Embed Size (px)
Citation preview
Neuroimaging in the prediagnostic phase of Parkinson’s diseasephase of Parkinson s disease
David J BrooksLondon, UK
GPSRC CNS 172 0709 RTG 1
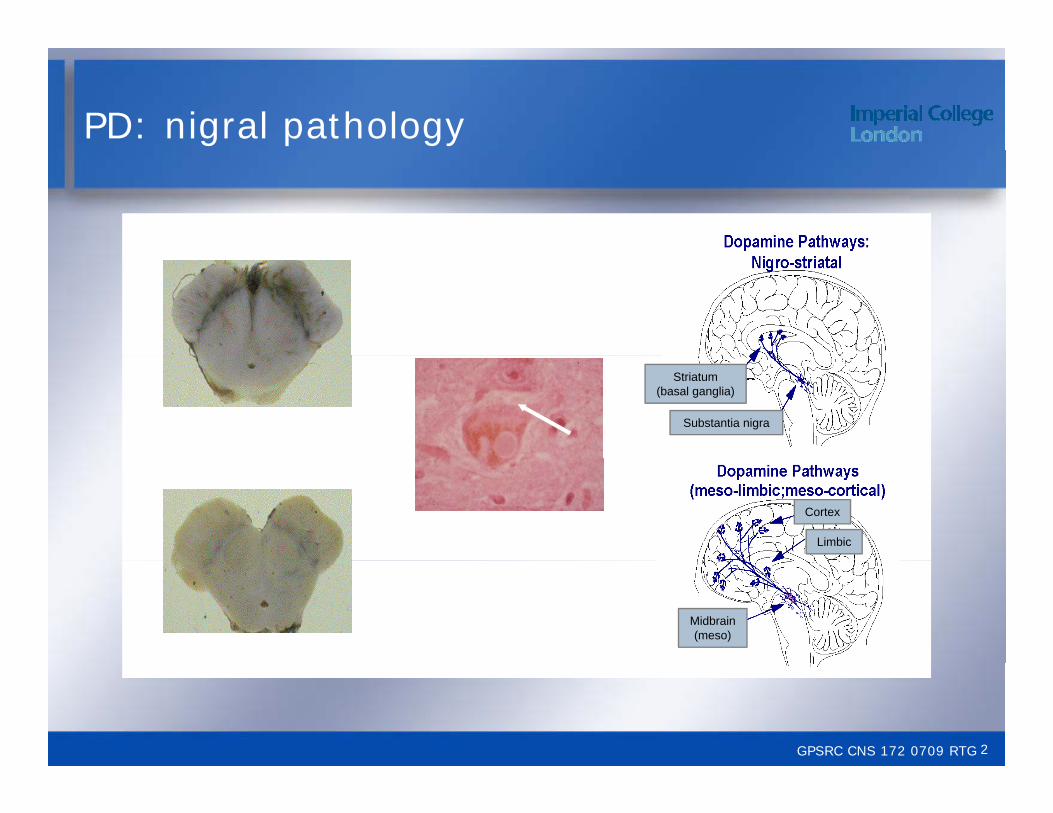
PD: nigral pathology
Striatum(basal ganglia)
Substantia nigra
Cortex
Limbic
Midbrain(meso)
GPSRC CNS 172 0709 RTG 2

Iron measurements using MRI in PD
MRI, magnetic resonance imaging
GPSRC CNS 172 0709 RTG
Michaeli et al. Mov Disord 2007;22:334–40.
MRI, magnetic resonance imaging
3
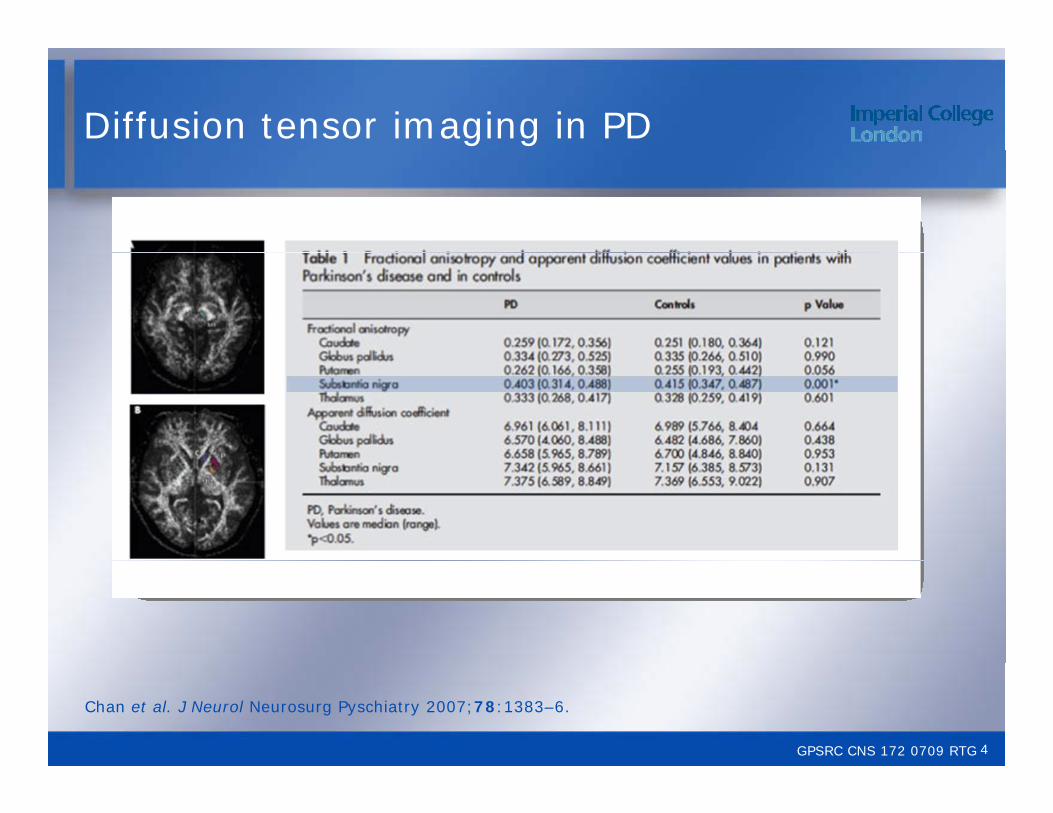
Diffusion tensor imaging in PD
GPSRC CNS 172 0709 RTG
Chan et al. J Neurol Neurosurg Pyschiatry 2007;78:1383–6.
4
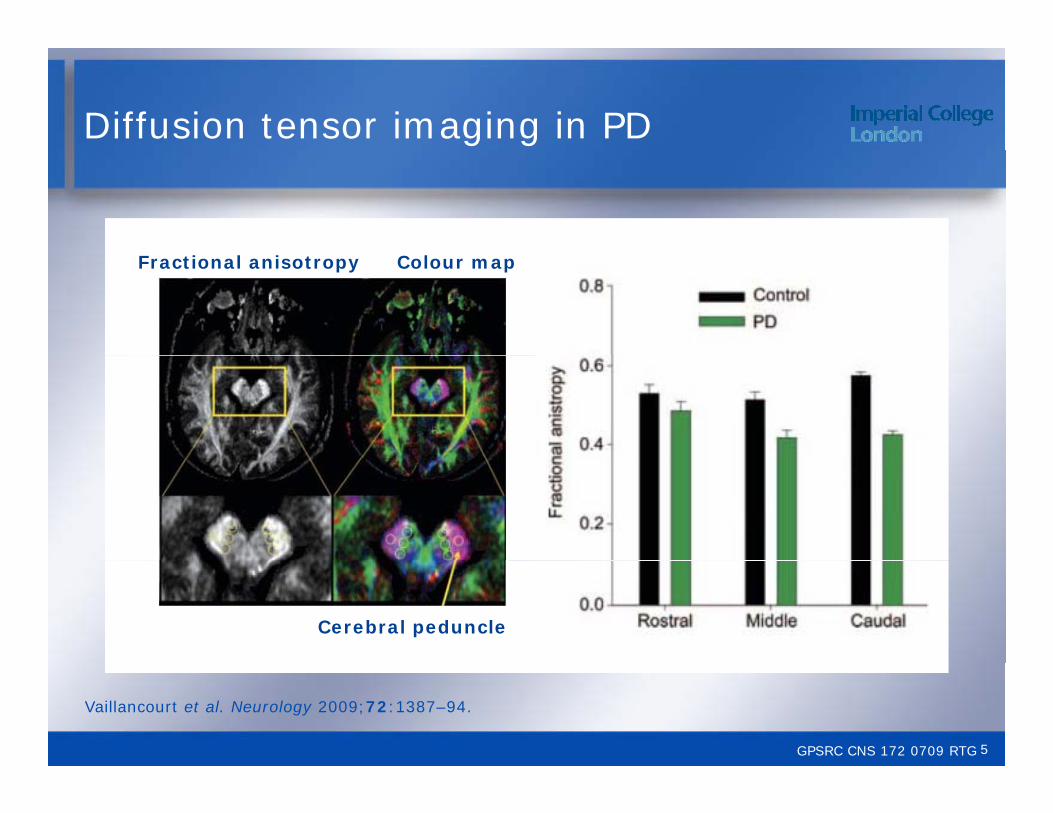
Diffusion tensor imaging in PD
Fractional anisotropy Colour map
Cerebral peduncle
GPSRC CNS 172 0709 RTG
Vaillancourt et al. Neurology 2009;72:1387–94.
5
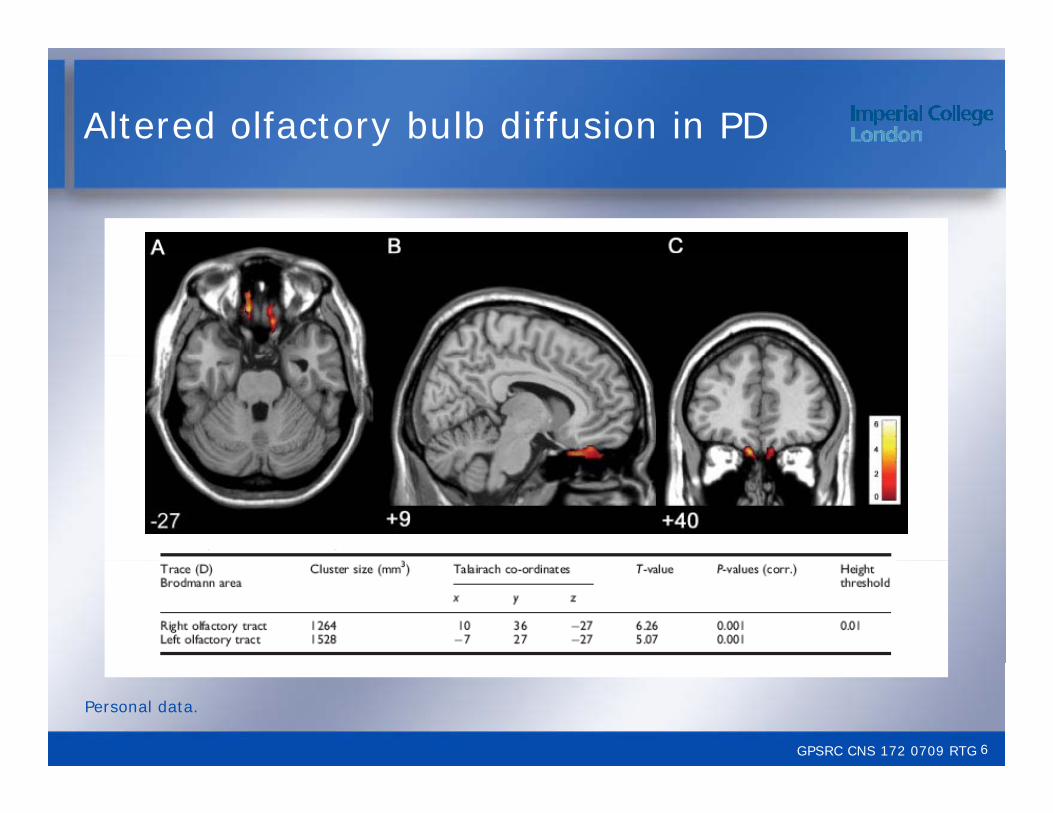
Altered olfactory bulb diffusion in PD
GPSRC CNS 172 0709 RTG
Personal data.
6
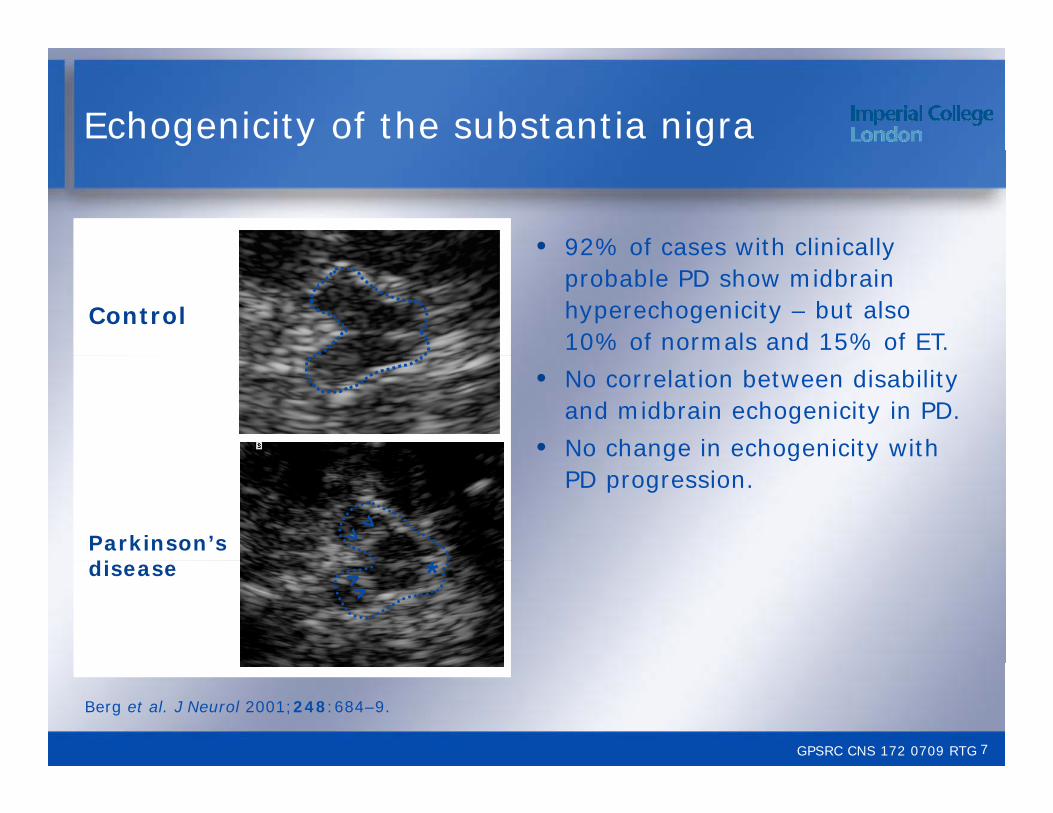
Echogenicity of the substantia nigra
• 92% of cases with clinically
Control
92% of cases with clinically probable PD show midbrain hyperechogenicity – but also 10% of normals and 15% of ET.
• No correlation between disability and midbrain echogenicity in PD.
• No change in echogenicity with
*Parkinson’s di
g g yPD progression.
*disease
GPSRC CNS 172 0709 RTG
Berg et al. J Neurol 2001;248:684–9.
7
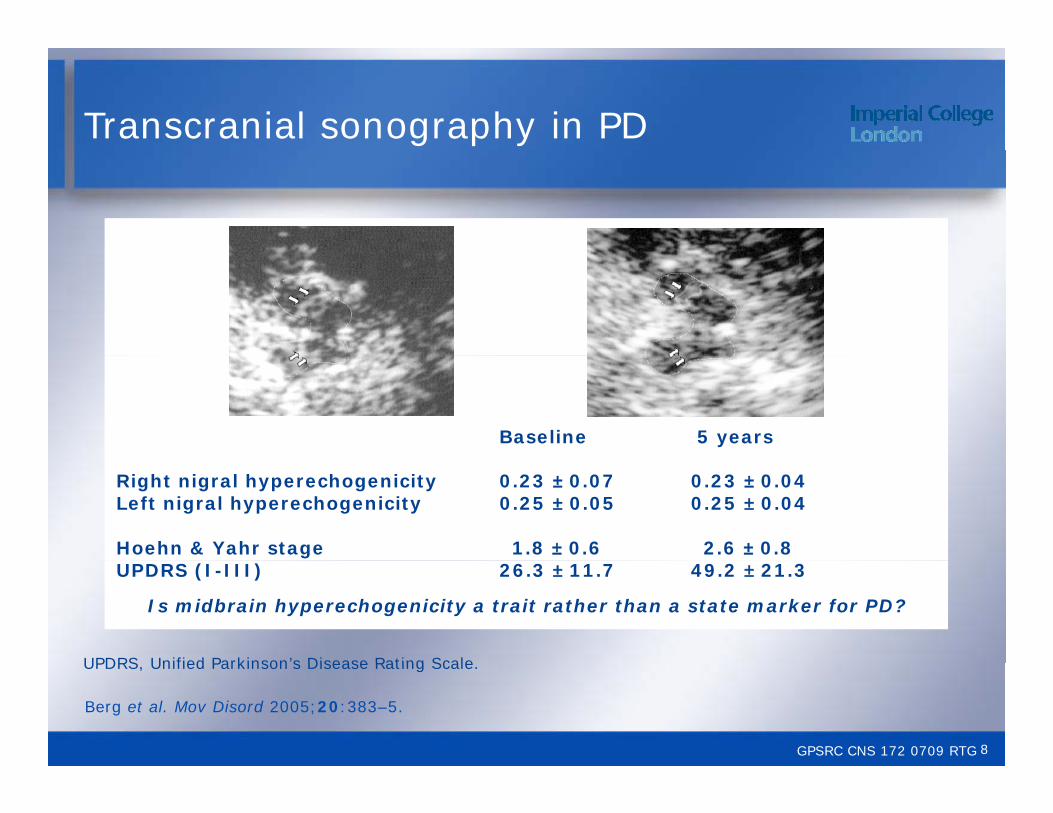
Transcranial sonography in PD
Baseline 5 years
Right nigral hyperechogenicity 0.23 ± 0.07 0.23 ± 0.04Left nigral hyperechogenicity 0.25 ± 0.05 0.25 ± 0.04
Hoehn & Yahr stage 1.8 ± 0.6 2.6 ± 0.8UPDRS (I-III) 26.3 ± 11.7 49.2 ± 21.3
Is midbrain hyperechogenicity a trait rather than a state marker for PD?
UPDRS Unified Parkinson’s Disease Rating Scale
GPSRC CNS 172 0709 RTG
Berg et al. Mov Disord 2005;20:383–5.
UPDRS, Unified Parkinson s Disease Rating Scale.
8
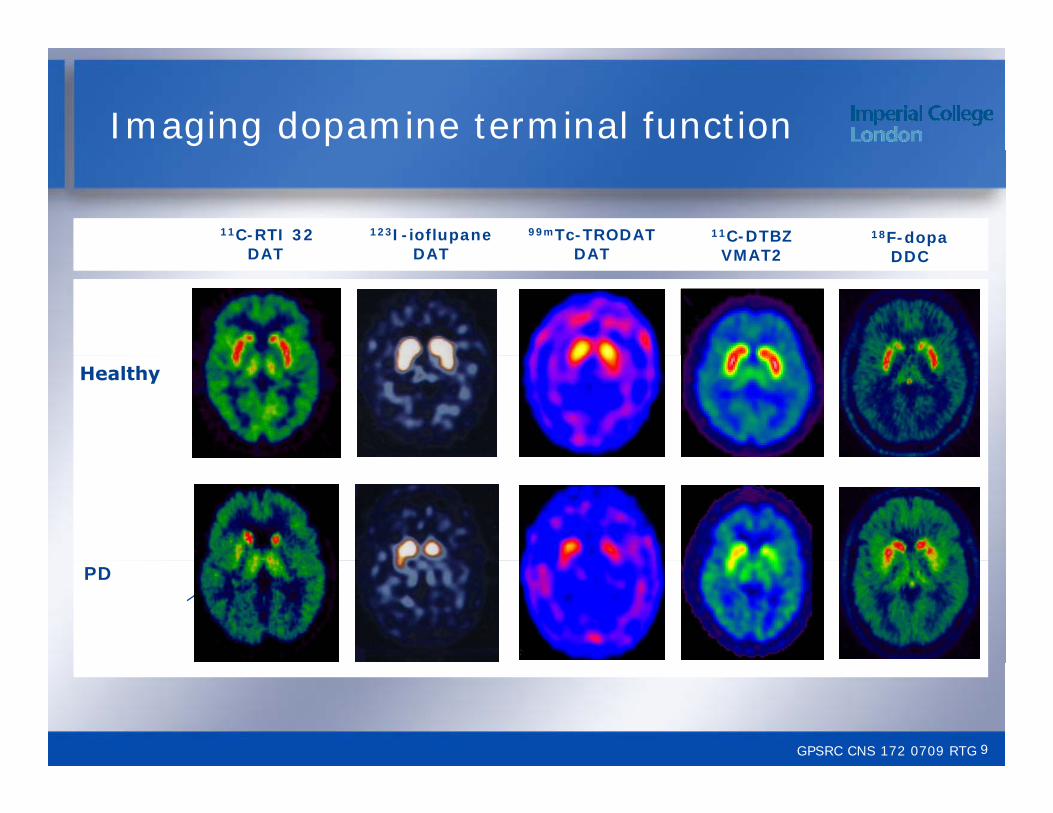
Imaging dopamine terminal function
11C-RTI 32DAT
11C-DTBZVMAT2
18F-dopaDDC
123I-ioflupaneDAT
99mTc-TRODATDATDAT VMAT2 DDCDAT DAT
PD
GPSRC CNS 172 0709 RTG 9
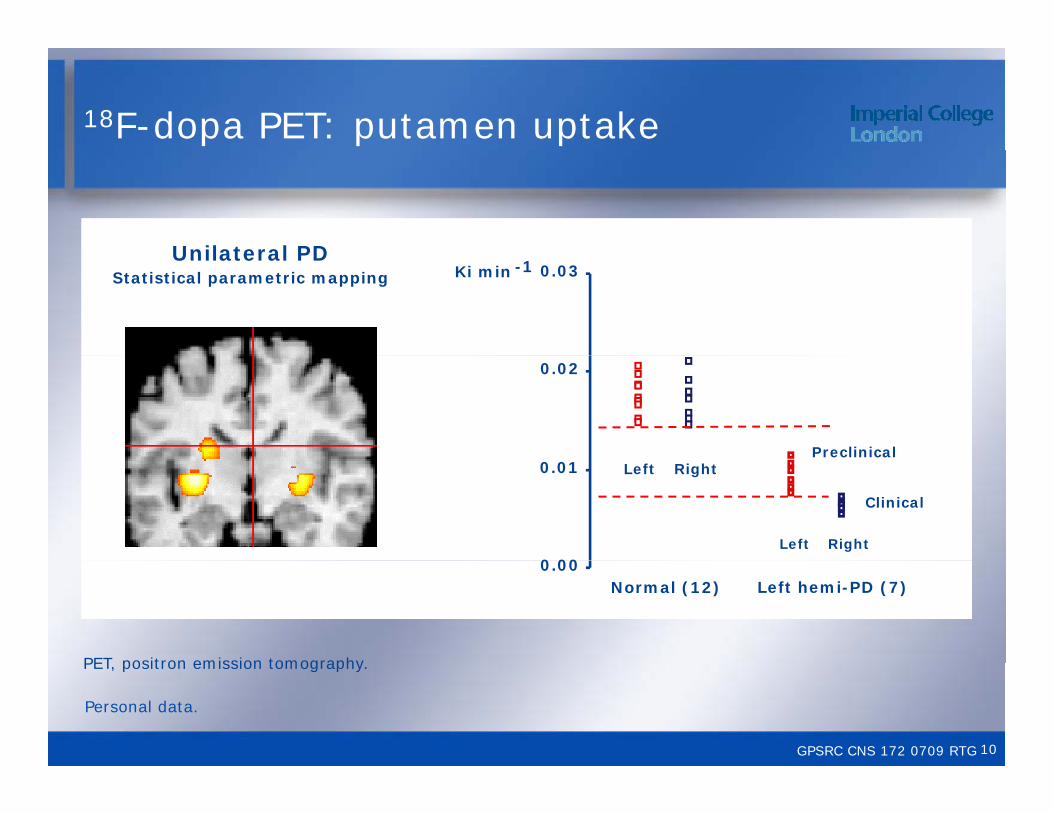
18F-dopa PET: putamen uptake
Unilateral PDUnilateral PDStatistical parametric mapping Ki min -1 0.03
0.02
Preclinical
0 00
0.01 Left Right
Left Right
Clinical
0.00Normal (12) Left hemi-PD (7)
PET positron emission tomography
GPSRC CNS 172 0709 RTG
Personal data.
PET, positron emission tomography.
10
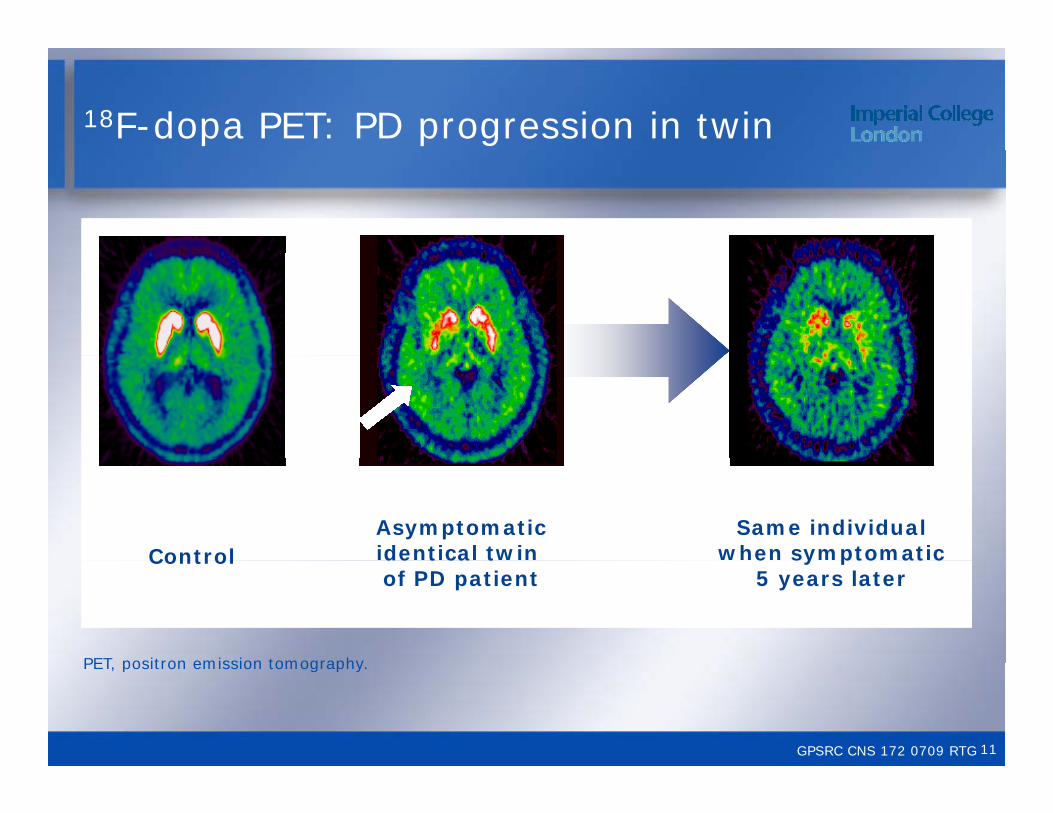
18F-dopa PET: PD progression in twin
Same individual when symptomaticControl
Asymptomaticidentical twin e sy pto at c
5 years laterControl de t ca t
of PD patient
PET positron emission tomography
GPSRC CNS 172 0709 RTG
PET, positron emission tomography.
11

18F-dopa uptake in twins of PD patients
0.0115 Identical twins Non-identical twins
0.0095
0.0055
0.0075
0 1 2 3 4 5 6 7 Time (years)
0 1 2 3 4 5 6 7
*0.0035
*
Concordance for dopaminergic nigro striatal dysfunction
At baseline At follow-upIdentical twins 55% 70%Non-identical twins 18% 22%
Concordance for dopaminergic nigro-striatal dysfunction
GPSRC CNS 172 0709 RTG
Piccini et al. Ann Neurol 1999;45:577–82.
12
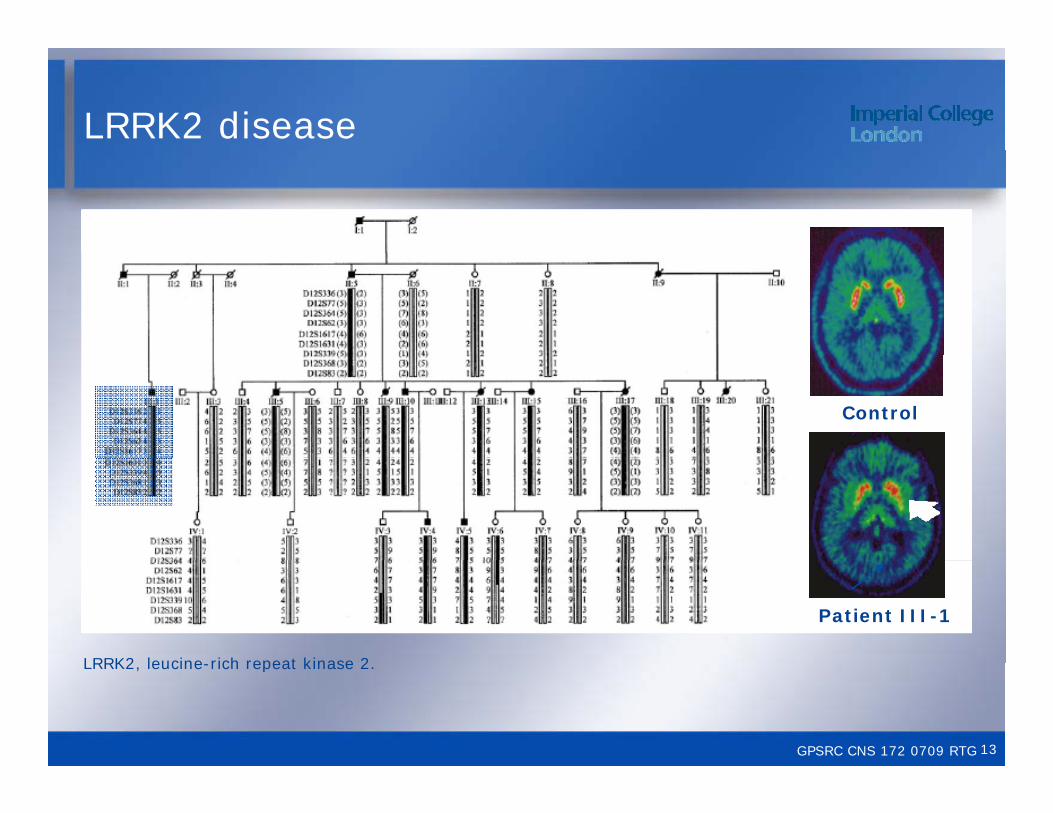
LRRK2 disease
Control
Patient III-1
LRRK2 leucine rich repeat kinase 2
GPSRC CNS 172 0709 RTG
LRRK2, leucine-rich repeat kinase 2.
13
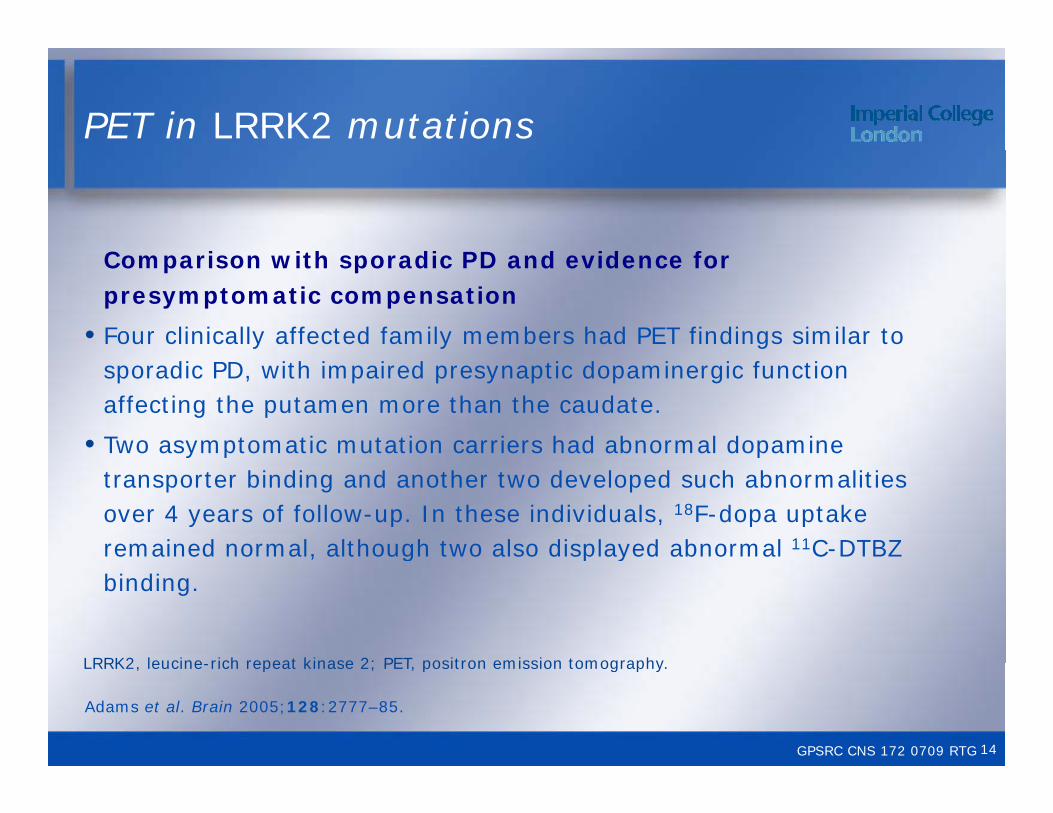
PET in LRRK2 mutations
C i ith di PD d id f Comparison with sporadic PD and evidence for presymptomatic compensation
• Four clinically affected family members had PET findings similar to sporadic PD, with impaired presynaptic dopaminergic function affecting the putamen more than the caudate.
• Two asymptomatic mutation carriers had abnormal dopamine transporter binding and another two developed such abnormalities over 4 years of follow-up. In these individuals, 18F-dopa uptake remained normal, although two also displayed abnormal 11C-DTBZ , g p ybinding.
LRRK2 leucine-rich repeat kinase 2; PET positron emission tomography
GPSRC CNS 172 0709 RTG
Adams et al. Brain 2005;128:2777–85.
LRRK2, leucine-rich repeat kinase 2; PET, positron emission tomography.
14

18F-dopa PET
Control IPD Parkin
PET positron emission tomography
GPSRC CNS 172 0709 RTG
PET, positron emission tomography.
15
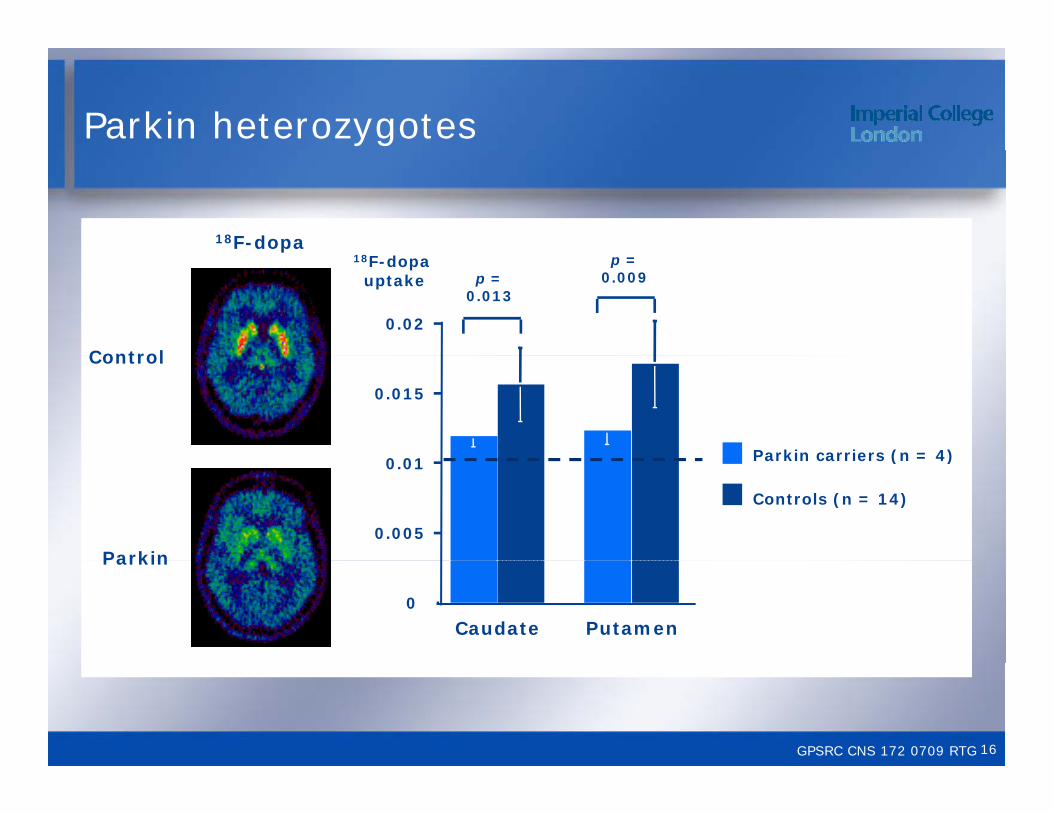
Parkin heterozygotes
18F-dopa
0.02
p = 0.013
p = 0.009
18F-dopa uptake
Control
0 01
0.015
Parkin carriers (n = 4)
Control
0.005
0.01 Parkin carriers (n = 4)
Controls (n = 14)
Parkin
0
Putamen
Parkin
Caudate
GPSRC CNS 172 0709 RTG 16
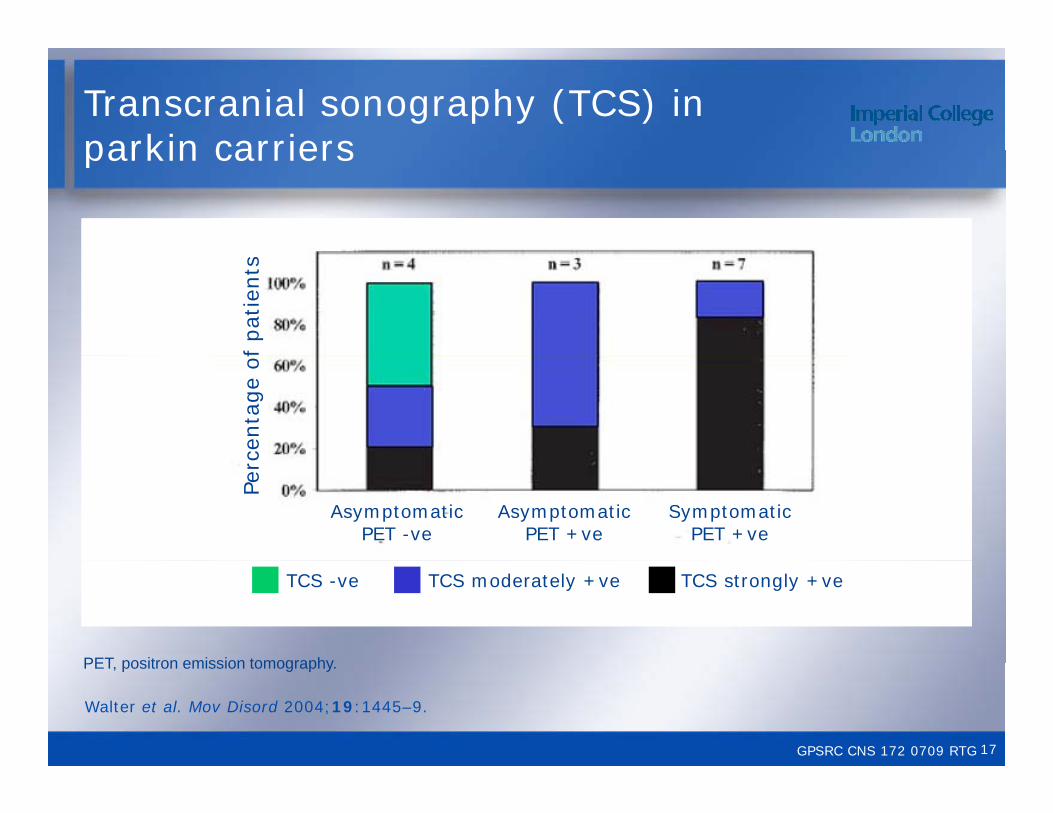
Transcranial sonography (TCS) in parkin carriersparkin carriers
f pat
ients
centa
ge
of
Perc
AsymptomaticPET -ve
AsymptomaticPET +ve
SymptomaticPET +ve
TCS -ve TCS moderately +ve TCS strongly +ve
PET positron emission tomography
GPSRC CNS 172 0709 RTG
Walter et al. Mov Disord 2004;19:1445–9.
PET, positron emission tomography.
17
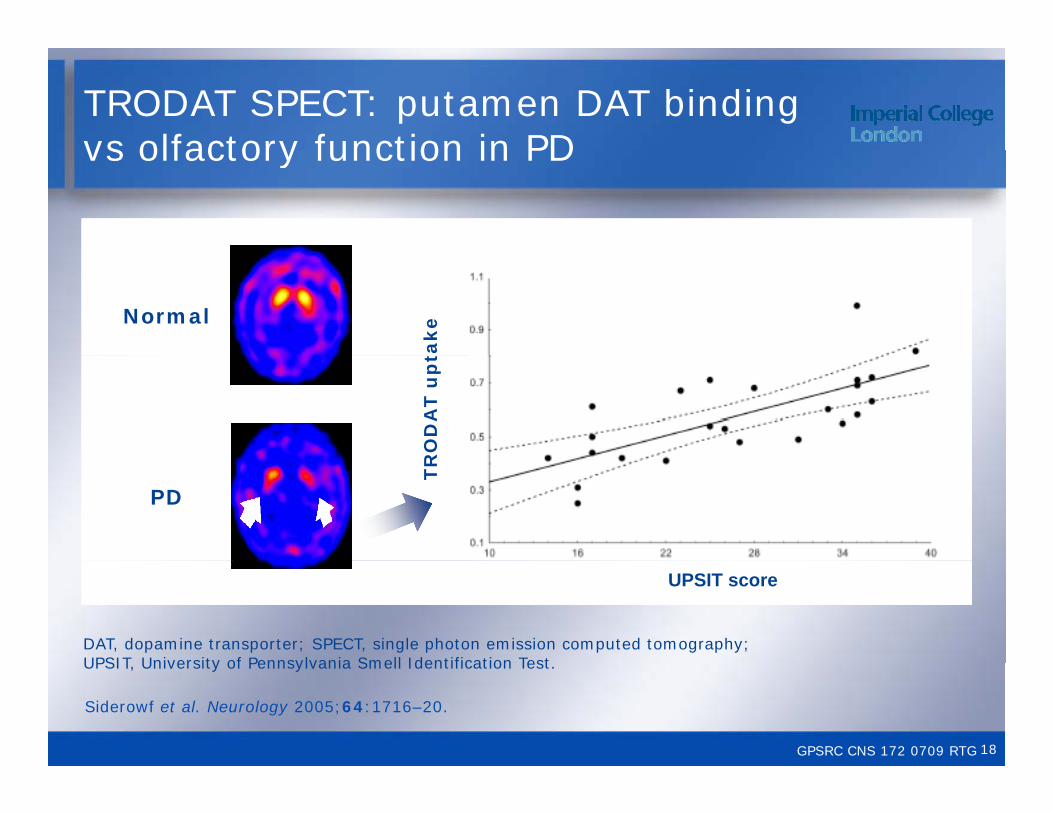
TRODAT SPECT: putamen DAT bindingvs olfactory function in PDvs olfactory function in PD
takeNormal
RO
DA
T u
pt
TR
PD
UPSIT score
DAT, dopamine transporter; SPECT, single photon emission computed tomography; UPSIT University of Pennsylvania Smell Identification Test
GPSRC CNS 172 0709 RTG
Siderowf et al. Neurology 2005;64:1716–20.
UPSIT, University of Pennsylvania Smell Identification Test.
18

Olfactory and dopaminergic dysfunctionin PD relativesin PD relatives
beta-CIT SPECT
Normal
HyposmicPD relative
PD
SPECT single photon emission computed tomography
GPSRC CNS 172 0709 RTG
Berendse et al. Ann Neurol 2001;50:34–41.
SPECT, single photon emission computed tomography.
19

Hyposmia and hippocampal DAT bindingbinding
11C-CFT PET
Normal
40
UP
SIT
-4
PD
DAT dopamine transporter; UPSIT University of Pennsylvania Smell Identification Test
HIPPOCAMPAL DAT
GPSRC CNS 172 0709 RTG
Bohnen et al. Neurosci Lett 2008;447:12–6.
DAT, dopamine transporter; UPSIT, University of Pennsylvania Smell Identification Test.
20

Imaging findings in hyposmia
SPECT, single photon emission computed tomography; TCS, transcranial sonography; UPDRS Unified Parkinson’s Disease Rating Scale
GPSRC CNS 172 0709 RTG
Sommer et al. Mov Disord 2004;19:1196–202.
UPDRS, Unified Parkinson s Disease Rating Scale.
21
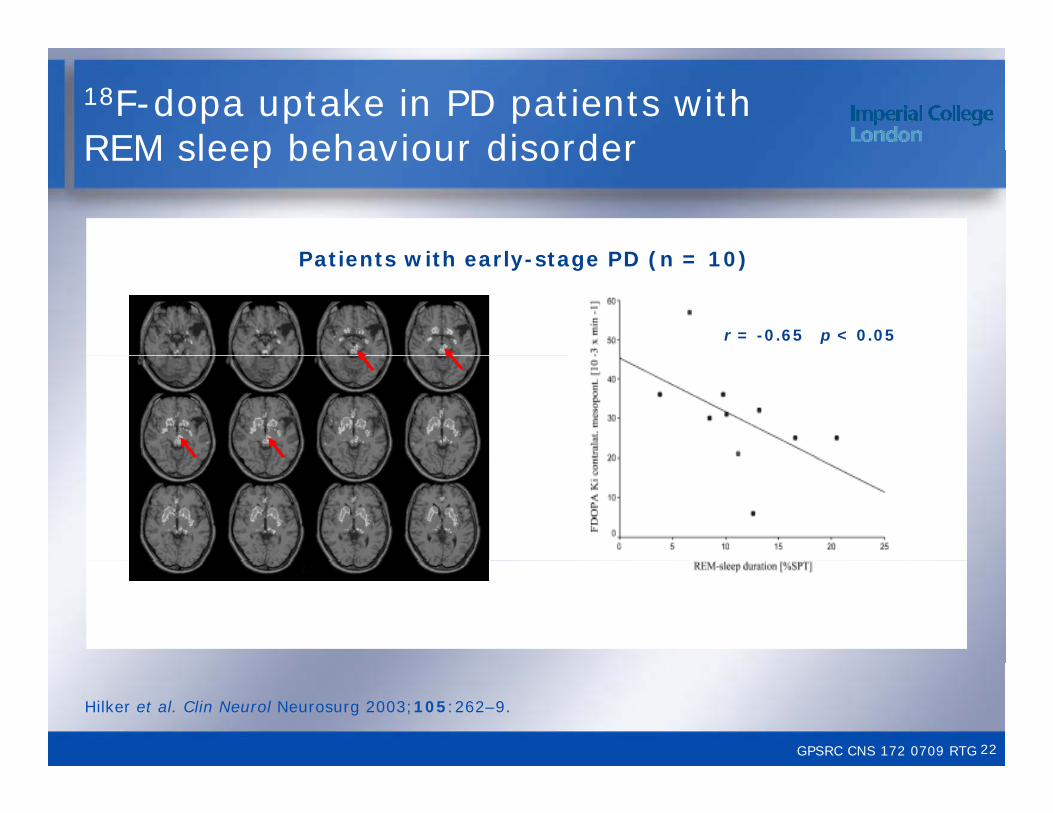
18F-dopa uptake in PD patients with REM sleep behaviour disorderREM sleep behaviour disorder
P ti t ith l t PD ( 10)Patients with early-stage PD (n = 10)
r = -0.65 p < 0.05
GPSRC CNS 172 0709 RTG
Hilker et al. Clin Neurol Neurosurg 2003;105:262–9.
22
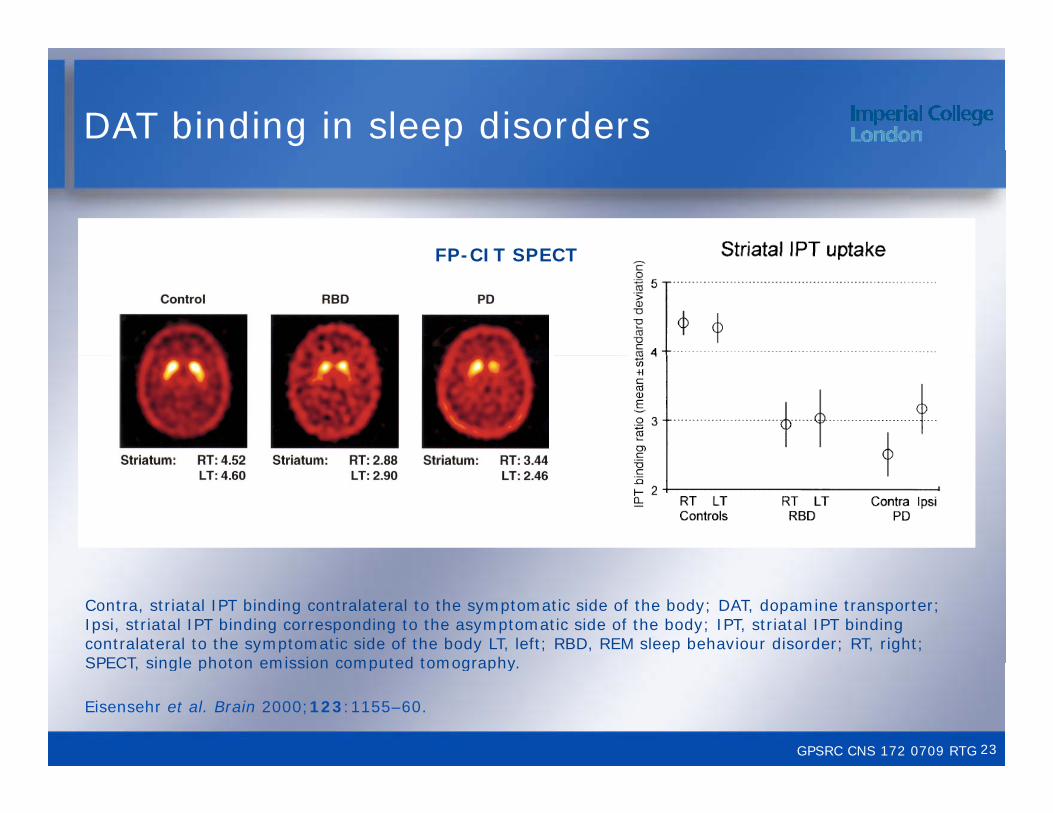
DAT binding in sleep disorders
FP CIT SPECTFP-CIT SPECT
Contra, striatal IPT binding contralateral to the symptomatic side of the body; DAT, dopamine transporter; Ipsi, striatal IPT binding corresponding to the asymptomatic side of the body; IPT, striatal IPT binding contralateral to the symptomatic side of the body LT, left; RBD, REM sleep behaviour disorder; RT, right; SPECT single photon emission computed tomography
GPSRC CNS 172 0709 RTG
Eisensehr et al. Brain 2000;123:1155–60.
SPECT, single photon emission computed tomography.
23
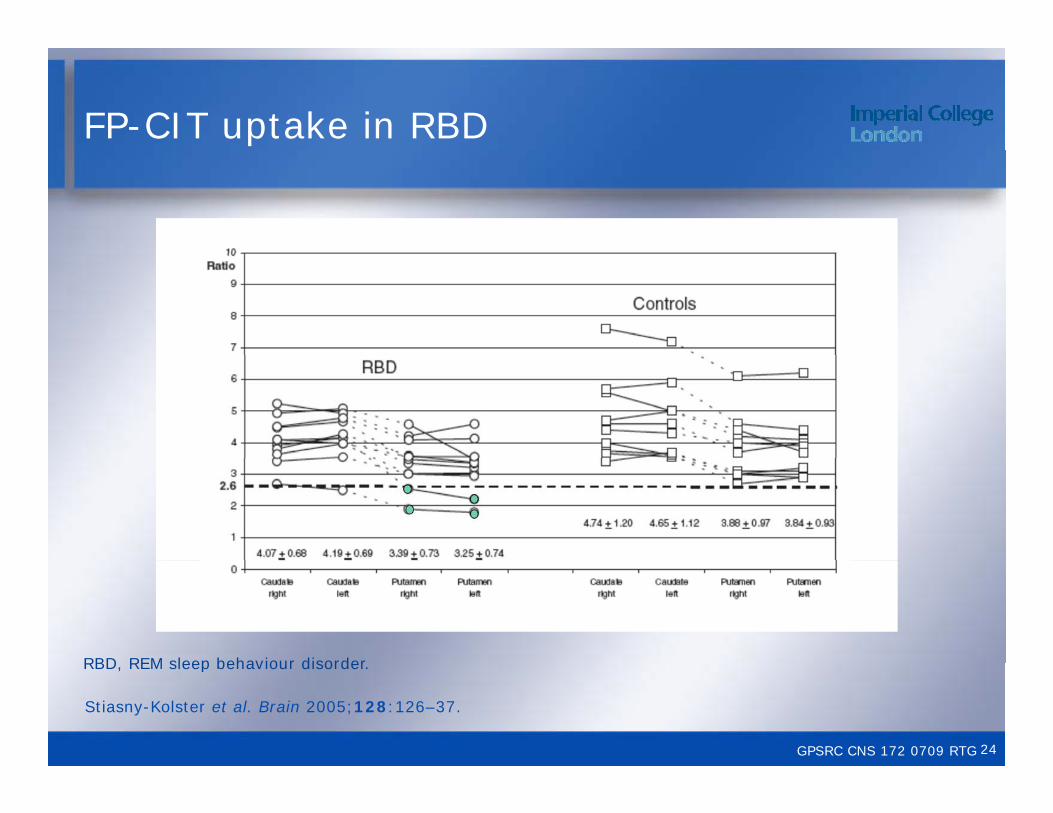
FP-CIT uptake in RBD
RBD REM sleep behaviour disorder
GPSRC CNS 172 0709 RTG
Stiasny-Kolster et al. Brain 2005;128:126–37.
RBD, REM sleep behaviour disorder.
24
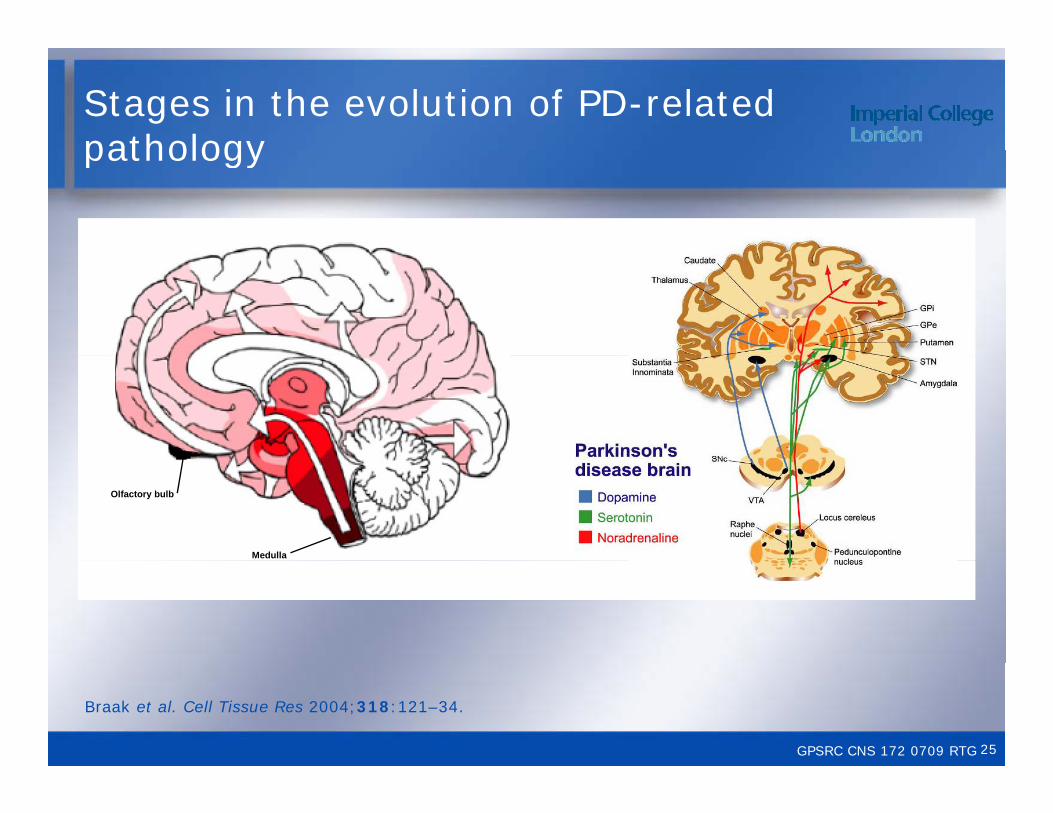
Stages in the evolution of PD-related pathologypathology
Medulla
Olfactory bulb
GPSRC CNS 172 0709 RTG
Braak et al. Cell Tissue Res 2004;318:121–34.
25

MIBG cardiac scintigraphy
Normal
Normallimit
PD
Braune et al. Neurology 1999;53:1020–5. Nagayama et al. J Neurol Neurosurg Psychiatry 2005;76:249–51.
GPSRC CNS 172 0709 RTG 26
Dementia in PDDementia in PD
GPSRC CNS 000 0709 RTGGPSRC CNS 172 0709 RTG 27
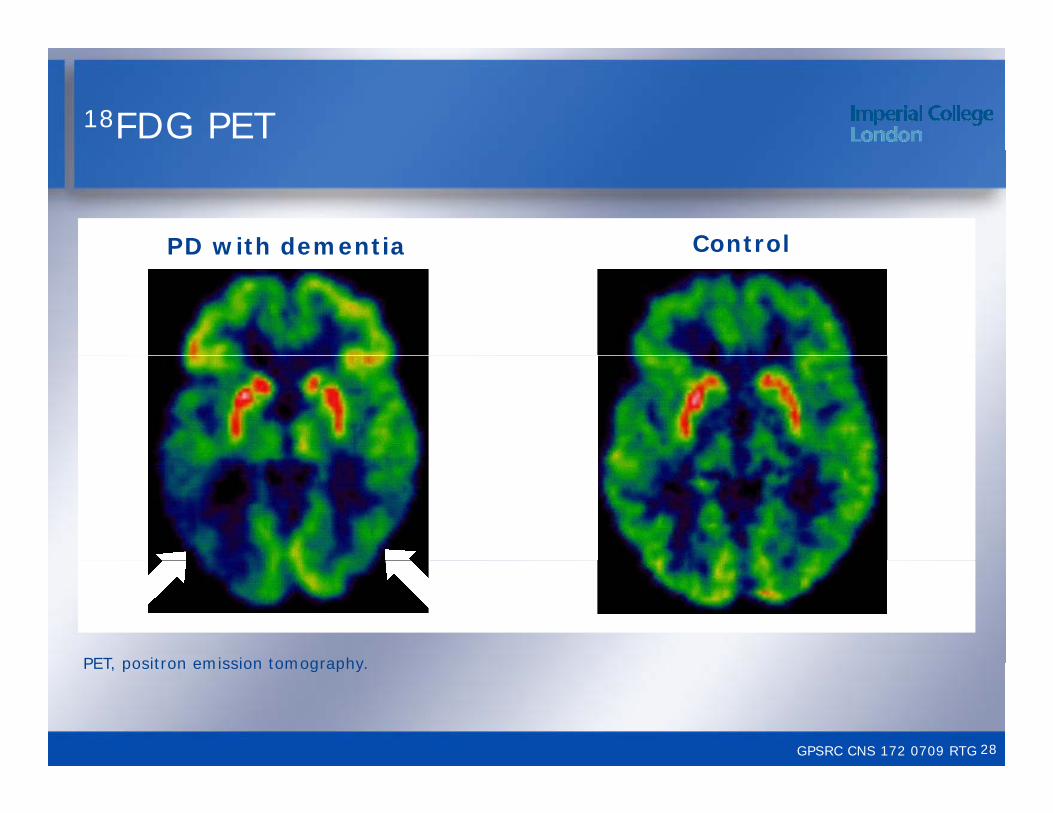
18FDG PET
PD with dementia ControlPD with dementia
PET positron emission tomography
GPSRC CNS 172 0709 RTG
PET, positron emission tomography.
28
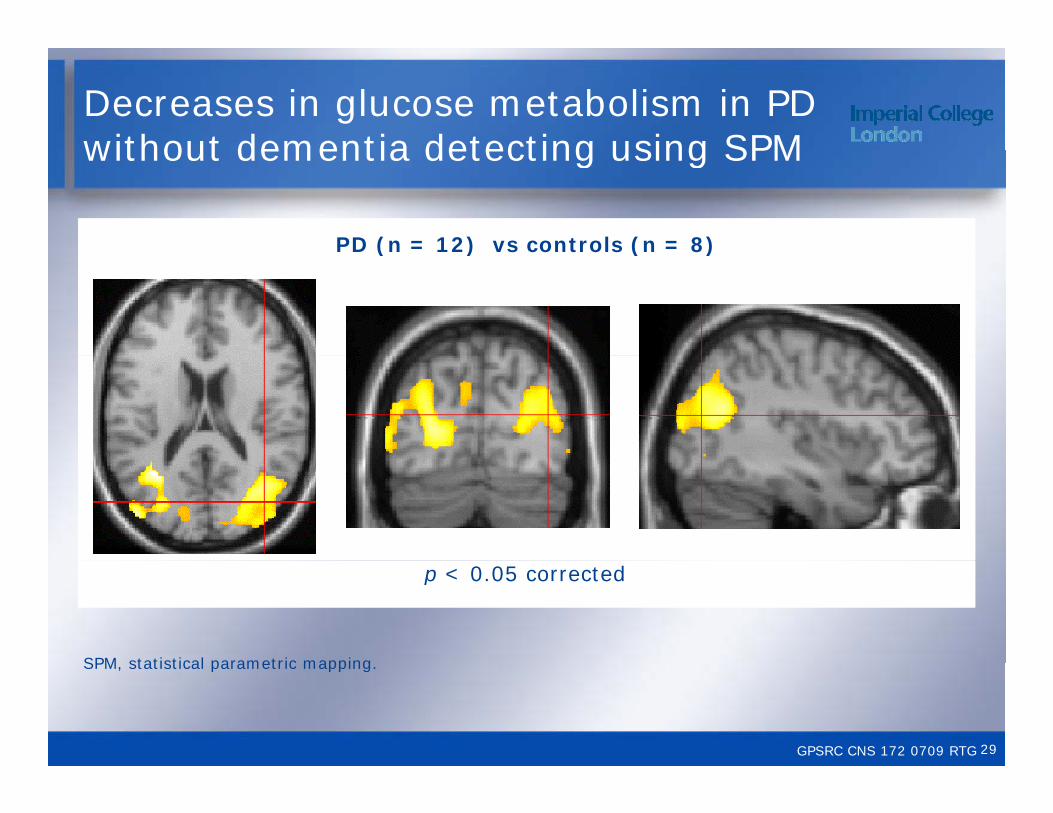
Decreases in glucose metabolism in PD without dementia detecting using SPMwithout dementia detecting using SPM
PD (n = 12) vs controls (n = 8)( ) ( )
p < 0.05 corrected
SPM statistical parametric mapping
GPSRC CNS 172 0709 RTG
SPM, statistical parametric mapping.
29
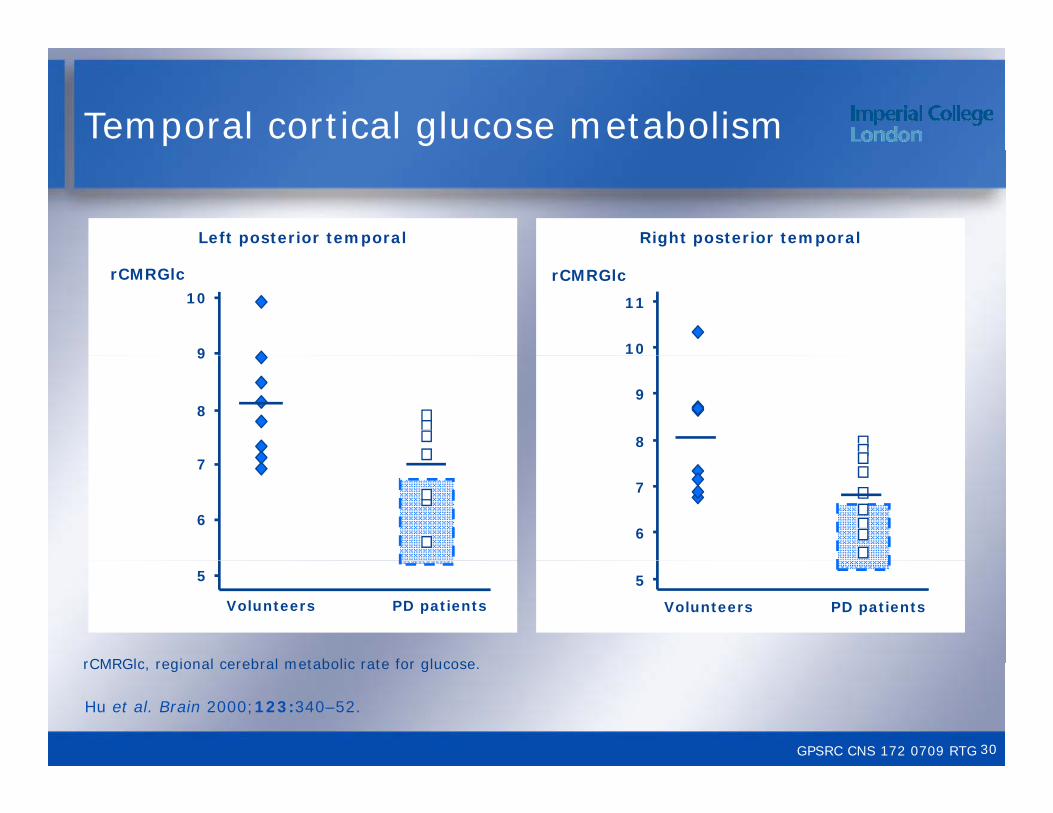
Temporal cortical glucose metabolism
Right posterior temporalLeft posterior temporal
10
11
rCMRGlcrCMRGlc
9
10
8
98
9
6
7
6
7
PD patients PD patients
5
Volunteers
5
Volunteers
rCMRGlc regional cerebral metabolic rate for glucose
GPSRC CNS 172 0709 RTG
Hu et al. Brain 2000;123:340–52.
rCMRGlc, regional cerebral metabolic rate for glucose.
30
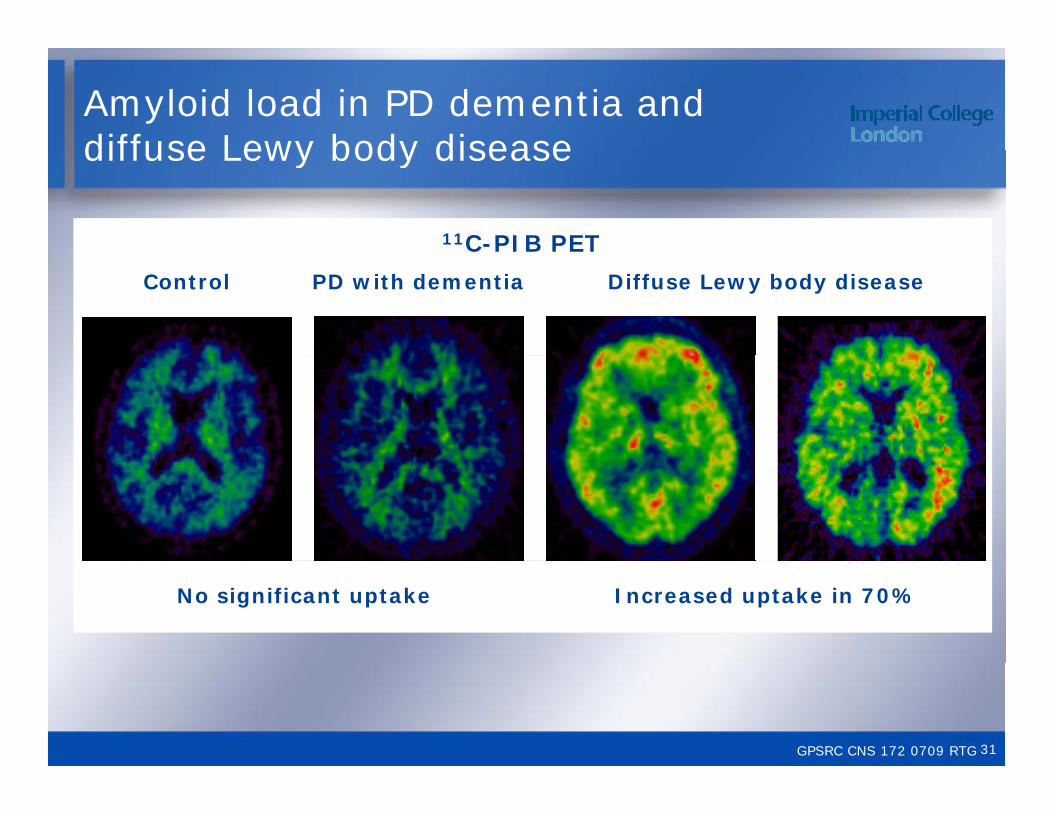
Amyloid load in PD dementia and diffuse Lewy body disease
11C-PIB PET
diffuse Lewy body disease
Diffuse Lewy body diseaseControl PD with dementia
No significant uptake Increased uptake in 70%
GPSRC CNS 172 0709 RTG 31
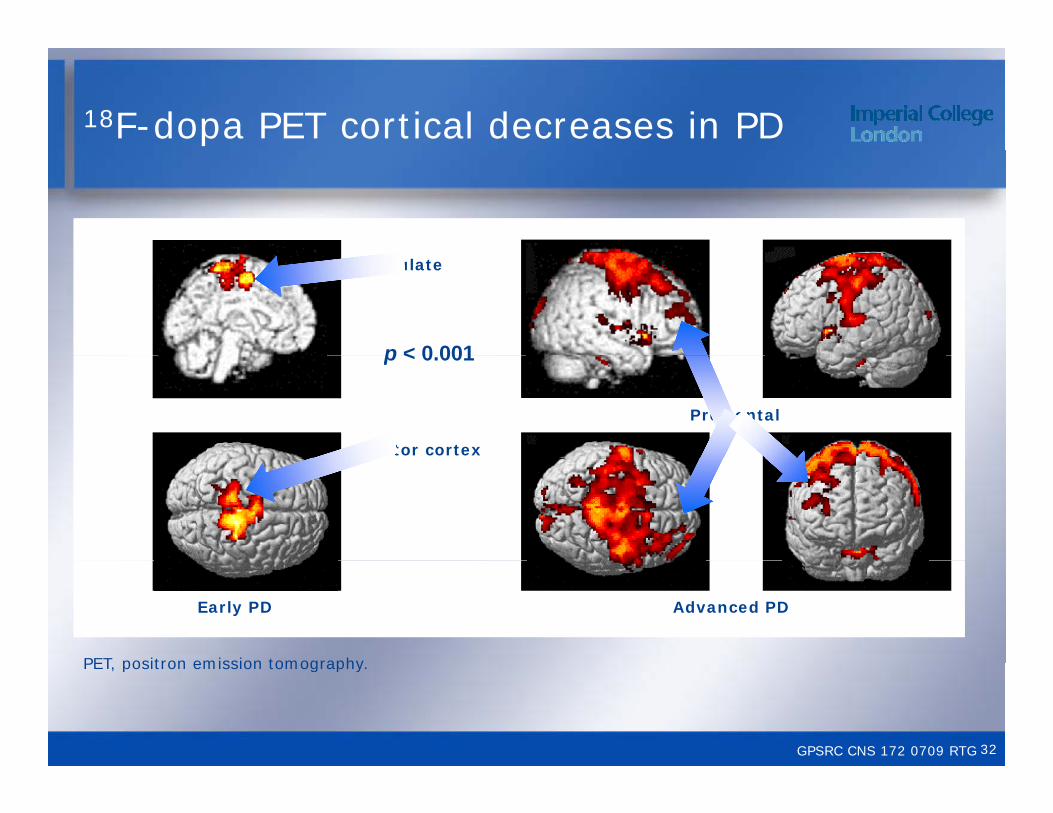
18F-dopa PET cortical decreases in PD
p < 0 001
cingulate
p < 0.001
Prefrontal
motor cortex
Early PD Advanced PD
PET positron emission tomography
GPSRC CNS 172 0709 RTG
PET, positron emission tomography.
32
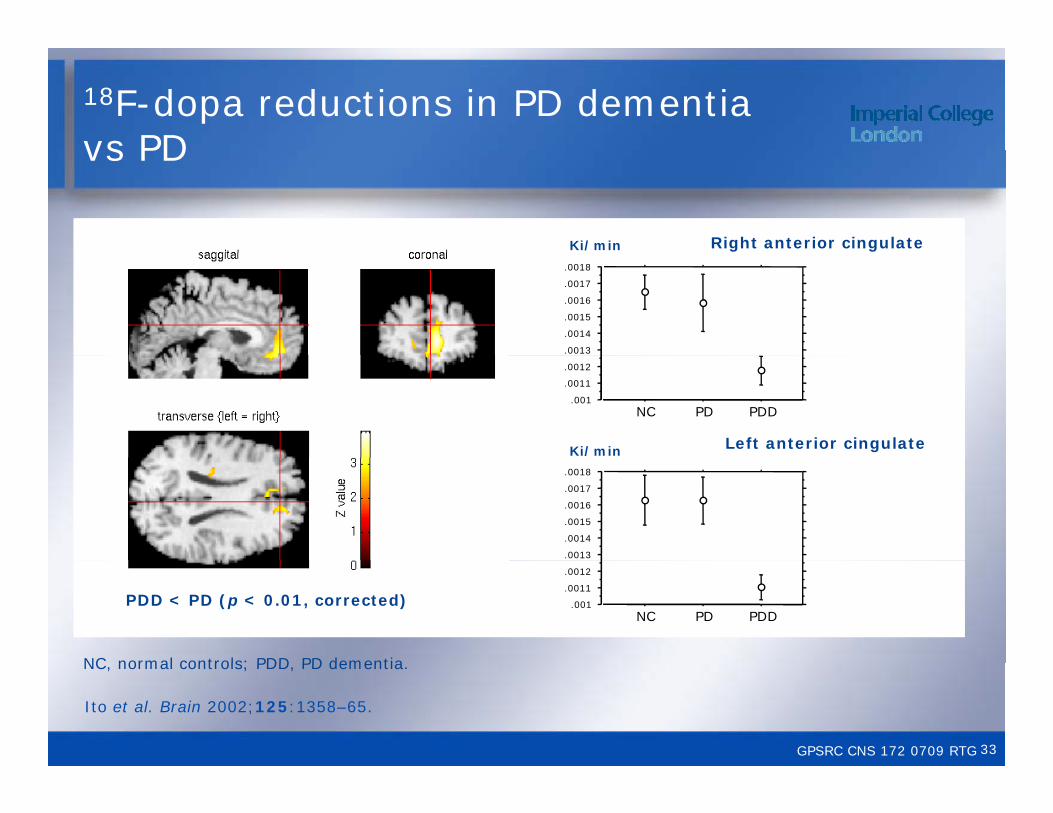
18F-dopa reductions in PD dementia vs PD
Right anterior cingulate
vs PD
Ki/min
.0013
.0014
.0015
.0016
.0017
.0018
Ki/min Left anterior cingulate
.001
.0011
.0012
NC PD PDD
.0013
.0014
.0015
.0016
.0017
.0018
PDD < PD (p < 0.01, corrected)
NC normal controls; PDD PD dementia
.001
.0011
.0012
NC PD PDD
GPSRC CNS 172 0709 RTG
Ito et al. Brain 2002;125:1358–65.
NC, normal controls; PDD, PD dementia.
33

Decreased F-dopa uptake in PD: fatigue vs no fatiguefatigue vs no fatigue
Th k h t d th t thi The speaker has requested that this slide is not shown for copyright reasons
GPSRC CNS 169 0709 RTGGPSRC CNS 172 0709 RTG 34
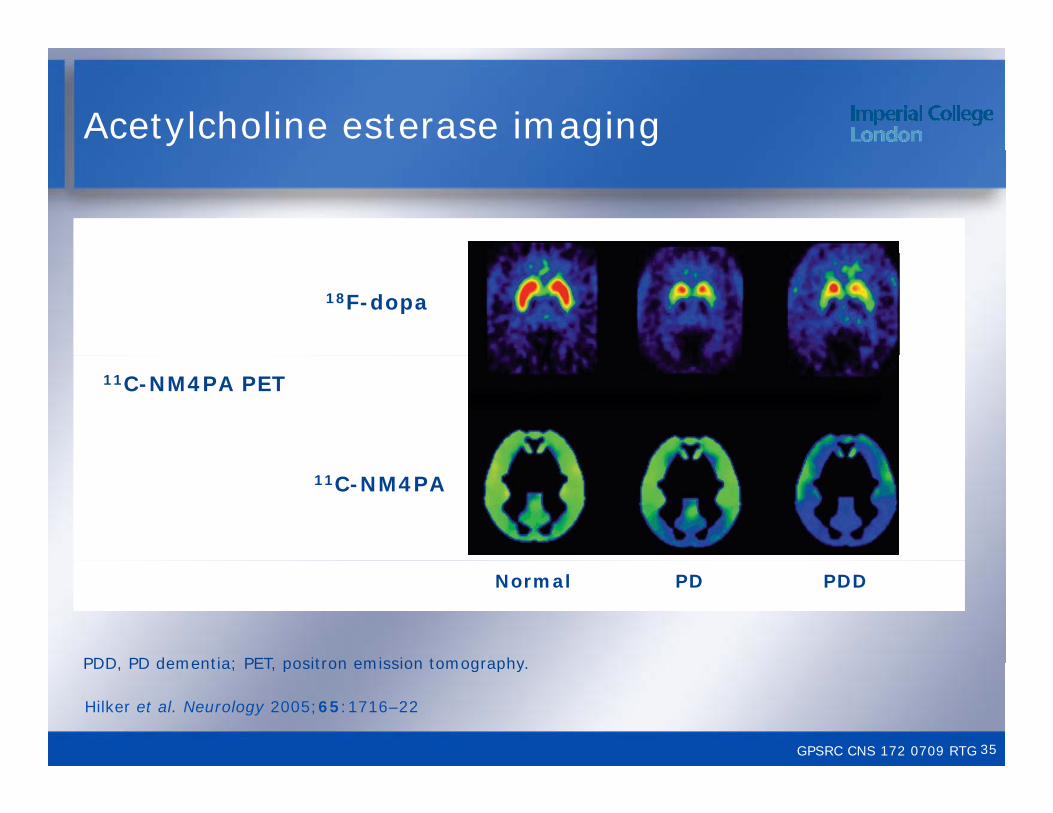
Acetylcholine esterase imaging
18F-dopa
11C-NM4PA PET
11C-NM4PA
Normal PD PDD
PDD PD dementia; PET positron emission tomography
GPSRC CNS 172 0709 RTG
PDD, PD dementia; PET, positron emission tomography.
Hilker et al. Neurology 2005;65:1716–22
35
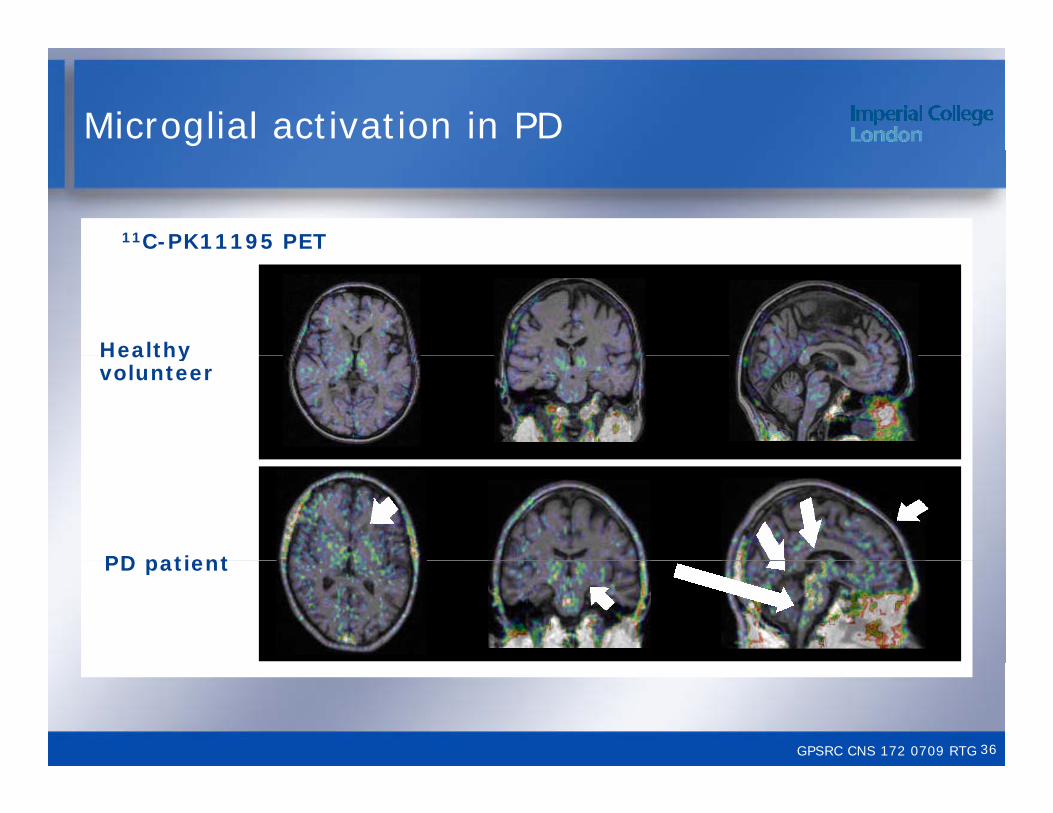
Microglial activation in PD
11C-PK11195 PET
Healthy Healthy volunteer
PD patientPD patient
GPSRC CNS 172 0709 RTG 36
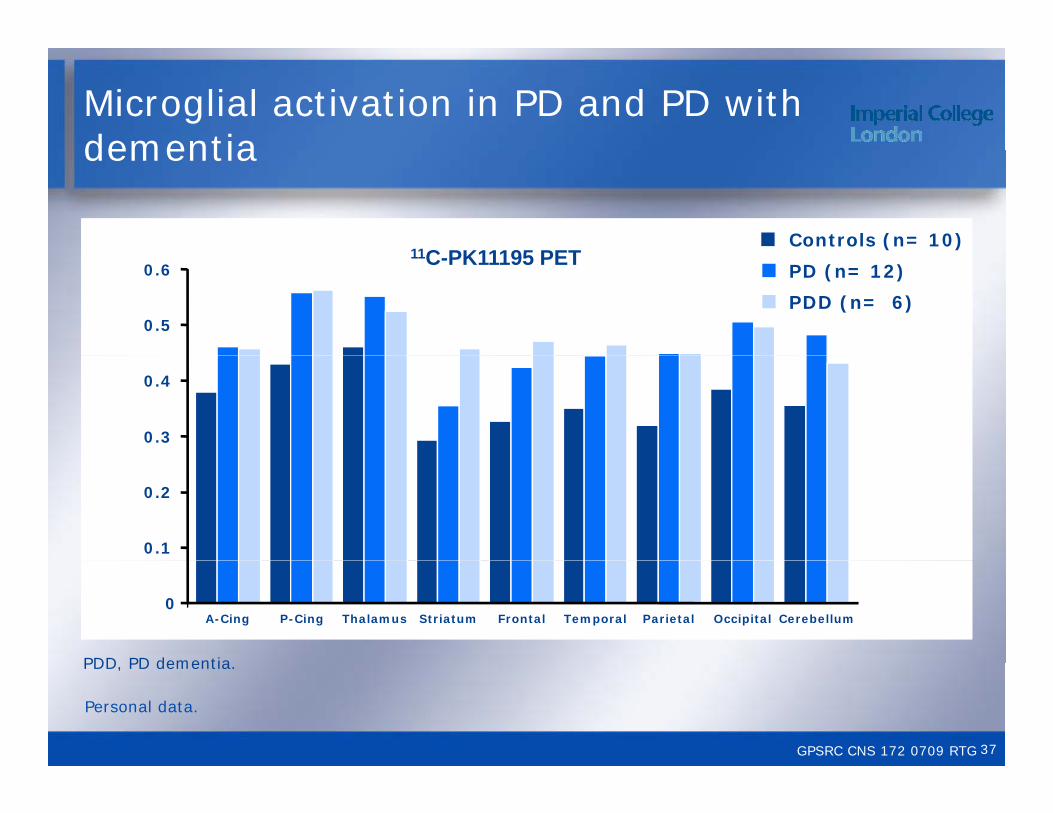
Microglial activation in PD and PD with dementia
Controls (n= 10)11C PK11195 PET
dementia
0.5
0.6 PD (n= 12)
PDD (n= 6)
11C-PK11195 PET
0.3
0.4
0.1
0.2
0A-Cing P-Cing Thalamus Striatum Frontal Temporal Parietal Occipital Cerebellum
PDD PD dementia
GPSRC CNS 172 0709 RTG
PDD, PD dementia.
Personal data.
37
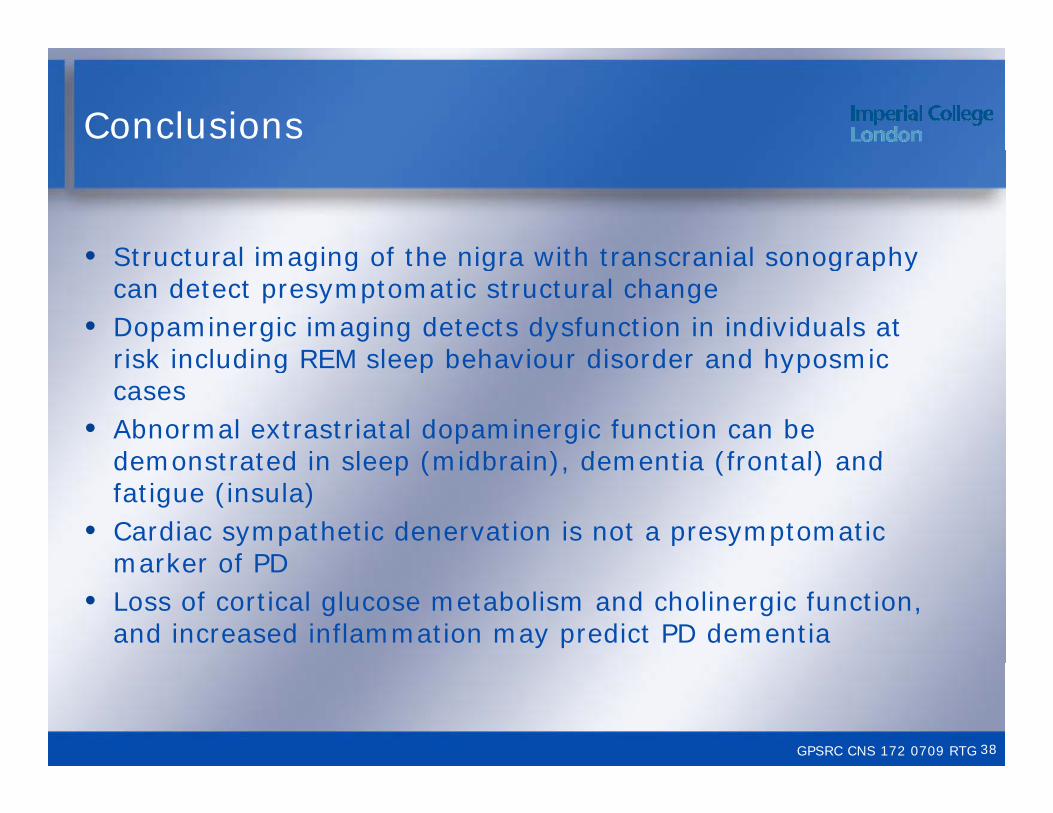
Conclusions
• Structural imaging of the nigra with transcranial sonography • Structural imaging of the nigra with transcranial sonography can detect presymptomatic structural change
• Dopaminergic imaging detects dysfunction in individuals at risk including REM sleep behaviour disorder and hyposmic risk including REM sleep behaviour disorder and hyposmic cases
• Abnormal extrastriatal dopaminergic function can be demonstrated in sleep (midbrain) dementia (frontal) and demonstrated in sleep (midbrain), dementia (frontal) and fatigue (insula)
• Cardiac sympathetic denervation is not a presymptomatic marker of PDmarker of PD
• Loss of cortical glucose metabolism and cholinergic function, and increased inflammation may predict PD dementia
GPSRC CNS 172 0709 RTG 38
Copyright statements
Slide 3 ©2007, reproduced with permission from John Wiley & Sons, Inc
Slide 4 ©2007, reproduced with permission from the BMJ Publishing Groupg p
Slide 5 ©2009, reproduced with permission from Wolters Kluwer Health
Slide 7 ©2001 reproduced with permission from Slide 7 ©2001, reproduced with permission from Springer
Slide 8 ©2005, reproduced with permission from John Wiley & Sons IncWiley & Sons, Inc
Slide 12 ©1999, reproduced with permission from John Wiley & Sons, Inc
Slide 17 ©2004, reproduced with permission from John Wiley & Sons, Inc
39
Copyright statements
Slide 18 ©2005, reproduced with permission from John Wiley & Sons, Inc
Slide 19 ©2001, reproduced with permission from John Wiley & Sons, Incy ,
Slide 20 ©2008, reproduced with permission from Elsevier
Slide 21 ©2004 reproduced with permission from John Slide 21 ©2004, reproduced with permission from John Wiley & Sons, Inc
Slide 22 ©2003, reproduced with permission from ElsevierElsevier
Slide 23 ©2000, reproduced with permission from Oxford University Press
Slide 24 ©2005, reproduced with permission from Oxford University Press
40
Copyright statements
Slide 25 ©2005, reproduced with permission from Springer
Slide 30 ©2000, reproduced with permission from Oxford University Pressy
Slide 33 ©2002, reproduced with permission from Oxford University Press
Slide 35 ©2005 reproduced with permission from Slide 35 ©2005, reproduced with permission from Wolters Kluwer Health
41