Embed Size (px)
Citation preview
New England Energy Market Outlook
Demand for Natural Gas Capacity and Impact of the Northeast Energy Direct Project
Prepared for
Kinder Morgan, Inc.
Prepared by
ICF International
9300 Lee Highway
Fairfax, VA 22031
1331 Lamar St., Suite 660
Houston, TX 77010
New England Energy Market Outlook – Demand for Gas Capacity and Impact of the NED Project
© 2015 2 icfi.com
Confidential and proprietary to ICF International
COPYRIGHT © 2015 ICF Resources, LLC All rights reserved.
Warranties and Representations. ICF endeavors to provide information and
projections consistent with standard practices in a professional manner. ICF MAKES NO
WARRANTIES, HOWEVER, EXPRESS OR IMPLIED (INCLUDING WITHOUT
LIMITATION ANY WARRANTIES OR MERCHANTABILITY OR FITNESS FOR A
PARTICULAR PURPOSE), AS TO THIS MATERIAL. Specifically but without
limitation, ICF makes no warranty or guarantee regarding the accuracy of any forecasts,
estimates, or analyses, or that such work products will be accepted by any legal or
regulatory body.
Waivers. Those viewing this Material hereby waive any claim at any time, whether now
or in the future, against ICF, its officers, directors, employees or agents arising out of or
in connection with this Material. In no event whatsoever shall ICF, its officers, directors,
employees, or agents be liable to those viewing this Material.
New England Energy Market Outlook – Demand for Gas Capacity and Impact of the NED Project
© 2015 3 icfi.com
Confidential and proprietary to ICF International
Table of Contents
Executive Summary .................................................................................................................... 5
Outlook for New England Gas Market Growth ................................................................................. 6
New England Gas Supply/Demand Balance ................................................................................... 6
NED Electric Market Benefits .......................................................................................................... 8
Reliability, Operational, and Environmental Benefits of Additional Pipeline Capacity ...................... 9
Introduction ............................................................................................................................... 13
Study Background ......................................................................................................................... 13
Project Description ........................................................................................................................ 16
ICF New England Study Scope ..................................................................................................... 17
Analytical Approach ....................................................................................................................... 17
Base Case Market Fundamentals ............................................................................................ 20
Residential/Commercial Demand .................................................................................................. 20
Industrial Demand ......................................................................................................................... 21
Gas Demand for the Electric Sector .............................................................................................. 21
Projected Supply Sources into New England ................................................................................ 24
New England Natural Gas Demand and Supply Balance ...................................................... 27
Normal Weather ............................................................................................................................ 27
Design Weather ............................................................................................................................. 28
Illustrative NED Impact on Winter 2013/14 ............................................................................. 30
Cost Savings - Normal Weather .............................................................................................. 33
Natural Gas Price Impact – Monthly Average ................................................................................ 33
Wholesale Power Price Impact – Monthly Average ....................................................................... 34
Cost Savings from Average Price Reductions ............................................................................... 34
Benefits from Reduced Daily Gas Price Volatility .......................................................................... 34
Net Estimated Electric Cost Savings ............................................................................................. 35
Other Benefits of Incremental New England Natural Gas Pipeline Capacity ...................... 37
Enhanced Operational Reliability ................................................................................................... 37
New England Energy Market Outlook – Demand for Gas Capacity and Impact of the NED Project
© 2015 4 icfi.com
Confidential and proprietary to ICF International
Operational Flexibility .................................................................................................................... 39
Support for Renewable Energy ...................................................................................................... 40
Environmental Benefits .................................................................................................................. 41
New England Energy Market Outlook – Demand for Gas Capacity and Impact of the NED Project
© 2015 5 icfi.com
Confidential and proprietary to ICF International
Executive Summary
ICF International (“ICF”) was engaged by Kinder Morgan Inc. (“KM”) to analyze the New
England natural gas and power markets and the need for new natural gas supplies and
capacity to serve the region. As part of this study, ICF was also asked to analyze
potential energy market, reliability and other benefits that may arise from the
construction of their proposed Northeast Energy Direct (“NED”) pipeline project to
serve the New England region. As described in more detail in this report, the NED market project would
originate at interconnects with interstate pipelines near Wright, New York and terminate at interstate
pipeline interconnections near Dracut, Massachusetts.
In this study, ICF projects natural gas demand and supply in New England through 2035 and assesses the
demand/supply capacity balance on a daily basis for discrete years. Emphasis is placed on understanding
the demand for capacity during the winter season, when natural gas is in high demand as a fuel for heating
and power generation. Sensitivity analyses consider the implications for capacity under both normal and
“design” weather conditions.1 The design weather condition is analyzed because it is a utility planning
standard that recognizes the essential nature of services and the consequences of disruptions under
extreme weather conditions — since a few hours of electricity disruption could result in loss of life and
economic loss worth hundreds of millions of dollars, it is important to know what the system can tolerate.
NED’s benefits to the New England electric market are estimated for the 10-year period after the project
is placed into service. Findings and conclusions integrate base case analysis produced using ICF’s
proprietary market models and market data.
ICF’s analysis of energy demand/supply trends supports a finding that New England faces the risk of
persistent and growing natural gas supply constraints, absent new sources of capacity. Given the current
structure of the regional energy markets, such risks could disproportionately affect electricity markets,
raising economic and potential service reliability concerns for consumers across the region. This report
provides quantitative assessments of the timing and magnitude of the impending gas supply constraints,
and the potential benefits associated with the development of new pipeline capacity that NED offers.
NED’s contribution to reduced and more stable gas prices is derived from providing incremental
transportation access to economic natural gas supply sources.
Key observations and conclusions are summarized below.
1 “Design” weather represents a utility standard for defining extreme conditions; typically the coldest temperatures on record
over a specified period of years. Utility practice varies from looking at the most recent 30 years to as long as temperature records have been kept.
New England Energy Market Outlook – Demand for Gas Capacity and Impact of the NED Project
© 2015 6 icfi.com
Confidential and proprietary to ICF International
Outlook for New England Gas Market Growth
New England Local Distribution Companies (LDCs) project that residential and commercial gas
demand will increase by 8% over the next 3 years, and continue at a moderate pace thereafter
As a result of state initiatives to expand natural gas use in both the residential and commercial sectors,
New England LDCs project their firm load requirements to grow by over 8% between 2015 and 2018.
Through 2035, ICF projects that residential and commercial demand will grow at an average rate of 1.3%
per year, with corresponding increases in winter peak day and seasonal demand.
New England power sector gas demand will grow as gas-fired power generation capacity
replaces retired coal and nuclear capacity
Cumulative retirements of nuclear, coal and older oil/gas units in New England are expected to reach
3,480 MW by 2019. In the future, the New England electricity market will be increasingly served by a
combination of natural gas, renewable and energy efficiency sources. ICF Base Case projections assume
that all states will achieve their stated Renewable Portfolio Standards (“RPS”) targets on schedule.2
Growth in electric load will be partially offset by energy efficiency gains, reducing projected growth in net
energy load to 0.8% per year through 2035. Notwithstanding these increases in renewables and energy
efficiency, ICF projects that the region will require approximately 1,750 MW of new gas-fired generating
capacity by 2019, further increasing power sector gas demand.
New England Gas Supply/Demand Balance
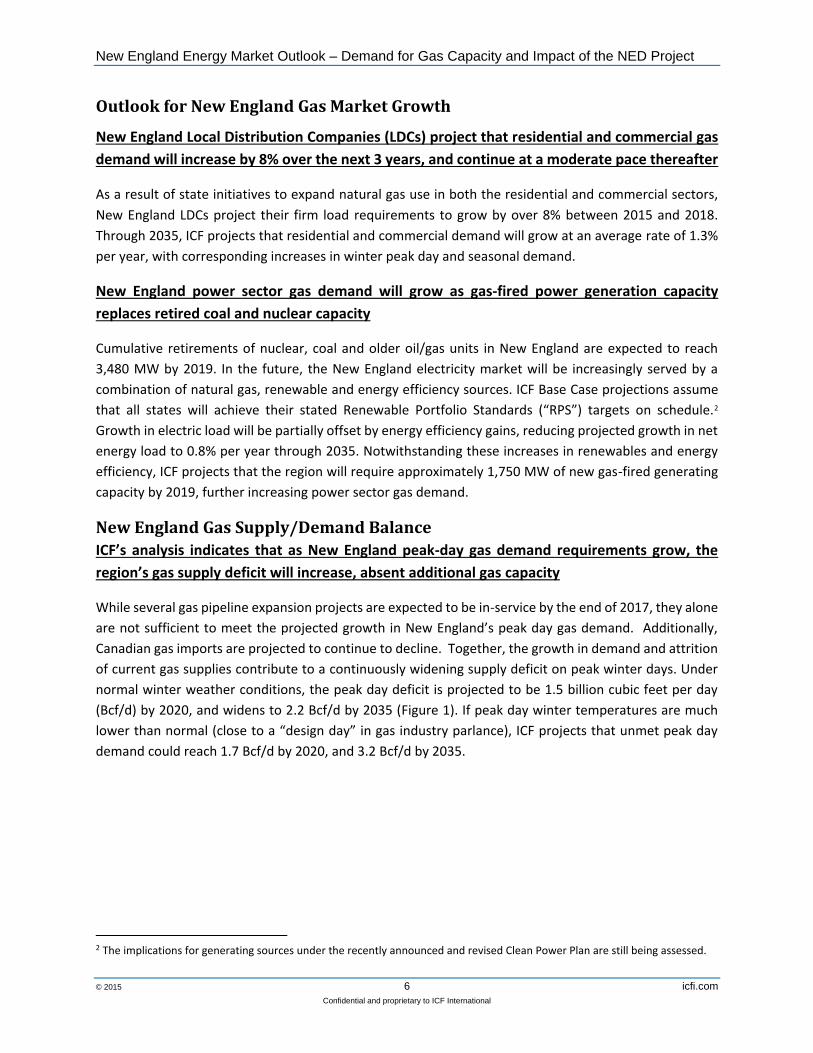
ICF’s analysis indicates that as New England peak-day gas demand requirements grow, the
region’s gas supply deficit will increase, absent additional gas capacity
While several gas pipeline expansion projects are expected to be in-service by the end of 2017, they alone
are not sufficient to meet the projected growth in New England’s peak day gas demand. Additionally,
Canadian gas imports are projected to continue to decline. Together, the growth in demand and attrition
of current gas supplies contribute to a continuously widening supply deficit on peak winter days. Under
normal winter weather conditions, the peak day deficit is projected to be 1.5 billion cubic feet per day
(Bcf/d) by 2020, and widens to 2.2 Bcf/d by 2035 (Figure 1). If peak day winter temperatures are much
lower than normal (close to a “design day” in gas industry parlance), ICF projects that unmet peak day
demand could reach 1.7 Bcf/d by 2020, and 3.2 Bcf/d by 2035.
2 The implications for generating sources under the recently announced and revised Clean Power Plan are still being assessed.
New England Energy Market Outlook – Demand for Gas Capacity and Impact of the NED Project
© 2015 7 icfi.com
Confidential and proprietary to ICF International
Figure 1: New England Normal Weather Peak Day Demand and Supply Balance
Source: ICF, note that red numbers indicate the size of the supply deficit.
Increased natural gas consumption for electric generation will contribute to increases in the
frequency and magnitude of daily natural gas capacity deficits over the course of a winter
season
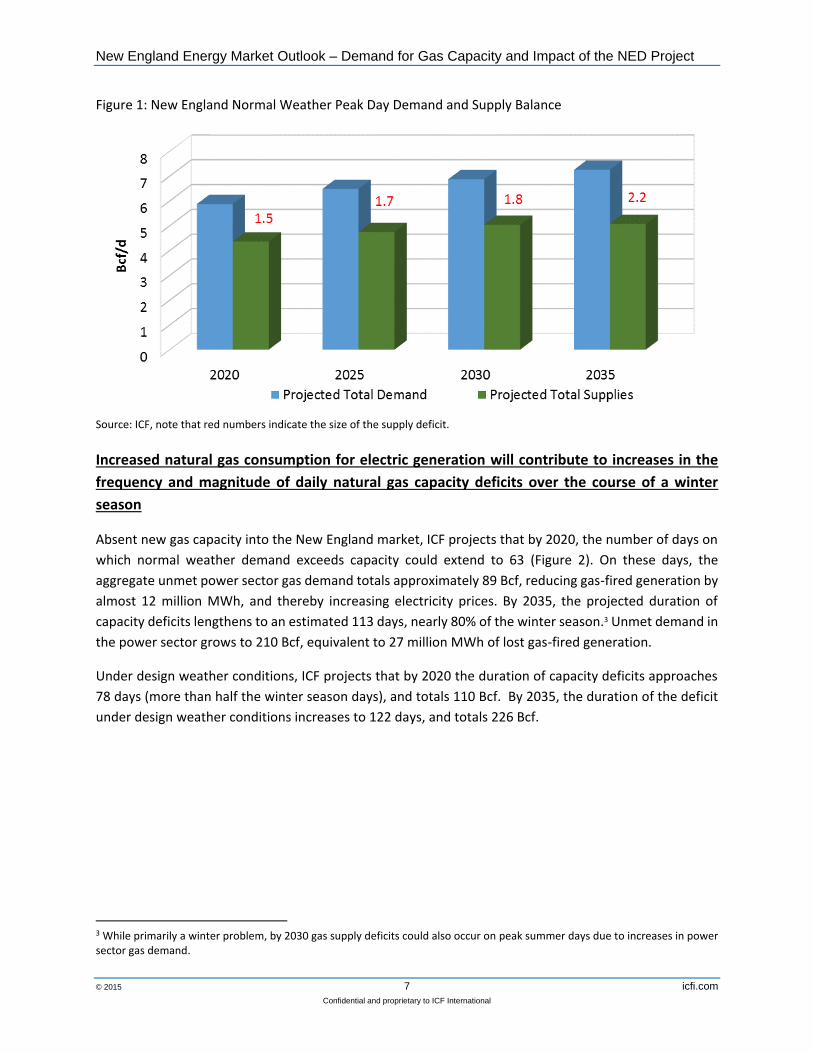
Absent new gas capacity into the New England market, ICF projects that by 2020, the number of days on
which normal weather demand exceeds capacity could extend to 63 (Figure 2). On these days, the
aggregate unmet power sector gas demand totals approximately 89 Bcf, reducing gas-fired generation by
almost 12 million MWh, and thereby increasing electricity prices. By 2035, the projected duration of
capacity deficits lengthens to an estimated 113 days, nearly 80% of the winter season.3 Unmet demand in
the power sector grows to 210 Bcf, equivalent to 27 million MWh of lost gas-fired generation.
Under design weather conditions, ICF projects that by 2020 the duration of capacity deficits approaches
78 days (more than half the winter season days), and totals 110 Bcf. By 2035, the duration of the deficit
under design weather conditions increases to 122 days, and totals 226 Bcf.
3 While primarily a winter problem, by 2030 gas supply deficits could also occur on peak summer days due to increases in power sector gas demand.
New England Energy Market Outlook – Demand for Gas Capacity and Impact of the NED Project
© 2015 8 icfi.com
Confidential and proprietary to ICF International
Figure 2: New England Normal Weather Load Duration Curves, 2020 - 2035
Source: ICF
The implication of these findings is that under both normal and design conditions, New England is
projected to experience continued and growing gaps between available gas demand and supply capacity.
These deficits will grow in daily frequency and impact the availability of gas supplies for power generation.
NED Electric Market Benefits
NED capacity could have reduced New England wholesale electric costs by approximately $3.7
billion had it been in service during the 2013/14 winter
The 2013/14 “Polar Vortex” winter resulted in both record high and exceptionally volatile gas prices, which
had a direct impact on wholesale power prices. ICF analyzed historical gas pipeline load factors and
natural gas prices to estimate the potential reductions in New England wholesale power prices that might
have been realized had the NED market project been in service. Based on reduced load factors and power
prices, ICF estimates total potential savings of $3.7 billion dollars had NED been in service during the
winter of 2013/14.
In a normal weather year, NED could save New England electric consumers $2.1 billion to $2.8
billion per year
ICF estimates that, on average, NED could save New England electric consumers $2.1 billion to $2.8 billion
per year over its first ten years of operation (2019 – 2028). For context, ISO-NE reported that “the total
value of the region’s wholesale electricity markets, including electric energy, capacity, and ancillary
services markets, rose…to about $9.9 billion in 2014 … [and electric] energy comprised $8.4 billion of the
total.”4 The potential cost savings stem from the highly correlated nature of natural gas prices and
4 ISO-NE Press Release on 2014 Annual Markets Report, at http://www.iso-ne.com/static-assets/documents/2015/05/amr14_release_05202015_final.pdf
New England Energy Market Outlook – Demand for Gas Capacity and Impact of the NED Project
© 2015 9 icfi.com
Confidential and proprietary to ICF International
wholesale power prices in New England, and the fact that lower gas prices resulting from NED capacity
can also reduce wholesale power prices. These savings would ultimately extend to all New England electric
consumers, including those in the states not directly receiving natural gas from the NED project.
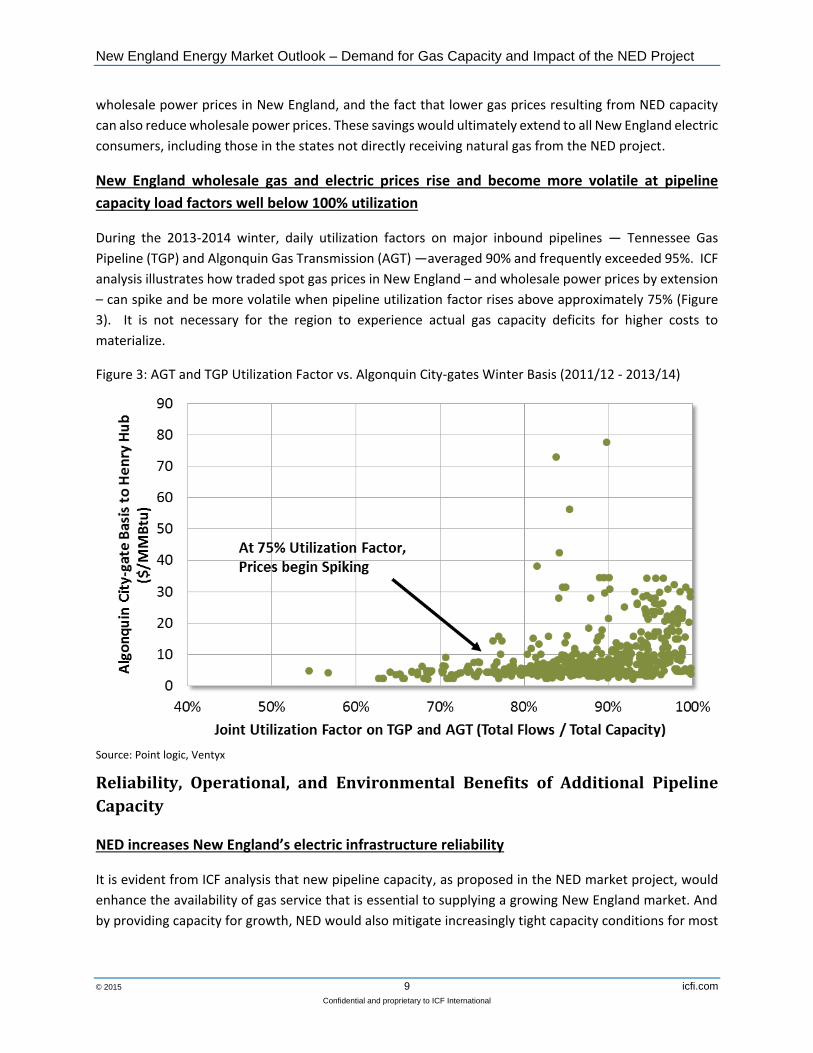
New England wholesale gas and electric prices rise and become more volatile at pipeline
capacity load factors well below 100% utilization
During the 2013-2014 winter, daily utilization factors on major inbound pipelines — Tennessee Gas
Pipeline (TGP) and Algonquin Gas Transmission (AGT) —averaged 90% and frequently exceeded 95%. ICF
analysis illustrates how traded spot gas prices in New England – and wholesale power prices by extension
– can spike and be more volatile when pipeline utilization factor rises above approximately 75% (Figure
3). It is not necessary for the region to experience actual gas capacity deficits for higher costs to
materialize.
Figure 3: AGT and TGP Utilization Factor vs. Algonquin City-gates Winter Basis (2011/12 - 2013/14)
Source: Point logic, Ventyx
Reliability, Operational, and Environmental Benefits of Additional Pipeline
Capacity
NED increases New England’s electric infrastructure reliability
It is evident from ICF analysis that new pipeline capacity, as proposed in the NED market project, would
enhance the availability of gas service that is essential to supplying a growing New England market. And
by providing capacity for growth, NED would also mitigate increasingly tight capacity conditions for most
New England Energy Market Outlook – Demand for Gas Capacity and Impact of the NED Project
© 2015 10 icfi.com
Confidential and proprietary to ICF International
power generators in New England.5 As such, for new and existing gas shippers alike, NED would also
provide valuable reliability against service interruptions.
The NED-TGP integration would support service continuity for roughly 50%, or 9,049 MW, of New
England’s current power supplies, shown in Table 1. Based on average dispatch heat-rates, TGP services
support some of the most efficient electric generators in New England.
Table 1: TGP Served Power Generation in New England
Operating Capacity
(MW)
% of New England
Total
Average Generation
(GWh)
% of New England
Total
Average Gas Burn (Bcf/d)
% of New England
Total
Direct Deliveries 4,894 27% 17,080 32% 0.34 32%
Indirect Deliveries via Supplying LDCs 827 5% 1,601 3% 0.04 4%
Indirect Deliveries via Supplying AGT 3,328 18% 9,142 17% 0.18 17%
Total TGP 9,049 50% 27,823 52% 0.57 52%
* For the purposes of this table, Milford & Ocean States I & II are included as TGP Direct Deliveries. * Numbers in the table may not add up exactly to the total because of rounding. Source: SNL and ICF
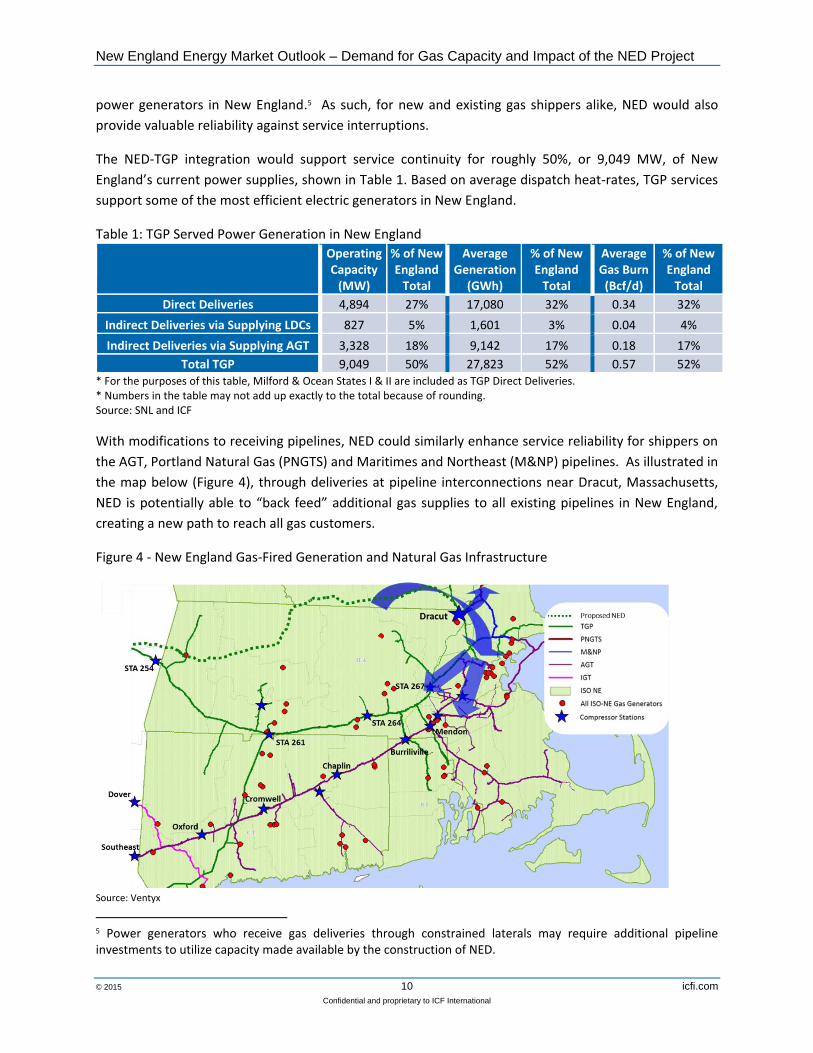
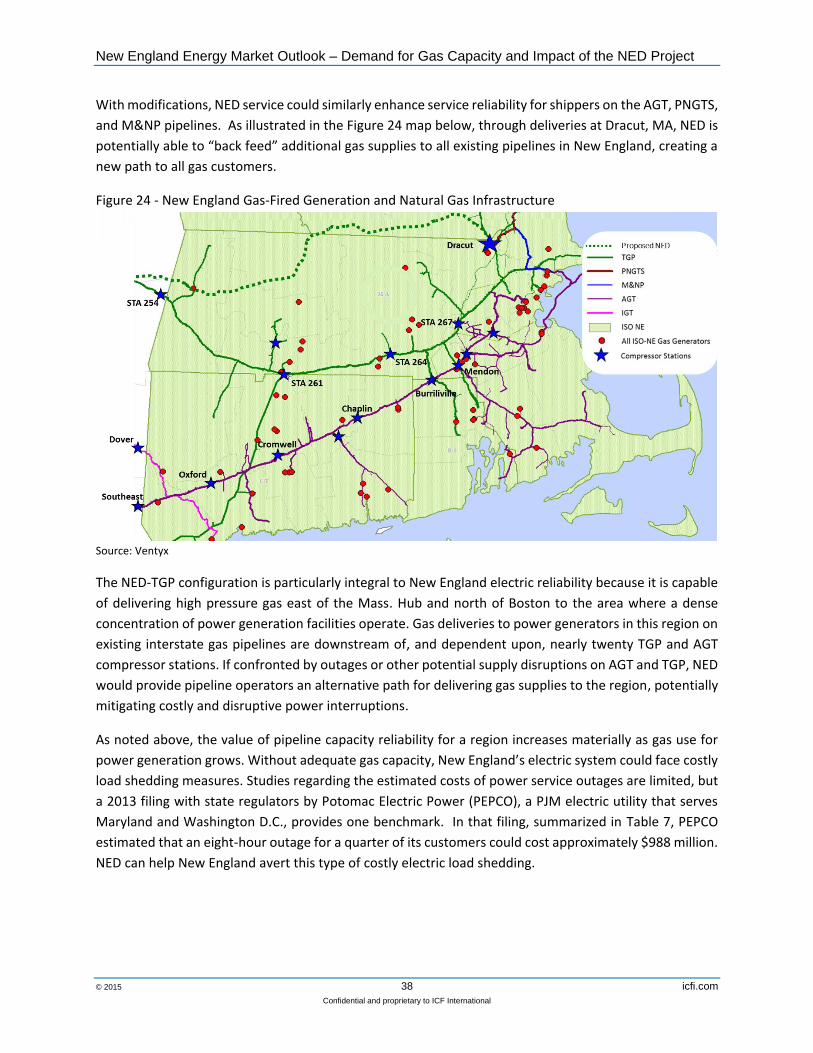
With modifications to receiving pipelines, NED could similarly enhance service reliability for shippers on
the AGT, Portland Natural Gas (PNGTS) and Maritimes and Northeast (M&NP) pipelines. As illustrated in
the map below (Figure 4), through deliveries at pipeline interconnections near Dracut, Massachusetts,
NED is potentially able to “back feed” additional gas supplies to all existing pipelines in New England,
creating a new path to reach all gas customers.
Figure 4 - New England Gas-Fired Generation and Natural Gas Infrastructure
Source: Ventyx
5 Power generators who receive gas deliveries through constrained laterals may require additional pipeline investments to utilize capacity made available by the construction of NED.
New England Energy Market Outlook – Demand for Gas Capacity and Impact of the NED Project
© 2015 11 icfi.com
Confidential and proprietary to ICF International
The NED-TGP configuration is particularly integral to New England electric reliability because it is capable
of delivering high pressure gas east of the Mass. Hub and north of Boston to an area where a dense
concentration of power generation facilities operate. Gas deliveries to power generators in this region on
existing interstate gas pipelines are downstream of, and dependent upon, nearly twenty TGP and AGT
compressor stations. If confronted by outages or other potential supply disruptions on existing AGT and
TGP facilities, NED would provide pipeline operators an alternative path for delivering gas supplies to the
region, potentially mitigating costly and disruptive power interruptions.
As noted above, the value of pipeline capacity reliability for a region increases materially as gas use for
power generation grows. Without adequate gas capacity, New England’s electric system could face costly
load shedding measures. NED can help New England avert or lessen this type of costly electric load
shedding.
NED increases the existing gas and electric infrastructure’s operational flexibility
Gas-fired electric generators require large volumes of high-pressure gas to operate. However, their
demand for gas can vary with electric markets and load conditions throughout the day, creating rapid
ramps up and down in gas loads. Pipeline operators typically will work with their shippers to accommodate
such intra-day “swings,” but their flexibility to do so is contingent upon having capacity adequate to meet
firm demand.6 If they do not have sufficient capacity above and beyond firm demand, their flexibility to
meet power generator demand fluctuations is limited.
Furthermore, absent new pipeline capacity additions, intra-day swing flexibility will inevitably erode as
large power generation loads are added (a process that has been happening rapidly in New England over
the past decade). These restrictions on intra-day load swings apply to both power and non-power gas
shippers. The remedy for lost operational flexibility is either to curb demand or to purchase additional
firm pipeline capacity that meets peak-hour needs within a day. Both solutions come with additional costs.
NED could restore and enhance the system’s operational flexibility to support power generators’ intra-
day swings, and thereby mitigate these added costs.
NED provides essential support for renewable generation
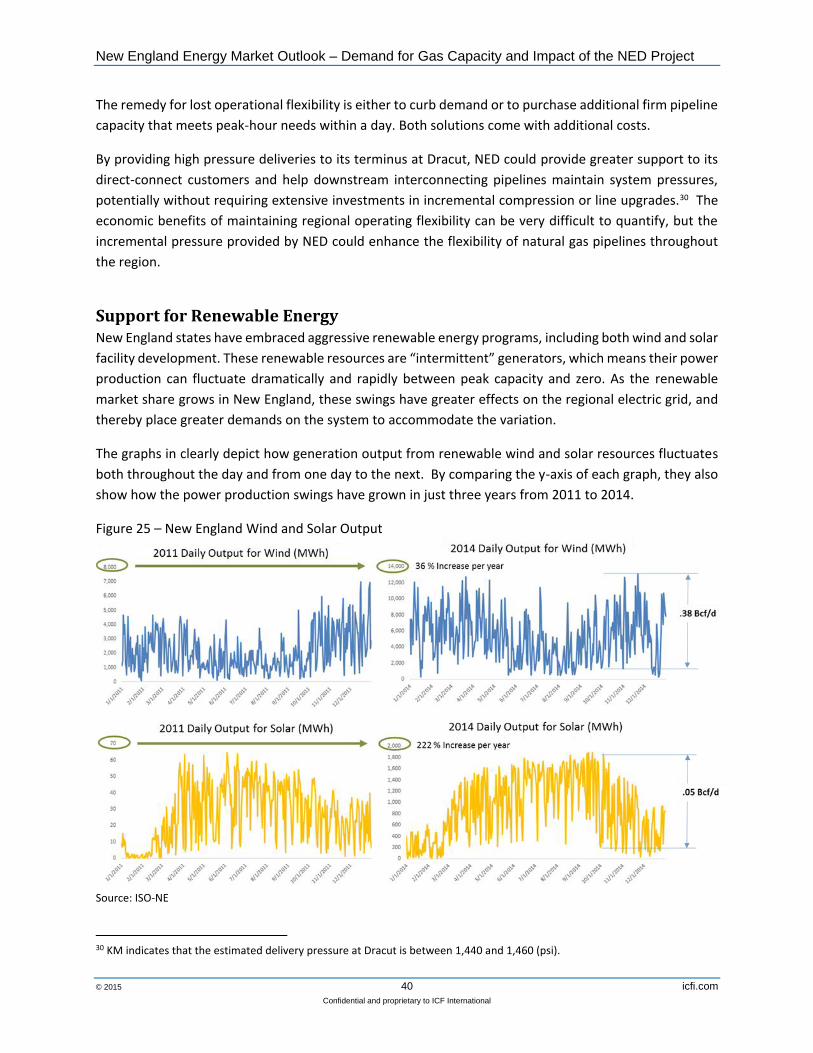
New England states have embraced aggressive renewable energy programs, including both wind and solar
resource development. These renewable resources are “intermittent” generators, which means their
power production can fluctuate dramatically and rapidly between peak capacity and zero. As the
renewable market share grows in New England, these swings have greater effects on the regional electric
grid, and thereby place greater demands on the system to accommodate the variation.
Gas-fired generation is a highly complementary resource to buffer the intermittent production of
renewable energy. Unlike other types of power generation that are more rigid in their dispatch
6 As is explained in the report, gas LDCs typically purchase “firm” service, which guarantees gas delivery. Power generators typically buy their supply from leftover capacity. This gas comes at a lower cost than firm supplies, but is “interruptible,” meaning that it is only available if there is capacity left over after firm customers are supplied. “Shippers” comprise all entities that contract with a pipeline for capacity and transportation of natural gas and own it while it is being transported by the pipeline.
New England Energy Market Outlook – Demand for Gas Capacity and Impact of the NED Project
© 2015 12 icfi.com
Confidential and proprietary to ICF International
capabilities, gas turbines are engineered to ramp up and down in tandem with renewable generation
variability. Assuming these turbines can be supplied with gas on a comparable schedule, gas generation
therefore provides an ideal complement to renewable energy. In that regard, the pipeline system’s
operational flexibility — which would be enhanced by NED — is a key source of capacity that can enable
gas turbines to manage intermittent renewable power, and support the rise of renewable generation in
New England.
NED provides environmental benefits by reducing power sector air emissions
Over the past ten years, New England’s power sector has dramatically reduced NOx, SO2, and CO2
emissions by shifting from oil- and coal-fired generation to natural gas. Introducing new natural gas
transportation capacity into New England would further reduce the region’s reliance on oil- and coal-fired
generation and provide additional incremental reductions in emissions.
ICF estimates that by 2020, absent new pipeline capacity, New England generators would encounter the
equivalent of approximately 12 million MWh of gas supply deficits to meet power demands. Using fuel oil
instead of gas to bridge such a deficit would emit an additional 5 thousand tons of NOx, 67 thousand tons
of SO2, and 5.6 million tons of CO2 into the atmosphere than gas-fired generation. These additional
emissions would sharply reverse the previous decade’s reductions, and represent respective increases of
23%, 372% and 14% of total NOx, SO2, and CO2 over 2013 emission levels.
New England Energy Market Outlook – Demand for Gas Capacity and Impact of the NED Project
© 2015 13 icfi.com
Confidential and proprietary to ICF International
Introduction
Study Background For the past 15 years, New England has been steadily increasing its reliance on natural gas-fired electricity
generation. At present, approximately 50% of New England’s power comes from gas-fired generation,
compared to roughly 15%7 in 2000. The projected retirements of regional nuclear and coal-fired power
plants will result in the construction of new gas-fired generation and continue this trend.
The growth in gas-fired generation raises important questions about the reliability of gas supplies to meet
that demand. Central to the issue is New England’s reliance on interruptible gas supplies for much of its
power generation fuel supply. Unlike LDCs, which contract for firm pipeline and storage services to ensure
gas supplies (especially on the coldest days), most gas-fired generators in New England rely on non-firm
(or “interruptible”) pipeline capacity for their fuel supplies. This practice worked in the past because
power sector gas demand was concentrated in the summer months, when interruptible pipeline capacity
is widely available. However, gas-fired power plants now provide a high percentage of total electric
generation throughout the year, including the winter months when LDC demands are high and
interruptible capacity is scarce. As more nuclear and coal plants retire and at least some portion of their
capacity is replaced by more gas-fired generation, year-round power sector gas demand will continue to
increase, and it will be increasingly difficult to meet power sector gas demand on peak winter days.
In a recent article for IEEE Power & Energy Magazine on conditions during the winter of 2013/14, ISO-NE
stated that “subordinate contracts for gas transport were generally not available to power providers.”8
ISO-NE was able to avoid potential brownouts and blackouts during the winter of 2013/14 through the
implementation of a number of measures, most notably its “Winter Reliability Program”.9 However, one
of the consequences of constraints on gas supplies has been extremely high and volatile natural gas prices
during the winter months. This increases the cost of fuel for electric generators, which results in higher
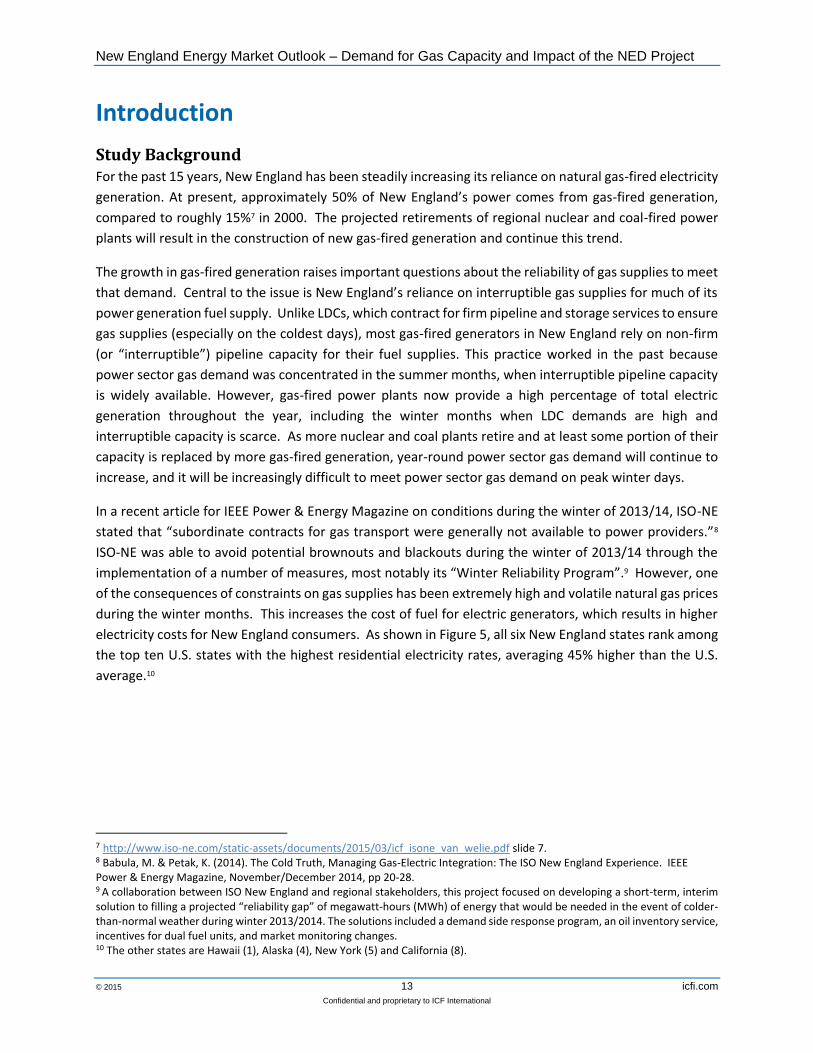
electricity costs for New England consumers. As shown in Figure 5, all six New England states rank among
the top ten U.S. states with the highest residential electricity rates, averaging 45% higher than the U.S.
average.10
7 http://www.iso-ne.com/static-assets/documents/2015/03/icf_isone_van_welie.pdf slide 7. 8 Babula, M. & Petak, K. (2014). The Cold Truth, Managing Gas-Electric Integration: The ISO New England Experience. IEEE Power & Energy Magazine, November/December 2014, pp 20-28. 9 A collaboration between ISO New England and regional stakeholders, this project focused on developing a short-term, interim solution to filling a projected “reliability gap” of megawatt-hours (MWh) of energy that would be needed in the event of colder-than-normal weather during winter 2013/2014. The solutions included a demand side response program, an oil inventory service, incentives for dual fuel units, and market monitoring changes. 10 The other states are Hawaii (1), Alaska (4), New York (5) and California (8).
New England Energy Market Outlook – Demand for Gas Capacity and Impact of the NED Project
© 2015 14 icfi.com
Confidential and proprietary to ICF International
Figure 5: Residential Electricity Rates Ranking by State (Highest to Lowest)
Source: EIA
In 2013, the governors of all six New England states issued a joint statement on natural gas and electric
system interdependency, and the need for regional cooperation on energy infrastructure issues.11 In 2015,
the governors again released a joint statement, acknowledging that “New England continues to face
significant energy system challenges with serious economic consequences for the region’s consumers.
These challenges require cost-effective solutions to reduce consumer energy costs, strengthen grid
reliability and enhance regional economic competitiveness”.12
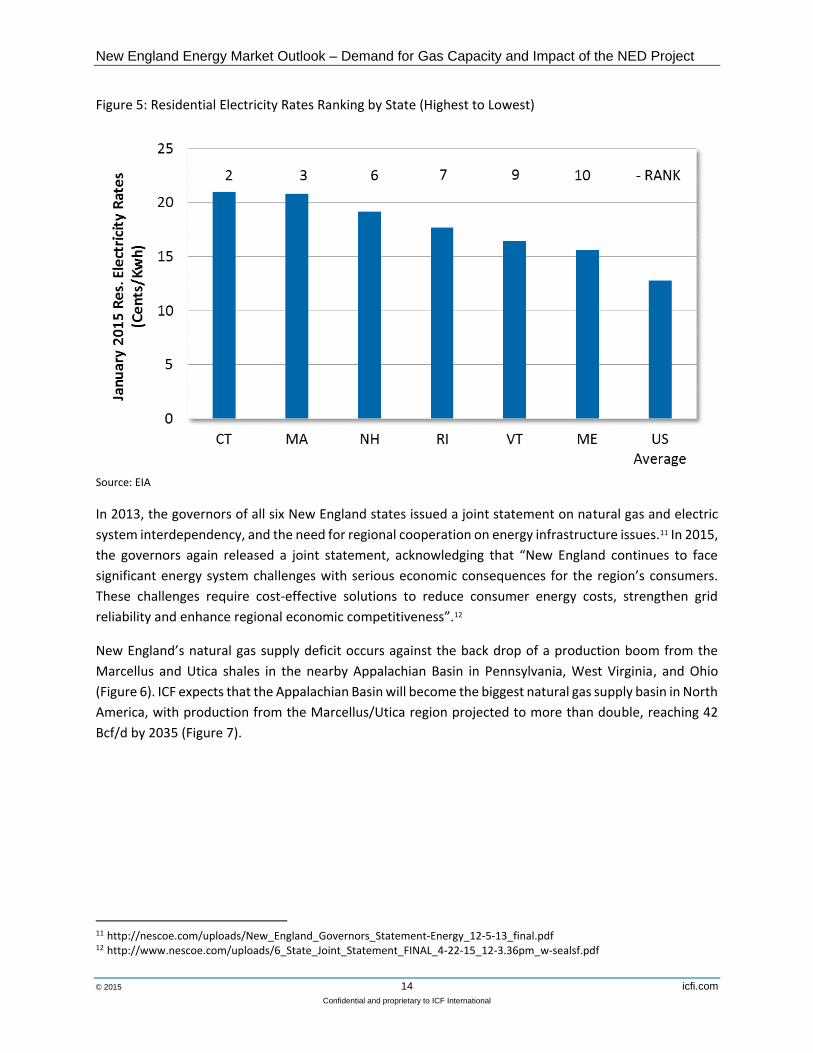
New England’s natural gas supply deficit occurs against the back drop of a production boom from the
Marcellus and Utica shales in the nearby Appalachian Basin in Pennsylvania, West Virginia, and Ohio
(Figure 6). ICF expects that the Appalachian Basin will become the biggest natural gas supply basin in North
America, with production from the Marcellus/Utica region projected to more than double, reaching 42
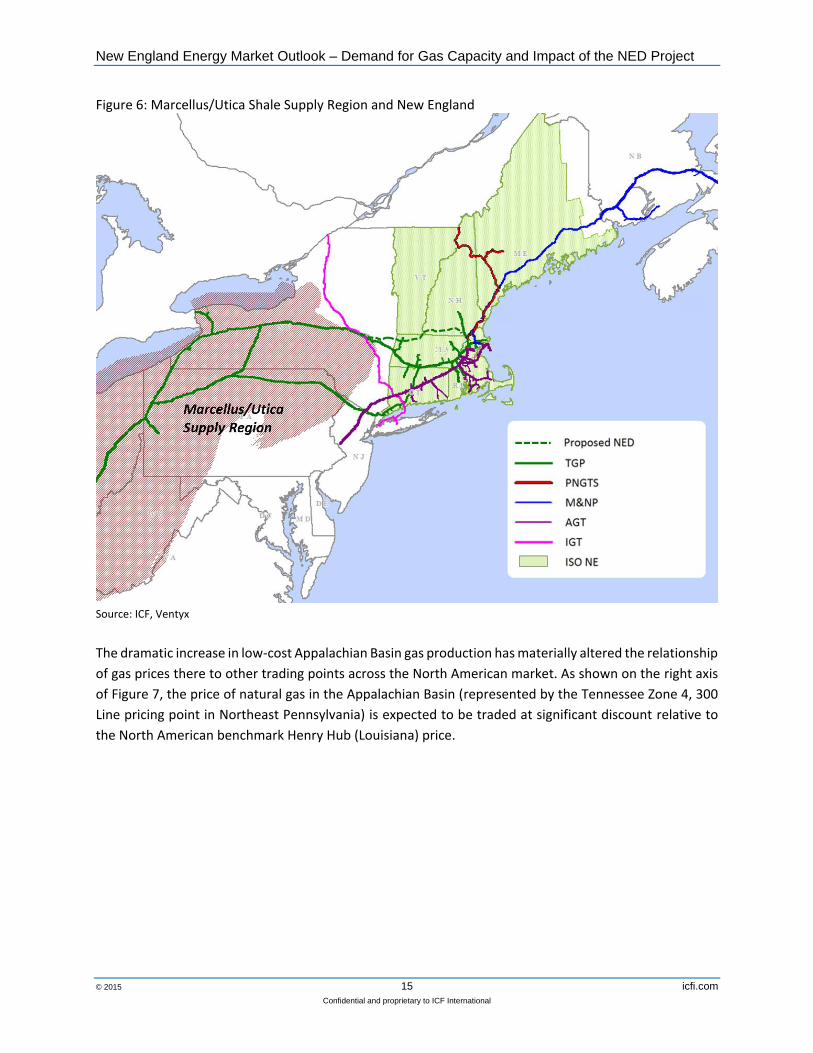
Bcf/d by 2035 (Figure 7).
11 http://nescoe.com/uploads/New_England_Governors_Statement-Energy_12-5-13_final.pdf 12 http://www.nescoe.com/uploads/6_State_Joint_Statement_FINAL_4-22-15_12-3.36pm_w-sealsf.pdf
New England Energy Market Outlook – Demand for Gas Capacity and Impact of the NED Project
© 2015 15 icfi.com
Confidential and proprietary to ICF International
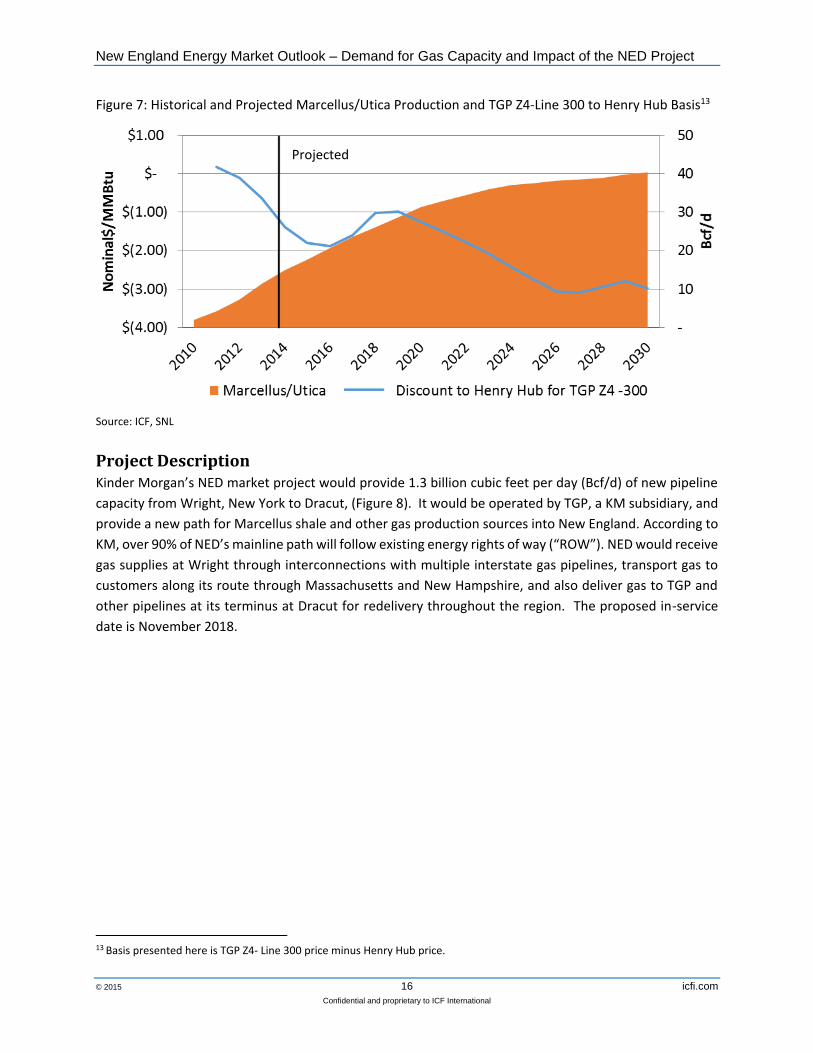
Figure 6: Marcellus/Utica Shale Supply Region and New England
Source: ICF, Ventyx
The dramatic increase in low-cost Appalachian Basin gas production has materially altered the relationship
of gas prices there to other trading points across the North American market. As shown on the right axis
of Figure 7, the price of natural gas in the Appalachian Basin (represented by the Tennessee Zone 4, 300
Line pricing point in Northeast Pennsylvania) is expected to be traded at significant discount relative to
the North American benchmark Henry Hub (Louisiana) price.
New England Energy Market Outlook – Demand for Gas Capacity and Impact of the NED Project
© 2015 16 icfi.com
Confidential and proprietary to ICF International
Figure 7: Historical and Projected Marcellus/Utica Production and TGP Z4-Line 300 to Henry Hub Basis13
Source: ICF, SNL
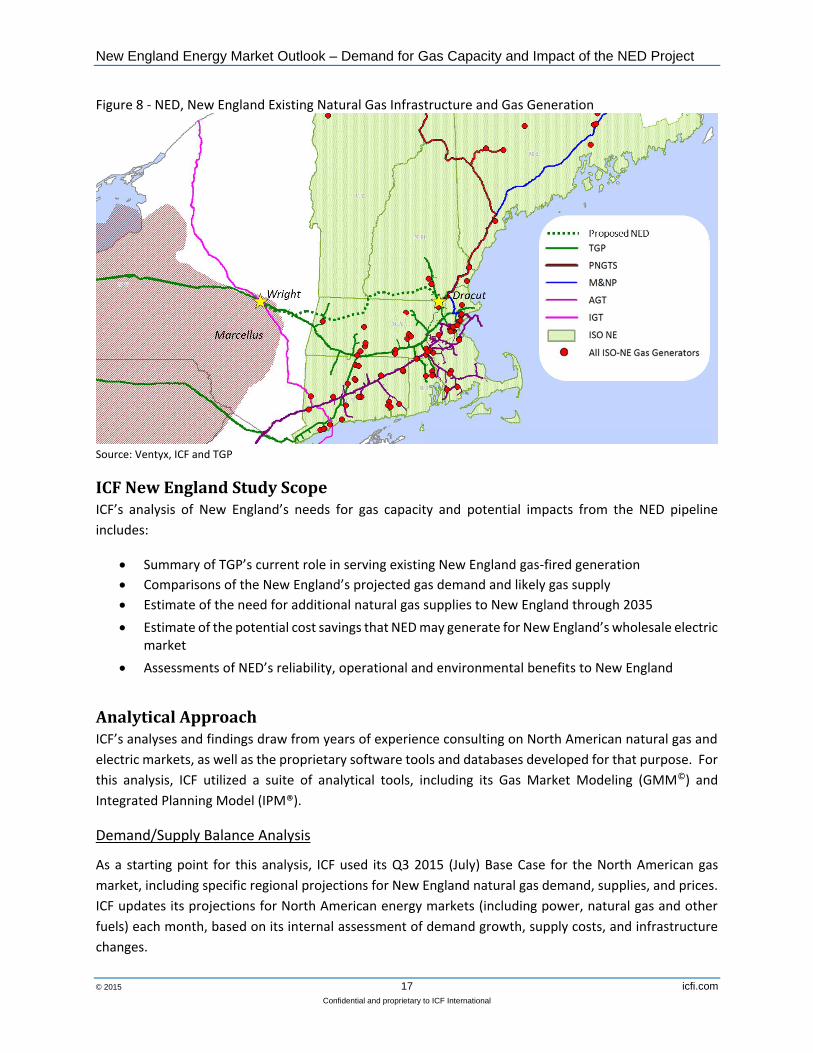
Project Description Kinder Morgan’s NED market project would provide 1.3 billion cubic feet per day (Bcf/d) of new pipeline
capacity from Wright, New York to Dracut, (Figure 8). It would be operated by TGP, a KM subsidiary, and
provide a new path for Marcellus shale and other gas production sources into New England. According to
KM, over 90% of NED’s mainline path will follow existing energy rights of way (“ROW”). NED would receive
gas supplies at Wright through interconnections with multiple interstate gas pipelines, transport gas to
customers along its route through Massachusetts and New Hampshire, and also deliver gas to TGP and
other pipelines at its terminus at Dracut for redelivery throughout the region. The proposed in-service
date is November 2018.
13 Basis presented here is TGP Z4- Line 300 price minus Henry Hub price.
Projected
New England Energy Market Outlook – Demand for Gas Capacity and Impact of the NED Project
© 2015 17 icfi.com
Confidential and proprietary to ICF International
Figure 8 - NED, New England Existing Natural Gas Infrastructure and Gas Generation
Source: Ventyx, ICF and TGP
ICF New England Study Scope ICF’s analysis of New England’s needs for gas capacity and potential impacts from the NED pipeline
includes:
Summary of TGP’s current role in serving existing New England gas-fired generation
Comparisons of the New England’s projected gas demand and likely gas supply
Estimate of the need for additional natural gas supplies to New England through 2035
Estimate of the potential cost savings that NED may generate for New England’s wholesale electric market
Assessments of NED’s reliability, operational and environmental benefits to New England
Analytical Approach ICF’s analyses and findings draw from years of experience consulting on North American natural gas and
electric markets, as well as the proprietary software tools and databases developed for that purpose. For
this analysis, ICF utilized a suite of analytical tools, including its Gas Market Modeling (GMM©) and
Integrated Planning Model (IPM®).
Demand/Supply Balance Analysis
As a starting point for this analysis, ICF used its Q3 2015 (July) Base Case for the North American gas
market, including specific regional projections for New England natural gas demand, supplies, and prices.
ICF updates its projections for North American energy markets (including power, natural gas and other
fuels) each month, based on its internal assessment of demand growth, supply costs, and infrastructure
changes.
New England Energy Market Outlook – Demand for Gas Capacity and Impact of the NED Project
© 2015 18 icfi.com
Confidential and proprietary to ICF International
Short-term residential and commercial demand for natural gas is projected using the portfolio plans filed
by major New England LDCs. Long-term projections are based upon the historical relationship between
residential and commercial natural gas consumption to population and economic growth.
Future growth in gas demand from the power sector is estimated using ICF’s IPM® model, which considers
New England’s electric gross annual and peak load growth, energy efficiency, renewable policies and
nuclear strategy. ICF models the impact of environmental policies, such as MATS, CSAPR and a Federal
cap-and-trade program on CO2 starting in 2020.14 Power sector demand is projected with reasonable
natural gas supply availability to dispatch the region’s generation portfolio.
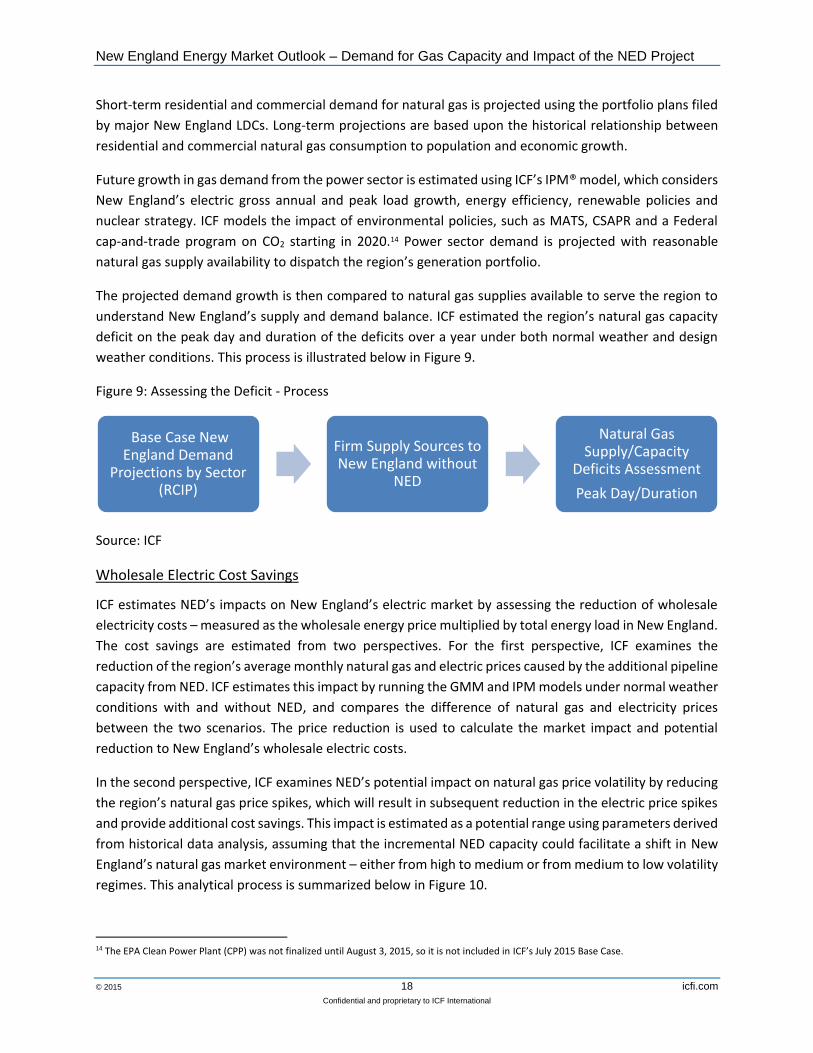
The projected demand growth is then compared to natural gas supplies available to serve the region to
understand New England’s supply and demand balance. ICF estimated the region’s natural gas capacity
deficit on the peak day and duration of the deficits over a year under both normal weather and design
weather conditions. This process is illustrated below in Figure 9.
Figure 9: Assessing the Deficit - Process
Source: ICF
Wholesale Electric Cost Savings
ICF estimates NED’s impacts on New England’s electric market by assessing the reduction of wholesale
electricity costs – measured as the wholesale energy price multiplied by total energy load in New England.
The cost savings are estimated from two perspectives. For the first perspective, ICF examines the
reduction of the region’s average monthly natural gas and electric prices caused by the additional pipeline
capacity from NED. ICF estimates this impact by running the GMM and IPM models under normal weather
conditions with and without NED, and compares the difference of natural gas and electricity prices
between the two scenarios. The price reduction is used to calculate the market impact and potential
reduction to New England’s wholesale electric costs.
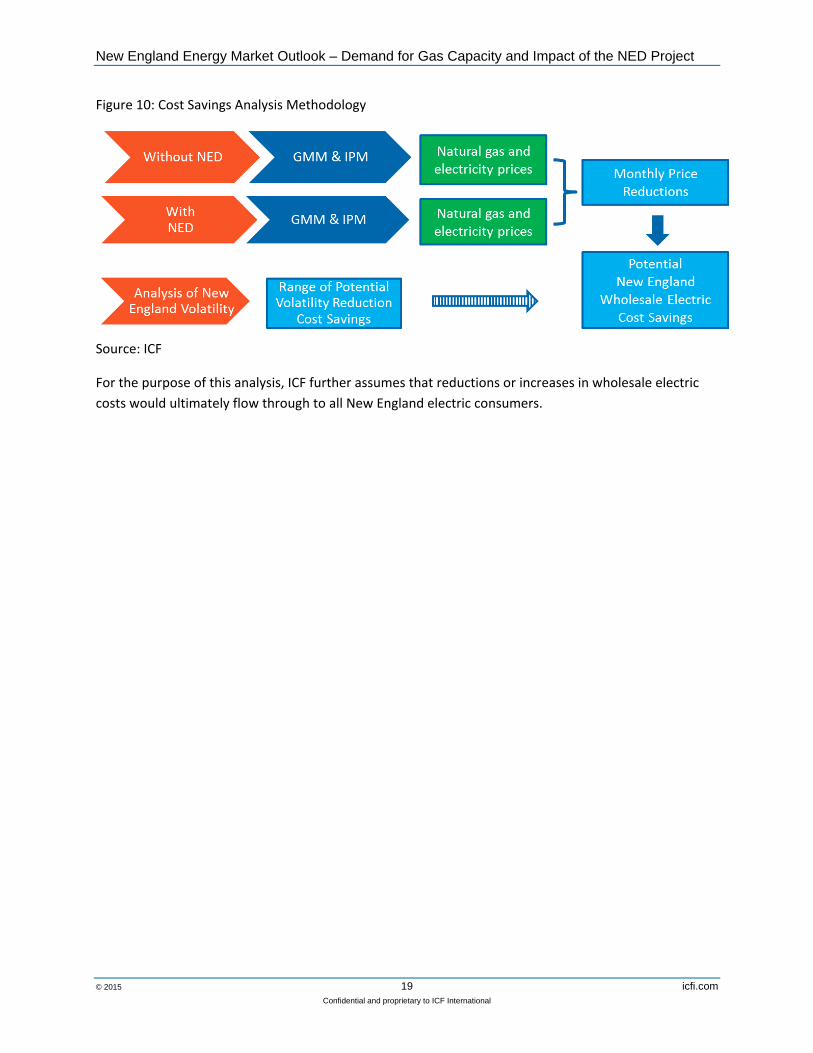
In the second perspective, ICF examines NED’s potential impact on natural gas price volatility by reducing
the region’s natural gas price spikes, which will result in subsequent reduction in the electric price spikes
and provide additional cost savings. This impact is estimated as a potential range using parameters derived
from historical data analysis, assuming that the incremental NED capacity could facilitate a shift in New
England’s natural gas market environment – either from high to medium or from medium to low volatility
regimes. This analytical process is summarized below in Figure 10.
14 The EPA Clean Power Plant (CPP) was not finalized until August 3, 2015, so it is not included in ICF’s July 2015 Base Case.
Base Case New England Demand
Projections by Sector (RCIP)
Firm Supply Sources to New England without
NED
Natural Gas Supply/Capacity
Deficits Assessment
Peak Day/Duration
New England Energy Market Outlook – Demand for Gas Capacity and Impact of the NED Project
© 2015 19 icfi.com
Confidential and proprietary to ICF International
Figure 10: Cost Savings Analysis Methodology
Source: ICF
For the purpose of this analysis, ICF further assumes that reductions or increases in wholesale electric
costs would ultimately flow through to all New England electric consumers.
New England Energy Market Outlook – Demand for Gas Capacity and Impact of the NED Project
© 2015 20 icfi.com
Confidential and proprietary to ICF International
Base Case Market Fundamentals
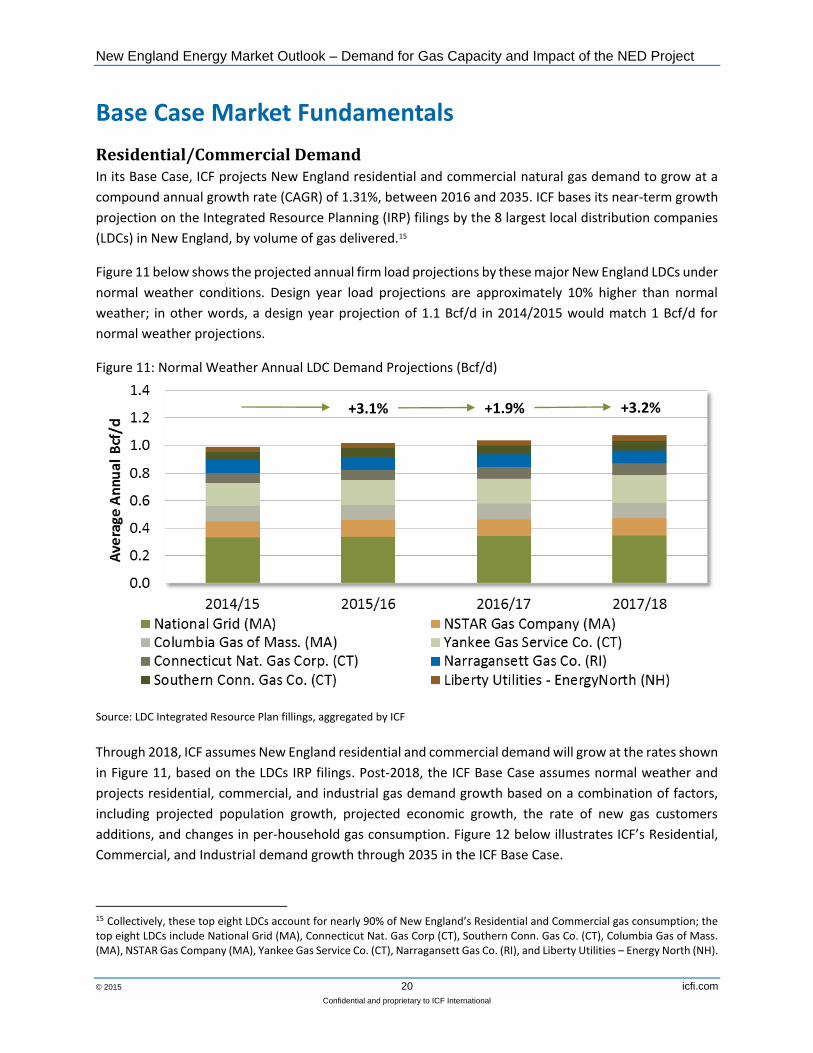
Residential/Commercial Demand In its Base Case, ICF projects New England residential and commercial natural gas demand to grow at a
compound annual growth rate (CAGR) of 1.31%, between 2016 and 2035. ICF bases its near-term growth
projection on the Integrated Resource Planning (IRP) filings by the 8 largest local distribution companies
(LDCs) in New England, by volume of gas delivered.15
Figure 11 below shows the projected annual firm load projections by these major New England LDCs under
normal weather conditions. Design year load projections are approximately 10% higher than normal
weather; in other words, a design year projection of 1.1 Bcf/d in 2014/2015 would match 1 Bcf/d for
normal weather projections.
Figure 11: Normal Weather Annual LDC Demand Projections (Bcf/d)
Source: LDC Integrated Resource Plan fillings, aggregated by ICF
Through 2018, ICF assumes New England residential and commercial demand will grow at the rates shown
in Figure 11, based on the LDCs IRP filings. Post-2018, the ICF Base Case assumes normal weather and
projects residential, commercial, and industrial gas demand growth based on a combination of factors,
including projected population growth, projected economic growth, the rate of new gas customers
additions, and changes in per-household gas consumption. Figure 12 below illustrates ICF’s Residential,
Commercial, and Industrial demand growth through 2035 in the ICF Base Case.
15 Collectively, these top eight LDCs account for nearly 90% of New England’s Residential and Commercial gas consumption; the top eight LDCs include National Grid (MA), Connecticut Nat. Gas Corp (CT), Southern Conn. Gas Co. (CT), Columbia Gas of Mass. (MA), NSTAR Gas Company (MA), Yankee Gas Service Co. (CT), Narragansett Gas Co. (RI), and Liberty Utilities – Energy North (NH).
+3.1% +3.2% +1.9%
New England Energy Market Outlook – Demand for Gas Capacity and Impact of the NED Project
© 2015 21 icfi.com
Confidential and proprietary to ICF International
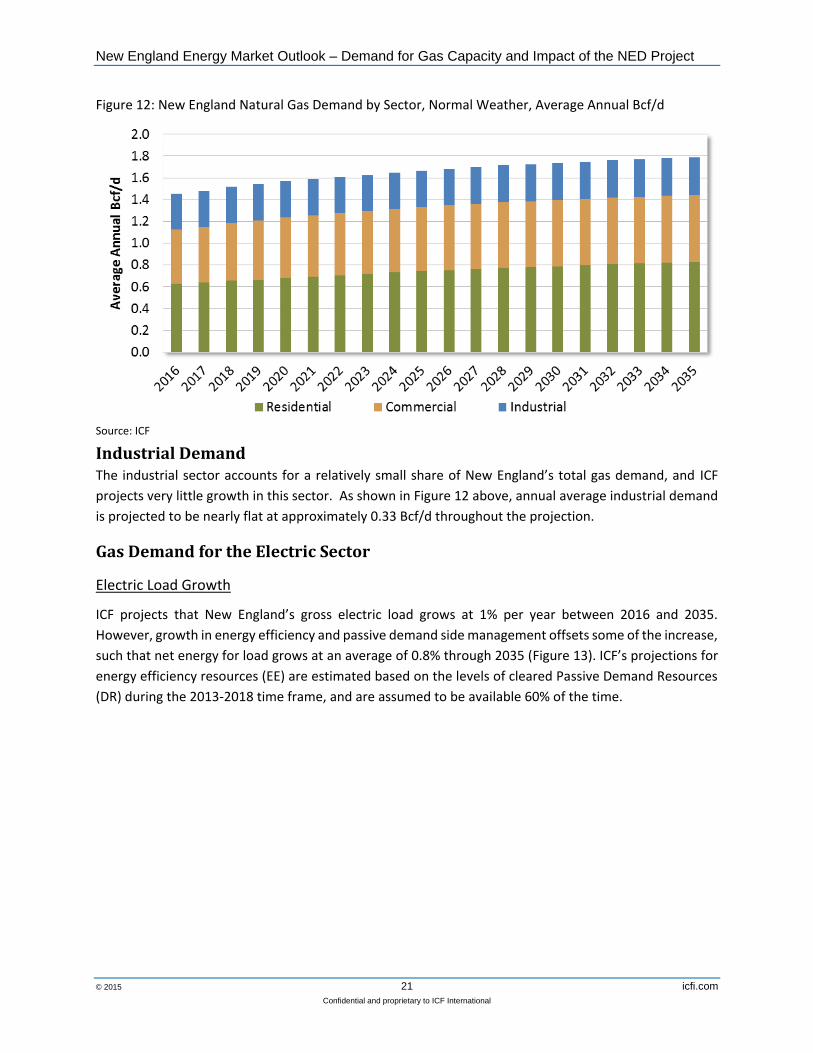
Figure 12: New England Natural Gas Demand by Sector, Normal Weather, Average Annual Bcf/d
Source: ICF
Industrial Demand The industrial sector accounts for a relatively small share of New England’s total gas demand, and ICF
projects very little growth in this sector. As shown in Figure 12 above, annual average industrial demand
is projected to be nearly flat at approximately 0.33 Bcf/d throughout the projection.
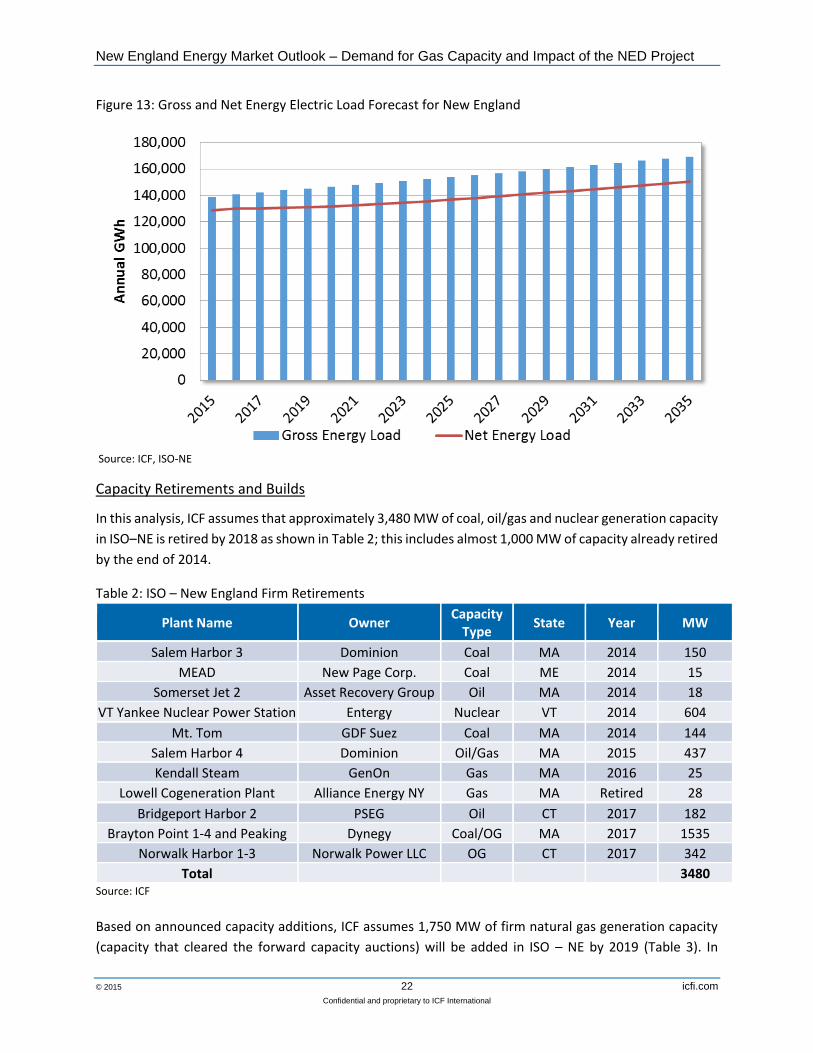
Gas Demand for the Electric Sector
Electric Load Growth
ICF projects that New England’s gross electric load grows at 1% per year between 2016 and 2035.
However, growth in energy efficiency and passive demand side management offsets some of the increase,
such that net energy for load grows at an average of 0.8% through 2035 (Figure 13). ICF’s projections for
energy efficiency resources (EE) are estimated based on the levels of cleared Passive Demand Resources
(DR) during the 2013-2018 time frame, and are assumed to be available 60% of the time.
New England Energy Market Outlook – Demand for Gas Capacity and Impact of the NED Project
© 2015 22 icfi.com
Confidential and proprietary to ICF International
Figure 13: Gross and Net Energy Electric Load Forecast for New England
Source: ICF, ISO-NE
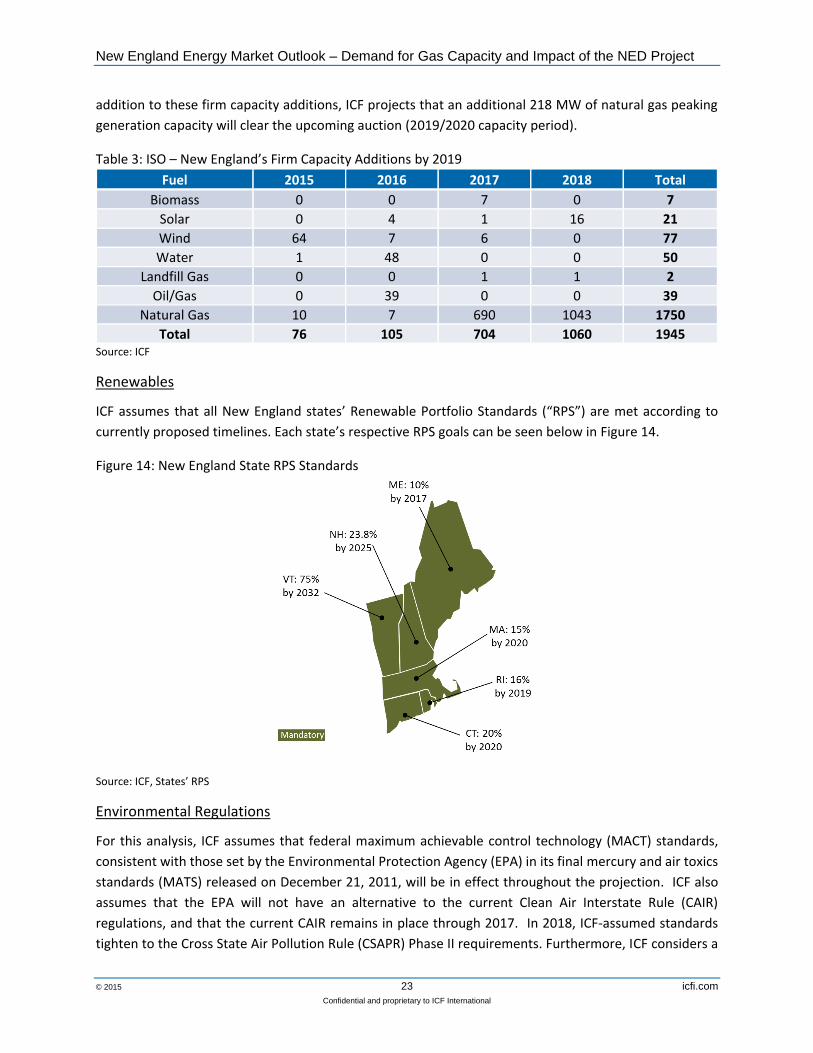
Capacity Retirements and Builds
In this analysis, ICF assumes that approximately 3,480 MW of coal, oil/gas and nuclear generation capacity
in ISO–NE is retired by 2018 as shown in Table 2; this includes almost 1,000 MW of capacity already retired
by the end of 2014.
Table 2: ISO – New England Firm Retirements
Plant Name Owner Capacity
Type State Year MW
Salem Harbor 3 Dominion Coal MA 2014 150
MEAD New Page Corp. Coal ME 2014 15
Somerset Jet 2 Asset Recovery Group Oil MA 2014 18
VT Yankee Nuclear Power Station Entergy Nuclear VT 2014 604
Mt. Tom GDF Suez Coal MA 2014 144
Salem Harbor 4 Dominion Oil/Gas MA 2015 437
Kendall Steam GenOn Gas MA 2016 25
Lowell Cogeneration Plant Alliance Energy NY Gas MA Retired 28
Bridgeport Harbor 2 PSEG Oil CT 2017 182
Brayton Point 1-4 and Peaking Dynegy Coal/OG MA 2017 1535
Norwalk Harbor 1-3 Norwalk Power LLC OG CT 2017 342
Total 3480 Source: ICF
Based on announced capacity additions, ICF assumes 1,750 MW of firm natural gas generation capacity
(capacity that cleared the forward capacity auctions) will be added in ISO – NE by 2019 (Table 3). In
New England Energy Market Outlook – Demand for Gas Capacity and Impact of the NED Project
© 2015 23 icfi.com
Confidential and proprietary to ICF International
addition to these firm capacity additions, ICF projects that an additional 218 MW of natural gas peaking
generation capacity will clear the upcoming auction (2019/2020 capacity period).
Table 3: ISO – New England’s Firm Capacity Additions by 2019
Fuel 2015 2016 2017 2018 Total
Biomass 0 0 7 0 7
Solar 0 4 1 16 21
Wind 64 7 6 0 77
Water 1 48 0 0 50
Landfill Gas 0 0 1 1 2
Oil/Gas 0 39 0 0 39
Natural Gas 10 7 690 1043 1750
Total 76 105 704 1060 1945
Source: ICF
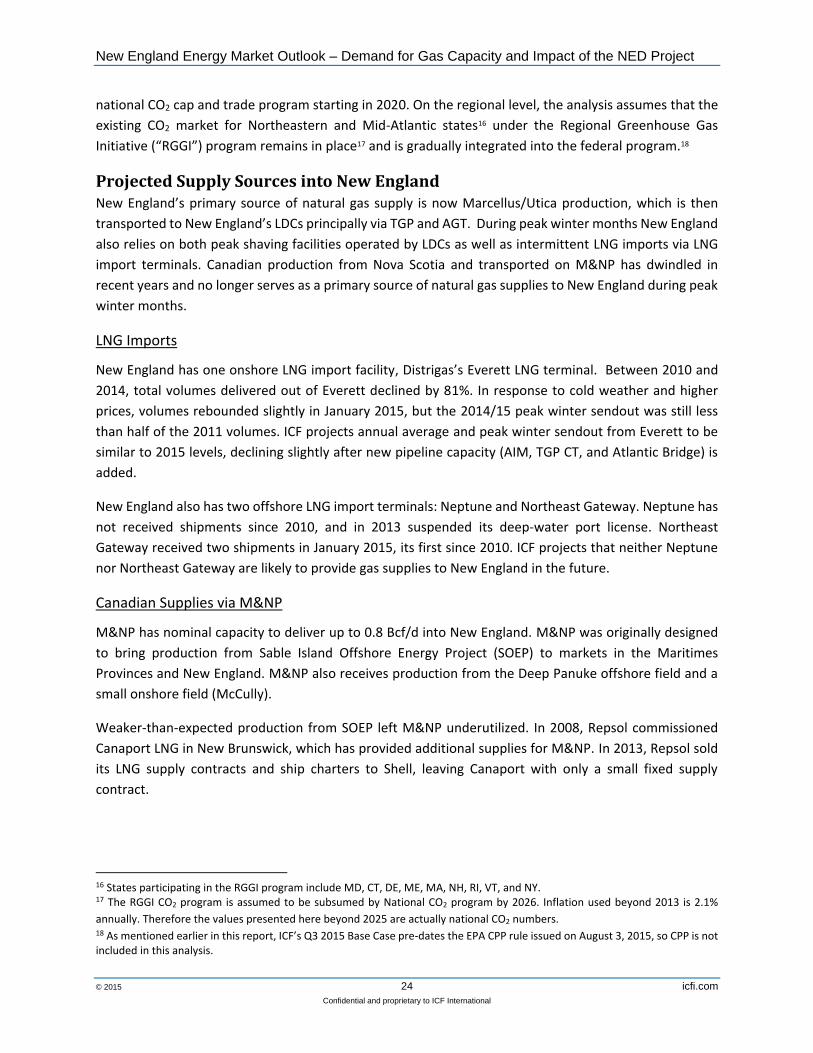
Renewables
ICF assumes that all New England states’ Renewable Portfolio Standards (“RPS”) are met according to
currently proposed timelines. Each state’s respective RPS goals can be seen below in Figure 14.
Figure 14: New England State RPS Standards
Source: ICF, States’ RPS
Environmental Regulations
For this analysis, ICF assumes that federal maximum achievable control technology (MACT) standards,
consistent with those set by the Environmental Protection Agency (EPA) in its final mercury and air toxics
standards (MATS) released on December 21, 2011, will be in effect throughout the projection. ICF also
assumes that the EPA will not have an alternative to the current Clean Air Interstate Rule (CAIR)
regulations, and that the current CAIR remains in place through 2017. In 2018, ICF-assumed standards
tighten to the Cross State Air Pollution Rule (CSAPR) Phase II requirements. Furthermore, ICF considers a
New England Energy Market Outlook – Demand for Gas Capacity and Impact of the NED Project
© 2015 24 icfi.com
Confidential and proprietary to ICF International
national CO2 cap and trade program starting in 2020. On the regional level, the analysis assumes that the
existing CO2 market for Northeastern and Mid-Atlantic states16 under the Regional Greenhouse Gas
Initiative (“RGGI”) program remains in place17 and is gradually integrated into the federal program.18
Projected Supply Sources into New England New England’s primary source of natural gas supply is now Marcellus/Utica production, which is then
transported to New England’s LDCs principally via TGP and AGT. During peak winter months New England
also relies on both peak shaving facilities operated by LDCs as well as intermittent LNG imports via LNG
import terminals. Canadian production from Nova Scotia and transported on M&NP has dwindled in
recent years and no longer serves as a primary source of natural gas supplies to New England during peak
winter months.
LNG Imports
New England has one onshore LNG import facility, Distrigas’s Everett LNG terminal. Between 2010 and
2014, total volumes delivered out of Everett declined by 81%. In response to cold weather and higher
prices, volumes rebounded slightly in January 2015, but the 2014/15 peak winter sendout was still less
than half of the 2011 volumes. ICF projects annual average and peak winter sendout from Everett to be
similar to 2015 levels, declining slightly after new pipeline capacity (AIM, TGP CT, and Atlantic Bridge) is
added.
New England also has two offshore LNG import terminals: Neptune and Northeast Gateway. Neptune has
not received shipments since 2010, and in 2013 suspended its deep-water port license. Northeast
Gateway received two shipments in January 2015, its first since 2010. ICF projects that neither Neptune
nor Northeast Gateway are likely to provide gas supplies to New England in the future.
Canadian Supplies via M&NP
M&NP has nominal capacity to deliver up to 0.8 Bcf/d into New England. M&NP was originally designed
to bring production from Sable Island Offshore Energy Project (SOEP) to markets in the Maritimes
Provinces and New England. M&NP also receives production from the Deep Panuke offshore field and a
small onshore field (McCully).
Weaker-than-expected production from SOEP left M&NP underutilized. In 2008, Repsol commissioned
Canaport LNG in New Brunswick, which has provided additional supplies for M&NP. In 2013, Repsol sold
its LNG supply contracts and ship charters to Shell, leaving Canaport with only a small fixed supply
contract.
16 States participating in the RGGI program include MD, CT, DE, ME, MA, NH, RI, VT, and NY. 17 The RGGI CO2 program is assumed to be subsumed by National CO2 program by 2026. Inflation used beyond 2013 is 2.1%
annually. Therefore the values presented here beyond 2025 are actually national CO2 numbers. 18 As mentioned earlier in this report, ICF’s Q3 2015 Base Case pre-dates the EPA CPP rule issued on August 3, 2015, so CPP is not included in this analysis.
New England Energy Market Outlook – Demand for Gas Capacity and Impact of the NED Project
© 2015 25 icfi.com
Confidential and proprietary to ICF International
Even as Eastern Canadian production and LNG imports have declined19, gas demand in the Maritimes
provinces has been increasing. While relatively small, at about 0.2 Bcf/d, demand in the Maritimes
provinces uses supplies that could otherwise be exported to New England. Flows on the M&NP system
have already reversed on occasion, with gas flowing north into New Brunswick. Even if Canaport continues
to import at or slightly above recent levels, the Maritime Provinces are likely to be net gas importers by
2020. As such, M&NP is unlikely to provide gas supplies during the winter peak starting in 2020.
Other Pipelines into New England
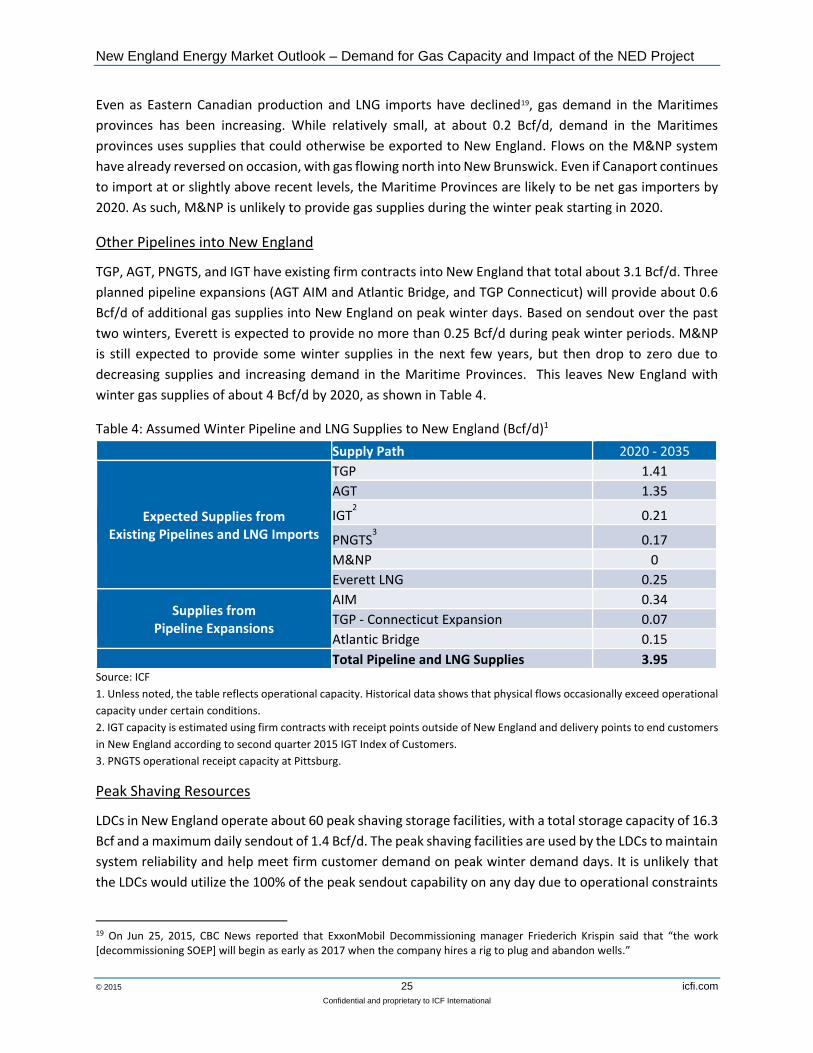
TGP, AGT, PNGTS, and IGT have existing firm contracts into New England that total about 3.1 Bcf/d. Three
planned pipeline expansions (AGT AIM and Atlantic Bridge, and TGP Connecticut) will provide about 0.6
Bcf/d of additional gas supplies into New England on peak winter days. Based on sendout over the past
two winters, Everett is expected to provide no more than 0.25 Bcf/d during peak winter periods. M&NP
is still expected to provide some winter supplies in the next few years, but then drop to zero due to
decreasing supplies and increasing demand in the Maritime Provinces. This leaves New England with
winter gas supplies of about 4 Bcf/d by 2020, as shown in Table 4.
Table 4: Assumed Winter Pipeline and LNG Supplies to New England (Bcf/d)1
Supply Path 2020 - 2035
Expected Supplies from Existing Pipelines and LNG Imports
TGP 1.41
AGT 1.35
IGT2 0.21
PNGTS3 0.17
M&NP 0
Everett LNG 0.25
Supplies from Pipeline Expansions
AIM 0.34
TGP - Connecticut Expansion 0.07
Atlantic Bridge 0.15
Total Pipeline and LNG Supplies 3.95 Source: ICF
1. Unless noted, the table reflects operational capacity. Historical data shows that physical flows occasionally exceed operational
capacity under certain conditions.
2. IGT capacity is estimated using firm contracts with receipt points outside of New England and delivery points to end customers
in New England according to second quarter 2015 IGT Index of Customers.
3. PNGTS operational receipt capacity at Pittsburg.
Peak Shaving Resources
LDCs in New England operate about 60 peak shaving storage facilities, with a total storage capacity of 16.3
Bcf and a maximum daily sendout of 1.4 Bcf/d. The peak shaving facilities are used by the LDCs to maintain
system reliability and help meet firm customer demand on peak winter demand days. It is unlikely that
the LDCs would utilize the 100% of the peak sendout capability on any day due to operational constraints
19 On Jun 25, 2015, CBC News reported that ExxonMobil Decommissioning manager Friederich Krispin said that “the work [decommissioning SOEP] will begin as early as 2017 when the company hires a rig to plug and abandon wells.”

New England Energy Market Outlook – Demand for Gas Capacity and Impact of the NED Project
© 2015 26 icfi.com
Confidential and proprietary to ICF International
and the desire to conserve peak shaving supplies for later in the season. ICF assumes a peak day sendout
of 1.1 Bcf/d, or 80% of maximum daily sendout capability. LDCs need their peak shaving capacity to ensure
reliable service for their firm demand customers, so they will not use it to meet spikes in non-firm power
sector gas demand.
New England Energy Market Outlook – Demand for Gas Capacity and Impact of the NED Project
© 2015 27 icfi.com
Confidential and proprietary to ICF International
New England Natural Gas Demand and Supply Balance
In order to determine if New England has sufficient natural gas infrastructure to serve the region’s growing
demand, ICF has compared projected daily gas demand and firm gas supplies for selected years.
Demand and supply balance analysis typically considers both “peak-day” — which is the day in a given
year with the highest demand — and annual consumption projections under both “normal” and “design”
conditions, where "normal” weather reflects long-term (20- to 30-year) averages and “design” weather
takes into account the coldest weather recorded over a designated time frame.20 The ICF demand/supply
analysis includes all four scenarios derived from combining these consumption and weather conditions,
with the objective of understanding potential gas supply or capacity deficits/surpluses for the highest
demand day, as well as their potential duration over a year. These findings provide valuable insights into
the optimal portfolio solutions for the region.
Capacity deficits are estimated as the difference between the Base Case projected demand and total gas
supplies.21 The estimated capacity deficits do not include potential needs for gas to support the
intermittent renewable generation. Duration of capacity deficits is the number of days during the specific
year when total demand exceeds total supplies.
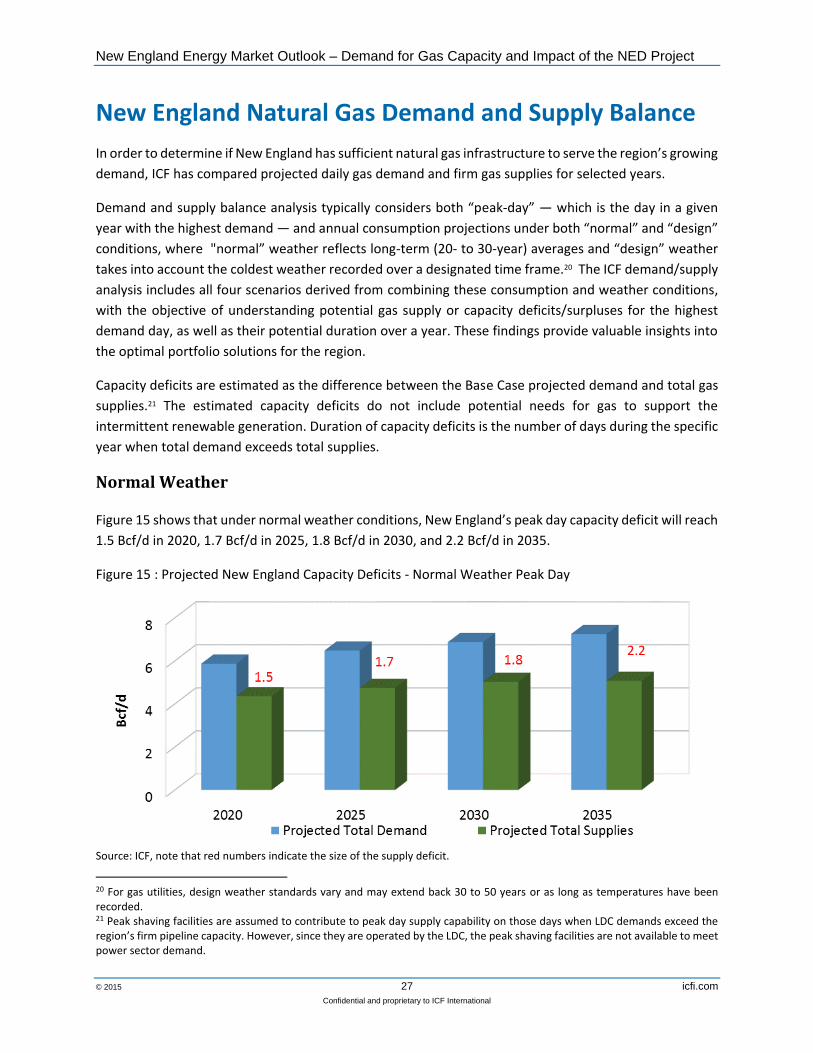
Normal Weather
Figure 15 shows that under normal weather conditions, New England’s peak day capacity deficit will reach
1.5 Bcf/d in 2020, 1.7 Bcf/d in 2025, 1.8 Bcf/d in 2030, and 2.2 Bcf/d in 2035.
Figure 15 : Projected New England Capacity Deficits - Normal Weather Peak Day
Source: ICF, note that red numbers indicate the size of the supply deficit.
20 For gas utilities, design weather standards vary and may extend back 30 to 50 years or as long as temperatures have been recorded. 21 Peak shaving facilities are assumed to contribute to peak day supply capability on those days when LDC demands exceed the region’s firm pipeline capacity. However, since they are operated by the LDC, the peak shaving facilities are not available to meet power sector demand.
2.2
New England Energy Market Outlook – Demand for Gas Capacity and Impact of the NED Project
© 2015 28 icfi.com
Confidential and proprietary to ICF International
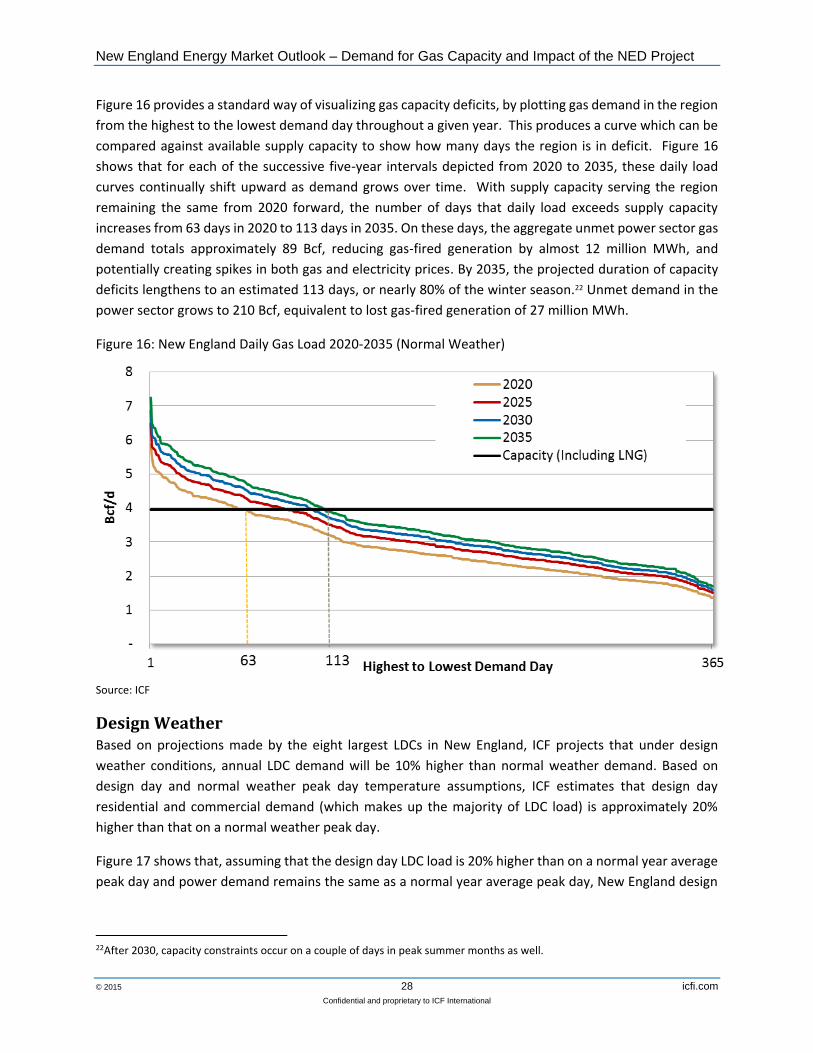
Figure 16 provides a standard way of visualizing gas capacity deficits, by plotting gas demand in the region
from the highest to the lowest demand day throughout a given year. This produces a curve which can be
compared against available supply capacity to show how many days the region is in deficit. Figure 16
shows that for each of the successive five-year intervals depicted from 2020 to 2035, these daily load
curves continually shift upward as demand grows over time. With supply capacity serving the region
remaining the same from 2020 forward, the number of days that daily load exceeds supply capacity
increases from 63 days in 2020 to 113 days in 2035. On these days, the aggregate unmet power sector gas
demand totals approximately 89 Bcf, reducing gas-fired generation by almost 12 million MWh, and
potentially creating spikes in both gas and electricity prices. By 2035, the projected duration of capacity
deficits lengthens to an estimated 113 days, or nearly 80% of the winter season.22 Unmet demand in the
power sector grows to 210 Bcf, equivalent to lost gas-fired generation of 27 million MWh.
Figure 16: New England Daily Gas Load 2020-2035 (Normal Weather)
Source: ICF
Design Weather Based on projections made by the eight largest LDCs in New England, ICF projects that under design
weather conditions, annual LDC demand will be 10% higher than normal weather demand. Based on
design day and normal weather peak day temperature assumptions, ICF estimates that design day
residential and commercial demand (which makes up the majority of LDC load) is approximately 20%
higher than that on a normal weather peak day.
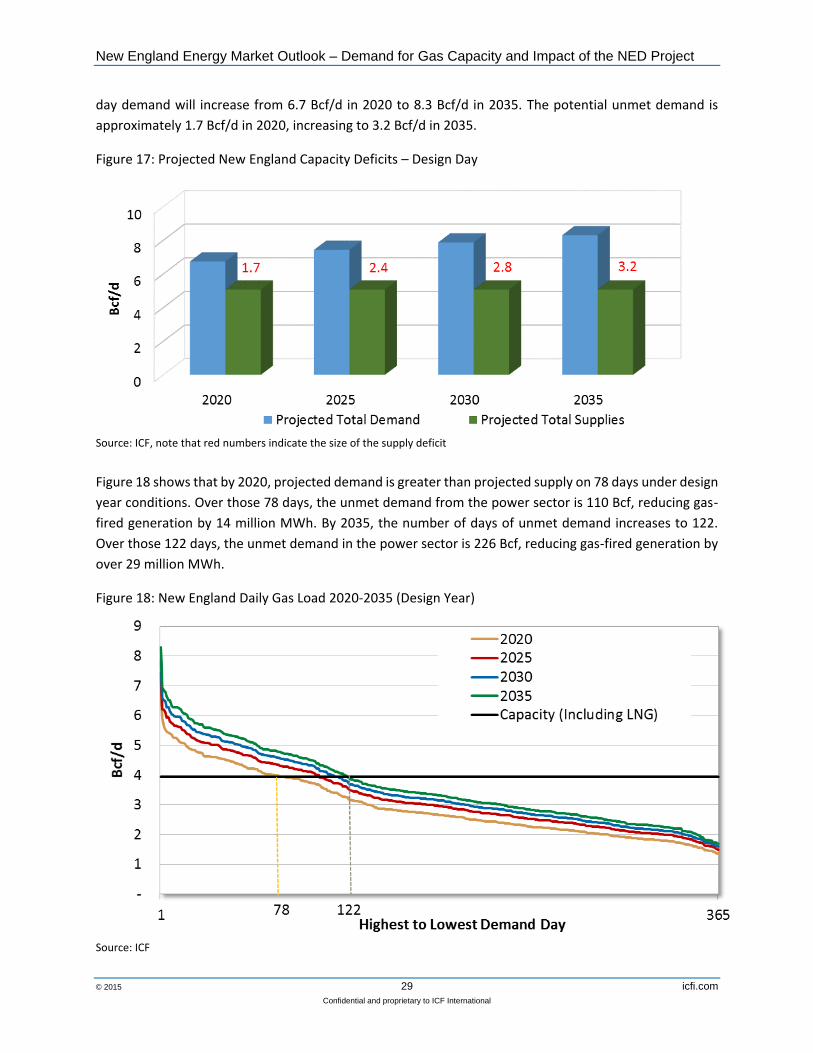
Figure 17 shows that, assuming that the design day LDC load is 20% higher than on a normal year average
peak day and power demand remains the same as a normal year average peak day, New England design
22After 2030, capacity constraints occur on a couple of days in peak summer months as well.
New England Energy Market Outlook – Demand for Gas Capacity and Impact of the NED Project
© 2015 29 icfi.com
Confidential and proprietary to ICF International
day demand will increase from 6.7 Bcf/d in 2020 to 8.3 Bcf/d in 2035. The potential unmet demand is
approximately 1.7 Bcf/d in 2020, increasing to 3.2 Bcf/d in 2035.
Figure 17: Projected New England Capacity Deficits – Design Day
Source: ICF, note that red numbers indicate the size of the supply deficit
Figure 18 shows that by 2020, projected demand is greater than projected supply on 78 days under design
year conditions. Over those 78 days, the unmet demand from the power sector is 110 Bcf, reducing gas-
fired generation by 14 million MWh. By 2035, the number of days of unmet demand increases to 122.
Over those 122 days, the unmet demand in the power sector is 226 Bcf, reducing gas-fired generation by
over 29 million MWh.
Figure 18: New England Daily Gas Load 2020-2035 (Design Year)
Source: ICF
New England Energy Market Outlook – Demand for Gas Capacity and Impact of the NED Project
© 2015 30 icfi.com
Confidential and proprietary to ICF International
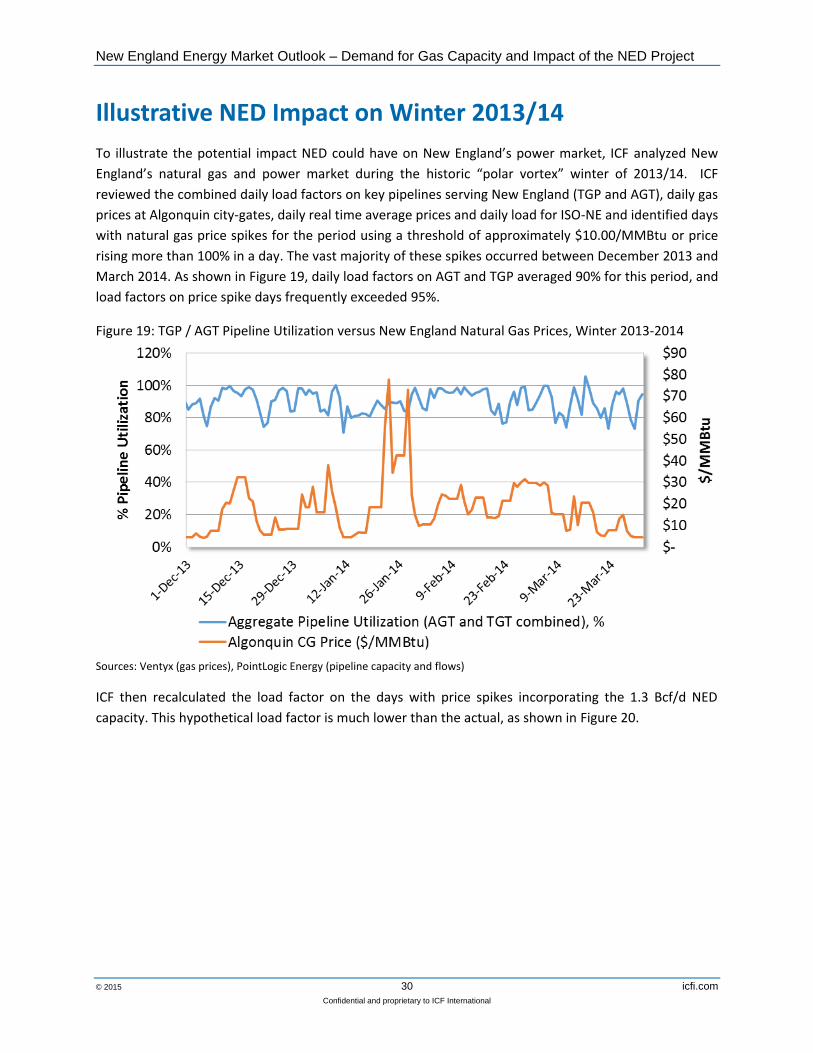
Illustrative NED Impact on Winter 2013/14
To illustrate the potential impact NED could have on New England’s power market, ICF analyzed New
England’s natural gas and power market during the historic “polar vortex” winter of 2013/14. ICF
reviewed the combined daily load factors on key pipelines serving New England (TGP and AGT), daily gas
prices at Algonquin city-gates, daily real time average prices and daily load for ISO-NE and identified days
with natural gas price spikes for the period using a threshold of approximately $10.00/MMBtu or price
rising more than 100% in a day. The vast majority of these spikes occurred between December 2013 and
March 2014. As shown in Figure 19, daily load factors on AGT and TGP averaged 90% for this period, and
load factors on price spike days frequently exceeded 95%.
Figure 19: TGP / AGT Pipeline Utilization versus New England Natural Gas Prices, Winter 2013-2014
Sources: Ventyx (gas prices), PointLogic Energy (pipeline capacity and flows)
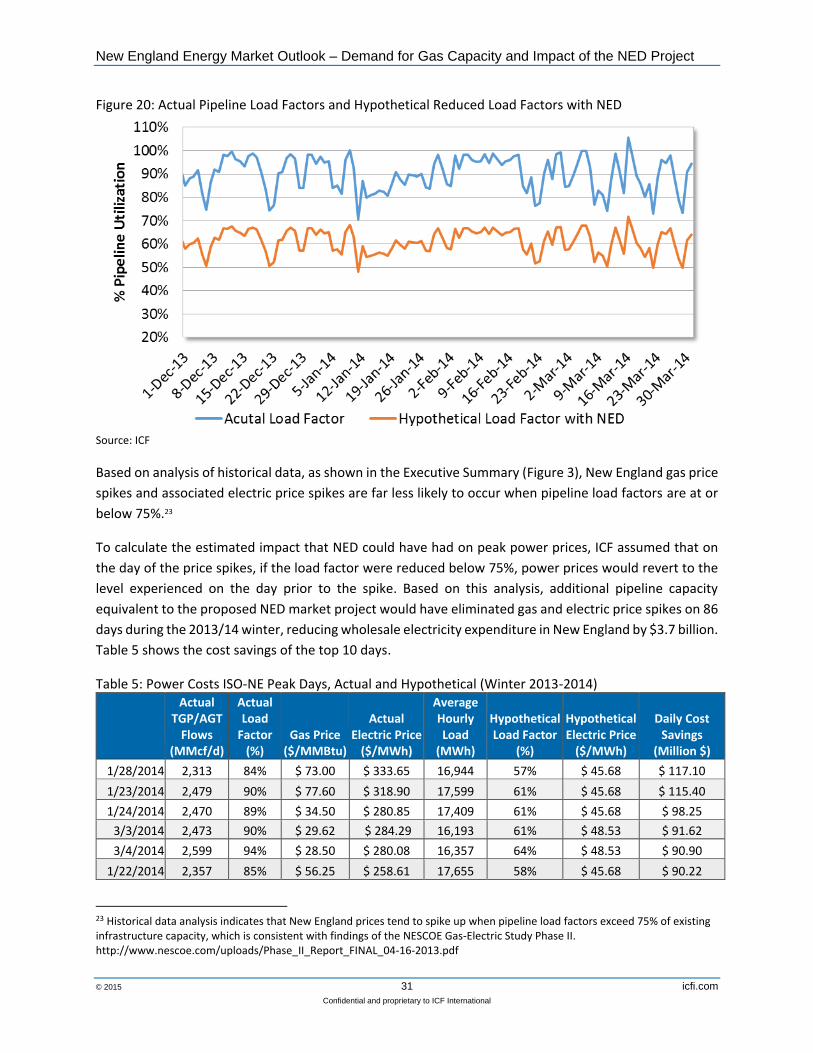
ICF then recalculated the load factor on the days with price spikes incorporating the 1.3 Bcf/d NED
capacity. This hypothetical load factor is much lower than the actual, as shown in Figure 20.
New England Energy Market Outlook – Demand for Gas Capacity and Impact of the NED Project
© 2015 31 icfi.com
Confidential and proprietary to ICF International
Figure 20: Actual Pipeline Load Factors and Hypothetical Reduced Load Factors with NED
Source: ICF
Based on analysis of historical data, as shown in the Executive Summary (Figure 3), New England gas price
spikes and associated electric price spikes are far less likely to occur when pipeline load factors are at or
below 75%.23
To calculate the estimated impact that NED could have had on peak power prices, ICF assumed that on
the day of the price spikes, if the load factor were reduced below 75%, power prices would revert to the
level experienced on the day prior to the spike. Based on this analysis, additional pipeline capacity
equivalent to the proposed NED market project would have eliminated gas and electric price spikes on 86
days during the 2013/14 winter, reducing wholesale electricity expenditure in New England by $3.7 billion.
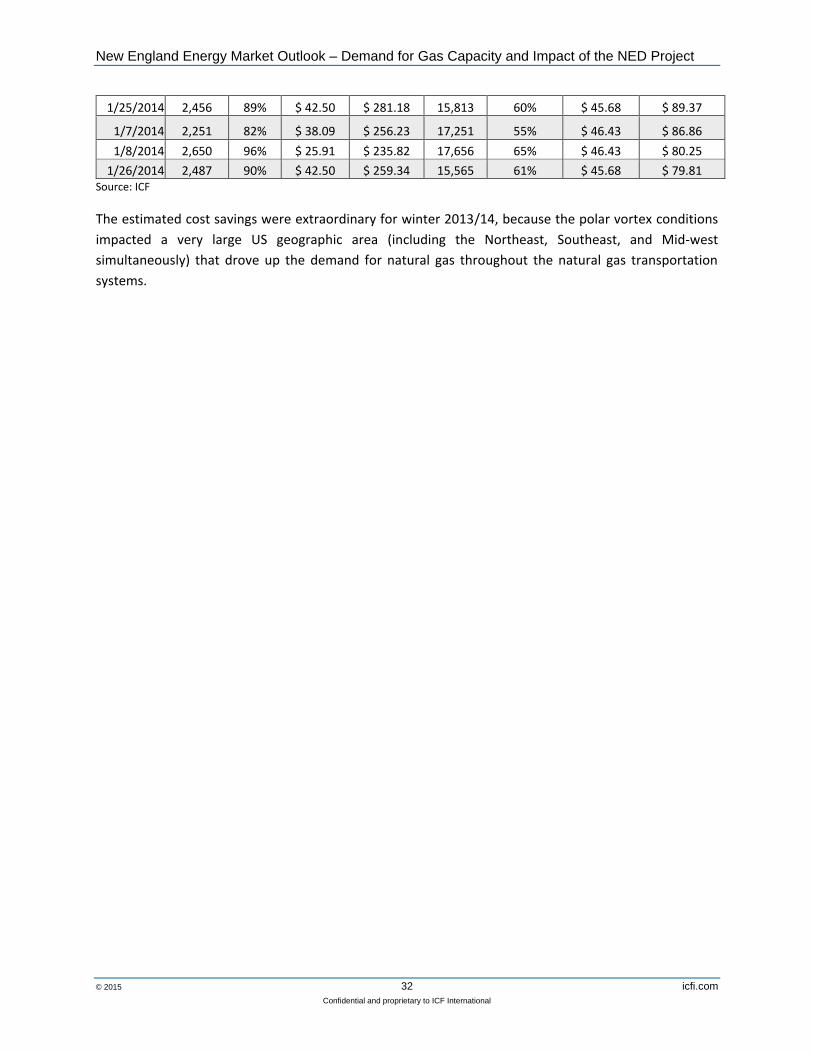
Table 5 shows the cost savings of the top 10 days.
Table 5: Power Costs ISO-NE Peak Days, Actual and Hypothetical (Winter 2013-2014)
Actual TGP/AGT
Flows (MMcf/d)
Actual Load
Factor (%)
Gas Price ($/MMBtu)
Actual Electric Price
($/MWh)
Average Hourly Load
(MWh)
Hypothetical Load Factor
(%)
Hypothetical Electric Price
($/MWh)
Daily Cost Savings
(Million $)
1/28/2014 2,313 84% $ 73.00 $ 333.65 16,944 57% $ 45.68 $ 117.10
1/23/2014 2,479 90% $ 77.60 $ 318.90 17,599 61% $ 45.68 $ 115.40
1/24/2014 2,470 89% $ 34.50 $ 280.85 17,409 61% $ 45.68 $ 98.25
3/3/2014 2,473 90% $ 29.62 $ 284.29 16,193 61% $ 48.53 $ 91.62
3/4/2014 2,599 94% $ 28.50 $ 280.08 16,357 64% $ 48.53 $ 90.90
1/22/2014 2,357 85% $ 56.25 $ 258.61 17,655 58% $ 45.68 $ 90.22
23 Historical data analysis indicates that New England prices tend to spike up when pipeline load factors exceed 75% of existing infrastructure capacity, which is consistent with findings of the NESCOE Gas-Electric Study Phase II. http://www.nescoe.com/uploads/Phase_II_Report_FINAL_04-16-2013.pdf
New England Energy Market Outlook – Demand for Gas Capacity and Impact of the NED Project
© 2015 32 icfi.com
Confidential and proprietary to ICF International
1/25/2014 2,456 89% $ 42.50 $ 281.18 15,813 60% $ 45.68 $ 89.37
1/7/2014 2,251 82% $ 38.09 $ 256.23 17,251 55% $ 46.43 $ 86.86
1/8/2014 2,650 96% $ 25.91 $ 235.82 17,656 65% $ 46.43 $ 80.25
1/26/2014 2,487 90% $ 42.50 $ 259.34 15,565 61% $ 45.68 $ 79.81 Source: ICF
The estimated cost savings were extraordinary for winter 2013/14, because the polar vortex conditions
impacted a very large US geographic area (including the Northeast, Southeast, and Mid-west
simultaneously) that drove up the demand for natural gas throughout the natural gas transportation
systems.
New England Energy Market Outlook – Demand for Gas Capacity and Impact of the NED Project
© 2015 33 icfi.com
Confidential and proprietary to ICF International
Cost Savings - Normal Weather
ICF estimated the energy market impact of NED by running GMM and IPM models under normal weather
conditions with and without the project, and then compared the difference for natural gas prices and
wholesale power prices. The wholesale power price reduction was then used to calculate the market
impact and potential cost savings to New England electric consumers. In addition, the project’s impact on
natural gas price volatility and the resulting further reduction to electric price spikes were then estimated
separately utilizing a statistical approach.
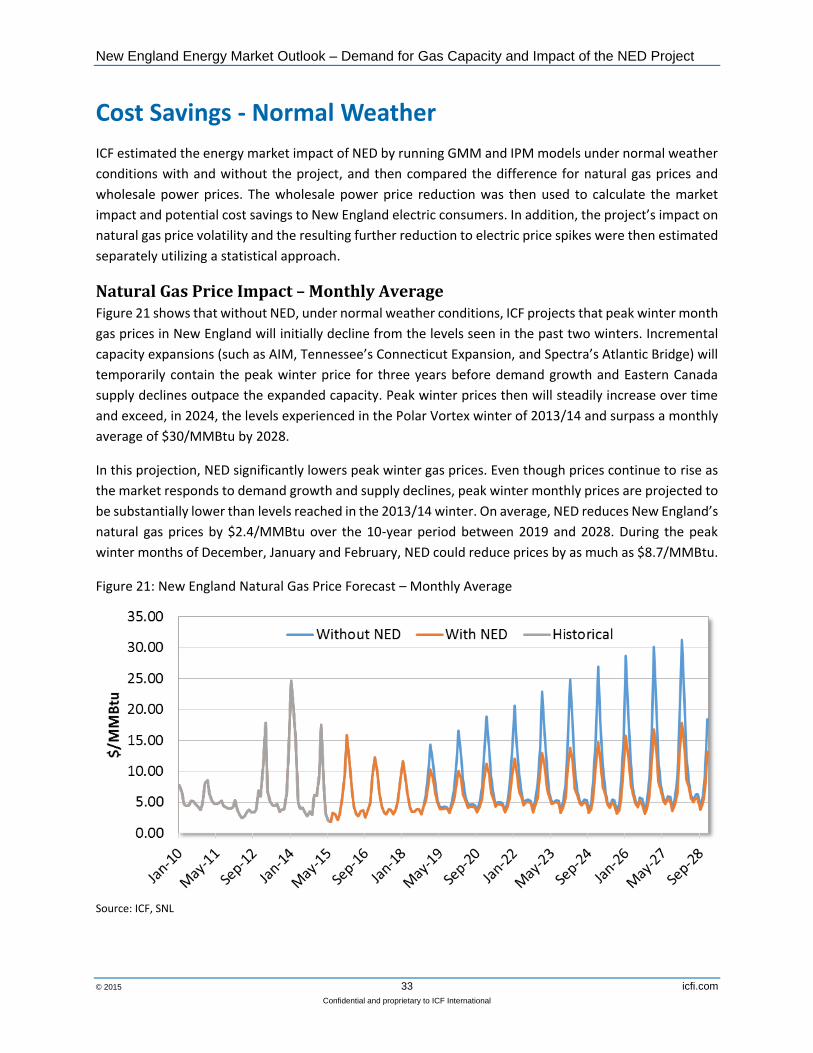
Natural Gas Price Impact – Monthly Average Figure 21 shows that without NED, under normal weather conditions, ICF projects that peak winter month
gas prices in New England will initially decline from the levels seen in the past two winters. Incremental
capacity expansions (such as AIM, Tennessee’s Connecticut Expansion, and Spectra’s Atlantic Bridge) will
temporarily contain the peak winter price for three years before demand growth and Eastern Canada
supply declines outpace the expanded capacity. Peak winter prices then will steadily increase over time
and exceed, in 2024, the levels experienced in the Polar Vortex winter of 2013/14 and surpass a monthly
average of $30/MMBtu by 2028.
In this projection, NED significantly lowers peak winter gas prices. Even though prices continue to rise as
the market responds to demand growth and supply declines, peak winter monthly prices are projected to
be substantially lower than levels reached in the 2013/14 winter. On average, NED reduces New England’s
natural gas prices by $2.4/MMBtu over the 10-year period between 2019 and 2028. During the peak
winter months of December, January and February, NED could reduce prices by as much as $8.7/MMBtu.
Figure 21: New England Natural Gas Price Forecast – Monthly Average
Source: ICF, SNL
New England Energy Market Outlook – Demand for Gas Capacity and Impact of the NED Project
© 2015 34 icfi.com
Confidential and proprietary to ICF International
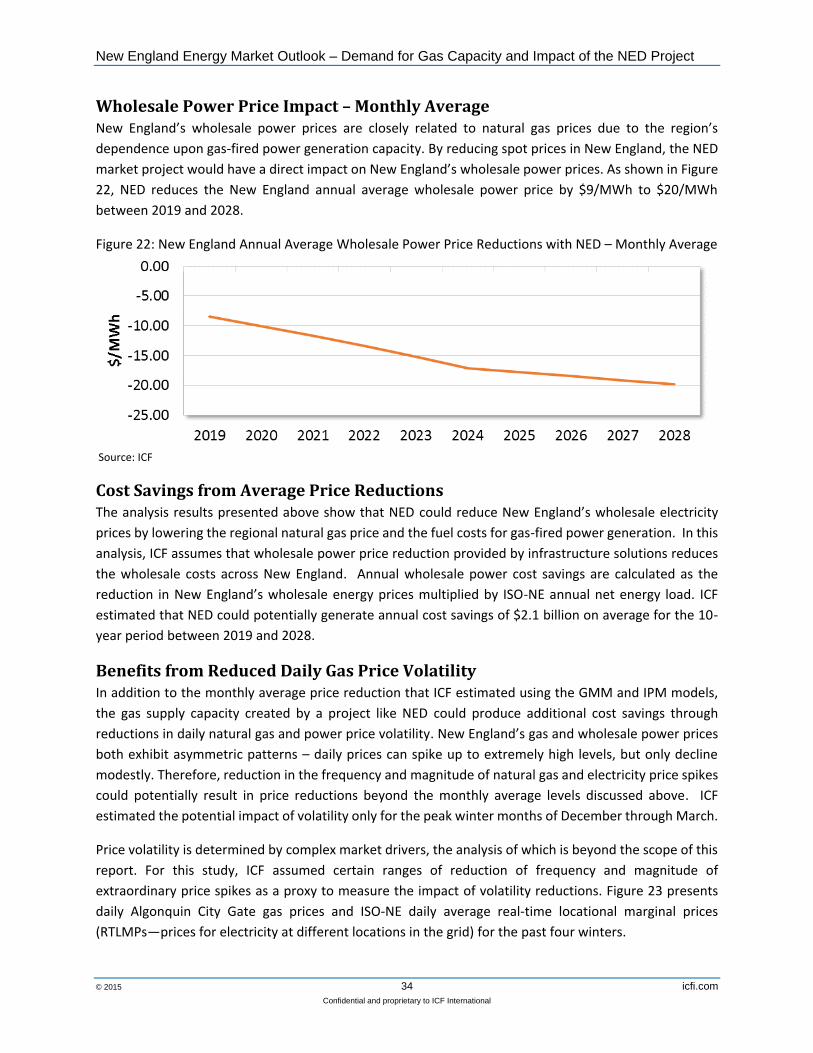
Wholesale Power Price Impact – Monthly Average New England’s wholesale power prices are closely related to natural gas prices due to the region’s
dependence upon gas-fired power generation capacity. By reducing spot prices in New England, the NED
market project would have a direct impact on New England’s wholesale power prices. As shown in Figure
22, NED reduces the New England annual average wholesale power price by $9/MWh to $20/MWh
between 2019 and 2028.
Figure 22: New England Annual Average Wholesale Power Price Reductions with NED – Monthly Average
Source: ICF
Cost Savings from Average Price Reductions The analysis results presented above show that NED could reduce New England’s wholesale electricity
prices by lowering the regional natural gas price and the fuel costs for gas-fired power generation. In this
analysis, ICF assumes that wholesale power price reduction provided by infrastructure solutions reduces
the wholesale costs across New England. Annual wholesale power cost savings are calculated as the
reduction in New England’s wholesale energy prices multiplied by ISO-NE annual net energy load. ICF
estimated that NED could potentially generate annual cost savings of $2.1 billion on average for the 10-
year period between 2019 and 2028.
Benefits from Reduced Daily Gas Price Volatility In addition to the monthly average price reduction that ICF estimated using the GMM and IPM models,
the gas supply capacity created by a project like NED could produce additional cost savings through
reductions in daily natural gas and power price volatility. New England’s gas and wholesale power prices
both exhibit asymmetric patterns – daily prices can spike up to extremely high levels, but only decline
modestly. Therefore, reduction in the frequency and magnitude of natural gas and electricity price spikes
could potentially result in price reductions beyond the monthly average levels discussed above. ICF
estimated the potential impact of volatility only for the peak winter months of December through March.
Price volatility is determined by complex market drivers, the analysis of which is beyond the scope of this
report. For this study, ICF assumed certain ranges of reduction of frequency and magnitude of
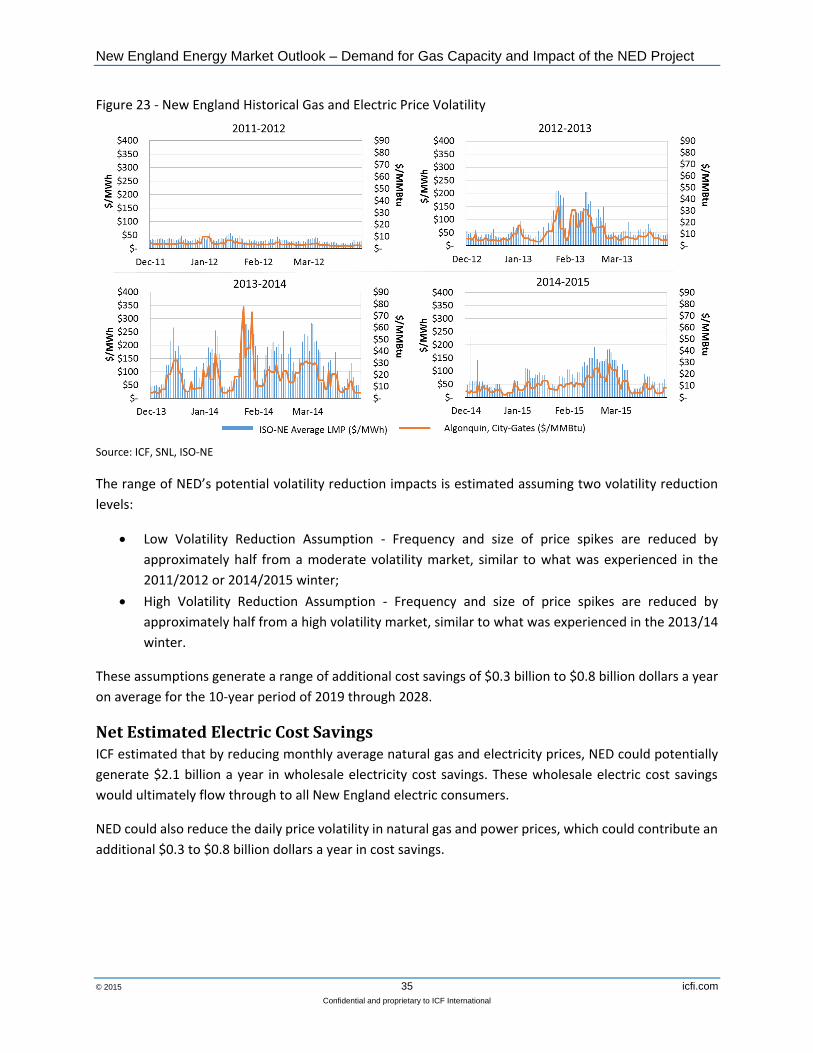
extraordinary price spikes as a proxy to measure the impact of volatility reductions. Figure 23 presents
daily Algonquin City Gate gas prices and ISO-NE daily average real-time locational marginal prices
(RTLMPs—prices for electricity at different locations in the grid) for the past four winters.
New England Energy Market Outlook – Demand for Gas Capacity and Impact of the NED Project
© 2015 35 icfi.com
Confidential and proprietary to ICF International
Figure 23 - New England Historical Gas and Electric Price Volatility
Source: ICF, SNL, ISO-NE
The range of NED’s potential volatility reduction impacts is estimated assuming two volatility reduction
levels:
Low Volatility Reduction Assumption - Frequency and size of price spikes are reduced by
approximately half from a moderate volatility market, similar to what was experienced in the
2011/2012 or 2014/2015 winter;
High Volatility Reduction Assumption - Frequency and size of price spikes are reduced by
approximately half from a high volatility market, similar to what was experienced in the 2013/14
winter.
These assumptions generate a range of additional cost savings of $0.3 billion to $0.8 billion dollars a year
on average for the 10-year period of 2019 through 2028.
Net Estimated Electric Cost Savings ICF estimated that by reducing monthly average natural gas and electricity prices, NED could potentially
generate $2.1 billion a year in wholesale electricity cost savings. These wholesale electric cost savings
would ultimately flow through to all New England electric consumers.
NED could also reduce the daily price volatility in natural gas and power prices, which could contribute an
additional $0.3 to $0.8 billion dollars a year in cost savings.
New England Energy Market Outlook – Demand for Gas Capacity and Impact of the NED Project
© 2015 36 icfi.com
Confidential and proprietary to ICF International
Overall, NED could generate, on average, $2.1 billion to $2.824 billion a year in total cost savings to New
England electric consumers, assuming zero volatility and high volatility reduction impacts respectively.
The annual carrying costs that need to be borne by electric consumers for pipeline infrastructure are
estimated using a pipeline Cost of Service proxy. Cost of service reflects the annual costs that a pipeline
needs to recover from all shippers who reserve capacity on the pipeline. Major variables in the cost of
service calculation include O&M costs, depreciation and taxes, and the returns on the capital investments
in constructing the pipeline. ICF estimated that the annual carrying costs of NED transportation capacity
for the power sector would be $400 million.25 Therefore, NED could generate an average annual net
electric cost savings of $1.7 billion to $2.4 billion to New England electric consumers.
24 Estimates for savings from average price reductions ($2.1) and volatility savings (up to $0.8 billion) are rounded to the nearest $0.1 billion; the round sum of the two is $2.8 billion. 25 ICF estimates the first year’s cost of service based on $2.0 billion total capital costs to be borne by New England’s electric sector for the construction of NED.
New England Energy Market Outlook – Demand for Gas Capacity and Impact of the NED Project
© 2015 37 icfi.com
Confidential and proprietary to ICF International
Other Benefits of Incremental New England Natural Gas Pipeline Capacity
ICF analysis in the preceding report sections focuses on potential capacity deficits and the resulting natural
gas and electricity price implications that could emerge as regional natural gas demand grows. This section
summarizes other potential benefits associated with additional pipeline capacity.
Enhanced Operational Reliability It is evident from ICF analysis that new pipeline capacity as proposed in the NED market project would
enhance the availability of gas service that is essential to supplying a growing New England market. And
by providing capacity for growth, NED would also mitigate increasingly tight capacity conditions for most
gas-fired power generators in New England. As such, for new and existing gas shippers alike, NED would
also provide valuable reliability against service interruptions.
Natural gas pipelines in New England and elsewhere have a demonstrated history of high reliability:
operational outages that impair services to firm customers are exceptionally rare. Nonetheless, the
expanded role of natural gas as a primary energy source for heating and as a fuel for electricity materially
increases the potential costs of service disruptions that might occur for any reason. NED is uniquely
effective in this regard because its interconnection with TGP at Dracut, Massachusetts and integration
with the TGP system would allow it to provide supplies for end users across both the eastern and western
parts of New England.
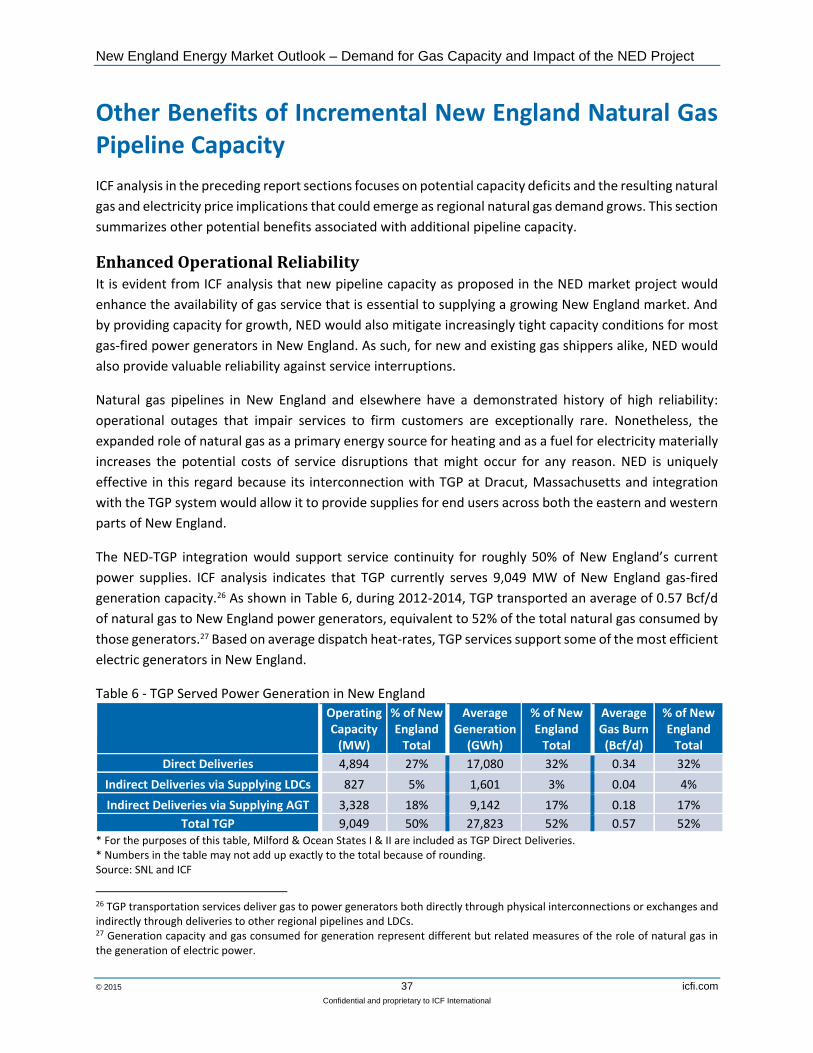
The NED-TGP integration would support service continuity for roughly 50% of New England’s current
power supplies. ICF analysis indicates that TGP currently serves 9,049 MW of New England gas-fired
generation capacity.26 As shown in Table 6, during 2012-2014, TGP transported an average of 0.57 Bcf/d
of natural gas to New England power generators, equivalent to 52% of the total natural gas consumed by
those generators.27 Based on average dispatch heat-rates, TGP services support some of the most efficient
electric generators in New England.
Table 6 - TGP Served Power Generation in New England
Operating Capacity
(MW)
% of New England
Total
Average Generation
(GWh)
% of New England
Total
Average Gas Burn (Bcf/d)
% of New England
Total
Direct Deliveries 4,894 27% 17,080 32% 0.34 32%
Indirect Deliveries via Supplying LDCs 827 5% 1,601 3% 0.04 4%
Indirect Deliveries via Supplying AGT 3,328 18% 9,142 17% 0.18 17%
Total TGP 9,049 50% 27,823 52% 0.57 52%
* For the purposes of this table, Milford & Ocean States I & II are included as TGP Direct Deliveries. * Numbers in the table may not add up exactly to the total because of rounding. Source: SNL and ICF
26 TGP transportation services deliver gas to power generators both directly through physical interconnections or exchanges and indirectly through deliveries to other regional pipelines and LDCs. 27 Generation capacity and gas consumed for generation represent different but related measures of the role of natural gas in the generation of electric power.
New England Energy Market Outlook – Demand for Gas Capacity and Impact of the NED Project
© 2015 38 icfi.com
Confidential and proprietary to ICF International
With modifications, NED service could similarly enhance service reliability for shippers on the AGT, PNGTS,
and M&NP pipelines. As illustrated in the Figure 24 map below, through deliveries at Dracut, MA, NED is
potentially able to “back feed” additional gas supplies to all existing pipelines in New England, creating a
new path to all gas customers.
Figure 24 - New England Gas-Fired Generation and Natural Gas Infrastructure
Source: Ventyx
The NED-TGP configuration is particularly integral to New England electric reliability because it is capable
of delivering high pressure gas east of the Mass. Hub and north of Boston to the area where a dense
concentration of power generation facilities operate. Gas deliveries to power generators in this region on
existing interstate gas pipelines are downstream of, and dependent upon, nearly twenty TGP and AGT
compressor stations. If confronted by outages or other potential supply disruptions on AGT and TGP, NED
would provide pipeline operators an alternative path for delivering gas supplies to the region, potentially
mitigating costly and disruptive power interruptions.
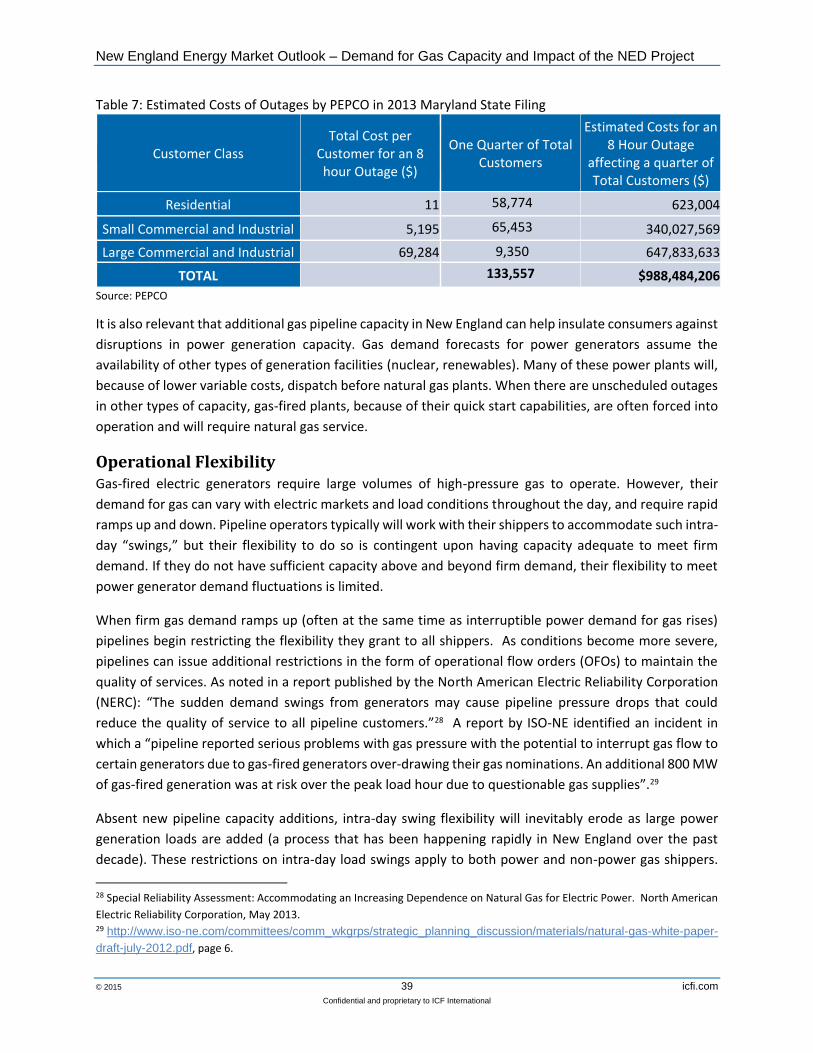
As noted above, the value of pipeline capacity reliability for a region increases materially as gas use for
power generation grows. Without adequate gas capacity, New England’s electric system could face costly
load shedding measures. Studies regarding the estimated costs of power service outages are limited, but
a 2013 filing with state regulators by Potomac Electric Power (PEPCO), a PJM electric utility that serves
Maryland and Washington D.C., provides one benchmark. In that filing, summarized in Table 7, PEPCO
estimated that an eight-hour outage for a quarter of its customers could cost approximately $988 million.
NED can help New England avert this type of costly electric load shedding.
New England Energy Market Outlook – Demand for Gas Capacity and Impact of the NED Project
© 2015 39 icfi.com
Confidential and proprietary to ICF International
Table 7: Estimated Costs of Outages by PEPCO in 2013 Maryland State Filing
Customer Class Total Cost per
Customer for an 8 hour Outage ($)
One Quarter of Total Customers
Estimated Costs for an 8 Hour Outage
affecting a quarter of Total Customers ($)
Residential 11 58,774 623,004
Small Commercial and Industrial 5,195 65,453 340,027,569
Large Commercial and Industrial 69,284 9,350 647,833,633
TOTAL 133,557 $988,484,206
Source: PEPCO
It is also relevant that additional gas pipeline capacity in New England can help insulate consumers against
disruptions in power generation capacity. Gas demand forecasts for power generators assume the
availability of other types of generation facilities (nuclear, renewables). Many of these power plants will,
because of lower variable costs, dispatch before natural gas plants. When there are unscheduled outages
in other types of capacity, gas-fired plants, because of their quick start capabilities, are often forced into
operation and will require natural gas service.
Operational Flexibility Gas-fired electric generators require large volumes of high-pressure gas to operate. However, their
demand for gas can vary with electric markets and load conditions throughout the day, and require rapid
ramps up and down. Pipeline operators typically will work with their shippers to accommodate such intra-
day “swings,” but their flexibility to do so is contingent upon having capacity adequate to meet firm
demand. If they do not have sufficient capacity above and beyond firm demand, their flexibility to meet
power generator demand fluctuations is limited.
When firm gas demand ramps up (often at the same time as interruptible power demand for gas rises)
pipelines begin restricting the flexibility they grant to all shippers. As conditions become more severe,
pipelines can issue additional restrictions in the form of operational flow orders (OFOs) to maintain the
quality of services. As noted in a report published by the North American Electric Reliability Corporation
(NERC): “The sudden demand swings from generators may cause pipeline pressure drops that could
reduce the quality of service to all pipeline customers.”28 A report by ISO-NE identified an incident in
which a “pipeline reported serious problems with gas pressure with the potential to interrupt gas flow to
certain generators due to gas-fired generators over-drawing their gas nominations. An additional 800 MW
of gas-fired generation was at risk over the peak load hour due to questionable gas supplies”.29
Absent new pipeline capacity additions, intra-day swing flexibility will inevitably erode as large power
generation loads are added (a process that has been happening rapidly in New England over the past
decade). These restrictions on intra-day load swings apply to both power and non-power gas shippers.
28 Special Reliability Assessment: Accommodating an Increasing Dependence on Natural Gas for Electric Power. North American
Electric Reliability Corporation, May 2013. 29 http://www.iso-ne.com/committees/comm_wkgrps/strategic_planning_discussion/materials/natural-gas-white-paper-
draft-july-2012.pdf, page 6.
New England Energy Market Outlook – Demand for Gas Capacity and Impact of the NED Project
© 2015 40 icfi.com
Confidential and proprietary to ICF International
The remedy for lost operational flexibility is either to curb demand or to purchase additional firm pipeline
capacity that meets peak-hour needs within a day. Both solutions come with additional costs.
By providing high pressure deliveries to its terminus at Dracut, NED could provide greater support to its
direct-connect customers and help downstream interconnecting pipelines maintain system pressures,
potentially without requiring extensive investments in incremental compression or line upgrades.30 The
economic benefits of maintaining regional operating flexibility can be very difficult to quantify, but the
incremental pressure provided by NED could enhance the flexibility of natural gas pipelines throughout
the region.
Support for Renewable Energy New England states have embraced aggressive renewable energy programs, including both wind and solar
facility development. These renewable resources are “intermittent” generators, which means their power
production can fluctuate dramatically and rapidly between peak capacity and zero. As the renewable
market share grows in New England, these swings have greater effects on the regional electric grid, and
thereby place greater demands on the system to accommodate the variation.
The graphs in clearly depict how generation output from renewable wind and solar resources fluctuates
both throughout the day and from one day to the next. By comparing the y-axis of each graph, they also
show how the power production swings have grown in just three years from 2011 to 2014.
Figure 25 – New England Wind and Solar Output
Source: ISO-NE
30 KM indicates that the estimated delivery pressure at Dracut is between 1,440 and 1,460 (psi).
New England Energy Market Outlook – Demand for Gas Capacity and Impact of the NED Project
© 2015 41 icfi.com
Confidential and proprietary to ICF International
Gas-fired generation is a highly complementary resource to buffer the intermittent production of
renewable energy. Unlike other types of power generation that are more rigid in their dispatch
capabilities, gas turbines are engineered to ramp up and down in tandem with renewable generation
variability. Assuming these turbines can be supplied with gas on a comparable schedule, gas generation
therefore provides an ideal complement to renewable energy. In that regard, the pipeline system’s
operational flexibility — which would be enabled by NED — discussed above is a key source of capacity
that can enable gas turbines to manage intermittent renewable power, and support the rise of renewable
generation in New England. In some instances, operators may find it contractually necessary to
supplement renewable energy with pipeline firm transportation contracts, but the norm will be to rely on
operational flexibility.
The graphs in Figure 25 above, confirm estimations of the pipeline capacity required to support New
England renewable energy in 2014. Using simplifying assumptions, the data suggest that intermittent load
swings of wind and solar resources could require an estimated daily pipeline capacity of .38 Bcf/d and .05
Bcf/d respectively, a total of .43 Bcf/d.31 On peak winter or summer days when pipeline capacity utilization
is high, such swings would exert a material pull on the region’s gas infrastructure, with resulting
supply/demand pressures and cost impacts.
Environmental Benefits Natural gas burns cleaner in power generation than other fossil fuels historically used in New England.
The development of new pipeline transportation capacity in New England is essential to supporting the
conversion of fuel oil- and coal-fired generation to natural gas, and achieving mandated reductions in NOx,
SO2, and CO2 emissions.32
Figure 26 - on the next page, summarizes the role that natural gas and nuclear energy have played in
reducing power generated from burning coal and oil. Between 2004 and 2013, coal and oil generation
declined from 25% of total generation to less than 7%.33
31 Key assumptions include the hourly duration of renewable energy production on a given intermittent resource day, and the effective heat rates of a modern gas turbine producing an equivalent amount of energy. 32 NOx is Nitrogen Oxides; SO2 is Sulfur Dioxide, CO2 is Carbon Dioxide; all Greenhouse Gases. 33 http://www.iso-ne.com/static-assets/documents/2014/12/2013_emissions_report_final.pdf, Figure 1-1.
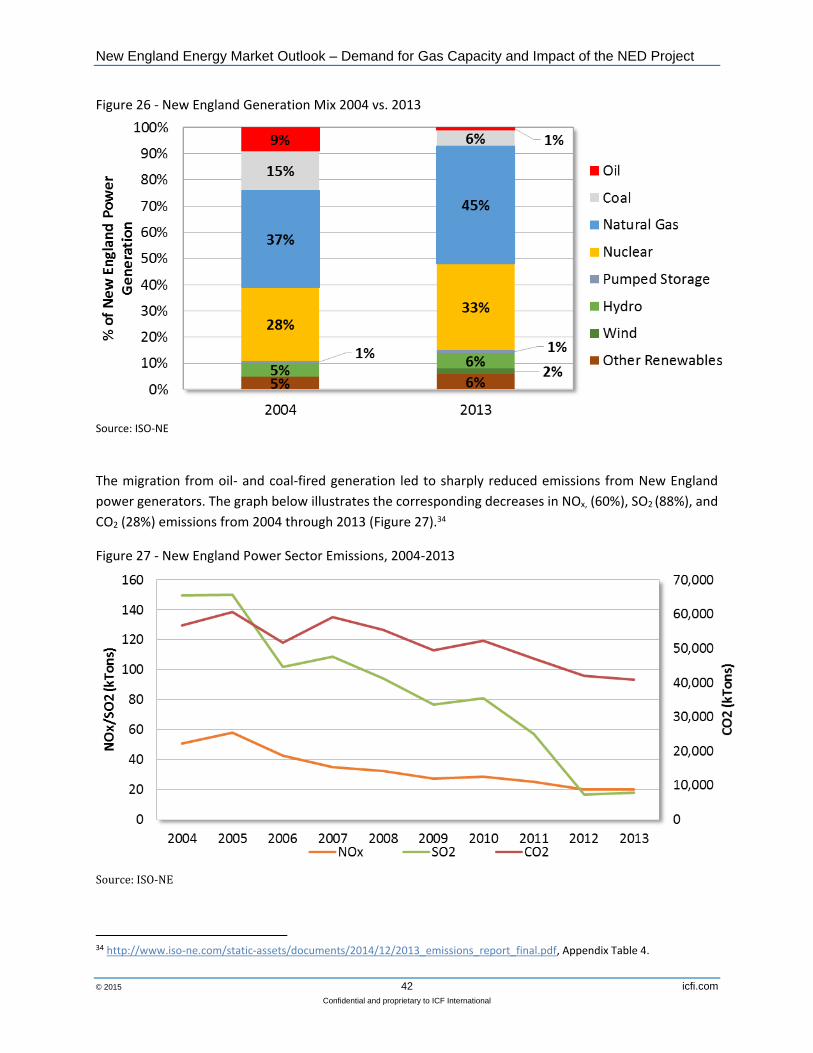
New England Energy Market Outlook – Demand for Gas Capacity and Impact of the NED Project
© 2015 42 icfi.com
Confidential and proprietary to ICF International
Figure 26 - New England Generation Mix 2004 vs. 2013
Source: ISO-NE
The migration from oil- and coal-fired generation led to sharply reduced emissions from New England
power generators. The graph below illustrates the corresponding decreases in NOx, (60%), SO2 (88%), and
CO2 (28%) emissions from 2004 through 2013 (Figure 27).34
Figure 27 - New England Power Sector Emissions, 2004-2013
Source: ISO-NE
34 http://www.iso-ne.com/static-assets/documents/2014/12/2013_emissions_report_final.pdf, Appendix Table 4.
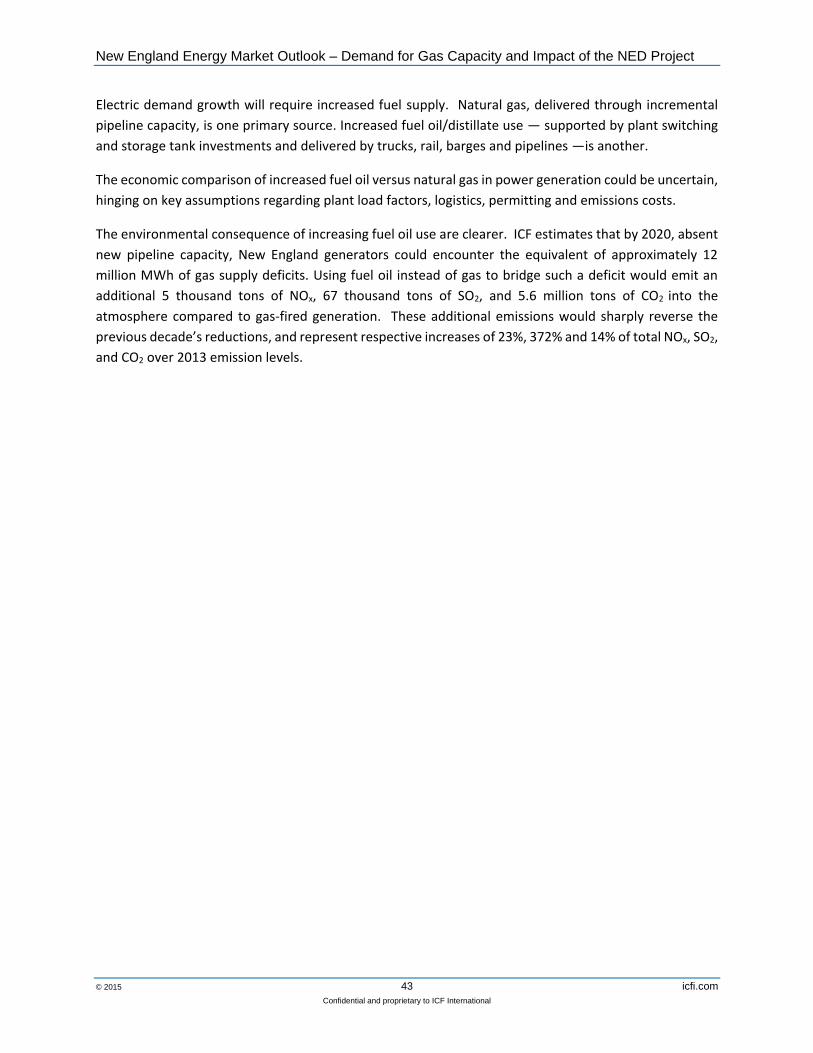
New England Energy Market Outlook – Demand for Gas Capacity and Impact of the NED Project
© 2015 43 icfi.com
Confidential and proprietary to ICF International
Electric demand growth will require increased fuel supply. Natural gas, delivered through incremental
pipeline capacity, is one primary source. Increased fuel oil/distillate use — supported by plant switching
and storage tank investments and delivered by trucks, rail, barges and pipelines —is another.
The economic comparison of increased fuel oil versus natural gas in power generation could be uncertain,
hinging on key assumptions regarding plant load factors, logistics, permitting and emissions costs.
The environmental consequence of increasing fuel oil use are clearer. ICF estimates that by 2020, absent
new pipeline capacity, New England generators could encounter the equivalent of approximately 12
million MWh of gas supply deficits. Using fuel oil instead of gas to bridge such a deficit would emit an
additional 5 thousand tons of NOx, 67 thousand tons of SO2, and 5.6 million tons of CO2 into the
atmosphere compared to gas-fired generation. These additional emissions would sharply reverse the
previous decade’s reductions, and represent respective increases of 23%, 372% and 14% of total NOx, SO2,
and CO2 over 2013 emission levels.

New England Energy Market Outlook – Demand for Gas Capacity and Impact of the NED Project
© 2015 44 icfi.com
Confidential and proprietary to ICF International
2


![British Columbia Labour Market Outlook 2010 - 2020 · Labour Market OutlookLabour Market Outlook British Columbia Labour Market Outlook: 2010-2020 [2] B.C. Labour Market Outlook,](https://img.pdfslide.net/doc/110x75/5e167e8e481eae63a43f8127/british-columbia-labour-market-outlook-2010-2020-labour-market-outlooklabour-market.jpg)