Embed Size (px)
Citation preview

This file is part of the following reference:
Jaroenram, Wansadaj (2015) New insight into detection
and evolution of Australian Penaeus stylirostris
densovirus. PhD thesis, James Cook University.
Access to this file is available from:
http://researchonline.jcu.edu.au/41272/
The author has certified to JCU that they have made a reasonable effort to gain
permission and acknowledge the owner of any third party copyright material
included in this document. If you believe that this is not the case, please contact
[email protected] and quote
http://researchonline.jcu.edu.au/41272/
ResearchOnline@JCU
New insight into detection and evolution of Australian Penaeus
stylirostris densovirus
Thesis submitted by
Wansadaj Jaroenram (MSc),
James Cook University, Townsville, QLD
In September 2015
For the Degree of Doctor of Philosophy
in College of Public Health, Medical and Veterinary Sciences
James Cook University

i
STATEMENT OF ACCESS DECLARATION
I, the undersigned, author of this work, understand that James Cook University will
make this thesis available for use within the University Library and, via the
Australian Digital Theses network, for use elsewhere.
I understand that, as an unpublished work, a thesis has significant protection under
the Copyright Act and;
I do not wish to place any further restriction on access to this work.
Signature Date: September 1, 2015
STATEMENT OF SOURCES DECLARATION
I declare that this thesis is my own work and has not been submitted in any form for
another degree or diploma at any university or other institution of tertiary education.
Information derived from the published or unpublished work of others has been
acknowledged in the text and a list of references is given.
Signature Date: September 1, 2015
ii
STATEMENT OF SOURCES ELECTRONIC COPY DECLARATION
I, the undersigned, the author of this work, declare that the electronic copy of this
thesis provided to the James Cook University Library is an accurate copy of the print
thesis submitted, within limits of the technology available.
Signature Date: September 1, 2015
DECLARATION OF ETHICS
The research presented and reported in this thesis was conducted within the
guidelines for research ethics outlined in the National Statement on Ethics Conduct
in Research Involving Human (1999), the Joint NHMRC/AVCC Statement and
Guidelines on Research Practice (1997), the James Cook University Policy on
Experimentation Ethics. Standard Practices and Guidelines (2001), and the James
Cook University Statement and Guidelines on Research Practice (2001). The
proposed research methodology received clearance from the James Cook University
Experimentation Ethics Review (Approval number A1836)
Signature Date: September 1, 2015

iii
ACKNOWLEDGEMENTS
This thesis work is dedicated first to Assoc. Prof. Leigh Owens (my supervisor), and
Dr. Jennifer Elliman (my co-supervisor). Without their guidance and support, this
thesis work would not have been possible. Second, I dedicate this work to JCU
International Postgraduate Research Scholarship. Without this scholarship, I would
not be able to study here. Third, I would like to thank Dr. Constantin Constantinoiu,
Dr. Ellen Ariel and Aquapath members for their help and suggestions which enabled
me to complete this thesis successfully. Last, and most of all, I dedicate this work to
my parents, Kan Jaroenram and Wijit Jaroenram. All I have and will accomplish are
only possible due to their love and sacrifices.
iv
ABSTRACT
Penaeus stylirostris densovirus (PstDV) has caused high mortality in Penaeus
stylirostris and runt deformity syndrome in Penaeus vannamei and Penaeus
monodon. This study aims to 1) develop a practical diagnostic approach to separate
infectious PstDV from endogenous viral elements, and 2) to determine the factors
that underlie molecular evolution of the Australian PstDV. Regarding the first, we
mapped the PstDV insertion patterns in the genome of Australian P. monodon. A
detection platform based on recombinase polymerase amplification (RPA) and a
lateral flow dipstick (LFD) was developed for detecting PstDV based on the DNA
region that is least likely to be endogenized. Under the optimal conditions, 30 min at
37 °C for RPA followed by 5 min at room temperature for LFD, the platform was 10
times more sensitive than the Saksmerphrome et al’s interim 3-tube nested PCR and
showed no cross-reaction with other shrimp viruses. It also reduced false positive
results arising from viral inserts to ~5% compared to 76–78% by the IQ2000TM
nested PCR kit and the 309F/R PCR protocol currently recommended by World
Organization for Animal Health for PstDV detection. Together with simplicity and
portability, the protocol serves as an alternative tool to PCR for screening PstDV.
As for the second objective, A 1-bp deletion (1305delA) within the nuclear
localization signal-encoding sequence of open reading frame 1 (ORF1; NS1) of
Australian PstDV was identified as a cause of 199-amino acid shortened NS1
protein and production of a second protein, C-terminal NS1. This mutation is
believed to reduce virulence as it strongly modifies the characteristics of NS1, which
is responsible for the majority of enzymatic activities in PstDV. This finding
supports a hypothesis regarding accommodation of PstDV in Australian prawns in
relation to viral genetics. However, a high degree of evolution (1.55 × 10⁻³
substitutions/site/year) for the virus, which was attributable to the viral
recombination, was observed with 10 potential genomic breakpoints identified. With
this finding, we suggest that awareness of the emergence of new virulent strains
should be increased as a preventative measure against future outbreaks of PstDV in
the Australian Indo-Pacific.
v
TABLE OF CONTENTS
Statement of Access Declaration........................................................................... i
Statement of Sources Declaration......................................................................... i
Statement of Sources Electronic Copy Declaration............................................. ii
Declaration of Ethics.............................................................................................. ii
Acknowledgments.................................................................................................. iii
Abstract................................................................................................................... iv
List of Tables.......................................................................................................... x
List of Figures......................................................................................................... xi
List of Abbreviations.............................................................................................. xiii
List of Publications................................................................................................. xx
CHAPTER 1: General Introduction..................................................................... 1
CHAPTER 2: Review of Literature...................................................................... 3
2.1. Introduction........................................................................................................ 3
2.2. PstDV information............................................................................................. 3
2.2.1. Classification and genome characterization............................................ 3
2.2.2. Occurrence and geographical distribution............................................... 5
2.2.3. Clinical signs and mode of transmission................................................. 8
vi
2.2.4. Prevalence and host ranks....................................................................... 9
2.3. Current factors hampering the success of control for PstDV............................. 12
2.3.1. Current problems in diagnostics: viral inserts in shrimp genome……… 12
2.3.1.1. PstDV endogenous viral elements in shrimp……...................... 12
2.3.1.2. Insertion pattern of PstDV elements in shrimp genome……… 13
2.3.1.3. PCR detection and false positive results arising from viral inserts
………………………………………………………………… 15
2.3.1.4. Recombinase polymerase amplification and lateral flow dipstick
assay: alternative approaches for PstDV detection.................... 15
2.3.2. Current problems in control of PstDV outbreaks: Lack of understanding
of the diversity and population dynamics of PstDV................................ 20
2.4. Concluding remarks........................................................................................... 23
CHAPTER 3: General Materials and methods................................................... 24
3.1. Preparation of total DNA extract....................................................................... 24
3.2. Preparation of total RNA extract....................................................................... 25
3.3. PCR amplification and gel electrophoresis........................................................ 25
3.4. Cloning and sequencing..................................................................................... 26
CHAPTER 4: Profiling of Endogenous Viral Elements in the Genome
of Australian Penaeus monodon.................................................. 27
4.1. Introduction....................................................................................................... 27
4.2. Materials and Methods...................................................................................... 28
vii
4.2.1. Shrimp samples and DNA temple preparation....................................... 28
4.2.2. PCR detection of PstDV-related sequences in shrimp genome.............. 28
4.3. Results................................................................................................................ 29
4.4. Discussion.......................................................................................................... 31
CHAPTER 5: Recombinase Polymerase Amplification Combined with a Lateral
Flow Dipstick for Detection of Infectious Penaeus stylirostris
Densovirus...................................................................................... 33
5.1. Introduction........................................................................................................ 33
5.2. Materials and Methods....................................................................................... 35
5.2.1. Samples infected with PstDV.................................................................. 35
5.2.2. Total DNA temple preparation................................................................ 35
5.2.3. Recombinant plasmid construction......................................................... 35
5.2.4. RPA primer and probe design................................................................. 36
5.2.5. RPA conditions and optimization............................................................ 37
5.2.6. Lateral flow dipstick (LFD) assay........................................................... 37
5.2.7. Molecular specificity of RPA–LFD........................................................ 38
5.2.8. Molecular sensitivity of PRA by LFD and AGE.................................... 38
5.2.9. Molecular sensitivity of one-step PCR and nested PCR by AGE…….. 38
5.2.10. Reliability of RPA–LFD by statistical sensitivity and specificity
analysis……………………………………………………………… 39
5.3. Results................................................................................................................ 40
5.3.1. Determination of the RPA–LFD conditions............................................ 40
viii
5.3.2. Molecular specificity of RPA–LFD........................................................ 41
5.3.3. Comparative molecular sensitivity of the RPA/AGE, RPA/LFD,
PCR/AGE and nested RT-PCR/AGE..................................................... 42
5.3.4. Reliability of RPA–LFD by statistical sensitivity and specificity
analysis………………………………………………………............... 45
5.4. Discussion.......................................................................................................... 49
CHAPTER 6: Viral Accommodation, Evolution and Phylodynamics of
Australian Penaeus stylirostris Densovirus.................................. 51
6.1. Introduction........................................................................................................ 51
6.2. Materials and Methods....................................................................................... 52
6.2.1. Shrimp samples and DNA temple preparation........................................ 52
6.2.2. PCR amplification, cloning and genome sequencing of Australian
PstDV..................................................................................................... 52
6.2.3. Bioinformatical analysis of PstDV genome............................................ 54
6.2.4. Point mutation analysis............................................................................ 54
6.2.5. Phylogenetic analysis.............................................................................. 54
6.2.6. Recombination and selection analysis..................................................... 55
6.2.7. Inference of the nucleotide substitution rate and the demographic
history…………………………………………………..…………….. 55
6.3. Result................................................................................................................. 57
6.3.1. Retrospective analysis of data from 1993............................................... 57
6.3.2. Whole genome analysis of Australian PstDV......................................... 57
ix
6.3.3. Mutation analysis..................................................................................... 61
6.3.4. Phylogenetic tree analysis....................................................................... 64
6.3.5. Recombination and selection analysis..................................................... 65
6.3.6. Inference of the nucleotide substitution rate and the demographic
history..................................................................................................... 68
6.4. Discussion.......................................................................................................... 70
CHAPTER 7: General Discussion......................................................................... 76
REFERENCES........................................................................................................ 80
APPENDIX A: Reagents and bacteriological media............................................... 91
APPENDIX B: A preliminary study on PstDV status in Australian and imported
prawns by Krabsetsve and Owens (unpublished)……………..... 94
APPENDIX C: Detail of PstDV insertion patterns in the genome of shrimp from
Farm A (Table B.1) and B (Table B.2) and the background of
prawn (Table B.3) examined in Chapter 4……………………... 103
APPENDIX D: The genome sequence of Australian PstDV (AUS-PstDV2012)
reported in this article (GenBank No. KM593913).................... 107
APPENDIX E: The host origins of Australian endemic PstDVs……………… 109
APPENDIX F: Detail of natural selection analysis using SLAC, FEL, and REL
approaches.................................................................................... 110
APPENDIX G: List of oral presentations and workshop....................................... 122
APPENDIX H: List of publications....................................................................... 123
x
LIST OF TABLES
Table 2.1 The geographical distribution of PstDV .......................................... 7
Table 2.2 Known host species of PstDV and the prevalence of the virus…… 11
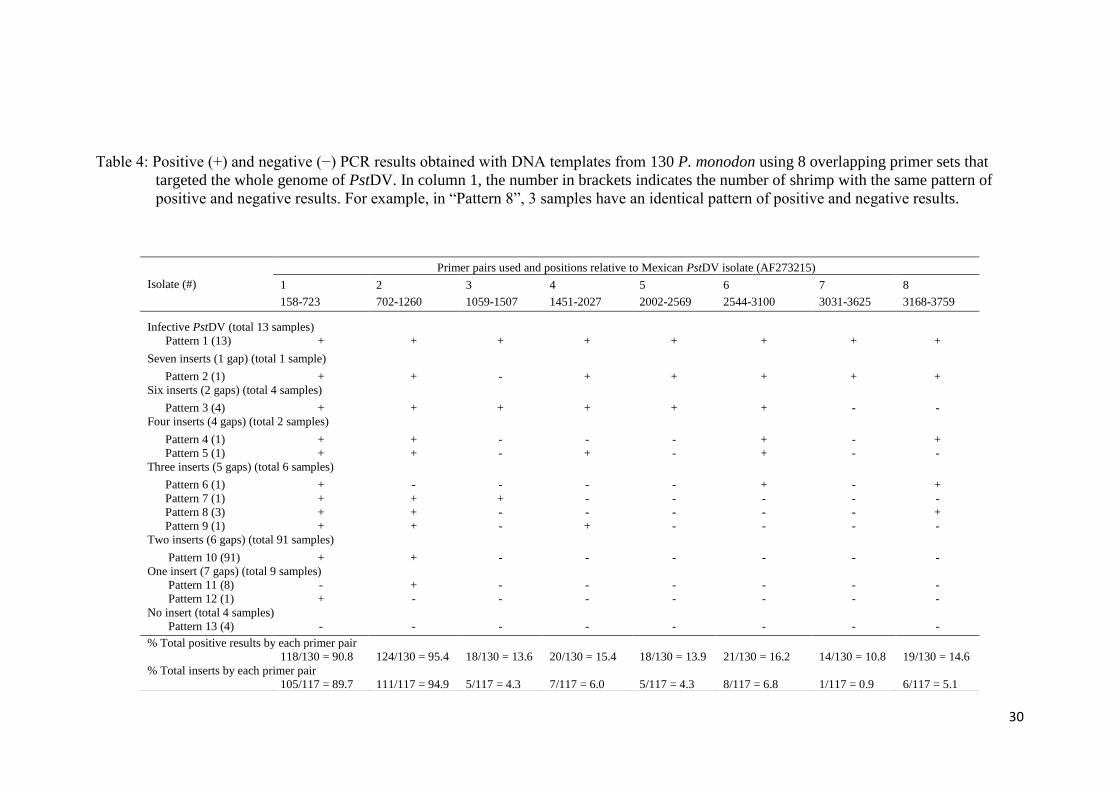
Table 4 Positive (+) and negative (−) PCR results obtained with DNA
templates from P. monodon (130 samples) using 8 overlapping
primer sets that targeted the whole genome of PstDV..................... 30
Table 5.1 Geographical origin, year of collection, species and number of
shrimp, and PstDV status of shrimp as determined by the
reference assay (an interim 3-tube nested PCR), and the
RPA-LFD protocol............................................................................ 47
Table 5.2 Diagnostic performance of the RPA-LFD protocol.......................... 48
Table 6.1 Primers used to sequence the complete genome of PstDV in this
study.................................................................................................. 53
Table 6.2 Comparison of nucleotide and predicted amino acid sequences of
the AUS-PstDV2012 (lineage II) and other sequenced PstDVs
from different geographical regions.................................................. 60
Table 6.3 The penaeid host, geographical location and the likely NLS of
PstDV in NS1 protein....................................................................... 63
Table 6.4 Number of positive (+) and negative (̶ ) selected codons on each
ORF of the genome of PstDVs circulating outside Australia
(nAus Grp 1) and inside Australia (Aus Grp 2) as analyzed by
SLAC, FEL and REL........................................................................ 67
Table 6.5 Evolutionary models compared by marginal likelihoods obtained
from the harmonic smoothed mean estimator performed under
different clock models: Strict (S), Relaxed lognormal (RL) and
Relaxed exponential (RE)................................................................. 69
xi
LIST OF FIGURES
Figure 2.1 Genomic organization of coding sequences of PstDV genome....... 5
Figure 2.2 Size variations observed in 50 days old P. monodon infected by
PstDV................................................................................................ 8
Figure 2.3 Mechanism of recombinase polymerase amplification (RPA)......... 17
Figure 2.4 The working principle of the Milenia® HybriDetect LFD................ 19
Figure 5.1 Schematic representation of RPA–LFD principle for the detection
of PstDV........................................................................................... 34
Figure 5.2 Optimization of RPA reaction using 10-fold serially diluted PstDV-
recombinant plasmid DNA as template............................................. 40
Figure 5.3 Molecular specificity of RPA–LFD carried out using shrimp
viruses as template............................................................................ 41
Figure 5.4 Comparison between the LFD assay and AGE for detecting
PstDV-RPA products........................................................................ 42
Figure 5.5 Molecular sensitivity test results of RPA using 10-fold serially
diluted total DNA extracted from PstDV-infected shrimp as
template…………………………………………………………… 43
Figure 5.6 Molecular sensitivity test results of RPA using 10-fold serially
diluted plasmid DNA as templates................................................... 44
Figure 5.7 Molecular sensitivity of PCR and nested-PCR carried out using
various amounts of PstDV-DNA as template................................... 45
Figure 6.1 (A) Genome organization of Australian PstDV obtained from this
study. (B) Genome organization of infectious PstDV representative
taken from GenBank database........................................................... 59
xii
Figure 6.2 Comparison of the 1305delA-containing ORF1 (NS1) sequences
obtained from various sources........................................................... 62
Figure 6.3 Phylogenetic relationships of the Australian PstDV isolate and
other geographical isolates as analysed using the maximum
likelihood method implemented in the PhyML 3.0.......................... 64
Figure 6.4 Recombination breakpoint (BP) placement support of: (A)
ORF1 Fr1, (B) ORF1 Fr2, (C) ORF2 and (D) ORF3....................... 66
Figure 6.5 Bayesian skyline plot........................................................................ 69
xiii
LIST OF ABBREVIATIONS
FAO Food and Agriculture Organization
aa Amino acid
AaeDNV Aedes aegypti densovirus
AalDNV Aedes albopictus densovirus
AGE Agarose gel electrophoresis
A. longinaris Artemesia longinaris
Aus Grp 2 Australian PstDV endemic strains (Group 2)
BEAST Bayesian evolutionary analysis by sampling trees
BLAST Basic Local Alignment Search Tool
Bp Base pair
BPs Breakpoints
BPS Bayesian skyline plot
Bst Bacillus stearothermophilus
C. angulatus Cyrtograpsus angulatus
°C Degree Celsius
CP Capsid protein
Da Dalton
Δc-AIC Changes in Akaike information criteria
1305delA Base A is deleted at the nt position 1305 of ORF1
xiv
1305insA Base A is inserted at the nt position 1304 of ORF1
dN Non-synonymous substitutions
DNA Deoxyribonucleic acid
DNase Deoxyribonuclease
DNV Densovirus
dS Synonymous substitution
dsDNA Double-stranded DNA
E.coli Escherichia coli
ESS Effective sample sizes
EST Expressed sequence taq
EVEs Endogenous viral elements
FAM Fluorescein amidite
FAO Food and Agriculture Organization
FEL Fixed Effects Likelihood
FITC Fluorescein isothiocyanate
FN False negative
FP False positive
FPLV Feline panleukopenia parvovirus
Fr1 Fragment 1 of ORF1
Fr2 Fragment 2 of ORF1
g Gravitational force
GARD Genetic Algorithms for Recombination Detection
xv
GAV Gill-associated virus
ΔG Gibbs free energy
h Hour
HPD Highest posterior density
H. penicillatus Hemigrapsus penicillatus
IHHNV Infectious hypodermal and hematopoietic necrosis virus
Inc. Incorporated
i.e. id est
K Lysine
kbp Kilo base pair
kcal Kilocalorie
kDa Kilo Dalton
LAMP Loop mediated DNA isothermal amplification
LB Lysogeny broth
LFD Lateral flow dipstick
MCMC Markov chain Monte Carlo
MCMS Midcrop Mortality Syndrome
min Minute
MrNV Macrobrachium rosenbergii nodavirus
M. rosenbergii Macrobrachium rosenbergii
µl Microlitre
xvi
µM Micromolar
mg Milligram
MgCl2 Magnesium chloride
ml Millilitre
mM Millimolar
MUSCLE Multiple sequence comparison by log-expectation
MW Molecular weight
− Negative
NCBI National Centre for Biotechnology Information
Ne Effective population size
Nfo Endonuclease IV
ng Nanogram
NLS Nuclear localization signal
nm Nanometre
nt Nucleotide
NTP Nucleoside triphosphate
NS1 Non-structural protein 1
NS2 Non-structural protein 2
nAus Grp 1 Non-Australian PstDV strains (Group 1)
OIE Office International des Epizooties
ORF Open reading frame
P. aztecus Penaeus aztecus
xvii
P. californiensis Penaeus californiensis
P. esculentus Penaeus esculentus
P. japonicus Penaeus japonicus
P. macrodactylus Palaemon macrodactylus
PmeDV Penaeus merguiensis densovirus
P. monodon Penaeus monodon
P. setiferus Penaeus setiferus
PstDV Penaeus stylirostris densovirus
P. stylirostris Penaeus stylirostris
P. subtilise Penaeus subtilise
P. vannamei Penaeus vannamei
PCR Polymerase chain reaction
pg Picogram
PL Postlarvae
+ Positive
% Percentage
R Arginine
RDS Runt deformity syndrome
RE Relaxed exponential clock model
REL Random Effects Likelihood
RL Relaxed lognormal clock model
xviii
RNA Ribonucleic acid
RPA Recombinase polymerase amplification
s Second
S Strict clock model
SSB Single-strand DNA binding protein
ssDNA Single-stranded DNA
SE South East
Sau Staphylococcus aureus
SLAC Single Likelihood Ancestor Counting
$ Dollar
TAE Tris-acetate-EDTA
Taq Thermus aquaticus
THF Tetrahydrofuran
TN True negative
TP True positive
TSV Taura syndrome virus
TYLCV Tomato yellow leaf curl virus
U Unit
UK United Kingdom
USA United State of America
UV Ultraviolet
xix
VP Viral capsid protein
WSSV White spot syndrome virus
YHV Yellow head virus
xx
LIST OF PUBLICATIONS
1. Jaroenram W, Owens L (2014). Separation of endogenous viral elements from
infectious Penaeus stylirostris densovirus using recombinase polymerase
amplification. Mol Cell Probe 28: 284-287
2. Jaroenram W, Owens L (2014). Recombinase polymerase amplification combined
with a lateral flow dipstick for discriminating between infectious Penaeus
stylirostris densovirus and virus-related sequences in shrimp genome. J Virol
Methods 208:144-151
3. Jaroenram W, Chaivisuthangkura P, Owens L (2015). One base pair deletion and
high rate of evolution: Keys to viral accommodation of Australian Penaeus
stylirostris densovirus. Aquaculture 443:40-48
1
CHAPTER 1
GENERAL INTRODUCTION
At present, shrimp (mostly penaeids) are viewed as a major trade fishery species due
to the increase in consumer demand for these animals. This demand has driven the
global shrimp industry to grow continuously at 9% a year since the 1970s (Zabbey et
al., 2010). According to the Food and Agriculture Organization of United Nations
(FAO), global shrimp production is approximately six million metric tonnes a year,
60% of which enters the international market and is worth more than US$10 billion
annually (Gillett R, 2008; http://www.fao.org/docrep/011/i0300e/i0300e00.htm). This
great market value contributes extensive benefits to economies especially in Asia
where most of the shrimp farming occurs. Unfortunately, an increase in the numbers
of diseases induces significant losses for the shrimp industry. Between 1990 and
2005, for example, the global shrimp production losses due to diseases were
approximately US$ 15 billion, 60% of which were attributed to viruses (Flegel,
2012). White spot syndrome virus (WSSV) and yellow head virus (YHV) have been
marked as the most dangerous pathogens for shrimp aquaculture due to their lethal
effect on Penaeus monodon (black tiger shrimp) and Penaeus vannamei (Pacific
white shrimp), the major cultivated shrimp species (Flegel, 2012).
Penaeus stylirostris densovirus (PstDV), commonly called infectious hypodermal
and hematopoietic necrosis virus (IHHNV), is also of importance as it causes mass
mortality in Penaeus stylirostris (blue shrimp), and Runt deformity syndrome (RDS)
in P. vannamei and P. monodon (Brock et al., 1983; Browdy et al., 1993; Bray et
al., 1994; Primavera and Quinitio, 2000; Khawsak et al., 2008; Rai et al., 2012). It is
also reported to be associated with slow growth in P. monodon (Rai et al., 2009; Rai
et al., 2012). Despite several approaches to viral disease prevention such as good on-
farm management practice (Xiang, 2001), the presence of PstDV has been reported.
2
Success in circumvention of outbreaks of PstDV requires efficient control measures
which constitutes detection, containment and control. To achieve this, proper
consideration and fulfilment of areas including the following issues are needed. 1)
Requirement for more efficient diagnostic systems. Such systems are required for
seed screening program and biosecurity. 2) Requirement for the understanding of the
population dynamics and evolution of PstDV (Robles-Sikisaka et al., 2010). This
issue is crucial for implementation of effective measures to control outbreaks/restrict
movement of the virus, for example, from geographical hotspots for the virus. This
thesis aims to address these two issues with the hope that integration of such outputs
and knowledge will help contribute toward better strategies to counter PstDV.
3
CHAPTER 2
REVIEW OF LITERATURE
2.1. Introduction
Penaeus stylirostris densovirus (PstDV) is a virus that causes mass mortality in P.
stylirostris and Runt deformity syndrome (RDS) in P. vannamei and P. monodon
(Brock et al., 1983; Browdy et al., 1993; Bray et al., 1994; Primavera and Quinitio,
2000; Khawsak et al., 2008; Rai et al., 2012). Although RDS is not fatal for shrimp,
the wide distribution in size it causes, reducing the value of affected crops to 50%,
also devastates crop production because shrimp market value depends mainly on the
body weight/size of shrimp (Bell and Lightner, 1984; Lightner, 1996a). This review
provides brief information of PstDV and highlights some relevant issues that need
proper consideration and fulfilment in order to circumvent outbreaks of PstDV.
2.2. PstDV information
2.2.1. Classification and genome characterization
PstDV is a non-enveloped icosahedral virus with an estimated size of 22 nm,
smallest of all known penaeid shrimp viruses. Its genome contains a single-stranded
linear DNA (ssDNA) of approximately 3.9 kilo base pairs (kbp), and shares a
common structure and organization with the genome of mosquito brevidensoviruses
(Aedes albopictus densovirus, AalDNV, and Aedes aegypti densovirus, AaeDNV).
Therefore, it is classified as a tentative species in the family Parvoviridae, genus
Brevidensovirus (Fauquet et al., 2005).
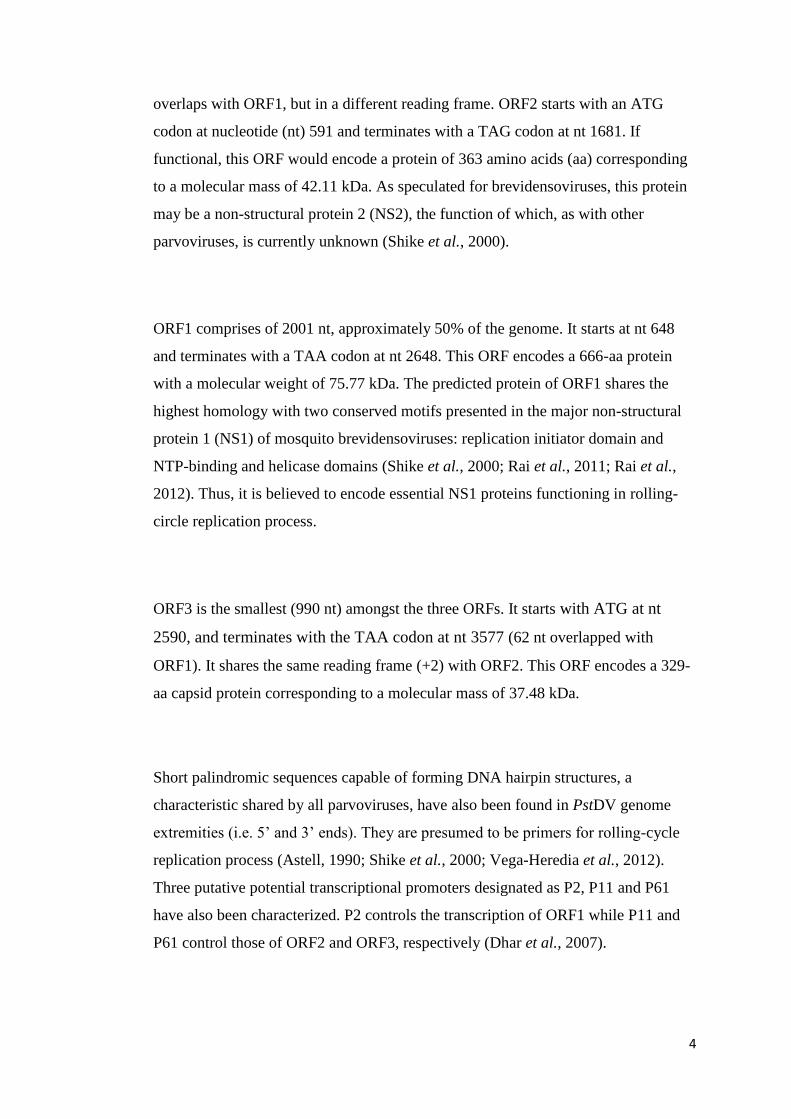
The genome of PstDV contains 3 main open reading frames (ORFs) arranged from
the left to the right on plus strand DNA: ORF2, ORF1; and ORF3 (Figure 2.1) (Rai
et al., 2011). Based on the Indian isolate reported recently (GenBank No.
GQ411199) (Rai et al., 2011), ORF2 comprises of 1092 bp with the sequence
4
overlaps with ORF1, but in a different reading frame. ORF2 starts with an ATG
codon at nucleotide (nt) 591 and terminates with a TAG codon at nt 1681. If
functional, this ORF would encode a protein of 363 amino acids (aa) corresponding
to a molecular mass of 42.11 kDa. As speculated for brevidensoviruses, this protein
may be a non-structural protein 2 (NS2), the function of which, as with other
parvoviruses, is currently unknown (Shike et al., 2000).
ORF1 comprises of 2001 nt, approximately 50% of the genome. It starts at nt 648
and terminates with a TAA codon at nt 2648. This ORF encodes a 666-aa protein
with a molecular weight of 75.77 kDa. The predicted protein of ORF1 shares the
highest homology with two conserved motifs presented in the major non-structural
protein 1 (NS1) of mosquito brevidensoviruses: replication initiator domain and
NTP-binding and helicase domains (Shike et al., 2000; Rai et al., 2011; Rai et al.,
2012). Thus, it is believed to encode essential NS1 proteins functioning in rolling-
circle replication process.
ORF3 is the smallest (990 nt) amongst the three ORFs. It starts with ATG at nt
2590, and terminates with the TAA codon at nt 3577 (62 nt overlapped with
ORF1). It shares the same reading frame (+2) with ORF2. This ORF encodes a 329-
aa capsid protein corresponding to a molecular mass of 37.48 kDa.
Short palindromic sequences capable of forming DNA hairpin structures, a
characteristic shared by all parvoviruses, have also been found in PstDV genome
extremities (i.e. 5’ and 3’ ends). They are presumed to be primers for rolling-cycle
replication process (Astell, 1990; Shike et al., 2000; Vega-Heredia et al., 2012).
Three putative potential transcriptional promoters designated as P2, P11 and P61
have also been characterized. P2 controls the transcription of ORF1 while P11 and
P61 control those of ORF2 and ORF3, respectively (Dhar et al., 2007).
5
Figure 2.1: Genomic organization of coding sequences of PstDV genome (Rai et
al., 2012). The genome is shown in plus strand. The three open reading
frames designated as ORF1, ORF2 and ORF3 are indicated in boxes.
ORF2 and ORF3 are in reading frame 1 (+1) and ORF1 is in reading
frame 3 (+3).
2.2.2. Occurrence and geographical distribution
PstDV has been reported in many regions around the world including North, South,
Central America, the Caribbean and the Indo-Pacific region and is now considered
cosmopolitan in distribution (Rai et al., 2012). PstDV was first reported in P.
stylirostris cultured in the early 1980s in Hawaii (Lightner et al., 1983a; Rai et al.,
2012) where it was believed to have been introduced by importation of live
experimental P. monodon from the Philippines during the early development of
shrimp aquaculture (Tang et al., 2003; Flegel, 2006). Then, it was found distributed
in every country of the Americas in which P. vannamei was cultivated (Lightner,
1996a) and in Asia and Africa (Tang and Lightner, 2006; Rai et al., 2009;
Saksmerprome et al., 2010). In South East (SE) Asia, it is believed to be introduced
from Thailand to Taiwan as both live and frozen shrimp in Taiwan are frequently
imported from Thailand. This assumption is supported by the high similarity in
DNA sequence (99.7%) of the virus amongst the 2 countries (Tang et al., 2003).
PstDV has also been reported in India, and it is also believed to have come from SE
Asia as these 2 geographical isolates are phylogenetically closely related (Rai et al.,
2009). Besides infectious PstDV, non-infectious sequence, mostly referred to virus-
related DNA fragments presenting in the genome of P. monodon, have been reported
in some parts of the world such as East Africa, western Indo-Pacific region (Tang
and Lightner, 2006; Tang et al., 2007) and SE Asia (Saksmerprome et al., 2011) (see
section 2.3.1.1).
6
Based on its distinct genotypes in both infectious and non-infectious groups, PstDV
has been separated into three types (Tang and Lightner, 2006; Tang et al., 2007):
Type 1 from the Americas and East Asia (principally the Philippines); Type 2 from
SE Asia (i.e. Thailand); Type 3A from East Africa (Mozambique but mainly
Madagascar), Australia and India; and Type 3B from the western Indo-Pacific
countries including Mauritius but mainly Tanzania and Mozambique, and Malaysia.
The first two genotypes are infectious to penaeid shrimp while the latter two genetic
variants, 3A and 3B, are not infectious even though their genomes contain all 3
ORFs similar to those labelled as infectious (Tang and Lightner, 2002a; Tang et al.,
2003; Tang and Lightner, 2006; Tang et al., 2007). Type 3A was later been found to
be integrated into the genome of P. monodon from East Africa, Tanzania and
Mozambique (Tang and Lightner, 2006; Tang et al., 2007). Although the PstDV
integrated sequences are reported as not infectious to host species, this has never
been tested experimentally and whether or not they encode proteins remains unclear.
Table 2.1 summarizes the geographical distribution of PstDV to date.
7
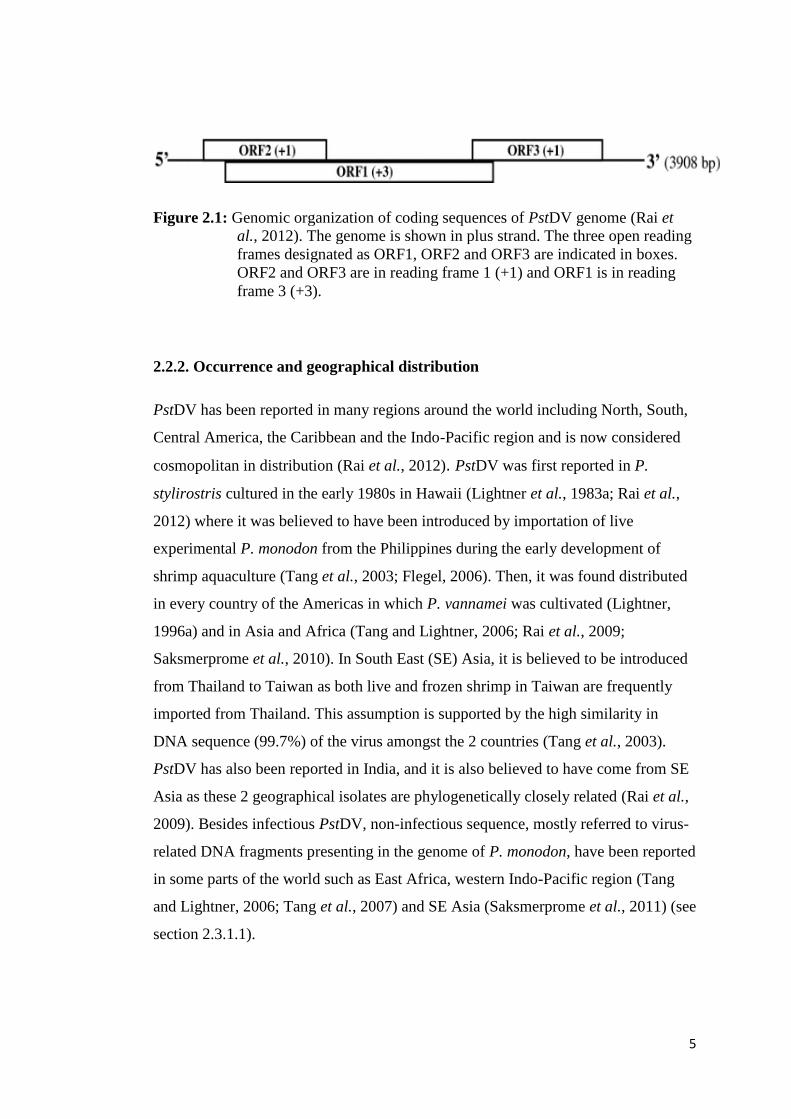
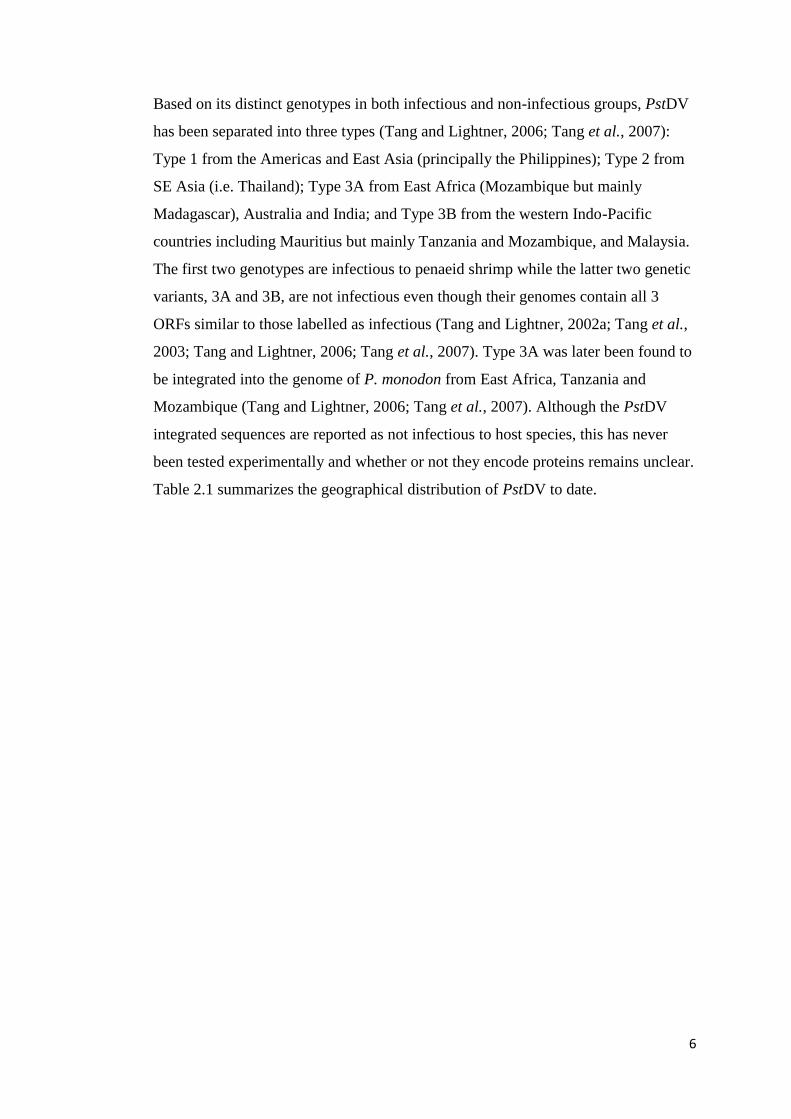
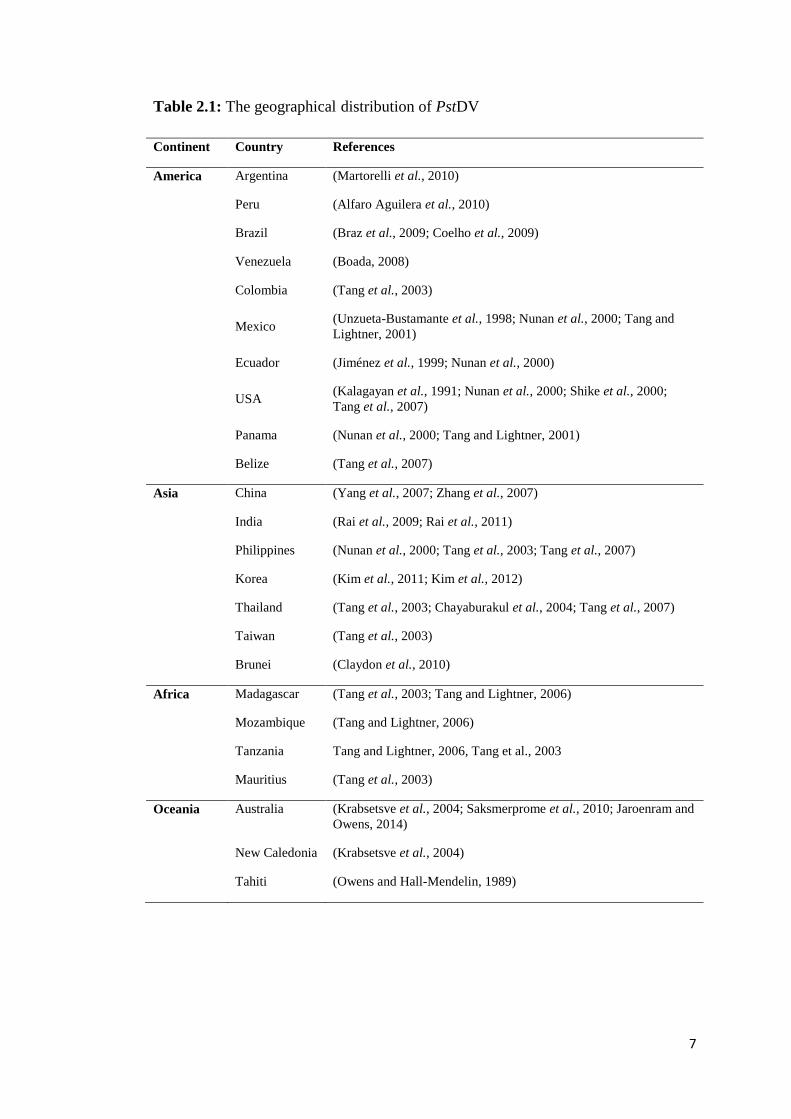
Table 2.1: The geographical distribution of PstDV
Continent Country References
America Argentina (Martorelli et al., 2010)
Peru (Alfaro Aguilera et al., 2010)
Brazil (Braz et al., 2009; Coelho et al., 2009)
Venezuela (Boada, 2008)
Colombia (Tang et al., 2003)
Mexico (Unzueta-Bustamante et al., 1998; Nunan et al., 2000; Tang and
Lightner, 2001)
Ecuador (Jiménez et al., 1999; Nunan et al., 2000)
USA (Kalagayan et al., 1991; Nunan et al., 2000; Shike et al., 2000;
Tang et al., 2007)
Panama (Nunan et al., 2000; Tang and Lightner, 2001)
Belize (Tang et al., 2007)
Asia China (Yang et al., 2007; Zhang et al., 2007)
India (Rai et al., 2009; Rai et al., 2011)
Philippines (Nunan et al., 2000; Tang et al., 2003; Tang et al., 2007)
Korea (Kim et al., 2011; Kim et al., 2012)
Thailand (Tang et al., 2003; Chayaburakul et al., 2004; Tang et al., 2007)
Taiwan (Tang et al., 2003)
Brunei (Claydon et al., 2010)
Africa Madagascar (Tang et al., 2003; Tang and Lightner, 2006)
Mozambique (Tang and Lightner, 2006)
Tanzania Tang and Lightner, 2006, Tang et al., 2003
Mauritius (Tang et al., 2003)
Oceania Australia (Krabsetsve et al., 2004; Saksmerprome et al., 2010; Jaroenram and
Owens, 2014)
New Caledonia (Krabsetsve et al., 2004)
Tahiti (Owens and Hall-Mendelin, 1989)
8
2.2.3. Clinical signs and mode of transmission
PstDV infection does not produce any specific clinical signs of disease (Lightner et
al., 1983b). In P. stylirostris, acute infected juveniles and sub-adults show reduced
food consumption, becoming motionless then rolling over and slowly sinking to the
pond bottom, then they die (Rai et al., 2012). In P. vannamei and P. monodon,
PstDV typically causes chronic disease (Lightner et al., 1983b) and the infection
results in development and growth abnormalities (i.e. deformed rostrum, wrinkled
antennal flagella, cuticular roughness, ‘bubble-heads’ and deformation of 6th
abdominal segment and tail fan) known as RDS (Brock et al., 1983; Browdy et al.,
1993; Bray et al., 1994; Primavera and Quinitio, 2000; Khawsak et al., 2008; Rai et
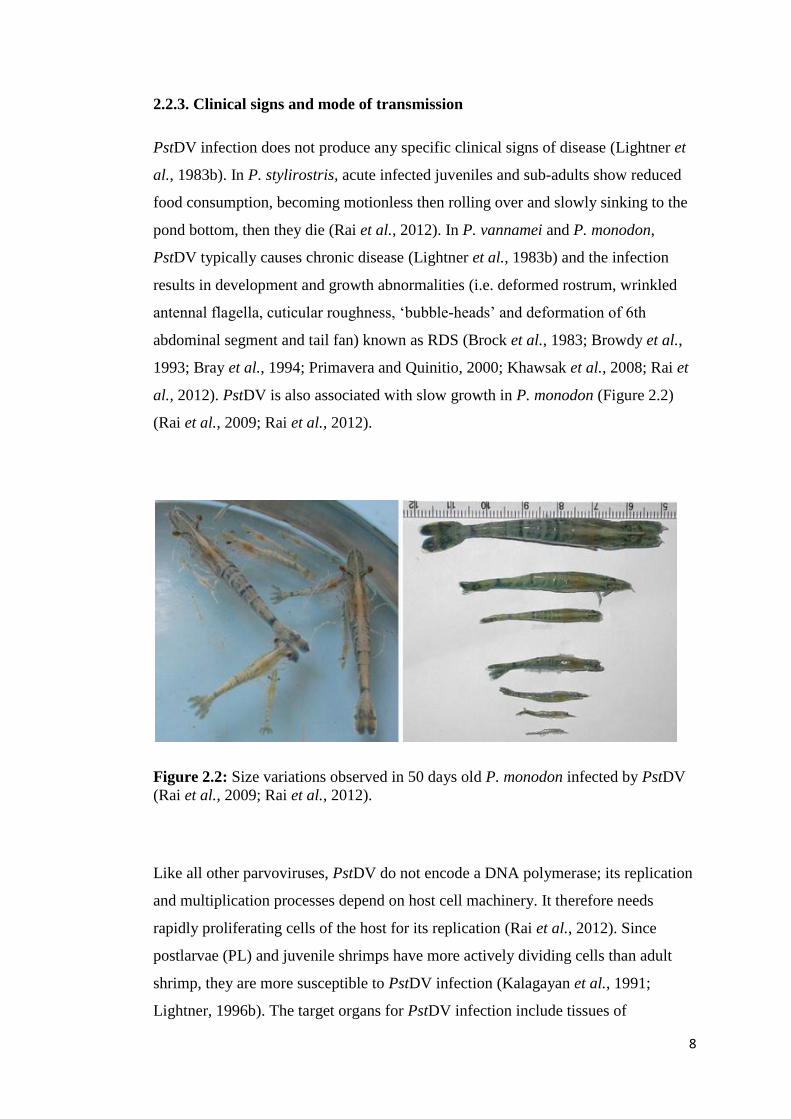
al., 2012). PstDV is also associated with slow growth in P. monodon (Figure 2.2)
(Rai et al., 2009; Rai et al., 2012).
Figure 2.2: Size variations observed in 50 days old P. monodon infected by PstDV
(Rai et al., 2009; Rai et al., 2012).
Like all other parvoviruses, PstDV do not encode a DNA polymerase; its replication
and multiplication processes depend on host cell machinery. It therefore needs
rapidly proliferating cells of the host for its replication (Rai et al., 2012). Since
postlarvae (PL) and juvenile shrimps have more actively dividing cells than adult
shrimp, they are more susceptible to PstDV infection (Kalagayan et al., 1991;
Lightner, 1996b). The target organs for PstDV infection include tissues of
9
ectodermal (cuticular epidermis, hypodermal epithelium of the fore and hind gut,
nerve cord and nerve ganglia) and mesodermal (hematopoietic organs, antennal
gland, tubule epithelium, gonads, lymphoid organ, connective tissue and striated
muscle) origin (Lightner, 1996b; Rai et al., 2012).
2.2.4. Prevalence and host ranks
PstDV can spread both horizontally and vertically (Lightner et al., 1983a; Motte et
al., 2003). Horizontal transmission occurs when individual shrimp eat dead infected
shrimp or are in the water contaminated with the virus. Several studies regarding the
successful horizontal transmission by ingestion of PstDV-infected shrimp support
this observation (Bell and Lightner, 1987; Tang and Lightner, 2006; Coelho et al.,
2009). Shrimp surviving PstDV become carriers for life even though they show no
signs of the disease (Bell and Lightner, 1987). Vertical transmission occurs due to
transfer of this virus from mother to offspring. This could be through the shedding
of viral particles at the time of spawning and then ingestion by larvae at first
feeding, or by the transmission of virus from oocytes to larvae (Lotz, 1997). The
vertical transmission of PstDV through female P. vannamei was confirmed by
nested-PCR analysis of embryos and larvae produced by PstDV-infected females
fertilized by PstDV-free males (Motte et al., 2003). Zhang and Sun also reported
PstDV in ovarian tissues and fertilized egg of Penaeus chinensis (Zhang and Sun,
1997).
The prevalence of PstDV can range from low to very high but 90-100% is typical in
farmed shrimp (Lightner et al., 1983a; Lightner et al., 1992; Martínez-Cordova,
1992; Chayaburakul et al., 2004). A prevalence as high as 51.5% was reported in P.
vannamei collected from culture areas of the northern China during 2001 and 2004
(Yang et al., 2007). PstDV was also reported to cause RDS and high mortalities
(80%) in PL and sub-adults of Macrobrachium rosenbergii cultured in Taiwan but
the prevalence was not presented (Hsieh et al., 2006). For wild captured shrimp, the
mean values of prevalence were: 100% in female P. stylirostris collected from the
mid-region of the Gulf of California, Mexico (Morales-Covarrubias et al., 1999);
10
51-63% in P. vannamei captured from the Pacific coast of Ecuador (Motte et al.,
2003); 18%-50% in Penaeus californiensis collected from the upper Gulf of
California, Mexico (Pantoja et al., 1999); 4.4% in Penaeus aztecus and Penaeus
setiferus from the East Coast of Mexico (Guzmán-Sáenz et al., 2009; Vega-Heredia
et al., 2012); 56% in Artemesia longinaris and 40% in Palaemon macrodactylus
collected from the Bahı´a Blanca Estuary, Argentina (Martorelli et al., 2010).
Another survey revealed 20% prevalence in Malaysian wild female berried M.
rosenbergii broodstock which showed no gross signs of disease (Hazreen Nita et al.,
2012). PstDV was also detected in crabs. Low prevalence (8.3%) was reported in
Hemigrapsus penicillatus (Hairy-clawed shore crabs) collected from the culture
areas of the northern China during the year 2001-2004 (Yang et al., 2007). In
contrast, a high prevalence of 67% was observed with Cyrtograpsus angulatus
collected from the Bahı´a Blanca Estuary, Argentina (Martorelli et al., 2010). In
Australia, a survey of 328 wild caught prawns (7 species), crabs and lobsters
revealed that only P. monodon were positive for PstDV or PstDV-like amplicons
(Krabsetsve and Owens, unpublished). In addition to natural infection, experimental
infection with no clinical signs of disease was observed with Penaeus subtilis
(Coelho et al., 2009).
Obviously, several shrimp species and arthropods commonly found in shrimp
culture areas (i.e. crabs) are susceptible to PstDV. It would appear that the most
dangerous scenario would be for a PstDV outbreak to occur in shrimp ponds and for
wild crustaceans such as crabs to have the opportunity to eat infected shrimp
carcasses. They would have a high chance of becoming infected and could possibly
carry the virus to an uninfected pond where the risk of transmission would be high if
they were eaten by shrimp (horizontal transmission). Therefore, the practice of
eliminating wild crustaceans from rearing ponds should constitute an effective
control measure for PstDV. Current known host species of PstDV and the
prevalence of the virus are listed in Table 2.2
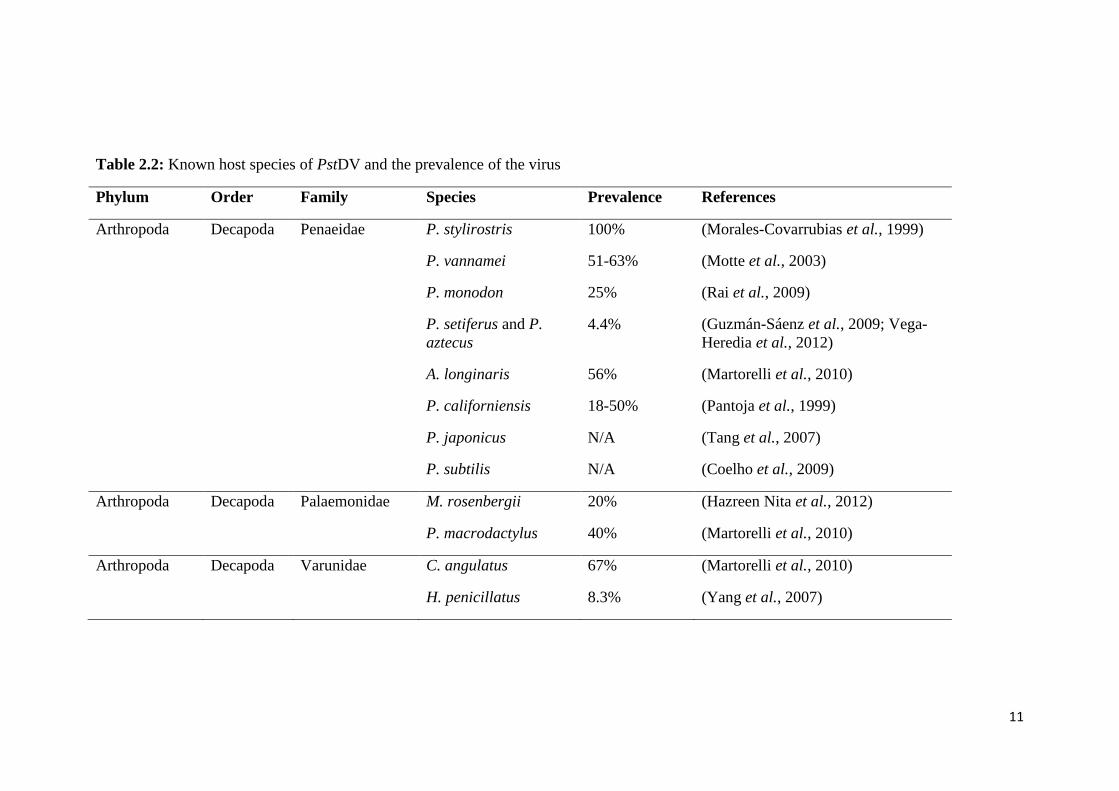
11
Table 2.2: Known host species of PstDV and the prevalence of the virus
Phylum Order Family Species Prevalence References
Arthropoda Decapoda Penaeidae P. stylirostris 100% (Morales-Covarrubias et al., 1999)
P. vannamei 51-63% (Motte et al., 2003)
P. monodon 25% (Rai et al., 2009)
P. setiferus and P.
aztecus
4.4% (Guzmán-Sáenz et al., 2009; Vega-
Heredia et al., 2012)
A. longinaris 56% (Martorelli et al., 2010)
P. californiensis 18-50% (Pantoja et al., 1999)
P. japonicus N/A (Tang et al., 2007)
P. subtilis N/A (Coelho et al., 2009)
Arthropoda Decapoda Palaemonidae M. rosenbergii 20% (Hazreen Nita et al., 2012)
P. macrodactylus 40% (Martorelli et al., 2010)
Arthropoda Decapoda Varunidae C. angulatus 67% (Martorelli et al., 2010)
H. penicillatus 8.3% (Yang et al., 2007)
12
2.3. Current factors hampering the success of control for PstDV
2.3.1. Current problems in diagnostics: viral inserts in shrimp genome
To date, retroviruses have been the only known eukaryotic viruses that require host
genomic integration for completion of their life cycle (Feschotte and Gilbert, 2012).
However, several recent reports have revealed countless non-retroviral sequences
that are integrated or ‘endogenized’ in the genomes of eukaryotes, for instance,
caulimovirus (Staginnus and Richert-Pöggeler, 2006; Iskra-Caruana et al., 2010) and
baculovirus (Lin et al., 1999) have been identified in plant genomes and insect
genomes respectively for some time. The discovery of endogenous viral elements
(EVEs) derived from non-retroviruses suggests that all major types of eukaryotic
viruses could give rise to EVEs (Feschotte and Gilbert, 2012).
2.3.1.1. PstDV endogenous viral elements in shrimp
PstDV was first reported to integrate into shrimp genome by Tang and Lightner
(2006). By screening P. monodon collected from various geographical areas using
PCR with primers MG831F/R designed for the type 3A viral sequence and DNA
sequencing, P. monodon from Madagascar (collected in 2001) and Australia
(collected in 2004) revealed the viral insert sequences linked with various shrimp
DNA markers including P. monodon clone AFE20M24 (GenBank No.
AY654006.1), P. vannamei microsatellite TUMXLV 6.114 (GenBank No.
AY46620.1), P. monodon clone AFE49M19.1 (GenBank No. AY654020.1), and P.
monodon microsatellite PM2334 (GenBank No. AY500859.1). Amongst these
samples, Australian P. monodon carried the type A viral sequence as high as 80%
(16 samples out of 20). Histological examination of P. monodon or P. vannamei
challenged with the Australian P. monodon carrying the viral inserts showed no
gross pathology of PstDV infection (i.e. Cowdry A inclusion bodies). Unfortunately,
these shrimp species were a poor choice for the 2-week bioassay as RDS changes
are chronic, not acute, and are unlikely to manifest within 2 weeks. The occurrence
of endogenous PstDV elements was also recently reported in Indian shrimp (Rai et
al., 2009). Of 177 P. monodon screened by the MG831F/R primers and the other
three recommended by OIE [IHHNV392F/R (Tang et al., 2000), IHHNV389F/R
13
(Tang and Lightner, 2006) and 309F/R (Tang et al., 2007)], 33.7% PL and 31.7%
adult shrimp possessed only type A-PstDV viral sequence while 22.8% PL and
10.5% adults had both type A and infectious type. DNA sequence analysis of PCR
products derived from the MG831F/R primers (832 bp) revealed linkage between
the PstDV sequences and various shrimp DNA microsatellites.
Recently, Krabsetsve and Owens (unpublished) screened 196 shrimp samples by
PCR using 3 OIE primers (IHHNV392F/R, IHHNV389F/R and 309F/R). The
samples made up of 158 shrimp (mainly P. monodon) collected from farms and
research institutes in northern Queensland between 1993 and 2009, 3 shrimp
imported from Brunei, and 35 shrimp (imported from New Caledonia, China,
Malaysia and Indonesia) purchased from fish shops in northern Queensland, during
2002 and 2009 (Table B.1, Appendix B). According to the results (Table B.2,
Appendix B), 124/158 samples (78.48%) of Australian shrimp, and 2/38 (5.26%) of
imported shrimp (only from Brunei) show positive result by the MG831F/R primers
indicating that they contain viral fragments in their genome. All samples from
Malaysia (10 shrimp) neither contain infectious type nor non-infectious type of
PstDV. By contrast, those from China and New Caledonia were most likely to carry
infectious PstDV as they give positive amplicons by all the 3 ORF primer sets
above. However, it is also possible that they just possessed independent inserts that
cover the target regions for all the 3 primers. Further assays to prove this hypothesis
are required.
2.3.1.2. Insertion pattern of PstDV elements in shrimp genome
Scattered reports of PstDV-related sequences inserted in shrimp (Tang and Lightner,
2006; Tang et al., 2007; Rai et al., 2009) opened up the question as to whether it
forms only one way or in a variety of ways (Saksmerprome et al., 2011) To answer
the question, Saksmerprome et al. (2011) screened 99 shrimp (P. monodon) using
PCR employing 7 overlapping primer pairs designed to cover 90% of the PstDV
genome (GenBank No. AF273215). All shrimp were collected from a shrimp
hatchery in Thailand. PCR failure with some pairs indicated sequence gaps that
14
revealed a random pattern of putative viral inserts in the genomes of individual
shrimp. Genome walking with one putative insert showed that the insert was
associated with the host microsatellites (thrombospondin-like expressed sequence
taq, EST of P. monodon: CF805583). The microsatellites reported differed from
those previously identified for the other PstDV inserts in P. monodon (Tang and
Lightner, 2006; Tang et al., 2007). This finding together with no pattern in the
number and length of inserts support the hypothesis that the insertion of viral DNA
may occur autonomously in a random manner and mostly likely occurs in repetitive
or transposon-like elements of the host chromosome (Flegel, 2009). PstDV-related
sequences have also been found in the genome of Cherax quadricarinatus
(Australian redclaw crayfish) (Rusaini et al., 2013).
A recent search for homologs of parvoviral proteins in publicly available eukaryotic
genome databases followed by experimental verification and phylogenetic analysis
revealed that several parvovirus-related DNA sequences were presented in the germ
lines of diverse animal species, including mammals, birds, fishes, arthropods, and
flatworms. Some of them were expressed, suggesting that these viral DNA
fragments are also functional in the host genomes (Liu et al., 2011).
As for PstDV, rather than causing mortality to P. monodon, it survives persistently
and becomes endogenized (see above). Although the reasons behind this
phenomenon remains unclear, accumulating evidence regarding the EVEs suggests
that the PstDV endogenized sequences, may be involved in viral control mediated
by a host RNA interference mechanism (Flegel, 2009). However, this hypothesis
needs further studies to prove. The multiple hosts of endogenous PstDV are similar
to those of other non-retroviruses including parvoviruses. This phenomenon
supports the assumption stating that “almost any major type of eukaryotic virus may
be endogenized, sometime in multiple hosts independently and over wide
evolutionally periods” (Feschotte and Gilbert, 2012).
15
2.3.1.3. PCR detection and false positive results arising from viral inserts
As almost all parts of the PstDV genome have been found integrated, many PCR
primers have inevitably given false positive results and this includes the 309F/R
primers (Tang et al., 2007) which are currently being recommended by OIE. Tthe
widely used IQ2000TM
detection kit (Intelligene, Taiwan) also shows a high
prevalence of 76% for shrimp collected from Thailand (Saksmerprome et al., 2011),
and a low prevalence with 5 % to 8% for shrimp sampled from Africa and Australia
(http://www.iq2000kit.com/news_detail.php?gid=1&nid=1). Since the nested
primers for the IQ2000 TM
kit are designed in the same region of the 309F/R primers,
the same level of false positive results with the samples tested would probably occur
(Saksmerprome et al., 2011).
False positives caused by the inserts occurred with the OIE primers and the
IQ2000TM
kit could lead to a negative impact on international shrimp trade and
disease quarantine management. Thus, more reliable and specific detection protocols
are required.
2.3.1.4. Recombinase polymerase amplification and lateral flow dipstick assay:
alternative approaches for PstDV detection
Recombinase polymerase amplification (RPA) is a novel approach for rapid and
specific DNA amplification. Unlike standard PCR, RPA amplifies DNA under
single temperature range (37–42 °C) (Piepenburg et al., 2006). Therefore,
sophisticated thermal cyclers are not required. Unlike other DNA isothermal
technologies including loop mediated DNA isothermal amplification (LAMP) which
use 4–6 primers working with Bacillus stearothermophilus (Bst) DNA polymerase
to synthesize various sizes of DNA amplicons comprising concatenated inverted
repeats of target DNA (Notomi et al., 2000), RPA employs phage-derived
recombinase working with single-strand DNA binding protein (SSB) to direct two
primers to a homologous target sequence in a DNA template. This is coupled to a
Staphylococcus aureus-derived DNA polymerase (Sau DNA polymerase) possessing
16
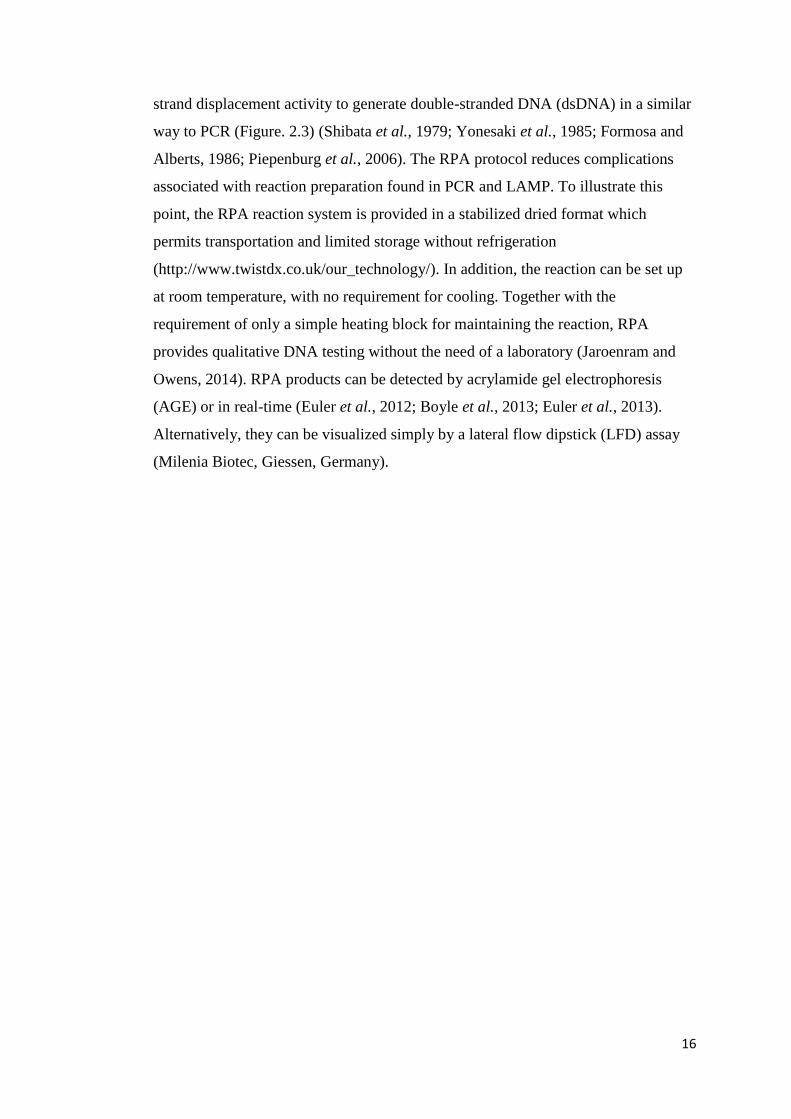
strand displacement activity to generate double-stranded DNA (dsDNA) in a similar
way to PCR (Figure. 2.3) (Shibata et al., 1979; Yonesaki et al., 1985; Formosa and
Alberts, 1986; Piepenburg et al., 2006). The RPA protocol reduces complications
associated with reaction preparation found in PCR and LAMP. To illustrate this
point, the RPA reaction system is provided in a stabilized dried format which
permits transportation and limited storage without refrigeration
(http://www.twistdx.co.uk/our_technology/). In addition, the reaction can be set up
at room temperature, with no requirement for cooling. Together with the
requirement of only a simple heating block for maintaining the reaction, RPA
provides qualitative DNA testing without the need of a laboratory (Jaroenram and
Owens, 2014). RPA products can be detected by acrylamide gel electrophoresis
(AGE) or in real-time (Euler et al., 2012; Boyle et al., 2013; Euler et al., 2013).
Alternatively, they can be visualized simply by a lateral flow dipstick (LFD) assay
(Milenia Biotec, Giessen, Germany).
17
Figure 2.3: Mechanism of recombinase polymerase amplification (RPA). The RPA
mechanism is driven by the three core proteins (recombinase, single-
strand DNA binding protein (SSB) and strand-displacing polymerase)
working under isothermal temperature with no requirement for an initial
chemical or thermal melting step. This diagram was created by TwistDx
Ltd (http://www.twistdx.co.uk/our_technology/) and is licensed under a
Creative Commons Attribution 3.0 United States License.
18
The lateral flow dipstick (LFD) assay is a technique intended to detect the presence
or absence of a target analyte in samples using the principle of hybridization and
chromatography in membrane strips without the need for specialized and costly
equipment (Milenia Biotec, Giessen, Germany). The assay can be applied to detect
any DNA of interest, and the read-out is visualised by eye (Jaroenram et al., 2009).
For the Milenia® HybriDetect LFD which was used in this study, it is a universal test
dipstick designed to develop qualitative test systems for several analytes. However,
to use this dipstick format, the user needs to develop an analyte-specific solution,
which contains a first detector (e.g. antibody, specific probe) labelled with
fluorescein isothiocyanate (FITC), and a second one (e.g. antibody, primers) labelled
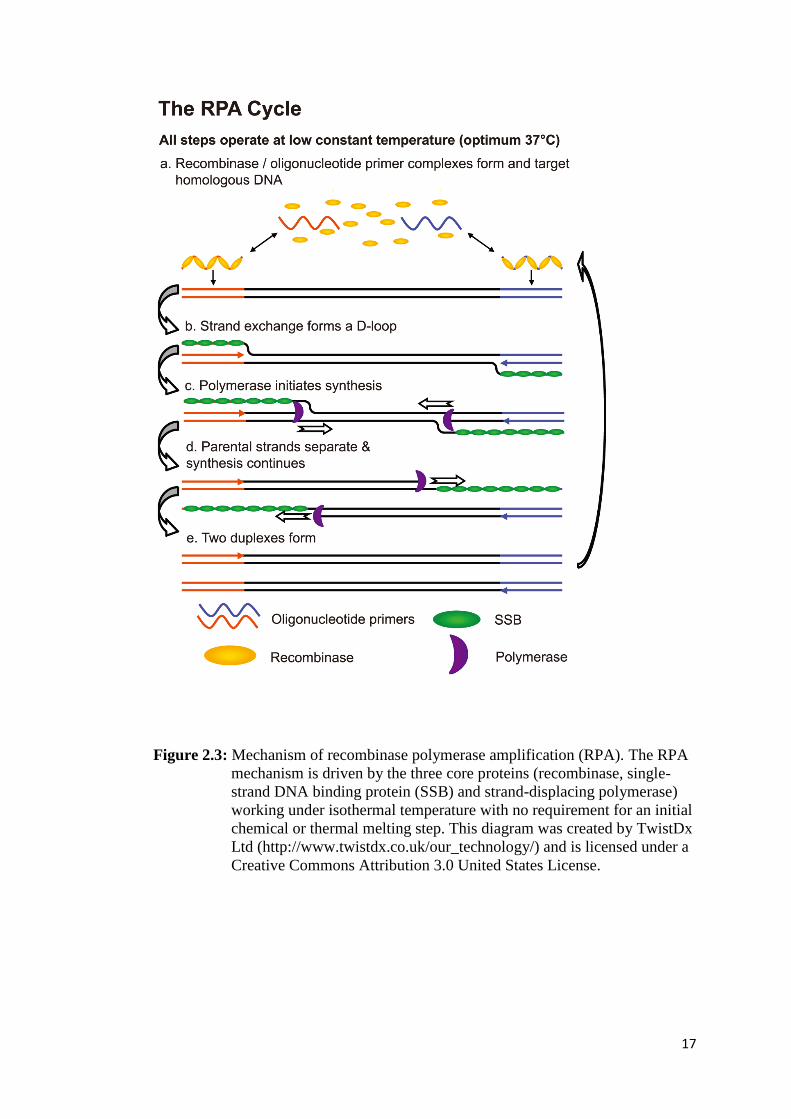
with biotin. The working principle of the Milenia®
HybriDetect LFD is depicted in
Figure 2.4. Briefly, a ready-to-use strip precoated with nanogold particles, anti-FITC
antibody and biotin ligand is prepared (Step 1). The sample to be determined (e.g.
protein, gene amplicons) is mixed with the developed analyte-specific solution (Step
2). The dipstick is dipped into the solution, and the result is read after a 5-min
incubation (Step 3-4). In these steps, the complexed analyte carrying FITC and
biotin binds first to the gold-labeled FITC-specific antibodies in the sample
application area of the dipstick. By capillary force, the gold complexes diffuse over
the membrane. Only the analyte-captured gold particles will bind when they
overflow the immobilized biotin-ligand molecules at the test band and generate a
visible red-purple colour. Unbound gold particles further migrate then to be fixed at
the control band by species-specific antibodies resulting in a read as a control line.
This technique can be carried out within 10 min, about 5-10 times faster than gel
electrophoresis (including gel preparation). Its additional advantage is confirmation
of DNA identity by hybridization. This feature could help eliminating the false
positive results arising from nonspecific amplification (Jaroenram et al., 2009).
Altogether, combining LFD with RPA would further increase the simplicity and
efficiency of detection protocols.
To date, the combined protocol has been reported to detect only two pathogens:
Plasmodium falciparum (Kersting et al., 2014) and methicillin-resistant
Staphylococcus aureus (Piepenburg et al., 2006). Thus, exploring the possibility of
19
using the combined protocol to detect other pathogens including PstDV is
interesting.
Figure 2.4: The working principle of the Milenia®
HybriDetect LFD.
20
2.3.2. Current problems in control of PstDV outbreaks: Lack of understanding
of the diversity and population dynamics of PstDV
Understanding the genetic diversity of PstDV is significantly important as it helps to
gain insights into evolution and population dynamics, and consequently may help
contribute toward better strategies to counter the virus.
In 2003, a test to evaluate the level of genetic diversity of PstDV genome was
conducted using 14 isolates collected from penaeid shrimp in SE Asia (Philippines,
Thailand and Taiwan), the Americas (Hawaii, Mexico, Colombia, Ecuador and
Panama) and Africa (Tanzania, Madagascar and Mauritius) during the year 1996-
2001 (Tang et al., 2003). Based on the sequence analysis of a 2.9-kb fragment of
PstDV DNA covering ORF1, ORF2 and ORF3, the Hawaii isolate showed a very
high nt identity to the Philippine (99.8%) and the Thai isolates (96.2%). This
observation supports the assumption that the PstDV circulating in the USA had
originated from Philippines (Lightner, 1996a; Tang et al., 2003). In contrast, the
Hawaii isolate showed great divergence to the Tanzanian (8.2%) and the
Madagascan isolates (14.1%). The notably high sequence divergences observed with
the Tanzania and the Madagascar isolates might result from the virus-related
sequences which were later found in the genome of P. monodon from these two
countries (Tang and Lightner, 2006) (see section 2.3.1.1).
At roughly the same time, a similar study (in terms of methodology and analysis)
was conducted by the same research group (Tang and Lightner, 2002b). By using 14
PstDV isolates collected from cultured shrimp stocks in only the Americas (USA;
Hawaii and Texas, Mexico, Colombia, Ecuador and Panama) between 1982 and
1997, less than 0.5% nt sequence divergence was observed (i.e. 99.6 - 100%
similarity) (Tang and Lightner, 2002b). Although 14 out of 25 nt substitutions
observed resulted in aa changes, there was no significant association between
clinical outcomes and any particular aa substitutions. According to the authors, the
results therein lead to the suggestion that the high stability of the PstDV genome
among the 14 isolates over the period examined is due to “the development of a
21
more balanced host-pathogen relationship”. This suggestion was supported by the
observation that no high mortalities of cultivated shrimp caused by PstDV have been
recorded on the Pacific coast of USA and Mexico after the epizootics of 1990s
(Morales-Covarrubias et al., 1999). They stated that “L. stylirostris has developed
resistance to IHHNV and/or the virus has reached an equilibrium with the host in
terms of genes related to virulence” (Morales-Covarrubias et al., 1999; Tang and
Lightner, 2002b; Robles-Sikisaka et al., 2010).
However, the Tang and Lightner (2002b) conclusion was based on only 14 samples
from the one genetic lineage. Additionally, quantitative measurement of a current
degree of genetic variation in terms of the underlying evolutionary processes i.e.
mutation, genetic drift, gene flow was not conducted. Recently, Robles-Sikisaka et
al. (2010) have presented contrasting results to the Tang and Lightner’s study
(2002b). By comparing the capsid protein (CP) gene sequence of 89 penaeid shrimp
(P. stylirostris, P. vannamei and Farfantepenaeus californiensis) collected from
locations in the north-western Pacific coast of Mexico between 2004 and 2005 with
14 published sequences of PstDV CP gene (P. stylirostris and P. monodon from
different geographic locations) using Bayesian coalescent approaches, an
unexpected high mean rate of nt substitution (1.39x10⁻⁴
substitutions/site/year) was
discovered. This was comparable to nt substitution rate of RNA viruses. The degree
of nt diversity was also high, almost 5 times greater than those reported previously
(Tang et al., 2003), and not uniform across geographic regions. The presence of
several quickly evolving lineages in the north-western Pacific coast of Mexico might
be viewed as geographic ‘‘hotspots’’ of PstDV diversity that could lead to the
emergence of virulent strains following changes in the host or environmental
conditions (Robles-Sikisaka et al., 2010).
In Australia, PstDV has been reported officially since 1991 (Owens et al., 1992)
despite this country being geographically isolated with strict quarantine policies to
control/avoid the importation of live shrimp from overseas. Comparison of the PCR
fragment derived from the Australian PstDV strain isolated from P. monodon from a
22
farm in northern Queensland in 1993 (GenBank No. AY590120) with other
geographical isolates revealed that the PCR fragment shared the highest nt similarity
(96.2%) to the Madagascar isolate, and it shared the highest nt divergence to the
Hawaiian and New Caledonian strains (90.1% and 90.3%, respectively (Krabsetsve
et al., 2004). In contrast to these results, comparison of the maximum possible
portion of PCR fragments (2814 bp) generated from the Australian PstDV
(GenBank No. GQ475529) isolated from the same area but in 2008 with 8 GenBank
records of PstDV isolates reported from Asia revealed 94–95% identity in nt
sequence and 96 to 97% identity in aa sequence (Saksmerprome et al., 2010). This
result indicates that sequence of this isolate (GenBank No. GQ475529) has high
identity to those of PstDV from nearby areas in SE Asia. Based on the contradictory
reports by the two research groups, it may be able to conclude that there are two
different PstDV lineages in Australia: one has a geological time frame and one has a
contemporary time frame. This is based on a high nt variation between the
Australian and Hawaii isolates reported by Krabsetsve et al. (2004) which is
geologically endemic in Australian P. monodon, and the other is a new SE Asian
strain introduction which has been recently reported by Saksmerprome et al (2010).
It unlikely the endemic strain was an endogenous viral element (EVE) as its whole
genome was later sequenced and submitted to GenBank database with an accession
No. EU675312.
As the two PstDV genetic variants mentioned above have been circulating in the
same region (northern Queensland), it led to the question as to whether or not their
genetic compositions reciprocally affect each other’s evolution. If they do, do they
lead to viral recombination and/or emergence of new virulent strains? Answering
these questions is important as it can pave the way to uncover the underlying
evolution and population dynamics of PstDV in Australia. This knowledge is
essential for implementing the monitoring and control measures to limit the spread
of the pathogen (i.e. restrict shrimp movement or transportation), particularly in
Australia and Indo-Pacific region where the marine environment and fauna are
shared. Understanding the impact that evolutionary processes have on the patterns of
genetic variation within and among PstDV populations, and understanding the
23
consequences of these patterns of genetic variation for various evolutionary
processes is also important and need to be studied.
2.4. Concluding remarks
The shrimp aquaculture industry is a major business carried out worldwide.
Unfortunately, it is under the serious threat of viral diseases including that caused by
PstDV. PstDV causes mass mortality in P. stylirostris, and RDS-associated stunted
growth in P. vannamei and P. monodon, resulting in a huge devastation in each
cycle of production. Despite several approaches to viral disease prevention,
outbreaks of PstDV have occurred. Success in circumvention of PstDV outbreaks
requires proper consideration and fulfillment of several areas which include, but not
limited to 1) Requirement for more reliable diagnostic approaches for seed screening
and biosecurity. 2) Requirement for the understanding of PstDV evolution and
population dynamics for effective implementation of monitoring and control
measures. This study aims to address two issues with the hope that the knowledge
will contribute toward better strategies to counter PstDV.
24
CHAPTER 3
GENERAL MATERIALS AND METHODS
The methods and materials described in this chapter were common and used in more
than one experimental chapter of the thesis. Those used only in one experiment were
described in the chapter to which they belong.
3.1. Preparation of total DNA extract
Total DNA extracts were prepared from PstDV-infected shrimp using Isolate II
Genomic DNA Kit (Bioline, London, UK) according to the manufacturer's protocol
with minor modification. Briefly, approximately 25 mg of samples (e.g. pleopods or
gills) was homogenised in 180 µl Lysis Buffer GL mixed with 25 µl Proteinase K
solution. After incubation at room temperature for 3 h, the homogenate was added
with 200 µl of Lysis Buffer G3 then incubated at 70 °C for 10 min followed by
adding 210 µl of 95% ethanol and mixing vigorously. Then, the homogenate-ethanol
mixture was transferred into reservoir of a combined spin column–collection tube
assembly and centrifuged at 11,000 × g for 1 min. After the column was emptied, it
was washed twice with 500 µl of wash buffer and dried by spinning at 11,000 × g
for 2 min to remove ethanol residue. The spin column was assembled to a new
microcentrifuge tube then was added with 100 µl of 70° C preheated elution buffer.
After 2 min incubation at room temperature, the column was centrifugation at
11,000 × g for 1 min, and then the flow-through containing total DNA was stored at
-20° C until use. To measure the quality and quantity of DNA extract, 2 µl of the
extract was spectrophotometrically analysed at 260 nm and 280 nm using
Nanophotometer (Implen GmbH, Germany). The concentration of the DNA was
adjusted to 50 ng/µl by nuclease-free water, and the DNA solution was subject to
further experiments as appropriate.
25
3.2. Preparation of total RNA extract
Total RNA extracts used in this study were extracted from shrimp infected with
viruses of interest (e.g. gill-associated virus, GAV; Taura syndrome virus, TSV;
Macrobrachium rosenbergii nodavirus, MrNV) using SV total RNA isolation
system (Promega, Madison, USA) with minor modifications. Briefly, approximately
50 mg of samples (either pleopods or gills) were homogenised in 175 µl RNA lysis
buffer followed by addition of 350 µl RNA dilution buffer. After centrifugation for
10 min at 12,000 × g, the supernatant was transferred to a 1.5-ml microcentrifuge
tube containing 200 µl of 95% ethanol. The mixture was mixed vigorously, and
transferred into reservoir of a combined spin column–collection tube assembly
which was subsequently centrifuged at 12,000 × g for 1 min. The column was then
added with freshly prepared DNase incubation mix (40 µl of yellow core buffer, 5 µl
of 90 mM MgCl2 and 5 µl of DNase I), and incubated for 15 min at room
temperature followed by the addition of 200 µl of DNase stop solution, and 1-min
centrifugation at 12,000 × g, respectively. After the column was emptied, it was
washed twice with 500 µl RNA wash solution then dried by spinning at 12,000 × g
for 2 min to remove ethanol residue. The spin column was assembled to a new
microcentrifuge tube, and was added with 100 µl of nuclease free water. After 1-min
centrifugation at 12,000 × g, the flow-through containing total RNA was
quantitatively and qualitatively analysed in the same manner of DNA, then stored at
-20˚C until used.
3.3. PCR amplification and gel electrophoresis
Unless otherwise stated, a standard PCR protocol for amplifying any target DNA
described in this thesis was performed as follows: 1) Prepare PCR mixture
containing 1× MyFi PCR buffer, 2U MyFiTM
Taq DNA Polymerase (Bioline,
London, UK), 0.4 µM each forward and reverse primer, , the specified amount of
DNA template and DNase-free water to a final concentration of 25 μl. 2) Amplify
target DNA under the thermal profile consisting of 3-min initial denaturation at
94°C, followed by 39 cycles of 94°C for 30 s, 55°C for 30 s, and 72°C for 90 s, with
26
a final extension at 72°C for 5 min. 3) Visualize PCR products by 1% TAE agarose
gel electrophoresis (AGE).
3.4. Cloning and sequencing
To perform DNA cloning and sequencing, after DNA sequences were amplified and
analysed by AGE, the PCR amplicons were extracted and purified from agarose gels
using Wizard® SV Gel and PCR Clean-Up system and ligated directly into plasmid
pGEM®-T Easy Vector (Promega, Madison, USA) according to the manufacturer's
protocol. The recombinant plasmid was cloned into JM109 Escherichia coli
competent cells (Promega, Madison, USA), and further amplified for 16 h in
Lysogeny broth (LB) (2 ml) containing 100 µg/ml of ampicillin following the
manufacturer’s protocol. The plasmid was extracted using Wizard® Plus SV
Minipreps DNA Purification System (Promega, Madison, USA). Sequencing of both
strands of DNA plasmids (5-6 clones/PCR fragment) was performed by Macrogen
Inc. (South Korea) using T7 and SP6 universal primers. The obtained sequences
were subject to further analysis as appropriate.
27
CHAPTER 4
PROFILING OF ENDOGENOUS VIRAL ELEMENTS IN THE GENOME
OF AUSTRALIAN PENAEUS MONODON
4.1. Introduction
The main objective of this study was to develop a novel molecular approach for
detecting PstDV. In general, selecting target DNA sequences is a key aspect for
developing any DNA detection system, as it is central to determining the specificity
of a diagnostic assay. It is known that the selection process can be done simply by
detecting appropriate DNA sequences which truly represent the living organism of
interest. However, this concept is exceptionally difficult for PstDV due to the
presence of its non-infectious forms, i.e. PstDV-related sequences, which are part of
shrimp genome (endogenous viral elements, EVEs). PstDV-related sequences
caused false positive results in many PCR detection protocols, including the
commonly accepted and widely used IQ2000TM
PCR detection kit (Intelligene,
Taiwan) (See Chapter 2.3.1.3).
A recent study by Saksmerprome et al. (2011) revealed that all parts of the PstDV
genome (except for hairpin ends which were not examined) were found to be
endogenised, suggesting that they may lead to false positive results for infectious
PstDV using not only the IQ2000TM
kit but also any other DNA-based detection
protocols reported thus far. It also revealed that the capsid gene of PstDV at the nt
position 3031–3625 (hereafter call the “3031-3625” region) (Mexican isolate,
GenBank No. AF273215) was least likely to produce inserts (only ~4% of false
positive rate was detected). However, the mechanism underling this phenomenon
remains unclear. Moreover, this finding was based on P. monodon collected only
from Thailand. This information stimulates the question as to whether or not such an
insertion pattern is common and consistent across different geographical lines of the
shrimp. If it is, the “3031-3625” region would be an alternative, promising target
28
DNA sequence for designing a more specific detection protocol for PstDV. To
answer the question, the experiments herein were conducted.
4.2. Materials and methods
4.2.1. Shrimp samples and DNA temple preparation
Shrimp samples (P. monodon) were obtained from 2 farms in northern Queensland
in October 2012. These farms showed no sign of PstDV infection i.e. RDS
associated slow growth syndrome. All prawns were progeny from wild caught
broodstock; 75% from the eastern coast of Queensland and 25% from Northern
Territory (personal communication with the farms). Most ponds have the progeny of
2-4 female broodstock to fill them. They were frozen and shipped to College of
Public Health, Medical and Veterinary Sciences, James Cook University. A total of
130 individual shrimp: 80 from four ponds of farm A (26, 25, 25 and four
prawns/pond), and 50 from two ponds of farm B (25 prawns each) were randomly
selected for DNA extraction. Total DNA was prepared according to the protocol
mentioned in Chapter 3.1. Two microliters of the template (50 ng/µl) were used in
the following experiments.
4.2.2. PCR detection of PstDV-related sequences in shrimp genome
All of the 130 shrimp samples were screened by PCR assays (See Chapter 3.3)
employing 8 overlapping primer pairs designed to cover the whole genome of
PstDV (minus the hairpin ends). Pairs 1-7 and 8 (ihhnA_3168/ihhnA_R3759) were
adopted from two studies by Saksmerprome et al., 2011 and 2012, respectively
29
4.3. Results
The results of PstDV insert screening are summarized in Table 4 (see Table C.1-C.3,
Appendix C, for detail of each farm and background of shrimp examined). Based on
the criteria, adopted from Saksmerprome et al. (2011), that shrimp with positive
results for amplicons using all 8 primer pairs were considered to be positive for
infectious PstDV (the whole genome was amplified), whereas those showing
incomplete results (for only some primer pairs, reflecting “gaps”) were considered
as false test positive (the whole viral genome could not be amplified), probably
arising from viral inserts, 13 of the 130 samples (all from Farm A) produced
amplicons for all of 8 primer pairs, suggesting that they contained infectious PstDV.
These samples were further subject to the evolutionary study in Chapter 6. The
remaining 117 samples gave negative results for one or more of the primer pairs
(Table 4), suggesting that the shrimp were not infected with PstDV but carried 1–7
partial fragments of the PstDV DNA, probably inserted into their genomic DNA. Of
the 117 samples, region 2 was found to insert in most of samples (111 shrimp),
accounting for 94.9% or approximately 5% greater than region 1, while the rest were
found in < 10 samples (< 6%). Interestingly, region 7 (the “3031–3625” region) was
detected in only one sample (0.85%) suggesting that it is least likely to be
endogenized. Further analysis was carried out on 20 arbitrarily selected samples
possessing gaps in the PstDV genome using PCR with the MG831F/R primers
specific for PstDV DNA-linked shrimp genomic DNA (Tang and Lightner, 2006).
Eight samples showed positive test results, indicating the presence of EVEs in their
genome, while the rest gave negative test results, which can be explained as PstDV-
related sequences may be associated with other regions on shrimp genomes which
the primers cannot anneal to (data not shown). However, further analysis of these
samples was not conducted as the aim of this study is to identify the sequence that
least likely to produce inserts only.
30
Table 4: Positive (+) and negative (−) PCR results obtained with DNA templates from 130 P. monodon using 8 overlapping primer sets that
targeted the whole genome of PstDV. In column 1, the number in brackets indicates the number of shrimp with the same pattern of
positive and negative results. For example, in “Pattern 8”, 3 samples have an identical pattern of positive and negative results.
Isolate (#)
Primer pairs used and positions relative to Mexican PstDV isolate (AF273215)
1 2 3 4 5 6 7 8
158-723 702-1260 1059-1507 1451-2027 2002-2569 2544-3100 3031-3625 3168-3759
Infective PstDV (total 13 samples)
Pattern 1 (13) + + + + + + + +
Seven inserts (1 gap) (total 1 sample)
Pattern 2 (1) + + - + + + + +
Six inserts (2 gaps) (total 4 samples)
Pattern 3 (4) + + + + + + - -
Four inserts (4 gaps) (total 2 samples)
Pattern 4 (1) + + - - - + - +
Pattern 5 (1) + + - + - + - -
Three inserts (5 gaps) (total 6 samples)
Pattern 6 (1) + - - - - + - +
Pattern 7 (1) + + + - - - - -
Pattern 8 (3) + + - - - - - +
Pattern 9 (1) + + - + - - - -
Two inserts (6 gaps) (total 91 samples)
Pattern 10 (91) + + - - - - - -
One insert (7 gaps) (total 9 samples)
Pattern 11 (8) - + - - - - - -
Pattern 12 (1) + - - - - - - -
No insert (total 4 samples)
Pattern 13 (4) - - - - - - - -
% Total positive results by each primer pair
118/130 = 90.8 124/130 = 95.4 18/130 = 13.6 20/130 = 15.4 18/130 = 13.9 21/130 = 16.2 14/130 = 10.8 19/130 = 14.6
% Total inserts by each primer pair
105/117 = 89.7 111/117 = 94.9 5/117 = 4.3 7/117 = 6.0 5/117 = 4.3 8/117 = 6.8 1/117 = 0.9 6/117 = 5.1
31
4.4. Discussion
Scattered reports of viral inserts in the genome of shrimp (De la Vega, 2006; Tang
and Lightner, 2006; Huang et al., 2008), crayfish (Rusaini et al., 2013) and insect
(Lin et al., 1999; Crochu et al., 2004; Koyama et al., 2010) genomes led to the
hypothesis that random, autonomous insertion of such sequences occurs in these
organisms and leads to specific, heritable immunity (Flegel, 2009). To test a
prediction of that hypothesis regarding random insertion of viral sequences into the
shrimp genome, Saksmerprome et al (2011) examined Thai P. monodon for random
genomic insertions of PstDV. By PCR analysis using multiple overlapping primer
pairs to cover the whole PstDV genome, PCR failure with some pairs indicated
sequence gaps that revealed a random pattern of putative viral inserts in the genomes
of individual shrimp occurred in a variety of ways (i.e. insertion). Using the same
PCR detection methodology with 130 P. monodon collected from farms in northern
Queensland, Australia, in 2012 (this study), only 13 samples were successfully
amplified by all primers, suggesting that a random pattern of gaps was present in all
the remaining samples (Table 4).
It is unlikely that the high frequency of putative gaps that we found resulted from
mismatches between primers and target templates as the primers used accommodate
the Australian PstDV (GenBank No. GQ475529 and EU675312). It was also very
unlikely that these putative gaps were from DNA degradation, since it should occur
randomly and be probabilistically distributed evenly over the whole genome in any
template DNA from a viral population; it would be unlikely for degradation to occur
selectively in specific regions of the PstDV genome in different individual shrimp
samples. Based on the arguments above and on the accumulating evidence regarding
EVEs in more recent publications (Tang and Lightner, 2006; Tang et al., 2007;
Flegel, 2009; Saksmerprome et al., 2011), together with the consistency of the PCR
results for the 8 PstDV genome regions for 13 of the shrimp, the simplest
explanation for random failures with the other 117 specimens was that they
indicated gaps or absences of portions of the PstDV genome.
32
Clearly seen in Table 4, region 7 (the “3031–3625” region) was detected in only one
sample (0.85%) suggesting that it is least likely to be endogenised. This finding is in
accordance with a recent study on the profiling of PstDV insertion examined in Thai
P. monodon (Saksmerprome et al., 2011). It indicates the common characteristics of
the insertion pattern across different geographical isolates of the shrimp, and offers
the opportunities for developing a more specific approach for PstDV detection. To
illustrate this point, the design of primers or DNA probes for a PCR detection
method focused on this area would be least likely to give a false test positive result
for the samples that we examined i.e., 1/117 (0.9%) instead of 105/117 (~90%) and
111/117 (~95%) for regions 1 and 2, respectively. In addition, using a multiplexed
method focused on regions 3 and 7 would theoretically eliminate false positives.
However, this concept was based on the insertion profile found in P. monodon. To
apply it to other species of shrimp (i.e. P. vannamei) or other species of animals (i.e.
crab and crayfish), which may possess different patterns of EVEs, constructing “gap
maps”, such as that shown in Table 4, may be needed to aid the selection of the most
suitable target DNA sequence that represents only the infectious PstDV. Another
way to eliminate false positive test results arising from EVEs is to detect the whole
genome of the virus by using, but not limited to, the 8-overlapping PCR primer
method described herein. However, the complexity and cost of 8 separate PCR
reactions is not attractive. Thus, having simple and robust methods suitable for
routine diagnosis such as LAMP (Jaroenram et al., 2009; Arunrut et al., 2011;
Jaroenram et al., 2012) and RPA (Piepenburg et al., 2006; Euler et al., 2012; Boyle
et al., 2013) would be useful.
In conclusion, we have explored and mapped the insertion patterns of PstDV-related
sequences inserted in the genome of Australian P. monodon, and we have found a
particular region in the PstDV capsid gene that is least likely to be endogenised (the
“3031–3625” region). We speculated that the capsid gene is largely cytoplasmic and
has little opportunity to interact with the shrimp genome and therefore integrates less
often. Further researches to elucidate the insertion mechanism would be particularly
informative. The “3031–3625” region was used as a target sequence to develop a
novel PstDV detection platform described in the next chapter.
33
CHAPTER 5
RECOMBINASE POLYMERASE AMPLIFICATION COMBINED WITH A
LATERAL FLOW DIPSTICK FOR DETECTION OF INFECTIOUS
PENAEUS STYLIROSTRIS DENSOVIRUS
5.1. Introduction
It is known that current PCR protocols including the OIE method detect non-
infectious PstDV-inserts found in P. monodon (Saksmerprome et al., 2011) (See
Chapter 2.3.1.3). The implications of false positives by using the method leads to a
negative impact on international shrimp trade and disease quarantine management.
Thus, more reliable detection platforms are required. Referring to the previous
Chapter, the sequence on the PstDV capsid gene at the nt position 3031–3625
(Genbank No. AF273215) is least likely to produce inserts (only 0.85% of false
positive rate was detected). This region offers opportunities for developing a more
specific approach for PstDV detection. In addition to specific detection systems,
having simple and robust methods suitable for routine and on-site diagnosis is also
crucial to provide appropriate control measures for the virus, especially for an early
response to an outbreak.
RPA-LFD is an alternative to PCR for disease diagnosis (Piepenburg et al., 2006;
Kersting et al., 2014) (see Chapter 2.3.1.4). To the best of our knowledge, the RPA-
LFD has not been used to detect any shrimp pathogen. Together with the serious
issue of viral insertions mentioned previously (Chapter 2.3.1.3), the approach was
examined here to determine whether it would detect PstDV rapidly and reduce
efficiently false positive results arising from viral inserts. The approach focuses the
PstDV capsid gene described above. Its working principle is illustrated in Figure
5.1.
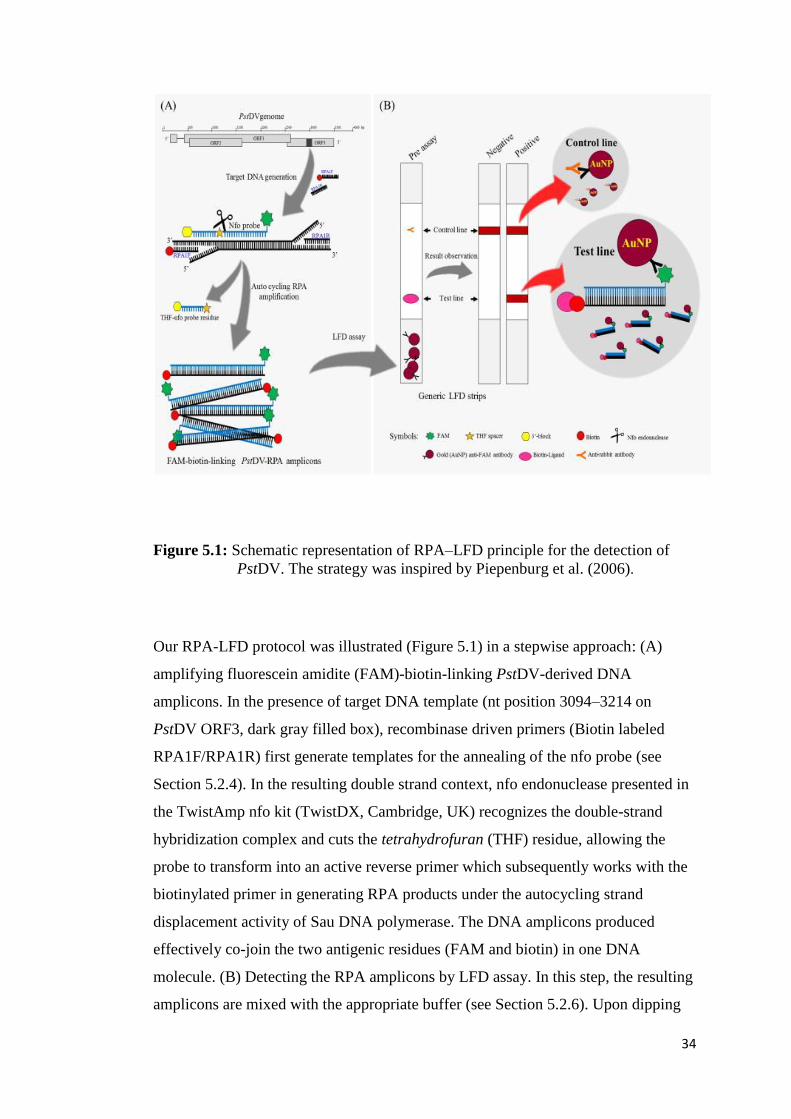
34
Figure 5.1: Schematic representation of RPA–LFD principle for the detection of
PstDV. The strategy was inspired by Piepenburg et al. (2006).
Our RPA-LFD protocol was illustrated (Figure 5.1) in a stepwise approach: (A)
amplifying fluorescein amidite (FAM)-biotin-linking PstDV-derived DNA
amplicons. In the presence of target DNA template (nt position 3094–3214 on
PstDV ORF3, dark gray filled box), recombinase driven primers (Biotin labeled
RPA1F/RPA1R) first generate templates for the annealing of the nfo probe (see
Section 5.2.4). In the resulting double strand context, nfo endonuclease presented in
the TwistAmp nfo kit (TwistDX, Cambridge, UK) recognizes the double-strand
hybridization complex and cuts the tetrahydrofuran (THF) residue, allowing the
probe to transform into an active reverse primer which subsequently works with the
biotinylated primer in generating RPA products under the autocycling strand
displacement activity of Sau DNA polymerase. The DNA amplicons produced
effectively co-join the two antigenic residues (FAM and biotin) in one DNA
molecule. (B) Detecting the RPA amplicons by LFD assay. In this step, the resulting
amplicons are mixed with the appropriate buffer (see Section 5.2.6). Upon dipping
35
the generic LFD strips (Milenia Biotec, Giessen, Germany) into the mixture, the
RPA amplicons are complexed with invisible gold-labeled anti-FAM antibodies
coated on the sample pad, then travel in a buffer stream to be trapped at the test line
by biotin-ligands, resulting in an appearance of red-pink color indicative of a
positive result. Non-captured gold particles move through the test line to be fixed at
the control line by anti-rabbit antibodies, and then produce colour serving as a flow
control for the strip. In the absence of PstDV target amplicons, colour will appear at
a control line only.
5.2. Materials and methods
5.2.1. Samples infected with PstDV
Frozen P. vannamei imported from China in 2012 were purchased from a local
supermarket in northern Queensland, Australia. The muscles collected from 10
individual arbitrarily selected shrimp were screened for the presence of PstDV using
the interim 3-tube nested PCR protocol designed to detect the whole genome of
PstDV (Saksmerprome et al., 2011). Samples with positive results were considered
to be positive for infectious PstDV (the entire genome was amplified). They were
subjected to the following experiments.
5.2.2. Total DNA temple preparation
Total DNA was extracted from muscles of PstDV-infected shrimp following the
protocol described in Chapter 3.1. Two microliters (50 ng/μl) of the DNA template
were used in RPA assays and recombinant plasmid construction.
5.2.3. Recombinant plasmid construction
The DNA sequences located between the nt positions 2544 and 3759 (1216 bp) of
the PstDV genome (GenBank No. AF273215) were amplified by PCR using
ihhnA_F2544/ihhnA_R3759 (Saksmerprome et al., 2010). The recombinant plasmid
36
containing the DNA fragment of interest was constructed, and purified according to
the standard protocol described in Chapter 3.4. The plasmid was diluted in 10-fold
serial dilutions to prepare stocks containing 5 × 10⁹–0.5 copies/μl. Two microliters
of the template was used in optimized RPA–LFD reaction.
5.2.4. RPA primer and probe design
According to the appendix in the TwistAmp™ reaction kit manuals
(http://www.twistdx.co.uk/images/uploads/docs/Appendix.pdf), predicting the
amplification performance of a given oligonucleotide primer based purely on its
sequence is not yet possible for RPA, possibly due to a non-fully understood
mechanism of RPA. This is unlike PCR or LAMP. Therefore, it is recommended to
carry out a simple assay development process including the design and the screening
of a series of candidate primers and selection of a preferred primer pair. However,
we omitted this step as our RPA primers met our requirements satisfactorily. The
primers were manually designed following the TwistAmp™ reaction kit manuals
with additional criteria to PCR primer design as follows: (1) Primers typically are
30–35 nt long. Those shorter than 30 nt (i.e. PCR primers) or longer than 45 nt (i.e.
LAMP inner primers) do not work well. (2) Long tracks of guanines at the 5′ end
should be avoided, possibly because they are detrimental for the formation of
recombinase filaments. (3) Guanines and cytosines at the 3′ end are preferred as they
provide a more stable ‘clamped’ target for the polymerase. (4) Gibbs free energy
(ΔG) should be lower than −4 kcal/mol for both 5′ and 3′ ends of the primers.
Following these guidelines, the forward primer RPA1F with a 5′-biotine label (5′-
biotin-CAACAGCAGCAAACTATGAAGACCCAATCC-3′), and the normal
reverse primer RPA1R (5′-ATTTCTCCGCCATACCAATTTCTAGTGTCA-3′) for
the detection of PstDV were designed from the conserved sequence (nt 3094–3214)
within the “3031–3625” region of PstDV capsid gene (Mexican isolate, GenBank
No. AF273215) (see Table 4 and Section 4.4). A DNA probe used for the LFD assay
(hereafter called nfo probe) was designed from the sequence between RPA primers.
The probe consists of an upstream stretch (30 nt) carrying a 5′-FAM antigenic label,
which is connected via a THF spacer to an adjacent downstream oligonucleotide (15
nt) carrying a C3-spacer (polymerase extension blocking group) at its 3′ end (5′-
37
FAM-ACAATTTGGATTCATGGAACAAATGCGAAC-THF-
GGTGACAGAAAAGCCTATAC-C3-spacer-3′). The primers and the probe were
synthesized by Bio Basic, Canada.
5.2.5. RPA conditions and optimization
RPA was performed in a 50-μl volume using a TwistAmp nfo kit (TwistDX,
Cambridge, UK), 0.42 μM each RPA primer, 0.1 μM nfo probe, 14 mM magnesium
acetate, 1× rehydration buffer and DNase-free water. All reagents, except for DNA
template and magnesium acetate, were prepared in a master mix, which was
distributed into each 0.2-ml reaction tube containing a dried enzyme pellet.
Magnesium acetate was pipetted into the tube lids. Subsequently, 2 μl DNA
template was added to the tubes. The lids were closed, the magnesium acetate was
centrifuged into the tubes to initiate the RPA mechanism, and then the tubes were
incubated at the given conditions immediately.
To determine the optimum amplification temperature, the RPA reactions were
carried out on a heating block set at 35, 37 and 40 °C for 45 min using 100 copies
and 10 copies of plasmid DNA as temples followed by heat inactivation at 93 °C for
3 min. A reaction mixture without DNA template was included as a negative control.
The products were purified using Wizard® SV Gel and PCR Clean-Up System
(Promega, Madison, USA) then analyzed by 2% AGE. To define the optimum time
for amplification, the reactions were conducted at the optimal temperature for 20,
30, 45 and 60 min using various amounts of plasmid DNA as templates followed by
product purification and AGE analysis as mentioned above.
5.2.6. Lateral flow dipstick (LFD) assay
To detect RPA amplicons by LFD, 2 μl of RPA product was added to 120 μl of the
assay buffer (1X phosphate buffered saline with 0.1%Tween 20) in a new tube.
Then, the LFD strip (Milenia Biotec, Giessen, Germany) was dipped into the
38
mixture for 2 min to visualize the test result. The entire LFD assay was done at room
temperature.
5.2.7. Molecular specificity of RPA–LFD
The molecular specificity of RPA primers and probe was examined under the
optimal conditions using 100 ng of total DNA prepared from shrimp infected with
PstDV, Penaeus merguiensis densovirus (PmeDV) and WSSV, 100 ng of total RNA
extracted from shrimp infected with GAV, TSV, MrNV, and 100 ng of DNA
extracted PstDV-free shrimp as templates. The resulting products were analyzed by
LFD and AGE.
The ability of the LFD assay and AGE to discriminate PstDV-RPA products from
non-related DNA was also explored. RPA reactions containing various amounts of
PstDV-DNA (1 ng, 100 pg, 10 pg and 1 pg) were carried out at non-optimised
conditions (35 °C for 1½ h) to ensure that non-specific amplicons were produced.
Reactions with PstDV-free DNA and with no DNA were also included as negative
controls. The results by LFD and AGE were compared.
5.2.8. Molecular sensitivity of PRA by LFD and AGE
Ten fold serial dilutions of total DNA extracted from PstDV-infected shrimp (10 ng,
1 ng, 100 pg and 10 pg) and plasmid DNA (105, 10
4, 10
3, 10
2 and 10 copies) were
used as templates for RPA. The resulting DNA products analyzed by LFD and by
AGE were compared.
5.2.9. Molecular sensitivity of one-step PCR and nested PCR by AGE
Unless otherwise stated, only two commonly accepted, standard PCR protocols for
detection of infectious PstDV were used here. One was the one-step method
39
employing 309F/R primers (Tang et al., 2007) which was certified by OIE in the
Manual of Diagnostic Tests for Aquatic Animals 2010
(http://www.oie.int/international-standard-setting/aquatic-manual/access-online/)
which states, “Primer set 309F/R amplifies only a segment from IHHNV types 1 and
2 (the infectious forms of IHHNV), but not types 3A and 3B, which are non-
infectious and part of the P. monodon genome.” The other was the interim 3-tube
nested PCR by Saksmerprome et al. (2011) who claim that, “This method employed
3 overlapping primer sets designed to cover 89.5% of the IHHNV genome such that
positive result for the all three sets from a shrimp specimen would indicate the
presence of infectious IHHNV”. To determine the detection sensitivity, the same set
of total DNA dilutions tested by RPA–LFD was amplified by the two PCR protocols
mentioned above. The results by AGE were compared to those by RPA–LFD.
5.2.10. Reliability of RPA–LFD by statistical sensitivity and specificity analysis
Screening shrimp with unknown PstDV status by RPA–LFD and the interim 3-tube
nested PCR (reference method) was conducted using 96 frozen samples obtained
from shrimp farms in northern Queensland, Australia, and 21 samples arbitrarily
selected from imported shrimp purchased from local fish shops in Townsville,
Australia, between 2002 and 2013 (117 samples in total). The reason to use the
interim 3-tube nested PCR as a reference is because it detects the entire genome of
PstDV such that positive result from a shrimp specimen would indicate the presence
of infectious PstDV. Table 5.1 summarizes the test results by both assays relative to
background of the shrimp tested (i.e. origin, year of collection, and species of
shrimp). The results were used to evaluate the diagnostic performance of the RPA–
LFD protocol following equations given in Table 5.2.
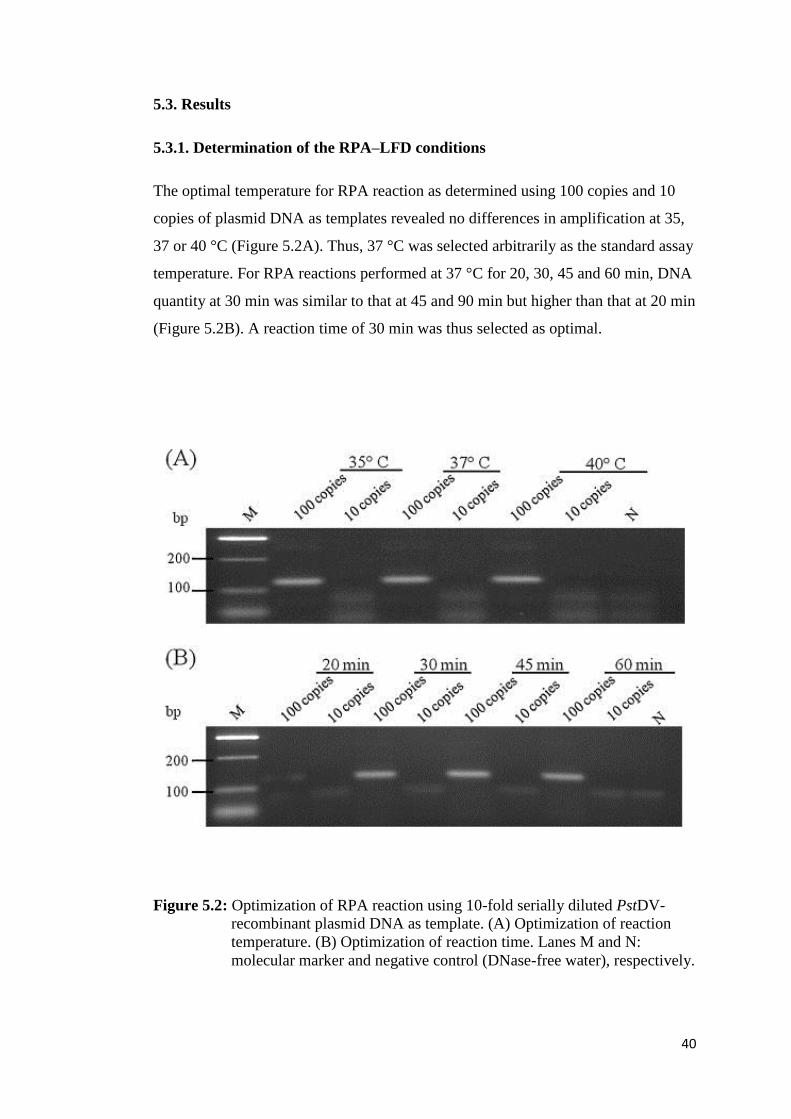
40
5.3. Results
5.3.1. Determination of the RPA–LFD conditions
The optimal temperature for RPA reaction as determined using 100 copies and 10
copies of plasmid DNA as templates revealed no differences in amplification at 35,
37 or 40 °C (Figure 5.2A). Thus, 37 °C was selected arbitrarily as the standard assay
temperature. For RPA reactions performed at 37 °C for 20, 30, 45 and 60 min, DNA
quantity at 30 min was similar to that at 45 and 90 min but higher than that at 20 min
(Figure 5.2B). A reaction time of 30 min was thus selected as optimal.
Figure 5.2: Optimization of RPA reaction using 10-fold serially diluted PstDV-
recombinant plasmid DNA as template. (A) Optimization of reaction
temperature. (B) Optimization of reaction time. Lanes M and N:
molecular marker and negative control (DNase-free water), respectively.
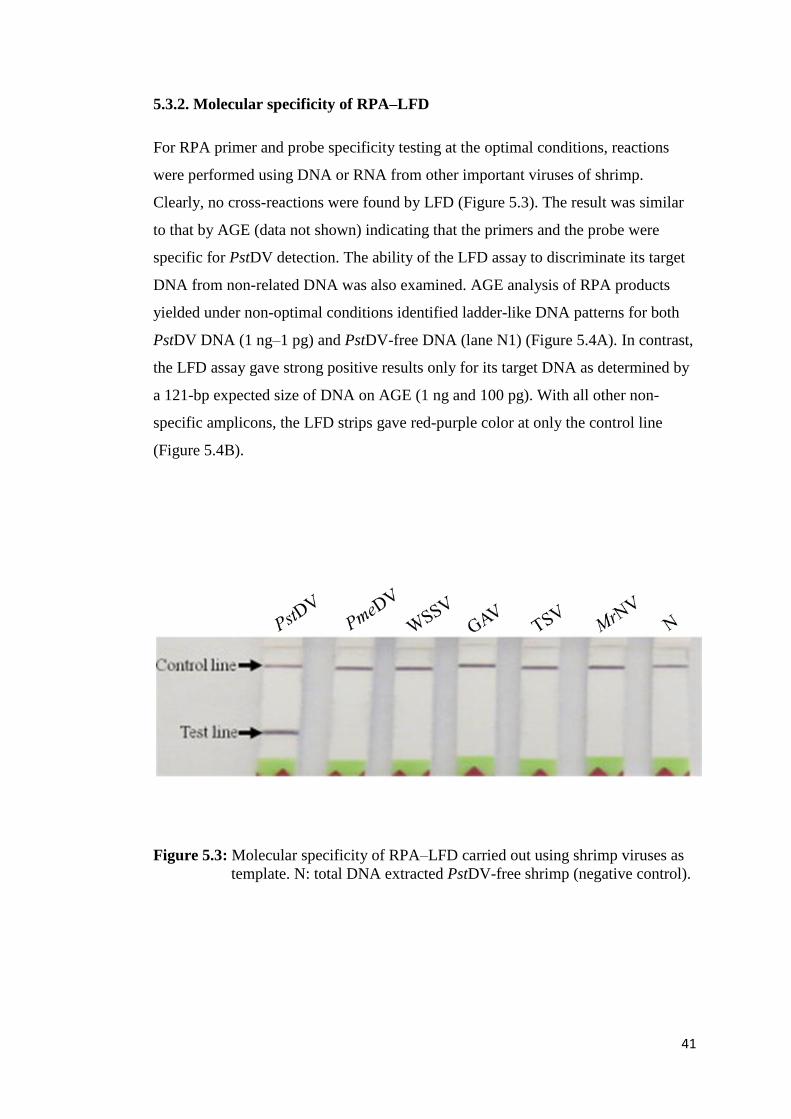
41
5.3.2. Molecular specificity of RPA–LFD
For RPA primer and probe specificity testing at the optimal conditions, reactions
were performed using DNA or RNA from other important viruses of shrimp.
Clearly, no cross-reactions were found by LFD (Figure 5.3). The result was similar
to that by AGE (data not shown) indicating that the primers and the probe were
specific for PstDV detection. The ability of the LFD assay to discriminate its target
DNA from non-related DNA was also examined. AGE analysis of RPA products
yielded under non-optimal conditions identified ladder-like DNA patterns for both
PstDV DNA (1 ng–1 pg) and PstDV-free DNA (lane N1) (Figure 5.4A). In contrast,
the LFD assay gave strong positive results only for its target DNA as determined by
a 121-bp expected size of DNA on AGE (1 ng and 100 pg). With all other non-
specific amplicons, the LFD strips gave red-purple color at only the control line
(Figure 5.4B).
Figure 5.3: Molecular specificity of RPA–LFD carried out using shrimp viruses as
template. N: total DNA extracted PstDV-free shrimp (negative control).
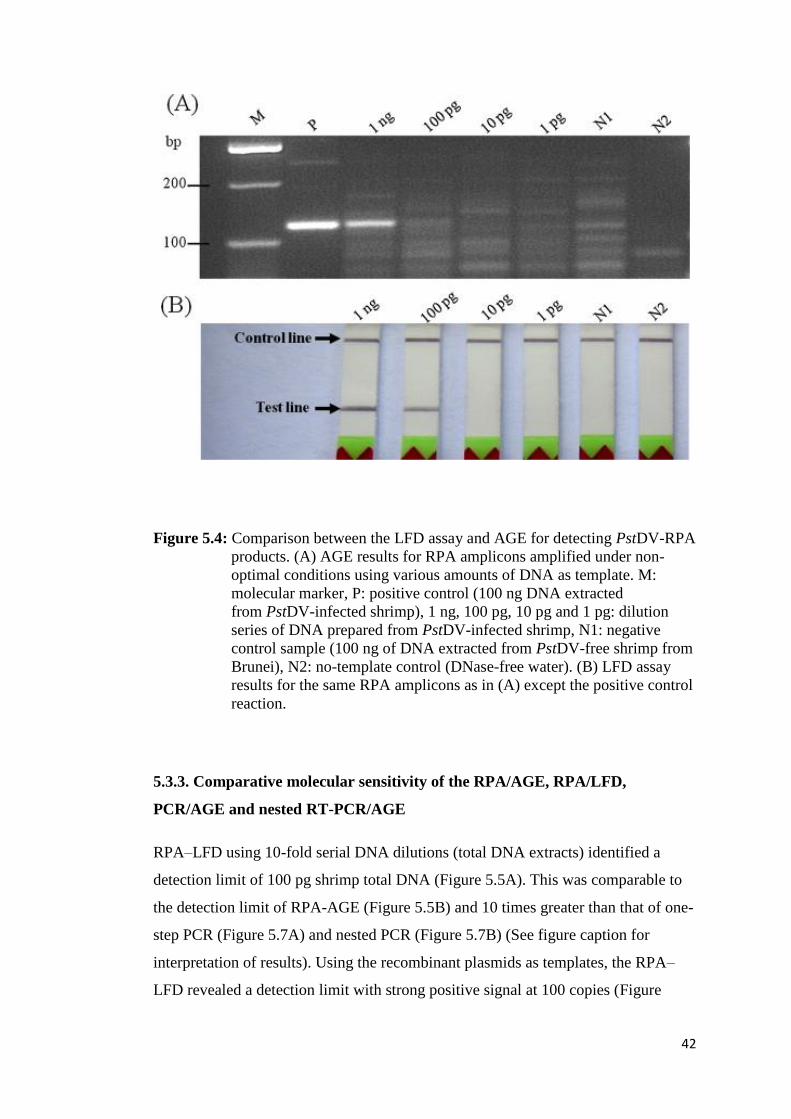
42
Figure 5.4: Comparison between the LFD assay and AGE for detecting PstDV-RPA
products. (A) AGE results for RPA amplicons amplified under non-
optimal conditions using various amounts of DNA as template. M:
molecular marker, P: positive control (100 ng DNA extracted
from PstDV-infected shrimp), 1 ng, 100 pg, 10 pg and 1 pg: dilution
series of DNA prepared from PstDV-infected shrimp, N1: negative
control sample (100 ng of DNA extracted from PstDV-free shrimp from
Brunei), N2: no-template control (DNase-free water). (B) LFD assay
results for the same RPA amplicons as in (A) except the positive control
reaction.
5.3.3. Comparative molecular sensitivity of the RPA/AGE, RPA/LFD,
PCR/AGE and nested RT-PCR/AGE
RPA–LFD using 10-fold serial DNA dilutions (total DNA extracts) identified a
detection limit of 100 pg shrimp total DNA (Figure 5.5A). This was comparable to
the detection limit of RPA-AGE (Figure 5.5B) and 10 times greater than that of one-
step PCR (Figure 5.7A) and nested PCR (Figure 5.7B) (See figure caption for
interpretation of results). Using the recombinant plasmids as templates, the RPA–
LFD revealed a detection limit with strong positive signal at 100 copies (Figure
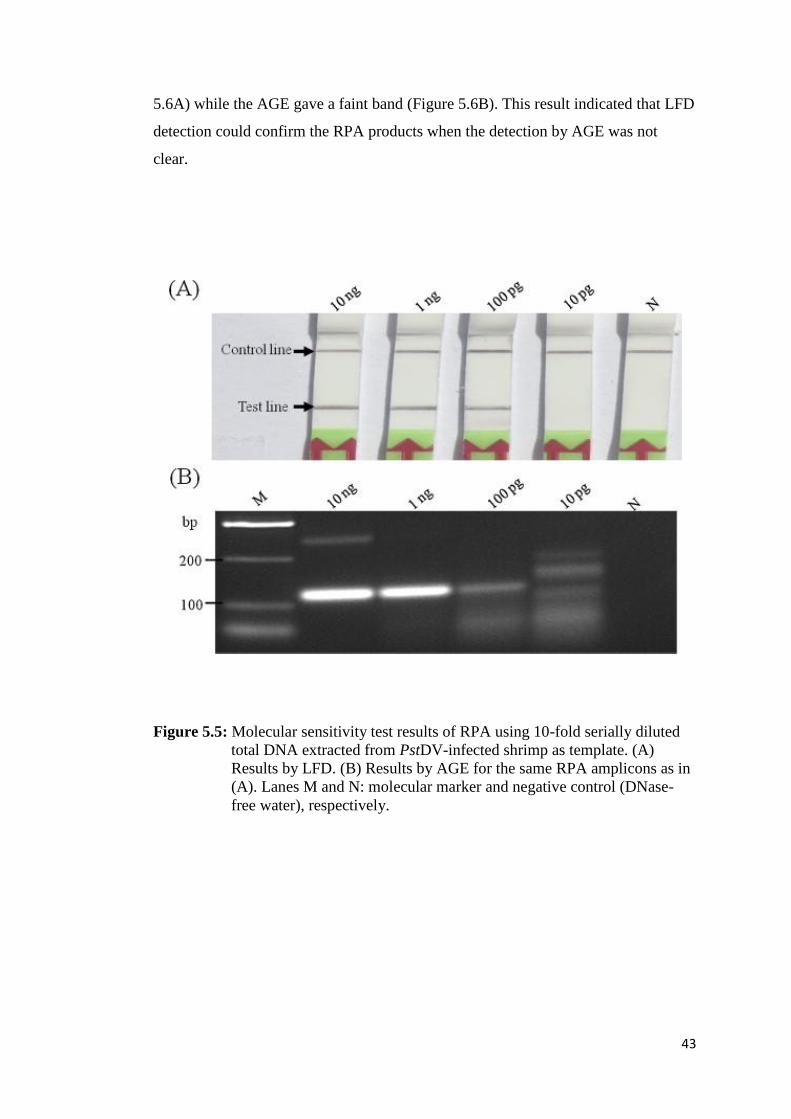
43
5.6A) while the AGE gave a faint band (Figure 5.6B). This result indicated that LFD
detection could confirm the RPA products when the detection by AGE was not
clear.
Figure 5.5: Molecular sensitivity test results of RPA using 10-fold serially diluted
total DNA extracted from PstDV-infected shrimp as template. (A)
Results by LFD. (B) Results by AGE for the same RPA amplicons as in
(A). Lanes M and N: molecular marker and negative control (DNase-
free water), respectively.
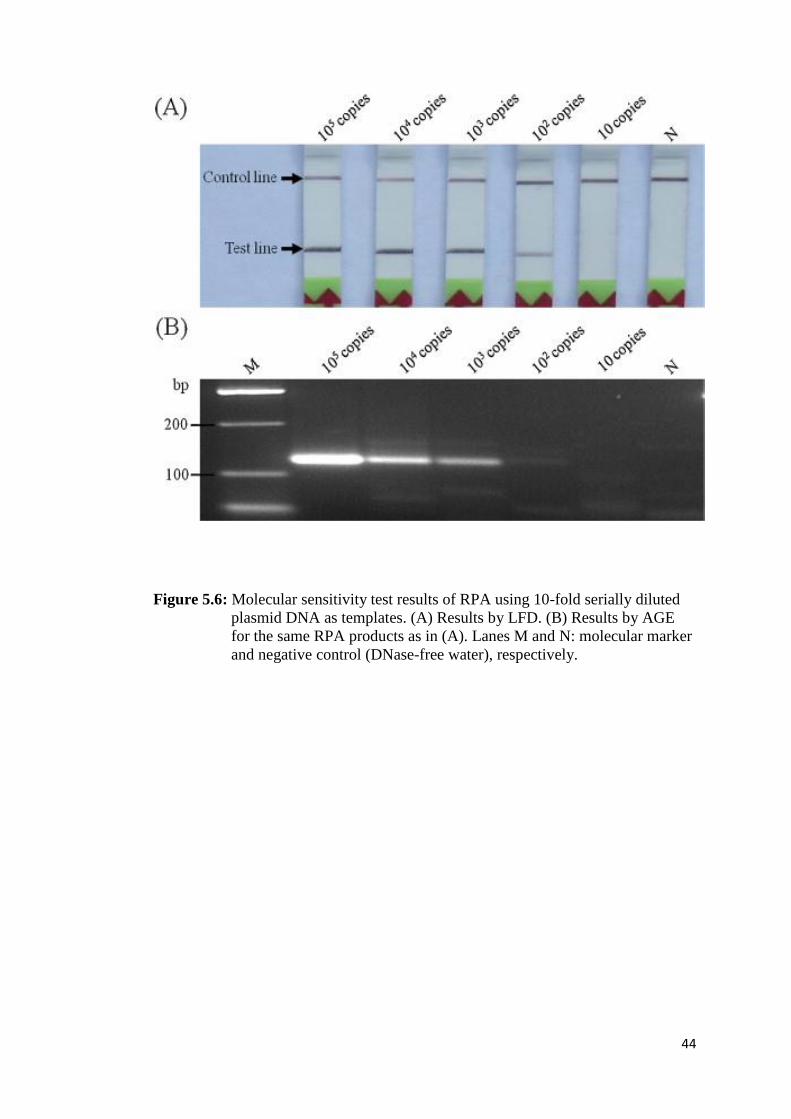
44
Figure 5.6: Molecular sensitivity test results of RPA using 10-fold serially diluted
plasmid DNA as templates. (A) Results by LFD. (B) Results by AGE
for the same RPA products as in (A). Lanes M and N: molecular marker
and negative control (DNase-free water), respectively.
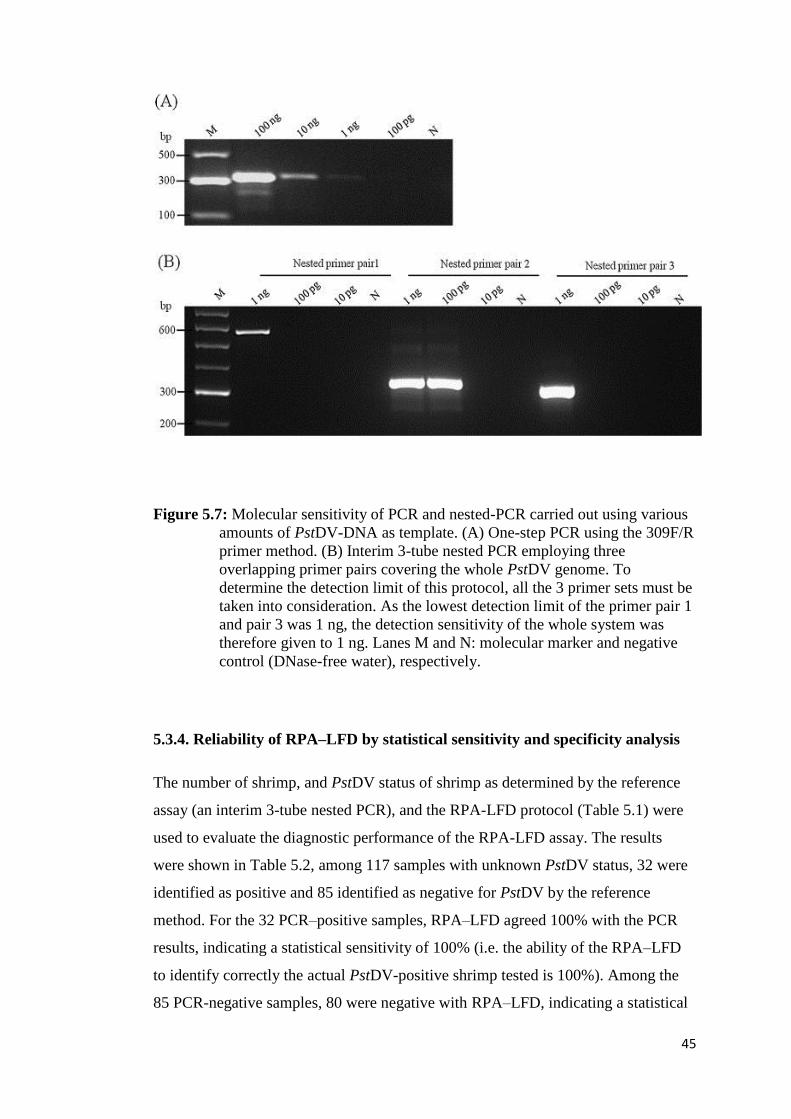
45
Figure 5.7: Molecular sensitivity of PCR and nested-PCR carried out using various
amounts of PstDV-DNA as template. (A) One-step PCR using the 309F/R
primer method. (B) Interim 3-tube nested PCR employing three
overlapping primer pairs covering the whole PstDV genome. To
determine the detection limit of this protocol, all the 3 primer sets must be
taken into consideration. As the lowest detection limit of the primer pair 1
and pair 3 was 1 ng, the detection sensitivity of the whole system was
therefore given to 1 ng. Lanes M and N: molecular marker and negative
control (DNase-free water), respectively.
5.3.4. Reliability of RPA–LFD by statistical sensitivity and specificity analysis
The number of shrimp, and PstDV status of shrimp as determined by the reference
assay (an interim 3-tube nested PCR), and the RPA-LFD protocol (Table 5.1) were
used to evaluate the diagnostic performance of the RPA-LFD assay. The results
were shown in Table 5.2, among 117 samples with unknown PstDV status, 32 were
identified as positive and 85 identified as negative for PstDV by the reference
method. For the 32 PCR–positive samples, RPA–LFD agreed 100% with the PCR
results, indicating a statistical sensitivity of 100% (i.e. the ability of the RPA–LFD
to identify correctly the actual PstDV-positive shrimp tested is 100%). Among the
85 PCR-negative samples, 80 were negative with RPA–LFD, indicating a statistical
46
specificity of 94.12% (i.e. the ability of the RPA–LFD to identify correctly the
actual PstDV-negative samples tested is 94.12%). Re-testing was made with the five
samples showing false positive by RPA–LFD and the similar results were obtained
(data not shown). Assuming the reference assay is correct, overall, the accuracy of
the RPA–LFD protocol to produce test result is 95.73%.
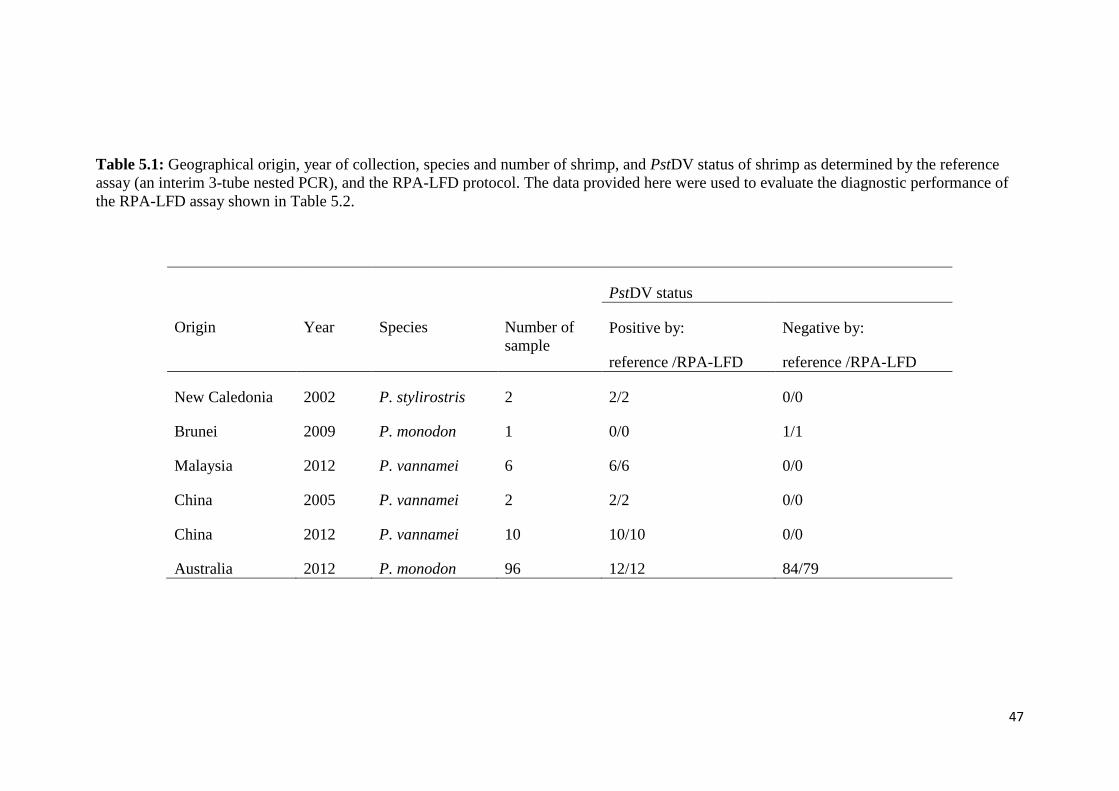
47
Table 5.1: Geographical origin, year of collection, species and number of shrimp, and PstDV status of shrimp as determined by the reference
assay (an interim 3-tube nested PCR), and the RPA-LFD protocol. The data provided here were used to evaluate the diagnostic performance of
the RPA-LFD assay shown in Table 5.2.
Origin
Year
Species
Number of
sample
PstDV status
Positive by:
reference /RPA-LFD
Negative by:
reference /RPA-LFD
New Caledonia 2002 P. stylirostris 2 2/2 0/0
Brunei 2009 P. monodon 1 0/0 1/1
Malaysia 2012 P. vannamei 6 6/6 0/0
China 2005 P. vannamei 2 2/2 0/0
China 2012 P. vannamei 10 10/10 0/0
Australia 2012 P. monodon 96 12/12 84/79
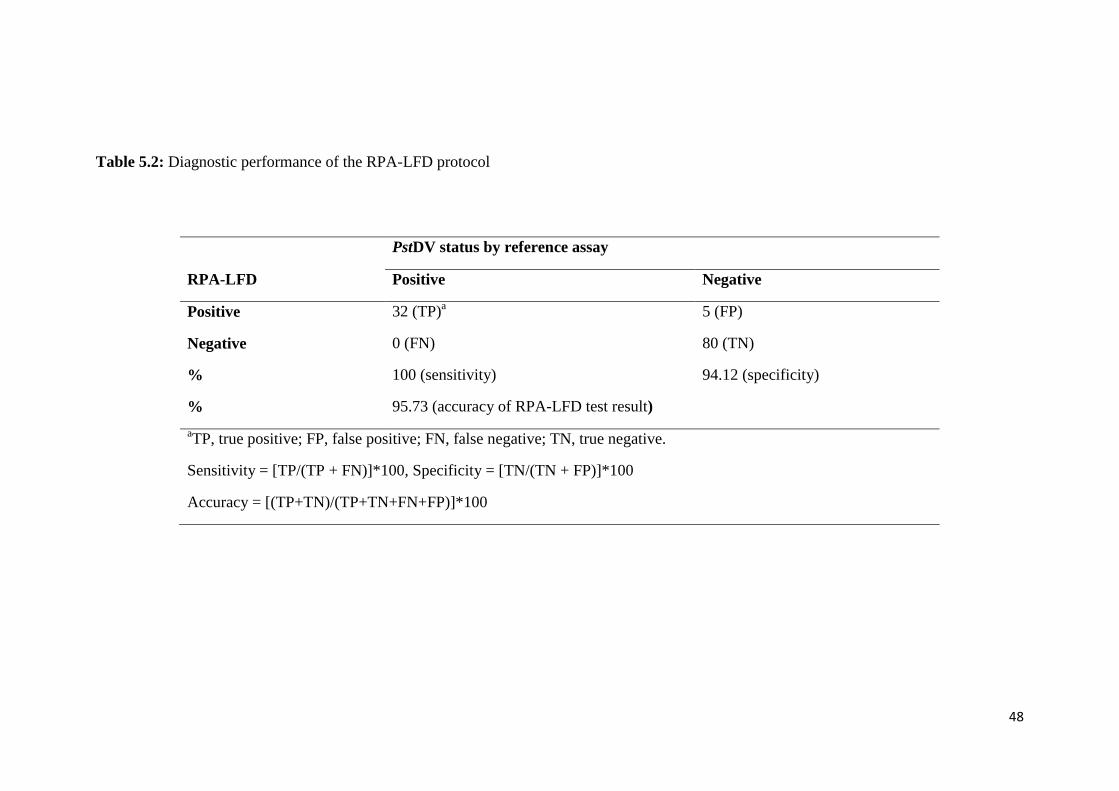
48
Table 5.2: Diagnostic performance of the RPA-LFD protocol
PstDV status by reference assay
RPA-LFD Positive Negative
Positive 32 (TP)a 5 (FP)
Negative 0 (FN) 80 (TN)
% 100 (sensitivity) 94.12 (specificity)
% 95.73 (accuracy of RPA-LFD test result)
aTP, true positive; FP, false positive; FN, false negative; TN, true negative.
Sensitivity = [TP/(TP + FN)]*100, Specificity = [TN/(TN + FP)]*100
Accuracy = [(TP+TN)/(TP+TN+FN+FP)]*100
49
5.4. Discussion
The detection platform described employs RPA for sensitive and specific
amplification of a target nucleic acid fragment followed by a LFD assay for rapid
visualization of the amplified DNA (Figure 5.1).
Temperature optimization (Sections 5.3.1) indicated that the assay was robust to
temperature changes and 37 °C was chosen for further work as being between two
equally effective temperatures (35 °C and 37 °C) (Figure 5.2A). Time analysis
indicated that no improvement in yield occurred after 30 min (Figure 5.2B) so this
was used in all analyses. The total analysis time including AGE was approximately
1 ½ h (excluding gel preparation). This time compares favourably to one-step PCR
times of 2-3 h and nested PCR times of 4-5 h. However, at a very low concentration
of target DNA, the RPA assay yielded nonspecific products occasionally (Figure
5.5B at 10 pg). This phenomenon may have arisen from unexpected amplification or
primer-dependent artifact as suggested by Piepenburg et al. (2006).
In order to increase the specificity of test results and further speed up the total time
for the RPA assay, we explored the possibility of using LFD format rather
electrophoresis for detection of RPA amplicons. It was obvious that the LFD assay
possesses high selectivity against mismatched DNA target sequences (Figure 5.4B).
The high degree of specificity demonstrated by this assay was attributed to a use of
gold-labeled anti-FAM antibodies to capture RPA product specifically. Clearly, the
LFD assay could confirm the identity of RPA amplicons. As a result, it increased the
overall specificity of the RPA–LFD over RPA combined with AGE and decreased
time from 2 ½ h (30 min for RPA and 2 h for AGE including gel preparation) to
approximately 35 min.
Detection of RPA products by LFD is simple, can be achieved within 1–2 min at
room temperature. Visual detection of test results by this method abrogates the need
50
for post-amplification hybridization step for DNA products and probes required for
LFD methods previously combined with LAMP for shrimp virus detection
(Kiatpathomchai et al., 2008; Jaroenram et al., 2009; Puthawibool et al., 2009;
Nimitphak et al., 2010; Arunrut et al., 2011).
In conclusion, combining RPA amplification with an LFD technique resulted in a
total assay time of approximately 35 min, about a quarter that of RPA-AGE and 6–8
times faster than the interim 3-tube nested PCR-AGE detection of PstDV. The
combined method also provided 10 times greater sensitivity than the nested PCR
mentioned. High sensitivity and specificity, the relatively short detection time, and
amplicon confirmation by hybridization are key advantages of this protocol.
Although the protocol cannot eliminate false positive results (by viral inserts)
completely, reducing those to ∼5% (Table 5.2) compared to 76–78% by the
IQ2000™ kit and the 309F/R PCR protocol reported previously (Saksmerprome et
al., 2011) presents RPA–LFD as an alternative to PCR for primary screening of
PstDV. As the protocol requires no other equipment than a simple heating block, it
makes qualitative DNA testing potentially accessible in a non-laboratory, point-of-
care environment. In addition, it serves as a model platform that could be adapted
easily to detect other pathogens or genetic markers of interest using basic laboratory
equipment.
51
CHAPTER 6
VIRAL ACCOMMODATION, EVOLUTION AND PHYLODYNAMICS OF
AUSTRALIAN PENAEUS STYLIROSTRIS DENSOVIRUS
6.1. Introduction
Implementation of monitoring and control measures for viral epizootic outbreaks
requires an understanding of the factors that underlie molecular evolution and
population dynamics (Robles-Sikisaka et al., 2010). This is also true for PstDV
circulating in Australia. Evidence for PstDV existing in Australian penaeids has
been accruing. Owens (1987) demonstrated histological and epidemiological
evidence for the presence of PstDV in prawns in northern Australia (Owens, 1987).
In 1991, the presence of this virus, as indicated by histopathological evidence and
high mortality, approaching 100%, in hybrid prawns (Penaeus esculentus x P.
monodon) of northern Queensland was officially reported (Owens et al., 1992).
Genomes of PstDV were subsequently sequenced from these hybrid prawns and
from other Australian Penaeus sampled in the following 14 years (1992-2005), and
submitted to GenBank database directly by Kjersti Krabsetsve and her colleagues
(GenBank No. KM593908, EU675312, KM593909, KM593910, KM593911 and
KM593912). In 2006, Tang and Lightner reported the presence of PstDV-related
sequences in the genome of P. monodon broodstock originating from Australia
during 2004 (Tang and Lightner, 2006). These endogenous viral elements (EVEs)
were assigned as a non-infectious form of PstDV (GenBank No. EU675312).
Recently, an infectious type of the virus was rediscovered in this region in 2008
(Saksmerprome et al., 2010). Interestingly, high mortalities and obvious gross
pathology i.e. RDS caused by PstDV in prawn have not been recorded in this
country since the first official report in 1991 despite the virus existing here, as
demonstrated by positive results of PCR tests (Krabsetsve et al., 2004;
Saksmerprome et al., 2010; Jaroenram and Owens, 2014). Our hypothesis is that
prawns have developed resistance to PstDV and/or the virus has mutated to reach
equilibrium with the host in terms of virulence genes. To test this hypothesis, in this
Chapter, we sequenced and analysed the genome of Australian PstDV, and
52
determined its genetic recombination and molecular evolution in relation to other
geographical isolates of PstDV.
6.2. Material and methods
6.2.1. Shrimp samples and DNA temple preparation
PstDV-related sequences inserted in the genome of P. monodon (EVEs) can cause
false positive results for infectious PstDV using any single primer pair based PCR
protocol (Tang and Lightner, 2006; Saksmerprome et al., 2011; Jaroenram and
Owens, 2014). To ensure that our results were not derived from EVEs, we took
PstDV-infected P. monodon reported in from Chapter 4 (Jaroenram and Owens,
2014). Briefly for the Chapter 4, 130 prawns with no signs of PstDV infection i.e.
RDS-associated stunt growth were sampled from 2 farms in northern Queensland in
2012. They were used to examine the insertion pattern PstDV-related sequences
using multiple overlapping primers pairs designed to detect the whole PstDV
genome. Thirteen samples were positive for all the primers (i.e. whole genome was
amplified) indicating that they carried infectious PstDV. Among these, 9 showing
strong and specific PCR bands were chosen for further studies in this chapter. The
positive shrimp were divided arbitrarily into 3 groups. Gills or pleopods from each
group were pooled for DNA extraction following the protocol described in Chapter
3.1.
6.2.2. PCR amplification, cloning and genome sequencing of Australian PstDV
Each DNA pool was subject to a standard PCR amplification (see Chapter 3.3) using
multiple overlapping primers (Table 6.1). The recombinant plasmids containing
PCR fragments of interest were constructed and purified. Sequencing of both strands
of DNA plasmids (5-6 clones/PCR fragment/DNA pool) was performed (see
Chapter 3.4).
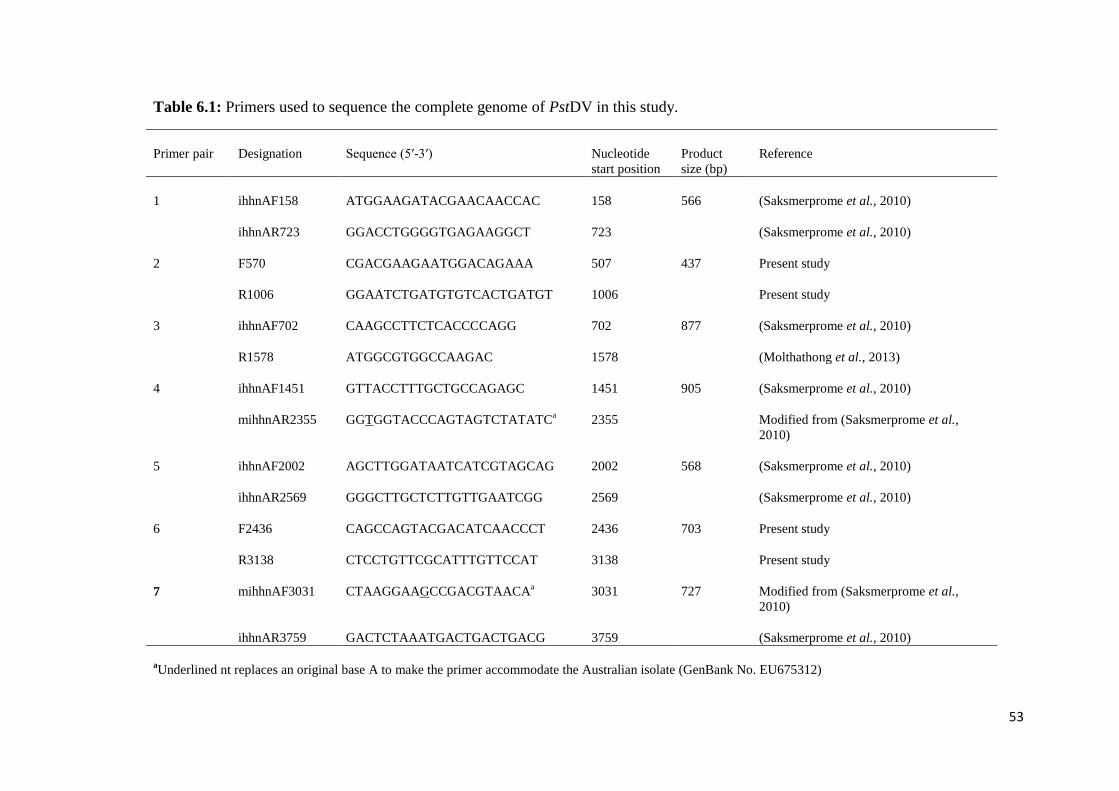
53
Table 6.1: Primers used to sequence the complete genome of PstDV in this study.
Primer pair Designation Sequence (5′-3′) Nucleotide
start position
Product
size (bp)
Reference
1 ihhnAF158 ATGGAAGATACGAACAACCAC 158 566 (Saksmerprome et al., 2010)
ihhnAR723 GGACCTGGGGTGAGAAGGCT 723 (Saksmerprome et al., 2010)
2 F570 CGACGAAGAATGGACAGAAA 507 437 Present study
R1006 GGAATCTGATGTGTCACTGATGT 1006 Present study
3 ihhnAF702 CAAGCCTTCTCACCCCAGG 702 877 (Saksmerprome et al., 2010)
R1578 ATGGCGTGGCCAAGAC 1578 (Molthathong et al., 2013)
4 ihhnAF1451 GTTACCTTTGCTGCCAGAGC 1451 905 (Saksmerprome et al., 2010)
mihhnAR2355 GGTGGTACCCAGTAGTCTATATCa 2355 Modified from (Saksmerprome et al.,
2010)
5 ihhnAF2002 AGCTTGGATAATCATCGTAGCAG 2002 568 (Saksmerprome et al., 2010)
ihhnAR2569 GGGCTTGCTCTTGTTGAATCGG 2569 (Saksmerprome et al., 2010)
6 F2436 CAGCCAGTACGACATCAACCCT 2436 703 Present study
R3138 CTCCTGTTCGCATTTGTTCCAT 3138 Present study
7 mihhnAF3031 CTAAGGAAGCCGACGTAACAa 3031 727 Modified from (Saksmerprome et al.,
2010)
ihhnAR3759 GACTCTAAATGACTGACTGACG 3759 (Saksmerprome et al., 2010)
aUnderlined nt replaces an original base A to make the primer accommodate the Australian isolate (GenBank No. EU675312)
54
6.2.3. Bioinformatical analysis of PstDV genome
The overlapping sequences (above) were analysed using Sequencer 4.9, and the
presence of potential ORFs was determined using the AlignX tool in the Vector NTI
program (Invitrogen, California, USA). The predicted amino acids and the molecular
weights of any potential proteins in an ORF were determined using proteomic tools
at ExPASy (http://us.expasy.org). The genome sequence of Australian PstDV
reported in this article (hereafter called AUS-PstDV2012) has been submitted into
GenBank database with the reference number KM593913 (Appendix D).
Comparative analyses of the genome and the encoded ORFs of this PstDV isolate
were performed using a BLAST search against the National Centre for
Biotechnology Information (NCBI) database.
6.2.4. Point mutation analysis
To prove that any point mutation found in ORF1 of the Australian PstDV (GenBank
No. EU675312) was real and inheritable, ORF1 was re-amplified from individual
PstDV-positive shrimp obtained as above and then sequenced. The sequences were
compared against the reported PstDV sequences (Table 6.2) using Vector NTI.
6.2.5. Phylogenetic analysis
Our entire DNA sequence was aligned the sequences of 19 worldwide distributed
PstDV representatives (Table 6.2) using MUSCLE 3.7 (Edgar, 2004). After
refinement using Gblocks 0.91b (Castresana, 2000; Talavera and Castresana, 2007),
all sequences with a standardized length of 2988 bp (except EU675312 and our
sequence having 2987 bp in length due to a single base deletion, see below),
covering ORF1 (NS1 herein), ORF2 (NS2), and ORF3 (VP) were used to construct
a phylogenetic tree under 1000 bootstrapping replicates using the maximum
likelihood method implemented in the PhyML 3.0 (Guindon et al., 2010). Graphical
representation and editing of the phylogenetic tree were performed with TreeDyn
198.3 (Chevenet et al., 2006).
55
6.2.6. Recombination and selection analysis
Prior to analysis, the 20 PstDV sequences (Table 6.2) were first aligned, 2 sequences
containing gaps and/or incomplete ORFs (GenBank No. GQ411199 and
DQ228358), were excluded from analysis as they were not recognized by the
programmes described herein. The remaining sequences were divided into 2 groups
according to their origin: 1) outside Australia (AF218266, EF633688, AF273215,
AY362548, KF214742, JX840067, AY355308, JN377975, AY102034, AY362547),
and 2) inside Australia (KM593908, KM593909, KM593910, KM593911,
KM593912, GQ475529, EU675312 and this study). The host origins of the
Australian endemic strains were given in Appendix E. ORFs of each group were
analysed for evidence of genetic recombination breakpoints (BPs) using the Genetic
Algorithms for Recombination Detection (GARD) undertaken under 4 nt
substitution bias models (F81, TrN93, HKY85 and REV) (Pond et al., 2006). Site-
specific signatures of positive and negative selections acting on each sequence were
also evaluated using three different codon-based maximum likelihood methods:
Single Likelihood Ancestor Counting (SLAC), Fixed Effects Likelihood (FEL) and
Random Effects Likelihood (REL) (Pond and Frost, 2005). Briefly, the first method
estimates the non-synonymous substitutions (dN) and synonymous substitution (dS)
values from reconstructed ancestral sequences and compares them against the
expected corresponding values. The second method estimates dN and dS directly
from the data at each codon site, while the last method estimates these parameters
across sites according to a predefined distribution. Signatures of natural selection
can then be inferred using the ratio of dN and dS, with ratio values less than 1
consistent with negative selection acting on aa-altering mutations, and values greater
than 1 suggesting positive selection to increase the number of replacements.
6.2.7. Inference of the nucleotide substitution rate and the demographic history
The rate of nt substitution was estimated using the computer software package called
Bayesian evolutionary analysis by sampling trees (BEAST) version 2.1.3 (Bouckaert
et al., 2014). The program uses a Bayesian Markov chain Monte Carlo (MCMC)
approach to evaluate evolutionary hypotheses without conditioning to a tree
56
topology, and it has been used to estimate the rate of evolution, divergence times
and temporal changes in effective population size (Cordellier and Pfenninger, 2008;
Duffy and Holmes, 2008; Fontanella et al., 2008). The substitution rate per site per
year for PstDVs circulating in Australia was estimated from an independent data set
that included a total of 8 dated PstDV DNA sequences: one was from this study
(Table 6.2, row 3) and the rest were taken from GenBank database (Table 6.2, row 1
and 7-12). The sampling time interval of these sequences was 22 years (1991 to
2012). After trimming incomplete ends that were unavailable for some isolates, all
sequences with a standardized length of 2988 bp (except those from 1993 and 2012,
this study, having 2987 bp in length due to the 1305delA), covering ORF1 (NS1
herein), ORF2 (NS2), and ORF3 (VP), were aligned using ClustalX 2.1 (Larkin et
al., 2007). The aligned output file was further analysed using BEAST 2.1.3.
Evolutionary model parameters incorporated in this analysis were as follows: 1) the
nt substitution and the site heterogeneity models were specified as HKY + G (4
categories) as suggested by jModeltest 0.1.1 (Posada, 2008), 2) the coalescent tree
prior was set to a constant population size as suggested elsewhere (Kim et al., 2012).
The MCMC chains (1.7× 10⁸ generations, with the sampling frequency of 1,000)
were performed separately under 3 molecular clock assumptions: strict clock;
relaxed clock exponential; and relaxed clock log normal. The output files were
analysed by Tracer 1.4 (Rambaut and Drummond, 2007) to verify chain
convergence and recognized when the effective sample sizes (ESS) exceeded 200.
The best-fit model was determined by comparing the marginal likelihood estimate
value of each model using the harmonic smoothed mean estimator implemented in
Tracer 1.4. The nt substitution rate of PstDV was determined using the best-fit
model. Parallel estimation for the 20 dated cosmopolitan PstDV (Table 6.2) was
undertaken and compared.
Population history of Australian endemic PstDV was investigated using Bayesian
skyline plot (BSP), which estimates changes in effective population size (Ne)
through time (T) from a sample of gene sequences (Strimmer and Pybus, 2001;
Drummond et al., 2005); as PstDV is a virus, we interpreted this parameter as the
effective number of infections in units of generations/year as suggested elsewhere
57
(Robles-Sikisaka et al., 2010). Given that the PstDV generation time is unknown,
we did not attempt to translate this parameter into the actual number of infections.
The analysis was performed under the best-fit clock model with additional
parameters including a constant skyline plot, and a uniform prior population size
with an upper bound of 107. The MCMC algorithm was run for 2.5×10
7 generations,
with sampling every 1000 generations. Visualization of parameters and BSP plots
were examined in Tracer 1.4.
6.3. Results
6.3.1. Retrospective analysis of data from 1993
In the thesis work of Krabsetsve, 2005 (unpublished), a number of P. monodon
collected from farms in northern Queensland, Australia, in 1993 were screened for
the presence of PstDV using PCR employing multiple overlapping primers designed
to cover the whole genome sequence of the virus. The objective was to obtain the
complete sequence of many Australian PstDV isolates for epidemiological analysis.
The complete genomic DNA of the virus was obtained and submitted to GenBank
database with a given reference number EU675312. We preliminarily analysed the
genome sequences of this viral strain, and we found a base A deletion at the nt
position 1305 (1305delA) in ORF 1 which is relative to position 1949 in its genome.
As this unexpected mutation is not found in other geographical isolates (see below
for detail of analysis), it opens up the question as to whether the1305delA mutation
is real, i.e. not a result from technical issues such as sequencing error. If it is real, is
it consistently inherited over time? To answer these questions, subsequently
experiments were conducted.
6.3.2. Whole genome analysis of Australian PstDV
According to the sequence analysis, the genome of our PstDV isolate (AUS-
PstDV2012) is 3604 nt in length and has a base composition of A (36.93%), T
(20.48%), G (19.26%) and C (23.34%). The G/C and A/T content of the genome
58
was calculated to be 42.59% and 57.41%, respectively. Unlike any other infectious
PstDV including the Hawaii isolate (AF218266), our isolate has ORF1 fragmented
into 2 smaller ORFs, and for the purpose of analysis, they are designated as ORF1
fragment 1 (ORF1 Fr1) and ORF1 fragment 2 (ORF1 Fr2). Their sizes are 1404 bp
and 654 bp, respectively) (Figure 1A). DNA sequences of these fragments
overlapped and they are in different reading frames (+1 and +3, respectively),
indicating the presence of frame-shift deletion. If functional, the ORF1 Fr1 (nt 442-
1845) would encode a non-structural fragment 1 (NS1 Fr1) protein of 467 amino
acids (aa) in length, which corresponds to a molecular weight (MW) of 52.83 kDa.
This NS1 Fr1 protein contains the highly conserved replication initiator motifs,
located between the aa position 257-315, which are common to all other infectious
PstDV. ORF1 Fr2 (nt 1788-2441) would encode a NS1 fragment 2 (NS1 Fr2)
protein of 217 aa in length, which corresponds to a MW of 24.75 kDa. This aa
sequence contains 3 highly conserved NTP-binding and helicase domains, located
between aa position 35-128 relative to the aa position 480-578 of the Hawaii isolate
(GenBank No. AF218266). Similar to other infectious PstDV, ORF2 (nt 386-1477,
1092 bp in length), our isolate encodes a 363-aa non-structural protein 2 (NS2) with
a MW of 42.15 kDa, while the ORF3 (nt 2383-3372, 990 bp in length) encodes a
329-aa viral capsid protein (VP) with a MW of 37.43 kDa. These 2 ORFs are in
reading frames +2 and +1, respectively. Figure 6.1 depicts the overall genome
organization of our isolate in comparison with that of the Hawaiian strain.
We compared our entire sequence with matching regions of PstDV sequence records
at GenBank (Table 6.2) and found that our sequence (Table 6.2, row 3) had 92.5%
and 93.9% identity to sequences of PstDV previously reported from Australia
(EU675312) and Madagascar (DQ228358), respectively (lineage I). Interestingly, it
shared slightly lower identity (~92%) with several other sequences originating from
the Americas and some parts of Asia (lineage III). Focusing on each ORF, ORF1
Fr1 showed the highest degree of similarity (~95%) to PstDVs in lineage I. ORF1
Fr2 and ORF2 were most similar to those in lineage IV, while ORF3 showed
comparable identity to all lineages (~93%). These observations were in accordance
with that of aa comparison (Table 6.2).
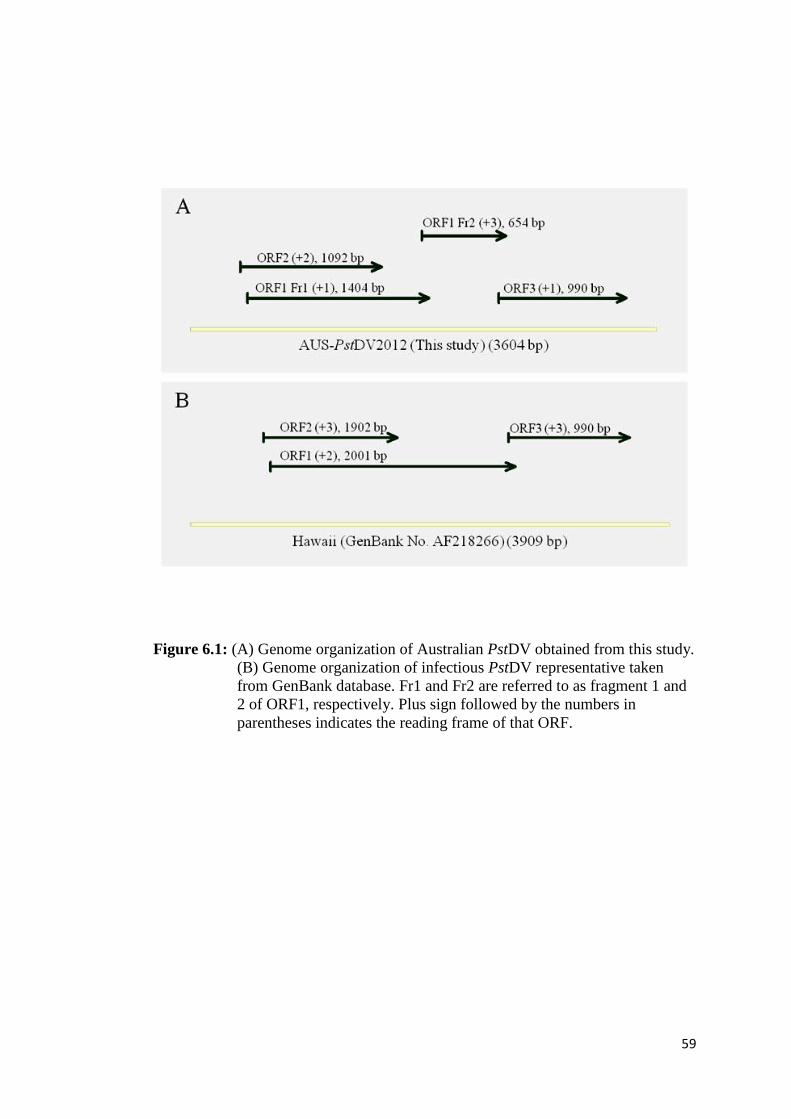
59
Figure 6.1: (A) Genome organization of Australian PstDV obtained from this study.
(B) Genome organization of infectious PstDV representative taken
from GenBank database. Fr1 and Fr2 are referred to as fragment 1 and
2 of ORF1, respectively. Plus sign followed by the numbers in
parentheses indicates the reading frame of that ORF.
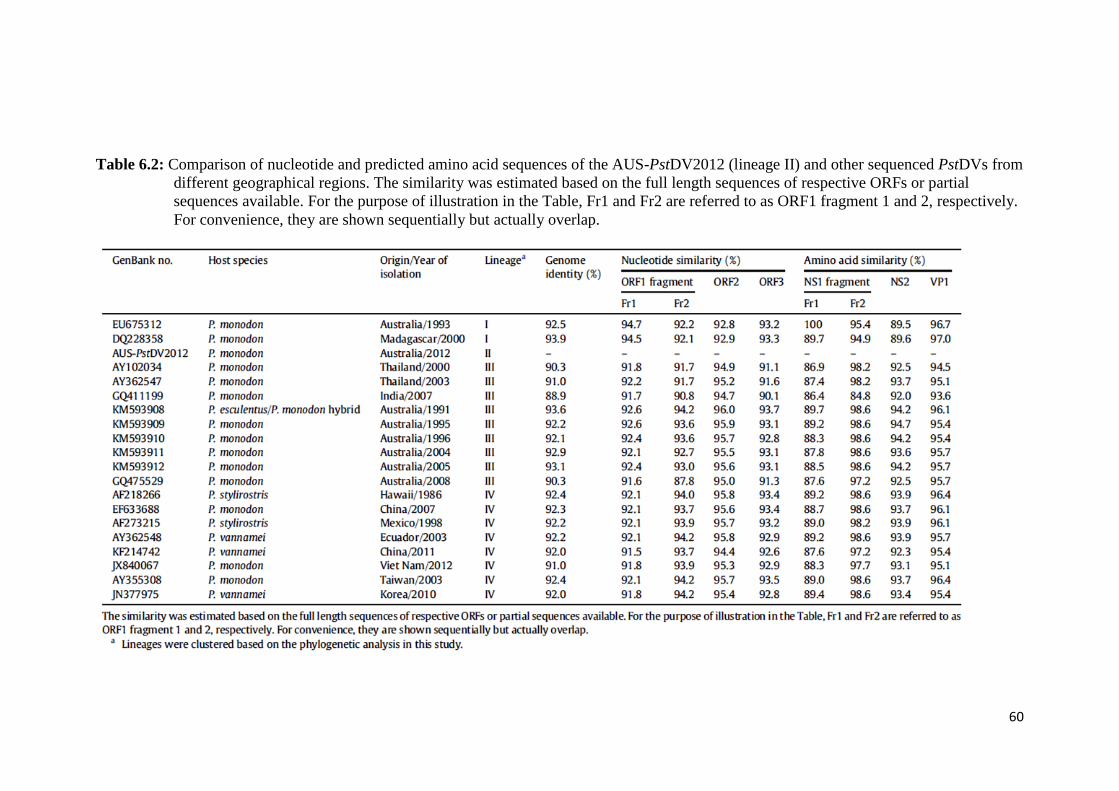
60
Table 6.2: Comparison of nucleotide and predicted amino acid sequences of the AUS-PstDV2012 (lineage II) and other sequenced PstDVs from
different geographical regions. The similarity was estimated based on the full length sequences of respective ORFs or partial
sequences available. For the purpose of illustration in the Table, Fr1 and Fr2 are referred to as ORF1 fragment 1 and 2, respectively.
For convenience, they are shown sequentially but actually overlap.
61
6.3.3. Mutation analysis
From Figure 6.2A (top), A at the nt position 1305 is missing (1305delA) in ORF1 of
the Australian PstDV from 1993 (EU675312) and 2012 (this study). To verify this
finding, PstDV-ORF1 was re-amplified from 9 individual infected shrimp then
sequenced. Clearly seen in Figure 2A (bottom), the ORF1 from all samples were
homozygous for the 1305delA mutation when compared to other infectious isolates
listed in Figure 6.2B. Examples of sequence chromatograms of the 1305delA
containing PstDV-ORF1 are shown in Figure 6.2C, demonstrating that the 1305delA
is not a technical error.
Further inspection revealed that the 1305delA occurs at the nuclear localization
signal (NLS) encoding sequence which is conserved among different geographical
isolated PstDV genomes (Owens, 2013). ORF1 has many potential NLSs with
embedded Chelsky sequences (4 aa, three of which are basic, starting dibasic e.g.,
K-K/R-x-K/R where K, R, x represent arginine, lysine and any aa, respectively).
One NLS starts at aa position 423 (KKK-16aa-KRK). As pointed out by Owens
(2013), our investigation confirms that the 1305delA causes an aa frame-shift in the
second half of NLS for both Australian PstDV isolates reported in 1993 (Table 6.3,
row 1) and 2012, the present study, (Table 6.3, row 2). This out-of-frame region
destroyed the KRK sequence at the C terminal. When a base A was artificially added
into the 1305delA position (i.e. 1304insA) of the above isolate, (Table 6.3, row 3), it
put the reading back in-frame, turning ORF1 Fr1 into a complete putative ORF1
which could generate the NLS with functional characteristics (22 aa in length with
KKK and KRK towards the N terminal and C terminal, respectively) of infectious
PstDV-derived NLSs (Table 6.3, row 4-11). Also of considerable interest is that this
frame shift straddles the site of the OIE diagnostic IHHNV309 primers (Tang and
Lightner, 2006) that are reported to separate infectious PstDV from endogenous
viral element PstDV of Australia and Madagascar.
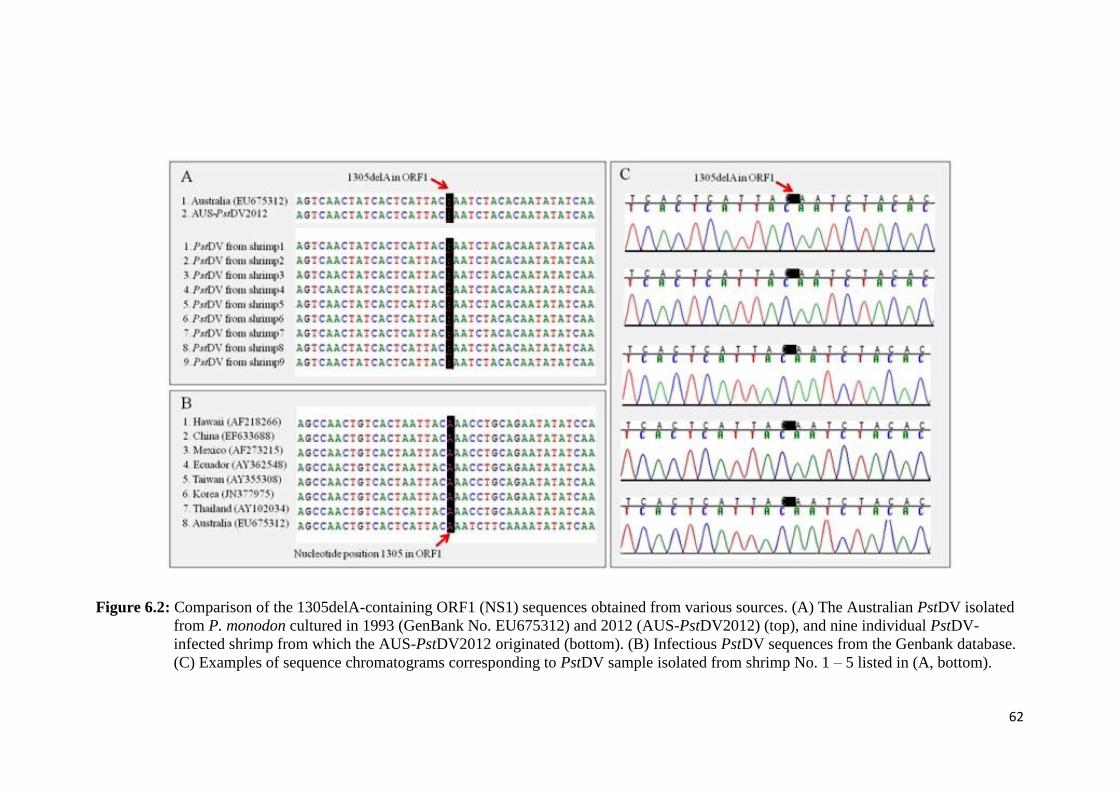
62
Figure 6.2: Comparison of the 1305delA-containing ORF1 (NS1) sequences obtained from various sources. (A) The Australian PstDV isolated
from P. monodon cultured in 1993 (GenBank No. EU675312) and 2012 (AUS-PstDV2012) (top), and nine individual PstDV-
infected shrimp from which the AUS-PstDV2012 originated (bottom). (B) Infectious PstDV sequences from the Genbank database.
(C) Examples of sequence chromatograms corresponding to PstDV sample isolated from shrimp No. 1 – 5 listed in (A, bottom).
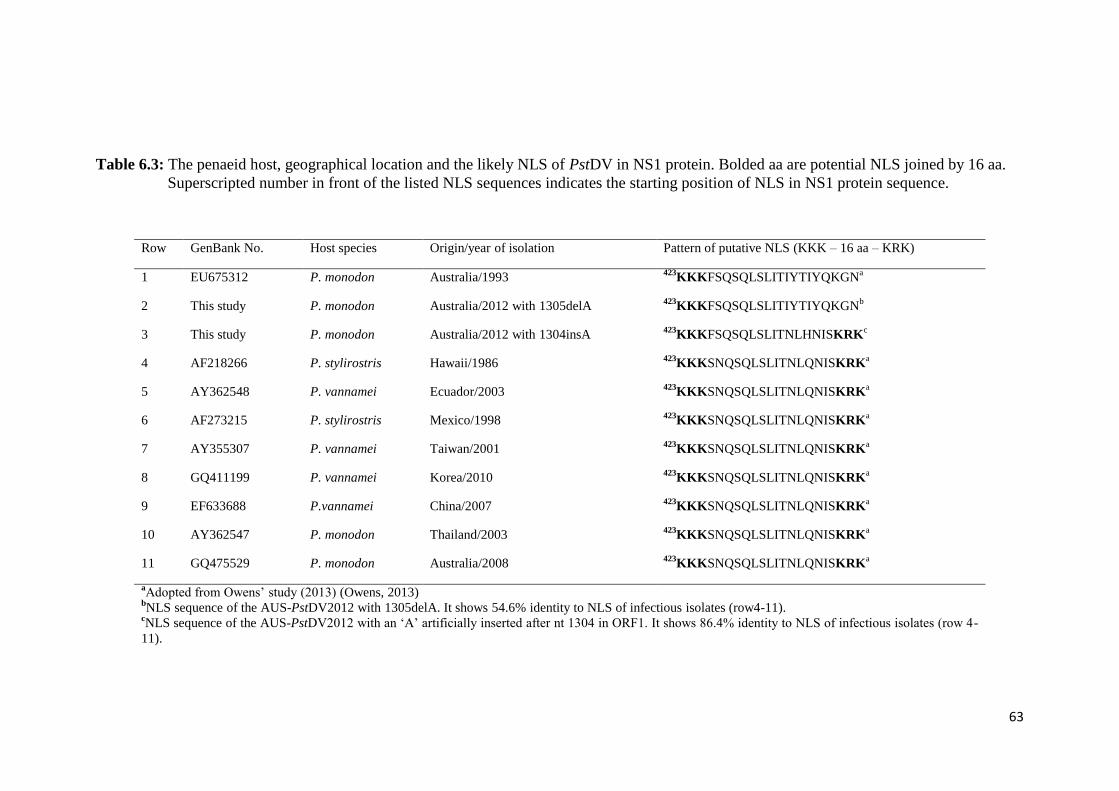
63
Table 6.3: The penaeid host, geographical location and the likely NLS of PstDV in NS1 protein. Bolded aa are potential NLS joined by 16 aa.
Superscripted number in front of the listed NLS sequences indicates the starting position of NLS in NS1 protein sequence.
Row GenBank No. Host species Origin/year of isolation Pattern of putative NLS (KKK – 16 aa – KRK)
1 EU675312 P. monodon Australia/1993 423
KKKFSQSQLSLITIYTIYQKGNa
2 This study P. monodon Australia/2012 with 1305delA 423
KKKFSQSQLSLITIYTIYQKGNb
3 This study P. monodon Australia/2012 with 1304insA 423
KKKFSQSQLSLITNLHNISKRKc
4 AF218266 P. stylirostris Hawaii/1986 423
KKKSNQSQLSLITNLQNISKRKa
5 AY362548 P. vannamei Ecuador/2003 423
KKKSNQSQLSLITNLQNISKRKa
6 AF273215 P. stylirostris Mexico/1998 423
KKKSNQSQLSLITNLQNISKRKa
7 AY355307 P. vannamei Taiwan/2001 423
KKKSNQSQLSLITNLQNISKRKa
8 GQ411199 P. vannamei Korea/2010 423
KKKSNQSQLSLITNLQNISKRKa
9 EF633688 P.vannamei China/2007 423
KKKSNQSQLSLITNLQNISKRKa
10 AY362547 P. monodon Thailand/2003 423
KKKSNQSQLSLITNLQNISKRKa
11 GQ475529 P. monodon Australia/2008 423
KKKSNQSQLSLITNLQNISKRKa
aAdopted from Owens’ study (2013) (Owens, 2013)
bNLS sequence of the AUS-PstDV2012 with 1305delA. It shows 54.6% identity to NLS of infectious isolates (row4-11).
cNLS sequence of the AUS-PstDV2012 with an ‘A’ artificially inserted after nt 1304 in ORF1. It shows 86.4% identity to NLS of infectious isolates (row 4-
11).
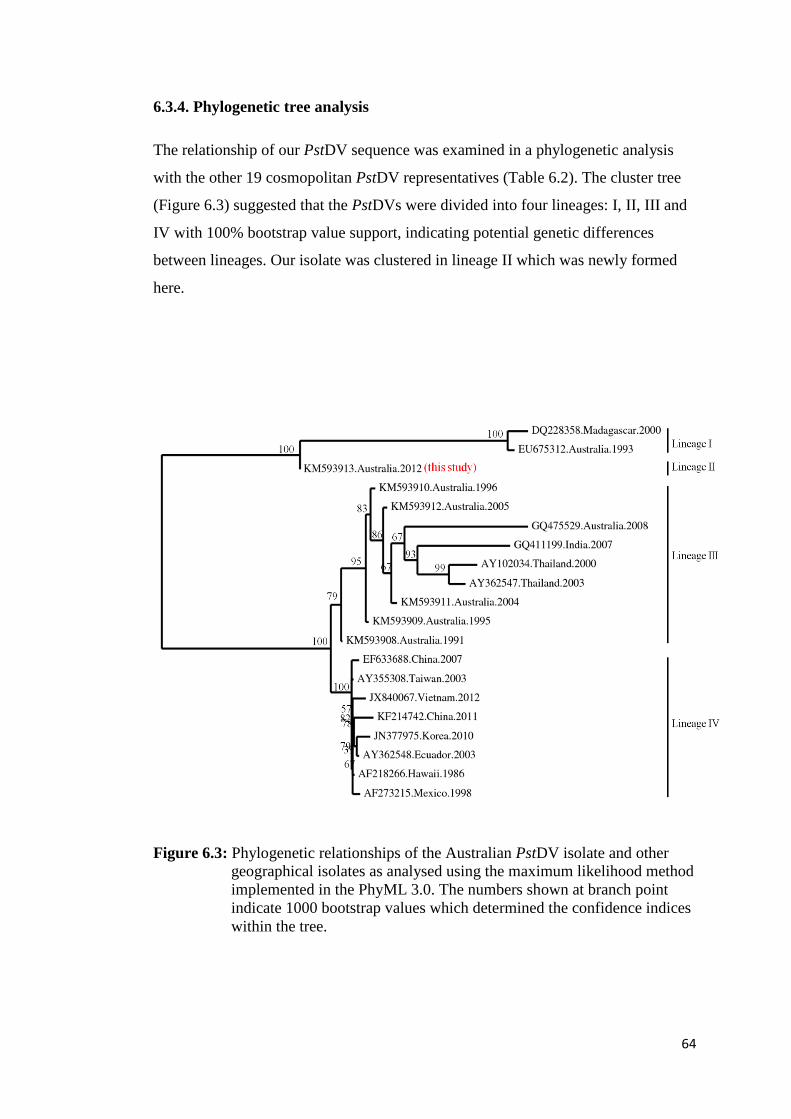
64
6.3.4. Phylogenetic tree analysis
The relationship of our PstDV sequence was examined in a phylogenetic analysis
with the other 19 cosmopolitan PstDV representatives (Table 6.2). The cluster tree
(Figure 6.3) suggested that the PstDVs were divided into four lineages: I, II, III and
IV with 100% bootstrap value support, indicating potential genetic differences
between lineages. Our isolate was clustered in lineage II which was newly formed
here.
Figure 6.3: Phylogenetic relationships of the Australian PstDV isolate and other
geographical isolates as analysed using the maximum likelihood method
implemented in the PhyML 3.0. The numbers shown at branch point
indicate 1000 bootstrap values which determined the confidence indices
within the tree.
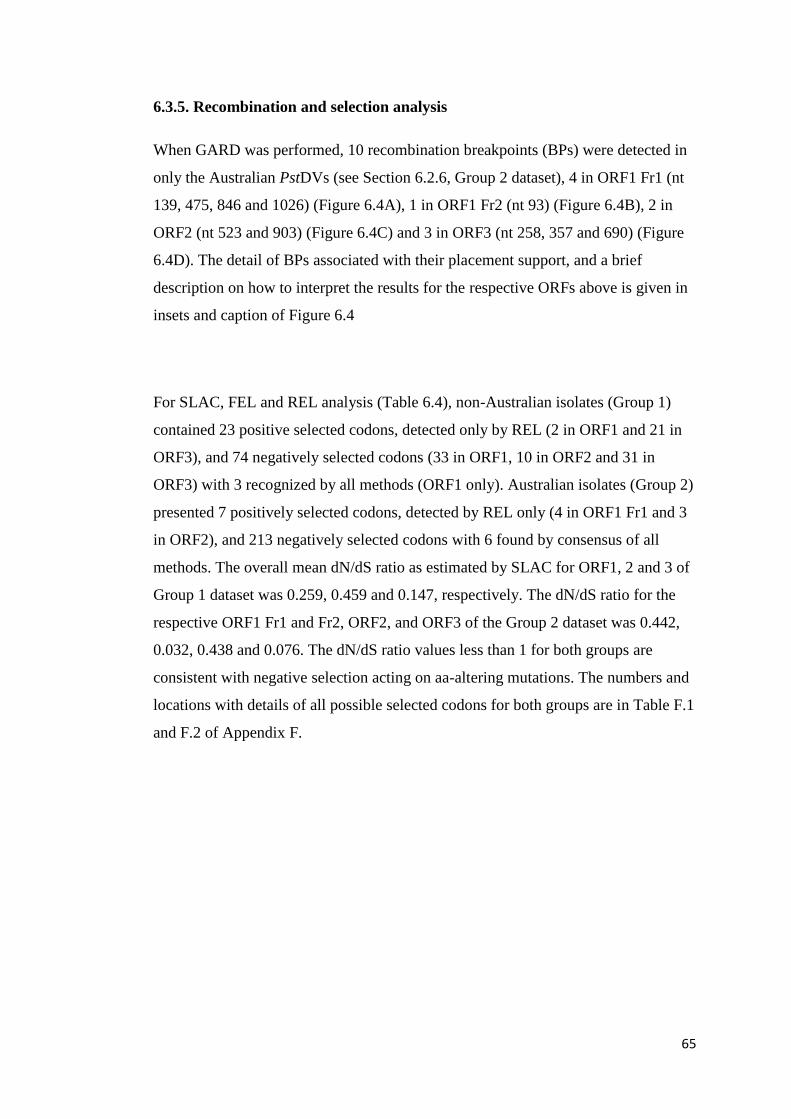
65
6.3.5. Recombination and selection analysis
When GARD was performed, 10 recombination breakpoints (BPs) were detected in
only the Australian PstDVs (see Section 6.2.6, Group 2 dataset), 4 in ORF1 Fr1 (nt
139, 475, 846 and 1026) (Figure 6.4A), 1 in ORF1 Fr2 (nt 93) (Figure 6.4B), 2 in
ORF2 (nt 523 and 903) (Figure 6.4C) and 3 in ORF3 (nt 258, 357 and 690) (Figure
6.4D). The detail of BPs associated with their placement support, and a brief
description on how to interpret the results for the respective ORFs above is given in
insets and caption of Figure 6.4
For SLAC, FEL and REL analysis (Table 6.4), non-Australian isolates (Group 1)
contained 23 positive selected codons, detected only by REL (2 in ORF1 and 21 in
ORF3), and 74 negatively selected codons (33 in ORF1, 10 in ORF2 and 31 in
ORF3) with 3 recognized by all methods (ORF1 only). Australian isolates (Group 2)
presented 7 positively selected codons, detected by REL only (4 in ORF1 Fr1 and 3
in ORF2), and 213 negatively selected codons with 6 found by consensus of all
methods. The overall mean dN/dS ratio as estimated by SLAC for ORF1, 2 and 3 of
Group 1 dataset was 0.259, 0.459 and 0.147, respectively. The dN/dS ratio for the
respective ORF1 Fr1 and Fr2, ORF2, and ORF3 of the Group 2 dataset was 0.442,
0.032, 0.438 and 0.076. The dN/dS ratio values less than 1 for both groups are
consistent with negative selection acting on aa-altering mutations. The numbers and
locations with details of all possible selected codons for both groups are in Table F.1
and F.2 of Appendix F.
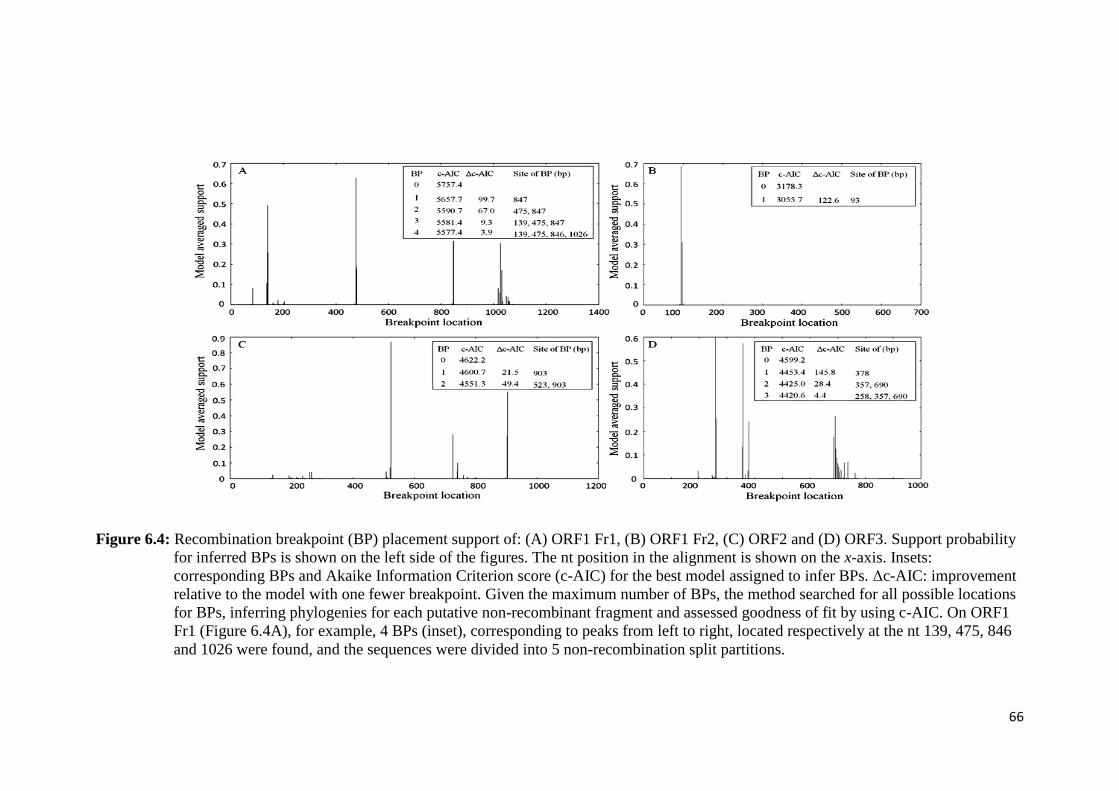
66
Figure 6.4: Recombination breakpoint (BP) placement support of: (A) ORF1 Fr1, (B) ORF1 Fr2, (C) ORF2 and (D) ORF3. Support probability
for inferred BPs is shown on the left side of the figures. The nt position in the alignment is shown on the x-axis. Insets:
corresponding BPs and Akaike Information Criterion score (c-AIC) for the best model assigned to infer BPs. Δc-AIC: improvement
relative to the model with one fewer breakpoint. Given the maximum number of BPs, the method searched for all possible locations
for BPs, inferring phylogenies for each putative non-recombinant fragment and assessed goodness of fit by using c-AIC. On ORF1
Fr1 (Figure 6.4A), for example, 4 BPs (inset), corresponding to peaks from left to right, located respectively at the nt 139, 475, 846
and 1026 were found, and the sequences were divided into 5 non-recombination split partitions.
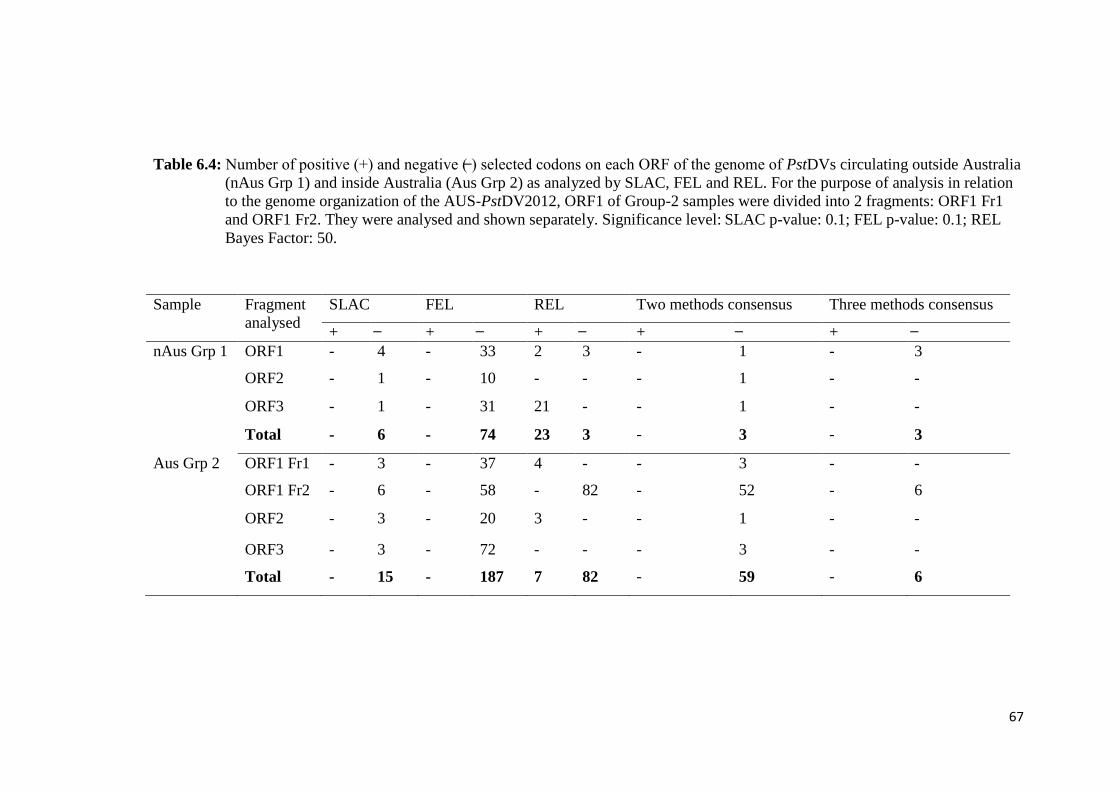
67
Table 6.4: Number of positive (+) and negative (̶ ) selected codons on each ORF of the genome of PstDVs circulating outside Australia
(nAus Grp 1) and inside Australia (Aus Grp 2) as analyzed by SLAC, FEL and REL. For the purpose of analysis in relation
to the genome organization of the AUS-PstDV2012, ORF1 of Group-2 samples were divided into 2 fragments: ORF1 Fr1
and ORF1 Fr2. They were analysed and shown separately. Significance level: SLAC p-value: 0.1; FEL p-value: 0.1; REL
Bayes Factor: 50.
Sample Fragment
analysed
SLAC FEL REL Two methods consensus Three methods consensus
+ ̶ + ̶ + ̶ + ̶ + ̶
nAus Grp 1 ORF1 - 4 - 33 2 3 - 1 - 3
ORF2 - 1 - 10 - - - 1 - -
ORF3 - 1 - 31 21 - - 1 - -
Total - 6 - 74 23 3 - 3 - 3
Aus Grp 2 ORF1 Fr1 - 3 - 37 4 - - 3 - -
ORF1 Fr2 - 6 - 58 - 82 - 52 - 6
ORF2 - 3 - 20 3 - - 1 - -
ORF3 - 3 - 72 - - - 3 - -
Total - 15 - 187 7 82 - 59 - 6
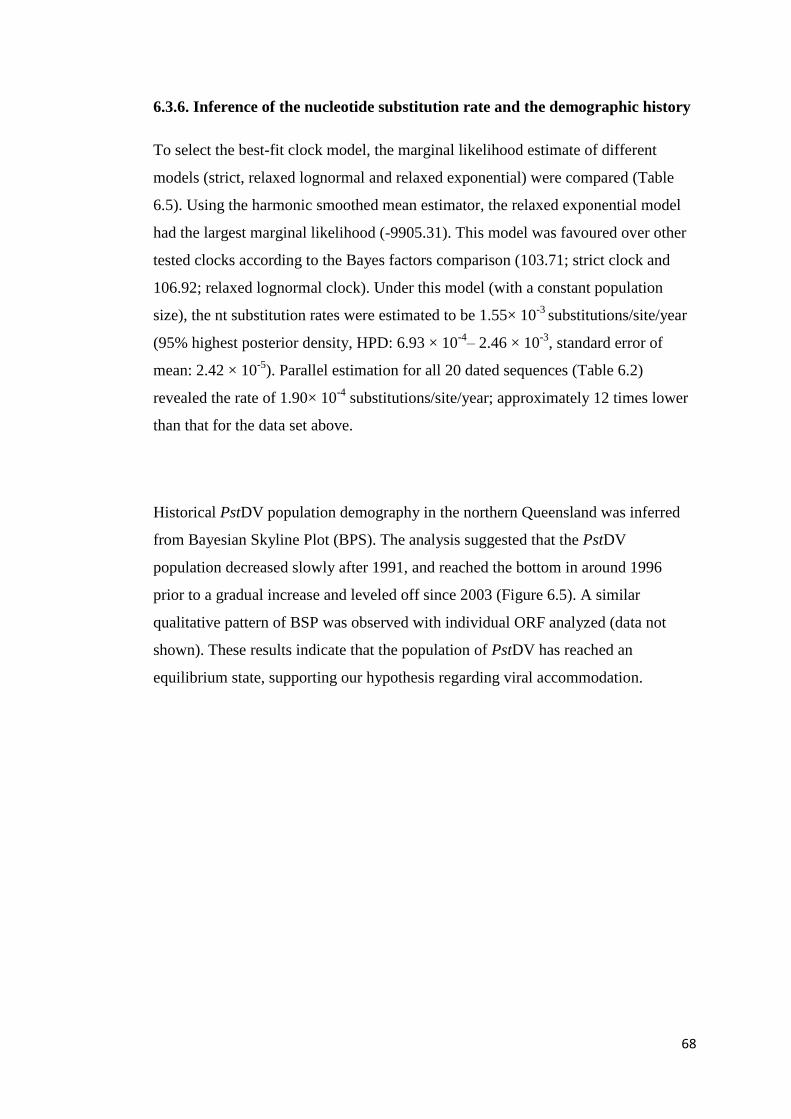
68
6.3.6. Inference of the nucleotide substitution rate and the demographic history
To select the best-fit clock model, the marginal likelihood estimate of different
models (strict, relaxed lognormal and relaxed exponential) were compared (Table
6.5). Using the harmonic smoothed mean estimator, the relaxed exponential model
had the largest marginal likelihood (-9905.31). This model was favoured over other
tested clocks according to the Bayes factors comparison (103.71; strict clock and
106.92; relaxed lognormal clock). Under this model (with a constant population
size), the nt substitution rates were estimated to be 1.55× 10⁻³
substitutions/site/year
(95% highest posterior density, HPD: 6.93 × 10⁻⁴
– 2.46 × 10⁻³
, standard error of
mean: 2.42 × 10⁻⁵
). Parallel estimation for all 20 dated sequences (Table 6.2)
revealed the rate of 1.90× 10⁻⁴
substitutions/site/year; approximately 12 times lower
than that for the data set above.
Historical PstDV population demography in the northern Queensland was inferred
from Bayesian Skyline Plot (BPS). The analysis suggested that the PstDV
population decreased slowly after 1991, and reached the bottom in around 1996
prior to a gradual increase and leveled off since 2003 (Figure 6.5). A similar
qualitative pattern of BSP was observed with individual ORF analyzed (data not
shown). These results indicate that the population of PstDV has reached an
equilibrium state, supporting our hypothesis regarding viral accommodation.
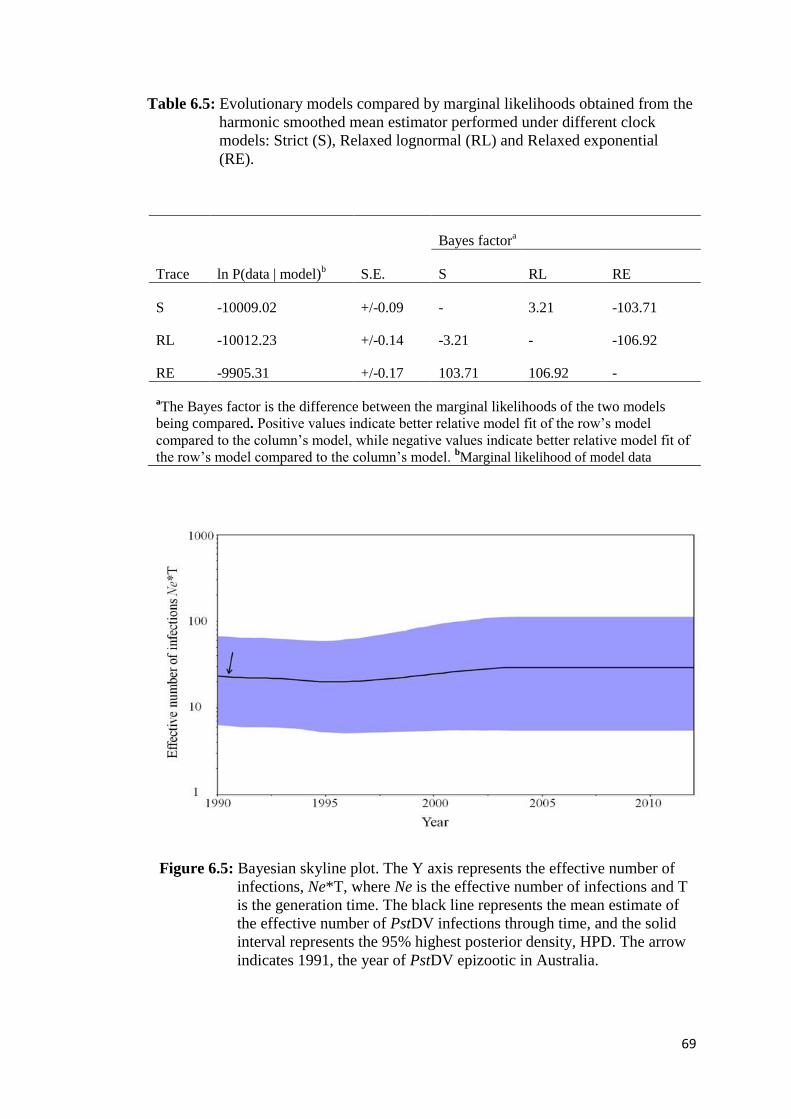
69
Table 6.5: Evolutionary models compared by marginal likelihoods obtained from the
harmonic smoothed mean estimator performed under different clock
models: Strict (S), Relaxed lognormal (RL) and Relaxed exponential
(RE).
Bayes factora
Trace ln P(data | model)b S.E. S RL RE
S -10009.02 +/-0.09 - 3.21 -103.71
RL -10012.23 +/-0.14 -3.21 - -106.92
RE -9905.31 +/-0.17 103.71 106.92 -
aThe Bayes factor is the difference between the marginal likelihoods of the two models
being compared. Positive values indicate better relative model fit of the row’s model
compared to the column’s model, while negative values indicate better relative model fit of
the row’s model compared to the column’s model. bMarginal likelihood of model data
Figure 6.5: Bayesian skyline plot. The Y axis represents the effective number of
infections, Ne*T, where Ne is the effective number of infections and T
is the generation time. The black line represents the mean estimate of
the effective number of PstDV infections through time, and the solid
interval represents the 95% highest posterior density, HPD. The arrow
indicates 1991, the year of PstDV epizootic in Australia.

70
6.4. Discussion
The initial discovery of the 1305delA mutation within ORF1 of the Australian
PstDV genomes (Figure 6.2A, top) posed the question whether it is real or an
artefact of technology. If it was real, was it consistently inherited over time?
Sequencing of the genome of PstDV from northern Queensland in 2012 found that
all 9 samples examined were homogenous for the 1305delA mutation (Figure 6.2A,
bottom). The sequence chromatograms showed clear DNA patterns, no overlapping
peaks or noise at the A-missing nt for all the sequences examined (Figure 6.2C,
highlighted). We discount polymerase errors since we used high fidelity enzymes
and sequenced amplicons in both directions. Furthermore, this point mutation was
also found in the other Australian PstDV sequence (GenBank No. EU675312)
collected from cultured shrimp in 1993; 19 years before this study. The sampling
period, the sampling area, the research methodology and researchers for these viral
isolates were independent. These facts combined with the number of individual
PstDV samples that possesses the mutation led to a logical conclusion that the A-
deletion was real.
The 1305delA occurs at the NLS encoding sequence (Table 6.3, rows 1-2). As the
NLS is involved with mediating proteins entry through the nuclear pore to be
functional in the host cell nucleus (Jans et al., 2000; Owens, 2013), incorrectly
translated NLS caused by the 1305delA may compromise its NL signature,
consequently affecting the DNA replication process of PstDV. The mutation also
creates a premature termination codon within ORF1 which leads to the predicted
NS1 protein being shortened by 199 aa with 2 putative minor proteins (NS1 Fr1 and
NS1 Fr2) produced instead, and separation of the replication initiator motifs from
NTP-binding and helicase domains (see Section 6.3.2). This change possibly
strongly modifies the characteristics of the NS1, and consequently affects the growth
of PstDV as NS1 was responsible for the majority of enzymatic activities involved
in viral transcription and replication. However, if both NS1 Fr1 and Fr2 are
associated post-translation, then some functionality would be returned with some
considerable loss in speed and efficiency. Further research that elucidates the basis
PstDV NS1 malfunction would be particularly informative. The 1305delA does not
71
cause any frame shift or premature stop codon in other ORFs as its location does not
overlap with those ORFs. The 1305delA has not been reported as responsible for
ORF1 frame-shift and can therefore be regarded as novel. As it is unique for the
Australian PstDV strain, it serves as a genetic marker for identifying this viral strain.
Both Australian PstDV strains isolated in 2012 (this study) and 1993 (GenBank No.
EU675312) contain this genomic marker. Therefore, they are assumed to originate
from the same ancestor. The marker can also be useful in studying the relationship
between the degree of virulence of PstDV and the genetic causes as it is associated
with defective NS1 production. This knowledge may be an important clue regarding
viral accommodation and genes related to virulence. As this sequence information is
from full length transcripts, it is clear that PstDVs with the 1305delA are circulating
in Australian prawn populations.
With PstDV genome analysis, our sequence shared a comparable degree of identity
with those in both lineage I (~93-94%) which originated from Australia and
Madagascar, and lineage III (~91-92%) from some parts of Asia (Table 6.2) When a
phylogenetic tree was constructed, AUS-PstDV2012 clustered in lineage II, a
different lineage to the isolate reported in 1993 (Figure 6.3). Both strains were
discovered from prawn farms in the same geographic area separated by only a 19-
year interval. In addition, they were assumed to originate from the same ancestor
due to the presence of the genetic marker in their genomes (see above). Interestingly,
several isolates from prawns cultured in northern Queensland were classified into
lineage III. Hence, it can be concluded that different lineages of PstDV have been
co-circulating in Australia, one originated from Asia (GenBank No. KM593910,
KM593912, GQ475529, KM593911, KM593909, and KM593908) and other
endemic strains (this study and GenBank No. EU675312) (Figure 6.3).
With GARD analysis, 10 break points in the genome of Australian PstDVs were
revealed: 4 in ORF1 Fr1 (Figure 6.4A), 1 in ORF1 Fr2 (Figure 6.4B), 2 in ORF2
(Figure 6.4C) and 3 in ORF3 (Figure 6.4D). This indicated the exchange of genetic
information between different isolates found in Australia, consequently contributing
72
to increased genetic diversity. This might be the reason for the two Australian
isolates sampled from the same geographical area but in different years (1993 and
2012) are less similar in DNA sequence than expected and are in different lineages.
The data herein are consistent with there being an older Australian endemic PstDV
(AUS-PstDV2012) and an introduction of an Asian PstDV around 1991 (GenBank
No. KM593908). Signals of natural selection (both positive and negative) as
analyzed using SLAC, FEL and REL were also found in many codons in PstDV
genomes both endemic (Table 6.4, Aus Grp2) and outside Australia (Table 6.4,
nAus Grp1). SLAC and FEL detected only negative selection signals, while REL
detected both positive and negative signals. It is known that different approaches to
inferring the same effect can lead to slightly different conclusions, never with 100%
accuracy (Poon et al., 2009). SLAC is the most conservative; it may miss some sites,
but it does not identify many neutral sites. Hence, the actual rate of false positives
can be much lower than the significance level. FEL detects more sites, while REL
selects most sites but yields the highest error rate (Pond and Frost, 2005; Poon et al.,
2009). With this in mind, we attempted not to translate our results into the actual
signature of selection, but inferred the overall number of possible events instead.
Thus, there are possible trends for both increasing the prevalence of adaptive traits
in PstDV populations, and decreasing prevalence of traits that diminish individual
viruses’ capacity to succeed reproductively. However, the latter case seems highly
likely due to the negative consensus values across all three methods.
Using Bayesian coalescent approaches to evaluate the evolutionary rate of PstDV
circulating in Australia, the nt substitution rate was estimated to be 1.55 × 10⁻³
substitutions/site/year, which is unexpectedly high for a dsDNA virus but perhaps
not for single-stranded (ss) DNA virus (see Robles-Sikisaka et al., 2010) and
comparable to RNA viruses which evolve at a rate of 10-3
to 10-5
substitutions/site/year (Scholtissek, 1995; Jenkins et al., 2002). It is generally
assumed that dsDNA viruses evolve at a similar rate to that of their hosts due to viral
dependence on the host’s cellular machinery for replication (Shackelton and
Holmes, 2006; Duffy and Holmes, 2008). This data set provides a good
approximation of the rate of evolution due to the length of the sequences that cover
73
all ORFs, the range of sampling dates (from 1991 to 2012; the first year of an
official record of PstDV existence in Australia until the latest, a 22-year interval).
We attribute this unexpectedly high estimate to the DNA recombination, a major
evolutionary mechanisms driving diversity and adaptation in parvoviruses
(Shackelton et al., 2007). Our estimate is approximately 12 times and 9 times higher
than that computed from 20 worldwide distributed isolates (this study) and the 18
isolates of a previous study (Robles-Sikisaka et al., 2010). However, note that the
study of Robles-Sikisaka et al. (2010) only looked at the capsid gene whilst we
looked at all ORFs and what effect this had on this comparison is unknown. We also
note that a number of other parvoviruses infecting mammals and begomoviruses
infecting plants have been reported to evolve at roughly the same rate. These include
human B19 erythrovirus (1x10⁻⁴
) (Shackelton and Holmes, 2006), human parvovirus
B19 (Parsyan et al., 2007), porcine circovirus 2 (Firth et al., 2009), canine
parvovirus (CPV) (1.7x10⁻⁴
), feline panleukopenia parvovirus (FPLV) (9.4x10⁻⁵
)
(Shackelton et al., 2005), and the ssDNA containing begomovirus, tomato yellow
leaf curl virus (TYLCV) (2.88x10⁻⁴
) (Duffy and Holmes, 2008).
Regarding the history of PstDV outbreak in Australia, high mortalities and obvious
gross pathology caused by the virus in farmed prawn were not recorded since 1991
despite the virus existing here. When a BPS-derived PstDV population growth was
inferred, the effective number of infections of PstDV decreased slowly after 1991,
prior to recovery in 1996 and remained stable from 2003 onwards (Figure 6.5). Of
considerable interest is that this time corresponded to the severe outbreaks of
Midcrop Mortality Syndrome (MCMS) in Australia (Anderson and Owens, 2001) of
which PstDV was a component. Electron microscopy demonstrated a parvovirus
was involved from March 1994 onwards and MCMS was nationwide by 1996 when
the upturn in the BSP started to occur. MCMS continued unabated until 2003 when
a combination of broodstock from the Northern Territory, restriction to one crop per
year, longer dry-outs of ponds and partial harvests returned predictable production to
the industry. We hypothesize that the high mortality rates in prawns infected with
MCMS put selective pressure for “fit” biotypes to replicate before prawns
succumbed (Figure 6.5). The apparent stability of the PstDV population does not
74
correlate with the high substitution rate we found. The simple explanation to this
contradiction is that mutation mostly produced negative traits (Table 6.4), resulting
in a trend for decreasing prevalence of traits that diminished individual virions
capacity to succeed reproductively and its genes to be present in the next generation.
Therefore, the effective viral population (Ne*T) did not increase much. Altogether,
we interpret reduction in virulence across northern Queensland primarily in terms of
pathogen evolution. Specifically, we hypothesize an inherent trade-off between
transmission rate and virulence that has changed over time as PstDV evolved. Future
research that elucidates the basis of this trade-off in association with the effect of
fragmented ORF1 caused by the 1305delA mutation would be particularly
informative.
For clarification on awareness of PstDV outbreaks in Australia, large amounts of
commodity prawns from South East Asia (Krabsetsve et al., 2004) have been
imported into Australia which is believed to be the source of Asian-originated
PstDV currently spreading in northern Queensland. Recombination of this strain
with an endemic strain could, in the worst case, lead to the emergence of virulent
strains following changes in the host or environmental conditions. Furthermore,
northern Australia shares the marine environment and fauna with the Indo-Pacific
region. In conjunction with the fact that shrimp farms are generally located in
coastal regions that also provide a natural habitat for wild shrimp, there are
opportunities for admixture of wild and captive shrimp populations. Consequently, a
lethal strain of PstDV originating in the wild or derived from the Indo-Pacific region
can also potentially be introduced into cultured populations, and vice versa. Routine
genetic monitoring of PstDV in both wild and cultured shrimp might aid
management efforts in this regard.
In 1999–2000, a new strain of Taura syndrome virus (TSV Mx2000), one of the
most serious shrimp pathogens, emerged in Mexican shrimp culture. It was reported
to have escaped detection since it did not react with the monoclonal antibody (MAb)
used for the routine screening of TSV by immunohistochemistry (ISH). Subsequent
75
cloning and sequencing showed that it contained distinctive capsid gene mutations
that contributed to detection failure in the ISH method (Robles-Sikisaka et al.,
2002). For PstDV, use of the BS4.5 DNA gene probe designed to specifically detect
the virus also failed to react with Australian isolate (Owens et al., 1992; Lightner,
1996c). A view was forming that the Australian isolate also has unique mutations
that contributed to the dot-blotting detection failure. This suggestion is highly likely
due to the presence of genetic recombination among Australian isolates (this study).
Genetic screens may allow the identification of otherwise undetectable strains, as
well as shed light on the unknown determinants of changes in virulence such as the
discovered point mutation in ORF1.
In conclusion, Australian prawns have developed resistance to PstDV and/or the
virus has reached equilibrium with the host in terms of genes related to virulence. A
1-bp deletion (1305delA) within ORF1 has been identified as being responsible for
199-aa shortened NS1 synthesis in Australian PstDV. Alteration of such a big aa
portion may modify the characteristics of the NS1, consequently affecting the
growth of PstDV. Thus, the 1305delA mutation is believed to be associated with the
reduction of virulence in the Australian strain. However, to experimentally prove
this concept is exceptionally difficult at present due to the lack of in vitro cell
cultures to support the growth of PstDV and to facilitate intensive studies. In
addition, the complete genome of the virus (including both hairpin ends) has not
been reported. The 1305delA serves as a genetic marker to identify this Australian
viral strain. The constant growth of Australian PstDV population and signs of viral
accommodation have also been revealed herein. However, we should not assume
that PstDV is a stable or static virus, and understate the potential for new virulence
stains to arise. This is because of a high degree of evolutionary and genetic variation
for PstDV attributable to the viral recombination has been observed. Thus,
awareness on the emergence of new virulent strains should be raised as preventative
measures for future outbreaks of PstDV in Australia and the Australian Indo-Pacific.
76
CHAPTER 7
GENERAL DISCUSSION
Penaeus stylirostris densovirus (PstDV) is an important shrimp pathogen that
contributes to the poor health and production losses of prawns across the globe (Rai
et al., 2012; Owens, 2013). Recently, PstDV-related sequences were found in the
genome of P. monodon and P. vannamei (Tang and Lightner, 2006; Saksmerprome
et al., 2011). This led to false positive results by PCR-based detection systems
including those recommend by the World Organization for Animal Health (OIE)
(the 309F/R PCR primer protocol and the IQ2000TM
PCR detection kit)
(Saksmerprome et al., 2011). Here, we examined and mapped the PstDV insertion
profile in the genome of Australian P. monodon. A DNA sequence which is likely to
represent infectious PstDV was also identified and used as a target sequence for
RPA-LFD, developed for specifically detecting PstDV. The protocol at 37 °C for 30
min followed by 5 min at room temperature showed no cross-reaction with other
shrimp viruses, and was 10 times more sensitive than both the OIE protocols
mentioned above. The major benefit of this protocol is that it could reduce false
positive results arising from viral inserts to ~5%, compared to 76-78% by the OIE
protocols above (Saksmerprome et al., 2011). Its total assay time is approximately
35 min, about 6–8 times faster than the Saksmerphrome et al.’s interim 3-tube
nested PCR-AGE detection of PstDV.
The estimated cost for a single assay using the RPA–LFD protocol (excluding DNA
extraction) is approximately US$ 8 or comparable to that of LAMP-LFD and the
IQ2000TM
kit which we estimated for standard nested PCR using a DNA extraction
kit, a nested PCR detection kit and gel electrophoresis followed by UV detection
(Jaroenram et al., 2009). This estimate does not include capital costs for equipment
(i.e. heating block). The RPA–LFD cost could probably be further reduced by
production-scale savings. The market force may also make it be more affordable in
the future, similar to PCR reagents and relevant equipment (i.e. thermal cycler)
77
which were more expensive in the early days of the technology than they are now.
Our RPA protocol reduced complications associated with reaction preparation found
in PCR or LAMP as the RPA reaction system is provided in a stabilized dried
format which permits transportation and limited storage without refrigeration
(http://www.twistdx.co.uk/our_technology/). In addition, the reaction can be
completely set up at room temperature. Together with the requirement of only a
simple heating block for maintaining the reaction, our protocol provides qualitative
DNA testing without the need of a laboratory, and that indicates the applicability for
onsite detection. However, our protocol is a prototype and to use it in field,
evaluation of its efficiency on a larger scale is first required. In addition, a simple
but efficient-and-compatible DNA extraction method has to be established and
combined in order to make the RPA-LFD described truly practical and robust. As
our protocol is the first RPA-based method for the detection of a shrimp pathogen, it
serves as a model platform that could be adapted easily to detect other pathogens or
genetic markers of interest using basic laboratory equipment.
Implementation of monitoring and control measures for viral epizootic outbreaks
requires an understanding of the factors that underlie molecular evolution and
population dynamics (Robles-Sikisaka et al., 2010). This is also true for PstDVs that
have been circulating in Australia. By screening P. monodon sampled from farms of
northern Queensland in 2012 using our RPA-LFD, several shrimp were positive for
infectious PstDV. When whole genome of the virus from these shrimp was
sequenced and analyzed, a single base deletion (1305delA) within the NLS-encoding
sequence of ORF1; NS1 was detected and identified as being responsible for 199-aa
shortened NS1 synthesis. This mutation is believed to reduce virulence as it strongly
modifies the characteristics of NS1, a protein that plays major roles in PstDV
replication and transcription. This suggestion correlates with the constant growth of
the Australian PstDV population examined using Bayesian skyline plot (BPS),
supporting our hypothesis regarding accommodation of PstDV in Australian P.
monodon in relation to viral genetics. Future research that elucidates the basis of
PstDV-NS1 malfunction in association with the viral accommodation would be
particularly informative. Identification of the co-presence of a completely functional
78
genotype whose virions would be able to encapsidate the non-functional mutant
genome, and understanding the consequences of these patterns of genetic variation
for various evolutionary processes is interesting and should be further studied.
The 1305delA we found is unique for an Australian PstDV strain. Therefore, it
serves as a genetic marker for this viral strain, and provides usefulness in studying
the relationship between the degree of virulence of PstDV and the genetic causes. It
is also beneficial for international seafood trade and quarantine management system.
To illustrate this point, if any country having encountered an outbreak of PstDV
claims that the PstDV is distributed from Australia via frozen seafood imported, this
claim can be proven right or wrong using the marker described for this strain. With
this approach, economic tension including trade restriction or sanction against
Australia can be prevented. Having research on developing a protocol to specifically
detect the 1305delA mutation would be of interest in this regard.
For clarification of awareness of PstDV outbreaks in Australia, although the
constant growth of Australian PstDV population and signs of viral accommodation
have been revealed herein, we should not assume that the PstDV is a stable, and
understate the potential for new virulence stains to arise. This is because of a high
degree of evolution for the virus, which was attributable to the viral recombination,
was also observed. With this finding, we primarily suggest that awareness of the
emergence of new virulent strains should be raised as a preventative measure against
future outbreaks of PstDV in Australia and the Australian Indo-Pacific where fauna
and marine environment are shared. However, analysis of a much larger number of
native, wild samples of P. monodon would be particularly useful, and required to
prove that the hypothesis regarding a faster rate of evolution and viral
accommodation proposed herein are consistent and represent the evolution of PstDV
in the Australia Indo-Pacific region in general.
79
In conclusion, a more practical and efficient protocol to specifically detect PstDV,
and the factors that underlie the evolution of the Australian PstDV have been
established and identified here, respectively. Integration of such outputs and
knowledge can help contribute toward better strategies to counter PstDV.
80
REFERENCES
Alfaro Aguilera, R., Guevara Torres, M. and Gonzales Chávez, I. (2010) Prevalencia
y distribución de los principales agentes etiológicos que afectan los
langostinos silvestres en Tumbes, Perú. Rev. peru biol 17: 359-364
Anderson, I.G. and Owens, L.G. (2001) The diagnosis and prevention of the mid-
crop mortality syndrome of pond-reared black tiger prawns (Penaeus
monodon), 56 pp. Oonoonba Veterinary Laboratory, Department of Primary
Industries.
Arunrut, N., Prombun, P., Saksmerprome, V., Flegel, T.W. and Kiatpathomchai, W.
(2011) Rapid and sensitive detection of infectious hypodermal and
hematopoietic necrosis virus by loop-mediated isothermal amplification
combined with a lateral flow dipstick. Journal of virological methods 171:
21-25
Astell, C. (1990) Terminal hairpins of parvovirus genomes and their role in DNA
replication. Handbook of parvoviruses 1: 59-80
Bell, T.A. and Lightner, D.V. (1984) IHHN virus: infectivity and pathogenicity
studies in Penaeus stylirostris and Penaeus vannamei. Aquaculture 38: 185-
194
Bell, T. and Lightner, D. (1987) IHHN disease of Penaeus stylirostris: effects of
shrimp size on disease expression. Journal of fish diseases 10: 165-170
Boada, M. (2008) Detection of the Infectious Hypodermal and Hematopoietic
Necrosis Virus (IHHNV) in Asymtomatic Cultured White Shrimp,
Litopenaeus vannamei (Boone), in Venezuela. REVISTA CIENTIFICA 18: 7-
11
Bouckaert, R., Heled, J., Kühnert, D., Vaughan, T., Wu, C.-H., Xie, D., Suchard,
M.A., Rambaut, A. and Drummond, A.J. (2014) BEAST 2: a software
platform for Bayesian evolutionary analysis. PLoS computational biology
10: e1003537
Boyle, D.S., Lehman, D.A., Lillis, L., Peterson, D., Singhal, M., Armes, N., Parker,
M., Piepenburg, O. and Overbaugh, J. (2013) Rapid detection of HIV-1
proviral DNA for early infant diagnosis using recombinase polymerase
amplification. MBio 4: e00135-13
Bray, W.A., Lawrence, A.L. and Leung-Trujillo, J.R. (1994) The effect of salinity
on growth and survival of Penaeus vannamei, with observations on the
interaction of IHHN virus and salinity. Aquaculture 122: 133-146
Braz, R.F.S., Rodrigues de Oliveira da Silva, C.P., Reis, L.G., Martins, P.C.C.,
Pereira de Sales, M. and Meissner, R.V. (2009) Prevalence of infectious
81
hypodermal and hematopoietic necrosis virus (IHHNV) in Penaeus vannamei
cultured in northeastern Brazil. Aquaculture 288: 143-146
Brock, J.A., Lightner, D.V. and Bell, T.A. (1983) A review of four virus (BP, MBV,
BMN and IHHNV) diseases of penaeid shrimp with particular reference to
clinical significance, diagnosis and control in shrimp aquaculture.
Proceedings of the 71st International. Council for the Exploration of the Sea,
CM: 1-18
Browdy, C.L., Holloway, J.D., King, C.O., Stokes, A.D., Hopkins, J.S. and Sandifer,
P.A. (1993) IHHN virus and intensive culture of Penaeus vannamei: effects
of stocking density and water exchange rates. Journal of Crustacean Biology
13: 87-87
Castresana, J. (2000) Selection of conserved blocks from multiple alignments for
their use in phylogenetic analysis. Molecular biology and evolution 17: 540-
552
Chayaburakul, K., Nash, G., Pratanpipat, P., Sriurairatana, S. and
Withyachumnarnkul, B. (2004) Multiple pathogens found in growth-retarded
black tiger shrimp Penaeus monodon cultivated in Thailand. Diseases of
aquatic organisms 60: 89-96
Chevenet, F., Brun, C., Bañuls, A.-L., Jacq, B. and Christen, R. (2006) TreeDyn:
towards dynamic graphics and annotations for analyses of trees. BMC
bioinformatics 7: 439
Claydon, K., Tahir, R.A.H., Said, H.M., Lakim, M.H. and Tamat, W. (2010)
Prevalence of shrimp viruses in wild Penaeus monodon from Brunei
Darussalam. Aquaculture 308: 71-74
Coelho, M.G.L., Silva, A.C.G., Vila Nova, C., Neto, J.M.O., Lima, A.C.N., Feijó,
R.G., Apolinário, D.F., Maggioni, R. and Gesteira, T.C.V. (2009)
Susceptibility of the wild southern brown shrimp (Farfantepenaeus subtilis)
to infectious hypodermal and hematopoietic necrosis (IHHN) and infectious
myonecrosis (IMN). Aquaculture 294: 1-4
Cordellier, M. and Pfenninger, M. (2008) Climate‐driven range dynamics of the
freshwater limpet, Ancylus fluviatilis (Pulmonata, Basommatophora).
Journal of Biogeography 35: 1580-1592
Crochu, S., Cook, S., Attoui, H., Charrel, R.N., De Chesse, R., Belhouchet, M.,
Lemasson, J.-J., de Micco, P. and de Lamballerie, X. (2004) Sequences of
flavivirus-related RNA viruses persist in DNA form integrated in the genome
of Aedes spp. mosquitoes. Journal of general virology 85: 1971-1980
De la Vega, E. (2006) A molecular approach to study the interaction between
environmental stress, immune response and disease in the black tiger prawn
(Penaeus monodon). Ph.D. Thesis. University of Queensland.
82
Dhar, A.K., Lakshman, D.K., Natarajan, S., Allnutt, F. and van Beek, N.A.M.
(2007) Functional characterization of putative promoter elements from
infectious hypodermal and hematopoietic necrosis virus (IHHNV) in shrimp
and in insect and fish cell lines. Virus Research 127: 1-8
Drummond, A.J., Rambaut, A., Shapiro, B. and Pybus, O.G. (2005) Bayesian
coalescent inference of past population dynamics from molecular sequences.
Molecular biology and evolution 22: 1185-1192
Duffy, S. and Holmes, E.C. (2008) Phylogenetic evidence for rapid rates of
molecular evolution in the single-stranded DNA begomovirus tomato yellow
leaf curl virus. Journal of virology 82: 957-965
Edgar, R.C. (2004) MUSCLE: multiple sequence alignment with high accuracy and
high throughput. Nucleic Acids Research 32: 1792-1797
Euler, M., Wang, Y., Heidenreich, D., Patel, P., Strohmeier, O., Hakenberg, S.,
Niedrig, M., Hufert, F.T. and Weidmann, M. (2013) Development of a panel
of recombinase polymerase amplification assays for detection of biothreat
agents. Journal of clinical microbiology 51: 1110-1117
Euler, M., Wang, Y., Nentwich, O., Piepenburg, O., Hufert, F.T. and Weidmann, M.
(2012) Recombinase polymerase amplification assay for rapid detection of
Rift Valley fever virus. Journal of Clinical Virology 54: 308-312
Fauquet, C.M., Mayo, M.A., Maniloff, J., Desselberger, U. and Ball, L.A.X. (2005)
Virus taxonomy: VIIIth report of the International Committee on Taxonomy
of Viruses. Academic Press.
Feschotte, C. and Gilbert, C. (2012) Endogenous viruses: insights into viral
evolution and impact on host biology. Nature Reviews Genetics 13: 283-296
Firth, C., Charleston, M.A., Duffy, S., Shapiro, B. and Holmes, E.C. (2009) Insights
into the evolutionary history of an emerging livestock pathogen: porcine
circovirus 2. Journal of virology 83: 12813-12821
Flegel, T.W. (2006) The special danger of viral pathogens in shrimp translocated for
aquaculture. Science Asia 32: 215-221
Flegel, T.W. (2009) Hypothesis for heritable, anti-viral immunity in crustaceans and
insects. Biol Direct 4: 32
Flegel, T.W. (2012) Historic emergence, impact and current status of shrimp
pathogens in Asia. Journal of Invertebrate Pathology 110: 166–173
Fontanella, F.M., Feldman, C.R., Siddall, M.E. and Burbrink, F.T. (2008)
Phylogeography of Diadophis punctatus: Extensive lineage diversity and
repeated patterns of historical demography in a trans-continental snake.
Molecular phylogenetics and evolution 46: 1049-1070
83
Formosa, T. and Alberts, B.M. (1986) Purification and characterization of the T4
bacteriophage uvsX protein. Journal of Biological Chemistry 261: 6107-
6118
Gillett R. (2008) Global study of shrimp fisheries. FAO Fisheries Technical Paper
No. 475. Rome, FAO. 331p
Guindon, S., Dufayard, J.-F., Lefort, V., Anisimova, M., Hordijk, W. and Gascuel,
O. (2010) New algorithms and methods to estimate maximum-likelihood
phylogenies: assessing the performance of PhyML 3.0. Systematic biology
59: 307-321
Guzmán-Sáenz, F.M., Molina-Garza, Z.J., Pérez-Castañeda, R., Ibarra-Gámez, J.C.
and Galavíz-Silva, L. (2009) Virus de la necrosis hipodérmica y
hematopoyética infecciosa (IHHNV) y virus del síndrome de Taura (TSV) en
camarón silvestre (Farfantepenaeus aztecus Ives, 1891 y Litopenaeus
setiferus Linnaeus, 1767) de La Laguna Madre, Golfo de México. Revista de
biología marina y oceanografía 44: 663-672
Hazreen Nita, M., Kua, B., Bhassu, S. and Othman, R. (2012) Detection and genetic
profiling of infectious hypodermal and haematopoietic necrosis virus
(IHHNV) infections in wild berried freshwater prawn, Macrobrachium
rosenbergii collected for hatchery production. Molecular Biology Reports 39
3785-3790
Hsieh, C.Y., Chuang, P.C., Chen, L.C., Tu, C., Chien, M.S., Huang, K.C., Kao,
H.F., Tung, M.C. and Tsai, S.S. (2006) Infectious hypodermal and
haematopoietic necrosis virus (IHHNV) infections in giant freshwater prawn,
Macrobrachium rosenbergii. Aquaculture 258: 73-79
Huang, S.W., Lin, Y.Y., Yu, E.M., Liu, T.T., Shu, H.Y., Wu, K.M., Tsai, S.F., Lo,
C.F., Kou, G.H. and Ma, G.C. (2008) A first glimpse into he genome of he
tiger shrimp, Penaeus monodon, Handbook and abstracts, 58.
Iskra-Caruana, M.L., Baurens, F.C., Gayral, P. and Chabannes, M. (2010) A Four-
Partner Plant-Virus Interaction: Enemies Can Also Come from Within.
Molecular plant-microbe interactions 23: 1394-1402
Jans, D.A., Xiao, C.Y. and Lam, M.H.C. (2000) Nuclear targeting signal
recognition: a key control point in nuclear transport? Bioessays 22: 532-544
Jaroenram, W., Arunrut, N. and Kiatpathomchai, W. (2012) Rapid and sensitive
detection of shrimp yellow head virus using loop-mediated isothermal
amplification and a colorogenic nanogold hybridization probe. Journal of
virological methods 186: 36-42
Jaroenram, W., Kiatpathomchai, W. and Flegel, T.W. (2009) Rapid and sensitive
detection of white spot syndrome virus by loop-mediated isothermal
amplification combined with a lateral flow dipstick. Molecular and cellular
probes 23: 65-70
84
Jaroenram, W. and Owens, L. (2014) Separation of endogenous viral elements from
infectious Penaeus stylirostris densovirus using recombinase polymerase
amplification. Molecular and Cellular Probes 28: 284-287
Jenkins, G.M., Rambaut, A., Pybus, O.G. and Holmes, E.C. (2002) Rates of
molecular evolution in RNA viruses: a quantitative phylogenetic analysis.
Journal of molecular evolution 54: 156-165
Jiménez, R., Barniol, R., De Barniol, L. and Machuca, M. (1999) Infection of IHHN
virus in two species of cultured penaeoid shrimp Litopenaeus vannamei
(Boone) and Litopenaeus stylirostris (Stimpson) in Ecuador during El Niño
1997–98. Aquaculture research 30: 695-705
Kalagayan, H., Godin, D., Kanna, R., Hagino, G., Sweeney, J., Wyban, J. and
Brock, J. (1991) IHHN Virus as an Etiological Factor in Runt-Deformity
Syndrome (RDS) of Juvenile Penaeus vannamei Cultured in Hawaii. Journal
of the World Aquaculture society 22: 235-243
Kersting, S., Rausch, V., Bier, F.F. and von Nickisch-Rosenegk, M. (2014) Rapid
detection of Plasmodium falciparum with isothermal recombinase
polymerase amplification and lateral flow analysis. Malaria journal 13: 99
Khawsak, P., Deesukon, W., Chaivisuthangkura, P. and Sukhumsirichart, W. (2008)
Multiplex RT-PCR assay for simultaneous detection of six viruses of penaeid
shrimp. Molecular and cellular probes 22: 177-183
Kiatpathomchai, W., Jaroenram, W., Arunrut, N., Jitrapakdee, S. and Flegel, T.W.
(2008) Shrimp Taura syndrome virus detection by reverse transcription loop-
mediated isothermal amplification combined with a lateral flow dipstick.
Journal of virological methods 153: 214-217
Kim, J.H., Choresca Jr, C.H., Shin, S.P., Han, J.E., Jun, J.W., Han, S.Y. and Park,
S.C. (2011) Detection of infectious hypodermal and hematopoietic necrosis
virus (IHHNV) in Litopenaeus vannamei shrimp cultured in South Korea.
Aquaculture 313: 161–164
Kim, J.H., Kim, H.K., Nguyen, V.G., Park, B.K., Choresca, C.H., Shin, S.P., Han,
J.E., Jun, J.W. and Park, S.C. (2012) Genomic sequence of infectious
hypodermal and hematopoietic necrosis virus (IHHNV) KLV-2010-01
originating from the first Korean outbreak in cultured Litopenaeus vannamei.
Archives of virology 157: 369-373
Koyama, T., Asakawa, S., Katagiri, T., Shimizu, A., Fagutao, F.F., Mavichak, R.,
Santos, M.D., Fuji, K., Sakamoto, T. and Kitakado, T. (2010) Hyper-
expansion of large DNA segments in the genome of kuruma shrimp,
Marsupenaeus japonicus. BMC genomics 11: 141
Krabsetsve, K., Cullen, B.R. and Owens, L. (2004) Rediscovery of the Australian
strain of infectious hypodermal and haematopoietic necrosis virus. Diseases
of aquatic organisms 61: 153-158
85
Larkin, M.A., Blackshields, G., Brown, N.P., Chenna, R., McGettigan, P.A.,
McWilliam, H., Valentin, F., Wallace, I.M., Wilm, A. and Lopez, R. (2007)
Clustal W and Clustal X version 2.0. Bioinformatics 23: 2947-2948
Lightner, D., Poulos, B., Bruce, L., Redman, R., Mari, J. and Bonami, J. (1992) New
developments in penaeid virology: application of biotechnology in research
and disease diagnosis for shrimp viruses of concern in the Americas.
Diseases of Cultured Penaeid Shrimp in Asia and the United States, Fulks W.
& Main K., Eds. The Oceanic Institute, Makapuu Point, Honolulu, Hawaii,
USA: 233-253
Lightner, D., Redman, R. and Bell, T. (1983a) Infectious hypodermal and
hematopoietic necrosis, a newly recognized virus disease of penaeid shrimp.
Journal of invertebrate pathology 42: 62-70
Lightner, D., Redman, R., Bell, T. and Brock, J. (1983b) Detection of IHHN virus in
Penaeus stylirostris and P. vannamei imported into Hawaii. Journal of the
World Mariculture Society 14: 212-225
Lightner, D.V. (1996a) Epizootiology, distribution and the impact on international
trade of two penaeid shrimp viruses in the Americas. Revue scientifique et
technique (International Office of Epizootics) 15: 579-601
Lightner, D.V. (1996b) The penaeid shrimp viruses IHHNV and TSV:
epizootiology, production impacts and role of international trade in their
distribution in the Americas. Rev. Scient. et Techni. Office Internat. des
Epizoo 15: 579-601
Lightner, D.V. (1996c) The penaeid shrimp viruses IHHNV and TSV:
epizootiology, production impacts and role of international trade in their
distribution in the Americas. Rev. sci. tech. Off. int. Epiz 15: 579-601
Lin, C.L., Lee, J.C., Chen, S.S., Wood, H.A., Li, M.L., Li, C.F. and Chao, Y.C.
(1999) Persistent Hz-1 virus infection in insect cells: evidence for insertion
of viral DNA into host chromosomes and viral infection in a latent status.
Journal of virology 73: 128-139
Liu, H., Fu, Y., Xie, J., Cheng, J., Ghabrial, S.A., Li, G., Peng, Y., Yi, X. and Jiang,
D. (2011) Widespread endogenization of densoviruses and parvoviruses in
animal and human genomes. Journal of virology: 9863-9876
Lotz, J.M. (1997) Viruses, biosecurity and specific pathogen-free stocks in shrimp
aquaculture. World Journal of Microbiology and Biotechnology 13: 405-413
Martínez-Cordova, L.R. (1992) Cultured blue shrimp (Penaeus stylirostris) infected
with infectious hypodermal and hematopoietic necrosis virus in
Northwestern Mexico. The Progressive Fish-Culturist 54: 265-266
Martorelli, S.R., Overstreet, R.M. and Jovonovich, J.A. (2010) First report of viral
pathogens WSSV and IHHNV in Argentine crustaceans. Bulletin Of Marine
Science 86: 117-131
86
Molthathong, S., Jitrakorn, S., Joyjinda, Y., Boonchird, C., Witchayachamnarnkul,
B., Pongtippatee, P., Flegel, T. and Saksmerprome, V. (2013) Persistence of
Penaeus stylirostris densovirus delays mortality caused by white spot
syndrome virus infection in black tiger shrimp (Penaeus monodon). BMC
veterinary research 9: 33
Morales-Covarrubias, M., Nunan, L., Lightner, D., Mota-Urbina, J., Garza-Aguirre,
M. and Chavez-Snachez, M. (1999) Prevalence of IHHNV in wild
broodstock of Penaeus stylirostris from the upper Gulf of California, Mexico.
J. Aquat. Anim. Health 11: 296-301
Motte, E., Yugcha, E., Luzardo, J., Castro, F., Leclercq, G., Rodrı́guez, J., Miranda,
P., Borja, O., Serrano, J. and Terreros, M. (2003) Prevention of IHHNV
vertical transmission in the white shrimp Litopenaeus vannamei.
Aquaculture 219: 57-70
Nimitphak, T., Meemetta, W., Arunrut, N., Senapin, S. and Kiatpathomchai, W.
(2010) Rapid and sensitive detection of Penaeus monodon
nucleopolyhedrovirus (PemoNPV) by loop-mediated isothermal
amplification combined with a lateral-flow dipstick. Molecular and cellular
probes 24: 1-5
Notomi, T., Okayama, H., Masubuchi, H., Yonekawa, T., Watanabe, K., Amino, N.
and Hase, T. (2000) Loop-mediated isothermal amplification of DNA.
Nucleic Acids Research 28: e63-e63
Nunan, L., Poulos, B. and Lightner, D. (2000) Use of polymerase chain reaction for
the detection of infectious hypodermal and hematopoietic necrosis virus in
penaeid shrimp. Marine Biotechnology 2: 319-328
Owens, L. (1987) Histological evidence for a IHHNV-like virus in Australia, First
Australian Prawn Farming Research Workshop. NSW Department of
Agriculture, Salamander Bay, New South Wales, Australia
Owens, L. (2013) Bioinformatical analysis of nuclear localisation sequences in
penaeid densoviruses. Marine genomics 12: 9-15
Owens, L., Anderson, I.G., Kenway, M., Trott, L. and Benzie, J.A.H. (1992)
Infectious Hypodermal and Hematopoietic Necrosis Virus (Ihhnv) in a
Hybrid Penaeid Prawn from Tropical Australia. Diseases of aquatic
organisms 14: 219-228
Owens, L. and Hall-Mendelin, S. (1989) Recent advances in Australian penaeid
diseases and pathology. Advances in Tropical Aquaculture, Tahiti. Actes
Colloq 9:103–112
Pantoja, C.R., Lightner, D.V. and Holtschmit, K.H. (1999) Prevalence and
geographic distribution of infectious hypodermal and hematopoietic necrosis
virus (IHHNV) in wild blue shrimp Penaeus stylirostris from the Gulf of
California, Mexico. Journal of Aquatic Animal Health 11: 23-34
87
Parsyan, A., Szmaragd, C., Allain, J.-P. and Candotti, D. (2007) Identification and
genetic diversity of two human parvovirus B19 genotype 3 subtypes. Journal
of general virology 88: 428-431
Piepenburg, O., Williams, C.H., Stemple, D.L. and Armes, N.A. (2006) DNA
detection using recombination proteins. PLoS biology 4: e204
Pond, S.L.K. and Frost, S.D.W. (2005) Not so different after all: a comparison of
methods for detecting amino acid sites under selection. Molecular biology
and evolution 22: 1208-1222
Pond, S.L.K., Posada, D., Gravenor, M.B., Woelk, C.H. and Frost, S.D.W. (2006)
Automated phylogenetic detection of recombination using a genetic
algorithm. Molecular biology and evolution 23: 1891-1901
Poon, A.F.Y., Frost, S.D.W. and Pond, S.L.K. (2009) Detecting signatures of
selection from DNA sequences using Datamonkey, Bioinformatics for DNA
Sequence Analysis, pp. 163-183. Springer.
Posada, D. (2008) jModelTest: phylogenetic model averaging. Molecular biology
and evolution 25: 1253-1256
Primavera, J.H. and Quinitio, E.T. (2000) Runt-deformity syndrome in cultured
giant tiger prawn Penaeus monodon. Journal of Crustacean Biology 20: 796-
802
Puthawibool, T., Senapin, S., Kiatpathomchai, W. and Flegel, T.W. (2009)
Detection of shrimp infectious myonecrosis virus by reverse transcription
loop-mediated isothermal amplification combined with a lateral flow
dipstick. Journal of virological methods 156: 27-31
Rai, P., Pradeep, B. and Karunasagar, I. (2009) Detection of viruses in Penaeus
monodon from India showing signs of slow growth syndrome. Aquaculture
289: 231-235
Rai, P., Safeena, M.P., Karunasagar, I. and Karunasagar, I. (2011) Complete nucleic
acid sequence of Penaeus stylirostris densovirus (PstDNV) from India. Virus
Research 158: 37-45
Rai, P., Safeena, M.P., Krabsetsve, K., La Fauce, K., Owens, L. and Karunasagar, I.
(2012) Genomics, Molecular Epidemiology and Diagnostics of Infectious
hypodermal and hematopoietic necrosis virus. Indian Journal of Virology 23:
203-214
Rambaut, A. and Drummond, A.J. (2007) Tracer v1. 4. Available from
http://beast.bio. ed.ac.uk/Tracer.
Robles-Sikisaka, R., Bohonak, A.J., McClenaghan Jr, L.R. and Dhar, A.K. (2010)
Genetic signature of rapid IHHNV (Infectious hypodermal and
hematopoietic necrosis virus) expansion in wild Penaeus shrimp populations.
PloS one 5: e11799
88
Robles-Sikisaka, R., Hasson, K.W., Garcia, D.K., Brovont, K.E., Cleveland, K.D.,
Klimpel, K.R. and Dhar, A.K. (2002) Genetic variation and
immunohistochemical differences among geographic isolates of Taura
syndrome virus of penaeid shrimp. Journal of general virology 83: 3123-
3130
Rusaini, L.F., Kathy A., Elliman, J., Bowater, R.O. and Owens, L. (2013)
Endogenous Brevidensovirus-like elements in Cherax quadricarinatus:
Friend or foe? Aquaculture 396: 136-145
Saksmerprome, V., Jitrakorn, S., Chayaburakul, K., Laiphrom, S., Boonsua, K. and
Flegel, T.W. (2011) Additional random, single to multiple genome fragments
of Penaeus stylirostris densovirus in the giant tiger shrimp genome have
implications for viral disease diagnosis. Virus Research 160: 180-190
Saksmerprome, V., Puiprom, O., Noonin, C. and Flegel, T.W. (2010) Detection of
infectious hypodermal and haematopoietic necrosis virus (IHHNV) in
farmed Australian Penaeus monodon by PCR analysis and DNA sequencing.
Aquaculture 298: 190-193
Scholtissek, C. (1995) Molecular evolution of influenza viruses. Virus genes 11:
209-215
Shackelton, L.A., Hoelzer, K., Parrish, C.R. and Holmes, E.C. (2007) Comparative
analysis reveals frequent recombination in the parvoviruses. Journal of
general virology 88: 3294-3301
Shackelton, L.A. and Holmes, E.C. (2006) Phylogenetic evidence for the rapid
evolution of human B19 erythrovirus. Journal of virology 80: 3666-3669
Shackelton, L.A., Parrish, C.R., Truyen, U. and Holmes, E.C. (2005) High rate of
viral evolution associated with the emergence of carnivore parvovirus.
Proceedings of the National Academy of Sciences of the United States of
America 102: 379-384
Shibata, T., Cunningham, R.P., DasGupta, C. and Radding, C.M. (1979)
Homologous pairing in genetic recombination: complexes of recA protein
and DNA. Proceedings of the National Academy of Sciences 76: 5100-5104
Shike, H., Dhar, A.K., Burns, J.C., Shimizu, C., Jousset, F.X., Klimpel, K.R. and
Bergoin, M. (2000) Infectious hypodermal and hematopoietic necrosis virus
of shrimp is related to mosquito brevidensoviruses. Virology 277: 167-177
Staginnus, C. and Richert-Pöggeler, K.R. (2006) Endogenous pararetroviruses: two-
faced travelers in the plant genome. Trends in plant science 11: 485-491
Strimmer, K. and Pybus, O.G. (2001) Exploring the demographic history of DNA
sequences using the generalized skyline plot. Molecular biology and
evolution 18: 2298-2305
89
Talavera, G. and Castresana, J. (2007) Improvement of phylogenies after removing
divergent and ambiguously aligned blocks from protein sequence alignments.
Systematic biology 56: 564-577
Tang, K. and Lightner, D.V. (2001) Detection and quantification of infectious
hypodermal and hematopoietic necrosis virus in penaeid shrimp by real-time
PCR. Diseases of aquatic organisms 44: 79-85
Tang, K. and Lightner, D.V. (2002a) Low sequence variation among isolates of
infectious hypodermal and hematopoietic necrosis virus (IHHNV)
originating from Hawaii and the Americas. Diseases of aquatic organisms
49: 93-97
Tang, K.F. and Lightner, D.V. (2002b) Low sequence variation among isolates of
infectious hypodermal and hematopoietic necrosis virus (IHHNV)
originating from Hawaii and the Americas. Diseases of aquatic organisms
49: 93-97
Tang, K.F., Poulos, B.T., Wang, J., Redman, R.M., Shih, H.-H. and Lightner, D.V.
(2003) Geographic variations among infectious hypodermal and
hematopoietic necrosis virus (IHHNV) isolates and characteristics of their
infection. Diseases of aquatic organisms 53: 91-99
Tang, K.F.J., Durand, S.V., White, B.L., Redman, R.M., Pantoja, C.R. and Lightner,
D.V. (2000) Postlarvae and juveniles of a selected line of Penaeus stylirostris
are resistant to infectious hypodermal and hematopoietic necrosis virus
infection. Aquaculture 190: 203-210
Tang, K.F.J. and Lightner, D.V. (2006) Infectious hypodermal and hematopoietic
necrosis virus (IHHNV)-related sequences in the genome of the black tiger
prawn Penaeus monodon from Africa and Australia. Virus Research 118:
185-191
Tang, K.F.J., Navarro, S.A. and Lightner, D.V. (2007) PCR assay for discriminating
between infectious hypodermal and hematopoietic necrosis virus (IHHNV)
and virus-related sequences in the genome of Penaeus monodon. Diseases of
aquatic organisms 74: 165
Unzueta-Bustamante, M.L., Holtschmit, K., Olivas-Valdez, J., Martínez-Córdova,
L., Porchas-Cornejo, M. and Lizárraga-Partida, M. (1998) Infectious
Hypodermal And Hematopoietic Necrosis Virus (Ihhnv) In Wild Parent
Stocks Of Blue Shrimp, Penaeus Styfirostris (Stimpson), In Guaymas Bay,
Sonora, Mexico. Ciencias Marinas 24: 491-498
Vega-Heredia, S., Mendoza-Cano, F. and Sánchez-Paz, A. (2012) The Infectious
Hypodermal and Haematopoietic Necrosis Virus: A Brief Review of What
We Do and Do Not Know. Transboundary and Emerging Diseases 59: 95-
105
Xiang, J. (2001) Recent advance of research and development on marine
biotechnology in China, 6-8. In Postgraduate conference on marine biology and
biotechnology, June, pp. 6-8
90
Yang, B., Song, X.L., Huang, J., Shi, C.Y. and Liu, L. (2007) Evidence of existence
of infectious hypodermal and hematopoietic necrosis virus in penaeid shrimp
cultured in China. Veterinary microbiology 120: 63-70
Yonesaki, T., Ryo, Y., Minagawa, T. and Takahashi, H. (1985) Purification and
some of the functions of the products of bacteriophage T4 recombination
genes, uvs X and uvs Y. European Journal of Biochemistry 148: 127-134
Zabbey, N., Erondu, E. and Hart, A. (2010) Nigeria and the prospect of shrimp
farming: critical issues. Livestock Res Rural Dev. 22
Zhang, C., Yuan, J. and Shi, Z. (2007) Molecular epidemiological investigation of
infectious hypodermal and hematopoietic necrosis virus and Taura syndrome
virus in Penaeus Vannamei cultured in China. Virologica Sinica 22: 380-388
Zhang, J.X. and Sun, X.Q. (1997) A preliminary study on the virus in the eggs of
Penaeus chinensis. J Oceanogr Huanghai and Bohai Seas 15: 48-51
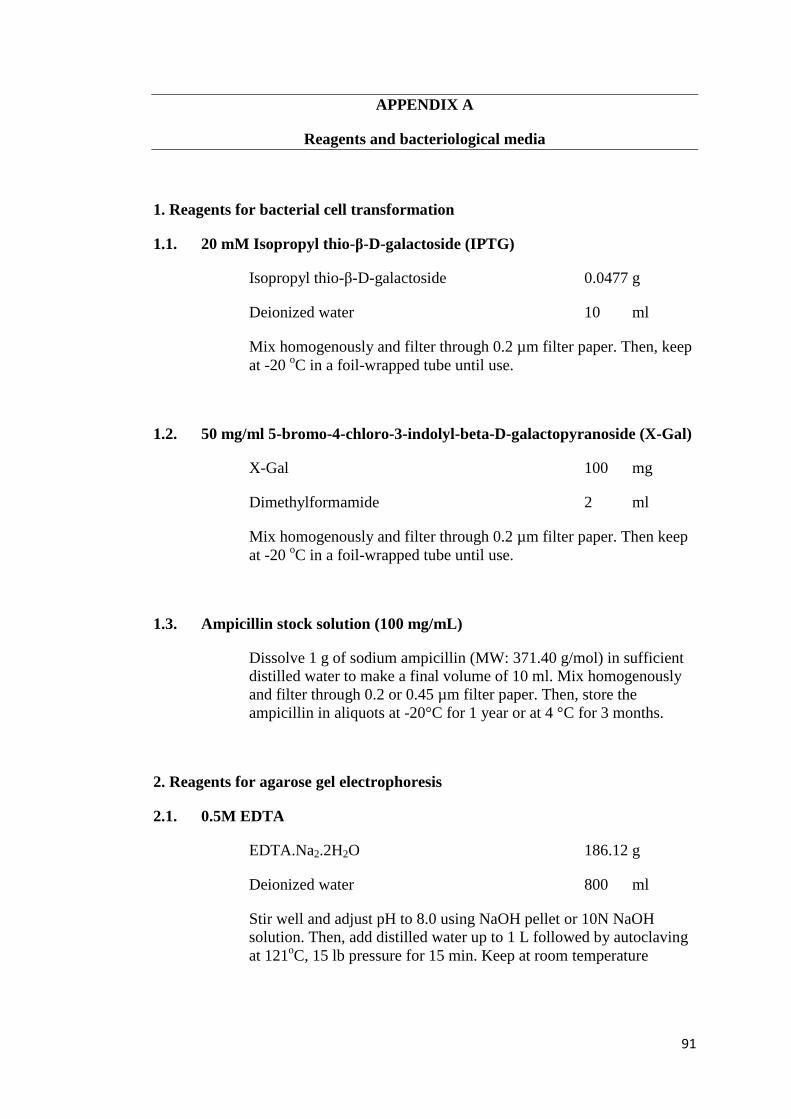
91
APPENDIX A
Reagents and bacteriological media
1. Reagents for bacterial cell transformation
1.1. 20 mM Isopropyl thio-β-D-galactoside (IPTG)
Isopropyl thio-β-D-galactoside 0.0477 g
Deionized water 10 ml
Mix homogenously and filter through 0.2 µm filter paper. Then, keep
at -20 oC in a foil-wrapped tube until use.
1.2. 50 mg/ml 5-bromo-4-chloro-3-indolyl-beta-D-galactopyranoside (X-Gal)
X-Gal 100 mg
Dimethylformamide 2 ml
Mix homogenously and filter through 0.2 µm filter paper. Then keep
at -20 oC in a foil-wrapped tube until use.
1.3. Ampicillin stock solution (100 mg/mL)
Dissolve 1 g of sodium ampicillin (MW: 371.40 g/mol) in sufficient
distilled water to make a final volume of 10 ml. Mix homogenously
and filter through 0.2 or 0.45 µm filter paper. Then, store the
ampicillin in aliquots at -20°C for 1 year or at 4 °C for 3 months.
2. Reagents for agarose gel electrophoresis
2.1. 0.5M EDTA
EDTA.Na2.2H2O 186.12 g
Deionized water 800 ml
Stir well and adjust pH to 8.0 using NaOH pellet or 10N NaOH
solution. Then, add distilled water up to 1 L followed by autoclaving
at 121oC, 15 lb pressure for 15 min. Keep at room temperature
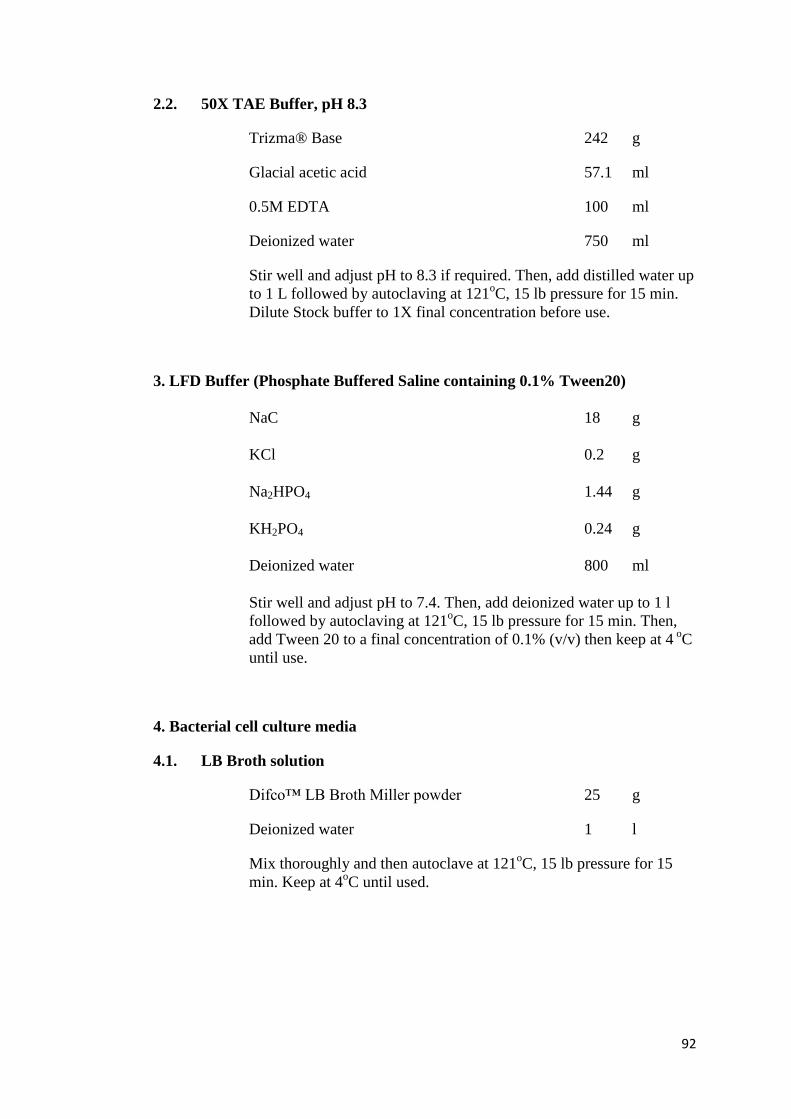
92
2.2. 50X TAE Buffer, pH 8.3
Trizma® Base 242 g
Glacial acetic acid 57.1 ml
0.5M EDTA 100 ml
Deionized water 750 ml
Stir well and adjust pH to 8.3 if required. Then, add distilled water up
to 1 L followed by autoclaving at 121oC, 15 lb pressure for 15 min.
Dilute Stock buffer to 1X final concentration before use.
3. LFD Buffer (Phosphate Buffered Saline containing 0.1% Tween20)
NaC 18 g
KCl 0.2 g
Na2HPO4 1.44 g
KH2PO4 0.24 g
Deionized water 800 ml
Stir well and adjust pH to 7.4. Then, add deionized water up to 1 l
followed by autoclaving at 121oC, 15 lb pressure for 15 min. Then,
add Tween 20 to a final concentration of 0.1% (v/v) then keep at 4 o
C
until use.
4. Bacterial cell culture media
4.1. LB Broth solution
Difco™ LB Broth Miller powder 25 g
Deionized water 1 l
Mix thoroughly and then autoclave at 121oC, 15 lb pressure for 15
min. Keep at 4oC until used.
93
4.2 LB agar plate
Difco™ LB Broth Miller powder 25 g
Difco™ Solidifying agent 15 g
Deionized water 1 l
Mix thoroughly and then autoclave at 121oC, 15 lb pressure for 15
min. Pour plates then keep at 4oC until use.
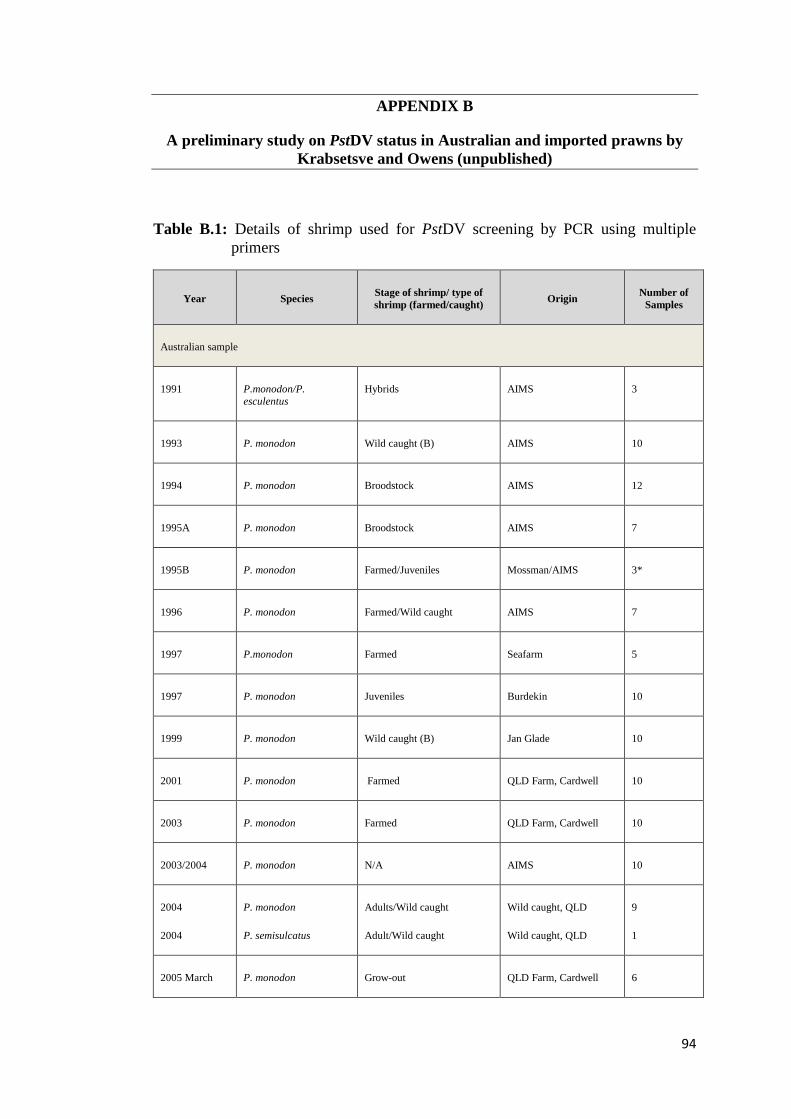
94
APPENDIX B
A preliminary study on PstDV status in Australian and imported prawns by
Krabsetsve and Owens (unpublished)
Table B.1: Details of shrimp used for PstDV screening by PCR using multiple
primers
Year Species Stage of shrimp/ type of
shrimp (farmed/caught) Origin
Number of
Samples
Australian sample
1991 P.monodon/P.
esculentus
Hybrids AIMS 3
1993 P. monodon Wild caught (B) AIMS 10
1994 P. monodon Broodstock AIMS 12
1995A P. monodon Broodstock AIMS 7
1995B P. monodon Farmed/Juveniles Mossman/AIMS 3*
1996 P. monodon Farmed/Wild caught AIMS 7
1997 P.monodon Farmed Seafarm 5
1997 P. monodon Juveniles Burdekin 10
1999 P. monodon Wild caught (B) Jan Glade 10
2001 P. monodon Farmed QLD Farm, Cardwell 10
2003 P. monodon Farmed QLD Farm, Cardwell 10
2003/2004 P. monodon N/A AIMS 10
2004
2004
P. monodon
P. semisulcatus
Adults/Wild caught
Adult/Wild caught
Wild caught, QLD
Wild caught, QLD
9
1
2005 March P. monodon Grow-out QLD Farm, Cardwell 6
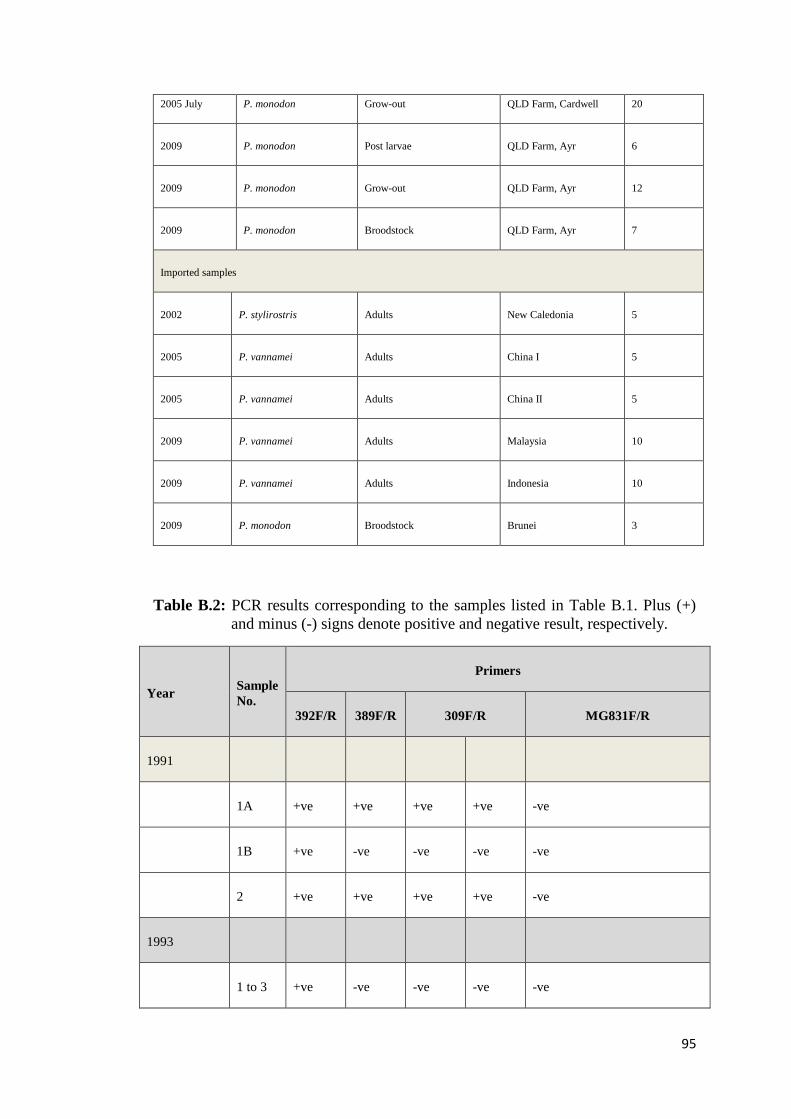
95
2005 July P. monodon Grow-out QLD Farm, Cardwell 20
2009 P. monodon Post larvae QLD Farm, Ayr 6
2009 P. monodon Grow-out QLD Farm, Ayr 12
2009 P. monodon Broodstock QLD Farm, Ayr 7
Imported samples
2002 P. stylirostris Adults New Caledonia 5
2005 P. vannamei Adults China I 5
2005 P. vannamei Adults China II 5
2009 P. vannamei Adults Malaysia 10
2009 P. vannamei Adults Indonesia 10
2009 P. monodon Broodstock Brunei 3
Table B.2: PCR results corresponding to the samples listed in Table B.1. Plus (+)
and minus (-) signs denote positive and negative result, respectively.
Year Sample
No.
Primers
392F/R 389F/R 309F/R MG831F/R
1991
1A +ve +ve +ve +ve -ve
1B +ve -ve -ve -ve -ve
2 +ve +ve +ve +ve -ve
1993
1 to 3 +ve -ve -ve -ve -ve
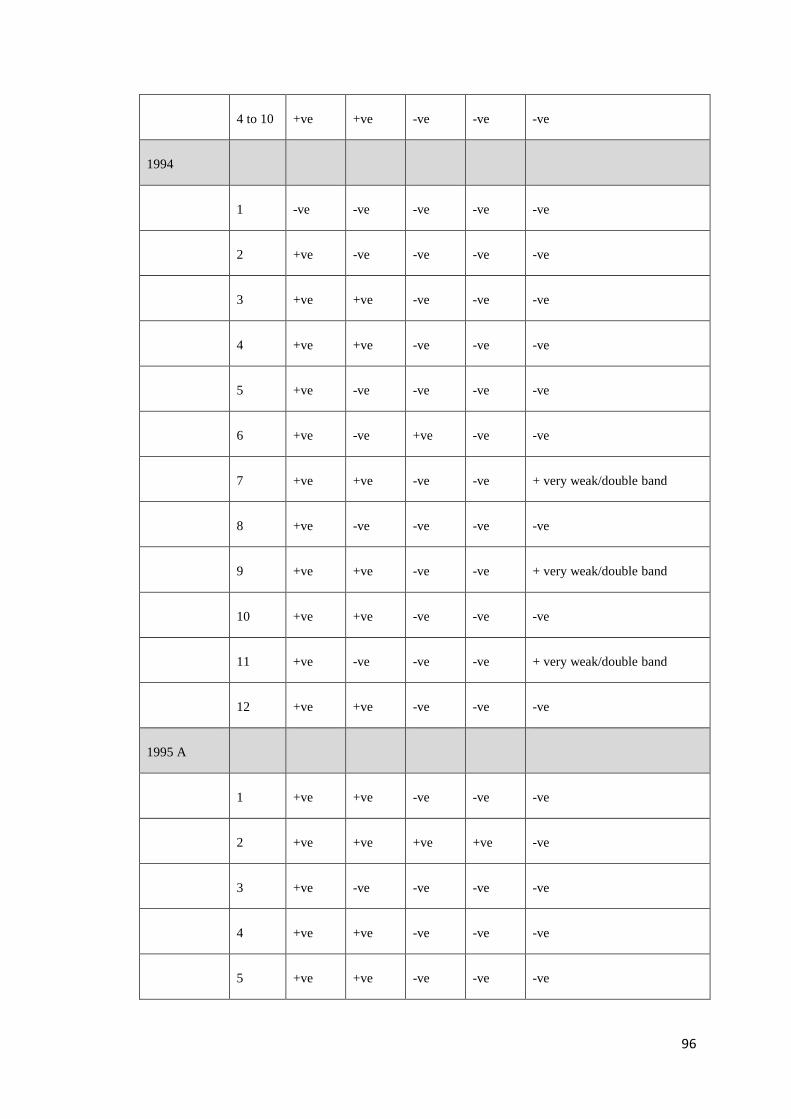
96
4 to 10 +ve +ve -ve -ve -ve
1994
1 -ve -ve -ve -ve -ve
2 +ve -ve -ve -ve -ve
3 +ve +ve -ve -ve -ve
4 +ve +ve -ve -ve -ve
5 +ve -ve -ve -ve -ve
6 +ve -ve +ve -ve -ve
7 +ve +ve -ve -ve + very weak/double band
8 +ve -ve -ve -ve -ve
9 +ve +ve -ve -ve + very weak/double band
10 +ve +ve -ve -ve -ve
11 +ve -ve -ve -ve + very weak/double band
12 +ve +ve -ve -ve -ve
1995 A
1 +ve +ve -ve -ve -ve
2 +ve +ve +ve +ve -ve
3 +ve -ve -ve -ve -ve
4 +ve +ve -ve -ve -ve
5 +ve +ve -ve -ve -ve
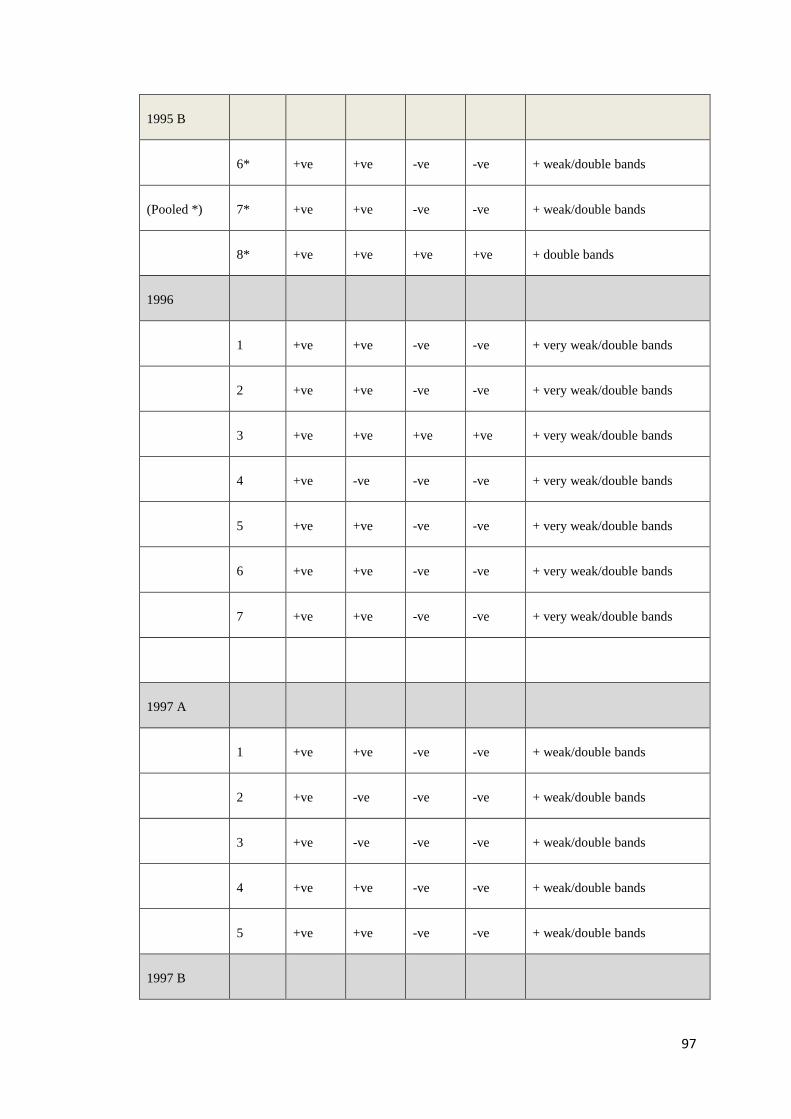
97
1995 B
6* +ve +ve -ve -ve + weak/double bands
(Pooled *) 7* +ve +ve -ve -ve + weak/double bands
8* +ve +ve +ve +ve + double bands
1996
1 +ve +ve -ve -ve + very weak/double bands
2 +ve +ve -ve -ve + very weak/double bands
3 +ve +ve +ve +ve + very weak/double bands
4 +ve -ve -ve -ve + very weak/double bands
5 +ve +ve -ve -ve + very weak/double bands
6 +ve +ve -ve -ve + very weak/double bands
7 +ve +ve -ve -ve + very weak/double bands
1997 A
1 +ve +ve -ve -ve + weak/double bands
2 +ve -ve -ve -ve + weak/double bands
3 +ve -ve -ve -ve + weak/double bands
4 +ve +ve -ve -ve + weak/double bands
5 +ve +ve -ve -ve + weak/double bands
1997 B
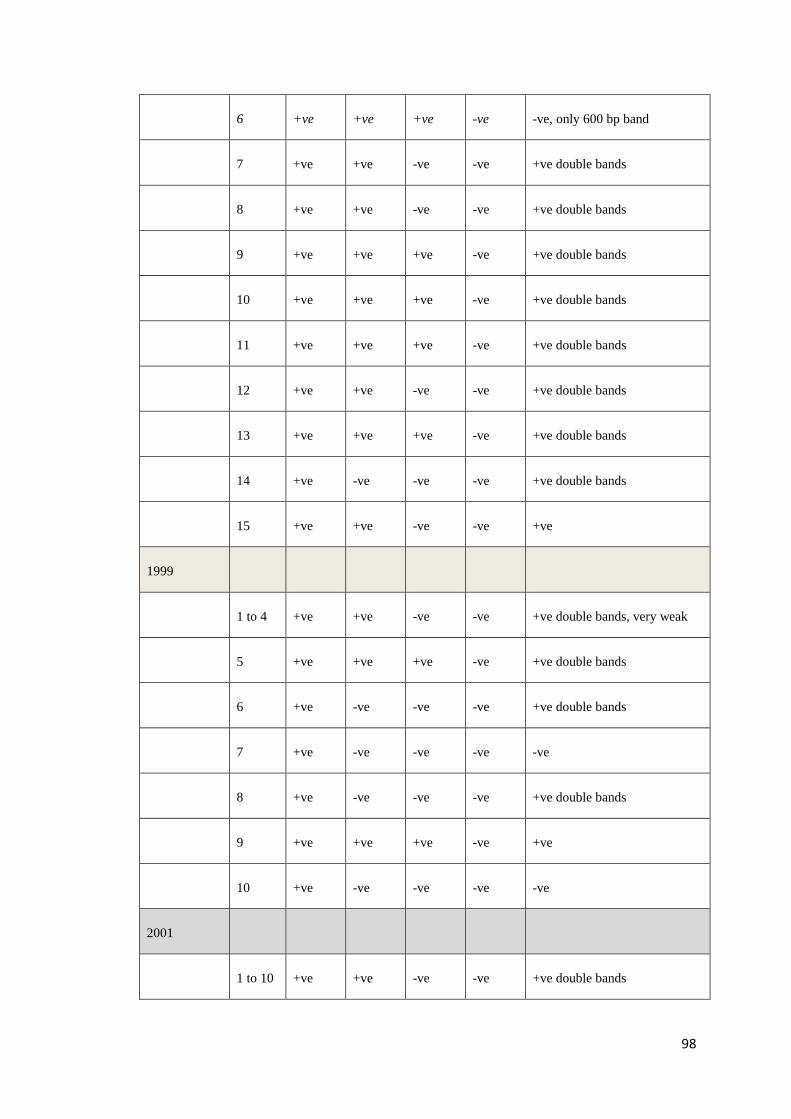
98
6 +ve +ve +ve -ve -ve, only 600 bp band
7 +ve +ve -ve -ve +ve double bands
8 +ve +ve -ve -ve +ve double bands
9 +ve +ve +ve -ve +ve double bands
10 +ve +ve +ve -ve +ve double bands
11 +ve +ve +ve -ve +ve double bands
12 +ve +ve -ve -ve +ve double bands
13 +ve +ve +ve -ve +ve double bands
14 +ve -ve -ve -ve +ve double bands
15 +ve +ve -ve -ve +ve
1999
1 to 4 +ve +ve -ve -ve +ve double bands, very weak
5 +ve +ve +ve -ve +ve double bands
6 +ve -ve -ve -ve +ve double bands
7 +ve -ve -ve -ve -ve
8 +ve -ve -ve -ve +ve double bands
9 +ve +ve +ve -ve +ve
10 +ve -ve -ve -ve -ve
2001
1 to 10 +ve +ve -ve -ve +ve double bands
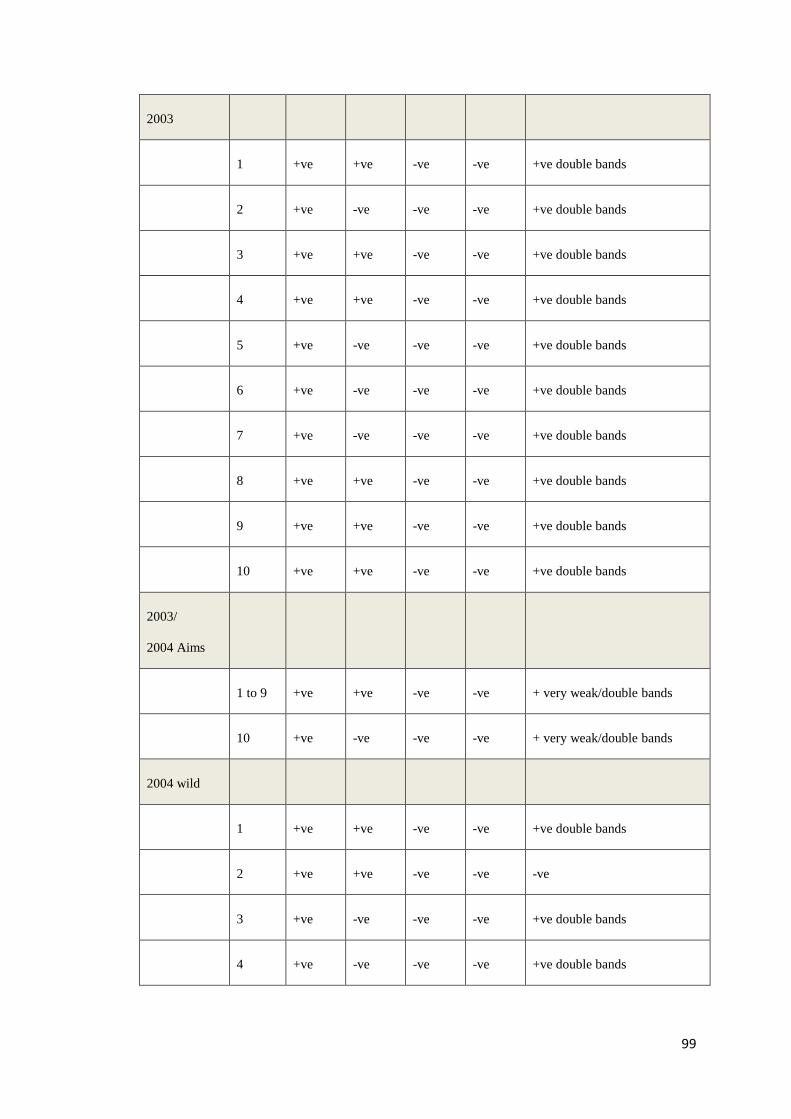
99
2003
1 +ve +ve -ve -ve +ve double bands
2 +ve -ve -ve -ve +ve double bands
3 +ve +ve -ve -ve +ve double bands
4 +ve +ve -ve -ve +ve double bands
5 +ve -ve -ve -ve +ve double bands
6 +ve -ve -ve -ve +ve double bands
7 +ve -ve -ve -ve +ve double bands
8 +ve +ve -ve -ve +ve double bands
9 +ve +ve -ve -ve +ve double bands
10 +ve +ve -ve -ve +ve double bands
2003/
2004 Aims
1 to 9 +ve +ve -ve -ve + very weak/double bands
10 +ve -ve -ve -ve + very weak/double bands
2004 wild
1 +ve +ve -ve -ve +ve double bands
2 +ve +ve -ve -ve -ve
3 +ve -ve -ve -ve +ve double bands
4 +ve -ve -ve -ve +ve double bands
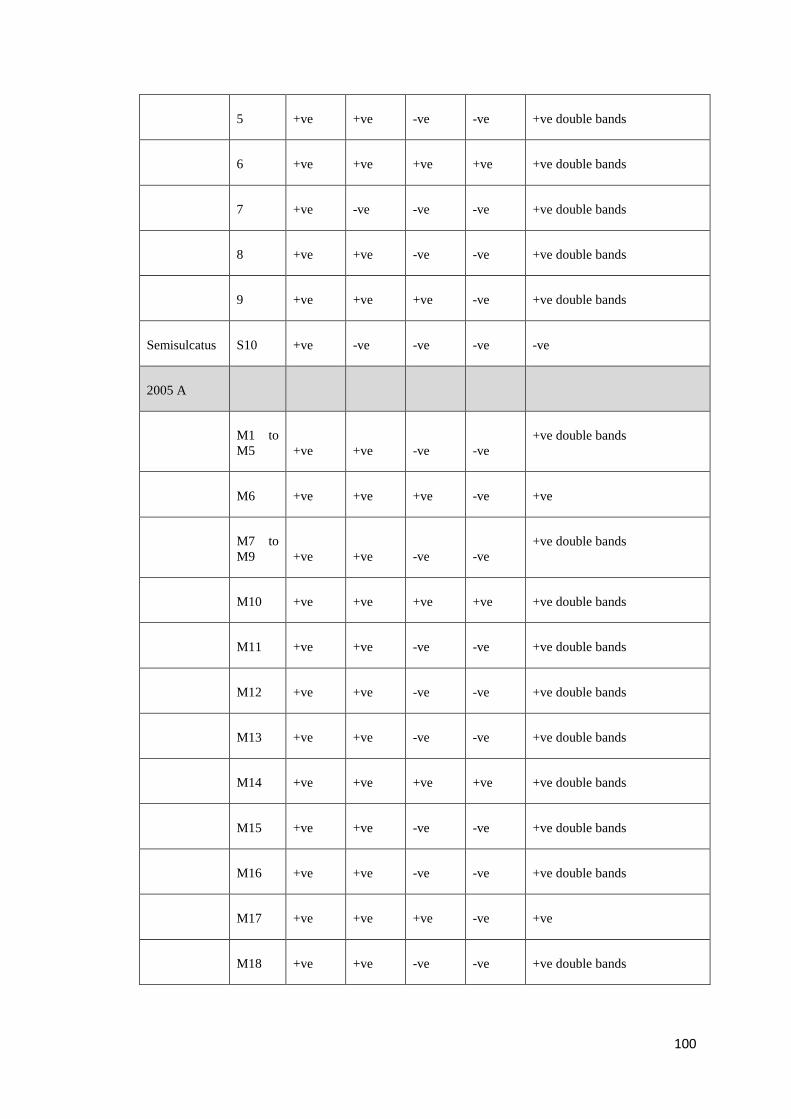
100
5 +ve +ve -ve -ve +ve double bands
6 +ve +ve +ve +ve +ve double bands
7 +ve -ve -ve -ve +ve double bands
8 +ve +ve -ve -ve +ve double bands
9 +ve +ve +ve -ve +ve double bands
Semisulcatus S10 +ve -ve -ve -ve -ve
2005 A
M1 to
M5 +ve +ve -ve -ve
+ve double bands
M6 +ve +ve +ve -ve +ve
M7 to
M9 +ve +ve -ve -ve
+ve double bands
M10 +ve +ve +ve +ve +ve double bands
M11 +ve +ve -ve -ve +ve double bands
M12 +ve +ve -ve -ve +ve double bands
M13 +ve +ve -ve -ve +ve double bands
M14 +ve +ve +ve +ve +ve double bands
M15 +ve +ve -ve -ve +ve double bands
M16 +ve +ve -ve -ve +ve double bands
M17 +ve +ve +ve -ve +ve
M18 +ve +ve -ve -ve +ve double bands
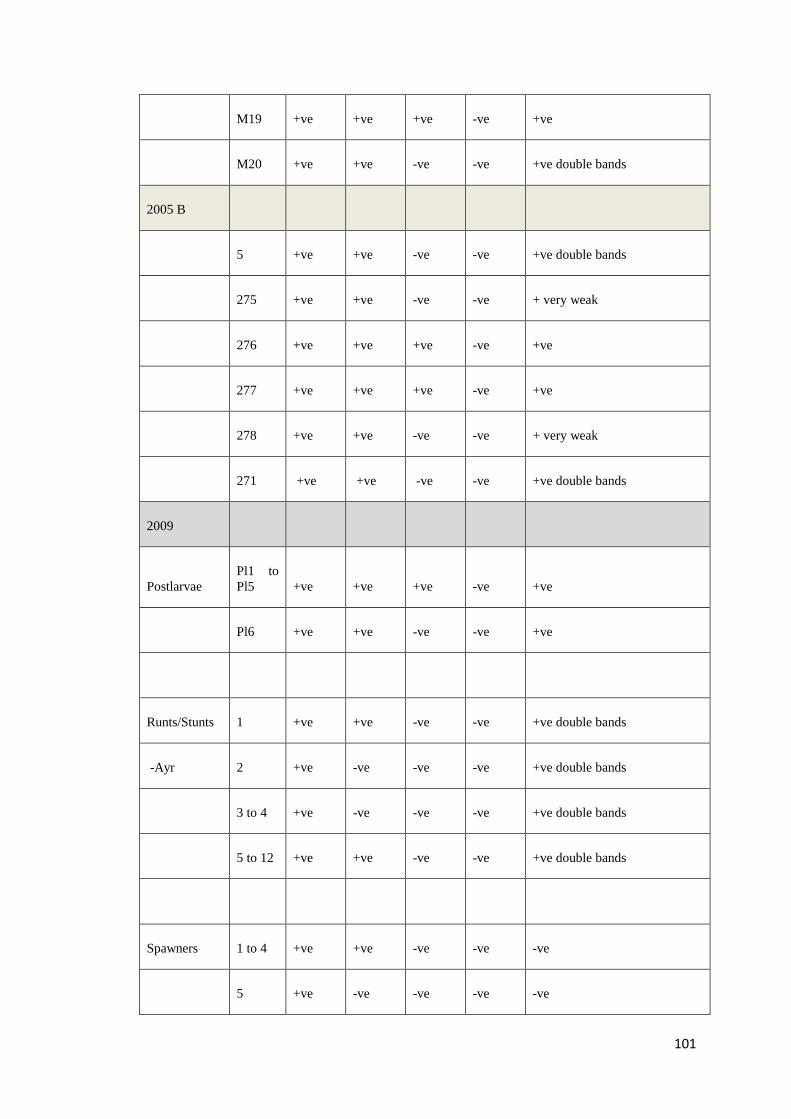
101
M19 +ve +ve +ve -ve +ve
M20 +ve +ve -ve -ve +ve double bands
2005 B
5 +ve +ve -ve -ve +ve double bands
275 +ve +ve -ve -ve + very weak
276 +ve +ve +ve -ve +ve
277 +ve +ve +ve -ve +ve
278 +ve +ve -ve -ve + very weak
271 +ve +ve -ve -ve +ve double bands
2009
Postlarvae
Pl1 to
Pl5 +ve +ve +ve -ve +ve
Pl6 +ve +ve -ve -ve +ve
Runts/Stunts 1 +ve +ve -ve -ve +ve double bands
-Ayr 2 +ve -ve -ve -ve +ve double bands
3 to 4 +ve -ve -ve -ve +ve double bands
5 to 12 +ve +ve -ve -ve +ve double bands
Spawners 1 to 4 +ve +ve -ve -ve -ve
5 +ve -ve -ve -ve -ve
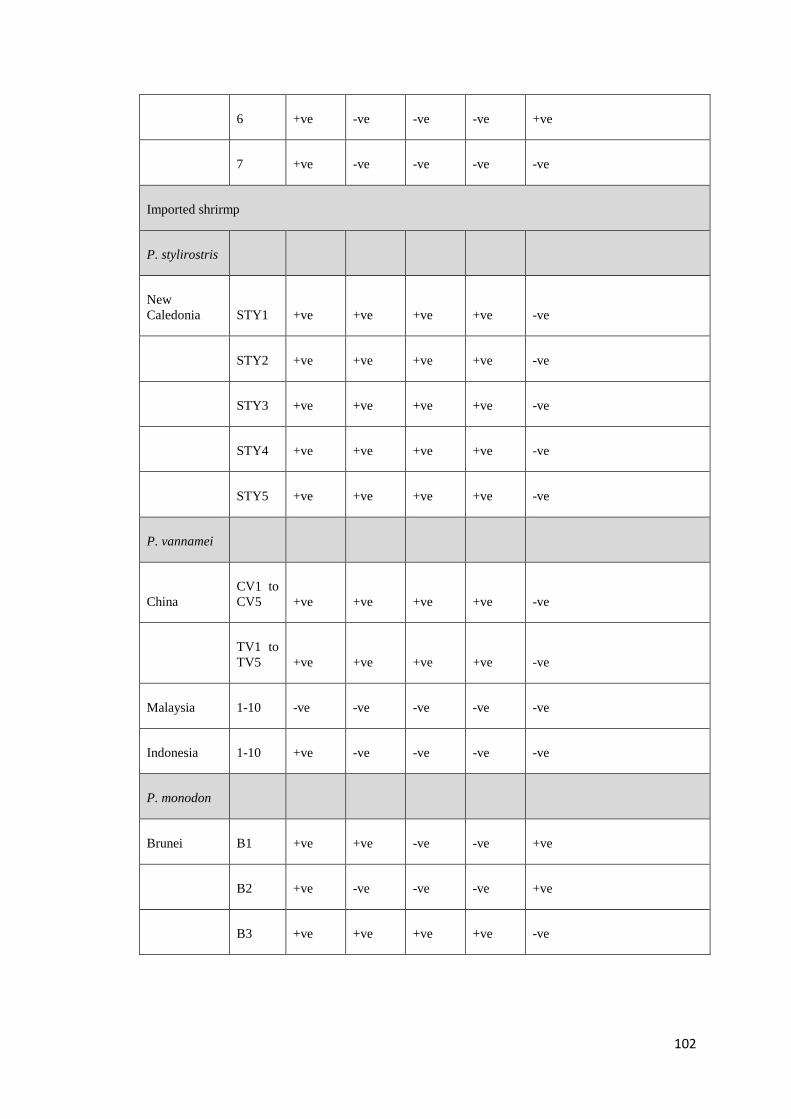
102
6 +ve -ve -ve -ve +ve
7 +ve -ve -ve -ve -ve
Imported shrirmp
P. stylirostris
New
Caledonia STY1 +ve +ve +ve +ve -ve
STY2 +ve +ve +ve +ve -ve
STY3 +ve +ve +ve +ve -ve
STY4 +ve +ve +ve +ve -ve
STY5 +ve +ve +ve +ve -ve
P. vannamei
China
CV1 to
CV5 +ve +ve +ve +ve -ve
TV1 to
TV5 +ve +ve +ve +ve -ve
Malaysia 1-10 -ve -ve -ve -ve -ve
Indonesia 1-10 +ve -ve -ve -ve -ve
P. monodon
Brunei B1 +ve +ve -ve -ve +ve
B2 +ve -ve -ve -ve +ve
B3 +ve +ve +ve +ve -ve
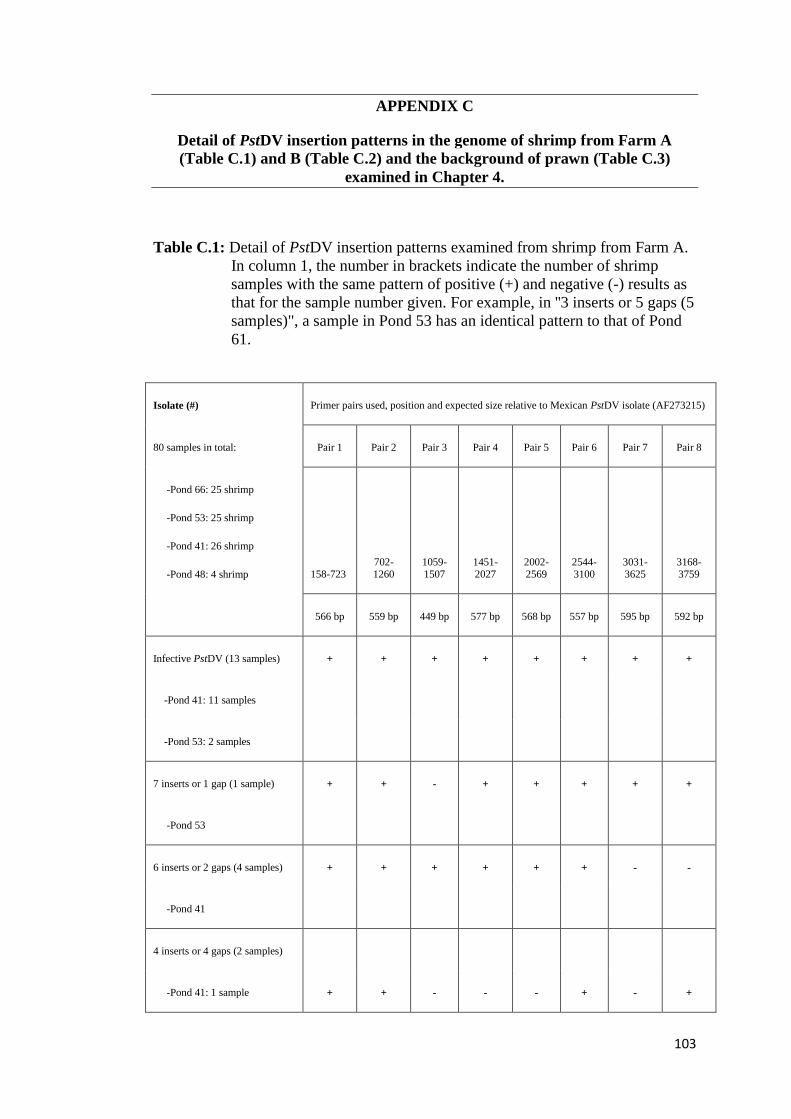
103
APPENDIX C
Detail of PstDV insertion patterns in the genome of shrimp from Farm A
(Table C.1) and B (Table C.2) and the background of prawn (Table C.3)
examined in Chapter 4.
Table C.1: Detail of PstDV insertion patterns examined from shrimp from Farm A.
In column 1, the number in brackets indicate the number of shrimp
samples with the same pattern of positive (+) and negative (-) results as
that for the sample number given. For example, in ''3 inserts or 5 gaps (5
samples)", a sample in Pond 53 has an identical pattern to that of Pond
61.
Isolate (#) Primer pairs used, position and expected size relative to Mexican PstDV isolate (AF273215)
80 samples in total: Pair 1 Pair 2 Pair 3 Pair 4 Pair 5 Pair 6 Pair 7 Pair 8
-Pond 66: 25 shrimp
-Pond 53: 25 shrimp
-Pond 41: 26 shrimp
-Pond 48: 4 shrimp 158-723
702-
1260
1059-
1507
1451-
2027
2002-
2569
2544-
3100
3031-
3625
3168-
3759
566 bp 559 bp 449 bp 577 bp 568 bp 557 bp 595 bp 592 bp
Infective PstDV (13 samples) + + + + + + + +
-Pond 41: 11 samples
-Pond 53: 2 samples
7 inserts or 1 gap (1 sample) + + - + + + + +
-Pond 53
6 inserts or 2 gaps (4 samples) + + + + + + - -
-Pond 41
4 inserts or 4 gaps (2 samples)
-Pond 41: 1 sample + + - - - + - +
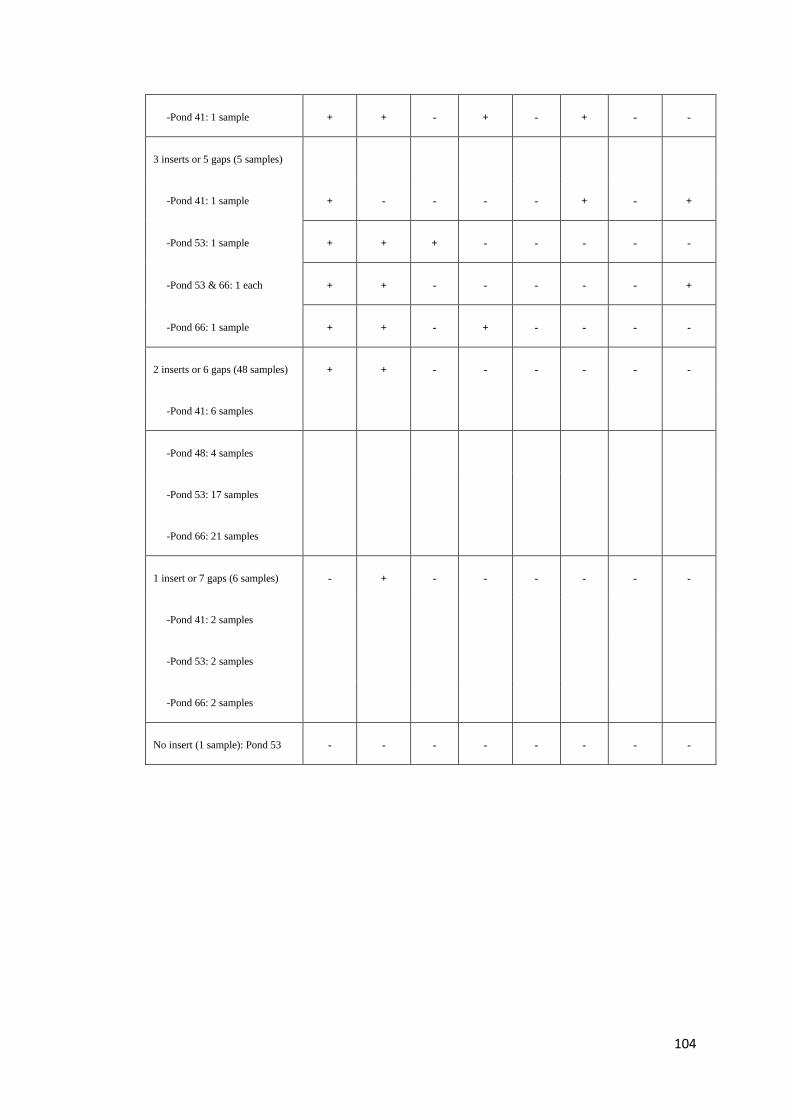
104
-Pond 41: 1 sample + + - + - + - -
3 inserts or 5 gaps (5 samples)
-Pond 41: 1 sample + - - - - + - +
-Pond 53: 1 sample + + + - - - - -
-Pond 53 & 66: 1 each + + - - - - - +
-Pond 66: 1 sample + + - + - - - -
2 inserts or 6 gaps (48 samples) + + - - - - - -
-Pond 41: 6 samples
-Pond 48: 4 samples
-Pond 53: 17 samples
-Pond 66: 21 samples
1 insert or 7 gaps (6 samples) - + - - - - - -
-Pond 41: 2 samples
-Pond 53: 2 samples
-Pond 66: 2 samples
No insert (1 sample): Pond 53 - - - - - - - -
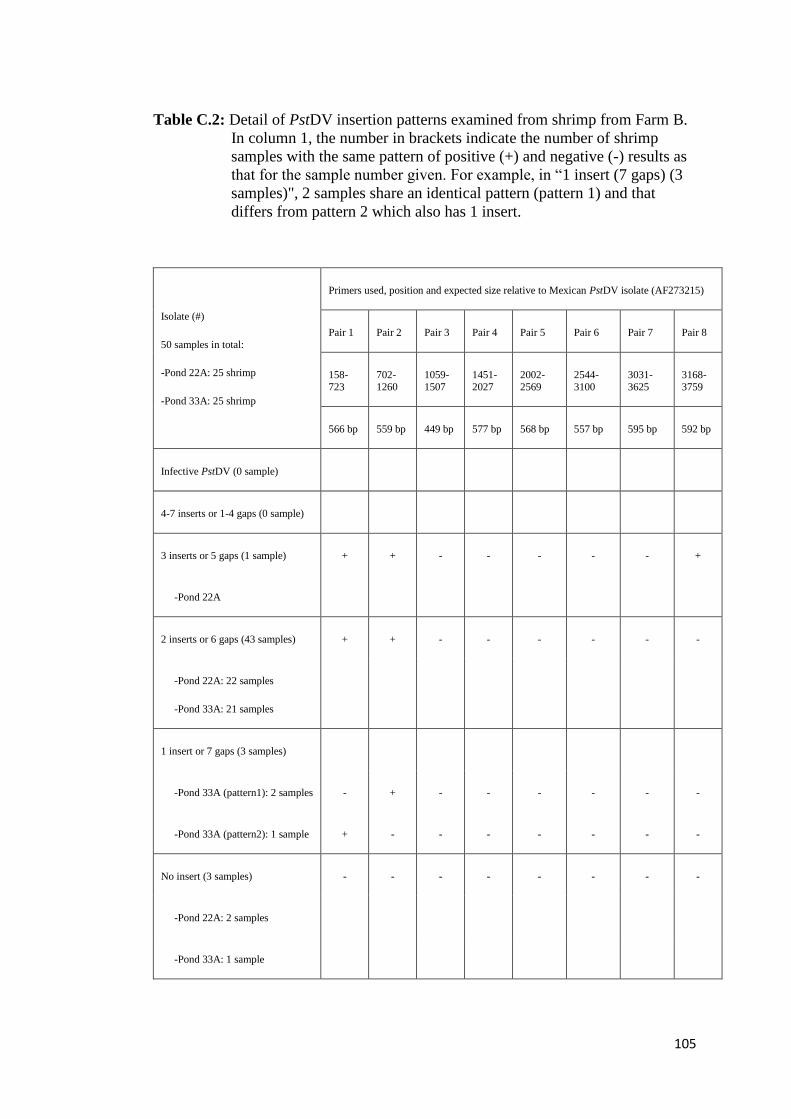
105
Table C.2: Detail of PstDV insertion patterns examined from shrimp from Farm B.
In column 1, the number in brackets indicate the number of shrimp
samples with the same pattern of positive (+) and negative (-) results as
that for the sample number given. For example, in “1 insert (7 gaps) (3
samples)", 2 samples share an identical pattern (pattern 1) and that
differs from pattern 2 which also has 1 insert.
Isolate (#)
50 samples in total:
-Pond 22A: 25 shrimp
-Pond 33A: 25 shrimp
Primers used, position and expected size relative to Mexican PstDV isolate (AF273215)
Pair 1 Pair 2 Pair 3 Pair 4 Pair 5 Pair 6 Pair 7 Pair 8
158-723
702-1260
1059-1507
1451-2027
2002-2569
2544-3100
3031-3625
3168-3759
566 bp 559 bp 449 bp 577 bp 568 bp 557 bp 595 bp 592 bp
Infective PstDV (0 sample)
4-7 inserts or 1-4 gaps (0 sample)
3 inserts or 5 gaps (1 sample) + + - - - - - +
-Pond 22A
2 inserts or 6 gaps (43 samples) + + - - - - - -
-Pond 22A: 22 samples
-Pond 33A: 21 samples
1 insert or 7 gaps (3 samples)
-Pond 33A (pattern1): 2 samples - + - - - - - -
-Pond 33A (pattern2): 1 sample + - - - - - - -
No insert (3 samples) - - - - - - - -
-Pond 22A: 2 samples
-Pond 33A: 1 sample
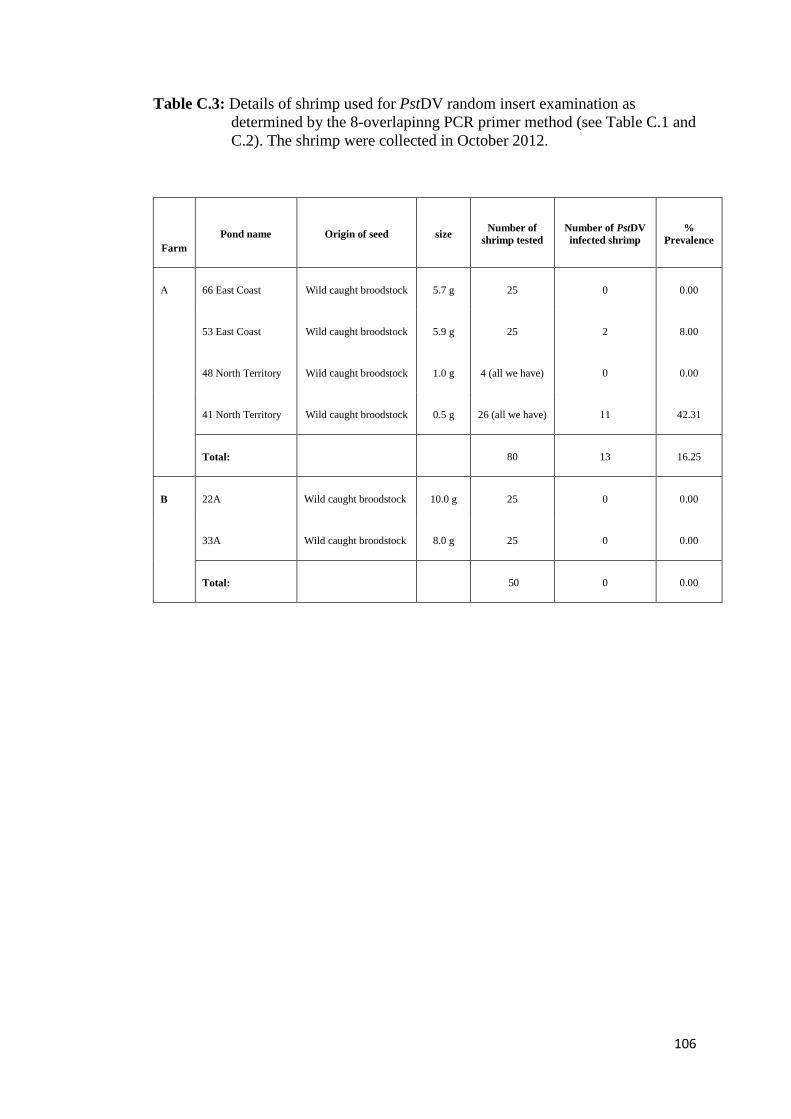
106
Table C.3: Details of shrimp used for PstDV random insert examination as
determined by the 8-overlapinng PCR primer method (see Table C.1 and
C.2). The shrimp were collected in October 2012.
Farm
Pond name Origin of seed size Number of
shrimp tested
Number of PstDV
infected shrimp
%
Prevalence
A 66 East Coast Wild caught broodstock 5.7 g 25 0 0.00
53 East Coast Wild caught broodstock 5.9 g 25 2 8.00
48 North Territory Wild caught broodstock 1.0 g 4 (all we have) 0 0.00
41 North Territory Wild caught broodstock 0.5 g 26 (all we have) 11 42.31
Total: 80 13 16.25
B 22A Wild caught broodstock 10.0 g 25 0 0.00
33A Wild caught broodstock 8.0 g 25 0 0.00
Total: 50 0 0.00
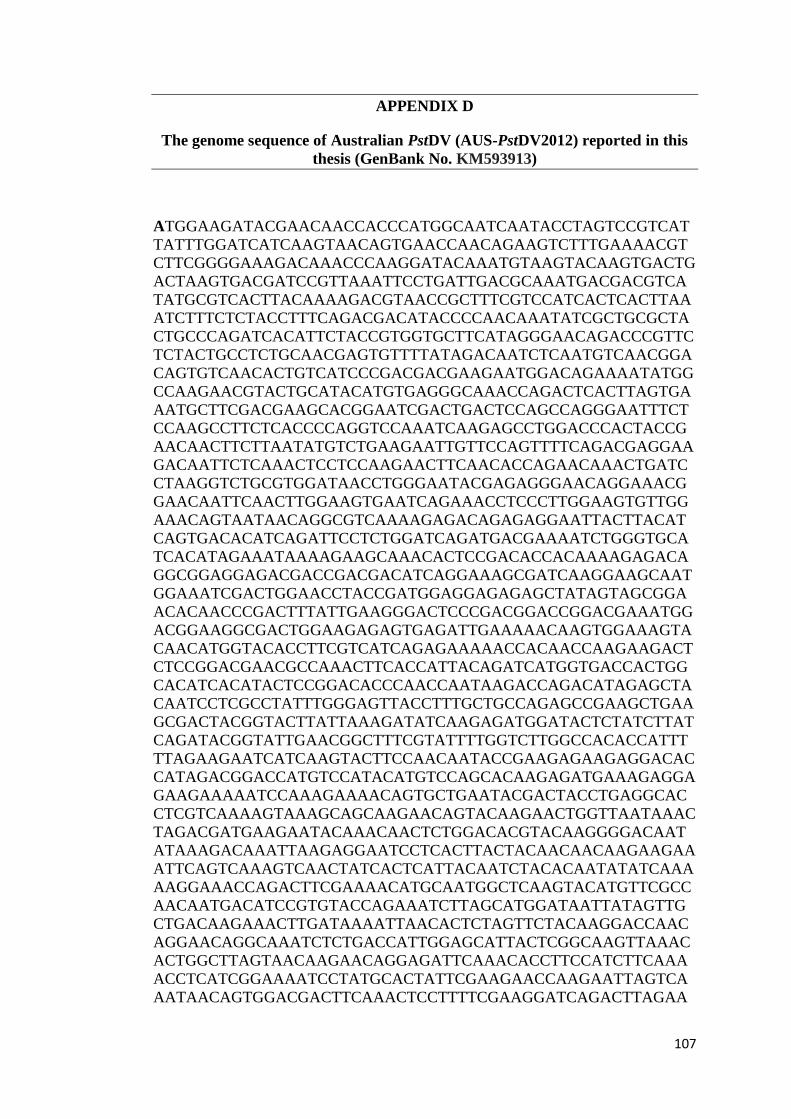
107
APPENDIX D
The genome sequence of Australian PstDV (AUS-PstDV2012) reported in this
thesis (GenBank No. KM593913)
ATGGAAGATACGAACAACCACCCATGGCAATCAATACCTAGTCCGTCAT
TATTTGGATCATCAAGTAACAGTGAACCAACAGAAGTCTTTGAAAACGT
CTTCGGGGAAAGACAAACCCAAGGATACAAATGTAAGTACAAGTGACTG
ACTAAGTGACGATCCGTTAAATTCCTGATTGACGCAAATGACGACGTCA
TATGCGTCACTTACAAAAGACGTAACCGCTTTCGTCCATCACTCACTTAA
ATCTTTCTCTACCTTTCAGACGACATACCCCAACAAATATCGCTGCGCTA
CTGCCCAGATCACATTCTACCGTGGTGCTTCATAGGGAACAGACCCGTTC
TCTACTGCCTCTGCAACGAGTGTTTTATAGACAATCTCAATGTCAACGGA
CAGTGTCAACACTGTCATCCCGACGACGAAGAATGGACAGAAAATATGG
CCAAGAACGTACTGCATACATGTGAGGGCAAACCAGACTCACTTAGTGA
AATGCTTCGACGAAGCACGGAATCGACTGACTCCAGCCAGGGAATTTCT
CCAAGCCTTCTCACCCCAGGTCCAAATCAAGAGCCTGGACCCACTACCG
AACAACTTCTTAATATGTCTGAAGAATTGTTCCAGTTTTCAGACGAGGAA
GACAATTCTCAAACTCCTCCAAGAACTTCAACACCAGAACAAACTGATC
CTAAGGTCTGCGTGGATAACCTGGGAATACGAGAGGGAACAGGAAACG
GAACAATTCAACTTGGAAGTGAATCAGAAACCTCCCTTGGAAGTGTTGG
AAACAGTAATAACAGGCGTCAAAAGAGACAGAGAGGAATTACTTACAT
CAGTGACACATCAGATTCCTCTGGATCAGATGACGAAAATCTGGGTGCA
TCACATAGAAATAAAAGAAGCAAACACTCCGACACCACAAAAGAGACA
GGCGGAGGAGACGACCGACGACATCAGGAAAGCGATCAAGGAAGCAAT
GGAAATCGACTGGAACCTACCGATGGAGGAGAGAGCTATAGTAGCGGA
ACACAACCCGACTTTATTGAAGGGACTCCCGACGGACCGGACGAAATGG
ACGGAAGGCGACTGGAAGAGAGTGAGATTGAAAAACAAGTGGAAAGTA
CAACATGGTACACCTTCGTCATCAGAGAAAAACCACAACCAAGAAGACT
CTCCGGACGAACGCCAAACTTCACCATTACAGATCATGGTGACCACTGG
CACATCACATACTCCGGACACCCAACCAATAAGACCAGACATAGAGCTA
CAATCCTCGCCTATTTGGGAGTTACCTTTGCTGCCAGAGCCGAAGCTGAA
GCGACTACGGTACTTATTAAAGATATCAAGAGATGGATACTCTATCTTAT
CAGATACGGTATTGAACGGCTTTCGTATTTTGGTCTTGGCCACACCATTT
TTAGAAGAATCATCAAGTACTTCCAACAATACCGAAGAGAAGAGGACAC
CATAGACGGACCATGTCCATACATGTCCAGCACAAGAGATGAAAGAGGA
GAAGAAAAATCCAAAGAAAACAGTGCTGAATACGACTACCTGAGGCAC
CTCGTCAAAAGTAAAGCAGCAAGAACAGTACAAGAACTGGTTAATAAAC
TAGACGATGAAGAATACAAACAACTCTGGACACGTACAAGGGGACAAT
ATAAAGACAAATTAAGAGGAATCCTCACTTACTACAACAACAAGAAGAA
ATTCAGTCAAAGTCAACTATCACTCATTACAATCTACACAATATATCAAA
AAGGAAACCAGACTTCGAAAACATGCAATGGCTCAAGTACATGTTCGCC
AACAATGACATCCGTGTACCAGAAATCTTAGCATGGATAATTATAGTTG
CTGACAAGAAACTTGATAAAATTAACACTCTAGTTCTACAAGGACCAAC
AGGAACAGGCAAATCTCTGACCATTGGAGCATTACTCGGCAAGTTAAAC
ACTGGCTTAGTAACAAGAACAGGAGATTCAAACACCTTCCATCTTCAAA
ACCTCATCGGAAAATCCTATGCACTATTCGAAGAACCAAGAATTAGTCA
AATAACAGTGGACGACTTCAAACTCCTTTTCGAAGGATCAGACTTAGAA
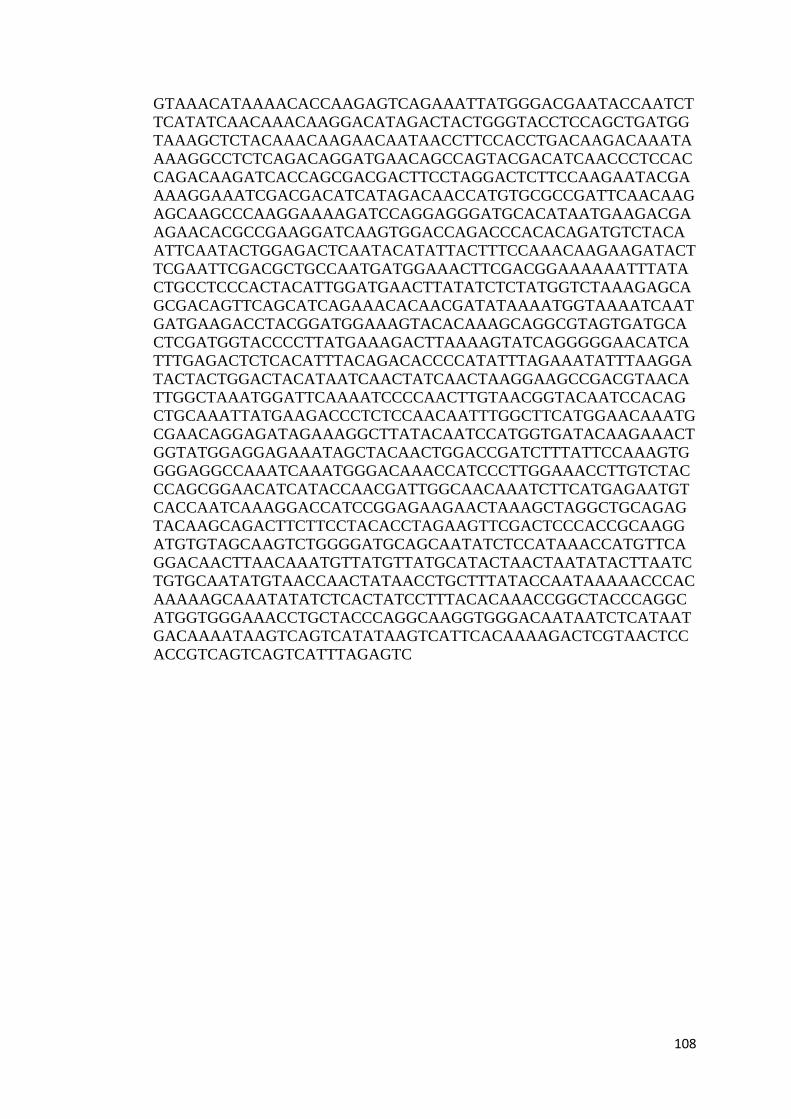
108
GTAAACATAAAACACCAAGAGTCAGAAATTATGGGACGAATACCAATCT
TCATATCAACAAACAAGGACATAGACTACTGGGTACCTCCAGCTGATGG
TAAAGCTCTACAAACAAGAACAATAACCTTCCACCTGACAAGACAAATA
AAAGGCCTCTCAGACAGGATGAACAGCCAGTACGACATCAACCCTCCAC
CAGACAAGATCACCAGCGACGACTTCCTAGGACTCTTCCAAGAATACGA
AAAGGAAATCGACGACATCATAGACAACCATGTGCGCCGATTCAACAAG
AGCAAGCCCAAGGAAAAGATCCAGGAGGGATGCACATAATGAAGACGA
AGAACACGCCGAAGGATCAAGTGGACCAGACCCACACAGATGTCTACA
ATTCAATACTGGAGACTCAATACATATTACTTTCCAAACAAGAAGATACT
TCGAATTCGACGCTGCCAATGATGGAAACTTCGACGGAAAAAATTTATA
CTGCCTCCCACTACATTGGATGAACTTATATCTCTATGGTCTAAAGAGCA
GCGACAGTTCAGCATCAGAAACACAACGATATAAAATGGTAAAATCAAT
GATGAAGACCTACGGATGGAAAGTACACAAAGCAGGCGTAGTGATGCA
CTCGATGGTACCCCTTATGAAAGACTTAAAAGTATCAGGGGGAACATCA
TTTGAGACTCTCACATTTACAGACACCCCATATTTAGAAATATTTAAGGA
TACTACTGGACTACATAATCAACTATCAACTAAGGAAGCCGACGTAACA
TTGGCTAAATGGATTCAAAATCCCCAACTTGTAACGGTACAATCCACAG
CTGCAAATTATGAAGACCCTCTCCAACAATTTGGCTTCATGGAACAAATG
CGAACAGGAGATAGAAAGGCTTATACAATCCATGGTGATACAAGAAACT
GGTATGGAGGAGAAATAGCTACAACTGGACCGATCTTTATTCCAAAGTG
GGGAGGCCAAATCAAATGGGACAAACCATCCCTTGGAAACCTTGTCTAC
CCAGCGGAACATCATACCAACGATTGGCAACAAATCTTCATGAGAATGT
CACCAATCAAAGGACCATCCGGAGAAGAACTAAAGCTAGGCTGCAGAG
TACAAGCAGACTTCTTCCTACACCTAGAAGTTCGACTCCCACCGCAAGG
ATGTGTAGCAAGTCTGGGGATGCAGCAATATCTCCATAAACCATGTTCA
GGACAACTTAACAAATGTTATGTTATGCATACTAACTAATATACTTAATC
TGTGCAATATGTAACCAACTATAACCTGCTTTATACCAATAAAAACCCAC
AAAAAGCAAATATATCTCACTATCCTTTACACAAACCGGCTACCCAGGC
ATGGTGGGAAACCTGCTACCCAGGCAAGGTGGGACAATAATCTCATAAT
GACAAAATAAGTCAGTCATATAAGTCATTCACAAAAGACTCGTAACTCC
ACCGTCAGTCAGTCATTTAGAGTC
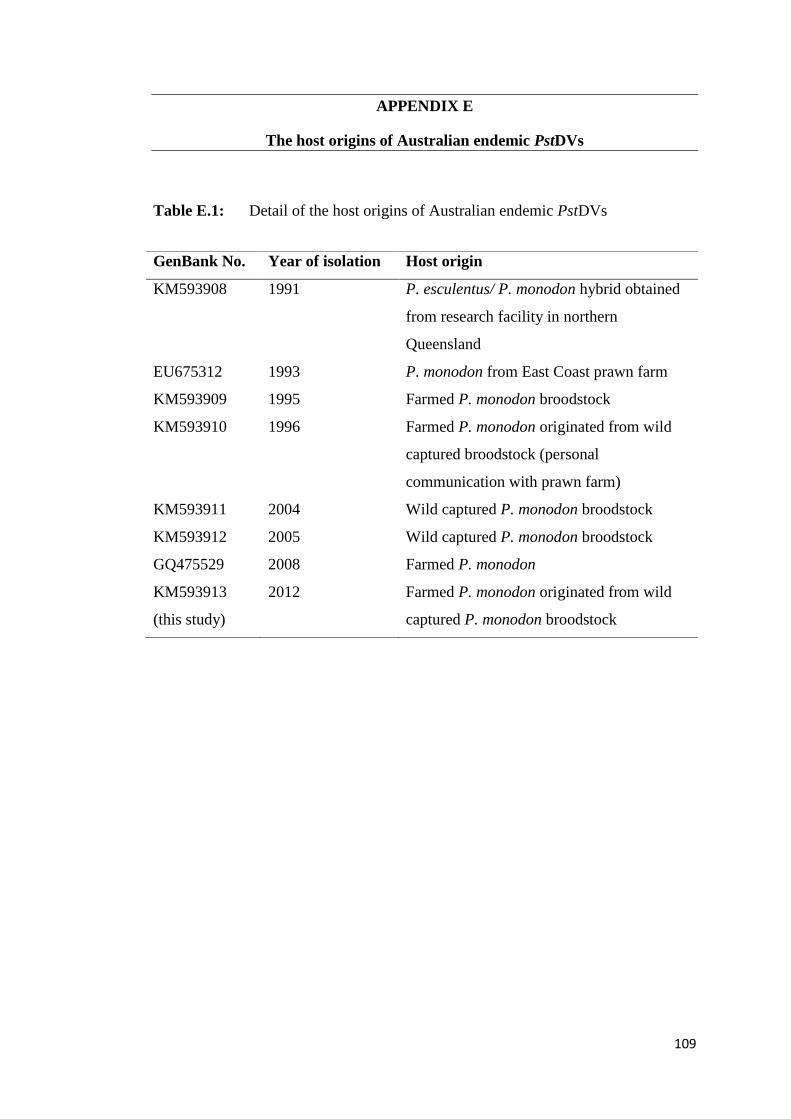
109
APPENDIX E
The host origins of Australian endemic PstDVs
Table E.1: Detail of the host origins of Australian endemic PstDVs
GenBank No. Year of isolation Host origin
KM593908 1991 P. esculentus/ P. monodon hybrid obtained
from research facility in northern
Queensland
EU675312 1993 P. monodon from East Coast prawn farm
KM593909 1995 Farmed P. monodon broodstock
KM593910 1996 Farmed P. monodon originated from wild
captured broodstock (personal
communication with prawn farm)
KM593911 2004 Wild captured P. monodon broodstock
KM593912 2005 Wild captured P. monodon broodstock
GQ475529 2008 Farmed P. monodon
KM593913
(this study)
2012 Farmed P. monodon originated from wild
captured P. monodon broodstock
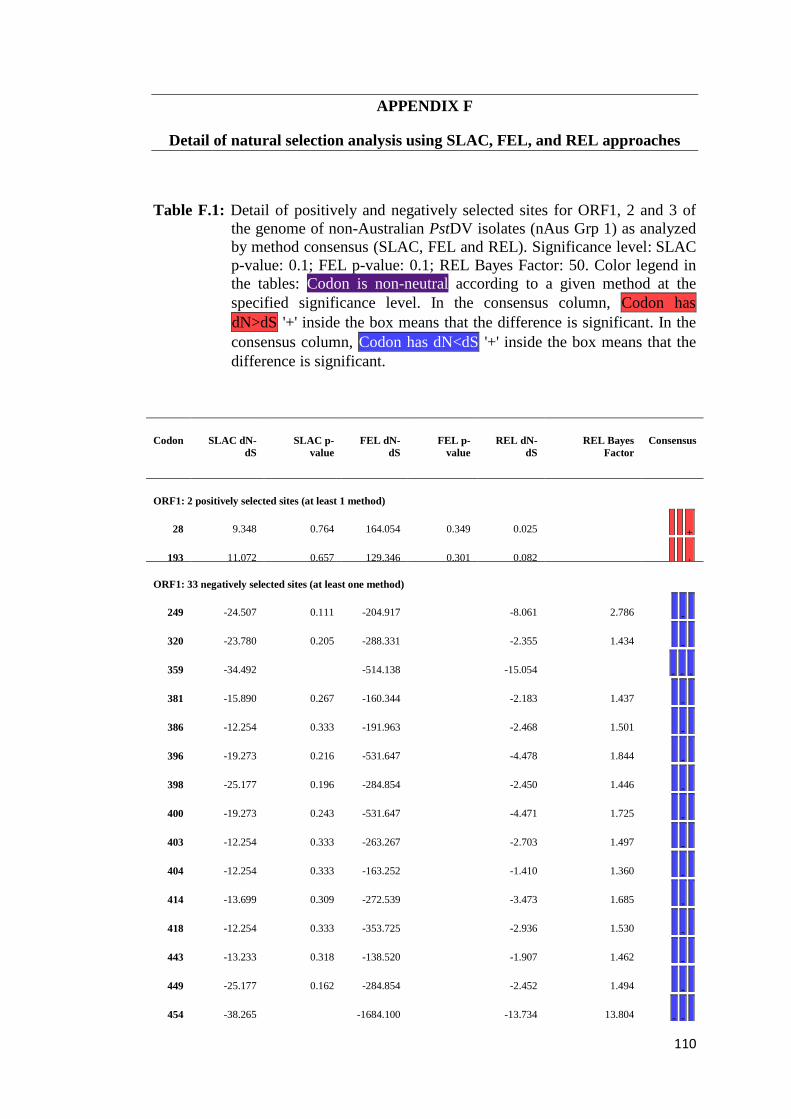
110
APPENDIX F
Detail of natural selection analysis using SLAC, FEL, and REL approaches
Table F.1: Detail of positively and negatively selected sites for ORF1, 2 and 3 of
the genome of non-Australian PstDV isolates (nAus Grp 1) as analyzed
by method consensus (SLAC, FEL and REL). Significance level: SLAC
p-value: 0.1; FEL p-value: 0.1; REL Bayes Factor: 50. Color legend in
the tables: Codon is non-neutral according to a given method at the
specified significance level. In the consensus column, Codon has
dN>dS '+' inside the box means that the difference is significant. In the
consensus column, Codon has dN<dS '+' inside the box means that the
difference is significant.
Codon SLAC dN-
dS
SLAC p-
value
FEL dN-
dS
FEL p-
value
REL dN-
dS
REL Bayes
Factor
Consensus
ORF1: 2 positively selected sites (at least 1 method)
28 9.348 0.764 164.054 0.349 0.025 54.024 +
193 11.072 0.657 129.346 0.301 0.082 50.913 +
ORF1: 33 negatively selected sites (at least one method)
249 -24.507 0.111 -204.917 0.048 -8.061 2.786 -
320 -23.780 0.205 -288.331 0.080 -2.355 1.434 -
359 -34.492 0.045 -514.138 0.006 -15.054 82.545 - - -
381 -15.890 0.267 -160.344 0.094 -2.183 1.437 -
386 -12.254 0.333 -191.963 0.089 -2.468 1.501 -
396 -19.273 0.216 -531.647 0.026 -4.478 1.844 -
398 -25.177 0.196 -284.854 0.076 -2.450 1.446 -
400 -19.273 0.243 -531.647 0.035 -4.471 1.725 -
403 -12.254 0.333 -263.267 0.072 -2.703 1.497 -
404 -12.254 0.333 -163.252 0.092 -1.410 1.360 -
414 -13.699 0.309 -272.539 0.047 -3.473 1.685 -
418 -12.254 0.333 -353.725 0.060 -2.936 1.530 -
443 -13.233 0.318 -138.520 0.095 -1.907 1.462 -
449 -25.177 0.162 -284.854 0.054 -2.452 1.494 -
454 -38.265 0.049 -1684.100 0.002 -13.734 13.804 - -
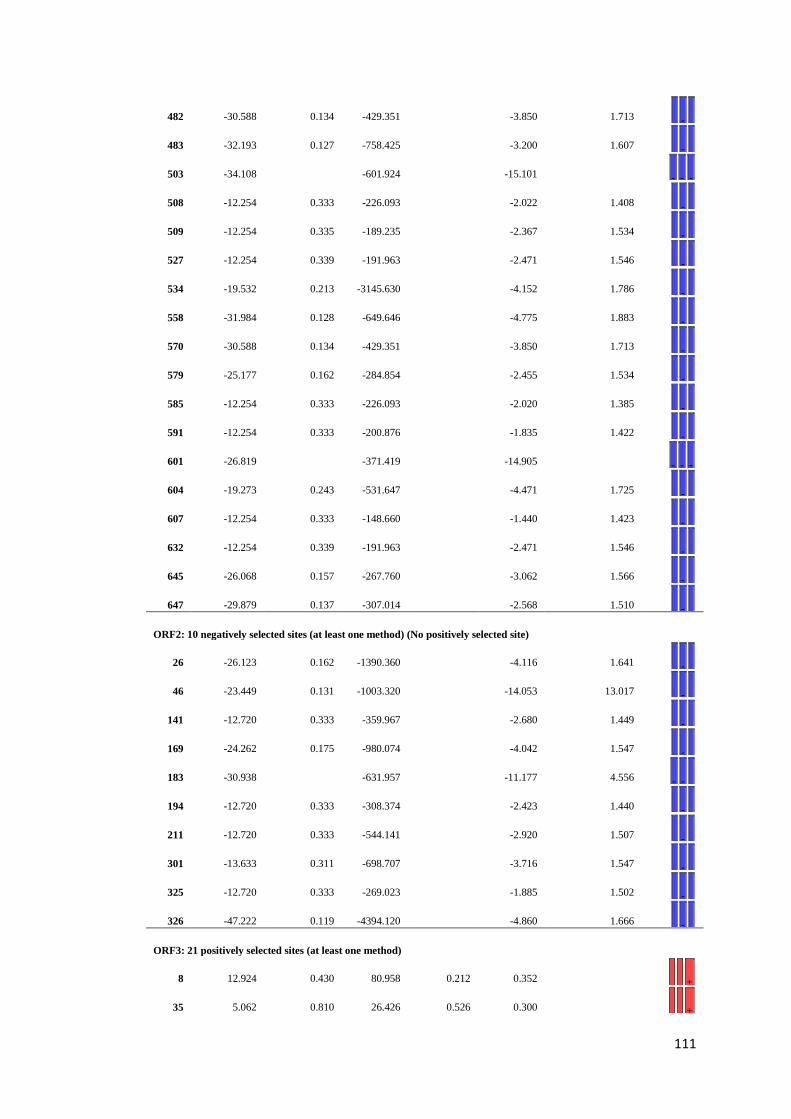
111
482 -30.588 0.134 -429.351 0.042 -3.850 1.713 -
483 -32.193 0.127 -758.425 0.032 -3.200 1.607 -
503 -34.108 0.047 -601.924 0.011 -15.101 98.748 - - -
508 -12.254 0.333 -226.093 0.075 -2.022 1.408 -
509 -12.254 0.335 -189.235 0.069 -2.367 1.534 -
527 -12.254 0.339 -191.963 0.068 -2.471 1.546 -
534 -19.532 0.213 -3145.630 0.015 -4.152 1.786 -
558 -31.984 0.128 -649.646 0.017 -4.775 1.883 -
570 -30.588 0.134 -429.351 0.042 -3.850 1.713 -
579 -25.177 0.162 -284.854 0.048 -2.455 1.534 -
585 -12.254 0.333 -226.093 0.083 -2.020 1.385 -
591 -12.254 0.333 -200.876 0.074 -1.835 1.422 -
601 -26.819 0.097 -371.419 0.026 -14.905 52.476 - - -
604 -19.273 0.243 -531.647 0.035 -4.471 1.725 -
607 -12.254 0.333 -148.660 0.084 -1.440 1.423 -
632 -12.254 0.339 -191.963 0.068 -2.471 1.546 -
645 -26.068 0.157 -267.760 0.069 -3.062 1.566 -
647 -29.879 0.137 -307.014 0.050 -2.568 1.510 -
ORF2: 10 negatively selected sites (at least one method) (No positively selected site)
26 -26.123 0.162 -1390.360 0.034 -4.116 1.641 -
46 -23.449 0.131 -1003.320 0.028 -14.053 13.017 -
141 -12.720 0.333 -359.967 0.094 -2.680 1.449 -
169 -24.262 0.175 -980.074 0.043 -4.042 1.547 -
183 -30.938 0.090 -631.957 0.049 -11.177 4.556 - -
194 -12.720 0.333 -308.374 0.099 -2.423 1.440 -
211 -12.720 0.333 -544.141 0.071 -2.920 1.507 -
301 -13.633 0.311 -698.707 0.063 -3.716 1.547 -
325 -12.720 0.333 -269.023 0.092 -1.885 1.502 -
326 -47.222 0.119 -4394.120 0.018 -4.860 1.666 -
ORF3: 21 positively selected sites (at least one method)
8 12.924 0.430 80.958 0.212 0.352 75545.300 +
35 5.062 0.810 26.426 0.526 0.300 184.277 +

112
44 5.026 0.816 21.713 0.569 0.291 156.904 +
51 -11.384 0.925 -930.813 0.066 0.307 217.359 - +
53 6.158 0.699 22.119 0.525 0.292 159.601 +
105 8.444 0.952 35.154 0.616 0.352 38011.900 +
113 -6.148 0.889 -75.432 0.391 0.301 188.842 +
163 7.454 0.623 42.507 0.354 0.312 244.865 +
167 6.148 0.667 30.558 0.374 0.304 202.017 +
185 7.871 0.610 40.868 0.361 0.311 238.683 +
188 6.148 0.667 26.915 0.440 0.300 185.584 +
240 13.690 0.440 94.149 0.319 0.352 82137.700 +
246 11.755 0.488 85.510 0.195 0.352 88298.600 +
247 6.064 0.676 33.568 0.344 0.307 215.710 +
292 5.024 0.816 26.030 0.536 0.299 181.558 +
303 12.290 0.445 70.562 0.195 0.352 64015.100 +
304 12.924 0.430 82.087 0.210 0.352 76154.500 +
314 6.148 0.667 27.249 0.438 0.301 188.457 +
319 -12.048 0.930 -495.996 0.145 0.307 215.928 +
322 5.690 0.758 22.857 0.563 0.294 165.248 +
325 5.793 0.707 33.882 0.348 0.307 217.966 +
ORF3: 31 negatively selected sites (at least one method)
27 -18.741 0.225 -269.663 0.021 -0.923 2.325 -
42 -12.296 0.333 -78.320 0.096 -0.916 2.098 -
51 -11.384 0.474 -930.813 0.066 0.307 0.005 -
63 -21.788 0.188 -138.386 0.055 -0.927 2.453 -
70 -21.877 0.187 -119.249 0.055 -0.926 2.420 -
85 -12.296 0.335 -97.296 0.067 -0.926 2.408 -
89 -22.152 0.185 -125.874 0.046 -0.935 2.771 -
93 -12.296 0.333 -130.322 0.074 -0.916 2.113 -
100 -29.028 0.088 -172.774 0.024 -0.919 2.189 - -
103 -17.692 0.244 -75.099 0.096 -0.921 2.242 -
114 -21.877 0.187 -119.242 0.066 -0.916 2.109 -
118 -12.296 0.333 -97.059 0.083 -0.915 2.081 -
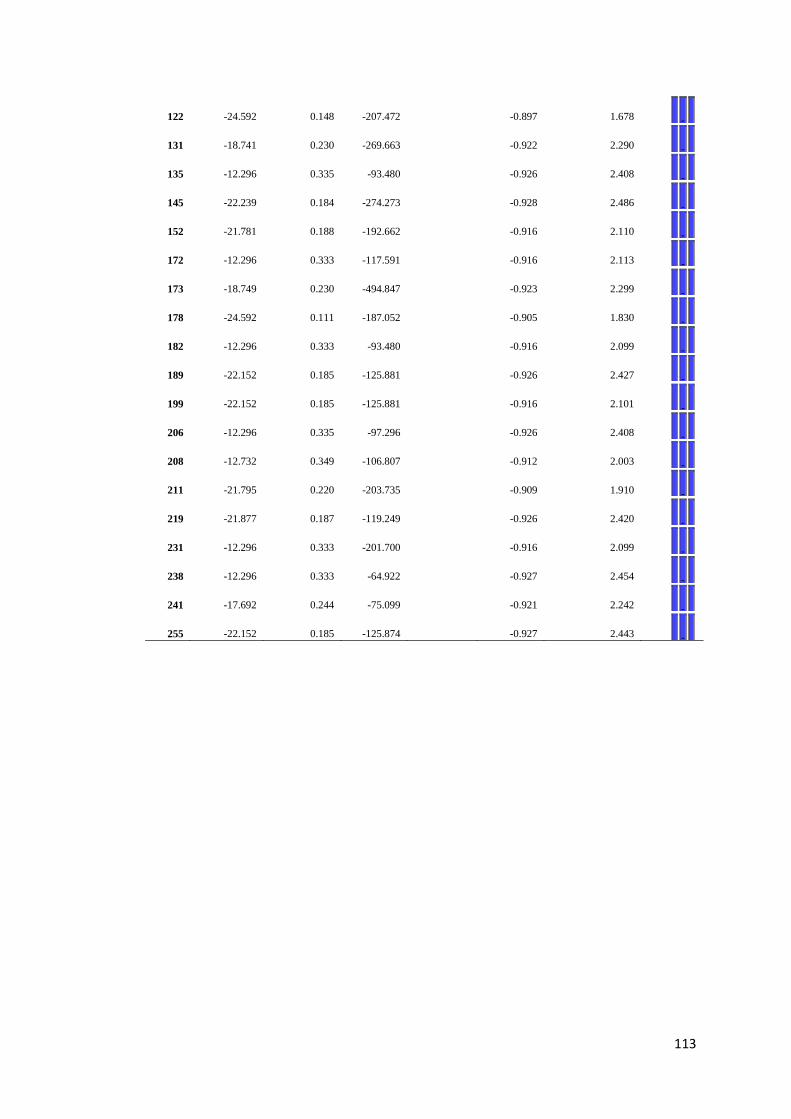
113
122 -24.592 0.148 -207.472 0.034 -0.897 1.678 -
131 -18.741 0.230 -269.663 0.021 -0.922 2.290 -
135 -12.296 0.335 -93.480 0.072 -0.926 2.408 -
145 -22.239 0.184 -274.273 0.021 -0.928 2.486 -
152 -21.781 0.188 -192.662 0.049 -0.916 2.110 -
172 -12.296 0.333 -117.591 0.058 -0.916 2.113 -
173 -18.749 0.230 -494.847 0.023 -0.923 2.299 -
178 -24.592 0.111 -187.052 0.020 -0.905 1.830 -
182 -12.296 0.333 -93.480 0.085 -0.916 2.099 -
189 -22.152 0.185 -125.881 0.053 -0.926 2.427 -
199 -22.152 0.185 -125.881 0.063 -0.916 2.101 -
206 -12.296 0.335 -97.296 0.067 -0.926 2.408 -
208 -12.732 0.349 -106.807 0.086 -0.912 2.003 -
211 -21.795 0.220 -203.735 0.048 -0.909 1.910 -
219 -21.877 0.187 -119.249 0.055 -0.926 2.420 -
231 -12.296 0.333 -201.700 0.051 -0.916 2.099 -
238 -12.296 0.333 -64.922 0.095 -0.927 2.454 -
241 -17.692 0.244 -75.099 0.096 -0.921 2.242 -
255 -22.152 0.185 -125.874 0.052 -0.927 2.443 -
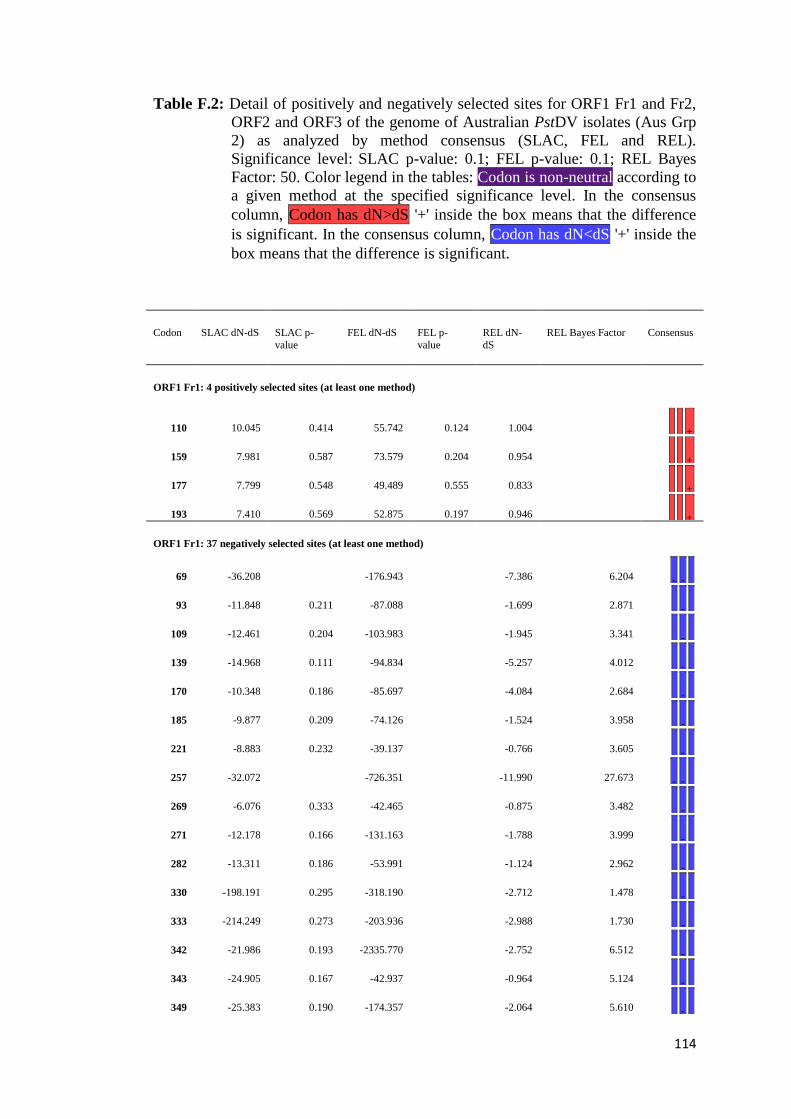
114
Table F.2: Detail of positively and negatively selected sites for ORF1 Fr1 and Fr2,
ORF2 and ORF3 of the genome of Australian PstDV isolates (Aus Grp
2) as analyzed by method consensus (SLAC, FEL and REL).
Significance level: SLAC p-value: 0.1; FEL p-value: 0.1; REL Bayes
Factor: 50. Color legend in the tables: Codon is non-neutral according to
a given method at the specified significance level. In the consensus
column, Codon has dN>dS '+' inside the box means that the difference
is significant. In the consensus column, Codon has dN<dS '+' inside the
box means that the difference is significant.
Codon SLAC dN-dS SLAC p-
value
FEL dN-dS FEL p-
value
REL dN-
dS
REL Bayes Factor Consensus
ORF1 Fr1: 4 positively selected sites (at least one method)
110 10.045 0.414 55.742 0.124 1.004 195.346 +
159 7.981 0.587 73.579 0.204 0.954 402.187 +
177 7.799 0.548 49.489 0.555 0.833 113.836 +
193 7.410 0.569 52.875 0.197 0.946 134.326
+
ORF1 Fr1: 37 negatively selected sites (at least one method)
69 -36.208 0.019 -176.943 0.008 -7.386 6.204 - -
93 -11.848 0.211 -87.088 0.061 -1.699 2.871 -
109 -12.461 0.204 -103.983 0.045 -1.945 3.341 -
139 -14.968 0.111 -94.834 0.025 -5.257 4.012 -
170 -10.348 0.186 -85.697 0.033 -4.084 2.684 -
185 -9.877 0.209 -74.126 0.050 -1.524 3.958 -
221 -8.883 0.232 -39.137 0.082 -0.766 3.605 -
257 -32.072 0.016 -726.351 0.001 -11.990 27.673 - -
269 -6.076 0.333 -42.465 0.086 -0.875 3.482 -
271 -12.178 0.166 -131.163 0.044 -1.788 3.999 -
282 -13.311 0.186 -53.991 0.081 -1.124 2.962 -
330 -198.191 0.295 -318.190 0.093 -2.712 1.478 -
333 -214.249 0.273 -203.936 0.075 -2.988 1.730 -
342 -21.986 0.193 -2335.770 0.007 -2.752 6.512 -
343 -24.905 0.167 -42.937 0.059 -0.964 5.124 -
349 -25.383 0.190 -174.357 0.027 -2.064 5.610 -
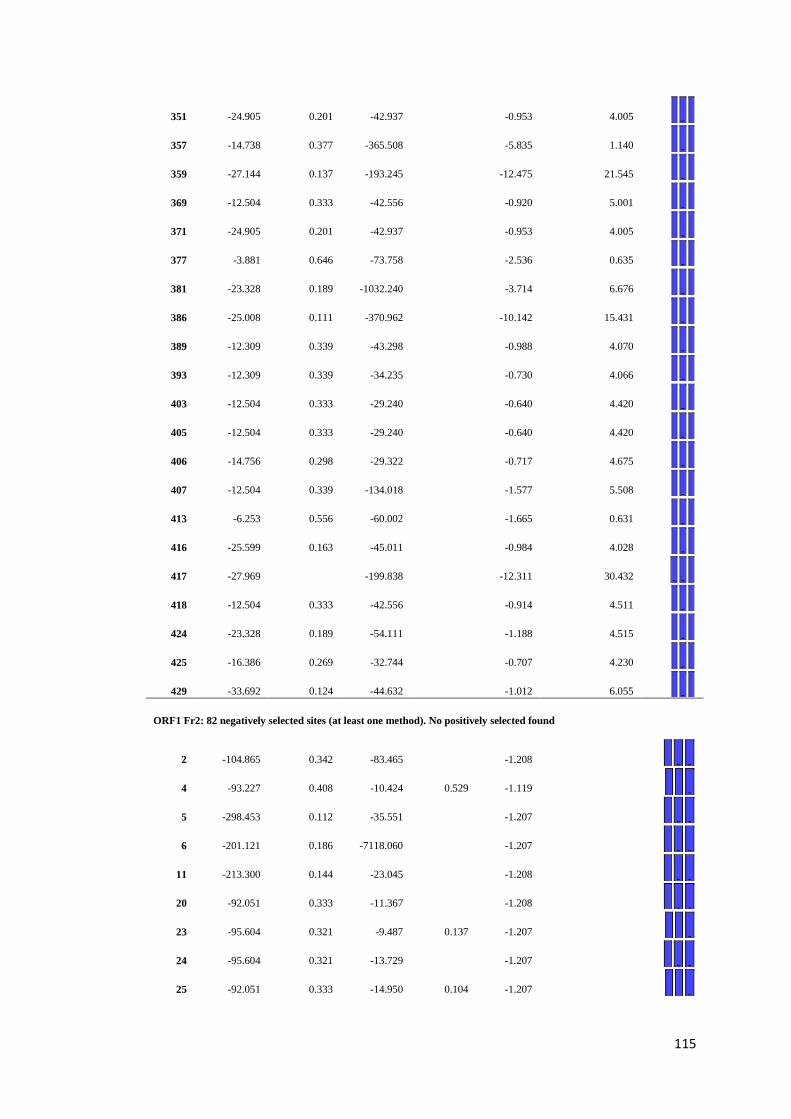
115
351 -24.905 0.201 -42.937 0.078 -0.953 4.005 -
357 -14.738 0.377 -365.508 0.022 -5.835 1.140 -
359 -27.144 0.137 -193.245 0.004 -12.475 21.545 -
369 -12.504 0.333 -42.556 0.061 -0.920 5.001 -
371 -24.905 0.201 -42.937 0.078 -0.953 4.005 -
377 -3.881 0.646 -73.758 0.056 -2.536 0.635 -
381 -23.328 0.189 -1032.240 0.004 -3.714 6.676 -
386 -25.008 0.111 -370.962 0.001 -10.142 15.431 -
389 -12.309 0.339 -43.298 0.055 -0.988 4.070 -
393 -12.309 0.339 -34.235 0.090 -0.730 4.066 -
403 -12.504 0.333 -29.240 0.093 -0.640 4.420 -
405 -12.504 0.333 -29.240 0.093 -0.640 4.420 -
406 -14.756 0.298 -29.322 0.090 -0.717 4.675 -
407 -12.504 0.339 -134.018 0.042 -1.577 5.508 -
413 -6.253 0.556 -60.002 0.064 -1.665 0.631 -
416 -25.599 0.163 -45.011 0.070 -0.984 4.028 -
417 -27.969 0.089 -199.838 0.003 -12.311 30.432 - -
418 -12.504 0.333 -42.556 0.064 -0.914 4.511 -
424 -23.328 0.189 -54.111 0.058 -1.188 4.515 -
425 -16.386 0.269 -32.744 0.081 -0.707 4.230 -
429 -33.692 0.124 -44.632 0.053 -1.012 6.055 -
ORF1 Fr2: 82 negatively selected sites (at least one method). No positively selected found
2 -104.865 0.342 -83.465 0.016 -1.208 120920.000 - -
4 -93.227 0.408 -10.424 0.529 -1.119 610.181 -
5 -298.453 0.112 -35.551 0.045 -1.207 6690.230 - -
6 -201.121 0.186 -7118.060 0.007 -1.207 8577280000.000 - -
11 -213.300 0.144 -23.045 0.059 -1.208 2115.700 - -
20 -92.051 0.333 -11.367 0.099 -1.208 58274.500 - -
23 -95.604 0.321 -9.487 0.137 -1.207 166339.000 -
24 -95.604 0.321 -13.729 0.098 -1.207 12970.200 - -
25 -92.051 0.333 -14.950 0.104 -1.207 59321.900 -
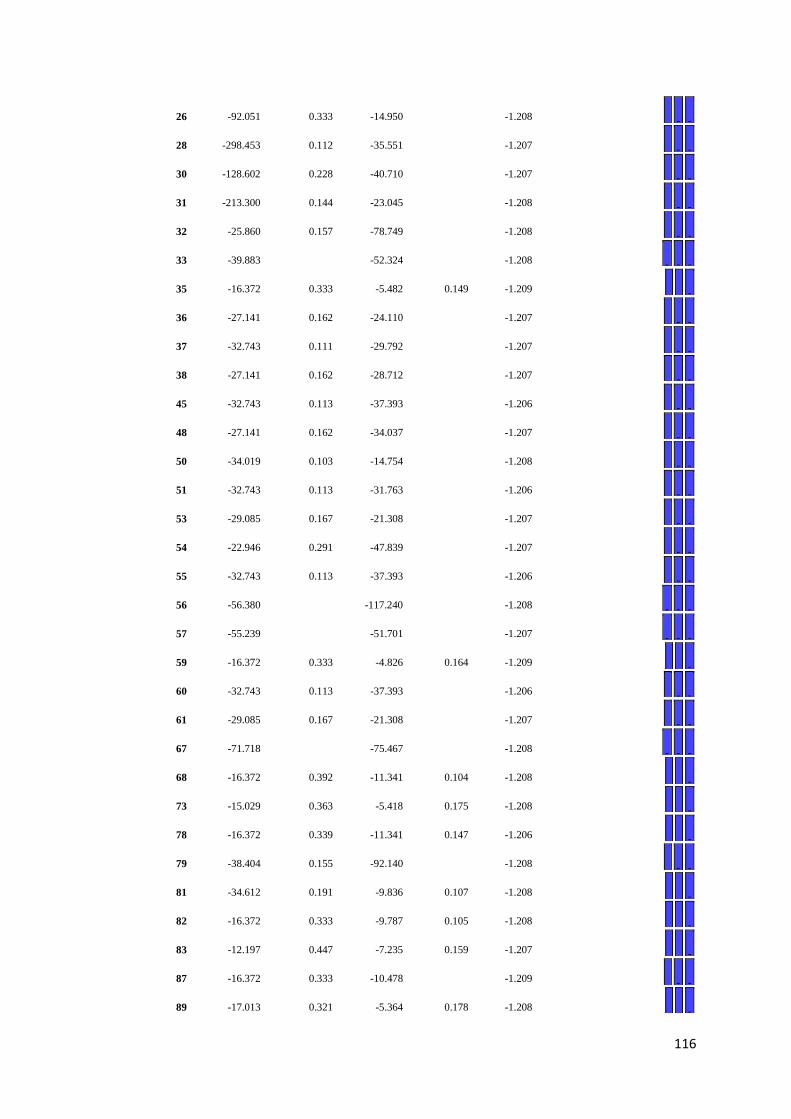
116
26 -92.051 0.333 -14.950 0.082 -1.208 66239.800 - -
28 -298.453 0.112 -35.551 0.045 -1.207 6690.230 - -
30 -128.602 0.228 -40.710 0.022 -1.207 73856500000.000 - -
31 -213.300 0.144 -23.045 0.065 -1.208 2056.810 - -
32 -25.860 0.157 -78.749 0.015 -1.208 36252.000 - -
33 -39.883 0.075 -52.324 0.019 -1.208 344217000.000 - - -
35 -16.372 0.333 -5.482 0.149 -1.209 496917.000 -
36 -27.141 0.162 -24.110 0.028 -1.207 58978500000.000 - -
37 -32.743 0.111 -29.792 0.036 -1.207 53997400000.000 - -
38 -27.141 0.162 -28.712 0.025 -1.207 60798900000.000 - -
45 -32.743 0.113 -37.393 0.025 -1.206 15985900000.000 - -
48 -27.141 0.162 -34.037 0.012 -1.207 27023600000.000 - -
50 -34.019 0.103 -14.754 0.044 -1.208 60786200000.000 - -
51 -32.743 0.113 -31.763 0.026 -1.206 16996700000.000 - -
53 -29.085 0.167 -21.308 0.032 -1.207 5312250.000 - -
54 -22.946 0.291 -47.839 0.008 -1.207 19199100.000 - -
55 -32.743 0.113 -37.393 0.025 -1.206 15985900000.000 - -
56 -56.380 0.045 -117.240 0.005 -1.208 60923700.000 - - -
57 -55.239 0.034 -51.701 0.002 -1.207 1845550000.000 - - -
59 -16.372 0.333 -4.826 0.164 -1.209 5333960.000 -
60 -32.743 0.113 -37.393 0.025 -1.206 15985900000.000 - -
61 -29.085 0.167 -21.308 0.032 -1.207 5312250.000 - -
67 -71.718 0.023 -75.467 0.008 -1.208 5922130.000 - - -
68 -16.372 0.392 -11.341 0.104 -1.208 17296300.000 -
73 -15.029 0.363 -5.418 0.175 -1.208 335897.000 -
78 -16.372 0.339 -11.341 0.147 -1.206 17368800.000 -
79 -38.404 0.155 -92.140 0.016 -1.208 186565.000 - -
81 -34.612 0.191 -9.836 0.107 -1.208 67423700.000 -
82 -16.372 0.333 -9.787 0.105 -1.208 639015.000 -
83 -12.197 0.447 -7.235 0.159 -1.207 431307.000 -
87 -16.372 0.333 -10.478 0.087 -1.209 701908.000 - -
89 -17.013 0.321 -5.364 0.178 -1.208 375136.000 -
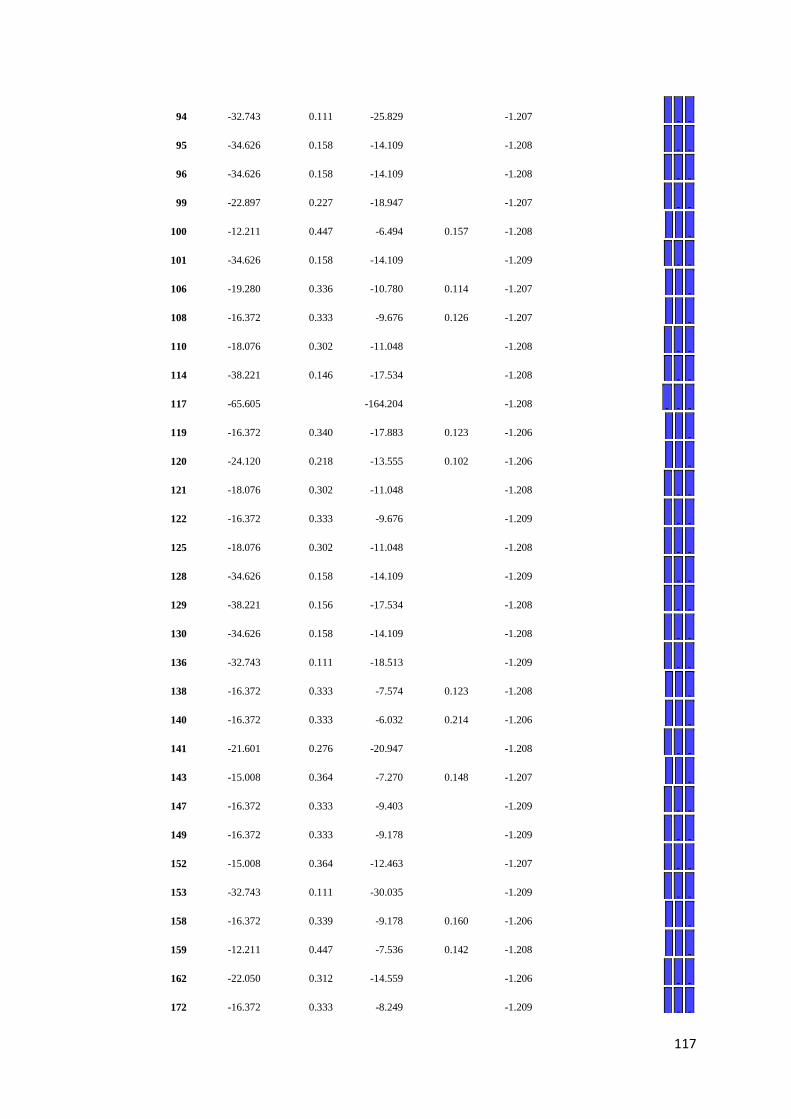
117
94 -32.743 0.111 -25.829 0.025 -1.207 504807000.000 - -
95 -34.626 0.158 -14.109 0.073 -1.208 3397.500 - -
96 -34.626 0.158 -14.109 0.073 -1.208 3397.500 - -
99 -22.897 0.227 -18.947 0.035 -1.207 423752000000.000 - -
100 -12.211 0.447 -6.494 0.157 -1.208 105485.000 -
101 -34.626 0.158 -14.109 0.058 -1.209 3621.550 - -
106 -19.280 0.336 -10.780 0.114 -1.207 23263.900 -
108 -16.372 0.333 -9.676 0.126 -1.207 109513.000 -
110 -18.076 0.302 -11.048 0.097 -1.208 25065.700 - -
114 -38.221 0.146 -17.534 0.065 -1.208 11250.600 - -
117 -65.605 0.016 -164.204 0.003 -1.208 7020822970.000 - - -
119 -16.372 0.340 -17.883 0.123 -1.206 2000880000.000 -
120 -24.120 0.218 -13.555 0.102 -1.206 33083000.000 -
121 -18.076 0.302 -11.048 0.097 -1.208 25065.700 - -
122 -16.372 0.333 -9.676 0.087 -1.209 57025700.000 - -
125 -18.076 0.302 -11.048 0.097 -1.208 25065.700 - -
128 -34.626 0.158 -14.109 0.066 -1.209 3524.600 - -
129 -38.221 0.156 -17.534 0.062 -1.208 10952.200 - -
130 -34.626 0.158 -14.109 0.073 -1.208 3397.500 - -
136 -32.743 0.111 -18.513 0.019 -1.209 261894000000.000 - -
138 -16.372 0.333 -7.574 0.123 -1.208 138450.000 -
140 -16.372 0.333 -6.032 0.214 -1.206 6247480.000 -
141 -21.601 0.276 -20.947 0.052 -1.208 11725.600 - -
143 -15.008 0.364 -7.270 0.148 -1.207 116280.000 -
147 -16.372 0.333 -9.403 0.096 -1.209 166410.000 - -
149 -16.372 0.333 -9.178 0.098 -1.209 163797.000 - -
152 -15.008 0.364 -12.463 0.079 -1.207 119174.000 - -
153 -32.743 0.111 -30.035 0.014 -1.209 1109760000.000 - -
158 -16.372 0.339 -9.178 0.160 -1.206 64875.000 -
159 -12.211 0.447 -7.536 0.142 -1.208 121084.000 -
162 -22.050 0.312 -14.559 0.087 -1.206 35739700.000 - -
172 -16.372 0.333 -8.249 0.099 -1.209 158708.000 - -
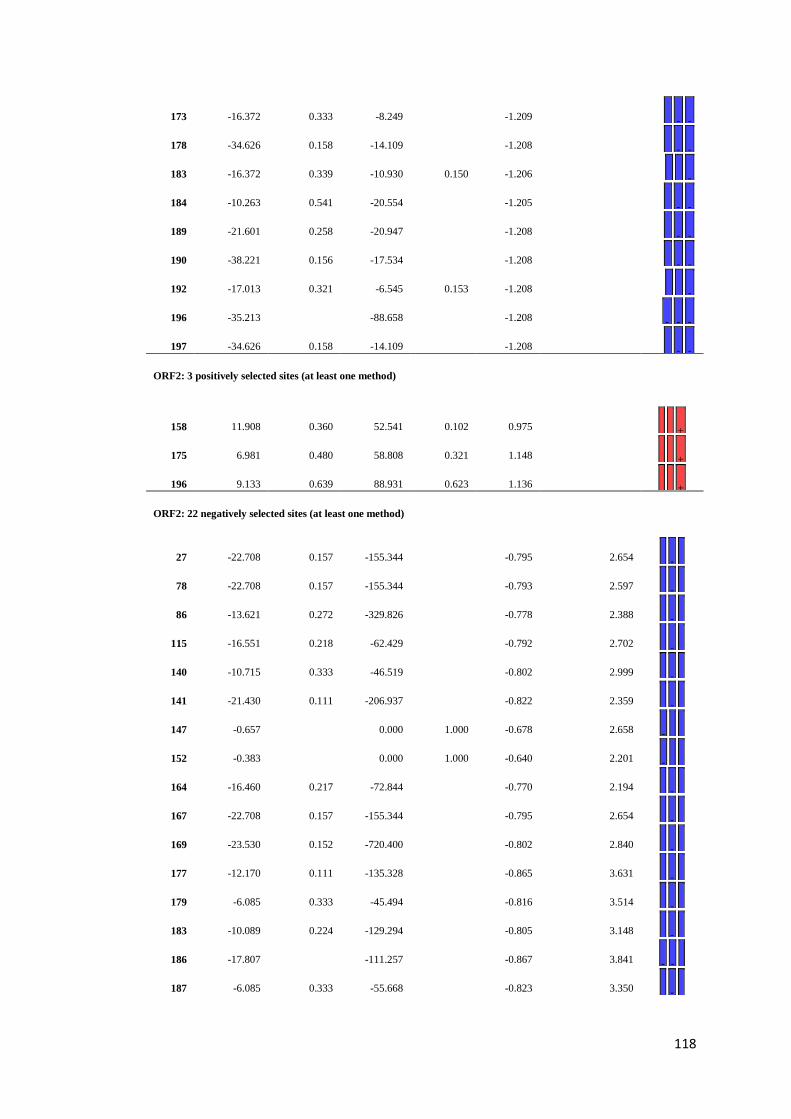
118
173 -16.372 0.333 -8.249 0.099 -1.209 158708.000 - -
178 -34.626 0.158 -14.109 0.072 -1.208 3371.940 - -
183 -16.372 0.339 -10.930 0.150 -1.206 9750690.000 -
184 -10.263 0.541 -20.554 0.064 -1.205 188.957 - -
189 -21.601 0.258 -20.947 0.055 -1.208 12047.700 - -
190 -38.221 0.156 -17.534 0.062 -1.208 10952.200 - -
192 -17.013 0.321 -6.545 0.153 -1.208 241795.000 -
196 -35.213 0.096 -88.658 0.014 -1.208 969808000.000 - - -
197 -34.626 0.158 -14.109 0.073 -1.208 3397.500 - -
ORF2: 3 positively selected sites (at least one method)
158 11.908 0.360 52.541 0.102 0.975 51.569 +
175 6.981 0.480 58.808 0.321 1.148 1634.730 +
196 9.133 0.639 88.931 0.623 1.136 1962.660 +
ORF2: 22 negatively selected sites (at least one method)
27 -22.708 0.157 -155.344 0.036 -0.795 2.654 -
78 -22.708 0.157 -155.344 0.036 -0.793 2.597 -
86 -13.621 0.272 -329.826 0.072 -0.778 2.388 -
115 -16.551 0.218 -62.429 0.085 -0.792 2.702 -
140 -10.715 0.333 -46.519 0.092 -0.802 2.999 -
141 -21.430 0.111 -206.937 0.021 -0.822 2.359 -
147 -0.657 0.008 0.000 1.000 -0.678 2.658 -
152 -0.383 0.014 0.000 1.000 -0.640 2.201 -
164 -16.460 0.217 -72.844 0.079 -0.770 2.194 -
167 -22.708 0.157 -155.344 0.036 -0.795 2.654 -
169 -23.530 0.152 -720.400 0.023 -0.802 2.840 -
177 -12.170 0.111 -135.328 0.008 -0.865 3.631 -
179 -6.085 0.333 -45.494 0.079 -0.816 3.514 -
183 -10.089 0.224 -129.294 0.059 -0.805 3.148 -
186 -17.807 0.053 -111.257 0.015 -0.867 3.841 - -
187 -6.085 0.333 -55.668 0.050 -0.823 3.350 -
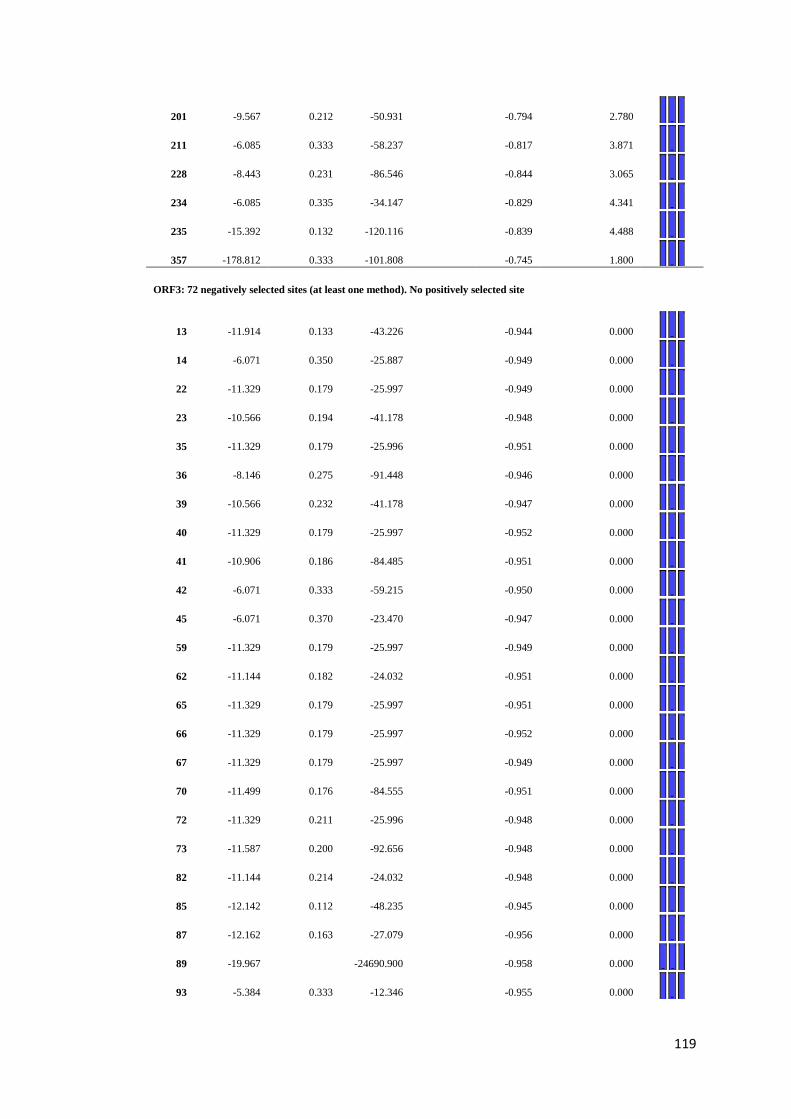
119
201 -9.567 0.212 -50.931 0.078 -0.794 2.780 -
211 -6.085 0.333 -58.237 0.094 -0.817 3.871 -
228 -8.443 0.231 -86.546 0.038 -0.844 3.065 -
234 -6.085 0.335 -34.147 0.088 -0.829 4.341 -
235 -15.392 0.132 -120.116 0.026 -0.839 4.488 -
357 -178.812 0.333 -101.808 0.092 -0.745 1.800 -
ORF3: 72 negatively selected sites (at least one method). No positively selected site
13 -11.914 0.133 -43.226 0.035 -0.944 0.000 -
14 -6.071 0.350 -25.887 0.064 -0.949 0.000 -
22 -11.329 0.179 -25.997 0.072 -0.949 0.000 -
23 -10.566 0.194 -41.178 0.056 -0.948 0.000 -
35 -11.329 0.179 -25.996 0.063 -0.951 0.000 -
36 -8.146 0.275 -91.448 0.034 -0.946 0.000 -
39 -10.566 0.232 -41.178 0.062 -0.947 0.000 -
40 -11.329 0.179 -25.997 0.059 -0.952 0.000 -
41 -10.906 0.186 -84.485 0.019 -0.951 0.000 -
42 -6.071 0.333 -59.215 0.031 -0.950 0.000 -
45 -6.071 0.370 -23.470 0.088 -0.947 0.000 -
59 -11.329 0.179 -25.997 0.072 -0.949 0.000 -
62 -11.144 0.182 -24.032 0.068 -0.951 0.000 -
65 -11.329 0.179 -25.997 0.065 -0.951 0.000 -
66 -11.329 0.179 -25.997 0.059 -0.952 0.000 -
67 -11.329 0.179 -25.997 0.072 -0.949 0.000 -
70 -11.499 0.176 -84.555 0.017 -0.951 0.000 -
72 -11.329 0.211 -25.996 0.080 -0.948 0.000 -
73 -11.587 0.200 -92.656 0.020 -0.948 0.000 -
82 -11.144 0.214 -24.032 0.084 -0.948 0.000 -
85 -12.142 0.112 -48.235 0.026 -0.945 0.000 -
87 -12.162 0.163 -27.079 0.043 -0.956 0.000 -
89 -19.967 0.032 -24690.900 0.004 -0.958 0.000 - -
93 -5.384 0.333 -12.346 0.092 -0.955 0.000 -
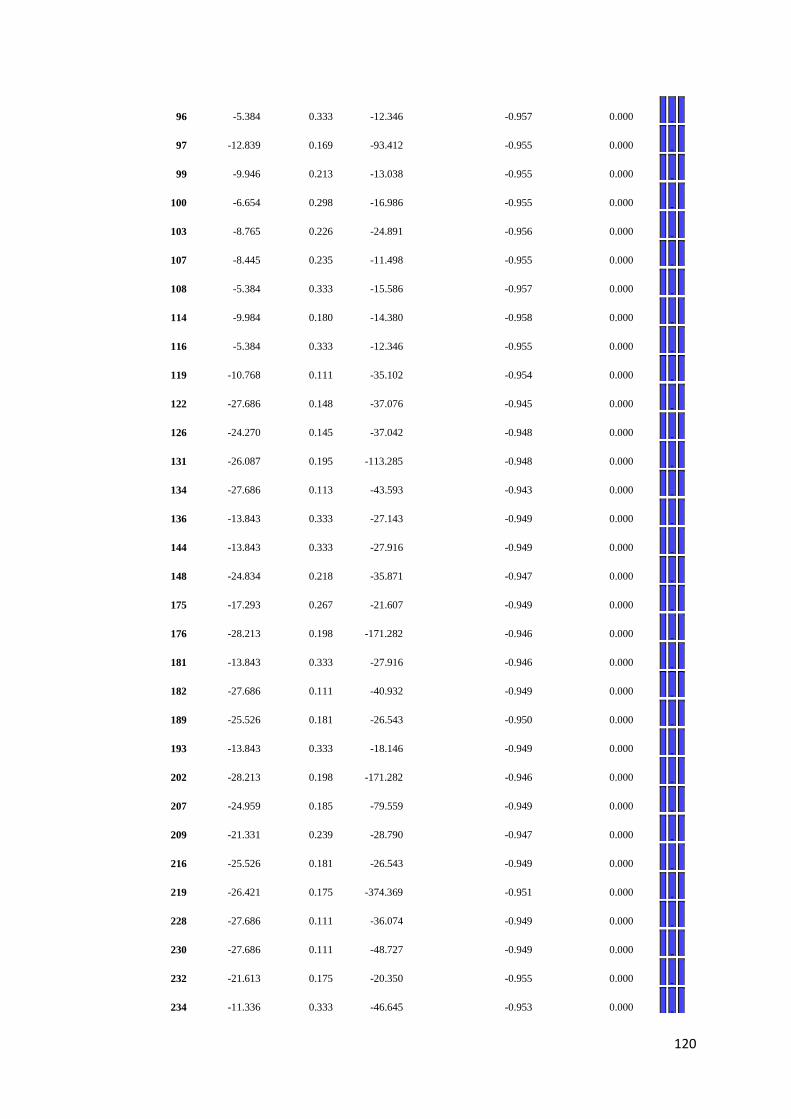
120
96 -5.384 0.333 -12.346 0.082 -0.957 0.000 -
97 -12.839 0.169 -93.412 0.007 -0.955 0.000 -
99 -9.946 0.213 -13.038 0.087 -0.955 0.000 -
100 -6.654 0.298 -16.986 0.084 -0.955 0.000 -
103 -8.765 0.226 -24.891 0.050 -0.956 0.000 -
107 -8.445 0.235 -11.498 0.094 -0.955 0.000 -
108 -5.384 0.333 -15.586 0.081 -0.957 0.000 -
114 -9.984 0.180 -14.380 0.064 -0.958 0.000 -
116 -5.384 0.333 -12.346 0.092 -0.955 0.000 -
119 -10.768 0.111 -35.102 0.013 -0.954 0.000 -
122 -27.686 0.148 -37.076 0.031 -0.945 0.000 -
126 -24.270 0.145 -37.042 0.028 -0.948 0.000 -
131 -26.087 0.195 -113.285 0.027 -0.948 0.000 -
134 -27.686 0.113 -43.593 0.033 -0.943 0.000 -
136 -13.843 0.333 -27.143 0.079 -0.949 0.000 -
144 -13.843 0.333 -27.916 0.077 -0.949 0.000 -
148 -24.834 0.218 -35.871 0.078 -0.947 0.000 -
175 -17.293 0.267 -21.607 0.085 -0.949 0.000 -
176 -28.213 0.198 -171.282 0.020 -0.946 0.000 -
181 -13.843 0.333 -27.916 0.091 -0.946 0.000 -
182 -27.686 0.111 -40.932 0.019 -0.949 0.000 -
189 -25.526 0.181 -26.543 0.066 -0.950 0.000 -
193 -13.843 0.333 -18.146 0.097 -0.949 0.000 -
202 -28.213 0.198 -171.282 0.020 -0.946 0.000 -
207 -24.959 0.185 -79.559 0.015 -0.949 0.000 -
209 -21.331 0.239 -28.790 0.071 -0.947 0.000 -
216 -25.526 0.181 -26.543 0.073 -0.949 0.000 -
219 -26.421 0.175 -374.369 0.015 -0.951 0.000 -
228 -27.686 0.111 -36.074 0.028 -0.949 0.000 -
230 -27.686 0.111 -48.727 0.013 -0.949 0.000 -
232 -21.613 0.175 -20.350 0.060 -0.955 0.000 -
234 -11.336 0.333 -46.645 0.059 -0.953 0.000 -
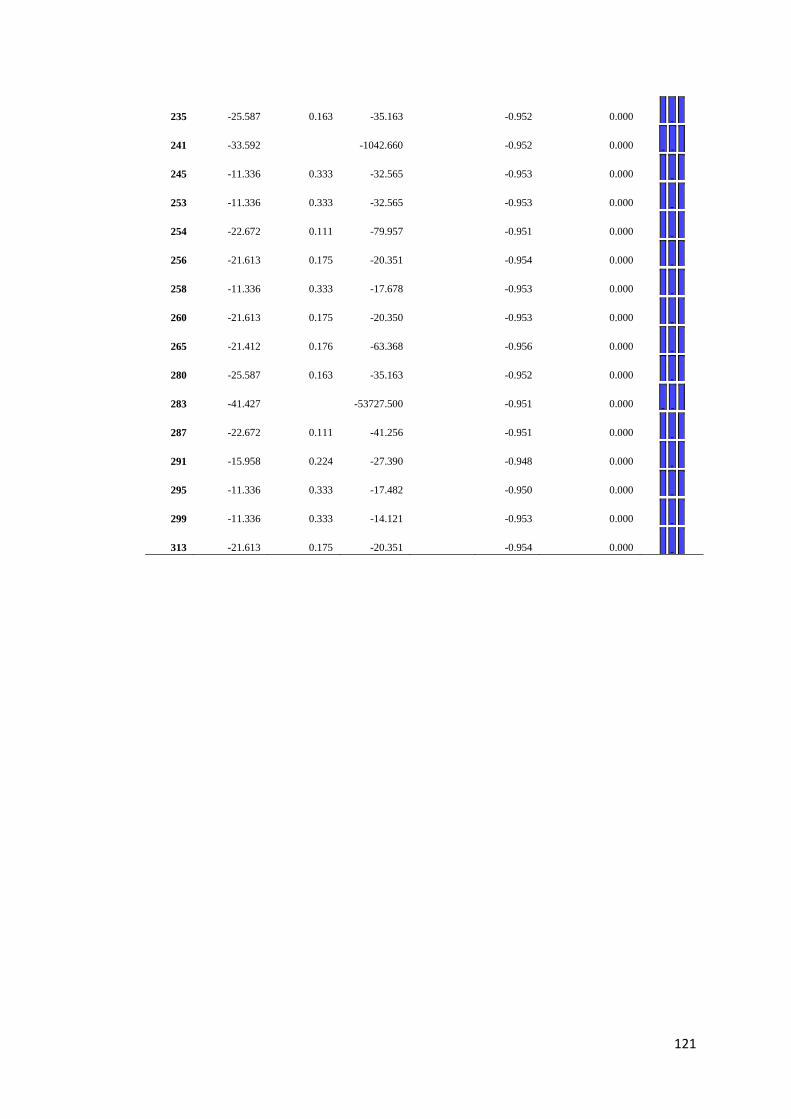
121
235 -25.587 0.163 -35.163 0.050 -0.952 0.000 -
241 -33.592 0.062 -1042.660 0.001 -0.952 0.000 - -
245 -11.336 0.333 -32.565 0.067 -0.953 0.000 -
253 -11.336 0.333 -32.565 0.067 -0.953 0.000 -
254 -22.672 0.111 -79.957 0.013 -0.951 0.000 -
256 -21.613 0.175 -20.351 0.063 -0.954 0.000 -
258 -11.336 0.333 -17.678 0.080 -0.953 0.000 -
260 -21.613 0.175 -20.350 0.072 -0.953 0.000 -
265 -21.412 0.176 -63.368 0.034 -0.956 0.000 -
280 -25.587 0.163 -35.163 0.050 -0.952 0.000 -
283 -41.427 0.045 -53727.500 0.000 -0.951 0.000 - -
287 -22.672 0.111 -41.256 0.017 -0.951 0.000 -
291 -15.958 0.224 -27.390 0.045 -0.948 0.000 -
295 -11.336 0.333 -17.482 0.097 -0.950 0.000 -
299 -11.336 0.333 -14.121 0.095 -0.953 0.000 -
313 -21.613 0.175 -20.351 0.063 -0.954 0.000 -
122
APPENDIX G
List of Oral presentations and workshop
2015 “One base pair deletion is associated with reduction of virulence in australian
Penaeus stylirostris densovirus”, World Aquaculture Conference 2015, 26-
30 June, Jeju, South Korea
2014 “Rapid and sensitive detection of Penaeus stylirostris densovirus by
recombinase polymerase amplification (RPA) combined with a lateral flow
dipstick (LFD)”, Aquaculture America 2014, 9-12 Feb, Seattle, USA
Workshop
2008 Biosafety Course, College of Public Health, Medical and Veterinary
Sciences, James Cook University, Townsville, Queensland, Australia
123
APPENDIX H
Publication 1

124

125

126
127
APPENDIX H
Publication 2

128

129

130

131

132

133

134
135
APPENDIX H
Publication 3

136

137

138

139

140

141

142

143


![INDEX [researchonline.jcu.edu.au]researchonline.jcu.edu.au/15180/6/15180__Lee-Ross... · business travel case study, 240b-241b Cadbury brothers ... Disneyland Paris disabled workers,](https://img.pdfslide.net/doc/110x75/5ae682337f8b9a9e5d8dcf42/index-travel-case-study-240b-241b-cadbury-brothers-disneyland-paris-disabled.jpg)