Embed Size (px)
Citation preview

New Zealand’s remaining indigenous cover: recent changes and biodiversity protection needs
Susan Walker, Robbie Price and Daniel Rutledge
Science for conServation 284
Published by
Science & Technical Publishing
Department of Conservation
PO Box 10420, The Terrace
Wellington 6143, New Zealand

Cover: Remnant of beech forest cut and burned in the 1920s–1930s, Huiarua Station, Tokomaru Bay.
Photo: P. Morrison (1974).
Science for Conservation is a scientific monograph series presenting research funded by New Zealand
Department of Conservation (DOC). Manuscripts are internally and externally peer-reviewed; resulting
publications are considered part of the formal international scientific literature.
Individual copies are printed, and are also available from the departmental website in pdf form. Titles
are listed in our catalogue on the website, refer www.doc.govt.nz under Publications, then Science &
technical.
© Copyright May 2008, New Zealand Department of Conservation
ISSN 1173–2946 (hardcopy)
ISSN 1177–9241 (web PDF)
ISBN 978–0–478–14402–4 (hardcopy)
ISBN 978–0–478–14403–1 (web PDF)
This report was prepared for publication by Science & Technical Publishing; editing and layout by
Sue Hallas. Publication was approved by the Chief Scientist (Research, Development & Improvement
Division), Department of Conservation, Wellington, New Zealand.
In the interest of forest conservation, we support paperless electronic publishing. When printing,
recycled paper is used wherever possible.

CONTeNTS
Abstract 5
1. Introduction 6
1.1 Biodiversity pattern and process at risk of loss 6
1.2 Risk of loss of biodiversity pattern 6
1.3 Limitations of the work 7
2. Background 8
2.1 Past loss of biodiversity and the threat of extinction 8
2.2 The vulnerability principle 9
2.3 Land environment units 10
2.4 Indicating poor legal protection 10
2.5 Indicating risk of loss (SBL) 10
2.5.1 The species–area relationship 11
2.5.2 Fragmentation effects 12
2.5.3 Limitations of the SBL measure 14
2.6 Threat categories for New Zealand’s land environments 14
3. General methods 16
3.1 Data sources 16
3.1.1 Land Cover Database 16
3.1.2 LeNZ 16
3.1.3 Protected areas 17
3.1.4 Districts, regions, DOC conservancies and areas, and
pastoral leases 17
3.1.5 Land-use capability 17
3.2 Data analysis 18
3.2.1 Identifying threatened environments 18
3.2.2 Indigenous cover not protected 18
3.2.3 The appropriate LeNZ level to assess threatened
environments 18
3.2.4 Land-use capability in areas under indigenous cover,
but not protected, in threatened environments 19
3.2.5 Changes in indigenous cover from 1996/97 to 2001/02
and subsequent risk to remaining biodiversity 19
3.3 Data limitations 19
3.3.1 environmental information 19
3.3.2 Land cover 19
3.3.3 Protection information 20
4. Results 20
4.1 Indigenous cover and threatened environments in 2001/02 20
4.2 Indigenous cover not protected in threatened environments 22

4.3 What is the most appropriate LeNZ level? 31
4.4 Land-use capability of indigenous cover not protected 38
4.5 Changes in indigenous cover from 1996/97 to 2001/02
and their consequences to remaining biodiversity 41
4.5.1 Nature of indigenous cover lost 41
4.5.2 Indigenous cover loss across land environments and
threat categories 43
4.5.3 SBL across land environments and threat categories 44
4.5.4 Loss of indigenous cover and change in SBL across
council areas 47
4.6 Changes due to database refinements and/or actual loss of
indigenous cover? 55
5. Discussion 55
5.1 Risk to remaining biodiversity in New Zealand 55
5.2 Pattern of loss of indigenous cover 56
5.3 The most appropriate LeNZ level 58
5.4 Dissemination of threat classification information 59
5.5 Limitations of the environment threat categories for
identifying significant indigenous vegetation 60
6. Conclusions 61
7. Recommendations 62
8. Acknowledgements 63
9. References 63
Appendix 1
Indigenous (‘1’) and non-indigenous (‘0’) cover classes (LCDB 1 and
LCDB 2) 67
Appendix 2
Area of indigenous vegetation not protected in LeNZ environments 68
Appendix 3
Level IV environments compared with Level II environment F1 77
Appendix 4
example of an interactive GIS application of the threat
classification table 81

5Science for Conservation 284
© Copyright May 2008, Department of Conservation. This paper may be cited as:
Walker, S.; Price, R.; Rutledge, D. 2008: New Zealand’s remaining indigenous cover: recent
changes and biodiversity protection needs. Science for Conservation 284. Department of
Conservation, Wellington. 82 p.
New Zealand’s remaining indigenous cover: recent changes and biodiversity protection needs
Susan Walker1, Robbie Price2 and Daniel Rutledge2
1 Landcare Research, Private Bag 1930, Dunedin 9054, New Zealand
email: [email protected]
2 Landcare Research, Private Bag 3127, Hamilton 3240, New Zealand
A B S T R A C T
There has been substantial loss of indigenous habitat in New Zealand’s coastal,
lowland and montane environments—and what does remain has little legal
protection. We define five categories of environments that contain indigenous
biodiversity most at risk of loss due to land clearance; risk was determined based
on the level of legal protection and past habitat loss. Land clearance and loss of
indigenous habitats continues across New Zealand, and highest rates of loss are
occurring in the most threatened environments. Moreover, ecosystems in these
most threatened areas support a disproportionate percentage of New Zealand’s
most threatened species and habitats. Thus, this pattern of clearance will
exacerbate threats to biodiversity. We recommend that the Land environments
of New Zealand database (LeNZ) be used to identify environments that are most
threatened by land clearance. The Land Cover Database will need to be updated
regularly to monitor progress in halting biodiversity declines.
Keywords: indigenous cover loss, at risk biodiversity

6 Walker et al.—New Zealand’s remaining indigenous cover
1. Introduction
This work has four objectives, addressing the current status of New Zealand’s
indigenous cover and change, and the consequences of the latter:
To explain the likely consequences for indigenous biodiversity of historical •
(prehuman to 2001/02) changes in indigenous land cover
To identify New Zealand’s terrestrial environments (as defined in the Land •
environments of New Zealand database (LeNZ); Leathwick et al. 2003b) that
are most vulnerable to biodiversity loss
To calculate the area of unprotected indigenous cover, identified in the •
national Land Cover Database (LCDB), in threatened land environments by
local authority district
To estimate the change in indigenous land cover from 1996/97 to 2001/02 •
in land environments, and the consequent likely change in risk to remaining
biodiversity, in each local authority district and Department of Conservation
(DOC) conservancy and area
1 . 1 B I O D I V e R S I T y P A T T e R N A N D P R O C e S S A T R I S K O F L O S S
The persistence of biodiversity requires the protection of both biodiversity
pattern (the ‘full range’ of biodiversity from genes to species, communities,
habitats and ecosystems, and landscapes) and the ecological and evolutionary
processes that sustain it (Margules & Pressey 2000; Moritz 2002).
Both pattern and processes are under threat in New Zealand. Indigenous
biodiversity pattern is under threat from ‘insufficient and fragmented habitat’,
while processes are under threat from ‘introduced invasive species which damage
their habitat and important ecosystem processes’.
1 . 2 R I S K O F L O S S O F B I O D I V e R S I T y P A T T e R N
The first objective of The New Zealand Biodiversity Strategy (NZBS) (DOC
& Mfe 2000: 41) regarding biodiversity on land addresses the threat posed to
biodiversity pattern by insufficient and fragmented habitat. Specifically, Objective
1.1 for biodiversity on land is to:
enhance the existing network of protected areas to secure a full range of •
remaining indigenous habitats and ecosystems.
Promote and encourage initiatives to protect, maintain and restore habitats •
and ecosystems that are important for indigenous biodiversity on land outside
of protected areas.
Priority actions associated with this objective require New Zealand agencies to
work to protect and maintain habitats and ecosystems important for indigenous

7Science for Conservation 284
biodiversity that are not represented in the existing protected area network or at
significant risk of irreversible loss or decline.
National databases can assist agencies to identify places where biodiversity
pattern is at significant risk of loss or decline. In this work, we combine databases
describing land environments, land cover and protected areas to determine the
extent of past habitat loss and legal protection within land environments. We use
past habitat loss and the legal protection status of land environments to indicate
places where the risk of irreversible biodiversity loss or decline through land
clearance (and the combined effects of fragmentation, pests, weeds and other
pressures) is likely to be greatest.
Specifically, this work suggests that indigenous habitats remaining in land
environments that have been much reduced in the past (much reduced
environments) are likely to support some of New Zealand’s rarest biodiversity
today. Further loss of these indigenous habitats would be a major setback
to the goal of maintaining a full range of biodiversity, and could result in
disproportionate loss of species (see below). effects of habitat fragmentation
are also likely to increase the risk of biodiversity loss in much reduced habitats.
Indigenous habitats remaining in land environments with little of their land area
legally protected for conservation purposes (poorly protected environments) are
also likely to contain biodiversity at high risk of loss. This is because indigenous
habitats that are not legally protected are more likely to be cleared for future land
development than legally protected habitats. Unprotected indigenous habitats
are also less likely to be fenced against stock, and/or to receive regular pest and
weed control to maintain biodiversity.
Work to protect, maintain and restore unprotected indigenous habitats in much
reduced and poorly protected environments would, therefore, make a major
difference to the security of a full range of New Zealand’s biodiversity.
1 . 3 L I M I T A T I O N S O F T H e W O R K
This work directs attention to places that are vulnerable to loss of biodiversity
pattern only. Specifically, it identifies places where biodiversity is vulnerable
because remaining habitats and ecosystems are likely to be at high risk from land
clearance and vulnerable to the effects of fragmentation, and where the costs of
further clearance to biodiversity could be disproportionately high.
The persistence of biodiversity requires protection not only of pattern but also
of essential ecological and evolutionary processes. Therefore, agencies with
responsibilities for biodiversity must allocate their resources to maintain both.
This work does not identify places where biodiversity is vulnerable to pressures
that damage ecosystem processes (e.g. predators, weeds, pollution, fire, drainage
and/or extractive land uses such as selective logging and extensive grazing). These
pressures threaten biodiversity processes in all environments in New Zealand,
not just in those environments that are much reduced and poorly protected.
Many indigenous species survive today only in relatively intact, extensive and
well-protected environments, depend upon ecosystem attributes and processes
that have been lost from more fragmented landscapes, and remain vulnerable to
ubiquitous pests, weeds and extractive land uses that continue to degrade them.

8 Walker et al.—New Zealand’s remaining indigenous cover
Accordingly, this work does not suggest that indigenous habitats in much
reduced and poorly protected land environments are the only places that require
biodiversity protection. Nor do we suggest that maintaining indigenous habitats
in relatively intact and well-protected environments is superfluous to the goal
of halting biodiversity decline. We simply indicate that more intact and better-
protected environments will tend to support biodiversity that is less threatened
by direct land clearance and the effects of fragmentation than biodiversity in
much reduced and poorly protected land environments.
Unfortunately, national, spatially explicit measures and estimates of process
disruption are not yet available to reveal how risks to biodiversity processes are
distributed across the landscape. Although the magnitude of impacts of pattern
and process loss cannot be objectively compared at this time, we may be sure that
their combined effect is considerably greater than loss of pattern (i.e. habitat loss)
alone. Therefore, our assessment of threat to remaining indigenous biodiversity
in environments on the basis of habitat (pattern) loss and legal protection will
considerably underestimate actual threat.
2. Background
2 . 1 P A S T L O S S O F B I O D I V e R S I T y A N D T H e T H R e A T O F e x T I N C T I O N
Historically, protection for New Zealand’s indigenous biota has largely been
opportunistic, expedient and ad hoc (Kelly 1980). As a consequence, the
national network of protected areas is strongly skewed towards higher, wetter,
mountainous environments, and there is little protection of habitats and
ecosystems in productive lowland and montane environments. There has also been
differential concentration of human impacts and loss or removal of indigenous
biodiversity across New Zealand’s environments. In general, environments of the
alpine and upper montane zones remain dominated by indigenous cover, while
environments of the warmer lower montane and lowland zones contain only
traces of indigenous communities, as a consequence of more intensive land-use
activities.
Similarly uneven patterns of protection and loss are evident in most nations in
the world (see Pressey et al. 1993; Pressey 1994; Stewart et al. 2003). Worldwide,
the consequences include increased loss and extinction of indigenous species in
those habitats and ecosystems where indigenous habitat loss has been greatest,
and where the proportion of land set aside for protection is smallest (e.g. Heijnis
et al. 1999; Heydenrych et al. 1999; Gaston et al. 2002).
Direct (or ‘active’) clearance for human land use (e.g. ploughing, felling, planting
in exotic forestry trees) is the principal cause of loss of indigenous cover in New
Zealand. Some additional loss also occurs through attrition and the deterioration
of fundamental processes (or ‘passive’ clearance; e.g. dieback of forest edges
may be caused by browsing). The consequences of habitat loss for biodiversity
are perhaps most plainly illustrated by the distribution of threatened plant species,

9Science for Conservation 284
which is strongly skewed towards lowland environments (e.g. Rogers & Walker
2002). For example, of New Zealand’s 278 Acutely and Chronically Threatened
vascular plant species—the two highest categories of extinction threat in the
New Zealand threat classification system of Molloy et al. (2002)—20% are coastal,
37% occur in the lowland zone and a further 31% in the montane zone, while the
subalpine and alpine zones contain only 7% and 5%, respectively (de Lange et
al. 2004). The concentration of threatened species at low elevations is also seen
at the regional scale. For example, Lee & Walker (2004) report that 80% of the
Acutely and Chronically Threatened vascular plants of the inland Central Otago
District occur in the lowland and montane zones.
2 . 2 T H e V U L N e R A B I L I T y P R I N C I P L e
It is recognised in New Zealand (e.g. in NZBS (DOC & Mfe 2000: 41, Objective
1.1a, above)) and internationally (Margules et al. 1988, 2002; Rouget et al.
2003) that there is an urgent need to establish more representative networks
of protected areas if much of today’s biodiversity is to survive into the future.
However, some species, habitats and ecosystems are less likely to persist under
current and future land-use trends and pressures than others1. Therefore, over
time, realistic opportunities for the protection of biodiversity are reduced, by
incremental or rapid loss, to a subset of the full range. This subset will typically
contain only those elements of the full range that are safest from clearance, pest
invasion and other pressures (Pressey & Taffs 2001a, b; Rouget et al. 2003).
Because realistic opportunities for the protection of biodiversity decrease over
time, achieving representativeness becomes less likely. If representativeness is to
be achieved, priority for protection must be given to the most vulnerable elements
of the full range of biodiversity pattern, i.e. those ecosystems, communities
and/or species for which there is the greatest likelihood of imminent loss or
degradation (World Resources Institute 1992; Pressey 1994; Pressey & Taffs
2001b).
This vulnerability principle (‘priority for protection must be given to the most
vulnerable elements of the full range’) is emphasised in the NZBS (DOC & Mfe
2000). For example, the first Priority Action (Objective 1, Biodiversity on Land,
Action b) states that priority for addition to public conservation lands should be
given to those ‘habitats and ecosystems important for indigenous biodiversity
that are not represented within the existing protected area network, or that are
at significant risk of irreversible loss or decline’.
These two characteristics—poor legal protection and risk of loss—are two
components of vulnerability.
1 For example, The NZBS (DOC & Mfe 2000: 34) highlights a number of examples of imminently
threatened ‘scarce habitats’ that remain largely unprotected and vulnerable to ongoing decline
because of the pressure to clear land for intensive use (e.g. agricultural development, urbanisation)
and/or the pressures imposed by introduced weeds. In contrast, most alpine and forest environments
are comparatively safe from direct clearance, since they are largely legally protected, and are either
unsuitable for human use or remote from human-induced pressures

10 Walker et al.—New Zealand’s remaining indigenous cover
2 . 3 L A N D e N V I R O N M e N T U N I T S
LeNZ provides a national spatial framework of units (‘land environments’) to
assess the vulnerability of remaining indigenous habitats and ecosystems. We
use the measures ‘poor legal protection’ and ‘susceptibility to biodiversity loss’
(SBL), respectively, to represent the two components of vulnerability within land
environments.
2 . 4 I N D I C A T I N G P O O R L e G A L P R O T e C T I O N
New Zealand is an island with an unusual evolutionary history of prolonged
isolation, and its indigenous biodiversity is distinctive and particularly vulnerable
to introduced herbivores, predators and weeds (e.g. Atkinson & Cameron 1993).
These ubiquitous pressures reduce the viability and persistence of biodiversity
across the landscape (including legally protected areas), and active ongoing
intervention is generally needed to secure biodiversity (Perley et al. 2001).
The combination of innate vulnerability with extreme habitat loss in lowland
environments has resulted in New Zealand having one of the worst records of
biodiversity loss of anywhere on earth (DOC & Mfe 2000: 4). In Australia and
other Commonwealth nations, legal protection of 15% of original ecosystem
extent has been adopted as a pragmatic (and arbitrary) target for conservation
planning purposes (e.g. Pressey & Taffs 2001a). However, to sustain biodiversity
in New Zealand, it is probably necessary to retain and actively manage indigenous
biodiversity across greater proportions of the original ecosystem than in most
other nations.
Accordingly, we suggest that in New Zealand a safety net of legal protection
covering at least 20% of the original area of each land environment is desirable
to retain a full range of biodiversity (see Lee & Walker 2004; Walker & Lee
2004; Walker et al. 2004). Support for this suggestion is also drawn from the
species–area relationship (see section 2.5.1), which indicates that indigenous
biodiversity decreases particularly rapidly once less than about 20% of original
habitat remains (but as we note in section 2.5.2, the onset of rapid decline may
occur earlier owing to isolation, co-extinction and other associated factors).
2 . 5 I N D I C A T I N G R I S K O F L O S S ( S B L )
Generalisations from ecological research suggest that risk of future biodiversity
loss is related to the extent of past loss of natural habitat. Below we give
synopses of two relevant generalisations from ecological science: species–area
relationships and fragmentation effects2.
2 The species–area relationship and fragmentation effects are the basis for various international
predictions of extinction risk related to habitat loss (see for example Brooks et al. 1997, 1999; Fahrig
1997, 2002; Thomas et al. 2004).
11Science for Conservation 284
2.5.1 The species–area relationship
Characteristics of the species–area relationship
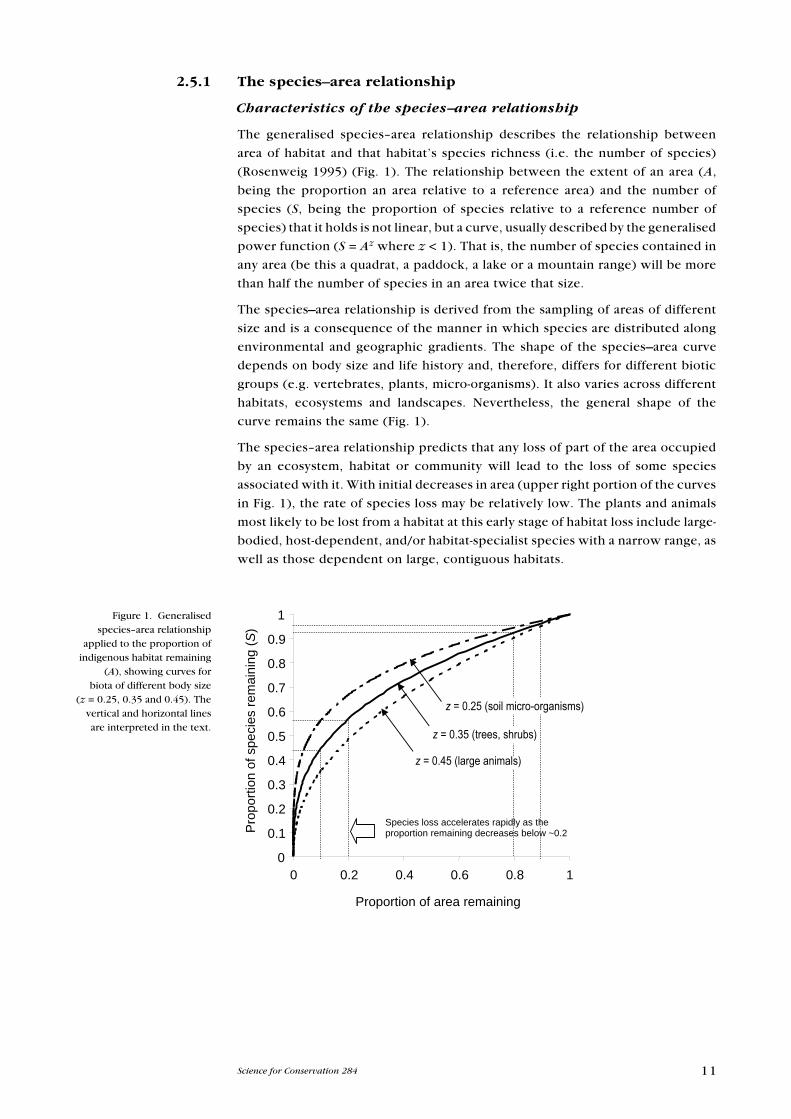
The generalised species–area relationship describes the relationship between
area of habitat and that habitat’s species richness (i.e. the number of species)
(Rosenweig 1995) (Fig. 1). The relationship between the extent of an area (A,
being the proportion an area relative to a reference area) and the number of
species (S, being the proportion of species relative to a reference number of
species) that it holds is not linear, but a curve, usually described by the generalised
power function (S = Az where z < 1). That is, the number of species contained in
any area (be this a quadrat, a paddock, a lake or a mountain range) will be more
than half the number of species in an area twice that size.
The species–area relationship is derived from the sampling of areas of different
size and is a consequence of the manner in which species are distributed along
environmental and geographic gradients. The shape of the species–area curve
depends on body size and life history and, therefore, differs for different biotic
groups (e.g. vertebrates, plants, micro-organisms). It also varies across different
habitats, ecosystems and landscapes. Nevertheless, the general shape of the
curve remains the same (Fig. 1).
The species–area relationship predicts that any loss of part of the area occupied
by an ecosystem, habitat or community will lead to the loss of some species
associated with it. With initial decreases in area (upper right portion of the curves
in Fig. 1), the rate of species loss may be relatively low. The plants and animals
most likely to be lost from a habitat at this early stage of habitat loss include large-
bodied, host-dependent, and/or habitat-specialist species with a narrow range, as
well as those dependent on large, contiguous habitats.
Figure 1. Generalised species–area relationship
applied to the proportion of indigenous habitat remaining
(A), showing curves for biota of different body size
(z = 0.25, 0.35 and 0.45). The vertical and horizontal lines are interpreted in the text.
Species loss accelerates rapidly as the proportion remaining decreases below ~0.2
z = 0.25 (soil microorganisms)
z = 0.35 (trees, shrubs)
z = 0.45 (large animals)
0
0.1
0.2
0.3
0.4
0.5
0.6
0.7
0.8
0.9
1
0 0.2 0.4 0.6 0.8 1
Proportion of area remaining
Pro
porti
on o
f spe
cies
rem
aini
ng (S
)
Figure 1
z = 0.25 (soil micro-organisms)
z = 0.35 (trees, shrubs)
z = 0.45 (large animals)

12 Walker et al.—New Zealand’s remaining indigenous cover
As habitat area is further reduced, the rate of species loss increases, and biota in
smaller size classes also become affected (middle portion of the curves in Fig. 1)
together with more wide-ranging, generalist species. As the area of indigenous
habitat decreases, each increment of further loss results in a greater magnitude
of loss of remaining biodiversity (lower left portion of the curves in Fig. 1).
However, because of the nature of the relationship between area and richness,
the last indigenous remnants in an environment are predicted to still contain a
proportion of the biodiversity associated with that environment.
Indicating SBL using the species–area relationship
A species–area relationship with an exponent (z) of 0.35 (see Fig. 1) may be an
appropriate ‘average’ to apply to biodiversity protection in New Zealand. This
exponent represents the end of the range of 0.25–0.35 suggested for islands
(Rosenweig 1995) and is most appropriate for prominent components of
vegetation, which are readily recognised (including by remote sensing), and is often
pragmatically used as a surrogate for other elements of indigenous biodiversity.
The curve of the species–area relationship with an exponent z = 0.35 predicts that
a 10% change from 90% to 80% remaining habitat (i.e. a change in the proportion
remaining from 0.9 to 0.8) will remove 3.9% of the original full complement of
species and 4.0% of those remaining in an area, but a 10% reduction from 20% to
10% remaining habitat removes 12.3% of the original full complement of species
and 21.5% of the species remaining. (These different rates of loss are indicated
by the distances between each pair of horizontal lines in Fig. 1.)
We refer to this increasing rate of loss as habitat loss proceeds as ‘susceptibility
to biodiversity loss’ or ‘SBL’. It can be quantified as a function of the proportion
or area of habitat remaining, being the derivative of the generalised species–
area relationship (i.e. the slope, or instantaneous rate of change at any point;
Fig. 2).The mathematical expression to calculate SBL is based on a generalised
species–area relationship with an exponent of 0.35:
SBL =0.35 × (proportion remaining indigenous cover (0.35 – 1)).
SBL ranges from 0.35 in an intact habitat to infinity when habitat area remaining
is negligible (Fig. 2).
In this work, we use SBL to indicate the relative impact of any increment of further
habitat loss within an environment, based on the loss that it has undergone in
the past.
2.5.2 Fragmentation effects
The species–area relationship and SBL indicate the likely non-linear consequences
of loss of habitat area for remaining biodiversity. However, in biological systems,
habitat loss and fragmentation also alter the nature of habitat, with negative
consequences for biodiversity beyond that due to the loss of habitat area alone.
Some fragmentation effects, like area effects, are also non-linear. In other words,
as with the species–area relationship, their effects increase more rapidly in
severity as habitat loss advances. For example, Andrén (1994) demonstrated
that there is a rapid increase in the average distance between habitat patches
(isolation) as the proportion of habitat in a landscape decreases below about 0.3
(or 30%) (Fig. 3).

13Science for Conservation 284
Figure 2. Susceptibility to biodiversity loss (SBL) v.
the proportion of species remaining for each land
environment (A). SBL is the instantaneous rate of change at any point of the species–area curve where z = 0.35.
Figure 3. Average and maximum simulated
isolation (distance to nearest neighbouring habitat) in
relation to the proportion of habitat remaining based
on simulations of habitat fragmentation (redrawn
from Andrén (1994)). A: One possible configuration
of fragmentation of habitat (black pixels). B: Average and maximum isolation of
remaining pixels derived from multiple random
spatial configurations of fragmentation for different
proportions of remaining habitat.
A.
Proportion of area remaining (A)
0
2
4
6
8
10
12
0.0 0.2 0.4 0.6 0.8 1.0
SBL = 0.35 A0.35-1
Proportion biodiversity remaining (Species–area relationship A
0.35) S
usce
ptib
ility
to b
iodi
vers
ity lo
ss (S
BL)
Proportion area remaining (A)
Figure 2
SBL = 0.35 A(0.35 - 1)
���
�����
����
����
�����
�����
������������
����
�����
�����
�����
�
�
�
�
�
��
� �� �� �� �� ������������������������������������������������������
���
����
����
����
����
����
����
����
��
�������������������������������������������������������������������
��������
��B.
0 10 20 30 40 50 60 70 80 90 100

14 Walker et al.—New Zealand’s remaining indigenous cover
Increased distance between habitat patches can: limit species’ access to key
resources; restrict the potential of migration for species and populations (for
example, as climate change progresses); and prevent the exchange of genetic
material between populations. Resulting inbreeding then lowers long-term
viability and limits resilience (i.e. ability to survive extremes or adapt to change).
For a New Zealand example, see Berry et al. (2005). Andrén (1994, 1996) suggested
that increased isolation may lead to sharp population declines once a threshold
of loss (generally between 10% and 30% habitat remaining) is exceeded. As with
the species–area relationship, this threshold is likely to vary across different
landscapes and biotic groups.
The ratio of fragment edge to fragment interior area also increases exponentially
as the average habitat patch area decreases with increased habitat loss. Small
fragments in modified landscapes may be largely or entirely edge habitat (i.e.
they have little or no buffered interior). The adverse physical and biological
consequences of high edge-to-interior ratios include increased exposure to
desiccation and climate extremes, and increased penetration by weeds and pests
(Harrison & Bruna 1999).
effects of fragmentation may contribute to more rapid biodiversity loss, and
higher risk to remaining indigenous biodiversity, than would be predicted by
habitat area loss alone. Consequently, the onset of rapid loss of biodiversity is
likely to commence earlier, and declines may be more rapid than suggested by
the species–area relationship and measures such as SBL that are based on it.
2.5.3 Limitations of the SBL measure
The SBL measure indicates the relative risk to remaining indigenous biodiversity
within any land environment, based on the species–area relationship. Our
application of the index is straightforward: environments are treated as individual
units, and no attempt is made to account for relationships among environments
(e.g. the effect of habitat loss within one environment on biodiversity within
another, adjacent or similar environment). The index does not quantify actual
biodiversity either within or across environments; this is because understanding
of potential and actual biodiversity patterns is still too rudimentary to allow us
to do so. It is very likely that more sophisticated measures of risk to indigenous
biodiversity across landscapes will be developed in the future, based on a deeper
and more detailed understanding of actual and potential biodiversity pattern
within and across environments.
2 . 6 T H R e A T C A T e G O R I e S F O R N e W Z e A L A N D ’ S L A N D e N V I R O N M e N T S
We propose a classification of threat to the remaining indigenous biodiversity in
New Zealand’s land environments based on the two components of vulnerability
(likelihood of loss): poor legal protection and risk of loss.
We use the past level of habitat loss (represented by percentage remaining
indigenous cover) as the primary threat criterion. Based on the above principles
(species–area relationships and fragmentation effects), remaining indigenous
biodiversity within environments with less than 30% indigenous cover is

15Science for Conservation 284
considered ‘threatened’ by land clearance (Table 1). Indigenous biodiversity is
classified as ‘At Risk’ in environments where 20–30% of indigenous cover remains,
and ‘Chronically Threatened’ in environments where 10–20% indigenous cover
remains. When less than 10% of indigenous cover remains, indigenous biodiversity
is considered to be ‘Acutely Threatened’. We have chosen the terminology
for these three threat categories to be consistent with the national system for
classifying species according to threat of extinction (Molloy et al. 2002)3.
Two further threat categories are erected to take poor legal protection into
account (Table 1). environments that have more than 30% indigenous cover
remaining and are poorly protected (i.e. they have less than 20% of their area
under legal protection) are categorised as ‘Critically Underprotected’ if less than
10% is protected, and ‘Underprotected’ if 10–20% is protected.
For convenience, we refer to environments within any of these five categories
as ‘threatened environments’.
environments that have been less preferred for intensive land uses in the past,
and have a fifth or more of their land area protected against future loss, fall into a
sixth category that we name ‘Less Reduced and Better Protected’ (more than 30%
indigenous cover remains, and over 20% of it is protected). This name reflects that
biodiversity within these environments is not entirely secure; rather, it remains
vulnerable to future loss should land-use patterns change, and to ubiquitous
pests and weeds. Vulnerable elements of the full range of biodiversity (e.g. large-
bodied, host-dependent and/or habitat-specialist species with a narrow range, and
those dependent on large, contiguous habitats) will be lost from environments
well before loss of 70% of original habitat has occurred. Therefore, environments
that are less reduced and better protected today support indigenous species that
can survive only in relatively intact, extensive and well-protected environments.
Their persistence will depend on the maintenance of extensive areas of native
cover, and of healthy, functioning ecosystem processes that have been lost from
the more fragmented landscapes represented in threatened environments.
3 The New Zealand threat classification system was designed specifically for taxa that occur in New
Zealand. Three higher-order categories and seven classes of threat are recognised, in order of
increasing threat: At Risk (Range Restricted and Sparse classes), Chronically Threatened (Serious
Decline and Gradual Decline classes), Acutely Threatened (Nationally Critical, Nationally endangered
and Nationally Vulnerable classes).
TABLe 1. THe SIx ReCOMMeNDeD LAND eNVIRONMeNT CATeGORIeS, AND
DeFINING CRITeRIA.
NO. CATeGORy CRITeRIA
1 Acutely Threatened < 10% indigenous cover remaining
2 Chronically Threatened 10–20% indigenous cover remaining
3 At Risk 20–30% indigenous cover remaining
4 Critically Underprotected > 30% indigenous cover remaining, < 10% legally protected
5 Underprotected > 30% indigenous cover remaining, 10–20% legally protected
6 Less Reduced and Better > 30% indigenous cover remaining, > 20% legally protected
Protected

16 Walker et al.—New Zealand’s remaining indigenous cover
3. General methods
3 . 1 D A T A S O U R C e S
Five sources of spatial data in digital format (GIS shapefiles and grids) were used
in the analyses.
3.1.1 Land Cover Database
Three versions of the Land Cover Database are available:
LCDB 1_2 (derived from satellite imagery acquired in 1996/97, second version, •
released in 2001, 14 cover classes)
LCDB 1C (corrected version, derived from satellite imagery acquired in •
1996/97, released July 2004, 43 classes)
LCDB 2 (derived from satellite imagery acquired September 2001–March •
2002, released July 2004, 43 classes) (Terralink 2004)
We used LCDB 1C as the principal data source defining the status of indigenous
cover in New Zealand in the summer of 1996/97. LCDB 2 was used to represent
land cover in 2001/02. Note that in this report LCDB 1C is referred to as ‘LCDB 1’
and that LCDB 1_2 data are presented only in section 4.6.
The 43 classes of land cover within LCDB 1 and LCDB 2 were assigned to
indigenous (22 ‘natural’ LCDB 2 cover classes) and non-indigenous (21 ‘exotic’
LCDB 2 cover classes) categories (Appendix 1). A third category (non-indigenous
cover recently disturbed, ‘NIRD’) was developed for LCDB 2 and represents areas
that had been classified as ‘Non-indigenous’ in 1996/97 that had changed by
2001/02 to one of the following LCDB 2 classes: 10, Coastal Sand and Gravel;
11, River and Lakeshore Gravel and Rock; or 12, Landslide. Because NIRD areas
do not represent recovery of indigenous vegetation, and are unlikely to revert to
indigenous cover over time, we assigned them to non-indigenous cover.
As stated previously, past level of habitat loss was to be our primary threat
criterion, so the percentage of indigenous cover remaining in an environment
in 2001/02 (based on indigenous cover classes of LCDB 2) was used to estimate
the risk to remaining biodiversity within that environment, i.e. its SBL. Change
in the percentage of indigenous cover remaining in an environment between
1996/97 and 2001/02 was used to estimate the change in the risk to indigenous
biodiversity within an environment.
3.1.2 LENZ
The LeNZ classification (Leathwick et al. 2003b) identifies the diversity of New
Zealand’s terrestrial environments, based on climate, soil and landform. Because
these factors are major drivers of the patterns of living organisms, it is reasonable
to assume that each different environment supported a unique assemblage of
ecosystems, habitats and species in the past—not different in all respects, but
in important features, from that in other environments. LeNZ can, therefore, be
used as a surrogate for the potential ‘full range’ of terrestrial ecosystems, habitats
and biodiversity once found across New Zealand.

17Science for Conservation 284
Land environments are classified at four different national scales: Level I (20 land
environments, A to T), Level II (100 land environments, A1 to T1), Level III (200
land environments, A1.1 to T1.1) and Level IV (500 land environments, A1.1a to
T1.1a). each level is nested within higher levels.
Because LeNZ is not a map of ecosystems or vegetation, but a map of abiotic
environments; the boundaries often divide environmental gradients that are
generally not visible on the ground. Because environmental gradients are often
gradual rather than sharp, and because the land cover seen on the ground today
is the product of both history and environment, current vegetation patterns are
most unlikely to ever match LeNZ boundaries. even at the finest level of LeNZ
(Level IV), each land environment is likely to contain a variety of native habitats
and ecosystems that grade continuously into habitats and ecosystems of adjacent
environments. Loss and protection statistics for a land environment are an average
taken across the different native habitats and ecosystems contained within it.
3.1.3 Protected areas
We used the ‘protection’ dataset compiled for Mfe, DOC & LGNZ (2004),
comprising land managed by DOC, and covenants administered by the Nature
Heritage Fund, Nga Whenua Rahui and Queen elizabeth II National Trust.
Limitations and methods relating to these data are described by Rutledge et al.
(2004). Note that council-protected lands are not included in this dataset.
The percentage area of land and/or indigenous cover of a land environment that
is protected (i.e. set aside for biodiversity conservation purposes) is a useful
index of how well the ecosystems, habitats and biodiversity associated with
that environment are protected from further loss (Leathwick et al. 2003a; Lee &
Walker 2004).
3.1.4 Districts, regions, DOC conservancies and areas, and pastoral leases
To define political districts and regions, we used national GIS databases delineating
73 local authority districts and cities, and 16 local authority regions. We did not
split political districts where they spread across more than one political region
(e.g. Franklin District, which spreads across Auckland and Waikato regions, was
kept distinct) (Table A2.1). DOC supplied spatial data showing its conservancy
and area boundaries in August 2006. To define the spatial extent of the 304
pastoral leases in the South Island high country, we used a spatial database of
lease boundaries supplied by DOC in January 2004.
3.1.5 Land-use capability
eight classes of Land-use capability (LUC) were used from the NZLRI (New
Zealand Land Resource Inventory; held by Landcare Research). The NZLRI is
a spatial database of 100 000 polygons (land parcels) covering the whole of
New Zealand. The characteristics or attributes (e.g. rock, soil, slope, erosion,
vegetation, LUC) of each parcel of land is described. LUC is an assessment of
the land’s capacity for sustained productive use taking into account physical
limitations, soil conservation needs and management requirements. ‘Class’ is
the most general unit of LUC, categorising land into eight classes, from Class I
(the most versatile and productive class with the highest value for agricultural
production) to VIII (the class with most limitations to use and, therefore, the
lowest value for agricultural production).

18 Walker et al.—New Zealand’s remaining indigenous cover
All shapefiles were converted to 25-m grids for analysis. The spatial database and
analysis methods were based on, and described by, Rutledge et al. (2004).
3 . 2 D A T A A N A L y S I S
3.2.1 Identifying threatened environments
Using LeNZ, LCDB 2, and the protection dataset, we calculated (1) the total area
of each land environment and (2) the area of each land environment within an
indigenous cover class (hereafter referred to as ‘indigenous cover remaining’),
and (3) the area of each land environment that was legally protected. Then, for
each of the five environment threat categories, we calculated the number of land
environments, the total area of the environments, and the total area of indigenous
cover.We then assigned each land environment to one of six categories, based
on the criteria in Table 1. This analysis was performed twice, with categories
determined at Levels IV and II of LeNZ, respectively.
To provide an overview of the distribution of threat categories across New
Zealand’s land environments, we (1) calculated the number of Level IV land
environments in each threat category within each Level I land environment, and
(2) mapped the national distributions of threatened environments.
3.2.2 Indigenous cover not protected
We calculated the area of each land environment that was under indigenous
cover and not within legally protected land (indigenous cover not protected,
hereafter ‘INP’) in 2001/02. We then calculated the area of indigenous cover not
protected in the first five land environment categories referred to as ‘threatened
environments’ (hereafter ‘INPTe’). Next, we calculated the area of INPTe in each
of New Zealand’s 73 district councils in DOC conservancies and areas, and in each
threatened environment category. We also calculated the area of INPTe within the
boundaries of the 304 pastoral leases remaining in the South Island High Country.
Again, each of these analyses was performed twice, with land environment threat
categories determined at Levels IV and II of LeNZ, respectively.
3.2.3 The appropriate LENZ level to assess threatened environments
Next, we compared the effectiveness and efficiency of threat categories
determined at Level II and Level IV. First, we illustrated effectiveness and efficiency
by examining variability of protection and land clearance, of biodiversity pattern,
and of current land cover types across Level IV environments within a given
Level II environment (F1).
We then quantified, across all land environments, land areas affected by two
issues arising from threat classification at Level II, rather than Level IV. First,
we quantified the less effective protection that would arise because the areas
are assigned to a lower category of threat, or to the ‘Less Reduced and Better
Protected’ category. Second, we quantified the less efficient protection resulting
from areas of indigenous cover being classified as ‘threatened’ when in fact they
were less reduced and/or better protected.

19Science for Conservation 284
3.2.4 Land-use capability in areas under indigenous cover, but not protected, in threatened environments
We calculated the area of indigenous cover not protected (INP) in each of eight
LUC classes and each of the six land environment categories. This analysis was
performed twice, with land environment categories determined at Level IV and
Level II of LeNZ.
3.2.5 Changes in indigenous cover from 1996/97 to 2001/02 and subsequent risk to remaining biodiversity
By comparing LCDB 1 and LCDB 2, we quantified the total change and net loss
of indigenous cover from 1996/97 to 2001/02 by environment threat category
and indigenous cover class. We calculated the rate of loss of indigenous cover
from 1996/97 to 2001/02 in each land environment as a percentage of LCDB 1
(i.e. 1996/97) indigenous cover. We then calculated the change in SBL for each
Level IV land environment from 1996/97 to 2001/02, based on the total area (and
hence proportion) of indigenous cover remaining at each date.
We compared these changes across land environment threat categories deter-
mined at LeNZ Level IV only. We quantified the contribution of each of the
73 council areas, and each DOC conservancy and area, to change in indigenous
cover, and to summed change in SBL across New Zealand’s land environments
from 1996/97 to 2001/02, by threatened environment category.
3 . 3 D A T A L I M I T A T I O N S
existing national large-scale environmental, biological and protection databases
are surrogates for the pattern of environments, biota and protection across New
Zealand. They all have limitations for application on the ground at the scale of
individual properties and areas. Particular concerns, and some implications, are
noted below.
3.3.1 Environmental information
LeNZ is based on 15 environmental variables with known relevance (e.g.
trees, ferns, land snails) for biodiversity pattern. It does not contain all of the
environmental variables that affect biodiversity pattern. It is of limited use in
identifying small-scale ecosystems and habitat types that are controlled by local,
extreme environmental conditions such as limestone outcrops (karst), and
geothermal and various wetland (and floodplain) ecosystems.
3.3.2 Land cover
In these analyses, we took the cover classes in LCDB 1 and LCDB 2 ‘at face value’.
However, the cover data are not accurate. We know there are misclassifications
and errors in both databases, but not their full magnitude or locations. Because
of mapping/classification error, and the broad scope and qualitative nature of
the cover classes (Grüner & Gapare 2004), LCDB 2 cover classes cannot and
should not be relied upon to assess whether cover for a given location is in fact
indigenous. Field inspection is needed to verify this.

20 Walker et al.—New Zealand’s remaining indigenous cover
Some cover classes are mixed and particularly problematic to categorise as
either indigenous or non-indigenous. For example, Depleted Grassland ground
cover is often dominated by the exotic flatweed Hieracium pilosella, but native
species may dominate in number (e.g. Meurk et al. 2002). We assigned it to
the Indigenous category based on expert opinion. Low-Producing Grassland
includes some completely exotic cover (e.g. coastal marram grass, sweet vernal
and browntop extensive pasture) but also grasslands of variable native and exotic
composition dominated by indigenous short tussocks. Based on expert opinion
that this class is primarily exotic across New Zealand, we have assigned it to the
Non-indigenous category.
Only one cover class (Herbaceous Freshwater Vegetation) is provided for wetlands,
and we have assigned it to the Indigenous category. Hence, our figures assume
that all wetlands still support native cover, which is unrealistic. Consequently,
some environments that support extensive wetlands that have been substantially
modified by unsympathetic land use (e.g. environment L3.1a on the Southland
Plains, in the Less Reduced and Better Protected category) will incorrectly be
assigned to less threatened categories.
3.3.3 Protection information
The protection dataset used for this analysis has several limitations, such as
the inclusion of some Crown land managed by DOC for purposes other than
conservation (e.g. buildings, gravel reserves, racecourses, cemeteries, marginal
strips) (Walker et al. 2004) and inaccuracies associated with covenant boundaries
(Rutledge et al. 2004). These sources of error will tend to increase estimates of
protected land in threatened environments. On the other hand, council-protected
areas (including regional parks such as the Hunua Ranges near Auckland) and
certain types of privately protected land (including biodiversity sanctuaries such
as the ecological island at Mt Maungatautari in the Waikato) are not included
in the protected dataset. Consequently, the area of indigenous vegetation not
protected in some districts will be overestimated.
4. Results
4 . 1 I N D I G e N O U S C O V e R A N D T H R e A T e N e D e N V I R O N M e N T S I N 2 0 0 1 / 0 2
Approximately two-thirds of New Zealand’s land environments were classified
within one of the five categories of threatened environment (67% of environments
if categories were determined at LeNZ Level IV, and 63% of environments if
categories were determined at Level II) (Table 2).
The five threat categories accounted for 54% or 53% (with categories determined
at LeNZ Levels IV and II, respectively) of the total land area of New Zealand.
This implies greater environmental heterogeneity (and hence greater potential
biodiversity) in threatened environments than across land not assigned to a
threat category in our classification. In other words, past biodiversity loss has

21Science for Conservation 284
been concentrated in the most environmentally diverse (and hence probably
biologically diverse) regions of New Zealand.
Less than half of New Zealand’s land area (12 632 214 ha, or 49%) was under some
form of indigenous cover (Table 2). Acutely Threatened, Chronically Threatened
and At Risk environments (i.e. those with < 30% indigenous cover remaining)
represented 57% of Level IV environments and 42% of New Zealand’s land area
(Level IV), and 51% of Level II land environments and 41% of New Zealand’s land
area (Level II).
The two categories with the highest SBL (Acutely and Chronically Threatened
environments, both with less than 20% of indigenous cover) together account
for 46% of environments and 32% of New Zealand’s land area (at Level IV), or
42% of environments and 26% of New Zealand’s land area (at Level II). The
area of indigenous cover that remains in Acutely and Chronically Threatened
environments is 565 751 ha (6.9% of the total land area of these 232 Level IV
environments), or 445 215 ha (6.8% of the total land area of the 42 Acutely and
Chronically Threatened Level II environments).
The largest portion of New Zealand’s threatened environments have less than
10% of indigenous cover remaining, and fall within the category of highest risk to
remaining biodiversity (Acutely Threatened). Acutely Threatened environments
account for 32% of Level IV land environments and 23% of total land area (at Level
IV), or 29% of Level II environments and 19% of New Zealand’s total land area
(at Level II). The average percentage of indigenous cover that remains in Acutely
Threatened environments is 3.8% (Level IV) or 4.5% (Level II), i.e. towards the
lower end of the 0–10% range.
TABLe 2. NeW ZeALAND’S LAND eNVIRONMeNT CATeGORIeS IN 2001/02, SHOWING THe PeRCeNTAGe OF
THe TOTAL NUMBeR OF eNVIRONMeNTS IN THe SIx LAND eNVIRONMeNT CATeGORIeS (% OF LeNZ), THe
PeRCeNTAGe OF THe TOTAL NeW ZeALAND LAND AReA THAT THIS AReA RePReSeNTS (% OF NZ) AND THe
PeRCeNTAGe OF LAND WITHIN THAT LAND eNVIRONMeNT CATeGORy (% OF FULL exTeNT).
LeNZ TOTAL ACUTeLy CHRONICALLy AT RISK CRITICALLy UNDeR- LeSS ReDUCeD
LeVeL THReATeNeD THReATeNeD UNDeR- PROTeCTeD AND BeTTeR
PROTeCTeD PROTeCTeD
Number of environments
No. of IV 500 158 74 52 33 18 165
LeNZ II 100 29 13 9 6 6 37
% of IV 100.0 31.6 14.8 10.4 6.6 3.6 33.0
LeNZ II 100.0 29.0 13.0 9.0 6.0 6.0 37.0
Full extent of environments
Area IV 26 000 680 5 888 292 2 323 074 2 788 941 1 825 031 1 158 487 12 016 855
(ha) II 26 000 680 4 983 260 1 674 228 4 090 474 772 143 2 138 778 12 341 796
% of IV 100.00 22.65 8.93 10.73 7.02 4.46 46.22
NZ II 100.00 19.17 6.44 15.73 2.97 8.23 47.47
Indigenous cover remaining in environments
Area IV 12 632 214 220 862 344 889 674 218 794 673 663 006 9 934 566
(ha) II 12 632 214 223 886 231 329 1 125 322 328 852 1 056 026 9 666 799
% of IV 48.58 3.75 14.85 24.17 43.54 57.23 82.67
full extent II 48.58 4.49 13.82 27.51 42.59 49.38 78.33

22 Walker et al.—New Zealand’s remaining indigenous cover
Figure 4 illustrates the uneven distribution of threatened environments across
New Zealand’s 20 Level I environments. Level I environment N (eastern South
Island Plains) contains the highest number of Acutely Threatened Level IV
environments (26), followed by environment B (Central Dry Lowlands) with 24.
The three Level I environments F (Central Hill Country & Volcanic Plateau), J
(Central Well-Drained Recent Soils) and A (Northern Lowlands) each contain 15
Acutely Threatened Level IV environments. In contrast, the least modified Level
I environments (O, P, R, S and T) contain no Level IV environments with less
than 30% indigenous cover remaining, and only one (S1.1a) has less than 20% of
its land area protected.
The maps in Figure 5 show the distribution of threatened environments in New
Zealand, and indicate that the categories of highest risk to indigenous biodiversity
are in lowland environments.
4 . 2 I N D I G e N O U S C O V e R N O T P R O T e C T e D I N T H R e A T e N e D e N V I R O N M e N T S
Table 3 contains summary statistics for indigenous cover not within protected
areas (INP).
Based on our Indigenous/Non-indigenous categorisation, 38% of New Zealand’s
indigenous cover (excluding reserves) was not legally protected (Table 3). In
the five threatened environments categories, high percentages (c. 60–90%)
of indigenous cover were not legally protected. In environments assigned to
the sixth category (Less Reduced and Better Protected), lower percentages
(c. 27–28%) of indigenous cover were not protected.
Acutely Threatened and Chronically Threatened environments contained smaller
total areas of INP than At Risk environments at both LeNZ levels (Table 3). The
Figure 4. Number of threatened Level IV
LeNZ land environments in New Zealand’s 20 Level I environments
(A to T, arranged in order of decreasing threat to
indigenous biodiversity).
�
�
��
��
��
��
��
� � � � � � � � � � � � � � � � � � � �
��������������������������������������������������������������������������������������
�������������������
��������
���
�����
����
�����
�����
����
��
U

23Science for Conservation 284
Figu
re 5
. N
ew Z
eala
nd
’s t
hre
aten
ed e
nvi
ron
men
ts. A
: Lev
el I
V o
f Le
NZ
. B: L
evel
II
of
LeN
Z.
A.
No
thre
at c
ateg
ory
Acu
tely
Thr
eate
ned
Chr
onic
ally
Thr
eate
ned
At R
isk
Crit
ical
ly U
nder
prot
ecte
d U
nder
prot
ecte
d
THR
EA
T
B.
Figu
re 5

24 Walker et al.—New Zealand’s remaining indigenous cover
largest areas of INPTe were in environments in the Critically Underprotected
and Underprotected categories, i.e. environments having more than 30% of
indigenous cover remaining (at Level IV and Level II).
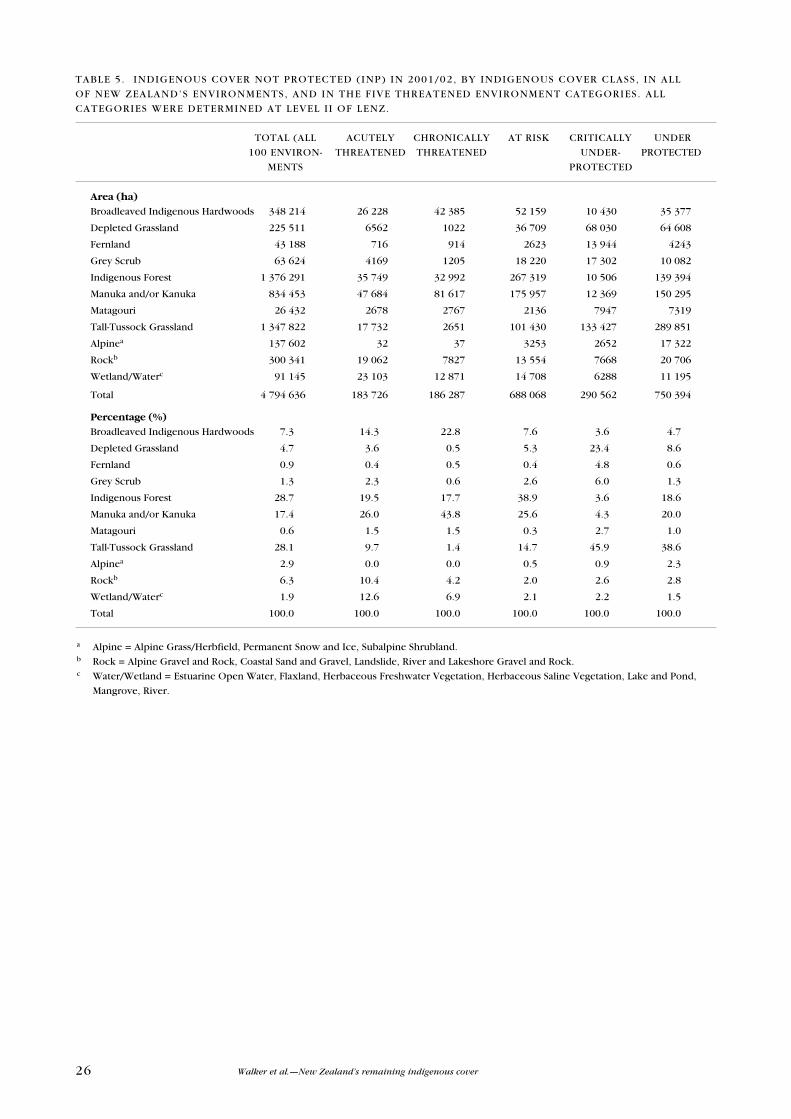
The areas covered by the LCDB 2 classes of INP in the five environment threat
categories (i.e. INPTes) are presented in Table 4 (at LeNZ Level IV) and in Table 5
(Level II). In Acutely Threatened and Chronically Threatened environments, INPTe
was dominated by forest and regenerating forest (Indigenous Forest, Manuka
and/or Kanuka and Broadleaved Indigenous Hardwoods LCDB 2 classes). In
contrast, in Critically Underprotected and Underprotected environments, INPTe
was dominated by the Tall-Tussock Grassland class (34% and 54%, respectively,
at LeNZ Level IV). Manuka and/or Kanuka and Indigenous Forest also accounted
for large portions of the INPTe in Critically Underprotected and Underprotected
threat categories. Depleted Grasslands were a significant component of Critically
Underprotected INPTe (17% at LeNZ Level IV).
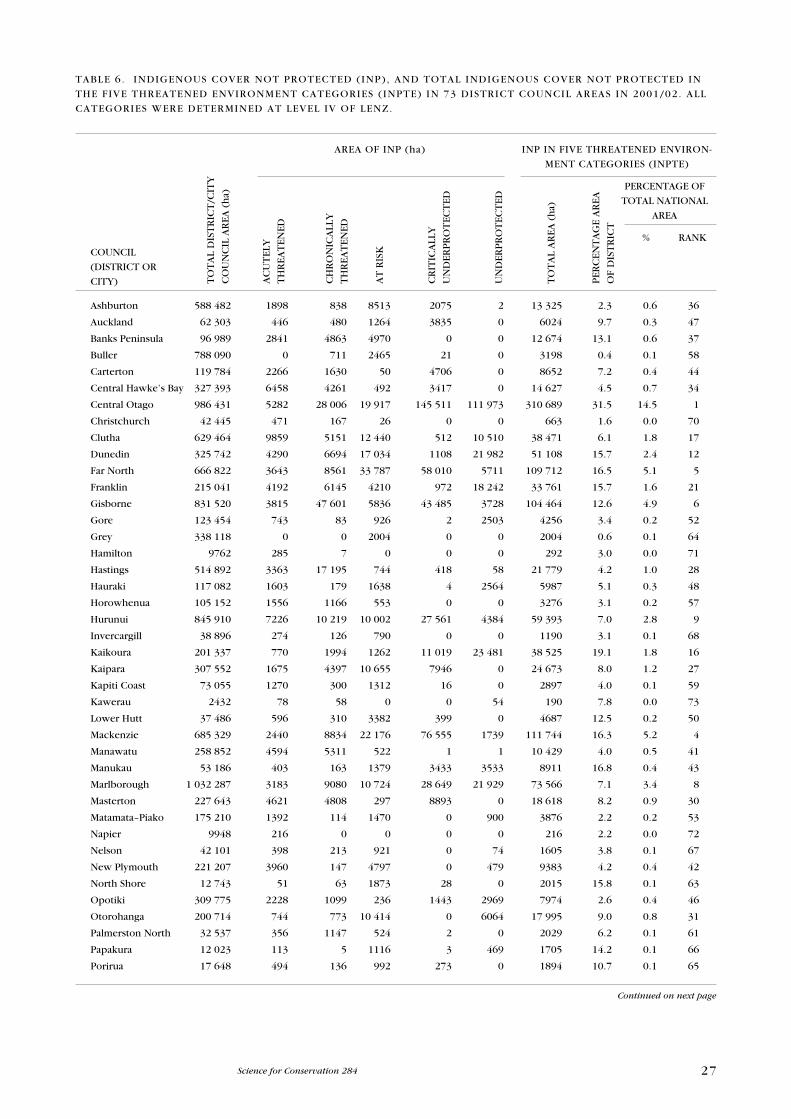
Tables 6 and 7 tabulate total INP and INPTe areas in each of 73 council areas
across New Zealand. Figure 6 compares INPTe areas for the 25 councils with the
greatest INPTe area. The four top-ranking councils (Central Otago, Queenstown
Lakes, Waitaki and Mackenzie) contain 33% of the national total area of INPTe
(at both LeNZ levels). Level II of LeNZ, which is less precise, shows Central
Otago, Southland, Mackenzie and Hurunui districts as the top-ranking councils,
containing 32% of INPTe.
Tables 8 and 9 tabulate total INP and INPTe areas in each of 13 DOC conservancies
and 47 DOC areas across New Zealand. The four top-ranking DOC areas (Central
Otago, Twizel, Gisborne and Coastal Otago) contain 35% of the national total
area of INPTe, and the top seven (including Wanaka, South Marlborough and
Wakatipu) contain 50%. The three highest ranked DOC conservancies are Otago
(with 27% of the national area of indigenous cover not protected), Canterbury
(with 18%), and east Coast/Hawke’s Bay (with 9%).
In 2004, the 304 current and former Crown pastoral leases in the South Island
high country contained 31% of New Zealand’s INP, and 27% (c. 567 380 ha)
of the remaining INPTe. The area of INPTe on pastoral leases may have been
higher than this estimate, since indigenous short-tussock grasslands contained
LeNZ TOTAL ACUTeLy CHRONICALLy AT RISK CRITICALLy UNDeR- LeSS ReDUCeD
LeVeL THReATeNeD THReATeNeD UNDeR- PROTeCTeD AND BeTTeR
PROTeCTeD PROTeCTeD
Area IV 4 794 636 182 573 285 416 468 195 708 816 497 697 2 651 940
(ha) II 4 794 636 183 726 186 287 688 068 290 562 750 394 2 695 598
% of IV 18.44 0.70 1.10 1.80 2.73 1.91 10.20
NZ II 18.44 0.71 0.72 2.65 1.12 2.89 10.37
% of IV 37.96 82.66 82.76 69.44 89.20 75.07 26.69
remaining II 37.96 82.06 80.53 61.14 88.36 71.06 27.89
TABLe 3. INDIGeNOUS COVeR NOT PROTeCTeD (INP) IN THe SIx LAND eNVIRONMeNT CATeGORIeS IN
2001/02, SHOWING THe AReA OF INP, THe PeRCeNTAGe OF THe TOTAL NeW ZeALAND LAND AReA THAT THIS
AReA RePReSeNTS (% OF NZ), AND THe PeRCeNTAGe THAT INP RePReSeNTS OF ALL ReMAINING INDIGeNOUS
COVeR (% OF ReMAINING) WITHIN eACH LAND eNVIRONMeNT CATeGORy.

25Science for Conservation 284
within the Low-Producing Grassland class in LCDB 2 are classified as ‘exotic’
and, therefore, not distinguished. Overall, indigenous cover on pastoral leases
remained relatively high, probably because the Land Act 1948 and Crown Pastoral
Land Act 1998 have constrained vegetation clearance activities, including soil
cultivation, at least to some degree. Furthermore, pastoral leases contain high
proportions of land of low value for agricultural production that does not lend
itself to cultivation. Because South Island high country pastoral leases remained
largely indigenous in character, much of the INPTe on pastoral leases was in
the At Risk, Critically Underprotected and Underprotected categories, with less
depleted indigenous cover (i.e. > 20% remaining). Pastoral leases contain just
5.5% (c. 25 500 ha) of the national INPTe in Acutely Threatened and Chronically
Threatened environment threat categories, i.e. environments where indigenous
cover has been reduced below 20% of original environment extent.
TABLe 4. INDIGeNOUS COVeR NOT PROTeCTeD (INP) IN 2001/02, By INDIGeNOUS COVeR CLASS, IN ALL
OF NeW ZeALAND’S eNVIRONMeNTS, AND IN THe FIVe THReATeNeD eNVIRONMeNT CATeGORIeS. ALL
CATeGORIeS WeRe DeTeRMINeD AT LeVeL IV OF LeNZ.
TOTAL (ALL ACUTeLy CHRONICALLy AT RISK CRITICALLy UNDeR
500 eNVIRON- THReATeNeD THReATeNeD UNDeR- PROTeCTeD
MeNTS PROTeCTeD
Area (ha)
Broadleaved Indigenous Hardwoods 348 214 31 197 48 706 52 436 36 960 20 533
Depleted Grassland 225 511 3702 21 524 26 737 118 190 9554
Fernland 43 188 1000 1675 1906 14 411 2616
Grey Scrub 63 624 3650 8079 8398 20 284 3840
Indigenous Forest 1 376 291 47 214 52 214 168 226 98 132 99 768
Manuka and/or Kanuka 834 453 48 671 102 089 132 558 144 537 64 265
Matagouri 26 432 3612 3157 6784 7913 490
Tall-Tussock Grassland 1 347 822 5212 23 055 38 657 237 179 267 834
Alpinea 137 602 14 100 263 5289 11 903
Rockb 300 354 14 228 12 273 19 335 17 360 11 516
Wetland/Waterc 91 146 24 073 12 545 12 897 8562 5376
Total 4 794 636 182 573 285 416 468 195 708 816 497 697
Percentage (%)
Broadleaved Indigenous Hardwoods 7.3 17.1 17.1 11.2 5.2 4.1
Depleted Grassland 4.7 2.0 7.5 5.7 16.7 1.9
Fernland 0.9 0.5 0.6 0.4 2.0 0.5
Grey Scrub 1.3 2.0 2.8 1.8 2.9 0.8
Indigenous Forest 28.7 25.9 18.3 35.9 13.8 20.0
Manuka and/or Kanuka 17.4 26.7 35.8 28.3 20.4 12.9
Matagouri 0.6 2.0 1.1 1.4 1.1 0.1
Tall-Tussock Grassland 28.1 2.9 8.1 8.3 33.5 53.8
Alpinea 2.9 0.0 0.0 0.1 0.7 2.4
Rockb 6.3 7.8 4.3 4.1 2.4 2.3
Wetland/Waterc 1.9 13.2 4.4 2.8 1.2 1.1
Total 100.0 100.0 100.0 100.0 100.0 100.0
a Alpine = Alpine Grass/Herbfield, Permanent Snow and Ice, Subalpine Shrubland. b Rock = Alpine Gravel and Rock, Coastal Sand and Gravel, Landslide, River and Lakeshore Gravel and Rock. c Water/Wetland = estuarine Open Water, Flaxland, Herbaceous Freshwater Vegetation, Herbaceous Saline Vegetation, Lake and
Pond, Mangrove, River.
26 Walker et al.—New Zealand’s remaining indigenous cover
TOTAL (ALL ACUTeLy CHRONI CALLy AT RISK CRITICALLy UNDeR
100 eNVIRON- THReATeNeD THReATeNeD UNDeR- PROTeCTeD
MeNTS PROTeCTeD
Area (ha)
Broadleaved Indigenous Hardwoods 348 214 26 228 42 385 52 159 10 430 35 377
Depleted Grassland 225 511 6562 1022 36 709 68 030 64 608
Fernland 43 188 716 914 2623 13 944 4243
Grey Scrub 63 624 4169 1205 18 220 17 302 10 082
Indigenous Forest 1 376 291 35 749 32 992 267 319 10 506 139 394
Manuka and/or Kanuka 834 453 47 684 81 617 175 957 12 369 150 295
Matagouri 26 432 2678 2767 2136 7947 7319
Tall-Tussock Grassland 1 347 822 17 732 2651 101 430 133 427 289 851
Alpinea 137 602 32 37 3253 2652 17 322
Rockb 300 341 19 062 7827 13 554 7668 20 706
Wetland/Waterc 91 145 23 103 12 871 14 708 6288 11 195
Total 4 794 636 183 726 186 287 688 068 290 562 750 394
Percentage (%)
Broadleaved Indigenous Hardwoods 7.3 14.3 22.8 7.6 3.6 4.7
Depleted Grassland 4.7 3.6 0.5 5.3 23.4 8.6
Fernland 0.9 0.4 0.5 0.4 4.8 0.6
Grey Scrub 1.3 2.3 0.6 2.6 6.0 1.3
Indigenous Forest 28.7 19.5 17.7 38.9 3.6 18.6
Manuka and/or Kanuka 17.4 26.0 43.8 25.6 4.3 20.0
Matagouri 0.6 1.5 1.5 0.3 2.7 1.0
Tall-Tussock Grassland 28.1 9.7 1.4 14.7 45.9 38.6
Alpinea 2.9 0.0 0.0 0.5 0.9 2.3
Rockb 6.3 10.4 4.2 2.0 2.6 2.8
Wetland/Waterc 1.9 12.6 6.9 2.1 2.2 1.5
Total 100.0 100.0 100.0 100.0 100.0 100.0
a Alpine = Alpine Grass/Herbfield, Permanent Snow and Ice, Subalpine Shrubland. b Rock = Alpine Gravel and Rock, Coastal Sand and Gravel, Landslide, River and Lakeshore Gravel and Rock. c Water/Wetland = estuarine Open Water, Flaxland, Herbaceous Freshwater Vegetation, Herbaceous Saline Vegetation, Lake and Pond,
Mangrove, River.
TABLe 5. INDIGeNOUS COVeR NOT PROTeCTeD (INP) IN 2001/02, By INDIGeNOUS COVeR CLASS, IN ALL
OF NeW ZeALAND’S eNVIRONMeNTS, AND IN THe FIVe THReATeNeD eNVIRONMeNT CATeGORIeS. ALL
CATeGORIeS WeRe DeTeRMINeD AT LeVeL I I OF LeNZ.
27Science for Conservation 284
AReA OF INP (ha) INP IN FIVe THReATeNeD eNVIRON-
MeNT CATeGORIeS (INPTe)
PeRCeNTAGe OF
TOTAL NATIONAL
AReA
% RANK
COUNCIL
(DISTRICT OR
CITy)
Ashburton 588 482 1898 838 8513 2075 2 13 325 2.3 0.6 36
Auckland 62 303 446 480 1264 3835 0 6024 9.7 0.3 47
Banks Peninsula 96 989 2841 4863 4970 0 0 12 674 13.1 0.6 37
Buller 788 090 0 711 2465 21 0 3198 0.4 0.1 58
Carterton 119 784 2266 1630 50 4706 0 8652 7.2 0.4 44
Central Hawke’s Bay 327 393 6458 4261 492 3417 0 14 627 4.5 0.7 34
Central Otago 986 431 5282 28 006 19 917 145 511 111 973 310 689 31.5 14.5 1
Christchurch 42 445 471 167 26 0 0 663 1.6 0.0 70
Clutha 629 464 9859 5151 12 440 512 10 510 38 471 6.1 1.8 17
Dunedin 325 742 4290 6694 17 034 1108 21 982 51 108 15.7 2.4 12
Far North 666 822 3643 8561 33 787 58 010 5711 109 712 16.5 5.1 5
Franklin 215 041 4192 6145 4210 972 18 242 33 761 15.7 1.6 21
Gisborne 831 520 3815 47 601 5836 43 485 3728 104 464 12.6 4.9 6
Gore 123 454 743 83 926 2 2503 4256 3.4 0.2 52
Grey 338 118 0 0 2004 0 0 2004 0.6 0.1 64
Hamilton 9762 285 7 0 0 0 292 3.0 0.0 71
Hastings 514 892 3363 17 195 744 418 58 21 779 4.2 1.0 28
Hauraki 117 082 1603 179 1638 4 2564 5987 5.1 0.3 48
Horowhenua 105 152 1556 1166 553 0 0 3276 3.1 0.2 57
Hurunui 845 910 7226 10 219 10 002 27 561 4384 59 393 7.0 2.8 9
Invercargill 38 896 274 126 790 0 0 1190 3.1 0.1 68
Kaikoura 201 337 770 1994 1262 11 019 23 481 38 525 19.1 1.8 16
Kaipara 307 552 1675 4397 10 655 7946 0 24 673 8.0 1.2 27
Kapiti Coast 73 055 1270 300 1312 16 0 2897 4.0 0.1 59
Kawerau 2432 78 58 0 0 54 190 7.8 0.0 73
Lower Hutt 37 486 596 310 3382 399 0 4687 12.5 0.2 50
Mackenzie 685 329 2440 8834 22 176 76 555 1739 111 744 16.3 5.2 4
Manawatu 258 852 4594 5311 522 1 1 10 429 4.0 0.5 41
Manukau 53 186 403 163 1379 3433 3533 8911 16.8 0.4 43
Marlborough 1 032 287 3183 9080 10 724 28 649 21 929 73 566 7.1 3.4 8
Masterton 227 643 4621 4808 297 8893 0 18 618 8.2 0.9 30
Matamata–Piako 175 210 1392 114 1470 0 900 3876 2.2 0.2 53
Napier 9948 216 0 0 0 0 216 2.2 0.0 72
Nelson 42 101 398 213 921 0 74 1605 3.8 0.1 67
New Plymouth 221 207 3960 147 4797 0 479 9383 4.2 0.4 42
North Shore 12 743 51 63 1873 28 0 2015 15.8 0.1 63
Opotiki 309 775 2228 1099 236 1443 2969 7974 2.6 0.4 46
Otorohanga 200 714 744 773 10 414 0 6064 17 995 9.0 0.8 31
Palmerston North 32 537 356 1147 524 2 0 2029 6.2 0.1 61
Papakura 12 023 113 5 1116 3 469 1705 14.2 0.1 66
Porirua 17 648 494 136 992 273 0 1894 10.7 0.1 65
TABLe 6. INDIGeNOUS COVeR NOT PROTeCTeD (INP), AND TOTAL INDIGeNOUS COVeR NOT PROTeCTeD IN
THe FIVe THReATeNeD eNVIRONMeNT CATeGORIeS ( INPTe) IN 73 DISTRICT COUNCIL AReAS IN 2001/02. ALL
CATeGORIeS WeRe DeTeRMINeD AT LeVeL IV OF LeNZ.
TO
TA
L D
IST
RIC
T/C
ITy
CO
UN
CIL
AR
eA (
ha)
AC
UT
eLy
TH
ReA
TeN
eD
CH
RO
NIC
ALL
y
TH
ReA
TeN
eD
AT
RIS
K
CR
ITIC
ALL
y
UN
DeR
PR
OT
eCT
eD
UN
DeR
PR
OT
eCT
eD
TO
TA
L A
ReA
(h
a)
PeR
CeN
TA
Ge
AR
eA
OF
DIS
TR
ICT
Continued on next page

28 Walker et al.—New Zealand’s remaining indigenous cover
AReA OF INP (ha) INP IN FIVe THReATeNeD eNVIRON-
MeNT CATeGORIeS (INPTe)
PeRCeNTAGe OF
TOTAL NATIONAL
AReA
% RANK
COUNCIL
(DISTRICT OR
CITy)
Queenstown Lakes 856 396 1471 2913 2714 53 095 99 483 159 676 18.6 7.5 2
Rangitikei 445 780 11 128 4929 2701 16 337 4276 39 372 8.8 1.8 14
Rodney 232 172 1006 2111 25 119 2125 3 30 364 13.1 1.4 23
Rotorua 238 205 1339 1470 2902 0 6836 12 548 5.3 0.6 38
Ruapehu 669 819 743 2709 43 762 3906 3718 54 838 8.2 2.6 10
Selwyn 604 810 1940 746 8660 2254 0 13 601 2.2 0.6 35
South Taranaki 357 185 6003 146 4083 0 401 10 633 3.0 0.5 40
South Waikato 179 445 849 164 504 0 508 2025 1.1 0.1 62
South Wairarapa 233 337 6377 5804 670 21 762 1 34 614 14.8 1.6 19
Southland 2 905 381 9132 12 146 10 425 12 104 46 513 90 320 3.1 4.2 7
Stratford 213 951 1089 133 14 767 0 0 15 990 7.5 0.7 33
Tararua 435 552 11 237 8189 552 10 400 0 30 379 7.0 1.4 22
Tasman 953 487 3277 6232 7338 166 72 17 086 1.8 0.8 32
Taupo 629 332 3715 284 32 766 757 848 38 369 6.1 1.8 18
Tauranga 12 872 628 1 60 19 0 707 5.5 0.0 69
Thames–Coromandel 219 700 1275 1366 1436 2110 2295 8481 3.9 0.4 45
Timaru 258 233 2263 1132 1012 6320 0 10 727 4.2 0.5 39
Upper Hutt 54 024 675 343 2398 10 0 3426 6.3 0.2 55
Waikato 305 697 6124 4921 3229 0 14 832 29 106 9.5 1.4 24
Waimakariri 213 075 1558 408 295 1609 0 3870 1.8 0.2 54
Waimate 346 519 2373 2630 7193 39 874 216 52 286 15.1 2.4 11
Waipa 144 427 2436 287 1342 0 1157 5223 3.6 0.2 49
Wairoa 403 830 1453 19 804 13 330 1 7 34 595 8.6 1.6 20
Waitakere 36 396 251 210 1327 2361 112 4261 11.7 0.2 51
Waitaki 698 635 4145 14 735 16 392 68 130 28 543 131 945 18.9 6.2 3
Waitomo 350 843 1437 192 27 531 0 10 142 39 302 11.2 1.8 15
Wanganui 234 469 1995 2614 20 104 0 71 24 783 10.6 1.2 26
Wellington 28 742 446 15 2020 920 0 3401 11.8 0.2 56
Western Bay of Plenty 196 035 2910 4 184 1104 21 469 25 671 13.1 1.2 25
Westland 1 145 206 0 0 2233 0 0 2233 0.2 0.1 60
Whakatane 440 625 1628 2395 1783 0 12 842 18 649 4.2 0.9 29
Whangarei 269 661 1575 3351 7655 33 159 2 45 742 17.0 2.1 13
Total 26 000 680 182 573 285 416 468 195 708 816 497 697 2 142 696 100.0
Table 6—continued
TO
TA
L D
IST
RIC
T/C
ITy
CO
UN
CIL
AR
eA (
ha)
AC
UT
eLy
TH
ReA
TeN
eD
CH
RO
NIC
ALL
y
TH
ReA
TeN
eD
AT
RIS
K
CR
ITIC
ALL
y
UN
DeR
PR
OT
eCT
eD
UN
DeR
PR
OT
eCT
eD
TO
TA
L A
ReA
(h
a)
PeR
CeN
TA
Ge
AR
eA
OF
DIS
TR
ICT

29Science for Conservation 284
AReA OF INP (ha) INP IN FIVe THReATeNeD eNVIRON-
MeNT CATeGORIeS (INPTe)
PeRCeNTAGe OF
TOTAL NATIONAL
AReA
% RANK
COUNCIL
(DISTRICT OR
CITy)
Ashburton 588 482 2719 167 25 1434 28 555 32 900 5.6 1.6 22
Auckland 62 303 801 187 5029 0 0 6017 9.7 0.3 42
Banks Peninsula 96 989 340 12 334 0 0 0 12 674 13.1 0.6 31
Buller 788 090 7 993 1171 21 28 2220 0.3 0.1 57
Carterton 119 784 3696 0 162 0 0 3859 3.2 0.2 46
Central Hawke’s Bay 327 393 8794 16 303 0 367 9480 2.9 0.5 36
Central Otago 986 431 15389 2725 31 485 55 861 167 163 272 623 27.6 13.0 1
Christchurch 42 445 301 358 4 0 0 663 1.6 0.0 67
Clutha 629 464 7395 504 44 430 333 10 970 63 631 10.1 3.0 10
Dunedin 325 742 5672 154 22 895 1842 20 912 51 475 15.8 2.5 15
Far North 666 822 6183 4214 91 873 0 5711 107 981 16.2 5.1 5
Franklin 215 041 5572 360 5186 0 22 091 33 209 15.4 1.6 21
Gisborne 831 520 1400 57 389 223 4258 43 63 313 7.6 3.0 11
Gore 123 454 332 10 5258 2 89 5691 4.6 0.3 43
Grey 338 118 0 0 0 0 3 3 0.0 0.0 72
Hamilton 9 762 264 4 0 0 7 274 2.8 0.0 69
Hastings 514 892 5313 14 938 1171 0 17 117 38 539 7.5 1.8 18
Hauraki 117 082 1442 60 1617 0 247 3366 2.9 0.2 49
Horowhenua 105 152 2428 0 498 0 0 2926 2.8 0.1 55
Hurunui 845 910 3497 21 198 8 526 87 195 112 423 13.3 5.4 4
Invercargill 38 896 790 171 878 0 0 1838 4.7 0.1 59
Kaikoura 201 337 513 2017 5769 1 42 344 50 643 25.2 2.4 16
Kaipara 307 552 2481 1339 20,821 0 0 24 641 8.0 1.2 26
Kapiti Coast 73 055 1332 0 1149 0 0 2481 3.4 0.1 56
Kawerau 2 432 30 48 0 0 0 78 3.2 0.0 71
Lower Hutt 37 486 837 2 773 0 0 1612 4.3 0.1 61
Mackenzie 685 329 4873 1749 10 322 68 604 50 301 135 849 19.8 6.5 3
Manawatu 258 852 2881 5 439 0 0 3325 1.3 0.2 50
Manukau 53 186 540 27 4811 0 3533 8911 16.8 0.4 37
Marlborough 1 032 287 4838 2225 16 649 399 82 514 106 625 10.3 5.1 6
Masterton 227 643 7,321 0 437 0 0 7758 3.4 0.4 39
Matamata–Piako 175 210 1161 38 1470 0 468 3136 1.8 0.1 53
Napier 9 948 178 38 0 0 0 216 2.2 0.0 70
Nelson 42 101 398 50 0 74 1083 1604 3.8 0.1 62
New Plymouth 221 207 16 5852 5271 0 295 11 434 5.2 0.5 33
North Shore 12 743 104 0 1911 0 0 2015 15.8 0.1 58
Opotiki 309 775 1230 701 1241 217 440 3828 1.2 0.2 47
Otorohanga 200 714 98 284 7123 0 14 744 22 249 11.1 1.1 27
Palmerston North 32 537 932 0 524 0 0 1456 4.5 0.1 63
Papakura 12 023 114 0 1119 0 472 1705 14.2 0.1 60
Porirua 17 648 622 0 76 0 0 698 4.0 0.0 66
Continued on next page
TO
TA
L D
IST
RIC
T/C
ITy
CO
UN
CIL
AR
eA (
ha)
AC
UT
eLy
TH
ReA
TeN
eD
CH
RO
NIC
ALL
y
TH
ReA
TeN
eD
AT
RIS
K
CR
ITIC
ALL
y
UN
DeR
PR
OT
eCT
eD
UN
DeR
PR
OT
eCT
eD
TO
TA
L A
ReA
(h
a)
PeR
CeN
TA
Ge
AR
eA
OF
DIS
TR
ICT
TABLe 7. INDIGeNOUS COVeR NOT PROTeCTeD (INP), AND TOTAL INDIGeNOUS COVeR NOT PROTeCTeD IN
THe FIVe THReATeNeD eNVIRONMeNT CATeGORIeS ( INPTe) IN 73 DISTRICT COUNCIL AReAS IN 2001/02. ALL
CATeGORIeS WeRe DeTeRMINeD AT LeVeL I I OF LeNZ.

30 Walker et al.—New Zealand’s remaining indigenous cover
AReA OF INP (ha) INP IN FIVe THReATeNeD eNVIRON-
MeNT CATeGORIeS (INPTe)
PeRCeNTAGe OF
TOTAL NATIONAL
AReA
% RANK
COUNCIL
(DISTRICT OR
CITy)
Queenstown Lakes 856 396 860 938 2979 47 807 15 644 68 228 8.0 3.3 9
Rangitikei 445 780 4238 404 23 579 0 7996 36 218 8.1 1.7 20
Rodney 232 172 2205 730 27 391 0 3 30 329 13.1 1.4 24
Rotorua 238 205 91 205 3272 0 39 3607 1.5 0.2 48
Ruapehu 669 819 306 1 449 69 621 0 405 71 781 10.7 3.4 8
Selwyn 604 810 1532 1194 0 584 27 967 31 278 5.2 1.5 23
South Taranaki 357 185 1063 4774 3959 0 51 9847 2.8 0.5 35
South Waikato 179 445 50 122 539 0 83 794 0.4 0.0 64
South Wairarapa 233 337 11301 0 277 0 0 11 578 5.0 0.6 32
Southland 2 905 381 6930 3129 100 843 10 680 38 299 159 881 5.5 7.6 2
Stratford 213 951 60 1245 9558 0 336 11 199 5.2 0.5 34
Tararua 435 552 8062 0 745 0 0 8807 2.0 0.4 38
Tasman 953 487 3417 1827 1068 238 8122 14 672 1.5 0.7 29
Taupo 629 332 6 1633 48 592 0 1538 51 769 8.2 2.5 14
Tauranga 12 872 685 0 22 0 0 707 5.5 0.0 65
Thames–Coromandel 219 700 2665 81 3326 27 215 6314 2.9 0.3 41
Timaru 258 233 3239 302 141 6466 5027 15 175 5.9 0.7 28
Upper Hutt 54 024 532 119 2302 0 0 2952 5.5 0.1 54
Waikato 305 697 4174 481 3291 0 19 827 27 773 9.1 1.3 25
Waimakariri 213 075 1558 408 0 156 11 951 14 072 6.6 0.7 30
Waimate 346 519 3771 183 8502 38 959 575 51 990 15.0 2.5 13
Waipa 144 427 892 214 770 0 1989 3864 2.7 0.2 45
Wairoa 403 830 1710 30 343 40 0 5030 37 123 9.2 1.8 19
Waitakere 36 396 292 14 3843 0 112 4261 11.7 0.2 44
Waitaki 698 635 10 900 1375 23 156 51 924 9166 96 521 13.8 4.6 7
Waitomo 350 843 134 1275 12 109 0 39 317 52 835 15.1 2.5 12
Wanganui 234 469 3878 255 3168 0 0 7301 3.1 0.3 40
Wellington 28 742 488 0 31 0 0 519 1.8 0.0 68
Western Bay of Plenty 196 035 3073 22 3 151 1 3250 1.7 0.2 52
Westland 1 145 206 0 0 0 0 0 0 0.0 0.0 73
Whakatane 440 625 315 1211 1760 0 2 3288 0.7 0.2 51
Whangarei 269 661 2467 2206 41 065 0 2 45 740 17.0 2.2 17
Total 26 000 680 183 726 186 287 688 068 290 562 750 394 2 099 038 100.0
Table 7—continued
TO
TA
L D
IST
RIC
T/C
ITy
CO
UN
CIL
AR
eA (
ha)
AC
UT
eLy
TH
ReA
TeN
eD
CH
RO
NIC
ALL
y
TH
ReA
TeN
eD
AT
RIS
K
CR
ITIC
ALL
y
UN
DeR
PR
OT
eCT
eD
UN
DeR
PR
OT
eCT
eD
TO
TA
L A
ReA
(h
a)
PeR
CeN
TA
Ge
AR
eA
OF
DIS
TR
ICT

31Science for Conservation 284
4 . 3 W H A T I S T H e M O S T A P P R O P R I A T e L e N Z L e V e L ?
Level IV environments represent a finer partitioning of LeNZ Level II
environments. The habitat loss and protection status of Level IV environments
within a single LeNZ Level II environment may vary quite widely. This reflects
their different environmental characteristics, and hence differences in their value
for agricultural production, as well as their biodiversity. Appendix 3 presents a
case study of differences among Level IV environments in patterns of protection
and land clearance, biodiversity pattern and current land cover types within one
Level II land environment (F1). The conclusions we drew from this example
were that:
environmental differences that drive patterns of biodiversity, and both present •
and past land clearance, are at a finer scale than the environmental pattern
evident at Level II of LeNZ.
Of the four LeNZ levels, Level IV best depicts patterns of biodiversity and •
reflects patterns of past clearance. Level IV also relates most strongly to scales
at which people perceive and use the landscape.
Level IV is the most appropriate LeNZ level to assess the vulnerability of •
remaining biodiversity.
AReA OF INP (ha) INP IN FIVe THReATeNeD eNVIRON-
MeNT CATeGORIeS (INPTe)
PeRCeNTAGe OF
TOTAL NATIONAL
AReA
% RANK
CONSeRVANCy
Auckland 544 209 4 680 5 600 35 948 12 755 18 219 77 202 14 4 10
Bay Of Plenty 1 052 894 8 110 4 763 6 754 1 129 42 690 63 446 6 3 11
Canterbury 3 987 916 23 899 34 595 69 225 217 364 30 792 375 876 9 18 2
east Coast/Hawke’s Bay 2 739 103 21 640 90 766 20 633 62 239 6 382 201 661 7 9 3
Nelson/Marlborough 2 307 820 7 700 17 741 21 366 43 112 47 715 137 634 6 6 5
Northland 1 245 377 6 893 16 308 52 011 99 116 5 714 180 042 14 8 4
Otago 3 051 847 23 097 52 464 58 724 205 066 243 774 583 125 19 27 1
Southland 3 195 728 11 135 12 409 14 403 11 003 51 122 100 073 3 5 9
Tongariro/Taupo 629 232 2 820 227 32 886 6 368 812 43 114 7 2 12
Waikato 1 833 584 17 402 11 613 62 413 2 126 41 429 134 982 7 6 7
Wanganui 2 100 197 30 512 17 646 75 120 3 652 9 046 135 976 6 6 6
Wellington 1 114 977 24 683 20 574 11 998 44 866 1 102 121 9 5 8
West Coast Tai Poutini 2 210 642 0 711 6 713 21 0 7 445 0 0 13
TO
TA
L A
ReA
OF
CO
NSe
RV
AN
Cy
(h
a)
AC
UT
eLy
TH
ReA
TeN
eD
CH
RO
NIC
ALL
y
TH
ReA
TeN
eD
AT
RIS
K
CR
ITIC
ALL
y
UN
DeR
PR
OT
eCT
eD
UN
DeR
PR
OT
eCT
eD
TO
TA
L A
ReA
(h
a)
PeR
CeN
TA
Ge
AR
eA
OF
CO
NSe
RV
AN
Cy
TABLe 8. INDIGeNOUS COVeR NOT PROTeCTeD (INP), AND TOTAL INDIGeNOUS COVeR NOT PROTeCTeD IN
THe FIRST FIVe THReATeNeD eNVIRONMeNT CATeGORIeS ( INPTe) IN 13 DOC CONSeRVANCIeS IN 2001/02. ALL
CATeGORIeS WeRe DeTeRMINeD AT LeVeL IV OF LeNZ.

32 Walker et al.—New Zealand’s remaining indigenous cover
AReA OF INP (ha) INP IN FIVe THReATeNeD eNVIRON-
MeNT CATeGORIeS (INPTe)
PeRCeNTAGe OF
TOTAL NATIONAL
AReA
% RANK
AReA
Aniwaniwa 171 942 73 290 219 0 62 643 0 0 45
Aoraki 67 469 0 0 0 0 0 0 0 0 47
Auckland 312 085 3 565 3 655 12 748 10 350 18 219 48 537 16 2 18
Bay of Islands 292 961 1 812 5 248 16 448 39 478 0 62 986 21 3 12
Buller–Kawatiri 428 996 0 711 1 319 21 0 2 051 0 0 41
Central Otago 801 512 4 047 22 418 18 382 117 171 77 643 239 660 30 11 1
Coastal Otago 1 167 457 16 639 23 320 36 332 7 086 45 326 128 702 11 6 4
Franz Josef–Waiau 226 459 0 0 865 0 0 865 0 0 44
Gisborne 1 128 863 5 324 67 067 19 109 44 016 3 735 139 251 12 6 3
Golden Bay 248 703 17 1 719 1 190 166 0 3 092 1 0 37
Great Barrier Island 29 204 260 81 323 302 0 966 3 0 42
Greymouth–Mawheranui 655 607 0 0 3 025 0 0 3 025 0 0 38
Hauraki 271 822 1 571 1 537 1 586 2 126 4 692 11 511 4 1 31
Hokitika 292 586 0 0 947 0 0 947 0 0 43
Kaitaia 298 010 1 385 3 030 16 904 10 896 5 708 37 923 13 2 20
Kapiti 166 981 2 799 1 022 2 927 296 0 7 043 4 0 33
Kauri Coast 264 662 1 843 2 981 7 278 9 394 0 21 496 8 1 24
Maniapoto 743 367 2 048 318 51 360 0 14 000 67 725 9 3 10
Motueka 437 002 3 658 3 999 6 271 0 146 14 073 3 1 29
Murihiku 1 800 185 11 068 8 763 14 249 11 001 49 565 94 645 5 4 8
Napier 1 059 640 14 082 22 386 1 157 17 311 59 54 994 5 3 17
New Plymouth 263 489 3 781 150 9 715 0 346 13 991 5 1 30
North Canterbury 1 207 001 11 135 15 120 13 853 22 935 2 225 65 268 5 3 11
Opotiki 378 658 2 162 1 022 148 913 2 527 6 773 2 0 34
Palmerston North 721 133 16 184 13 838 3 649 3 652 6 908 44 231 6 2 19
Poneke 119 641 1 713 677 7 734 1 326 0 11 450 10 1 32
Rangitaiki 433 067 2 559 2 405 3 220 18 12 525 20 727 5 1 25
Rotorua Lakes 369 859 1 609 2 295 3 264 0 9 404 16 572 4 1 28
Ruakapuka 1 257 077 7 630 3 966 14 464 34 211 16 60 287 5 3 14
Ruapehu 138 095 1 13 2 032 3 403 24 5 473 4 0 35
Solander Island 95 0 0 0 0 0 0 0 0 48
Sounds 248 684 152 1 307 62 271 1 122 2 914 1 0 39
South Marlborough 972 878 3 873 9 984 12 886 42 295 46 447 115 485 12 5 6
SouthWestland Weheka 606 994 0 0 557 0 0 557 0 0 46
Southern Islands 174 358 0 0 0 0 0 0 0 0 48
St Arnaud 400 554 1 732 958 379 0 2 070 1 0 40
Stratford 363 402 4 823 222 10 952 0 687 16 683 5 1 26
Tauranga 249 970 3 941 63 270 1 111 20 760 26 146 10 1 23
Te Anau 1 221 091 67 3 646 154 3 1 557 5 428 0 0 36
Turangi 492 097 2 821 244 31 021 2 965 788 37 839 8 2 21
Twizel 923 781 2 415 14 449 33 014 155 308 28 551 233 736 25 11 2
Waikato 817 411 13 781 9 727 9 301 0 22 737 55 546 7 3 16
Waimakariri 532 588 2 720 1 061 7 894 4 910 0 16 585 3 1 27
Wairarapa 828 350 20 171 18 874 1 337 43 244 1 83 627 10 4 9
Wakatipu 514 340 616 2 355 1 425 31 592 58 916 94 903 18 4 7
Wanaka 568 538 1 796 4 373 2 586 49 217 61 889 119 859 21 6 5
Wanganui 752 172 5 724 3 436 50 805 0 1 106 61 071 8 3 13
Warkworth 202 921 856 1 863 22 878 2 102 1 27 699 14 1 22
Whangarei 389 743 1 852 5 050 11 382 39 348 6 57 637 15 3 15
TO
TA
L A
ReA
OF
AR
eA (
ha)
AC
UT
eLy
TH
ReA
TeN
eD
CH
RO
NIC
ALL
y
TH
ReA
TeN
eD
AT
RIS
K
CR
ITIC
ALL
y
UN
DeR
PR
OT
eCT
eD
UN
DeR
PR
OT
eCT
eD
TO
TA
L A
ReA
(h
a)
PeR
CeN
TA
Ge
AR
eA
OF
AR
eA
TABLe 9. INDIGeNOUS COVeR NOT PROTeCTeD (INP), AND TOTAL INDIGeNOUS COVeR NOT PROTeCTeD
IN THe FIRST FIVe THReATeNeD eNVIRONMeNT CATeGORIeS ( INPTe) IN 49 DOC AReAS IN 2001/02. ALL
CATeGORIeS WeRe DeTeRMINeD AT LeVeL IV OF LeNZ.