Embed Size (px)
Citation preview
\ Ill newfoundland labrador
k hydro a nalcor energy company
Hydro Place. 500 Columbus Drive.
P.O. Box 12400. St. John's. NI.
Canada A1B 4K7
t. 709.737.1400 1. 709.737.1800
www.n1h.nica
February 11, 2015
The Board of Commissioners of Public Utilities
Prince Charles Building 120 Torbay Road, P.O. Box 21040
St. John's, Newfoundland & Labrador
A1A 5B2
Attention: Ms. Cheryl Blundon Director Corporate Services & Board Secretary
Dear Ms. Blundon:
Re: Newfoundland and Labrador Hydro - the Board's Investigation and Hearing into Supply Issues and Power Outages on the Island Interconnected System — Nostradamus Upgrades Monthly Report
In accordance with item 2.1 of the Liberty Report Recommendations dated December 17, 2014,
wherein Hydro is required to "provide the Board with monthly updates on the status of
Nostradamus upgrades until the production model is fully in-service and shaken down", please find enclosed the original plus 12 copies of Hydro's report entitled Accuracy of Nostradamus
Load Forecasting at Newfoundland and Labrador Hydro Monthly Report: January 2015.
We trust the foregoing is satisfactory. If you have any questions or comments, please contact
the undersigned.
Yours truly,
NEWFOUNDLAND AND LABRADOR HYDRO
G- ffrey P. You j'
nior Legal Co Irrwsel
GPY/jc
cc: Gerard Hayes — Newfoundland Power
Thomas Johnson — Consumer Advocate
Paul Coxworthy — Stewart McKelvey Stirling Scales
Thomas 0' Reilly — Cox & Palmer Sheryl Nisenbaum — Praxair Canada Inc. Danny Dumaresque
ecc: Roberta Frampton Benefiel — Grand Riverkeeper Labrador

Accuracy of Nostradamus Load Forecasting at
Newfoundland and Labrador Hydro
Monthly Report: January 2015
Newfoundland and Labrador Hydro
February 10, 2015

Accuracy of Nostradamus Load Forecasting January 2015
Newfoundland and Labrador Hydro i
Table of Contents
1. NOSTRADAMUS LOAD FORECASTING ..................................................................................... 1
1.1 Nostradamus .................................................................................................................... 1
1.2 Short‐Term Load Forecasting ........................................................................................... 1
1.2.1 Utility Load ................................................................................................................ 1
1.2.2 Industrial Load .......................................................................................................... 2
1.2.3 Supply and Demand Status Reporting ...................................................................... 2
1.3 Load Forecasting Improvements ...................................................................................... 3
1.4 Potential Sources of Variance .......................................................................................... 4
2. JANUARY 2015 FORECAST ACCURACY ..................................................................................... 5
2.1 January Adjustments ........................................................................................................ 5
2.2 January 6, 2015 ................................................................................................................ 9

Accuracy of Nostradamus Load Forecasting January 2015
Newfoundland and Labrador Hydro Page 1
1. NOSTRADAMUS LOAD FORECASTING 1
1.1 Nostradamus 2
Newfoundland and Labrador Hydro (Hydro) uses software called Nostradamus, by 3
Ventyx, for short‐term load forecasting with a time frame of seven days. “The 4
Nostradamus Neural Network Forecasting system is a flexible neural network based 5
forecasting tool developed specifically for utility demand forecasting. Unlike 6
conventional computing processes, which are programmed, neural networks use 7
sophisticated mathematical techniques to train a network of inputs and outputs. Neural 8
networks recognize and learn the joint relationships (linear or non‐linear) between the 9
ranges of variables considered. Once the network learns these intricate relationships, 10
this knowledge can then easily be extended to produce accurate forecasts.” 11
(Nostradamus User Guide, Release 8.2, Ventyx, an ABB Company, May 2014). 12
The Nostradamus model is trained using a sequence of continuous historic periods of 13
hourly weather and demand data, then forecasts system demand using predictions of 14
those same weather parameters for the next seven days. 15
1.2 Short‐Term Load Forecasting16
Hydro uses its short‐term load forecast to manage the power system and ensure 17
adequate generating resources are available to meet customer demand. 18
1.2.1 Utility Load 19
Hydro contracts AMEC Foster Wheeler to provide the weather parameters in the form 20
of hourly weather forecasts for a seven‐day period. At the same time as the weather 21
forecast data is provided, AMEC also provides observed data at the same locations for 22
the previous 24 hours (calendar day). The forecast and actual data are automatically 23
retrieved from AMEC and input to the Nostradamus database. 24
Nostradamus can use a variety of weather parameters for forecasting as long as a 25
historical record is available for training. Hydro uses the following weather parameters: 26
air temperature, wind speed, and cloud cover. Nostradamus can use each variable 27
more than once, for example both the current and forecast air temperatures are used in 28
forecasting load. Wind chill is not used explicitly as the neural network function of 29
Nostradamus will form its own relationships between load, wind and temperature, 30
which should be superior to the one formula used by Environment Canada to derive 31
wind chill. 32
Accuracy of Nostradamus Load Forecasting January 2015
Newfoundland and Labrador Hydro Page 2
Weather data for four locations are used in Nostradamus: St. John’s, Gander, Deer Lake, 1
and Port aux Basques. Data from January 1, 2012 to October 31, 2014 are being used 2
for training and verification purposes. The training and verification periods are selected 3
to provide a sufficiently long period to ensure that a range of weather parameters are 4
included, e.g., high and low temperatures, but short enough that the historic load is still 5
representative of loads that can be expected in the future. 6
In addition to the weather and demand data, a parameter that indicates daylight hours 7
each day is input to Nostradamus. 8
Demand data for the Avalon Peninsula alone and for the Island Interconnected System 9
as a whole are input to Nostradamus automatically each hour. Only total utility load 10
(conforming), Newfoundland Power’s and Hydro’s, is input in the Nostradamus model. 11
Industrial load (non‐conforming), which is not a function of weather is forecast outside 12
the Nostradamus program and added to the forecasts from Nostradamus to derive the 13
total load forecast. 14
During the process of training the Nostradamus model, it creates separate submodels 15
for weekdays, weekends and holidays to account for the variation in customer use of 16
electricity. Nostradamus has separate holiday groups for statutory holidays and also for 17
days that are known to have unusual loads, for instance the days between Christmas 18
and New Year’s and the school Easter break. 19
1.2.2 Industrial Load 20
Industrial load tends to be almost constant, as industrial processes are independent of 21
weather. Under the current procedure, the power‐on‐order for each Industrial 22
Customer, plus the expected owned generation from Corner Brook Pulp and Paper 23
(CBPP), is used as the industrial load forecasts unless System Operations engineers 24
modify the forecast based on some knowledge of customer loads, for instance a 25
decrease due to reduced production at CBPP or a ramp up in the load expected at Vale. 26
Engineers can change the expected load in one or more cells of a seven by twenty‐four 27
hour grid, or can change the default value to be used indefinitely. 28
1.2.3 Supply and Demand Status Reporting 29
The forecast peak reported to the Board of Commissioners of Public Utilities (the Board) 30
on the daily Supply and Demand Status Report is the forecast peak as of 7:20 am. The 31
weather forecast for the next seven days and the observed weather data for the 32
previous day are input at approximately 5:00 am. Nostradamus is then run every hour 33
of the day and the most recent forecast is available for reference by System Operations 34
engineers and the Energy Control Centre operators for monitoring and managing 35

Accuracy of Nostradamus Load Forecasting January 2015
Newfoundland and Labrador Hydro Page 3
available spinning reserves. The with‐in day forecast updates are used by operators to 1
decide if additional spinning reserve is required in advance of forecast system peaks. 2
1.3 Load Forecasting Improvements 3
Hydro implemented the following changes to the load forecasting process in 2014: 4
Additional training for staff; 5
Updating to the most recent Nostradamus software version; 6
Revised training and verification periods and additional quality control of the 7
weather data, including the data from January 2014 which will improve the 8
capability of the model to forecast loads at low temperatures; 9
Adding weather parameters for cloud cover and daylight hours; 10
Modifying actual demand data used in Nostradamus training to remove unusual 11
system conditions such as significant outages; 12
Changing forecasting processes so that Nostradamus forecasts only utility load, 13
with industrial forecasts done separately; 14
Changing forecasting process to allow adjustments to the generated forecast to 15
account for unusual system conditions (e.g., to account for an abnormal system 16
configuration that may result in more or less system losses); and 17
Creation of new plots and tables showing the load forecast, spinning reserve, 18
and available reserve, which are available on demand to System Operations staff 19
for managing the system. 20
The changes to the Nostradamus model have eliminated the erratic load shapes that 21
were present in the forecasts at loads in excess of 1600 MW in January 2014 and 22
improved the reliability of the peak forecast. In addition, improved model performance 23
has allowed an increase in forecast update frequency to hourly throughout the day; 24
previously the forecast was updated five times per day. 25
Additional improvements to the forecasting process are planned for 2015, as follows: 26
A further update to the software once it is released by the vendor; 27
A move to twice daily weather forecasting and receipt of observed data which 28
will improve forecasting of the afternoon peak and the following day; and 29
Monthly accuracy reporting on the weather forecasts from AMEC, which will 30
improve the understanding of any Nostradamus forecast variance. 31

Accuracy of Nostradamus Load Forecasting January 2015
Newfoundland and Labrador Hydro Page 4
1.4 Potential Sources of Variance 1
Improvements made to the Nostradamus forecasting model and Hydro’s processes for 2
load forecasting have improved the reliability of the load forecasts and it is anticipated 3
that planned revisions will further improve the accuracy. 4
As with any forecasting however, there will be ongoing discrepancies between the 5
forecast and the actual values. Typical sources of variance in the load forecasting are as 6
follows: 7
Differences in the industrial load forecast due to unexpected changes in 8
customer loads; 9
Inaccuracies in the weather forecast, particularly temperature, wind speed or 10
cloud cover; and 11
Non‐uniform customer behaviour which results in unpredictability. 12
Accuracy of Nostradamus Load Forecasting January 2015
Newfoundland and Labrador Hydro Page 5
2. JANUARY 2015 FORECAST ACCURACY 1
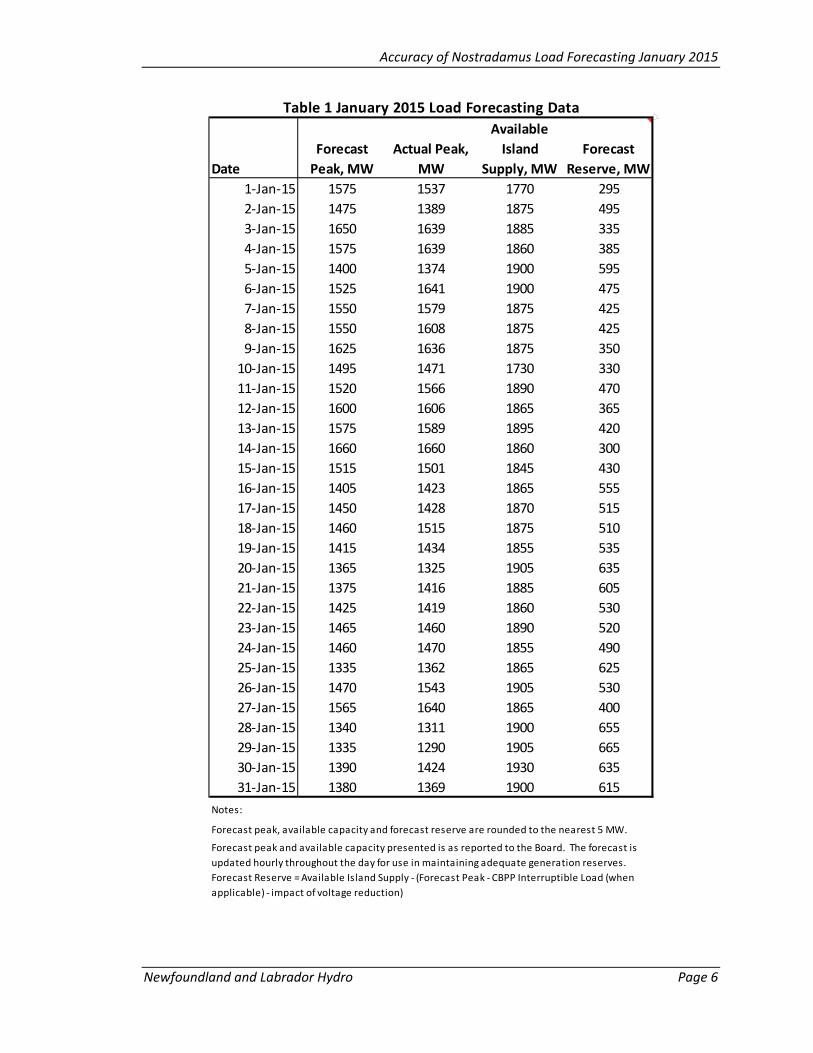
Table 1 presents the daily forecast peak, the observed peak, and the available system 2
capacity, as included in Hydro’s daily Supply and Demand Status Reports submitted to 3
the Board for each day in January 2015. The data are also presented in Figure 1. 4
2.1 January Adjustments 5
There was one day in early January when System Operations engineers decided it was 6
necessary to make an adjustment to the Nostradamus forecast to account for the 7
coincidence of low temperatures with the ongoing impact of the Christmas period on 8
the domestic load. Using guidance from Hydro’s System Planning group, System 9
Operations added 34 MW to the forecast from 3:00 pm till 11:00 pm on January 3. 10
On January 6 and again on January 14, Newfoundland Power requested a short‐term 11
voltage reduction during the expected peak demand period in order to reduce the peak. 12
Therefore, System Operations adjusted the Island utility load values input to 13
Nostradamus upwards by 20 MW for two hourly readings, estimated from the observed 14
decrease in the load when the voltage reduction was put in place. 15
January 6, 2015 17:00 load increased from 1478 MW to 1498 MW 16
January 6, 2015 18:00 load increased from 1476 MW to 1496 MW 17
January 14, 2015 08:00 load increased from 1501 MW to 1521 MW 18
January 14, 2015 09:00 load increased from 1465 MW to 1485 MW 19
A portion of the 20 MW adjustment, namely 10 MW, was added to the Avalon utility 20
load for the same periods. 21
These adjustments were made to the Nostradamus data so that in the future, when 22
January 2015 is used in training the forecasting model, Nostradamus will use a value 23
that is not affected by the requested voltage reduction. The adjustments were not 24
made to any other database, and were not made to the values reported in the daily 25
Supply and Demand Status Reports. 26
The observed peaks during January 2015 were between 1290 MW on January 29 and 27
1660 MW on January 14. There were peaks above 1600 MW, which would be 28
considered a high demand, on eight days: January 3, 4, 6, 8, 9, 12, 14 and 27. It was at 29
loads in excess of 1600 MW in January 2014 that the Nostradamus model provided 30
erratic results. 31
Accuracy of Nostradamus Load Forecasting January 2015
Newfoundland and Labrador Hydro Page 6
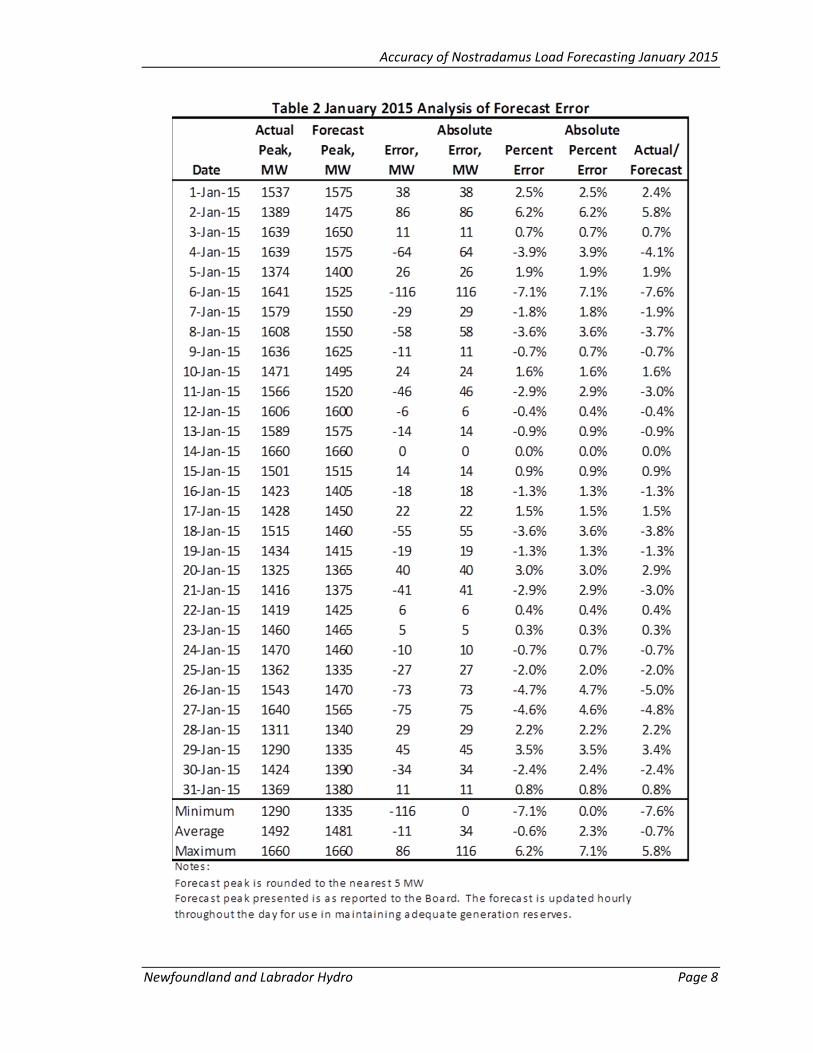
Date
Forecast
Peak, MW
Actual Peak,
MW
Available
Island
Supply, MW
Forecast
Reserve, MW
1‐Jan‐15 1575 1537 1770 295
2‐Jan‐15 1475 1389 1875 495
3‐Jan‐15 1650 1639 1885 335
4‐Jan‐15 1575 1639 1860 385
5‐Jan‐15 1400 1374 1900 595
6‐Jan‐15 1525 1641 1900 475
7‐Jan‐15 1550 1579 1875 425
8‐Jan‐15 1550 1608 1875 425
9‐Jan‐15 1625 1636 1875 350
10‐Jan‐15 1495 1471 1730 330
11‐Jan‐15 1520 1566 1890 470
12‐Jan‐15 1600 1606 1865 365
13‐Jan‐15 1575 1589 1895 420
14‐Jan‐15 1660 1660 1860 300
15‐Jan‐15 1515 1501 1845 430
16‐Jan‐15 1405 1423 1865 555
17‐Jan‐15 1450 1428 1870 515
18‐Jan‐15 1460 1515 1875 510
19‐Jan‐15 1415 1434 1855 535
20‐Jan‐15 1365 1325 1905 635
21‐Jan‐15 1375 1416 1885 605
22‐Jan‐15 1425 1419 1860 530
23‐Jan‐15 1465 1460 1890 520
24‐Jan‐15 1460 1470 1855 490
25‐Jan‐15 1335 1362 1865 625
26‐Jan‐15 1470 1543 1905 530
27‐Jan‐15 1565 1640 1865 400
28‐Jan‐15 1340 1311 1900 655
29‐Jan‐15 1335 1290 1905 665
30‐Jan‐15 1390 1424 1930 635
31‐Jan‐15 1380 1369 1900 615
Notes:
Table 1 January 2015 Load Forecasting Data
Forecast peak, available capacity and forecast reserve are rounded to the nearest 5 MW.
Forecast peak and available capacity presented is as reported to the Board. The forecast is
updated hourly throughout the day for use in maintaining adequate generation reserves.
Forecast Reserve = Available Island Supply ‐ (Forecast Peak ‐ CBPP Interruptible Load (when
applicable) ‐ impact of voltage reduction)

Accuracy of Nostradamus Load Forecasting January 2015
Newfoundland and Labrador Hydro Page 7
The available capacity during the month was between 1730 MW on January 10 and 1
1930 MW on January 30. Reserves were sufficient throughout the period. 2
Table 2 presents error statistics for the peak forecasts during the month of January 3
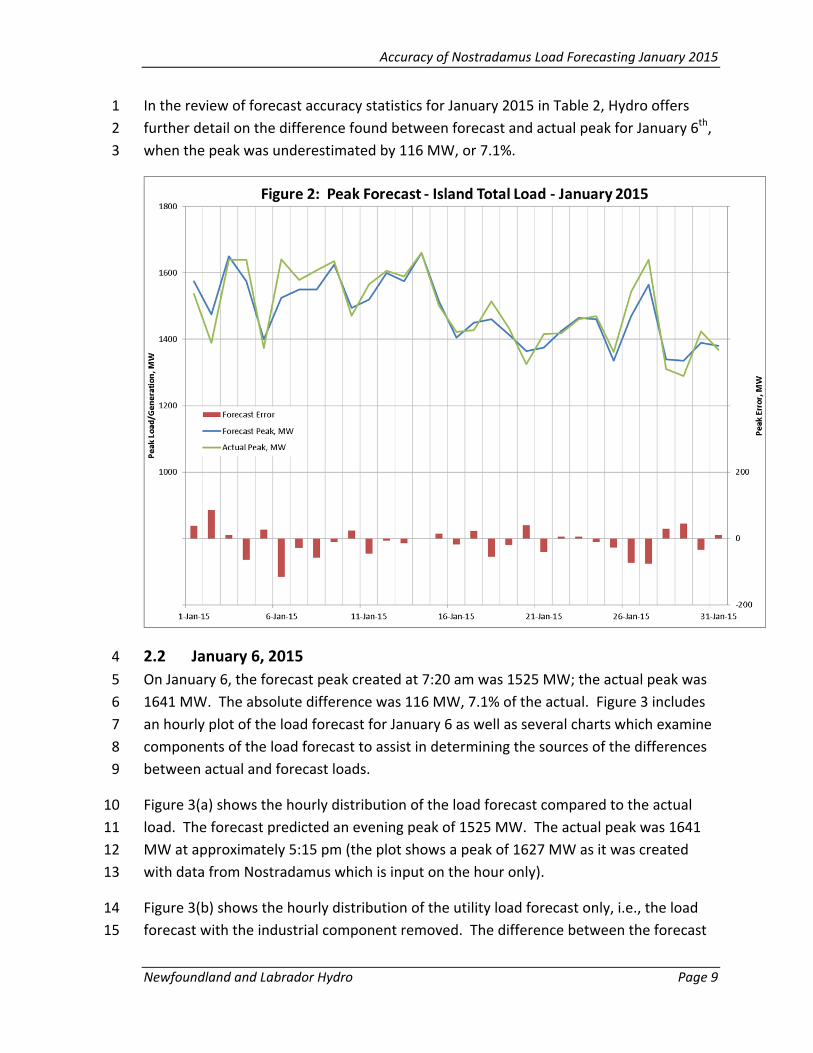
2015. Figure 2 is a plot of the forecast and actual peaks, as shown in Figure 1, but with 4
the addition of a bar chart showing the difference between the two data series. In both 5
the tables and the figures, a positive error is an overestimate; a negative error is an 6
underestimate. 7
Through the month of January the forecast peak was in a range between 7% below the 8
actual peak and 6% above the actual peak. On the best day the forecast peak was the 9
same as the actual peak; on the worst day it was 116 MW too low. On average, the 10
forecast peak was 34 MW different than the actual peak, or 2.3%. 11
Accuracy of Nostradamus Load Forecasting January 2015
Newfoundland and Labrador Hydro Page 8
Accuracy of Nostradamus Load Forecasting January 2015
Newfoundland and Labrador Hydro Page 9
In the review of forecast accuracy statistics for January 2015 in Table 2, Hydro offers 1
further detail on the difference found between forecast and actual peak for January 6th, 2
when the peak was underestimated by 116 MW, or 7.1%. 3
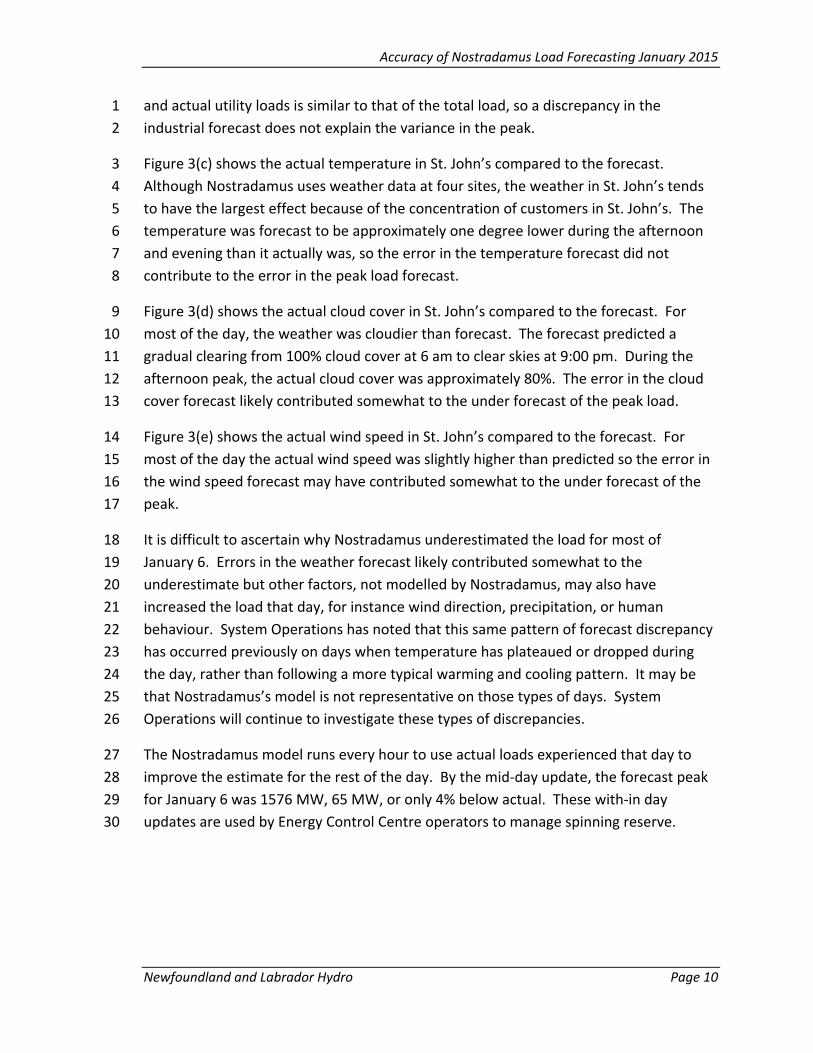
2.2 January 6, 2015 4
On January 6, the forecast peak created at 7:20 am was 1525 MW; the actual peak was 5
1641 MW. The absolute difference was 116 MW, 7.1% of the actual. Figure 3 includes 6
an hourly plot of the load forecast for January 6 as well as several charts which examine 7
components of the load forecast to assist in determining the sources of the differences 8
between actual and forecast loads. 9
Figure 3(a) shows the hourly distribution of the load forecast compared to the actual 10
load. The forecast predicted an evening peak of 1525 MW. The actual peak was 1641 11
MW at approximately 5:15 pm (the plot shows a peak of 1627 MW as it was created 12
with data from Nostradamus which is input on the hour only). 13
Figure 3(b) shows the hourly distribution of the utility load forecast only, i.e., the load 14
forecast with the industrial component removed. The difference between the forecast 15
Accuracy of Nostradamus Load Forecasting January 2015
Newfoundland and Labrador Hydro Page 10
and actual utility loads is similar to that of the total load, so a discrepancy in the 1
industrial forecast does not explain the variance in the peak. 2
Figure 3(c) shows the actual temperature in St. John’s compared to the forecast. 3
Although Nostradamus uses weather data at four sites, the weather in St. John’s tends 4
to have the largest effect because of the concentration of customers in St. John’s. The 5
temperature was forecast to be approximately one degree lower during the afternoon 6
and evening than it actually was, so the error in the temperature forecast did not 7
contribute to the error in the peak load forecast. 8
Figure 3(d) shows the actual cloud cover in St. John’s compared to the forecast. For 9
most of the day, the weather was cloudier than forecast. The forecast predicted a 10
gradual clearing from 100% cloud cover at 6 am to clear skies at 9:00 pm. During the 11
afternoon peak, the actual cloud cover was approximately 80%. The error in the cloud 12
cover forecast likely contributed somewhat to the under forecast of the peak load. 13
Figure 3(e) shows the actual wind speed in St. John’s compared to the forecast. For 14
most of the day the actual wind speed was slightly higher than predicted so the error in 15
the wind speed forecast may have contributed somewhat to the under forecast of the 16
peak. 17
It is difficult to ascertain why Nostradamus underestimated the load for most of 18
January 6. Errors in the weather forecast likely contributed somewhat to the 19
underestimate but other factors, not modelled by Nostradamus, may also have 20
increased the load that day, for instance wind direction, precipitation, or human 21
behaviour. System Operations has noted that this same pattern of forecast discrepancy 22
has occurred previously on days when temperature has plateaued or dropped during 23
the day, rather than following a more typical warming and cooling pattern. It may be 24
that Nostradamus’s model is not representative on those types of days. System 25
Operations will continue to investigate these types of discrepancies. 26
The Nostradamus model runs every hour to use actual loads experienced that day to 27
improve the estimate for the rest of the day. By the mid‐day update, the forecast peak 28
for January 6 was 1576 MW, 65 MW, or only 4% below actual. These with‐in day 29
updates are used by Energy Control Centre operators to manage spinning reserve. 30

Accuracy of Nostradamus Load Forecasting January 2015
Newfoundland and Labrador Hydro Page 11
Figure 3 Accuracy Analysis ‐ January 6, 2015
1000
1200
1400
1600
1800
12:00 AM 4:00 AM 8:00 AM 12:00 PM 4:00 PM 8:00 PM 12:00 AM
Actual Total Load
Forecast Total Load
(a)
800
1000
1200
1400
1600
12:00 AM 4:00 AM 8:00 AM 12:00 PM 4:00 PM 8:00 PM 12:00 AM
Actual Utility Load
Forecast Utility Load
(b)
‐10
‐8
‐6
‐4
‐2
0
12:00 AM 4:00 AM 8:00 AM 12:00 PM 4:00 PM 8:00 PM 12:00 AM
Actual St. John's Temperature
Forecast St. John's Temperature
(c)
0
20
40
60
80
100
120
12:00 AM 4:00 AM 8:00 AM 12:00 PM 4:00 PM 8:00 PM 12:00 AM
Actual St. John's Cloud Cover
Forecast St. John's Cloud Cover
(d)
0
20
40
60
80
12:00 AM 4:00 AM 8:00 AM 12:00 PM 4:00 PM 8:00 PM 12:00 AM
Actual St. John's Wind Speed
Forecast St. John's Wind Speed
(e)