Embed Size (px)
Citation preview
Important disclosures appear on the last page of this report.
The Henry Fund
Henry B. Tippie School Master of Finance
Ziyi Zhang [[email protected]]
Nike, Inc. (NKE) November 20, 2019
Consumer Discretionary Stock Rating Buy
Investment Thesis Target Price $105-110 Nike Inc. (NKE) has 3 different revenue segments, all of which are at a dominating position in its industry. It has two main supply chain, inline and online, accounting for 90% and 10% of its total revenue, respectively. Nike has been showing a concentrating movement towards its online market, which brings benefit to operation and also can benefit itself from the increasing global e-commerce market. The previous and ongoing acquisitions strengthen Nike’s position along with its strategy. There factors lead us to our BUY recommendation on NKE with an upside of approximately 11%. Drivers of Thesis
• Both athletic footwear and apparel market have shown a stable growth in the forecasting period from 2020 to 2024, leading to a forecasted CAGR of 10% and 9% respectively for NKE.
• The 4 tech-related acquisitions Nike made in past year strengthens Nike’s ability in the high margin direct-to-customer business.
• Nike’s penetration in e-commerce will benefit itself in the growing trend of global e-commerce market.
Risks to Thesis
• Nike operates all over the world, which leads to a high exposure to fluctuations in foreign exchange rates. Nike had 26.8% of its international revenue hedged, but that could not be an assurance of its operating results.
• Counterfeit market expands wildly and could hurt Nike’s brand reputation, which leads to a decrease in brand-loyalty.
• Competitors from both U.S. and international area create an intensive market for Nike.
Henry Fund DCF $104.41 Henry Fund DDM $133.21 Relative Multiple $107.60 Price Data Current Price $93.05 52wk Range $66.53 – 96.87 Consensus 1yr Target $103.23 Key Statistics Market Cap (B) $145.30 Shares Outstanding (B) 1.56 Institutional Ownership 84.70% Five Year Beta 0.93 Dividend Yield 1.10% Est. 5yr Growth 15.90% Price/Earnings (TTM) 34.75 Price/Earnings (FY1) 26.97 Price/Sales (TTM) 3.65 Price/Book (mrq) 15.78 Profitability Operating Margin 12.51% Profit Margin 10.81% Return on Assets (TTM) 12.78% Return on Equity (TTM) 47.32%
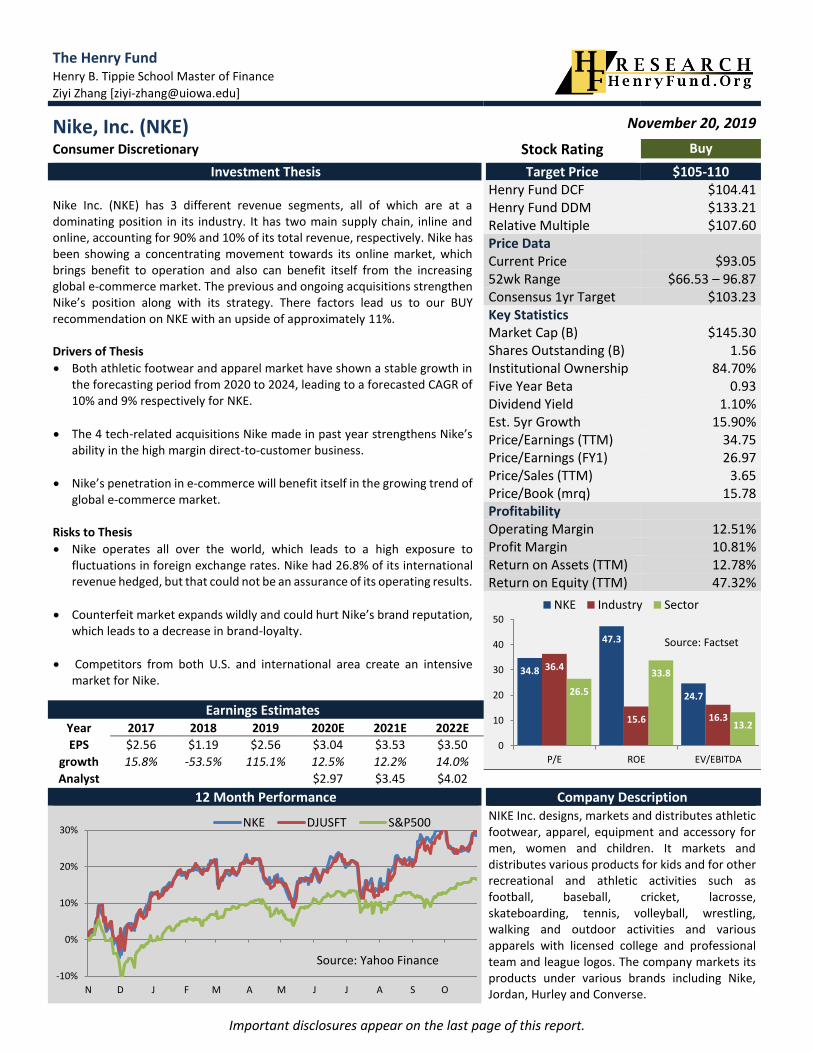
Earnings Estimates Year 2017 2018 2019 2020E 2021E 2022E
EPS $2.56 $1.19 $2.56 $3.04 $3.53 $3.50
growth 15.8% -53.5% 115.1% 12.5% 12.2% 14.0%
Analyst $2.97 $3.45 $4.02 12 Month Performance Company Description
NIKE Inc. designs, markets and distributes athletic footwear, apparel, equipment and accessory for men, women and children. It markets and distributes various products for kids and for other recreational and athletic activities such as football, baseball, cricket, lacrosse, skateboarding, tennis, volleyball, wrestling, walking and outdoor activities and various apparels with licensed college and professional team and league logos. The company markets its products under various brands including Nike, Jordan, Hurley and Converse.
34.8
47.3
24.7
36.4
15.6 16.3
26.5
33.8
13.2
0
10
20
30
40
50
P/E ROE EV/EBITDA
NKE Industry Sector
Source: Factset
-10%
0%
10%
20%
30%
N D J F M A M J J A S O
NKE DJUSFT S&P500
Source: Yahoo Finance
Page 2
EXECUTIVE SUMMARY
We recommend a buy on NKE, with an upside of 20.3%. Nike has three main products, including footwear, apparel and equipment. The footwear business takes up the largest position, accounting for 66% of total revenue. Revenue is broken down by wholesale customers and direct-to-customers (DTC) segment. From the geographical perspective, sales from international market dominants the total revenue with 26% of its international revenue hedged. Nike has been trying to move towards the e-commerce market and reducing the capital expenditures towards the inline stores. Also, Nike is trying to be more penetrated to DTC and reducing retailer partners.
Nike has acquired 4 tech-related companies in order to strength its position in DTC and e-commerce. The new launch, Nike Fit, would optimize current supply chain, ensure its customers’ loyalties and improve the margin.
The competition is intensive in both footwear and apparel industries. The fluctuations in exchange rate hurt the revenue as well. However, Nike is still dominating the whole sports-related industry.
COMPANY DESCRIPTION
Product Structure
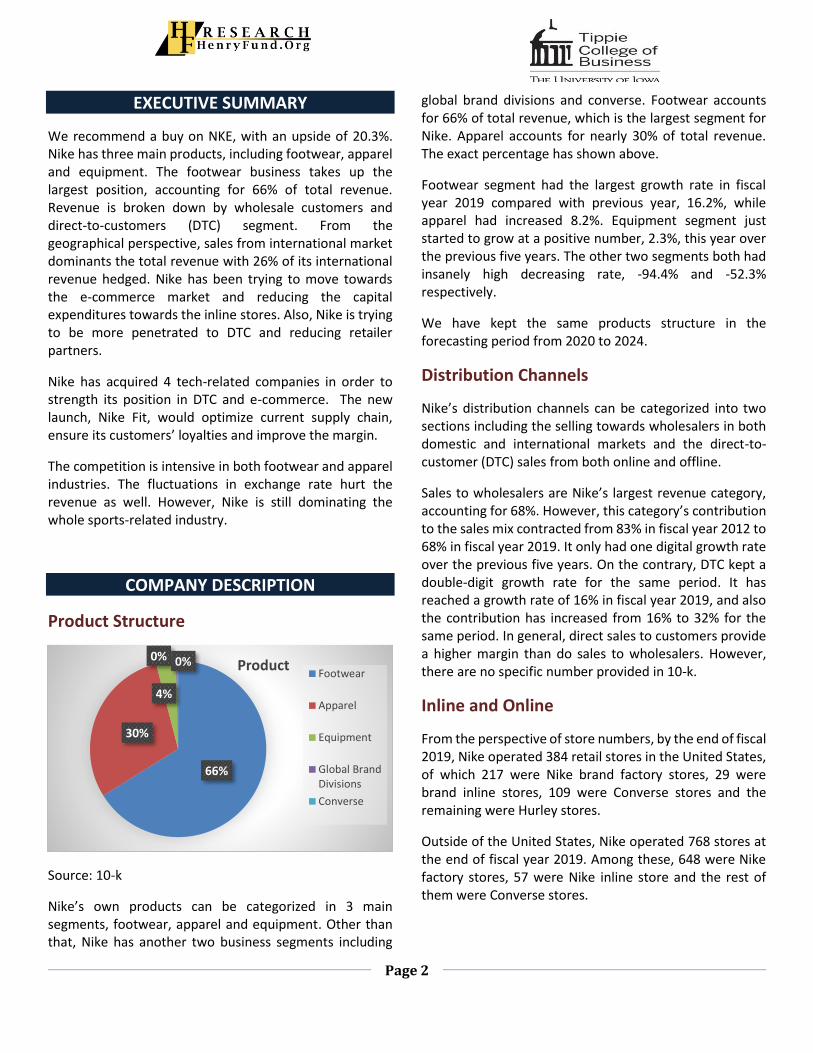
Source: 10-k
Nike’s own products can be categorized in 3 main segments, footwear, apparel and equipment. Other than that, Nike has another two business segments including
global brand divisions and converse. Footwear accounts for 66% of total revenue, which is the largest segment for Nike. Apparel accounts for nearly 30% of total revenue. The exact percentage has shown above.
Footwear segment had the largest growth rate in fiscal year 2019 compared with previous year, 16.2%, while apparel had increased 8.2%. Equipment segment just started to grow at a positive number, 2.3%, this year over the previous five years. The other two segments both had insanely high decreasing rate, -94.4% and -52.3% respectively.
We have kept the same products structure in the forecasting period from 2020 to 2024.
Distribution Channels
Nike’s distribution channels can be categorized into two sections including the selling towards wholesalers in both domestic and international markets and the direct-to-customer (DTC) sales from both online and offline.
Sales to wholesalers are Nike’s largest revenue category, accounting for 68%. However, this category’s contribution to the sales mix contracted from 83% in fiscal year 2012 to 68% in fiscal year 2019. It only had one digital growth rate over the previous five years. On the contrary, DTC kept a double-digit growth rate for the same period. It has reached a growth rate of 16% in fiscal year 2019, and also the contribution has increased from 16% to 32% for the same period. In general, direct sales to customers provide a higher margin than do sales to wholesalers. However, there are no specific number provided in 10-k.
Inline and Online
From the perspective of store numbers, by the end of fiscal 2019, Nike operated 384 retail stores in the United States, of which 217 were Nike brand factory stores, 29 were brand inline stores, 109 were Converse stores and the remaining were Hurley stores.
Outside of the United States, Nike operated 768 stores at the end of fiscal year 2019. Among these, 648 were Nike factory stores, 57 were Nike inline store and the rest of them were Converse stores.
66%
30%
4%
0% 0% ProductFootwear
Apparel
Equipment
Global BrandDivisions
Converse
Page 3
The sales came from store accounts for 90% of total revenue and had a growth rate of 6% compared with fiscal 2018.
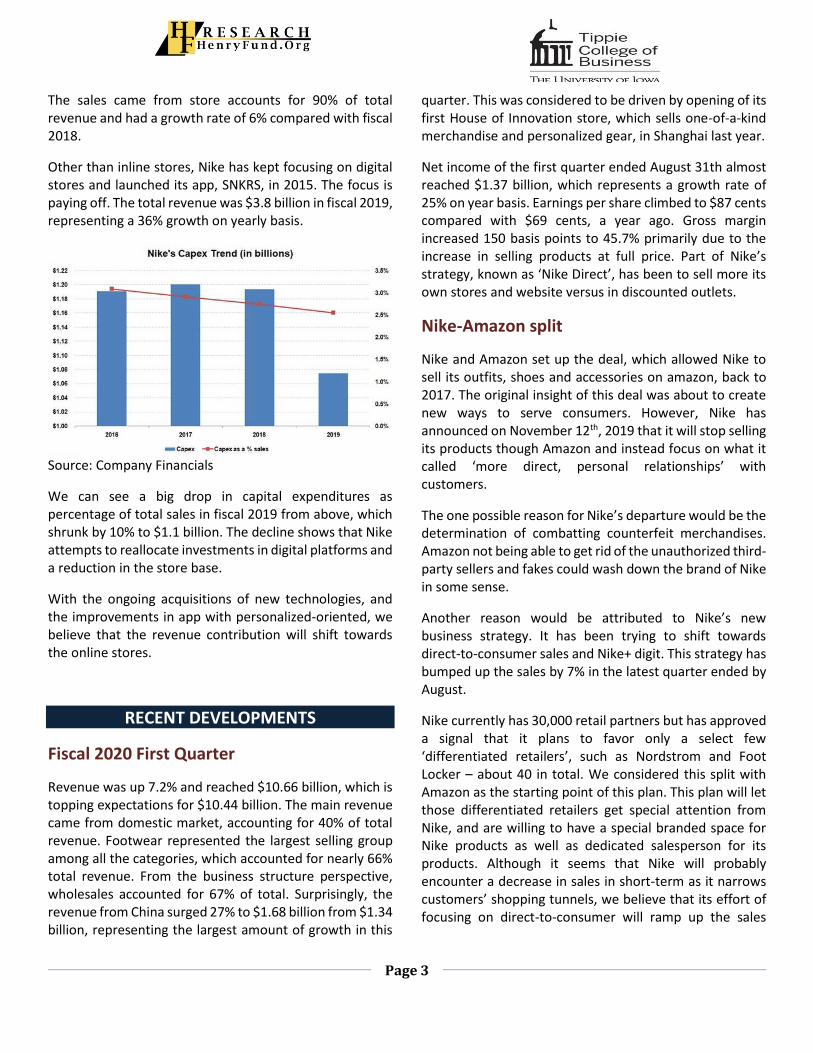
Other than inline stores, Nike has kept focusing on digital stores and launched its app, SNKRS, in 2015. The focus is paying off. The total revenue was $3.8 billion in fiscal 2019, representing a 36% growth on yearly basis.
Source: Company Financials
We can see a big drop in capital expenditures as percentage of total sales in fiscal 2019 from above, which shrunk by 10% to $1.1 billion. The decline shows that Nike attempts to reallocate investments in digital platforms and a reduction in the store base.
With the ongoing acquisitions of new technologies, and the improvements in app with personalized-oriented, we believe that the revenue contribution will shift towards the online stores.
RECENT DEVELOPMENTS
Fiscal 2020 First Quarter
Revenue was up 7.2% and reached $10.66 billion, which is topping expectations for $10.44 billion. The main revenue came from domestic market, accounting for 40% of total revenue. Footwear represented the largest selling group among all the categories, which accounted for nearly 66% total revenue. From the business structure perspective, wholesales accounted for 67% of total. Surprisingly, the revenue from China surged 27% to $1.68 billion from $1.34 billion, representing the largest amount of growth in this
quarter. This was considered to be driven by opening of its first House of Innovation store, which sells one-of-a-kind merchandise and personalized gear, in Shanghai last year.
Net income of the first quarter ended August 31th almost reached $1.37 billion, which represents a growth rate of 25% on year basis. Earnings per share climbed to $87 cents compared with $69 cents, a year ago. Gross margin increased 150 basis points to 45.7% primarily due to the increase in selling products at full price. Part of Nike’s strategy, known as ‘Nike Direct’, has been to sell more its own stores and website versus in discounted outlets.
Nike-Amazon split
Nike and Amazon set up the deal, which allowed Nike to sell its outfits, shoes and accessories on amazon, back to 2017. The original insight of this deal was about to create new ways to serve consumers. However, Nike has announced on November 12th, 2019 that it will stop selling its products though Amazon and instead focus on what it called ‘more direct, personal relationships’ with customers.
The one possible reason for Nike’s departure would be the determination of combatting counterfeit merchandises. Amazon not being able to get rid of the unauthorized third-party sellers and fakes could wash down the brand of Nike in some sense.
Another reason would be attributed to Nike’s new business strategy. It has been trying to shift towards direct-to-consumer sales and Nike+ digit. This strategy has bumped up the sales by 7% in the latest quarter ended by August.
Nike currently has 30,000 retail partners but has approved a signal that it plans to favor only a select few ‘differentiated retailers’, such as Nordstrom and Foot Locker – about 40 in total. We considered this split with Amazon as the starting point of this plan. This plan will let those differentiated retailers get special attention from Nike, and are willing to have a special branded space for Nike products as well as dedicated salesperson for its products. Although it seems that Nike will probably encounter a decrease in sales in short-term as it narrows customers’ shopping tunnels, we believe that its effort of focusing on direct-to-consumer will ramp up the sales
Page 4
finally, because customers would be more likely enjoyed better shopping experience created by Nike itself.
Nike Fit
Nike has launched Nike Fit on May 9th, 2019. It is a new scanning technology that uses computer vision and machine learning to fit customers for shoes. When consumers open the Nike app and want to buy shoes, instead of selecting a numerical size, the shopper will be presented with the option to scan their foot straight using a smartphone. A scan only takes less than 15 seconds to figure out the recommend size for a particular pair of shoes. In addition, customers may think it is not necessary to do the scan as they usually know the exact size they wear usually. However, depends on the different style of shoes, the size may vary a little bit, Nike Fit allows customers to get rid of the complexities and uncertainties resulted from checking the size chart.
Based on the speech presented by Martin, Nike’s global head of digital products, 3 in 5 people are wearing the wrong shoe size at any given time. He also stated that wrong size is the biggest reason for shoes being returned. In addition to Nike offers free return in 30 days, the cost due to the return deliveries would decrease the margin. Therefore, the launch of Nike Fit will assist in decreasing the cost of revenue and bumping up the margin regards to the potential decrease in delivery costs. [1]
Other than that, the operational system of Nike Fit links to the data center that it can gather the data of customers’ size in each region. We believe that this will increase the inventory turnover for Nike as Nike would forecast the demand of different size based on the actual data. Before the release of Nike Fit, Nike typically ships shoes in bulk to different regions based on a standard “curve” according to the prediction in size for the whole industry. The exact data gained from the Nike’s customers will accurate the distribution closer to the actual need.
Meanwhile, from a macro perspective, Nike Fit can be considered as part of the plan that Nike moves towards the business structure of direct-to-consumer. It pushes to sell more products directly to consumers through its own shops, websites and mobile app. Martin also has stated another ideal goal for Nike that he would want to see a day where shoe sizes don’t exist, instead, customers can get a pair of shoes with their name on the outside. If this is what
Nike is aiming at, we highly believe that it will create an unpredictable amount of loyalty, which in return booms the sales.
Recent Acquisitions
Nike is boosting its direct-to-consumer business with tech acquisitions. Details about the mergers and acquisitions in previous couple years list below.
Nike bought Zodiac Inc., a consumer data analytics firm, in March 2018.
Nike bought Invertex Ltd., which uses 3-D technology and mobile applications to analyze consumer buying behavior, in April 2018.
Nike acquired Celect, a leading retail predictive analytics and demand sensing firm, on Aug 6th, 2019.
Nike acquired TraceMe, a platform designed to connect sport celebrities with ‘superfans’, on Oct 11th, 2019.
(All terms of the deal above have not been made public)
Given the background that Nike’s supply chain is more complicated than most other retailers, as it manufactures its own products selling globally through in-store and online channels and also a variety of third-party retail partners sells Nike products via both physical and digital tunnels, Nike has to manage tons of different streams of demand data. Under this circumstance, Nike is in urging to expand its capabilities of predictive analytics in order to optimize the supply chain. The cost due to unnecessary inventories and deliveries intensively influences Nike’s margin.
Here we can see the that the history of acquisitions has clearly unveiled Nike’s desire of developing its analysis capabilities, which strengthens Nike’s ability in forecasting inventories. They help Nike to become more insight-driven, data-optimized and hyper-focused on consumer behavior.
Also, another signal stands out from those acquisitions is that Nike is intended to fulfill its own data source to meet its strategy on expertizing Nike-owned platform. This strategy is served to Nike’s core trend, direct-to-consumer. With an enormous data resource, Nike could better forecast the customer’ needs by both optimizing its
Page 5
inventories of specific styles and customizing the app to increase the favorability of online shopping. Actually, Nike has projected that its DTC business will reach $16 billion in sales by the end of fiscal year 2020, which represents a growth rate of 30% from fiscal year 2019. [2]
In the meanwhile, Nike has a really strong balance sheet for the ongoing and future acquisitions. Its quick ratio is nearly 1.39, which is higher than the quick ratio of past four years average whole retail apparel industry. Its debt is well covered by operating cash flow by 134.3%, and the interest payments are also well covered by EBIT with a rate of 94x. We believe that, under this level of liquidity, Nike will keep acquiring the most advanced technologies that are fully served with its own goal. This has shown a potential boom in the future.
INDUSTRY TRENDS
Global e-Commerce Market
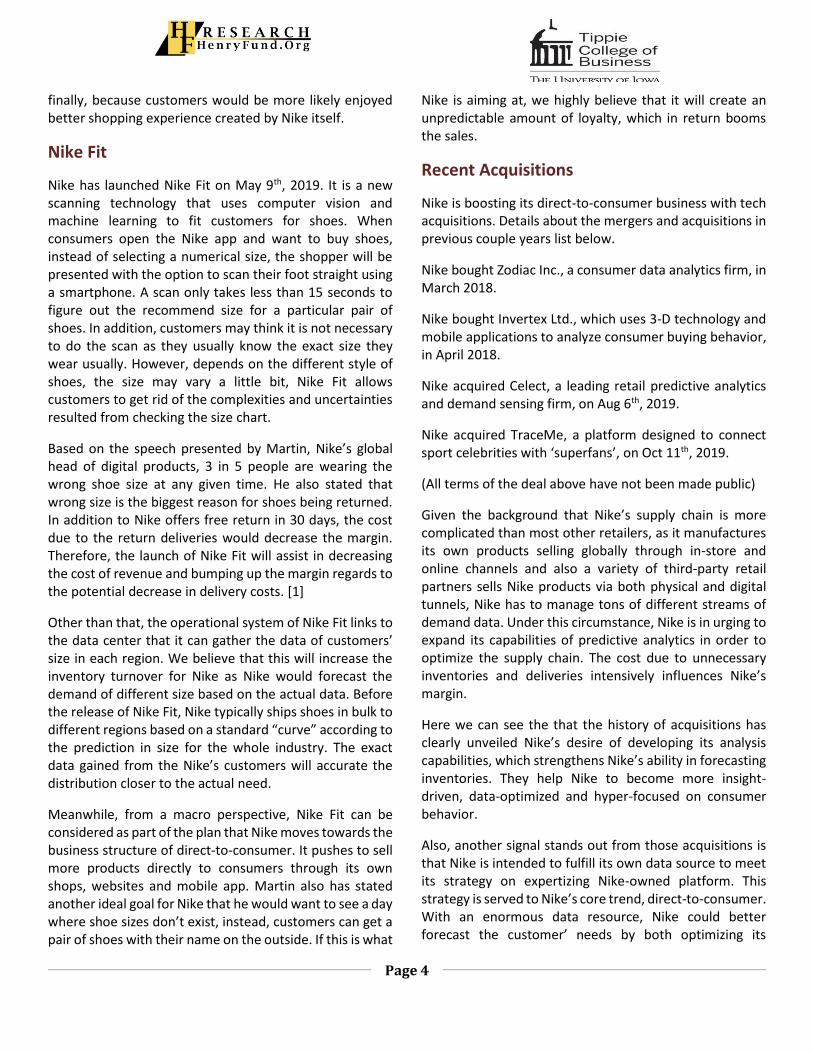
The image below has shown a dramatic increase in global e-commerce market from 2014. It also has predicted that the CAGR of the period from 2019 to 2023 will be 13%, and will reach 6.5 trillion by the end of 2023. The domestic e-commerce market has a CAGR of 7.8% for the same period. We can conclude that e-commerce business model has been gaining popularity in recent years and is expected to increase the heat in the following years.
The expansion of e-commerce market leads to a potential boom for Nike. In fiscal year 2019, revenue delieverd by digital platforms was $3.8 billion, which represents a gowth rate of nearly 36% compared to fiscal year 2018.
Source: Statista
Nike announced that it plans to continue investing in its infrastructure to support and expand digital capabilities. It also expects that the investments would be accounted for 3-4% of total revenue in 2020. The acquisitions we have discussed before are served as the powerhouse for strengthening Nike’s digital platform. In a word, the company has been drastically ramping up its online efforts and hopes to get 30% of its revenue from e-commerce by 2022 — up from 15% today.
In addition, alongside the potential growth in revenue, the digital commerce platforms also decrease the costs relative with retail middlemen or sellers. We can prove this by the decrease in the cost of sales as percentage of total revenue since 2017. However, the decrease in costs has partially been offset by the increase in the investments relative with technology. We don’t see this as a concern for Nike’s future income though as the e-commerce platform will reach a stable situation without a large amount of infusing, and thus the net margin will increase.
U.S. Athletic Footwear Industry
The demand for athletic footwear is expected to reach $9.8 billion by the end of 2023, which represents a CAGR of 3.2% from $8.3 billion in 2018. The most motivated driver of this grow is attributed to the wave of health-consciousness sweeping through the population, which directly leads to growth in consumers participating in sports and fitness activities. The increasing participation generate the high need of both athletic apparels and
Page 6
footwears. In addition, people have been popularizing athleisure as a style, and thus, other than functionality, the style and comfortability boost additional demand of athletic outfit and footwear. [3]
Nike is the leading athletic footwear supplier in the US market. Actually, Nike has been dominating the footwear industry in the U.S., according to NPD Group sports, the company is the NO.1 footwear brand in the U.S. in terms of sales, which roughly represents one-third of the market. Under this dominating position, we believe that the revenue will be solid and stable in the following years.
Global Sports Apparel Market
According to the new research published by Allied Market Research, the global sports apparel market is expected to generate revenue of $248.1 billion by 2026, growing at a CAGR of 5.1% during the forecast period, 2019-2026. The major factors drive the increase of this market would be the growing health awareness, a surge in female participation in sports and increasing disposable income.
The increase in the health awareness increase in the amount of adoption of fitness activities such as aerobics, swimming, running, and yoga. Customers would require different types of apparel along with diversified activities. Although the revenue from male customer still dominants the total sales, the female customers have brought a big growth with 11% in fiscal year 2019, which is double the number of growths brought by male customers. Female are naturally more likely to get more apparels when it is not even necessary. Therefore, the rise in participation of women in sports and fitness activities boosts the revenue. The celebrity endorsement also has paved the way for sports apparel. Lastly, increase in disposable income leads to an improvement in living standards in the emerging countries such as China and India along with rise in affinity of consumers in emerging economies toward health and fitness, and thus further boost the demand for fitness apparel.
In general, the men segment is expected to hold the highest share of the global market, the women segment would witness the fastest growth, registering a CAGR of 5.6% during the forecast period. From the geographical perspective, North America was the dominant in 2019, accounting for more than one third of the global sports
apparel market share, and is expected to keep the dominance. [4]
Counterfeit Goods Market
The counterfeit merchandise floods the market and could adversely influence the sales and profit margins. According to latest figure published by the OCED, footwear accounted for 22% of the total value of counterfeit goods seized by customs in 2016. This is obviously a bad signal for Nike’s products. Customers could mistakenly purchase fake products, containing low quality, which may further adversely affect consumer confidence in Nike and water down the reputation of the brand as well.
Fortunately, Nike has already started its revolution to fight with the counterfeit products, splitting up with Amazon. According to Statista, 15% of Amazon buyers concern about the counterfeit products and 55.6% hasn’t encounter a problem but has the concern about this issue. Although this decision narrows the selling stream of Nike, which would decrease the revenue in short-term, we believe that this is a smart decision for Nike’s long-term revenue by protecting customers’ benefits from getting rid of those potential unauthorized sellers, and also may keep the loyalty by supporting the brand’s reputation.
MARKETS AND COMPETITION
Peer Comparisons
General Comparisons in Sports market
Company Revenue ($B) Market Cap ($B)
NIKE 39.1 146.1
adidas AG 26.0 59.7
Lululemon 3.3 29.8
ANTA 4.2 26.5
PUMA 5.0 11.2
Li Ning 1.8 7.7
Under Armour 5.2 7.4
Asics 3.6 3.0
Source: Factset
Page 7
Company Footwear ($B)
Apparel ($B)
Others ($B)
NIKE 25.9 11.7 1.6
adidas AG 15.1 9.7 1.1
Lululemon - 3.3 -
ANTA 2.2 1.3 .1
PUMA 2.4 1.9 .9
Li Ning 0.8 0.7 0.1
Under Armour
1.1 3.5 .7
Asics 3.56 - -
Source: Factset
Nike is the largest among all competitors by both revenue and market capitalization. Nike’s footwear segment had sales of $25.9 billion, approximately 83% higher than adidas’ sales in footwear, which is Nike’s main competitor in the footwear industry. Nike’s apparel segment also dominants the apparel market with sales of $11.7 dollar, nearly 21% larger than adidas.
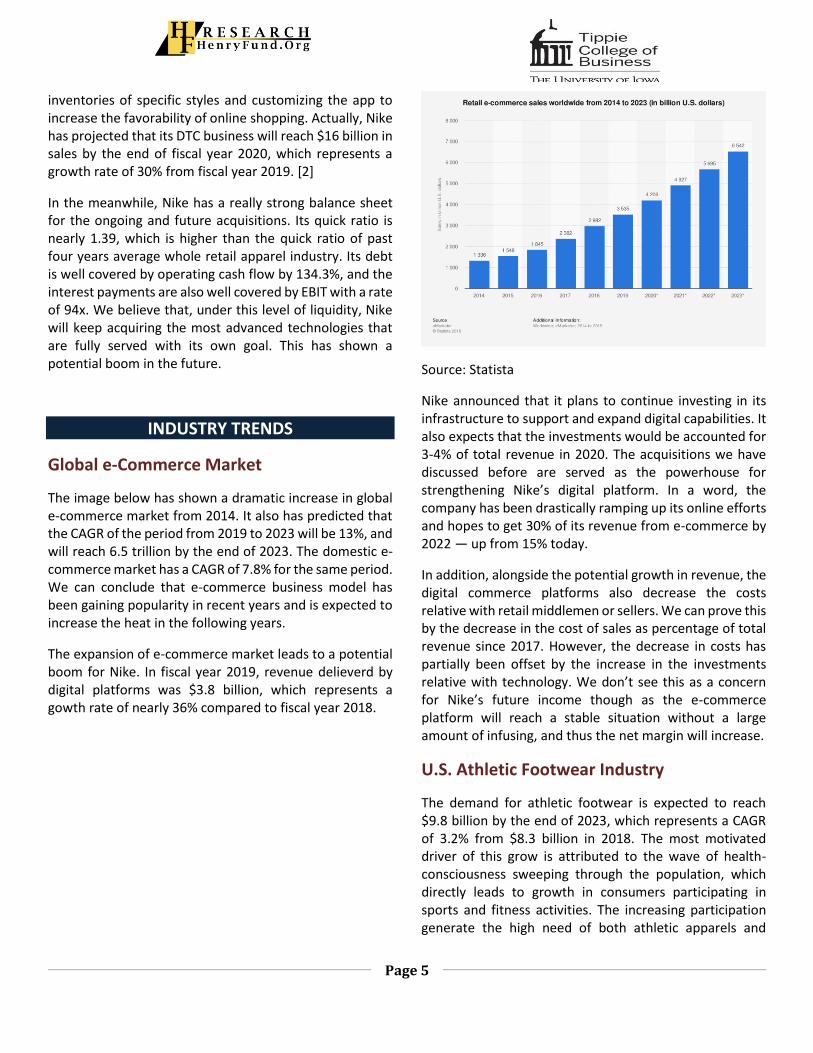
Popularity of each brand with American customers in 2018 has been shown below. ANTA and Li Ning did not penetrate American market that much, and that is why their names are not listed in the survey.
Source: Statista
We can see that Nike leads the market in popularity with both male and female customers. Under armour and adidas have similar popularity in female customers around 15%, but still lower than Nike’s 24%.
However, women customers are more style-oriented while men are more likely to choose the most functional such as fit dry. Also, female customers rapidly increase
recently. We have the concern that the popularity would probably move from Nike to other brands like adidas or Under Armour.
Inventory Turnover
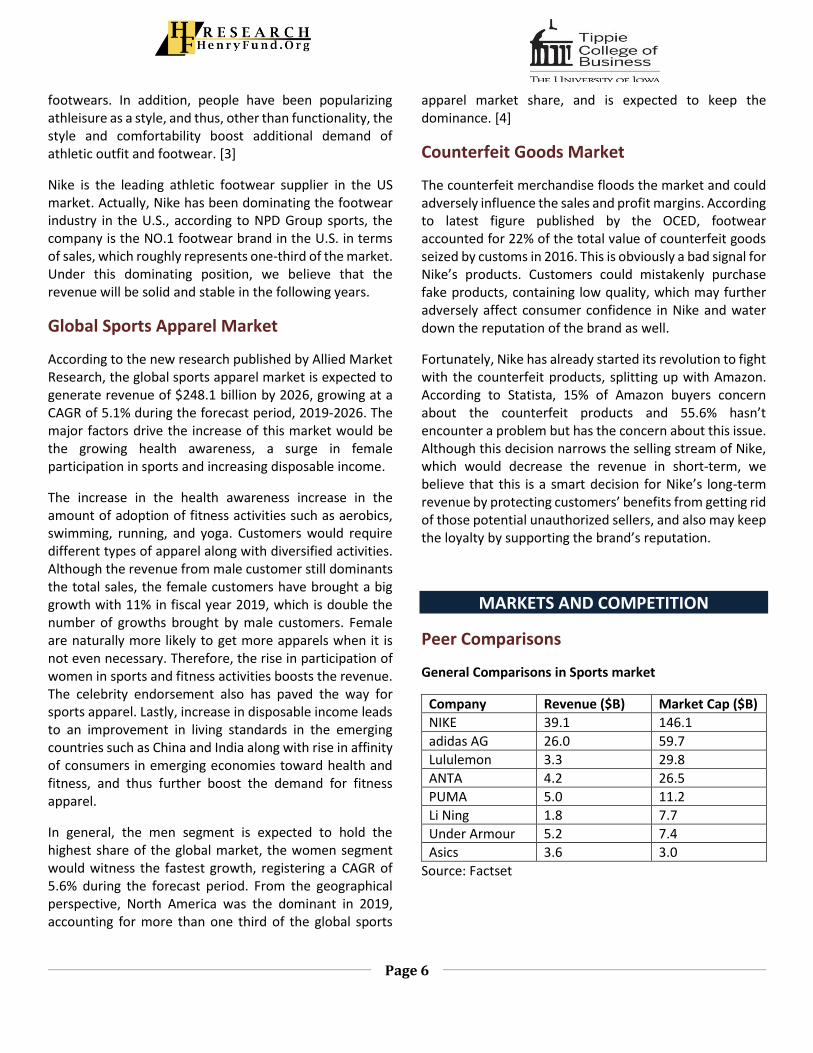
Inventory turnover can be considered as the most important indicator for retailors to show how well they manage their inventories and supply chain. Retailors have significant amount of money tied up in inventory, and thus the quicker they can get the inventories to be sold, the more lucrative retailors can be. Below is the inventory turnover comparison.
Source: Factset
Nike has a relatively high and stable inventory turnover around 4 indicating it has well operated its supply chain in previous five years.
Li Ning has been beating Nike in this area since 2017. However, 94.8% of Li Ning’s revenue came from China, and thus it is easier for Li Ning to manage its supply chain as it does not fully operate in diversifying regions. However, Li Ning, the CEO of the company, has announced in 2019 that he would want to bring Li Ning to the whole world step by step. We consider Li Ning to be a potential thread to Nike.
Lululemon was better before 2017 and has decreased to almost the same rate as Nike’s. However, lululemon only has business in apparel with very limited quantities of certain styles and colors, and thus its supply chain is not as complex as Nike.
0.00% 10.00% 20.00% 30.00%
Nike
adidas
Under Armour
Asics
Puma
Lululemon
Favorite Sportswear
Female Male
2
2.5
3
3.5
4
4.5
5
5.5
2015 2016 2017 2018 2019
Inventory Turnover
Nike AdidasANTA Under ArmourASICS Li NingLululemon
Page 8
ANTA has beat Nike in a short period from 2016 to 2017. We would not regard ANTA to be a serious rival as ANTA only does business in China while Nike fits in the global industry. Even from the perspective of Chinese market, Nike is leading the market with market share at 22.1% while Anta only comprises 10.4%.
In general, based on what we have discussed before about Nike’s split with amazon and the DTC strategy, we believe that Nike would optimize its supply chain even better and in return increase the inventory turnover. We have forecasted a stable increase in inventory turnover during the forecasting period with an average of 4.07.
Margin Analysis
Company Gross Margin
Operating Margin
Net Margin
NIKE 44.54 12.08 10.3
adidas AG 49.72 10.47 7.79
Lululemon 55.23 21.42 14.71
ANTA 52.47 20.5 17.02
PUMA 46.64 6.72 4.03
Li Ning 44.53 6.49 6.8
Under Armour 44.98 3.07 -0.89
Asics 46.72 2.72 -5.26
Source: Factset
We can see from the chart above that Nike has the most unfavorable gross margin among peers. We believe this is because they are more widely spread all over the world, which leads to a higher cost in inventories. Also, Lululemon often sells out products that are priced much higher than substitutes in the marketplace. This flows into the company’s superior margins and efficiency numbers relative to its peers. Nike, on the contrary, has more diversified product with high range of price, and the price are generally lower than Lululemon. ANTA has all its manufacture and sell in China, leading to a more favorable labor and shipping fee, and thus the gross margin is higher than every other peer except Lululemon. In addition, Nike keeps innovating in product materials such as leather, and this leads to a direct increase in material costs.
Nike wins the third place in both operating margin and net margin. We believe this is due to Nike’s ongoing increasing advancements in technology and reducing infrastructure.
We have forecasted both margins to be stable and similar with the one in fiscal 2019 in forecasting period starting from 2020 to 2024, 12% and 10% respectively.
ECONOMIC OUTLOOK
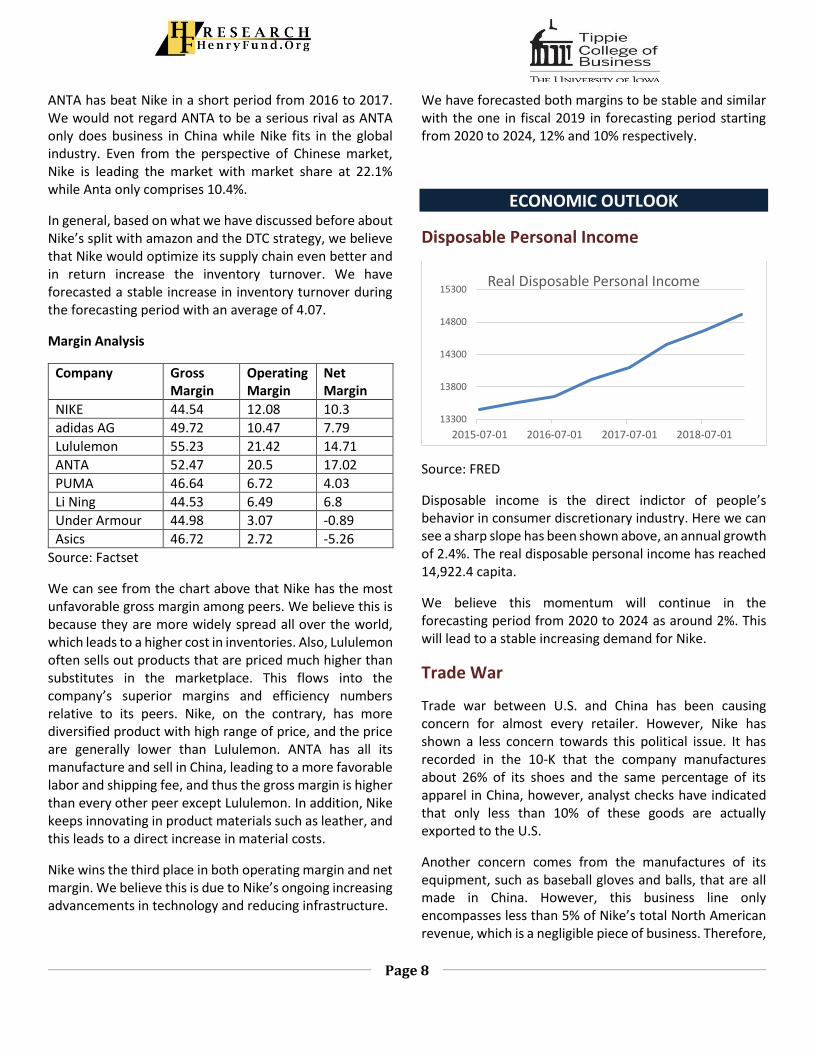
Disposable Personal Income
Source: FRED
Disposable income is the direct indictor of people’s behavior in consumer discretionary industry. Here we can see a sharp slope has been shown above, an annual growth of 2.4%. The real disposable personal income has reached 14,922.4 capita.
We believe this momentum will continue in the forecasting period from 2020 to 2024 as around 2%. This will lead to a stable increasing demand for Nike.
Trade War
Trade war between U.S. and China has been causing concern for almost every retailer. However, Nike has shown a less concern towards this political issue. It has recorded in the 10-K that the company manufactures about 26% of its shoes and the same percentage of its apparel in China, however, analyst checks have indicated that only less than 10% of these goods are actually exported to the U.S.
Another concern comes from the manufactures of its equipment, such as baseball gloves and balls, that are all made in China. However, this business line only encompasses less than 5% of Nike’s total North American revenue, which is a negligible piece of business. Therefore,
13300
13800
14300
14800
15300
2015-07-01 2016-07-01 2017-07-01 2018-07-01
Real Disposable Personal Income
Page 9
even if all the equipment category is imported from China, the exposure to tariffs is not necessary to be a concern.
Strengthening Dollar
Starting from the beginning of 2018, the US Dollar index has increased from 89.19 to 99.67, representing an 11.7% increase. The index has shown a potential decrease in Nike’s revenue. Although there is no specific revenue-breakdown by domestic and international market, it has shown in Factset that revenue came from United States only accounted for 35% of total fiscal 2019 revenue. The biggest exchange rate threat came from China as the revenue came from Greater China represented the biggest increase over the previous couple years with double-digit growth rate. It has increased 20% and 31% in fiscal 2018 and 2019, respectively. In order to relatively decrease the influence from the fluctuations in exchange rate, Nike has entered into foreign exchange forward and options to hedge the foreign exposures. However, there could be no assurance that those hedging would limit the impact of movements in exchange rates on the company’s results of operations.
The total notional amount of derivative instruments was $6.5 billion as of May 31, 2019. This represents a 17.5% of total Nike’s revenue, and 26.8% of Nike’s international revenue. The strengthening trend in dollar will lead to a higher hedge positions for Nike.
CATALYSTS FOR GROWTH
The global sporting events will be a boost for Nike’s benefit, which includes the women’s World Cup taking place this year, and the upcoming 2020 Olympic Games in Tokyo.
INVESTMENT POSITIVES
• NKE has done wonderful jobs diversifying its revenue away from inline stores. After several acquisitions done in the past year, its position in online stores will be more solid.
• NKE has realized the adverse influence from counterfeited market and split with Amazon to prevent its brand reputation.
• NKE’s focus on the DTC business increases its operating margin.
INVESTMENT NEGATIVES
• Fluctuations in exchange rate can not assured be hedged from forward contracts and options. The political phenomenon is hard to predict, and thus the adverse influence related can not be avoid from operations.
• Counterfeit market expands wildly without any useful resisting movements. It is hard to quantify how much it could influence Nike’s revenue, but obviously adversely influence its reputation.
• Trade war between U.S. and China could lead to a reduction in the Greater China market as the increasing national sentiments generated from the dispute. This may result in a movement from Nike to Chinese own sports brand, such as Li Ning, for Chinese customers.
VALUATION
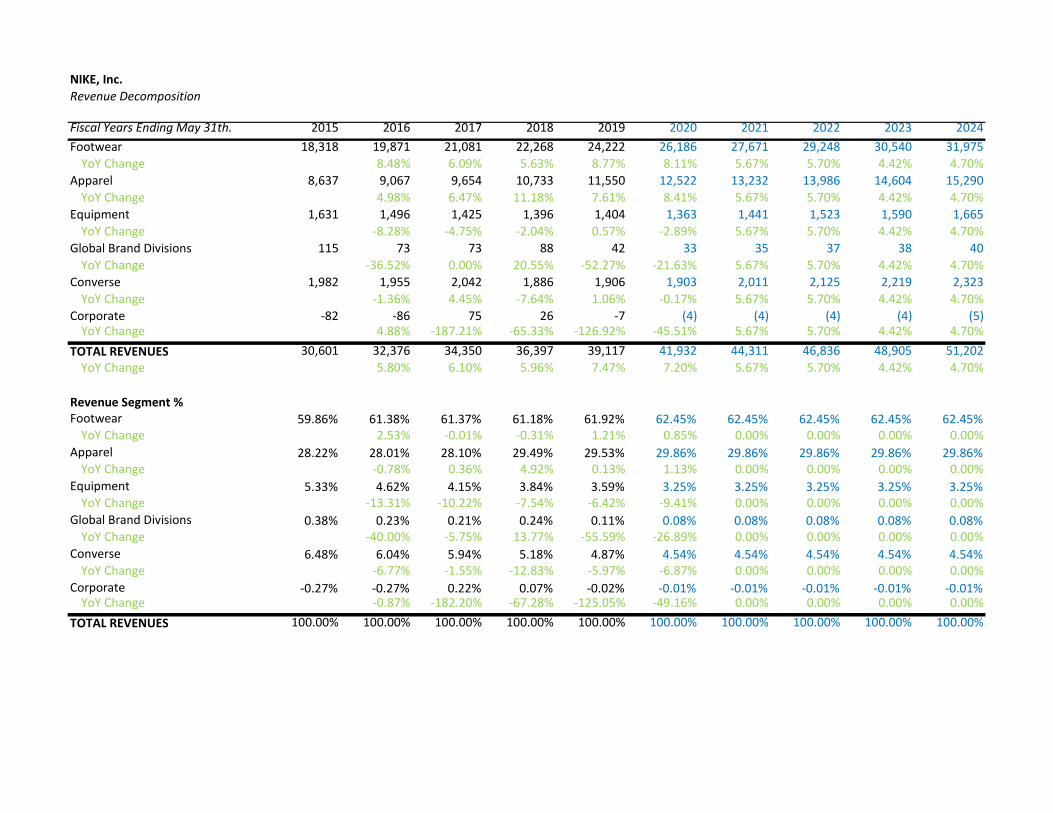
Revenue
We forecasted the revenue in total and kept the structure unchanged during forecasting period starting 2020.
We have broken down the revenue by its trend and seasonality. Nike generally had a decrease in revenue in Q2 and Q3, with Q2 larger than Q3. We believe this is primarily due to Q2 is in the winter period from September to December when customers would move to other brands have winter outfits and fewer sports outfits from Nike. Also, in general, customers do fitness activities less during wintertime. On the contrary, Q1 usually has the largest sales. We believe this is relative with the weather as well, as Q1 represents the month period from June to September.
The largest driver of sales came from footwear with an average of 61.14% for the historical period starting from
Page 10
2015 to 2019. Apparel contributed an average 28.67% of total sales for the same period. We have kept a stable structure during our forecasting period starting from 2020 to 2024. We have seen Nike’s focus more towards the footwear market, and thus we have forecasted contributions from footwears and apparels to be 62.45% and 29.86% respectively.
Cost of Revenue
We have broken down the cost of revenue as percentage of total revenue into quarterly. In general, we have kept each quarterly percentage to be the same as the average of same quarter for the previous five years. Similarly, we have seen Q2 had the largest percentage,55.86%, while Q1 had the lowest, 53.69%.
We also have factorized Nike’s movement of moving towards e-commerce and high margin DTC business, and thus led to a general decrease in each quarter cost of revenue. Therefore, we have reduced an 1% in each quarter.
Capital Expenditures
We have seen a trend in the past year that Nike tried to decrease the percentage of capital expenditure over the total sale. We believe that this trend is due to its movement towards online market. Nike has launched its app since 2015, and has kept focusing on online sales. Therefore, we felt the amount of capital expenditures will keep decreasing in the following years. Nike’s capital expenditure was approximately $1.2 billion in fiscal 2019, and we have decreased it by 5% in fiscal 2020. We then continued this reduction for the following years until 2024.
Valuation Model
We have used three financial models to forecast Nike’s stock price. The best representation of Nike’s intrinsic value would be our DCF model. We feel this way because DCF accounts for non-operating assets and liabilities. All our forecasts about Nike moving towards DTC, such as increase in short-term investments and decrease in capital expenditure, could significantly affect the value of firm. Other models might not account for these. Our DCF model gave us a target price of $104, representing an upside of 11.8%.
Another valuation model we have built was a DDM. This valuation model only based on income statements. Nike has shown a trend of acquiring new technology companies, and this trend would relate to changes in debt. Income statements only show activities in operations, and thus we do not favor in this model. We have seen Nike has a trend of paying $0.02 more every consecutive year, and thus we have kept this trend until 2024. Our DDM gave us a target price of $130.1, representing an upside of only 40%.
The last model we have built was a P/E model. We have chosen adidas, PUMA, Under Armour, and Lululemon Atheletica for Nike. All those companies have been listed in Nike’s list of competitors and operate in a global market. Another consideration for choosing those companies is they all have similar business structure with apparels, footwears and equipment. P/E gave us a target price of $107.6, representing an upside of 15.7%.
KEYS TO MONITOR
Nike has all its manufacturing goes to independent contractors overseas, including Vietnam, China, and Indonesia. Changes in political issues, such as tariffs, would hurt company directly.
REFERENCES
1. CNBC https://www.cnbc.com/2019/05/08/nike-is-launching-nike-fit-to-scan-your-feet-tell-you-your-shoe-size.html
2. Financial Strength https://csimarket.com/Industry/industry_Financial_Strength_Ratios.php?ind=1301
3. GALEhttps://bi-gale-com.proxy.lib.uiowa.edu/essentials/article/GALE%7CI2502068632/18899da45102ab0bf203984ecef3eeef?u=uiowa_main
4. Allied Market Research https://www.alliedmarketresearch.com/press-release/sports-apparel-market.html
5. Statista 6. Sec.gov
Page 11
https://www.sec.gov/Archives/edgar/data/320187/000032018719000051/nke-531201910k.htm
7. Factset 8. Yahoo Finance
https://finance.yahoo.com/quote/NKE?p=NKE&.tsrc=fin-srch
9. FRED
IMPORTANT DISCLAIMER
Henry Fund reports are created by students enrolled in the Applied Securities Management program at the University of Iowa’s Tippie College of Business. These reports provide potential employers and other interested parties an example of the analytical skills, investment knowledge, and communication abilities of our students. Henry Fund analysts are not registered investment advisors, brokers or officially licensed financial professionals. The investment opinion contained in this report does not represent an offer or solicitation to buy or sell any of the aforementioned securities. Unless otherwise noted, facts and figures included in this report are from publicly available sources. This report is not a complete compilation of data, and its accuracy is not guaranteed. From time to time, the University of Iowa, its faculty, staff, students, or the Henry Fund may hold an investment position in the companies mentioned in this report.
NIKE, Inc.Revenue Decomposition
Fiscal Years Ending May 31th. 2015 2016 2017 2018 2019 2020 2021 2022 2023 2024Footwear 18,318 19,871 21,081 22,268 24,222 26,186 27,671 29,248 30,540 31,975
YoY Change 8.48% 6.09% 5.63% 8.77% 8.11% 5.67% 5.70% 4.42% 4.70%Apparel 8,637 9,067 9,654 10,733 11,550 12,522 13,232 13,986 14,604 15,290
YoY Change 4.98% 6.47% 11.18% 7.61% 8.41% 5.67% 5.70% 4.42% 4.70%Equipment 1,631 1,496 1,425 1,396 1,404 1,363 1,441 1,523 1,590 1,665
YoY Change -8.28% -4.75% -2.04% 0.57% -2.89% 5.67% 5.70% 4.42% 4.70%Global Brand Divisions 115 73 73 88 42 33 35 37 38 40
YoY Change -36.52% 0.00% 20.55% -52.27% -21.63% 5.67% 5.70% 4.42% 4.70%Converse 1,982 1,955 2,042 1,886 1,906 1,903 2,011 2,125 2,219 2,323
YoY Change -1.36% 4.45% -7.64% 1.06% -0.17% 5.67% 5.70% 4.42% 4.70%Corporate -82 -86 75 26 -7 (4) (4) (4) (4) (5)
YoY Change 4.88% -187.21% -65.33% -126.92% -45.51% 5.67% 5.70% 4.42% 4.70%TOTAL REVENUES 30,601 32,376 34,350 36,397 39,117 41,932 44,311 46,836 48,905 51,202
YoY Change 5.80% 6.10% 5.96% 7.47% 7.20% 5.67% 5.70% 4.42% 4.70%
Revenue Segment %Footwear 59.86% 61.38% 61.37% 61.18% 61.92% 62.45% 62.45% 62.45% 62.45% 62.45%
YoY Change 2.53% -0.01% -0.31% 1.21% 0.85% 0.00% 0.00% 0.00% 0.00%Apparel 28.22% 28.01% 28.10% 29.49% 29.53% 29.86% 29.86% 29.86% 29.86% 29.86%
YoY Change -0.78% 0.36% 4.92% 0.13% 1.13% 0.00% 0.00% 0.00% 0.00%Equipment 5.33% 4.62% 4.15% 3.84% 3.59% 3.25% 3.25% 3.25% 3.25% 3.25%
YoY Change -13.31% -10.22% -7.54% -6.42% -9.41% 0.00% 0.00% 0.00% 0.00%Global Brand Divisions 0.38% 0.23% 0.21% 0.24% 0.11% 0.08% 0.08% 0.08% 0.08% 0.08%
YoY Change -40.00% -5.75% 13.77% -55.59% -26.89% 0.00% 0.00% 0.00% 0.00%Converse 6.48% 6.04% 5.94% 5.18% 4.87% 4.54% 4.54% 4.54% 4.54% 4.54%
YoY Change -6.77% -1.55% -12.83% -5.97% -6.87% 0.00% 0.00% 0.00% 0.00%Corporate -0.27% -0.27% 0.22% 0.07% -0.02% -0.01% -0.01% -0.01% -0.01% -0.01%
YoY Change -0.87% -182.20% -67.28% -125.05% -49.16% 0.00% 0.00% 0.00% 0.00%TOTAL REVENUES 100.00% 100.00% 100.00% 100.00% 100.00% 100.00% 100.00% 100.00% 100.00% 100.00%
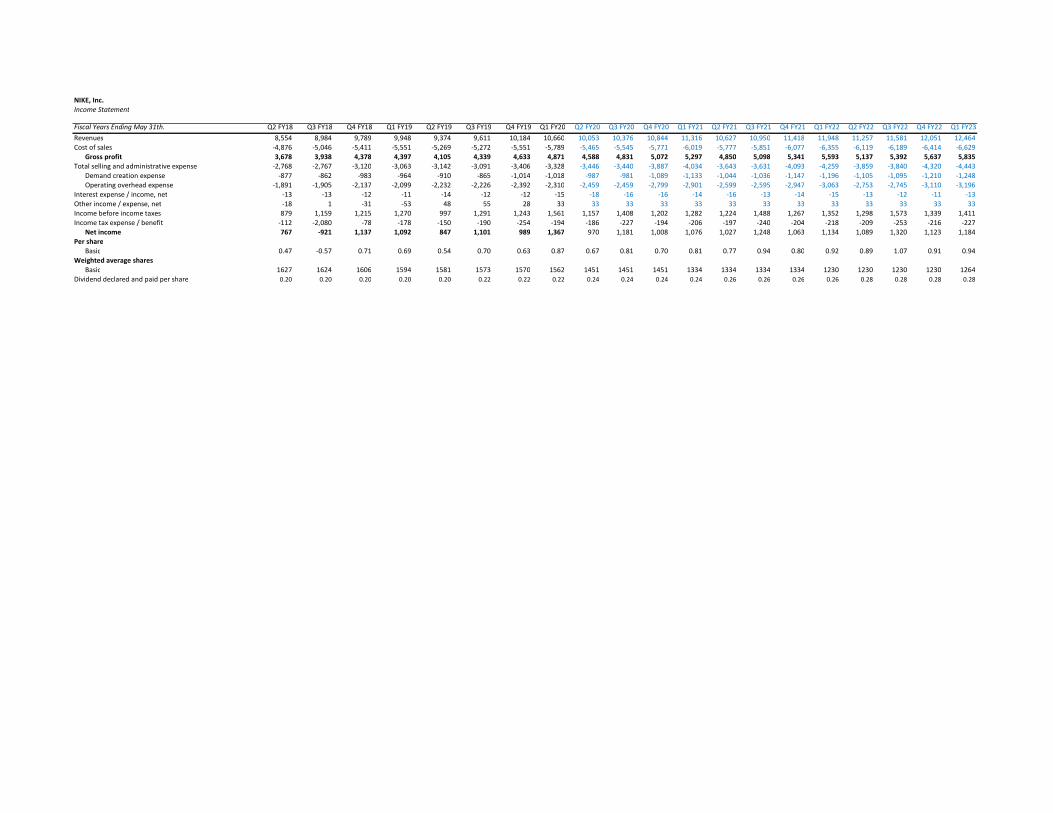
NIKE, Inc.Income Statement
Fiscal Years Ending May 31th. Q2 FY18 Q3 FY18 Q4 FY18 Q1 FY19 Q2 FY19 Q3 FY19 Q4 FY19 Q1 FY20 Q2 FY20 Q3 FY20 Q4 FY20 Q1 FY21 Q2 FY21 Q3 FY21 Q4 FY21 Q1 FY22 Q2 FY22 Q3 FY22 Q4 FY22 Q1 FY23Revenues 8,554 8,984 9,789 9,948 9,374 9,611 10,184 10,660 10,053 10,376 10,844 11,316 10,627 10,950 11,418 11,948 11,257 11,581 12,051 12,464Cost of sales -4,876 -5,046 -5,411 -5,551 -5,269 -5,272 -5,551 -5,789 -5,465 -5,545 -5,771 -6,019 -5,777 -5,851 -6,077 -6,355 -6,119 -6,189 -6,414 -6,629
Gross profit 3,678 3,938 4,378 4,397 4,105 4,339 4,633 4,871 4,588 4,831 5,072 5,297 4,850 5,098 5,341 5,593 5,137 5,392 5,637 5,835Total selling and administrative expense -2,768 -2,767 -3,120 -3,063 -3,142 -3,091 -3,406 -3,328 -3,446 -3,440 -3,887 -4,034 -3,643 -3,631 -4,093 -4,259 -3,859 -3,840 -4,320 -4,443
Demand creation expense -877 -862 -983 -964 -910 -865 -1,014 -1,018 -987 -981 -1,089 -1,133 -1,044 -1,036 -1,147 -1,196 -1,105 -1,095 -1,210 -1,248Operating overhead expense -1,891 -1,905 -2,137 -2,099 -2,232 -2,226 -2,392 -2,310 -2,459 -2,459 -2,799 -2,901 -2,599 -2,595 -2,947 -3,063 -2,753 -2,745 -3,110 -3,196
Interest expense / income, net -13 -13 -12 -11 -14 -12 -12 -15 -18 -16 -16 -14 -16 -13 -14 -15 -13 -12 -11 -13Other income / expense, net -18 1 -31 -53 48 55 28 33 33 33 33 33 33 33 33 33 33 33 33 33Income before income taxes 879 1,159 1,215 1,270 997 1,291 1,243 1,561 1,157 1,408 1,202 1,282 1,224 1,488 1,267 1,352 1,298 1,573 1,339 1,411Income tax expense / benefit -112 -2,080 -78 -178 -150 -190 -254 -194 -186 -227 -194 -206 -197 -240 -204 -218 -209 -253 -216 -227
Net income 767 -921 1,137 1,092 847 1,101 989 1,367 970 1,181 1,008 1,076 1,027 1,248 1,063 1,134 1,089 1,320 1,123 1,184Per share 1933.00 4029.00 4526.87 4413.51 4666.70
Basic 0.47 -0.57 0.71 0.69 0.54 0.70 0.63 0.87 0.67 0.81 0.70 0.81 0.77 0.94 0.80 0.92 0.89 1.07 0.91 0.94Weighted average shares
Basic 1627 1624 1606 1594 1581 1573 1570 1562 1451 1451 1451 1334 1334 1334 1334 1230 1230 1230 1230 1264Dividend declared and paid per share 0.20 0.20 0.20 0.20 0.20 0.22 0.22 0.22 0.24 0.24 0.24 0.24 0.26 0.26 0.26 0.26 0.28 0.28 0.28 0.28
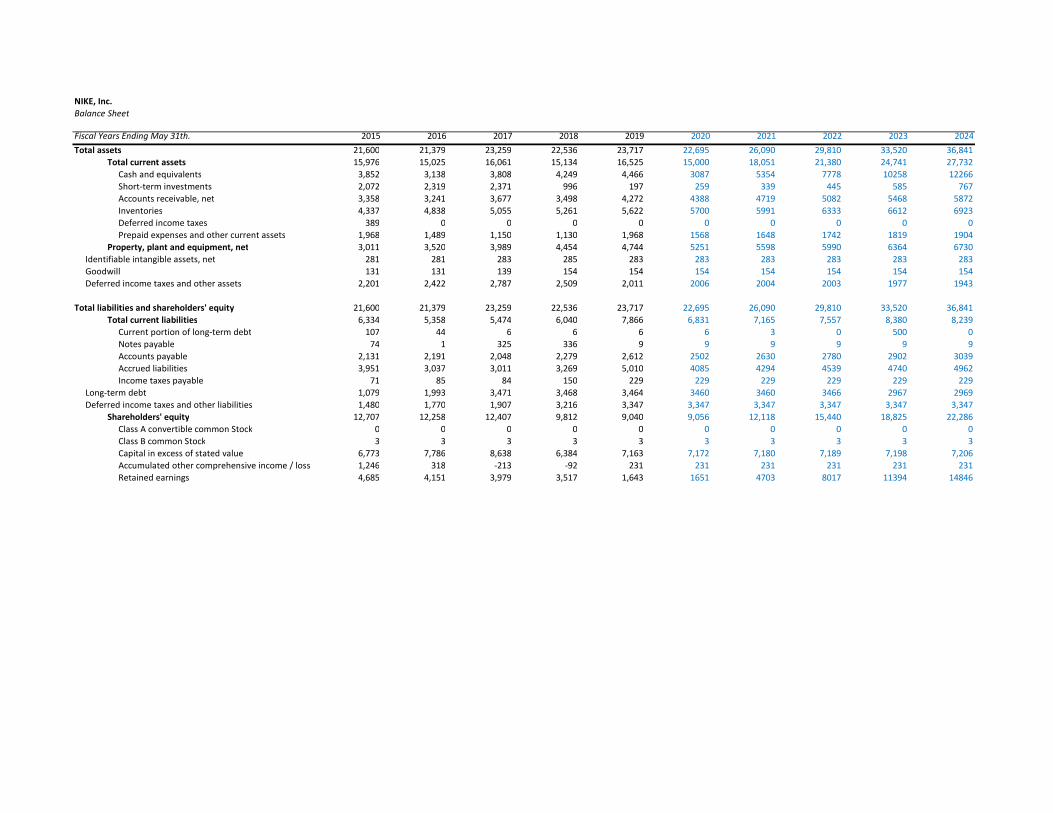
NIKE, Inc.Balance Sheet
Fiscal Years Ending May 31th. 2015 2016 2017 2018 2019 2020 2021 2022 2023 2024Total assets 21,600 21,379 23,259 22,536 23,717 22,695 26,090 29,810 33,520 36,841
Total current assets 15,976 15,025 16,061 15,134 16,525 15,000 18,051 21,380 24,741 27,732Cash and equivalents 3,852 3,138 3,808 4,249 4,466 3087 5354 7778 10258 12266Short-term investments 2,072 2,319 2,371 996 197 259 339 445 585 767Accounts receivable, net 3,358 3,241 3,677 3,498 4,272 4388 4719 5082 5468 5872Inventories 4,337 4,838 5,055 5,261 5,622 5700 5991 6333 6612 6923Deferred income taxes 389 0 0 0 0 0 0 0 0 0Prepaid expenses and other current assets 1,968 1,489 1,150 1,130 1,968 1568 1648 1742 1819 1904
Property, plant and equipment, net 3,011 3,520 3,989 4,454 4,744 5251 5598 5990 6364 6730Identifiable intangible assets, net 281 281 283 285 283 283 283 283 283 283Goodwill 131 131 139 154 154 154 154 154 154 154Deferred income taxes and other assets 2,201 2,422 2,787 2,509 2,011 2006 2004 2003 1977 1943
Total liabilities and shareholders' equity 21,600 21,379 23,259 22,536 23,717 22,695 26,090 29,810 33,520 36,841Total current liabilities 6,334 5,358 5,474 6,040 7,866 6,831 7,165 7,557 8,380 8,239
Current portion of long-term debt 107 44 6 6 6 6 3 0 500 0Notes payable 74 1 325 336 9 9 9 9 9 9Accounts payable 2,131 2,191 2,048 2,279 2,612 2502 2630 2780 2902 3039Accrued liabilities 3,951 3,037 3,011 3,269 5,010 4085 4294 4539 4740 4962Income taxes payable 71 85 84 150 229 229 229 229 229 229
Long-term debt 1,079 1,993 3,471 3,468 3,464 3460 3460 3466 2967 2969Deferred income taxes and other liabilities 1,480 1,770 1,907 3,216 3,347 3,347 3,347 3,347 3,347 3,347
Shareholders' equity 12,707 12,258 12,407 9,812 9,040 9,056 12,118 15,440 18,825 22,286Class A convertible common Stock 0 0 0 0 0 0 0 0 0 0Class B common Stock 3 3 3 3 3 3 3 3 3 3Capital in excess of stated value 6,773 7,786 8,638 6,384 7,163 7,172 7,180 7,189 7,198 7,206Accumulated other comprehensive income / loss 1,246 318 -213 -92 231 231 231 231 231 231Retained earnings 4,685 4,151 3,979 3,517 1,643 1651 4703 8017 11394 14846
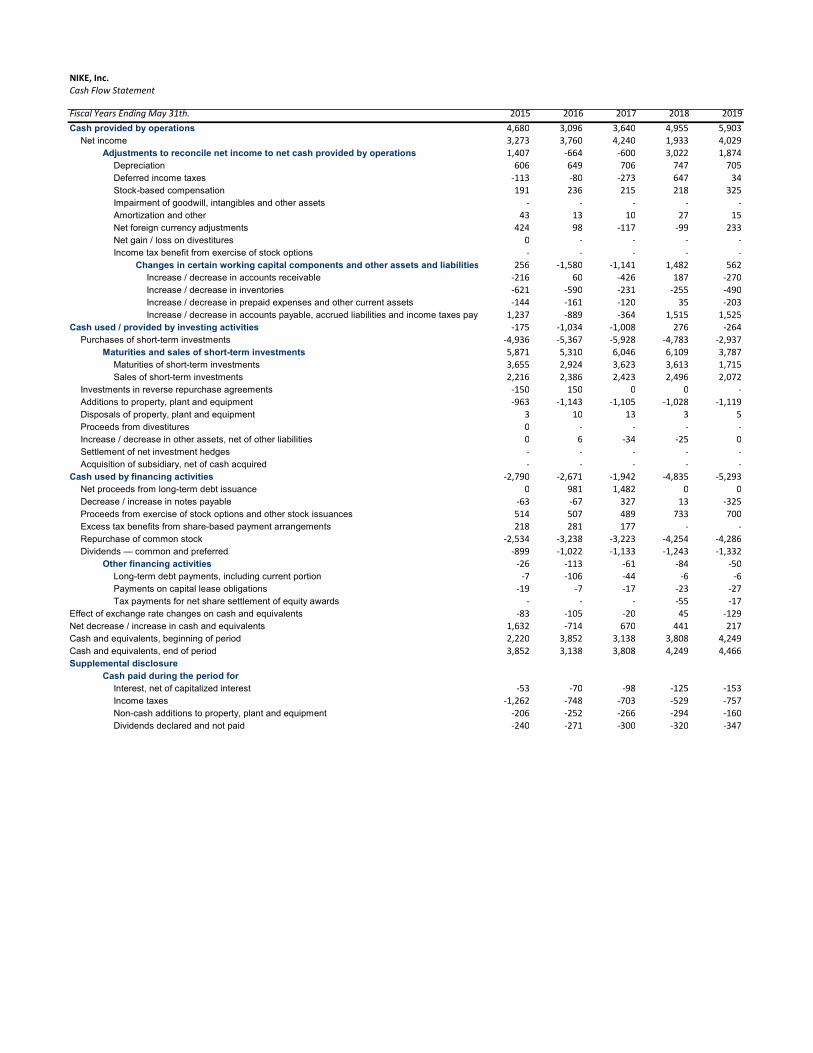
NIKE, Inc.Cash Flow Statement
Fiscal Years Ending May 31th. 2015 2016 2017 2018 2019Cash provided by operations 4,680 3,096 3,640 4,955 5,903
Net income 3,273 3,760 4,240 1,933 4,029Adjustments to reconcile net income to net cash provided by operations 1,407 -664 -600 3,022 1,874
Depreciation 606 649 706 747 705Deferred income taxes -113 -80 -273 647 34Stock-based compensation 191 236 215 218 325Impairment of goodwill, intangibles and other assets - - - - -Amortization and other 43 13 10 27 15Net foreign currency adjustments 424 98 -117 -99 233Net gain / loss on divestitures 0 - - - -Income tax benefit from exercise of stock options - - - - -
Changes in certain working capital components and other assets and liabilities 256 -1,580 -1,141 1,482 562Increase / decrease in accounts receivable -216 60 -426 187 -270Increase / decrease in inventories -621 -590 -231 -255 -490Increase / decrease in prepaid expenses and other current assets -144 -161 -120 35 -203Increase / decrease in accounts payable, accrued liabilities and income taxes payable 1,237 -889 -364 1,515 1,525
Cash used / provided by investing activities -175 -1,034 -1,008 276 -264Purchases of short-term investments -4,936 -5,367 -5,928 -4,783 -2,937
Maturities and sales of short-term investments 5,871 5,310 6,046 6,109 3,787Maturities of short-term investments 3,655 2,924 3,623 3,613 1,715Sales of short-term investments 2,216 2,386 2,423 2,496 2,072
Investments in reverse repurchase agreements -150 150 0 0 -Additions to property, plant and equipment -963 -1,143 -1,105 -1,028 -1,119Disposals of property, plant and equipment 3 10 13 3 5Proceeds from divestitures 0 - - - -Increase / decrease in other assets, net of other liabilities 0 6 -34 -25 0Settlement of net investment hedges - - - - -Acquisition of subsidiary, net of cash acquired - - - - -
Cash used by financing activities -2,790 -2,671 -1,942 -4,835 -5,293Net proceeds from long-term debt issuance 0 981 1,482 0 0Decrease / increase in notes payable -63 -67 327 13 -325Proceeds from exercise of stock options and other stock issuances 514 507 489 733 700Excess tax benefits from share-based payment arrangements 218 281 177 - -Repurchase of common stock -2,534 -3,238 -3,223 -4,254 -4,286Dividends — common and preferred -899 -1,022 -1,133 -1,243 -1,332
Other financing activities -26 -113 -61 -84 -50Long-term debt payments, including current portion -7 -106 -44 -6 -6Payments on capital lease obligations -19 -7 -17 -23 -27Tax payments for net share settlement of equity awards - - - -55 -17
Effect of exchange rate changes on cash and equivalents -83 -105 -20 45 -129Net decrease / increase in cash and equivalents 1,632 -714 670 441 217Cash and equivalents, beginning of period 2,220 3,852 3,138 3,808 4,249Cash and equivalents, end of period 3,852 3,138 3,808 4,249 4,466Supplemental disclosure
Cash paid during the period forInterest, net of capitalized interest -53 -70 -98 -125 -153Income taxes -1,262 -748 -703 -529 -757Non-cash additions to property, plant and equipment -206 -252 -266 -294 -160Dividends declared and not paid -240 -271 -300 -320 -347
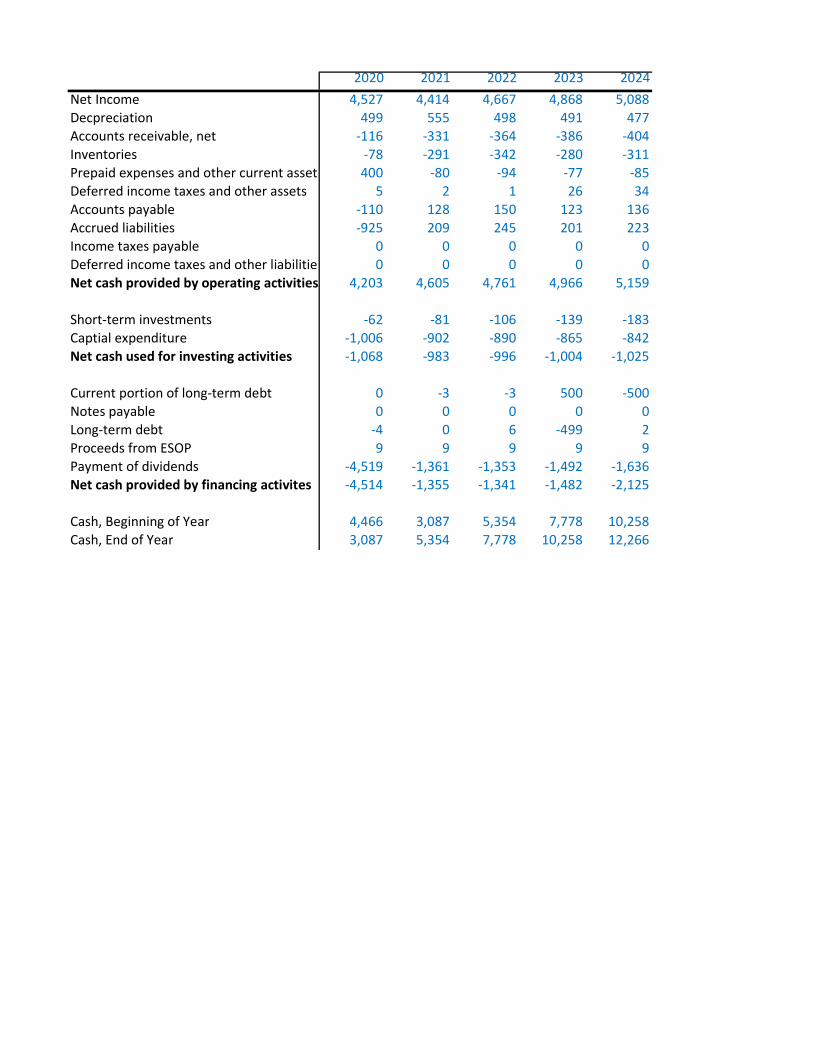
2020 2021 2022 2023 2024Net Income 4,527 4,414 4,667 4,868 5,088Decpreciation 499 555 498 491 477Accounts receivable, net -116 -331 -364 -386 -404Inventories -78 -291 -342 -280 -311Prepaid expenses and other current assets 400 -80 -94 -77 -85Deferred income taxes and other assets 5 2 1 26 34Accounts payable -110 128 150 123 136Accrued liabilities -925 209 245 201 223Income taxes payable 0 0 0 0 0Deferred income taxes and other liabilities 0 0 0 0 0Net cash provided by operating activities 4,203 4,605 4,761 4,966 5,159
Short-term investments -62 -81 -106 -139 -183Captial expenditure -1,006 -902 -890 -865 -842Net cash used for investing activities -1,068 -983 -996 -1,004 -1,025
Current portion of long-term debt 0 -3 -3 500 -500Notes payable 0 0 0 0 0Long-term debt -4 0 6 -499 2Proceeds from ESOP 9 9 9 9 9Payment of dividends -4,519 -1,361 -1,353 -1,492 -1,636Net cash provided by financing activites -4,514 -1,355 -1,341 -1,482 -2,125
Cash, Beginning of Year 4,466 3,087 5,354 7,778 10,258Cash, End of Year 3,087 5,354 7,778 10,258 12,266
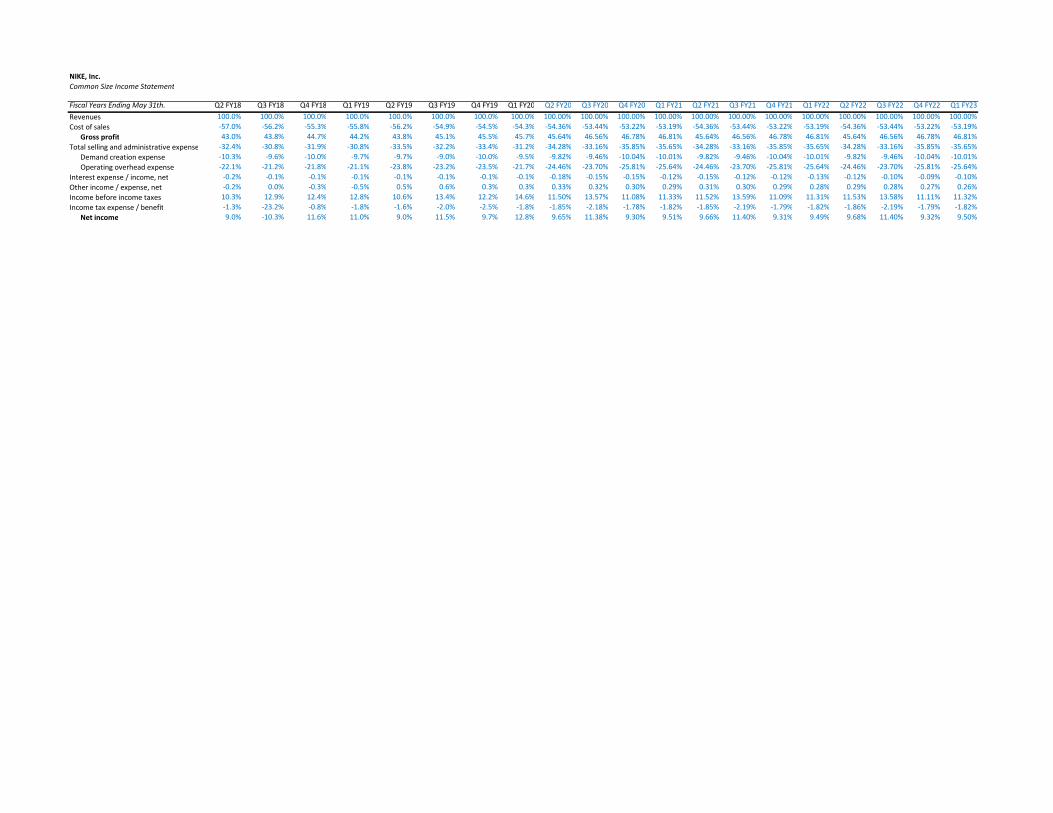
NIKE, Inc.Common Size Income Statement
Fiscal Years Ending May 31th. Q2 FY18 Q3 FY18 Q4 FY18 Q1 FY19 Q2 FY19 Q3 FY19 Q4 FY19 Q1 FY20 Q2 FY20 Q3 FY20 Q4 FY20 Q1 FY21 Q2 FY21 Q3 FY21 Q4 FY21 Q1 FY22 Q2 FY22 Q3 FY22 Q4 FY22 Q1 FY23Revenues 100.0% 100.0% 100.0% 100.0% 100.0% 100.0% 100.0% 100.0% 100.00% 100.00% 100.00% 100.00% 100.00% 100.00% 100.00% 100.00% 100.00% 100.00% 100.00% 100.00%Cost of sales -57.0% -56.2% -55.3% -55.8% -56.2% -54.9% -54.5% -54.3% -54.36% -53.44% -53.22% -53.19% -54.36% -53.44% -53.22% -53.19% -54.36% -53.44% -53.22% -53.19%
Gross profit 43.0% 43.8% 44.7% 44.2% 43.8% 45.1% 45.5% 45.7% 45.64% 46.56% 46.78% 46.81% 45.64% 46.56% 46.78% 46.81% 45.64% 46.56% 46.78% 46.81%Total selling and administrative expense -32.4% -30.8% -31.9% -30.8% -33.5% -32.2% -33.4% -31.2% -34.28% -33.16% -35.85% -35.65% -34.28% -33.16% -35.85% -35.65% -34.28% -33.16% -35.85% -35.65%
Demand creation expense -10.3% -9.6% -10.0% -9.7% -9.7% -9.0% -10.0% -9.5% -9.82% -9.46% -10.04% -10.01% -9.82% -9.46% -10.04% -10.01% -9.82% -9.46% -10.04% -10.01%Operating overhead expense -22.1% -21.2% -21.8% -21.1% -23.8% -23.2% -23.5% -21.7% -24.46% -23.70% -25.81% -25.64% -24.46% -23.70% -25.81% -25.64% -24.46% -23.70% -25.81% -25.64%
Interest expense / income, net -0.2% -0.1% -0.1% -0.1% -0.1% -0.1% -0.1% -0.1% -0.18% -0.15% -0.15% -0.12% -0.15% -0.12% -0.12% -0.13% -0.12% -0.10% -0.09% -0.10%Other income / expense, net -0.2% 0.0% -0.3% -0.5% 0.5% 0.6% 0.3% 0.3% 0.33% 0.32% 0.30% 0.29% 0.31% 0.30% 0.29% 0.28% 0.29% 0.28% 0.27% 0.26%Income before income taxes 10.3% 12.9% 12.4% 12.8% 10.6% 13.4% 12.2% 14.6% 11.50% 13.57% 11.08% 11.33% 11.52% 13.59% 11.09% 11.31% 11.53% 13.58% 11.11% 11.32%Income tax expense / benefit -1.3% -23.2% -0.8% -1.8% -1.6% -2.0% -2.5% -1.8% -1.85% -2.18% -1.78% -1.82% -1.85% -2.19% -1.79% -1.82% -1.86% -2.19% -1.79% -1.82%
Net income 9.0% -10.3% 11.6% 11.0% 9.0% 11.5% 9.7% 12.8% 9.65% 11.38% 9.30% 9.51% 9.66% 11.40% 9.31% 9.49% 9.68% 11.40% 9.32% 9.50%

NIKE, Inc.Common Size Balance Sheet
Fiscal Years Ending May 31th. 2015 2016 2017 2018 2019 2020E 2021E 2022E 2023E 2024ETotal assets 70.59% 66.03% 67.71% 61.92% 60.63% 54.12% 58.88% 63.65% 68.54% 71.95%
Total current assets 52.21% 46.41% 46.76% 41.58% 42.25% 35.77% 40.74% 45.65% 50.59% 54.16%Cash and equivalents 12.59% 9.69% 11.09% 11.67% 11.42% 7.36% 12.08% 16.61% 20.97% 23.96%Short-term investments 6.77% 7.16% 6.90% 2.74% 0.50% 0.62% 0.77% 0.95% 1.20% 1.50%Accounts receivable, net 10.97% 10.01% 10.70% 9.61% 10.92% 10.46% 10.65% 10.85% 11.18% 11.47%Inventories 14.17% 14.94% 14.72% 14.45% 14.37% 13.59% 13.52% 13.52% 13.52% 13.52%Deferred income taxes 1.27% 0.00% 0.00% 0.00% 0.00% 0.00% 0.00% 0.00% 0.00% 0.00%Prepaid expenses and other current assets 6.43% 4.60% 3.35% 3.10% 5.03% 3.74% 3.72% 3.72% 3.72% 3.72%
Property, plant and equipment, net 9.84% 10.87% 11.61% 12.24% 12.13% 12.52% 12.63% 12.79% 13.01% 13.14%Identifiable intangible assets, net 0.92% 0.87% 0.82% 0.78% 0.72% 0.67% 0.64% 0.60% 0.58% 0.55%Goodwill 0.43% 0.40% 0.40% 0.42% 0.39% 0.37% 0.35% 0.33% 0.31% 0.30%Deferred income taxes and other assets 7.19% 7.48% 8.11% 6.89% 5.14% 4.78% 4.52% 4.28% 4.04% 3.79%
Total liabilities and shareholders' equity 70.59% 66.03% 67.71% 61.92% 60.63% 54.12% 58.88% 63.65% 68.54% 71.95%Total current liabilities 20.70% 16.55% 15.94% 16.59% 20.11% 16.29% 16.17% 16.13% 17.14% 16.09%
Current portion of long-term debt 0.35% 0.14% 0.02% 0.02% 0.02% 0.01% 0.01% 0.00% 1.02% 0.00%Notes payable 0.24% 0.00% 0.95% 0.92% 0.02% 0.02% 0.02% 0.02% 0.02% 0.02%Accounts payable 6.96% 6.77% 5.96% 6.26% 6.68% 5.97% 5.93% 5.93% 5.93% 5.93%Accrued liabilities 12.91% 9.38% 8.77% 8.98% 12.81% 9.74% 9.69% 9.69% 9.69% 9.69%Income taxes payable 0.23% 0.26% 0.24% 0.41% 0.59% 0.55% 0.52% 0.49% 0.47% 0.45%
Long-term debt 3.53% 6.16% 10.10% 9.53% 8.86% 8.25% 7.81% 7.40% 6.07% 5.80%Deferred income taxes and other liabilities 4.84% 5.47% 5.55% 8.84% 8.56% 7.98% 7.55% 7.15% 6.84% 6.54%
Shareholders' equity 41.52% 37.86% 36.12% 26.96% 23.11% 21.60% 27.35% 32.97% 38.49% 43.53%Class A convertible common Stock 0.00% 0.00% 0.00% 0.00% 0.00% 0.00% 0.00% 0.00% 0.00% 0.00%Class B common Stock 0.01% 0.01% 0.01% 0.01% 0.01% 0.01% 0.01% 0.01% 0.01% 0.01%Capital in excess of stated value 22.13% 24.05% 25.15% 17.54% 18.31% 17.10% 16.20% 15.35% 14.72% 14.07%Accumulated other comprehensive income / loss 4.07% 0.98% -0.62% -0.25% 0.59% 0.55% 0.52% 0.49% 0.47% 0.45%Retained earnings 15.31% 12.82% 11.58% 9.66% 4.20% 3.94% 10.61% 17.12% 23.30% 28.99%
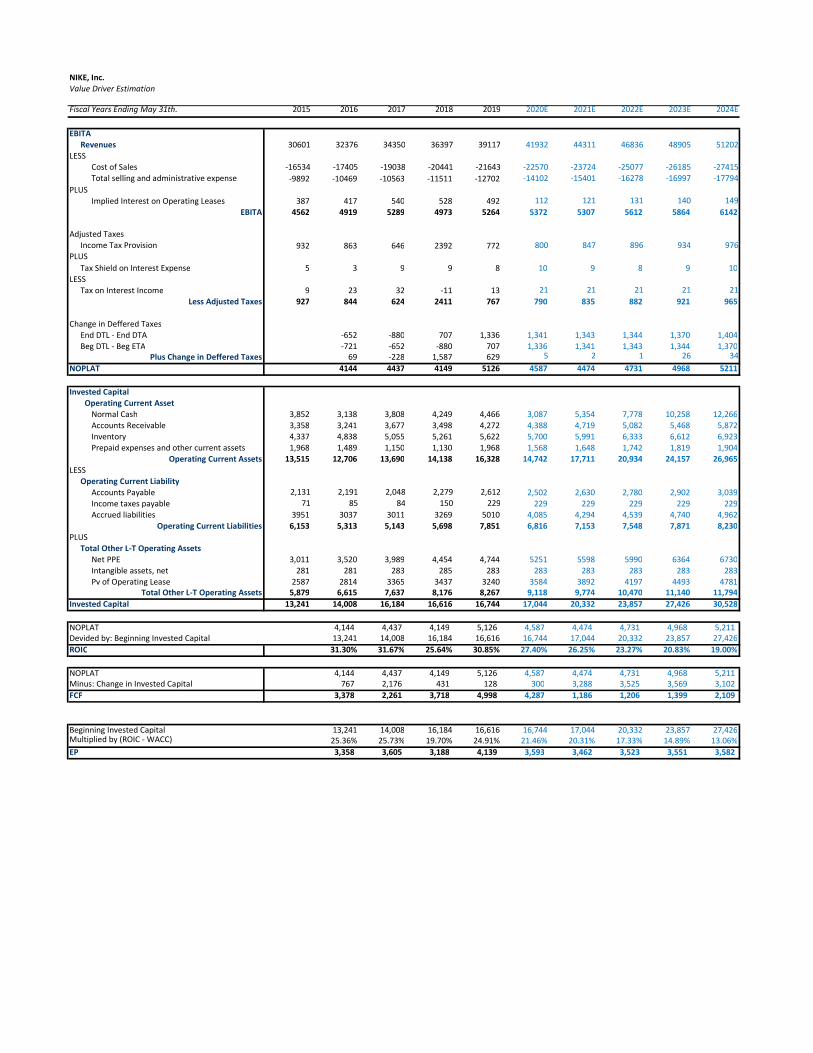
NIKE, Inc.Value Driver Estimation
Fiscal Years Ending May 31th. 2015 2016 2017 2018 2019 2020E 2021E 2022E 2023E 2024E
EBITARevenues 30601 32376 34350 36397 39117 41932 44311 46836 48905 51202
LESSCost of Sales -16534 -17405 -19038 -20441 -21643 -22570 -23724 -25077 -26185 -27415Total selling and administrative expense -9892 -10469 -10563 -11511 -12702 -14102 -15401 -16278 -16997 -17794
PLUSImplied Interest on Operating Leases 387 417 540 528 492 112 121 131 140 149
EBITA 4562 4919 5289 4973 5264 5372 5307 5612 5864 6142
Adjusted TaxesIncome Tax Provision 932 863 646 2392 772 800 847 896 934 976
PLUSTax Shield on Interest Expense 5 3 9 9 8 10 9 8 9 10
LESSTax on Interest Income 9 23 32 -11 13 21 21 21 21 21
Less Adjusted Taxes 927 844 624 2411 767 790 835 882 921 965
Change in Deffered TaxesEnd DTL - End DTA -652 -880 707 1,336 1,341 1,343 1,344 1,370 1,404Beg DTL - Beg ETA -721 -652 -880 707 1,336 1,341 1,343 1,344 1,370
Plus Change in Deffered Taxes 69 -228 1,587 629 5 2 1 26 34NOPLAT 4144 4437 4149 5126 4587 4474 4731 4968 5211
Invested Capital Operating Current Asset
Normal Cash 3,852 3,138 3,808 4,249 4,466 3,087 5,354 7,778 10,258 12,266Accounts Receivable 3,358 3,241 3,677 3,498 4,272 4,388 4,719 5,082 5,468 5,872Inventory 4,337 4,838 5,055 5,261 5,622 5,700 5,991 6,333 6,612 6,923Prepaid expenses and other current assets 1,968 1,489 1,150 1,130 1,968 1,568 1,648 1,742 1,819 1,904
Operating Current Assets 13,515 12,706 13,690 14,138 16,328 14,742 17,711 20,934 24,157 26,965LESS
Operating Current LiabilityAccounts Payable 2,131 2,191 2,048 2,279 2,612 2,502 2,630 2,780 2,902 3,039Income taxes payable 71 85 84 150 229 229 229 229 229 229Accrued liabilities 3951 3037 3011 3269 5010 4,085 4,294 4,539 4,740 4,962
Operating Current Liabilities 6,153 5,313 5,143 5,698 7,851 6,816 7,153 7,548 7,871 8,230PLUS
Total Other L-T Operating AssetsNet PPE 3,011 3,520 3,989 4,454 4,744 5251 5598 5990 6364 6730Intangible assets, net 281 281 283 285 283 283 283 283 283 283Pv of Operating Lease 2587 2814 3365 3437 3240 3584 3892 4197 4493 4781
Total Other L-T Operating Assets 5,879 6,615 7,637 8,176 8,267 9,118 9,774 10,470 11,140 11,794Invested Capital 13,241 14,008 16,184 16,616 16,744 17,044 20,332 23,857 27,426 30,528
NOPLAT 4,144 4,437 4,149 5,126 4,587 4,474 4,731 4,968 5,211 Devided by: Beginning Invested Capital 13,241 14,008 16,184 16,616 16,744 17,044 20,332 23,857 27,426ROIC 31.30% 31.67% 25.64% 30.85% 27.40% 26.25% 23.27% 20.83% 19.00%
NOPLAT 4,144 4,437 4,149 5,126 4,587 4,474 4,731 4,968 5,211 Minus: Change in Invested Capital 767 2,176 431 128 300 3,288 3,525 3,569 3,102 FCF 3,378 2,261 3,718 4,998 4,287 1,186 1,206 1,399 2,109
Beginning Invested Capital 13,241 14,008 16,184 16,616 16,744 17,044 20,332 23,857 27,426Multiplied by (ROIC - WACC) 25.36% 25.73% 19.70% 24.91% 21.46% 20.31% 17.33% 14.89% 13.06%EP 3,358 3,605 3,188 4,139 3,593 3,462 3,523 3,551 3,582
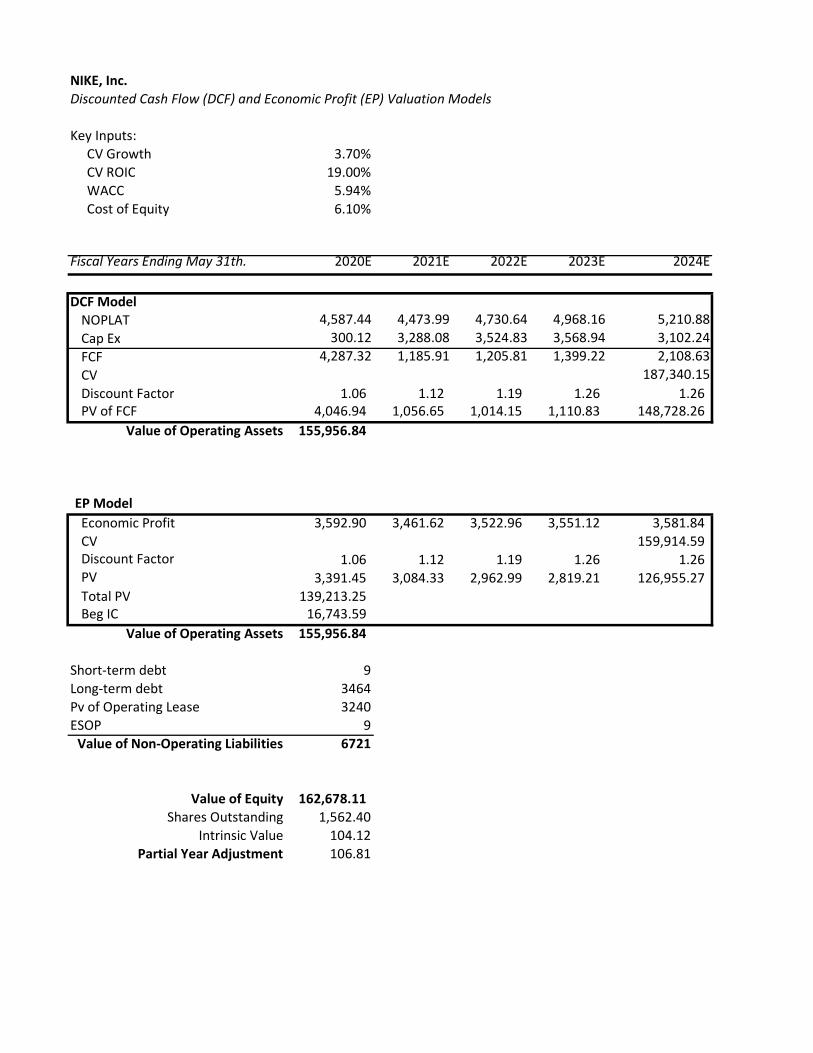
NIKE, Inc.Discounted Cash Flow (DCF) and Economic Profit (EP) Valuation Models
Key Inputs: CV Growth 3.70% CV ROIC 19.00% WACC 5.94% Cost of Equity 6.10%
Fiscal Years Ending May 31th. 2020E 2021E 2022E 2023E 2024E
DCF ModelNOPLAT 4,587.44 4,473.99 4,730.64 4,968.16 5,210.88 Cap Ex 300.12 3,288.08 3,524.83 3,568.94 3,102.24 FCF 4,287.32 1,185.91 1,205.81 1,399.22 2,108.63 CV 187,340.15 Discount Factor 1.06 1.12 1.19 1.26 1.26 PV of FCF 4,046.94 1,056.65 1,014.15 1,110.83 148,728.26
Value of Operating Assets 155,956.84
EP ModelEconomic Profit 3,592.90 3,461.62 3,522.96 3,551.12 3,581.84 CV 159,914.59 Discount Factor 1.06 1.12 1.19 1.26 1.26 PV 3,391.45 3,084.33 2,962.99 2,819.21 126,955.27 Total PV 139,213.25 Beg IC 16,743.59
Value of Operating Assets 155,956.84
Short-term debt 9Long-term debt 3464Pv of Operating Lease 3240ESOP 9
Value of Non-Operating Liabilities 6721
Value of Equity 162,678.11 Shares Outstanding 1,562.40
Intrinsic Value 104.12Partial Year Adjustment 106.81
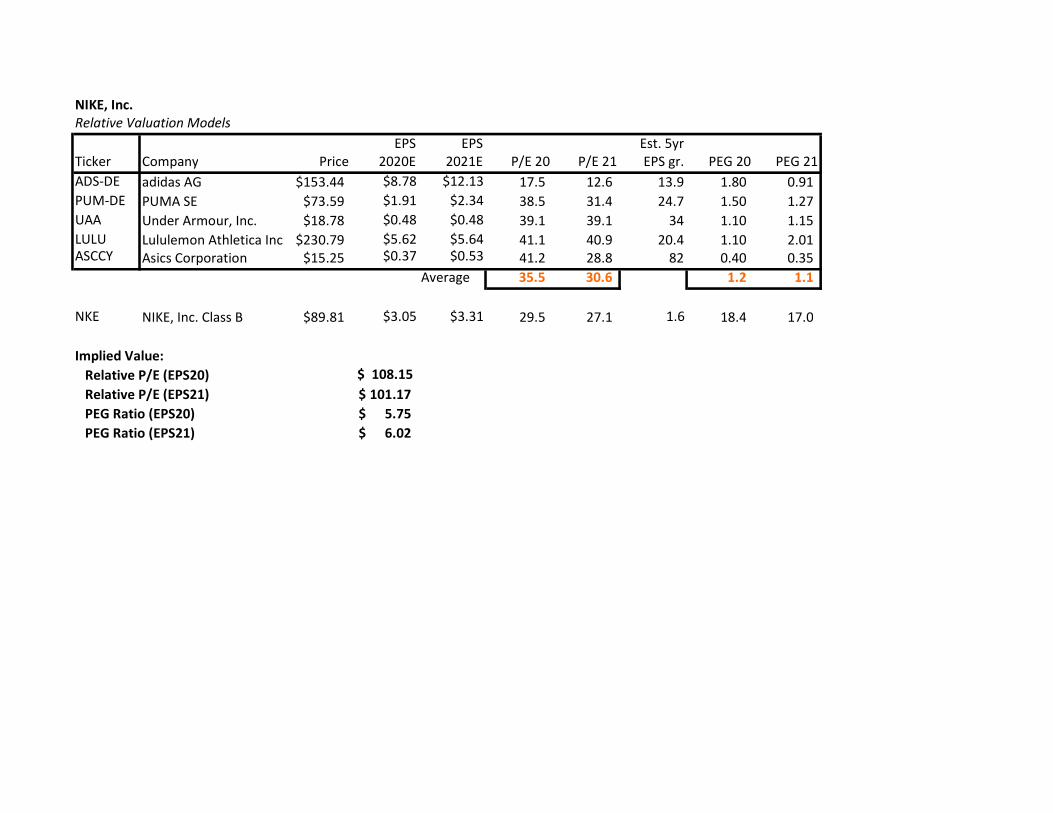
NIKE, Inc.Relative Valuation Models
EPS EPS Est. 5yrTicker Company Price 2020E 2021E P/E 20 P/E 21 EPS gr. PEG 20 PEG 21ADS-DE adidas AG $153.44 $8.78 $12.13 17.5 12.6 13.9 1.80 0.91 PUM-DE PUMA SE $73.59 $1.91 $2.34 38.5 31.4 24.7 1.50 1.27 UAA Under Armour, Inc. $18.78 $0.48 $0.48 39.1 39.1 34 1.10 1.15 LULU Lululemon Athletica Inc. $230.79 $5.62 $5.64 41.1 40.9 20.4 1.10 2.01 ASCCY Asics Corporation $15.25 $0.37 $0.53 41.2 28.8 82 0.40 0.35
Average 35.5 30.6 1.2 1.1
NKE NIKE, Inc. Class B $89.81 $3.05 $3.31 29.5 27.1 1.6 18.4 17.0
Implied Value: Relative P/E (EPS20) $ 108.15 Relative P/E (EPS21) 101.17$ PEG Ratio (EPS20) 5.75$ PEG Ratio (EPS21) 6.02$
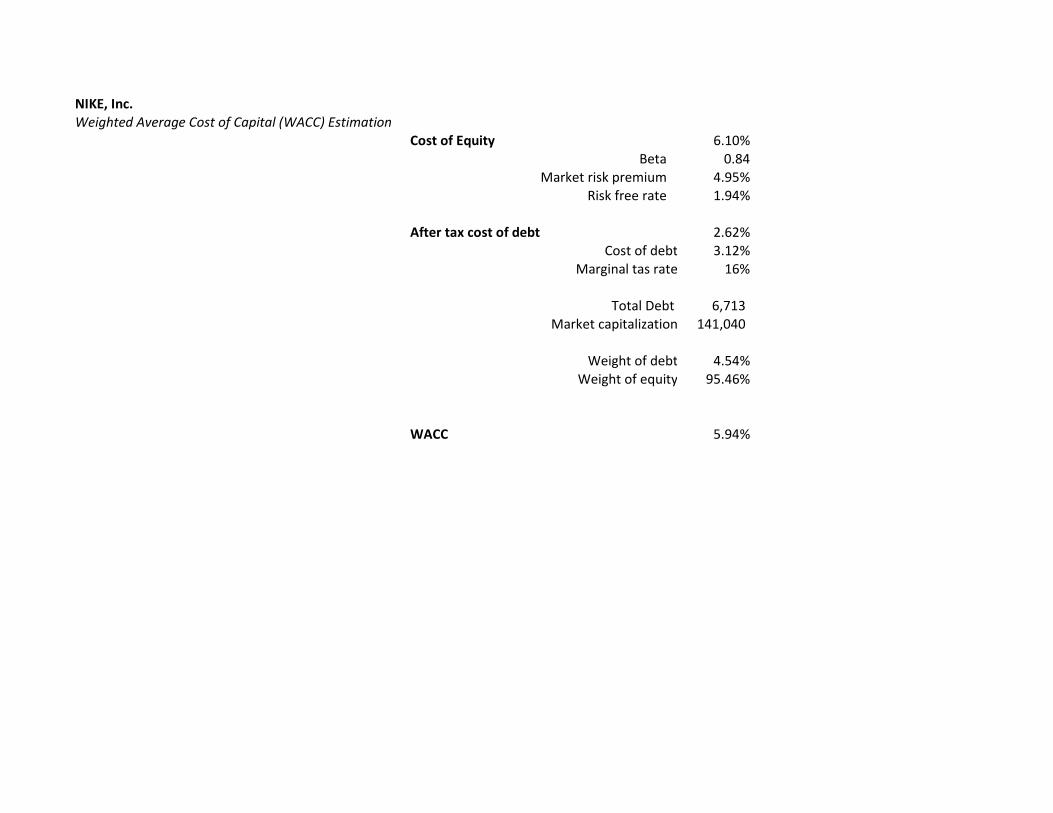
NIKE, Inc.Weighted Average Cost of Capital (WACC) Estimation
Cost of Equity 6.10%Beta 0.84
Market risk premium 4.95%Risk free rate 1.94%
After tax cost of debt 2.62%Cost of debt 3.12%
Marginal tas rate 16%
Total Debt 6,713 Market capitalization 141,040
Weight of debt 4.54%Weight of equity 95.46%
WACC 5.94%
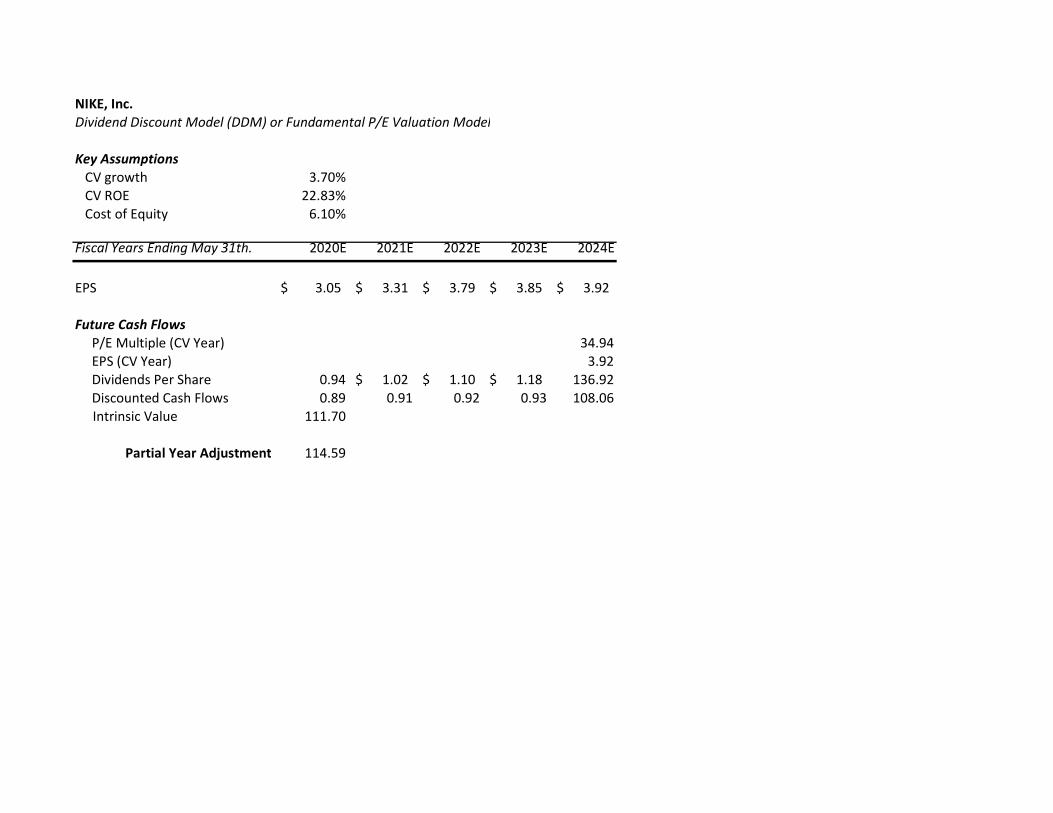
NIKE, Inc.Dividend Discount Model (DDM) or Fundamental P/E Valuation Model
Key Assumptions CV growth 3.70% CV ROE 22.83% Cost of Equity 6.10%
Fiscal Years Ending May 31th. 2020E 2021E 2022E 2023E 2024E
EPS 3.05$ 3.31$ 3.79$ 3.85$ 3.92$
Future Cash Flows P/E Multiple (CV Year) 34.94 EPS (CV Year) 3.92 Dividends Per Share 0.94 1.02$ 1.10$ 1.18$ 136.92 Discounted Cash Flows 0.89 0.91 0.92 0.93 108.06
Intrinsic Value 111.70
Partial Year Adjustment 114.59
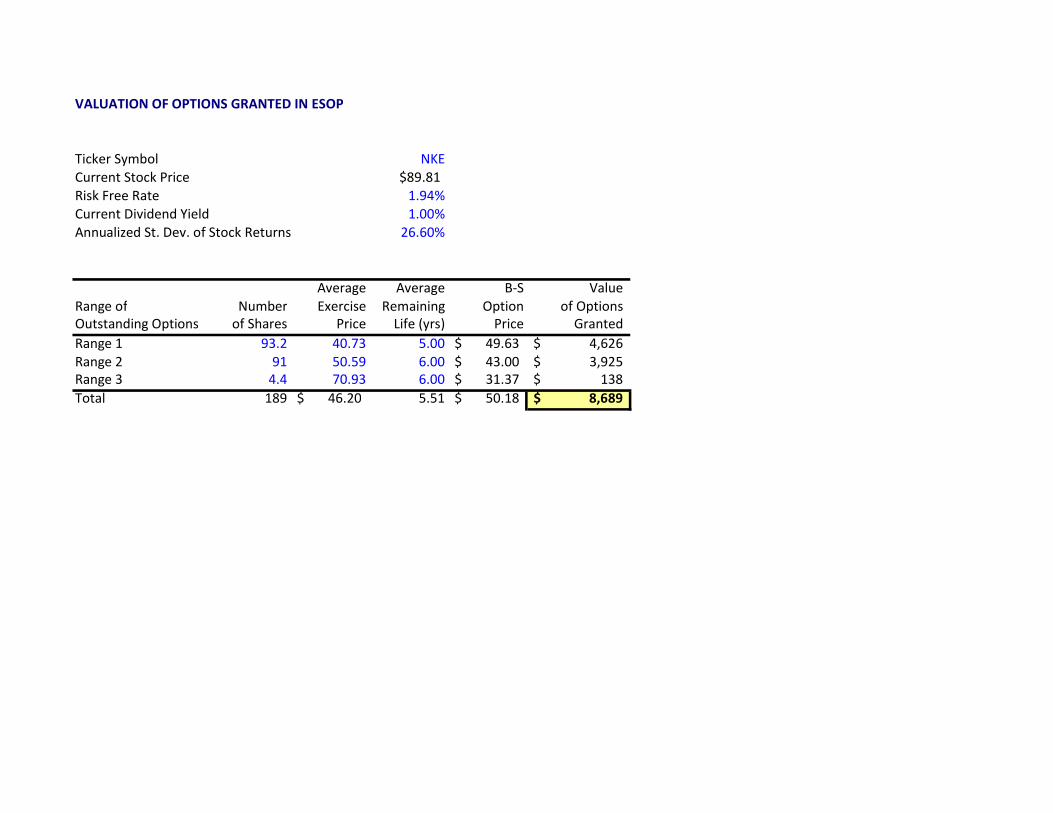
VALUATION OF OPTIONS GRANTED IN ESOP
Ticker Symbol NKECurrent Stock Price $89.81Risk Free Rate 1.94%Current Dividend Yield 1.00%Annualized St. Dev. of Stock Returns 26.60%
Average Average B-S ValueRange of Number Exercise Remaining Option of OptionsOutstanding Options of Shares Price Life (yrs) Price GrantedRange 1 93.2 40.73 5.00 49.63$ 4,626$ Range 2 91 50.59 6.00 43.00$ 3,925$ Range 3 4.4 70.93 6.00 31.37$ 138$ Total 189 46.20$ 5.51 50.18$ 8,689$
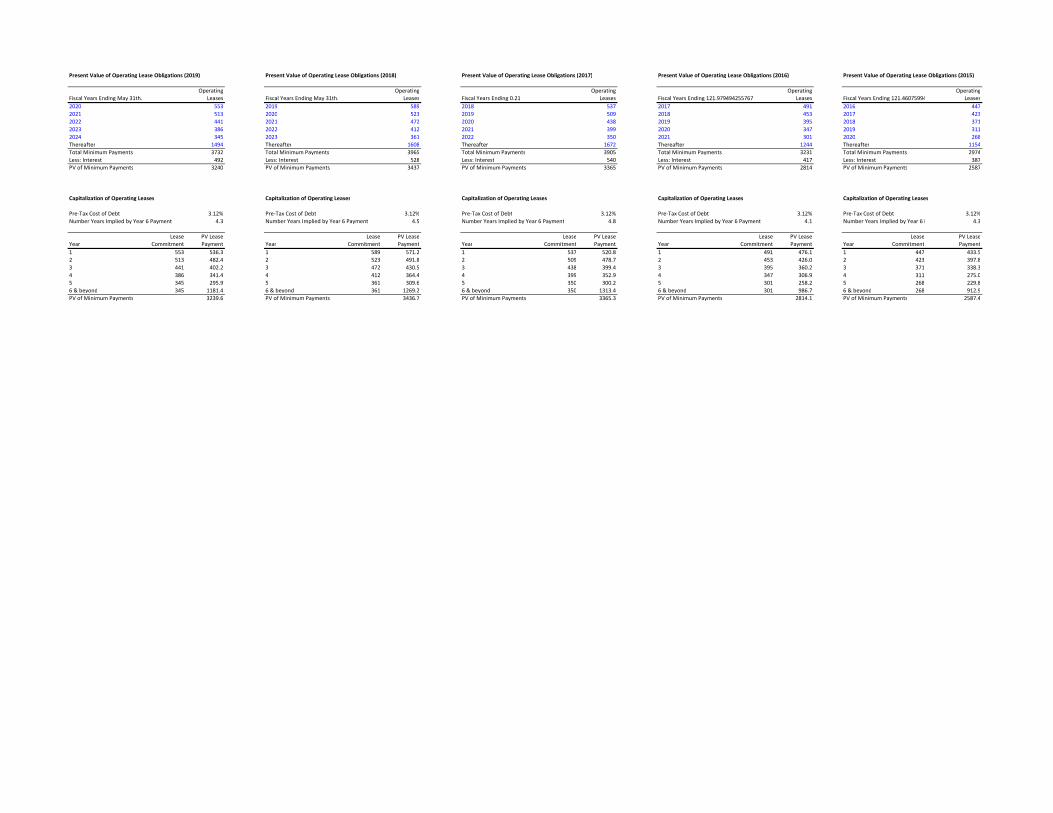
Present Value of Operating Lease Obligations (2019) Present Value of Operating Lease Obligations (2018) Present Value of Operating Lease Obligations (2017) Present Value of Operating Lease Obligations (2016) Present Value of Operating Lease Obligations (2015)
Operating Operating Operating Operating OperatingFiscal Years Ending May 31th. Leases Fiscal Years Ending May 31th. Leases Fiscal Years Ending 0.21 Leases Fiscal Years Ending 121.979494255767 Leases Fiscal Years Ending 121.460759943951 Leases2020 553 2019 589 2018 537 2017 491 2016 4472021 513 2020 523 2019 509 2018 453 2017 4232022 441 2021 472 2020 438 2019 395 2018 3712023 386 2022 412 2021 399 2020 347 2019 3112024 345 2023 361 2022 350 2021 301 2020 268Thereafter 1494 Thereafter 1608 Thereafter 1672 Thereafter 1244 Thereafter 1154Total Minimum Payments 3732 Total Minimum Payments 3965 Total Minimum Payments 3905 Total Minimum Payments 3231 Total Minimum Payments 2974Less: Interest 492 Less: Interest 528 Less: Interest 540 Less: Interest 417 Less: Interest 387PV of Minimum Payments 3240 PV of Minimum Payments 3437 PV of Minimum Payments 3365 PV of Minimum Payments 2814 PV of Minimum Payments 2587
Capitalization of Operating Leases Capitalization of Operating Leases Capitalization of Operating Leases Capitalization of Operating Leases Capitalization of Operating Leases
Pre-Tax Cost of Debt 3.12% Pre-Tax Cost of Debt 3.12% Pre-Tax Cost of Debt 3.12% Pre-Tax Cost of Debt 3.12% Pre-Tax Cost of Debt 3.12%Number Years Implied by Year 6 Payment 4.3 Number Years Implied by Year 6 Payment 4.5 Number Years Implied by Year 6 Payment 4.8 Number Years Implied by Year 6 Payment 4.1 Number Years Implied by Year 6 Payment 4.3
Lease PV Lease Lease PV Lease Lease PV Lease Lease PV Lease Lease PV LeaseYear Commitment Payment Year Commitment Payment Year Commitment Payment Year Commitment Payment Year Commitment Payment1 553 536.3 1 589 571.2 1 537 520.8 1 491 476.1 1 447 433.52 513 482.4 2 523 491.8 2 509 478.7 2 453 426.0 2 423 397.83 441 402.2 3 472 430.5 3 438 399.4 3 395 360.2 3 371 338.34 386 341.4 4 412 364.4 4 399 352.9 4 347 306.9 4 311 275.05 345 295.9 5 361 309.6 5 350 300.2 5 301 258.2 5 268 229.86 & beyond 345 1181.4 6 & beyond 361 1269.2 6 & beyond 350 1313.4 6 & beyond 301 986.7 6 & beyond 268 912.9PV of Minimum Payments 3239.6 PV of Minimum Payments 3436.7 PV of Minimum Payments 3365.3 PV of Minimum Payments 2814.1 PV of Minimum Payments 2587.4
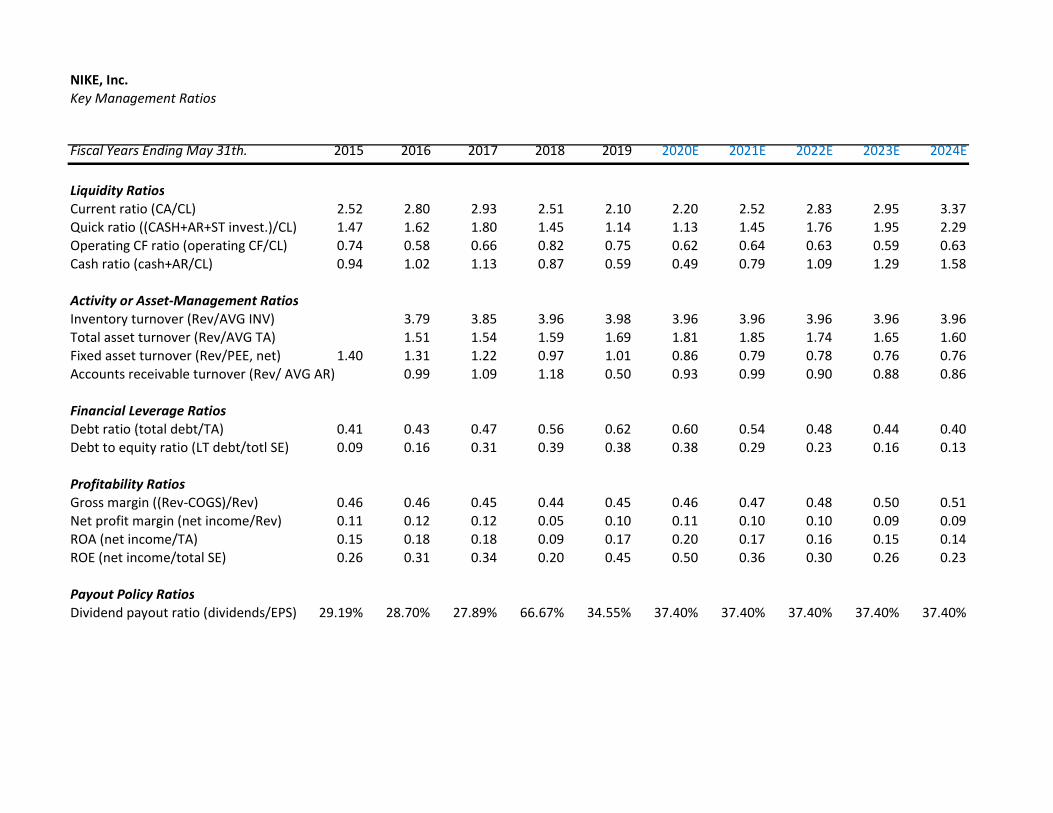
NIKE, Inc.Key Management Ratios
Fiscal Years Ending May 31th. 2015 2016 2017 2018 2019 2020E 2021E 2022E 2023E 2024E
Liquidity RatiosCurrent ratio (CA/CL) 2.52 2.80 2.93 2.51 2.10 2.20 2.52 2.83 2.95 3.37Quick ratio ((CASH+AR+ST invest.)/CL) 1.47 1.62 1.80 1.45 1.14 1.13 1.45 1.76 1.95 2.29Operating CF ratio (operating CF/CL) 0.74 0.58 0.66 0.82 0.75 0.62 0.64 0.63 0.59 0.63Cash ratio (cash+AR/CL) 0.94 1.02 1.13 0.87 0.59 0.49 0.79 1.09 1.29 1.58
Activity or Asset-Management RatiosInventory turnover (Rev/AVG INV) 3.79 3.85 3.96 3.98 3.96 3.96 3.96 3.96 3.96Total asset turnover (Rev/AVG TA) 1.51 1.54 1.59 1.69 1.81 1.85 1.74 1.65 1.60Fixed asset turnover (Rev/PEE, net) 1.40 1.31 1.22 0.97 1.01 0.86 0.79 0.78 0.76 0.76Accounts receivable turnover (Rev/ AVG AR) 0.99 1.09 1.18 0.50 0.93 0.99 0.90 0.88 0.86
Financial Leverage RatiosDebt ratio (total debt/TA) 0.41 0.43 0.47 0.56 0.62 0.60 0.54 0.48 0.44 0.40Debt to equity ratio (LT debt/totl SE) 0.09 0.16 0.31 0.39 0.38 0.38 0.29 0.23 0.16 0.13
Profitability RatiosGross margin ((Rev-COGS)/Rev) 0.46 0.46 0.45 0.44 0.45 0.46 0.47 0.48 0.50 0.51Net profit margin (net income/Rev) 0.11 0.12 0.12 0.05 0.10 0.11 0.10 0.10 0.09 0.09ROA (net income/TA) 0.15 0.18 0.18 0.09 0.17 0.20 0.17 0.16 0.15 0.14ROE (net income/total SE) 0.26 0.31 0.34 0.20 0.45 0.50 0.36 0.30 0.26 0.23
Payout Policy RatiosDividend payout ratio (dividends/EPS) 29.19% 28.70% 27.89% 66.67% 34.55% 37.40% 37.40% 37.40% 37.40% 37.40%
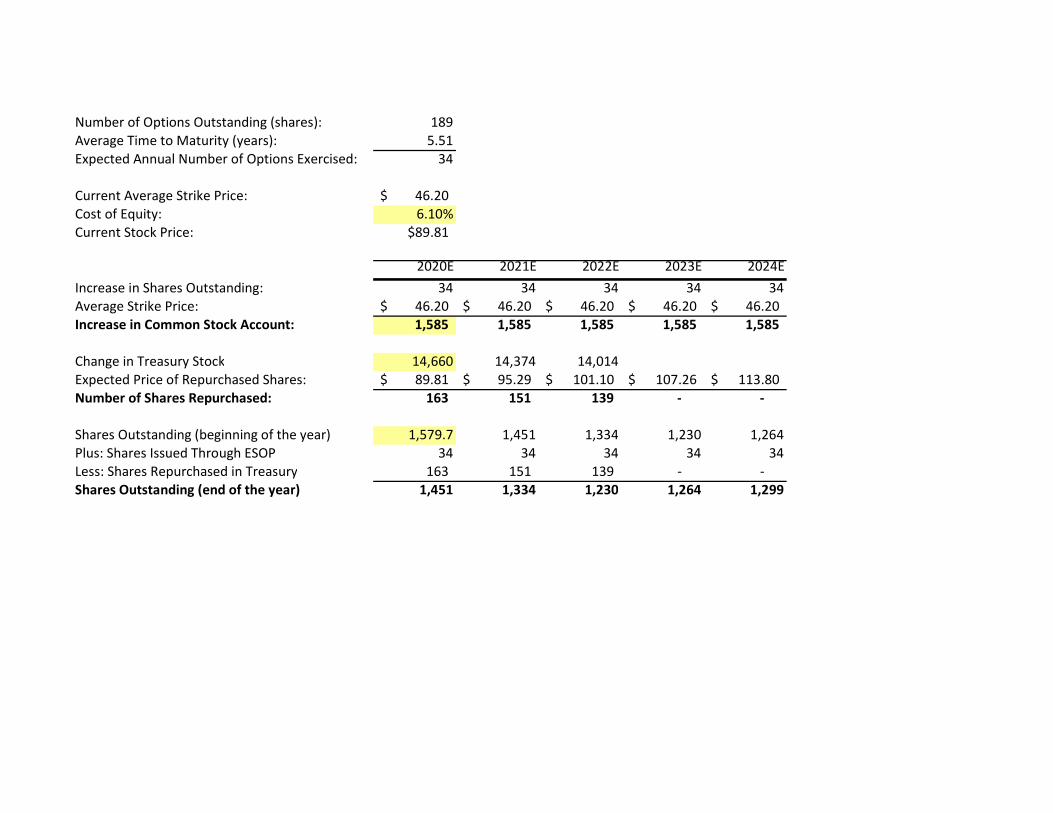
Number of Options Outstanding (shares): 189Average Time to Maturity (years): 5.51Expected Annual Number of Options Exercised: 34
Current Average Strike Price: 46.20$ Cost of Equity: 6.10%Current Stock Price: $89.81
2020E 2021E 2022E 2023E 2024EIncrease in Shares Outstanding: 34 34 34 34 34Average Strike Price: 46.20$ 46.20$ 46.20$ 46.20$ 46.20$ Increase in Common Stock Account: 1,585 1,585 1,585 1,585 1,585
Change in Treasury Stock 14,660 14,374 14,014Expected Price of Repurchased Shares: 89.81$ 95.29$ 101.10$ 107.26$ 113.80$ Number of Shares Repurchased: 163 151 139 - -
Shares Outstanding (beginning of the year) 1,579.7 1,451 1,334 1,230 1,264Plus: Shares Issued Through ESOP 34 34 34 34 34Less: Shares Repurchased in Treasury 163 151 139 - - Shares Outstanding (end of the year) 1,451 1,334 1,230 1,264 1,299
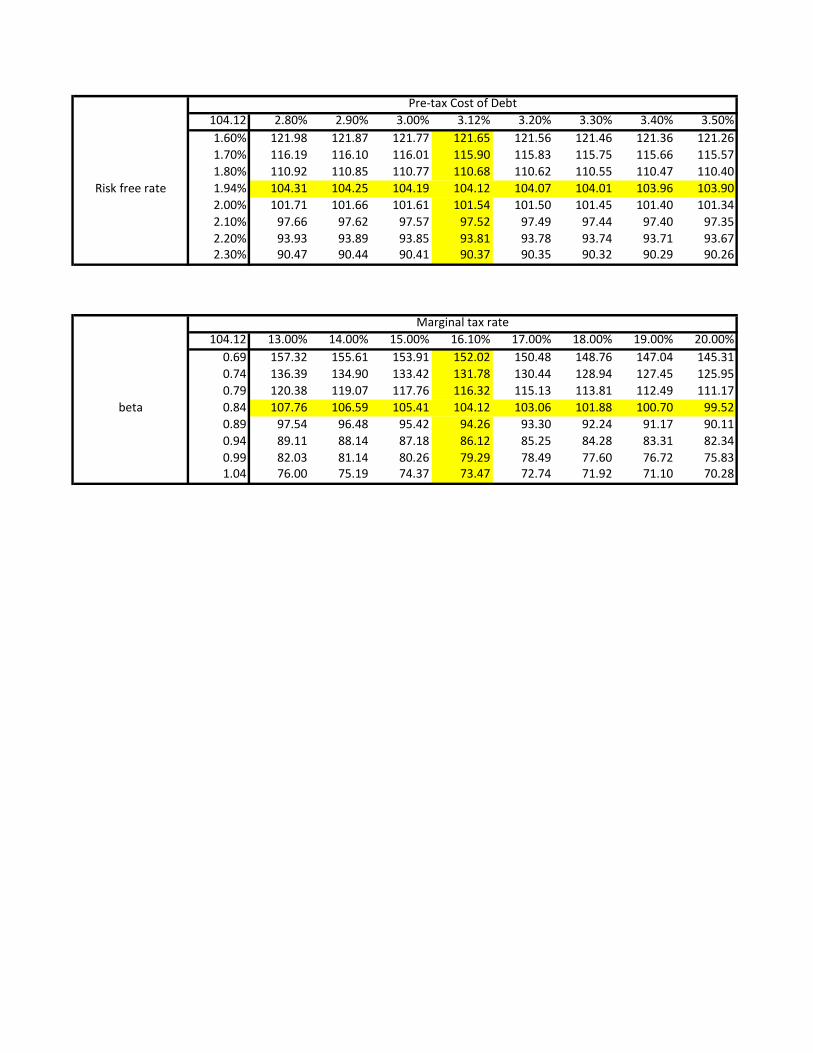
104.12 2.80% 2.90% 3.00% 3.12% 3.20% 3.30% 3.40% 3.50%1.60% 121.98 121.87 121.77 121.65 121.56 121.46 121.36 121.261.70% 116.19 116.10 116.01 115.90 115.83 115.75 115.66 115.571.80% 110.92 110.85 110.77 110.68 110.62 110.55 110.47 110.40
Risk free rate 1.94% 104.31 104.25 104.19 104.12 104.07 104.01 103.96 103.902.00% 101.71 101.66 101.61 101.54 101.50 101.45 101.40 101.342.10% 97.66 97.62 97.57 97.52 97.49 97.44 97.40 97.352.20% 93.93 93.89 93.85 93.81 93.78 93.74 93.71 93.672.30% 90.47 90.44 90.41 90.37 90.35 90.32 90.29 90.26
104.12 13.00% 14.00% 15.00% 16.10% 17.00% 18.00% 19.00% 20.00%0.69 157.32 155.61 153.91 152.02 150.48 148.76 147.04 145.310.74 136.39 134.90 133.42 131.78 130.44 128.94 127.45 125.950.79 120.38 119.07 117.76 116.32 115.13 113.81 112.49 111.17
beta 0.84 107.76 106.59 105.41 104.12 103.06 101.88 100.70 99.520.89 97.54 96.48 95.42 94.26 93.30 92.24 91.17 90.110.94 89.11 88.14 87.18 86.12 85.25 84.28 83.31 82.340.99 82.03 81.14 80.26 79.29 78.49 77.60 76.72 75.831.04 76.00 75.19 74.37 73.47 72.74 71.92 71.10 70.28
Pre-tax Cost of Debt
Marginal tax rate