Embed Size (px)
Citation preview

Cruise report 64PE410
NIOZ Baltic 2016 Texel-Nynäshamn (Sweden)
May 16th-May 28th
Baltic Sea Chief Scientist: Marcel van der Meer
The 64PE410 NIOZ Baltic 2016 team

Contents 1. Introduction ...................................................................................... 5
1.1 Aim and background ....................................................................... 5
1.2 Team members .............................................................................. 6
1.2.1 Scientific ..................................................................................... 6
1.2.2 Crew .......................................................................................... 6
2. NIOZ Baltic 2016 cruise ...................................................................... 7
2.1 Station 1 .......................................................................................... 7
2.2 Station 2 .......................................................................................... 8
2.3 Station 3 .......................................................................................... 9
2.4 Station 4 ........................................................................................ 10
2.5 Station 5 ........................................................................................ 11
2.6 Station 6 ........................................................................................ 11
2.7 Station 7 Arkona Basin ..................................................................... 12
2.8 Station 8 Arkona Basin (methane) ..................................................... 13
2.9 Station 9 Bornholm Basin ................................................................. 14
2.10 Station 10 Gotland Basin ................................................................ 16
3. NUTRIENTS – NIOZ Baltic Sea 2016 Cruise 64PE410 on R.V. Pelagia ...... 18
3.1 Summary ....................................................................................... 18
3.2 Equipment and Methods ................................................................... 18
3.2.1 Sample Handling ........................................................................ 18
3.2.2 Analytical Methods ..................................................................... 19
3.2.3 Calibration and Standards ........................................................... 20
3.3 Statistics ........................................................................................ 21
3.3.1 Quality Control........................................................................... 21
3.3.2 Mean Detection Limits................................................................. 21
3.3.3 Further Remarks ........................................................................ 22
3.4 References ...................................................................................... 22
4. Long chain alkyl diols ....................................................................... 23
4.1 Suspended Particulate Matter (SPM) .................................................. 23
4.2 Seawater collection for chlorophyll and flow cytometry ......................... 23
4.2.1 Flow cytometry .......................................................................... 23
4.3 Chlorophyll ..................................................................................... 24
4.4 References ...................................................................................... 25
5. Marine fungi ........................................................................................ 27
6. Particulate organic matter ..................................................................... 28
7. Microscopy .......................................................................................... 30
8. Piston Core for DNA and pore water sampling .......................................... 32
9. In-situ pumping ................................................................................... 34
10. MULTICORES ..................................................................................... 43
10.1 Part 1 – Stations 1-6: ..................................................................... 43
10.1.1 Station 1: ................................................................................ 43
10.1.2 Station 2: ................................................................................ 43
10.1.3 Station 3: ................................................................................ 44
10.1.4 Station 4: ................................................................................ 44
10.1.5 Station 5: ................................................................................ 44
10.1.6 Station 6: ................................................................................ 44
10.2 Part Two – Stations 7, 9 & 10: ......................................................... 44
10.2.1 Station 7: ................................................................................ 45
10.2.2 Station 9: ................................................................................ 45
10.2.3 Station 10: .............................................................................. 45
11. Methane sampling .............................................................................. 51
12. Pore water sampling and sub-sampling ................................................. 59
12.1 Methods ........................................................................................ 59
12.1.1 Glove bag sampling and centrifuge ............................................. 59
12.1.2 Rhizons ................................................................................... 59
12.1.3 Sub-sampling of pore waters ..................................................... 60
12.2 Sampling of pore waters ................................................................. 60
12.3 References .................................................................................... 69
13. In situ pump filter and water column collection from Arkona Basin and Gotland Deep for incubation of aerobic methane oxidisers (to be done at NIOZ) ............................................................................................................. 70
13.1 Research questions: ....................................................................... 70
13.2 Material retrieved: ......................................................................... 70
13.2.1 Arkona Basin: 54º 55.208 N, 13º 29.992 E .................................. 70
13.2.2 Gotland Deep: 57º 12.734 N, 19º 56.968 E ................................. 71
13.3 REFERENCES ................................................................................. 72
14. TA, DIC, pH and CO32- profiles .............................................................. 73
15. LGR .................................................................................................. 80

16. Alkalinity Titrations – Pore water .......................................................... 83
Appendix 1: CTD casts as filled out during cruise ......................................... 86
Appendix 2: N/P station 1 ....................................................................... 100
Appendix 3: N/P station 2 ....................................................................... 101
Appendix 4: N/P Station 3, 4, 5 and 6 ...................................................... 102
Appendix 5: N/P station 7 ....................................................................... 103
Appendix 6: N/P station 8 ....................................................................... 104
Appendix 7: N/P station 9 ....................................................................... 105
Appendix 8: N/P station 10 ..................................................................... 106
Appendix 9: station 7 piston core pore water N species (Rhizons) ................ 107
Appendix 10: station 7 multi core pore water N species (2 sampling methods, Rhizons and Centrifugation) .................................................................... 108
Appendix 11: station 9 piston core pore water N species (Centrifugation) ..... 109
Appendix 12: station 9 multi core pore water N species (Rhizons) ................ 110
Appendix 13: station 10 piston core pore water N species (Centrifugation) .... 111
Appendix 14: station 10 multi core pore water N species (Centrifugation) ..... 112
Appendix 15: Pore water DIC stations 7 and 9 ........................................... 113
Appendix 16: Pore water DIC station 10 ................................................... 114
Appendix 17: HS station 7 and 9 .............................................................. 115
Appendix 18: HS station 9 (piston core) and 10 ......................................... 117
Appendix 19: Theoretical vs actual piston core length ................................. 118

1. Introduction
1.1 Aim and background This cruise to the Baltic Sea is carried out by scientist from both the
Marine Microbiology and Biogeochemistry and the Ocean System Science departments from the NIOZ.
The Baltic Sea is the world’s largest brackish body of water with an area of about 377,000 km2 that is partitioned into multiple sub-basins. The Baltic is almost entirely encircled by land with a large freshwater contribution (including precipitation) of 660 km3/yr from a drainage basin that is 1.6 million km2. An inflow of 475 km3/yr of saltwater pours in through the only connection to the North Sea, the narrow Straits of Denmark. The Baltic Sea is a fairly shallow basin and on average only about 54 m deep. The salinity varies greatly in the Baltic Sea ranging from a salinity of ~3.5 in the north to ~8 in the Baltic proper and ~30 in the region where the Baltic connects to the North Sea. A permanent separation between a relatively fresh surface water layer and more saline bottom water (a halocline) exists at about 13-15 m water depth.
The large salinity gradient, especially on the western side of the Baltic though the narrow straits of Denmark is very well suited for calibrating indirect methods to estimate paleo salinity, so called paleo salinity proxies. Especially core top calibrations for various organic and inorganic proxies and linking surface water biological signals to sedimentary information. In order to do these paleo salinity proxy calibrations we will take water samples from various depths, focusing on the sea surface, the photic zone, but including much deeper samples at a few stations for nutrient analysis and to study the biology in these water masses by various methods. Suspended particulate organic matter including Algae, bacteria and archaea are sampled using in situ pumps and sediments will be sampled using a multi-corer.
Since the last deglaciation the Baltic Sea transformed from the freshwater Baltic Ice Lake (± 12600 to10300 years ago) to the slightly brackish Yoldia Sea (± 10300 to 9500 years ago) into the freshwater Ancylus Lake (± 9500-8000 years ago) and then into the brackish Littorina Sea (± 8000 to 3000 years ago). The present Baltic Sea is a continuation of the Littorina Sea, but with a salinity of almost half (a salinity of 7 to 8 in the Baltic proper) that of the Littorina Sea. In the deeper basins of the Baltic Sea, the Arkona, Bornholm and Gotland basins we will take long piston cores that span this entire history or at least a large part of it. These long sediments records will then be used to validate and test the proxies developed based on the core tops from the Denmark Strait.
The separation between the surface and bottom water layers results in reduced mixing and anoxic bottom waters, which is becoming more and more of problem in the Baltic Sea. The relatively limited inflow of saline water through the strait of Denmark results in reduced venting of the bottom waters (mixing due to saline water sinking to the bottom). While the run off of nutrients results in more extensive blooms, especially of cyanobacteria in the Baltic Sea, organic matter of which sinks after death and organic matter remineralization consumes the oxygen in the sediment and bottom water resulting in anoxic conditions. Organic matter remineralization (oxidation) under anoxic conditions results in sulfide and methane production amongst others. Sulfide is highly toxic for higher organisms and methane is a strong greenhouse gas. Studying redox gradients in the water column and especially the sediments, and the microorganisms involved in these different processes, such as methane oxidation for instance, is

also part of this cruise and will take place mainly in the deeper basins. The saltwater intrusions from the North Sea resulting in bottom water venting could a link between the “paleo-proxy” development and application part and the anoxic conditions in the Baltic part of the cruise.
1.2 Team members 1.2.1 Scientific Marcel van der Meer, MMB, NIOZ Chief scientist
Alice Webb, OCS, NIOZ titrations/VINTA/testing new equipment, piston core
Darci Rush, MMB, NIOZ multicore slicing; aerobic methanotrophy incubations
Fatimah Sulu-Gambari, OCS, NIOZ porewater/coordination, Oxygen measurements
Gabriella Weiss, MMB, NIOZ Multi-core, core slicing, pore water alkalinity, piston core
Saara Suominen, MMB, NIOZ In situ pumps, anaerobic water sampling + help with CTD sampling
Margriet Lantink, OCS, NIOZ porewater sampling
Rick Hennekam, OCS, NIOZ porewater sampling
Sigrid van Grinsven, MMB, NIOZ POC/PON/POP, δD, water-incubation experiments, pore water alkalinity, anaerobic water sampling + help with CTD sampling
Sergio Balzano, MMB, NIOZ Phytoplankton/bacteria collection & chlorophyll
Judith van Bleijswijk, MMB, NIOZ POC/PON/POP, δD water, own experiments
Sharyn Ossebaar, OCS, NIOZ NUTS
Yvo Witte, NMF, NIOZ Technical support
Jan Dirk de Visser, NMF, NIOZ Technical support
1.2.2 Crew Pieter Kuijt Master
Ewout Adriaans Able seaman
Len Bliemer Chief Officer
Wim Jan Boon Able seaman

Iwan den Breejen Cook
Roel van der Heide Able seaman
Roald van der Heide Electrician
Olga Koster 2nd Officer
Vitali Maksimovs Steward
Inno Meijer 2nd Engineer
Jaap Seepma Chief Engineer
Hein de Vries Able seaman
2. NIOZ Baltic 2016 cruise Transit
16-05-2016: We left the NIOZ harbor Monday morning at approximately 10:30 for a two day transit to station 1. During transit we organized the lab and tried to get over our seasickness (those that got sick). We arrived at station 1 at 01:00 on Wednesday 18th of May 2016 (local time). During the transits water from the aquaflo system was sampled for water isotope analysis back at the NIOZ, every hour starting on Tuesday 17th of May in the afternoon (section 15).
2.1 Station 1 58°29.76’ N 09°35.91’ E
Water depth 550m
Multibeam
18-01-2016: At 1 am the seafloor was mapped using the multi beam from the bridge. Based on this mapping it was decided the original station coordinates were the best for Station 1.
CTD
At 06:00 we started a CTD cast (St. 1, cast 2) and we profiled the entire water column to 550 meters depth and sampled water from 12 depths, 2 bottles per depth (see CTD sample list, appendix 1), for various nutrients, the carbonate system, chlorophyll, algae and bacteria abundances, hydrogen isotopes etc.
In situ pumps

This shallow in situ pump cast (3) started around 08:00, pumps were deployed at 55, 25 and 10 meters water depth and pumped for 1 hour using 0.7µm GFF filters. Deployment ended around 09:30.
The serial port USB converts we brought did not function, again, possibly because software for multiple of these converters are installed for the same com port resulting in all kinds of issues. We are using a converter and laptop from the Pelagia for programming the in situ pumps.
Multi-core
12 cores were retrieved (cast 4), 8 sliceable and 4 archive cores of approximately 40 centimeters. 4 cores were sliced, 3 for lipid and DNA analysis to 10 centimeter depth, slices of which were stored in the -80 freezer and 1 to 10 centimeter depth the slices of which were stored in Bengal rose in the fridge (4ºC). 1 Archive core was stored at 4 ºC, left over cores were disposed of.
Transit
18-05-2016: At 10 am transit from Station 1 to Station 2 started. During transits sampling for water isotopes continued. Station 2 had to be moved to a slightly different position because the original coordinates fell right in a zone for which it was advised not to anchor, fish or otherwise disturb the bottom. The second problem was that somewhere in our permission from Sweden the 16th of May had turned into the 19th of May, we were granted permission to work in the Swedish EEZ before the 19th, but not their territorial waters. See below for the actual coordinates decided up on and to be confirmed by multi beam mapping.
2.2 Station 2 57º 45.9’ N, 11° 7.0’ E
Water depth 44m
Multi-beam
To get an idea of the seafloor a multibeam map (cast 1) was made from approximately 1.5 miles before to 1.5 miles after Station 2 at approximately 17:00. Due to the limited depth and therefore limited beam width multiple lines were mapped to get a good idea of seafloor topography. Based on the multi beam map we determined the chosen location was good.
CTD
At 18:30 a CTD cast was taken (St. 2, cast 2) and we sampled 6 depths and closed 3 bottles at each depth for nutrients, carbonate chemistry and microscopy. We sampled the tree in situ pump depths also for chlorophyll, hydrogen isotopes, POC, PON, POP, algae and bacterial counts etc.
In situ pump filter from 25 meter.

In situ pumps
Three pumps (0.7 µm filters) were deployed at 30, 15 and 5 meters using the payout of the winch to determine depth (there was an issue with “nullen” of the winch that was resolve afterwards).
Multi-core
12 cores were retrieved (cast 4), 8 sliceable and 4archive cores of approximately 30 centimeters. 4 cores were sliced, 3 for lipid and DNA analysis slices of which were stored in the -80 freezer and 1 the slices of which were stored in Bengal rose in the fridge (4ºC). 1 Archive core was stored for further analysis at NIOZ. The cores looked very nice with extremely fluffy material at the top and lots of larger animals living in the sediment, including sea potato’s.
During the overnight transit to station 3 hourly samples were taken for water isotope analysis at the NIOZ.
2.3 Station 3 56° 36.158'N 11° 46.522'E
Water depth 38m
Multi-beam
To get an idea of the seafloor a multibeam map (cast 1) was made from approximately 1.5 miles before to 1.5 miles after Station 3. Again, due to the limited depth and therefore limited beam width multiple lines were mapped to get a good idea of seafloor topography.
CTD
At 07:00 a CTD cast was taken (St. 3, cast 2) and we profiled the water column to 31,4 meters depth at a safe distance from the seafloor, 3 bottles for 31.4, 25, 20, 15, 10 and 5 meters water depth (see CTD sample list, appendix 1). 25, 20 and 5 meter depths were also the in situ pump depths for the 0.7 µm filter. The in situ pumps were also deployed with 0.3 µm filters at all depths (5,10, 15, 20, 25 and 30m). There was a large fluorescence peak at 20 meters, microscopy indicated that there was a large number of dinoflagellates, Pyridinium and Protoperidinium.
In situ pumps
In situ pump filter from 20 meter.
Multi core.

Cast 3, at 25, 20 and 5 meters using 0.7 µm filters. Unfortunately Antje (in situ pump A) did not pump, the start date for operation had somehow reset to 1-1-70 even though the actual time and date the pump used was correct.
Cast 4, at 15, 10 and 5 meters using 0.3 µm filters.
Cast 5, at 15, 10 and 5 meters using 0.3 µm filters.
Multi-core (cast 6)
Beautiful multicores, even better than at station 2, slightly longer (± 40 cm). 4 Cores will be sliced up to 10 cm, 3 for DNA and lipid analysis stored in the -80 freezer and 1 stored in Bengal rose at 4 ºC (reefer). 1 Archive core is stored at 4 ºC for further analysis at the NIOZ.
Transit
Transit from Station 3 to Station 4 started at 13:30 and during transit water from the aquaflo was sampled every hour for water isotope analysis.
2.4 Station 4 56° 17.025' N 12° 16.835' E
Water depth 30.3m
Multi-beam
To get an idea of the seafloor a multibeam map (cast 1) was made from approximately 1.5 miles before to 1.5 miles after Station 3. Again, due to the limited depth and therefore limited beam width multiple lines were mapped to get a good idea of seafloor topography. The seafloor seemed relatively flat except for a known shipwreck.
CTD
20-01-2016, 1 am, a CTD cast was taken (St. 4, cast 2) and we profiled the water column to 23 meters depth and sampled water from 5 depths, 3 bottles for 23, 20, 15, 10 and 5 meters water depth (see CTD sample list, appendix 1). 20, 15 and 5 meter depths were also the in situ pump depths.
In situ pumps
At approximately 20:00 a shallow in situ pump (0.7 µm filters) cast was made (cast 3), the pumps were pumping for 1 hour. There seemed to be a communication issue between pump C and the computer, the connection on the pump was cleaned. Later there was a connection error with pump B (St. 5) suggesting it might be the cable not the connection on the pump that was the problem!
Multi core
At 20:30 the multi-core was deployed (cast 4) the cores here were about 30 cm but slanted and a bit “messy”, the second deployment (cast 5) was much better.
Transit

Transit to Station 5 started at ±21:30, samples for water isotopes were taken roughly every hour.
2.5 Station 5 55° 55.510' N 12° 42.770' E
Water depth 45m
Multibeam
In between Sweden and Denmark, the area around the station coordinates was mapped using multi beam (cast 1) and indicated that the station was in the middle of a deep relatively flat area in between the two countries.
CTD
At 06:30 we started a CTD cast (St. 5, cast 2) and we profiled the water column to 38 meters depth and sampled water from 7 depths, 3 bottles per depth (see CTD sample list, appendix 1). The in situ pump depths were 25, 20 and 10 meters, the fluorescence peak was at 20 meter. Nutrients and the carbonate system were analyzed for all depths, chlorophyll, algae and bacterial counts etc. only for the in situ pump depths.
In situ pumps
There was one in situ pump deployment (cast 3) with pumps at 3 depths 25, 20 and 10 meters.
Multi-core
12 cores were retrieved (cast 5), 8 sliceable and 4 archive cores of approximately 30 centimeters. 4 cores were sliced, 3 for lipid and DNA analysis to 10 centimeter depth, slices of which were stored in the -80 freezer and 1 for which the slices were stored in Bengal rose in the fridge (4ºC).
Transit
Transit to station 6 was only one hour during which one sample for water isotope analysis was taken.
2.6 Station 6 55° 49.340' N 12° 45.420' E
Water depth 27m
Multi beam
The sea floor was mapped using multi beam to make sure sampling would take place in a suitable location. We decided to sample slightly north of the original coordinates because the water column was slightly deeper, 27 instead of just over 20 meter and the close by location of a (electricity)cable. The very limited depth makes mapping difficult.
CTD

The first CTD cast, just before lunch was aborted because essential material for sampling was still in use for the previous CTD cast just a few hours before. The first CTD cast after lunch (cast 3) failed due to a connection issue between the software and hardware which turned out to be the CTD deck unit, fortunately there is a spare. The third CTD cast (6-4) was successful and we collected water from 20, 15, 10 and 5 meter water depth. Be aware that file names and samples names might still refer to cast 6-3!
In situ pumps
The in situ pumps were deployed (cast 5) using 0.7 µm filters for one hour at 20, 15 and 5 meter depth.
Multi core
The first multi core deployment was discarded due to very turbulent water potentially due to a little shock leaving the sediment. A second cast (6) looked the same suggesting that the surface sediment was extremely fluffy and easily disturbed. 4 positions in the multi corer did not trigger, but enough cores were retrieved for the planned work.
Transit
Transit to station 7 in the Arkona Basin started at approximately 4:30 and during transit hourly samples were taken for water isotope analysis.
2.7 Station 7 Arkona Basin Water depth 45 meter
Piston coring
21-05-2016 Matthias Moros [The Leibniz Institute for Baltic Sea Research (IOW), Department of Marine Geology, Warnemünde, Germany] advised us two site for piston coring in the Arkona Basin, 54° 50.910'N 13° 21.412'E (7A) and 54° 50.995'N 13° 24.818'E (7B), together with our original Station 7 (C; 54° 53.500'N 13° 24.624'E) we now have three location for station 7 very close together. At station 7 we did an extensive multi beam cast (7-1) to map the sea floor after which we took two piston cores of, respectively 12.48 and 12.22 m (7-2 and 7-3) for analysis back at NIOZ and IOW. After a transit of approximately 15 minutes, station 7B where the seafloor was mapped by multi beam (7-4) and the piston the cores were of 12.66 and 11.84 m (7-5 and 7-6) were taken also for analysis back at NIOZ and IOW. The transit to station 7C was about 20 minutes and this was the main water work and sediment station.
Also at station 7 the seafloor was mapped using multi beam (7-7) after which we took a piston core (7-8) of 12.40 m with predrilled holes for pore water and methane sampling. After the sampling with rhizons, pore water, and cut-off syringes, methane, the
Pore water sampling of piston core sections using rhizons

sections were split and subsampled for DNA, lipids and test samples for laser ablation ICP-MS.
CTD
After moving a little upstream to avoid sediment in the surface waters, we did a CTD cast using the 3 goflo bottles in case we would see anoxic bottom water and to test the bottles. The water depths for water sampling were 5, 15, 25, 30, 35 and 40 meter, with a fluorescence peak at approximately 25 meter.
The goflo bottles were not a success, a lot of time had to be invested to make the bottle function and even than the don’t actually close after triggering. The main reason for bringing goflo bottles was that these can be tapped under N2 pressure however, but then the taps for connecting the N2 have to be available otherwise this will not work. As a back-up system for the clean CTD frame these bottles are useless, for us they are dramatic. With a lot of work Roald van der Heide managed to re-wire and remake some taps for 3 bottles that now, at least in theory, could work. They don’t, at least not yet. Again these bottles should be thrown away and not used for anything, not even as back-up. This should have been tested and tried at the NIOZ before dumping them on the Pelagia. Fortunately the staff on the Pelagia sees this as a challenge.
In situ pumps
After the CTD cast we did three in situ pump casts at one with 0.7 µm filters at 5, 25 and 30 meters depth and two with 0.3 µm filters at all CTD depths.
Overnight we already started looking for methane bubbling using multi beam in the area just North of station 7, close to know sites of methane in the water column (like station TF0113; Gülzow et al., 2013, Biogeosciences). The idea was that this might safe time the next day, unfortunately no methane bubbles were observed.
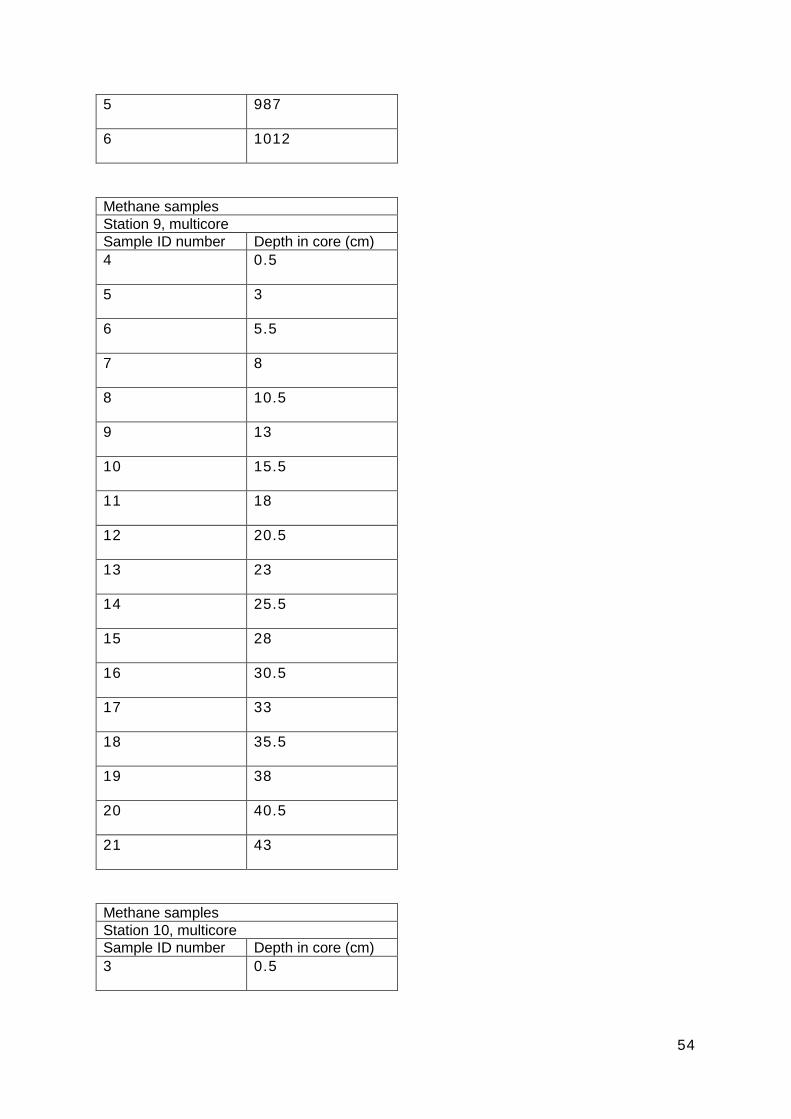
On the 22-05-2016 we did several multi core casts for slicing, pore water sampling both by rhizons as well as slicing and centrifuging, methane sampling, an archive core. The first cast (7-13) failed, with the second (7-14) we retrieved many of the required cores, but not all. We needed 12 archive cores for experiments back at NIOZ and this took another 2 casts (7-15 and 7-16).
After retrieving all the necessary multi cores and everyone was busy sampling them, an additional CTD cast (7-17) was taken to specifically sample the fluorescence peak for microscopy etc.
2.8 Station 8 Arkona Basin (methane) After the last CTD cast at station 7 we continued our search for methane gas emissions from the sediment by multi beam and fish finder (cast 8.1), again just a little north of station 7 at locations known for methane in the water
Piston core sampled for DNA and lipids.

column. Unfortunately we were not able to actually find methane bubble, possibly due to the lack of emissions from the sediment massive enough to be detected this way. The fail save plan was to sample at TF0113 (Gülzow et al., 2013), a known methane site (54º 55.2’ N, 13º 30.0’ E, max depth 53 meter).
CTD
Another try with the goflo bottles (8-2), still not really successful and they need to be, at least on station 10. We sampled 6 depths, 43, 30, 25, 18 (fluorescence peak), 10 and 5m. At 43 meters depth the oxygen concentrations declined, suggesting, based on literature from this site, that this might also be the depth methane starts to increase, oxygenic methane consumption zone, potentially.
In situ pumps
In situ pumps with 0.7 µm filters were deployed to CTD depths 25, 18 and 5 meter (8-3). To sample the potential aerobic methane consumption zone with 0.3 µm filters for (incubation) experiments back at the NIOZ some Niskin bottles were removed from the CTD frame and all three in situ pumps were mounted in the CTD frame. The CTD was lowered to 43 meter depth twice, casts 8-4 and 8-5. Some extra water from 43 meter was also collected during cast 8-5.
There remained a communication error/failure between especially in situ pump B and the computer, but also sometimes pump C and the computer. After trying to exclude multiple option we replace the actual connecting cable with one here on the ship, it seems the original connecting cable for pump C has lost its “grip” and has to be replaced! Replacing the connectors on the pumps with the pump A types might also be a good investment!
2.9 Station 9 Bornholm Basin 55° 28.080'N 15° 28.620'E
Water depth 93 meter
Multi beam
23-05-2016, the sea floor was mapped using the multi beam (9-1), if we want to use the multi beam data, for all stations so far, the data has to be recalculated based on the local velocity profiles.
CTD
Three in situ pumps in the CTD frame.

At approximately 77 meter water depth the oxygen concertation was approximately 36 µmol kg-1 and we tried again to use the goflo bottle(s) to sample low oxygen water for “anaerobic” nutrients. One goflo bottle closed and this one was sampled, we did not expect free sulfide. The other depths sampled were 5, 23 (fluorescence maximum), 35, 45 and 60 (cast 9-2). We closed 4 bottles at 23 m to make sure we would have enough water from the fluorescence maximum.
Multi core
Since we wanted to sample the multi cores for methane and pore water besides slicing for more paleo applications we decide to take the cores relatively early in the morning since especially the pore water sample work-up takes most of the rest of the day. Rather than sampling pore water with both rhizons and slicing/centrifugation, only rhizons were used. The first cast (9-3) overfilled some core tubes and the others almost. For the second cast (9-4) 10 top weights were removed, although the cores looked very nice the amount of water on top was too little for further processing. For cast 9-5 another 6 top weights and 2 middle weights were removed and the cores looked great.
Piston core
One piston core was taken for further analysis at NIOZ from station 9 (cast 6), we used an 18 meter set-up and retrieved approximately 14.40 m core. The first few meters were very rich in gas which made the core run out of the liner. There are some small piece of core from in between sections due to this (2-3, ±3cm and 4-5, ±6cm), after a few meters sectioning the core got better. The top 30, or so, cm was collected in a geochemical bag.
In situ pumps
Three casts, one with 0.7 µm filters at 5, 22 and 35 m (9-7) and two casts with 0.3 µm filters (9-8 and 9-9) at all CTD depths.
24-05-2016
Predrilled piston core (18m set up, core length 14 m 60 cm), a piston core predrilled for methane analysis was deployed early in the morning and sampled for methane through the drilled holes (cast 9-10). Afterwards the sections were split and subsampled for DNA, lipids and pore water. Pore water sampling of piston cores using rhizons is not a success, there for the choice has been made for sampling for pore water after splitting the core followed by centrifugations. This can of course affect things like sulfide
Very nice multi core from very fluffy sediments.

concentrations, but is better than rhizon sampling. It is better to try to do something the right way, than knowing you’re doing it wrong.
Transit
After leaving station 9, the piston core was cut, sampled for methane and split for further subsampling. In the meantime the crew found out the side winch had slowly unreeled and had to be partly taken of the winch and rolled tight again. Material from yesterday was cleaned and during our 20 hour transit samples will be taken every hour on the hour for the LGR.
2.10 Station 10 Gotland Basin 57° 12.702'N 19° 57.000'E
Water depth 220m
Multi beam
On the 25th of May 2016 we started with mapping the seafloor using the multi beam (cast 10-1).
CTD
After the mapping we deployed the CTD to profile the water column and take water samples. There was a strong oxycline between 60 and 75 meters water depth below which oxygen was almost completely gone. We decided to sample water from 200, 150, 100, 72 (at the bottom of the oxycline), 60 (at the top), 50, 25, 15 (fluorescence maximum) and 5m (10-2). Since only 2 of the 3 goflo bottles closed a second cast was needed (10-3) in which only one bottle closed, not the depth we missed in the first cast, so a third cast was needed (10-4) focused on sampling 100 m water depth.
Multi core
Since we wanted to sample the multi cores for methane and pore water besides slicing for more paleo applications we decide to take the cores relatively early in the morning since especially the pore water sample work-up takes most of the rest of the day. Rather than sampling pore water with both rhizons and slicing/centrifugation, only centrifugation was used. For the first time the new multi core sub frame was used, which resulted in absolutely beautiful cores (cast 10-4). Although borderline to short, we managed to get the required 30 cm core depth for nearly all cores (1 core was 1 cm to short). A second cast (10-5) was done to retrieve archive cores for further experiments back at NIOZ, a total of 12 cores were taken. Multi corer with sub
frame.

Piston core
One piston core was taken for further analysis at NIOZ from station 10 (cast 6), we used an 21 meter set-up and retrieved approximately 16 m and 77 cm core.
In situ pumps
Cast 10-7 the three upper depths (5, 15, 25m) including the fluorescence maximum were sampled using 0.7 µm filters (1h). In the next cast (10-8) the same depths were sampled using 0.3 µm filters (1h). In the third cast (10-9) 50, 60 and 72 m water depth were sampled using 0.3 µm filters for 1.5 hours. Pump B seems to use way more batteries than the other two?
26-05-2016
Predrilled piston core (21 m set up, core length 15 m 93 cm), a piston core predrilled for methane analysis was deployed early in the morning and sampled for methane through the drilled holes (cast 10-10). Afterwards the sections were split and subsampled for DNA, lipids and pore water.
In situ pumps
The deeper water depths, 100, 150 and 200 were sampled using using 0.3 µm filters for 2 hours (cast 11). Pump A, 200 meter failed, the cast will be repeated with 200, 175 and 125 meter sampling depths (cast 10-12). A and B pumps where switched.
To sample the potential aerobic methane consumption zone with 0.3 µm filters for (incubation) experiments back at the NIOZ some Niskin bottles were removed from the CTD frame and all three in situ pumps were mounted in the CTD frame. The CTD was lowered to 68 meter depth (cast 10-13). Also 120l water was collected from this depth for laboratory filtration.
After 1279 miles we arrived in Nynäshamn.
Piston core section.
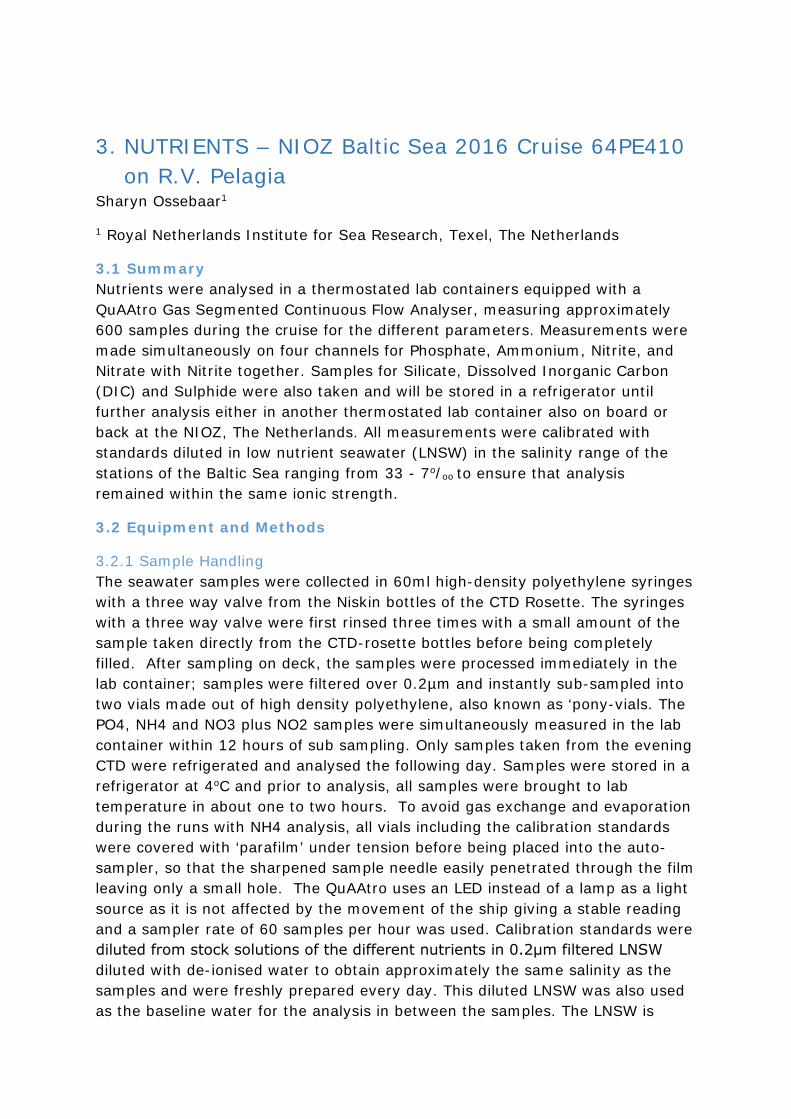
3. NUTRIENTS – NIOZ Baltic Sea 2016 Cruise 64PE410 on R.V. Pelagia
Sharyn Ossebaar1
1 Royal Netherlands Institute for Sea Research, Texel, The Netherlands
3.1 Summary Nutrients were analysed in a thermostated lab containers equipped with a QuAAtro Gas Segmented Continuous Flow Analyser, measuring approximately 600 samples during the cruise for the different parameters. Measurements were made simultaneously on four channels for Phosphate, Ammonium, Nitrite, and Nitrate with Nitrite together. Samples for Silicate, Dissolved Inorganic Carbon (DIC) and Sulphide were also taken and will be stored in a refrigerator until further analysis either in another thermostated lab container also on board or back at the NIOZ, The Netherlands. All measurements were calibrated with standards diluted in low nutrient seawater (LNSW) in the salinity range of the stations of the Baltic Sea ranging from 33 - 7o/oo to ensure that analysis remained within the same ionic strength.
3.2 Equipment and Methods
3.2.1 Sample Handling The seawater samples were collected in 60ml high-density polyethylene syringes with a three way valve from the Niskin bottles of the CTD Rosette. The syringes with a three way valve were first rinsed three times with a small amount of the sample taken directly from the CTD-rosette bottles before being completely filled. After sampling on deck, the samples were processed immediately in the lab container; samples were filtered over 0.2µm and instantly sub-sampled into two vials made out of high density polyethylene, also known as ‘pony-vials. The PO4, NH4 and NO3 plus NO2 samples were simultaneously measured in the lab container within 12 hours of sub sampling. Only samples taken from the evening CTD were refrigerated and analysed the following day. Samples were stored in a refrigerator at 4oC and prior to analysis, all samples were brought to lab temperature in about one to two hours. To avoid gas exchange and evaporation during the runs with NH4 analysis, all vials including the calibration standards were covered with ‘parafilm’ under tension before being placed into the auto-sampler, so that the sharpened sample needle easily penetrated through the film leaving only a small hole. The QuAAtro uses an LED instead of a lamp as a light source as it is not affected by the movement of the ship giving a stable reading and a sampler rate of 60 samples per hour was used. Calibration standards were diluted from stock solutions of the different nutrients in 0.2μm filtered LNSW diluted with de-ionised water to obtain approximately the same salinity as the samples and were freshly prepared every day. This diluted LNSW was also used as the baseline water for the analysis in between the samples. The LNSW is

surface seawater depleted of most nutrients. Each run of the system had a correlation coefficient of at least 0.9999 for 10 calibration points, but typical 1.0000 for linear chemistry. The samples were measured from the lowest to the highest concentration in order to keep carry-over effects as small as possible, i.e. from surface to deep waters. Concentrations were recorded in ‘μmol per liter’ (μM/L) at an average container temperature of 21.8°C. During the cruise, a freshly diluted mixed nutrient standard, containing silicate, phosphate and nitrate (a so-called nutrient cocktail), was measured in every run. The cocktail sample was used as a guide to monitor the performance of the standards.
Pore-water from sediment cores was collected under anoxic conditions in glove bags under nitrogen atmosphere and sub sampled for H2S, DIC, N, PO4 and Si. For the PO4 pore-water samples, an extra addition of 5µl 5N HCl per 1ml of sample was added to compensate for high DIC background levels, expected up to 25mM DIC, to keep the pH in between 1 and 2 to prevent any form of iron-phosphate precipitates. Sulfide samples were diluted using a dilution factor of 4 made with anoxic demineralised water containing 8ml 1N NaOH/L. DIC samples were also diluted using a dilution factor of 10 with anoxic demineralised water containing 17g NaCl/L, this ensuring that the samples remained with the same ionic strength as deep water of the Baltic Sea.
3.2.2 Analytical Methods The colorimetric methods used are as follows:
Ortho-Phosphate (PO4) reacts with ammonium molybdate at pH 1.0, and potassium antimonyltartrate is used as a catalyst. The yellow phosphate-molybdenum complex is reduced by ascorbic acid and forms a blue reduced molybdophosphate-complex which is measured at 880nm (Murphy & Riley, 1962).
Ammonium (NH4) reacts with phenol and sodiumhypochlorite at pH 10.5 to form an indo-phenolblue complex. Citrate is used as a buffer and complexant for calcium and magnesium at this pH. The blue color is measured at 630nm (Koroleff, 1969 and optimized by W. Helder and R. de Vries, 1979).
Nitrate plus Nitrite (NO3+NO2) is mixed with an imidazol buffer at pH 7.5 and reduced by a copperized cadmium column to Nitrite. The Nitrite is diazotated with sulphanylamide and naphtylethylene-diamine to a pink colored complex and measured at 550nm. Nitrate is calculated by subtracting the Nitrite value of the Nitrite channel from the ‘NO3+NO2’ value. (Grasshoff et al, 1983).
Nitrite (NO2) is diazotated with sulphanylamide and naphtylethylene-diamine to form a pink colored complex and measured at 550nm. (Grasshoff et al, 1983).
Another thermostated lab container on board or back at the NIOZ, The Netherlands;

Silicate (Si) reacts with ammonium molybdate to a yellow complex and after reduction with ascorbic acid, the obtained blue silica-molybdenum complex is measured at 820nm. Oxalic acid is added to prevent formation of the blue phosphate-molybdenum complex (Strickland & Parsons, 1968).
Dissolved Inorganic Carbon (DIC):
Samples are acidified online after being oxidised by H2O2 to prevent H2S being released before entering the silicon dialyser whereby the formed CO2 is dialysed to a secondary flow. This secondary flow contains a slightly alkaline phenolphthalein solution giving a pink colour. The more CO2 that is dialysed, the lower the pH and therefore some discolouration of the pink reagent is observed. This decolouring is measured at 520nm and is an inverse chemistry spectrophotometer method described by Stoll, Bakker, Nobbe and Haesse, 2001.
H2S:
To keep the samples in the S2- form under alkaline conditions, a small aliquot of
NaOH is added. The Hydrogen Sulfide in the sample reacts with para-aminodimethylaniline and ferric chloride to yield methylene blue which is measured at 660nm as described by Grasshof, K., 1969.
3.2.3 Calibration and Standards Nutrient primary stock standards were prepared at the NIOZ as follows;
Phosphate (PO4): by weighing Potassium dihydrogen phosphate in a calibrated volumetric PP flask to make 1mM PO4 stock solution.
Ammonium (NH4): by weighing Ammonium Chloride in a calibrated volumetric PP flask to make 1mM NH4 stock solution.
Nitrate (NO3): by weighing Potassium nitrate in a calibrated volumetric PP flask set to make a 10mM NO3 stock solution.
Nitrite (NO2): by weighing Sodium nitrite in a calibrated volumetric PP flask set to make a 0.5mM NO2 stock solution.
Silicate: by weighing Na2SiF6 in a calibrated volumetric PP flask to 19.84mM Si stock solution.
DIC: by weighing Na2CO3 stock in a calibrated volumetric PP flask set to make a 200mM stock solution.
S2- : by weighing Na2S in 0.5N NaOH set to make a 50mM Sulphide stock
solution.

All standards were stored at room temperature in a 100% humidified box. The calibration standards were prepared daily by diluting the separate stock standards, using three electronic pipettes, into four 100ml PMP volumetric flasks (calibrated at the NIOZ) filled with diluted LNSW. The blank values of the diluted LNSW were measured onboard and added to the calibration values to get the absolute nutrient values.
3.3 Statistics
3.3.1 Quality Control Our standards have already been proven by inter-calibration exercises from ICES and Quasimeme, and over the past years the RMNS exercise organised by MRI, Japan, concluded them to be within the best obtainable limits to the mean of the better laboratories.
To gain some accuracy, the Cocktail standard which contains PO4, NO3 and Si has been monitored since 1997, showing between run reproducibility better than 1.5% , but typically 0.7% of its average value. The following values were obtained from the cocktail which was diluted 100 times in a calibrated PP volumetric flask, being measured in every run onboard.
Average value S.D. N Dilution Factor
PO4 0.899 uM 0.009uM 42 250
NO3 13.701 uM 0.285uM 42 250
Although our cocktail standard is measured in every run and its value remained stable for all nutrient measurements during the cruise, it is vitally important to get a certified nutrient reference material, like the standard seawater for salinity that is directly for use, in order to obtain real accuracy to give better comparison between labs and cruises.
3.3.2 Mean Detection Limits The method detection limit was calculated during the cruise using the standard deviation of ten samples containing 2% of the highest standard used for the calibration curve and multiplied with the student’s value for n=10, thus being 2.82. (M.D.L = Std Dev of 10 samples x 2.82)

µM/l Used measuring ranges µM/l:
PO4 0.011 2.0
NH4 0.007 5.0
NO3+NO2 0.005 15.5
NO2 0.002 0.5
3.3.3 Further Remarks It is suggested that through diluting the samples by means of electronic pipettes, one for the sample and one for the dilution water, a small error of maximum 1.0% could be introduced.
The reported pore-water results took into account the dilution steps that were made in the glovebag prior to analysis for HS- and DIC.
3.4 References Grasshoff, K. et al, Methods of seawater analysis. Verlag Chemie GmbH, Weinheim, 1983 419 pp
Grasshof, K., Advances in Automated Analysis, Technicon International Congress, 1969, Volume II, pp 147-150.
Koroleff, 1969 and optimized by W. Helder and R. de Vries, 1979. An automatic phenol-hypochlorite method for the determination of ammonia in sea- and brackish waters. Neth. J. Sea Research 13(1): 154-160.
Murphy, J. & Riley, J.P., A modified single solution method for the determination of phosphate in natural waters. Analytica chim. Acta,1962, 27, p31-36
Stoll, M.H.C, Bakker K., Nobbe G.H., Haese R.R., Analytical Chemistry, 2001, Vol 73, Number 17, pp 4111-4116.
Strickland, J.D.H. and Parsons, T.R., A practical handbook of seawater analysis. First edition, Fisheries Research Board of Canada, Bulletin. No 167, 1968. p.65.

4. Long chain alkyl diols Sergio Balzano
Several freshwater and marine microalgal species from the eukaryotic supergroup Heterokontophyta (Rampen et al., 2014; Rampen et al., 2011; Sinninghe Damste et al., 2003) can synthesize, among other lipids, long chain alkyl diols (LCD). LCDs can vary in chain length and in the position of the second alcohol functional groups, they are usually taxon specific. LCDs are widespread in marine and freshwater sediment and their distribution can also reflect ancient temperature and nutrient conditions (Rampen et al., 2012). The biological sources of LCDs are not fully clear since LCDs are usually more abundant than LCD-producers in the water column. To investigate this discrepancy I’m currently coupling 18S rRNA gene high throughput amplicon sequencing (Balzano et al., 2015) with lipid analyses to infer relationships between LCDs and LCD-producers in the water column. The Baltic Sea is affected by latitudinal and vertical salinity gradients and is inhabited by both freshwater and seawater microalgae (Hällfors, 2004). The Baltic Sea is thus likely to contain LCDs of both marine and freshwater origin and the analyses of lipids and microbial eukaryotes in the Suspended Particulate Matter (SPM) can provide a diverse dataset and improve the current knowledge about the biological sources of LCDs.
4.1 Suspended Particulate Matter (SPM) During the 64PE410 cruise we sampled SPM from different stations along a decreasing salinity gradient. SPM was sampled using an in situ pump (information by Saara Suominen) from 3 depths (surface, fluorescence maximum, and bottom of the photic zone). Additional sampling depths were occasionally selected in correspondence of secondary fluorescence peaks or sharp changes in temperature and/or salinity. 50 to 100 L seawater were filtered through 0.7 µm pore-size, 120 mm diameter glass fiber (GF/F) filters which were immediately stored at -80 °C after filtration.
4.2 Seawater collection for chlorophyll and flow cytometry To complement the investigation of the microbial eukaryotes in the Baltic Sea useful information can be provided by analyzing the concentration of chlorophyll as well as by enumerating cells from different microbial classes in the water column. 2L seawater were collected using Niskin bottles mounted on a Conductivity-Temperature-Depth (CTD) frame from the same depths at which SPM has been sampled.
4.2.1 Flow cytometry Seawater was processed immediately for future flow cytometry analyses which will allow the enumeration of small (< 5µm) phytoplankton, heterotrophic

bacteria, and viruses. For heterotrophic bacteria and viruses 1 mL seawater was added, in triplicate, in 2 mL cryovials pre-filled with 20 µL gluteraldehyde. For small phytoplankton, mostly consisting in cyanobacteria from the genera Prochlorococcus and Synechococcus as well as photosynthetic nano and picoeukaryotes, 3.5 mL seawater were added in triplicate in 5 mL cryovials pre-filled with 100 µL formaldehyde (18%)-hexamine (10%) solution. Cryovials were then incubated at 4 °C for 30 minutes, and flash frozen in liquid nitrogen where they were stored for 1-2 hours. Cryovials were then transferred at -80 °C for future analyses in flow cytometry. Samples are labeled by the station number and a sample code as shown in the Table below.
4.3 Chlorophyll Seawater collected from the Niskin bottles (see above) was stored at 4 °C for 1 hour maximum until being processed for future chlorophyll measurements. 300 to 800 mL seawater were filtered in triplicate though 0.7 µm pore-size, 25 mm diameter, pre-combusted glass fiber (GF/F) filters using glassware filtration units connected to a vacuum pump. After filtration filters were stored at -20 °C in pre-labelled 1.5 mL eppendorf tubes. Tubes are labeled by the station number and a sample code as shown below.
Table 1: samples Station Cast CTD bottle
# Temperature Salinity Sample code1 Depth
(m) Volume
filtered for chlorophyll
(mL) 1 2 23 10.7 30 Surface 10 630 1 2 21 8.1 32 DCM 24.5 570 1 2 17 7.1 35 Bottom 55 500 2 2 16 11.1 26 Surface 5 600 2 2 10 8.7 32.7 DCM 15 600 2 2 4 7.9 34 Bottom 30 600 3 2 18 11.5 16.1 1 5 600 3 2 15 11.2 17.8 2 10 600 3 2 12 7.4 25.4 3 15 600 3 2 9 5.7 32.7 4 20.5 500 3 2 6 5.8 33.4 5 25 600 3 2 3 5.5 33.6 6 31.5 600 4 2 15 10.7 17.5 Surface 5 600 4 2 9 6.5 28.4 DCM 15 600 4 2 6 5.6 33.7 Bottom 20 600 5 2 18 9.6 19.5 Surface 10 700 5 2 12 6.2 32.6 Middle 20 500

5 2 9 6 33.1 Bottom 25 500 6 3 13 11.7 4.6 Surface 4.5 500 6 3 7 9.1 14.6 Middle 14.5 600 6 3 4 6 20.6 Bottom 20.5 600 7 9 21 11.8 8.1 1 4.5 600 7 9 18 10 8.3 2 14 500 7 9 15 5.9 9.6 3 24.5 500 7 9 12 5.9 11 4 29.5 600 7 9 9 5.9 14.3 5 24.5 600 7 9 6 6 17.4 6 35.6 600 7 17 7 19 400 7 17 9 21 300 8 2 23 11.1 8.1 1 5 500 8 2 20 10.9 8.1 2 9 400 8 2 17 6.4 8.3 3 18 300 8 2 14 6.1 10 4 24 600 8 2 11 6 11.7 5 30 600 8 2 8 5.6 17.1 6 43 600 9 2 22 10.6 7.8 1 5 500 9 2 19 8.5 8 2 22.5 400 9 2 15 5.9 8.5 3 35 600 9 2 12 5.8 10.6 4 45.5 700 9 2 9 5.6 13.4 5 59.2 600 9 2 6 7 18.4 6 77.4 600
10 2 17 11.1 6.95 1 4 500 10 2 15 6.9 6.95 2 13 300 10 2 13 5.1 7.1 3 24 700 10 2 11 4.7 7.2 4 49.5 700 10 2 9 4 7.3 5 59.8 800 10 2 7 5.2 9.1 6 71.9 800 10 3 3 6 11.1 7 99.4 02
10 2 3 6.8 12.8 8 149.7 02
10 2 2 7.1 13.5 9 199.8 02
1 Code as written on the sampling tubes for both flow cytometry cryovials and chlorophyll eppendorf tubes. 2 Seawater was not filtered for chlorophyll at these 3 depth because of the very low fluorescence values previously observed on the CTD profile. Samples were instead processed for flow cytometry and are labeled station 10-7, station 10-8 and station 10-9.
4.4 References Balzano, S., Abs, E., Leterme, S.C., 2015. Protist diversity along a salinity gradient in a coastal lagoon.
Aquatic Microbial Ecology 74, 263-277.

Hällfors, G., 2004. Checklist of Baltic Sea phytoplankton species (including some heterotrophic protistan groups). . Baltic Sea Environment Proceedings 95, 1-208.
Rampen, S.W., Datema, M., Rodrigo-Gamiz, M., Schouten, S., Reichart, G.-J., Damste, J.S.S., 2014. Sources and proxy potential of long chain alkyl diols in lacustrine environments. Geochimica Et Cosmochimica Acta 144, 59-71.
Rampen, S.W., Schouten, S., Damste, J.S.S., 2011. Occurrence of long chain 1,14-diols in Apedinella radians. Organic Geochemistry 42, 572-574.
Rampen, S.W., Willmott, V., Kim, J.-H., Uliana, E., Mollenhauer, G., Schefuss, E., Damste, J.S.S., Schouten, S., 2012. Long chain 1,13-and 1,15-diols as a potential proxy for palaeotemperature reconstruction. Geochimica Et Cosmochimica Acta 84, 204-216.
Sinninghe Damste, J.S., Rampen, S., Irene, W., Rupstra, C., Abbas, B., Muyzer, G., Schouten, S., 2003. A diatomaceous origin for long-chain diols and mid-chain hydroxy methyl alkanoates widely occurring in Quaternary marine sediments: Indicators for high-nutrient conditions. Geochimica Et Cosmochimica Acta 67, 1339-1348.

5. Marine fungi Judith van Bleijswijk
There is increasing evidence that marine fungi might play a significant role in remineralization of organic matter in anoxic sediments. However, data on the presence and activity of marine fungi is still very scarce. During this cruise in the Baltic my aim was to find more evidence for the potential importance of marine fungi by analyzing fungal DNA in multicores and piston cores that have been taken at various stations. Focus will be on core slices with known pore water chemistry. More specifically, anoxic layers with high DIC and average alkalinity (indicative for mineralization and not calcium carbonate dissolution) will be extracted. Using primers specific for marine fungi, the presence of marine fungi can be quantified with quantitative PCR. In addition, the community composition of marine fungi can be analyzed using 454 FLX sequencing.

6. Particulate organic matter Judith van Bleijswijk Particles for POC and PON, POP were collected from Niskin bottles mounted on a CTD at 3-9 depths per station. Chlorophyll and subsampels for flow cytometry and microscopy were taken from the same Niskin bottle. Nutrients and gasses were measured from different Niskin bottles that were closed at the same depth. A volume of 2-3L of water was filtered using the HPLC filtration set up of the plankton lab (plastic cups of 300 ml, vacuum filtration) over ashed pre-weighted 47 mm GFF filters. Per station, per depth, two filters were stored at -20 degrees. An overview of all samples is given below in Table 1.
Filter Volume (L)
Station, cast, depth (m)
Filter Volume (L)
Station, depth (m)
Filter Volume (L)
Station, depth (m)
1-2 2.0-2.0 St1, c2, 10.1
37-38
2.0-2.0 St6, c3, 4.6
70-71
2.0-2.0 St9, c2, 5.1
3-4 2.0-2.0 St1, c2, 24.4
39-40
2.0-2.0 St6, c3, 14.6
72-73
2.0-2.0 St9, c2, 22.5
5-6 2.0-2.0 St1, c2, 55.1
41-42
2.0-2.0 St6, c3, 20.6
74-75
2.0-2.0 St9, c2, 34.8
7-8 2.0-2.0 St2, c2, 5.2
43-44
2.0-2.0 St7, c?, 4.6
76-77
2.0-2.0 St9, c2, 45.4
9-10 2.0-2.0 St2, c2, 14.9
45-46
2.0-2.0 St7, c?, 14.8
78-79
2.0-2.0 St9, c2, 59.2
11-12
2.0-2.0 St2, c2, 30.0
49-50
2.0-2.0 St7, c?, 24.3
80-81
2.0-2.0 St9, c2, 77.4
13-14
2.0-2.0 St3, c2, 4.7
52-55
2.0-2.0 St7, c?, 29.7
82-83
2.0-2.0 St10, c2, 4.2
15-16
2.0-2.0 St3, c2, 10.2
53-54
2.0-2.0 St7, c?, 35.6
84-85
2.0-2.0 St10, c2, 13.9
17-18
2.0-2.0 St3, c2, 14.9
56-57
2.0-2.0 St7, c?, 40.1
86-87
2.0-2.0 St10, c2, 24.2

19-20
2.0-2.0 St3, c2, 20.3
58-59
2.0-2.0 St8, c2, 4.9
88-89
3.0-3.0 St10, c2, 49.3
21-22
2.0-2.0 St3, c2, 24.8
60-61
2.0-2.0 St8, c2, 9.3
90-91
2.0-2.0 St10, c2, 59.8
23-24
2.0-2.0 St3, c2, 31.4
62-63
2.0-2.0 St8, c2, 18.0
92-93
2.0-2.0 St10, c2, 71.9
25-26
2.0-2.0 St4, c2, 4.8
64-65
2.0-2.0 St8, c2, 24.1
94-95
2.5-2.5 St10, c2, 99.4
27-28
2.0-2.0 St4, c2, 14.5
66-67
2.0-2.0 St8, c2,30.1
96-97
2.4-2.4 St10, c2, 149.8
29-30
2.0-2.0 St4, c2, 19.8
68-69
2.0-2.0 St8, c2, 43.4
98-99
2.0-2.0 St10, c2, 199.6
31-32
2.0-2.0 St5, c2, 9.8
33-34
2.0-2.0 St5, c2, 20.1
35-36
2.0-2.0 St5, c2, 24.9
2.0-2.0

7. Microscopy Judith van Bleijswijk From the same Niskin bottles that were sampled for POC,PON, POP, Chlorophyll and flow cytometry, a subsample of 0.5 or 1 L was prepared for microscopic analyses of the plankton at the Deep Chlorophyll Maximum. An overview is given below.
Station 1, cast 2, DCM at 24.4 m, 1L >10um and Station 2, cast 2, 1L >10um
Chain forming diatoms are dominant (many small diameter chains, and less large Guinardia-like chains, Rhizosolenia). Some dinoflagellates (Ceratium sp.). Adult copepods and nauplii
Station 3, cast 2, 1L >10um
Chain forming diatoms blooming (>100 chains per field 10x10; small, and larger Guinardia-like species, Rhizosolenia) with Coscinodiscus also present. Large dinoflagelates (Protoperidinium, Dinophysis) appear. Adult copepods and nauplii, also tintinnids present.
Station 4, cast 2 , 1L >10um
Similar to station 3 but less intensive chain forming diatom bloom (20 chains per field 10x10). In addition non-chain forming Chaetoceros densus 10 per field. And apparent silicoflagelate presence (Dyctyocha speculum) 20 per field. Also, large dinoflagellate variation. Also many small phototroph swimmers (gymnodinium-like).
Station 5, cast 2 , 1L >10um
Remarkebly large diameter chain-forming diatoms, Guinardia-like, Chaetoceros sp. Also small dinoflagellate swimmers (Gymnodinium, Glenodinium-like), many tintinnids,copepod faecal pellets and debris.
Station 6 cast 3 , 1L >10um
At 4.6 m depth mainly small swimmers and only few diatoms. At 14.6 m bloom of silicoflagelate Dictyocha speculum 60 per field 10x10!. Also variation of large diatoms (20 per field). At 20.6 m no dinoflagellates, no silicoflagelates, still diatoms (20/field).
Station 7 cast? , 1L >10um
Poor station with sharp chlorophyll maximum at 25 m. No large plankton present. Only small flagellated swimming cells (Scriptiella, Peridinella, Gymnodinium-like).

Station 7, cast 17, 1L >10 um and 1L >0.45um
Small dinoflagelates (>30 per field), plus smaller swimmers, plus filamentous cyanobacteria and small cyanobacteria.
Station 8, cast 2, 0.5L > 0.22 um
Small cyanobacteria, small diatoms (Scriptiella), a lot of debris, and filaments (cyanobacteria?).
Station 9, cast 2, 0.5L >0.22um
Small diatoms Thallassiosira (1/2 per field) no large diatoms, small dinoflagellate (Scriptiella-like 10 per field), many pollen grains. Large dinoflagellate Dinophysis and many (cyanobacteria) filaments.
Station 10 cast ?, 0.5L > 0.22 um
At DCM a bloom of dinoflagelates: Dinophysis (>12 per field), Protoperidinium, prorocentrum, Gyrodinium, Katodinium, Scriptiella-like as in earlier stations. Many rotifers. At 200m no living plankton visible, only dark-brown small globules with extending filaments (iron-phosphate? crystels?)

8. Piston Core for DNA and pore water sampling Judith van Bleijswijk Three piston cores were predrilled for porewater sampling and DNA analyses.
DNA Piston 1: Information by Sigrid van Grinsven
DNA Piston 2 and 3: Cores were split in sections of 1 m, sliced and opened. The two exposed sides of the core were photographed. Subsequently pore water was sampled from one side and DNA samples were taken from the other side on the same core depth. The sample list is given below.
DNA Piston Core 2, Station .. cast …
section Label# cm from bottom
remark
4 40, 39, 38, 37 20, 40, 60, 80
5 36, 35, 34, 33 20, 40, 60, 80 A hole of 10 cm at 90 cm
6 32, 31, 30, 29 20, 40, 64, 84
7 28, 27, 26, 25 20, 40, 60, 80 two holes: one at 66-70; one at 90-95
8 24, 23, 22, 21 20, 40, 60, 80 cracks
9 20, 19, 18, 17 20, 40, 60, 80
10 16, 15, 14, 13 20, 40, 60, 80 Wet sediment, bivalves (~1 cm) visible
11 12, 11, 10, 9 20, 40, 60, 80 Wet sediment, bivalves visible
12 8, 7, 6, 5 20, 40, 60, 80 dry
13 4, 3, 2, 1 20, 40, 60, 80 dry
14 0, -1, -2, -3 20, 40, 60, 80 wet
15 -4, -5, -6, -7 20, 40, 60, 80 wet
DNA piston core 3, Station 10
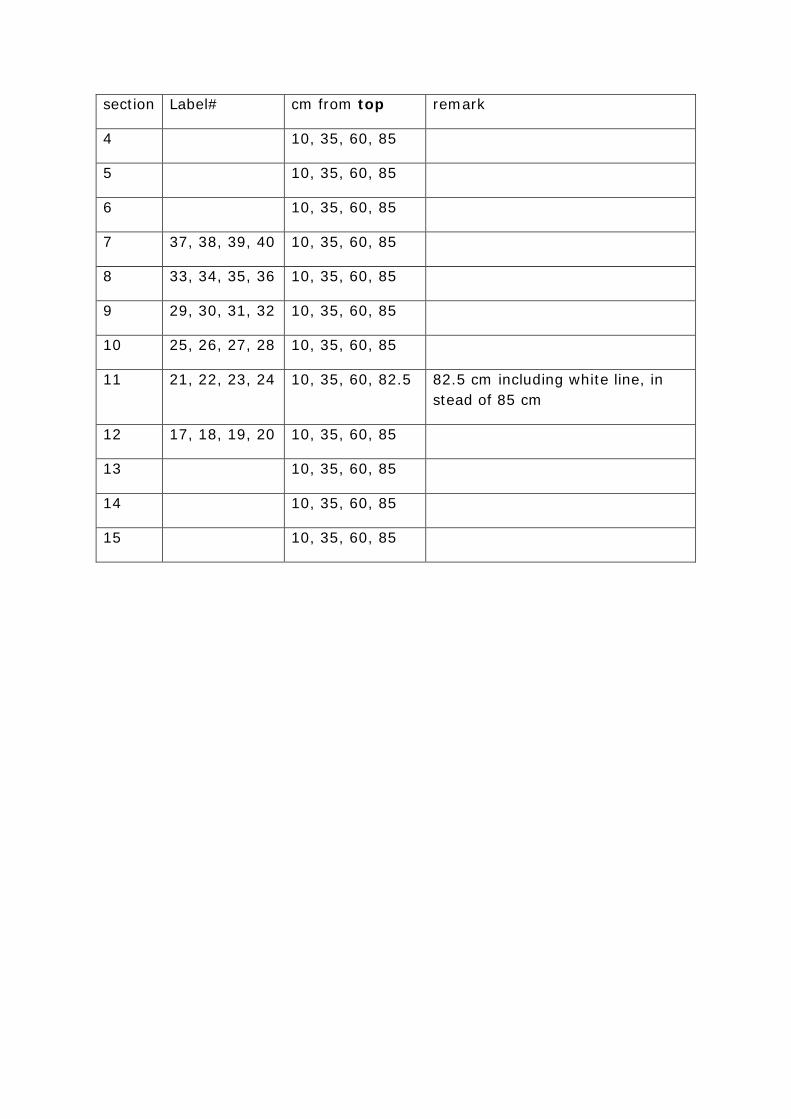
section Label# cm from top remark
4 10, 35, 60, 85
5 10, 35, 60, 85
6 10, 35, 60, 85
7 37, 38, 39, 40 10, 35, 60, 85
8 33, 34, 35, 36 10, 35, 60, 85
9 29, 30, 31, 32 10, 35, 60, 85
10 25, 26, 27, 28 10, 35, 60, 85
11 21, 22, 23, 24 10, 35, 60, 82.5 82.5 cm including white line, in stead of 85 cm
12 17, 18, 19, 20 10, 35, 60, 85
13 10, 35, 60, 85
14 10, 35, 60, 85
15 10, 35, 60, 85

9. In-situ pumping Saara Suominen
McLane Large Volume Water Transfer System Sampler (WTS-LV) in-situ pumps (McLane Research Laboratories Inc., East Falmouth, MA, USA) were deployed at each station at the same depths as the CTD cast. Between the Norths Sea and the Baltic Sea (stations 1-6), during a large salinity gradient, pumps were deployed at only at the three upper depths, except for station 3 were three additional deeper depths were used. Depths were chosen according to the CTD profiles and especially fluorescence maximums to access the bloom populations. In the Baltic Sea (stations 7-10) pumps were deployed also to deeper depths. In addition at stations 8 and 10 pumps were mounted on to the CTD frame to collect several filters at the same depth for an incubation project of Darci Rush (Figure 1).
Figure 1, Pumps mounted on the CTD frame
The three shallow depths were filtered on pre-ashed 142 mm 0,7 um glass fibre filters, while at stations with more depths the whole water column (including shallow depths) was additionally pumped through pre-ashed 0.3 um glass fibre filters. Most deployments ended in clogged filters and the time limit determined for pumping was not reached.
Filters were collected immediately after pumps were brought up, photographed if possible, folded once, wrapped in two layers of aluminium foil and taken to the -80 °C freezer. Filters from each cast were collected in one geochemical bag and labelled with station and cast number, depth and filter size. An example of the program used for each pump is shown in table 1.

Table 1. An example of programmed parameters for pump deployment. All pumps were programmed similarly except for time limit (60-120 minutes) and scheduled start.
Cruise 64PE410 Station 6 cast 7 Sample volume 10000 [liters] Initial flow rate 6000 [ml/min] Minimum flow rate 4000 [ml/min] Time limit 60 [minutes] Pump data period 1 [minutes] Scheduled start 05/21/2016 16:55:00
There were connection problems with the pumps C and B and the computer, which were resolved by changing the connection cable. The computer provided by NIOZ was not functioning, because of a missing driver for the USB connection, and a computer was borrowed from the Pelagia (Roald) to access the CrossCut software. The pump B was running out of battery power faster than the other two pumps. Some changes to the connections in the electronics were made during the last cruise, which could be the issue, or alternatively there was something hindering the flow more than normal. In two occasions pump A did not pump due to unknown software problems.
After the cruise all pumps were rinsed outside, and the filter holders were washed thoroughly with fresh water. Filters will be used for molecular and organic geochemical analysis at the NIOZ. Table 2 shows the conditions and pumped volume for each deployment and photographs of filters are in fig 1-5.

Table 2. In situ pump deployments, depths and liters filtered during cruise 64PE406. Deviations marked in red color explained in textDate Station Pump Depth (m) Time deployment (UTC) Pumping time Computer (L) Read before (L) Read after (L) calculated liters min flow at (sec)
18/05/2016 Station 1, cast 3 Pump C 10 6.15-7.15 1 hour 66.31 69091 69152 61.0 939.00.7 µm Pump B 25 221.61 87065 87241 176.0 3202.0
Pump A 55 154.07 60919 61078 159.0 2125.0Station 2, cast 3 Pump C 5 17.55-18.55 1 hour 79.03 69152 69221.0 69.0 1172.0
0.7 µm Pump B 15 70.87 87241 87295 54.0 1033.0Pump A 30 55.33 61078.0 61134 56.0 791.0
19/05/2016 Station 3 cast 3 Pump C 5 06.15-07.15 1 hour 71.76 69222 69285 63.0 1024.00.7 µm Pump B 20 201.45 87295.0 87441 146.0 3122.0
Pump A 25 0.00 61134 61134 0.0 FROM ISSUES WITH PROStation 3, cast 4 Pump C 5 08.15-09.15 1 hour 50.02 69285 69329 44.0 725.0
0.3 µm Pump B 10 61.76 87441 87498 57.0 906.0Pump A 15 32.5 61134 61165 31.0 507.0
Station 3, cast 5 Pump C 20 09.55-10.55 1 hour 78.64 69329 69402 73.0 1243.00.3 µm Pump B 25 84.34 87498 87576 78.0 1185.0
Pump A 30 35.31 61165 61202 37.0 487.0ALL BATTERIES CHANGED
Station 4, cast 3 Pump C 5 17.30-18.30 1 hour 223.25 69403 69565 162.0 time limit reached0.7 µm Pump B 15 189.78 87578 87702 124.0 2818.0
Pump A 20 35.34 61204 61239 35.0 474.020/05/2016 Station 5, cast 3 Pump C 10 05.50-06.50 1 hour 92.81 69565 69605 40.0 1319.0
0.7 µm Pump B 20 133.5 87702 87794 92.0 1997.0Pump A 25 48.59 61246.0 61289.0 43.0 678.0
Station 6, cast 5 Pump C 5 12.50-13.50 1 hour 48.86 69651 69689 38.0 732.00.7 µm Pump B 15 138.56 87794.0 87898 104.0 2003.0
Pump A 20 48.68 61289 61339 50.0 661.021/05/2016 Station 7, cast 10 Pump C 5 18.10-19.10 1 hour 72.8 69690 69749 59.0 1093.0
0.7 µm Pump B 15 140.38 87898.0 87976 78.0 2163.0Pump A 25 143.4 61339 61443 104.0 2110.0
Station 7, cast 11 Pump C 5 20.00-21.00 1 hour 35.57 69749 69780 31.0 580.00.3 µm Pump B 15 64.11 87976 88013 37.0 1010.0
Pump A 25 58.13 61443 61541 98.0 859.0Pump C 30 21.45-22.45 1 hour 107.42 69780 69879 99.0 1686.0
0.3 µm Pump B 35 242.85 88013 88194 181.0 time limit reachedPump A 40 61.03 61541 61602 61.0 910.0
22/05/2016 Station 8, cast 3 Pump C 5 15.00-16.00 1 hour 63.55 69879 69928 49.0 964.00.7 µm Pump B 18 114.21 88196 88255 59.0 1803.0
Pump A 25 95.18 61603 61699 96.0 1314.0For Darci Station 8, cast 4 Pump C 40 17.15-18.15 1 hour 55.63 69928 69980 52.0 786.0
0.3 µm Pump B 40 89.19 88255.0 88317 62.0 1303.0Pump A 40 37.53 61699 61736 37.0 520.0
Station 8, cast 5 Pump C 40 18.50-19.50 1 hour 51.08 69980 70029 49.0 721.00.3 µm Pump B 40 72.55 88317 88370 53.0 1045.0
Pump A 40 291.74 61736 62061 325.0 time limit reached

23/05/2016 Station 9, cast 7 Pump C 5 11.30-12.30 1 hour 49.62 70030 70068 38.0 778.00.7 µm Pump B 23 161.52 88377.0 88453 76.0 2607.0
Pump A 35 129.52 62064 62194 130.0 1954.0Station 9, cast 8 Pump C 5 13.15-14.15 1 hour 48.6 70068 70100 32.0 775.0
0.3 µm Pump B 23 241.84 88453 88622 169.0 time limit reachedPump A 35 53.95 62194 62249 55.0 835.0
Station 9, cast 9 Pump C 45 15.30-16.30 1 hour 241.44 70100 70306 206.0 time limit reached0.3 µm Pump B 59 268.49 88622.0 88832 210.0 time limit reached
Pump A 77 66.26 62249 62315 66.0 933.025/05/2016 Station 10, cast 8 Pump C 5 11.25-12.25 1 hour 111.52 70309 70399 90.0 1657.0
0.7 µm Pump B 15 211.02 88846 88972 126.0 3380.0Pump A 25 115.22 62316 62429 113.0 1691.0
Station 10, cast 9 Pump C 5 13.20-14.20 1 hour 64.18 70399 70452 53.0 977.00.3 µm Pump B 15 193.04 88972.0 89084 112.0 3040.0
Pump A 25 65.01 62429 62494 65.0 1002.0Station 10, cast 10 Pump C 50 15.15-16.45 1,5 hours 208.9 70452 70622 170.0 3207.0
0.3 µm Pump B 60 298.45 89084 89330 246.0 4567.0Pump A 72 58.91 62494 62557 63.0 904.0
26/05/2016 Station 10, cast 12 Pump C 100 07.45-09.45 2 hours 355.65 70623 70921 298.0 5142.00.3 µm Pump B 150 371.32 89331.0 89591 260.0 time limit reached
Pump A 200 62557 62561 4.0 failed, low batteryStation 10, cast 13 Pump C 125 12.00-15.00 2 hours 78.15 70922 70986 64.0 1095.0
0.3 µm Pump B 200 522.65 89599 89977 378.0 time limit reachedPump A 175 113.34 62561 62672 111.0 1657.0
For Darci Station 10, cast 14 Pump C 68.4 15.00-16.00 1 hour 163.13 70986 71120 134.0 2443.00.3 µm Pump B 68.4 266.27 89977.0 90167 190.0 time limit reached
Pump A 68.4 87.98 62672 62760 88.0 1396.0

38
Figure 2. Pictures of filters from station one reading from left to right: 10 m, 25 m, 55 m
Figure 3, Pictures of filters from station 2, depths 5 m, 15 m and 30 m
Figure 4, Pictures of filters from station 3, depths 5 m and 20 m with 0.7 um filters and depths, 5 m, 10 m, 15 m, 20 m, 25 m and 30 m with 0.3 um filters. The first deployment to 25 m with pump A failed.

39
Figure 5, Pictures of filters from station 4, depths 5 m, 15 m and 20 m
Figure 6, Pictures of filters from station 5, depths 10 m, 20 m and 25 m
Figure 7, Pictures of filters from station 6, depths 5 m, 15 m and 20 m

40
Figure 8, Pictures of filters from station 7, depths 5 m, 15 m and 25 m with 0.7 um filters. Depths 5 m, 15 m, 25 m, 30 m, 35 m and 40 m with 0.3 um filters.
Figure 9, Pictures of filters from station 8, depths 5 m, 18 m and 25 m. In addition 40 m filtered 6 times for Darci Rush (not shown).

41
Figure 10, Pictures of filters from station 9, depths 5m, 23 m and 39 m with 0.7 um filters. Depths 5 m, 23 m, 39 m, 45 m, 59 m and 77 m with 0.3 um filters

42
Figure 11, Pictures of filters from station 10, depths 5 m 15 m and 25 m with 0.7 um filters. Depths 5 m, 15 m, 25 m, 50 m, 60 m, 70 m, 100 m, 125 m, 150 m, 175 m and 200 m with 0.3 um filters

43
10. MULTICORES Gabriella Weiss & Darci Rush
Station Water Depth
Core Length (cm)
Sliced Cores Lipids/DNA (-80°C)
Sliced Cores
(Bengal Rose - 4°C)
Cores for
Pore water
Cores for
methane Porosity/Carbonate 5mL (-20°C)
Archived Cores (4°C)
1 550 40 3 (10cm) 1 (10cm) 0 0 0 1
2 44 40 3 (2 to 10cm, 1 to
8cm) 1 (10cm) 0 0 0 1
3 37.5 45 3 (10cm) 1 (10cm) 0 0 0 1
4 30 35 3 (10cm) 1 (10cm) 0 0 0 1
5 45 35 3 (10cm) 1 (10cm) 0 0 0 1
6 27 45 3 (10cm) 1 (10cm) 0 0 0 1
7 50 55 3 (30cm) 1 (10cm) 2 1 1 (30cm) 13
8 NO SEDIMENT WORK
9 90 55 3 (30cm) 1 (10cm) 1 1 1 (30cm) 1
10 246 30 3 (2 to 30cm, 1 to
29cm) 1 (10cm) 1 1 1 (30cm) 13
10.1 Part 1 – Stations 1-6: For all stations, four cores were sliced at half cm resolution for the first two cm and every one cm thereafter until 10cm and labeled cores A, B, C and D. Slices from three cores (A, B, C) were stored in geochemical bags at -80°C for lipid/DNA analyses. Slices from one core (D) were stored in pots with Bengal rose for foraminiferal analyses and kept in the reefer at 4°C. At least one archive core was taken at each station and also stored at 4°C.
10.1.1 Station 1: First deployment of the multicorer was successful, with cores measuring approximately 42cm in length. Sediment was relatively homogenous dark brown with roots throughout. The top 2-3cm were soupy, but the sediment became more condensed further down the core, with no significant changes throughout the top 10cm.
10.1.2 Station 2: The multicorer was deployed once successfully. Upon initial inspection, sediment appeared to be quite fluffy with many holes and worms throughout. However, only the first cm was watery, and the subsequent depths were quite thick and sticky grey to brown clay with some black layers mixed in. Each core had a lot of

44
bioturbation, with many of the perpetrators still at work burrowing through the sediment. Core C had a “zee-klit” (Echinocardium cordatum) around 3-4cm and core D had a cluster of worms at 5-6cm making these slices a bit smaller than normal. The outside ring on the coring tube of core C broke, therefore slicing stopped after 8cm.
10.1.3 Station 3: Multicores measured approximately 45cm in length and were again heavily bioturbated with a number of brittle stars and small worms throughout. Core B contained a large Echinocardium cordatum between 4 and 8cm. Sediment was quite soupy in the top few cm and the first cm had to be removed with a syringe.
10.1.4 Station 4: Multicores were approximately 35cm in length. Cores were very similar to station 3, with many brittle stars, but less obvious bioturbation. Another Echinocardium cordatum was found in core B and another large one was found on the multicore frame, along with a number of brittle stars.
10.1.5 Station 5: Cores measured around 35cm and the top layer was populated with a number of brittle stars, which continued to be present throughout, but strong bioturbation was less clear than in previous cores. At 5-6cm, a shell layer was present.
10.1.6 Station 6: Multicoring was done twice because it was brought to the surface a bit too quickly the first time and the top layers of the cores were slanted and sediment was suspended into the bottom water. The second time, the top layer was less disturbed, but still very fluffly. Approximately 0.5-1cm of bottom water was included in the first half cm slice to included suspended top sediment. The top few cm was a grey-brown color, but switched to a dark grey-black color around 6-7cm with a strong sulfide smell. Cores measured around 45cm in length.
10.2 Part Two – Stations 7, 9 & 10: For all three stations, four cores were sliced at half cm resolution for the first two cm and every one cm thereafter until 30cm and labeled cores A, B, C and D. Slices from three cores (A, B, C) were stored in geochemical bags at -80°C for lipid/DNA analyses. Slices from 0-10cm from core D were stored in pots with Bengal rose for foraminiferal analyses and kept in the reefer at 4°C. ~5mL wet sediment was sampled at 1cm resolution up to 30cm from core D for future porosity/carbonate measurements and stored at -20°C. At least one archive core was taken at each station and also stored at 4°C. Cores were also taken for methane measurements and pore water analyses, see sections 11 & 12.
45
10.2.1 Station 7: Multicorer was deployed twice. The first time the cores were too full. The second deployment yielded cores approximately 55cm in length with slightly uneven tops. The top cm of the cores was very fluffy brown. After the first cm, the sediment was a mix between rich brown and dark grey – black and became completely dark grey – black after 3cm, but did not smell of sulfides until around 7-8cm. Core B contained more water throughout than the others and core C was more dry and sticky than the others. There was no clear bioturbation but some bubbling of gases was present at the very bottom depths.
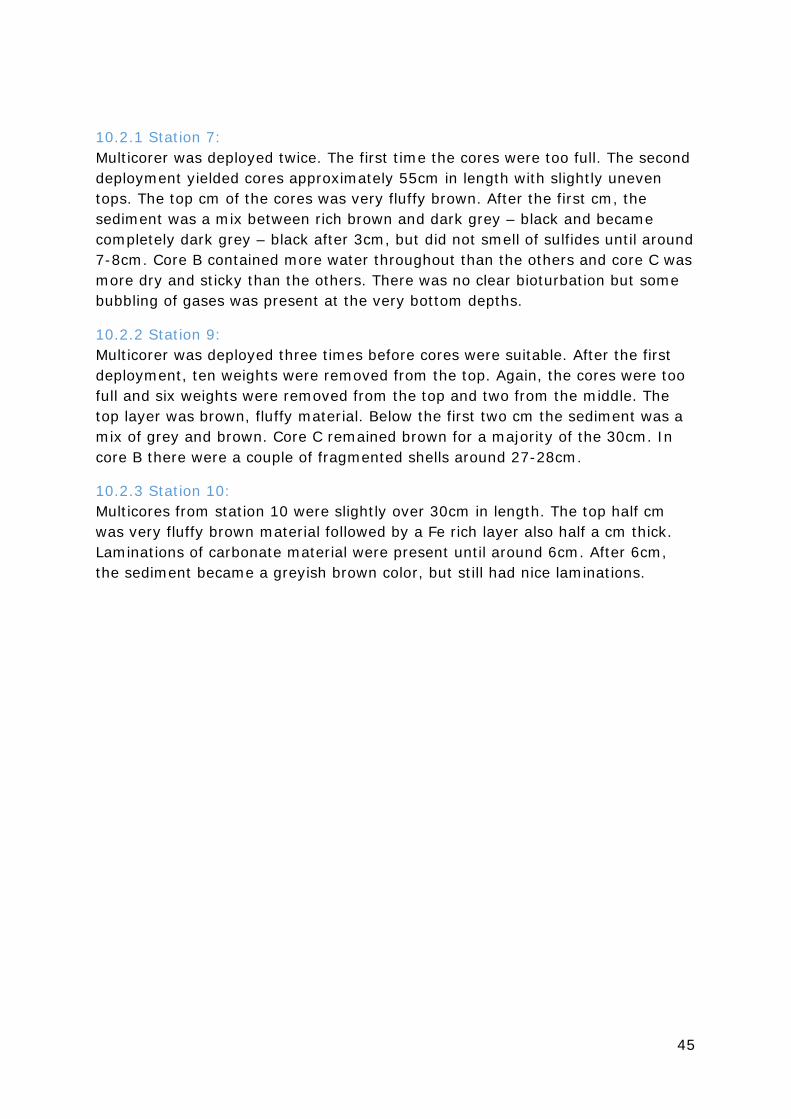
10.2.2 Station 9: Multicorer was deployed three times before cores were suitable. After the first deployment, ten weights were removed from the top. Again, the cores were too full and six weights were removed from the top and two from the middle. The top layer was brown, fluffy material. Below the first two cm the sediment was a mix of grey and brown. Core C remained brown for a majority of the 30cm. In core B there were a couple of fragmented shells around 27-28cm.
10.2.3 Station 10: Multicores from station 10 were slightly over 30cm in length. The top half cm was very fluffy brown material followed by a Fe rich layer also half a cm thick. Laminations of carbonate material were present until around 6cm. After 6cm, the sediment became a greyish brown color, but still had nice laminations.

46
Station 1 Station 2

47
Station 3 Station 4

48
Station 5 Station 6

49
Station 7 Station 10

50
Station 9 - top
Station 9 - bottom

51
11. Methane sampling Sigrid van Grinsven Methane samples were taken from both multicores and piston cores of stations 7, 9 and 10. Methane samples Station 7, multicore A Sample ID number Depth in core (cm) 5 1
6 3.5
7 6
8 8.5
9 11
10 13.5
11 16
12 18.5
13 21
14 23.5
15 26
16 28.5
17 31
18 33.5
19 36
20 38.5
21 41
22 43.5
Methane samples Station 7, multicore B Sample ID number Depth in core (cm) 7 0.5

52
8 3
9 5.5
10 8
11 10.5
12 13
13 15.5
14 18
15 20.5
16 23
17 25.5
18 28
19 30.5
20 33
21 35.5
22 38
Methane samples Station 7, piston core Sample ID number Depth in core (cm) 7 112
8 137
9 162
10 187
11 212
12 237
13 262
14 287
15 312

53
16 337
17 362
18 387
19 412
20 437
21 462
22 487
23 512
24 537
25 562
26 587
27 612
28 637
29 662
30 687
31 712
32 737
33 762
34 787
35 812
36 837
37 862
38 887
39 912
40 937
4 962
54
5 987
6 1012
Methane samples Station 9, multicore Sample ID number Depth in core (cm) 4 0.5
5 3
6 5.5
7 8
8 10.5
9 13
10 15.5
11 18
12 20.5
13 23
14 25.5
15 28
16 30.5
17 33
18 35.5
19 38
20 40.5
21 43
Methane samples Station 10, multicore Sample ID number Depth in core (cm) 3 0.5

55
4 3
5 5.5
6 8
7 10.5
8 13
9 15.5
10 18
11 20.5
12 23
13 25.5
14 28
15 30.5
16 33
17 35.5
Methane samples Station 9, piston core Sample ID number Depth in core (cm) -4 20
-3 45
-2 70
-1 95
0 120
1 145
2 170
3 195
4 220
5 245

56
6 270
7 295
8 320
9 345
10 370
11 395
12 420
13 445
14 470
15 495
16 520
17 545
18 570
19 595
20 620
21 645
22 670
23 695
24 720
25 745
26 770
27 795
28 820
29 845
30 870
31 895

57
32 920
33 945
34 970
35 995
36 1020
37 1045
38 1070
39 1095
40 1120
Methane samples Station 10, piston core Sample ID number Depth in core (cm) 2 18
3 43
4 68
5 93
6 118
7 143
8 168
9 193
10 218
11 243
12 268
13 293
14 318
15 343
16 368

58
17 393
18 418
19 443
20 468
21 493
22 518
23 543
24 568
25 593
26 618
27 643
28 668
29 693
30 718
31 743
32 768
33 793
34 818
35 843
36 868
37 893
38 918
39 943
40 968

59
12. Pore water sampling and sub-sampling Fatimah Sulu-Gambari, Rick Hennekam, Margriet Lantink, Sigrid van Grinsven
During the Baltic expedition (64PE410) 3 stations were sampled for pore water analyses. Both a piston core and a multicore were sampled for pore waters at Stations 7, 9, and 10. Either an approach using (1) Rhizons and/or (2) slicing in an anoxic glove bag with subsequent centrifugation were used for pore water extraction (see Sampling section below for further details per core). Pore water extraction was done directly after core recovery. Slicing and subsequent sub-sampling were performed at ±8 °C, both in N-flushed glove bags. Bottom waters (i.e. water on top of the sediments) were also sampled from the multi cores (labeled sample depth 0).
12.1 Methods
12.1.1 Glove bag sampling and centrifuge From multicores at Stations 7, 9, and 10, pore water samples were taken by slicing them inside a glove bag. The cores where pushed up vertically into the glovebox using a core pusher. Subsequently the core was sampled with the desired resolution of 1-cm for the top 30 cm’s. Caution was taken to avoid sampling sediment from the outer rim as this potentially contains relatively wet sediment from the surface that had been dragged along while the core is pushed into the sediment. The retrieved sediment was put into a Greiner tube and centrifuged at 3000 RPM for 15-30 minutes (depending on the amount of pore water recovered). After centrifugation the (pore) water from the Greiner tubes was decanted in a syringe and then filtered into a container, awaiting subsequent sub-sampling (see details below, done within 6 hours after pore water retrieval).
12.1.2 Rhizons Rhizons are made of a hydrophilic porous polymer tube, with a typical pore diameter of 0.1 μm, extended with a polyvinyl chloride tube. The outer diameter of a Rhizon is 2.4 mm, and the filter section has a length of 5 cm. To support the polymer, a wire is fixed to one end of the porous polymer. The fluid sampled from the sediment flows into the tiny space between the porous tube and the supporting wire. The pore size ensures the extraction of microbial- and colloidal-free, ready-to-analyze solutions (Seeberg-Elverfeldt et al., 2005). The Rhizons are distributed by Rhizosphere Research Products (Wageningen, NL). The Rhizon tube is pushed into the sediment and samples are obtained at the extraction points by weak negative pressure. During the cruise the Rhizons were pushed into the sediment via predrilled holes in the multi and piston core tubes. A negative pressure was obtained by a connection of the Rhizon, via a 3-way valve, to a pulled syringe, hold in position

60
with a wooden stick. The Rhizons were left with negative pressure for around 60 minutes. After the pore water extraction the 3-way valves were closed and the syringes were brought into a glove bag for subsampling done at 8°C.
12.1.3 Sub-sampling of pore waters After pore water recovery the samples were sub-sampled in an N-flushed glove bag. The amounts of pore water collected varied and therefore sub-sampling was done using (generally) the following priority of the several treatments: SO4 > HS > Metals > N species > PO4 + Si > DIC > Alkalinity. Only for the piston core of Station 10 this priority list was altered (first N Species then Metals) because of a limited amount of glass vials left. The general scheme for the sub-sampling of the porewater samples can be seen in Table PW-1. Table PW-1. Scheme of pore water treatment
Analysis ml sampled
Vial Treatment Code Method Storage
SO4 0.5 Glass None IC NIOZ -20°C HS 0.5 Glass 1.5 ml 8 mmol/L
NaOH HS Onboar
d Sharyn
4°C
Metals (trace to major elements)
1 15 ml Greiner 10 μl Suprapur 30% HCl
ME NIOZ -20°C
N Species (NH4, NO3, NO2)
0.5 Pony None NSPEC Onboard Sharyn
-20°C
PO4, Silica 1 Pony 5 μl 5 M HCl PO4, Si Onboard Sharyn
4°C
DIC 0.5 Glass First sampe, then added 4,5 ml saturated NaCl solution
DIC Onboard Sharyn
4°C
Alkalinity >1 50 ml Greiner (left over)
None ALK/BULK
Onboard Titration
4°C
12.2 Sampling of pore waters The multi and piston cores of Stations 7, 9, and 10 were sampled for pore waters. Station 7 Cast 13 Multi Core has been done by both Rhizon sampling and slicing+centrifuge sampling. For all other cores one of the two pore water extraction methods were used. On the following pages per core a table is given for the samples taken and the sub-sampling performed on these samples.

61
Station 7 Cast 8 Piston Core Core Section
Sample Depth in Section (cm)
Depth in Core (cm)
Method SO4 HS Metals N species
PO4
+ Si DIC Alk
12 1 9.5 49.5 Rhizon X X X X - - - 12 2 34.5 74.5 Rhizon X X X X - - - 12 3 59.5 99.5 Rhizon X X X X - - - 12 4 84.5 124.5 Rhizon X X X X - - - 11 5 9.5 149.5 Rhizon X X X - - - - 11 6 34.5 174.5 Rhizon X X X X - - - 11 7 59.5 199.5 Rhizon X X X - - - - 11 8 84.5 224.5 Rhizon X X X X - - - 10 9 9.5 249.5 Rhizon X X X X - - - 10 10 34.5 274.5 Rhizon X X X - - - - 10 11 59.5 299.5 Rhizon X X X X - - - 10 12 84.5 324.5 Rhizon X X X X - - - 9 13 9.5 349.5 Rhizon X - - - - - - 9 14 34.5 374.5 Rhizon X - - - - - - 9 15 59.5 399.5 Rhizon X X X - - - - 9 16 84.5 424.5 Rhizon X X X - - - - 8 17 9.5 449.5 Rhizon X X X X - - - 8 18 34.5 474.5 Rhizon X X X - - - - 8 19 59.5 499.5 Rhizon X - - - - - - 8 20 84.5 524.5 Rhizon X - - - - - - 7 21 9.5 549.5 Rhizon X X X X - - - 7 22 34.5 574.5 Rhizon X X X X - - - 7 23 59.5 599.5 Rhizon X X X X - - - 7 24 84.5 624.5 Rhizon X X X - - - - 6 25 9.5 649.5 Rhizon X - - - - - - 6 26 34.5 674.5 Rhizon X X X - - - - 6 27 59.5 699.5 Rhizon X X X - - - - 6 28 84.5 724.5 Rhizon X - - - - - - 5 29 9.5 749.5 Rhizon X - - - - - - 5 30 34.5 774.5 Rhizon X - - - - - - 5 31 59.5 799.5 Rhizon X X X - - - - 5 32 84.5 824.5 Rhizon X X X - - - - 4 33 9.5 849.5 Rhizon X - - - - - - 4 34 34.5 874.5 Rhizon X X X - - - - 4 35 59.5 899.5 Rhizon X X X X - - - 4 36 84.5 924.5 Rhizon X X X - - - -
62
Station 7 Cast 13 Multi Core (Rhizon Sampling) Sample Depth from sediment-
water interface (cm) Method SO4 HS Metals N
species PO4 + Si
DIC Alk
0 -0.8 Rhizon X X X X X X X 1 1.2 Rhizon X X X X X X X 2 3.2 Rhizon - - - - - - - 3 5.2 Rhizon X X X X X X X 4 7.2 Rhizon X X X X - - - 5 9.2 Rhizon X X X X X X X 6 11.2 Rhizon X X X X X X X 7 13.2 Rhizon X X X X X X X 8 15.2 Rhizon X X X X X X - 9 17.2 Rhizon X X X X - - - 10 18.2 Rhizon X X X X X X - 11 19.2 Rhizon X X X X X - - 12 20.2 Rhizon X X - - - - - 13 21.2 Rhizon X X - X - - - 14 22.2 Rhizon X X X X X X - 15 26.2 Rhizon X X X X - - X 16 27.2 Rhizon X X X X - - - 17 28.2 Rhizon X X X - - - - 18 29.2 Rhizon X X - X - - - 19 31.2 Rhizon X X X - - - - 20 33.2 Rhizon X X - X - - - 21 34.2 Rhizon X X X - - - - 22 37.2 Rhizon X X - X - - - 23 39.2 Rhizon X X - X - - - 24 41.2 Rhizon X X - X - - - 25 43.2 Rhizon X - - - - - - 26 45.2 Rhizon X X - X - - - 27 47.2 Rhizon X - - X - - - 28 49.2 Rhizon X X - X - - -

63
Station 7 Cast 13 Multi Core (Slicing+Centrifuge Sampling) Sample Depth from sediment-
water interface (cm) Method SO4 HS metals N
species PO4 + Si
DIC Alk
0 -1 Centrif. X X X X X X X 1 1 Centrif. X X X X X X X 2 2 Centrif. X X X X X X X 3 3 Centrif. X X X X X X X 4 4 Centrif. X X X X X X X 5 5 Centrif. X X X X X X X 6 6 Centrif. X X X X X X X 7 7 Centrif. X X X X X X X 8 8 Centrif. X X X X X X X 9 9 Centrif. X X X X X X X 10 10 Centrif. X X X X X X X 11 11 Centrif. X X X X X X - 12 12 Centrif. X X X X X X X 13 13 Centrif. X X X X X X X 14 14 Centrif. X X X X X X X 15 15 Centrif. X X X X X X X 16 16 Centrif. X X X X X X X 17 17 Centrif. X X X X X X X 18 18 Centrif. X X X X X X X 19 19 Centrif. X X X X X X X 20 20 Centrif. X X X X X X X 21 21 Centrif. X X X X X X X 22 22 Centrif. X X X X X X X 23 23 Centrif. X X X X X X X 24 24 Centrif. X X X X X X X 25 25 Centrif. X X X X X X X 26 26 Centrif. X X X X X X - 27 27 Centrif. X X X X X X X

64
Station 9 Cast 5 Multi Core Sample Depth from sediment-
water interface (cm) Method SO4 HS metals N
species PO4 + Si
DIC Alk
0 -1 Rhizon X X X X X X X 1 1 Rhizon X X X X X X X 2 3 Rhizon X X X X X X X 3 5 Rhizon X X X X X X X 4 7 Rhizon X X X X X X X 5 9 Rhizon X X X X X X X 6 11 Rhizon X X X X X X X 7 13 Rhizon X X X X X X X 8 15 Rhizon X X X X X X X 9 17 Rhizon X X X X X X X 10 19 Rhizon X X X X X X X 11 21 Rhizon X X X X X X - 12 27 Rhizon X X X X X X - 13 29 Rhizon X X X X X X - 14 31 Rhizon X X X X X X - 15 33 Rhizon X X X X X X - 16 35 Rhizon X X X X - X - 17 37 Rhizon X X X X X - - 18 39 Rhizon X X X X X - - 19 41 Rhizon X X X X X X - 20 43 Rhizon X X X X X X - 21 45 Rhizon X X X X X X - 22 47 Rhizon X X X - - - - 23 49 Rhizon X X X X X X -

65
Station 9 Cast 8 Piston Core Core Section
Sample Depth in Section (cm)
Depth in Core (cm)
Method SO4 HS metals N species
PO4 + Si
DIC Alk
15 1 5 5 Centrif. X X X X X X X
15 2 20 20 Centrif. X X X X X X X
14 3 20 60 Centrif. X X X X X - -
14 4 40 80 Centrif. X X X X X - -
14 5 60 100 Centrif. X X X X X - -
14 6 80 120 Centrif. - - - - - - -
13 7 20 160 Centrif. - - - - - - -
13 8 40 180 Centrif. - - - - - - -
13 9 60 200 Centrif. - - - - - - -
13 10 80 220 Centrif. - - - - - - -
12 11 20 260 Centrif. - - - - - - -
12 12 40 280 Centrif. - - - - - - -
12 13 60 300 Centrif. - - - - - - -
12 14 80 320 Centrif. - - - - - - -
11 15 20 360 Centrif. - - - - - - -
11 16 40 380 Centrif. - - - - - - -
11 17 60 400 Centrif. - - - - - - -
11 18 80 420 Centrif. - - - - - - -
10 19 20 460 Centrif. - - - - - - -
10 20 40 480 Centrif. - - - - - - -
10 21 60 500 Centrif. - - - - - - -
10 22 80 520 Centrif. - - - - - - -
9 23 20 560 Centrif. - - - - - - -
9 24 40 580 Centrif. - - - - - - -
9 25 60 600 Centrif. - - - - - - -
9 26 80 620 Centrif. - - - - - - -
8 27 20 660 Centrif. - - - - - - -
8 28 40 680 Centrif. - - - - - - -
8 29 60 700 Centrif. - - - - - - -
8 30 80 720 Centrif. - - - - - - -
7 31 20 760 Centrif. - - - - - - -

66
7 32 40 780 Centrif. - - - - - - -
7 33 60 800 Centrif. - - - - - - -
7 34 80 820 Centrif. - - - - - - -
6 35 20 860 Centrif. - - - - - - -
6 36 40 880 Centrif. - - - - - - -
6 37 60 900 Centrif. - - - - - - -
6 38 80 920 Centrif. - - - - - - -
5 39 20 960 Centrif. - - - - - - -
5 40 40 980 Centrif. - - - - - - -
5 41 60 1000 Centrif. - - - - - - -
5 42 80 1020 Centrif. - - - - - - -
4 43 20 1060 Centrif. - - - - - - -
4 44 40 1080 Centrif. - - - - - - -
4 45 60 1100 Centrif. - - - - - - -
4 46 80 1120 Centrif. - - - - - - -

67
Station 10 Cast 4 Multi Core Sample Depth from sediment-
water interface (cm) Method SO4 HS metals N
species PO4 + Si
DIC Alk
0 -1 Centrif. X X X X X X X 1 1 Centrif. X X X X X X X 2 2 Centrif. X X X X X X X 3 3 Centrif. X X X X X X X 4 4 Centrif. X X X X X X X 5 5 Centrif. X X X X X X X 6 6 Centrif. X X X X X X X 7 7 Centrif. X X X X - - - 8 8 Centrif. X X X X X X X 9 9 Centrif. X X X X X X X 10 10 Centrif. X X X X X X X 11 11 Centrif. X X X X X X X 12 12 Centrif. X X X X X X X 13 13 Centrif. X X X X X X X 14 14 Centrif. X X X X X X X 15 15 Centrif. X X X X X X X 16 16 Centrif. X X X X X X X 17 17 Centrif. X X X X X X X 18 18 Centrif. X X X X X X X 19 19 Centrif. X X X X X X X 20 20 Centrif. X X X X X X X 21 21 Centrif. X X X X X X X 22 22 Centrif. - - - - - - - 23 23 Centrif. X X X X X X X 24 24 Centrif. X X X X X X X 25 25 Centrif. X X X X X X X 26 26 Centrif. X X X X X X X 27 27 Centrif. X X X X X X X 28 28 Centrif. X X X X X X X 29 29 Centrif. X X X X X X - 30 30 Centrif. X X X X - - -

68
Station 10 Cast 11 Piston Core
Core Section
Sample Depth in Section (cm)
Depth in Core (cm)
Method SO4 HS metals N species
PO4 + Si
DIC Alk
16 1 10 8 Centrif. X X X X X X X
16 2 35 33 Centrif. X X X X X - X
16 3 60 58 Centrif. X X X X X X -
16 4 85 83 Centrif. X X - - - - -
15 5 10 108 Centrif. X X - - - X -
15 6 35 133 Centrif. X X - - - X -
15 7 60 158 Centrif. X X - - - - -
15 8 85 183 Centrif. X - - - - - -
14 9 10 208 Centrif. - - - - - - -
14 10 35 233 Centrif. X - - - - - -
14 11 60 258 Centrif. X* - - - - - -
14 12 85 283 Centrif. - - - - - - -
13 13 10 308 Centrif. X* - - - - - -
13 14 35 333 Centrif. X* - - - - - -
13 15 60 358 Centrif. X* - - - - - -
13 16 85 383 Centrif. - - - - - - -
12 17 10 408 Centrif. X* - - - - - -
12 18 35 433 Centrif. - - - - - - -
12 19 60 458 Centrif. - - - X - X -
12 20 85 483 Centrif. - - - X* - X -
11 21 10 508 Centrif. - - - X - X -
11 22 35 533 Centrif. - - - X - - -
11 23 60 558 Centrif. - - - X* - X -
11 24 85 583 Centrif. - - - X* - - -
10 25 10 608 Centrif. - - - X* - - -
10 26 35 633 Centrif. - - - X* - - -
10 27 60 658 Centrif. - - - X* - - -
10 28 85 683 Centrif. - - - X* - - -
9 29 10 708 Centrif. - - - X* - - -
9 30 35 733 Centrif. - - - X* - - -

69
9 31 60 758 Centrif. - - - X* - - -
9 32 85 783 Centrif. - - - X* - - -
8 33 10 808 Centrif. - - - X* - - -
8 34 35 833 Centrif. - - - X* - - -
8 35 60 858 Centrif. - - - X* - - -
8 36 85 883 Centrif. - - - X* - - -
7 37 10 908 Centrif. - - - X* - - -
7 38 35 933 Centrif. - - - X* - - -
7 39 60 958 Centrif. - - - X* - - -
7 40 85 983 Centrif. - - - X* - - -
* <0.5 ml but still sub-sampled
12.3 References Seeberg-Elverfeldt, J., Schlüter, M., Feseker, T., Kölling, M., 2005. Rhizon sampling of porewaters near the sediment-water interface of aquatic systems. Limnology and Oceanography: Methods, 3, 361-371

70
13. In situ pump filter and water column collection from Arkona Basin and Gotland Deep for incubation of aerobic methane oxidisers (to be done at NIOZ) Darci Rush
13.1 Research questions: 1) What microbes (specifically aerobic methane oxidising bacteria) are
oxidizing the methane that diffuses/bubbles from the anoxic water/sediments into the oxic water column of Baltic Basins?
2) Do these bacteria produce specific biomarker lipids that we can use to trace past methane oxidation (e.g. bacteriohopanepolyol lipids)?
3) What effects do changes in environmental conditions have on the bacterial populations and their lipids?
To this end, we will analyse the bacteria population and lipid signatures of the oxic water column directly above methane influenced sediment (Arkona) and water (Gotland). Additionally, we will set up incubation experiments at NIOZ to determine effects changes in environmental conditions (e.g Temperature, pH, methane concentration) have on these bacteria.
13.2 Material retrieved: 22-05-2016:
13.2.1 Arkona Basin: 54º 55.208 N, 13º 29.992 E Station 8, Cast 2, 4 and 5
The location of the site for Arkona Basin water and filter collection was decided based on a long-term monitoring site (TF0113) where active methane seepage into the water column had been reported (Gülzow et al., 2013). We did not detect methane in the water column using either real-time multibeam scanning or FishFinder. However, it is possible that methane was diffusing and not creating bubbles. We collected water and filters at the lowest possible depth that the CTD could get to the sediment water interface (43.4 m water depth, which was 10 m above the sediment at 53.4 m)
Collection:
6 filters (2 deployments of in situ pumps) were pumped for 1 hour at 43.4 m water depth VOLUME of water filtered from section 9
2 Niskin Bottles were filled at the same depth
- 10L of in situ water was stored at +4ºC to be used in the setup of the incubation experiments
- 3x 60 mL of water was collected and killed with ca. 200 µL of HgCl to kill any activity, to be analysed for initial methane concentration

71
- 5 of filters were submerged in a minimum amount of water from the Niskin bottle fired at the same depth (ca. 400 mL) and stored at +4ºC to be used once back at NIOZ
- 1 filter was frozen at -80ºC to be used for lipid and DNA analyses
26-05-2016:
13.2.2 Gotland Deep: 57º 12.734 N, 19º 56.968 E Station 10, Cast 14
Collection:
3 filters (1 deployments of in situ pumps) were pumped for 1 hour at the oxic/anoxic transtition zone (at 68.4 m water depth) Volume of water filtered
>10 Niskin Bottles were filled at the same depth
- 10L of in situ water was stored at +4ºC to be used in the setup of the incubation experiments at NIOZ
- 3x 60 mL of water was collected and killed with ca. 200 µL of HgCl to kill any activity, to be analysed for initial methane concentration

72
- all 3 of filters were submerged in a minimum amount of water from the Niskin bottle fired at the same depth (ca. 400 mL) and stored at +4ºC to be used once back at NIOZ
- To maximise the amount of material used for incubation set ups and be able to start our transit to Port, instead of using one of the in situ pump filters for DNA/lipid analyses, we filtered 9 x ca. 7L of in situ water on 3 filtration units. These filter was frozen at -80ºC to be used for lipid and DNA analyses
13.3 REFERENCES Gülzow, w., Rehder, G., Schneider v. Deimling, J., Seifert, T., and Toth Z. (2013). One year of continuous measurements constraining methane emissions from the Baltic Sea to the atmosphere using a ship of opportunity. Biogeosciences 10, 81-99.

73
14. TA, DIC, pH and CO32- profiles Alice Webb & Sharyn Ossebaar
The progressive mineralisation of organic matter that occurs at depth in the Baltic, together with the generally low buffer capacity in low salinity waters results in a low pH environment. This cruise offers nice gradients in pH, carbonate ions, TCO2 and Total Alkalinity to test and try out new equipment. Our specific objectives includes:
- Describe the chemical characteristics (CO2 and nutrient) across a salinity gradient
- Test novel spectrophotometry method for the analysis of pH and carbonate ions
- Compare DIC analysed with a coulometric method (VINDTA) and DIC measured with AIRICA
- Compare calculated pH (Seacarb package, R) and measured pH (SPEC)
At all ten stations, water samples were taken from the CTD rosette sampler at depths throughout the water column. Total CO2 (CT also known as DIC) and Total Alkalinity were measured using a VINDTA instrument (MARIANDA, Kiel). The accuracy is set by internationally recognised and widely used certified reference material (CRM, Dickson). CT is the sum of all dissolved inorganic species and is determined by a precise coulometric method. For every coulometric cell used in the coulometer (~1 per day), two CRMs were measured in duplicate at the beginning and the end of the analyses. The alkalinity measurements were performed by potentiometric titration with a strong acid (HCL) as a titrant. The acid consumption up to the second end point is equivalent to the titration alkalinity. The system includes a Metrohm Titrino for precise continuous additions of acid, a pH measurement electrode and a reference electrode. The measurement temperature was kept at 25 C. Analysis of samples were carried out straight after sampling. A total of 161 analyses were carried out on the VINDTA.
DIC was also measured using the AIRICA system which uses a high precision syringe pump to deliver the exact amount of sample to a stripper. CO2 is liberated from the sample by acidification and is transported by a stream of carrier gas. The latter passes through a LICOR non-dispersive IR gas analyser , where CO2 concentration in the gas is measured. The integration of the resulting peak is directly proportional to the amount of CO2 extracted from the sample.
pH and CO32- profiles were measured using a precise automated
spectrophotometric pH measurement system.
DIC and TA were then used to calculate pH with SeaCarb package from the R software. This will allow us to compare calculated pH and measured pH.

74
Station Cast date Niskin bottle Depth Temp Salinity VINDTA Spec pH
Spec CO32-
Airica DIC
1 2 18/05/2016 1CRM1a x x
1 2 18/05/2016 1CRM1b x x
1 2 18/05/2016 1 A1 533 6.94 35 x x x x
1 2 18/05/2016 1 B1 533 6.94 35 x x
1 2 18/05/2016 2 A2 533 6.94 35 x x
1 2 18/05/2016 3 A3 400 6.98 35 x x
1 2 18/05/2016 4 A4 400 6.98 35 x x
1 2 18/05/2016 4 B2 400 6.98 35 x x
1 2 18/05/2016 6 A6 324.8 7.03 35 x x
1 2 18/05/2016 8 A8 248.5 6.96 35 x x
1 2 18/05/2016 10 A10 199.5 6.98 35 x x
1 2 18/05/2016 12 A12 150.1 6.84 35 x x x x
1 2 18/05/2016 12 A13 150.1 6.84 35 x x
1 2 18/05/2016 14 A14 100.1 6.8 35 x x
1 2 18/05/2016 16 A16 80.1 6.8 35 x x
1 2 18/05/2016 18 A18 55.1 7.08 35 x x x x
1 2 18/05/2016 20 A20 40.1 7.13 35 x x
1 2 18/05/2016 22 B3 24.4 8.1 35 x x
1 2 18/05/2016 24 B4 10.1 10.73 35 x x x x
1 2 18/05/2016 24 A15 10.1 10.73 35 x x
2 2 18/05/2016 1 A1 40 x x x x
2 2 18/05/2016 1 A3 40 x x
2 2 18/05/2016 1 A2 40 x x
2 2 18/05/2016 4 A4 30 x x x x
2 2 18/05/2016 7 A5 20 x x x x
2 2 18/05/2016 10 A6 15 x x
2 2 18/05/2016 13 A7 10 x x x x
2 2 18/05/2016 16 A8 5 x x
2 2 18/05/2016 16 A9 5 x x

75
2 2 18/05/2016 16 A10 5 x x
2 2 18/05/2016 2CRM1a x x
2 2 18/05/2016 2CRM1b x x
3 2 19/05/2016 3CRM1a x x
3 2 19/05/2016 3CRM1b x x
3 2 19/05/2016 1 A1 31.4 33.6 x x x x
3 2 19/05/2016 1 A2 31.4 33.6 x x
3 2 19/05/2016 4 A4 24.8 33.4 x x x x
3 2 19/05/2016 7 A5 20.3 32.7 x x x x
3 2 19/05/2016 10 A6 14.9 25.4 x x
3 2 19/05/2016 13 A7 10.2 17.8 x x x x
3 2 19/05/2016 16 A8 4.7 16.1 x x x x
3 2 19/05/2016 16 A9 4.7 16.1 x x
3 2 19/05/2016 16 A9 4.7 16.1 x x
4 2 19/05/2016 1 A1 23.6 5.6 33.97 x x x
4 2 19/05/2016 4 A2 23.6 5.6 33.97 x x x
4 2 19/05/2016 7 A4 19.8 5.6 33.95 x x x
4 2 19/05/2016 10 A5 14.5 6.54 28.45 x x x
4 2 19/05/2016 13 A7 9.8 8.7 20.4 x x x
4 2 19/05/2016 16 A8 4.8 10.74 17.5 x
4 2 19/05/2016 19 A9 4.8 10.74 17.5 x
4 2 19/05/2016 3CRM2a x
4 2 19/05/2016 3CRM2b x
5 2 20/05/2016 4CRM1a 35 x
5 2 20/05/2016 4CRM1b 35 x
5 2 20/05/2016 1 38.1 33.7 x x x
5 2 20/05/2016 1 38.1 35 x
5 2 20/05/2016 1 38.1 33.7 x
5 2 20/05/2016 4 30.4 33.6 x x x
5 2 20/05/2016 4 30.4 33.1 x
5 2 20/05/2016 7 24.9 33.1 x x x

76
5 2 20/05/2016 10 20.1 32.6 x x x
5 2 20/05/2016 10 20.1 32.6 x
5 2 20/05/2016 13 15 22 x x x
5 2 20/05/2016 16 9.8 19.5 x x x
5 2 20/05/2016 19 4.8 18.5 x x x
5 2 20/05/2016 19 4.8 18.5 x
5 2 20/05/2016 19 5.8 17.5 x
6 2 20/05/2016 3 20.6 33.46 x x x
6 2 20/05/2016 3 20.6 33.1 x
6 2 20/05/2016 3 20.6 33.46 x
6 2 20/05/2016 6 14.6 22.2 x x x
6 2 20/05/2016 6 14.6 22.2 x
6 2 20/05/2016 9 10 15.49 x x x
6 2 20/05/2016 9 10 15.49 x
6 2 20/05/2016 9 10 15.49 x
6 2 20/05/2016 12 4.6 12.15 x x x
6 2 20/05/2016 12 4.6 12.15 x
6 2 20/05/2016 12 4.6 12.15 x
6 2 20/05/2016 12 4.6 12.15 x
6 2 20/05/2016 4CRM2a 35 x
6 2 20/05/2016 4CRM2b 35 x
7 9 21/05/2016 5CRM1a 35 x x
7 9 21/05/2016 5CRM1b 35 x x
7 9 21/05/2016 4 40.1 6 17.47 x x x x
7 9 21/05/2016 4 40.1 6 17.47 x x
7 9 21/05/2016 4 40.1 6 17.47 x x
7 9 21/05/2016 4 40.1 6 17.47 x x
7 9 21/05/2016 4 40.1 6 17.47 x x
7 9 21/05/2016 7 35.6 6 14.4 x x x x
7 9 21/05/2016 10 29.7 5.95 11 x x x x
7 9 21/05/2016 13 24.3 5.94 9.65 x x x x

77
7 9 21/05/2016 16 14.2 10.04 8.34 x x x x
7 9 21/05/2016 19 4.6 11.9 8.16 x x x x
7 9 21/05/2016 19 4.6 11.9 8.16 x x
7 9 21/05/2016 19 4.6 11.9 8.16 x x
7 9 21/05/2016 5CRM2a 34 x x
7 9 21/05/2016 5CRM2b 34 x x
8 2 22/05/2016 6CRM1a 35 x x
8 2 22/05/2016 6CRM1b 35 x x
8 2 22/05/2016 7 43.4 5.61 17.05 x x x x
8 2 22/05/2016 7 43.4 5.61 17.05 x x
8 2 22/05/2016 7 43.4 5.61 17.05 x x
8 2 22/05/2016 7 43.4 5.61 17.05 x x
8 2 22/05/2016 10 30.1 5.99 11.2 x x x x
8 2 22/05/2016 10 30.1 5.99 11.2 x x
8 2 22/05/2016 13 24.1 6.11 10.02 x x x x
8 2 22/05/2016 16 18 6.44 8.28 x x x x
8 2 22/05/2016 16 9.3 6.44 8.28 x x
8 2 22/05/2016 22 4.9 11.4 8.14 x x x x
8 2 22/05/2016 19 9.3 10.86 8.14 x x x x
8 2 22/05/2016 22 4.9 11.4 8.14 x x
8 2 22/05/2016 7CRM2a 33.3 x x
8 2 22/05/2016 7CRM2b 33.3 x x
9 2 23/05/2016 5 77 6.95 18.44 x x x x
9 2 23/05/2016 5 77 6.95 18.44 x x
9 2 23/05/2016 5 77 6.95 18.44 x x
9 2 23/05/2016 5 77 6.95 18.44 x x
9 2 23/05/2016 8CRM1a 33.3 x x
9 2 23/05/2016 8CRM1b 33.3 x x
9 2 23/05/2016 5 77 6.95 18.44 x x
9 2 23/05/2016 7 59 5.64 13.42 x x x x
9 2 23/05/2016 7 59 5.64 13.42 x x

78
9 2 23/05/2016 10 45 5.82 10.58 x x x x
9 2 23/05/2016 13 35 5.46 8.55 x x x x
9 2 23/05/2016 13 35 5.46 8.55 x x
9 2 23/05/2016 16 23 8.5 8.04 x x x x
9 2 23/05/2016 20 5 10.63 7.82 x x x x
9 2 23/05/2016 20 5 10.63 7.82 x x
9 2 23/05/2016 20 5 10.63 7.82 x x
9 2 23/05/2016 8CRM2a 35 x x
9 2 23/05/2016 8CRM2b 35 x x
10 2 25/05/2016 9CRM1a 35 x x
10 2 25/05/2016 9CRM1b 35 x x
10 2 25/05/2016 16 4 11.11 6.95 x x x
10 2 25/05/2016 16 4 11.11 6.95 x x
10 2 25/05/2016 14 14 6.4 6.95 x x x
10 2 25/05/2016 14 14 6.4 6.95 x x
10 2 25/05/2016 12 24 5.08 7.07 x x x
10 2 25/05/2016 10 50 4.75 7.2 x x x
10 2 25/05/2016 8 60 4.04 7.39 x x x
10 2 25/05/2016 6 72 5.2 9.2 x x x
10 4 25/05/2016 7 101 6.08 11.74 x x x
10 2 25/05/2016 3 150 6.89 12.82 x x x
10 2 25/05/2016 1 200 7.1 13.48 x x x
10 2 25/05/2016 1 200 7.1 13.48 x x
10 2 25/05/2016 33.3 x x
10 2 25/05/2016 33.3 x x
10 2 25/05/2016 1 200 7.1 0 x x
10 2 25/05/2016 1 200 7.1 13.48 x x
10 2 25/05/2016 3 150 6.89 12.82 x x
10 4 25/05/2016 5 101 6.08 11.74 x x
10 2 25/05/2016 6 72 5.2 9.2 x x
10 2 25/05/2016 8 60 4.04 7.39 x x

79
10 2 25/05/2016 10 50 4.75 7.2 x x
10 2 25/05/2016 12 24 5.08 7.07 x x
10 2 25/05/2016 14 14 6.4 6.95 x x
10 2 25/05/2016 16 4 11.11 6.95 x x
10 2 25/05/2016 33.3 x x
10 2 25/05/2016 33.3 x x

80
15. LGR Gabriella Weiss
Samples were collected hourly during transits between stations for future water isotope analysis on the LGR-Liquid Water Isotope Analyzer back at NIOZ.
(See tables below).

81
TRANSIT 1: North Sea to St. 1: 17/05/2016
TRANSIT 2: St. 1 to St. 2: 18/05/2016
TRANSIT 3: St. 2 to St. 3: 18 - 19/05/2016
Name Ship time UTC Name Ship time UTC Name Ship time UTC
T1.1 14:06 12:06 T2.1 10:30 8:30 T3.1 23:35 21:35
T1.2 15:00 13:00 T2.2 11:30 9:30 T3.2 0:30 22:30
T1.3 16:00 14:00 T2.3 12:28 10:28 T3.3 1:25 23:25
T1.4 17:00 15:00 T2.4 13:28 11:28 T3.4 2:30 0:30
T1.5 17:56 15:56 T2.5 14:29 12:29 T3.5 4:30 2:30
T1.6 19:00 17:00 T2.6 15:30 13:30 T3.6 6:50 4:50
T1.7 20:00 18:00 T2.7 16:34 14:34
T1.8 21:00 19:00 T2.8 17:45 15:45
T1.9 22:00 20:00
T1.10 23:00 21:00
T1.11 0:00 22:00
TRANSIT 4: St. 3 to St. 4: 19/05/2016
TRANSIT 5: St. 4 to St. 5: 19-20/05/2016
TRANSIT 7: St. 6 to St. 7: 20-21/05/2016
Name Ship time UTC Name Ship time UTC Name Ship time UTC
T4.1 13:30 11:30 T5.1 21:25 T7.1 17:01 13:01
T4.2 14:30 12:30 T5.2 22:29 T7.2 18:32 14:32
T4.3 15:30 13:30 T5.3 23:27 T7.3 18:50 14:50
T4.4 16:29 14:29 T5.4 0:30 T7.4 19:59 17:59
T7.5 20:58 18:58
TRANSIT 6: St 5 to St.
6: 20/05/2016 T7.6 22:58 20:58
Name Ship time UTC T7.7 0:03 22:03
T6.1 9:10 7:10

82
Transit 8: St. 8 to St. 9: 22 - 23/05/2016
Transit 9: St. 9 to St. 10: 24 - 25/05/2016
Transit 10: St. 10 to Harbour: 26 - 27/05/2016
Name Ship time UTC Name Ship time UTC Name Ship time UTC
T8.1 23:36 19:36 T9.1 9:00 7:00 T10.1 18:30 16:30
T8.2 0:26 22:26 T9.2 9:59 7:59 T10.2 20:30 18:30
T8.3 1:31 23:31 T9.3 11:00 9:00 T10.3 21:26 19:26
T8.4 2:24 0:24 T9.4 12:00 10:00 T10.4 23:27 21:27
T8.5 3:31 1:31 T9.5 12:59 10:59 T10.5 0:31 22:31
T8.6 4:30 2:30 T9.6 14:03 12:03 T10.6 1:31 23:31
T9.7 15:00 13:00 T10.7 2:31 0:31
T9.8 skipped T10.8 3:29 1:29
T9.9 17:00 15:00 T10.9 4:30 2:30
T9.10 18:00 16:00 T10.10 5:27 3:27
T9.11 19:00 17:00 T10.11 6:32 4:32
T9.12 20:00 18:00 T10.12 7:32 5:32
T9.13 21:04 19:04 T10.13 8:31 6:31
T9.14 22:30 20:30
T9.15 23:15 21:15
T9.16 0:01 22:01
T9.17 1:00 23:00
T9.18 2:01 0:01
T9.19 3:12 1:12
T9.20 3:59 1:59

83
16. Alkalinity Titrations – Pore water Gabriella Weiss
Alkalinity from pore water extractions was determined by titrations with 0.01 M HCl on 1 mL of pore water. Below are the results (for sample # see porewaters subsampling, section 12) .
St. 7: Arkona Basin Rhizons
0
2
4
6
8
10
12
14
16
0 5 10 15 20 25
sam
ple
#
Alkalinity
St. 7: Arkona Basin - Multicore Centrifuge
0
5
10
15
20
25
30
0 5 10 15 20 25 30 35
sam
ple
#
Alkalinity

84
St. 9: Bornholm Basin – Multicore Rhizons
0
2
4
6
8
10
12
0 2 4 6 8 10 12sa
mpl
e #
Alkalinity
St. 9: Bornholm Basin - Piston Core
0
2
4
6
8
10
12
18 19 19 20 20 21
sam
ple
#
Alkalinity

85
St. 10: Gotland Basin – Multicore Centrifuge
0
5
10
15
20
25
30
0 1 1 2 2 3 3 4sa
mpl
e #
Alkalinity
St. 10: Gotland Basin – Piston Core
0
1
2
3
0 1 1 2 2 3 3
sam
ple
#
Alkalinity

86
Appendix 1: CTD casts as filled out during cruise STATION 1
CAST 2
Date 18-05-2016
location 58°29.761’N 9°35.906’E
max depth 550
surface temp 11.5
BOTTLE Depth (m) temp. Sal. Remark
1 533 6.94
2 533 6.94
3 400 6.98
4 400 6.98
5 324.8 7.03
6 324.8 7.03
7 248.5 6.96
8 248.5 6.96
9 199.5 6.98 O2 dip
10 199.5 6.98 O2 dip
11 150.1 6.84
12 150.1 6.84
13 100.1 6.80
14 100.1 6.80
15 80.1 6.80 O2 peak
16 80.1 6.80 O2 peak
17 55.1 7.08 Small O2 and fluorescence peak
18 55.1 7.08 Small O2 and fluorescence peak
19 40.1 7.13 20 40.1 7.13 21 24.4 8.10 fluorescence peak
22 24.4 8.10 fluorescence peak
23 10.1 10.73 24 10.1 10.73

87
STATION 2
CAST 2
Date 18-05-2016
location 57°45.896’N 11°7.003’E
max depth (m) 44
surface temp (°C) 11.5
BOTTLE Depth (m) temp. Sal. Remark
1 40 7.6 34
2 40 7.6 34
3 40 7.6 34
4 30 7.87 33.97
5 30 7.87 33.97
6 30 7.87 33.97
7 20.2 8.28 33.50 O2 sub max + fluorescence peak
8 20.2 8.28 33.50 O2 sub max + fluorescence peak
9 20.2 8.28 33.50 O2 max + fluorescence peak
10 14.9 8.67 32.72 O2 maximum + fluorescence peak
11 14.9 8.67 32.72 O2 maximum + fluorescence peak
12 14.9 8.67 32.72 O2 maximum + fluorescence peak
13 10 10.69 28.79 O2 max
14 10 10.69 28.79 O2 max
15 10 10.69 28.79 O2 max
16 5.2 11.06 25.96
17 5.2 11.06 25.96
18 5.2 11.06 25.96
19
20 21 22 23 24

88
STATION 3
CAST 2
Date 19-05-2016
location 56°36.155’N 11°46.523’E
max depth (m) 37.5
surface temp (°C) 11.5
BOTTLE Depth (m) temp. Sal. Remark
1 31.4 5.5 33.6
2 31.4 5.5 33.6
3 31.4 5.5 33.6
4 24.8 5.8 33.4
5 24.8 5.8 33.4
6 24.8 5.8 33.4
7 20.3 5.7 32.7 Fluorescence maximum
8 20.3 5.7 32.7 Fluorescence maximum
9 20.3 5.7 32.7 Fluorescence maximum
10 14.9 7.4 25.4 (Temp/sal variable)
11 14.9 7.4 25.4 (Temp/sal variable)
12 14.9 7.4 25.4 (Temp/sal variable)
13 10.2 11.2 17.8 (Temp/sal variable)
14 10.2 11.2 17.8 (Temp/sal variable)
15 10.2 11.2 17.8 (Temp/sal variable)
16 4.7 11.5 16.1
17 4.7 11.5 16.1
18 4.7 11.5 16.1
19
20
21
22
23
24

89
STATION 4
CAST 2
Date 19-05-2016
location 56°17.021’N 12°16.840’E
max depth (m) 30.3
surface temp
BOTTLE Depth (m) temp. Sal. Remark
1 23.6 5.6 33.97
2 23.6 5.6 33.97
3 23.6 5.6 33.97
4 19.8 5.6 33.95 Fluorescence peak
5 19.8 5.6 33.95 Fluorescence peak
6 19.8 5.6 33.95 Fluorescence peak
7 14.5 6.54 28.45 O2 peak
8 14.5 6.54 28.45 Did not close
9 14.5 6.54 28.45 O2 peak
10 9.8 8.70 20.40
11 9.8 8.70 20.40
12 9.8 8.70 20.40
13 4.8 10.74 17.50
14 4.8 10.74 17.50
15 4.8 10.74 17.50
16
17
18
19
20
21
22
23
24

90
STATION 5
CAST 2
Date 20-05-2016
location
max depth (m) 45
surface temp (°C) 11.2
BOTTLE Depth (m) temp. Sal. Remark
1 38.1 5.83 33.7
2 38.1 5.83 33.7
3 38.1 5.83 33.7
4 30.4 5.87 33.6
5 30.4 5.87 33.6
6 30.4 5.87 33.6
7 24.9 5.96 33.1
8 24.9 5.96 33.1
9 24.9 5.96 33.1
10 20.1 6.17 32.6 Fluorescence maximum
11 20.1 6.17 32.6 Fluorescence maximum
12 20.1 6.17 32.6 Fluorescence maximum
13 15.0 8.9 22
14 15.0 8.9 22
15 15.0 8.9 22
16 9.8 9.58 19.5
17 9.8 9.58 19.5
18 9.8 9.58 19.5
19 4.8 10.2 18.5
20 4.8 10.2 18.5
21 4.8 10.2 18.5
22
23
24

91
STATION 6
CAST 3
Date 20-05-2016
location 55°49.748’N 12°45.271’E
max depth (m) 27
surface temp (°C) 11.951
BOTTLE Depth (m) temp. Sal. Remark
1 20.6 5.98 33.462 Closed to early after reaching depth.
2 20.6 5.98 33.462 Did not close!
3 20.6 5.98 33.462
4 14.6 9.14 22.2
5 14.6 9.14 22.2
6 14.6 9.14 22.2
7 10 11.1 15.49
8 10 11.1 15.49
9 10 11.1 15.49
10 4.6 11.7 12.15
11 4.6 11.7 12.15
12 4.6 11.7 12.15
13
14
15
16
17
18
19
20
21
22
23
24
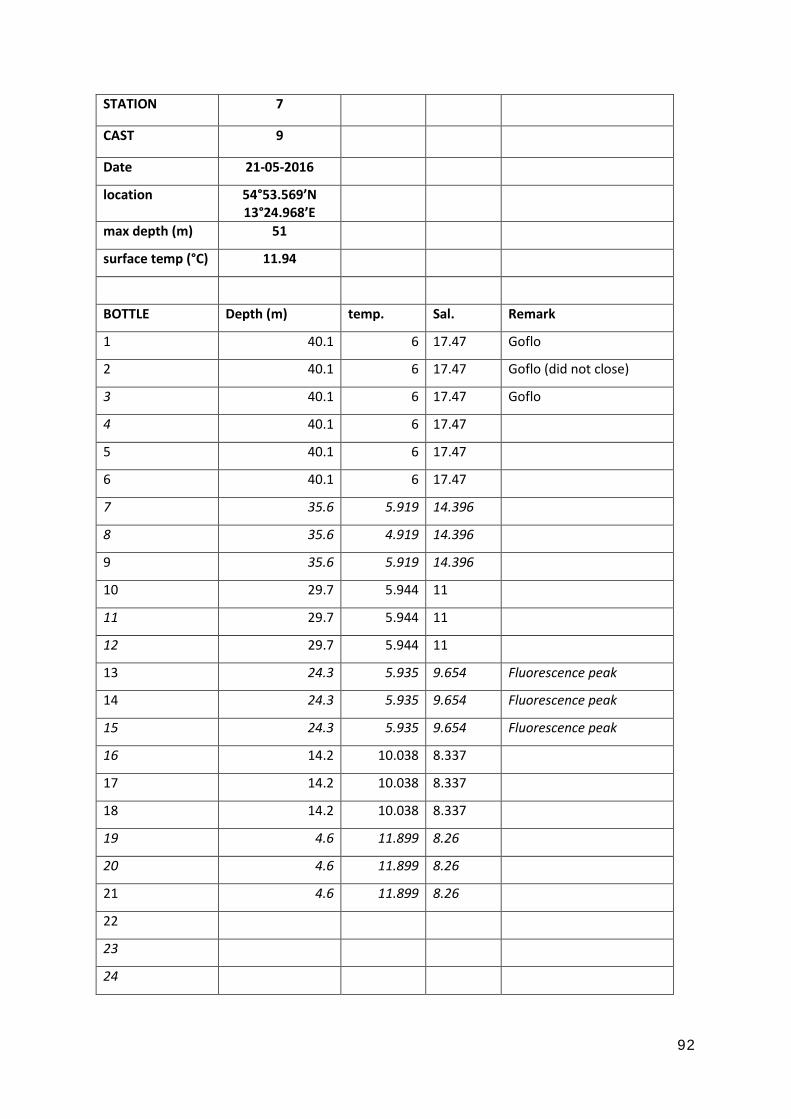
92
STATION 7
CAST 9
Date 21-05-2016
location 54°53.569’N 13°24.968’E
max depth (m) 51
surface temp (°C) 11.94
BOTTLE Depth (m) temp. Sal. Remark
1 40.1 6 17.47 Goflo
2 40.1 6 17.47 Goflo (did not close)
3 40.1 6 17.47 Goflo
4 40.1 6 17.47
5 40.1 6 17.47
6 40.1 6 17.47
7 35.6 5.919 14.396
8 35.6 4.919 14.396
9 35.6 5.919 14.396
10 29.7 5.944 11
11 29.7 5.944 11
12 29.7 5.944 11
13 24.3 5.935 9.654 Fluorescence peak
14 24.3 5.935 9.654 Fluorescence peak
15 24.3 5.935 9.654 Fluorescence peak
16 14.2 10.038 8.337
17 14.2 10.038 8.337
18 14.2 10.038 8.337
19 4.6 11.899 8.26
20 4.6 11.899 8.26
21 4.6 11.899 8.26
22
23
24
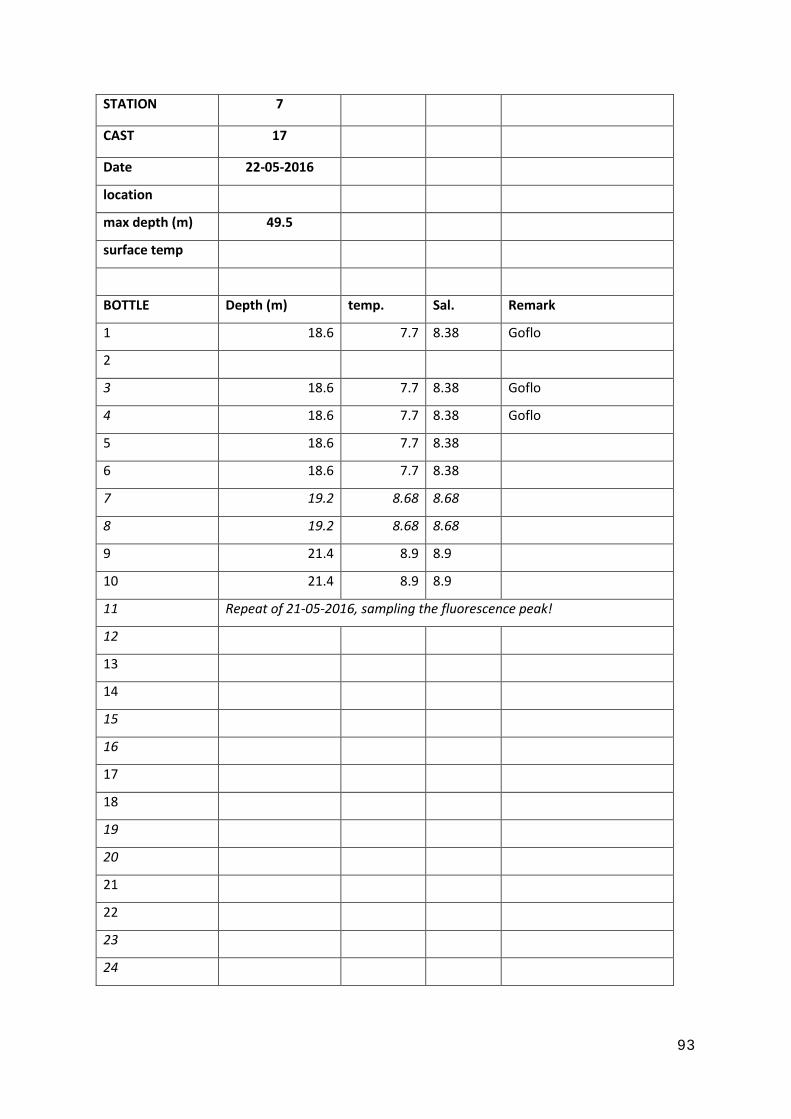
93
STATION 7
CAST 17
Date 22-05-2016
location
max depth (m) 49.5
surface temp
BOTTLE Depth (m) temp. Sal. Remark
1 18.6 7.7 8.38 Goflo
2
3 18.6 7.7 8.38 Goflo
4 18.6 7.7 8.38 Goflo
5 18.6 7.7 8.38
6 18.6 7.7 8.38
7 19.2 8.68 8.68
8 19.2 8.68 8.68
9 21.4 8.9 8.9
10 21.4 8.9 8.9
11 Repeat of 21-05-2016, sampling the fluorescence peak!
12
13
14
15
16
17
18
19
20
21
22
23
24

94
STATION 8
CAST 2
Date 22-05-2016
location 54°55.208’N 13°29.992’E
max depth (m) 53.4
surface temp (°C) 11.275
BOTTLE Depth (m) temp. Sal. Remark
1 43.4 5.61 17.05 Goflo
2
3 43.4 5.61 17.05 Goflo
4 43.4 5.61 17.05 Goflo
5 43.4 5.61 17.05
6 43.4 5.61 17.05
7 43.4 5.61 17.05
8 43.4 5.61 17.05
9 30.1 5.99 11.2
10 30.1 5.99 11.2
11 30.1 5.99 11.2
12 24.1 6.11 10.02
13 24.1 6.11 10.02
14 24.1 6.11 10.02
15 18 6.44 8.28
16 18 6.44 8.28
17 18 6.44 8.28
18 9.3 10.86 8.14 Fluorescence max.
19 9.3 10.96 8.14 Fluorescence max.
20 9.3 10.86 8.14 Fluorescence max.
21 4.9 11.14 8.14
22 4.9 11.14 8.14
23 4.9 11.14 8.14
24

95
STATION 9
CAST 2
Date 23-05-2016
location 55°28.084’N 15°28.616’E
max depth (m) 89.3
surface temp (°C) 10.646
BOTTLE Depth (m) temp. Sal. Remark
1 77.4 6.95 18.44 Goflo
2
3 77.4 6.95 18.44 Goflo
4 77.4 6.95 18.44 Goflo
5 77.4 6.95 18.44
6 77.4 6.95 18.44
7 59.2 5.64 13.42
8 59.2 5.64 13.42
9 59.2 5.64 13.42
10 45.4 5.82 10.58
11 45.4 5.82 10.58
12 45.4 5.82 10.58
13 34.8 5.46 8.55
14 34.8 5.46 8.55
15 34.8 5.46 8.55
16 22.5 8.50 8.04 Fluorescence
17 22.5 8.50 8.04 Fluorescence
18 22.5 8.50 8.04 Fluorescence
19 5.1 10.63 7.82
20 5.1 10.63 7.82
21 5.1 10.63 7.82
22
23
24

96
STATION 10
CAST 2
Date 25-05-2016
location 57°12.700’N 19°56.996’E
max depth (m) 246 (probably less, ±220)
surface temp (°C) 11.6
BOTTLE Depth (m) temp. Sal. Remark
1 199.8 7.205 13.475
2
3 149.7 6.878 12.818
4 99.4 6.068 11.180 Goflo did not close
5 99.4 6.068 11.180
6 71.9 5.202 9.196 Oxycline bottom
7 71.9 5.202 9.196 Oxycline bottom
8 59.8 4.036 7.387 Oxycline top
9 59.8 4.036 7.387 Oxycline top
10 49.5 4.75 7.2
11 49.5 4.75 7.2
12 24.1 5.082 7.071
13 24.1 5.082 7.071
14 13.8 6.900 6.95 Fluorescence peak
15 13.8 6.900 6.95
16 4.2 11.108 6.95
17 4.2 11.108 6.95
18
19
20
21
22
23
24

97
STATION 10
CAST 3
Date 25-05-2016
location 57°12.670’N 19°56.983’E
max depth (m) 220
surface temp (°C) 11.4
BOTTLE Depth (m) temp. Sal. Remark
1 199.8 7.214 13.489
2
3 99.8 6.076 11.193 Goflo did not close
4 71.3 5.141 8.902
5 71.3 5.141 8.902
6 60.4 4.09 7.437
7 60.4 4.09 7.437
8 Cast was emptied and redone!
9
10
11
12
13
14
15
16
17
18
19
20
21
22
23
24

98
STATION 10
CAST 4
Date 25-05-2016
location 57°12.710’N 19°57.012’E
max depth (m) 220
surface temp (°C) 11.4
BOTTLE Depth (m) temp. Sal. Remark
1 101.4 6.08 11.24 Goflo
2
3 101.4 6.08 11.24 Goflo
4 101.4 6.08 11.24 Goflo
5 101.4 6.08 11.24
6 101.4 6.08 11.24
7 70.2 5.052 8.8
8 70.2 5.052 8.8
9 60.0 4.08 7.4
10 60.0 4.08 7.4
11 At least 1 worked!
12
13
14
15
16
17
18
19
20
21
22
23
24

99
STATION 10
CAST 14
Date 26-05-2016
location 57°12.734’N 19°56.968’E
max depth (m) 246?
surface temp (°C) 10.7
BOTTLE Depth (m) temp. Sal. Remark
1 68.4 4.9 8.4 Fluorescence 0.169
2
3 Extra water for Darci, all bottles closed, 11 bottles were removed to hang the 3 in situ pumps in the CTD frame.
4
5
6
7
8
9
10
11
12
13
14
15
16
17
18
19
20
21
22
23
24

100
Appendix 2: N/P station 1
ANAL Q3 64PE410 NIOZ BALTIC 2016.ANLRUN 160518-NP-CTDSt1R1.RUNDATE 18-5-2016TIME 12:18:52OPER SOCOMM Recalculate from Run160518-NP-CTDSt1.runMETH PO4 NH4 NO3+NO2 NO2 COMMENTSUNIT µmol/L µmol/L µmol/L µmol/LBaseline 0.005 0.015 0.002 0.001
CRUISE No. Station No. Cast No. Bottle No. Depth (m) Sample ID
64PE410 1 2 24 10.1 64PE410 St1-2-24 0.005 0.09 0.01 0.003 PO4 DETECTION LIMIT64PE410 1 2 23 10.1 64PE410 St1-2-23 0.005 0.08 0.01 0.003 PO4 DETECTION LIMIT64PE410 1 2 22 24.4 64PE410 St1-2-22 0.009 0.21 0.09 0.00964PE410 1 2 21 24.4 64PE410 St1-2-21 0.014 0.23 0.12 0.00964PE410 1 2 20 40.1 64PE410 St1-2-20 0.312 1.93 1.09 0.05564PE410 1 2 19 40.1 64PE410 St1-2-19 0.309 1.93 1.08 0.05464PE410 1 2 18 55.1 64PE410 St1-2-18 0.415 2.15 2.48 0.12564PE410 1 2 17 55.1 64PE410 St1-2-17 0.417 2.15 2.47 0.12364PE410 1 2 16 80.1 64PE410 St1-2-16 0.475 1.84 3.64 0.28964PE410 1 2 15 80.1 64PE410 St1-2-15 0.478 1.83 3.63 0.28964PE410 1 2 14 100.1 64PE410 St1-2-14 0.539 1.57 4.79 0.39164PE410 1 2 13 100.1 64PE410 St1-2-13 0.546 1.56 4.85 0.39764PE410 1 2 12 150.1 64PE410 St1-2-12 0.671 0.84 7.44 0.51064PE410 1 2 11 150.1 64PE410 St1-2-11 0.673 0.83 7.46 0.51264PE410 1 2 10 199.5 64PE410 St1-2-10 0.732 0.07 9.39 0.26964PE410 1 2 9 199.5 64PE410 St1-2-9 0.733 0.07 9.38 0.27264PE410 1 2 8 248.5 64PE410 St1-2-8 0.728 0.52 8.73 0.48064PE410 1 2 7 248.5 64PE410 St1-2-7 0.719 0.60 8.62 0.49464PE410 1 2 6 324.8 64PE410 St1-2-6 0.816 0.07 10.48 0.03464PE410 1 2 5 324.8 64PE410 St1-2-5 0.819 0.06 10.49 0.03164PE410 1 2 4 400.0 64PE410 St1-2-4 0.823 0.05 10.39 0.03864PE410 1 2 3 400.0 64PE410 St1-2-3 0.823 0.05 10.37 0.03964PE410 1 2 2 533.0 64PE410 St1-2-2 1.010 0.05 11.58 0.03764PE410 1 2 1 533.0 64PE410 St1-2-1 0.992 0.04 11.64 0.037

101
Appendix 3: N/P station 2
ANAL Q3 64PE410 NIOZ BALTIC 2016.ANLRUN 160519-NP-CTD St2_St3aR1.RUNDATE 19-5-2016TIME 10:38:30OPER SOCOMM Recalculate from Run160519-NP-CTD St2_St3a.runMETH PO4 NH4 NO3+NO2 NO2 COMMENTSUNIT µmol/L µmol/L µmol/L µmol/L
Baseline 0.004 0.055 0.008 0.001CRUISE No. Station No. Cast No. Bottle No.Depth (m) Sample ID
64PE410 2 2 17 5.2 64PE410 St2-2-17 0.005 0.14 0.05 0.006 PO4 DETECTION LIMIT64PE410 2 2 16 5.2 64PE410 St2-2-16 0.005 0.15 0.05 0.009 PO4 DETECTION LIMIT64PE410 2 2 15 10.0 64PE410 St2-2-15 0.017 0.12 0.06 0.01264PE410 2 2 14 10.0 64PE410 St2-2-14 0.015 0.24 0.08 0.01864PE410 2 2 13 10.0 64PE410 St2-2-13 0.018 0.22 0.05 0.01364PE410 2 2 11 14.9 64PE410 St2-2-11 0.053 0.17 0.04 0.01864PE410 2 2 10 14.9 64PE410 St2-2-10 0.051 0.13 0.05 0.01964PE410 2 2 9 20.2 64PE410 St2-2-9 0.069 0.25 0.16 0.03364PE410 2 2 8 20.2 64PE410 St2-2-8 0.068 0.22 0.18 0.04064PE410 2 2 7 20.2 64PE410 St2-2-7 0.066 0.26 0.11 0.02264PE410 2 2 5 30.0 64PE410 St2-2-5 0.215 1.27 0.77 0.05964PE410 2 2 4 30.0 64PE410 St2-2-4 0.223 1.26 0.84 0.06764PE410 2 2 3 40.0 64PE410 St2-2-3 0.304 1.48 1.02 0.08064PE410 2 2 2 40.0 64PE410 St2-2-2 0.266 1.45 1.03 0.07564PE410 2 2 1 40.0 64PE410 St2-2-1 0.270 1.50 1.00 0.073

102
Appendix 4: N/P Station 3, 4, 5 and 6
ANAL Q3 64PE410 NIOZ BALTIC 2016.ANLRUN 160520-NP-CTD St3b_St4b_St5b_St6bR1.RUNDATE 20-5-2016TIME 17:16:13OPER SOCOMM Recalculate from Run160520-NP-CTD St3b_St4b_St5b_SMETH PO4 NH4 NO3+NO2 NO2 COMMENTSUNIT µmol/L µmol/L µmol/L µmol/LBaseline 17 0.003 0.045 0.003 0.001
CRUISE No. Station No. Cast No. Bottle No. Depth (m) Sample ID
64PE410 3 2 17 4.7 64PE410 St3-2-17 0.025 0.16 0.05 0.01364PE410 3 2 16 4.7 64PE410 St3-2-16 0.024 0.12 0.02 0.00564PE410 3 2 14 10.2 64PE410 St3-2-14 0.029 0.12 0.04 0.0164PE410 3 2 13 10.2 64PE410 St3-2-13 0.025 0.11 0.01 0.00364PE410 3 2 11 14.9 64PE410 St3-2-11 0.012 0.10 0.34 0.03064PE410 3 2 10 14.9 64PE410 St3-2-10 0.015 0.11 0.24 0.02064PE410 3 2 8 20.3 64PE410 St3-2-8 0.353 0.24 6.41 0.27464PE410 3 2 7 20.3 64PE410 St3-2-7 0.355 0.23 6.45 0.27664PE410 3 2 5 24.8 64PE410 St3-2-5 0.606 0.22 9.64 0.28964PE410 3 2 4 24.8 64PE410 St3-2-4 0.595 0.20 9.63 0.28964PE410 3 2 2 31.4 64PE410 St3-2-2 0.642 0.13 10.06 0.25164PE410 3 2 1 31.4 64PE410 St3-2-1 0.644 0.13 10.08 0.246
64PE410 4 2 14 4.8 64PE410 St4-2-14 0.026 0.16 0.05 0.00564PE410 4 2 13 4.8 64PE410 St4-2-13 0.022 0.14 0.05 0.00564PE410 4 2 11 9.8 64PE410 St4-2-11 0.059 0.14 0.06 0.00464PE410 4 2 10 9.8 64PE410 St4-2-10 0.053 0.14 0.05 0.00364PE410 4 2 7 14.5 64PE410 St4-2-7 0.037 0.14 0.10 0.00664PE410 4 2 5 19.8 64PE410 St4-2-5 0.727 0.18 9.38 0.09864PE410 4 2 4 19.8 64PE410 St4-2-4 0.721 0.14 9.26 0.09764PE410 4 2 2 23.6 64PE410 St4-2-2 0.780 0.13 9.78 0.07864PE410 4 2 1 23.6 64PE410 St4-2-1 0.762 0.12 9.58 0.079
64PE410 5 2 20 4.8 64PE410 St5-2-20 0.070 0.18 0.07 0.00764PE410 5 2 19 4.8 64PE410 St5-2-19 0.069 0.12 0.02 0.00364PE410 5 2 17 9.8 64PE410 St5-2-17 0.084 0.15 0.06 0.01064PE410 5 2 16 9.8 64PE410 St5-2-16 0.080 0.12 0.06 0.00964PE410 5 2 14 15.0 64PE410 St5-2-14 0.151 0.14 0.27 0.02364PE410 5 2 13 15.0 64PE410 St5-2-13 0.135 0.13 0.16 0.01364PE410 5 2 11 20.1 64PE410 St5-2-11 0.803 0.34 7.85 0.14164PE410 5 2 10 20.1 64PE410 St5-2-10 0.802 0.33 7.78 0.13764PE410 5 2 8 24.9 64PE410 St5-2-8 0.809 0.35 7.85 0.13964PE410 5 2 7 24.9 64PE410 St5-2-7 0.905 0.38 9.79 0.14064PE410 5 2 5 30.4 64PE410 St5-2-5 0.920 0.42 10.33 0.14064PE410 5 2 4 30.4 64PE410 St5-2-4 0.922 0.42 10.37 0.13864PE410 5 2 2 38.1 64PE410 St5-2-2 0.919 0.45 10.30 0.13864PE410 5 2 1 38.1 64PE410 St5-2-1 0.916 0.45 10.35 0.138
64PE410 6 4 12 4.6 64PE410 St6-4-12 0.117 0.12 0.03 0.01064PE410 6 4 11 4.6 64PE410 St6-4-11 0.119 0.12 0.03 0.00764PE410 6 4 9 10.0 64PE410 St6-4-9 0.122 0.11 0.03 0.00364PE410 6 4 8 10.0 64PE410 St6-4-8 0.119 0.11 0.03 0.00264PE410 6 4 6 14.6 64PE410 St6-4-6 0.127 0.13 0.19 0.00864PE410 6 4 5 14.6 64PE410 St6-4-5 0.178 0.15 0.64 0.01864PE410 6 4 3 20.6 64PE410 St6-4-3 0.918 0.50 9.93 0.13964PE410 6 4 1 20.6 64PE410 St6-4-1 TEST 0.927 0.50 9.99 0.139 NISKIN BOTTLE CLOSED TOO FAST

103
Appendix 5: N/P station 7
ANAL Q3 64PE410 NIOZ BALTIC 2016.ANLRUN 160522-NP-CTD St7R1.RUNDATE 22-5-2016TIME 12:35:18OPER SOCOMM Recalculate from Run160522-NP-CTD St7.runMETH PO4 NH4 NO3+NO2 NO2UNIT µmol/L µmol/L µmol/L µmol/L COMMENTSBaseline 0.001 0.055 0.002 0.000
CRUISE NoStation NoCast No. Bottle No.Depth (m)Sample ID
64PE410 7 9 20 4.6 64PE410 St7-9-20 0.217 0.18 0.07 0.00464PE410 7 9 19 4.6 64PE410 St7-9-19 0.223 0.14 0.03 0.00364PE410 7 9 17 14.2 64PE410 St7-9-17 0.228 0.12 0.02 0.00464PE410 7 9 16 14.2 64PE410 St7-9-16 0.225 0.12 0.02 0.00364PE410 7 9 14 24.3 64PE410 St7-9-14 0.448 0.57 0.07 0.01964PE410 7 9 13 24.3 64PE410 St7-9-13 0.454 0.58 0.10 0.02364PE410 7 9 11 29.7 64PE410 St7-9-11 0.542 1.30 0.57 0.17564PE410 7 9 10 29.7 64PE410 St7-9-10 0.526 1.28 0.53 0.10664PE410 7 9 8 35.6 64PE410 St7-9-8 0.579 1.11 1.29 0.40064PE410 7 9 7 35.6 64PE410 St7-9-7 0.570 1.09 1.22 0.39364PE410 7 9 5 40.1 64PE410 St7-9-5 0.840 0.96 3.50 0.28764PE410 7 9 4 40.1 64PE410 St5-2-4 0.724 0.70 2.72 0.31364PE410 7 9 3 40.1 64PE410 St5-2-3GOFL 0.852 1.00 3.58 0.283 GO FLO BOTTLE64PE410 7 9 1 40.1 64PE410 St5-2-1GOFL 0.824 1.01 4.27 0.241 GO FLO BOTTLE

104
Appendix 6: N/P station 8
ANAL Q3 64PE410 NIOZ BALTIC 2016.ANLRUN 160522-NP-CTD St8R1.RUNDATE 22-5-2016TIME 17:46:22OPER SOCOMM Recalculate from Run160522-NP-CTD St8.ruMETH PO4 NH4 NO3+NO2 NO2UNIT µmol/L µmol/L µmol/L µmol/LBaseline 0.009 0.043 0.002 0.000
CRUISE No. Station No. Cast No. Bottle No. Depth (m) Sample ID
64PE410 8 2 22 4.9 64PE410 St8-2-22 0.282 0.141 0.049 0.00164PE410 8 2 21 4.9 64PE410 St8-2-21 0.289 0.109 0.031 0.00264PE410 8 2 19 9.3 64PE410 St8-2-19 0.317 0.101 0.022 0.00264PE410 8 2 18 9.3 64PE410 St8-2-18 0.322 0.083 0.021 0.00264PE410 8 2 16 18.0 64PE410 St8-2-16 0.442 0.115 0.043 0.00864PE410 8 2 15 18.0 64PE410 St8-2-15 0.452 0.100 0.023 0.01064PE410 8 2 13 24.1 64PE410 St8-2-13 0.504 1.002 0.368 0.04364PE410 8 2 12 24.1 64PE410 St8-2-12 0.507 1.001 0.364 0.04164PE410 8 2 10 30.1 64PE410 St8-2-10 0.535 1.286 0.578 0.13564PE410 8 2 9 30.1 64PE410 St8-2-9 0.531 1.264 0.592 0.14364PE410 8 2 7 43.4 64PE410 St8-2-7 0.871 0.889 3.564 0.18864PE410 8 2 6 43.4 64PE410 St8-2-6 0.995 1.191 4.143 0.135

105
Appendix 7: N/P station 9
ANAL Q3 64PE410 NIOZ BALTIC 2016.ANLRUN 160523-NP-CTD St9R1.RUNDATE 23-5-2016TIME 10:29:55OPER SOCOMM Recalculate from Run160523-NP-CTD St9R1.runMETH PO4 NH4 NO3+NO2 NO2 COMMENTSUNIT µmol/L µmol/L µmol/L µmol/LBaseline 0.002 0.040 0.002 0.000
CRUISE No. Station No. Cast No. Bottle No. Depth (m) Sample ID
64PE410 9 2 21 5.1 64PE410 St9-2-21 0.339 0.13 0.04 0.00164PE410 9 2 20 5.1 64PE410 St9-2-20 0.333 0.12 0.03 0.00164PE410 9 2 17 22.5 64PE410 St9-2-17 0.391 0.15 0.02 0.00064PE410 9 2 16 22.5 64PE410 St9-2-16 0.395 0.20 0.02 0.00464PE410 9 2 14 34.8 64PE410 St9-2-14 0.613 0.54 0.06 0.01464PE410 9 2 13 34.8 64PE410 St9-2-13 0.631 0.53 0.06 0.01564PE410 9 2 11 45.4 64PE410 St9-2-11 0.574 1.02 0.39 0.08764PE410 9 2 10 45.4 64PE410 St9-2-10 0.568 1.01 0.38 0.09464PE410 9 2 8 59.2 64PE410 St9-2-8 0.582 0.96 1.13 0.34764PE410 9 2 7 59.2 64PE410 St8-2-7 0.583 0.96 1.11 0.34964PE410 9 2 5 77.4 64PE410 St8-2-5 1.977 0.11 10.75 0.019 HYPOXIC64PE410 9 2 3 77.4 64PE410 St8-2-3 GOF 1.940 0.11 10.81 0.018 GO FLO, HYPOXIC

106
Appendix 8: N/P station 10
ANAL Q3 64PE410 NIOZ BALTIC 2016.ANLRUN 160525-NP-CTD St10_PCPW St9R1.RUNDATE 25-5-2016TIME 13:33:02OPER SOCOMM Recalculate from Run160525-NP-CTD St10_PCPW St9.ruMETH PO4 NH4 NO3+NO2 NO2 COMMENTSUNIT µmol/L µmol/L µmol/L µmol/LBaseline 0.002 0.042 0.002 0.001
CRUISE No. Station No. Cast No. Bottle No. Depth (m) Sample ID
64PE410 10 2 16 4.2 64PE410 St10-2-16 0.040 0.10 0.00 0.001 DETECTION LIMIT64PE410 10 2 14 13.8 64PE410 St10-2-14 0.183 0.13 0.00 0.001 DETECTION LIMIT64PE410 10 2 12 24.1 64PE410 St10-2-12 0.287 0.32 0.00 0.001 DETECTION LIMIT64PE410 10 2 10 49.5 64PE410 St10-2-10 0.432 0.43 0.15 0.03264PE410 10 2 8 59.8 64PE410 St10-2-8 0.858 0.49 1.64 0.14464PE410 10 2 6 71.9 64PE410 St10-2-6 2.301 0.47 5.00 0.09764PE410 10 2 5 99.4 64PE410 St10-2-5 2.506 0.14 6.13 0.03064PE410 10 4 4 100 64PE410 St10-4-4 GF 2.545 0.10 5.99 0.040 GO FLO BOTTLE64PE410 10 2 3 149.7 64PE410 St10-2-3 GF 2.392 0.11 8.27 0.007 GO FLO BOTTLE64PE410 10 2 1 199.8 64PE410 St10-2-1 GF 2.474 0.14 9.80 0.025 GO FLO BOTTLE
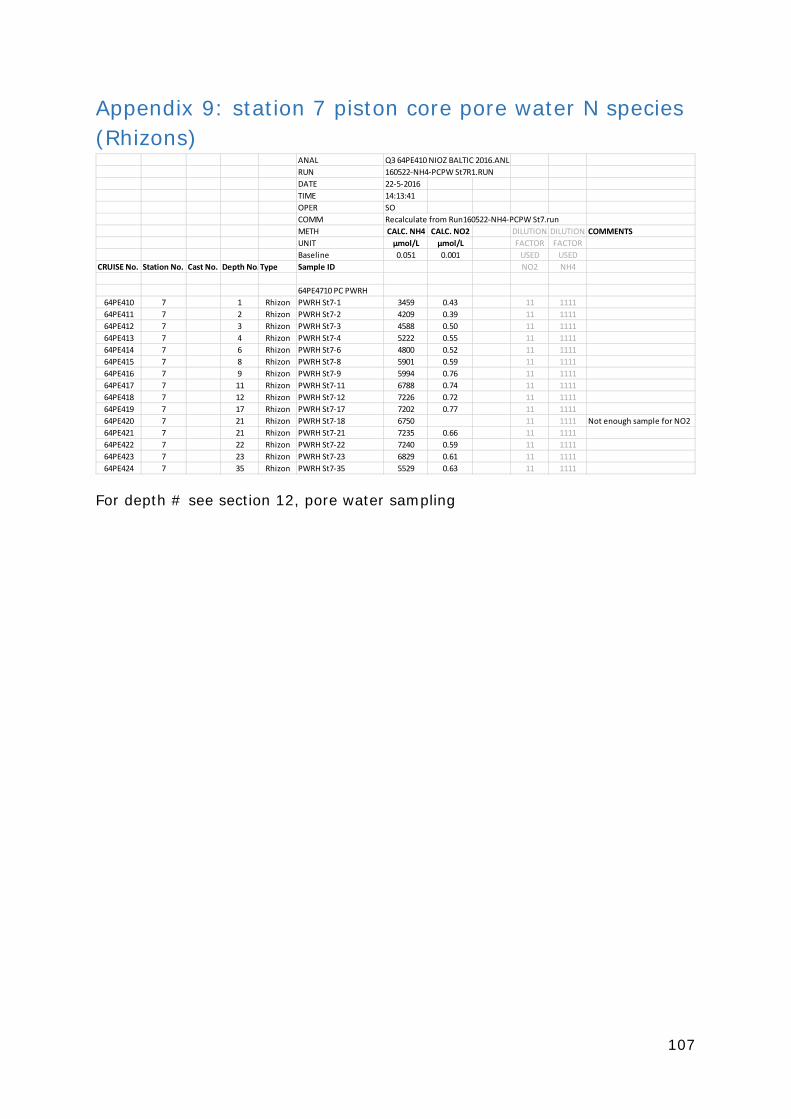
107
Appendix 9: station 7 piston core pore water N species (Rhizons)
For depth # see section 12, pore water sampling
ANAL Q3 64PE410 NIOZ BALTIC 2016.ANLRUN 160522-NH4-PCPW St7R1.RUNDATE 22-5-2016TIME 14:13:41OPER SOCOMM Recalculate from Run160522-NH4-PCPW St7.runMETH CALC. NH4 CALC. NO2 DILUTION DILUTION COMMENTSUNIT µmol/L µmol/L FACTOR FACTORBaseline 0.051 0.001 USED USED
CRUISE No. Station No. Cast No. Depth No.Type Sample ID NO2 NH4
64PE4710 PC PWRH64PE410 7 1 Rhizon PWRH St7-1 3459 0.43 11 111164PE411 7 2 Rhizon PWRH St7-2 4209 0.39 11 111164PE412 7 3 Rhizon PWRH St7-3 4588 0.50 11 111164PE413 7 4 Rhizon PWRH St7-4 5222 0.55 11 111164PE414 7 6 Rhizon PWRH St7-6 4800 0.52 11 111164PE415 7 8 Rhizon PWRH St7-8 5901 0.59 11 111164PE416 7 9 Rhizon PWRH St7-9 5994 0.76 11 111164PE417 7 11 Rhizon PWRH St7-11 6788 0.74 11 111164PE418 7 12 Rhizon PWRH St7-12 7226 0.72 11 111164PE419 7 17 Rhizon PWRH St7-17 7202 0.77 11 111164PE420 7 21 Rhizon PWRH St7-18 6750 11 1111 Not enough sample for NO264PE421 7 21 Rhizon PWRH St7-21 7235 0.66 11 111164PE422 7 22 Rhizon PWRH St7-22 7240 0.59 11 111164PE423 7 23 Rhizon PWRH St7-23 6829 0.61 11 111164PE424 7 35 Rhizon PWRH St7-35 5529 0.63 11 1111

108
Appendix 10: station 7 multi core pore water N species (2 sampling methods, Rhizons and Centrifugation)
For depth # see section 12, pore water sampling
ANAL Q3 64PE410 NIOZ BALTIC 2016.ANRUN 160523-NH4NO2-MCPW St7R1.RUDATE 23-5-2016TIME 13:14:03OPER SOCOMM Recalculate from Run160523-NH4 METH CALC. NH4 CALC.NO2UNIT µmol/L µmol/LBaseline 0.036 0.000
CRUISE No. Station No. Cast No. Depth No. Extraction Sample ID
MC PW Rhizons St764PE410 7 Multicore 0 Rhizon MCRH St7-0 3.0 0.3664PE410 7 Multicore 1 Rhizon MCRH St7-1 240.0 0.2664PE410 7 Multicore 3 Rhizon MCRH St7-3 617.8 0.2864PE410 7 Multicore 4 Rhizon MCRH St7-4 735.5 0.2864PE410 7 Multicore 5 Rhizon MCRH St7-5 884.4 0.3064PE410 7 Multicore 6 Rhizon MCRH St7-6 986.6 0.2564PE410 7 Multicore 7 Rhizon MCRH St7-7 1132.2 0.2364PE410 7 Multicore 8 Rhizon MCRH St7-8 1237.7 0.1364PE410 7 Multicore 9 Rhizon MCRH St7-9 1351.0 0.0764PE410 7 Multicore 10 Rhizon MCRH St7-10 1492.1 0.0664PE410 7 Multicore 11 Rhizon MCRH St7-11 1425.5 0.1064PE410 7 Multicore 13 Rhizon MCRH St7-13 1518.8 0.1364PE410 7 Multicore 14 Rhizon MCRH St7-14 1661.0 0.1264PE410 7 Multicore 15 Rhizon MCRH St7-15 1819.9 0.1464PE410 7 Multicore 16 Rhizon MCRH St7-16 1854.3 0.3364PE410 7 Multicore 18 Rhizon MCRH St7-18 1985.4 0.2164PE410 7 Multicore 20 Rhizon MCRH St7-20 2104.3 0.2564PE410 7 Multicore 22 Rhizon MCRH St7-22 2233.2 0.2364PE410 7 Multicore 23 Rhizon MCRH St7-23 2282.0 0.2664PE410 7 Multicore 24 Rhizon MCRH St7-24 2345.4 0.3064PE410 7 Multicore 26 Rhizon MCRH St7-26 2524.2 0.5164PE410 7 Multicore 27 Rhizon MCRH St7-27 2544.2 0.7864PE410 7 Multicore 28 Rhizon MCRH St7-28 2617.6 0.30
MC PW Centrifuge St764PE410 7 Multicore 0 Centrifuge MCCent St7-0 9.9 0.6364PE410 7 Multicore 1 Centrifuge MCCent St7-1 178.9 1.3264PE410 7 Multicore 2 Centrifuge MCCent St7-2 203.4 1.3264PE410 7 Multicore 3 Centrifuge MCCent St7-3 267.8 1.2264PE410 7 Multicore 4 Centrifuge MCCent St7-4 315.6 1.2164PE410 7 Multicore 5 Centrifuge MCCent St7-5 366.7 1.4064PE410 7 Multicore 6 Centrifuge MCCent St7-6 441.1 2.0264PE410 7 Multicore 7 Centrifuge MCCent St7-7 481.1 2.2164PE410 7 Multicore 8 Centrifuge MCCent St7-8 612.2 1.4664PE410 7 Multicore 9 Centrifuge MCCent St7-9 636.7 1.5464PE410 7 Multicore 10 Centrifuge MCCent St7-10 698.9 0.7964PE410 7 Multicore 11 Centrifuge MCCent St7-11 472.2 2.0964PE410 7 Multicore 12 Centrifuge MCCent St7-12 827.7 0.9664PE410 7 Multicore 13 Centrifuge MCCent St7-13 901.1 1.1364PE410 7 Multicore 14 Centrifuge MCCent St7-14 977.7 1.1064PE410 7 Multicore 15 Centrifuge MCCent St7-15 1089.9 0.5564PE410 7 Multicore 16 Centrifuge MCCent St7-16 1137.7 0.7064PE410 7 Multicore 17 Centrifuge MCCent St7-17 1301.0 0.4464PE410 7 Multicore 18 Centrifuge MCCent St7-18 1312.1 0.3664PE410 7 Multicore 19 Centrifuge MCCent St7-19 1434.4 0.5464PE410 7 Multicore 20 Centrifuge MCCent St7-20 1555.5 0.8664PE410 7 Multicore 21 Centrifuge MCCent St7-21 1554.3 0.7464PE410 7 Multicore 22 Centrifuge MCCent St7-22 1595.4 0.6664PE410 7 Multicore 23 Centrifuge MCCent St7-23 1659.9 0.9264PE410 7 Multicore 24 Centrifuge MCCent St7-24 1738.8 1.3164PE410 7 Multicore 25 Centrifuge MCCent St7-25 1902.1 0.8064PE410 7 Multicore 26 Centrifuge MCCent St7-26 1925.4 0.6864PE410 7 Multicore 27 Centrifuge MCCent St7-27 1856.5 0.84

109
Appendix 11: station 9 piston core pore water N species (Centrifugation)
For depth # see section 12, pore water sampling
ANAL Q3 64PE410 NIOZ BALTIC 2016.ANLRUN 160525-NP-CTD St10_PCPW St9R1.RUNDATE 25-5-2016TIME 13:33:02OPER SOCOMM Recalculate from Run160525-NP-CTD St10_PCPW St9.ruMETH PO4 NH4 NO3+NO2 NO2 COMMENTSUNIT µmol/L µmol/L µmol/L µmol/LBaseline 0.002 0.042 0.002 0.001
CRUISE No. Station No. Cast No. Depth No. Extraction
PC PW Centrifuged St964PE410 9 Multicore 1 Centrifuge PCPWCent St9-1 1572.1 6.18 2.5964PE411 9 Multicore 2 Centrifuge PCPWCent St9-2 1769.9 5.70 1.2564PE412 9 Multicore 3 Centrifuge PCPWCent St9-3 2513.1 8.57 2.0564PE413 9 Multicore 4 Centrifuge PCPWCent St9-4 2637.6 5.76 2.3564PE414 9 Multicore 19 Centrifuge PCPWCent St9-19 5421.7 11.41 7.48

110
Appendix 12: station 9 multi core pore water N species (Rhizons)
For depth # see section 12, pore water sampling
ANAL Q3 64PE410 NIOZ BALTIC 2016.ANLRUN 160523-NH4NO2-MCPW St9R1.RUNDATE 23-5-2016TIME 18:58:31OPER SOCOMM Recalculate from Run160523-NH4NO2-MCPW METH CALC. NH4 CALC. NO2 COMMENTSUNIT µmol/L µmol/LBaseline 0.042 0.000
CRUISE No. Station No. Cast No. Depth No. Extraction Sample ID
MC PW Rhizons St964PE410 9 Multicore 0 Rhizon MCRH St9-0 2.5 0.2164PE410 9 Multicore 1 Rhizon MCRH St9-1 186.7 0.4264PE410 9 Multicore 2 Rhizon MCRH St9-2 345.6 0.2164PE410 9 Multicore 3 Rhizon MCRH St9-3 378.9 0.3464PE410 9 Multicore 4 Rhizon MCRH St9-4 470.0 0.4264PE410 9 Multicore 5 Rhizon MCRH St9-5 500.0 0.5064PE410 9 Multicore 6 Rhizon MCRH St9-6 574.4 0.0964PE410 9 Multicore 7 Rhizon MCRH St9-7 712.2 0.0064PE410 9 Multicore 8 Rhizon MCRH St9-8 726.6 0.0164PE410 9 Multicore 9 Rhizon MCRH St9-9 756.6 0.0064PE410 9 Multicore 10 Rhizon MCRH St9-10 742.2 0.0664PE410 9 Multicore 11 Rhizon MCRH St9-11 748.9 0.29 NO2 PEAK CHECKED64PE410 9 Multicore 12 Rhizon MCRH St9-12 887.7 0.0664PE410 9 Multicore 13 Rhizon MCRH St9-13 943.3 0.0064PE410 9 Multicore 14 Rhizon MCRH St9-14 897.7 0.0064PE410 9 Multicore 15 Rhizon MCRH St9-15 987.7 0.0064PE410 9 Multicore 16 Rhizon MCRH St9-16 1003.3 1.46 NO2 PEAK CHECKED64PE410 9 Multicore 17 Rhizon MCRH St9-17 1109.9 0.0064PE410 9 Multicore 18 Rhizon MCRH St9-18 1184.4 0.0264PE410 9 Multicore 19 Rhizon MCRH St9-19 1131.0 0.0164PE410 9 Multicore 20 Rhizon MCRH St9-20 1167.7 0.0164PE410 9 Multicore 21 Rhizon MCRH St9-21 1224.4 0.89 NO2 PEAK CHECKED64PE410 9 Multicore 23 Rhizon MCRH St9-23 1282.1 0.00
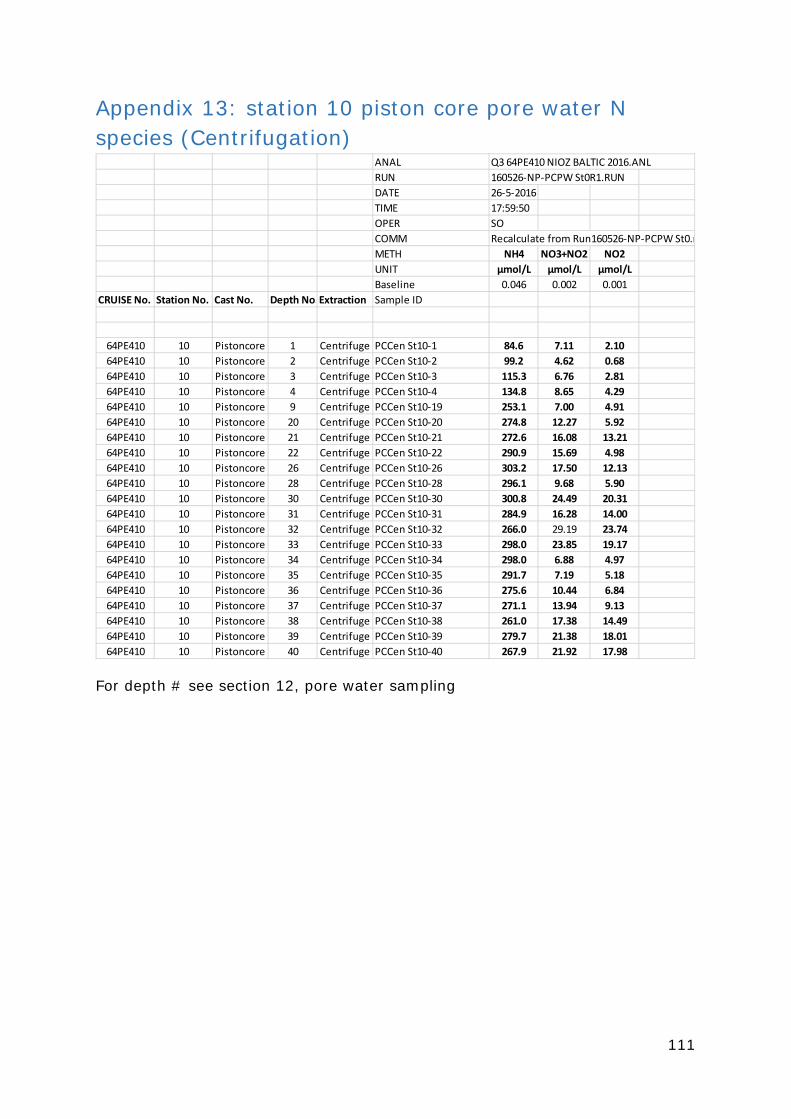
111
Appendix 13: station 10 piston core pore water N species (Centrifugation)
For depth # see section 12, pore water sampling
ANAL Q3 64PE410 NIOZ BALTIC 2016.ANLRUN 160526-NP-PCPW St0R1.RUNDATE 26-5-2016TIME 17:59:50OPER SOCOMM Recalculate from Run160526-NP-PCPW St0.rMETH NH4 NO3+NO2 NO2UNIT µmol/L µmol/L µmol/LBaseline 0.046 0.002 0.001
CRUISE No. Station No. Cast No. Depth No.Extraction Sample ID
64PE410 10 Pistoncore 1 Centrifuge PCCen St10-1 84.6 7.11 2.1064PE410 10 Pistoncore 2 Centrifuge PCCen St10-2 99.2 4.62 0.6864PE410 10 Pistoncore 3 Centrifuge PCCen St10-3 115.3 6.76 2.8164PE410 10 Pistoncore 4 Centrifuge PCCen St10-4 134.8 8.65 4.2964PE410 10 Pistoncore 9 Centrifuge PCCen St10-19 253.1 7.00 4.9164PE410 10 Pistoncore 20 Centrifuge PCCen St10-20 274.8 12.27 5.9264PE410 10 Pistoncore 21 Centrifuge PCCen St10-21 272.6 16.08 13.2164PE410 10 Pistoncore 22 Centrifuge PCCen St10-22 290.9 15.69 4.9864PE410 10 Pistoncore 26 Centrifuge PCCen St10-26 303.2 17.50 12.1364PE410 10 Pistoncore 28 Centrifuge PCCen St10-28 296.1 9.68 5.9064PE410 10 Pistoncore 30 Centrifuge PCCen St10-30 300.8 24.49 20.3164PE410 10 Pistoncore 31 Centrifuge PCCen St10-31 284.9 16.28 14.0064PE410 10 Pistoncore 32 Centrifuge PCCen St10-32 266.0 29.19 23.7464PE410 10 Pistoncore 33 Centrifuge PCCen St10-33 298.0 23.85 19.1764PE410 10 Pistoncore 34 Centrifuge PCCen St10-34 298.0 6.88 4.9764PE410 10 Pistoncore 35 Centrifuge PCCen St10-35 291.7 7.19 5.1864PE410 10 Pistoncore 36 Centrifuge PCCen St10-36 275.6 10.44 6.8464PE410 10 Pistoncore 37 Centrifuge PCCen St10-37 271.1 13.94 9.1364PE410 10 Pistoncore 38 Centrifuge PCCen St10-38 261.0 17.38 14.4964PE410 10 Pistoncore 39 Centrifuge PCCen St10-39 279.7 21.38 18.0164PE410 10 Pistoncore 40 Centrifuge PCCen St10-40 267.9 21.92 17.98

112
Appendix 14: station 10 multi core pore water N species (Centrifugation)
For depth # see section 12, pore water sampling
ANAL Q3 64PE410 NIOZ BALTIC 2016.ANLRUN 160526-NH4NO2-MCPW St10R1.RUNDATE 26-5-2016TIME 10:02:43OPER SOCOMM Recalculate from Run160526-NH4NO2-MCPW St10METH NH4 NO3+NO2 NO2UNIT µmol/L µmol/L µmol/LBaseline 0.048 0.003
CRUISE No. Station No. Cast No. Depth No.Extraction Sample ID
MC PW Centrifuge St1064PE410 10 Multicore 0 Centrifuge MCCen St10-0 2.8 14.7 0.2864PE410 10 Multicore 1 Centrifuge MCCen St10-1 8.3 2.6 0.6164PE410 10 Multicore 2 Centrifuge MCCen St10-2 23.2 3.2 0.5264PE410 10 Multicore 3 Centrifuge MCCen St10-3 29.4 3.8 1.5364PE410 10 Multicore 4 Centrifuge MCCen St10-4 35.1 3.3 1.8764PE410 10 Multicore 5 Centrifuge MCCen St10-5 37.0 3.1 0.4464PE410 10 Multicore 6 Centrifuge MCCen St10-6 39.1 1.3 0.2664PE410 10 Multicore 7 Centrifuge MCCen St10-7 42.7 6.5 1.0964PE410 10 Multicore 8 Centrifuge MCCen St10-8 48.3 2.2 0.7364PE410 10 Multicore 9 Centrifuge MCCen St10-9 49.8 2.6 0.4864PE410 10 Multicore 10 Centrifuge MCCen St10-10 52.0 3.9 0.8364PE410 10 Multicore 11 Centrifuge MCCen St10-11 57.0 4.1 1.2164PE410 10 Multicore 12 Centrifuge MCCen St10-12 59.1 3.4 0.8664PE410 10 Multicore 13 Centrifuge MCCen St10-13 60.8 4.7 1.4164PE410 10 Multicore 14 Centrifuge MCCen St10-14 62.1 5.1 1.8364PE410 10 Multicore 15 Centrifuge MCCen St10-15 65.2 5.3 2.4764PE410 10 Multicore 16 Centrifuge MCCen St10-16 67.1 5.2 1.6164PE410 10 Multicore 17 Centrifuge MCCen St10-17 68.1 4.2 1.5664PE410 10 Multicore 18 Centrifuge MCCen St10-18 71.2 3.6 1.4064PE410 10 Multicore 19 Centrifuge MCCen St10-19 75.0 4.0 1.4864PE410 10 Multicore 20 Centrifuge MCCen St10-20 75.0 6.4 3.3264PE410 10 Multicore 21 Centrifuge MCCen St10-21 76.9 5.1 1.7464PE410 10 Multicore 23 Centrifuge MCCen St10-23 79.5 5.2 1.8164PE410 10 Multicore 24 Centrifuge MCCen St10-24 82.6 2.5 0.4064PE410 10 Multicore 25 Centrifuge MCCen St10-25 80.8 2.9 0.9964PE410 10 Multicore 26 Centrifuge MCCen St10-26 82.7 1.5 0.4664PE410 10 Multicore 27 Centrifuge MCCen St10-27 85.3 4.1 1.2964PE410 10 Multicore 28 Centrifuge MCCen St10-28 86.1 5.9 1.1664PE410 10 Multicore 29 Centrifuge MCCen St10-29 87.6 6.3 2.0264PE410 10 Multicore 30 Centrifuge MCCen St10-30 88.2 7.1 2.90

113
Appendix 15: Pore water DIC stations 7 and 9
For depth # see section 12, pore water sampling
ANAL Q2 64PE410 NIOZ BALTIC 2016.ANLRUN DIC-160524-PWR1.RUNDATE 24-5-2016TIME 15:44:50OPER SOCOMM Recalculate from RunDIC-160524-PMETH CALC. DIC COMMENTSUNIT µmol/lBaseline 21 NaCl
Cruise No. Station No. Cast No. Slice No. Extraction Sample ID
64PE410 7 Multicore 0 Rhizons MCPWRH St7-0 1654.164PE410 7 Multicore 1 Rhizons MCPWRH St7-1 1584.764PE410 7 Multicore 2 Rhizons MCPWRH St7-2 5450.964PE410 7 Multicore 3 Rhizons MCPWRH St7-3 10944.864PE410 7 Multicore 4 Rhizons MCPWRH St7-4 11180.264PE410 7 Multicore 5 Rhizons MCPWRH St7-5 14366.564PE410 7 Multicore 6 Rhizons MCPWRH St7-6 15737.464PE410 7 Multicore 7 Rhizons MCPWRH St7-7 18583.564PE410 7 Multicore 8 Rhizons MCPWRH St7-8 16292.6
64PE410 7 Multicore 0 Centrifuge MCPW Cen St7-0 1761.264PE410 7 Multicore 1 Centrifuge MCPW Cen St7-1 2376.464PE410 7 Multicore 2 Centrifuge MCPW Cen St7-2 2866.364PE410 7 Multicore 3 Centrifuge MCPW Cen St7-3 3647.064PE410 7 Multicore 4 Centrifuge MCPW Cen St7-4 3783.264PE410 7 Multicore 5 Centrifuge MCPW Cen St7-5 4444.464PE410 7 Multicore 6 Centrifuge MCPW Cen St7-6 4899.764PE410 7 Multicore 7 Centrifuge MCPW Cen St7-7 5567.864PE410 7 Multicore 8 Centrifuge MCPW Cen St7-8 6384.064PE410 7 Multicore 9 Centrifuge MCPW Cen St7-9 7170.064PE410 7 Multicore 10 Centrifuge MCPW Cen St7-10 7025.064PE410 7 Multicore 11 Centrifuge MCPW Cen St7-11 4887.364PE410 7 Multicore 12 Centrifuge MCPW Cen St7-12 9372.864PE410 7 Multicore 13 Centrifuge MCPW Cen St7-13 10615.464PE410 7 Multicore 14 Centrifuge MCPW Cen St7-14 11127.764PE410 7 Multicore 15 Centrifuge MCPW Cen St7-15 11879.564PE410 7 Multicore 16 Centrifuge MCPW Cen St7-16 13992.264PE410 7 Multicore 17 Centrifuge MCPW Cen St7-17 12783.564PE410 7 Multicore 18 Centrifuge MCPW Cen St7-18 16639.264PE410 7 Multicore 19 Centrifuge MCPW Cen St7-19 16682.264PE410 7 Multicore 20 Centrifuge MCPW Cen St7-20 18614.564PE410 7 Multicore 21 Centrifuge MCPW Cen St7-21 20170.264PE410 7 Multicore 22 Centrifuge MCPW Cen St7-22 20149.764PE410 7 Multicore 23 Centrifuge MCPW Cen St7-23 19274.964PE410 7 Multicore 24 Centrifuge MCPW Cen St7-24 21556.664PE410 7 Multicore 25 Centrifuge MCPW Cen St7-25 21191.564PE410 7 Multicore 26 Centrifuge MCPW Cen St7-26 22668.464PE410 7 Multicore 27 Centrifuge MCPW Cen St7-27 21738.6
64PE410 9 Multicore 0 Rhizons MCPWRH St9-0 1867.064PE410 9 Multicore 1 Rhizons MCPWRH St9-1 2404.164PE410 9 Multicore 2 Rhizons MCPWRH St9-2 3987.564PE410 9 Multicore 3 Rhizons MCPWRH St9-3 4412.464PE410 9 Multicore 4 Rhizons MCPWRH St9-4 5277.364PE410 9 Multicore 5 Rhizons MCPWRH St9-5 5450.964PE410 9 Multicore 6 Rhizons MCPWRH St9-6 6165.264PE410 9 Multicore 7 Rhizons MCPWRH St9-7 7005.064PE410 9 Multicore 8 Rhizons MCPWRH St9-8 7821.464PE410 9 Multicore 9 Rhizons MCPWRH St9-9 8703.264PE410 9 Multicore 10 Rhizons MCPWRH St9-10 9107.364PE410 9 Multicore 11 Rhizons MCPWRH St9-11 9847.564PE410 9 Multicore 12 Rhizons MCPWRH St9-12 6626.564PE410 9 Multicore 13 Rhizons MCPWRH St9-13 12211.364PE410 9 Multicore 14 Rhizons MCPWRH St9-14 9675.664PE410 9 Multicore 15 Rhizons MCPWRH St9-15 13344.764PE410 9 Multicore 16 Rhizons MCPWRH St9-16 13275.964PE410 9 Multicore 19 Rhizons MCPWRH St9-19 14833.864PE410 9 Multicore 20 Rhizons MCPWRH St9-20 15347.164PE410 9 Multicore 21 Rhizons MCPWRH St9-21 16090.564PE410 9 Multicore 23 Rhizons MCPWRH St9-23 17145.2
64PE410 9 Pistoncore 1 Centrifuge PCPWCentt9-1 17651.1 NO SEPTUM IN CAP 64PE410 9 Pistoncore 2 Centrifuge PCPWCentt9-2 16618.3

114
Appendix 16: Pore water DIC station 10
For depth # see section 12, pore water sampling
ANAL Q2 64PE410 NIOZ BALTIC 2016.ANRUN DIC-160527-MCPCPW St10R1.RUNDATE 27-5-2016TIME 9:46:37OPER SOCOMM Recalculate from RunDIC-160527- METH DIC DILUTIONUNIT µmol/l FACTOR
Cruise No. Station No. Cast No. Slice No. Extraction Sample ID CALC. GLOVEBAGFOR INFO ONL
64PE410 10 Multicore 0 Centrifuge MCPWCen St10-0 1571.6 1064PE410 10 Multicore 1 Centrifuge MCCen St10-1 2044.8 1064PE410 10 Multicore 2 Centrifuge MCCen St10-2 2056.0 1064PE410 10 Multicore 3 Centrifuge MCCen St10-3 1968.0 1064PE410 10 Multicore 4 Centrifuge MCCen St10-4 2265.7 1064PE410 10 Multicore 5 Centrifuge MCCen St10-5 2189.0 1064PE410 10 Multicore 6 Centrifuge MCCen St10-6 2257.1 1064PE410 10 Multicore 7 Centrifuge MCCen St10-7 2329.2 1064PE410 10 Multicore 8 Centrifuge MCCen St10-8 2329.8 1064PE410 10 Multicore 9 Centrifuge MCCen St10-9 2377.4 1064PE410 10 Multicore 10 Centrifuge MCCen St10-10 2230.7 1064PE410 10 Multicore 11 Centrifuge MCCen St10-11 3111.9 1064PE410 10 Multicore 12 Centrifuge MCCen St10-12 3443.2 1064PE410 10 Multicore 13 Centrifuge MCCen St10-13 2955.2 1064PE410 10 Multicore 14 Centrifuge MCCen St10-14 2507.5 1064PE410 10 Multicore 15 Centrifuge MCCen St10-15 2372.8 1064PE410 10 Multicore 16 Centrifuge MCCen St10-16 2903.2 1064PE410 10 Multicore 17 Centrifuge MCCen St10-17 2516.7 1064PE410 10 Multicore 18 Centrifuge MCCen St10-18 2590.7 1064PE410 10 Multicore 19 Centrifuge MCCen St10-19 2553.0 1064PE410 10 Multicore 20 Centrifuge MCCen St10-20 2414.4 1064PE410 10 Multicore 21 Centrifuge MCCen St10-21 2465.2 1064PE410 10 Multicore 23 Centrifuge MCCen St10-23 2635.5 1064PE410 10 Multicore 24 Centrifuge MCCen St10-24 2638.2 1064PE410 10 Multicore 25 Centrifuge MCCen St10-25 2504.9 1064PE410 10 Multicore 26 Centrifuge MCCen St10-26 2376.7 1064PE410 10 Multicore 27 Centrifuge MCCen St10-27 2654.0 1064PE410 10 Multicore 28 Centrifuge MCCen St10-28 2380.0 1064PE410 10 Multicore 29 Centrifuge MCCen St10-29 1948.1 10
64PE410 10 Pistoncore 1 Centrifuge PCCen St10-1 1183.7 1064PE410 10 Pistoncore 2 Centrifuge PCCen St10-2 2673.1 1064PE410 10 Pistoncore 4 Centrifuge PCCen St10-4 2637.5 1064PE410 10 Pistoncore 6 Centrifuge PCCen St10-6 3057.3 1064PE410 10 Pistoncore 7 Centrifuge PCCen St10-7 52.0 10

115
Appendix 17: HS station 7 and 9
ANAL Q2 64PE410 NIOZ BALTIC 2016.ANLRUN HS-160524-PW-PC_MC St7_St9R1.RUNDATE 24-5-2016TIME 10:41:43OPER SOCOMM Recalculate from RunHS-160524-PW-PC_MC St7_St9R1METH CALC. HS- COMMENTS DILUTION DILUTIONUNIT µmol/l FACTOR FACTORBaseline 0.252 GLOVEBAG LAB
Cruise No. Station No. Cast No. Bottle No. Depth (m) Sample ID FOR INFO ONLY
64PE410 9 2 5 99.4 CTD St9-2-5 064PE410 9 2 3 199..8 CTD St9-2-3 GOFLO 0 GO FLO BOTTLE
Cruise No. Station No. Cast No. Slice No. Extraction PC PW Rhizons St764PE410 7 Multicore 1 Rhizons PCPWRHSt7-1 202.5 464PE410 7 Multicore 2 Rhizons PC PW St7-2 271.1 464PE410 7 Multicore 3 Rhizons PC PW St7-3 29.8 464PE410 7 Multicore 4 Rhizons PC PW St7-4 23.0 464PE410 7 Multicore 5 Rhizons PC PW St7-5 9.6 464PE410 7 Multicore 6 Rhizons PC PW St7-6 10.1 464PE410 7 Multicore 7 Rhizons PC PW St7-7 7.2 464PE410 7 Multicore 8 Rhizons PC PW St7-8 7.0 464PE410 7 Multicore 9 Rhizons PC PW St7-9 5.4 464PE410 7 Multicore 10 Rhizons PC PW St7-10 3.5 464PE410 7 Multicore 11 Rhizons PC PW St7-11 2.9 464PE410 7 Multicore 12 Rhizons PC PW St7-12 2.0 464PE410 7 Multicore 13 Rhizons PC PW St7-15 1.1 464PE410 7 Multicore 14 Rhizons PC PW St7-16 0.0 464PE410 7 Multicore 15 Rhizons PC PW St7-17 0.0 464PE410 7 Multicore 16 Rhizons PC PW St7-18 0.0 464PE410 7 Multicore 17 Rhizons PC PW St7-21 0.0 464PE410 7 Multicore 18 Rhizons PC PW St7-22 0.0 464PE410 7 Multicore 19 Rhizons PC PW St7-23 0.0 464PE410 7 Multicore 20 Rhizons PC PW St7-24 0.0 464PE410 7 Multicore 21 Rhizons PC PW St7-26 0.0 464PE410 7 Multicore 22 Rhizons PC PW St7-27 0.0 464PE410 7 Multicore 23 Rhizons PC PW St7-31 0.0 464PE410 7 Multicore 24 Rhizons PC PW St7-32 0.0 NO SEPTUM IN CAP 464PE410 7 Multicore 25 Rhizons PC PW St7-34 0.0 NO SEPTUM IN CAP 464PE410 7 Multicore 26 Rhizons PC PW St7-35 0.0 464PE410 7 Multicore 27 Rhizons PCPWRHSt7-36 0.0 4

116
For slice or depth # see section 12, pore water sampling
MC PW Rhizons St964PE435 9 Multicore 0 Rhizons MCPW RH St9-0 0.0 464PE434 9 Multicore 1 Rhizons MCPW RH St9-1 0.0 464PE433 9 Multicore 2 Rhizons MCPW RH St9-2 3.3 464PE432 9 Multicore 3 Rhizons MCPW RH St9-3 75.6 464PE431 9 Multicore 4 Rhizons MCPW RH St9-4 221.1 464PE430 9 Multicore 5 Rhizons MCPW RH St9-5 151.8 NO SEPTUM IN CAP 464PE429 9 Multicore 6 Rhizons MCPW RH St9-6 423.1 464PE428 9 Multicore 7 Rhizons MCPW RH St9-7 522.8 464PE427 9 Multicore 8 Rhizons MCPW RH St9-8 500.5 464PE426 9 Multicore 9 Rhizons MCPW RH St9-9 645.8 464PE425 9 Multicore 10 Rhizons MCPW RH St9-10 753.3 464PE424 9 Multicore 11 Rhizons MCPW RH St9-11 798.0 464PE423 9 Multicore 12 Rhizons MCPW RH St9-12 927.2 464PE422 9 Multicore 13 Rhizons MCPW RH St9-13 983.8 464PE421 9 Multicore 14 Rhizons MCPW RH St9-14 1226.4 464PE420 9 Multicore 15 Rhizons MCPW RH St9-15 1326.1 464PE419 9 Multicore 16 Rhizons MCPW RH St9-16 1065.2 464PE418 9 Multicore 17 Rhizons MCPW RH St9-17 1537.7 464PE417 9 Multicore 18 Rhizons MCPW RH St9-18 1283.8 464PE416 9 Multicore 19 Rhizons MCPW RH St9-19 2119.3 4 364PE415 9 Multicore 20 Rhizons MCPW RH St9-20 1891.1 4 364PE414 9 Multicore 21 Rhizons MCPW RH St9-21 1771.5 4 364PE413 9 Multicore 22 Rhizons MCPW RH St9-22 565.9 NO SEPTUM IN CAP 464PE412 9 Multicore 23 Rhizons MCPW RH St9-23 2173.9 4 3

117
Appendix 18: HS station 9 (piston core) and 10
ANAL Q2 64PE411 FeVICI BALTIC 2016.ANLRUN HS-160529-CTD S20_S17-64PE410 PCMC S10R1.RUNDATE 29-5-2016TIME 13:26:31OPER SO ERROR MESSAGE WITH RECALCULATION TH COMM Recalculate from RunHS-160529-CTD S20_S17-64PE41 METH CALC HS DILUTION UNIT µmol/L FACTOR Baseline GLOVEBAG
Cruise No.Station No. Cast No. Bottle No. Depth (m) Sample ID FOR INFO ONLY64PE410
64PE410 10 2 1 199.8 CTD St10-2-1 0.064PE410 10 2 3 149.7 CTD St10-2-3 0.064PE410 10 4 4 100 CTD St10-4-4 0.0
Cruise No.Station No. Cast No. Slice No. Extraction
64PE410 10 Pistoncore 1 Centrifuge PCCen St10-1 AlX10 0.0 1064PE410 10 Pistoncore 2 Centrifuge PCCen St10-2 AlX10 0.0 1064PE410 10 Pistoncore 3 Centrifuge PCCen St10-3 AlX10 0.0 1064PE410 10 Pistoncore 4 Centrifuge PCCen St10-4 AlX10 0.0 1064PE410 10 Pistoncore 5 Centrifuge PCCen St10-5 AlX10 0.0 1064PE410 10 Pistoncore 6 Centrifuge PCCen St10-6 AlX10 0.0 1064PE410 10 Pistoncore 7 Centrifuge PCCen St10-7 AlX10 0.0 10
64PE410 9 Pistoncore 1 Centrifuge PCCen St9-1 AlX10 1699.2 1064PE410 9 Pistoncore 2 Centrifuge PCCen St9-2 AlX10 485.2 1064PE410 9 Pistoncore 3 Centrifuge PCCen St9-3 AlX10 37.1 1064PE410 9 Pistoncore 4 Centrifuge PCCen St9-4 AlX10 29.1 1064PE410 9 Pistoncore 5 Centrifuge PCCen St9-5 AlX10 6.1 1064PE410 9 Pistoncore 18 Centrifuge PCCen St9-18AlX10 2.5 1064PE410 9 Pistoncore 19 Centrifuge PCCen St9-19AlX10 0.0 1064PE410 9 Pistoncore 40 Centrifuge PCCen St9-40AlX10 0.0 10
64PE410 10 Multicore 0 Centrifuge MCCen St10-0 AlX10 0.0 1064PE410 10 Multicore 1 Centrifuge MCCen St10-1 AlX10 0.0 1064PE410 10 Multicore 2 Centrifuge MCCen St10-2 AlX10 0.0 1064PE410 10 Multicore 3 Centrifuge MCCen St10-3 AlX10 0.0 1064PE410 10 Multicore 4 Centrifuge MCCen St10-4 AlX10 0.0 1064PE410 10 Multicore 5 Centrifuge MCCen St10-5 AlX10 0.0 1064PE410 10 Multicore 6 Centrifuge MCCen St10-6 AlX10 2.5 1064PE410 10 Multicore 7 Centrifuge MCCen St10-7 AlX10 6.0 1064PE410 10 Multicore 8 Centrifuge MCCen St10-8 AlX10 7.7 1064PE410 10 Multicore 9 Centrifuge MCCen St10-9 AlX10 10.2 1064PE410 10 Multicore 10 Centrifuge MCCen St10-10 AlX10 10.5 1064PE410 10 Multicore 11 Centrifuge MCCen St10-11 AlX10 9.1 1064PE410 10 Multicore 12 Centrifuge MCCen St10-12 AlX10 7.6 1064PE410 10 Multicore 13 Centrifuge MCCen St10-13 AlX10 19.9 1064PE410 10 Multicore 14 Centrifuge MCCen St10-14 AlX10 14.7 1064PE410 10 Multicore 15 Centrifuge MCCen St10-15 AlX10 11.8 1064PE410 10 Multicore 16 Centrifuge MCCen St10-16 AlX10 11.8 1064PE410 10 Multicore 17 Centrifuge MCCen St10-17 AlX10 33.2 1064PE410 10 Multicore 18 Centrifuge MCCen St10-18 AlX10 32.3 1064PE410 10 Multicore 19 Centrifuge MCCen St10-19 AlX10 14.4 1064PE410 10 Multicore 20 Centrifuge MCCen St10-20 AlX10 29.0 1064PE410 10 Multicore 21 Centrifuge MCCen St10-21 AlX10 32.1 1064PE410 10 Multicore 23 Centrifuge MCCen St10-23 AlX10 43.6 1064PE410 10 Multicore 24 Centrifuge MCCen St10-24 AlX10 31.1 1064PE410 10 Multicore 25 Centrifuge MCCen St10-25 AlX10 38.8 1064PE410 10 Multicore 26 Centrifuge MCCen St10-26 AlX10 85.2 1064PE410 10 Multicore 27 Centrifuge MCCen St10-27 AlX10 36.2 1064PE410 10 Multicore 28 Centrifuge MCCen St10-28 AlX10 55.5 1064PE410 10 Multicore 29 Centrifuge MCCen St10-29 AlX10 26.1 1064PE410 10 Multicore 30 Centrifuge MCCen St10-30 AlX10 16.6 10

118
Appendix 19: Theoretical vs actual piston core length
Cruise Pelagia NIOZ BALTIC
BALT 001BALT 002
BALT 003BALT 004
BALT 005BALT 006
BALT 007BALT 008
BALT 009cast 7-2
cast 7-3cast 7-5
cast 7-6cast 7-8
cast 9-6cast 9-10
cast 10-6cast 10-10
Caracteristics W
ater depth (m)
49.0049.00
49.0051.00
51.0075.00
75.00240.00
240.00length of m
ain cable (m)
49.0049.00
49.0051.00
51.0075.00
75.00232.00
232.00length of pipe (m
)13.35
13.3513.35
13.3513.35
16.2116.21
18.7118.71
Piston cable (m
) 17.95
17.9517.95
17.9517.95
Trigger arm cable (m
) 18.66
18.6618.66
18.6618.66
21.5321.53
24.0324.03
Free fall height (m) A
3.003.00
3.003.00
3.003.00
3.003.00
3.00rebound com
pensation (m) B
0.110.11
0.110.11
0.110.14
0.140.40
0.40Loop (m
) A+B
3.113.11
3.113.11
3.113.14
3.143.40
3.40R
ate of compensation
100%100%
100%100%
100%100%
100%100%
100%M
asses (kg)B
omb
00
00
00
00
0C
orer in water w
ithout trigger arm (kN
)14.48
14.4814.48
14.4814.48
14.4814.48
14.4814.48
Corer in air w
ithout trigger arm (kg)
17331785
17331733
17381733
17331733
1733C
orer in air (kg)1870
18701870
18701870
18701870
18701870
All parts of trigger arm
in air (kg)136
136136
136136
136136
136136
Sensors
Bom
b30014
3001430014
3001430014
3001430014
3001430014
Trigger arm30013
3001330013
3001330013
3001330013
3001330013
Core
Measured penetration (m
)13.35
13.3513.35
13.4013.50
16.2016.40
18.5018.30
Length of core (m)
12.4812.22
12.6611.84
12.4014.40
14.6016.77
15.93pénétration visuelle (m
)./.
./../.
./../.
./../.
./.R
ate of sediment in the corer
93.4%91.5%
94.8%88.3%
91.8%88.8%
87.8%90.6%
87.0%Q
uality levelC
ableM
easured rebound (m)
Theorical total rebound (m)
Duration of rebound (m
)M
aximum
of cable tension (t)S
teelS
teelS
teelS
teelS
teel 14mm
Steel
Steel
Steel
Steel
Rem
arquesG
ood coreG
ood coreG
ood coreG
ood coreG
ood coreG
ood coreG
ood coreG
ood coreG
ood coreSoft sedim
ent,Soft sedim
entSoft sedim
entBut low
er re-W
eight dropsSoft sedim
entsam
e as 7But looks like
Also here it
weight drops
covery. Weight
to hard, so veryw
eight dropsfirst w
ater looked like
hard in winch
drops hardsoft m
aterialto hard on w
inchcam
e in linerfirst w
aterm
ay havein liner.
effect on recovery

119