Embed Size (px)
Citation preview

KPSC Case No. 2OO5-0034 1 AG 1 S t Set Data Request
I tem No. 221
I12 BLUE CHIP FINANCIAL, FORECASTS 13 JULY 1,2005 1 Page 15 of41
A Sampling Of Views On The Economy, Financial Markets And Government Policy [viewpoints: I Excerpted From Recent Reports Issued By Our Blue Chip Panel Members And Others p If Housing Cools, What Picks Up the Slack?
In our view, we have a potentially destabilizing situation on our hands. First, the effect of the housing boom has been so powerful that real estate has accounted for 70% of the rise in overall household net worth since 2001, Over 40% of all private-sectorjobs created since 2001 have been in housing-related sectors, such as construction, real estate and mortgage brokers. Over the past four years, consumer spending and residential construction collectively has accounted for 90% of the total growth in GDP. If this bull market ends, what will be left to provide the stimulus for the overall economy is a pretty valid question?
Since more people own a home than a stock, and because so much of the activity is leveraged, not to mention that the wealth effect on con- sumer spending is two-to-three times more powerful than the equity market, the consequences of even a small decline in home prices could be just as severe as the fallout we saw in stocks back in 2000-2001. It is also important to note that while homeowners may well stay in their home if prices were to fall - depending on their net home equity posi- tion - the article in the Economist aptly concluded that “over-exposed investors are more likely 10 sell, especially ifrents do not cover their itrt erest payment 5.’’
This is no longer a case of the so-called “fundamentals” (interest rates, demographics, land supply) driving home prices but pure speculation and widespread accessibility to ‘buy now, pay later’ mortgage products -the primary factors driving the sector any more are massive leverage and speculation, Sub-prime mortgage borrowers accounted for a 28% share of total new mortgage lending in the second half of 2003 versus 5% a decade ago. Fully 17% of homeowners today or almost one in five have a loan-to-value ratio of 95% or more, up from a 3% share fifteen years ago.
On the speculation side, 23% of all homes bought in the past year were not by primary homeowners but by investors and a further 13% was activity in second homes. In addition, 42% of all first-time buyers made no down payment on their house purchase last year (this represents 25% of all buyers, and is up froni almost 0% just five years ago). Cali- fornia, as was the case in the late- 19SOs, is at the center of the bubble - where over 60% of new mortgages so far this year have been in either interest-only or negative-amortization loans compared with an 8% share i n 20071 (the national figure is over 30%) In the areas of the country that have experienced the hottest price appreciation, ARMS have risen to 50% share of total mortgage issuance, leaving these homeowners more subject to the vagaries of the Fed rate cycle than the action at the longer end of the curve.
As for house prices, they have moved so far out of whack with inconies. Moreover, households have loaded themselves up with so much debt that even in this low interest rate environment over one-third of I.J.S. households are now devoting over one.-third of their income to their niortgage payments. Every 1 in S households or 12% are now seeing over half their income siphoned off toward monthly mortgage costs. Homeowner affordnbility is now, believe i t or not, at a 13-year low. The household sector’s debt-service ratio in QI rose to 13.4% from 13.2% in 2OO-tQJ - this is a ratio is at an all-time high despite the su- per-low intercst rate environment. These numbers are quite telling be- cause they signill that even sinall increinental shifts in interest rates and home prices this cycle could result i n soiiie destabilizing economic and financial conditions.
It’s becoming very clear that the regulators are becoming increasingly concerned on this file. While our research found that interest rate movements are six times more important in determining home price .- $ .
values than shifts in personal income growth, during this cycle there has .- been an added ‘torque’ from the sharp relaxation in credit-scoring from the lenders and the proliferation of new product This is vividly illus- trated by the fact that the Fed’s loan officer survey shows that mortgage standards have actually eased some 13-percentage points over the past three years. The regulators are clearly concerned, which is why the Fed and other overseers recently instructed lenders making home-equity lines of credit to conduct more in-depth analysis of borrower income, debt levels and the ability to repay.
The BusitiessCVeek article said that the regulators are actually now draft. ing more strict guidelines for plain-vanilla mortgage lending as well. Don’t forget the state regulators - and w e just saw the Illinois legisla- ture pass a bill that gives the state agency responsible for banks the power to review mortgage applications in lower income areas to deter- mine whether loan counseling should be recommended before the mort- gage is approved (and at the expense of the loan originator).
- -
We examined 52 urban areas in the USA with populations of one mil- lion or more and assessed their individual home price-to-personal- income ratios in an historical perspective. Fully 75% are overextended in terms of having prices in the past year running ahead of incomes; and at least 60% are in bubble territon, defined by areas that have their price-to-income ratios more than one-standard deviation away from the historical norm. So Mr. Greenspan is correct -- there is not national housing bubble but the majority of the country is in a froth.
Home prices have been rising I O S b annually for the past five years. As the University of Michigan surve) told us recently, almost one-quarter of households believe” now is a good time to buy because housing is a good investment” and prices are seen going even higher from where they are. What that tells us is that the belief system in the bull market in housing is now so strong that even a flattening-out in housing values would have a material impact on consumer confidence, retail sales, the savings rate and GDP. A move to stagnant home price growth or even an outright decline is inevitable, if the pattern of other housing bubbles overseas is copied on this side of the pond ( U K , Australia, Ireland, and Netherlands). As an Ecotiotttisr article noted, “nnotlier ivortFitig lessoti f iom C J ~ J . O O C ~ ~ O ~ America i.r flint el en n mere levditig ojlioirse prices con trigger n sharp slorva“wn i17 consiinier spending. ”
In our weekly we ran some simulations and found out how the economy would respond if the bull market in housing were to fizzle and home prices went from 15% to 0% in the course of the next six months. Here are the numbers: Real GDP gronth in 2005 would go from our estimate of 3.3% to 2.9%; and for 2006 it uould go from 3.1% to 2.0%. So most of the impact from a swing to stagnant housing gi’owth would be felt next year, and result in just over a percentage point subtraction off GDP growth. A 10% decline would practically lock us into a recession-type environment and we estimate that a decline of that magnitude would result in GDP growth of barely more than 1%.
In the OY0 home price appreciation scenario, the biggest hit would be to housing construction, which would go from our current estimate of +0.5% for 2006 to -8%; and consumer spending on durables, which goes from 2.5% to 0.2%. The personal savings rate would go to 2.4% instead of I “8% from its current Ieve~ of 0.8% as credit growth throttles back. (Coiititiucd on tiex[ pnge)
c
I JULY I , 2005 BLUl ~ - -
KPSC Case No. 2005-00.34 1 AG 1 St Set Data Request
I tem No. 22 1 Page 16 of 41
A Sampling Of Views On The Economy, Financial Markets And Government Policy Excerpted From Recent Reports Issued By Our Blue Chip Panel Members And Others ---
What is interesting in this is that we have a litmus test in the UK, where home priced have not yet gone down in absolute terms but the year-on- year growth in housing values have slowed to 3% from over 22% at the June/2004 peak. Over that time we saw year-on-year retail sales growth sag from 7.4% to 1.3%. The wealth effect has been so great that GDP growth has softened from 3.5% in the four quarters before home price trends peaked to a 2.5% annual rate since, which more or less is in line with our projections for what it would mean for US. growth if home prices went from 5th gear to neutral. We’ve seen this same develop- ment take place in Australia and in both cases, all i t has taken is a slow- ing in home price growth - not an actual decfine - to push the central banks to the sidelines. But for all the talk about how lower market in- terest rates will perpetuate the U.S. bubble, in the UK what we have seen is both long-term rates and home price growth recede together because since the peak, 10-year Gilt yields have fallen 80 basis points. That’s right Virginia - home price growth and bond yields can indeed go down in tandem,just as the simultaneous decline in long-term rates and tech stocks back in 2000,2001 and 2002.
David A Rosenberg, Aderrill Lyiicli Ecotiomics, New York, NY
Bonds For The Long Run
At the June 29-30 FOMC meeting, the Fed is expected to mark the one- year anniversary of its shift into tightening mode with a ninth consecu- tive quarter-point rate hike, lifting the funds target to 3.25%. A couple 9 of weeks before, on June 14, another anniversary will take place: it will ‘ be one year since the 10-year Treasury closed at its multi-year peak of 4.87%. During the past year, while overnight rates have risen by 200 bps, 10-year yields have fallen nearly 9 0 bps. The yield curve has flat- tened with a twist before, but given the amotint of Fed tightening, the rally in the bond market has been unprecedented.
From a base just under 4%0, there have been a couple of attempts at higher yields: in early December 2003 (to above 4.40%) and late March 2005 (to above 4,60%)--note the “higher highs”. However, these at- tempts did not last as yields are currently back under 4%. The persistent low yields have been called a “conundrum”. There is an array of rea- sons: global economic slowdown, low/falling “all-in” inflation expecta- tions, low/falling global bond yields relative to the U.S., a still profit- able carry trade, Asian central bank buying, a shortage of long-term bonds, pension re-regulation, and, most recently, a flight to quality arising from credit issues and EU instability.
On the surface, these mostly appear as technical or cyclical factors that should ebb over time, allowing bond yields to better reflect what the Fed has been doing. For example, Asian central banks have already slowed their purchases. However, some of these factors have underly- ing fundamental and secular dimensions.
For example, the shortage of long-term bonds arose because supply was constricted owing to meager corporate offerings from firms flush with cash and Treasury’s cancellation of the 30-year bond, while the demand for long duration assets was growing (particularly by pensions). At some point, Isancr profit growth will stoke corporate issuance and the Treasury is alrcady considering re-introduction of the 30 year. How-
i!,o ever, we \‘ie\v the demand growth as a reflection o f ? demographically- motivated shift i n the demand for bonds. The first of the Baby Boomers turn 60 nest year and their cohorts are collectively causing an aggregate portfolio preference shift towards income generation and capital preser- vation. This could persist for years. As another example, “all-in” infla-
tion expectations reflect both the expected inflation-to-maturity plus an inflation risk premium. While the former is highly cyclical, we judge the latter to be on a secular downtrend. The proliferation of formal in- flation targets andor the dual forces of disinflation (technology and globalization) have fimdamentally reduced the bias towards inflation. This was long prophesized, but it seems that bond markets needed to witness a minimal inflation reaction to soaring oil prices before believ- ing. This too could persist for a while.
The bottom line is that the fundamental and secular trends suggest that the equilibrium level of long bond yields is below where it was before, with the yield curve commensurately flatter. In consequence, we have significantly lowered our outlook for US. long-term yields by as much as 130 bps. Moreover, the U.S. and global economies are slowing, sug- gesting that the Fed’s tightening moves could well be near an end.
Although we judge the long-run equilibrium for the fed funds rate to be in the 4% to 4.25% range I , oil price headwinds and lingering inflation- dampening economic slack suggest that the Fed will shift from its 25- bps-per-meeting pace to a more cautious clip. We look for fed h n d s to be 3.50% by year-end and to top out at that level for this cycle, holding a bit below normal owing to slightly below potential GDP growth. An- ticipation and realization of the Fed’s first pause has buoyed the bond market, and we look for 10-year yields to slip to 3.70% by year-end (and perhaps to even lower levels in the interim). As 2006 unfolds, increasing inflation and trade deficit risks owing to home equity fueled consumer spending, and the ebbing of some of the cyclical and techni- cal factors cited above shotild cause bond yields to start drifting up, \\ ith 10 years in the 4.10% range by the end of next year.
Sherry Cooper, BMO Ne,sbitt Biotir, Toroilto, Cotincia
,\Ieasured In Both Action And \\‘ords
The musings of various Fed officials indicate a consensus persists for sticking to a measured course of hiking interest rates 25 basis points per meeting Comments of Jeffrey Lacker, President of the Federal Reserve Bank of Richmond, Lvere representative: ‘ I . . .we’re fairly accommoda- ti\e at these rates ... I think it is too early to say when we’re going to stop. It‘s obviously going to be data-dependent.”
The focus for the upcoming June 15-29 FOMC meeting instead will again be on language: Will the FOMC remove the “measured” phrase, s i p l i n g the possibility of an early end of the tightening cycle? Al- though the prospects for removal of “measured” increase with each rate hike. we think i t is too soon to expect this key word to be dropped from thr. statement. In his testimony before the Joint Economic Committee last week, Chairman Greenspan included that portion of the FOMC statement in his prepared remarks, indicating continued con- tentment with such language. Removal of “measured” might be taken as a sign of an imminent pause or end to the tightening process. We think i t is premature for the FOiMC to want to transmit such a message.
We conlinue to believe that the market is pricing in too little Fed tight- ening beyond the nest hvo FOMC meetings. In the near term, the indus- trial data are likely to remain soft as the inventory cycle runs its course. However, by the fall or winter, we expect manufacturing to reaccelerate, reinforcing the Fed’s determination to push financial con- ditions toward a more neutral level.
Bill Dirdley, Jnti Hcrtziiis, Ed hich‘elq~ a t ~ d Aridrew Tilton, Golthf l t~ Slicli.r Ecotlonric Re.scrit ch, New I b , t NY

1 (=BLUE CHIP FINANCIAL FORECASTS JULY 1,2005 1 I
I
KPSC Case No. 2005-0034 1 AG 1 St Set Data Request ,
Item No. 22 1 Page 17 o f 4 1
1. Please provide your forecasts of the seasonally adjusted annualized percent change in the following variables during Q2 2005?
Real GDP Chained GDP Price Index Consumer Price Index Consensus 3.3% 2.7% 3.9% Top 10 Average 3.8% Bottom 10 Average 2.8% ! 3.4%
2.0% 4.7% 2.7%
2. A. Will the FOMC drop the phrase “measured pace” from its June 28Ih-29lh policy statement
(Percentage of those responding) _I Yes No 14.3% 85.7%
B. What will be the FOMC’s federal hnds rate target at the end of 2005 and 2006?
Federal hnds rate target at the end of: 2005 2-
Consensus 3.83% 4.30% Top 10 Average 4.13% 4.88% Bottom 10 Average 3.48% 3.75%
3. Will 10-year Treasury note yields rise to 5.0% before the end of this year? Will they rise to 5.0% by the end of 2006?
bv the end of 2006? Will 10-year Treasury note yields rise to 5.0% Will 10-year Treasury note yields rise to 5.0%
bv the end of 2005? - Yes - No - Yes - No 28.6% 7 1.4% 76.2% 23.8%
4. The 12-month change in the core Consumer Price Index stood at 2.2% in May. What will be the December.over-December increase in the core CPI in 2005 and 2006?
12-month percent change in core CPI as of December: goJ ____ 2005
Top 10 Average 2.7% 2.9% Consensus 2.4% 2.5%
Bottom 10 Average 2.1% 2.1%
5. A What will be the price of crude oil at the end of this year?
Price of West Texas Intermediate crude oil on December 3 1.200.5
Consensus $50.20 per barrel Top 10 Average Bottom 10 Average
$56.83 per barrel $43.60 per barrel
B. Will the price of crude oil increase to $100 per barrel at some point within the next five years?
(Percentage of those responding) yeJ No 14.3% 85.7%
6. The Institute of Supply Management’s Index of activity in the manufachiring sector fell to 5 1.4 in May 2005 versus its peak of 62.8 in January 2004. Several analysts have noted that the FOMC has never tightened policy when the ISM was below the 50 level. Do you think the ISM index is likely to fall below the 50 level at some point this year?
(Percentage of those responding) - Yes No 40.5% 59.5%
B. If the IShl index does fall below the SO level do you believe that would aulomatically preclude further tightening by the FOMC?
(Percentage of those responding) .__ Yes __ No 4.8% 95.2%

I JULY 1,2005 S BLUE
KPSC Case No. 2005-0034 1 AG 1 St Set Data Request
Item No. 221 Page 18 of41
,
Oct Nov Dec Monthly Indicator Jan Feb Mar Apr May Jun Jly Aug Sep Retail and Food Service Sales (a) 0.0 0.7 0.3 1.6 -0.5 Total Auto & Truck Sales (b) Personal Income (a, current $) Personal Consumption (a, current $)
Consumer Sentiment (U. of Mich.) Household Employment (c) Non-hrm Payroll Employment (c) Unemployment Rate (“3) Average Hourly Earnings (‘82s) Average Hourly Earnings (current $) Non-farm Workweek (hrs.) Industrial Production (d) Capacity Utilization (%) ISM Index (formerly NAPM, g) Housing Starts (b) Housing Permits (b) New Home Sales (1-family, c) Construction Expenditures (a) Consumer Price Index (s.a., d) CPI ex. Food and Energy (s.a., d) Producer Price Index (n.s.a., d) Durable Goods Orders (a) L.eading Economic Indicators (6) Balance of Trade & Services (9
r Consumer Credit (e)
16.7 -2.4 -0. I 6.5
95.5 85
124 5.2
8.24 15.90 33.7 4.1
79.1 56.4
2.180 2.126 1,194
0.4 3.0 2.3 4.2
-1.0 -0.3
-58.1
16.8 0.5 0.7 3.4
94.1 -97 300 5.4
8.22 15.91 33.7
3.4 79.4 55.3
2.228 2.093 1,256
1.2 3.0 2.4 4.7
-0.1 -0.1
-60.1 Federal Funds Rate (%) 2.28 2 50 3-Mo. Treasury Bill Rate (%) 2.33 2.54 10-Year Treasury Note Yield (%) 4.22 4.17 4.50 2 4 4.14 _ _ ~ _ _ _ ~ --
19 2004 Monthly Indicator J a n Fcb M a r Apr May J u n Jly Aug Sep Oct Kov Dec Retail and Food Service Sales (a) 1 .o 0.6 2.1 -0.7 1.5 .0.5 0.8 . , Total Auto & Tnick Sales (b) 16.7 16.9 17.1 17.0 18.1 15.8 17.6 Personal lncome (a, current $) 0.3 0.4 0.4 0.6 0.5 0.2 0.2 Personal Consumption (a, current $) 0.6 0.6 0.4 0.1 1.0 -0.3 1.2 Consumer Credit (e) 10.5 1.5 2.8 3.5 2.7 2.6 7.9 Consumer Sentiment (U of Mich.) 103.8 94.4 95.8 94.2 90 2 95.6 96.7 Household Eniployment (c) 72 -147 74 237 201 312 481 Non-farm Payroll Employment (c) 117 94 320 337 250 106 83 Uneniployiiient Rate (“A) 5.7 Average Hourly Earnings (‘US) 8.27 Average Hourly Earnings (current $) 15.48 Non-hrni \Vorkweek (hrs.) 33.8
Capacity Utilization (?$) 76.9 ISM lnl les (fornierly NAPM, g) 62.8
I Housing Starts (b) 1.927 Housing Perniits (b) 1.963 I
New Home Salts (I-family, c) 1,155 Construction Espenditures (a) -0.4 Consumer Price Index (s.a., d) 1.9
1.1 3.3
Durable Goods Orders (3) -2.6 Lmding Econoniic Indicators (g) 0.4
Industrial Production (d) 2 1
C‘PI ex. Food and Energy (sa., d) Producer Price Index (n.s.a., d)
Balanct. of Tcidr S: Services (0 -46.0 I I Federnl Funds Rate (%) 1 .oo \ 3-Mu. Trensury Bill Rate (“A) 0.88
4.15 10-Year Trtxsury Note Yield (“A) I
5.6 8.27
15.51 33.8
3.1 77.7 62.1
1.852 1.984 1,158
0 6 1.7 1.2 2 1 3.9 0.0
-45.8 1.01 0.93 4.08
5 7 8 24
15.54 33.8
3 “2 77 4 62 3
2.007 2.064 1,253
2.3 1.7 1.6 1.5 5.9 0 8
.47.0 1.00 0.94 3.83
5.5 8.75
15.58 33.7 4.7
77.7 62.3
1.968 2.069 1,162
1.3 2.3 1.8 3.7
-2.7 0.1
-4 8 .4 1.00 0.94 4.35
5.6 8.21
15.61 33.8 5.4
78 2 62.6
I .973 2.129 1,213
0.6 3.1 1.7 4 9
-0.9 0.4
-48 7 1.00 0.91 4.72
5.6 5.5 8 20 8.23
1561 1570 33.6 33.8 4.7 4.8
77.8 78.3 61.2 61.6
1.827 1.986 2.014 2.114 1,205 1,104
0.4 0.8 3.3 3.0 1.9 1.8 4.0 3.8 1.3 1.9
-0.3 -0.3 -54.9 -51.3 1.03 1.26 1.27 1.33 4.73 4.50
-0 I 17.0 0.4 0.1 1.7
95.9 19
188 5.4
8.26 15.74 33.7
5.0 78.3 59.6
2.025 2.05s 1,165
0.3 2.7 1.7 3.3
-0.5 -0.3
-54.2 1.43 1.48 4.28
1.8 17.9 0.2 0.6 9.0
94.2 -131 130 5 “4
8.25 15 77 33.8
3.9 78.0 59.1
1.912 2.039 1,223
0.6 2.5 2.0 3.3 1.0
-0.2 -5 1.9 1.61 1.65 4.13
0.9 17.4 0.8 0.7 8. I
91.7 300 282 5.5
8 22 15.81 33.8 4.5
78.5 57.5
2.062 2.093 1,306
0.4 3.2 2.0 4.5
-1 .o -0.3
-55.6 1.76 1.76 4.10
0 0 16.8 0 4 0.4 0 9
92.8 466 132 5 4
8.7 I 15.81 33 7 3 7
78 7 57.6
1.807 2 093 1,175
1 .o 3.5 -.- -77
5.0 2.0 0.3
-59.0 1.93 2.07 4.19
1.3 18.9 4.0 0.9 4 2
97. I -137 155 5 1
8.23 15.85 33.7 4 4
79.2 57.3
2.050 2.081 1,247
1 .o 3.3 2.2 4.2 1.4 0.3
-54.7 2.16 2.19 4.23
17.3 0.5 0.9 3.9
92.6 357 122 5.2
8.19 15.95 33.7 3.6
79.4 55.2
1.833 2.02 1 1,313
0.7 3.1 2 3 4.9
-1.6 -0.6
-53.6 2.63 2.74
17.9 17.1 0.7 0.6 0.7
87.7 86.9 94.8 598 316 274 78 5.2 5.1
8 16 16.00 16.03 33.8 33.8 3.1 2.7
79.1 79.4 53.3 51.4
2005 2.009 2.148 2.050 1,316
0.5 3.5 2.8 2.2 2.2 4.8 3.5 1 9 0 0 -0.5
2 79 3.00 2 78 2.83
-57.0
(a) nioiitli-o\er-riiontli %O change; (b) millions, saar; (c) thousands, saur; (d) year-over-year % chnuge; (e) annualized % change; (0 ,$ billions; (g) level. lllost series arc subject to frequent government revisions. Use with care.

KPSC Case No. 2005-0034 1 AG 1 St Set Data Request
Item No. 221 Page 19 of 41
Thursday 30 Personal Income &PCE (May) Chicago PMI (Jun) Weekly Jobless Claims Factors Affecting Monetary
Reserves
Friday July 1 ISM Manufacturing (Jun) Unit Vehicle Sales (Jun) Construction Spending (May) Consumer Sentiment (Univ. of Michigan, Final, Jun)
Consumer Price Index (Jun) Retail Sales (Jun) Weekly Jobless Claims Factors Affecting Monetary
------ 13 Trade Balance (May) Trade Prices (Jun) Mortgage Applications
Reserves
11 6 U BLUE CHIP FINANCIAL FORECASTS I JULY 1 x 1
Monday June 27
Tuesday
~ O M C Meeting !8
lonsurner Confidence (Confer- :nce Board, (June) Meekly Store Sales
Wednesday 29 FOMC Meeting GDP (Final, QI) Corporate Profits (Final, QI) Mortgage Applications
4 Independence Day All U.S. Markets Closed
> :actory Orders (May)
6 ISM Non-Manufacturing (Jun) Weekly Store Sales Challenger survey (Jun) Mortgage Applications
7 Weekly Jobless Claims Factors Affecting Monetary
Reserves
8 Employment Report (Jun) Wholesale Trade (May) Consumer Credit (May)
- -- 12 Weekly Store Sales
11 15 Industrial Production (Jun) Producer Price Index (Jun) Consumer Sentiment (Univ. of Michigan, Preliminary, Jly) Empire State Index (Jly) Bank Credit (Jun) Business Inventories (May)
18
(Jul) NAHB Housing Market Index
19 Housing Starts (Jun) Weekly Store Sales
20 Mortgage Applications
21 Leading Indicators (Jun) Philadelphia Fed Index Jul)
meeting) Existing Home Sales (May) Weekly Jobless Claims Factors Affecting Monetary
FOMC Minutes (Jun 28 6 -2Ytb
Reserves
22 Durable Goods (May) New Home Sales (May)
25 Existing Home Sales (.Jim)
26 Consuiner Confidence (Confer- ence Board, (.Id) Weekly Store Sales
27 Durable Goods (Jun) New Home Sales (Jun) Beige Book for Aiig Ylh FOMC meeting Mortgage Applications
28 Personal Income &PCE (May) Chicago PMI (Jun) Weekly Jobless Claims Factors Affecting Monetay
Reserves
29 GDP (Advance, Q2) Enrploymcnt Cost Index (q?) Chicago PMI (Jul) Consumer Sentinlent (Univ. of Michigan, Final, Jul)
August 1 ISM Manufacturing (Jul) Unit Vehicle Sales (Jul) Constnickion Spending (Jun)
5 Employment Report (Jul) Consumer Credit (Jun)
2
Factory Orders (Jim) Challenger survey (Jul) Factors Affecting Monetary Weekly Store Sales

KPSC Case No. 2005-00341 AG 1 St Set Data Request
I temNo. 221 Page 20 of 41
1
BLUE CHIP FORECASTERS
Action Economics, LLC, Boulder, CO Dr. Michael Englund Banc of America Securities, LLC. New York, NY Dr. Mickey Levy and Dr. Peter E. Kretzmer Bank of Tokyo-Mitsubishi, Ltd., New York, N Y Christopher S. Rupkey Barclays Capital, New York, N Y Dean Maki Bear Steams & Co., New York, N Y Dr. John Ryding and Conrad DeQuadros BMO Nesbitt Burns, Toronto, Canada Dr. Sherry Cooper and Douglas Porter Briefing.com, Boston, MA Timothy E. Rogers Camilli Economics, New York Kathleen M. Camilli Chmura Economics & Analytics, Richmond, VA Dr. Christine Chmura and Dr. Xiaobing Shuai Classicalprinciples.com, Chicago, IL Dr. Robert J. Genetski Citigroup Asset Management, New York, N Y Brian Keyser CIearView Economics, LLC, Cleveland, O H
oDr~ Kenneth T. Mayland onierica Bank, Detroit, MI
Dana B. Johnson Cycledata Corp., San Diego, CA Robert S Powers DePrince R: Associates, Murfreesburo, TN Dr. Albert E. DePrince Jr. Deutsche Bank Securities, Inc., New York, N Y Dr. Peter Hooper and Dr. Joseph Lavorgna Fannie Mae, Washington, DC Dr. David W. Berson and Dr. Orawin 'T. Velz Georgia State University, Atlanta, G A Dr. Rajeev Dhawan and Emin Hajiyev Goldman Sachs R: Co , N e w York, NY Dr William Dudley Independent Economic Advisory, Providence, RI Gary L.. Ciminero, CFA ING Investment Management, Inc., Hartford, CT James A. Griftin J r J.P. Morgan Chase, New York, N Y Bruce Kasman and Robert Mellman JPMorgan Asset Management, Columbus, OH Dr. Anthony Chan J.W. Coons Advisois, LLC, Columbus, OH James W. Coons Kellner Economic Advisers, Part Washington, N Y
u D ~ , Irwin L. Kellner LA SallelABN AMRO Treasury Rcsearch, Chicago, IL Carl R. TannenbaLlm Loomis, SaYles LQ Company, L.P., Bloomfield, MI B[i;in tiorrigan and David Sowerby
Memll Lynch Economics, New York, Ny David Rosenberg, Gerald E. Cohen and Thomas Porcelli Jr. Mesirow Financial, Chicago, IL Diane Swonk Moody's Investors Service, New York, N Y John Lonski and John Puchalla Naroff Economic Advisors, Philadelphia, PA Dr. Joel L. Naroff National Association of Realtors, Washington, DC Dr. David A. L,ereah and Dr. S. Lawrence Yun National City Corporation, Cleveland, OH Richard DeKaser Nomiira Securities International, Inc., New York, NY Dr. David H. Resler and Gerald Zukowski Perna Associates, Hartford, CT Dr. Nicholas S . Perna PNC Financial Services Group, Pittsburgh, PA Dr. Stuart G. Hoffman Prudential Equity Group LLC, New York, NY Richard D. Rippe RBS Greenwich Capital Economics, Greenwich, CT Stephen Stanley and Michelle Girard Scotiabank, Toronto, Canada Aron Gampel and Dr. Warren Jestin Standard R: Poor's Corp , New York, N Y Dr. David M. Blitzer and David Wyss SunTrust Banks, Inc., Atlanta, GA Gregory L Miller and Christopher P. George Swiss Re, New York, N Y Kurt Karl The Northern Trust Company, Chicago, IL Paul L. Kasriel and Ashn G Bangalore Thredgold Economic Associates, Salt L.ake City, UT Jeff K . Thredgold T~LISCO Capital Management, Richmond, VA Alan Gayle UBS Warburg, Stamford. CT James O'Sullivan and Samuel Coffin U.S Trust Co., New York, HY Dr. Robert T. McGee and Nora C. Mirshafii Wachovia, Charlotte, NC Dr. John Silvia and Mark Vitner Wayne Hummer & Co., Chicago, IL William B. Hummer Wells Capital Management, San Francisco, CA Gary Schlossberg Woodworth Holdings, L.td , Sunmiit, NJ Jay N. Woodworth
CONTRIBUTORS TO IETERNATIONAL SURVEY Deutsche Bank Securities Inc., New York, NY ING Financial Markets, Loiidou, England Miziilio Research Institute, Tokyo, Japan Scotiabank, Toronto, Canada WestLB AG, Dtisseldorf, Gciiiiniiy
I

I
990001 805 1 www.aspenpublishers.com
KPSC Case No. 2005-00341 AG 1 St Set Data Request
Item No. 221 Page 21 of41

KPSC Case No. 2005-0034 1 AG 1 St Set Data Request
Item No. 22 1 Page 22 of 4 1
BLUE CHIP FINANCIAL FORECASTS
Top Analysts' Forecasts Of U.S. And Foreign Interest Rates,
Currency Values And The Factors That Influence Them.
Vd. 24, No. 6 June 1, 2005
I \ SPEN P U B L I S H E R S
BLUE CHIP FINANCIAL FORECASTS EXECUTIVE EDITOR: RANDELL E. MOORE 3663 Madison Ave. Kansas City, MO 64 1 1 1 Phone (816) 931-0131 Fax (8 16) 93 1-0430 E-mail: [email protected]
Publisher: Paul Gibson V.P., Circulation: Geny Centrowitz Marketing Manager: Dom Cervi
0 2005 Aspen Publishers, Inc.
Blue Chip Financial Forecasts (ISSN: 0741- 8345) is published monthly by Aspen Publish- ers, I 185 Avenue of the Americas, New York, NY 10036. All rights reserved. Printed in the U.S.A.
Subscriptions: $695 per year for print or e- mail delivery of 12 monthly issues. $825 per year for both print and e-mail delivery of 12 monthly issues. For niultiple..copy rates and site-license agreements call Terry Watkins toll free at 866473-9156, or contact her at terry.watkinsOaspenpublisliers.com
Customer Service: 1-800-234-1660 To Order: 1-800-638-8137 Customer Service Fss: 1-800-901-9075 E-mail: [email protected] Web Sites:www.aspenpublishers.com
www.bluechippubs.com
Blue Chip Financial Forecasts is a general circulation news monthly. No statement in this issue is to be construed as a recommendation to buy or sell securities or to provide invest- nient advice. The editor and Aspen Publishers, while considering the contents to be accurate and reliable, take no responsibility for the in- formation contained herein.
Copyright warning and notice: It is illegal tinder federal copyright law to reproduce all or part of this publication or its contents by pho- tocopying, e-mailing, faxing, scanning or any other nieans without the publisher's permis- sion. Federal copyright law (17 USC 101 et seq ) imposes a liability of up to $100,000 per issue for such infringement, costs and attor- ney's fees. A tevard is ofrered for informa- tion concerning illicit duplication.
, I - - ...L.. KPSC Case No. 2005-0034 1 AG I St Set Data Request
Item No. 22 1 Page 23 of 41
~ - -
............................................................................. P. 1 Domestic Commentary
Domestic Summary Table -- Table af consensus forecasts ................................. of U.S. interest rates and key economic assumptions P. 2
International Summary Table -- Table of consensus forecasts of international interest rates and fareign exchange rates .......................... P, 3
...................................................................... P. 3 International Commentary
Individual Panel Members' U.S. Forecasts -- Of interest rates and key assumptions for the next six quarters ......................................... p. 4-9
Individual Panel Members' International Forecasts Of /.-
international interest rates and foreign exchange rates ........................ p. 10-1 1 --i
Viewpoints -- A sampling of views on the economy, markets and government policy excerpted from recent reports issued by our panel members' ............................................................................. p. 12-13
Special Questions -- Results of twice annual long-range survey forecasts for the five years 2007 through 201 1 and the five-year period 20 12-20 16 ...................................................................................... p. 14
Databank -- Historical data on many key indicators of economic activity ...................................................................................... p. 15
Calendar -- Release dates for important upcoming economic data, FOMC meetings, etc. ....................................................................... p. 16
i List Of Contributing Economists -- To Domestic and '.- International survey ......................................................... inside of back cover

KPSC Case No. 2005-00341 AG 1 St Set Data Request
I tem No. 22 1 Page 24 of 4 1
-- Markets Priced For Less -______ Fed Tightening Than Consensus Predicts -
omestic Commentary The Treasury curve flattened to a new cy- 0 cal low in May as the 2-year/lO-year spread fell to a bit less than 50 basis points (versus cycle high of 266 basis points on July 31, 2003). Most ofthe narrowing occurred at the long end as the 10-year note made a late-month run at the psychologically important 4.00% level before being tumed back. The long end of the curve remains supported by inflationary concerns that remain largely "contained", anticipation that global pension reforms will leave nahiral buyers of long-dated credits (i.e. insurance companies, pension funds, etc.) scrambling for duration in the years ahead, continued Asian central bank demand and loads of short-covering. Traders are also aware that should 10-year yields fall much below 4.0% in coming months- setting of another mortgage refinancing frenzy--1ioldets of mortgage- backed paper will be forced to hedge their positions in the Treasury market, adding another layer of demand. Lessening concerns about an economic "soft patch" and reduced anxiety about corporate credits and potential hedge fund problems curtailed an earlier flight-to-safety bid in May that had buoyed prices of short-dated 'Treasuries.
Financial markets trade as if the Federal Resene is rapidly approach- ing its goal of policy neutrality. Though the FObIC is widely ex- pected by analysts and the markets to raise its federal funds rate tar- get by 25 basis points to 3.25% in late June, current fed funds futures market prices imply a better than even chance tliat policymakers will not raise rates in August or September and that total tightening by the Fed in the second half of the year will come to no more than 50 basis points. That Lvould produce a year's end federal funds rate target of 3.7596 versus 4.25% if policymakers wer'e to hike rates by a quarter point at each of this year's five remaining meetings.
."?olicyniakers were unaiiinious in their May 3rd decision to hike the 3 kkJuiids rate by a quarter point 3.00iu. The policy statement retained the key phrases that policy still remains "accoiniiiodntive" and that poli- cyniakers believe they can continue to remo\e the stimulus at a "measured" pace. However, there were t\vo key changes in the May statement that gave i t a niore hawkish tone veisiis tlie one issued in MarcIi. L x f t out in hlay was the statemrnt that "the risc in energy prices ... has not notably led through to core consiinicr prices." More- over, policymakers only downgratled tlie outlook on grotvth margin- ally. stating that "tlis solid pace olspcnding giou tli had slowed "sonie\vhar". Subsequently relcnse minutes ot' [lie May 3rd meeting confirmed that \\ hile doivnsicic risks to fro\\ t h had become more evident. most FOLK members asstinietl t h a t [hey \\ i:re "transitory."
The tlow of data since tlie ewly Mny FOMC mecting has proved that assuniption to he largely correct and that the so-called "soft patch" \ \as largel! confined to the manufacturing sectur. Following unes- pectccl softness i n niiicli oFtIie March data, solid April gains in non- farin payrolls. retail sales, housing starts. home sales and durable goods orders generally esceeded consensus expectations. Moreover, real GDP gro\vtli i n Q I \vas revised up from 3.191 to 3.5%. While the upu.nrd re\ ision t i a s not quitt: as strong as had been expected the coniposition of grov tli i n the quarter was niore balanced than previ- ously believed. I t is noiv estiniated the final sales (GDP minus inven- tories) rose at a 2.7% Kite veisus the 1.9% originally cstimated.
Underlying tlii: GDP re\ ision was ii sharp do\vnwartI atljustment iii
thc govcriiiiiciit's estimate ofthe net export ticf'icit, a slight boost in its estimate ofpcrson:il consumption and fastcr than pre\,iously esti- m;i[cd gmvtli i n residential investment. Oftsetting these adjustments, growth i n business tiseri invcstment wiis rcvisetl downward as was the contiibutioii made to GDI' growth by a s~\cclliiiy of business in- veiitoi y levels. Lcss than expccted sales o f c;irs and light trucks ap- pe;irs to accotint for a good bit of tlic bulge i n QI btisiiicss invento- ries and iesuliing pull-back i n niantifacturiny production over recent iiioiitlis. hlottii vehicle aiid p i t s production lcll 3.5% i n April after a
4.0% drop in March, bringing tlie level of assemblies to a three and a half year low. While current schedules imply an improvement in May and June assembly rates, tlie sharp drop i n prior months suggest Q2 vehicle output will fall below that in QI, shaving several tenths of a percentage point from Q2's rate of real GDP growth.
One other notable aspect of the just-released revision to Q 1 GDP were sharp upward revisions to personal income in Q-? 2004 and QI 2005 that almost certainly imply government benchmark revisions to the National Income and Product Accounts data to be released this summer will reveal stronger than previously thought growth in nomi- nal GDP at tlie end of last year.
As for economic groutli going Fonrard, the consensus now looks for real GDP to grow at an annualized rate of3.30io in Q2 and 3.4% in the second half of this year. This is a little less robust than was ex- pected a month ago but still iii close proximity to the economy's trend rate of growth. Solid gronth in personal income and continuing gains in job creation are expected to keep real PCE growth i n the vicinity of 3.0?/0-3.5% over the remainder of this year. Business in- vcstnicnt in equipnient and softuare is predicted to rebound nicely i n Q2 and beyond follou.ing the softness seen i n QI that may have pri- marily resulted from the end of the bonus depreciation allowance at the end of 2004. Bubble or not, residential iiivestnient, too, appears on track to post another solid gain i n Q2 and will likely continue to grow absent significantly higher mortgage rates. In the first four months of 2005 sales of new and existing homes were nearly 10% ahead oftlie record setting 2004 annual total. On the flip side, efforts to bring business inventories in line \\ it11 demand will almost cer- tainly cut into the rate of manufacturing output and real GDP growth in Q? and possibly Q3. Once tlie inventory overhang is addressed, however. gro\vth in protluction is likely to ievive. Net exports, too nil1 likely remain ;I drag on groutli ocer tlie remainder of the year. but siibtmct less fioni G D P than that secii in QI.
Iftlic FOMC is on the verge of pawing its tightening cycle, it has j ' c t to drop any hints to tliat cftcct. Fcd Cliaiiriian Alan Greenspan essen- tially laughed of! tlie notion tliat tlic FOMC had already achieved "policy neutrality" duiing a speech on May X I h aiid Chicago Fed Bank President Michael hlosko\\ said on May 76'" that the FOhIC can continue to hike intcrcst rates at :I "measwed pace". While Moskow said inflation espt'ctntious are well contained. he noted that sliortafes i n particular sectors o f t l i ~ labor market could push up Ia- bar costs. 'The day before. At1;inta Fetl Bank President Jack Guyiin categorically statcd that tlic Fctl 1iaJ not ieaclied a neutral policy stance. tliougli the Fed nxs nppacli ing a time of increasing uncer- tainty for nionetnry polic) . GII! n n also echoed earlier remarks b> Gi,eenspnn that some regional Iioiising m:irkets are eshibiting signs of frothiness Several Fetl sptxikers also 1i;ive recently noted that poli- cymakers continue to view the Ion level of long-tenii rates as a "co. nundnini", but a liaridftil ofproniiiient analysts are now piedicting that bond yields may reiiiain lo\\ for an extended period of time.
Consenstis Forecwts Tlic consensus predicts the federal funds rate ivill average 3.7% i n Q4 of this !.ear, implying that i f the FOMC continues to raise rates in quai ter-point increments that i t will tightt'n policy at just three of the fivc rsiii;iining iiicetings this year. The consensus sces perhaps 50 basis points of' additional tightening by the FOMC in 2006. Thc conscnsiis continues to predict that 10-year yields will eventitally rise to 5.0'10 nest yeai, but yiclds are falling
ttrfrt:\* oJ'/hir rrrolrtlr :S 1.1,s C ~ O ~ I Y P I I ~ I I V / i ) t w y t v t v ) .
S p c c h l Questions On page I.? aFthis issiic you \viII find the results of our twice-yearly long-iniiyc sun ey with consensus forecasts for the years 2007 thiough 20 I I nnci avernges fo r tlie five-year periods
f. Lib . t . , t r t liaii most analysts can cut tlicir forecasts ( r e i s page 2 f w . s ~ o t ~ -
2007-20 I I tilit1 2012-20 I6

K P S C Case No. 2005-00341 - A G 1 S t Set Data Request
Item No. 221 Page 25 of 41
I2 BLUE CHIP FINANCIAL FORECASTS JUNE 1,2005 I Consensus Forecasts Of U.S. Interest Rates And Key Assumptions' --
Consensus Forecasts-Quarterly Av 2Q - 3 4 -;.4Q 1Q 2Q '-.3
2005 2005 "2005 -2006 2006 ' 2006 3.0 -3.4 Ti 3.7 4.0 4.2 :4.3 2: 6.0 6.4 ).+ '6.7 7.0 7.2 7.3";
-- ----- I -------Average For Week Ending------ ----Average For Month---- Latest Q
Interest Rates Mav20 Mav 13 &jg& Apr.29 & Mar. Feb. 102005 Federal Funds Rate 3.01 2.99 2.96 2.78 2.79 2.63 2.50 2.47 Prime Rate 6.00 4.60 3.82 3.75 3.75 5.58 5.49 5.44
! LIBOR, 3-mo. 3.26 .3.26 3.22 3.19 3.15 3.02 2.82 2.84 Commercial Paper, I-mo. 2.95 2.97 2.97 2.89 2.84 2.67 2.49 2.50 Treasury bill, 3-mo. 2.88 2.8s 2.88 2.90 2.84 2.80 2.58 2.58 Treasury bill, 6-mo. 3.16 3.18 3.18 3.13 3.14 3.09 235 2.87 Treasury bill, 1 yr. 3.32 3.35 3.33 3.28 3.32 3.30 3.03 3..06 Treasury note, 2 yr. 3.62 3.68 3.65 3.57 3.65 3.73 3.35 3.44 Treasury note, 5 yr. 3.83 3.91 3.88 3.90 4.00 4.17 3.77 3.88 Treasury note, 10 yr. 4.11 4.21 4.22 4.26 4.34 4.50 4.17 4.30 Treasury note, 20 yr. 4.53 4.62 4.64 4.68 4.75 4.89 4.61 4.76 Corporate Aaa bond 5.10 5.20 5.25 5.27 5.33 5.40 5.20 5.32 Corporate Ban bond 6.02 6.03 6.02 6.01 6.05 6.06 5.82 5.97 State & L.ocal bonds 4.25 4.35 4.35 4.42 4.46 4.57 4.35 4.44 I-lome mortgage rate 5.71 5.77 5.75 5.80 5.86 5.93 5.63 5.76
I
___r____________________________________History _______________________________I________---
2Q 3 4 . 4 4 IQ 2 4 3Q 4Q 1 Q* Key Assumptions - - - . _ _ _ _ _ I _ _ _ I _ _ _ 2003 2003 2003 2004 2004 2004 2004 2005 Major Currency Index 90.8 90.7 87.8 85.3 88.0 86.5 81.9 S1.3 Real GDP 4.1 7.4 4.2 4.5 3.3 4.0 3.8 3.5 GDP Price Index 1.1 1.4 1.6 2.8 3.2 1.4 2.3 3.2 Consumer Price Index 0.4 2.2 0.9 4.0 4.4 1.7 3.4 2.5
available from The Il'flll S~rtv~.luiri.rrnl. Definitions reported here are same as those in FRSR H 15 Treasury yields arc reported on n constant mnturity b the U S Federal Reserve Board's Mtijor Currcncy Intlex is from FRSR H.10 and G.S. Historical data for Real GDP and GDP Chained Price Index arc from thc' Burc'aii of Eco- noiiiic Analysis (BEA). Consumer Price Indcx (CPI) history is from the Department of Labor's Bureau of Labor St:itistics (BLS)
U.S. Treasury Yie ld Curve U.S. 3-Mo. T-Bills & 10-Yr. T-Note Yield (Quarterly Average) History Forecast Week ended May 20,2005 and Year Ago v s
2Q 2005 and 3Q 2006 Consensus forecasts 7.00 6.50 - - 6 00 :" -X- Week ended 5/20/05
5.50 -- +Consensus 3Q 2006
-J Year Ago -
3rno 6rno lyr 2yr 5 y r lOyr 20yr IQ i a ia ia 10 10 ia 10 i a ia 1997 1998 1999 2000 2001 2002 2003 2005 2005 2006 Maturities
Corporate Bond Spreads As of week ended May 20,2005
400 , 400 375
300 275 250
125 - 75
375 $ 350
325 300 275 250 225 200 175 150 125 100 75
Corporale Bond Yield , J \.
3.2 3.1 \ , ' 4.0 4.2 4.4 4 .4 '
3.0 3.5 '' 3.8 4.1 4.2 4.3 3.0 3.4 3.7 4.0 4.1 4.2 3.2 3.7 4.0 4.1 4.3 4.3 3.5 3.8 4.1 4.3 4.5 4.5 3.1 4.1 4.3 4.5 4.6 4.7 4.0 4.3 4.6 4.7 4.9 4.9 4.3 4.6 4.8 5.0 5.1 5.1 4.7 5.0 5.2 5.4 5.5 5.5 5.3 5.6 5.9 6.1 6.3 6.3 6.1 6.4 6.7 6.9 7.0 7.1 4.4 4.7 4.9 5.0 5.1 5.2 5.8 6.1 6.3 6.5 6.6 6.6 Consensus Forecasts-Quarterly Avg. 2Q 3Q 4Q IQ 2Q 3Q ------ 2005 2005 2005 2006 2006 2006 81.3 82.2 81.5 80.9 80.5 80.4 3.3 3.4 3.4 3.3 3.3 3.4 2.6 2.1 2.2 2.3 2.2 2.2 3.9 2.4 2.5 2.6 2.6 2.5
_.
U . S . Treasury Yield Curve As of week ended Mav 20.2005
Aaa Corporate Bond Yield minus 10-Year T-Bond Yield
---+__t_- : ;:$ ;
0
1997 1998 1999 2000 2001 2002 2003 2004 2005 1997 1998 1999 2000 2001 2002 2003 2004 2005
IJ.S. Japan U.K. Switzerland Canada Australia Eurozone
IJS. Germany Japan U.K. France Italy Switzerland Canada Australia Spain Eurozone
0 U.S. Japan U.K. Switzerland Canada Australia Euro
Japan U.K. Switzerland Canada Australia Eurozone
------------- 3-Month Inte _____----_- History---- ____--
Month Year Latest: Ago: Ago:
3.31 3.19 1.31 0.06 0.06 0.03 4.84 4.91 4.59 0.75 0.75 0.2s 2.63 2.63 2.13 5.63 5.72 5.95 2.16 2.16 2.13
Latest: Ago: Ago: 4.05 4.27 4.73 3.30 3.4.5 4.32 1.27 1.27 l"46 4.33 4.57 5.15 3.31 3.45 4.36 3.50 3.61 4.54 2.00 2.10 2.7s 4.05 4.16 4.87 5.27 5.37 5.97 3.30 3.47 4.3s 3.35 3.51 4.43
3 6 .,12 .
3.48 3.86 4.16 0.10 0.10 ' 0.19 4.16 4.69 4.63 0.75 0.93 1.28 2.66 2.15 2.96 5.85 5.86 5.81 2.14 2.11 2.36 --
ent B o n d Yields'------ Consensus Forecasts Months From Now: 3 6 12
4.54 4.75 4.94 3.60 3.70 3.90 1.48 1.65 1.82 4.76 4.79 4.80 3.61 3.71 3.91 3.78 3.89 4.08 2.26 2.45 2.44 4.41 4.58 4.63 5.58 5.69 5.53 3.64 3.76 3.96 3.60 3.68 3.76
-------- Fo reign E scli a n ge Rates ' ----------- -----------History---------- I Consensus Forecasts 1
Month Year 1 Months From Now: I Latest: Ago: Ago: 83.99 82.22 8 s S G 107.46 105.95 1 11.76 I.S?SS 1.9047 1.S1 I ? 1.7793 1.1920 1.2724 1.76 12 1.2465 1.373 1 0.7623 0.7763 0.70% 1.25SS 1.2938 1.2097
Consensus M l o n t h Rates
\ s . U.S. Rate h o\\
- 3 . 3 1 3 3
-2.56 -0.6s 7 ;7
-1.15 -... I
I n 12 hlo. -3.97 0.47 -2.88 "1.20 1.66 -1.80
3 6 12 84.1 82.4 81.0 104.2 102.0 100.2 1.86 1.87 1.86 1.17 1.12 1.12 1.24 1.21 1.21 0.78 0.79 0.78 1.29 1.32 1.33
Consensus 10-Year Gov't
l'ieltls vs. U.S. Yield N O W
Germany -0.75
U.K. 0.25 France -0.74 Italy -0.55 Switzerland -2.05 Canada 0.00 Australia 1.22 Spain -0.75 Eurozone -0.70
Japan -2.75
In 12 hlo. -1.04 -3.12 -0.14 -1.03 -0.86 -2.50 -0.32 0.59 -0.98 -1.18
KPSC Case No. 2005-0034 1 AG 1 St Se t Data Request
I tem No. 2 2 1 Page 26 of 4 1
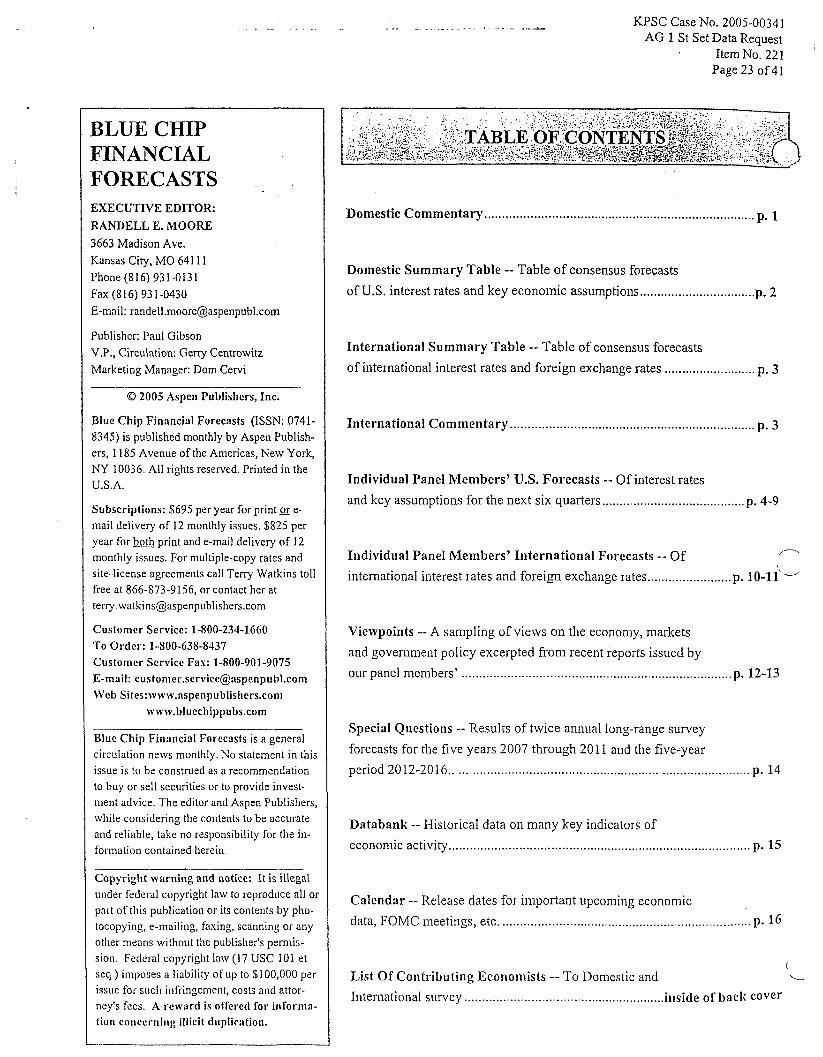
International Comnientnry Global sovereign bond yields sank anew in May, plumbing record depths in the European Union, In part, the declines reflect the belief that global growth is slowing and that infla- tionary pressures will remain contained. Global manufacturing activ- ity has slowed noticeably over the last several months, likely reflect- ing an overhang of business inventories that must be worked down to bring them more in line with demand. Moreover, industrial commod- ity prices, including crude oil, have retreated from earlier highs, eas- ing concerns of an eventual pass-through into prices of finished goods. Most analysts look for the inventory correction to run its course over the next quarter or two, eventually producing a rebound in manufac- turing activity and a return to stronger global economic growth. But i f commodity prices continue to retreat, inventories continue to rise and yield curves continue to flatten, or invert (thcy are already inverted in the U.K , Australia and New Zealand) anxiety about significantly slower growth next year is likely to mount. Some analysts have also attributed the decline in yields to rapidly aging populations in major industrial nations that is increasing the demand for income producing investments. A trend, they say, that may well keep yields much lower in future years than ninny analysts now assunie.
Central bank activity in June is likely to be muted. While the FOMC is expected to raise rates by a quarter point on June 30Ih, other major central banks arc generally predicted to stick with + b a i t and see" stances. The European Central Bank (ECB) next meets June 2"" and no change in policy is expected. Indeed, markets and possibly ECB policymakers seem more focused on the outcome of upcoming refer- endum on the European Union constitution Polls have shown a small majority favoring rejection of the constitution in France on May 30"' and a larger majority of Dutch voters favoring rejection on June I". Markets liave likely discounted this outcome so the biggest reaction \\auld result from an unexpccted "oui" vote i n either or both nations. Tepid economic growth is now widely expected to keep the ECB froiii raising interest rates until sometime next year. Real GDP in the cur- rency zone grcw at a bcttcr-tlian-prctlicted ratc of0.5% (q'q) during Q I propped up by strongcr than cspcctcd grou t h in Germany. An esport-di,iven increase i n Gciiiian real G D P of 1.056--the best per- formance i n four years-oflict contractions of 0.5?b in Italy that fol- loned a 0.4% diop in Q-I and ;I 0 1 % tlcclinc i n tlie Netherlands that followed uncliangecl gronth i n tlic l inol quartci' of last year. Gcr- many's economy flir.ted t i i t h recession in the second half of last yeai and the Q 1 pop c a m as a niajor stirpi ise I-Ion ct t'r. many analysts suspect calendar year adjustnient problems uiidcrstatcd GDP growth in Q-l and merstatcd gron tli i n Q I Moreovcr. morc recent data sug- pests Eurozone pro\vth in Q-! ma! fall bclo\v that in Q1. German busi- ness confidence fcll to ;I 1 I-month lo\\ i n May arid Italian business confidence slipped to a i K year low. The OECD has slashed its esti- mate of real GDP gro\vth this yrar i n tlie Eurozone to jusr 1.2%.
The Bank of England (BOE,) is also espectcd to Ieaie rates unchangcd \vheu i t meets June Sth/9lh and may \wII also stay on the sidelines through year's end. Home price @I oLvtli has cooled considerably in recent months and household spending has finally softened. The manufacturing sector, like those in many otlicr nations, is undergoing a major slou. down at the monierit. That said, housing demand could reaccelerate and inflation has continued to ci'eep up\vaid. Importaiitly, labor market conditions remain very tight and \\age gronrh is strong and likely ii major concern of BoE members.
The B d of Cwiado (BoC) Icft its ovciniglit money rate unchanged at 2.5% 21s expected \vhen i t nici hlny 25"' bui i.epe;ited its pledge to raise rates when industrixl produciion rebountls T i c . stlength of the Calla- tliaii tiollnr has 1 iu i~ t exports and proiuptetl t l ie BoC to cut its forecast of real GDP growth this yc;ir froiii 2 S'%, to 2 6% l l i e consenstIs looks for the DOC to icsuiiie mising intcrcst rates this CIII (uv 10 mid I f /b iiitiividirol p i i t el i t ret i iho.r 'j;j/ c~ctrsi.~)

I-___ 4 BLUE CHIP FINANCIAL FORECASTS JUNE 1,2005 I
Second Quarter 2005 Interest Rate Forecasts
-- Percenl Per Annum - Average For Quarter-- I__. -- Intermediate-Term--- ~ Long-Tern- '
2 3 4 5 6 7 8 9 1 0 1 1 1 2 1 3 1 4 15 Federal Prime LIBOR Corn. Treas. Treas. Treas. Treas. Treas. Treas. Treas. Aaa Baa Slate& Ham Funds Bank Rate Paper Bills Bills Bills Noles Noles Noles Noles Carp Carp. Local Mlg
3440. 1.Mo. 3"MO. 6-Mo. 1-Yr. 2-Yr. 5 Y r . 10-Yr. 20-Yr. Bond Bond Bonds Ralt
--Short-Term--
-- -- Menill Lynch Economics
Scoliabank
JPMorgan Asset Mgt Dtutsche Bank Securilies. Inc
J P Morgan Chase
Georgia Stale University
Prudenlial Equity Group LLC UBS Warburg
Cycledala Carp
Action Economics
Kellner Economic Advisers
ING lnvestmenl Mgl Wachovia
Woodworth Holdings Swiss Re
Mwdys Investors Service
Lwmis, Sayles 8 Company
Perna Associates Goldman Sachs & Co
blesirow Financial
Barclays Capital Ciligroup Assel Management
rrusco Capital Management
DePrince 8 Associates Clearview Economics
Comerica Bank RBS Greenwich Capital Econ
Chmura Economics 8 Analylics
Nomura Securilies Inc SunTrusl Banks
Nalional Cily Corporalion Classicalprinciples corn
J W Cwns Advisors LLC I J S Tfusl Company Standard 8 P o o h Corp
The Norlhern TNS~ Company lndapendent Economic Advisor/
Fannie Mae
BRIO Nesbill Bums
Banc of America Securilies Wayne Hummer 8 Co
Bani Slearns 8 Co PNC Financial Services
LaSalle Nal'l Bank
Nal'l Assn of Reallors Thredgold Economic Assoc
Briefing corn Naroff Economic Advisors
Wells Capital lrlanagemenl
3 3 H 6 3 H 3 5 H 3 3 H 6 3 H 3 5 H
3 3 H 6 3 H 3 5 H 3 3 H 6 3 H 3 3 3 1 6 1 3 4
3 1 6 1 na 3 0 6 0 3 5 H 3 0 6 0 3 3
3 0 6 0 3 3
3 0 6 0 3 3 3 0 6 0 3 2
3 0 6 0 3 2
3 0 6 0 3 1 3 0 6 0 3 1
3 0 6 0 3 1
2 9 L 5 9 L 3 3 2 9 L 5 9 L 3 2
2 9 L 5 9 L 3 3 2 9 L 5 9 L 3 3 2 9 L 5 9 L 3 3
2 9 L 5 9 L 3 3
2 9 L 5 9 L 3 3
2 9 L 5 9 L 3 2
2 9 L 5 9 L 3 2 2 9 L 5 9 L 3 2
2 9 L 5 9 L 3 2 2 9 L 5 9 L 3 2
2 9 L 5 9 L 3 2
2 9 L 5 9 L 3 3 2 9 L 5 9 L 3 2
2 9 L 5 9 L 3 2 2 9 L 5 9 L 3 1
2 9 L 5 9 L 3 2
2 9 L 5 9 L 3 3
2 9 L 5 9 L 3 3
2 9 L 5 9 L 3 2 2 9 L 5 9 L 3 2
2 9 L 5 9 L na
2 9 L 5 9 L 3 5 2 9 L 5 9 L 3 3 2 9 L 5 9 L 3 2
2 9 L 5 9 L 3 2 2 9 L 5 9 L 3 2
2 9 L 5 9 L 3 2
na 3 4 H 3 4 H 3 3 3 3 na
na
na 3 2
na
3 1 3 0
3 1
3 0 3 0
3 1
3 2
3 1
2 9
2 9 na na
3 0 3 1
3 0
2 9 3 0 3 0
3 0
3 0 3 0
3 2 3 0
na
3 3
3 4 H 3 1 3 1
3 1
3 1
3 0 3 0
2 9
3 0
3 1 3 1
3 1
2 9
2 9 3 0 3 0 3 1
2 8
3 0 3 0 2 9
2 9 2 9
3 0
3 0 2 9
3 1 3 0
3 0
na
36 3 6 H na na
3 2
3 4
na
3 2 3 3
3 2
3 2
3 2 3 3 3 3
3 2
3 1 3 3 na 3 4
3 4
3 2
3 3 3 2
3 2 3 2
3 3
3 2 3 2
3 5 3 2
3 2
na 4.1 4 5 4 0 3 9 4 2
3 7 4 0 4 2
na 3 8 4 3 na 3 9 4 2
3 6 3 8 4 1
36 4 0 4 2
na 3 9 4 2
3 4 3 7 3 9 3 6 3 7 4 0
3 5 36 3 9
na 36 4 0 3 4 3 7 3 9 3 5 3 8 4 2
3 4 3 6 3 9
3 3 3 7 4 0 3 4 3 8 4 1
3 4 3 7 4 0
3 5 3 7 4 2 3 6 3 7 4 0
4 1 H 4 2 H 4 4
3 4
3 5 3 3
3 3 3 4
3 4
3 3 3 3
3 9 3 3
3 6
2 7 L 2 8 L 3 0 L na 3 0 3 1 3 2 3 4
3 1 2 9 3 0 L 3 4
na 2 9 na 3 3
3 0 2 9 3 1 3 3
3 0 3 0 3 2 3 3
3 1 3 2 3 3 3 6 na 3 0 3 3 3 5
3 1 2 9 3 1 3 4
3 0 2 9 3 2 3 4 3 0 2 9 3 2 3 4
3 7 3.9
3 8 4 2 3 7 4 0
3 7 3 9
4 7 H 4 4
4 1 L 4 5
4 4
4 4
4 4
4 6
4 2 4 2
4 3
4 2 4 2
4 4
4 3
4 3
4.3 4 2
4 4 4 3
4 6
4 2 4 5
4 2
4 2 3 7 3 8 L 4 3
3 7 4 0 4 3
3 7 4 1 4 5
3 7 3 9 4 3
4 0 4 7 H 4 6
3 7 4 0 4 3
3 9 4 1 4 2
3 5 L 3 9 4 3 3 7 4 0 4 2
3 7 4 0 4 4 3 7 4 0 4 3
3 7 3 8 L 4 2
3 7 4 2 4 4
3 9 4 2 4 6 3 7 4 0 4 3
36 3 8 L 4 2 3 7 4 0 4 3 3 7 4 0 4 2
3 0 3 1 3 1 3 2 L 3 6 4 0 4 3
2 9 L 5 9 L 3 1 L 3 0 3 0 3 3 3 4 3 7 3 9 4 2
2 9 L 5 9 L 3 1 L 2 9 2 9 3 1 3 3 3 7 4 0 4 1 L
2 9 L 5 9 L 3 1 L 3 0 2 9 3 1 3 3 36 3 9 4 2
2 9 L 5 9 L 3 1 L 3 0 3 0 3 2 3 4 3 8 4 0 4 3
na 4 6 4 9
4 8
na
na
4 8
na 4 5
4 9
4 5
4 5 4 6 4 8
4 6 4 6
4 7
4 6 na
5 3 H na
4 6 4 9
4 6 4 6
4 7
4 7 4 9
4 7 5 1
4 7
4 8 4 7
4 6 na
na
4 6 na
4 9
4 6 4 6
na
4 4 4 6 4 6
na na na 5 4 6 2 4 4
5 1 L 6 0 4 2
na na na
na na na
5 5 6 2 na
5 5 6 2 4 5 na na na
5 1 L 5 8 L 4 3
5 2 6 1 4 3 5 7 62 4 9 H
5 2 6 0 4 3
5 3 6 1 4 4
5 4 6 1 4 5
5 2 5 9 na 5 2 6 1 4 3
5 4 6 1 4 5
5 2 6 1 4 4 5 8 H na na
5 2
5 6 5 3
5 5 5 2 5 2
5 2
5 3 5 6
5 2 5 7
5 3 5 3 5 4
5 2 5 4
5 3 5 2 5 3
5 6 5 3 5 2
5 3 5 2 5 3
5 2
na na
na 4 6
6 0 na 6 2 4 7
6 1 4 4 6 0 4 4
6 1 4 3
6 1 4 5 na na
6 0 na 6 3 H 4 7
6 1 4 4
6 1 na
6 0 na
6 0 4 5 6 1 4 5
na 4 4
6 0 4 3 5 9 4 6
6 3 H 4 6
6 1 na 63 H 4 2 6 2 4 5 6 1 4 4 6 1 4 4 6 1 4 4
na
5 6 5 7 na
na
6 1
6 0 na 5 7
5 8
5 7
5 8 5 7
5 9
5 7
5 8
5 9 5 8
5 7 5 9
6 1
5 7
6C 5 8
5 8 5 8 5 s 6C 5 e 5: 5 1
5 1
5 € 5 i
6 ( 5 t 5 t
5 1
6 ( 51
5 1 5 '
51 5 '
5 ' 4 3 L 5 1 L 5 8 L 4 1 L 5 1
4 6 5 3 6 1 4 3 5
4 8 5 3 6 1 4 4 5 '
2 9 L 5 9 L 3 3 3 0 2 8 L 3 1 3 4 3 7 3 9 4 2 4 7 5.2 6 1 4 4 54 I_
June Consensus 3.0 6.0 3.2 3.0 3.0 3.2 3.5 3.7 4.0 4.3 4.7 5.3 6.1 4.4 5.1 r - I
T o p 1 0 A v g 3 1 6 1 3 4 3 2 3 2 3 4 3 7 4 0 4 3 4 5 4 9 5 6 6 2 4 6 6
B o t t o m l O A v g 2 9 5 9 3 1 2 9 2 9 3 1 3 3 36 3 9 4 2 4 5 5 2 5 9 4 3 5
MayConsensus 3 0 6 0 3 2 3 0 3 0 3 3 3 5 3 8 4 2 4 5 4 9 5 5 6 2 4 6 6
Number of Forecasts Chanqed From A Monlh Aso
Down 2 3 15 12 19 I 9 24 31 42 44 33 39 30 25 4
Same 32 37 21 20 19 17 12 14 5 5 4 5 6 5
U p 1 5 9 1 1 7 1 1 7 6 4 2 0 2 1 4 2
Diffusionlndex 63 % 56 % 46 % 44 % 42 % 36 % 29 % 22 % 9 % 5 % 10 % 8 % 18% 14 % I
JSPSC Case No. 2005-0034 1 AG 1 St Set Data Request
Item No. 22 1 Page 27 Of 4 1
Key A s s u m p t i o n 0 - vg F a
4k.-
A fs Majo
u n e n q
ink na
81 3
82 5 na na
na
83 0
na
82 0
83 0 81 0
82 0 840 82 5
na
83 5
82 4 81 9
na
82 3 na
83 0
83 1
83 8 83 5
82 9 83 2 80 3 83 4
81 1
82 9 na
81 2
83 0 80 1
na 8-42
na
80 5
na 82 5 80 6
83 0
82 1 na
81 0
na 83 0
na - 82.3
83 5
80 9
80 7
1
3
28
92 -
--(W YO Change)--.
GDP Cons
;DP Index Index -- 2 8 2 4
3 5 3 4
3 5 3 0
4 0
4 0
3 4
3 5 3 4
3 5 3 3
3 5
2 2 L
3 0 3 0
3 0 3 0 3 3 3 0
4 1 H 3 3
3 5 2 5
3 3
3 7 3 0
3 3 3 6
3 4 2 9
2 8
36 2 8
3 0 3 0
3 7
3 3 3 5 3 7 3 8
3 0 3 6
2 9 3 1
3 5
2 8
1.8 4 1 3 0 4 5
2 1 4 0
2 1 2 1 L 2 0 4 9
2 7 3 2 2 2 3 4
1 5 L 4 2 2 7 3 4
2 6 4 4
2 1 3 0
2 0 3 3
2 4 2 5
3 0 3 8
1 6 2 4
2 3 4 6
2 4 4 6
4 0 4 9 2 9 4 8
2 4 4 9
3 3 4 5
2 0 4 4
3 0 4 1
1 8 2 5
:: H :ig 1 8 4 3 3 0 2 9
2 4 4 2 3 2 3 5
3 0 4 7 3 3 4 3
2 6 3 9 2 4 3 7
2 7 4 3
3 8 4 4 2 3 3 1
2 4 3 3
3 0 4 0 2 5 4 5
2 6 3 4
2 8 3 5 2 8 4 4
2 4 3 0
2 4 3 0 2 3 3 2 2 3 3 4 2 8 3 3
2 9 2 9 5 2 H -- 3.3 2.6 3.9
3 8 3 4 4 8
2 7 1 9 2 8
3 4 2 5 3 3
22 9 10
14 18 9
13 22 30
41 % 63 % 70

KPSC Case No. 2005-0034 1 AG 1 St Set Data Request
Item No. 221 Page 28 of 4 1
._" --- ..-..I_______..___I___ _-. . .- I" -_-"._ - --- I - . ---_ &_. _"-.--*--.-. --- .dL*-- -
JUNE 1,2005 H 1
Third Quarter 2005 Interest Rate Forecasts Key Assumptions
Avg For
4 l r . - A.
ed's Majo Currency
5 Index
- ---Percent Per Annum -Average For Quarter- -- - -Short.Term--- -1nlermediale-Term- ---Long-Tenn-
1 2 3 4 5 6 7 8 9 1 0 11 12 13 14 15 Federal Prime LIBOR Com. Treas. Treas Treas. Treas. Treas. Treas. Treas. Aaa Baa Stale 8 Home Funds Bank Rale Paper Bills Bills Bills Notes Notes Notes Notes Carp Corp. Local Mtg
Rate Rate 3-MO. I-Ma. 3-Mo. 6-Mo. 1-Yr. 2-Yr. 5Yr. 10-Yr. 2GYr. Bond Bond Bonds Rale
GDP Cons
JPMorgan Asset Mgl
Deulsche Bank Securities. Inc. Standard a Poor's Carp
Bear Slearns a Co
BMCI Nesbitl Bums Goldman Sachs
UBS Warburg
Action Economics
Trusu, Capital Management Cycledata Corp
J P. Morgan Chase
Menilt Lynch Economics Classicalprinciples corn
Briefing com
Kellner Economic Advisers
Swiss Re Moody's lnveslors Sew'ce
U S. Trust Company
Perna Associales Barclays Capital
RBS Greenwich Capital Econ
Citigroup Asset Management
DePrince 8 Associates Independent Economic Advisory
tional City Corporation .I0 ' nura Economics & Analylics
omerica Bank Prudential Equity Group LLC
Narofl Economic Advisors Banc of America Securilies
ING Investment Mgt
Wells Capilal Management Loomis. Sayles 8 Company
LaSalle Nalt Bank Nal'l Assn of Realtors
Georgia Stale University
Nomura Securilies tnc Clearview Economics
Fannie Mae blesirow Financial
PNC Financial Services Cop
Wayne Hummer & Ca J W Cwns Advisors LLC
Scoliabank The Northern Trust Company
Wachovia
Woodworth Holdings Thredgold Economic Assoc
3 8 H
3 8 H
3 6 36 3 5
3 5
3 5
3 5
3 5 3 5
3 5
3 5 3 5
3 5
3 5
3 5 3 4
3 4
3 4 3 4
3 4
3 4 3 4
3 4 3 4
3 4
3 4 3 4
3 4 3 4
3 4
3 4 3 4
3 4 3 4
3 4 3 4
3 4 3 4
3 4
3 3 3 3 3 3 3 3 3 3
3 3
3 3 3 2
6 8 H 4 0 H 6 8 H 3 8
3 8 H
na
3 7
3 8 H 3 6
na na
3 5 36 36 na
na na
3 5
3 6 3 8 H 3 5
3 5 3 4
3 5
3 5
36 3 5
3 5 3 4
3 5
3 5 3 6
3 7 na
3 5
3 5 3 4
36 3 5 na
3 4
3 4 3 4
na
3 4
3 5
3 8 4 1 H
3 9 H na
3 6 3 7
3 7 3 9
3 7 3 8
36 na
3 7 na
3 5 3 9
3 6 3 8
3 5 3 7 3 6 na
3 6 na
3 6 3 8
3 5 3 8
33 3 7 3 6 3 8
3 5 3 8 36 3 7
36 3 7
3 0 L 3 8
4 2 4 5 4 7
na 4 3 4 5
3 9 4 2 4 4
4 0 4 3 4 8 4 0 4 1 4 5
4 0 3 9 4 3
4 6
4 8
4 7 5 0
4 9
4 5
4 7
4 5
5 0 4 6
4.9
4 5 4 6
4 5
4 3 4 5 4 5
4 2 L
4 4 5 0
4 6
4 6 4 4
4 6 4 5
5 0
4 5 4 7
5 4 5 6 6 5
5 0 na na
na 5 7 6 6 na 6 1 7 0 H
5 1 5 8 6 6
na 6 1 na
na na na
5 2 5 3 6 1 5 4 6 0 6 7
5 0 5 6 6 3 na na na na na na
5 2 5 7 6 5
4 9 5 6 6 4
4 7 5 8 6 3 4 8 5 4 6 1
4 9 5 5 6 4
4 5 L 5 2 L 6 0 L 4 9 5 6 6 5 na 5 9 na
5 0 5 7 6 5
4 9 5 7 6 4 4 7 5 5 6 6 4 9 5 3 6 3 5 0 5 7 6 5 5 6 6 3 na 4 9 5 4 6 3 5 2 5 9 6 5
5 7 H 6 4 H 7 0 4 7 5 5 6 3 5 0 5 7 6 4
4 8 5 4 6 2 4 9 5 6 6 4
5 0 5 8 6 6
5 0 5 6 6 3 na 5 6 6 5
4 8 5 4 6 1
4 7 5 3 6 2 na 5 6 6 2
5 7 5 3 na
4 5 5 4 6 4
5 0 5 6 6 3
4 8 5 6 6 2 4 8 5 7 6 5
na 5 2 L na 4 7 5 4 6 2
5 0 5 6 6 3 4 6 5 4 6 1
4 7
na
4 7
5 1 4 7
na
na
4 5 5 1
4 6
na na
na 4 6
5 0 na
4 6
4 5 4 5
4 7
4 7 na
4 5
4 6 4 7 na
4 5 4 7
5 2 H na 4 5 4 6
4 7
4 9 4 7 na na
4 4 4 6
na 4 6
4 6 na
4 7 4 4 4 5
4 6
4 3 L
6 2
na 6 5
6 5
6 1
5 9 na
5 9
6 5
6 1 na na
6 1
6 0 5 6
5 7
6 1 5 7
6 0
6 2 6 2
6 1
6 0
6 2
6 1 6 6
6 0 63 6 4
6 0 6 2
6 0
6 1 6 2
6 3 6 5
5 9 5 9
5 9
5 9 6 0
6 0
5 9 5 8 5 7 5 8 6 1
5 9
a2 o na
78 2 82 4
78 0
na
na 82 0 840
81 0 na
na
na na
82 0
na
846 83 0
79 7 na
848
840 848 849
82 0 78 9
83 0
82 0 83 0
na 81 0
na
82 6 80 2
na na
85 0
82 0
na
82 4 840
84 1
81 5 79 5
na 85 0 81 0
81 0 61 1 - 82.2
___ 845
79 9
80 2
1
3
28
92 -
3 a 3 9
30 3 5 3 0
3 5
3 5 4 1
36 30 3 5 2 7
3 4 3 7
3 2 3 5 4 0
4 2 3 3 4 0
3 7 3 1
3 7
3 5
2 0 3 2
2 2 2 3
1 9 1 4
2 7 26 2 0 2 2
2 2 1 9 1 7 0 6 L
2 2 2 0
3 5 H 2 a
2 8 3 4
2 0 4 9 H
6 6 6 6
6 5 6 5 6 5
6 5
6 5
6 5 6 5
6 5
6 5 6 5
6 5
6 5 6 4 6 4
6 4
6 4 6 4
6 4
6 4 6 4
6 4 64 6 5 6 4
6 4 6 4
6 4
6 4 6 4
6 4 6 4
64
6 4 64
6 4
6 4 6 3
6 3 6 3 6 3
6 3
6 3 6 3
6 2
3 9
4 0 H
4 0 H 3 8
3 8
3 8
3 8 3 8
3 8
3 7 3 7
3 7
3.7
36 3 8
3 8
3 8 3 8
3 7
3 7
3 7 36 36 36 3 6 3 9
3 8 3 7
3 7
3 7 3 7
3 6 3 6 na
3 7 36 na 3 7
3 6
3 6 3 5
na 4 1
4 4 4 4 4 0 4 3
3 9 4 1
na 4 3
na 4 0 4 2 4 5 3 9 4 1
3 7 3 8
3 9 39 3 8 39 3 9 4 1
3 1 L 4 0 4 7 H 4 7 H
44
44 4 7
4 3
4 6 4 3 4 6
4 3
4 0
4 1
4 2 4 1
4 2 4 8
4 3
4 3
4 2 4 2
4 2 4 6
4 2 4 5
1 5 1 8
2 2 2 4
2 4 2 5
2 2 3 1
1 6 2 4
1 0 L 2 2
1 5 2 2
2 4 2 9
2 1 1 3
1 8 1 6
2 8 2 8
2 0 2 8
2 2 2 5 4 5 H 1 6 1 6
3 5 2 3 2 8 3 5 1 9 2 3 3 7 2 0 2 0
3 1 24 2 7
3 2 2 0 2 4
4 0 2 1 2 7
3 2 2 4 2 8
3 7 2 0 2 2 3 3 2 0 1 5
2 9 2 1 27
2 7 3 5 1 9 1 9 2 5 1 8
2 6 1 5 2 8
3 6 2 1 2 6
3 6 1 9 1 9
3 3 1 8 23 3 6 2 2 2:
3 0 2 5 2 1 2 5 L 24 2 1
3 2 2 3 2 3 3 5 2 5 2 5
3 5 30 3 5
3 5 2 1 2 6
3 2 2 9 3 2
3.4 2.1 2.4
3 9
3 7 3 9
3 7 3 6
3 7
3 7 4 1
4 3 4 0
na 3 7 3 7
3 7 3 8 3 7 3 7
3 6 3 6
4 0
3 7
39
3 5 3 5 3 4
3 4
3 3 3 5
3 3
3 5 3 7
3 5 3 4 3 3 33 3 5 3 5
3 4
3 4 33 3 4
3 5 3 2 3 4
3 7
3 7 3 7
3 5
3 4 3 6
36 3 9
3 9 3 8
3 6 3 4 3 5
36 36 3 5 3 5
3 5
3 6 3 8
3 5
36
4 1
4 1
4 1 4 0
3 9 4 1 4 0
4 4
4 6
4 1 3 8
3 9
4 0 3 9 4 0
4 0
4 0 3 9
3 9
3 8 3 9
4 0
5 1 H 5 1 H 4 3 4 5
4 3 4 6
4 1 4 4 4 4 4 6
4 3 4 7 4 3 4 6
4 3 4 6
4 2 4 4 4 1 4 3 4 4 4 4
4 1 4 4
4 2 4 4 4 2 4 6
3 1 L 3 0 3 2 L na 3 5 3 9 na 3 3 3 5 3 7
36 3 8 3 4 36
3 7 L 4 0 4 4 4 0 4 4 4 6
3 8 4 1 4 2 L 3 8 4 0 L 4 3 4 1 4 4 4 6
3 9 4 2 4 4
3 4 L 3 3 3 2 3 4 L na 3 1 3 4 L 3 3 3 4
3 4 L 3 3 3 3
3 4 3 2 3 2 3 0 1 6 0 L 3 4 L 3 3 3 1 3 8 4 0 4 1 4 9 4 8 5 4 6 1 6 6 4 9 6 4 -- SunTrust Banks
June Consensus 3.4 6.4 3.7 3.5 3.4 3.7 3.8 4.1 4.3 4.6 5.0 5.6 6.4 4.7 6.1 --_ --
ToplOAvg 36 6 6 3 9 3 7 3 7 3 9 4 2 4 4 4 7 4 9 5 4 6 0 6 7 4 9 6 4
BottomlOAvg 3 2 6 2 3 5 3 3 3 2 3 4 3 5 3 8 4 1 4 3 4 7 5 3 6 1 4 5 5 8
MayConsensus 3 4 6 4 3 7 3 5 3 4 3 7 3 9 4 2 4 5 4 8 5 2 5 8 6 5 4 8 6 3
Number of Forecasls Chanqed From A Monlh Aqo
D o w 7 6 18 15 18 21 22 27 40 41 31 36 34 24 36
38 38 22 17 21 15 13 17 5 6 5 6 2 5 5
2 2 3 2 3
1 2 % 1 1 % 1 0 % 1 5 % 13
4 0 2 8 3 3
2 9 1 6 1 5
3.5 2 1 2 5
19 11 22
19 23 17
10 14 9
41 % 53 % 36

KPSC Case No. 2005-00341 AG 1 St Set Data Request
Item No. 221 Page 29 of 41
Key - ivg. For
16 I BLUE CHIP FINANCIAL FORECASTS N JUNE 1.2005 I
__._
-(OU % Change+
Fourth Quarter 2005 Interest Rate Forecasts
-- Bear Slearns 8 Co
Standard 8 Poor's Corp
Naroff Economic Advisors
Action Economics
J P. MorganChase
JPMorgan Assel Mgl Classicalprinciples corn
Deutsche Bank Securities. Inc
RBS Greenwich Capilal Econ
Citigroup Assel Management
Moody's Investors Service
National City Corporation
U S TNS~ Company TNSCO Capilal Management
BMO Nesbitt Burns
Georgia Stale University
Barclays Capilal
UBS Warburg
Goldman Sachs
Swiss Re Loomis. Sayles 8 Company
Perm Associates
Wells Capital Management Nat'i Assn of Realtors
Briefing corn
Comerica Bank Independent Economic Advisory
Chmura Economics 8 Analytics Banc of Amercia Securilies
PNC Financial Services
Wayne Hummer 8 Co
ING Investment Mgl Thredgold Economic Assoc
DePrince 8 Associates
Fannie Mae Mesirow Financial
Prudential Equily Group LLC
Nomura Securilies Inc
Cycledala Corp
Keller Economic Advisers
Clearview Economics LaSalle Nal'l Bank
Merrill Lynch Economics
Wachovia Woodworth Holdings
J W Coons Advisors LLC Scoliabank
The Northern Trust Company
Sunirusl Banks
4 2 H
40 4 0 4 0 4 0 4 0 4 0 4 0 40 4 0 40 39 3 9
39 39 39 39 39 39 39 39 38 38 38 38 38 38 38 37 37 37 37 37 37 37 37 3 5 35 35 35 35 3 5 35 35 35 33 3 3 3 3
7 2 H 4 7 H 70 70 70 70 70 70 70 70 70 70 69 6 9 6 9 6 9 6 9 6 9 69 69 69 6 9 6 8 6 8 6 8 6 8 6 8 6 8 67 6 7 67 67 67 67 6 7 67 67 6 5 6 5 65 65 65 65 65 65 65 6 3 63 6 3
4 3 4 4 4 3 4 2 4 2 4 2 41 4 3 4 2 4 4 4 0 4 3 4 2 4 4 na 44 4 2 4 2 4 0 41 4 2 41 39 39 40 3 9
4 0 40 4 0 4 0 4 0 39 4 0 na 4 0 41 38 38 38 37 37 37 3 6 3 6 3 7
4 5 H 4.4 H
41 4 3 4 0 na 4 0 na
na 40 41 4 0 39 4 0 4 0 39 na
39 na
na
4 3 38 3 8 39 3 8 38 38 38 38 na 38 38 38 37 37 37 na
3 7 3 6 3 6 38 35 37 na 35 36
40 44 4 0 40 41 41 41 40 40 41 37 41 39 40 39 33 40 39 40 37 40 37 38 38 36 38 38 38 36 37 37 37 37 37 38 35 3 5 35 34 34 37 36 35 36
33 L 32 34 L 33 L 32
46 H
41 46 H
44 na
43 43 na 42 42 44 38 42 41 41 40 4 0 na na 42 39 41 38 39 39 38 3 9 39 41 38 39 38 39 3 9
39 41 39 35 37 38 36 38 na
36 38
47 4 3 50 H
4 8 na
45 4 7 na 44 4 3 44 39 4 2 43 42 42 49 na 43 43 4 0 43 40 41 41 4 0 41 4 0 43 39 41 na
41 41 35 43 41 3 7 3 9
38 37 38 na
38 40
3 3 L na
35 39
48 47 52 H
48 47 48 50 45 45 45 41 43 40 46 43 46 50 43 41 43 41 43 41 42 43 42 44 44 44 41 42 40 43 44 3 9 39 44 42 41 39 40 4 0 38 40 43
50 47 56 H 47 50 5 0 50 48 47 46 44 46 4 0 L 50 46 47 51 46 46 4 5 46 45 43 44 45 44 4 5 47 45 43 45 46 45 44 44 42 47 44 43 42 41 44 42 43 47
37 L 41 39 43
3 4 L na 31 L na 34 L 39 42 3 0 L 6 0 L 34 L 3 3 L 31 L 37 40 41 49
51 50 58 H
48 52 4 8 50 53 50 49 4 8 48 4 0 1 52 50 49 5 3 4 9 4 8 48 49 4 7 46 4 7 47 4 8 51 51 47 4 5 48 4 9 46 4 6 45 4 5 49 4 6 4 6 4 2 44 49 44 45 49 45 4 8 43 47
na na
6 2 H
5 5 na 57 5 6
5.5 54 53 5 3 5 3 4 3 L 57 52 na na na na 52 52 51 49 51 51 52 5 4 57 4 9 4 6 52 54 47 48 na
6 0
54 50 50 4 5 4 7 53 na 4 8 5 3 49 50 na
6 7 60 6 9 H 55 na 58 61 na 61 6 0 58 61 50 L 6 4 59 59 6 2 na 65 5 8 6 0 60 5 6 57 5 8 58 60 64 57 56 58 6 2 5 5 58 56 54 61 56 5 6 5 9 5 3
6 0
na 5 6 59 57 5 9 5 3
57 6 5
76 H 68 76 6 2 na 67 6 9 na
69 6 7 6 8 69 58 L
71 67 67 na
na
na 6 5 67 68 65 6 5
66 67 6 9 na
65 6 7 6 5
70 62 69 6 2 na
67 63 6 3 64 62 69 na 65 6 6 64 68 na
71
5 5 49 57 H
48 na
4 9
na
na
5 0 na
49 49 45 54 48 na
48 na na na 49 55 49 49 48 47 51 na
na 48 48 47
69 66 70 6 0 na
64 65 na 6 6
64 64 6 5 5 5 6 8 62 6 5 64 na 64 6 0 6 3 6 2 6 2 64 62 6 3 68 67 62 6 2 62 6 5
4 4 L 61 47 6 3 47 6 0 na 6 0 49 6 5 na 60
i 6 61 50 5 5 4 5 6 0 53 64 na na 46 6 0
4 7 64 na 6 0 49 6 0 45 58 51 6 3 - -
June Consensus 3.7 6.7 4.0 3.8 3.7 4.0 4.1 4.3 4.6 4.8 5.2 5.9 6.7 4.9 6.3 ~-
Top10Avg 40 70 44 41 41 43 46 48 50 52 57 6 4 71 53 67
Bollorn10Avg 34 64 3 6 35 3 3 3 6 37 39 4 2 44 47 54 62 4 6 5 9
LlayConsensus 38 6 8 4 0 38 38 4 0 42 44 47 5 0 54 61 6 8 50 65
lumber of Forecasts Chanqed From A Monlh Aao - Down 7 6 1 1 12 15 17 17 28 35 39 29 39 28 25 35
Same 36 36 23 21 24 18 18 15 10 8 7 4 7 5 1
Up 6 7 13 6 10 8 8 6 4 2 3 2 5 2 :
Diffusionindex 49% 51% 52% 42% 45% 40% 40% 28% 18% 12% 17% 9 % 21% 1 4 % I$
-OW.- A.
d's M?]a
:urmncy
83 6 75 5 81.0 80 0
na
81 0
na na
864 I 82 0 85 8 80 3 83 0 81 0 77 0
na na
na na na
82 3 77 7
na na na
81 0 85 0 77 3
na 840
84 4 80 0 81 0 85 4
na
82 0 80 0 85 0 80 0 83 0 82 0 78 1
na 86 0 79 0 81 9 77 0
na
81 5
--(SMR+ B C D.
GDP Cons Real Price Pnce
3DP Index Index
17 28 28 24 L 20 2 2 38 21 25 40 23 27 3 5 22 18 3 6 21 28 28 21 2 3 38 22 23 4 3 H 18 24 38 26 30 39 .26 22 39 22 24 40 18 20
I_
81.5 --
84.9
78.2
79 7
3
4
26
85 ~
35 30 H 3 3 19 30 20 35 22 3 3 18 30 25 34 15 L 38 17 30 26 33 22 31 19 37 25 3 5 21 4 3 H 23 3 3 25 32 19 3 3 18 3 5 23 40 21 3 5 21 34 19 37 20 3 7 1 6
41 18 38 17 28 25 30 22 38 17 27 2 3 30 16 33 26
37 H 22 23 24 19 2 5 23 19 31 31 25
25 28 23 24 25 28 26 27 25 18 20 21 31 32 28 25 15 L 24
35 30 H 32 28 24 2 6 30 20 20 3 5 21 24
35 2 1 25
-- r-r64E I . 2005 BLI
First Quarter 2006 Interest Rate Forecasts
-Shorl.Tenn--- 4 5 6
Com Treas Treas. Paper Bills 8ilis 1-Mo. 3-Mo. 6-Mo.
--_I__
Bear Sleams 8 Co
Moody's Investors Service Action Economics R8S Greenwich Capital Econ National City Carporalion Naroff Economic Advisors Citigroup Assel Managemenl J P Morgan Chase Standard 8 Pwr's Corp Trusco Capital Managemenl JPMorgan Asset Mgt
Deutsche Bank Securities. Inc Barclays Capital 8MO NesbiH Bums Goldman Sachs 8 Co Loomis. Sayles 8 Company Swiss Re Georgia Stale University Pema Associates U S Trust Company UBS Warburg
ING Investment Mgt Wells Capilal Management TI princi ples corn
yne Hummer 8 Co 1'1 Assn of Realtors
Comerica Bank DePrince Associates Fannie Mae Chmura Economics 8 Analyiics PNC Financial Services Bane of America Securities Briefing corn Prudenlial Equity Group LLC Thredgold Economic Assoc
Kellner Economic Advisers Mesirow Financial lndependenl Economic Advisory Wachovia Wwdwoflh Holdings J W Coons Advisors LLC Nomura Securilies Inc Clearview Economics LaSalle Nat" Bank Cyciedala Corp
Scoliabank SunTrusl Banks
46 H 45 45 45 44 44 44 44 43 43 43 4 3 4 2 42 41 41 41 41 40 40 4 0 4 0 40 40 40 40 40 39 39 39 39 39 39 38 38 38 38 38 38 38 37 37 37 3 5 35 33
7 6 H 5 0 H
7.5 75 75 74 74 74 74 73 7 3 73 7 3 7 2 7 2 71 71 71 71 70 70 7 0 7 0 7 0 70 70 70 70 69 6 9 69 69 69 69 6 8 6 8 6 8 6 8 6 8 6 8 6 8 67 6 7 67 6 5 65 63
5 0 H 4 9 4 8 43 47 46 46 46 4 5 4 5 4 3 4 5 44 44 44 4 3 na 44 4 3 4 3 4 3 4 2 4 2 4 2 41 4 2 4 2 na
41 42 41 41 44 4 0 4 0 41 39 39 39 4 0 4 0 39 38 38 34
46 4 5 4 5 43 4 5 4 5 na
44 4 3 4 3 na 4 2 41 na 41 4 7 na 4 0 41 na 41 41 na 41 4 0 4 0 4 0 39 40 4 0 na 40 41 38 4 0 na 38 38 38 36 37 37 39 3 6
4 7 H 46 4 5 4 0 4 5 44 4 4 4 2 4 2 4 3 44 34 4.2 41 4 0 4 2 41 4 2 4 2 4 2 4 0 38 41 4 0 4 0 38 39 39 4 0 38 4 0 3 9 39 38 37 39 37 3 5 38 3 5 3 6
3 5 38 3 5
4 8 n 4.7 H
33 L 3 2
5.0H 5 2 H 52 4 9 4 9 4 7 41 4 7 4 5 na 4 3 44 46 na 41 43 na 4 0 44 4 2 4 3 43 na 41 39 43 42 41 4 0 42 41 41 4 0 4 3 4 0 44 40 4 0 42 38 3 6
41 36 3 6 38 38 37
5 0 51 48 43 51 47 na 45 45 47 na 50 43 45 41 45 44 44 42 na na 41 44 43 43 42 44 37 42 41 45 42 46 42 41 44 40 38 4 3 na 38 38 39 39
35 L 39
45 51 49 47 5 3 H 49 50 48 49 50 50 51 44 44 43 46 47 45 40 43 42 41 45 44 43 44 4 6
41 45 43 45 44 49 44 41 40 43 41 46 40 45 41 41 41
53 48 50 50 49 59 H 49 53 49 52 52 5 3 52 48 48 48 48 49 47 39 L 47 48 43 49 48 46 47 47 46 48 44 47 47 50 46 43 44 46 44 49 42 47 42 4 4
44 38 L 43
30 L 60 L 31 L 3 3 L 31 L 3 5 L 37 L 38 L 45
54 52 50 52 51 6 0 H 51 5 5 52 5 5 51 5 5 5 5 51 50 51 51 52 50 38 L 50 5 3 46 53 52 48 51 4 8 45 52 46 49 49 52 47 41 47 51 47 51 45 49 44 49 47 49 44
na 70 8 0 H 57 5 6 61 6 9 51 57 58 6 4 50 5 5 6 4 71 52 55 64 7 2 50 6 5 H 7 2 H 7 8 6 1 H 54 6 2 6 9 na na na na na na 6 2 70 51 59 6 7 74 56 59 61 7 0 52 58 na na na na 6 3 na 49 53 6 0 6 8 49 na 6 7 na na 54 63 70 50 5 5 61 6 8 na na 6 2 70 na 55 64 72 4 8 41 L 4 8 L 5 6 L 45 na 58 5 0 59 54 5 2 54 4 9 na 57 4 7 51 53 58 49 44 61 54 50 55 49 5 3 48 5 3 51 51 59
na 65 5 6
64 60 58 61 61 58 6 5
5 8 59 6 0 64 57 59 57 60 58 61 59 58 54 61 5 6
61 71
na 7 2 6 6
71 6 7 6 6
70 71 6 4 na
6 9 6 7 6 8 71 64 6 5 na 6 8 6 7 6 8 6 5 66 6 3
7 0 6 3 69 76
na 4 0 L 51 na 52 50 5 0 49 47 na 49 na 5 0
51 4 5 51 na 51 46 4 8 na na 4 5 52 47 51 52
71 6 8 6 2 6 8 6 7 7 3 6 6
na 6 7 71 6 7 na 6 6
63 6 7 6 6
6 4 6 6 65 53 ria
6 8 6 2 6 8 6 4 6 5 66 6 5 6 0 6 8 6 3
6 4 6 4 6 8 6 3
57 6 2 6 8 6 2 6 6 6 2 6 3 61 6 4 6 2 61 6 0
_.
J u n e C o n s e n s u s 4.0 7.0 4.2 4.1 4.0 4.1 4.3 4.5 4.7 5.0 5.4 6.1 6.9 5.0 6.5 -.--
T o p l O A v g 44 74 4 7 4 5 44 46 49 50 52 54 59 67 74 54 69
B o l l o m I O A v g 36 6 6 3 8 36 3 5 37 38 40 43 44 48 5 6 64 46 60
MayConsensus 40 70 4 2 41 40 42 44 46 49 51 5 5 6 2 7 0 51 6 6
Yumber of Forecasts Chanoed From A Monlh A q o
Down 8 8 15 14 19 21 18 26 31 34 24 30 23 20 31
Same 31 31 19 19 17 13 16 13 It 9 10 10 12 7 E
UP 8 8 11 6 1 1 9 8 8 5 4 5 4 5 4 E
Dinusion Index 50 x 50 x 46 % 40 % 41 % 36 % 3 8 x 3 1 % 22 % 18 x 26 % 20 % 28 % 24 oh 2c
KPSC Case No. 2005-0034 1 AG 1 St Set Data Request
Item No. 22 1 Page 30 of 4 1
4QQ % Change& ivg For -ak -
A 8s Majo urrency - 85 3 86 9 79 0 877 F 78 8 82 5 81 0
na 721 I 80 0 80 5
na na
75 0
na 81 9
na
na 75 6
83 0 na
78 0 na na
85 0
na 79 0 86 0
na 75 9 82 0
na na
78 5 80 0 840 81 5 85 5 87 0 77 0 82 7 84 0 81 0 76 5 80 0 76 I 81 6
--I__
80.9
85 4
76 4
79 6
4
5
24
80 ' ~
35 22 39 40 34 32 36 35 24 33 3 5 39 30 29 30 37 32 32 30 30 30 35 28 33 3 6 36 35 36 34 28 na 34 35 38 35 25 39
-ww---- 8. C D
GDP Cons Real Pnce Pnce GDP Index Index
29 30 33 t( 31 32 27 30 24 21 24 24 22 26 29 20 25 20 22 28 21 22 21 27 30 22 17 21 28 22 22 22 24 17 22 21 22 20 24 28 na
22 23 20 21 24
37 H 26 23 34 28 25 21 17 20 32 21 25 28 33 19 26 26 26 26 23 25 na 27 27 22 26 30
15 L 19 4 0 H 25 27 32 26 25 3 5 30 32 32 21 24 37 22 21 35 19 30 3 0 23 15 L 28 25 31 30 20 23 22 L 24 27 -
3.3 2.3 2.6
38 3 0 32
27 19 20
34 23 25
15 8 5
22 26 30
9 12 1 1
43 Oh 54 % 57
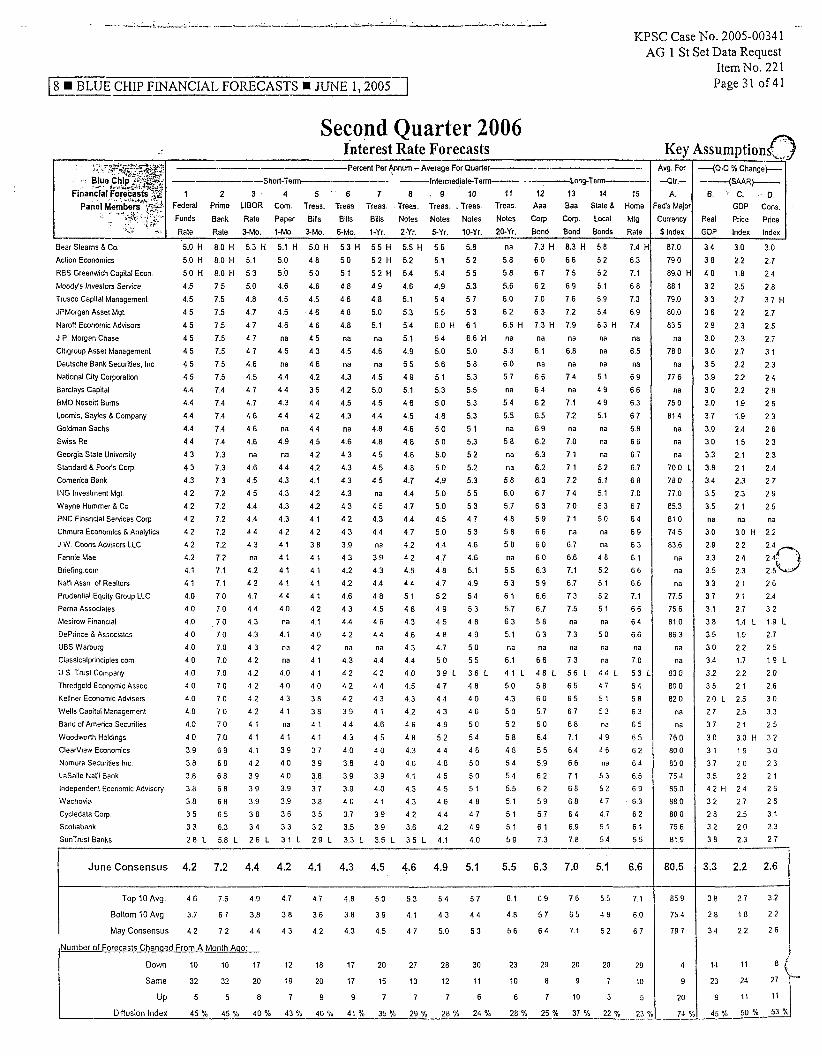
18 BLUE CHIP FINANCIAL FORECASTS JUNE 1.2005 I
Key - Second Quarter 2006
Interest Rate Forecasts -Percent Per Annum -Average For Quarter--- -_
Short-Term-------- -Intermediate-Term- . ----Long-Te- 2 3 - 4 5 ' 6 7 8 . 9 10 11 12 13 14 15
Federal Prime LIBOR Corn. Treas. Treas Treas. Treas. Treas. .Tress. Treas Aaa Baa State8 Home Funds Bank Rate Paper Bills Bills Bills Notes Notes Notes Notes Carp. Carp Local Mlg
Yr. 10-Yr. 2O-Yf: Bond Bond Bonds Rale ---
A s s u m p t i o n 0 -(QQ % C h a n g e 7
I
KPSC Case No. 2005-00341 AG 1 St Set Data Request
Item No. 22 1 Page 31 of41
Bear Steams d Co Action Economics RBS Greenwich Capital Eeon. Mocdy's Inveslon Service
Trusco Capilal Management JPMorgan Assel Mgt
Naroff Economic Advisors J P. Morgan Chase Ciligroup Assel Management Deulsche Bank Securities. Inc Nalional City Corporalion Barclays Capital
BMO Nesbitl Bums Loomis. Sayles 8 Company Goldrnan Sachs Swiss Re Georgia Slate Univenily Standard 8 Pw<s Corp. Cornerica Bank ING Investment hlgl Wayne Hummer 8 Co PNC Financial Services Corp Chmura Economics 8 Analyiics J W Coons Advisors LLC Fannie Mae
BneAng coin Nal'l Assn of Realtors PNdenlial Equity Group LLC Pema Associates hlesirow Financial DePrince 8 Associates UBS Warburg Classicalprinciples corn U S Trust Company Thredgold Economic Assoc Kellner Economic Advisers
Wells Capilal htanagemenl Banc of America Securities Woodworth Holdlngs Clearview Economics Nomura Securilies Inc LaSalle Nal'l Bank Independent Economic Advisory Wachovia Cycledata Cop
Scoliabnnk SunTNst Banks
5 0 H 5 0 H 5 0 H 4 5 4 5 4 5 4 5 4 5 4 5 4 5 4 5 4 4 4 4 4 4 4 4 4 4 4 3 4 3 4 3 4 2 4 2 4 2 4 2 4 2 4 2 4 1 4 1 4 0 4 0 4 0 4 0 4 0 4 0 4 0 4 0 4 0 4 0 4 0 4 0 3 9 3 8 3 8 3 6 3 8 3 5 3 3
8 0 H 8 0 H 8 0 H 7 5 7 5 7 5 7 5 7 5 7 5 7 5 7 5 7 4 7 4 7 4 7 4 7 4 7 3 7 3 7 3 7 2 7 2 7 2 7.2 7 2 7 2 7 1 7 1 7 0 7 0 7 0 7 0 7 0 7 0 7 0 7 0 7 0 7 0 7 0
7 0 6 9 6 6 6 8 6 8 6 8 6 5
6 3
5 3 H 5 1 5 3 5 0
4.8 4 7 4 7 4 7 4 7 4 6 4 5 4 7 4 7 4 6 4 6 4 6 na
4 6 4 5 4 5 4 4 4 4 4 4 4 3 na 4 2 4 2 4 7 4 4 4 3 4 3 4 3 4 2 4 2 4 2 4 2 4 2 4 1 4 1 4 1 4 2 3 9 3 9 3 9 3 6 3 4
5 1 H 5 0 5 0 4 6 4 5 4 5 4 6 na
4 5 na
4 4 4 4 4 3 4 4 na
4 9 na
4 4 4 3 4 3 4 3 4 3 4 2 4 1 4 1 4 1 4 1 4 4 4 0 na
4 1 na
na 4 0 4 0 4 3 4 1 na
4 1 3 9 4 0 4 0 3 9 3 9 3 6
3 3
5 0 H 4 8 5 0 4 6 4 5 4 6 4 6 4 5 4 3 4 6 4 2 3 5 4 4 4 2 4 4 4 5 4 2 4 2 4.1
4 2 4 2 4 1 4 2 3 8 4 1 4 1 4 1 4 1 4 2 4 1 4 0 4 2 4 1 4 1 4 0 3 8 36 4 1 4 1 3 7 3 9 3 8 3 7 3 8 3 5 3 2
5 3 H 5 0 5 1 4 8 4 6 4 8 4 6 na 4 5 na
4 3 4 2 4 5 4 3 na 4 6 4 3 4 3 4 3 4 3 4 3 4 2 4 3 3 9 4 3 4 2 4 2 4 6 4 3 4 4 4 2 na
4 3 4 2 4 2 4 2 3 9 4 4 4 3 4 0 3 6 3 9 3 9 4 0 3 7 3 5
5 5 H
5 2 H 5 2 H 4 9 4 8 5 0 5 1 na
4 6 na
4 5 5 0 4 5 4 4 4 8 4 8 4 5 4 5 4 5 na
4 5 4 3 4 4 na 3 9 4 3 4 4 4 8 4 5 4 6 4 4 na
4 4 4 2 4 4 4 3 4 1 4 6
4 5 4 0 4 0 3 9 4 0 4 1 3 9 3 9
5 5 H 5 2 5 4 4 6 5 1 5 3 5 4 5 1 4 9 5 5 4 9 5 1 4 6 4 5 4 6 4 8 4 8 4 8 4 7 4 4 4 7 4 4 4 7 4 2 4 2 4 5 4 4 5 1 4 6 4 3 4 6 4 3 4 4 4 0 4 5 4 3 4 2 4 6 4 8 4 3 4 6 4 1 4 3 4 3 4 2 3 6
5 6 5 8 5 1 5 2 5 4 5 5 4.9 5 3 5 4 5 7 5 5 5 3 S O H 6 1 5 4 5 0 5 6 5 1 5 3 5 0 4 6 5 0 5 0 5 0 5 0 4 9 5 0 5 0 4 5 5 0 4 4 4 7 4 8 4 7 5 2 4 9 4 5 4 8 4 7 5 0
6 6 H 5 0 5 6 5 3 5 5 5 3 5 3 5 1 5 3 5 2 5 2 5 3 5 5 5 3 4 7 5 3 4 6 4 6 5 1 4 9 5 4 5 3 4 8 4 9 5 0 5 5
3 9 L 3 8 L 4 7 4 6 4 4 4 0 4 3 4 6 4 8 5 0
5 2 5 4 4 4 4 6 4 6 5 0 4 5 5 0 4 5 5 1 4 6 4 8 4 4 4 7 4 2 4 9
2 8 L 5 8 L 2 6 L 3 1 L 2 9 L 3 3 L 3 5 L 3 5 L 4 1 4 0
na 7.3 H 8.3 H 5 8 5 8 6 0 6 6 5 8 6 7 7 5 5 6 6 2 6 9
6 0 7 0 7 6 6 2 6 3 7 2 6 5 H 7 3 H 7 9 na 5 3 6 0
5 7 na
5 4 5 5 na
5 8 na na 5 6 6 0 5 7 4 8 5 8 5 0 na 5 5 5 3 6 1 5 7 6 3 5 1 na
6 1
na 6 1 na 6 6
6 4 6 2 6 5 6 9 6 2 6 3
6.2 6 3
6 7 6 3
5 9 6 6
6 0 6 0 6 3 5 9 6 6 6 7 5 8 6 3
na 6 6
na 6 8 na 7 4 na 7 1 7 2 na
7 0 7 1 7 1 7 2 7.4 7 0 7 1 na 6 7 6 6 7 1 6 7 7 3 7 5 na 7 3 na
7 3
5 2 5 2 5 1 5 9 5 4 6 3 H na na na 5 1 4 9 4 9 5 1 na na
na 5 2 5 1 5 1 5 3 5 0 na
na
4 8 5 2 5 1 5 2 5 1 na 5 0 na na
7.4 H 6 3
7 1 6 8 7 3 6 9
7 4 na 6 5
na 6 9 6 6 6 3 6 7 6 6 6 6
6 7 6 7 6 8 7 0 6 7 6 4 6 9 6 3
6 1 6 6
6 6
7 1 6 6
6 4 6 6 na 7 0
4 1 L 4 8 L 5 6 L 4 4 L 5 3 I 5 0 5 8 6 5 4 7 6 4 4 3 6 0 6 5 5 1 5 8 5 0 5 7 6 7 5 3 6 3
5 2 6 0 6 8 na 6 5
5 8 6 4 7 1 4 9 6 5 4 8 5 5 6 4 4 6 6 2 5 4 5 9 6 6 na 6 4 5 4 6 2 7 1 5 3 6 5 5 5 6 2 6 8 5 2 6 9 5 1 5 9 6 8 4 7 6 3 5 1 5 7 64 4 7 6 2 5 1 6 1 6 9 5 1 6 1 5 9 7 3 7 8 5 4 5 5
June Consensus 4.2 7.2 4.4 4.2 4.1 4.3 4.5 4.6 4.9 5.1 5.5 6.3 7.0 5.1 6.6 --
5 0 5 3 5 4 5 7 6 1 6 9 7 6 5 5 7 1
BaltornlOAvg 3 7 6 7 3 6 3 8 3 6 3 8 3 9 4 1 4 3 4 4 4 8 5 7 6 5 4 8 6 0
MayConsensus 4 2 7 2 4 4 4 3 4 2 4 3 4 5 4 7 5 0 5 3 5 6 6 4 7 1 5 2 6 7
Number of Forecasts Chan ed From A Monlh Aqo
20 27 28 30 23 29 20 20 28
15 13 12 11 10 6 9 7 10
6 7 1 0 3 5
% 35 Oh 29 % 28 % 24 % 26 % 25 % 37 % 22 % 23
7 7 7 6
rvg Fw all -
A. ff s Majoi
unency 5 Index
87.0 79 0
890 k 88 1 79 0
80 0 83 5
na 78 0
na
77 6 na
75 0 81 4
na na na
700 I 70 0
77 0
-
e5 3 81 0 74 5
83 6 na na na
77 5 15 6 61 0 86 3
na na
83 0 80 0 82 0
na ria
76 0 80 0 83 0
75 4
85 0 88 0 80 0
75 6
81 9
Index Index
3 4 3 8 4 0 3 2 3 3 3 6 2 9 3 0 3 0
3 5 3 9 3 0 3 0
3 7 3 0 3 0
3 3 3 8 3 4
3 5 3 5 na 3 0 2 9 3 3 3 5 3 3 3 7 3 1 3 8 3 5 3 0 3 4 3 2 3 5
3 0 3 0 2 2 2 7 1 8 2 4
2 5 2 8 2 7 3 7 H 2 2 2 7 2 3 2 5 2 3 2 7 2 7 3 1 2 2 2 3 2 2 2 4 2 2 2 8 1 9 2 6 1 9 2 3 2 4 2 6 1 5 2 3 2 1 2 3 2 1 2 4 2 3 2 7 2 3 2 9 2 1 2 5 na na 3 0 H 2 2 2 2 2 4 ::f2 2 3 2 5 2 1 2 6 2 1 2 4 2 7 3 2 1 4 L 1 9 L 1 9 2 7 2 2 2 5 1 7 1 9 L 2 2 2 0 2 1 2 6
80.5
85 9
75 4
79 7
4
9
20
74 --
2 0 L 2 5 3 0
2 7 2 5 3 3
3 7 2 1 2 5 3 0 3 0 H 3 2 3 1 1 9 3 0
3 7 2 0 2 3 3 5 2 2 2 1 4 2 H 2 4 2 6 3 2 2 7 2 6 2 6 2 5 3 1 3 2 2 0 2 3 3 8 2 3 2 7
------I --
I 3.3 2.2 2.6
9 11 11 I I

Third Quarter 2006 Interest Rate Forecasts
_I-
-Average For Quarler ---.- -lntennediateTerm--- - 1 o n g T e u
2 3 4 5 6 7 8 9 1 0 11 12 13 14 15 Federal Pnme LIBOR Cam Treas Treas Treas Treas Treas Treas Treas Aaa Baa State& Home
Notes Notes Notes Corp Corp Local Mlg
1-Yr 2.Yr 5-Yr 10-Yr. 20-Yr Bond Bond Bonds Rate
RBS Greenwich Capital Econ. Bear Stearns a Co
Aclion Economics 1 DeuLsche Bank Securities, Inc k
Loomis. Sayles 8 Company
Comerica Bank Moody's investors Service BMO Nesbitl Burns
Twsco Capital Management JPMorgan Asset Mgt
Barciays Capital NamR Economic Advisors Goldman Sachs 8 Co.
J P. Morgan Chase PNC Financial Services Cop
Swiss Re Citigroup Asset Management J.W. Coons Advisors LLC
National City Corporation Fannie Mae
Chmura Economics & Analylics Wayne Hummer 8 Co (ellner Economic Advisers
orgia Stale University i.(J arView Economics
Standard 8 Poor's Cop
Woodworth Holdings ING Investment Mgl
Briefing cam Nal'l Assn. 01 Realtors LaSalle Nal'l Bank DePrince & Associates Prudential Equity Group LLC
Perna Associates Mesirow Financial Nomura Securities Inc UBS Warburg Classicalprinciples cam Thredgold Economic Assac
i Independent Economic Advisory
j U S Trusl Company
!, Wachovia Banc of America Securities
Wells Capital hlanagemenl Cycledata Corp Scoliabank SunTNst Banks
5 2 H 5 0
5 0 4 8 4 6 4 6 4 5 4 5 4 5 4 5 4 5 4 5 4 5 4 5 4 5 4 5 4 5 4 5
4 5 4 5 4 3 4 3
4 3 4 3 4 3 4 3 4 3 4 2 4 2 4 2 4 2 4 2 4 0 4 0 4 0 4 0 4 0 4 0 4 0 4 0 4 0 4 0
4 0 3 9 3 5 3 3
8 2 H 8 0 8 0 7 8 7 6 7 6 7 5 7 5 7 5 7 5 7 5 7 5 7 5 7 5 7 5 7 5 7 5 7 5 7 5 7 5 7 3 7.3 7 3 7 3 7 3 7 3 7 3 7 2 7 2 7 2 7 2 7 2 7 0 7 0 7 0 7 0 7 0 7 0 7 0 7 0 7 0 7 0 7 0 6 9 6 5 6 3
5 4 H 5 3 5 1 4 8 4 9 4 7 4 9 4 8 4 8 4 7 4 7 4 7 4 7 4 7 4 7 4 7 4 7 4 6 4 6
na 4 5 4 5 4 4 na
4 5 4 6
4 4 4 5 4 3 4 3 4 0 4 5 4 7 4 5 4 3
4 3 4 3 4 2 4 2 4 2 4 1 4 1 4 1 4 0 3 8 3 4
5 3 H 5 1 5 0 na
4 7 4 6 4 6
4 5 4 5 4 5 4 5 4 7 na na
4 6 5 1 4 5 4 4 4 5
4 4 4 4 4 4 4 5 na
4 3 4 4 4 3 4 3 4 2 4 2 4 0 4 3 4 4 4 0
na
4 1 na na
4 0
4 1 4 0
na
4 0
4 0
3 6 3 3
5 2 H 5 0 4 8 4 9 4 5 4 4 4 6 4 5 4 5 4 6 3 6 4 6 4 5 4 5 4 4 4 6 4 3 4 1 4 2 4 4 4 4 4 3 4.1 4 2 4 1 4 2 4 3 4 2 4 2 4 1 3 9 4 2 4 1 4 3 4 1 3 9 4 2 4 1 4 0
4 0 4 1 4 1 4 0 3 7 3 5
3 2
5 3 H 5 2 5 0 na
4 5 4 6 4 7 4 5 4 6 4 8 4 1 4 8 na na
4 5 4 8 4 4 4 2 4 3 4 6 4 5 4 4 4 4 4 3 4 3 4 3 4 6
4 3 4 2 4 2 4 0
4 4 4 7 4 4 4 4
3 8 na 4 3 4 2 4 1 4 2 4 4 4 2 3 8 3 7 3 5
5 4 H 5 4 H
5 2 na
4 6 4 7 4 9 4 6 4 8 5 0 4 7 5 1 4 9 na
4 6 5 0
4 5 na
4 5 4 0 4 6 4 6 4 5 4 5 4 3 4 5 4 8 na 4 4 4 4 4 0
4 6
4 9 4 5 4 6 4 0 na
4 4
4 4
4 2 4 1 4 6
4 4
4 1 3 9 3 9
5 5 H 5 5 t i 5 2 5 5 4 9 4 9 4 7 4 7 5 1 5 3 4 8 5 5 4 7 5 1 4 7 5 0
4 8 4 4 4 9 4 4 4 9 4 8 4 5 4 8 4 6 4 8 5 1 4 5 4 6 4 4
4 2 4 8 5 2 4 6 4 5 4 5 4 3 4 4 4 5 4 5
4 0 4 5 4 5 4 2 4 2 3 6
5 5
5 6
5 2 5 8 5 1 5 1 5 0 5 0
5 4 5 5 5 0
5 9 H 5 1 5 3 4 8 5 1 4 8 4 5 5 2 4 9 5 1 5 2 4 5 5 0 4 5 5 0 5 4 5 0
4 8 4 7 4 6
5 0 5 4
4 9 4 6
4 7
4 7 5 0
4 1 4 7 3 9 4 8 4 8 4 3
4 4 4 1
5 5 5 6 5 3 6 0 5 4 5 4 5 4 5 4
5 7 5 3 5 3
6 1 H 5 1 56 4 8 5 4 4 9 4 7 5 4 4 6 5 4 5 4 4 2 5 2 4 7 5 2 5 6 5 5
5 0 4 9 5 1 5 1 5 5 5 4 4 9 4 9 5 0
5 5
4 8 5 4 3 8 5 0
5 1 4 6
4 7 5 0
2 1 L 5 1 1 2 1 L 2 5 L 2 4 L 2 8 L 3 0 L 2 9 L 3 5 1 3 4 L
5 8 6 8 na 7 2 5 9 6 1 6 0 na 5 7 6 6 5 7 6 4 5 7 6 2 5 4 6 3 5 9 7 0 6 2 6 3 na 6 1
6 5 H 7 3 na 6 9 na na
4 8 6 0 5 8 6 3
5 1 6 0
5 0 6 2 5 8 6 7 na 6 1 5 9 6 6
5 8 6 5 4 0 L 6 0 na
4 9 na
6 0
6 0 5 4 5 4 5 5
5 2 6 2 5 8 6 3 5 3
na 6 1 5 0 5 8 4 1 5 2 5 4 4 9 5 1 5 1 6 0
6 3 5 6
6 2 6 6 6 8 6 1 6 0 6 3
6 5 6 7 6 9 5 9 5 8 na
6 6
5 8 6 4
7 6 8 2 6 6
na 7 3 7 3 6 9 7 2 7 6 7.2 na
7 9 na na
7 2 7.1 6 7 6 8 7 6 6 7 na
7 1 6 5 7 2 6 5
7 1 7 3 7 5 7 0 6 8 7 2 7 4 7 5 7 8 na 6 6
na
7 3 6 5 7 2
5 4 7 1 5 6 7 2 5 3 6 4 na na 5 1 6 8 5 2 6 9 5 1 6 9 5 0 6 4
5 9 7 3 5 4 6 9 4 6 6 3 6 2 H 7.5 na
na 5 1 na na
na 5 2 4 6 na
5 4
5 0 na
4 7 5 2 5 0
5 2 5 2 5 2 5 4
5 2 5 3 5 2 na
na
na na
4 1 5.1
6 8 na
6 5 6 7 6 4 6 4 7 1 6 1 7 0 6 9 5 9 6 8 6 4 6 8 7.1 7 0 6 5
6 7 6 6 6 8 7 2 6 7 6 5
6 3 na
7 0 6 4
7 3 4 8 L 5 6 L 4 4 L 5 3 6 0 6 8 na 65 6 1 7 1 4 8 6 5
5 7 6 8 5 4 6 2 5 7 6 4 4 7 6 1
6 2 7 0 5 2 6 1 7 7 H 8 3 H 5 5 44
June Consensus 4.3 7.3 4.4 4.3 4.2 4.3 4.5 4.7 4.9 5.1 5.5 6.3 7.1 5.2 6.6 -- _I ---.-
Top lOAvg 4 7 7.7 4 9 4 8 4 7 4 8 5 0 5 3 5 5 5 6 6 1 7 0 7 7 5 6 7:
Bot lomlOAvg 3 7 6 7 3 8 3 7 36 3 8 3 9 4 1 4 3 4 4 4 8 5 7 6 5 4 8 5s
Mayconsensus 4 3 7 3 4 5 4 3 4 3 4 4 4 6 4 8 5 0 5 3 5 6 6 4 7 2 5 3 6 1
i'lunibar of Forecasts Chanaed From A Monlh A a o
Down 10 10 18 14 21 18 20 25 28 30 25 28 22 16 21
Same 32 32 i a 19 18 17 12 15 12 12 11 11 13 13 11
Up 5 5 9 6 8 8 10 G 6 4 3 4 4 2 1
I Diffusionlndex 45 % 45 % 40 % 40 % 36 % 38 % 38 X 29 % 26 22 % 22 % 22 % 27 % 27 % 2
KPSC Case No. 200.5-0034 1 AG 1 St Set Data Request
Item No. 22 1 Page 32 of 4 1
,
Key Assumptions - ,vg For -Qtr -
A. d's Majc
urrency
ilndex 90.0 I 88 3
78 0 na
81 0
77 0 88 5 78 0 78 0 81 0
na
85 5 na na
80 0
na 75 0 83 7 76 7
na 73 3 86 0 80 0
na 79 0 69 7 77 0
76 0 na na
74 2 86 8 76 5 76 6 80 9 82 0
na na
80 0 848
83 0 na
88 5
na 80 0
74 7 83 0 __
80.4
86 5
75 0
79 9
7
7
18
67 __I_
4 0
3 5 3 8 3 4
3 7 33 4 0
3 3 2 8 3 8 3 5 3 3 3 0 3 0
na
3 1 3 0 3 5
3 5 3 9
3 8 3 4 3 0 3 0 3 0 3 5
3 0 3 5 3 5 3 7
-(a0 % Change)-
B C D -Y+~RF------
GDP Cons leal Pnce Pnce iDP Index index
1 8 2 4 2 9 2 9 2 1 2 7 2 1 2 1 1 8 2 4 2 4 2 8 1 1 L 2 5 1 9 2 3 2 5 3 2 2 2 2 6 2 1 2 2 2 2 2 3 2 3 2 7 2 5 2 8 na na
1 7 2 5 3 0 H 3 0
2 1 2 3 2 1 2 4 2 1 2 5 2 2 2 0 2 1 2 5 2 0 3 2 1 6 1 7 1 8 3 0 2 3 2 0 2 2
2 7 L 2 0 3 3 2 1 3 4 2 3 3 6 2 8
1 2 L 2 7 1 4 3 2 2 9
2 3 2 7 2 1 2 9 2 5 3 3 H
4 2 H 1 4 2 0
3 5 1 9 24 3 0 2 2 2 5 3 7 1 4 1 6
3 5 2 1 2 6 4 0 2 5 2 7 3 3 2 3 2 3 36 2 1 2 5 3 2 2 7 2 6 3 2 2 7 3 2 2 8 2 5 30 3 3 2 0 2 3 3 3 2 2 2 6
3.4 2.2 2.5 -- 3 9 2 7 3 1
2 9 1 6 1 9
3 4 2 2 2 5
12 10 7
23 27 31
11 9 8
49 % 49 % 51
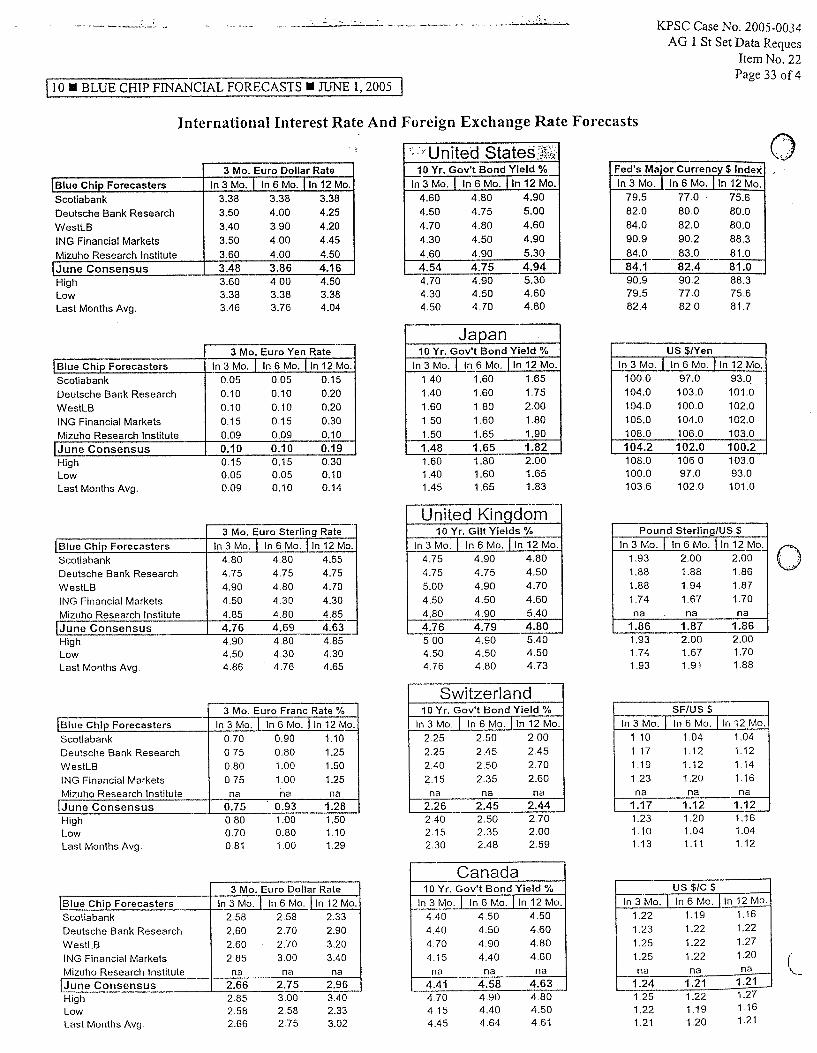
Blue Chip Forecas te rs Scotiabank Deutsche Bank Research WestLB ING Financial Markets Mizuho Research Institute
IJune C o n s e n s u s
3 Mo. Euro Yen'Rate In 3 Mo. 1 In 6 Mo. I In 12 Mo. 0.05 0.05 0.15 0.10 0.10 0.20 0 10 0.10 0.20 015 0.15 030
0.10 0.10 0.19 0.09 0.09 0 . E
Scotiabank Deutsche Bank Research WestLB ING Financial Markets
4.80 4.80 4.55 4.75 4.75 4.75 4.90 4.80 4.70 4 50 4.30 4.30
Scotiabank Deutsche Bank Research
ING Financial Markets WestLB
0 7 0 090 1.10 0 75 0 80 1.25
0 75 1.00 1.25 0 80 1.00 1.50
Mizuho Research Institute na na na
Scotiabank Deutsche Bank Research WestLB ING Financial Markets
2.58 2 58 2.33 2.60 2.70 2.90 2.60 2.70 3.20 2 85 3.00 3.40
KPSC Case Na. 2005-0034 AG 1 S t Set Data Reques
Item No. 22 Page 33 of 4 I 10 H BLUE CHIP FINANCIAL FORECASTS H JUNE 1,2005 1 ,-I.__-
International Interest Rate And Foreign Exchange Rate Forecasts
- 2 United 10 Yr. Gov't Bond Yield %
4.60 4 50 4.90
Fed's_Major Currency $ Index , In 3 Mo. I In 6 Mo. 1 In 12 Mo. 79.5
84.0 82.0 80.0 90.9 90.2 88.3
Deutsche Bank Research 3.50 4.00 4.25 WestLB 3.40 3.90 4.20 ING Financial Markets 3.50 4.00 4.45 Mizuho Research Institute I 3.60 4.00 4.50
I 3.48 3.86 4.16 High 3.60 4.00 4.50
[June C o n s e n s u s - 4.60 4.90 5.30
4.70 4.90 5.30 4.54 4.75 4.94
83.0 81.0
90.9 90.2 88.3 4 30 4.50 4.60 4 50 4 70 4.80
79.5 77.0 75.6 82.4 82.0 81.7
Low 3.38 3.38 3.38 Last Months Avg. 3.46 3.76 4.04
J a p a n -- I0 Yr. Gov't Bond Yield YO
In 3 Mo. I In 6 Mo. I In 12 M z 1.40 1.60 1.65 1.40 1.60 1.75 1.60 1.80 2.00 1.50 1.60 1.80
US $/Yen In 3 Mo. I In 6 Mo. I In
I 100.0 97.0 93.0 104.0 103.0 101.0 104.0 100.0 102.0 105.0 104.0 102.0
1.65 1.90
1.80 2.00 1 :::: 1.65 1.82 I
1.60
108.0 '106.0 103.0 104.2 102.0 100.2 108.0 106.0 103.0
1.40 1.60 1.65 1.45 1.65 1.83
100.0 97.0 93.0 103.6 102.0 101.0
I United K i n a d o d 1 3 Mo. Euro Sterling Rate 1 In 3 Mo. 1 In 6 Mo. 1 In 12 Mo. [Blue Chip Forecas te rs
I 10 Yr. Gilt Yields % I P o u n d SterlinglUS $ I t 475 4 90 In 3 Mo. I In 6 Mo. I In 12 Mo. 193 200 2.00 1 0
4.75 4.75 4.50 5.00 4.90 4.70 4 50 4.50 4.60
1.88 1.88 1.86 1.88 1.94 1.87 1 I 1.74 1.67 1.70
4.90 4.70 4.50 4.60
Mizuho Research Institute I 4.85 4.80 4.85 [ J u n e C o n s e n s u s 1 4.76 4.69 4.63 Hiah 4.90 4 80 4.85
4.80 4.90 5.40 4.76 4.79 4.80 5.00 4.90 5.40
na . n a na 1.86 1.87 1.86 1.93 2.00 2.00 -
Low Last Months Avg
4.50 4 30 4.30 4.86 4 76 4.65
4 50 4 50 4.50 4 76 4 80 4.73
174 1.67 1.70 193 1.9 1 1.88
Switzerland 10 Yr. Gov't Bond Yield%
2 25 2 45 2.45 2 40 250 270
235 260 2 15
szus $ _I
In 3 Mo. I In 6 Mo. I In 12 Mo. 110 1.04 1 04
1 3 Mo. Euro Franc Rate YO 1 In 3 Mo. I In 6 Mo. I In 12 ME LBlue Chip Forecas te rs
117 112 119 112 1 23 1.20 116
1 na .I7 172-+{ 1.23 l"20 1.16
na na na 2.26 2.45 2.44
2.50 2.70 2.40 .., Low Last Months Avg
0.70 0.80 1.10 0 81 1.00 1.29
110 1.04 1.04 1.13 1.1 1 1.12
2 35 2.00 2 15 2 30 2 48 2.59
Canada 10 Yr. Gov't Bond Yield YO
4 70 4 90 440 460
1 3 Mo. Euro Dollar Rate I In 3 Mo. I In 6 Mo. I In 12 Mo. [Blue C h i p r e c a s t e r s
us $IC $
1.23 1.25 1.22 1.27 1.25
na na __ na 1.24 1.21 1.21 1.25
- 1.22 1.27
Mizuho Research Institute __ na na na [ J u n e C o n s e n s u s 2.66 2.75 2.96 Hiqh 285 300 3.40
na n a ria 4.41 4.58 4.63 4 70 4 90 4.80
1.19 1 16 1.20 1.21
1.22 1.21
Low Last Months Avg
2.58 2.58 2.33 2.66 2.75 3.02
4 15 4.40 4.50 4 45 4.64 4.61

IBIue Chip Forecasters Scotiabank
3 Mo. Euro Dollar Rate In 3 Mo. 1 In 6 Mo. I In 12 Mo.
5.95 5.75 5.75
Germany France In 3 Mo. 1 In 6 Mo. I In 12 Mo. In 3 Mo. I In 6 Mo. I In 12 Mo.
3.60 3.70 3.30 3.65 375 3 35
- Spain -.-- Italy
In 3 Mo. 1 In 6 h. 1 In 12 Mo. In 3 Mo. 1 In 6 Mo. [ In 12 3.70 3.85 3.40 3.65 3.75 3.35
3.70 3.90 ING Financial Markets 3 60 3.90
3.70 3.80 4.50 3.80 4.50 3.71 3.91 380 4.50
Low 3.60 3.35 3.74 3.85
3.80 3.90 4.10 3.60 3.70 3.80 4.10 3.60 3.90 4.00 4.70 3.70 3.78 3.89 4.08 3.64 3.90 4.00 4.70 3.70 3.70 3.80 3.40 3.60 3.73 3.80 3.99 3.59 3.74 3.85
.- Japan
Switzerland
Eurozone
United Kingdom
Canada Australia
Current In 3 Mo. In 6 Mo. In 12 Mo. ,-3.25 -3.38 -3.95 "3.97 1.53 1.28 0.83 0.47
-0.68 -0.82 -1.11 -1 "20 2.32 2.37 2.0 1 1.66
-.-
-2.56 -2.73 -2.93 -2.88
-1.15 -1.34 -1.68 -1 .ao
KPSC Case No. 2005-00341 AG 1 St Set Data Request ,
ItemNo. 221 ' Page 34 of 4 1 I JUNE 1,2005 BLIJE --
International Interest Rate And Foreign Exchange Rate Forecasts
Australia r
I 0 Yr. Gov't Bond Yield YO
5.45 5.60 5.50 5.80 5.60 5.50 5 . 6 ~
A $/US S
- In 3 Mo. I In 6 Mo. I In 12 Mo. 0.82 0.85 0.85 0.77 0.77 0.75 o 77 0.76 0.73 0.77 a 78 0.80
Deutsche Bank Research WestLB ING Financial Markets
5.85 5.85
5.70 5.95 5.95 5.90 5.90
Mizuho Research Institute 1 na na na , LZjZGnZ'ensus 1 5.85--, 5.86 5.81
High 5.95 5.95 5.95
na na na 5.58 5.69 5.53 5.80 5.85 5 . 6 ~
na na na 0.78 0.79 0.78 0.82 0.85 ' 0.85
5.70 5.75 5.75 5.79 5.89 5.86
5.35 5.50 5.40 5.66 5.74 5.75
0.77 0.76 0.73 0.78 a.79 0.78
Low Last Months Avg
Eurozone
3.60 3.70 3.30
10 Yr. Euro Bondkeld % ,
In 3 Mo. I In 6 Mo. I In 12 Mo. _I_
- 3 Mo. Euro Rate
Scotiabank Deutsche Bank Research WestLB ING Financial Markets 2.15 2.15 2.20
EurolUS $ __
1.28 1.28 1.30 1.30 1.38 1.33 1 1.22 1.22 1.26
3.50 3.50 3.75
3.50 3.60 3.90 3.80 3.90 4.10
Mizuho Research Institute I 2.10 2.15 22: 1 I June Consensus 1 2.14 2.17
High 2.20 2.30 2.70
1.26 1.29 1.32 - 1.37 1.42 1.43
.- na -.- 3.60 3.68 ___ 3.80 3.90 4.10
LOW
Last Months Avg 2.10 2.10 2.20 2.13 2.21 2.4 1
3.50 3.50 3.30 3 63 3.73 3.74
1.22 1.22 1.26 1.33 1.35 1.35
Consensus Forecasts L Mo. interi=l Consensus Forecasts
IO-vear Bond Yields vs US. Yield Current
0.28 -2.05 0.00 1.22
-0.75 -,0.74 -0.55 -0.75 -0.70
-2.78 in 6 Mo.
0.04
--- -3.10
-2.30 -0.18 0.94
-1 -05 -1.04 -0.86 -0.99 -1.08
In 12 Mo. -3.1 2 -0.14 -2.50 -0.32 0.59
-1.04 -1.03 -0.86 -0.98 -1.18 --
In 3 Mo. -3.06 0.22
-0.13 -2.28
1.04 -0.94 -0.93 -0.77 -0.90 -0.94 --
._-_____-
United Kingdom Switzerland Canada Australia Germany
Spain

~TGXZE CHIP FINANCIAL FORKTS JUNE I. 200.5 I
KPSC Case No. 2005-00341 AG 1 St Set Data Request
Item No. 221 Page 3.5 of41
,
~ ~~~~
A Sampling Of Views On The Economy, Financial Markets And tiovernment Policy Escerpted From Recent Reports Issued By Our Blue Chip Panel Members And Others n
Approaching Neutrality? .. . Despite 200 basis points of tightening, neither we nor the Fed believe that monetary policy has reached a neutral stance, and thus more tight- ening is likely. But there's a disconnect between our views and those expressed in financial markets: Market participants, increasingly fed up with forecasts that yields are heading higher, are throwing in the towel and betting that the tightening cycle is nearly over. Who's right? Neutrality, defined a century ago by the Swedish economist b u t Wicksell, is that level of real interest rates that equilibrates aggregate supply with demand and is consistent with price stability. Of course, no one really knows what that level is. To quote Fed Chairman Greenspan last week, 'it's an amorphous concept [and] \ve'll know i t when we see it. ' It's understandable that policymakers won't commit to any specific estimates. After all, other elements of financial conditions such as asset prices and credit conditions affect the linkage from monetary policy to the economy. And Fed officials already give market participants a healthy dose of fonvard-looking policy guidance. I t may be overly precise on my part, but I've long thought that the range for neutrality implies that the Fed has at least another 100 basis points of tightening beyond today's 3% funds rate. How will we know i t when we see it? The ansivers to hvo key ques- tions will translate Wicksell's abstraction into action for policymakers: Has the economy slowed to a pace at or below its sustainable trend, or is i t poiscd to reaccelerate to something at or above trend? And more important, has underlying inflation, which has lately moved above the Fed's presumed comfort zone, peaked or is i t merely pausing? As I see it, there are now upside risks to both growth and inflation from current rates. Here's n h y . The answers n.on't yet be found i n incoming data, uhich are ambiguous on both counts. For example, growth in consumer demand, jobs and income all rebounded sharply in April, but bccause an early Easter probably depressed March levcls, it's premature to decide that the April recovcry marks a new trend. Furtlierniorc, i t appears from surveys and production that the effects of the recent slo\cing in growth and efforts to work off inkentories of cars and titicks are still depressing growth in manufacturing Likeivisc, some seasonal anti statistical quirks probably have distoned recent "core" inflation readings Seasonal adjustment techniques apparently fail to eliminate completely the typical seasonal patterns in March and April inflation readings. especially in apparel and hotel room r:ites. And rcccnt sharp increases i n utility quotes have perversely reduccd corc inflation becntise statisticians strip out the ef- fects of utilities' price changes from rents nhen calculating the change in on oivners' equivalent rent - uhicli ;kccounts for nearly one-third of the core CPI Investois should bovare: What sc;isoiial factors subtract i n April will show up i n other months, not disappear.
To be stire, ironing out thc recent volatility i n the dtita helps put them i n perspective. For example, therc really was a deceleration i n consumer spending: Ober tlic first four months of 2005, \ve estimate that real con- sumer spending slowcd to a 2 3Yn annual rate. reflecring the loss of discretionary iricoiiie from surging encigy quotrts Monthly job growth over that period has improvccl to 2 1 1,000, as payrolls have begun to catch tip u'itli the economy. Anti despite April's tlat ic.';iding, corc infla- tion in tlic first four months of 2005 1i:is moved uell above the Fed's comfbrt zone: h1c;tstired by tlic CPI, i t is running nt 2.65'0, and nicas- ured by the t\vo vm iants of the pcrsonal consumption espciiditiires price gnufie, we cstiniiitc tlitit i t is running at 2..3-2.50/; This is hnrdly consis- tent \\it11 the Fed's I'orecnsl that coie iiitlxtion tvill avernge I % % both this year and ncst. Noncthclsss, these observations still don't resolve tlic growth and inl1;ition tlcbatc.
c,,r The resolution lies in analysis of fundamentals. As I see it, the inter- play between lower energy prices, favorable financial conditions and pent-up demand will soon promote stronger growth. While refinin:: . 1 capacity is still taut and thus energy markets are vulnerable to shocks .'
that could push prices higher, it's notable that crude quotes have plunged $10 from their March peaks as oil markets have moved into contango. As a result, wholesale gasoline prices have declined 19% from their early-April highs, and average prices at the pump have de- clined by twelve cents in the past five weeks. As expected, fears of credit restraint have faded. But yields have remained low and stock prices have rebounded, implying that financial conditions remain sup- portive of growth. Meanwhile, despite April's inflation pause, inflation fundamentals point to more upside risks. Quickening labor costs now are joining the forces that promoted higher inflation over the past 16 months - a better bal- ance behveen supply and demand, and a still-accommodative monetary policy - to extend that trend. Most of the acceleration in unit labor costs is the result of slowing productivity growth, which Fed officials might downplay because they focus more on the trend in productivity growth. But I'm confident that compensation growth will begin gradu- ally to accelerate, reflecting tighter labor markets and rising inflation expectations. In addition, anecdotal evidence points to more price in- creases in consumer staples and in rents, among others, that will add to core inflation soon. Financial markets now seem priced to a muddle-through economic scenario with little upside inflation risk -one in which the end of Fed tightening is in sight. Judging by the TIPS market, for example, real
breakeven inflation (BEI) has tumbled by 30-35 basis points to below 2.5%. That's understandable, given the decline in energy quotes, but given the TIPS liquidity premium that boosts BE1 slightly, today's pric- ing implies a complacent inflation outlook. Even five-year ahead five- year fonvard BE1 has plunged by roughly the same amount, to below 210 bp. And judging by the yield curve. market participants now ex- pect roughly 75 basis points of tightening betu.cen now and year-end, and believe that such an increase Lvould mark an enti to the current tightwing cycle. I disagree. The projected resumption of hearty grixvth and rising inflation that 1 see mean that it's worthwhile betting against the benign consensus. I see thc risks for both grouth and inflation tilted higher than either current data or the consensus supgest. but uncertainties remain. The economic reacceleration may take another couple of months to materi- alize. And seasonal oddities may supprcrss inflntion for a M hile longer. In that contest, ivhile the Fed seems unlikely to pause soon in its nieas- ured tightening campaign, a near-tenn failure of thc economy or prices to accelerate could stir thoughts of n pause. If so, inarket participants may over-read any indication that officials are thinking about taking stock of what they've accomplished,
Fcd Cyclc In 8'" Inning; Easing I n 2006 To Stecpcri Curve We remain bullish on bonds as we see tlie Fed ending its current tight- ening campaign i n August at 3 3 5 b on the funds rate, and by early next year we expect tlie Fed to cut rates tivice, bringing tlie funds rate to 3.0% The 10-yenr note yield iievcr came close to approaching the 4.65% level we had expected in the secoiid quarter, though we had said that such a move would reprcsent an ovelslioot, and any sharp spasms tli;it occur on tlic back of upside econoniic surprises should be viewed as buying opportunities. The trend is still towards lower long-ten11 rates, m t i any aggressive Fcd tightwing \\:iII ouly serve to exacerbate tlie flattcning i n the curve and clotid the ccononiic outlook.
yields have declined by about 30 bp since the end of March, while c ~
liic/ra,r/ BcWrc/.* I \ (O/ .SN/I Stnnlc); h'w l 'U/"k. N1'
i

. .. .. ,.
I JUNE 1,2005 BLU
KPSC Case No. 2005-00341 AG 1 St Set Data Request
Item No. 22 1 Page 36 of 4 1
A Sampling Of Views On The Economy, Financial Markets And Government Policy Excerpted From Recent Reports Issued By Our Blue Chip Panel ICIembers And Others
While there is always the risk of a policy overshoot-we noticed that the Fed typically pierces our Taylor-Rule estimate of neutrality and an excessive move this time around would mean going as much as 100 basis points above our 3 5 % estimate of where the f’unds rate will peak this cycle. This would be devastating for the front end of the market and will likely trigger an inversion of the yield curve and significantly lift recession risks. This is why we continue to stick with our base-case scenario of no more than two more rate hikes this cycle. In our view, the Fed can ill-afford to tighten as much as it has in tlie past with under- lying inflation so low, an output gap that seenis to be in a 1%-2% range, Lvhich is beyond bizarre for this stage o f the cycle, and so much lever- age tied to short-term debt (as much as I13 in tlie household sector), Lvithout risking a renewed outbreak of deflation concerns next year. When we run our Taylor Rule with our estimates of the output gap and potential GDP growth along with our 3%-ish forecast, the neutral funds rate we come up with is 2.75%. Thus, we think the Fed should have gone to a pause-and assess mode at the March 22nd FOMC meeting. When we plug in what we believe the Fed’s numbers are-including its 3%+ GDP growth forecast-to our Taylor Rule equation, the neutral number is closer to 3.5%. This is more an art than a science and one \vould think that with the 2~110s curve now half its normal shape at around 50 basis points that the Fed would pay heed. But, they are cer- tainly not signaling any shift in its tightening-at-every meeting strategy, and we are concerned that our forecast is a floor and not a ceiling. Honevcr, i t is a little scary when tlie Fed chief tells the bond market hat i t is wrong-that it is somehow in a “conundrum“. And here we
i-J aye 10-year yields now lower than on tlie fateful day of February 16th \\hen hlr. Greenspan uttered that version of ‘irrational exuberance’. hlaybe tlie bond market is sending tlie Fed the same signal i t sent back in 2000-that i t does not share the Fed’s 4%+ growth forecast. Life continue to receive comments that the level of iates is too low for tlie Fed to stop, but tlie reality is that i t is not tlic level of rates that de- termines what happens to tlie economy going forward, but the change in rates that influences groLvth. Keep in mind that the niovc to a 1% funds rate in mid-2003 and the commensurate down-move to 3.1% i n the 10- \ear note yield had enough of an impact to invoke a nxijor change in cconoiiiic behavior at the time. So to think that wlien all tlie policy lags ;ire accounted for, a move in rates off those low levels will not have an impact on economic behavior basically defics Newton’s third law of motion that every action has an equal and opposite reaction. n‘hile i t reninins to be seen as to ho\v far the Fed will go in the near- tcrni. rest assured that these tightcning cycles rarely, if ever, last longer than 12-15 months. By then, a financial event usually forces the Fed to the sidelines (Ghl . Ford, hedge funds, housing, CDOs-take your pick) and a year after tlie first rate hike is usually the length of time it takes for the economy to cool off. Tlie length of time behveen the last hike and tlie first cut is ar.otuid six months. In fact, our models are pointing to t \ \ o rate cuts in the first half of 2006. This may sowid bizarre and i l l - timed-but i t actually \\ o d d have becn prescient to start discussing this in tlic opening months of 19S9, 1995 and 2000 evcn though at the time i t looked like tlie Fed \vould iicver stop raising riites. DliiYd ,”I R o . s o r b o ~ . Akizi-t ill Lj*/icli, Ne\r* York, N
lnllntion Prcssures Subsiding \Yorries tiitit increases i n oil and industrial commodity prices might
200.5. I n some quarters of tlie finnncial niarkcts, each fresh hint of building pi ice presstiles conjtueti up memories of thc nightmarish ac- celcfiition of i n tlation that eccompanictl earlier “shocks” in tlie energy
[\J. spill over into other markets intensilictl during the eorly months of
markets. But the world has changed since the oil shocks of the ‘70s. The world is far more efficient in the usage of energy. In September 1990, Fed Chairman Alan Greenspan testified before the Joint Eco- nomic Committee that a “.. . sustained increase of S 10 per barrel of oil would reduce the level of real GDP roughly I percent within a year.” Today, the “rule of thumb” suggests that a sustained S 10 rise in oil prices would trim real GDP by less that half that much. A substantial shift in the way monetary policy responds to energy price shocks is another, and arguably more important reason that the econ- omy has become less vulnerable to sudden suppi> -side price changes. In the 1970s, the Fed sought to cushion tlie impact of higher oil prices on real economic activity by adopting a more accommodative stance. Unfortunately, that policy only prolonged the reallocation of resources necessitated by the sudden increase in relative energy costs while ena- bling businesses to attempt to recoup higher resource costs with higher prices. The result of that ill-advised policy was the nightmare of “stag- flation”-declining production and accelerating inflation. Monetary policymakers appear to have learned from that experience and have successfully resisted pressures to mitigate the impact of sud- den increases in oil prices. Indeed, the Fed’s policy course in the wake of oil price surges in 1990, 2000, and again now scems, if anything, to have been directed at preventing any transmission of higher energy costs to the general level of prices. Hence, in 1990 the Fed temporarily suspended the easing of monetary policy that i t had begun more than a year before Iraq’s invasion of Kuivait. In the fall of 2000, the FOMC mentioned only a concern that rapidly rising energy prices “harbors tlie possibility of raising inflation expectations” and maintained the belief tli:it the “risks” to the outlook were tilted toward rising inflation. In both instances, the FOMC eventually responded to the slump that was trig- gercd in part by rising oil prices, but tlie first response has been consis- tently tilted tonard resisting tlie inflntionaiy consequences of higher energy costs. I n the most recent instance, nionetary policy seems to be successfully preventing tlie “pass-through” effects of higher fuel costs to tlic general level of prices. Though the FOMC in early May noted that ”pressures on inflation have picked up and pricing powcr is more evideiit“.~ the latest CPI report and more recent developments in tlic energy market seen1 to vindicate the judgment that the Fed’s conimitmcnt to pi icc stability would contain those pressures and prevent a persistent acccleration of inflation. Though the headline CPI jumped 0 5% in April. the “core“ CPI held steady. Of course. one month does not establish a trend, and we cannot dismiss the risk that subsequent inflation reports \ \ i l l generate nen evidence of price pressures. But these \vould no longer be linked to rising energy costs, since oil futures prices Iia\ e recently retreated from their April Fool’s Day record high to new tliree-month lows. Other observations, however, add substance to the prospect that retreat- ing ciiergy piices and a “correction“ will lend to more moderate infla- tion. Tlie latest siirvcys of niniiukicturing acti\ it! i n the New York and Pliiladelpliin Fed districts each held signs of diminishing price pres- sut’es. Indices of both prices paid wid pi,ices recei\ed in each of those districts \vcte at tlieii lowest readings i n over a >‘ciir, and reinforce simi- lar c\ridencc. from i,ecent ISM (Institute foi Supply hlanagenient) sur- veys of the iiianufacturing ant1 non-iii:inufncturiiig sectors. Meanwhile. the gioivtli tiends in a variety of nie;isuies of the money supply have deceicratetl riinrkcdly i n rcccnt months; pei Iiqis t i i t liiojt conipelling reason to expect both inflation and long-term int1;ition espectations will reni;tin "\veil contained.” Dtiifd Rerlw. A‘otiiiiru Ecotioiiiic I h w r c l i , A h 1’oi.X. A T

KPSC Case No. 200.5-00341 AG 1 St Set Data Request
I tem No. 22 1 Page 37 of 41
,
I. The table below contains results of our twice-annual LONG-RANGE CONSENSUS survey. There are also Top 10 and Bottom 10 averages for each variable. Shown are estimates for the years 2006 through 2010 and averages for the five-year periods 2007-201 1 and 2012-2016. Apply these projections cautiously. Few economic, demographic and political forces can be evaluated accurately over such time spans.
Interest Rates I I Federal Funds Rate --
2. Prime Rate
3. LIBOR, 3-Mo.
4. Commercial Paper, 1-Mo.
5. Treasury Bill Yield, 3-Mo.
6 Treasury Bill Yield, 6-Mo.
7. Treasury Bill Yield, I-Yr.
8. Treasury Note Yield, 2-Yr.
10. Treasury Note Yield, 5-Yr.
1 1 Treasury Note Yield, 10-Yr.
12 Treasury Note Yield, 20-Yr.
13 Corporate Ann Bond Yield
13. Corporate Ban Bond Yield
13 State 8 Local Bonds Yield
15. Home Mortgage Rate
A FRB - Major Currency Index
B. Rcul GDP
C. G D P Cliainctl Price Index
D. Consunlet Price Index
Five-Year Averages -- Average For The Year--- 2007 2008 2009 2010 2011 2007-2011 2012-2016 - - - - -
CONSENSUS 4.5 4.3 4.2 4.1 4.1 4.2 4.2 Top 10 Average 5.5 5.2 5.3 5.1 4.9 5 2 5.0 Bokom 10 Average 3.6 3.5 3.0 3.0 3.3 3.3 3.4
COKSENSUS 7.5 7.1 7.1 7.0 7.1 7.2 7.2 Top 10 Average 8.5 8. I 8.2 8.0 7.9 8.1 7.9 Bottom 10 Average 3 6 5.9 6.0 5.9 6.3 6.1 6.4
COKSENSUS 4.7 4.5 4.3 4.3 4.3 4.4 4.4 Too 10 Average 5.7 5.4 5.5 5.4 5.1 5.4 5.2 Boitom 10 Average 3.8 3.6 3.2 3.2 3.5 3.5 3.6 -
CONSENSUS 4.5 4.4 4.2 4.1 4.2 4.3 4.2 Top 10 Average 5.6 5.3 5.4 5.3 5 .0 5.3 5.0 Bottom 10 Average 3.6 3.5 3.0 3.0 3.3
Top 10 Average 5.5 5.3 5.3 5.2 4.9 5.2 5.1
3.4 CONSENSUS 4.4 4.3 4.1 4.1 4.1 4.2 4.2
3.3 _.I
Bottom 10 Average 3.5 3.4 2.9 2.9 3.3 3.2 3.3 CONSENSUS 4.6 4.4 4.3 4.2 4.2 4.3 4.3
Top 10 Average 5.7 5.4 5.4 5.3 5.1 5.4 5.2 Bottom 10 Average 3.7 3.5 3 .0 3 .0 3.4 3.3 3.5 __I
COKSENSUS 4.7 4.6 4.4 4.4 4.4 4.5 4.4 Top 10 Average 5.9 5.6 5.6 5.4 5.3 5.6 5.3 Bottom 10 Average _. 3.8 3.7 3.2 3.2 3.5 3.5 3.6
CONSENSUS 5.0 4.8 4.7 4.6 4.6 4.8 4.7 Too 10 Averane 6.2 6.0 4.4 5.6 5.5 5.5 5.6 Bo;tom 10 Average 4.0 3.9 3.6 3.7 3.9 3.8 3.9 f -Y
CONSENSUS 5.2 5.1 5.1 5.0 5.0 5.1 5.1 Top 10 Average 6.7 6.5 6.4 6.2 6.1 6.4 6.0 Bottom 10 Average 4 . 3 4. I 4.0 4.1 4.1 4.1 ~ 3 3 --
CONSENSUS 5.5 5.4 5.4 5.3 5.3 5.4 5.4 Top I0 Average 7.1 6.9 6.6 6.4 6.4 6.7 6.4
COSSENSUS 5.9 5.8 5.7 5.6 5.6 5.7 5.8 Top 10 Average 7.6 7.5 7.1 6.9 6.9 7.2 6.8
Bottom 10 Average 4.5 4.4 4.1 4.2 4.4 4.3 4.4
Bottom 10 Average 4.S 4.7 4.4 4.5 4.6 4.6- 4.6 COSSENSUS 6.6 6.5 6.5 6.4 6.5 6.5 6.5
Top 10 Average 8.2 s. I 7.9 7.7 7.7 7.9 7 7 Bottom 10 Average 5.4 5.4 5.2 5.3 5.3 5.3 I 5.3 I
COSSENSUS 7.3 7.3 7.3 7.2 7.2 7.2 7.3 Top I0 Average 8.7 8 "6 5.6 8.5 8 4 S 6 s 3
6.0 6.0 6.0 6.1 6.0 CONSENSUS 5.5 5.4 5.3 5.2 5.3 5.3 5.4
Bo;tom 10 Average -6.2 6.1 --- Top 10 Average 6.S 6.5 6.3 6 1 6.3 6 4 6.2
CONSENSUS 7.0 6.9 6.8 6.7 6.7 6.8 6.8 Bottom 10 Average 4.7 4.4 4.2 4.3 4.5 4.4 4.5
Top 10 Average s 5 s 4 8.1 7.9 7.8 S.2 s o Bottoni 10 Average 6. I 5.9 5.6 _I_- 5.7 5.6 5.s 5.5
CONSENSUS 83.2 84.1 81.6 84.9 65.4 51.4 s5.9 Top 10 Average 93.6 96.7 9S.0 99.0 99.6 91.4. 101.3 Bottom 10Avcrage - '74.3 73.4 72.0 71.0 71.2- 72.4 70.2
------"--- Ye:ir-Over-Yc;lr, % Change--------- Five-Year Averages - - - 2007 2008 2009 2010 loll 2007-2011 2012-2016
CONSENSUS 3.3 3.1 3.4 3.4 3.3 3.3 3.3 Top 10 Average 3.9 3 .6 3.7 4.0 3.8 3.S 3.5 Boitoiii 10 Aviragc 2.6 1.9 2.9 2.9 - 2.7 2.6 3 .O
CONSENSIJS 2.3 2.3 2.2 2.2 -.- 7 1 2.2 2.2 , Top 10 Average 2 9 3 1 2.8 2 9 2 7 2 9 2.7 ! Hnttom 10 Average 1.8 1.7 I .6 1.6 I .7 1.7 1.7
CONSENSUS 2.7 2.7 2.6 2.6 2.6 2.6 2.6 L
Top 10 Average 3.3 3.4 3.3 3.3 3.2 3.3 3 2 13ottoni 10 Average 2.3 2.1 1.9 2.0 2.1 2.1 2.0

_. ~ _._ --_ ___- --.- ".- . I_.. - " - _ _ -~ KPSC Case No. 2005-00341 AG 1 St Set Data Request
Item No. 22 1 Page 38 of 41
L W m G E i
____ . . I . .L- I - . .i I
2005 Jun - Jly Aug Sep Oct Nov Dec Monthly Indicator Jan Feb Mar Apr May
Retail and Food Service Sales (a) 0.0 0.7 0.4 1.4 . . Total Auto & Truck Sales @) Personal Income (a, current $) Personal Consumption (a, current $) Consumer Credit (e) Consurncr Sentiment (U. of Mich.) Household Employment (c) Non-farm Payroll Employment (c) Unemployment Rate (%) Average Hourly Earnings ('82%) Average Hourly Earnings (current %) Non- farm Workweek (hrs.) industrial Production (a) Capacity Utilization (%) IShl Index (formerly NAPM, g) Housing Starts (b) Housing Permits (b) New Home Sales (I-family, e) Construction Expcnditures (a) Consumer Price Index (s.a., d) CPI ex. Food and Energy (s.a., d) Prodiicer Price Index (n.s.a., d) Durable Goods Orders (a) L.ending Economic Indicators (g) Balance of Tradt 6r Services (0 Fcdcral Funds Rate (%) ,n 3-Mu Treaiuv Bill Rate (%)
16.7 -2.4 -0. I 6.5
9 5 s 85
124 5.2
8.24 15.90 33.7 4.1
79. I 56.4
2.180 2.126 1,194
0.4 3.0 2.3 4 2
-1.0 -0.3
-58.5 2.28 2.33
16.8 17.3 17.9 0.5 0.5 0.7 0.7 0.9 0.6 3.3 3.1
94.1 92.6 87.7 -91 357 598 300 146 274 5.4 5.2 5.2
8.22 8.19 15.91 15.95 16.0 33.7 33.1 33.9
3.4 3.9 3.1 79.4 79.4 79.2 55.3 55.2 53.3
2.228 1.836 2.038 2.093 2.021 2.129 1,256 1,313 1,316
0.5 0.5 3.0 3.1 3.5 2.4 2.3 2.2 4.7 4.9 4.8
-0.1 -1.6 1.9 -0.1 -0.6 -0.2
-60.6 -55.0 2.50 2.63 2.79 2.54 2.74 2.78
' W E Y e i i r Treasury Note Yield (%) 4.22 4.17 4.50 4.34
2004 hlonthly Indicator J a n Feb hlar Apr hlay J u n Jly Aug Sep Oct Kov Dec Retail and Food Service Salcs (a) Total Auto fi: Tnick Sales (b) Pcrson;il Income (a, current $) Personal Consumption (a, current 5 ) Ccinsuiner Credit (e ) Consumer Sentiment (U. of Mich.) I+ouschold Employncnt (c) Non-fami Payroll Employment (c) Unsmploymsnt Rate (YO) Average Hourly Earnings ('525) Avcragc Hourly Earnings (current $) Son-farm \York\veek (hrs.) lndustrinl Production (d) Cqxicity Litilizntion (76) IShl lides ( fornierly NAPM, g) Housing Strirts (h) Hoiising Pcniiits (b) Nc\v HOIW Sales ( I - h n i l y , c) Construction Espsiiditures (a) Conswncr Price Index (s.a., d) CPI L'S. F~itld and Encrgy (s.a., d) Prodiiccr Pricr. lndcx (n.s.a., d) Durnhlo G~iiids Orders (a) L,c;iding Economic Indicators (g) 13:il;lncc of Tmde S: Services (0 j'cJci;11 F t i i i h Rille (%) .-u 3-1\10, Trsasury Bill R;ite ("A) IO.J'c.;ir Trcmiry Note Yield ("A)
1.0 16.7 0.3 0.6
10 5 103.8
72 1 I7 5.7
8.27 15.48 33.8
2.1 76.9 62.8
I .927 1.963 1,155
-0.4 1.9 1.1 3.3
-2.6 0.4
-45.9 1.00 0.88 4.15
0.6 2.1 -0.7 16.9 17.1 17 0 0.4 0 4 0.6 0.6 0.4 0.1 1.5 2 8 3.5
94.4 95.8 94.2 -147 74 237
94 320 337 5.6 5.7 5.5
8.27 8.21 S"25 15.51 15.53 15.58 33.8 33.8 33.7
3.1 3.2 4.1 71.7 77.4 71.7 62.1 62.3 62.3
1.852 2.007 1,968 1.954 2.064 2.069 1,158 1,253 1,162
0.6 2.3 1.3 1 7 1.7 2.3 1.2 1.6 1 "8 2.1 1.5 3.7 3.9 5 9 "2.1 0.0 0.8 0 1
-45.9 -47.1 -48.5 1.01 1.00 1.00 0.93 0.94 0.93 4.08 3.83 4.35
1.5 -0.5 18.1 15.8 0.5 0.2 1.0 .,0.3 2.7 2,6
902 95.6 LO1 312 250 106 5.6 5.6
5.21 8.20 15.61 15.64 33.8 33.6 5.4 4.7
78~2 71.8 62.6 61.2
1.974 1.827 2.129 2.014 1,243 1,205
0.6 0.4 3.1 3 "3 1.7 1.9 4.9 4.0
-0.9 I .3 0.4 -0.3
-37.4 -55.4 1.00 1.03 0.94 1.27 4.72 4.73
0.8 11.6 0.2 1.2 7.9
96.7 45 1
83 5.5
8.23 15.70 33.8 4.8
78.3 61.6
1.956 2.1 14 1,104
0.8 3.0 I .8
. 3.8 1.9
-0.3 -50.7
I .26 1.33 4.50
-0. I 17.0 0.4 0.. 1 1.7
9 5 ~ 9 19
185 5.4
8.26 15.73 33.1
5.0 75 3 59.6
2.025 2.055 1,165
0.3 2.7 1.7 3.3
-0.5 -0.3
-54.0 1.43 1.48 4.28
I .8 17.9 0.2 0.6 9.0
94.2 -131 130 5.4
8.25 15.77 33.8 3.9
78.0 59.1
1.912 2.039 1,223
0.6 2.5 2.0 3.3 1 0
-0.2 -5 1.2 1.61 1.65 4.13
0.9 17.4 0.8 0.7 8.1
91.7 300 282 5.5
8.22 15.81 33.8 4.5
18.5 51.5
2.062 2.093 1,306
0.4 3.2 2.0 4.5
. I . O -0.3
-55.9 1.76 1.76 4.10
0.0 16.8 0.4 0.4 0.9
92 8 466 132 5.4
8.21 15.81 33.1
3.1 78.7 57.6
1.807 2.093 1,175
1 .o 3.5 2.2 5 "0 2 0 0.3
-59.4 1.93 2.07 4.19
I .3 I 5.9 4.0 0 9 4 2
97 1 -137
I ii S 4
5.23 I 5 s i
3.3 7 44
79 2 51.3
2.050 2 OSl 1,247
1 0 3.3 2.2 4 1 I .4 0.3
-55.7 2 16 2,111 4.2.;

KPSC Case No. 2005-00341 AG 1 St Set Data Request
Item No. 22 1 Page 39 of 41
I I
I16 I BLUE CHIP FINANCIAL FORECASTS I JIJNE 1.2005 I
I Calendar.0f2UpcomingEconomic Data Releases' ' . I Monday
30 Memorial Day All US. Markets Closed
6
13
20
(May) Leading Economic Indicators
27
4 I n d e p ende n ce Day All U.S. Markets Closed
Tuesday 1 'hicago PbfI (May) 'onsumer Confidence (Confer- oce Board, klay)
'onsumer Credit (Apr) Veekly Store Sales
-I__
14 'roducer Price Index (May) Mail Sales (May) Neekly Store Sales
11 Meekly Store Sales
28 Consumer Confidence (Confer ence Board, (June) Weekly Store Sales
5 Factory Orders (M:iy)
Wednesday rune 1 SM Manufactuiing (May) - Jnit Vehicle Sales (May) Zonstruction Spending (Apr) Meekly Store Sales vIortgage Applications
s Wholesale Trade (Apr) Mortgage Applications
15 Consumer Price Index (May) Industrial Production (May) Business Inventories (Apr) Empire State Index (Jun) NAHB Housing Index (Jun) Foreign Sec. Purchases (Apr) Beige Book (Jun 29-30 mcet- ing) Mortgage Applications
22
29 FOMC Meeting CDP (final, QI) Corporate Profits (Final, QI ) Mortgage Applications
G ISM Non-Manufacturing (Jun Wcekly Store Sales Challenger survey (Jtin) Mortgage Applications
Thursday
roductivi6 (Revised, Q l ) actory Orders (Apr) ' h a h g e r Survey (May) deekly Jobless Claims actors Affecting Monetary Reserves
I__
1
Veekly Jobless Claims 'actors Affecting Monetary Reserves
16 lousing Starts (May) 'hiladelphia Fed Index (Jun) Neekly Jobless Claims :actors Affecting Monetary Reserves
23 3xisting Homc Sales (Ma)) Neekly Jobless Claims -actors Affecting Monetay
Reserves
30 Personal Income &PCE ( X l a l Chicago Phll (Jtin) Weckly Jobless Claims Factors Affecting Monetan
Reserves
7 Weekly Jobless Claims Factors Affecting Monc tq
Reserves
Friday I inployment Report (May) SM Non-manufacturing (May)
10 i S Trade (Apr) rrade Prices (May) rreasury Budget (May) 3ank Credit (May)
17 h r r e n t Account (QI) lonsumer Sentiment (Univ. of ilichigan, Preliminary, Jun)
21 Durable Goods (May) iiew Home Salts (May)
July 1 lS\I Mnnufacturinf (Jun) Unit Vehicle Sales (Jun) Constniction Spendinp (May) Constinier Sentiment (Univ. of hlichigan, Final. Jun)
- 8 Employment Report (Jim) \i"holesale Trade (May) Consunier Credit (blny)

KPSC Case No. 2005-0034 1 AG 1 St Set Data Request
Item No. 22 1 Page 40 of 4 1
~
BLUE CHIP FORECASTERS ("JONTRIBUTORS TO DOMESTIC SURVEY
Action Economics, LLC, Boulder, CO Dr. Michael Englund Banc of America Securities, LLC. New York, NY Dr. Mickey Levy and Dr. Peter E. Kretzmer Barclays Capital, New York, NY Dean Maki Bear Stearns & Co., New York, NY Dr. John Ryding and Conrad DeQuadros BMO Nesbitt Bums, Toronto, Canada Dr. Sherry Cooper and Douglas Porter Briefing.com, Boston, MA Timothy E. Rogers Camilli Economics, New York Kathleen M. Camilli Chmura Economics & Analytics, Richmond, VA Dr. Christine Chmura and Dr. Xiaobing Shuai Classicalprinciples.com, Chicago, IL Dr. Robert J. Genetski Citigroup Asset Management, New York, NY Brian Keyser Clearview Economics, LLC, Cleveland, OH Dr. Kenneth T. Mayland Conierica Bank, Detroit, MI Dana B. Johnson
Q obert S. Powers ycledata Corp., San Diego, CA
DePrince LF: Associates, Murfreesburo, TN Dr. Albert E. DePrince Jr. Deutsche Bank Securities, Inc., New York, NY Dr. Peter Hooper and Dr. Joseph Lavorgna Fannie Mae, Washington, DC Dr. David W. Berson and Dr. Orawin T. Velz Georgia State University, Atlanta, G A Dr. Rajeev Dhawan and Emin Hajiyev Goldman Sachs LF: Co., New York, NY Dr. William Dudley Greenwich Capital Management, Greenwich, CT Stephen Stanley and Michelle Girard Independent Economic Advisory, Providence, RI Gary L. Ciminero, CFA ING Investment Management, Inc., Hartford, CT James A. Griffin Jr. J.P. Morgan Chase, New York, NY Bruce Kasnian and Robert Mellman JPMorgan Fleming Asset Management, Columbus, OH Dr. Anthony Chan J.W. Coons Advisors, LLC, Columbus, OH James W. Coons Kellner Economic Advisers, Port Washington, NY Dr. Irwin L. Kellner
.:La Snlle/ABN AMRO Treasury Research, Chicago, IL Carl R. Tannenbaum L,ooniis, Say1cS & Company, L.P., Bloomfield, MI Brian Ilorrigan and navid Sowerby
Merrill Lynch Economics, New York, NY David Rosenberg, Gerald E. Cohen and Thomas Porcelli Jr. Mesirow Financial, Chicago, IL Diane Swonk Moody's Investors Service, New York, NY John Lonski and John Puchalla Naroff Economic Advisors, Philadelphia, PA Dr. Joel L. Naroff National Association of Realtors, Washington, DC Dr. David A. Lereah and Dr. S . Lawrence Yun National City Corporation, Cleveland, OH Richard DeKaser Nomura Securities International, Inc., New York, NY Dr. David H. Resler and Dr. Parul Jain Perm Associates, Hartford, CT Dr. Nicholas S. Perna PNC Financial Services Group, Pittsburgh, PA Dr. Stuart G. Hoffman Prudential Equity Group LLC, New York, NY Richard D. Rippe Scotiabank, Toronto, Canada Aron Gampel and Dr. Warren Jestin Standard & Poor's Corp., New York, NY Dr. David M. Blitzer and David Wyss SunTrust Banks, Inc., Atlanta, GA Gregory L. Miller and Christopher P. George Swiss Re, New York, NY Kurt Karl The Northern Trust Company, Chicago, IL Paul L. Kasriel and Asha G. Bangalore Thredgold Economic Associates, Salt Lake City, UT Jeff K. Thredgold Trusco Capital Management, Richmond, VA Alan Gayle UBS Warburg, Stamford, CT James O'Sullivan and Samuel Coffin US. Trust Co., New York, NY Dr. Robert T. McGee and Nora C. Mirshafii Wachovia, Charlotte, NC Dr. John Silvia and Mark Vitner Wayne Hummer & Co., Chicago, IL \Villiani B. Hummer Wells Capital Management, San Francisco, CA Gary Schlossberg Woodworth Holdings, Ltd , Summit, NJ Jay N. Woodworth
CONTRIBUTORS T O IKTERNATIONAL SURVEY
Deutschc Bank Securities Inc., New York, NY ING Financial Markets, London, England Mizuho Research Iiistihite, Tokyo, Japan Scotinbaiik, Toronto, Canada IVestLB AG, Dusseldorf, Germany

KPSC Case No. 2005-00341 AG 1 St Set Data Request
Item No. 221 Page 41 of41
,
990001 8050 ww.tv.aspenpublishers.com

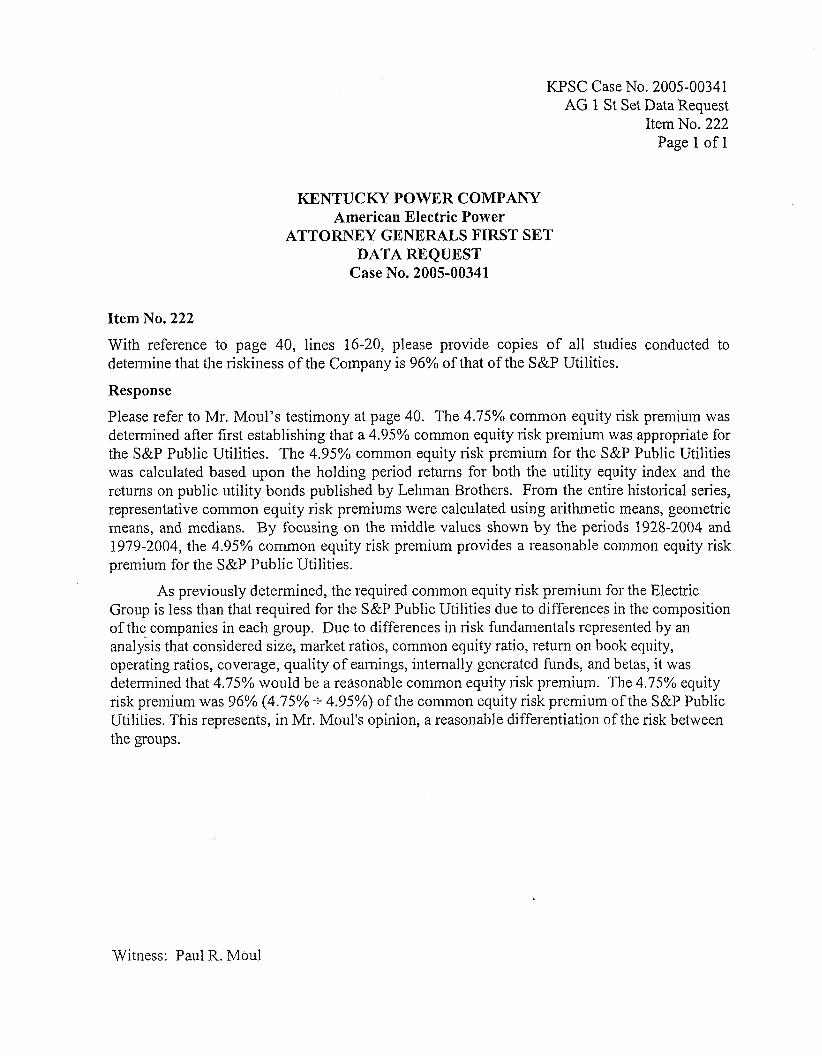
KPSC Case No. 2005-00341 AG 1 St Set Data Request
Item No. 222 Page 1 of 1
KENTUCKY POWER COMPANY American Electric Power
ATTORNEY GENERALS FIRST SET DATA REQUEST
Case No. 2005-00341
Item No. 222
With reference to page 40, lines 16-20, please provide copies of all studies conducted to determine that the riskiness of the Company is 96% of that of the S&P Utilities.
Response
Please refer to Mr. Moul's testimony at page 40. The 4.75% common equity risk premium was determined after first establishing that a 4.95% common equity risk premium was appropriate for the S&P Public Utilities. The 4.95% common equity risk premium for the S&P Public Utilities was calculated based upon the holding period returns for both the utility equity index and the returns on public utility bonds published by Lehman Brothers. From the entire historical series, representative common equity risk premiums were calculated using arithmetic means, geometric means, and medians. By focusing on the middle values shown by the periods 1928-2004 and 1979-2004, the 4.95% common equity risk premium provides a reasonable common equity risk premium for the S&P Public Utilities.
Group is less than that required for the S&P Public Utilities due to differences in the composition of the companies in each group. Due to differences in risk fundamentals represented by an analysis that considered size, market ratios, common equity ratio, return on book equity, operating ratios, coverage, quality of earnings, internally generated funds, and betas, it was determined that 4.75% would be a reasonable common equity risk premium. The 4.75% equity risk premium was 96% (4.75% -+ 4.95%) of the common equity risk premium of the S&P Public Utilities. This represents, in Mr. Moul's opinion, a reasonable differentiation of the risk between the groups.
As previously determined, the required common equity risk premiuni for the Electric
Witness: Paul R. Moul


KPSC Case No. 2005-00341 AG 1 St Set Data Request
Item No. 223 Page 1 of20
ICENTIJCKY POWER COMPANY American Electric Power
ATTORNEY GENERALS FIRST SET DATA REQUEST
Case No. 2005-00341
Item No. 223 With reference to page 48, lines 17-23, please provide a copy of the S&P document regarding financial guidelines for assessing credit quality.
Response
The requested docunient is attached.
Witness: Paul R. Moul
KPSC Case No. 2005-00341 AG 1 St Set Data Request
Item No. 223 Page 2 of 20
lication date: 02-Jun-2004 .eprinted from RatingsDirect
New Business Profile Scores Assigned for US. Utility and Power Companies; Financial Guidelines Revised Credit Analysts: Ronald M Barone, New York (1) 212-438-7662; Richard W Cortright, Jr. , New York (1) 212-438-7665; Suzanne G Smith, New York ( I ) 212-438-2106; John W Whitlock, New York (1) 212-438-7678; Andrew Watt, New York (1) 212-438-7868; Arthur F Simonson, New York ( I ) 212-438-2094
Standard & Poor's Ratings Services has assigned new business profile scores to U.S. utility and power companies to better reflect the relative business risk among companies in the sector. Standard & Poor's also has revised its published risk- adjusted financial guidelines. The new business scores and financial guidelines do not represent a change to Standard & Poor's ratings criteria or methodology, and no ratings changes are anticipated from the new business profile scores or revised financial guidelines.
New B u s i n e s s Profile Scores and Revised Financial Guidelines Standard & Poor's has always monitored changes in the industry and altered its business risk assessments accordingly. This is the first time since the 10-point business profile scale for U.S. investor-owned utilities was implemented that a comprehensive assessment of the benefits and the application of the methodology has been made. The principal purpose was to determine if the methodology continues to provide meaningful differentiation of business risk. The review indicated that while business profile scoring continues to provide analytical benefits, the complete range of the 10-point scale was not being utilized to the fullest extent.
Standard & Poor's has also revised the key financial guidelines that it uses as an integral part of evaluating the credit quality of U.S. utility and power companies. These guidelines were last updated in June 1999. The financial guidelines for three principal ratios (funds from operations (FFO) interest coverage, FFO to total debt, and total debt to total capital) have been broadened so as to be more flexible. Pretax interest coverage as a key credit ratio was eliminated.
Finally, Standard R Poor's has segmented the utility and power industry into sub- sectors based on the dominant corporate strategy that a company is pursuing. Standard & Poor's has published a new U.S. utility and power company ranking list that reflects these sub-sectors.
There are numerous benefits to the reassessment. Fuller utilization of the entire 10- point scale provides a superior relative ranking of qualitative business risk. A simultaneous revision of the financial guidelines supports the goal of not causing rating changes from the recalibration of the business profiles. Classification of companies by sub-sectors will ensure greater comparability and consistency in ratings. The use of industry segmentation will also allow more in-depth statistical analysis of ratings distributions and rating changes.
(1 of 19)

New Business Profile Scores Assigned for 1J.S. Utility and Power Companies; Financial Guidelines Revised
The reassessment does not represent a change to Standard & Poor's criteria or methodology for determining ratings for utility and power companies. Each business profile score should be considered as the assignment of a new score; these scores do not represent improvement or deterioration in our assessment of an individual company's business risk relative to the previously assigned score. The financial guidelines continue to be risk-adjusted based on historical utility and industrial medians. Segmentation into industry sub-sectors does not imply that specific company characteristics will not weigh heavily into the assignment of a company's business profile score.
-- Back to TOR
Results Previously, 83% of U.S. utility and power business profile scores fell between '3' and '6', which clearly does not reflect the risk differentiation that exists in the utility and power industry today. Since the 10-point scale was introduced, the industry has transformed into a much less homogenous industry, where the divergence of business risk--particularly regarding management, strategy, and degree of competitive market exposure--has created a much wider spectriim of risk profiles. Yet over the same period, business profile scores actually converged more tightly around a median score of '4'. The new business profile scores, as of the date of this publication, are shown in Chart 1. The overall median business profile score is now I5l.
Chart I
Distribution of Business Profile Scores
% of Companies
1 2 3 4 5 6 7 & 9 10
N e w Business Profile Score
KPSC Case No. 2005-0034 1 AG 1 St Set Data Request
Item No. 223 Page 3 of 20
(2 af 19)

New Business Profile Scores Assigned for U.S. Utility and Power Companies; Financial Guidelines Revised
Table 1 contains the revised financial guidelines. It is important to emphasize that these metrics are only guidelines associated with expectations for various rating levels. Although credit ratio analysis is an important part of the ratings process, these three statistics are by no means the only critical financial measures that Standard & Poor's uses in its analytical process. We also analyze a wide array of financial ratios that do not have published guidelines for each rating category.
(3 of 19) Item No. 223 Page 4 of 20
Again, ratings analysis is not driven solely by these financial ratios, nor has it ever been. In fact, the new financial guidelines that Standard & Poor's is incorporating for the specified rating categories reinforce the analytical framework whereby other factors can outweigh the achievement of otherwise acceptable financial ratios. These factors include:
Effectiveness of liability and liquidity management; Analysis of internal funding sources; Return on invested capital; The record of execution of stated business strategies; Accuracy of projected performance versus actual results, as well as the trend; Assessment of management's financial policies and attitude toward credit; and Corporate governance practices.
Charts 2 through 6 show business profile scores broken out by industry sub-sector. The five industry sub-sectors are:
Transmission and distribution--Water, gas, and electric; Transmission only--Electric, gas, and other; Integrated electric, gas, and combination utilities; Diversified energy and diversified nonenergy; and
0 Energy merchantlpower developer/trading and marketing companies.
KPSC Case No. 2005-003.1 I AG 1 St Set Data Request
Item Na. 223 Page S af 20
(4 of 19)

New Business Profile Scores Assigned for U.S. Utility and Power Companies; Financial Guidelines Revised
Chart 2
Transmission and Distribution-Water, Gas, and Eleciric
96 of Companies
35 1
30
25
20
15
10
5
0 I 2 3 4 5 6 7
Business Profile Score 8 9 10
KPSC Case No. 2005-00341 AG 1 St Set Data Request
Item No. 223 Page G of 20
(5 of 19)

New Business Profile Scores Assigned for U.S. Utility and Power Companies; Financial Guidelines Revised
Chart 3
Transmission Only--E[ec€ric, Gas, and Other
96 of Companies
45 I 40
35
30
25
20
15
10
5
0 I 2 3 4 5 6 7
Business Profile Score 9 I 0
KPSC Case No. 2005-00341 AG 1 St Set Data Request
Itern No. 223 Page I of 20
(6 of 19)]
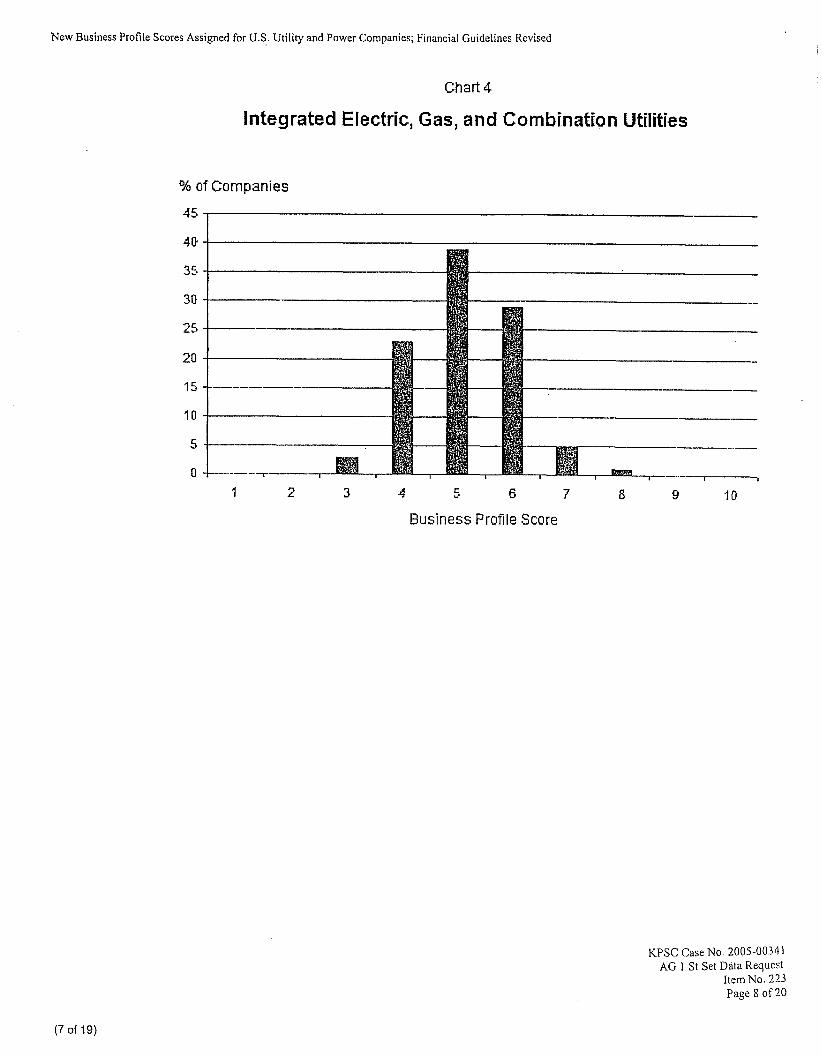
New Business Profile Scores Assigned for U S . Utility and Power Companies; Financial Guidelines Revised
Chart 4
Integrated Electric, Gas, and Combination Utilities
%I of Companies 45
40
35
30.
25 -.
20
15
l o
- -.
-----
5 -
I 2 3 4 5 6 7
Business Profile Score 8 9 10
KPSC Case No. 2005-00.341 AG 1 St Set Data Request
Item No. 223 Page 8 of 20
(7 of 19)

New Business Profile Scores Assigned for US. Utility and Power Companies; Financial Guidelines Revised
Chart 5
Diversified Energy and Diversified Nan-Energy
96 of Companies
35 30 I 25
20
15
10
5
0 I 2 3 4 5 s 7 6 9 I0
Business Profile Score
KPSC Case No. 2005-00341 AG 1 St Set Data Request
Item No. 22.3 Page 9 of20
(8 of 19)
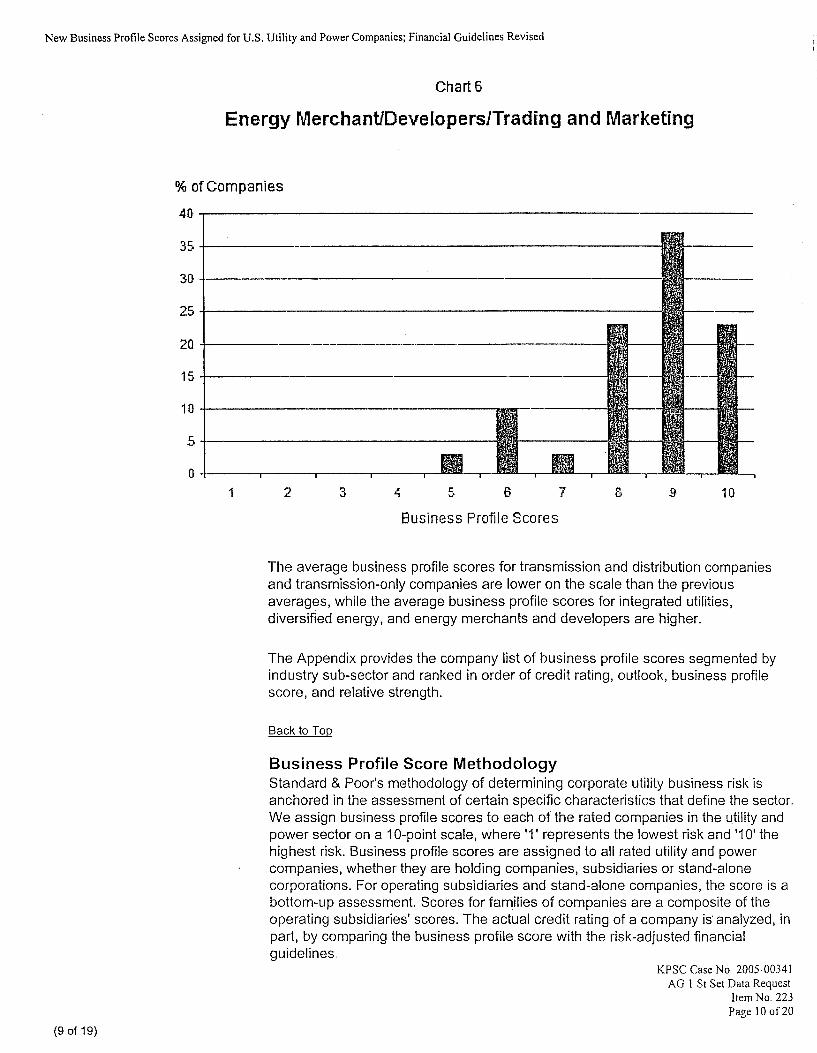
New Business Profile Scores Assigned for US. lJtility and Power Companies; Financial Guidelines Revised
Chart 6
Energy MerchanUDeveloperslTrading and Marketing
% of Companies
40
35
30
25
za
15
10
5
D I 2 3 4 5 6 7 9 10
Business Profile Scores
The average business profile scores for transmission and distribution companies and transmission-only companies are lower on the scale than the previous averages, while the average business profile scores for integrated utilities, diversified energy, and energy merchants and developers are higher.
The Appendix provides the company list of business profile scores segmented by industry sub-sector and ranked in order of credit rating, outlook, business profile score, and relative strength.
Back to Top
Business Profile Score Methodology Standard & Poor's methodology of determining corporate utility business risk is anchored in the assessment of certain specific characteristics that define the sector. We assign business profile scores to each of the rated companies in the utility and power sector on a 1 O-point scale, where '1' represents the lowest risk and '1 0' the highest risk. Business profile scores are assigned to all rated utility and power companies, whether they are holding companies, subsidiaries or stand-alone corporations. For operating subsidiaries and stand-alone companies, the score is a bottom-up assessment. Scores for families of companies are a composite of the operating subsidiaries' scores. The actual credit rating of a company is' analyzed, in part, by comparing the business profile score with the risk-adjusted financial guidelines.
'
KPSC Case No. 2005-00341 AG 1 St Set Data Request
Item No. 223 Page 10 of 20
(9 of 19)

New Business Profile Scores Assigned for U S . Utility and Power Companies; Financial Guidelines Revised I I
For most companies, business profile scores are assessed using five categories; specifically, regulation, markets, operations, competitiveness, and management. The emphasis placed on each category may be influenced by the dominant strategy of the company or other factors. For example, for a regulated transmission and distribution company, regulation may account for 30% to 40% of the business profile score because regulation can be the single-most important credit driver for this type of company. Conversely, competition, which may not exist for a transmission and distribution company, would provide a much lower proportion (e.g., 5% to 15%) of the business profile score.
For certain types of companies, such as power generators, power developers, oil and gas exploration and production companies, or nonenergy-related holdings, where these five components may not be appropriate, Standard & Poor's will use other, more appropriate methodologies. Some of these companies are assigned business profile scores that are useful only for relative ranking purposes.
A s noted above, the business profile score for a parent or holding company is a camposite of the business profile scores of its individual subsidiary companies. Again, Standard & Poor's does not apply rigid guidelines for determining the proportion or weighting that each subsidiary represents in the overall business profile score. Instead, it is determined based on a number of factors. Standard & Poor's will analyze each subsidiary's contribution to FFO, forecast capital expenditures, liquidity requirements, and other parameters, including the extent to which one subsidiary has higher growth. The weighting is determined case-by-case.
Back to Toe
Appendix: U.S. Utility and Power Company Ranking List
- ._.- .A*. I "
ower Company Rank . , ." ../ --. _.. - . ._ - -... </(-I - - r
Company ; Corporate C
nsrnission and Dis _ _ Baton Rouge Water Works Co. (The)
Nicor Gas Co. AAIStablelA-I +
Nicor Inc. AAIStableIA-I+
Washington Gas Light Co AA-IStableIA- 1 +
AAIStablel- , -
.._ . .-I."-.... _ " _ . .
. - - . ..,."..*~--"-. -.." ._
--.^ - "~ - .,-...- " - WGL Holdings lnc AA-IStablelA-I + 3 , ". .".-_yI . . -- New Jersey Natural Gas Co
, . x
-. ._,_ , ,'. .*" ... _ycI,-
- . I . .XI, I .... &.. . , I .., . .., "*. =,- . ater Service C . ...* *. ..*...-""
I Questar Gas Co.
, I I +.d %*-.d *---. .~ ~ x " I . -1 ..I ".",.. "~ . ,- .--.. ~ _. - . . . . - ,. cI.,-*.-u-
1 ; Boston Edison Co. 1 A/Stable/A-I I! -__-I_-- - -__. -- - - . ---- .__
(10 of 19)
KPSC Case No. 2005-0034 1 AG 1 St Set Data Request
item No. 22.3 ., " I * - -

New Business Profile Scores Assigned for 1J.S. IJtility and Power Companies; Financial Guidelines Revised
(11 of 19)
7
1 '1 . 11 1 _I -.. , JNStablelA-I .--11.--.~.""?..1"-1. 1
11 . I l i
___T_ 5--- -- -- ----
I 1 Commonwealth Electric Co. i-,.'""".-"?.-." ..<--- ?..-A- ..... ---".._l__.LC ....... ....---. ' Cambridge Electric Light Co. I--" r----. I_-
1 NStableI--
i NStable/-- 1 -7
I;,
1
...,-. ...-.,-l__..l__l "..I___
--* 1
_y-- I Massachusetts Electric Co. LAfSta blelA-I
Narragansett Electric Co. { NStableIA-I -*-- -.-....-
? I 1 -.-I 21 21 1
Northwest Natural Gas Co. 1 NStablelA-I
; AIStablel-- qLconnecticutwaier Service Inc.
1 Connecticut Water Co. (The) j AfStablel -- i Aquarion Go. I: NStableI--
! Atstable/--
-r- 7 i ---~ -~--"."&......&-.--...-.. --.,,-.-.,.-.
.... 2 '
L-,,*-*.-.".-
.. .,.." ._..--. '.-..... ..-.lr-r.-.~-~-"".~-------~~
3 1 i
,..%.-".--.,.-- ..,-. -_ -.-. u. ,.y,*---I ..-.- ......... ,.-.. .. . M * Y " .... l.__l........_..j.. *,,"..-~-,,"'.~ ,_, ~ . . _ - er Co. of Connecticut .... ._.,....CII.YU..IIY ........... >:.,.- --.,- ............... ...-.........- r.-..l*.-%
NSTAR Gas Co. 1 AfStablel-- I
i 1
._.<* .................... -I...-W"ILI .Y.<-.-i- ..................... ........I._ ..C ........... Y..... ... .; NStablelA-I
......................... ......--.- ..- . ..-.- . - . . . . -*".-.a.. .. ......- --...- .~.,"--"--~.~,~--.",~~,- iedmont Natural Gas Co. Inc.
.................. -C..,..I-_IR.. -.I-
i National Grid USA k ' * ~ : .-,,,. ~
! Consolidated Edison Co. of New York : Inc. ; AfStablelA-l
-..,./..%. .Y_" .--... -. . . -.,. -.,.,-".,"-*--.""-#: Orange and Rockland Utilities Inc. i: AIStablelA-I i 2 [
Rockland Electric Co. NStableI-- I I 2 j
Consolidated Edison Inc. i 2 i
Laclede Gas Go. ; L 38
Laclede Group Inc. i ! 3 ;
Atlantic City Sewerage Co. : NStablel-- 1 Niagara Mohawk Power Corp. : AIStableI-- i 3j
. ................ &*.I_.. . -^ .+.-. -.11-- L..- L . . : ...... " ..... -I -.I- I-.. .IY."..I-.*.-.. . -" . ~ - - ~ _ " " ,.,.- -- .-.. ..... - . ~~-.* . ,~."~ w,~.d.. ..._, 9"L ,,.,.,-..,.. _jn* -,..._,. .i
. _ .................. ,_".,. . ,-...--* .-.~"--. ~. .. ..... l..-...".IY"..I ,I._.*. .. .-......_ . ..(.<... ..f.,,,,,.-,." -..-. I-.-_. .-_--..... .... .._.. --,,'" . ,1".,". * ,.. . .....,. .. on.?in"-. .,,~-,~,...,,,,,,.1
. . . . . . . . . . . . . . . . . . ~ ._"._ -...-.--.-- . . . . . . . . . . . . . . -. -1. ..... ........".. .. ._ .......... -.*,"..: -.,-_ ,.--..-- "--4
.._- ..-. '_- .,._ -_-_ .. ". .
", ........... ......-.- ..-.. - ? - ... ..-",..-<**.'..-;,%..-.." .---- "IIU."-.-(
. ,_.- .... ..._.._..-.-..-.-. ,-. . . . -.,.-.,.,,*. *...1I".YI .-.*--!,<.-.*" ~ ~ , " . . , , d
' NStableI-- ; Central Hudson Gas & Electric Co. . . . . . . . . . . . . . . "_r .-.-.-,~ .... . . . . . . . ...................
American Water Capital Carp.
Boston Gas Co. . . . . . . . . . . . . . . .,..-* ,,.,--~.
. . . . . - . . . . . . , - , / - . ,..--_..,
. Middlesex Water Co.
".-. n-..-..,.*- .......... i Atlanta Gas Light Co. I A-/Stable/--
... .....--...-. ,-,Y..*-.* ..,*..~I,.U.U ,,..
.~ . . . . . . . ....... -..., --..-..--.. ....-...- . . . . . . . .
... .-. .- ._.. - ..- .Y....," ,_,_._-.----- _ 1 ~ ..I.1 ............. I .. .X--.-.".. ^~--"..l._I-~ -.-.-..-.... .J 1__.. .1_ . .,--. -.-*.2
,:.. ........ .. . . . . . . . ._-J> .... t _-.____l_l__ J; 1 United Water New Jersey j A-/Negative/-- E 4:
KPSC Case No. 2005-00341 AG 1 St Set Data Request
Item No. 223 Page 12 of 20
I
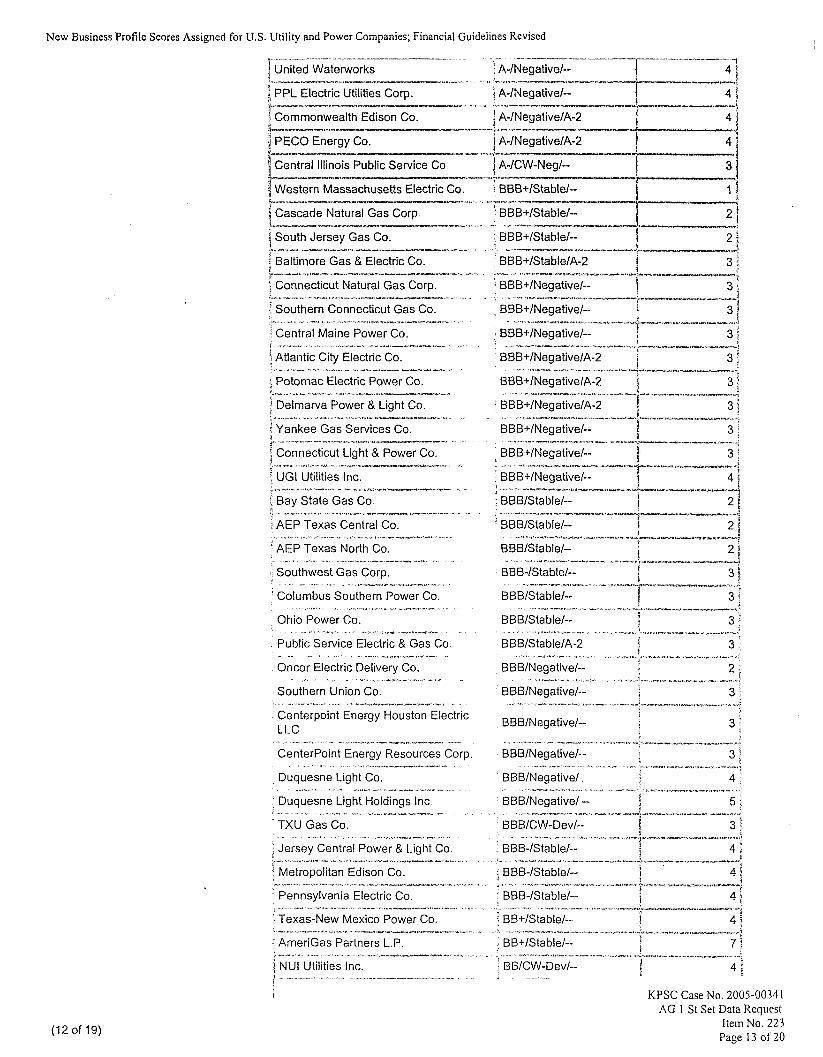
New Business Profile Scores Assigned for U S . Utility and Power Companies; Financial Guidelines Revised - - -----__I_--
...... ..... -.-..--..."~--_/-,- _..__.- --...."".-v-..-p _- i 43 \
T I
-1
United Waterworks : A-/Negative/--
, A-/Negative/--
4 1
, PPL Electric Utilities Corp.
. Commonwealth Edisan Co.
' PECO Energy Co. A-INegativelA-2
~--"""-"-"-.-.-".".- --.. -..- - .---.- --*---------.- 5 ..... 1?...1___. 1 2
k---------- - ..II" Central Illinois Public Service Co 1 A-ICW-NegL
Western Massachusetts Electric Co. 1 BBB+/Stable/-
Cascade Natural Gas Corp BBB+/Stable/-
- -..*-I, _ *--..-- Y-III.lsU.II--F ....... ^UI_IP.
. . !-..".-.- --1- r
:i South Jersey Gas Co. ...-4. . --1___.- . I Baltimore Gas & Electric Co.
Connecticut Natural Gas Corp.
outhern Connecticut Gas Co
-."... ?,.,.,w--,.*-....,-*-*--. . ...-.. .....ll.. .._ .. .
. . . . . . -.,, -~~""...~,-L-.,.., .. Central Maine Power Co.
1 - . - -," ..,- *-.-- . ._ ', Atlantic City Electric Co.
: Yankee Gas Services Co.
' Connecticut Light & Power Co. . - --, -"- -. ... -.- ----.,,-..--"-, i ---, ,, ..-- -- %. ~ -*----.." Y .--.
GI Utilities Inc.
ay State Gas Co
EP Texas Central Co.
............... ,-*----.....*- .
... ,-.. ...... "..*. yr
..> ...... -I.- r- , AEP Texas North Co.
Southwest Gas Corp.
ColumbUS Southern Power CO
Ohio Power Co.
Public Service Electric & Gas Co
Oncor Electric Delivery Co.
Southern Union Co.
Centerpoint Energy Houston Electric
y Resources Corp.
-. .-_ -.-"- .. .. .-.--.. *,"C ....
r.-_-......,l
I -. - . - .- ", .-*,.- ........ I."...Y<I.
C.",.._ -* . . . -- . .- I -,>..*.."------ ~,
. - , - -- I*. -..Y .m---, --
. .-.. - Duquesne Light CO.
Duquesne Light Holdings
TXU Gas Co. " -. I >- * *-". .-
. < ~ . ".*.,,. . .". -, ""...". -.. .- .... ...-,". .* .. I .
Pennsylvania Electric Co
Texas-New Mexico Power Co. . . . . . . . . . ..__'"l-l"----.....-l .
c 21
31 3 ;
..w! t 1 BBB+/Stable/--
: B B B+/S tablelA-2 - ---.I_Ill-^l..--.-""-.yI"-*.--.--u.-
i i
: BBB+/Negative/-- ;
.,WY.D"IIYIUU.^~.I-lml
........ ..I-..-).-....-* ..qI-.*-r^l---d.m-.-- ...... BBB+/Negative/-- ! 3 i . ....... *.,"..-*">-a.-.-.~ "....I.II--U-.i--2&.. .I-.wI-.yuI.I,'
j ............ .ll-.._ll.-. ............. ?.,..,-... B BB +/Neg ativelA- 2 1 BBB+/NegativelA-2 i ........................... .,.... ..... _,-.-,- ..,-.- ___E.I..
. . . . ,- .I-,.-,_.--l--.-^YI__I ............ BBB+/Negative/A-2 I i 3! . . ..,. L.".-.-......>C.d ..... -.,.&---"-!..I.. . ly_ --.. .i BBB+/Negativel-- i 1 3 ;
4 1
; 1 ........................ BBBIStablel-- i
--.-..*.I..^-^".-.--)---I --.-....."I-- --..-.I--._- ....... 3 j
28
.................... ,.b-*%..*.... ---"...*-.......-.* I BBBHNegativel--
: EBB+INegative/-- j 1. i c . ~.-"t;l-.-rcr~.l"---r-- ul.~uu,;.-~--"",~-~-~
I
1
' BBBIStablel-- 1 I
BBBIStablel-- E
,........ ............ '......-..-.-=.... ... BBBISta blel--
BBB-/Stable/-- .............. ,-,..- ......... ,.-.- li. *,~.-"--~-,.~-~-"-~~-~~
i E ................................ ....,-,........--........-. 4
........... .,~.-~-~...-.~,-_..---.-,.-I,,
BBBIStablel--
BBBIStablelA-2 . , ........................
, .... *I,.. .,-, . ,1.... . . . . . . . . 2 :
.. I . . . ......... !I.." ............................ :....!
BBBINegativek-
.......................
..... ..
_.*. .. -L,"...~.,--...C...II._. ........ ".."...~."....n_._...__.._...I _=_.. . /Stable/--
......... .....,. ---."..-" .," . - ......l..l.ll._ . BBICW-Devl--
.I ....... .- ... -. . . . . __ .... - ____I__. ... : . . . -_ .
(12 of 19)
KPSC Case No. 2005-0034 1 AG 1 St Set Data Request
Item No. 223 Page 13 of 20

New Business Profile Scores Assigned for I.J.S. Utility and Power Companies; Financial Guidelines Revised
(13 of 19)
T------------- " _I I___ - _ I _ - ~ - _ _ _ I x _ _ - - -___. I -- - 8 i 8
................. _"."..-"..._II. ..-- ... __.--I. - *I..* 3 Suburban Propane Partners L.P.
{ Star Gas Partners L.P.
f BB-/Stable/--
1 ; BB-/Stable/--
5
8
3
3
i 1
-1_.
7 SEMCO Energy Inc. 1 BB-/Negative/--
4 Ferrellgas Partners L.P. BB-/Negative/--
F G i ' E d i s o n C o . BIStablel-- I '! BIStable/-- ; T e Z i n n Power co.
L.--?-..."*-- I e lllinova Corp.
*,.",, '---- l.--.l....-*-l-.-..-....-.-i-- 1 3-----------
........ *-...._
v..-..-"*, .---Uu-
"-.."..A"- !**---- B/Negative/- i 7
Mid-West Independent Transmission . NStablel-- System Operator Inc. 1
^ L . . _ I _ . ~ .."-.-..---..----,..I.--- " > .-I."~."_--..-.-.l.-. .YY/-..,-.l._ll" -"--. 1 1 ' American Transmission Co. NStable/A-I
Ne nd Power Co.
Colonial Pipeline Co. ........... ...l_.__.,..n.-._l---.- .........
...... ..;..
.................. ........... - ......ll..l .. .... Transmission Co. ..... --,*Lyuy*Im,*I . . . . . . . . . . .
. . . . . . . . . . . . . . . .
.. ........ ... .,.,.... ",...>..*% ".l<.l_.l-*...
: Texas Gas Transmission LLC
nsmission System L.P. Ij BBB+/Stable/-- - " " ~ -" ._ -*.,"..%- -.
orida Gas Transmission Co.
International Transmission Co.
ITC Holding Corp.
Texas Eastern Transmission L.P.
PanEnergy Corp.
. . --.- ......... .- -
. . . . . . . . . . +.,".+.*- ........ ........ I-"---..- ...
1 . ......... --.-_I ...... *l,nl.
. . . . . . . . . . . ....I...-... I -- .......... -a,...;,-.. ..1.. ..c_..._-,.*".L..DI. I ' BBB/Stable/--
..............
......
............. "--*....."..-.........I ..".__ I- ................... .-,tl--.-,.i-.U".,
: TE Products Pipeline GO. L.P. BBB/Stable/-- i 4 f . . . . ....... -....."..-_*..- ......... - . . . . .... -"__. ...........
TEPPCO Partners L.P.
. . . . . . . . . . . . . . . . . .
Colorado Interstate Gas Ca.
..... _. . . . . . . . . __ - -- . . . . - - . . __ . &
KPSC Case No. 2005-00341 AG 1 St Set Data Rcquest
Item No. 221 Page 14 of 20

New Business Profile Scores Assigned for U.S. Utility and Power Companies; Financial Guidelines Revised
(14 of 19)
. A-IStableIA-2 Virginia Electric & Power Co. (Dominion Virginia) - - ._..-". -. I _ . - x.- __. ." Idaho Power Co. A /Stable/A-2
IDACORP Inc
Energen Corp
Vectren Utility Holdings Inc
Wisconsin Power & Light Co.
Atmos Energy Corp.
Southern Indiana Gas & Electric Co.
Montana-Dakota U
Pacificor
Northern Border Partners L.P.
Central Illinois Light Co.
CILCORP
Union Electric Co
Arneren Corp.
. - .._. _ -
.. -I-_* .-_. ~ ." . \ ~ ~ -... ..
.-..- .,,- ".,.+. . ,-- =... r--- *-.-
" ,.
t - -". .- . 1 I . ,
- .....-I_ ,. --..-----..-. *
.-<+ -.,..-..* _..- - I_._
I. 1 . . - ~ ~ . .I-__..- ," - "_
_ _ -"- .-.-I..-..-"*--"" I
- __ - --_ - - __ KPSC Case No 2005-00341
AG 1 St Set Data Request I temNo 223 Paqe 15 of 20

New Business Profile Scores Assigned for US . Utility and Power Companies; Financial Guidelines Revised
1 Kentucky Utilities Co. 1 BBB+/Stable/A-2 51
Enogex Inc. ' BBB+/Stable/-- .."..-L,."..I..I_....-..-... ,.-. ....
................ ,,.. ,-,,-, "YX-I../,-".-~_."-r-.. ...... ............ -. ...,.......-...-.- . Energy East Corp. ................ p~' . , .m"~~-w-- . . .n~" ....
i 4 I RGS Energy Group Inc. . BBB+/Negative/-- 41,
BBB+/Negative/A-2
' Kaneb Pipe Line Operating Partnership 1 L.P.
BBB+lNegativel-- .. ...-~.t.l..lV...... U.Y ,-_".,. J,-."~'._ ,_., -C..,..nl
*. BBB+/Negative/A-2 1 61 ....... .2> ........... .".~-."-~"~.--,..~~,-~.~-~-~.~.?"~~~~~..-~-~~ -.-.-,- : BBB+/Negative/A-2 1 61 ............ -;.I . . . . . . . . . ...............-.. " ~ ~ ~ ~ ~ ~ " . ~ ........... ..-. .. 1w.. r. t.lYYYI-I.4
Questar Market Resources Inc. i I 81
Portland General Electric Co. BB+/CW-Neg./A-2 . . . . . . . . . . ,.y ............... _.., . . . . . . . . . . . ... ....*'....-....*'..A .... '......",-"~-.> . . . . ._ . . . . ..........-.....",....- ...
.-_.. . . . . . . . . . . . . . . . . I ,- - ....................... ,~~ ..... NiSource Inc.
. . . . . . . . . ...... Public Service Co. of Colorado BBBlStable /A-2 5 ) --. I ....-.......... . . . . . . . . . .
5 . . . . . . . . . I.n ,..-. . .---,.... yc" . .... 5 ............ --. ....... .*
i Southwestern Public Service Co. BBBIStable /A-2 i 5 ,j ...................... ..c~ ....... .- ....._._... .. . . . . . ...... ..-...*- *-...-.. !
51 I--..-* -I",*
Appalachian Power Co. BBBIStablel-- . . ....._ :,'-,.--,-.- .._.... . . . . . . . . . . . ..,..'I . <.. ............ ...
,"..".."._,-..I . .,.,,.+..- ......... ............. ^. . - ........
............... ... . ....,. -"..- ....... BBBlStablel-
KPSC Case No. 2005-00341 AG 1 St Set Data Request
Item No. 223 Page 1 G of 20
i i
(15 of 19)

New Business Profile Scores Assigned for US. Utility and Power Companies; Financial Guidelines Revised - - --1___1 - ~ - _ I _ ~ - --q __(.-I__-....-- ,..-."".---i c 6 f
r__ _ _ _ - - ~ _ _ _ Kansas City Power & Light Co.
PNM Resources Inc. ' BBBIStablel--
j BBBIStablelA-2 is.. "-l- -"-__.. e- .-P
-. I. " - i- *I*_* -,.-.. L--, alifornia Edison Co BBIS ta ble/A-2 [ 61
I 3 BBBIStablelA-2 -I__.
1 6 1
--[-A
"-_ .-_._I--- 1 - "- *.-.llY---l--.-I
fi Empire District Electric Co.
li~iz~ Orleans Inc.
d Duke Energy Fietd Services LLC
*---....., "-,-.--CIuI. .....-.-,. I . -.."-I --.--.-- ;I Entergy Mississippi Inc. --. . i - BBBIStablel-- -[-4
i \ BBBIStablel--
! BBBIStablelA-2 --*- -..w I""'----
1 LlUx%.*-II.-.,... -* .- 5 --.,"-#--..Yn__D_,..".
51
5 : . . . .rruw"...->
Arizona Public Service Co. ! BBBlN eg a tive/A-2 I ,"--I .d.*.-.,."-...-- .-- +",-.-%---" TXU US. Holdings Co ~ BBBINegativeb- 1
. -. mw., ...... *_ , ' .LW._ L-,..-"-e&.."*.)* .-...--- I,.* --*... .. 1 Pinnacle West Capital Corp.
......... . . - * . . " - . . - L I - - . Y - . leco Power LLC ...... - .. *-..--.. -.. *
Puget Sound Energy Inc. . .-, -.. ....w---,-.
- _ - - - - . ........... ..... acific Gas & Electric Co.
leveland Electric Illuminating Co . . . . ,.- ....... ...-..".%II- ......
. . . -.-- ... . ............ .
oledo Edison Co. I .,.- - 1 r
Pennsylvania Power Co.
a System Energy Resources Inc. BBB-/Stable/-- .. < ~. - - ._l"l.r- - -- --. - . Tampa Electric Co.
Black Hills Power Inc.
Westar Energy Inc
Kansas Gas & Electric Co
Indianapolis Power & Light Co
IPALCO Enterprises Inc.
*- /......... . . . . . . . . l^l .... --" .
- ~ - - . __.__~ -..-- . ..,-....- ..
.l. - . . _."._-.._*. I-_
..... ."--....I ....... ucts Operating L.P. . . . . - ". .,"...'--,".,-"!M
nterprise Products Partners L P.
.... ......*-.-. ............. a.......rr.-m.u^..ru.ol,ml..... d
BBB-INegativelA-3 I .. --.. ... ...-....I.... ....... --I----.C-I_.IICI__.,Jl_-"II
BB+/Positivel--
BB+/Positive/--
BB+/Stable/-- 4 i .......... -,I ,-.___..-. .......... .......
.-I"'..._ --_.._...- .....
................ .-... ...-........--.... .- ~ ~ . - ~ "
BB-tlStableI-- i 4 ; 3 .. ........-..-..-. ............ -,"~~--~---,-.~~.~.~~"-- .... *..j
BB+/Stable/--
B B+/S ta blel-- ,.<4v,.-...A......
GulfTerra Energy Partners L.P. BB+/CW-NegI-- 6 ) . . . . . . . . . . --L,.CI---I..- . .......-..-. ..
Consumers Energy Co. ........... ..".,-- ..... *..."....m..-".-,...".,-
ucson Electric Power Co.
: Dayton Power & Light Co. .... .AI,.. ................ ".L~ ....,. ~Y(.lrU?.m,".C*....lr . . . .
....................... -." --* .I*-,I-" .<.-. .....
... ._.,-, "...,I-"I.MyII.I."..- ......... Nevada Power Co.
Sierra Pacific Power Co. ".< .... -.,"-- .>."-.- ......-................. ...-...... .
1 .... ____I_ I____ . . .
(16 of 19)
BBICW-NegI-- I -. - .,.-. , .,.>."--- _.,., - _ ..",
......... .*7.Z..#.*...
...... . KPSC Case No. 2005-0034 1
AG 1 St Set Data Request Item No. 223
Pave 17 nf 7fl
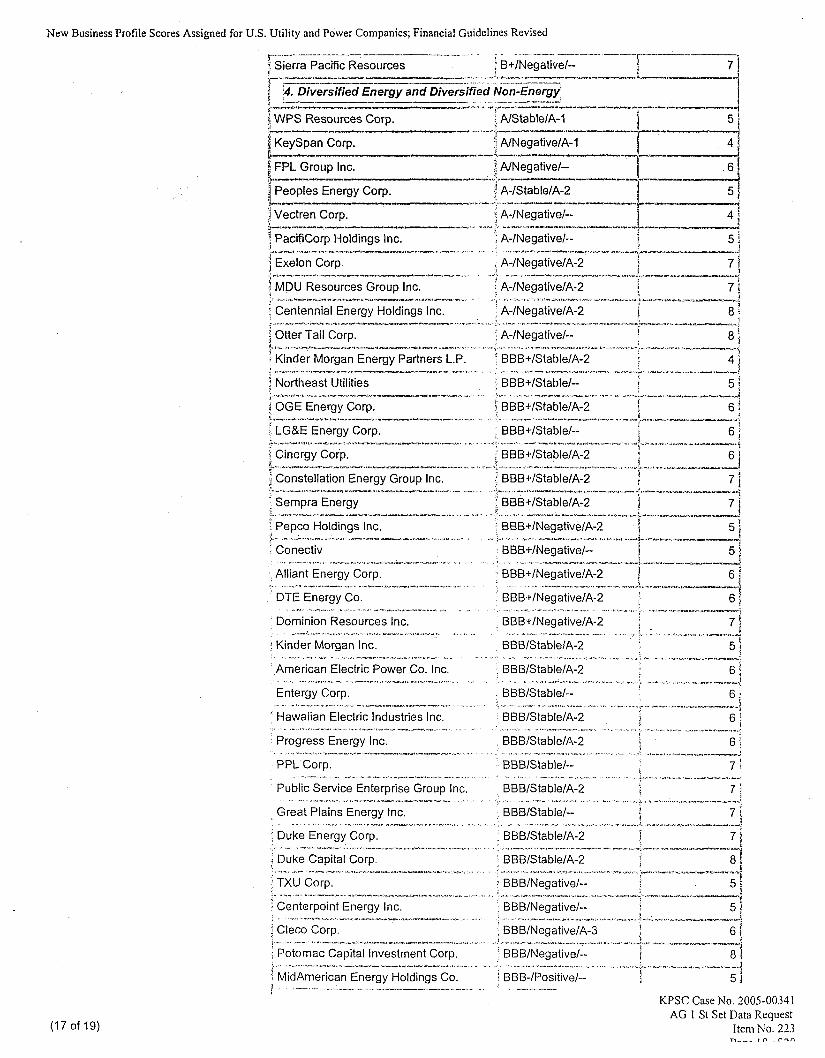
New Business Profile Scores Assigned for U.S. Utility and Power Companies; Financial Guidelines Revised
(17 of 19)
BBB+/Stable/--
... 1 -,+._.. ... .
. - . , - ~ "". terprise Group Inc.
~ . ., . . . .
; Patarnac Capital Investment Corp. ' BBBINegativel-- i 81
MidAmerican Energy Holdings Co. i BBB-/Positive/-- i 51 ;.. . . ..* ....... ~~ ........,_. .......-...- >'-".- ~ .,.- , , . . .:. . . .. ..r* 3.c. .... -* -..-...- . . .. -, ._; -;.-.. ....-.. ~-~ .,._,. ~.- --_ .._. f . ~ _.__.__ .. . - .
KPSC Case No. 2005-00341 AG 1 St Set Data Request
Iten? No. 273 n--- ,* - r m n

New Business Profile Scores Assigned for U.S. Utility and Power Companies; Financial Guidelines Revised
(18 of 19)
FirstEnergy Corp. BBB-/Stable/-- I
PSEG Power LLC , BBBIStableI-- i 8 . . . . . . . . . .- i.”~,l-n-t?..-...-NI...-”,.~I” . . . . . . . . . . . . ....... ~ ..... ....i..r-Z”Y*l,.”.i..; .... ....
PPL Energy Supply LLC i 8 ; . . . . . . . . . . . ,-...., . ..-, ~ ‘ * , 4 _ ~ 1 ~ ~ , 1 ~ 1 . 1 * ’ ~ ~ ..................................... .I.I...I:,’I.YI-..~ .... _.~~I ._.-, -. ...
: BBB/Negativel-- . . . . . . . . . . . . . . . ..... =.,I,-“-. .,.- ..
.... ,--. ........................ /~l:l l.,,~.~,ll,,,-l- ,-.>, . . . . ..*.....7.-...-... ....... -.-.,,,-<,,.
Cogentrix Energy B B,-/S ta blel-- . . . . . . . . . . . l.l.,.._ _,.”.._ .,.- ............................ I...../ ... ..,-.....I.. . ,-~*-.-.-,:-c5 .............................. __..,
PSEG Energy Holdings Inc. BB-/Stable/-- . . . . ,,. ............. _- .. -“~,~..-”-.,”~-~,.~
. AES Corp. . .,^_ .l. .l._ .”~ ._.. l ,~_ _I.._I--_-
. ., ......,...---..-. ........... -.,,. Energy Supply Co. LL
......... ..-I-.I~...”UIIW1C.-”UI .... “,.....
.................... _.------.I_-...-
; Edison Mission Energy : BINegativel- .................... . . ................
KPSC Case No. 200.5-0034 AG 1 St Set Data Requcs
Item No. 22 uner. i n ..c 7

New Business Profile Scores Assigned for U.S. Utility and Power Companies; Financial Guidelines Revised
Reliant Energy Mid-Atlantic Power 1 1 B,Negative,-- 4 Holdings LLC i ---I.-.. -"".--.- '*f .=-.-*.-.-*--<---
I 0
1 2--
Mirant Americas Generation Inc. e DI--I-- L--- 4 Mirant Americas Energy Marketing L.P. 4 DI--1-
Back to Toe
Published by Standard & Poor's, a Division of The McGraw-t-lilt Companies, Inc. Executive offices. 1221 Avenue of the Americas, New York, NY 10020. Editorial offices: 55 Water Street, New York, NY 10041 I Subscriber services" (1) 21 2-438-7280. Copyright 2003 by The McGraw-Hill Companies, Inc. Reproduction in whole or in part prohibited except by permission. All rights reserved. Information has been obtained by Standard & Poor's from sources believed to be reliable. However, because of the possibility of human or mechanical error by our sources, Standard & Poor's or others, Standard & Poor's does not guarantee the accuracy, adequacy, or completeness of any information and is not responsible for any errors or omissions or the result obtained from the use of such information. Ratings are statements of opinion, not statements of fact or recommendations to buy, hold, or sell any securities.
KPSC Case No. 2005-00341 AG 1 St Set Data Request
Item No. 223 Page 20 of 20
(19 of 19)