Embed Size (px)
Citation preview
© The Author 2015. Published by Oxford University Press. All rights reserved. For Permissions, please email: [email protected]
Tree Physiology 35, 1146–1165doi:10.1093/treephys/tpv073
Non-structural carbohydrates in woody plants compared among laboratories
Audrey G. Quentin1,2,46, Elizabeth A. Pinkard1, Michael G. Ryan3,4,5, David T. Tissue2, L. Scott Baggett5, Henry D. Adams6, Pascale Maillard7, Jacqueline Marchand8, Simon M. Landhäusser9, André Lacointe10,11, Yves Gibon12,13, William R.L. Anderegg14, Shinichi Asao3,4, Owen K. Atkin15,16, Marc Bonhomme10,11, Caroline Claye17, Pak S. Chow9, Anne Clément-Vidal18, Noel W. Davies19, L. Turin Dickman6, Rita Dumbur20, David S. Ellsworth2, Kristen Falk21, Lucía Galiano22,23, José M. Grünzweig20, Henrik Hartmann24, Günter Hoch25, Sharon Hood26, Joanna E. Jones17, Takayoshi Koike27, Iris Kuhlmann24, Francisco Lloret28,29, Melchor Maestro30, Shawn D. Mansfield31, Jordi Martínez-Vilalta28,29, Mickael Maucourt13,32, Nathan G. McDowell6, Annick Moing12,13, Bertrand Muller33, Sergio G. Nebauer34, Ülo Niinemets35, Sara Palacio30, Frida Piper36, Eran Raveh37, Andreas Richter38, Gaëlle Rolland33, Teresa Rosas28, Brigitte Saint Joanis10,11, Anna Sala26, Renee A. Smith2, Frank Sterck39, Joseph R. Stinziano40, Mari Tobias35, Faride Unda31, Makoto Watanabe41, Danielle A. Way40,42, Lasantha K. Weerasinghe15,43, Birgit Wild38,44, Erin Wiley9 and David R. Woodruff45
1CSIRO Land and Water, Private Bag 12, Hobart, Tasmania 7001, Australia; 2Hawkesbury Institute for the Environment, University of Western Sydney, Richmond, NSW 2753, Australia; 3Natural Resources Ecology Laboratory, Colorado State University, Fort Collins, CO 80523-1499, USA; 4Graduate Degree Program in Ecology, Colorado State University, Fort Collins, CO 80523-1401, USA; 5USDA Forest Service, Rocky Mountain Research Station, Fort Collins, CO 80521, USA; 6Earth and Environmental Sciences Division, Los Alamos National Laboratory, Los Alamos, NM, 87545, USA; 7INRA, UMR 1137, Ecologie et Ecophysiologie Forestières, Centre de Nancy, F-54280 Champenoux, France; 8INRA, UMR 1137, Ecologie et Ecophysiologie Forestières, Plateforme Technique d’Ecologie Fonctionnelle (OC 081) Centre de Nancy, F-54280 Champenoux, France; 9Department of Renewable Resources, University of Alberta, Edmonton, AB, T6G 2E3, Canada; 10INRA, UMR 0547 PIAF, F:63100 Clermont-Ferrand, France; 11Clermont Université, Université Blaise Pascal, UMR 0547 PIAF, F:6310 Clermont-Ferrand, France; 12UMR1332, Biologie du Fruit et Pathologie, INRA, Bordeaux University, 71 avenue Edouard Bourlaux, F-33140 Villenave d’Ornon, France; 13Plateforme Métabolome du Centre de Génomique Fonctionnelle Bordeaux, MetaboHUB, IBVM, Centre INRA, 71 avenue Edouard Bourlaux, F-33140 Villenave d’Ornon, France; 14Princeton Environmental Institute, Princeton University, Princeton NJ 08540, USA; 15Division of Plant Sciences, Research School of Biology, Building 46, The Australian National University, Canberra, ACT, 2601, Australia; 16ARC Centre of Excellence in Plant Energy Biology, The Australian National University, Canberra, ACT, 2601, Australia; 17Tasmanian Institute of Agriculture, School of Land and Food, Private Bag 98, University of Tasmania, Hobart, Tasmania 7001, Australia; 18CIRAD, UMR AGAP, F-34398 Montpellier, France; 19Central Science Laboratory, Private Bag 74, University of Tasmania, Hobart, Tasmania 7001, Australia; 20Robert H. Smith Faculty of Agriculture, Food and Environment, The Hebrew University of Jerusalem, P.O. Box 12, Rehovot 7610001, Israel; 21Department of Forest Ecosystems and Society, Oregon State University, Corvallis, OR 97331, USA; 22Swiss Federal Research Institute WSL, CH-8903 Birmensdorf, Switzerland; 23Institute of Hydrology, Freiburg University, Fahnenbergplatz, D-79098 Freiburg, Germany; 24Max Planck Institute for Biogeochemistry, Hans-Knöll Str. 10, 07745 Jena, Germany; 25Department of Environmental Sciences - Botany, University of Basel, Schönbeinstrasse 6, CH-4056 Basel, Switzerland; 26Division of Biological Sciences, University of Montana, Missoula MT-59812, USA; 27Silviculture and Forest Ecological Studies, Hokkaido University Sapporo, Hokkaido 060-8589, Japan; 28CREAF, Cerdanyola del Vallès E-08193 Barcelona, Spain; 29Universidad Autònoma Barcelona, Cerdanyola del Vallès E-08193 Barcelona, Spain; 30Instituto Pirenaico de Ecología (IPE-CSIC), Av. Nuestra Señora de la Victoria s/n, 22700 Jaca, Huesca, Spain; 31Department of Wood Science, University of British Columbia, V6T 1Z4 Vancouver, Canada; 32Université Bordeaux, UMR 1332, Biologie du Fruit et Pathologie, 71 avenue Edouard Bourlaux, F-33140 Villenave d’Ornon, France; 33INRA, UMR 759 LEPSE, Montpellier, F-34060 France; 34Plant Production Department, Universitat Politécnica de Valéncia, Camino de vera s.n. 46022-Valencia, Spain; 35Department of Plant Physiology, Estonian University of Life Sciences, Kreutzwaldi 1, 51014 Tartu, Estonia; 36Centro de Investigación en Ecosistemas de la Patagonia (CIEP), Simpson 471, Coyhaique, Chile; 37Department of Fruit Trees Sciences, Institute of Plant Sciences, A.R.O., Gilat Research Center, D.N. Negev 85289, Israel; 38Department of Microbiology and Ecosystem Science, University of Vienna, Althanstrasse 14, A-1090 Vienna, Austria; 39Forest Ecology and Forest Management Group, Wageningen University, Postbox 47, 6700 AA, Wageningen, the Netherlands; 40Department of Biology, Western University, 1151 Richmond Street, London, N6A 5B7, ON, Canada; 41Institute of Agriculture, Tokyo University of Agriculture and Technology Fuchu, Tokyo 183-8509, Japan; 42Nicholas School of the Environment, Duke University, Box 90328, Durham, NC 27708, USA; 43Faculty of Agriculture, University of Peradeniya, Peradeniya, 20400, Sri Lanka; 44Department of Earth Sciences, University of Gothenburg, Guldhedsgatan 5A, 40530 Gothenburg, Sweden; 45USDA Forest Service, Forestry Sciences Laboratory, Corvallis, OR 97331, USA; 46Corresponding author ([email protected])
Received November 22, 2014; accepted July 9, 2015; published online September 29, 2015; handling Editor Maurizio Mencuccini
Research paper

Tree Physiology Online at http://www.treephys.oxfordjournals.org
Introduction
Non-structural carbohydrates (NSC) are products of photosyn-thesis, provide substrates for growth and metabolism and can be stored by the plant. Consequently, NSC play a central role in plant response to the environment ( Chapin et al. 1990, Kozlowski 1992). Major theories of plant defense and growth such as the ‘growth–differentiation balance hypothesis’ ( Loomis 1932), the ‘carbon/nutrient hypothesis’ ( Bryant et al. 1983), revisions to the ‘hydraulic limitation hypothesis’ ( Ryan et al. 2006) and the ‘carbon limitation hypothesis’ ( Körner 2003) all outline a role for NSC, but that role has yet to be firmly estab-lished or rejected. In more recent years, NSC of woody plants have received wider attention in the context of understanding drought-induced mortality ( Grünzweig et al. 2008, McDowell et al. 2008, Galiano et al. 2011, Muller et al. 2011, Piper 2011, Adams et al. 2013, Duan et al. 2013, Hartmann et al. 2013, Mitchell et al. 2013, 2014, O’Brien et al. 2014, Sevanto et al. 2014, Dickman et al. 2015), altitudinal boundaries for forests ( Hoch et al. 2002, Hoch and Körner 2003, Handa et al. 2005, Li et al. 2008, Fajardo et al. 2011, 2012, 2013, Fajardo and Piper 2014), growth limitation ( Sala et al. 2010, 2012, Piper and Fajardo 2011, Palacio et al. 2014) and plant survival under poor resource conditions ( Kobe 1997, Strauss and Agrawal 1999, Haukioja and Koricheva 2000, Lusk and Piper 2007, Quentin et al. 2011, Piper and Fajardo 2014).
Several major questions about the role and regulation of stored carbohydrates in woody plants remain unanswered, such as their role in indicating plant carbon balance, helping plants cope with stress, and whether control of storage and use is active, passive or more complex ( Chapin et al. 1990, Sala et al. 2011, 2012, Wiley and Helliker 2012). The many uncertainties about how NSC are involved in the regulation of whole-tree car-bon metabolism make predictions of growth and productivity under environmental change difficult ( Ryan 2011).
Many carbohydrates can comprise NSC such as monosaccha-rides (glucose and fructose), disaccharides (sucrose), polysac-charides (starch and fructans), oligosaccharides (raffinose) and sugar alcohols (inositol, sorbitol and mannitol) ( Rastall 1990, Stick and Williams 2010). Sucrose, fructose and glucose are gen-erally, but not always, the predominant soluble sugars, and starch is the pivotal non-soluble longer-term storage compound ( Mooney 1972, Chapin et al. 1990); many studies focus on these four carbohydrates while measuring plant NSC. The diver-sity of carbohydrates and matrices (tissue structural and bio-chemical characteristics), and the search for reliable and inexpensive methods that can be used for the large number of samples in environmental plant physiology studies, has led to the development of many analytical methods to determine the iden-tity and amount of carbohydrates in plant tissue (Table 1, Table S1 available as Supplementary Data at Tree Physiology Online;
Non-structural carbohydrates (NSC) in plant tissue are frequently quantified to make inferences about plant responses to envi-ronmental conditions. Laboratories publishing estimates of NSC of woody plants use many different methods to evaluate NSC. We asked whether NSC estimates in the recent literature could be quantitatively compared among studies. We also asked whether any differences among laboratories were related to the extraction and quantification methods used to determine starch and sugar concentrations. These questions were addressed by sending sub-samples collected from five woody plant tissues, which varied in NSC content and chemical composition, to 29 laboratories. Each laboratory analyzed the samples with their laboratory-specific protocols, based on recent publications, to determine concentrations of soluble sugars, starch and their sum, total NSC. Labora-tory estimates differed substantially for all samples. For example, estimates for Eucalyptus globulus leaves (EGL) varied from 23 to 116 (mean = 56) mg g−1 for soluble sugars, 6–533 (mean = 94) mg g−1 for starch and 53–649 (mean = 153) mg g−1 for total NSC. Mixed model analysis of variance showed that much of the variability among laboratories was unrelated to the categories we used for extraction and quantification methods (method category R2 = 0.05–0.12 for soluble sugars, 0.10–0.33 for starch and 0.01–0.09 for total NSC). For EGL, the difference between the highest and lowest least squares means for categories in the mixed model analysis was 33 mg g−1 for total NSC, compared with the range of laboratory estimates of 596 mg g−1. Laboratories were reasonably consistent in their ranks of estimates among tissues for starch (r = 0.41–0.91), but less so for total NSC (r = 0.45–0.84) and soluble sugars (r = 0.11–0.83). Our results show that NSC estimates for woody plant tissues cannot be compared among laboratories. The relative changes in NSC between treatments measured within a laboratory may be compa-rable within and between laboratories, especially for starch. To obtain comparable NSC estimates, we suggest that users can either adopt the reference method given in this publication, or report estimates for a portion of samples using the reference method, and report estimates for a standard reference material. Researchers interested in NSC estimates should work to identify and adopt standard methods.
Keywords: extraction and quantification consistency, non-structural carbohydrate chemical analysis, particle size, reference method, soluble sugars, standardization, starch.
Comparing NSC content among laboratories 1147

Tree Physiology Volume 35, 2015
Gomez et al. 2003). Within any given plant species, a wide range of NSC values have been reported in different studies (Table 2). Potential explanations for these differences include plant age and growing conditions, but the extraction and quantification methods
may also have a major impact on the results ( Rose et al. 1991, Chow and Landhäusser 2004). For 8–12-month-old Eucalyptus globulus saplings, leaf total NSC concentration varied between 28 and 224 mg g−1 when measured using three different soluble
1148 Quentin et al.
Table 1. Summary of the primary solvents and assays used for extraction and quantification methods to estimate soluble sugars and starch in five plant materials. The method categories also vary in the number of extractions, duration, temperature and standards. For further details on each specific method, please refer to Tables S1 and S2 available as Supplementary Data at Tree Physiology Online. AA, α-amylase; Amylo., amyloglucosidase; DMSO, dimethyl sulfoxide; EtOH, ethanol; FRUC, fructose; G6PDH, glucose-6-phosphate dehydrogenase; GHK, glucose hexokinase; GLUC, glucose; GOPOD, glucose oxidase/peroxidase-o-dianisidine; H2SO4, sulfuric acid; HCl, hydrochloric acid; HClO4, perchloric acid; 1H-NMR, proton nuclear magnetic reso-nance; HPAEC-PAD, high-performance anion exchange chromatography-pulsed amperometric detection; HPLC, high-performance liquid chromatogra-phy; KOH, potassium hydroxide; MCW, methanol : chloroform : water; NA: not attributed; NaOH, sodium hydroxide; PGI, phosphoglucose isomerase; SUC, sucrose. Soluble sugar methods include 31 laboratories and starch methods 28 laboratories. Two laboratories have used two methods to esti-mates the soluble sugars, whereas one laboratory did not estimate starch.
Strength No. of extraction Combination Duration (min) Temperature (°C) No. of laboratories
Soluble sugars Extraction methods EtOH or MeOH 70–80%1 1–5 EtOH or W 2–60 60–100 19 W – 1–3 – 10–60 65–100 8 MCW – 1–3 – 5 to overnight 4–60 3
Absorbance Reagents Standards No. of laboratories Quantification methods HPLC – – Trehalose or
mannitol8
HPAEC-PAD – – GLUC, FRUC, SUC 3 1H-NMR – – GLUC, FRUC 1 Enzymatic 340 G6PDH + GHK + PGI + Invertase GLUC, FRUC, SUC 10 Colorimetric 620 Anthrone GLUC 5
490 Phenol GLUC 4
Duration (min) Temperature (°C) No. of laboratoriesStarch Gelatinization methods None – – 4 NaOH 30–180 50–100 8 DMSO 5 100 2 KOH 30 95 1 EtOH 30 100 1 AA 30 85–90 2 Others2 NA–90 120 5
Reagent/enzyme No. of extraction Temperature (°C) Duration (min h−1) No. of laboratories Digestion/extraction methods Acid HClO4 1 Room temperature 16–20 h 2
H2SO4 Autoclave 3.5 min 1HCl 100 6 min 1
Enzymatic Amylo. 1 or 2 45–100 30 min to 24 h 16AA + amylo. 2 55–100 3–30 min 8
37–100 1 min to 16 h
Absorbance Reagent Standard No. of laboratories Quantification methods HPLC – – GLUC 4 HPAEC – – GLUC 2 Enzymatic 340 G6PDH + HK GLUC 10 Colorimetric 620–630 Anthrone GLUC 4
490 Phenol GLUC 4510–5253 GOPOD GLUC 5
1Strength used for the first extraction. With further extractions, strength varied between 30 and 80% for ethanol, and 0% when water is used.2Includes shaking, autoclaving, boiling and ultrasound.3Method using the Megazyme® kit.

Tree Physiology Online at http://www.treephys.oxfordjournals.org
Comparing NSC content among laboratories 1149Ta
ble
2.
Proc
edur
es fo
r so
lubl
e su
gar,
star
ch m
easu
rem
ents
and
NSC
con
cent
ratio
ns a
nd m
ean
valu
es fo
r E.
glo
bulu
s an
d Pr
unus
per
sica
and
for
Pinu
s ed
ulis
for
vario
us e
nviro
nmen
tal r
espo
nse
stud
ies.
AA, α
-am
ylas
e; A
myl
o., a
myl
oglu
cosi
dase
; BA, β
-am
ylas
e; D
MSO
, dim
ethy
l sul
foxi
de; D
ig.,
dige
stio
n; E
nz.,
enzy
mat
ic; E
tOH
, eth
anol
; Ext
r., e
xtra
ctio
n; F
RUC, f
ruct
ose;
GLU
C, g
luco
se; G
OPO
D,
gluc
ose
oxid
ase/
pero
xida
se-o
-dia
nisi
dine
; HCl,
hydr
ochl
orid
e ac
id; H
PLC
, hig
h-pe
rform
ance
liqu
id c
hrom
atog
raph
y; L
, lea
f; M
CW
, met
hano
l : c
hlor
ofor
m :
wat
er; m
o: m
onth
-old
; Qua
nt.,
quan
tifica
-tio
n; R
, roo
ts; s
pec,
spe
ctro
phot
omet
ry; S
, ste
m; S
t, st
arch
; SU
C, s
ucro
se; T
SS, t
otal
sol
uble
sug
ars;
UPL
C, u
ltra
perfo
rman
ce li
quid
chr
omat
ogra
phy;
W, w
ater
; yo,
yea
r-ol
d.
Refe
renc
esA
geTi
ssue
Sam
ple
wei
ght
(mg)
Solu
ble
suga
rsSt
arch
Con
cent
ratio
n (m
g g−
1)
in th
e lit
erat
ure
Extr.
Qua
nt.
(ass
ay)
Dig
.Q
uant
. (a
ssay
)G
LUC
FRU
CSU
CTS
SSt
Tota
l NSC
E. g
lobu
lus
Sh
vale
va e
t al.
(2006)
∼12 m
oL
20
EtO
HSp
ec.
(ant
hron
e)H
Cl
Spec
. 62
07
2–8
34
9–5
61
15
–11
7
R5
03
2–4
52
9–3
27
8–8
8
Eyle
s et
al.
(200
9a)
11 m
oL
50
EtO
Hx1
Spec
. 49
0
(phe
nol)
Am
ylo.
Spec
. 49
0
(phe
nol)
10
59
41
99
S4
07
91
18
R3
31
00
13
2
Eyle
s et
al.
(200
9b)
∼16 m
oL
50
EtO
Hx1
Spec
. 49
0
(phe
nol)
Am
ylo.
Spec
. 49
0
(phe
nol)
46
93
14
0
M
erch
ant e
t al.
(2010)
∼12 m
oL
40
MC
WG
C5
42
12
O
’Gra
dy e
t al.
(2010)
>6 y
oL
(at 7
m
high
)5
0Et
OH
x1Sp
ec. 4
90
(p
heno
l)A
myl
o.Sp
ec. 4
90
(p
heno
l)5
66
41
20
L (a
t 15
m
high
)1
93
75
6
Q
uent
in e
t al.
(2010)
∼8 m
oL
50
EtO
Hx1
Spec
. 49
0
(phe
nol)
Am
ylo.
Spec
. 49
0
(phe
nol)
93
–10
63
7–3
91
30
–14
5
Pi
nkar
d et
al.
(2011)
∼3–4
mo
L5
0Et
OH
x1Sp
ec. 4
90
(p
heno
l)A
myl
o.Sp
ec. 4
90
(p
heno
l)1
42
93
18
7
Q
uent
in e
t al.
(2011)
>6 y
oL
50
EtO
Hx1
Spec
. 49
0
(phe
nol)
Am
ylo.
Spec
. 49
0
(phe
nol)
14
5
S6
0R
63
Ba
rry
et a
l. (2
01
2)
18 m
oL
50
EtO
Hx1
Spec
. 49
0
(phe
nol)
Am
ylo.
Spec
. 49
0
(phe
nol)
60
16
76
S2
49
32
R2
84
06
7
Dra
ke e
t al.
(201
3)
?S
10
0Et
OH
x2Sp
ec 6
30
(a
nthr
one)
6–1
4
R (t
ap)
7–1
6
Dua
n et
al.
(201
3)
8 m
oL
20
EtO
Hx2
+ W
Spec
62
0
(ant
hron
e)A
A +
am
ylo.
Spec
. 51
58
3–9
03
3–1
40
11
7–2
24
S3
2–6
02
–83
5–6
2R
10
–24
1–2
12
–25
Ey
les
et a
l. (2
01
3)
7 m
oL
50
EtO
Hx1
UPL
CA
myl
o.Sp
ec. 4
90
(p
heno
l)1
82
21
54
92
14
6
(Con
tinue
d)

Tree Physiology Volume 35, 2015
1150 Quentin et al.
Tabl
e 2.
(Con
tinue
d)
Refe
renc
esA
geTi
ssue
Sam
ple
wei
ght
(mg)
Solu
ble
suga
rsSt
arch
Con
cent
ratio
n (m
g g−
1)
in th
e lit
erat
ure
Extr.
Qua
nt.
(ass
ay)
Dig
.Q
uant
. (a
ssay
)G
LUC
FRU
CSU
CTS
SSt
Tota
l NSC
M
itche
ll et
al.
(2013)
6 m
oL
20
EtO
Hx2
+ W
Spec
62
0
(ant
hron
e)A
A +
am
ylo.
Spec
. 51
5
(GO
POD
)8
51
20
20
6
S2
01
33
3R
46
30
76
G
auth
ier et
al.
(2014)1
<6 m
oL
5Et
OH
x3En
z.A
myl
o.Sp
ec 5
15
(G
OPO
D)
71
01
7
P. p
ersi
ca
Moi
ng e
t al.
(1992)
2 m
oL
?Et
OH
x2H
PLC
Am
ylo.
HPL
C1
1.1
5.6
93
6.7
95
89
18
4
Nii
(1997)
37–3
8 y
oL
?Et
OH
Spec
(a
nthr
one)
78
77
15
5
Tw
orko
ski e
t al.
(1997)
5–6
yo
L2
00
EtO
HH
PLC
Am
ylo.
Spec
.3
8–1
58
33
–48
86
–19
1S
44
–77
39
–45
83
–12
2
Esco
bar-G
utié
rrez
et a
l. (1
997)
2.5
mo
L?
EtO
Hx2
HPL
CA
myl
o.3
91
05
32
15
13
53
50
In
gles
e et
al.
(2002)
3 y
oR
15
0Et
OH
Enz.
Am
ylo.
Enz.
6–9
G
raha
m (
2002)
2 m
oR
50
MC
WH
PLC
Am
ylo.
Spec
. 45
01
69
95
75
21
09
S1
13
75
43
38
8L
20
71
51
06
26
13
2
Leite
et a
l. (2
00
4)
11 y
oS
(Oct
)1
0Et
OH
x2H
PLC
Am
ylo.
Enz.
52
76
96
5.5
13
4S
(Feb
)1
43
57
41
69
0
Bonh
omm
e et
al.
(2005)
4 y
oS
10
EtO
Hx2
HPL
CA
myl
o.En
z.1
52
87
21
28
4
Gor
don
et a
l. (2
006)
2 y
oR
??
HPL
CA
myl
o.?
15
0
Dic
hio
et a
l. (2
007)
>3 y
oL
?Et
OH
Spec
. 62
5
(ant
hron
e)A
myl
o.Sp
ec. 4
25
(G
OPO
D)
12
05
12
5
S1
00
10
11
0R
24
06
03
00
Li
et a
l. (2
007)2
5 y
oL
15
00
0Et
OH
x3H
PLC
Am
ylo.
Spec
. (G
OPO
D)
42
95
12
57
6
Che
ng e
t al.
(2009)2
8 y
oL
15
00
0Et
OH
x3H
PLC
Am
ylo.
Spec
. (G
OPO
D)
44
11
43
23
65
W
eibe
l et a
l. (2
008)
4–5
yo
REt
OH
Spec
. (a
nthr
one)
26
0
S?
16
0R
19
0 P
. edu
lis
Ada
ms
et a
l. (2
013)3
15–2
5 y
oL
12
WEn
z.A
myl
o.En
z.1
0–5
60
–18
51
9–2
16
An
dere
gg a
nd A
nder
egg
(201
3)10–1
5 y
oL
?Et
OH
+ M
CW
Spec
59
5BA
+ a
myl
o.Sp
ec. 5
95
5–1
00
–30
30
–60
R1
0–2
88
–21
45
–95
D
ickm
an e
t al.
(2015)3
?L
(2007)
12
WEn
z.A
myl
o.En
z.5
16
10
16
L (2
008)
41
53
8L
(2009)
40
41
21
6
Seva
nto
et a
l. (2
014)3
15–2
5 y
oL
12
WEn
z.A
myl
o.En
z.1
3–2
71
–19
27
–36
6–3
13
6–5
9
1Va
lues
repo
rted
in g
m−2
.2Es
timat
ions
wer
e m
ade
on fr
esh
wei
ght.
3N
o fe
rtili
zer us
ed.

Tree Physiology Online at http://www.treephys.oxfordjournals.org
sugar and starch extraction methods, and three different quantifi-cation methods (Table 2). Studies have also used the same extraction and assay methods to analyze different tissues (leaves, stems, roots) that consist of different matrices (Table 2), despite evidence that different matrices can have a profound impact on the analytical results ( Smeraglia et al. 2002, Matuszewski et al. 2003, Thompson and Ellison 2005, Santiago da Silva et al. 2012). For example, the phenolics and tannins in many conifer needles can interfere with enzymatic/colorimetric techniques ( Ashwell 1957), but not all plant tissues contain these chemicals. Given such variability in NSC estimates, we believe that there is an urgent need to compare estimates of NSC of standard sam-ples for different laboratories around the world, with the labora-tories using the same methods as in their recent publications.
Several other factors suggest that a comparison of the NSC of standard samples would be worthwhile. First, such a comparison would allow plant ecophysiologists studying the role of NSC and regulation to assess and compare their own results. Second, the composition of NSC can vary widely among species, tissues and seasons ( Hoch et al. 2003, Landhäusser and Lieffers 2003, El Zein et al. 2011, Richardson et al. 2013, Dickman et al. 2015), and this diversity further contributes to potential misinterpretation when comparing results from studies that use different methods. Finally, knowledge of the comparability of quantitative estimates of NSC would benefit articles that review NSC among studies to formulate hypotheses about the regulation of plant carbon and growth mechanisms ( Körner 2003, Ainsworth and Rogers 2007, McDowell et al. 2008). To our knowledge, no study has addressed the comparability of NSC among different laboratories.
Our primary objective was to assess whether soluble sugar, starch and total NSC concentrations could be compared across laboratories that use NSC estimates to understand plant response to a variety of biotic and abiotic factors. Many of these studies focused on NSC estimates in woody species, so our common samples were from trees. We answered the question of inter-laboratory comparability in NSC quantification by sending sub-samples of five different tissue samples (leaf, root and stem) that we have hypothesized varied widely in NSC, matrix struc-ture and chemistry, to 29 laboratories. The laboratories evalu-ated the samples using their own ‘in-house’ protocols of NSC extraction and quantification (see Tables S1 and S2 available as Supplementary Data at Tree Physiology Online).
Our second objective was to determine whether estimates from an individual laboratory were consistent across the five standard samples. If a laboratory’s estimates were high, low or similar relative to all laboratories for a given sample, would the same rank apply for the other four standard samples? Consis-tency among samples would indicate the reliability of comparing relative change within and among laboratories.
The third objective was to determine whether any differences among laboratory estimates were related to the methods of extraction and/or quantification of soluble sugars and starch,
and if variability among laboratories differed by sample. Because our first objective was the primary purpose for the study, our ability to test the third objective suffered by having to group extraction and quantification methods into broad categories. This grouping and our sample of laboratories precluded testing factors that may be important sources of variability because of lack of replication. These factors include the number, tempera-ture and duration of extractions and the gelatinization of starch. We partially addressed this issue by investigating the effect of different extraction methods on sugar estimates in a single labo-ratory using a common quantification method.
Materials and methods
Non-structural carbohydrate analyses of standard samples in different laboratories
We selected five samples for our standards: leaves (EGL), roots (EGR) and stem (EGS) of E. globulus, Pinus edulis needles (PEN) and Prunus persica leaves (PPL). We selected these samples because a priori knowledge suggested that they differed in the concentration of soluble sugars and starch, and had very differ-ent structural or chemical matrices that would challenge NSC extraction. Each substrate was homogenized, irradiated at 27.8 kGy for microbiological control to meet international quar-antine requirements and then homogenized. Method S1 avail-able as Supplementary Data at Tree Physiology Online describes the collection and handling of samples used.
Sub-samples of the same five dried and ground samples were sent to 29 laboratories around the world (Austria, Australia, Canada, Chile, Estonia, France, Germany, Japan, Israel, The Netherlands, Spain, Switzerland and the USA), where each labora-tory used their own protocol to analyze the samples in triplicate (see Method S2, Tables S1 and S2 available as Supplementary Data at Tree Physiology Online). One laboratory (Q) only provided sugar estimates, and two other laboratories (L1, L2; Z1, Z2) pro-vided sugar estimates from two different methods. The number of estimates for starch was 28, the number of estimates for total soluble sugars was 31, and the independent estimates for sugars from laboratories L and Z were combined with the single starch estimate from those laboratories to yield 30 NSC estimates. One laboratory had samples analyzed twice by two separate investiga-tors, which we counted as six laboratory replicates, but only one starch, soluble sugar and NSC mean estimate. Table 1 summa-rizes the procedures used in this study to measure soluble sugars and starch in plant tissues and Tables S1 and S2 available as Supplementary Data at Tree Physiology Online provide more detailed methods. All data were reported as mg g−1 of dry mass.
Different methods for soluble sugar extraction within a single laboratory
We selected four methods of soluble sugar extraction: 80% ethanol (80% EtOH), 70% methanol (70% MeOH), methanol :
Comparing NSC content among laboratories 1151

Tree Physiology Volume 35, 2015
chloroform : water (MCW) at 80 °C (MCW 80) and MCW at ambient laboratory temperature (MCW amb). Individual soluble sugars (glucose, fructose, sucrose) were extracted from 20 mg of dried plant tissue for each of the five samples for each of the four methods. Alcohol methods (EtOH) were derived from Gomez et al. (2002), and ternary solvent methods (MCW) from Dickson and Larson (1975). All four methods were conducted within the same laboratory (see Method S3 available as Supple-mentary Data at Tree Physiology Online).
Other methods
We also performed an analysis of the effect of microwaving duration to halt enzymatic activity (see Method S4 available as Supplementary Data at Tree Physiology Online), and the effect of particle size (see Method S5 available as Supplementary Data at Tree Physiology Online) in single laboratories.
Statistical analyses
For Objective 1, we used a general linear mixed model analysis to determine differences in estimates among laboratories with labo-ratory and sample types as fixed effects and the extraction and quantification categories (below) as random effects. For Objective 2, we used Spearman rank correlations for laboratory ranks among all sample pairs to evaluate the consistency of laboratory esti-mates for samples with different chemical constituents. Correla-tions were estimated for total soluble sugars, starch and total NSC.
For Objective 3, we used a different general linear mixed model analysis, with extraction and quantification groups and sample as fixed effects, and laboratory as a random effect. We could not perform one overall test with laboratories and meth-ods, because methods were confounded with laboratory. We grouped methods according to the type of solvent used for the extraction methods (EtOH, EtOH + W, MCW, W for the soluble sugars; and Acid, AA + amylo., Amylo. for starch) and by the type of quantitative assay for the quantification methods (HPLC, Enz., Spec. 490, Spec. 620 and Spec. 510). High-performance anion exchange chromatography-pulsed amperometric detection (HPAEC-PAD) and proton nuclear magnetic resonance (1H-NMR) were grouped with HPLC. Both sugar and starch concentrations were log-normally distributed and all components were trans-formed for analysis. Least squares means (LSM) were back-transformed to original units after estimation of the model parameters. Other differences in laboratory protocols (differ-ences among the number, temperature and duration of extrac-tions or methods used for the gelatinization of starch) were not considered as factors within the method because of the lack of replication. General linear mixed model analyses were done using SAS PROC GLIMMIX (SAS Institute 2012). The proportion of the variance explained by the method categories compared with sample and laboratory was evaluated using the method of computing R2 for generalized linear mixed models described in Nakagawa and Schielzeth (2013). We assessed how differences
among method categories compared with differences among samples and laboratories by comparing the R2 for models with only the method category as a fixed factor with (i) R2 for models with only sample category as a fixed factor and (ii) with the R2 for the full model with sample and method as fixed factors and laboratory as a random factor. R2 measures were computed using the ‘R’ statistical package version 3.1.2 ( R Development Core Team 2014) and the MuMIn library.
We examined the differences between soluble sugar extraction methods on total NSC in the same laboratory with an analysis of variance for each sample type (α = 0.05). For all tests and all experiments, we set α at 0.05. Participants were assured of ano-nymity in the experiment, and the results were coded by letters.
Results
Objective 1: estimates for soluble sugars, starch and total NSC for the same samples varied substantially among laboratories
Estimates for individual sugars, total soluble sugars, starch and total NSC differed among laboratories (P < 0.001, Figure 1), with a large range for all components. For example, in E. globulus leaves (EGL), laboratory estimates ranged from 23 to 116 mg g−1 (coefficient of variation (CV) 35%) for total soluble sugars, 6–533 mg g−1 (CV 102%) for starch and 53–649 mg g−1 (CV 69%) for total NSC (Figure 1). Laboratory estimates for Prunus leaves (PPL, average CV = 87% for sugars, starch and total NSC) were more variable than those for other samples (average CV = 54–69% for all NSC components). Starch estimates were more variable among laboratories (CV 87–120%) than were soluble sugars and total NSC (CV 24–71% for sugars and 44–71% for total NSC, Figure 1). For all samples and NSC com-ponents, 10–57% of the laboratories were within the 95% con-fidence intervals estimated for the means. Laboratories were most consistent for starch estimated for the Eucalyptus leaf, stem and root samples (EGL, EGS, EGR, 16 of 28 laboratories were within the 95% confidence intervals), and least consistent for sugar estimates for Eucalyptus leaves (4 of 30 laboratories) and total NSC estimated for Pinus leaves (8 of 30 laboratories) and Prunus leaves (3 of 30 laboratories). The subset of the labora-tories that identified sucrose and glucose + fructose (n = 20) were relatively consistent, having an average of 51% or 10 of 20 laboratory estimates within the 95% confidence intervals (range = 7–14 laboratories, Figure 1a). The interaction between laboratory and sample type was highly significant for sugars, starch and total NSC (P < 0.001), indicating that differences among laboratories differed with sample type.
The range of estimates varied substantially with method and sample types (Figure 1, Figure S1 available as Supplementary Data at Tree Physiology Online). For example, NSC in the PPL sample showed high variability among laboratories (Figure 1, Fig-ure S1a available as Supplementary Data at Tree Physiology
1152 Quentin et al.

Tree Physiology Online at http://www.treephys.oxfordjournals.org
Online), and estimates for soluble sugars varied largely within each method of extraction and quantification, except for the water extraction (W) (see Figure S1a available as Supplementary Data at Tree Physiology Online). In comparison, NSC in the EGS sample had the lowest variability among laboratories ( Figure 1b) and estimates varied less within each method (see Figure S1b available as Supplementary Data at Tree Physiology Online).
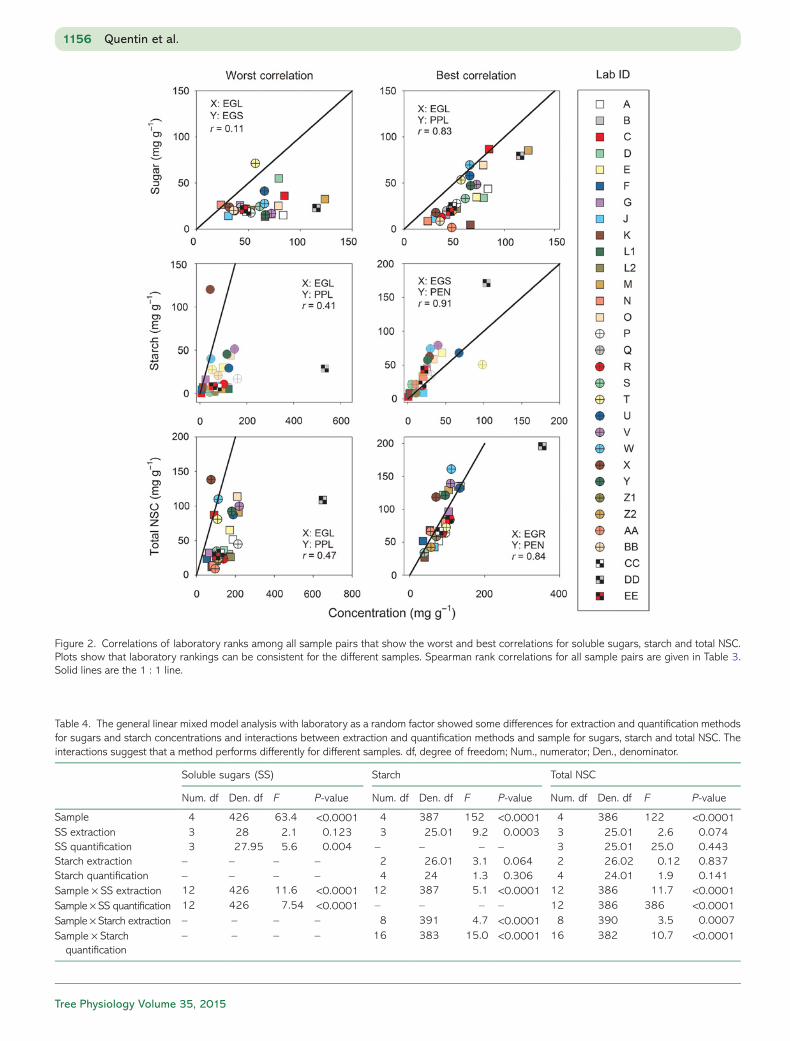
Objective 2: laboratories had similar rankings for all five common samples
Laboratory rankings were consistent for most sample pairs (Table 3; Figure 2), with higher rank correlations for starch (0.41–0.91, mean = 0.71) and total NSC (0.45–0.84, mean = 0.60) than for soluble sugars (0.11–0.83, mean = 0.44). This consistency shows that laboratories with estimates below, above
Comparing NSC content among laboratories 1153
Figure 1. Laboratory estimates of (a) sucrose, glucose + fructose, total soluble sugar, and (b) starch and NSC for five samples: EGL, PEN, PPL, EGR and EGS, with means (text and solid line), range, coefficient of variation (CV) and 95% confidence interval (dashed lines). Estimates are ranked by sugar extraction category: W, water; EtOH + W, ethanol water mixture; MCW, methanol : chloroform : water; EtOH, ethanol. Estimates differed substan-tially among laboratories and within method categories.

Tree Physiology Volume 35, 2015
or near the mean for one sample tend to have a similar ranking for that carbohydrate relative to other laboratories for other samples.
Objective 3: extraction and quantification methods affect NSC estimates, but the effect is lower than variability among laboratories
We investigated whether the methods used to extract or quantify NSC could explain the variability in NSC results among laboratories
(Table 4; Figure 3). When analyses were pooled across laboratories and samples, NSC estimates did not differ by sugar or starch extrac-tion or quantification methods (Table 4, P = 0.07–0.84, Figure 3c, e, g, and i: LSM). Across laboratories and samples, starch estimates were lower for ethanol + water sugar extraction than for the other three sugar extraction categories (Figure 3b: LSM, P < 0.05), but did not differ by starch extraction or quantification categories (Figure 3d and h: LSM). Across laboratories and samples, sugar estimates did not vary by extraction method category (Figure 3a:
1154 Quentin et al.
Figure 1. (Continued)

Tree Physiology Online at http://www.treephys.oxfordjournals.org
LSM), but did by sugar quantification method category (Figure 3f: LSM, P < 0.05), with the Spec. 620 colorimetric method produc-ing higher estimates than the HPLC, enzymatic or Spec. 490 method. A principal component analysis showed that within a method, the estimates for soluble sugars were more variable than were estimates for starch (see Figures S2 and S3 available as Supplementary Data at Tree Physiology Online).
An analysis of R2 for model components showed that the dif-ferences in method category in our analysis accounted only for a small portion of differences in NSC among laboratories. R2 for total soluble sugars with sugar extraction method category was 0.05 and 0.12 for sugar detection method category, compared with 0.30 for sample and 0.66–0.69 for the full model. R2 for starch with starch extraction method category was 0.10 and 0.11 for starch detection method category, compared with 0.23 for sample and 0.88 or 0.92 for the full model; sugar extraction method category had an R2 of 0.33. R2 for total NSC with sugar extraction method category was 0.09, 0.04 for sugar detection method category, 0.01 for starch extraction method category and 0.09 for starch detection category compared with 0.37 for sample and 0.79–0.84 for the full model. Additionally, differ-ences between the highest and lowest LSM for the overall effect of methods categories were small compared with the differ-ences among laboratories (compare Figure 3 with Figure 1).
Objective 3: method effects differ by sample
Sample and method had significant interactions (Table 4, P < 0.0001), with the foliar samples (EGL, PEN and PPL) showing
more variation among method categories than the wood sam-ples (EGR, EGS). For example, the sugar extractions with water (W and EtOH + W) yielded lower soluble sugar and total NSC estimates for the foliar samples (EGL, PEN and PPL), while having less effect on woody samples (EGR and EGS, Figure 3a and c). Starch concentration differences among extraction and quantification methods in woody samples were similar to those for foliar samples (Figure 3b, d and h). Colorimetric quantifica-tion (Spec. 490 and Spec. 620) of starch and soluble sugars almost always produced higher estimates for soluble sugars, starch and total NSC than did the HPLC or enzymatic methods ( Figure 3f–i).
Objective 3: single laboratory tests of soluble sugar extraction methods, microwaving and particle size
Soluble sugar extraction methods influenced sugar estimates when samples were quantified in the same laboratory using the same method. Estimates of total soluble sugars were affected by extraction methods for all samples (P < 0.05) except EGL (P > 0.10). Differences among sugar extraction methods tested in the same laboratory (Figure 4) were relatively minor com-pared with differences among laboratories (Figure 1a), with the largest differences occurring for the MCW extractions at different temperatures (Figure 4).
Microwaving small samples (<5 g) of P. edulis at 800 W required 180 s to deactivate enzymes. No microwaving or 90 s of microwaving was not effective at halting the conversion of sucrose and starch to glucose + fructose. At 300 s, starch and NSC increased, suggesting conversion of non-NSC compounds to NSC (see Method S4 available as Supplementary Data at Tree Physiology Online, Figure 5). Grinding Pinus banksiana tissues to a smaller particle size (<105 μm) yielded higher starch and total NSC estimates for root tissues (but not needles or stem) com-pared with extractions of larger particle size (<400 μm, Method S5, Figure S4 available as Supplementary Data at Tree Physiology Online).
Discussion
Absolute estimates of NSC are not comparable among laboratories (Objective 1)
Results demonstrate that estimates of soluble sugar, starch and total NSC provided by different laboratories in this study cannot be compared, even if they are obtained with the same general methods. Laboratories differed substantially in estimates for sugars, starch and total NSC, and the variability across laborato-ries and even within a method category was unexpectedly large. Therefore, comparing values for any NSC component across studies in the literature (e.g., Ainsworth et al. 2002, Morgan et al. 2003, Wittig et al. 2009) should not be done, either for individual studies or for meta-analyses, unless the study accounts for laboratory effects.
Comparing NSC content among laboratories 1155
Table 3. The Spearman rank correlation indicates correlations for labo-ratories between sample pairs of 0.11–0.83 (mean = 0.44) for soluble sugars, 0.41–0.91 (mean = 0.71) for starch and 0.45–0.84 (mean = 0.60) for total NSC. These results suggest starch has the most consistency among laboratory ranks for the different samples. *P < 0.05, **P < 0.01.
EGL EGR EGS PEN PPL
Soluble sugars EGL EGR 0.33 EGS 0.11 0.73** PEN 0.29 0.52** 0.41* PPL 0.83** 0.39* 0.37* 0.41*
Starch EGL EGR 0.69** EGS 0.59** 0.87** PEN 0.47* 0.83** 0.91** PPL 0.41* 0.68** 0.84** 0.81**
Total NSC EGL EGR 0.59** EGS 0.49** 0.69** PEN 0.45* 0.84** 0.64** PPL 0.49** 0.54** 0.55** 0.72**
Tree Physiology Volume 35, 2015
1156 Quentin et al.
Figure 2. Correlations of laboratory ranks among all sample pairs that show the worst and best correlations for soluble sugars, starch and total NSC. Plots show that laboratory rankings can be consistent for the different samples. Spearman rank correlations for all sample pairs are given in Table 3. Solid lines are the 1 : 1 line.
Table 4. The general linear mixed model analysis with laboratory as a random factor showed some differences for extraction and quantification methods for sugars and starch concentrations and interactions between extraction and quantification methods and sample for sugars, starch and total NSC. The interactions suggest that a method performs differently for different samples. df, degree of freedom; Num., numerator; Den., denominator.
Soluble sugars (SS) Starch Total NSC
Num. df Den. df F P-value Num. df Den. df F P-value Num. df Den. df F P-value
Sample 4 426 63.4 <0.0001 4 387 152 <0.0001 4 386 122 <0.0001SS extraction 3 28 2.1 0.123 3 25.01 9.2 0.0003 3 25.01 2.6 0.074SS quantification 3 27.95 5.6 0.004 – – – – 3 25.01 25.0 0.443Starch extraction – – – – 2 26.01 3.1 0.064 2 26.02 0.12 0.837Starch quantification – – – – 4 24 1.3 0.306 4 24.01 1.9 0.141Sample × SS extraction 12 426 11.6 <0.0001 12 387 5.1 <0.0001 12 386 11.7 <0.0001Sample × SS quantification 12 426 7.54 <0.0001 – – – – 12 386 386 <0.0001Sample × Starch extraction – – – – 8 391 4.7 <0.0001 8 390 3.5 0.0007Sample × Starch
quantification– – – – 16 383 15.0 <0.0001 16 382 10.7 <0.0001

Tree Physiology Online at http://www.treephys.oxfordjournals.org
Relative differences within a single laboratory can be consistent and meaningful (Objective 2)
The Spearman rank correlation analysis of sample pairs showed that laboratory ranks were fairly consistent among the five sam-ples for starch, but less so for soluble sugars and total NSC. These results suggest that relative differences among treatments and species within a laboratory can be meaningful. While we did not explicitly test how laboratories would perform using the same substrate with two different NSC concentrations, preserv-ing laboratory rank across such a diverse sample cohort was a significant finding in this experiment. Therefore, an assessment
of relative responses of different treatments to a control may be robust, especially for starch, and meaningful within and between studies.
Method differences explained only some of the variability among laboratories, but meeting Objective 1 compromised our ability to identify these differences (Objective 3)
Differences among methods, as captured by our extraction and quantification group approaches, were generally small relative to the differences among laboratories. However, fulfilling our
Comparing NSC content among laboratories 1157
Figure 3. Differences in LSM for all samples and for individual samples (EGL, PEN, PPL, EGR, EGS) for the extraction and quantification methods for soluble sugars, starch and total NSC show that method category generally had little effect on NSC difference, perhaps because of high within-method variance. Error bars are standard errors for the LSM. Total soluble sugars results are grouped by sugar extraction (a) and quantification (f) method. Starch results are grouped by sugar (b) and starch (d) extraction method and starch quantification method (h). Total NSC results are grouped by sugar (c) and starch (e) extraction methods, and for sugar (g) and starch (i) quantification methods. Significant differences (*) among methods within each tissue were assessed with Tukey–Kramer test (α = 0.05).

Tree Physiology Volume 35, 2015
primary objective (to identify whether NSC estimates could be compared among laboratories) compromised the ability to iden-tify differences between methods. We can interpret these results to mean that: (i) real differences among methods would exist, and variation among laboratories would be minimized if the laboratories using the same method followed the same proto-cols exactly for extraction and quantification; or (ii) NSC quanti-fication is such a highly variable and sensitive procedure that even minor differences among laboratories’ procedures not cap-tured in an explicit protocol would cause variation among labo-ratories using the same method. We suspect that both explanations play a role in the low ability of ‘methods’ to explain laboratory differences.
Variation in protocols within a method category may have contributed to the lack of significant differences among meth-ods. For example, the number, temperature and duration of extractions and the method of starch gelatinization (Table 2, Tables S1 and S2 available as Supplementary Data at Tree Physiology Online) are known to affect soluble sugar and starch estimates ( Yemm and Willis 1954, MacRae et al. 1974, Rose et al. 1991, Johansen et al. 1996, Shi et al. 2002, Gomez et al. 2003, Kim et al. 2003). We were surprised at the variability among laboratories in these factors, and even laboratories using the same ‘method’ differed in these important factors. Variability of method application within a method category yielded little or no replication for these factors, and limited the evaluation to broad method categories. As an example of how these factors might contribute to differences among laboratories, yet not appear in our methods analysis, we found that higher tempera-ture increased sugar concentration for MCW extracts in two of the four samples (Figure 4).
The lack of differences among soluble sugar extraction method categories (P = 0.12, Table 4), coupled with the small differences between different methods within a single laboratory (Figure 4), suggests that variation in the application of extrac-tion methods across laboratories was larger than the effect of the extraction solvent. However, despite laboratory differences in protocol, we could still detect an effect of soluble sugar quan-tification methods on sugar estimates (Figure 3, P = 0.004). These differences may result from the fact that different methods quantify different sugars. This result suggests that systematic differences in quantification, especially between colorimetric and HPLC-based methods, might be interpreted and possibly corrected.
1158 Quentin et al.
Figure 4. Means and standard errors for soluble sugars by extraction method for samples processed in one laboratory and using the same quantification method. Results show that extraction method can affect estimates especially for PEN and PPL samples. In all samples MCW-based methods produced consistently lower estimates than alcohol-based methods. Different letters indicate significant difference at α = 0.05 according to F-protected LSD test.
Figure 5. Effect of microwaving samples <5 g at 800 W on amount of glucose + fructose (Gluc + Fruc), sucrose (Suc), starch and total NSC for foliar (a) and twig (b) samples of P. edulis. See Method S4 available as Supplementary Data at Tree Physiology Online for details on the method. At 0 and 90 s microwaving time, sucrose hydrolyzing and starch deb-ranching enzymes are still active, leading to lower sucrose levels, higher glucose + fructose levels and higher starch levels because debranching enzymes make starch more accessible to the enzymatic assay. At 180 s and above, enzymes are deactivated, yielding consistent sucrose and glucose + fructose. At 300 s, starch starts to gelatinize, again making it more accessible to the assay. Orthogonal contrasts for trend with micro-waving time: glucose + fructose, quadratic for leaf and twig, P < 0.05; sucrose, linear for leaf and twig, P < 0.001; starch, quadratic for leaf and twig, P < 0.01; total NSC, quadratic for leaf and twig, P < 0.01.
Tree Physiology Online at http://www.treephys.oxfordjournals.org
We also did not assess the effect of other factors such as air temperature, level of expertise of the person conducting the analyses or quality of the laboratory equipment. Such factors might contribute to the variability among laboratories, even for those using the same general method, but they have not been assessed.
Method effects differ by sample (Objective 3)
Non-structural carbohydrate components exist within a complex and varied chemical matrix and need to be extracted from this matrix for analysis. Procedures to extract NSC from the matrix can free the target compound, but also convert other compounds into the target. Maximizing the extraction while minimizing the conversion is the goal of procedures, but may not always occur ( Hansen and Møller 1975, Thompson and Ellison 2005, Santiago da Silva et al. 2012, Huang and Fu 2013). In our study, soluble sugar estimates for Eucalyptus and Prunus leaves differ with the sugar quantification method (colorimetric meth-ods generate higher estimates than do HPLC or enzymatic meth-ods, Figure 3; see Note S1 available as Supplementary Data at
Tree Physiology Online). Clearing interfering compounds from the solvent might minimize these effects ( Thompson and Ellison 2005), as would avoiding acid use during sugar extraction ( Chow and Landhäusser 2004). The significant interactions between sample type and methods also suggest that different extraction and quantification protocols will give different results for NSC in samples with different matrices.
How can we make quantitative, comparable estimates of the true value of NSC components?
Determination of the role and regulation of NSC is governed by what we can measure ( Dietze et al. 2014). Our study demon-strates that laboratories and methods produce widely different and non-comparable estimates and progress in plant science will be limited until this problem is resolved, although relative differ-ences in NSC have been and will continue to be important for many questions. Being able to compare between and within studies and knowing the true value are essential for a mechanis-tic understanding of NSC pools and fluxes ( Ryan 2011), espe-cially for questions about the role of NSC in ecosystem
Comparing NSC content among laboratories 1159
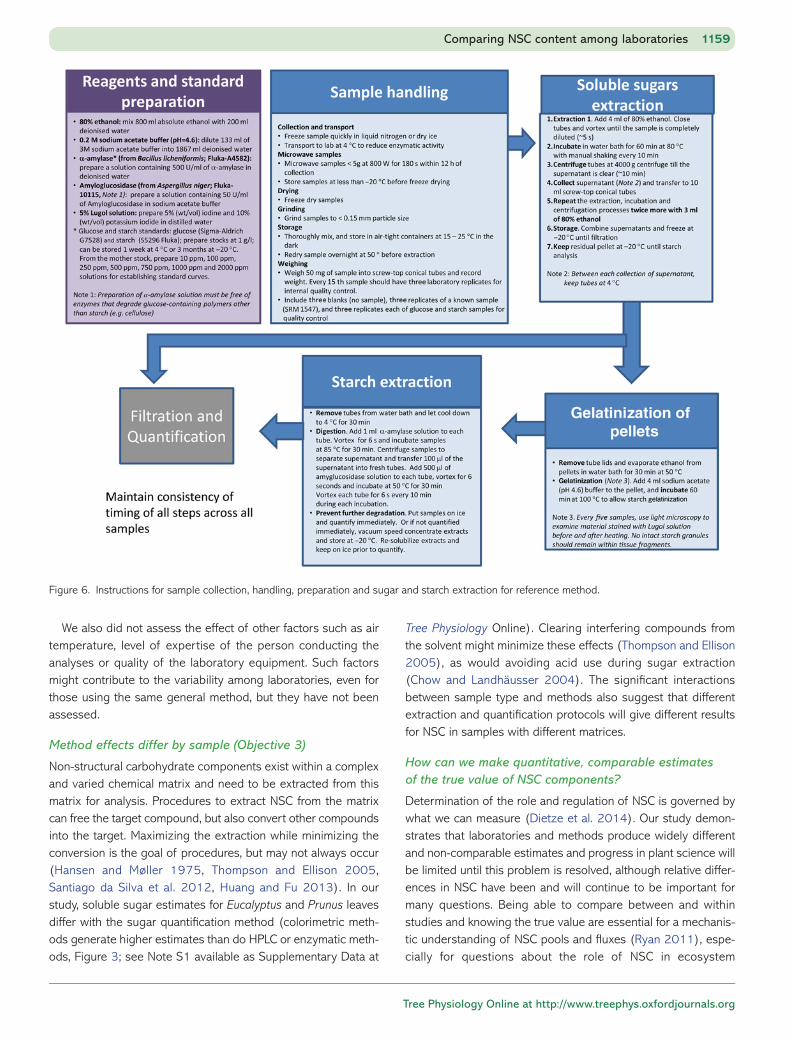
Figure 6. Instructions for sample collection, handling, preparation and sugar and starch extraction for reference method.

Tree Physiology Volume 35, 2015
productivity, stress responses and plant adaptations. Relative differences within and across studies are valuable for testing many hypotheses, and this study shows that these have values, particularly for starch.
Comparability might be solved using two approaches: either adopt a standard method and report values for certified refer-ence material (CRM) or embrace a central laboratory for all pro-cessing. A standard method would require a detailed and easily applied protocol, from sample collection to quantification, so that any laboratory can reproduce values for the CRM. Another solu-tion to the comparability problem would be to establish and adopt a central laboratory for all NSC analyses, similar to the calibration laboratories of the Global Atmosphere Watch pro-gram (http://www.wmo.int/pages/prog/arep/gaw/qassurance.html) or the US National Atmospheric Deposition Program (http://nadp.sws.uiuc.edu). A central laboratory could use differ-ent methods for samples of different characteristics and still maintain comparability among samples. Both approaches can be criticized for the lack of flexibility and freedom they impose on the scientific community, and raise the practical issue of what to do with the existing costly analytical equipment. Adopting a standard method for NSC determination in plants would likely be more practical than establishing a central facility, but would impose an investment for laboratories to comply with the selected standard. Adoption of either approach would depend on the cooperation of the science community.
Our results provide some insights into which methods might give the most homogenous results (i.e., those less affected by random error). High performance liquid chromatography was the quantification method with the least variable results, whereas colorimetric assays exhibited more variability (Figure 1, Figure S1 available as Supplementary Data at Tree Physiology Online). High performance liquid chromatography methods (including HPAEC-PAD and 1H-NMR) are increasingly chosen by laborato-ries because of (i) their high resolution, even with a small amount of sample and (ii) reproducibility due to a close control of parameters affecting the efficiency of separation and quanti-fication ( Giannoccaro et al. 2008, Raessler et al. 2010). How-ever, the HPLC process is time-consuming, laborious and expensive—especially for carbon balance studies where only the total amount of glucose equivalents may be of interest. In addi-tion, HPLC still relies on sugar and starch extractions that vary substantially with solvent and other method details.
Colorimetric methods are less expensive than other tech-niques, rapid and can detect all types of sugars, and therefore are still widely used; nevertheless, they have major drawbacks, including: (i) the necessity to prepare a calibration curve using a series of standards because different carbohydrates give differ-ent absorbance responses (see Dubois et al. 1956, Hall 2013); (ii) the use of toxic and dangerous chemicals; and (iii) possible interference of metabolites with the concentrated sulfuric acid ( Ashwell 1957).
The enzymatic method also produced relatively consistent results and allowed for the measurement of individual sugars. This method requires expertise for timing of enzyme additions, checking for cross contamination (converting non-targeted oli-gosaccharides) and maintenance of a precise pH for NADPH. In this study, three laboratories using the enzymatic method reported negative results for sucrose (Figure 1; Table S1 avail-able as Supplementary Data at Tree Physiology Online). Negative results are not normally reported and are usually assumed to be zero, but indicate that something went wrong in the assay. This might be caused by inappropriate extraction (hydrolyzing sucrose into glucose and fructose) or too low pH (leading to NADPH degradation following the addition of invertase, the enzyme enabling the quantification of sucrose). To solve these issues, cross- validation with HPLC or NMR should be performed each time a new sample type is analyzed.
Best practice in other plant chemical analyses generally use CRMs to ensure comparability of results (e.g., Quevauviller et al. 1994, Clement et al. 1996, Saunders et al. 2004). Unfor-tunately, CRM for carbohydrates do not currently exist. Many laboratories use pure sugar and/or starch standards (n = 15 in our study) to define recovery of known concentrations of spe-cific sugars. However, these standards do not account for the effect of plant matrix which may generate incomplete carbohy-drate extraction or yield compounds that interfere with quantifi-cation ( Emons et al. 2004). A CRM is accompanied by a certificate, which specifies property values of the material: before the certificate is delivered, a procedure establishes material traceability to an accurate realization of the unit, and for which each certified value is accompanied by an uncertainty at a stated level of confidence ( Emons et al. 2004). Certified reference materials are a key element of analytical data quality assurance and are used for four main purposes: (i) instrument calibration; (ii) method validation, in particular for assessment of the reliability of a method; (iii) ensuring the traceability of measurement results; and (iv) statistical quality control ( Emons et al. 2004). Certified reference material for NSC will likely require several samples with different matrices, sugar and starch concentrations. Integration of CRMs into NSC analysis should be standard practice to improve comparability among laboratories.
In addition to the difficulty of quantitatively assessing soluble sugars and starch, studies assessing NSC may miss important components that could represent a substantial fraction of NSC. Most studies assessing NSC have focused on analyzing the three ‘major’ sugars (sucrose, glucose, fructose) and starch, and assume that this pool represents the NSC available to the plant—a reasonable assumption for most trees ( Hoch et al. 2003, Hoch and Körner 2005). A few studies suggest that we should some-times look deeper. For example, sorbitol is found in high concen-trations in PPL ( Zhang et al. 2013) and quercitol in droughted Eucalyptus astringens leaves ( Arndt et al. 2008), and raffinose
1160 Quentin et al.

Tree Physiology Online at http://www.treephys.oxfordjournals.org
concentration was greater than that of starch in birch buds ( Ruuhola et al. 2011).
Conclusions and recommendations for the future
We conclude that absolute values of NSC, total soluble sugars, starch and individual sugars cannot be directly compared among laboratories, even among laboratories that use a method in the same method category. Differences relative to a control may have value with a single laboratory and for comparisons among laboratories for starch, but less so for total NSC and for soluble sugars. Differences in absolute values among laboratories were poorly related to our broad method categories, but many factors that may contribute to different estimates could not be assessed in our analyses.
Our study shows that developing methods to produce reliable, absolute and comparable estimates of NSC and its components in plant tissue will be a serious challenge because of high vari-ability in methods currently in use, lack of absolute standards and little information about the causes of the high variation in estimates among laboratories. Our team discussed the benefits and pitfalls of proposing a standard method for sample collec-tion, storage, processing, extraction and quantification as a first step towards achieving comparability among laboratory esti-mates. Team members mostly supported the publication of a standard method (although there was less agreement about the particular method), but there were also strong arguments against such an approach. The small differences among method catego-ries and the high variability of laboratory processes within the method categories in this study suggest that adopting a stan-dard method would have a higher likelihood of producing com-parable estimates across studies. A standard method would at least insure that differences among studies are not because of methodological differences. However, neither this study nor any other of which we are aware has identified a ‘best’ method. Arguments against proposing a standard method are (i) that we do not have the data to support selecting any particular method, (ii) laboratories that change methods will lose a connection to past studies, (iii) laboratories that do not adopt the proposed standard method risk having difficulty in publishing their results, and (iv) there was disagreement over what the proposed method should be—with the largest disagreements over the sample size (50 mg samples processed in ∼10 ml vials versus 10 mg samples processed in standard 96-well plates) and sam-ple storage prior to processing (to freeze or not).
Recognizing the different viewpoints of our team members, to help the research community move towards NSC analysis that is comparable both among and within laboratories, we propose:
� A reference method for sample collection and storage, sample processing, sugar extraction, starch extraction and quantifica-tion. We use the term ‘reference method’ to identify the
method as one that can indicate comparability among labora-tory estimates, as distinct from a ‘standard method’ that might imply a ‘best’, fully vetted method. Our data showed that water extractions gave the least variability among laboratories for soluble sugar extraction (see Figure S2A available as Sup-plementary Data at Tree Physiology Online), and that the α-amylase + amyloglucosidase extractions gave the least vari-ability for starch (see Figure S3A available as Supplementary Data at Tree Physiology Online). Although water is the optimal extraction solvent for low molecular weight sugars and exhib-ited the least variability, it can also dissolve interfering hydro-philic polysaccharides and proteins. Extraction in aqueous alcohol can minimize this problem, and provide a high recov-ery of low molecular weight sugars. Standardization of alco-hol strength and the number, temperature and duration of extractions is important to minimize variability in the results (see Figure S2a available as Supplementary Data at Tree Physiology Online). Using these results, the discussion about methods in Note S2 available as Supplementary Data at Tree Physiology Online, and the results for microwave duration and intensity (Figure 5) and particle size (see Figure S4 available as Supplementary Data at Tree Physiology Online), we recom-mend the method detailed in Figure 6 be adopted as a refer-ence method. HPLC and variants showed the least variability among quantification methods because of its precision, but perhaps also because HPLC procedures incorporate filtration to remove interfering compounds. However, the reference method does not include a filtration or quantification step. We ended the reference method with extraction, because our study does not provide the data to support a recommendation for the adoption of the expensive HPLC quantification and fil-tration steps.
� That laboratories adopt the reference method for sample col-lection and storage, sample processing, sugar and starch extraction and filtration, or laboratories retain their current methods but analyze a portion of a study’s samples with the reference method for sample collection and storage, sample processing, sugar and starch extraction and filtration. Sam-ples selected for analysis with the reference method should span the range of NSC values identified using the laborato-ry’s current methods and results should be reported in publi-cations. Laboratories retaining methods different from the reference method should provide a rationale for their use and a full description of the method. Following either of these recommendations would aid both in-house procedures and comparability among studies.
� Researchers should implement standard procedures of inter-nal quality control and include a detailed description of this procedure to the method. Analytical results should evaluate and present ‘measurement uncertainty’, given by the sample replicates, starch and sugar standards and NSC values for the peach leaf standard (SRM 1547). While SRM 1547 does not
Comparing NSC content among laboratories 1161

Tree Physiology Volume 35, 2015
have certified estimates for NSC and its components, it is a widely available and standardized sample.
� Certified reference materials and laboratory inter-calibration should be developed and applied in all NSC analyses. The development of an appropriate range of CRMs will require coordination within the research community to ensure that the CRMs represent the range of tissues and matrices of interest. Once CRMs have been developed, an indication of quality control should be published with all NSC results, to aid in more effective among-laboratory comparisons.
� The research community, including ecologists and biochem-ists, should work to develop a small set of standard methods that are appropriate for particular samples and questions and test the reference method.
The problem we have highlighted here, that NSC estimates are not comparable among different laboratories, will likely limit understanding of plant response to environmental stress. While our study focused on NSC determination in woody vegetation, a similar range of methods is used in non-woody species (e.g., Campo et al. 2013, Jaikumar et al. 2014, Kagan et al. 2014, King et al. 2014), and our results are likely to be relevant to the broader plant science community. A more unified approach to NSC analysis and standardization of methods will contribute to better understanding of plant responses to environment and management.
Supplementary data
Supplementary data for this article are available at Tree Physiology Online.
Acknowledgments
A.G.Q. is grateful to members of the participating laboratories for their work and co-operation. We would like to thank Marc Vandame, Nicole Sonderegger, Laurianne Rouan, Mathieu Moreau, Alieta Eyles, Elena Lahoz, Leo Goudzwaard, Arjen van Peppel, Efrat Neuhaus, Julie Lavergne, Catherine Deborde, Britta Jahn-Humphrey, Dugald Close and Widad Al-Shawi for their help and contribution with the laboratory analyses.
Conflict of interest
None declared.
Funding
M.G.R. was funded by McMaster fellowship (1158.C). S.P. was funded by Juan de la Cierva contract (MCI project) and project ARBALMONT/786-2012 (OPAN, MAAMA, Spain). F.P. was funded by Fondecyt 11121175. Ü.N. and M.T. were funded by
the Estonian Ministry of Education and Science, grant IUT-8-3. N.G.M. and L.T.D. were funded by DOE-BER. H.D.A. was funded by LANL-LDRD. J.M.-V. was funded by the Spanish Government (CGL 2010-16376). S.H. was funded by the Montana Institute on Ecosystems’ Graduate Enhancement Award from NSF EPS-CoR Track-1 NSF-IIA-1443108. Valuable comments from Dr Mauricio Mencuccini (University of Edinburgh), Dan Binkley (Colorado State University) and two anonymous reviewers were also greatly appreciated.
References
Adams HD, Germino MJ, Breshears DD, Barron-Gafford GA, Guardiola-Claramonte M, Zou CB, Huxman TE (2013) Nonstructural leaf carbo-hydrate dynamics of Pinus edulis during drought-induced tree mortality reveal role for carbon metabolism in mortality mechanism. New Phytol 197:1142–1151.
Ainsworth EA, Rogers A (2007) The response of photosynthesis and stomatal conductance to rising [CO2]: mechanisms and environmental interactions. Plant Cell Environ 30:258–270.
Ainsworth EA, Davey PA, Bernacchi CJ et al. (2002) A meta-analysis of elevated [CO2] effects on soybean (Glycine max) physiology, growth and yield. Glob Change Biol 8:695–709.
Anderegg WRL, Anderegg LDL (2013) Hydraulic and carbohydrate changes in experimental drought-induced mortality of saplings in two conifer species. Tree Physiol 33:252–260.
Arndt SK, Livesley SJ, Merchant A, Bleby TM, Grierson PF (2008) Quer-citol and osmotic adaptation of field-grown Eucalyptus under seasonal drought stress. Plant Cell Environ 31:915–924.
Ashwell G (1957) Colorimetric analysis of sugars. Methods Enzymol 3:73–105.
Barry KM, Quentin A, Eyles A, Pinkard EA (2012) Consequences of resource limitation for recovery from repeated defoliation in Eucalyptus globulus Labilladière. Tree Physiol 32:24–35.
Bonhomme M, Rageau R, Lacointe A, Gendraud M (2005) Influences of cold deprivation during dormancy on carbohydrate contents of vege-tative and floral primordia and nearby structures of peach buds (Prunus persica L. Batch). Sci Hortic (Amsterdam) 105:223–240.
Bryant JP, Chapin FS III, Klein DR (1983) Carbon/nutrient balance of boreal plants in relation to vertebrate herbivory. Oikos 40:357–368.
Campo L, Monteagudo AB, Salleres B, Castro P, Moreno-Gonzalez J (2013) NIRS determination of non-structural carbohydrates, water soluble carbohydrates and other nutritive quality traits in whole plant maize with wide range variability. Span J Agric Res 11:463–471.
Chapin FS, Schulze E, Mooney HA (1990) The ecology and economics of storage in plants. Annu Rev Ecol Syst 21:423–447.
Cheng J, Fan P, Liang Z, Wang Y, Niu N, Li W, Li S (2009) Accumulation of end products in source leaves affects photosynthetic rate in peach via alteration of stomatal conductance and photosynthetic efficiency. J Am Soc Hortic Sci 134:667–676.
Chow PS, Landhäusser SM (2004) A method for routine measurements of total sugar and starch content in woody plant tissues. Tree Physiol 24:1129–1136.
Clement R, Keith L, Siu K (1996) Reference materials for environmental analysis. Lewis Publishers, Boca Raton, FL.
Dichio B, Xiloyannis C, Sofo A, Montanaro G (2007) Effects of post-harvest regulated deficit irrigation on carbohydrate and nitrogen par-titioning, yield quality and vegetative growth of peach trees. Plant Soil 290:127–137.
Dickman LT, McDowell NG, Sevanto S, Pangle RE, Pockman WT (2015) Carbohydrate dynamics and mortality in a piñon-juniper woodland
1162 Quentin et al.

Tree Physiology Online at http://www.treephys.oxfordjournals.org
under three future precipitation scenarios. Plant Cell Environ 38:729–739.
Dickson RE, Larson PR (1975) Incorporation of 14C-photosynthate into major chemical fractions of source and sink leaves of cottonwood. Plant Physiol 56:185–193.
Dietze MC, Sala A, Carbone MS, Czimczik CI, Mantooth JA, Richardson AD, Vargas R (2014) Nonstructural carbon in woody plants. Annu Rev Plant Biol 65:667–687.
Drake PL, Mendham DS, Ogden GN (2013) Plant carbon pools and fluxes in coppice regrowth of Eucalyptus globulus. For Ecol Manag 306:161–170.
Duan H, Amthor JS, Duursma RA, O’Grady AP, Choat B, Tissue DT (2013) Carbon dynamics of eucalypt seedlings exposed to progres-sive drought in elevated [CO2] and elevated temperature. Tree Physiol 33:779–792.
DuBois M, Gilles KA, Hamilton JK, Rebers PA, Smith F (1956) Colorimet-ric method for determination of sugars and related substances. Anal Chem 28:350–356.
El Zein R, Maillard P, Bréda N, Marchand J, Montpied P, Gérant D (2011) Seasonal changes of C and N non-structural compounds in the stem sapwood of adult sessile oak and beech trees. Tree Physiol 31:843–854.
Emons H, Linsinger TPJ, Gawlik BM (2004) Reference materials: termi-nology and use. Can’t one see the forest for the trees? Trends Analyt Chem 23:442–449.
Escobar-Gutiérrez A, Moing A, Gaudillère J-P (1997) Time course of carbohydrates concentration in mature leaves of peach seedlings [Prunus persica (L.) Batsch] during the night. ISHS Acta Horticulturae 465: IV International Peach Symposium, pp 337–344.
Eyles A, Pinkard EA, Mohammed C (2009a) Shifts in biomass and resource allocation patterns following defoliation in Eucalyptus globu-lus growing with varying water and nutrient supplies. Tree Physiol 29:753–764.
Eyles A, Pinkard EA, O’Grady AP, Worledge D, Warren CR (2009b) Role of corticular photosynthesis following defoliation in Eucalyptus globulus. Plant Cell Environ 32:1004–1014.
Eyles A, Pinkard EA, Davies NW, Corkrey R, Churchill K, O’Grady AP, Sands P, Mohammed C (2013) Whole-plant versus leaf-level regula-tion of photosynthetic responses after partial defoliation in Eucalyptus globulus saplings. J Exp Bot 64:1625–1636.
Fajardo A, Piper FI (2014) An experimental approach to explain the southern Andes elevational treeline. Am J Bot 101:788–795.
Fajardo A, Piper FI, Cavieres LA (2011) Distinguishing local from global climate influences in the variation of carbon status with altitude in a tree line species. Glob Ecol Biogeogr 20:307–318.
Fajardo A, Piper FI, Pfund L, Körner C, Hoch G (2012) Variation of mobile carbon reserves in trees at the alpine treeline ecotone is under environmental control. New Phytol 195:794–802.
Fajardo A, Piper FI, Hoch G (2013) Similar variation in carbon storage between deciduous and evergreen treeline species across elevational gradients. Ann Bot 112:623–631.
Galiano L, Martínez-Vilalta J, Lloret F (2011) Carbon reserves and can-opy defoliation determine the recovery of Scots pine 4 yr after a drought episode. New Phytol 190:750–759.
Gauthier PPG, Crous KY, Ayub G et al. (2014) Drought increases heat tolerance of leaf respiration in Eucalyptus globulus saplings grown under both ambient and elevated atmospheric [CO2] and temperature. J Exp Bot 65:6471–6485.
Giannoccaro E, Wang Y-J, Chen P (2008) Comparison of two HPLC sys-tems and an enzymatic method for quantification of soybean sugars. Food Chem 106:324–330.
Gomez L, Rubio E, Augé M (2002) A new procedure for extraction and measurement of soluble sugars in ligneous plants. J Sci Food Agric 82:360–369.
Gomez L, Jordan MO, Adamowicz S, Leiser H, Pagès L (2003) Du pré-lèvement au dosage: réflexions sur les problèmes posés par la mesure des glucides non structuraux chez les végétaux ligneux. Cah Agric 12:369–386.
Gordon D, Rosati A, Damiano C, Dejong T (2006) Seasonal effects of light exposure, temperature, trunk growth and plant carbohydrate sta-tus on the initiation and growth of epicormic shoots in Prunus persica. J Hortic Sci Biotechnol 81:421–428.
Graham CJ (2002) Nonstructural carbohydrate and prunasin composi-tion of peach seedlings fertilized with different nitrogen sources and aluminum. Sci Hortic (Amsterdam) 94:21–32.
Grünzweig JM, Carmel Y, Riov J, Sever N, McCreary DD, Flather CH (2008) Growth, resource storage, and adaptation to drought in Cali-fornia and eastern Mediterranean oak seedlings. Can J For Res 38:331–342.
Hall MB (2013) Efficacy of reducing sugar and phenol–sulfuric acid assays for analysis of soluble carbohydrates in feedstuffs. Anim Feed Sci Technol 185:94–100.
Handa IT, Körner C, Hättenschwiler S (2005) A test of the treeline car-bon limitation hypothesis by in situ CO2 enrichment and defoliation. Ecology 86:1288–1300.
Hansen J, Møller I (1975) Percolation of starch and soluble carbohy-drates from plant tissue for quantitative determination with anthrone. Anal Biochem 68:87–94.
Hartmann H, Ziegler W, Trumbore S (2013) Lethal drought leads to reduction in nonstructural carbohydrates in Norway spruce tree roots but not in the canopy. Funct Ecol 27:413–427.
Haukioja E, Koricheva J (2000) Tolerance to herbivory in woody vs. herbaceous plants. Evol Ecol 14:551–562.
Hoch G, Körner C (2003) The carbon charging of pines at the climatic treeline: a global comparison. Oecologia 135:10–21.
Hoch G, Körner C (2005) Growth, demography and carbon relations of Polylepis trees at the world’s highest treeline. Funct Ecol 19:941–951.
Hoch G, Popp M, Körner C (2002) Altitudinal increase of mobile carbon pools in Pinus cembra suggests sink limitation of growth at the Swiss treeline. Oikos 98:361–374.
Hoch G, Richter A, Körner C (2003) Non-structural carbon compounds in temperate forest trees. Plant Cell Environ 26:1067–1081.
Huang Y-B, Fu Y (2013) Hydrolysis of cellulose to glucose by solid acid catalysts. Green Chem 15:1095–1111.
Inglese P, Caruso T, Gugliuzza G, Pace L (2002) Crop load and rootstock influence on dry matter partitioning in trees of early and late ripening peach cultivars. J Am Soc Hortic Sci 127:825–830.
Jaikumar NS, Snapp SS, Flore JA, Loescher W (2014) Photosynthetic responses in annual rye, perennial wheat, and perennial rye subjected to modest source : sink ratio changes. Crop Sci 54:274–283.
Johansen HN, Glitsø V, Bach Knudsen KE (1996) Influence of extraction solvent and temperature on the quantitative determination of oligosac-charides from plant materials by high-performance liquid chromatog-raphy. J Agric Food Chem 44:1470–1474.
Kagan IA, Kirch BH, Thatcher CD, Teutsch CD, Pleasant RS (2014) Chro-matographic profiles of nonstructural carbohydrates contributing to the colorimetrically determined fructan, ethanol-soluble, and water-soluble carbohydrate contents of five grasses. Anim Feed Sci Technol 188:53–63.
Kim S, Kim W, Hwang IK (2003) Optimization of the extraction and purification of oligosaccharides from defatted soybean meal. Int J Food Sci Technol 38:337–342.
King JR, Conway WC, Rosen DJ, Oswald BP, Williams HM (2014) Total nonstructural carbohydrate trends in deeproot sedge (Cyperus entre-rianus). Weed Sci 62:186–192.
Kobe RK (1997) Carbohydrate allocation to storage as a basis of interspe-cific variation in sapling survivorship and growth. Oikos 80:226–233.
Körner C (2003) Carbon limitation in trees. J Ecol 91:4–17.
Comparing NSC content among laboratories 1163
Tree Physiology Volume 35, 2015
Kozlowski TT (1992) Carbohydrate sources and sinks in woody plants. Bot Rev 58:107–222.
Landhäusser SM, Lieffers VJ (2003) Seasonal changes in carbohydrate reserves in mature northern Populus tremuloides clones. Trees 17:471–476.
Leite G, Bonhomme M, Lacointe A, Rageau R, Sakr S, Guilliot A, Maurel K, Pétel G, Couto-Rodriguez A (2004) Influence of lack of chilling on bud-break patterns and evolution of sugar contents in buds and stem tissues along the one-year-old shoot of the peach trees. VII Interna-tional Symposium on Temperate Zone Fruits in the Tropics and Sub-tropics. Acta Hortic 662:61–71.
Li M-H, Xiao W-F, Wang S-G, Cheng G-W, Cherubini P, Cai X-H, Liu X-L, Wang X-D, Zhu W-Z (2008) Mobile carbohydrates in Himalayan treeline trees I. Evidence for carbon gain limitation but not for growth limitation. Tree Physiol 28:1287–1296.
Li WD, Duan W, Fan PG, Yan ST, Li SH (2007) Photosynthesis in response to sink—source activity and in relation to end products and activities of metabolic enzymes in peach trees. Tree Physiol 27:1307–1318.
Loomis W (1932) Growth-differentiation balance vs. carbohydrate-nitro-gen ratio. Proc Am Soc Hortic Sci 29:240–245.
Lusk CH, Piper FI (2007) Seedling size influences relationships of shade tolerance with carbohydrate-storage patterns in a temperate rainfor-est. Funct Ecol 21:78–86.
MacRae JC, Smith D, McCready RM (1974) Starch estimation in leaf tissue—a comparison of results using six methods. J Sci Food Agric 25:1465–1469.
Matuszewski BK, Constanzer ML, Chavez-Eng CM (2003) Strategies for the assessment of matrix effect in quantitative bioanalytical methods based on HPLC-MS/MS. Anal Chem 75:3019–3030.
McDowell N, Pockman WT, Allen CD et al. (2008) Mechanisms of plant survival and mortality during drought: why do some plants survive while others succumb to drought? New Phytol 178:719–739.
Merchant A, Peuke AD, Keitel C, Macfarlane C, Warren CR, Adams MA (2010) Phloem sap and leaf δ13C, carbohydrates, and amino acid concentrations in Eucalyptus globulus change systematically according to flooding and water deficit treatment. J Exp Bot 61:1785–1793.
Mitchell PJ, O’Grady AP, Tissue DT, White DA, Ottenschlaeger ML, Pinkard EA (2013) Drought response strategies define the relative contribu-tions of hydraulic dysfunction and carbohydrate depletion during tree mortality. New Phytol 197:862–872.
Mitchell PJ, O’Grady AP, Tissue DT, Worledge D, Pinkard EA (2014) Co-ordination of growth, gas exchange and hydraulics define the car-bon safety margin in tree species with contrasting drought strategies. Tree Physiol 34:443–458.
Moing A, Carbonne F, Rashad MH, Gaudillère J-P (1992) Carbon fluxes in mature peach leaves. Plant Physiol 100:1878–1884.
Mooney HA (1972) The carbon balance of plants. Annu Rev Ecol Syst 3:315–346.
Morgan PB, Ainsworth EA, Long SP (2003) How does elevated ozone impact soybean? A meta-analysis of photosynthesis, growth and yield. Plant Cell Environ 26:1317–1328.
Muller B, Pantin F, Génard M, Turc O, Freixes S, Piques M, Gibon Y (2011) Water deficits uncouple growth from photosynthesis, increase C content, and modify the relationships between C and growth in sink organs. J Exp Bot 62:1715–1729.
Nakagawa S, Schielzeth H (2013) A general and simple method for obtaining R2 from generalized linear mixed-effects models. Methods Ecol Evol 4:133–142.
Nii N (1997) Changes of starch and sorbitol in leaves before and after removal of fruits from peach trees. Ann Bot 79:139–144.
O’Brien MJ, Leuzinger S, Philipson CD, Tay J, Hector A (2014) Drought survival of tropical tree seedlings enhanced by non-structural carbohy-drate levels. Nat Clim Change 4:710–714.
O’Grady AP, Eyles A, Worledge D, Battaglia M (2010) Seasonal patterns of foliage respiration in dominant and suppressed Eucalyptus globulus canopies. Tree Physiol 30:957–968.
Palacio S, Hoch G, Sala A, Körner C, Millard P (2014) Does carbon stor-age limit tree growth? New Phytol 201:1096–1100.
Pinkard EA, Eyles A, O’Grady AP (2011) Are gas exchange responses to resource limitation and defoliation linked to source : sink relation-ships? Plant Cell Environ 34:1652–1665.
Piper FI (2011) Drought induces opposite changes in the concentration of non-structural carbohydrates of two evergreen Nothofagus species of differential drought resistance. Ann For Sci 68:415–424.
Piper FI, Fajardo A (2011) No evidence of carbon limitation with tree age and height in Nothofagus pumilio under Mediterranean and tem-perate climate conditions. Ann Bot 108:907–917.
Piper FI, Fajardo A (2014) Foliar habit, tolerance to defoliation and their link to carbon and nitrogen storage. J Ecol 102:1101–1111.
Quentin AG, Pinkard EA, Beadle CL, Wardlaw TJ, O’Grady AP, Paterson S, Mohammed CL (2010) Do artificial and natural defoliation have simi-lar effects on physiology of Eucalyptus globulus Labill. seedlings? Ann For Sci 67:203. doi:10.1051/forest/2009096
Quentin AG, Beadle CL, O’Grady AP, Pinkard EA (2011) Effects of partial defoliation on closed canopy Eucalyptus globulus Labilladière: growth, biomass allocation and carbohydrates. For Ecol Manag 261:695–702.
Quevauviller P, Astruc M, Ebdon L, Desauziers V, Sarradin PM, Astruc A, Kramer GN, Griepink B (1994) Certified reference material (CRM 462) for the quality control of dibutyl- and tributyl-tin determinations in coastal sediment. Appl Organomet Chem 8:629–637.
Raessler M, Wissuwa B, Breul A, Unger W, Grimm T (2010) Chromato-graphic analysis of major non-structural carbohydrates in several wood species—an analytical approach for higher accuracy of data. Anal Methods 2:532–538.
Rastall RA (1990) Methods in plant biochemistry. Volume 2. Carbohy-drates. Academic Press, London, UK.
R Development Core Team (2014) R: a language and environment for statistical computing. R Foundation for Statistical Computing, Vienna, Austria. http://www.R-project.org (26 May 2015, date last accessed).
Richardson AD, Carbone MS, Keenan TF, Czimczik CI, Hollinger DY, Murakami P, Schaberg PG, Xu X (2013) Seasonal dynamics and age of stemwood nonstructural carbohydrates in temperate forest trees. New Phytol 197:850–861.
Rose R, Rose CL, Omi SK, Forry KR, Durall DM, Bigg WL (1991) Starch determination by perchloric acid vs enzymes: evaluating the accu-racy and precision of six colorimetric methods. J Agric Food Chem 39:2–11.
Ruuhola T, Keinanen M, Keski-Saari S, Lehto T (2011) Boron nutrition affects the carbon metabolism of silver birch seedlings. Tree Physiol 31:1251–1261.
Ryan MG (2011) Tree responses to drought. Tree Physiol 31:237–239. Ryan MG, Phillips N, Bond BJ (2006) The hydraulic limitation hypothesis
revisited. Plant Cell Environ 29:367–381. Sala A, Piper F, Hoch G (2010) Physiological mechanisms of drought-
induced tree mortality are far from being resolved. New Phytol 186:274–281.
Sala A, Fouts W, Hoch G (2011) Carbon storage in trees: does relative carbon supply decrease with tree size? In: Meinzer FC, Lachenbruch B, Dawson TE (eds) Size and age-related changes in tree structure and function. Springer, Heidelberg, pp 287–306.
Sala A, Woodruff DR, Meinzer FC (2012) Carbon dynamics in trees: feast or famine? Tree Physiol 32:764–775.
Santiago da Silva CM, Habermann G, Marchi MRR, Zocolo GJ (2012) The role of matrix effects on the quantification of abscisic acid and its metabolites in the leaves of Bauhinia variegata L. using liquid chroma-tography combined with tandem mass spectrometry. Braz J Plant Physiol 24:223–232.
1164 Quentin et al.

Tree Physiology Online at http://www.treephys.oxfordjournals.org
SAS Institute (2012) Sas/Stat 12.1 User’s Guide: The Glimmix Proce-dure. SAS Publishing, pp 2916–3263.
Saunders S, Karduck P, Sloof WG (2004) Certified reference materials for micro-analysis of carbon and nitrogen. Microchimica Acta 145:209–213.
Sevanto S, McDowell NG, Dickman LT, Pangle R, Pockman WT (2014) How do trees die? A test of the hydraulic failure and carbon starvation hypotheses. Plant Cell Environ 37:153–161.
Shi J, Mazza G, le Maguer M (2002) Functional foods: biochemical and processing aspects. Vol. II. CRC Press, London, UK.
Shvaleva AL, Silva FCE, Breia E et al. (2006) Metabolic responses to water deficit in two Eucalyptus globulus clones with contrasting drought sensitivity. Tree Physiol 26:239–248.
Smeraglia J, Baldrey SF, Watson D (2002) Matrix effects and selectivity issues in LC-MS-MS. Chromatographia 55:S95–S99.
Stick RV, Williams S (2010) Carbohydrates: the essential molecules of life. Elsevier, London, UK.
Strauss SY, Agrawal AA (1999) The ecology and evolution of plant toler-ance to herbivory. Trends Ecol Evol 14:179–185.
Thompson M, Ellison SLR (2005) A review of interference effects and their correction in chemical analysis with special reference to uncer-tainty. Accred Qual Assur 10:82–97.
Tworkoski T, Glenn D, Welker W (1997) Carbohydrate and nitrogen par-titioning within one-year shoots of young peach trees grown with grass competition. HortScience 32:1174–1177.
Weibel A, Reighard G, Rajapakse N, DeJong T (2008) Dormant carbohy-drate reserves of two peach cultivars grafted on different vigor root-stocks. ISHS Acta Horticulturae 903: IX International Symposium on Integrating Canopy, Rootstock and Environmental Physiology in Orchard Systems, pp 815–820.
Wiley E, Helliker B (2012) A re-evaluation of carbon storage in trees lends greater support for carbon limitation to growth. New Phytol 195:285–289.
Wittig VE, Ainsworth EA, Naidu SL, Karnosky DF, Long SP (2009) Quan-tifying the impact of current and future tropospheric ozone on tree biomass, growth, physiology and biochemistry: a quantitative meta-analysis. Glob Change Biol 15:396–424.
Yemm EW, Willis AJ (1954) The estimation of carbohydrates in plant extracts by anthrone. Biochem J 57:508–514.
Zhang C, Shen Z, Zhang Y, Han J, Ma R, Korir NK, Yu M (2013) Cloning and expression of genes related to the sucrose-metabolizing enzymes and carbohydrate changes in peach. Acta Physiol Plant 35:589–602.
Comparing NSC content among laboratories 1165