Embed Size (px)
Citation preview
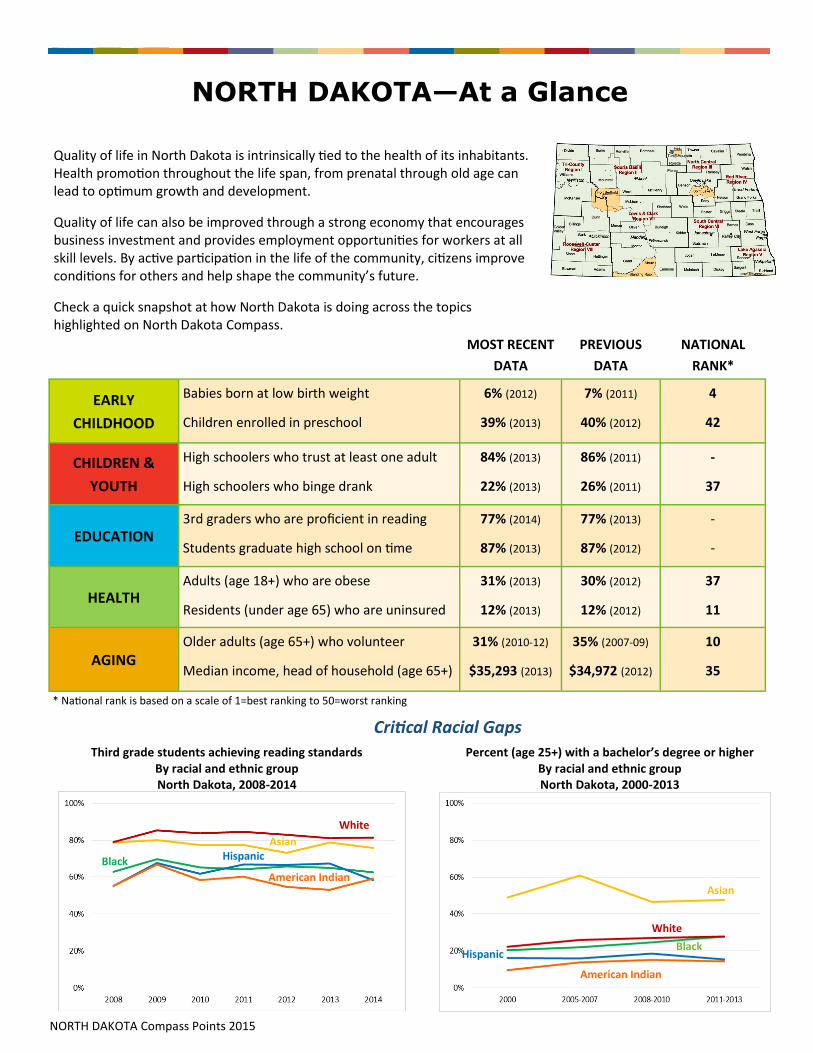
North Dakota also surpasses the U.S. job growth (38% compared to 3%, 2000-2013).
While seven counties saw a 5 percent or larger increase in the number of jobs from the first quarter in 2013 to the first quarter in 2014, 20 counties experienced a job decrease.
Reinvigorated State Population
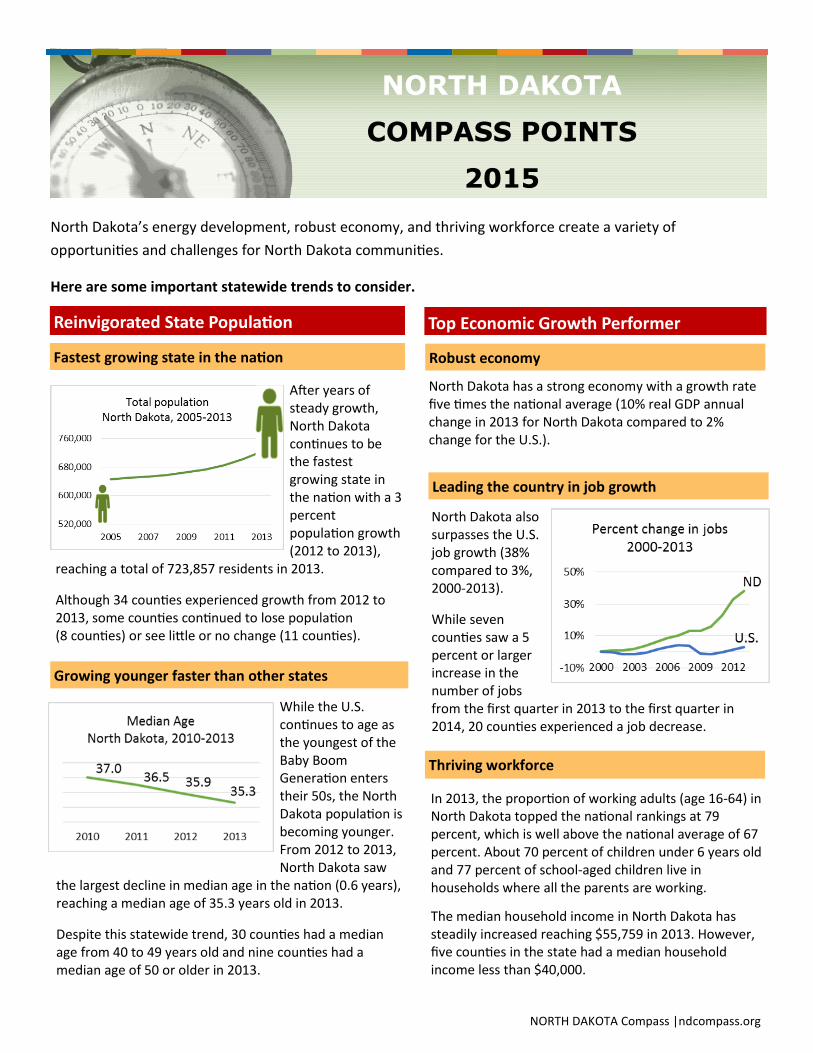
Fastest growing state in the nation
Growing younger faster than other states
Top Economic Growth Performer
Robust economy
Thriving workforce
In 2013, the proportion of working adults (age 16-64) in North Dakota topped the national rankings at 79 percent, which is well above the national average of 67 percent. About 70 percent of children under 6 years old and 77 percent of school-aged children live in households where all the parents are working.
The median household income in North Dakota has steadily increased reaching $55,759 in 2013. However, five counties in the state had a median household income less than $40,000.
NORTH DAKOTA
COMPASS POINTS
2015
NORTH DAKOTA Compass |ndcompass.org
While the U.S. continues to age as the youngest of the Baby Boom Generation enters their 50s, the North Dakota population is becoming younger. From 2012 to 2013, North Dakota saw
the largest decline in median age in the nation (0.6 years), reaching a median age of 35.3 years old in 2013.
Despite this statewide trend, 30 counties had a median age from 40 to 49 years old and nine counties had a median age of 50 or older in 2013.
North Dakota has a strong economy with a growth rate five times the national average (10% real GDP annual change in 2013 for North Dakota compared to 2% change for the U.S.).
After years of steady growth, North Dakota continues to be the fastest growing state in the nation with a 3 percent population growth (2012 to 2013),
reaching a total of 723,857 residents in 2013.
Although 34 counties experienced growth from 2012 to 2013, some counties continued to lose population (8 counties) or see little or no change (11 counties).
North Dakota’s energy development, robust economy, and thriving workforce create a variety of
opportunities and challenges for North Dakota communities.
Here are some important statewide trends to consider.
Leading the country in job growth
NORTH DAKOTA—At a Glance
MOST RECENT
DATA
PREVIOUS
DATA
NATIONAL
RANK*
EARLY
CHILDHOOD
Babies born at low birth weight
Children enrolled in preschool
6% (2012)
39% (2013)
7% (2011)
40% (2012)
4
42
CHILDREN &
YOUTH
High schoolers who trust at least one adult
High schoolers who binge drank
84% (2013)
22% (2013)
86% (2011)
26% (2011)
-
37
EDUCATION 3rd graders who are proficient in reading
Students graduate high school on time
77% (2014)
87% (2013)
77% (2013)
87% (2012)
-
-
HEALTH Adults (age 18+) who are obese
Residents (under age 65) who are uninsured
31% (2013)
12% (2013)
30% (2012)
12% (2012)
37
11
AGING Older adults (age 65+) who volunteer
Median income, head of household (age 65+)
31% (2010-12)
$35,293 (2013)
35% (2007-09)
$34,972 (2012)
10
35
Quality of life in North Dakota is intrinsically tied to the health of its inhabitants. Health promotion throughout the life span, from prenatal through old age can lead to optimum growth and development.
Quality of life can also be improved through a strong economy that encourages business investment and provides employment opportunities for workers at all skill levels. By active participation in the life of the community, citizens improve conditions for others and help shape the community’s future.
Check a quick snapshot at how North Dakota is doing across the topics highlighted on North Dakota Compass.
American Indian
Hispanic Black
Asian
White
Asian
White
Black Hispanic
American Indian
NORTH DAKOTA Compass Points 2015
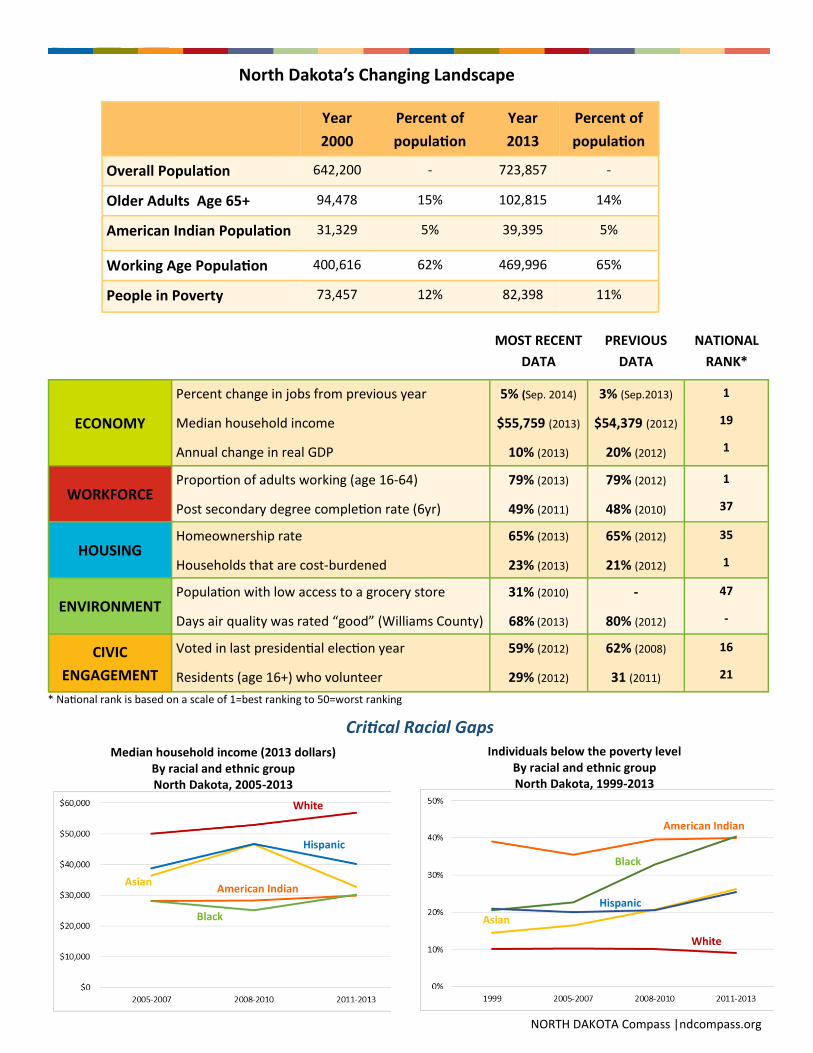
Third grade students achieving reading standards By racial and ethnic group North Dakota, 2008-2014
Percent (age 25+) with a bachelor’s degree or higher By racial and ethnic group North Dakota, 2000-2013
* National rank is based on a scale of 1=best ranking to 50=worst ranking
Critical Racial Gaps
MOST RECENT
DATA
PREVIOUS
DATA
NATIONAL
RANK*
ECONOMY
Percent change in jobs from previous year
Median household income
Annual change in real GDP
5% (Sep. 2014)
$55,759 (2013)
10% (2013)
3% (Sep.2013)
$54,379 (2012)
20% (2012)
1
19
1
WORKFORCE Proportion of adults working (age 16-64)
Post secondary degree completion rate (6yr)
79% (2013)
49% (2011)
79% (2012)
48% (2010)
1
37
HOUSING Homeownership rate
Households that are cost-burdened
65% (2013)
23% (2013)
65% (2012)
21% (2012)
35
1
ENVIRONMENT Population with low access to a grocery store
Days air quality was rated “good” (Williams County)
31% (2010)
68% (2013)
-
80% (2012)
47
-
CIVIC
ENGAGEMENT
Voted in last presidential election year
Residents (age 16+) who volunteer
59% (2012)
29% (2012)
62% (2008)
31 (2011)
16
21
Year
2000
Percent of
population
Year
2013
Percent of
population
Overall Population 642,200 - 723,857 -
Older Adults Age 65+ 94,478 15% 102,815 14%
American Indian Population 31,329 5% 39,395 5%
Working Age Population 400,616 62% 469,996 65%
People in Poverty 73,457 12% 82,398 11%
North Dakota’s Changing Landscape
NORTH DAKOTA Compass |ndcompass.org
Median household income (2013 dollars) By racial and ethnic group North Dakota, 2005-2013
Individuals below the poverty level By racial and ethnic group North Dakota, 1999-2013
* National rank is based on a scale of 1=best ranking to 50=worst ranking
Asian
Asian
White
White
Hispanic
Hispanic
American Indian
American Indian
Black
Black
Critical Racial Gaps

Although many people have access to health insurance, health concerns are still high in North Dakota. In 2013, 88 percent of residents under age 65 in North Dakota had health insurance coverage. This rate of coverage is higher than the national average of 83 percent.
However, the proportion of adults (18 years and older) who are obese continues to slightly increase each year (31% in 2013 compared to 30% in 2012 and 28% in 2011).
In North Dakota, there are large racial and income gaps along the cradle-to-career continuum. Given the increase in North Dakota’s diversity with its growing population, these disparities will increase unless they are addressed.
More notable trends
North Dakota
Compass
Located at the Center for Social Research at North Dakota State University, ND Compass was developed by The Center for Social Research in partnership with Wilder Research, MN, with funding from:
Bush Foundation Otto Bremer Foundation
All data for the 2015 North Dakota Compass Points come from North Dakota Compass, with the most recent data compiled in February 2015. Data sources, years, margins of error, and additional notes are available on ndcompass.org.
Communities benefit from high rates of homeownership, because it is a significant asset-building strategy for many individuals, in addition to an important source of stability for children and their families. In 2013, North Dakota had a homeownership rate of 65 percent, but the rate differs by metropolitan status.
Healthy and Active Communities
Cradle-To-Career Success
Stay Connected!
Join our Newsletter!
Like us on Facebook
Follow us on Twitter
Visit us on Pinterest
Visit us on YouTube
NORTH DAKOTA Compass Points 2015
60%
Metro area
72%
Non-Metro area
Homeownership rate North Dakota, 2013
Concern for the health of people
Healthy communities
U.S.
ND


![Vademecum [Remer]](https://img.pdfslide.net/doc/110x75/577cc59e1a28aba7119cddba/vademecum-remer.jpg)