Embed Size (px)
Citation preview

DEPARTMENT OF PRIMARY INDUSTRY AND RESOURCES
Northern Territory Pastoral Feed OutlookMarch 2018The purpose of this quarterly outlook is to summarise information relevant to the pastoral industry such as current feed supplies, seasonal conditions, the development of drought conditions in central Australia and fire risk.
You can see the entire document and all districts by continuing to scroll through this file. If you are interested in selected sections, you can click on the links below.
Summary of current situation & trends - all districts
Northern Territory Seasonal Outlook – as at March 2018
Individual District Summaries:
Darwin District
Katherine District
Victoria River District
Sturt Plateau District
Roper District
Gulf District
Barkly District
Tennant Creek District
Northern Alice Springs District
Plenty District
Southern Alice Springs District

NT Pastoral Feed Outlook – March 2018
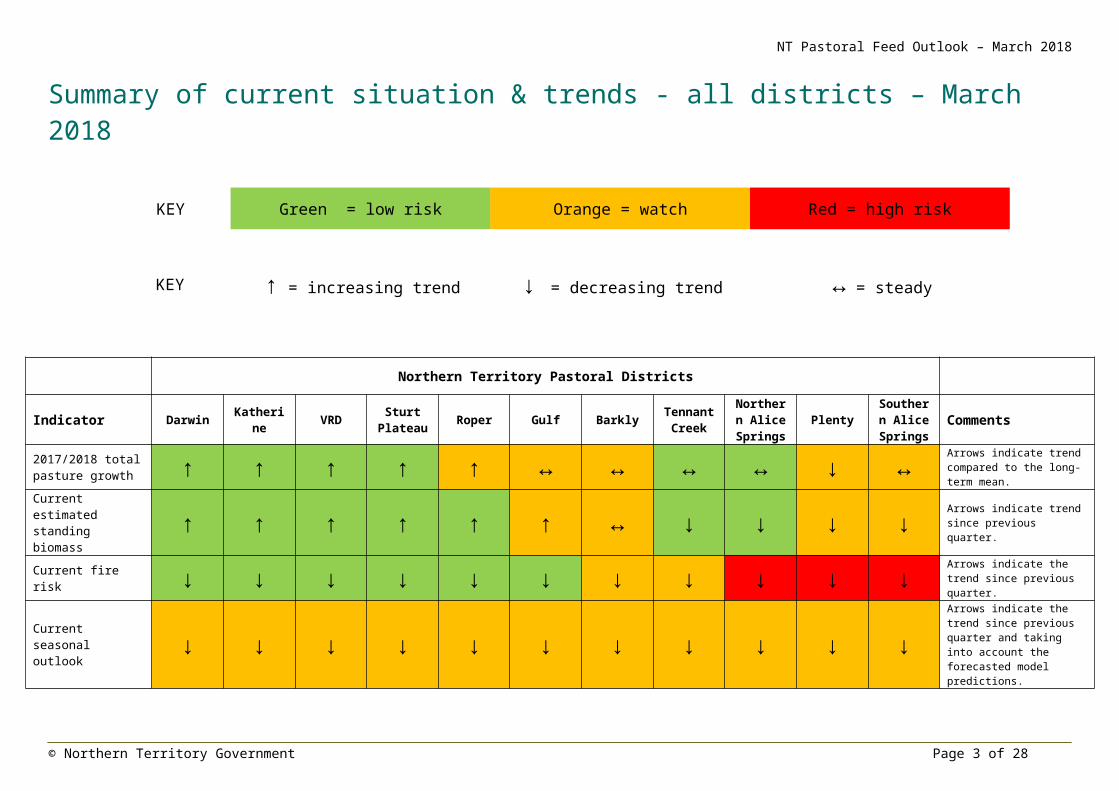
Summary of current situation & trends - all districts – March 2018
KEY Green = low risk Orange = watch Red = high risk
KEY ↑ = increasing trend ↓ = decreasing trend ↔ = steady
Northern Territory Pastoral Districts
Indicator Darwin Katherine VRD Sturt
Plateau Roper Gulf Barkly Tennant Creek
Northern Alice Springs
PlentySouthern Alice Springs
Comments
2017/2018 total pasture growth ↑ ↑ ↑ ↑ ↑ ↔ ↔ ↔ ↔ ↓ ↔ Arrows indicate trend
compared to the long-term mean.
Current estimated standing biomass ↑ ↑ ↑ ↑ ↑ ↑ ↔ ↓ ↓ ↓ ↓ Arrows indicate trend
since previous quarter.
Current fire risk ↓ ↓ ↓ ↓ ↓ ↓ ↓ ↓ ↓ ↓ ↓ Arrows indicate the trend since previous quarter.
Current seasonal outlook ↓ ↓ ↓ ↓ ↓ ↓ ↓ ↓ ↓ ↓ ↓
Arrows indicate the trend since previous quarter and taking into account the forecasted model predictions.
For further information about this Outlook, please contact Chris Materne on 08 8951 8135 or Dionne Walsh on 08 8999 2178
© Northern Territory Government Page 2 of 16
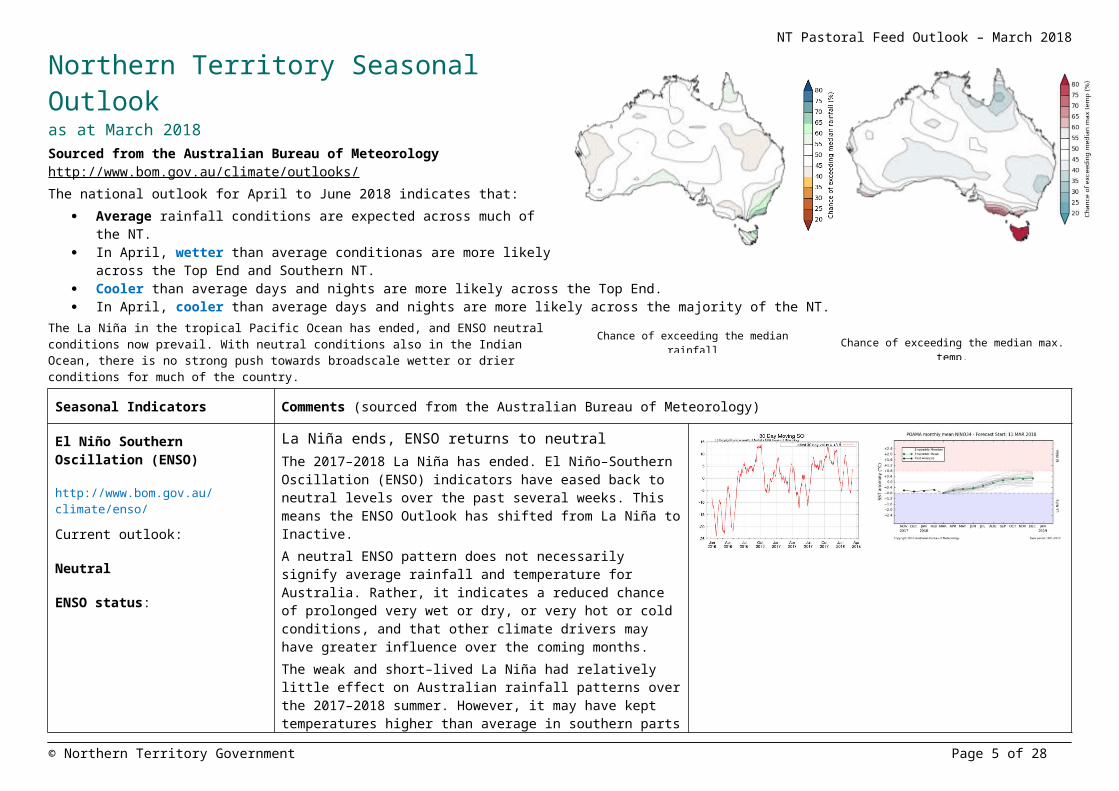
NT Pastoral Feed Outlook – March 2018Northern Territory Seasonal Outlookas at March 2018Sourced from the Australian Bureau of Meteorologyhttp://www.bom.gov.au/climate/outlooks/The national outlook for April to June 2018 indicates that:
Average rainfall conditions are expected across much of the NT. In April, wetter than average conditionas are more likely across the
Top End and Southern NT. Cooler than average days and nights are more likely across the Top
End. In April, cooler than average days and nights are more likely across
the majority of the NT.The La Niña in the tropical Pacific Ocean has ended, and ENSO neutral conditions now prevail. With neutral conditions also in the Indian Ocean, there is no strong push towards broadscale wetter or drier conditions for much of the country.
Seasonal Indicators Comments (sourced from the Australian Bureau of Meteorology)
El Niño Southern Oscillation (ENSO)
http://www.bom.gov.au/climate/enso/Current outlook:
Neutral
ENSO status:
La Niña ends, ENSO returns to neutralThe 2017–2018 La Niña has ended. El Niño–Southern Oscillation (ENSO) indicators have eased back to neutral levels over the past several weeks. This means the ENSO Outlook has shifted from La Niña to Inactive.A neutral ENSO pattern does not necessarily signify average rainfall and temperature for Australia. Rather, it indicates a reduced chance of prolonged very wet or dry, or very hot or cold conditions, and that other climate drivers may have greater influence over the coming months.The weak and short–lived La Niña had relatively little effect on Australian rainfall patterns over the 2017–2018 summer. However, it may have kept temperatures higher than average in southern parts of the country due to weather patterns being slower moving, and further south than normal.
© Northern Territory Government Page 3 of 16
Chance of exceeding the median rainfallApril to June 2018 Chance of exceeding the median max. temp.
April to June 2018

NT Pastoral Feed Outlook – March 2018Indian Ocean Dipole (IOD)
http://www.bom.gov.au/climate/enso/#tabs=Indian-OceanCurrent outlook:
Neutral
IOD also neutral. All six of the climate models surveyed by the Bureau indicate that the IOD will remain neutral into the southern hemisphere winter of 2018.The influence of the IOD on Australian climate is weak during December to April. This is because the monsoon trough shifts south over the tropical Indian Ocean changing wind patterns, which prevents the IOD pattern from being able to form.
© Northern Territory Government Page 4 of 16
NT Pastoral Feed Outlook – March 2018
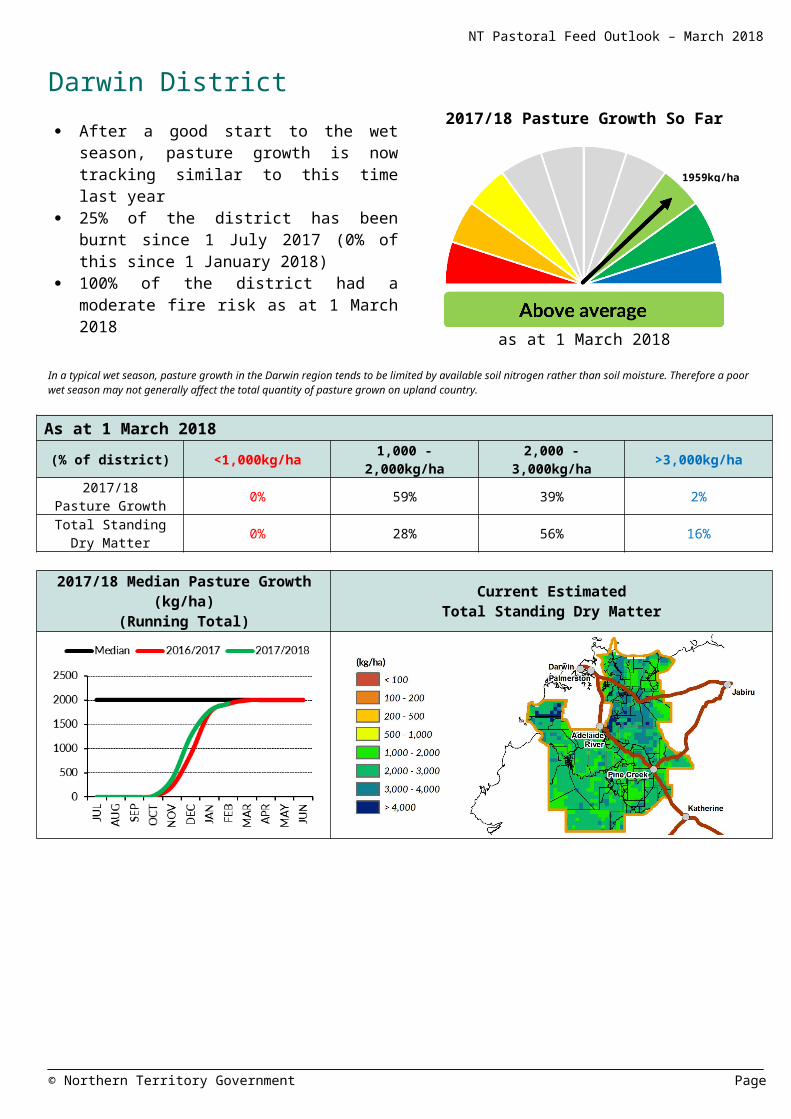
Darwin District
After a good start to the wet season, pasture growth is now tracking similar to this time last year
25% of the district has been burnt since 1 July 2017 (0% of this since 1 January 2018)
100% of the district had a moderate fire risk as at 1 March 2018
2017/18 Pasture Growth So Far
as at 1 March 2018In a typical wet season, pasture growth in the Darwin region tends to be limited by available soil nitrogen rather than soil moisture. Therefore a poor wet season may not generally affect the total quantity of pasture grown on upland country.
As at 1 March 2018(% of district) <1,000kg/ha 1,000 -
2,000kg/ha2,000 -
3,000kg/ha >3,000kg/ha2017/18
Pasture Growth 0% 59% 39% 2%Total Standing Dry
Matter 0% 28% 56% 16%
2017/18 Median Pasture Growth (kg/ha)
(Running Total)Current Estimated
Total Standing Dry Matter
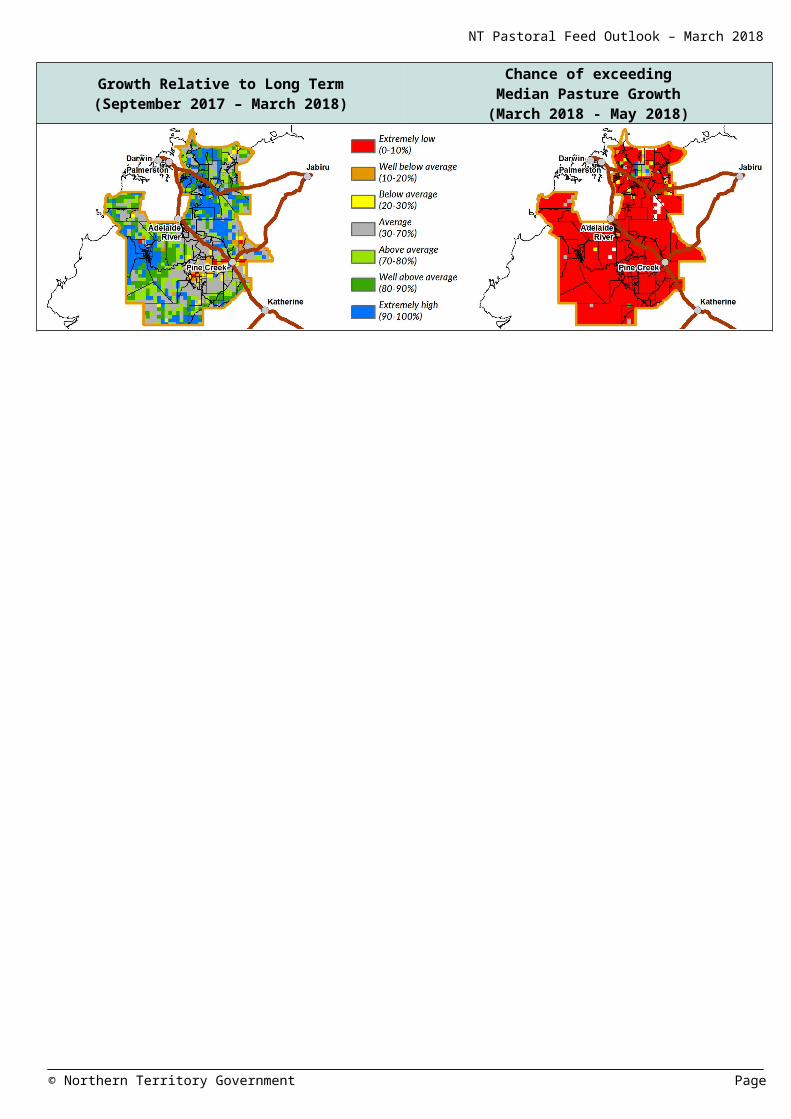
Growth Relative to Long Term(September 2017 – March 2018)
Chance of exceedingMedian Pasture Growth
(March 2018 - May 2018)
© Northern Territory Government Page
1959kg/ha

NT Pastoral Feed Outlook – March 2018
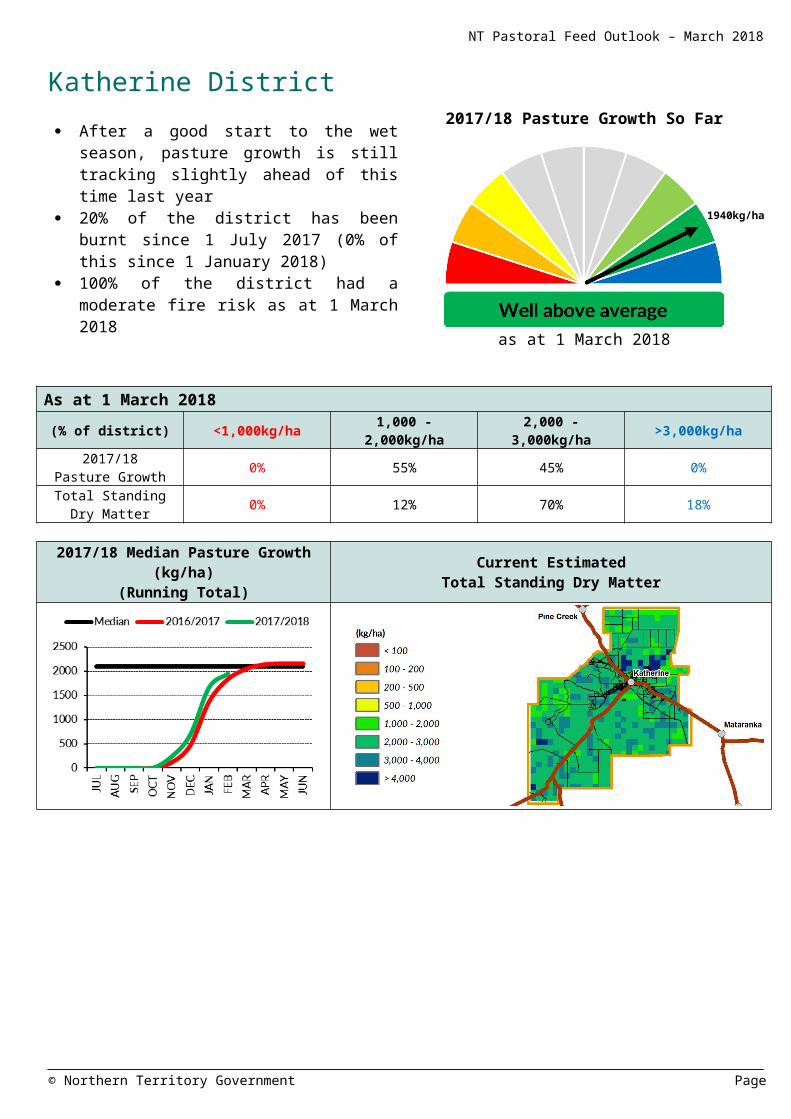
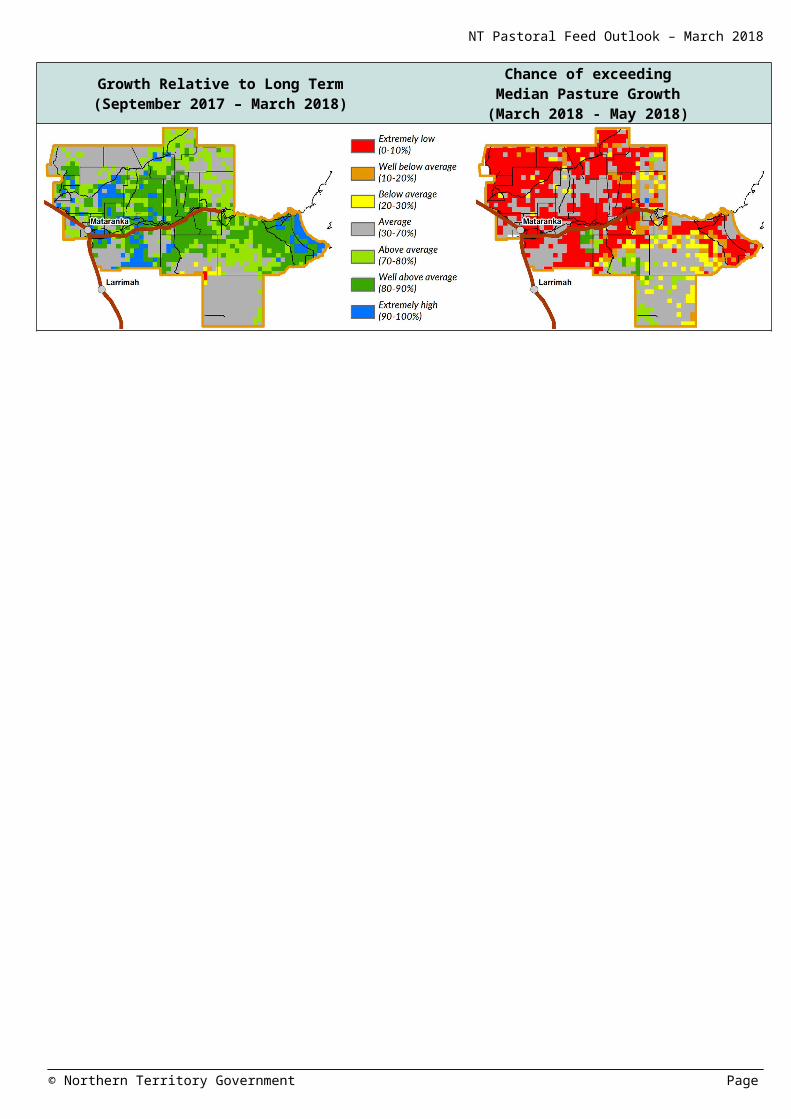
Katherine District
After a good start to the wet season, pasture growth is still tracking slightly ahead of this time last year
20% of the district has been burnt since 1 July 2017 (0% of this since 1 January 2018)
100% of the district had a moderate fire risk as at 1 March 2018
2017/18 Pasture Growth So Far
as at 1 March 2018
As at 1 March 2018(% of district) <1,000kg/ha 1,000 -
2,000kg/ha2,000 -
3,000kg/ha >3,000kg/ha2017/18
Pasture Growth 0% 55% 45% 0%Total Standing Dry
Matter 0% 12% 70% 18%
2017/18 Median Pasture Growth (kg/ha)
(Running Total)Current Estimated
Total Standing Dry Matter
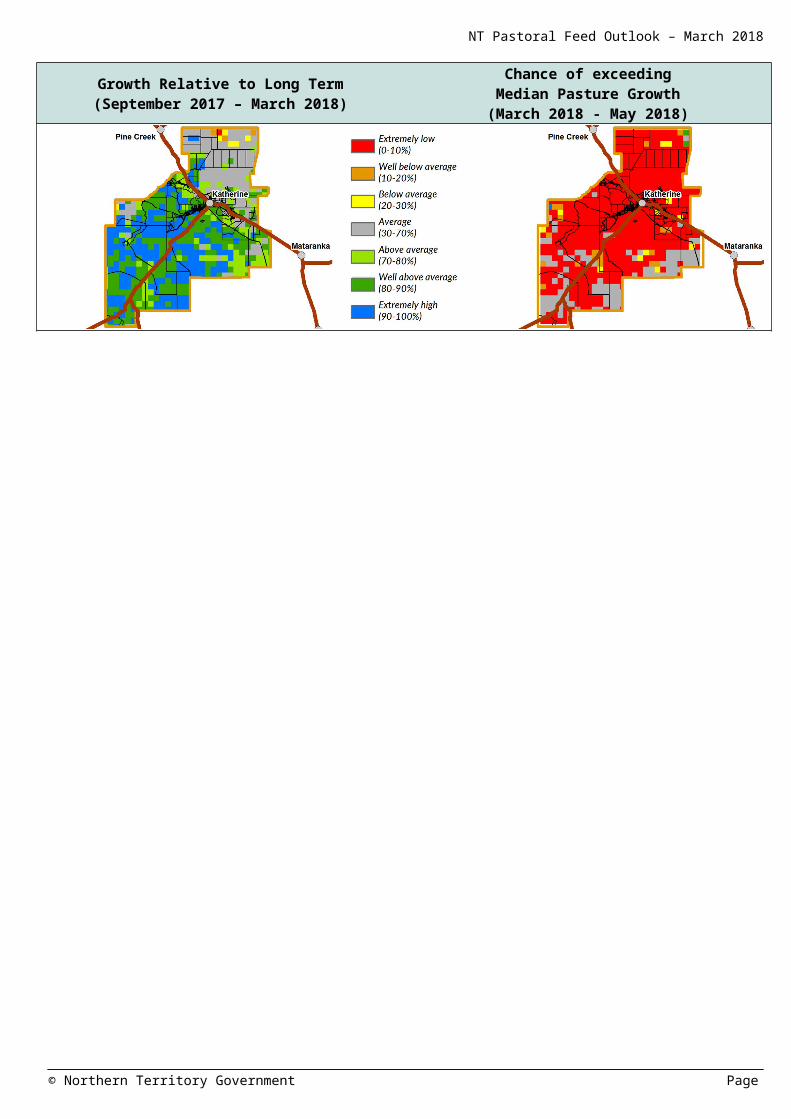
Growth Relative to Long Term(September 2017 – March 2018)
Chance of exceedingMedian Pasture Growth
(March 2018 - May 2018)
© Northern Territory Government Page
1940kg/ha
NT Pastoral Feed Outlook – March 2018
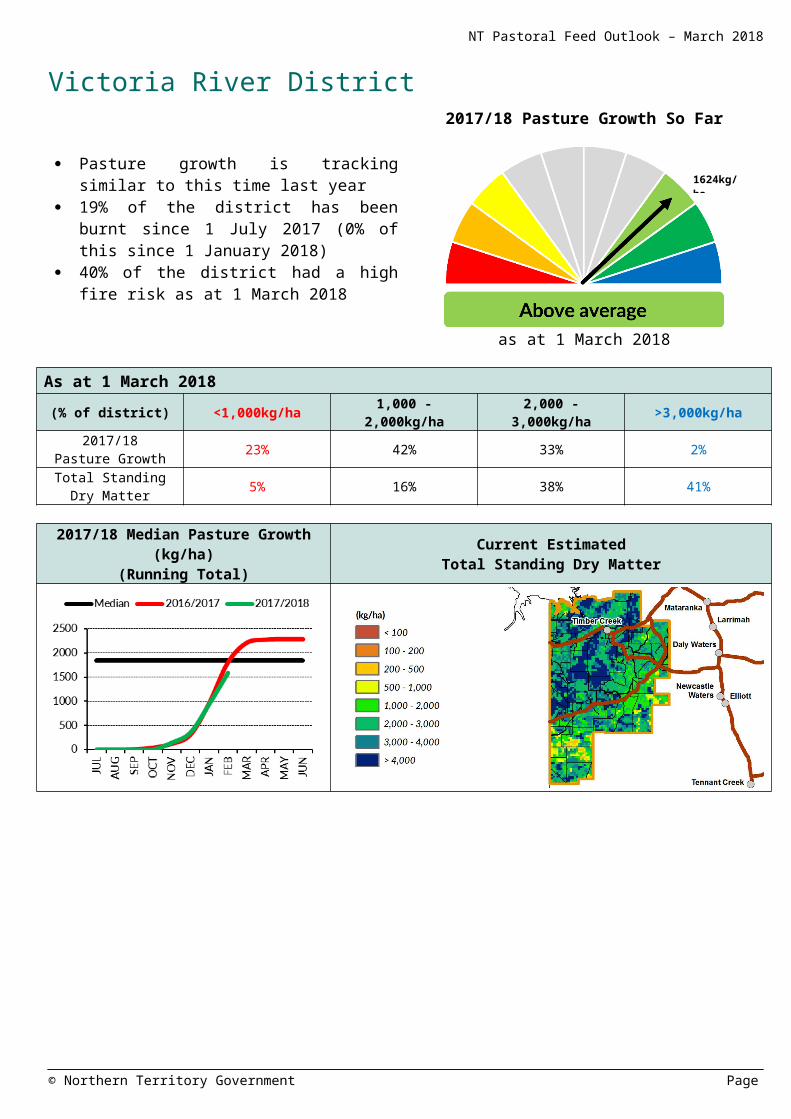
Victoria River District
Pasture growth is tracking similar to this time last year
19% of the district has been burnt since 1 July 2017 (0% of this since 1 January 2018)
40% of the district had a high fire risk as at 1 March 2018
2017/18 Pasture Growth So Far
as at 1 March 2018
As at 1 March 2018(% of district) <1,000kg/ha 1,000 -
2,000kg/ha2,000 -
3,000kg/ha >3,000kg/ha2017/18
Pasture Growth 23% 42% 33% 2%Total Standing Dry
Matter 5% 16% 38% 41%
2017/18 Median Pasture Growth (kg/ha)
(Running Total)Current Estimated
Total Standing Dry Matter
Growth Relative to Long Term(September 2017 – March 2018)
Chance of exceedingMedian Pasture Growth
(March 2018 - May 2018)
© Northern Territory Government Page
1624kg/ha
NT Pastoral Feed Outlook – March 2018
Sturt Plateau District
Pasture growth is tracking similar to this time last year
24% of the district has been burnt since 1 July 2017 (0% of this since 1 January 2018)
7% of the district had a high fire risk as at 1 March 2018
2017/18 Pasture Growth So Far
as at 1 March 2018
As at 1 March 2018(% of district) <1,000kg/ha 1,000 -
2,000kg/ha2,000 -
3,000kg/ha >3,000kg/ha2017/18
Pasture Growth 5% 50% 45% 0%Total Standing Dry
Matter 1% 18% 62% 19%
2017/18 Median Pasture Growth (kg/ha)
(Running Total)Current Estimated
Total Standing Dry Matter
2017/18 Median Pasture Growth
Growth Relative to Long Term(September 2017 – March 2018)
Chance of exceedingMedian Pasture Growth
(March 2018 - May 2018)
© Northern Territory Government Page
1848kg/ha
NT Pastoral Feed Outlook – March 2018
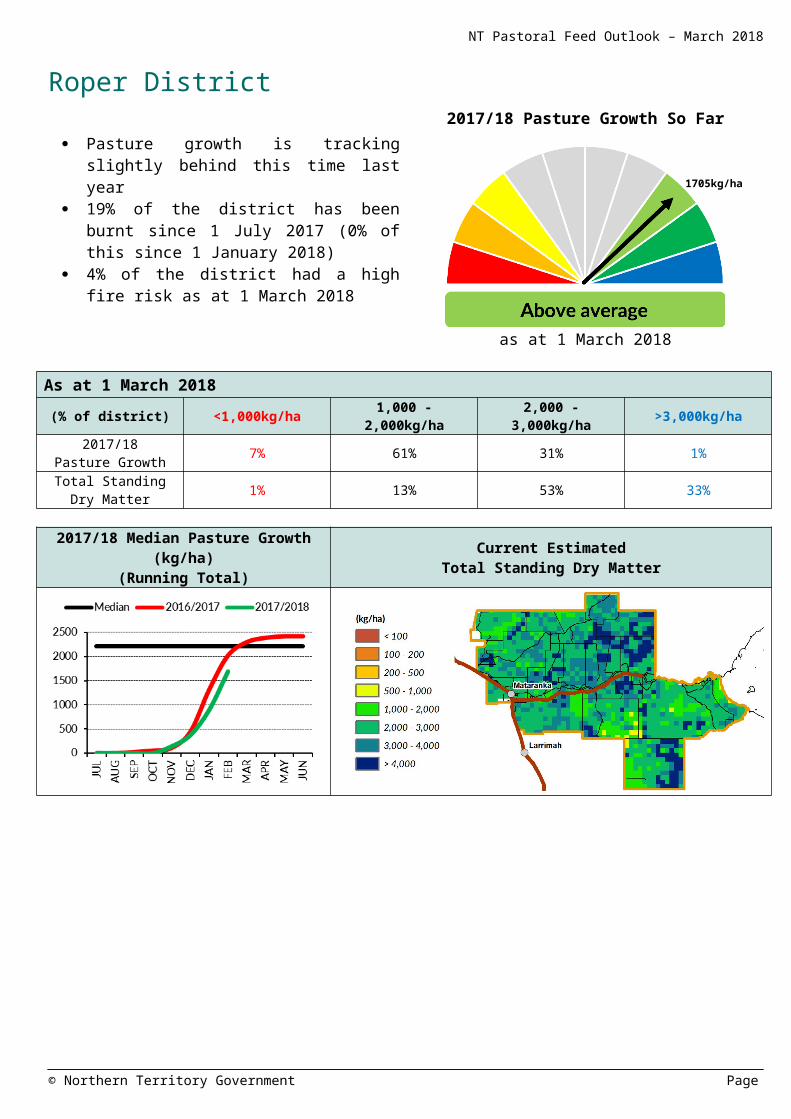
Roper District
Pasture growth is tracking slightly behind this time last year
19% of the district has been burnt since 1 July 2017 (0% of this since 1 January 2018)
4% of the district had a high fire risk as at 1 March 2018
2017/18 Pasture Growth So Far
as at 1 March 2018
As at 1 March 2018(% of district) <1,000kg/ha 1,000 -
2,000kg/ha2,000 -
3,000kg/ha >3,000kg/ha2017/18
Pasture Growth 7% 61% 31% 1%Total Standing Dry
Matter 1% 13% 53% 33%
2017/18 Median Pasture Growth (kg/ha)
(Running Total)Current Estimated
Total Standing Dry Matter
Growth Relative to Long Term(September 2017 – March 2018)
Chance of exceedingMedian Pasture Growth
(March 2018 - May 2018)
© Northern Territory Government Page
1705kg/ha
NT Pastoral Feed Outlook – March 2018
Gulf District
Pasture growth is tracking slightly behind this time last year
25% of the district has been burnt since 1 July 2017 (0% of this since 1 January 2018)
33% of the district had a high fire risk as at 1 March 2018
2017/18 Pasture Growth So Far
as at 1 March 2018
As at 1 March 2018(% of district) <1,000kg/ha 1,000 -
2,000kg/ha2,000 -
3,000kg/ha >3,000kg/ha2017/18
Pasture Growth 30% 46% 24% 0%Total Standing Dry
Matter 10% 23% 37% 30%
2017/18 Median Pasture Growth (kg/ha)
(Running Total)Current Estimated
Total Standing Dry Matter
Growth Relative to Long Term(September 2017 – March 2018)
Chance of exceedingMedian Pasture Growth
(March 2018 - May 2018)
© Northern Territory Government Page
1430kg/ha
NT Pastoral Feed Outlook – March 2018
Barkly District
After a good start to the wet season, pasture growth is now tracking well behind this time last year
9% of the district has been burnt since 1 July 2017 (less than 1% of this since 1 January 2018)
78% of the district had a high fire risk as at 1 December 2018
2017/18 Pasture Growth So Far
as at 1 March 2018
As at 1 March 2018(% of district) <250kg/ha 250 - 500kg/ha 500 - 1,000kg/ha >1,000kg/ha
2017/18Pasture Growth 23% 42% 26% 9%
Total Standing Dry Matter 8% 6% 43% 43%
2017/18 Median Pasture Growth (kg/ha)(Running Total)
Current EstimatedTotal Standing Dry Matter
Growth Relative to Long Term(September 2017 – March 2018)
Chance of exceedingMedian Pasture Growth
(March 2018 - May 2018)
© Northern Territory Government Page
511kg/ha

NT Pastoral Feed Outlook – March 2018
Tennant Creek District
The 2017/18 wet season is considered average compared to the long-term records, however pasture growth is tracking well behind this time last year
25% of the district has been burnt since 1 July 2017 (less than 1% of this since 1 January 2018)
89% of the district had a high fire risk as at 1 December 2018
2017/18 Pasture Growth So Far
as at 1 March 2018
As at 1 March 2018(% of district) <250kg/ha 250 - 500kg/ha 500 - 1,000kg/ha >1,000kg/ha
2017/18Pasture Growth 33% 50% 14% 3%
Total Standing Dry Matter 9% 5% 8% 78%
2017/18 Median Pasture Growth (kg/ha)
(Running Total)Current Estimated
Total Standing Dry Matter
Growth Relative to Long Term(September 2017 – March 2018)
Chance of exceedingMedian Pasture Growth
(March 2018 - May 2018)
© Northern Territory Government Page
356kg/ha

NT Pastoral Feed Outlook – March 2018
Northern Alice Springs District
The 2017/18 season is considered average, compared to long-term records, however pasture growth is tracking well behind this time last year
7% of the district has been burnt since 1 July 2017 (less than 1% of this since 1 January 2018)
99% of the district had a high fire risk as at 1 March 2018
2017/18 Pasture Growth So Far
as at 1 March 2018
As at 1 March 2018(% of district) <250kg/ha 250 - 500kg/ha 500 - 1,000kg/ha >1,000kg/ha
2017/18Pasture Growth 44% 37% 18% 1%
Total Standing Dry Matter 1% 4% 15% 80%
2017/18 Median Pasture Growth (kg/ha)
(Running Total)Current Estimated
Total Standing Dry Matter
Growth Relative to Long Term(September 2017 – March 2018)
Chance of exceedingMedian Pasture Growth
(March 2018 - May 2018)
© Northern Territory Government Page
331kg/ha

NT Pastoral Feed Outlook – March 2018
Plenty District
Pasture growth is tracking well behind this time last year
1% of the district has been burnt since 1 July 2017 (0% of this since 1 January 2018)
97% of the district had a high fire risk as at 1 March 2018
2017/18 Pasture Growth So Far
as at 1 March 2018
As at 1 March 2018(% of district) <250kg/ha 250 - 500kg/ha 500 - 1,000kg/ha >1,000kg/ha
2017/18Pasture Growth 71% 24% 5% 0%
Total Standing Dry Matter 2% 11% 38% 49%
2017/18 Median Pasture Growth (kg/ha)
(Running Total)Current Estimated
Total Standing Dry Matter
Growth Relative to Long Term(September 2017 – March 2018)
Chance of exceedingMedian Pasture Growth
(March 2018 - May 2018)
© Northern Territory Government Page
204kg/ha
NT Pastoral Feed Outlook – March 2018
Southern Alice Springs District
Pasture growth is tracking well behind this time last year
Less than 1% of the district has been burnt since 1 July 2017 (0% of this since 1 January 2018)
94% of the district had a high fire risk as at 1 December 2018
2017/18 Pasture Growth So Far
as at 1 March 2018
As at 1 March 2018(% of district) <250kg/ha 250 - 500kg/ha 500 - 1,000kg/ha >1,000kg/ha
2017/18Pasture Growth 76% 20% 4% 0%
Total Standing Dry Matter 2% 12% 33% 53%
2017/18 Median Pasture Growth (kg/ha)
(Running Total)Current Estimated
Total Standing Dry Matter
Growth Relative to Long Term(September 2017 – March 2018)
Chance of exceedingMedian Pasture Growth
(March 2018 - May 2018)
© Northern Territory Government Page
193kg/ha
Pasture Information
The pasture and fire risk information in this document is derived from AussieGRASS. AussieGRASS is a model that simulates pasture growth and standing biomass using climate data, vegetation mapping, fire history and regional estimates of grazing pressure. The model can be used to track simulated pasture growth and total standing pasture biomass at the landscape scale.
Note that the model does not use stocking rate data for individual properties. Where stock numbers are significantly higher or lower than typical for a district, model estimates of total standing dry matter may be erroneous.
Disclaimer
While all care has been taken to ensure that information contained in this document is true and correct at the time of production, changes in circumstances after the time of distribution may impact on the accuracy of its information. The Northern Territory of Australia gives no warranty or assurance, and makes no representation as to the accuracy of any information or advice contained herein, or that it is suitable for your intended use.
You should not rely solely upon information in this document for the purpose of making business or investment decisions in relation to your particular situation.
The Northern Territory of Australia disclaims any liability or responsibility or duty of care towards any person for loss of damage caused by any use of or reliance on this information.