Embed Size (px)
Citation preview
ACTAUNIVERSITATIS
UPSALIENSISUPPSALA
2021
Digital Comprehensive Summaries of Uppsala Dissertationsfrom the Faculty of Pharmacy 300
Novel and refined small-scaleapproaches to determine theintrinsic dissolution rate of drugs
SARA B. E. ANDERSSON
ISSN 1651-6192ISBN 978-91-513-1256-9URN urn:nbn:se:uu:diva-450069

Dissertation presented at Uppsala University to be publicly examined in A1:111, Biomedical Center, Husargatan 3, Uppsala, Friday, 24 September 2021 at 09:15 for the degree of Doctor of Philosophy (Faculty of Pharmacy). The examination will be conducted in English. Faculty examiner: Professor Peter Langguth (Johannes Gutenberg-Universität Mainz).
AbstractAndersson, S. B. E. 2021. Novel and refined small-scale approaches to determine the intrinsic dissolution rate of drugs. Digital Comprehensive Summaries of Uppsala Dissertationsfrom the Faculty of Pharmacy 300. 66 pp. Uppsala: Acta Universitatis Upsaliensis.ISBN 978-91-513-1256-9.
Many drugs are administered as crystalline particles compressed into tablets and taken orally. When the tablet reaches the gastrointestinal tract, it disintegrates and the drug particles dissolve in the gastrointestinal fluid. The dissolved molecules are absorbed across the intestinal membranes into the bloodstream to reach their target sites. Only dissolved molecules can be absorbed, and if a drug has low solubility and/or dissolution rate in gastrointestinal fluid, the drug absorption might be insufficient. Hence, knowing the solubility and dissolution behaviour of a potential drug candidate is necessary early in the drug development process. The aim of this thesis was to evaluate and refine different approaches for measuring and determining dissolution rate, as well as to develop novel in vitro small-scale dissolution methods.
First, interlaboratory variability in determination of intrinsic dissolution rate (IDR) and apparent solubility (Sapp) was investigated using a miniaturized dissolution instrument. To minimize the interlaboratory variability, standardized protocols for both the experimental design and the data analyses were required, and a flow chart for performing standardized powder and disc IDR measurements was established. Next, as an alternative to the powder and disc methods, carefully dispersed suspensions were used to determine the IDR, and rapid and more controlled IDR measurements were obtained using suspensions with dispersed primary particles. From the suspension measurements, an IDR/Sapp ratio of the compounds were determined. This ratio can potentially be used to identify whether a compound is likely to show dissolution rate-limited absorption and hence is sensitive to particle size reduction. The final experiments used a single particle dissolution approach to determine the IDR at four different fluid velocities. Computational fluid dynamics (CFD) simulations were used to theoretically investigate the flow conditions and dissolution rates. Single particle dissolution measurements under well-defined conditions gave high-quality dissolution data. An IDR was determined within 5-60 minutes using particles with initial diameters of 37.5-104.6 μm. The single particle dissolution experiments were used to determine the thickness of the effective hydrodynamic boundary layer (heff). The heff values were also assessed by CFD simulations, and a good concordance between experimental and simulated heff values was obtained.
The approaches presented in this thesis can be used to derive qualified knowledge about the dissolution properties of drugs with several potential applications in drug development, such as profiling of solid drugs, informed formulation decisions, assisting the modelling of drug dissolution and providing improved understanding of the in vivo-dissolution behaviour
Keywords: dissolution, intrinsic dissolution rate, poorly water-soluble compounds, single particle dissolution, solubility
Sara B. E. Andersson, Department of Pharmaceutical Biosciences, Box 591, Uppsala University, SE-75124 Uppsala, Sweden.
© Sara B. E. Andersson 2021
ISSN 1651-6192ISBN 978-91-513-1256-9URN urn:nbn:se:uu:diva-450069 (http://urn.kb.se/resolve?urn=urn:nbn:se:uu:diva-450069)

Till Céline
“Tell me, what is it you plan to do withyour one wild and precious life?”
Mary Oliver

List of Papers
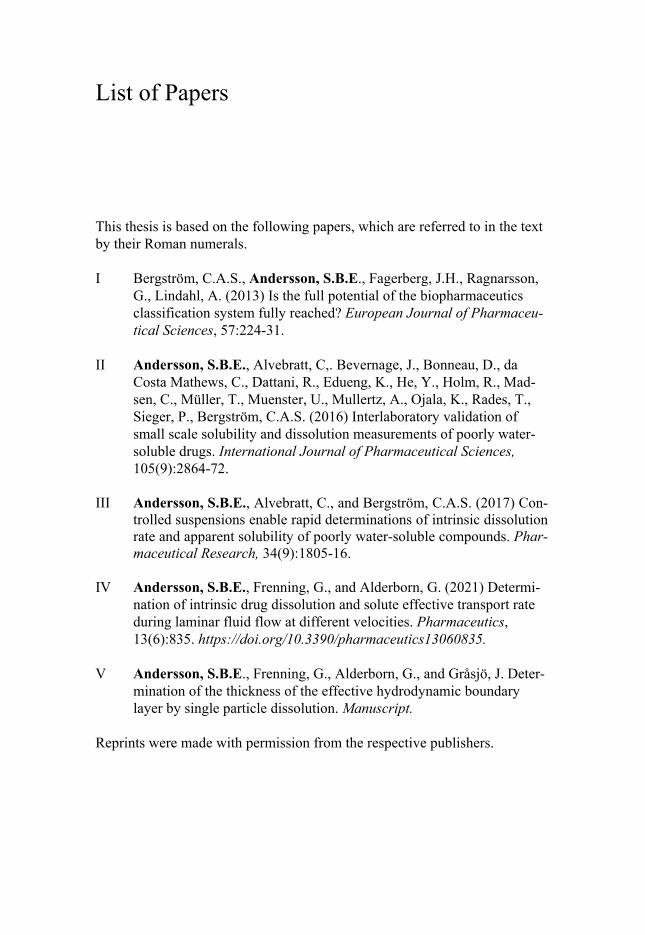
This thesis is based on the following papers, which are referred to in the text by their Roman numerals.
I Bergström, C.A.S., Andersson, S.B.E., Fagerberg, J.H., Ragnarsson, G., Lindahl, A. (2013) Is the full potential of the biopharmaceutics classification system fully reached? European Journal of Pharmaceu-tical Sciences, 57:224-31.
II Andersson, S.B.E., Alvebratt, C,. Bevernage, J., Bonneau, D., da Costa Mathews, C., Dattani, R., Edueng, K., He, Y., Holm, R., Mad-sen, C., Müller, T., Muenster, U., Mullertz, A., Ojala, K., Rades, T., Sieger, P., Bergström, C.A.S. (2016) Interlaboratory validation of small scale solubility and dissolution measurements of poorly water-soluble drugs. International Journal of Pharmaceutical Sciences, 105(9):2864-72.
III Andersson, S.B.E., Alvebratt, C., and Bergström, C.A.S. (2017) Con-trolled suspensions enable rapid determinations of intrinsic dissolution rate and apparent solubility of poorly water-soluble compounds. Phar-maceutical Research, 34(9):1805-16.
IV Andersson, S.B.E., Frenning, G., and Alderborn, G. (2021) Determi-nation of intrinsic drug dissolution and solute effective transport rate during laminar fluid flow at different velocities. Pharmaceutics, 13(6):835. https://doi.org/10.3390/pharmaceutics13060835.
V Andersson, S.B.E., Frenning, G., Alderborn, G., and Gråsjö, J. Deter-mination of the thickness of the effective hydrodynamic boundary layer by single particle dissolution. Manuscript.
Reprints were made with permission from the respective publishers.

Other contributions:
i. Bergström, C.A.S., Holm, R., Jørgensen, S.A., Andersson, S.B.E.,Artursson, P., Beato, S., Borde, A., Box, K., Brewster, M., Dressman,J., Feng, K-I., Halbert, G., Kostewicz, E., McAllister, M., Muenster,U., Thinnes, J., Taylor, R., Mullertz, A. (2013) Early pharmaceuticalprofiling to predict oral drug absorption: Current status and unmetneeds. European Journal of Pharmaceutical Sciences, 57:173-99.
ii. Pedersen, C., Slepenkin, A., Andersson, S.B.E., Fagerberg, J.H.,Bergström, C.A.S., Peterson E.M. (2014) Formulation of the microbi-cide INP0341 for in vivo protection against a vaginal challenge byChlamydia trachomatis. PLoS One, 30;9(10):e110918.
iii. Sjögren, E., Andersson, S., Sundgren-Andersson, A., Halldin, M.M.,Stålberg O. (2016) Assessment of free drug concentration in cyclodex-trin formulations is essential to determine drug potency in functionalin vitro assays. International Journal of Pharmaceutical Sciences,105(9):2913-20.
Contents
Introduction ................................................................................................... 11 Background .............................................................................................. 11 The biopharmaceutics classification system ............................................ 12
BCS class II compounds ...................................................................... 13 Solubility .................................................................................................. 14 Dissolution ............................................................................................... 14
Thickness of the effective hydrodynamic boundary layer ................... 15 Biorelevant dissolution media ............................................................. 16 Intrinsic dissolution rate ...................................................................... 16 Miniaturized dissolution instruments .................................................. 17 Dissolution measurements using suspensions ..................................... 17 Dissolution measurements using single particles ................................ 18
Aims of the thesis.......................................................................................... 19
Methods ........................................................................................................ 20 Model compounds .................................................................................... 20 Miniaturized dissolution instrument ......................................................... 21
Preparation of dissolution media ......................................................... 22 Establishment of standard curve .......................................................... 22 Powder dissolution and apparent solubility ......................................... 23 Dissolution from discs ......................................................................... 23 Dissolution from suspensions .............................................................. 23
The micropipette-assisted microscopy technique ..................................... 25 Preparation of drug slurry .................................................................... 25 Single particle dissolution .................................................................... 26 Measuring IDR from single particles................................................... 27
Simulation models for single particle dissolution .................................... 28 Diffusion layer thickness determinations ................................................. 28
Results and discussion .................................................................................. 30 Analysing the biopharmaceutics classification system ............................ 30 Interlaboratory validation of solubility and dissolution measurements .... 32 Measuring IDR using powder, disc and suspension-based methods ........ 37 Dissolution from single particles .............................................................. 40
Simulations of fluid flow velocities and single particle dissolution .... 40 Determining intrinsic dissolution rate from single particles ................ 43

Determination of diffusion layer thickness .............................................. 47
Conclusions ................................................................................................... 50
Future perspectives ....................................................................................... 52
Populärvetenskaplig sammanfattning ........................................................... 54
Acknowledgements ....................................................................................... 56
References ..................................................................................................... 59

Abbreviations
B Breath of a single particle BCS Biopharmaceutics classification system BDDCS Biopharmaceutics drug disposition classification system CFD Computational fluid dynamics Cpd Compound CV Coefficient of variation Cs Drug concentration D Diffusion coefficient Dp Projected area diameter DCS Developability classification system DSC Differential scanning calorimetry DIDR Disc intrinsic dissolution rate DMSO Dimethyl sulfoxide Do Dose number EMA The European Medicines Agency FA Fraction absorbed FaSSIF Fasted-state simulated intestinal fluid FDA The U.S. Food and Drug Administration FeSSIF Fed-state simulated intestinal fluid GI Gastro-intestinal heff Thickness of the effective hydrodynamic boundary layer HIF Human intestinal fluid IDR Intrinsic dissolution rate IR Immediate release k Slope of the dissolution curve L Length of a single particle logP Partition coefficient IVIVC In vitro-in vivo correlations m Total mass of compund M0 Maximum oral dose n Number of particles PhB Phosphate buffer PIDR Powder intrinsic dissolution rate r Radius of a particle r0 Initial radius of particle r(t) Radius of particle at time t S0 Initial surface area of a particle

Sapp Apparent solubility St Surface area of a particle at time t SA Surface area SAND Surface area normalized dissolution rate SIDR Suspension intrinsic dissolution rate SR Solubilization ratio t TimeT Thickness of a single particle Tm Melting temperature V Volume W0 Initial weight of a particle Wt Weight of a particle at time t ρ Density of a drug compound
11
Introduction
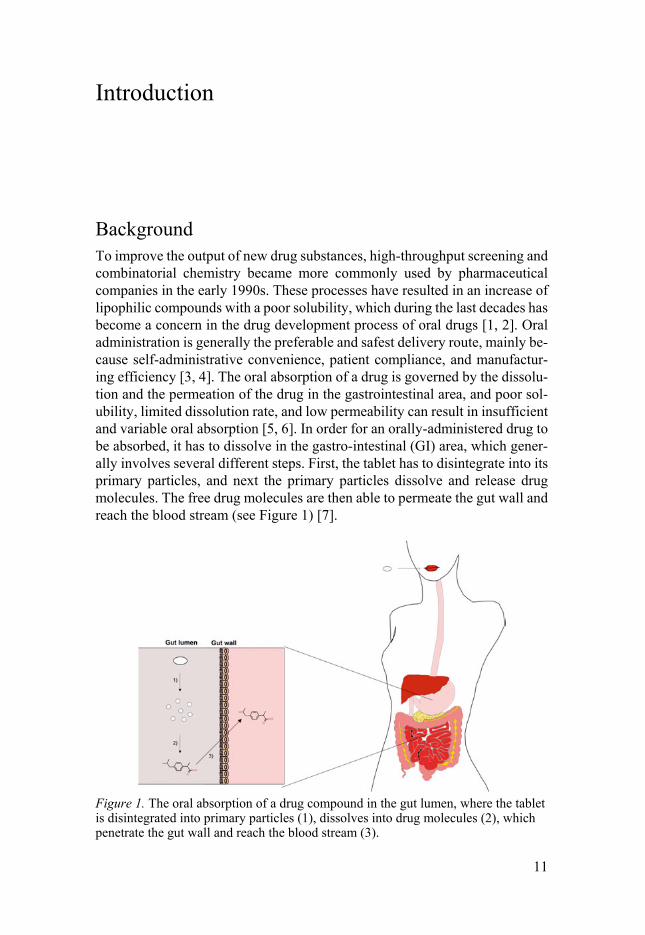
Background To improve the output of new drug substances, high-throughput screening and combinatorial chemistry became more commonly used by pharmaceutical companies in the early 1990s. These processes have resulted in an increase of lipophilic compounds with a poor solubility, which during the last decades has become a concern in the drug development process of oral drugs [1, 2]. Oral administration is generally the preferable and safest delivery route, mainly be-cause self-administrative convenience, patient compliance, and manufactur-ing efficiency [3, 4]. The oral absorption of a drug is governed by the dissolu-tion and the permeation of the drug in the gastrointestinal area, and poor sol-ubility, limited dissolution rate, and low permeability can result in insufficient and variable oral absorption [5, 6]. In order for an orally-administered drug to be absorbed, it has to dissolve in the gastro-intestinal (GI) area, which gener-ally involves several different steps. First, the tablet has to disintegrate into its primary particles, and next the primary particles dissolve and release drug molecules. The free drug molecules are then able to permeate the gut wall and reach the blood stream (see Figure 1) [7].
Figure 1. The oral absorption of a drug compound in the gut lumen, where the tablet is disintegrated into primary particles (1), dissolves into drug molecules (2), which penetrate the gut wall and reach the blood stream (3).

12
If a compound has a satisfactory membrane permeability, the rate-limiting step is usually the solubility and/or dissolution of a drug molecule. These com-pounds with low solubility but high permeability are classified as biopharma-ceutics classification system (BCS) class II compounds [8]. The intestinal membrane permeability of a compound is mainly dependent on its chemical structure, and for any particular candidate compound, the chemical structure can usually be modified to achieve an acceptable permeability. However, structural modifications must be made early on in the drug discovery process [9, 10]. One way to improve the dissolution profile is through formulation studies and salt/solid form selection. These processes are usually performed in the final stage of drug discovery or in the early stage of drug development [2, 11]. In order for an orally administered drug to be absorbed, it has to dis-solve in the gastrointestinal fluids. The dissolution process is described in more detail on page 14.
The biopharmaceutics classification system The biopharmaceutics classification system (BCS) is used to categorize drug compounds into four different classes [12]. The system is based on the perme-ability and solubility of the drug molecules (Table 1), and serves as a regula-tory tool to help determine whether bioequivalence studies are needed for im-mediate release (IR) formulations or whether in vitro data is enough to allow for a biowaiver [13, 14]. In BCS, a compound is classified as highly soluble if its highest drug dose is soluble in 250 mL or less of aqueous media over a physiological pH-range from 1.0 to 6.8 according to the European Medicines Agency (EMA) standards or to 7.5 according to the U.S. Food and Drug Ad-ministration (FDA) standards at 37°C. High permeability is defined as if at least 85% (EMA) or 90% (FDA) of the oral dose is absorbed, i.e. permeates through the intestinal membrane. Also, a compound needs to dissolve rapidly to be eligible for a biowaiver, i.e. more than 85% of the dose has to dissolve within 30 minutes in 900 mL or less in three media with different pHs (1.0, 4.5 and 6.8).
Table 1. The Biopharmaceutical Classification System (BCS).
Class Solubility Permeability
I High High II III IV
Low High Low
High Low Low

13
The BCS can be used to select the most appropriate formulation design (for BCS class II/IV drugs) and/or chemical modifications (for BCS class III/IV drugs) to improve absorption [15]. Based on the BCS, two other classification system have been developed, the biopharmaceutics drug disposition classifi-cation system (BDDCS) [16] and the developability classification system (DCS) [17]. The BDDCS uses metabolism instead of permeability in its clas-sification, and is used to identify disposition and drug–drug interaction pat-terns in the intestine and liver [16, 18]. The DCS is based on 500 mL instead of 250 mL for the solubility definition [17]. The larger volume of 500 mL is used to compensate for drug loss from the intestine (i.e. the permeability) dur-ing drug dissolution and solubility assessment. The DCS can be used to indi-cate if BCS class II compounds are dissolution-rate limited or solubility lim-ited, and this information can be used to guide the formulation design in the right direction. The dose number (Do) can be used to determine whether a compound is classified as highly soluble or not [19]: o = ( / ) × (Eq. 1) where is the maximum oral dose, is the volume (i.e. 250 mL) and is the solubility in the medium used. A Do < 1 indicates that the maximum dose is soluble, and for a compound to be classified as a BCS class I or III com-pound, the Do has to be < 1 over the whole pH-range from 1.0 to 6.8. As a consequence, a large number of acids are classified as BCS II or IV com-pounds even though they are highly soluble in the small intestine where most of the absorption takes place [20, 21]. In this thesis, most of the compounds studied belong to BCS class II.
BCS class II compounds Previous studies have estimated that approximately 30% of the compounds already on the market are BCS class II compounds, i.e. have poor water-solu-bility but high permeability [22]. However, the tendency to select lipophilic compounds has increased the number of BCS class II compounds in the drug discovery process from approximately 30% to at least 50–60% [23], and some estimates are as high as 90% [22]. Since BCS class II compounds have a high permeability, and quickly permeate biomembranes, the limiting factors of in-sufficient absorption are the slow dissolution rate and/or the poor solubility. Hence, formulation strategies to improve drug dissolution and/or solubility are of interest.
14
Solubility A fundamental property that is determined early on in the drug discovery pro-cess is the solubility of a drug compound. Drug solubility can be defined as the maximum quantity of a compound that completely dissolves in a specific volume of solvent, which is when an equilibrium is established between the solution and the solid phase at a specified temperature and pressure [24, 25]. This equilibrium point is also called the equilibrium solubility. Equilibrium solubility is measured using traditional methods, i.e. the shake flask method [26], where the compound is weighed in a particular solvent, and the dissolved material is measured when equilibrium is obtained. However, solubility itself has several different definitions. The solubility where the drug is in a neutral (un-ionized) form is called the intrinsic solubility [2]. Another type of solubility, kinetic solubility, is usually described as the concentration at which a precipitate first appears in a solution [27], i.e. it rep-resents the precipitation tendency, which is usually measured by adding a con-centrated stock (e.g. dimethyl sulfoxide (DMSO)) solution into an aqueous media [2]. The kinetic solubility is usually much higher than the equilibrium solubility. The definition of solubility measured and used the most in this the-sis is apparent solubility (Sapp), which may be either higher or lower than the equilibrium solubility. Apparent solubility can differ from equilibrium solu-bility if for example a supersaturation with a higher concentration than the equilibrium solubility is obtained, or if there has been insufficient time to reach equilibrium [2].
Dissolution Formulation strategies to improve drug dissolution are of interest because an increase in dissolution rate most often results in a higher bioavailability of the drug [28, 29]. Several methods can be employed to increase the dissolution rate, such as salt formation, amorphous solid dispersions and particle size re-duction [30]. For example, using milling to reduce particle size is a well-known approach for enhancing the dissolution rate by increasing the specific surface area [31-33]. A larger surface area in contact with the dissolution me-dium will result in faster dissolution of the solid material. The dissolution pro-cess can be described by the Noyes-Whitney/Nernst-Brunner equation [34-36]: = × × ( − )ℎ (Eq. 2)
15
where / is the dissolution rate, is the diffusion coefficient, is the concentration of the drug compound in the diffusion layer, the concentra-tion of drug compound in the bulk, and ℎ is the thickness of the diffusion layer. Sink conditions are obtained if the concentration of the solute does not exceed 10 percent of the amount required for equilibrium solubility ( ), and in this case, the concentration gradient ( − ) can be considered constant. Sink conditions can be achieved when a sufficiently large volume of medium is used, or when the solute is consistently removed from the medium at a faster speed than it passes into solution [37].
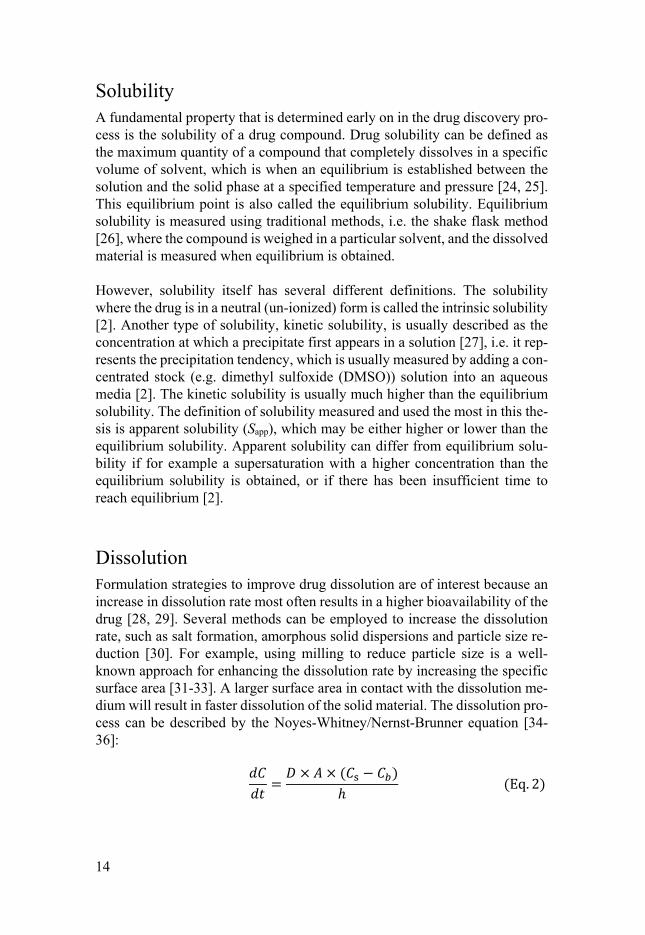
Thickness of the effective hydrodynamic boundary layer To fully understand the dissolution process, the mass transfer mechanisms at the solid-liquid interface have to be explained [38]. For a solid dissolving in a liquid, there will be a gradient in the fluid velocity ranging from zero at the surface of the solid to a maximum value, some distance from the solid-liquid interface, that reaches the value of the fluid velocity in the bulk (see Figure 2). This gradient or layer around a solid material is usually called the hydrody-namic boundary layer [39]. The transport of material from the surface of the solid is carried out by diffusion and convective flow. For example, closer to the solid surface where fluid velocity is low, mass transfer is dominated by diffusion. In the region where the fluid velocity is high, mass transfer is dom-inated by convection.
Figure 2. Illustration of the diffusion layer model for drug dissolution.
This process is also considered in the Noyes and Whitney/Nernst and Brunner equation (Equation 2) which makes the simplifying assumption that the layer of liquid surrounding the solid, i.e. the hydrodynamic boundary layer, is stag-nant and the outer compartment is a perfectly stirred bulk. This “stagnant

16
layer” is described also as the effective hydrodynamic boundary layer, and its thickness is denoted ℎ, or heff as refered to in this thesis. One thing to bear in mind is that the particle size [31, 40-44] and shape [37] may affect ℎ, which in turn will affect the dissolution rate. Furthermore, the speed of the fluid flow, as well as different fluid flow conditions (i.e. stirred particles moving in a vial versus a fixed disc or particle), will have different influences on ℎ and disso-lution rate [45].
Biorelevant dissolution media To mimic the fluid in the small intestine, several simulated intestinal fluids have been developed, e.g. fasted and fed state simulated intestinal fluids (FaS-SIF and FeSSIF) [46, 47]. These simulated intestinal fluids reflect appropriate in vivo pH, buffer capacity, and osmolarity, and contain bile salts and phos-pholipids which self-aggregate to form micelles and vesicles [7]. The presence of these factors is especially important for testing poorly water-soluble (lipo-philic) compounds, because they can partition into the micelles and vesicles and solubilize, resulting in an increased apparent solubility [48-52]. Simulated fluids are used as alternatives to human intestinal fluid (HIF) which requires more time and resources and sampling directly from the GI tract of a human [53].
Intrinsic dissolution rate The dissolution rate is usually reported as the concentration (e.g. μg/mL) or as the percentage of the drug dissolved per time unit. A more standardized meas-urement of dissolution is the intrinsic dissolution rate (IDR), i.e. the surface-specific dissolution rate (μg/min/cm2) which adjusts the dissolution rate by the surface area of the solid material in contact with water. IDR measurements can be used to identify formulation strategies because these provides data about the effects that can be expected from e.g. particle size reduction and salt form selection. The IDR is typically measured using a rotating disc of compacted powder of the drug compound immersed in dissolution media [54]. The advantage of us-ing a disc is that the surface area is known and can be assumed to be constant during the dissolution period [55]. Traditional compendial dissolution meth-ods, e.g. the Wood apparatus (e.g. USP II apparatus), are also available to determine the IDR of a compound [54, 56]. However, one of the disadvantages with these methods is that as much as approximately 500 mg of material is required to compress a disc [57]. Since the quantity of the compound is limited early on in the development process, these dissolution methods are often not suitable. Another disadvantage with the disc method is that inhomogeneities

17
on the surface of the disc may happen during compression, which can poten-tially affect the dissolution behaviour [58]. Furthermore, loosely attached powder on the surface of a compact may give rise to inaccurate data at the beginning of a dissolution measurement [56].
Miniaturized dissolution instruments Several miniaturized dissolution instruments have been developed as alterna-tives to the traditional USP apparatuses as a way to reduce the amount drug compound needed for a dissolution experiment, [54, 55, 59-63]. One small-scale dissolution instrument that is commonly used is the µDISS Profiler (Pion Inc., Billerica, MA.). This apparatus uses fiber optic dip probes to read con-centration over time in situ, scanning absorbances between 200 and 700 nm. The fiber optic dip probes have interchangeable tips with a path length in the range of 1-20 mm suited to measure various concentrations [55, 64]. The µDISS Profiler was initially developed as a compound-sparing miniaturized disc method, as the solid material needed to make compacted discs can be as little as approximately 5 mg. However, it has been concluded that the µDISS Profiler can also use powder dissolution to estimate the IDR [50, 65]. The advantage of using powder dissolution over a disc is that the powder-based method facilitates more rapid determination of the dissolution rate because of the increased surface area of the material in contact with the dissolution me-dium. Hence, a smaller amount of solid material is needed to perform disso-lution experiments, i.e. 0.6 mg or even less, and powders can dissolve up to 600 times faster than discs [65]. However, one of the disadvantages of using powder dissolution to determine the IDR is the difficulty in defining the sur-face area of the solid material involved in the dissolution process [66], because the surface area of dry powder determined experimentally by various tech-niques is not necessarily equivalent to the area available during the dissolu-tion. For example, lipophilic drugs have a tendency to agglomerate when they come into contact with an aqueous medium, and hence, the exposed surface area will be lower than the surface area measured from the primary particles [67].
Dissolution measurements using suspensions One way to obtain rapid dissolution measurements and to determine the IDR is to make use of suspensions. The advantage of suspensions is that the particle size can be measured, and hence, a surface area can be estimated. Milling re-duces particle size and increases surface area which results in a faster dissolu-tion [68]. In the suspensions, small amounts of surfactants are usually added to prevent the primary particles from aggregation. In the case of well-dis-persed particles, a previous study reports that the surface area of the primary

18
particles is adequate to use for analysis of in vitro dissolution rate measure-ments [67]. In another study, wet-milling of compounds in aqueous medium was used to produce sub-micron suspensions. These suspensions were used for in vivo studies [69, 70], however, the sub-micron suspensions can be used for both in vitro and in vivo studies. Hence, the same suspension can be used in both during preformulation and in preclinical studies, leading to less varia-bility and potentially improved in vitro-in vivo correlations (IVIVC).
Dissolution measurements using single particles An additional disadvantage of the powder dissolution method, i.e. a multipar-ticulate approach, is that the dissolution condition for each single particle can vary because of difference in particle size and shape [71], and the fluid flow around each single particle is not fully understood [45]. Since both the particle size [38, 40, 72] and shape [37] as well as the fluid flow conditions occurring around a particle [45] are reported to affect the heff, which itself may poten-tially affect the dissolution rate, the heff also needs to be assessed. In recent decades, dissolution measurements of single particles have been made under conditions in which the particle size and shape can be accurately observed [45, 73-78]. As described above, the IDR values are usually determined from a constant surface area from a disc, however, the changing surface area of a single particle as it dissolves has been reported to be an equivalent method [79]. Another advantage of using single particles is the minute amount of drug compound necessary for determine the dissolution rate. In addition, if particle imaging is used, i.e. using a microscope technique, analytical method devel-opment is not required [76].

19
Aims of the thesis
The overall aim of this thesis is to evaluate and refine different approaches to measure and determine dissolution rate, as well as to develop novel and im-proved in vitro small-scale methods useful for dissolution profiling of poorly water-soluble compounds with a specific focus on the intrinsic dissolution rate (IDR) and apparent solubility (Sapp). In paper I, the BCS and its solubility definition was examined. In paper II, interlaboratory variability during dis-solution studies was investigated, and guidelines on how to perform standard-ized powder and disc IDR measurements in the miniaturized dissolution in-strument used were established. Improved methods for measuring and evalu-ating IDR (papers III and IV) and ℎ (paper V) were developed using sus-pensions (paper III) and a single particle approach (papers IV and V). The specific aims were to:
• Explore the current solubility definition of the biopharmaceutics classification system (BCS) by studying 58 BCS class II compounds for which the impact of pH and lipids on the observed solubility was analysed from an in vivo FA perspective.
• Investigate the interlaboratory variability between powder and disc
dissolution measurements for poorly water-soluble compounds using the µDISS Profiler as a minituarized dissolution apparatus.
• Develop standardized guidelines for IDR measurements in the µDISS Profiler to ensure high quality dissolution data.
• Use suspensions for obtaining IDR measurements more rapidly, where the surface area is characterized and well-known.
• Develop a single particle dissolution approach as a means to deter-mine the IDR of a compound under well-defined conditions.
• Determine the ℎ values for single particles under varying fluid flow velocities.

20
Methods
Model compounds In paper I, 242 compounds currently classified by BCS were extracted from the literature [16, 17, 21, 80-84]. Of these 242 compounds, 58 BCS class II compounds were further analyzed and fraction absorbed (FA) values were ex-tracted from the literature [21, 85-95]. The data sets used in papers II–V were selected to include poorly soluble compounds with different physicochemical properties (see Table 2 and Figure 3). In paper II, aprepitant, bromocriptine mesylate and felodipine were used as standard compounds for evaluating in-terlaboratory variability when measuring dissolution data. Atenolol, feno-fibrate, ibuprofen, indomethacin, tadalafil and valsartan were used as experi-mental compounds to establish guidelines on how to perform dissolution measurements for IDR determination with the µDISS Profiler. In paper III, aprepitant, cinnarizine, felodipine, fenofibrate, griseofulvin, indomethacin and tadalafil were used to rapidly determine IDR from suspensions and de-velop a small-scale set-up using the µDISS Profiler. In papers IV and V, carbamazepine, ibuprofen and indomethacin was used to measure IDR and determine the ℎ from a single particle using a micropipette-assisted micros-copy method.
Table 2. Physicochemical properties of the compounds used in papers II–V.
Compound Mw (g/mol) logP pKa Tm (°C)
Atenolola 266.3 0.4 9.6 (a) 147 Aprepitant Bromocriptine mesylate Carbamazepine Cinnarizine Felodipine Fenofibrate Griseofulvinb Ibuprofen Indomethacin Tadalafil Valsartan
534.4 750.7 236.3 368.5 384.3 360.8 352.8 205.3 357.8 389.4 435.5
4.5 2.9 2.3 5.6 3.4 5.3 2.2 2.9 3.1 2.6 1.5
9.7 (a); 2.8 (b) 4.9 (b)
n 2.0; 7.5 (b)
n n
4.1 (a) 4.4 (a) 4.1 (a)
> 10 (b) 3.9 (a)
253 215 190 121 146 81
220 75
161 302 116
a Hydrophilic reference compound used to validate the method in paper II b Reference compound used to compare dissolution rates in paper III

21
Figure 3. Molecular structures of the compounds used in papers II–V.
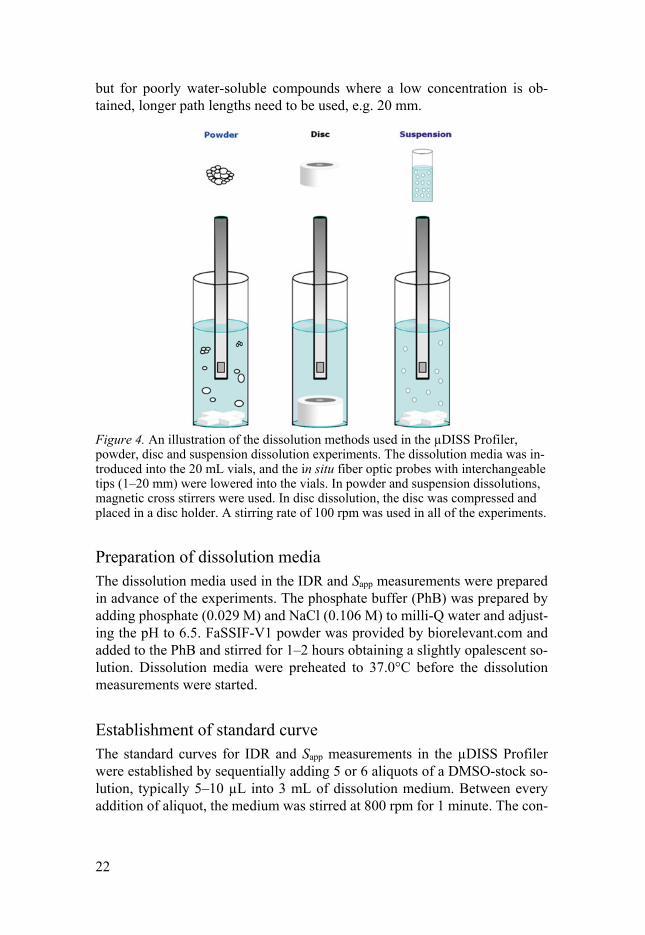
Miniaturized dissolution instrument A miniaturized dissolution instrument, the µDISS Profiler (Pion Inc., Billerica MA, USA), was used to determine the IDR and Sapp in papers I–IV. This small-scale dissolution apparatus was used to measure IDR from powder as-says (papers II and III), discs (papers II–IV) and suspensions (paper III), see Figure 4. The plateau of the dissolution profile was used to determine the Sapp (papers I–IV). Here, a volume of 10–15 mL of the dissolution medium was used, and the vials were placed in a heating block where the temperature could be controlled. In situ fiber optic probes were used to analyze the con-centration over time, and the path length of the tip of the probes (1-20 mm) was selected based on the concentration in the solution (i.e. the solubility of the compound). For higher concentrations, a path length of 1 mm is sufficient,
22
but for poorly water-soluble compounds where a low concentration is ob-tained, longer path lengths need to be used, e.g. 20 mm.
Figure 4. An illustration of the dissolution methods used in the µDISS Profiler, powder, disc and suspension dissolution experiments. The dissolution media was in-troduced into the 20 mL vials, and the in situ fiber optic probes with interchangeable tips (1–20 mm) were lowered into the vials. In powder and suspension dissolutions, magnetic cross stirrers were used. In disc dissolution, the disc was compressed and placed in a disc holder. A stirring rate of 100 rpm was used in all of the experiments.
Preparation of dissolution media The dissolution media used in the IDR and Sapp measurements were prepared in advance of the experiments. The phosphate buffer (PhB) was prepared by adding phosphate (0.029 M) and NaCl (0.106 M) to milli-Q water and adjust-ing the pH to 6.5. FaSSIF-V1 powder was provided by biorelevant.com and added to the PhB and stirred for 1–2 hours obtaining a slightly opalescent so-lution. Dissolution media were preheated to 37.0°C before the dissolution measurements were started.
Establishment of standard curve The standard curves for IDR and Sapp measurements in the µDISS Profiler were established by sequentially adding 5 or 6 aliquots of a DMSO-stock so-lution, typically 5–10 µL into 3 mL of dissolution medium. Between every addition of aliquot, the medium was stirred at 800 rpm for 1 minute. The con-

23
centration of the stock solutions was determined based on the expected solu-bility of the compound, and hence, the final concentration in the dissolution experiment.
Powder dissolution and apparent solubility Powder dissolution measurements were performed by weighing approxi-mately 0.5–2.0 mg of drug compound into 20 mL vials. Magnetic cross stirrers were placed in the vials, the vials were placed in the heating block, and the in situ fiber optic dip probes were lowered into the vials. Measurements were started while 15 mL of dissolution medium was added to the vials. In papers I–III, preheated FaSSIF (37.0 ± 0.5°C) was used as dissolution medium to mimic intestinal fluids in the fasted state. In addition, preheated PhB pH 6.5 (37.0 ± 0.5°C) was used in paper I and II to investigate the solubilization capacity of FaSSIF. The medium used in paper IV to estimate the Sapp of ibu-profen and indomethacin was room tempurature milli-Q water. Powder disso-lution continued until a plateau was obtained, and the Sapp was estimated from this plateau. Powder dissolution was performed in triplicate and the magnetic cross stirrers were set to 100 rpm in all measurements.
Dissolution from discs The Mini-IDR compression system (Heath Scientific, Milton Keynes, UK) was used to make discs with a surface area of 0.071 cm2. Here, approximately 5 mg of drug compound was loaded into the Mini-IDR and compressed for 2 minutes at 80 kg. The discs were inserted into disc holders, which also func-tion as stirrers. The disc holders were placed into 20 mL vials on a heating block and the in situ fiber optic dip probes were lowered into the vials. Disc dissolution measurements were started while the media was introduced into the vials. In papers II and III, preheated PhB and FaSSIF were used as dis-solution media. In paper IV, room temperature milli-Q water was used as media. The disc dissolution was performed in triplicate and the stirring rate was set to 100 rpm in all measurements.
Dissolution from suspensions
Preparation of suspensions The suspensions were prepared by wet-milling using a planetary ball mill (Model PM 100, Retsch GmbH, Haas, Germany) and 10 milling beads with a dimeter of 5 mm. The drug compound was added into a milling bowl together with PhB (pH 6.5) containing 1.0% (w/w) PVP K30 and 0.2% (w/w) SDS. The drug compound and the PhB were milled for 20 min at 600 rpm to produce a suspension. The final concentration of the suspensions was 2 mg/mL, 4
24
mg/mL or 15 mg/mL, depending on the Sapp of the compound. For cinniariz-ine, 1.0% (w/w) HPMC instead of 1.0% (w/w) PVP K30 was used during wet-milling, and for indomethacin, the pH of the PhB was adjusted to 2.5 to pre-vent this acidic compound from dissolving.
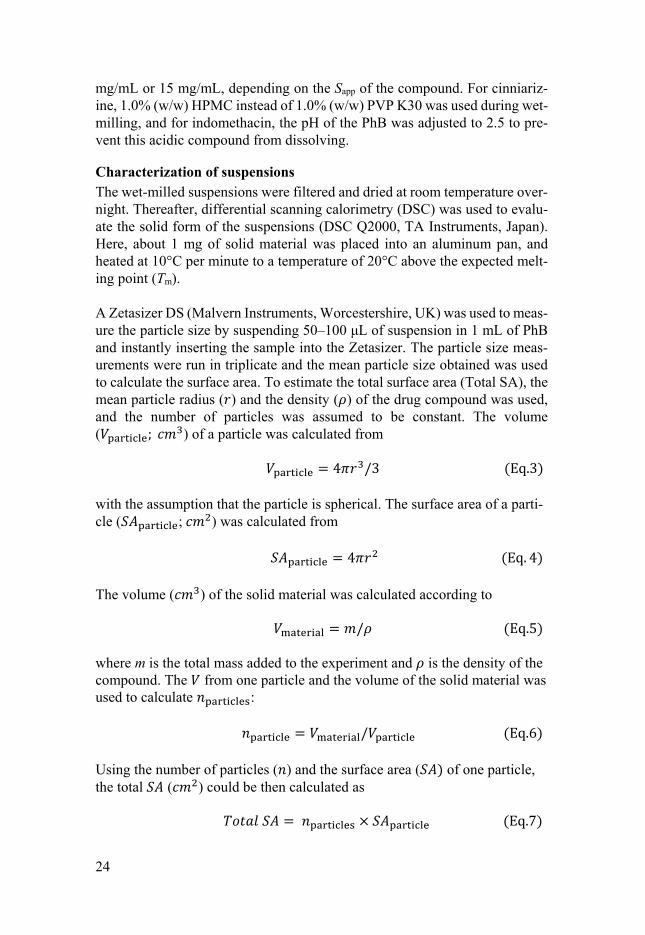
Characterization of suspensions The wet-milled suspensions were filtered and dried at room temperature over-night. Thereafter, differential scanning calorimetry (DSC) was used to evalu-ate the solid form of the suspensions (DSC Q2000, TA Instruments, Japan). Here, about 1 mg of solid material was placed into an aluminum pan, and heated at 10°C per minute to a temperature of 20°C above the expected melt-ing point (Tm). A Zetasizer DS (Malvern Instruments, Worcestershire, UK) was used to meas-ure the particle size by suspending 50–100 μL of suspension in 1 mL of PhB and instantly inserting the sample into the Zetasizer. The particle size meas-urements were run in triplicate and the mean particle size obtained was used to calculate the surface area. To estimate the total surface area (Total SA), the mean particle radius ( ) and the density ( ) of the drug compound was used, and the number of particles was assumed to be constant. The volume ( ; ) of a particle was calculated from
= 4 /3 (Eq.3) with the assumption that the particle is spherical. The surface area of a parti-cle ( ; ) was calculated from = 4 (Eq. 4) The volume ( ) of the solid material was calculated according to = / (Eq.5) where m is the total mass added to the experiment and is the density of the compound. The from one particle and the volume of the solid material was used to calculate : = / (Eq.6) Using the number of particles ( ) and the surface area ( ) of one particle, the total ( ) could be then calculated as = × (Eq.7)
25
IDR measurements from suspensions Dissolution measurements from suspensions were performed by adding 20–500 µL of suspension into 14.50–14.98 mL of FaSSIF. First, 20 mL vials were filled with FaSSIF, magnetic cross stirrers were put in the vials, and the vials were placed into the heating block. The fiber optic dip probes were lowered into the FaSSIF (37°C) and the stirring was started and set to 100 rpm. The dissolution measurement was started, and quickly thereafter, aliquots of the suspension were added. The volume used for each suspension aliquot de-pended on the Sapp of the compound in FaSSIF. All measurements were per-formed in triplicate. For each compound, 2 or 3 triplicates were performed, resulting in a total of 6 or 9 IDR measurements. In these measurements, dif-ferent amounts of suspension (equal to 0.1–5.0 times the saturation level) were used. The dissolution measurements were run for a maximum of 20 min, and the first minutes were used to calculate the IDR. The first data points obtained under sink conditions were used to calculate the IDR according to the equation = × × 1/ (Eq.8) where V is the volume, k is the initial slope of the dissolution curve and A is the total surface area calculated using the calculation given above.
The micropipette-assisted microscopy technique An illustration of the micropipette-assisted microscopy technique used to study the dissolution rate of single particles is presented in Figure 5. This tech-nique was initially developed to study microgels in different solutions [96], and a recent work also used this techniques to study bead-drug interactions [97]. Here, glass capillaries were used to create micropipettes with a tip diam-eter of approximately 50 µm. The micropipette was inserted into a microinjec-tor (IM-11-2, Narishige, Tokyo, Japan) with suction applied to keep the parti-cle attached to the micropipette.
Preparation of drug slurry A saturated solution was prepared by stirring an excess amount of drug com-pound in milli-Q water (room temperature) overnight. A filter with a pore size of 0.2 µm was used to remove excess solid material from the solution. There-after, a drug slurry was prepared by adding about 2 mg of compound to 5 mL of saturated solution. One or two drops of this saturated solution were trans-ferred from a transfer pipette onto a petri dish. From these drops, a couple of particles were obtained.

26
Figure 5. An illustration of the micropipette-assisted microscopy technique. The op-tical light microscope (a) was used to detect single particles attached to a micropi-pette inserted into a microinjector (b) with applied suction (c). A peristaltic pump (d) with a continuous fluid flow of medium (e) was connected to a flow-pipette (f). To maintain a constant fluid volume on the petri dish, a second flow-pipette (g) was connected to the peristaltic pump, removing fluid (h) at the same rate.
Single particle dissolution The micropipette was used to pick up a single particle from the petri dish, and to turn the particle in different dimensions to measure the three main dimen-sions before the dissolution measurement was commenced. To begin the sin-gle particle dissolution experiment, the micropipette with the attached article was inserted into a flow-pipette connected to a peristaltic pump (Pharmacia, Uppsala, Sweden) with continuous fluid flow through the flow-pipette and out onto the petri dish (Figure 6). Fluid was removed at the same rate from the petri dish, by connecting a second flow-pipette to the peristaltic pump. In this study, room temperature milli-Q water was used as the dissolution medium. The dissolution of the single particles was studied using four different fluid flow velocities; 46, 66, 88 and 103 mm/s. To image the single particle through-out the dissolution run, an optical light microscope (Olympus Bx-51, Olym-pus, Tokyo, Japan) and a DP digital camera (Olympus, Tokyo, Japan) were used. The images of the single particle were analyzed by the camera software (Olympus cellSense Dimension, Tokyo, Japan).

27
Figure 6. An illustration of the single particle dissolution experiment. A single parti-cle was attached to a micropipette and inserted into a flow-pipette with constant fluid flow velocities varying between 46–103 mm/s. The decrease of the single parti-cle was observed using a microscope.
Measuring IDR from single particles The IDR of a single particle was estimated from the slope of a curve of the cumulative dissolved amount of compound per surface area (µg/cm2) against time (min). The IDR was also calculated using the following equation:
= −( − )2 (Eq. 9)
where is the initial weight of the particle, is the weight of the particle at time , is the initial surface area of the particle, and is the surface area of the particle at time .

28
Simulation models for single particle dissolution Computational fluid dynamics (CFD) simulations were used to investigate the dissolution rate and the flow conditions occurring around the particles (papers IV and V). Here, rectangular particles (similar to the ones used in the disso-lution experiments) and spherical particles with the same surface area were compared. To mimic the flow-pipette, a cylindrical domain with a diameter of 1.6 mm and a length of 3 mm was used. A holder kept the particle on the center axis of the flow-pipette, at a distance of 1 mm from the outflow (Figure 7).
Figure 7. Geometry of (a) computational domain, (b) a rectangular particle and (c) an equivalent sphere. The particle is shown in red and the holder in blue.
Simulations were performed for the same fluid flow velocities investigated experimentally using the software COMSOL Multiphysics 5.4 (COMSOL AB, Stockholm, Sweden). The dissolved drug concentration was fixed at = 74.1 µg/mL = 74.1 g/m3 at the particle boundary using the experimentally- determined solubility of ibuprofen in an aqueous medium.
Diffusion layer thickness determinations The following equation [72] was used to determine the thickness of the diffu-sion layer (ℎ ) from the particles in the dissolution experiments: sℎ ∙ = − ( ) + ℎ ∙ ℎ +ℎ + ( ) (Eq. 10)
where is the diffusion coefficient, is the aqueous solubility, the time, the density, the initial radius of the particle and ( ) the radius of a particle at time point . The particle was assumed to be spherical, and the radii and surface areas used were equivalent to the estimated radii and surface areas of the rectangular particle used in the dissolution experiments.

29
From the CFD simulations, the values of / from particle surface was ex-tracted The dissolution rate per unit area, / , of a spherical particle with radius is given by the following equation: = × 1ℎ + 1 (Eq. 11)
from which the following expression for ℎ is obtained: ℎ = × 1 − 1 (Eq. 12)

30
Results and discussion
Analysing the biopharmaceutics classification system In this literature study (paper I), 242 compounds were identified in published datasets for which BCS classification had been stated. From these 242 com-pounds, BCS class II compounds with a fraction absorbed (FA) greater than 85% were selected for further analysis, based on the FDA and EMA guide-lines, where a compound with a FA >85% was classified as having high per-meability and hence categorized as BCS class I or II compound depending on the solubility. The purpose of going through this process was to find out whether all compounds currently identified as BCS class II compounds were correctly sorted according to the experimental procedure on which BCS is based, or if in vivo any of these would behave more like BCS class I com-pounds. The protolytic functions of the 58 BCS class II compounds were equally distributed between acids (37.9%) and bases (37.9%), while a few (20.7%) were neutral compounds. One ampholyte and one zwitterion were included in the dataset. Figure 8 shows the log Do where the dashed line (logDo = 0) equals a dose number of 1. A dose number below 1 indicates that the compound is completely soluble.
Figure 8. Computationally predicted pH-dependent dose number for BCS class II compounds. The graph shows the logarithm of the dose number (logDo), and hence, logDo of 0 corresponds to Do of 1 (dashed line). For compounds with a Do less than this value the maximum dose given is completely soluble.

31
In this study, 29 of the BCS class II compounds had a FA >85% and these were analyzed further. A majority of these were acids (59%), 21% were bases, 14% were non-ionizable, and one ampholyte (3%) and one zwitterion (3%) were found in the dataset. This count shows that acidic compounds in many cases are classified as BCS class II compounds even though they are absorbed to a high extent. As can be seen for the acidic compounds (Figure 8), most of them are completely soluble at pH 6.8 while a majority are not soluble at pH 1.0. This result indicates that acidic compounds are being falsely classified as having solubility-limited absorption when in reality they are completely ab-sorbed from the small intestine. For many of the BCS class II bases, was predicted to be greater than 1 at pH 6.8 (Figure 8), indicating the risk of pre-cipitation of such compounds when transferred from the stomach to the intes-tine. As expected, neutral compounds were unaffected by the pH. For these com-pounds, the impact of lipids and bile salts may be more relevant to investigate [50, 98]. For example, lipids have been suggested to increase the solubility of drug compounds with logP values above 3 [50, 99-102]. Hence, we analyzed if computational tools predicted lipids to be important for the solubility of the remaining 12 non-acidic BCS class II compounds (Figure 9a,b). The models predicted most of them to have increased solubility in FaSSIF compared to buffer.
Figure 9. Predicted solubilities in buffer and FaSSIF based on the solubilization ra-tio (SR). (a) Solubility in FaSSIF using predicted buffer solubility from ADMET Predictor, (b) solubility in buffer calculated using predicted solubility in FaSSIF from ADMET Predictor.
The computational exercise indicated that lipids were predicted to improve the solubility of a number of compounds, perhaps even to such an extent that would allow the oral dose to be completely dissolved. Therefore, the solubility in FaSSIF and buffer was experimentally determined (Figure 10a). Three of the compounds had a logP greater than 3 and eight of them had a logD6.5 greater than 2, which are indications that they will have a higher solubility

32
when lipids are present. Of the 12 compounds investigated, four had a Do < 1 in FaSSIF (lorazepam, ofloxacin, tamoxifen and rifampicin), when the DSC volume criterion was used (500mL), phenazopyridine and dapsone also ob-tained Do < 1 in FaSSIF (Figure 10b). All other compounds had a higher sol-ubility in FaSSIF than in buffer, although this higher solubility was not enough to result in a Do < 1. To summarize, the computational and experimental meth-ods used in this study, under biorelevant conditions, indicated complete dis-solution for 20 of the 29 BCS class II compounds with FA > 85%. When the DCS solubility criterion (500 mL) was used, two additional compounds were completely dissolved.
Figure 10. (a) Experimentally determined solubility and (b) dose number for non-acidic compounds with FA > 85%.
Interlaboratory validation of solubility and dissolution measurements The interlaboratory variability from powder and disc dissolution studies in the µDISS Profiler was investigated. There was a large variation when the partic-ipant laboratories analyzed the data themselves, one reason being that the standardized experimental protocol did not include guidelines for data analy-sis. The Sapp and IDR of the reference compounds were therefore compared before and after a standardized data analysis protocol was established. The standardized protocol included factors such as quality of the standard curve established for each dissolution measurement in the µDISS Profiler (i.e. wave-length and second derivative used during data analysis), the amount com-pound added during a powder measurement (risk of too turbid solutions), and the quality of the disc.
To evaluate the interlaboratory variability, the coefficient of variation (CV) was calculated before and after standardization. For powder dissolution, the CV of Sapp was calculated, whereas for disc dissolution, the CV of IDR was

33
calculated. The CV of Sapp before analytical standardization ranged from 34.2% to 160.5% in FaSSIF and from 35.0% to 99.4% in PhB. However, after the analyses were standardized, these values decreased to 11.8% to 24.6% in FaSSIF and 12.5% to 29.8% in PhB. The CV of Sapp and the CV of IDR are presented in Table 3 and 4.
Table 3. The CV of apparent solubility from powder dissolution in FaSSIF and phos-phate buffer (PhB) before and after standardized data analysis.
Compound Medium CV(%) “Before” CV(%) “After”
Aprepitant FaSSIF 160.5 23.2 Bromocriptine mesylate Felodipine Aprepitant Bromocriptine mesylate Felodipine
FaSSIF FaSSIF
PhB PhB PhB
102.4 34.2
81.4 99.4 35.0
11.8 24.6
24.8 29.8 12.5
The results presented in Table 3 can be compared to a previous interlaboratory study that used calibrated tablets in 28 laboratories to assess the variability in dissolution testing using standard USP II dissolution baths. The CV in that study was 9–24% [103]. In general, then, ca. 10–30% seems to be a good ap-proximation of the variability that can be expected in dissolution measure-ments in different buffers [104].
Table 4. The CV of disc IDR in FaSSIF and phosphate buffer (PhB) before and after standardized data analysis.
Compound Medium CV(%) “Before” CV(%) “After”
Aprepitant FaSSIF 70.9 35.9 Bromocriptine mesylate Felodipine Aprepitant Bromocriptine mesylate Felodipine
FaSSIF FaSSIF
PhB PhB PhB
94.4 54.7
109.6 74.5 75.0
40.0 48.9
127.5 70.9 77.3
For disc dissolution, the CV of IDR before standardized analysis ranged from 54.7% to 94.4% in FaSSIF and from 74.5% to 109.6% in PhB. The change in CV after re-analysis of the disc IDR data was not as pronounced as that ob-tained for Sapp. However, the disc data are based on fewer replicates and par-ticipant laboratories, which also is a result of the difficulty of measuring IDR from disc. To establish guidelines on how to perform IDR measurements with the µDISS Profiler, the IDR of atenolol, fenofibrate, ibuprofen, indomethacin, tadalafil and valsartan were measured in FaSSIF using both powder dissolution and

34
discs (Figure 11) [64, 65]. Here, it became obvious that disc IDR was suitable for compounds with a relatively high solubility (>1 mg/mL). For example, the IDR values of atenolol, ibuprofen and valsartan were measured using the disc method because of their solubility above 1 mg/mL in FaSSIF. Using a disc, the IDR could be measured within an hour. In contrast, powder dissolution is difficult to perform for these compounds because so much material needs to be added to the measurement, which will disturb the reading of the μDISS in situ UV probes. On the other hand, disc IDR is difficult to perform for poorly water-soluble compounds due to low concentrations. To be able to detect any-thing at all, the disc needs to run for several hours, for some compounds up to several days. In this case, the only alternative is usually to use powder disso-lution, even though the surface area is not known and the IDR is estimated only from the solubility plateau.
Figure 11. Dissolution profiles of the six experimental compounds in FaSSIF pre-sented as mean ± SD. To evaluate the proposed guidelines, compounds (Cpd) 1-5 were used. The IDR values were measured from powder dissolution (■ red squares) and/or disc dissolution (● blue circles).

35
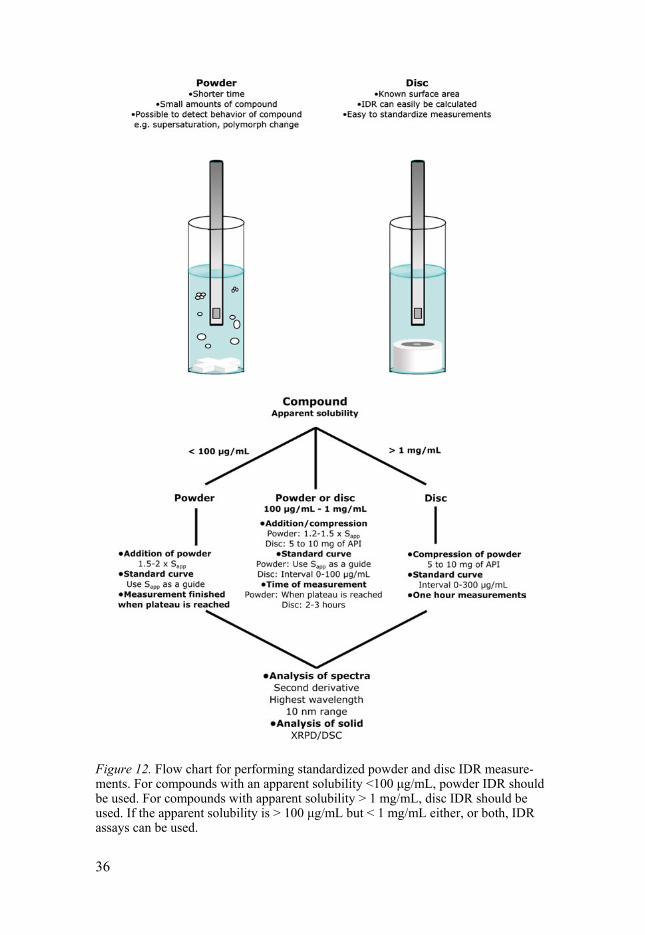
Based on the results obtained from the experimental analysis, a decision flowchart was established for IDR measurements (Figure 12). Here, powder dissolution is recommended for compounds with a solubility less than 100 µg/mL. For compounds with a solubility above 1 mg/mL, disc dissolution is most suitable. For a compound with a solubility between 100 µg/mL and 1 mg/mL, the IDR can be obtained by either powder or disc dissolution.
To validate the suggested flowchart, five compounds (Cpd 1-5; Figure 11), still under development were received from one of the industrial partners, and the IDR of those were determined using the suggested flowchart (Figure 12). Using the established workflow, the IDR values of the five compounds could be determined on the first try. Because cpd 5 had a solubility above 1 mg/mL, disc dissolution was used and an IDR of 972 mg/min/cm2 was obtained within 60 minutes. For cpd 1-3, the solubilities were less than 100 µg/mL, and in these cases, powder dissolution was used to determine the IDR values. Cpd 4 had a solubility between 100 µg/mL and 1 mg/mL, and in this case, disc dis-solution was selected to determine the IDR, which was successfully measured at 4.8 µg/min/cm2. Hence, it was shown that the proposed standardized proto-cols and workflow suggested for the µDISS Profiler produced excellent dis-solution rate measurements on the first run without any need to refine the measurements.
36
Figure 12. Flow chart for performing standardized powder and disc IDR measure-ments. For compounds with an apparent solubility <100 μg/mL, powder IDR should be used. For compounds with apparent solubility > 1 mg/mL, disc IDR should be used. If the apparent solubility is > 100 μg/mL but < 1 mg/mL either, or both, IDR assays can be used.

37
Measuring IDR using powder, disc and suspension-based methods New improved dissolution methods would be of great value as these could reduce the time needed for formulation development and the number of clini-cal studies required [105, 106]. Disc IDR (DIDR) and powder IDR (PIDR) are commonly used to determine the dissolution rate of a compound, but an addi-tional method, using suspensions, is a potential strategy for obtaining more rapid and accurate dissolution measurements [68]. The IDR of six model com-pounds were measured in FaSSIF using suspensions, discs and powder (Table 5). The plateau of the dissolution profiles were used to determine the Sapp val-ues. As can be seen in Table 5, the suspension IDR (SIDR) were similar to the DIDR obtained, which indicates that SIDR can be used as an alternative to the traditional DIDR measurements. The advantage of using SIDR over DIDR is rapid IDR determination (only a few minutes instead of several hours, some-times even days needed to obtain an IDR from the disc method). One disad-vantage of the disc method is that some compounds are difficult to compress, or uneven disc surfaces may be obtained during compression. Another benefit with a suspension is the possibility to standardize experiments by adding a specific amount of compound to each measurement, e.g. an exact volume of suspension is pipetted into each vial, and hence, a high reproducibility can be obtained, which is especially valuable when comparing dissolution rates in various biorelevant media, or comparing different formulations.
Different saturation levels were studied in the dissolution experiments, here described as low, intermediate (IM) and high. In this case, the material added resulted in non-saturated (low) or saturated solutions (IM and high). The SIDR obtained from these measurements were not statistically significantly differ-ent, and hence, the IDR can be accurately determined regardless of the amount compound added (Table 5).
Table 5. The Sapp and IDR measured in FaSSIF, using powder, disc and suspension-based methods. The SIDR values were measured using a low, intermediate (IM) and high concentration of concentration of suspension.
Compound Sapp (µg/mL)
PIDR (µg/min/cm2)
DIDR (µg/min/cm2)
SIDR Low (µg/min/cm2)
SIDR IM (µg/min/cm2)
SIDR High (µg/min/cm2)
Aprepitant Cinnarizine Felodipine Fenofibrate Griseofulvina Indomethacin Tadalafil
17.3 ± 1.8 11.1 ± 1.2 31.8 ± 1.7 12.2 ± 0.3 10.7 ± 0.5 422 ± 18 5.9 ± 0.7
1.3 ± 0.2 1.6 ± 0.2 4.4 ± 0.2 1.2 ± 0.0 1.1 ± 0.1
42.8 ± 1.8 0.6 ± 0.1
2.2 ± 0.7 0.1 ± 0.1 0.8 ± 0.2 0.2 ± 0.0
10.1 ± 1.0 60.1 ± 5.6 0.5 ± 0.0
1.0 ± 0.2 0.2 ± 0.0 1.0 ± 0.1 0.3 ± 0.1 11.1 ± 1.3 70.6 ± 3.0 1.6 ± 0.3
- -
1.2 ± 0.1 0.3 ± 0.0
10.1 ± 0.7 65.2 ± 4.8 1.8 ± 0.1
1.5 ± 0.2 0.2 ± 0.0 1.2 ± 0.0 0.2 ± 0.0 9.0 ± 1.1
63.2 ± 8.7 1.7 ± 0.1
Abbreviations: Apparent solubility (Sapp), Powder IDR (PIDR), disc IDR (DIDR) and suspen-sions IDR (SIDR) a Griseofulvin was studied in phosphate buffer (PhB).

38
Griseofulvin was used as a reference compound based on a previous study that investigated the dissolution rate using a known surface area [37]. The SIDR for griseofulvin was compared to these values, which were in the range of 9.0 to 13.7 μg/min/cm2. Hence, the SIDR method developed in this study produce data that are in agreement with other SIDR methods available.
In Figure 13, dissolution profiles of felodipine and tadalafil are presented as examples demonstrating the time needed for dissolution profiling of the dif-ferent methods. Noticeably, the suspension method has a rapid dissolution, with most of the compound dissolving within the first minutes, compared to the disc method, which has a very slow release rate.
Figure 13. Dissolution profiles of felodipine and tadalafil in FaSSIF using suspen-sions (● dark blue circles), powder (■ light blue squares) and discs (▲ black trian-gles). The dissolution profiles from the disc measurements were slow because of the small surface area of the disc (0.071 cm2). The suspensions with milled particles had a more rapid dissolution.
Figure 14 presents the ratio of IDR and Sapp in FaSSIF for the six model com-pounds studied. This ratio could potentially be used as a tool to determine if a compound is dissolution rate-limited, and hence, would benefit from formu-lation strategies such as particle size reduction. Cinnarizine has the lowest ra-tio of 0.015, while tadalafil has the highest ratio of 0.23. A low ratio is ex-pected when a compound is dissolution rate-limited. However, this limitation depends on the dose and particle size, and the former is not usually known early on in drug development process.
The IDR/Sapp ratio was also compared to the logP values of the compounds. As can be observed in Figure 14, the compounds with the highest logP values had the lowest ratios. For example, when using biorelevant media (FaSSIF in this case), it has been reported that the solubilization of a drug in the micells and vesicles present in the solution will increase with an increased drug lipo-philicity [50]. However, the dissolution rate does not increase to the same ex-tent, which may potentially drive a lower IDR/Sapp ratio.

39
Figure 14. The IDR/Sapp ratios compared to the logP values for the six model com-pounds used.

40
Dissolution from single particles Simulations of fluid flow velocities and single particle dissolution The fluid velocities used in the single particle dissolution measurements were 46, 66, 88 and 103 mm/s, which are similar or higher, compared to the fluid flow velocities estimated in other dissolution apparatuses. For example, the USP 4 dissolution apparatus [107], which has a similar laminar fluid flow pat-tern, has estimated fluid velocities of 0.33 mm/s and 2.4 mm/s, depending on the flow rate and diameter of the cell used [107, 108]. For the basket (USP 1) and paddle (USP 2) apparatuses, simulated fluid velocities at 50 rpm range from 0 to 67 mm/s and 26 mm/s, respectively [109]. In the µDISS Profiler, the estimated fluid velocities at 100 rpm are 17 mm/s for the disc stirrer and 57 mm/s for the cross stirrers [110].
To model in silico flow conditions and dissolution rate in the single particle set-up, CFD simulations were used. Rectangular particles similar to the parti-cles in the experiments were compared to equivalent spherical particles with the same dimensions and surface area. Figure 15 shows the fluid flow pattern in the micropipette-assisted microscope technique that was assessed for two of the fluid velocities, 46 mm/s and 103 mm/s.
Figure 15. Magnitude of fluid velocity across the flow-pipette for a rectangular par-ticle (a,b) and an equivalent sphere (c,d) for two different fluid velocities: (a,c) 46 mm/s and (b,d) 103 mm/s.
41
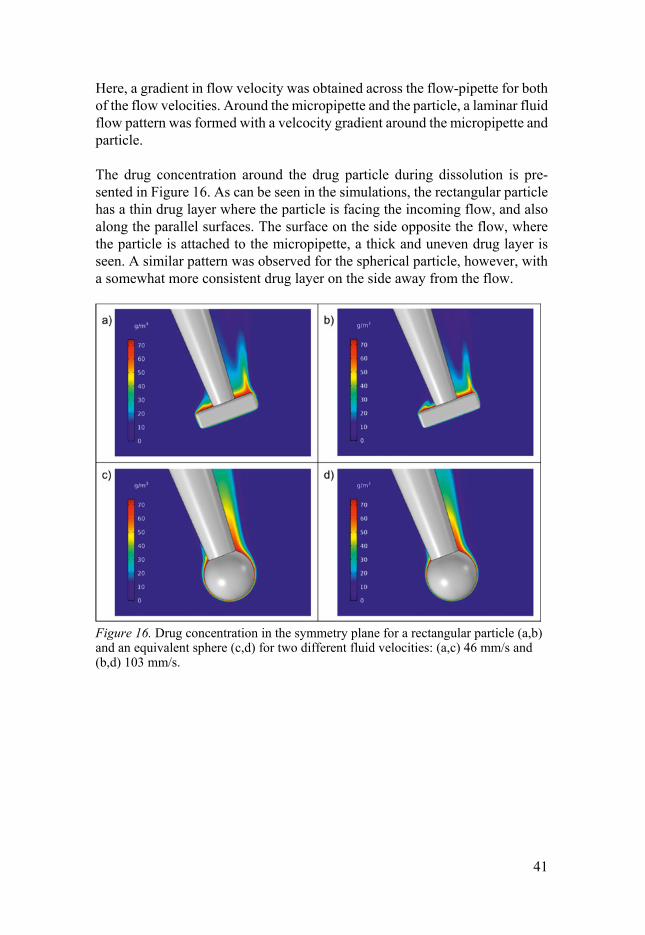
Here, a gradient in flow velocity was obtained across the flow-pipette for both of the flow velocities. Around the micropipette and the particle, a laminar fluid flow pattern was formed with a velcocity gradient around the micropipette and particle. The drug concentration around the drug particle during dissolution is pre-sented in Figure 16. As can be seen in the simulations, the rectangular particle has a thin drug layer where the particle is facing the incoming flow, and also along the parallel surfaces. The surface on the side opposite the flow, where the particle is attached to the micropipette, a thick and uneven drug layer is seen. A similar pattern was observed for the spherical particle, however, with a somewhat more consistent drug layer on the side away from the flow.
Figure 16. Drug concentration in the symmetry plane for a rectangular particle (a,b) and an equivalent sphere (c,d) for two different fluid velocities: (a,c) 46 mm/s and (b,d) 103 mm/s.

42
The flow patterns around the particles were investigated in more detail (Figure 17), and as can be seen, the dissolution rates on the opposite sides of the par-ticle were different. The dissolution of the rectangular particle was more rapid on the edges and at the corners (Figure 17a,b), and as a consequence, the shape of the rectangular particle becomes somewhat rounder during the dissolution measurement. As expected, the dissolution was most rapid for the side facing the incoming flow, intermediate for the parallel sides, and smallest for the side facing away from the flow. A gradual reduction of the dissolution rate along the direction of the flow was obtained for the sphere (Figure 17c,d).
Figure 17. Dissolution rates of a rectangular particle viewed from different angles and an equivalent sphere for two different fluid velocities (a,c) 46 mm/s and (b,d) 103 mm/s.
43
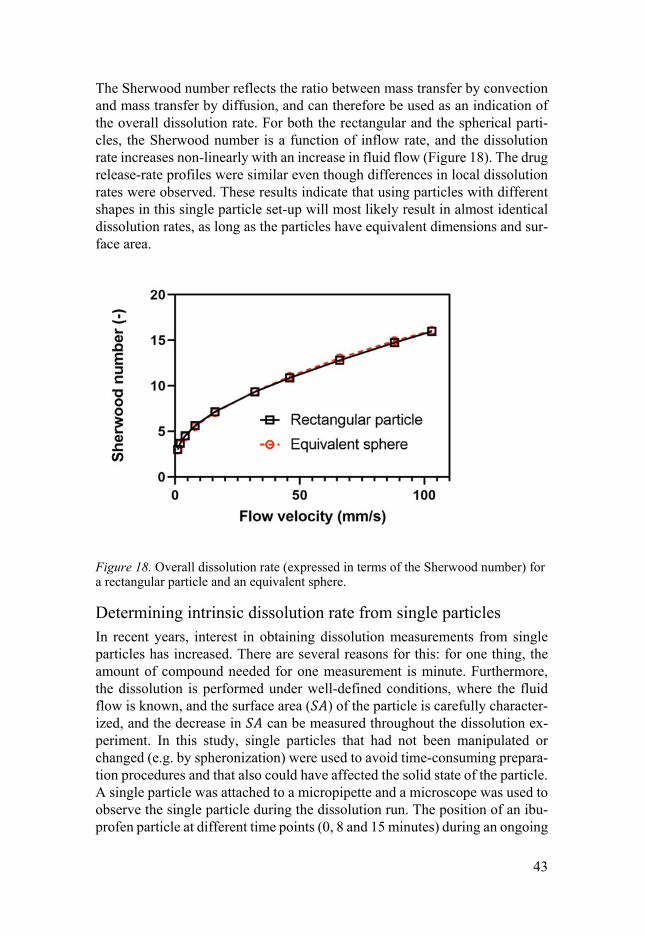
The Sherwood number reflects the ratio between mass transfer by convection and mass transfer by diffusion, and can therefore be used as an indication of the overall dissolution rate. For both the rectangular and the spherical parti-cles, the Sherwood number is a function of inflow rate, and the dissolution rate increases non-linearly with an increase in fluid flow (Figure 18). The drug release-rate profiles were similar even though differences in local dissolution rates were observed. These results indicate that using particles with different shapes in this single particle set-up will most likely result in almost identical dissolution rates, as long as the particles have equivalent dimensions and sur-face area.
Figure 18. Overall dissolution rate (expressed in terms of the Sherwood number) for a rectangular particle and an equivalent sphere.
Determining intrinsic dissolution rate from single particles In recent years, interest in obtaining dissolution measurements from single particles has increased. There are several reasons for this: for one thing, the amount of compound needed for one measurement is minute. Furthermore, the dissolution is performed under well-defined conditions, where the fluid flow is known, and the surface area ( ) of the particle is carefully character-ized, and the decrease in can be measured throughout the dissolution ex-periment. In this study, single particles that had not been manipulated or changed (e.g. by spheronization) were used to avoid time-consuming prepara-tion procedures and that also could have affected the solid state of the particle. A single particle was attached to a micropipette and a microscope was used to observe the single particle during the dissolution run. The position of an ibu-profen particle at different time points (0, 8 and 15 minutes) during an ongoing

44
dissolution measurement is presented in Figure 19. The micropipette kept the particle in a fixed position during the dissolution run, which enabled accurate measurements of the length ( ) and the thickness ( ) of the particle. The third particle dimension, the breadth ( ), was estimated based on the decreases of
and .
Figure 19. A single particle dissolution experiment of an ibuprofen particle in the micropipette-assisted microscopy technique.
The IDR values from the single particles were calculated using Equation 9 and also by using the slope of a plot of the cumulative dissolved amount of com-pound per surface area (µg/cm2) against time (min). The derived IDR values were similar, however, the calculated values from Equation 9 showed higher standard deviations, and hence, the estimated IDR values from the slope are presented here (Table 6). As can be seen in Table 6, the dissolution rate in-creased with an increase in the fluid velocity.
Table 6. Intrinsic dissolution rate (IDR) of carbamazepine, ibuprofen and indometh-acin single particles in four different fluid velocities (46, 66, 88 and 103 mm/s).
Carbamazepine IDR (µg/min/cm2)
Ibuprofen IDR (µg/min/cm2)
Indomethacin IDR (µg/min/cm2)
46 mm/s 246.0 ± 15.7 47.8 ± 6.2 6.74 ± 1.68 66 mm/s 88 mm/s 103 mm/s
284.7 ± 31.3 297.3 ± 31.9 311.6 ± 17.0
57.2 ± 4.8 63.6 ± 6.7
67.7 ± 13.1
7.87 ± 0.53 8.22 ± 0.33 8.86 ± 1.98
Figure 20 plots the cumulative amount of dissolved drug (µg/cm2) against time (min) to illustrate the dissolution process of the single particles. The single particles used in the dissolution experiments had an initial projected area di-ameter ( ) of 37.5 to 104.6 µm and an initial mass of 0.06 to 0.85 µg. The final of the single particles was 29.0 to 80.0 µm and the final mass ranged from 0.01 to 0.26 µg. The smallest particles that could be measured with this technique were approximately 30 µm. When the particles became smaller than 30 µm they either detached from the micropipette or could no longer be ob-served clearly in the microscope. When evaluating the different fluid veloci-ties used, it became evident that it was problematic to measure the dissolution

45
rate at the highest fluid velocity (103 mm/s). For carbamazepine, the dissolu-tion run was only maintained for a few minutes, which made the results some-what uncertain at this high fluid velocity. In contrast, indomethacin, which is the most poorly water-soluble compound of the three compounds studied, could be measured for 60 minutes at all four fluid velocities.
Figure 20. The cumulative amount of dissolved drug (µg/cm2) presented as mean ± SD in each fluid velocity (46, 66, 88 and 103 mm/s) for carbamazepine, ibuprofen and indomethacin.

46
Figure 21 plots IDR against the flow velocity, and it can be seen that the IDR increased with increased in fluid flow velocity, though IDR was perhaps ap-proaching a limit. This figure can be compared to Figure 18, which shows a similar relationship between Sherwood number and flow velocity. A disc IDR measurement of ibuprofen was performed in the µDISS and compared to the dissolution rate obtained from the single particles. The disc IDR obtained 9.0 ± 1.9 µg/min/cm2, which was markedly lower than the IDR obtained from the single particle measurements. The fluid flow velocity in the µDISS Profiler has been estimated at 17 mm/s for a disc stirrer [110], which is considerably slower than the fluid velocities of the single particle experiments (46–103 mm/s), and may partly explain the differences in IDR values obtained from the two different methods.
Figure 21. Intrinsic dissolution rate (IDR, µg/min/cm2) as a function of flow veloc-ity (mm/s) for ibuprofen single particles (● black circles), and disc intrinsic dissolu-tion rate (DIDR) measurement of ibuprofen (■ red square).
47
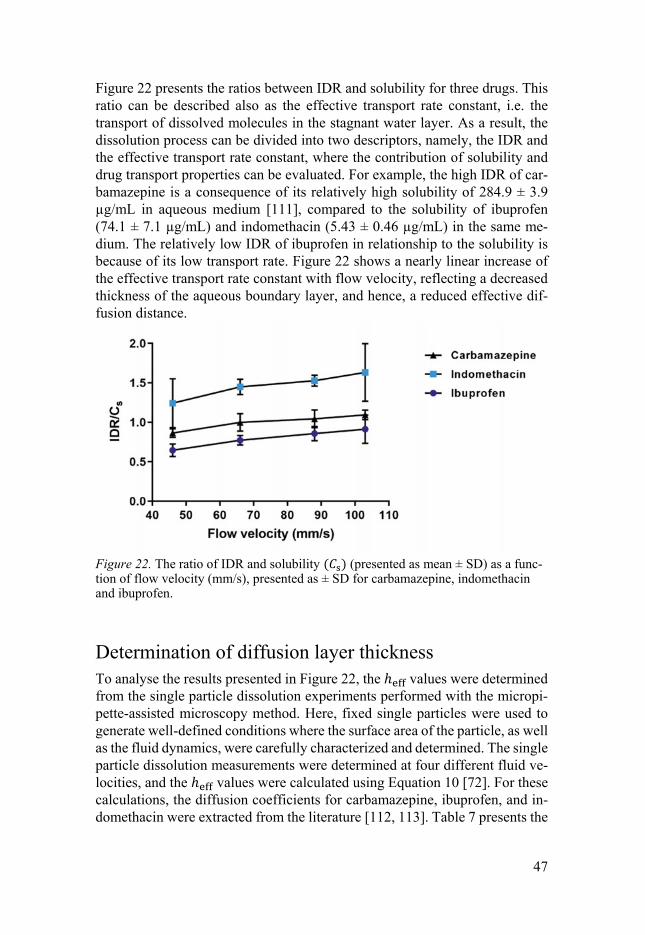
Figure 22 presents the ratios between IDR and solubility for three drugs. This ratio can be described also as the effective transport rate constant, i.e. the transport of dissolved molecules in the stagnant water layer. As a result, the dissolution process can be divided into two descriptors, namely, the IDR and the effective transport rate constant, where the contribution of solubility and drug transport properties can be evaluated. For example, the high IDR of car-bamazepine is a consequence of its relatively high solubility of 284.9 ± 3.9 µg/mL in aqueous medium [111], compared to the solubility of ibuprofen (74.1 ± 7.1 µg/mL) and indomethacin (5.43 ± 0.46 µg/mL) in the same me-dium. The relatively low IDR of ibuprofen in relationship to the solubility is because of its low transport rate. Figure 22 shows a nearly linear increase of the effective transport rate constant with flow velocity, reflecting a decreased thickness of the aqueous boundary layer, and hence, a reduced effective dif-fusion distance.
Figure 22. The ratio of IDR and solubility ( ) (presented as mean ± SD) as a func-tion of flow velocity (mm/s), presented as ± SD for carbamazepine, indomethacin and ibuprofen.
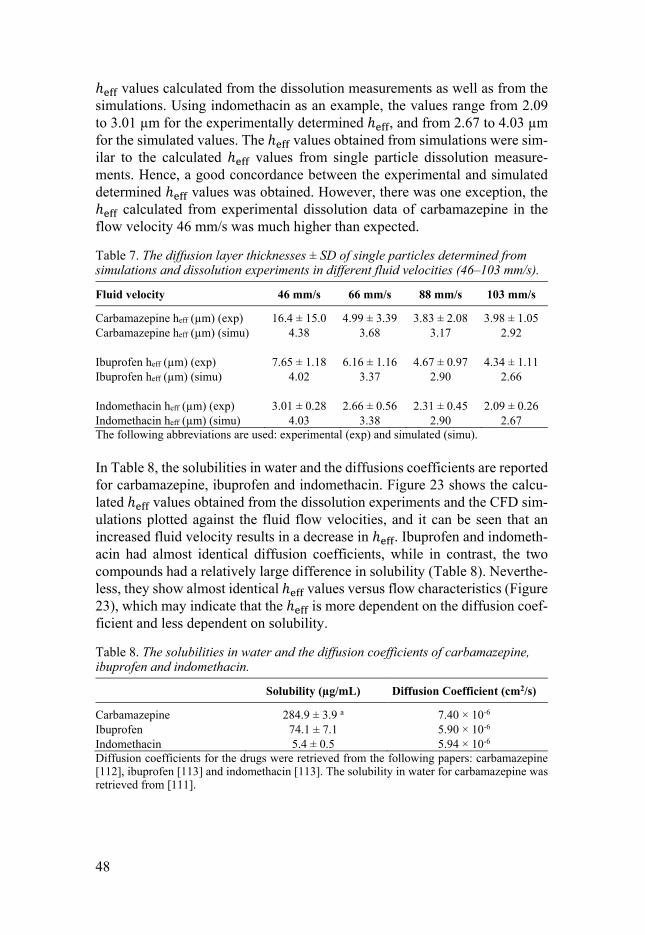
Determination of diffusion layer thickness To analyse the results presented in Figure 22, the ℎ values were determined from the single particle dissolution experiments performed with the micropi-pette-assisted microscopy method. Here, fixed single particles were used to generate well-defined conditions where the surface area of the particle, as well as the fluid dynamics, were carefully characterized and determined. The single particle dissolution measurements were determined at four different fluid ve-locities, and the ℎ values were calculated using Equation 10 [72]. For these calculations, the diffusion coefficients for carbamazepine, ibuprofen, and in-domethacin were extracted from the literature [112, 113]. Table 7 presents the
48
ℎ values calculated from the dissolution measurements as well as from the simulations. Using indomethacin as an example, the values range from 2.09 to 3.01 µm for the experimentally determined ℎ , and from 2.67 to 4.03 µm for the simulated values. The ℎ values obtained from simulations were sim-ilar to the calculated ℎ values from single particle dissolution measure-ments. Hence, a good concordance between the experimental and simulated determined ℎ values was obtained. However, there was one exception, the ℎ calculated from experimental dissolution data of carbamazepine in the flow velocity 46 mm/s was much higher than expected.
Table 7. The diffusion layer thicknesses ± SD of single particles determined from simulations and dissolution experiments in different fluid velocities (46–103 mm/s).
Fluid velocity 46 mm/s 66 mm/s 88 mm/s 103 mm/s
Carbamazepine heff (µm) (exp) 16.4 ± 15.0 4.99 ± 3.39 3.83 ± 2.08 3.98 ± 1.05 Carbamazepine heff (µm) (simu) Ibuprofen heff (µm) (exp) Ibuprofen heff (µm) (simu) Indomethacin heff (µm) (exp) Indomethacin heff (µm) (simu)
4.38
7.65 ± 1.18 4.02
3.01 ± 0.28
4.03
3.68
6.16 ± 1.16 3.37
2.66 ± 0.56
3.38
3.17
4.67 ± 0.97 2.90
2.31 ± 0.45
2.90
2.92
4.34 ± 1.11 2.66
2.09 ± 0.26
2.67 The following abbreviations are used: experimental (exp) and simulated (simu). In Table 8, the solubilities in water and the diffusions coefficients are reported for carbamazepine, ibuprofen and indomethacin. Figure 23 shows the calcu-lated ℎ values obtained from the dissolution experiments and the CFD sim-ulations plotted against the fluid flow velocities, and it can be seen that an increased fluid velocity results in a decrease in ℎ . Ibuprofen and indometh-acin had almost identical diffusion coefficients, while in contrast, the two compounds had a relatively large difference in solubility (Table 8). Neverthe-less, they show almost identical ℎ values versus flow characteristics (Figure 23), which may indicate that the ℎ is more dependent on the diffusion coef-ficient and less dependent on solubility.
Table 8. The solubilities in water and the diffusion coefficients of carbamazepine, ibuprofen and indomethacin.
Solubility (µg/mL) Diffusion Coefficient (cm2/s)
Carbamazepine 284.9 ± 3.9 a 7.40 × 10⁻⁶ Ibuprofen Indomethacin
74.1 ± 7.1 5.4 ± 0.5
5.90 × 10⁻⁶ 5.94 × 10⁻⁶
Diffusion coefficients for the drugs were retrieved from the following papers: carbamazepine [112], ibuprofen [113] and indomethacin [113]. The solubility in water for carbamazepine was retrieved from [111].

49
Figure 23. Diffusion layer thickness (μm) vs fluid velocity (mm/s) determined from simulations and dissolution experiments.

50
Conclusions
This thesis focused on the development of new and refined small-scale ap-proaches for measuring dissolution, which should help researchers study the factors that influence the apparent solubility and dissolution rate of poorly wa-ter-soluble compounds. The emphasis was on developing methods that can measure and evaluate the intrinsic dissolution rate (IDR), i.e. the surface area normalized dissolution rate (SAND). Here, different methods (discs, powder, suspensions and single particles) were used as a means to measure IDR under different experimental conditions. The specific conclusions of this thesis are:
• The analyses of BCS class II compounds demonstrates that acidic compounds may be classified as solubility-limited even though they are completely absorbed in vivo. In this study, 20 of the 29 BCS class II compounds with FA >85% were expected to be completely dis-solved. Hence, the BCS classification is not necessarily completely informative, and are perhaps not being used to its full potential (paper I).
• When measuring Sapp and IDR using the µDISS Profiler, standardized protocols for the experimental design and the data analysis were re-quired to minimize interlaboratory variability. Factors influencing the dissolution studies were the quality of the standard curve, the amount of undissolved powder disturbing the UV probes, and the quality of the discs. A guideline for IDR measurements in the µDISS Profiler was established, which resulted in good agreement in IDR data among various laboratories (paper II).
• The use of suspensions allows an increased, well-defined surface area to be in contact with the dissolution medium, providing rapid and ac-curate measurements of IDR. Furthermore, suspensions may be a po-tential bridge between in vitro and in vivo measurements during the early stages of drug development (paper III).
51
• The IDR/Sapp ratio could be a potential tool for identifying the likeli-hood of dissolution rate-limited absorption for a compound, and hence, its sensitivity to particle size reduction (paper III).
• Single particle dissolution measurements under well-defined condi-tions resulted in dissolution data of high quality. The IDR values were determined in four fluid flow velocities using particles with a pro-jected area diameter ( ) of 37.5–104.6 µm. The IDR increased with an increase in fluid flow velocity for all of the studied compounds (paper IV).
• Using CFD simulations, the dissolution rates were investigated for rectangular particles similar to the particles used in the experiments, and equivalent spheres, and it was concluded that the overall drug re-lease rate was similar from the two shapes. Thus, differently shaped particles can be studied by the single particle method and the IDR values obtained can be compared (paper IV).
• The effective hydrodynamic boundary layer thickness (ℎ ) could be determined from single particle measurements under laminar fluid flow at different fluid velocities. A good concordance was found be-tween experimental and simulated calculated ℎ values. The results indicate that the ℎ is independent of the solubility, and depends pre-dominantly on the diffusion coefficient (paper V).

52
Future perspectives
Dissolution testing is an important tool to help predict the in vivo performance of drug compounds and formulations. Lately, much effort has been focused on improving in vitro conditions to better reflect in vivo conditions. For ex-ample, biorelevant dissolution media have been developed that mimic the gas-trointestinal (GI) fluids, and dissolution/absorption apparatuses have been de-signed to be more similar the GI tract and the transit patterns. Nevertheless, some aspects have received little attention, such as how well the in vitro hy-drodynamics correspond to in vivo hydrodynamics. There is a need for an im-proved knowledge of hydrodynamics in the GI tract as well as in the dissolu-tion instruments, as a means to improving in vitro-in vivo correlations (IVIVC).
Various apparatuses and procedures are used to evaluate and measure the dis-solution rate, making it difficult to compare dissolution data from different studies. For example, the exact way that dissolution methods (e.g. powder, discs, and suspensions) are used varies a lot in different laboratories, which may also use different biorelevant media and stirring rates. Furthermore, im-portant factors such as particle size and shape, surface area and heff are, in many cases, not presented at all. The contemporary literature includes an al-most unlimited number of dissolution studies, but with such high variability and discrepancies, it is difficult to draw any general conclusions and to obtain decent input data for in silico models. Hence, more standardized methods and procedures are needed to more successfully make use of the dissolution data received.
In this study, a single particle dissolution approach was used as a promising method for obtaining dissolution data of high quality under well-defined con-ditions. This single particle dissolution approach can be used as a complemen-tary method to traditional dissolution testing, to increase the knowledge about how different parameters influence the dissolution process. For example, the effect of different biorelevant media can be studied on a single particle level using several different fluid flow velocities. Also, the effect of different parti-cle sizes and shapes can be studied to a greater extent, and use can be made of different shape factors. It would be of interest to compare the results obtained in the single particle dissolution approach to dissolution data obtained by dis-solution instruments with a similar fluid flow pattern, i.e. the USP 4 apparatus.

53
Another alternative way to use the single particle approach studied in this the-sis would be to image freely rotating particles dissolving in a biorelevant me-dium. Such a set-up would better mimic in vivo conditions, compared to the micropipette technique used where the particle is fixed in a steady position. The hydrodynamic conditions will probably differ dramatically, and poten-tially result in very different intrinsic dissolution rate (IDR) values.
Finally, the increased interest in new and innovative formulations, as well as drugs targeting routes other than traditional oral administration (e.g. pulmo-nary formulations for inhaling) demand more modified and adjustable in vitro test systems that better predict in vivo performance relevant to those different conditions.
54
Populärvetenskaplig sammanfattning
En majoritet av alla läkemedel tas oralt, dvs. genom att svälja en tablett eller kapsel via munnen. Detta gör det enkelt och smidigt för patienten att själv sköta sitt läkemedelsintag, samtidigt som tillverkning av orala beredningar så som tabletter är relativt enkel och kan göras i stor skala. För att en tablett ska kunna tas upp och utöva sin effekt i kroppen behöver den först falla sönder till mindre enheter, primära partiklar, som sedan löses upp i magtarmvätskan. Därefter kan fria läkemedelsmolekyler ta sig över tarmväggen och nå blodcir-kulationen. En nackdel med många av de läkemedel som utvecklas idag är att de är svårlösliga i vatten och även har en mycket långsam upplösning i mag-tarmvätskan. Då läkemedlet inte hinner lösa upp sig under den tid det trans-porteras genom magtarmkanalen, kan det heller inte tas upp av kroppen och utöva sin tänkta effekt. Därför är just olika strategier för att öka lösligheten och upplösningen av svårlösliga orala läkemedel en viktig aspekt inom läke-medelsframtagning. Syftet med denna avhandling är att utveckla nya metoder och strategier för att kunna mäta samt utvärdera ett läkemedels upplösnings-förmåga i magtarmvätskan. För att utvärdera variabiliteten av upplösningsstudier mellan olika laboratorier gjordes en studie tillsammans med ett antal läkemedelsföretag och universitet. Alla medverkande parter använde sig av samma upplösningsinstrument (µDISS Profiler), läkemedelssubstanser samt protokoll. De initiala resultaten visade att det var stor spridning i de löslighets- och upplösningsdata som rap-porterades. Genom att upprätta riktlinjer och ett flödesschema över hur expe-rimenten skulle utföras, samt hur data skulle analyseras på ett enhetligt sätt minskade variabiliteten och god överensstämmelse av löslighets- och upplös-ningsdata erhölls. Ett vanligt sätt att rapportera ett läkemedels upplösning är genom den så kal-lade inneboende upplösningshastigheten, dvs. den ytspecifika upplösnings-hastigheten (μg/min/cm2) där upplösningshastigheten justeras mot ytan på det fasta materialet (läkemedlet) i kontakt med vatten. Den inneboende upplös-ningshastigheten brukar mätas genom att använda en disk (en liten pressad tablett) med konstant area (cm2) eller genom att använda läkemedelspulver. Nackdelen med att använda en disk är att dessa upplösningsförsök oftast går väldigt långsamt för svårlösliga substanser, ibland är koncentrationen till och med så låg att en upplösning inte går att detektera. Nackdelen med att använda

55
pulver är att arean för de ingående partiklarna oftast inte är känd, vilket gör att uppmätta upplösningsvärden är otillförlitliga. För att lösa denna problematik har en ny metod utformats där suspensioner används för att mäta upplösnings-hastigheten. Genom att använda sig av suspensioner där läkemedelspartiklar mals ner till en bestämd storlek, kan den totala arean av alla ingående partiklar beräknas. Fördelen med att använda suspensioner vid bestämning av den in-neboende upplösningshastigheten är att dessa mätningar går snabbare samt ger mer tillförlitliga värden. Upplösningsprocessen för ett läkemedel är komplicerad då det ingår många olika komponenter. För att bättre förstå hur upplösningen går till för varje en-skild partikel utvecklades en singel-partikel metod. I denna metod fästes en enskild partikel på en mikro-pipett och analyserades med hjälp av ett mikro-skop under olika flödeshastigheter. Arean av den enskilda partikeln kunde ut-värderas under hela upplösningsförsöket vilket resulterade i väldefinierade upplösningsvärden. Det var också tydligt att den inneboende upplösningshas-tigheten ökade med en ökad flödeshastighet. Från upplösningsförsöken kunde också tjockleken på diffusionslagret (ℎ) beräknas, vilket kan ge ytterligare värdefull information om upplösningsprocessen. Avslutningsvis har denna avhandling ökat den grundläggande förståelsen för upplösning av svårlösliga substanser. De metoder och strategier som present-eras kan användas för att göra mer välgrundade antaganden och beslut när upplösning av substanser utvärderas i läkemedelsutveckling. Detta leder i sin tur till en mindre kostsam och mer effektiv utveckling av nya läkemedel.

56
Acknowledgements
The work presented in this thesis was carried out at the Department of Phar-macy and the Department of Biopharmaceutical Sciences, Faculty of Phar-macy, Uppsala University. I would like to acknowledge the Oral Biopharma-ceutical Tools (OrBiTo) project within the Innovative Medicines Initiative (IMI) for partly funding my PhD project, as well as giving me the opportunity to collaborate with international researchers from the academia and pharma-ceutical industry. Apotekarsocieteten, IF:s stiftelse, Apotekare C.D. Carlssons stiftelse and Elisabeth och Alfred Ahlqvists stiftelse are gratefully acknowl-edged for giving me the opportunity to participate and present my research at international conferences. First, I would like to thank the Faculty of Pharmacy and all the amazing peo-ple, which I have had the pleasure of working with. I would especially like to thank Professor Christel Bergström who introduced me to the pharmaceutical research world and gave me the opportunity to be a part of the OrBiTo project. Min handledare Professor Göran Alderborn. Tack för ditt utomordentliga stöd under min doktorandtid. Med handen på hjärtat, utan dig hade jag inte varit där jag är idag. Du har gett mig en stor frihet att utvecklas som forskare, sam-tidigt som din noggrannhet och förmåga att se det större perspektivet har lyft kvaliteten på min forskning. Min bi-handledare Professor Göran Frenning. Tack för din hjälpsamhet och din alltid lika kloka input. Ett speciellt tack för hjälpen med simuleringarna i upplösningsstudierna med enskilda partiklar. Dr. Johan Gråsjö, tack för all hjälp under åren med att förstå ekvationer samt att analysera data. Din positiva inställning och ditt glada humör är guld värt! Ett extra stort tack för hjälpen med artikel #5 som vi gjorde helt exceptionellt bra. Former and current colleagues in the Pharmaceutics group. Thank you for the years we have shared together, all of the research discussions, journal clubs and times in the lab. To all my fellow PhD students; Anna, Irès, Maryam, Marilena and Sohan – I look forward to your defence! Jonas, thanks for being a great “rumbo” the last year of my PhD studies.

57
Dr. Lucia Lazorova, tack för ALLT! Du är en fantastisk människa och har ett hjärta av guld. Du finns alltid där och ställer upp i vått och torrt. Tack för all hjälp i labbet, på kurslabb, med alla möjliga administrativa uppgifter, men framförallt, tack för att du är du och alltid har stöttat mig! Dr. Samaneh Pazesh, BMC har inte varit detsamma utan dig och jag saknar våra dagliga pratstunder. Tack för att du alltid peppat mig och funnits där för mig som kollega och vän. Till mina forna kollegor Dr. Jonas Fagerberg, Dr. Linda Alskär, Dr. Caroline Alvebratt och Dr. Khadijah Edueng. Tack Jonas för att du tog dig an mig som SoFoSko-student, lärde mig allt du kunde om svårlösliga substanser och för ditt alltid lika glada och optimistiska humör. Tack Linda för alla våra pratstun-der, för ditt stöd under min doktorandtid och för att du såg till att labbet alltid var i tipp topp Tack Carro för att du valde att göra ditt examensarbete hos mig, samt ditt bidrag i flera av mina artiklar. Ditt alltid lika positiva humör och glada skratt smittar av sig på labb! Thank you Khadijah for all the help in the lab, and for taking such good care of the µDISS Till Uppsala universitet, universitetsledningen, konsistoriet och alla som jag fått äran att spendera tid tillsammans med under mina år som ordförande för Farmaceutiska doktorandrådet (FDR) och Doktorandnämnden (DN). Det har varit en stor ära, ett nöje och en otrolig ynnest att få träffa så många inspire-rande ledare, forskare, doktorander och studenter. Ett stort tack till alla mina fantastiska vänner, min släkt och familj som stöttat mig under min tid som doktorand. Utan er hade detta inte varit möjligt! Mia, Nina, Sanna och Tine, tack för att ni kom in i mitt liv precis när jag behövde det. För alla våra härliga samtal, att få utvecklas tillsammans med er, San Fransisco och all inspiration i ”Home-gruppen” – ”You are driving in the wrong lane” Moster Camilla, tack för att du alltid finns där för mig och sprider positiv energi i mitt liv. Beatrice och Wendela, mina fina kusiner som jag alltid har så kul tillsammans med. Våra London-äventyr med pornstar martini går inte av för hackor Och söta Ralph, jag ser fram emot att hoppa mer studsmatta! Mamma och pappa, tack för att ni är mina största cheerleaders och stöttar mig i allt jag gör. Ert stöd har betytt allt under dessa år. Ni är världens bästa mor-mor och morfar till Céline, jag önskar att vi bodde närmare varandra så att vi kunde ses (nästan) varje dag

58
Niklas, min lillebror, för att du är du. Du har alltid varit speciell för mig, och vi håller ihop – du och jag! En stor kram till Loui, fasters lilla hjärtegull! Christopher, tack för att du är min stöttepelare och en fantastisk pappa till Céline. Ditt lugn har varit ovärderligt för mig under tider då jag varit mer – hysterisk Jag älskar dig! Céline, min fantastiska dotter! Du är min största inspiration här i livet och jag lär mig något nytt av dig varje dag. Du är envis, kaxig, rolig, smart och vet precis vad du vill. Du är min egen lilla Pippi Långstrump och när jag blir ”stor” ska jag bli precis som du. Jag älskar dig till månen och tillbaka! ♥ Sara Andersson, augusti, 2021

59
References
1. Lipinski, C.A., Drug-like properties and the causes of poor solubility and poor permeability, Journal of Pharmacological and Toxicological Methods, 2000, 44(1); 235-249.
2. Sugano, K., Okazaki, A., Sugimoto, S., Tavornvipas, S., Omura, A., Mano, T., Solubility and dissolution profile assessment in drug discovery, Drug Metabolism and Pharmacokinetics, 2007, 22(4); 225-254.
3. Sastry, S.V., Nyshadham, J.R., Fix, J.A., Recent technological advances in oral drug delivery – a review, Pharmaceutical Science & Technology Today, 2000, 3(4); 138-145.
4. Date, A.A., Hanes, J., Ensign, L.M., Nanoparticles for oral delivery: Design, evaluation and state-of-the-art, Journal of Controlled Release, 2016, 240 504-526.
5. Takano, R., Sugano, K., Higashida, A., Hayashi, Y., Machida, M., Aso, Y., Yam-ashita, S., Oral absorption of poorly water-soluble drugs: Computer simulation of fraction absorbed in humans from a miniscale dissolution test, Pharmaceutical Research, 2006, 23(6); 1144-1156.
6. Takano, R., Furumoto, K., Shiraki, K., Takata, N., Hayashi, Y., Aso, Y., Yama-shita, S., Rate-limiting steps of oral absorption for poorly water-soluble drugs in dogs; Prediction from a miniscale dissolution test and a physiologically-based computer simulation, Pharmaceutical Research, 2008, 25(10); 2334-2344.
7. Fagerberg, J.H., Bergstrom, C.A.S., Intestinal solubility and absorption of poorly water soluble compounds: predictions, challenges and solutions, Therapeutic De-livery, 2015, 6(8); 935-959.
8. Yu, L.X., Amidon, G.L., Polli, J.E., Zhao, H., Mehta, M.U., Conner, D.P., Shah, V.P., Lesko, L.J., Chen, M.L., Lee, V.H.L., Hussain, A.S., Biopharmaceutics classification system: The scientific basis for biowaiver extensions, Pharmaceu-tical Research, 2002, 19(7); 921-925.
9. Lipinski, C.A., Lombardo, F., Dominy, B.W., Feeney, P.J., Experimental and com-putational approaches to estimate solubility and permeability in drug discovery and development settings, Advanced Drug Delivery Reviews, 1997, 23(1-3); 3-25.
10. Curatolo, W., Physical chemical properties of oral drug candidates in the discov-ery and exploratory development settings, Pharmaceutical Science & Technology Today, 1998, 1(9); 387-393.
11. Henck, J.O., Byrn, S.R., Designing a molecular delivery system within a preclin-ical timeframe, Drug Discovery Today, 2007, 12(5-6); 189-199.
12. Amidon, G.L., Lennernäs, H., Shah, V.P., Crison, J.R., A theoretical basis for a biopharmaceutic drug classification: the correlation of in vitro drug product dis-solution and in vivo bioavailability, Pharmaceutical Research, 1995, 12 413-420.
13. FDA, FDA Guidance for Industry: Waiver of In Vivo Bioavailability and Bioe-quivalence Studies for Immediate-Release Solid Oral Dosage Forms Based on a Biopharmaceutics Classification System, 2017, https://www.gmp-compliance.org/files/guidemgr/UCM070246.pdf.

60
14. EMA, Committe for Medicinal Products for Human Use. Guideline on the inves-tigation of bioequivalence, 2010, https://www.ema.europa.eu/en/documents/sci-entific-guideline/guideline-investigation-bioequivalence-rev1en.pdf.
15. Pouton, C.W., Formulation of poorly water-soluble drugs for oral administration: Physicochemical and physiological issues and the lipid formulation classification system, European Journal of Pharmaceutical Sciences, 2006, 29(3-4); 278-287.
16. Wu, C.Y., Benet, L.Z., Predicting drug disposition via application of BCS: Transport/absorption/elimination interplay and development of a biopharmaceu-tics drug disposition classification system, Pharmaceutical Research, 2005, 22(1); 11-23.
17. Butler, J.M., Dressman, J.B., The Developability Classification System: Appli-cation of Biopharmaceutics Concepts to Formulation Development, Journal of Pharmaceutical Sciences, 2010, 99(12); 4940-4954.
18. Benet, L.Z., The role of BCS (biopharmaceutics classification system) and BDDCS (biopharmaceutics drug disposition classification system) in drug devel-opment, Journal of Pharmaceutical Sciences, 2013, 102(1); 34-42.
19. Oh, D.M., Curl, R.L., Amidon, G.L., Estimating the Fraction Dose Absorbed from Suspensions of Poorly Soluble Compounds in Humans - a Mathematical-Model, Pharmaceutical Research, 1993, 10(2); 264-270.
20. Dressman, J., Butler, J., Hempenstall, J., Reppas, C., The BCS: where do we go from here?, Pharmaceutical Technology, 2001, 25 68-76.
21. Yazdanian, M., Briggs, K., Jankovsky, C., Hawi, A., The "high solubility" defini-tion of the current FDA Guidance on Biopharmaceutical Classification System may be too strict for acidic drugs, Pharmaceutical Research, 2004, 21(2); 293-299.
22. Benet, L.Z., Wu, C.-Y., Custodio, J.M., Predicting drug absorption and the effects of food on oral bioavailability, Bulletin Technique Gattefossé, 2006, 99 9-16.
23. Ku, M.S., Use of the biopharmaceutical classification system in early drug devel-opment, Aaps Journal, 2008, 10(1); 208-212.
24. Alsenz, J., Kansy, M., High throughput solubility measurement in drug discovery and development, Advanced Drug Delivery Reviews, 2007, 59(7); 546-567.
25. Bhattachar, S.N., Deschenes, L.A., Wesley, J.A., Solubility: it's not just for phys-ical chemists, Drug Discovery Today, 2006, 11(21-22); 1012-1018.
26. Baka, E., Comer, J.E.A., Takacs-Novak, K., Study of equilibrium solubility measurement by saturation shake-flask method using hydrochlorothiazide as model compound, Journal of Pharmaceutical and Biomedical Analysis, 2008, 46(2); 335-341.
27. Stuart, M., Box, K., Chasing equilibrium: Measuring the intrinsic solubility of weak acids and bases, Analytical Chemistry, 2005, 77(4); 983-990.
28. Singh, A., Worku, Z.A., Van den Mooter, G., Oral formulation strategies to im-prove solubility of poorly water-soluble drugs, Expert Opinion on Drug Delivery, 2011, 8(10); 1361-1378.
29. Jain, S., Patel, N., Lin, S.S., Solubility and dissolution enhancement strategies: current understanding and recent trends, Drug Development and Industrial Phar-macy, 2015, 41(6); 875-887.
30. Chu, K.R., Lee, E., Jeong, S.H., Park, E.S., Effect of particle size on the dissolu-tion behaviors of poorly water-soluble drugs, Archives of Pharmacal Research, 2012, 35(7); 1187-1195.
31. Jinno, J., Kamada, N., Miyake, M., Yamada, K., Mukai, T., Odomi, M., Toguchi, H., Liversidge, G.G., Higaki, K., Kimura, T., Effect of particle size reduction on dissolution and oral absorption of a poorly water-soluble drug, cilostazol, in bea-gle dogs, Journal of Controlled Release, 2006, 111(1-2); 56-64.

61
32. Kesisoglou, F., Panmai, S., Wu, Y.H., Nanosizing - Oral formulation develop-ment and biopharmaceutical evaluation, Advanced Drug Delivery Reviews, 2007, 59(7); 631-644.
33. Williams, H.D., Trevaskis, N.L., Charman, S.A., Shanker, R.M., Charman, W.N., Pouton, C.W., Porter, C.J.H., Strategies to Address Low Drug Solubility in Dis-covery and Development, Pharmacological Reviews, 2013, 65(1); 315-499.
34. Noyes, A.A., Whitney, W.R., The rate of solution of solid substances in their own solutions, Journal of the American Chemical Society, 1897, 19(12); 930-934.
35. Brunner, E., Reaction rate in heterogenous systems., Zeitschrift Fur Physikalische Chemie-Stochiometrie Und Verwandtschaftslehre, 1904, 47(1); 56-102.
36. Nernst, N., Theory on the reaction rate in heterogenous systems., Zeitschrift Fur Physikalische Chemie-Stochiometrie Und Verwandtschaftslehre, 1904, 47(1); 52-55.
37. Mosharraf, M., Nystrom, C., The Effect of Particle-Size and Shape on the Surface Specific Dissolution Rate of Microsized Practically Insoluble Drugs, Interna-tional Journal of Pharmaceutics, 1995, 122(1-2); 35-47.
38. Galli, C., Experimental determination of the diffusion boundary layer width of micron and submicron particles, International Journal of Pharmaceutics, 2006, 313(1-2); 114-122.
39. Bisrat, M., Nyström, C., Physicochemical aspects of drug release. VIII. The rela-tion between particle size and surface specific dissolution rate in agitated suspen-sions, International Journal of Pharmaceutics, 1988, 47 223-231.
40. Hintz, R.J., Johnson, K.C., The Effect of Particle-Size Distribution on Dissolution Rate and Oral Absorption, International Journal of Pharmaceutics, 1989, 51(1); 9-17.
41. Sheng, J.J., Sirois, P.J., Dressman, J.B., Amidon, G.L., Particle Diffusional Layer Thickness in a USP Dissolution Apparatus II: A Combined Function of Particle Size and Paddle Speed, Journal of Pharmaceutical Sciences, 2008, 97(11); 4815-4829.
42. Lu, A.T.K., Frisella, M.E., Johnson, K.C., Dissolution Modeling - Factors Af-fecting the Dissolution Rates of Polydisperse Powders, Pharmaceutical Re-search, 1993, 10(9); 1308-1314.
43. Bisrat, M., Anderberg, E.K., Barnett, M.I., Nystrom, C., Physicochemical As-pects of Drug Release .15. Investigation of Diffusional Transport in Dissolution of Suspended, Sparingly Soluble Drugs, International Journal of Pharmaceutics, 1992, 80(2-3); 191-201.
44. deAlmeida, L.P., Simoes, S., Brito, P., Portugal, A., Figueiredo, M., Modeling dissolution of sparingly soluble multisized powders, Journal of Pharmaceutical Sciences, 1997, 86(6); 726-732.
45. Marabi, A., Mayor, G., Burbidge, A., Wallach, R., Saguy, I.S., Assessing disso-lution kinetics of powders by a single particle approach, Chemical Engineering Journal, 2008, 139(1); 118-127.
46. Galia, E., Nicolaides, E., Horter, D., Lobenberg, R., Reppas, C., Dressman, J.B., Evaluation of various dissolution media for predicting in vivo performance of class I and II drugs, Pharmaceutical Research, 1998, 15(5); 698-705.
47. Jantratid, E., Janssen, N., Reppas, C., Dressman, J.B., Dissolution media simu-lating conditions in the proximal human gastrointestinal tract: An update, Phar-maceutical Research, 2008, 25(7); 1663-1676.
48. Mithani, S.D., Bakatselou, V., TenHoor, C.N., Dressman, J.B., Estimation of the increase in solubility of drugs as a function of bile salt concentration, Pharma-ceutical Research, 1996, 13(1); 163-167.
62
49. Soderlind, E., Karlsson, E., Carlsson, A., Kong, R., Lenz, A., Lindborg, S., Sheng, J.J., Simulating Fasted Human Intestinal Fluids: Understanding the Roles of Lecithin and Bile Acids, Molecular Pharmaceutics, 2010, 7(5); 1498-1507.
50. Fagerberg, J.H., Tsinman, O., Sun, N., Tsinman, K., Avdeef, A., Bergstrom, C.A., Dissolution rate and apparent solubility of poorly soluble drugs in bio-relevant dissolution media, Molecular Pharmaceutics, 2010, 7(5); 1419-1430.
51. Rangel-Yagui, C.O., Pessoa, A., Tavares, L.C., Micellar solubilization of drugs., Journal of Pharmacy and Pharmaceutical Sciences, 2005, 8(2); 147-163.
52. Nystrom, C., Bisrat, M., Physicochemical Aspects of Drug Release .3. Coulter-Counter Measurements of Solubility and Dissolution Rate of Sparingly Soluble Compounds Using Micellar Solutions, Journal of Pharmacy and Pharmacology, 1986, 38(6); 420-425.
53. Dahlgren, D., Venczel, M., Ridoux, J.P., Skjold, C., Mullertz, A., Holm, R., Au-gustijns, P., Hellstrom, P.M., Lennernas, H., Fasted and fed state human duodenal fluids: Characterization, drug solubility, and comparison to simulated fluids and with human bioavailability, European Journal of Pharmaceutics and Biophar-maceutics, 2021, 163 240-251.
54. Wood, J.H., Syarto, J.E., Letterman, H., Improved holder for disk intrinsic disso-lution rate studies, Journal of Pharmaceutical Sciences, 1965, 54(7); 1068.
55. Avdeef, A., Tsinman, O., Miniaturized rotating disk intrinsic dissolution rate measurement: Effects of buffer capacity in comparisons to traditional Wood's ap-paratus, Pharmaceutical Research, 2008, 25(11); 2613-2627.
56. Hulse, W.L., Gray, J., Forbes, R.T., A discriminatory intrinsic dissolution study using UV area imaging analysis to gain additional insights into the dissolution behaviour of active pharmaceutical ingredients, International Journal of Phar-maceutics, 2012, 434(1-2); 133-139.
57. Yu, L.X., Carlin, A.S., Amidon, G.L., Hussain, A.S., Feasibility studies of utiliz-ing disk intrinsic dissolution rate to classify drugs, International Journal of Phar-maceutics, 2004, 270(1-2); 221-227.
58. Madelung, P., Bertelsen, P., Jacobsen, J., Mullertz, A., Ostergaard, J., Dissolution enhancement of griseofulvin from griseofulvin-sodium dodecyl sulfate discs in-vestigated by UV imaging, Journal of Drug Delivery Science and Technology, 2017, 39 516-522.
59. Persson, A.M., Baumann, K., Sundelof, L.O., Lindberg, W., Sokolowski, A., Pet-tersson, C., Design and characterization of a new miniaturized rotating disk equipment for in vitro dissolution rate studies, Journal of Pharmaceutical Sci-ences, 2008, 97(8); 3344-3355.
60. Alsenz, J., Haenel, E., Anedda, A., Du Castel, P., Cirelli, G., Miniaturized IN-trinsic DISsolution Screening (MINDISS) assay for preformulation, European Journal of Pharmaceutical Sciences, 2016, 87 3-13.
61. Tseng, Y.C., Patel, M., Zhao, Y.N., Determination of Intrinsic Dissolution Rate Using Miniaturized Rotating and Stationary Disk Systems, Dissolution Technol-ogies, 2014, 21(2); 24-29.
62. Kuentz, M., Analytical technologies for real-time drug dissolution and precipita-tion testing on a small scale, Journal of Pharmacy and Pharmacology, 2015, 67(2); 143-159.
63. Etherson, K., Dunn, C., Matthews, W., Pamelund, H., Barragat, C., Sanderson, N., Izumi, T., Mathews, C.D., Halbert, G., Wilson, C., McAllister, M., Mann, J., Ostergaard, J., Butler, J., Khadra, I., An interlaboratory investigation of intrinsic dissolution rate determination using surface dissolution, European Journal of Pharmaceutics and Biopharmaceutics, 2020, 150 24-32.
63
64. Avdeef, A., Tsinman, K., Tsinman, O., Sun, N., Voloboy, D., Miniaturization of Powder Dissolution Measurement and Estimation of Particle Size, Chemistry & Biodiversity, 2009, 6(11); 1796-1811.
65. Tsinman, K., Avdeef, A., Tsinman, O., Voloboy, D., Powder dissolution method for estimating rotating disk intrinsic dissolution rates of low solubility drugs, Pharmaceutical Research, 2009, 26(9); 2093-2100.
66. Nystrom, C., Westerberg, M., The Use of Ordered Mixtures for Improving the Dissolution Rate of Low Solubility Compounds, Journal of Pharmacy and Phar-macology, 1986, 38(3); 161-165.
67. Hoelgaard, A., Møller, N., Studies on particle size problems. X. Evaluation of effective surface areas of micronized powders from dissolution rate measure-ments, Archiv der Pharmazie - Chemistry in Life Sciences, 1973, 1 1-13.
68. Lindfors, L., Skantze, P., Skantze, U., Westergren, J., Olsson, U., Amorphous drug nanosuspensions. 3. Particle dissolution and crystal growth, Langmuir, 2007, 23(19); 9866-9874.
69. Niwa, T., Hashimoto, N., Novel technology to prepare oral formulations for pre-clinical safety studies, International Journal of Pharmaceutics, 2008, 350(1-2); 70-78.
70. Niwa, T., Miura, S., Danjo, K., Universal wet-milling technique to prepare oral nanosuspension focused on discovery and preclinical animal studies - Develop-ment of particle design, International Journal of Pharmaceutics, 2011, 405(1-2); 218-227.
71. Amidon, G.E., Higuchi, W.I., Ho, N.F., Theoretical and experimental studies of transport of micelle-solubilized solutes, Journal of Pharmaceutical Sciences, 1982, 71(1); 77-84.
72. Wang, J., Flanagan, D.R., General solution for diffusion-controlled dissolution of spherical particles. 1. Theory, Journal of Pharmaceutical Sciences, 1999, 88(7); 731-738.
73. Prasad, K.V., Ristic, R.I., Sheen, D.B., Sherwood, J.N., Dissolution kinetics of paracetamol single crystals, International Journal of Pharmaceutics, 2002, 238(1-2); 29-41.
74. Svanback, S., Ehlers, H., Yliruusi, J., Optical microscopy as a comparative ana-lytical technique for single-particle dissolution studies, International Journal of Pharmaceutics, 2014, 469(1); 10-16.
75. Svanback, S., Ehlers, H., Antikainen, O., Yliruusi, J., High-Speed Intrinsic Dis-solution Rate in One Minute Using the Single-Particle Intrinsic Dissolution Rate Method, Analytical Chemistry, 2015, 87(21); 11058-11064.
76. Svanback, S., Ehlers, H., Antikainen, O., Yliruusi, J., On-chip optofluidic single-particle method for rapid microscale equilibrium solubility screening of biologi-cally active substances, Analytical Chemistry, 2015, 87(10); 5041-5045.
77. Raghavan, S.L., Ristic, R.I., Sheen, D.B., Sherwood, J.N., Dissolution kinetics of single crystals of alpha-lactose monohydrate, Journal of Pharmaceutical Sci-ences, 2002, 91(10); 2166-2174.
78. Ostergaard, J., Ye, F., Rantanen, J., Yaghmur, A., Larsen, S.W., Larsen, C., Jen-sen, H., Monitoring lidocaine single-crystal dissolution by ultraviolet imaging, Journal of Pharmaceutical Sciences, 2011, 100(8); 3405-3410.
79. Parrott, E.L., Wurster, D.E., Higuchi, T., Investigation of drug release from sol-ids. I. Some factors influencing the dissolution rate, Journal of the American Pharmacists Association, 1955, 44(5); 269-273.
80. Bergstrom, C.A.S., Strafford, M., Lazorova, L., Avdeef, A., Luthman, K., Arturs-son, P., Absorption classification of oral drugs based on molecular surface prop-erties, Journal of Medicinal Chemistry, 2003, 46(4); 558-570.

64
81. Lindenberg, M., Kopp, S., Dressman, J.B., Classification of orally administered drugs on the World Health Organization Model list of Essential Medicines ac-cording to the biopharmaceutics classification system, European Journal of Pharmaceutics and Biopharmaceutics, 2004, 58(2); 265-278.
82. Yang, Y.S., Faustino, P.J., Volpe, D.A., Elllison, C.D., Lyon, R.C., Yu, L.X., Biopharmaceutics classification of selected beta-blockers: Solubility and perme-ability class membership, Molecular Pharmaceutics, 2007, 4(4); 608-614.
83. Kleberg, K., Jacobsen, J., Mullertz, A., Characterising the behaviour of poorly water soluble drugs in the intestine: application of biorelevant media for solubil-ity, dissolution and transport studies, Journal of Pharmacy and Pharmacology, 2010, 62(11); 1656-1668.
84. Ramirez, E., Laosa, O., Guerra, P., Duque, B., Mosquera, B., Borobia, A.M., Lei, S.H., Carcas, A.J., Frias, J., Acceptability and characteristics of 124 human bio-equivalence studies with active substances classified according to the Biophar-maceutic Classification System, British Journal of Clinical Pharmacology, 2010, 70(5); 694-702.
85. Perez, P.A.C., Sanz, M.B., Torres, L.R., Avalos, R.C., Gonzalez, M.P., Diaz, H.G., A topological sub-structural approach for predicting human intestinal ab-sorption of drugs, European Journal of Medicinal Chemistry, 2004, 39(11); 905-916.
86. Varma, M.V., Gardner, I., Steyn, S.J., Nkansah, P., Rotter, C.J., Whitney-Pickett, C., Zhang, H., Di, L., Cram, M., Fenner, K.S., El-Kattan, A.F., pH-Dependent Solubility and Permeability Criteria for Provisional Biopharmaceutics Classifi-cation (BCS and BDDCS) in Early Drug Discovery, Molecular Pharmaceutics, 2012, 9(5); 1199-1212.
87. Sugano, K., Fraction of a dose absorbed estimation for structurally diverse low solubility compounds, International Journal of Pharmaceutics, 2011, 405(1-2); 79-89.
88. Taubert, D., von Beckerath, N., Grimberg, G., Lazar, A., Jung, N., Goeser, T., Kastrati, A., Schomig, A., Schomig, E., Impact of P-glycoprotein on clopidogrel absorption, Clinical Pharmacology & Therapeutics, 2006, 80(5); 486-501.
89. Gan, J.P., Ruan, Q., He, B., Zhu, M.S., Shyu, W.C., Humphreys, W.G., In Vitro Screening of 50 Highly Prescribed Drugs for Thiol Adduct Formation-Compari-son of Potential for Drug-Induced Toxicity and Extent of Adduct Formation, Chemical Research in Toxicology, 2009, 22(4); 690-698.
90. Sanghvi, T., Ni, N., Mayersohn, M., Yalkowsky, S.H., Predicting passive intes-tinal absorption using a single parameter, Qsar & Combinatorial Science, 2003, 22(2); 247-257.
91. Zhu, C.Y., Jiang, L., Chen, T.M., Hwang, K.K., A comparative study of artificial membrane permeability assay for high throughput profiling of drug absorption potential, European Journal of Medicinal Chemistry, 2002, 37(5); 399-407.
92. Chu, K.A., Yalkowsky, S.H., An interesting relationship between drug absorption and melting point, International Journal of Pharmaceutics, 2009, 373(1-2); 24-40.
93. Loos, U., Musch, E., Jensen, J.C., Mikus, G., Schwabe, H.K., Eichelbaum, M., Pharmacokinetics of Oral and Intravenous Rifampicin during Chronic Admin-istration, Klinische Wochenschrift, 1985, 63(23); 1205-1211.
94. Lennernas, H., Clinical pharmacokinetics of atorvastatin, Clinical Pharmacoki-netics, 2003, 42(13); 1141-1160.
95. Chiou, W.L., Barve, A., Linear correlation of the fraction of oral dose absorbed of 64 drugs between humans and rats, Pharmaceutical Research, 1998, 15(11); 1792-1795.

65
96. Nilsson, P., Hansson, P., Ion-exchange controls the kinetics of deswelling of polyelectrolyte microgels in solutions of oppositely charged surfactant, Journal of Physical Chemistry B, 2005, 109(50); 23843-23856.
97. Ahnfelt, E., Gernandt, J., Al-Tikriti, Y., Sjogren, E., Lennernas, H., Hansson, P., Single bead investigation of a clinical drug delivery system - A novel release mechanism, Journal of Controlled Release, 2018, 292 235-247.
98. Fagerberg, J.H., Al-Tikriti, Y., Ragnarsson, G., Bergstrom, C.A.S., Ethanol Ef-fects on Apparent Solubility of Poorly Soluble Drugs in Simulated Intestinal Fluid, Molecular Pharmaceutics, 2012, 9(7); 1942-1952.
99. Dressman, J.B., Reppas, C., In vitro-in vivo correlations for lipophilic, poorly water-soluble drugs, European Journal of Pharmaceutical Sciences, 2000, 11 S73-S80.
100. Bergstrom, C.A.S., Wassvik, C.M., Johansson, K., Hubatsch, I., Poorly soluble marketed drugs display solvation limited solubility, Journal of Medicinal Chem-istry, 2007, 50(23); 5858-5862.
101. Gamsiz, E.D., Ashtikar, M., Crison, J., Woltosz, W., Bolger, M.B., Carrier, R.L., Predicting the Effect of Fed-State Intestinal Contents on Drug Dissolution, Phar-maceutical Research, 2010, 27(12); 2646-2656.
102. Ottaviani, G., Gosling, D.J., Patissier, C., Rodde, S., Zhou, L.P., Faller, B., What is modulating solubility in simulated intestinal fluids?, European Journal of Pharmaceutical Sciences, 2010, 41(3-4); 452-457.
103. Qureshi, S.A., McGilveray, I.J., Typical variability in drug dissolution testing: study with USP and FDA calibrator tablets and a marketed drug (glibenclamide) product, European Journal of Pharmaceutical Sciences, 1999, 7(3); 249-258.
104. Gray, V., Kelly, G., Xia, M., Butler, C., Thomas, S., Mayock, S., The Science of USP 1 and 2 Dissolution: Present Challenges and Future Relevance, Pharmaceu-tical Research, 2009, 26(6); 1289-1302.
105. Lennernaas, H., Aarons, L., Augustijns, P., Beato, S., Bolger, M., Box, K., Brew-ster, M., Butler, J., Dressman, J., Holm, R., Frank, K.J., Kendall, R., Langguth, P., Sydor, J., Lindahl, A., McAllister, M., Muenster, U., Mullertz, A., Ojala, K., Pepin, X., Reppas, C., Rostami-Hodjegan, A., Verwei, M., Weitschies, W., Wil-son, C., Karlsson, C., Abrahamsson, B., Oral biopharmaceutics tools - Time for a new initiative - An introduction to the IMI project OrBiTo, European Journal of Pharmaceutical Sciences, 2014, 57 292-299.
106. Bergstrom, C.A.S., Box, K., Holm, R., Matthews, W., McAllister, M., Mullertz, A., Rades, T., Schafer, K.J., Teleki, A., Biorelevant intrinsic dissolution profiling in early drug development: Fundamental, methodological, and industrial aspects, European Journal of Pharmaceutics and Biopharmaceutics, 2019, 139 101-114.
107. The United States Pharmacopeia and National Formulary USP 39–NF 34; The United States Pharmacopeial Convention, I.R., MD, 2016.
108. D'Arcy, D.M., Liu, B., Bradley, G., Healy, A.M., Corrigan, O.I., Hydrodynamic and species transfer simulations in the USP 4 dissolution apparatus: considera-tions for dissolution in a low velocity pulsing flow, Pharmaceutical Research, 2010, 27(2); 246-258.
109. D'Arcy, D.M., Corrigan, O.I., Healy, A.M., Evaluation of hydrodynamics in the basket dissolution apparatus using computational fluid dynamics--dissolution rate implications, European Journal of Pharmaceutical Sciences, 2006, 27(2-3); 259-267.
110. Johansson, K.E., Plum, J., Mosleh, M., Madsen, C.M., Rades, T., Mullertz, A., Characterization of the Hydrodynamics in a Miniaturized Dissolution Apparatus, Journal of Pharmaceutical Sciences, 2018, 107(4); 1095-1103.

66
111. Sehic, S., Betz, G., Hadzidedic, S., El-Arini, S.K., Leuenberger, H., Investigation of intrinsic dissolution behavior of different carbamazepine samples, Interna-tional Journal of Pharmaceutics, 2010, 386(1-2); 77-90.
112. Lu, Y., Li, M.Z., Simultaneous Rapid Determination of the Solubility and Diffu-sion Coefficients of a Poorly Water-Soluble Drug Based on a Novel UV Imaging System, Journal of Pharmaceutical Sciences, 2016, 105(1); 131-138.
113. Upadrashta, S.M., Haglund, B.O., Sundelof, L.O., Diffusion and Concentration Profiles of Drugs in Gels, Journal of Pharmaceutical Sciences, 1993, 82(11); 1094-1098.


Acta Universitatis UpsaliensisDigital Comprehensive Summaries of Uppsala Dissertationsfrom the Faculty of Pharmacy 300
Editor: The Dean of the Faculty of Pharmacy
A doctoral dissertation from the Faculty of Pharmacy, UppsalaUniversity, is usually a summary of a number of papers. A fewcopies of the complete dissertation are kept at major Swedishresearch libraries, while the summary alone is distributedinternationally through the series Digital ComprehensiveSummaries of Uppsala Dissertations from the Faculty ofPharmacy. (Prior to January, 2005, the series was publishedunder the title “Comprehensive Summaries of UppsalaDissertations from the Faculty of Pharmacy”.)
Distribution: publications.uu.seurn:nbn:se:uu:diva-450069
ACTAUNIVERSITATIS
UPSALIENSISUPPSALA
2021