Embed Size (px)
Citation preview
NPDES Stormwater Cost SurveyNPDES Stormwater Cost SurveyNPDES Stormwater Cost SurveyNPDES Stormwater Cost Survey
NPD
ES Storm
water C
ost Survey
Prepared For:
California State Water Resources Control Board
Contract: 02-189-250-0
Prepared by:
Offi ce of Water ProgramsCalifornia State University, Sacramento
January 2005
Includes Appendix H:
Alternative Approaches to Stormwater ControlPrepared by:
Center for Sustainable CitiesUniversity of Southern California

NPDES Stormwater Cost Survey Final Report
Brian K. Currier, P.E.
Research Engineer - Environmental California State University, Sacramento
Office of Water Programs
Joseph M. Jones Accountant
California State University, Sacramento Office of Water Programs
Glenn L. Moeller, P.E. Research Engineer - Environmental
California State University, Sacramento Office of Water Programs
Contract Manager: Bruce Fujimoto, P.E.
California State Water Resources Control Board
January 2005

EXECUTIVE SUMMARY
NPDES Stormwater Cost Survey i January 2005
EXECUTIVE SUMMARY
This report is funded by the California State Water Resources Control Board under contract 02-189-250-0, “Survey of Costs to Develop, Implement, Maintain and Monitor Municipal Separate Storm Sewer System (MS4) Storm Water Management Programs and Description of Alternatives for Control of Stormwater Quality in Los Angeles County.”
BACKGROUND
The current costs to implement best management practices (BMPs) have been the basis for lawsuits and petitions challenging the California stormwater regulatory program. Additionally, some permittees contend that current MS4 permits necessitate the use of advanced water treatment to meet water quality standards, which would drastically escalate costs above current levels. This contention is presented in the report titled “An Economic Impact Evaluation of Proposed Storm Water Treatment for Los Angeles County” (Gordon, 2002). This project addresses these issues through two tasks.
Task A – Documenting Stormwater Program Costs
Five California municipalities and one metropolitan area with stormwater programs that are demonstrating meaningful progress toward maximum extent practicable (MEP) compliance as identified by Regional Water Quality Control Board (RWQCB) staff were surveyed for the most recent stormwater compliance costs. Demonstrating meaningful progress is defined in this report as implementing activities specifically presented in the Storm Water Management Plans (SWMPs). Because permits use an iterative approach that increases requirements until water quality objectives are met, current levels of implementation may not be the ultimate MEP standard. This report does not address the benefits of permit compliance activities. Some scenarios addressing ultimate compliance cost are addressed in Task B. Task A was accomplished by the Office of Water Programs (OWP) at California State University, Sacramento (CSUS).
Task B – Alternative Approaches to Stormwater Quality Control
Task B is an assessment of regulatory policy to determine the intent of stormwater regulation regarding advanced treatment. Alternatives for stormwater quality control that are believed to comply with the intent of the regulations are described. Costs were estimated for the Los Angeles Regional Water Quality Control Board (LARWQCB) area. Task B was accomplished by the University of Southern California (USC) and the University of California at Los Angeles (UCLA).
RESULTS
Cost Survey (Task A)
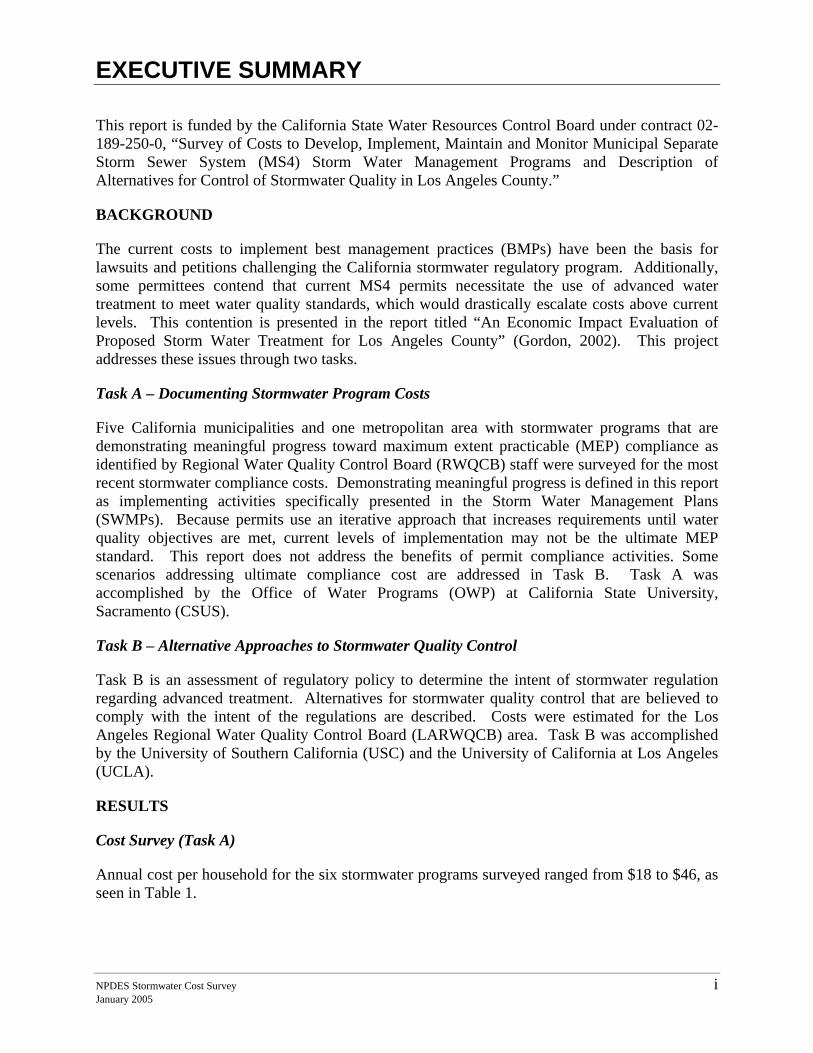
Annual cost per household for the six stormwater programs surveyed ranged from $18 to $46, as seen in Table 1.
EXECUTIVE SUMMARY
ii NPDES Stormwater Cost Survey January 2005
Table 1. Stormwater Costs per Household for the California Cost Survey (Task A)
Municipalities Municipality Description Cost/Household ($) City of Encinitas Coastal tourism, small city 46 City of Fremont Bay Area, moderately integrated countywide program 45 City of Santa Clarita Tourism and industrial 39 City of Corona Industrial 32 City of Sacramento Pumped stormwater, large city 29 Fresno-Clovis Metropolitan Area
65-90% infiltration, fully integrated multi-city program 18
The Fresno-Clovis Metropolitan Area (FCMA) had substantially lower cost per household. The following factors are thought to contribute to the FCMA costs limit costs being lower than the other survey results:
• flood control and stormwater quality basins are combined, • land was set aside for water projects, • climate helps infiltration due to infrequent storms and low annual rainfall, • lower land cost compared to other cities, • FMFCD owned land needed for basins prior to storm water permits requirements, • topography lends to drainage of urban areas to post-construction BMPs, and • highly permeable soils allow extensive use of infiltration.
These factors are unique or more prevalent for FCMA than for the other cities surveyed. Excluding the FCMA as an ideal situation, the range of cost is $29 to $46 per household.
The results of the survey are compared to values from the USEPA report “Economic Analysis of the Final Phase II Stormwater Rule.” This report contains a summary of costs from two separate efforts to estimate Phase II cost per household. The first is the results of a survey stormwater costs for 56 Phase II municipalities performed by the National Association of Flood and Stormwater Management Agencies (NAFSMA). The NAFSMA survey represents the six minimum measures of the Phase II regulations because two measures seemed to have been combined: 1) Public Education and Outreach and 2) Public Involvement and Participation.
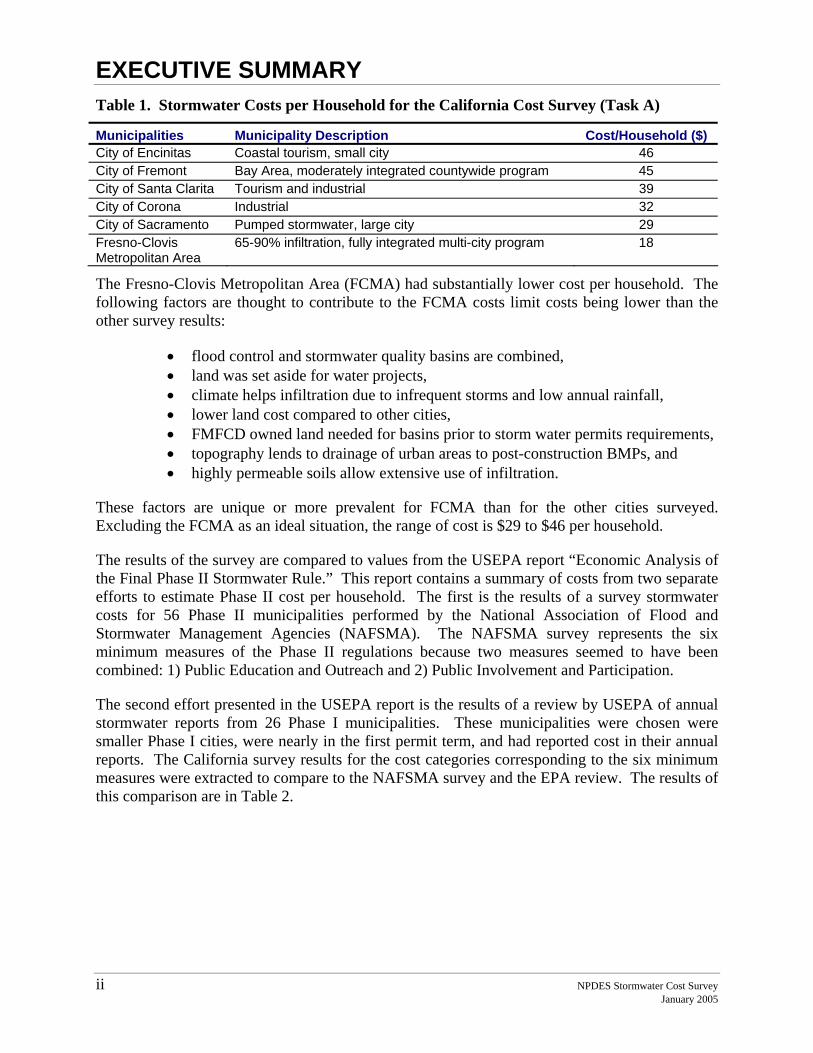
The second effort presented in the USEPA report is the results of a review by USEPA of annual stormwater reports from 26 Phase I municipalities. These municipalities were chosen were smaller Phase I cities, were nearly in the first permit term, and had reported cost in their annual reports. The California survey results for the cost categories corresponding to the six minimum measures were extracted to compare to the NAFSMA survey and the EPA review. The results of this comparison are in Table 2.
EXECUTIVE SUMMARY
NPDES Stormwater Cost Survey iii January 2005
Table 2. Stormwater Costs per Household for Six1 Minimum Measures from the California Survey, the NAFSMA2 Phase II Survey, and the USEPA review of Phase I Annual Reports (USEPA, 1999)
Study Median
(50%) ($) Mean ($) Max ($) Adjusted California Survey3 24 26 35 NAFSMA Phase II Survey4 4.63 10 61 EPA Phase I Survey5 3.16 10 67 1. Public Education and Outreach and Public Involvement and Participation were assumed combined for the NAFSMA
survey. 2. NAFSMA: National Association of Flood and Stormwater Management Agencies 3. Based only on costs from cost categories that correspond to the six minimum measures 4. NAFSMA survey based on 56 Phase II respondents to a survey on stormwater costs for five minimum measures.
Values adjusted to 2003 dollars. 5. EPA results based on a review of 26 annual reports for smaller Phase I cities that were nearly in their first NPDES
term so that costs would be more representative of Phase II programs. Values adjusted to 2003 dollars.
In some cases, programs in the California survey appeared to go beyond the minimum requirements of the permit. The cost of this additional effort was not included when it could be identified or estimated, such as street sweeping in Sacramento that was above the permit required frequency. Including the total cost of the street sweeping program the cost per household for Sacramento would increase $1.69. In some cases the additional effort could not be estimated. This was particularly true when stormwater activities were combined with activities that occurred more frequently than the permit requirement for the stormwater activities, such as when stormwater construction inspections for Santa Clarita were performed at every construction permit inspection and these permit inspections occurred more frequently than the permit requirement.
Description of Alternatives for Control of Stormwater Quality (Task B)
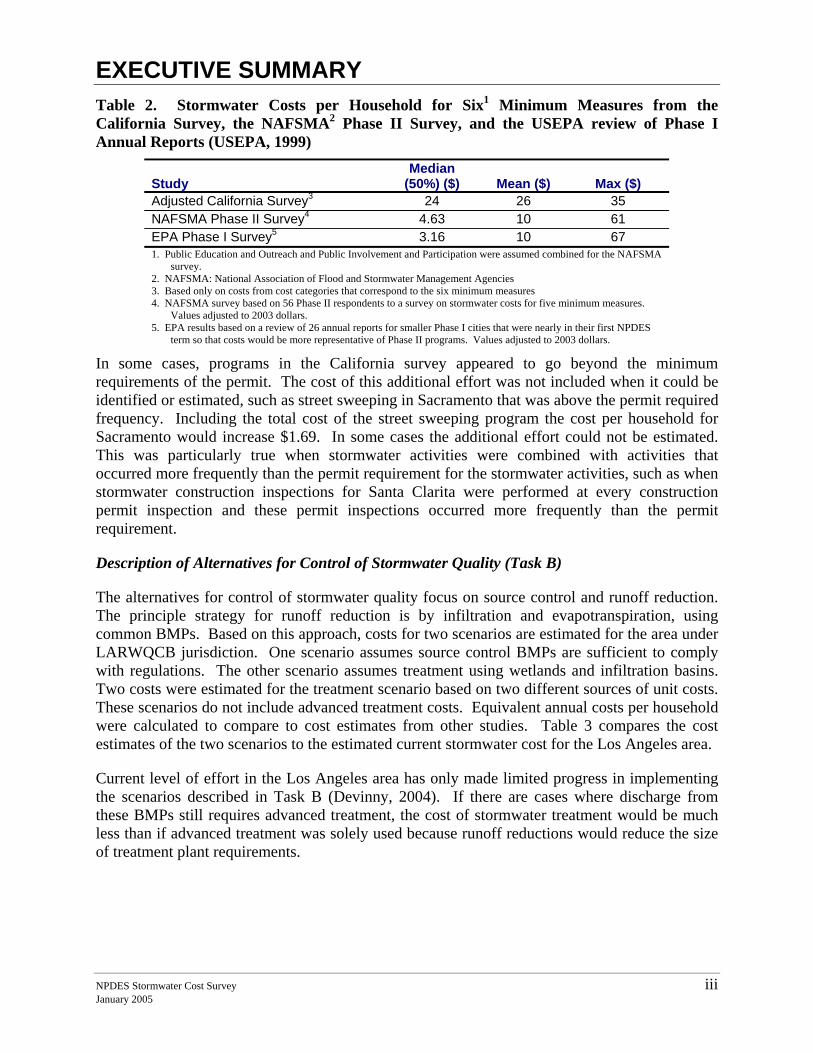
The alternatives for control of stormwater quality focus on source control and runoff reduction. The principle strategy for runoff reduction is by infiltration and evapotranspiration, using common BMPs. Based on this approach, costs for two scenarios are estimated for the area under LARWQCB jurisdiction. One scenario assumes source control BMPs are sufficient to comply with regulations. The other scenario assumes treatment using wetlands and infiltration basins. Two costs were estimated for the treatment scenario based on two different sources of unit costs. These scenarios do not include advanced treatment costs. Equivalent annual costs per household were calculated to compare to cost estimates from other studies. Table 3 compares the cost estimates of the two scenarios to the estimated current stormwater cost for the Los Angeles area.
Current level of effort in the Los Angeles area has only made limited progress in implementing the scenarios described in Task B (Devinny, 2004). If there are cases where discharge from these BMPs still requires advanced treatment, the cost of stormwater treatment would be much less than if advanced treatment was solely used because runoff reductions would reduce the size of treatment plant requirements.
EXECUTIVE SUMMARY
iv NPDES Stormwater Cost Survey January 2005
Table 3. Equivalent Cost Per Household For Task B Alternatives
Cost Scenario for the Los Angeles Area
Equivalent Annual Cost, $/household
Current Effort 18
Alternative to Advanced Treatment: Pollution Prevention Scenario (Present worth 2.8 billion)1
27
Alternative to Advanced Treatment: Wetlands and Infiltration Basins Scenario, calculated using cost per area (Present worth 5.7 billion)1
55
Alternatives to Advanced Treatment: Wetlands and Infiltration Basins Scenario, calculated using cost per capture volume (present worth 7.4 billion)1
71
1. Little progress has been made in implementing these scenarios (Devinny, pers. comm., 9/14/04). These costs may be added to the current effort if existing programs continue to be required. Costs based on Devinny et. al. (Appendix H), see Table G-6 for equivalent annual cost calculation.
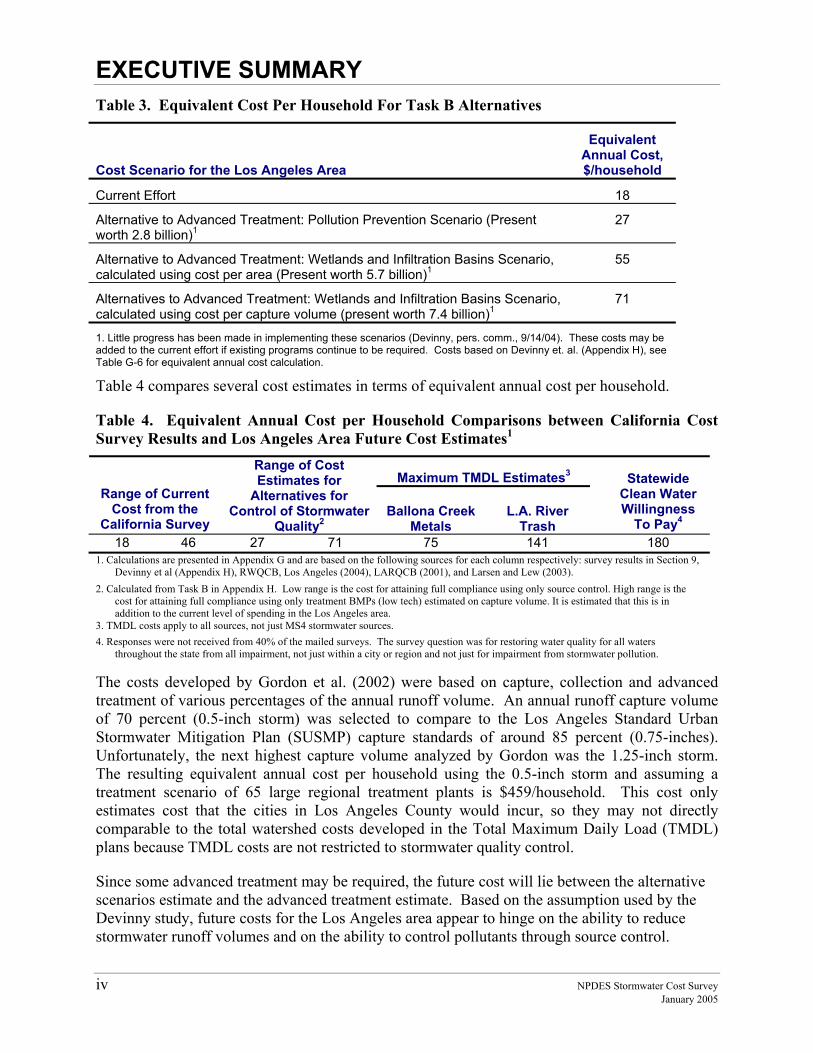
Table 4 compares several cost estimates in terms of equivalent annual cost per household.
Table 4. Equivalent Annual Cost per Household Comparisons between California Cost Survey Results and Los Angeles Area Future Cost Estimates1
Maximum TMDL Estimates3 Range of Current
Cost from the California Survey
Range of Cost Estimates for
Alternatives for Control of Stormwater
Quality2 Ballona Creek
Metals L.A. River
Trash
Statewide Clean Water Willingness
To Pay4 18 46 27 71 75 141 180
1. Calculations are presented in Appendix G and are based on the following sources for each column respectively: survey results in Section 9, Devinny et al (Appendix H), RWQCB, Los Angeles (2004), LARQCB (2001), and Larsen and Lew (2003).
2. Calculated from Task B in Appendix H. Low range is the cost for attaining full compliance using only source control. High range is the cost for attaining full compliance using only treatment BMPs (low tech) estimated on capture volume. It is estimated that this is in addition to the current level of spending in the Los Angeles area.
3. TMDL costs apply to all sources, not just MS4 stormwater sources. 4. Responses were not received from 40% of the mailed surveys. The survey question was for restoring water quality for all waters
throughout the state from all impairment, not just within a city or region and not just for impairment from stormwater pollution.
The costs developed by Gordon et al. (2002) were based on capture, collection and advanced treatment of various percentages of the annual runoff volume. An annual runoff capture volume of 70 percent (0.5-inch storm) was selected to compare to the Los Angeles Standard Urban Stormwater Mitigation Plan (SUSMP) capture standards of around 85 percent (0.75-inches). Unfortunately, the next highest capture volume analyzed by Gordon was the 1.25-inch storm. The resulting equivalent annual cost per household using the 0.5-inch storm and assuming a treatment scenario of 65 large regional treatment plants is $459/household. This cost only estimates cost that the cities in Los Angeles County would incur, so they may not directly comparable to the total watershed costs developed in the Total Maximum Daily Load (TMDL) plans because TMDL costs are not restricted to stormwater quality control.
Since some advanced treatment may be required, the future cost will lie between the alternative scenarios estimate and the advanced treatment estimate. Based on the assumption used by the Devinny study, future costs for the Los Angeles area appear to hinge on the ability to reduce stormwater runoff volumes and on the ability to control pollutants through source control.
TABLE OF CONTENTS
NPDES Stormwater Cost Survey v January 2005
TABLE OF CONTENTS
Executive Summary ......................................................................................................................... i
Table of Contents............................................................................................................................ v
List of Tables ................................................................................................................................ vii
List of Figures .............................................................................................................................. viii
List of Appendices ......................................................................................................................... ix
1.0 Introduction......................................................................................................................... 1
1.1 Background..................................................................................................................... 1
1.2 Report Organization........................................................................................................ 2
2.0 Methodology....................................................................................................................... 5
2.1 Technical Advisory Group.............................................................................................. 5
2.2 City Selection.................................................................................................................. 5
2.3 Cost Survey Categories................................................................................................... 6
2.4 Identifying New, Existing, and Enhanced Costs ............................................................ 7
2.5 Data Collection ............................................................................................................... 7
2.6 Data Quality Evaluation................................................................................................ 10
2.7 Inherent limitations ....................................................................................................... 10
2.8 Data Comparisons to other studies ............................................................................... 11
3.0 City of Corona................................................................................................................... 13
3.1 Data Sources ................................................................................................................. 13
3.2 Cost Data Summary ...................................................................................................... 14
3.3 Confidence in the Data.................................................................................................. 17
4.0 City of Encinitas ............................................................................................................... 19
4.1 Data Sources ................................................................................................................. 19
4.2 Cost Data Summary ...................................................................................................... 20
4.3 Confidence in the Data.................................................................................................. 23
5.0 City of Fremont................................................................................................................. 25
5.1 Data Sources ................................................................................................................. 25
5.2 Cost Data Summary ...................................................................................................... 26
5.3 Confidence in the Data.................................................................................................. 29
TABLE OF CONTENTS
vi NPDES Stormwater Cost Survey January 2005
6.0 Fresno-Clovis Metropolitan Area ..................................................................................... 31
6.1 Data Sources ................................................................................................................. 31
6.2 Cost Data Summary ...................................................................................................... 32
6.3 Confidence in the Data.................................................................................................. 35
7.0 City of Sacramento ........................................................................................................... 37
7.1 Data Sources ................................................................................................................. 37
7.2 Cost Data Summary ...................................................................................................... 38
7.3 Confidence in the Data.................................................................................................. 41
8.0 City of Santa Clarita.......................................................................................................... 43
8.1 Data Sources ................................................................................................................. 43
8.2 Cost Data Summary ...................................................................................................... 44
8.3 Confidence in the Data.................................................................................................. 46
9.0 Analysis............................................................................................................................. 49
9.1 Cost per Household....................................................................................................... 49
9.2 Aggregate Cost breakdown by Cost Categories ........................................................... 53
9.3 New, Existing, and Enhanced Costs ............................................................................. 53
9.4 Discussion of Stormwater Costs for Selected Cost Categories .................................... 58
9.5 Limitations .................................................................................................................... 60
9.6 Comparisons to Other Studies and Surveys.................................................................. 60
10.0 Closing .............................................................................................................................. 63
10.1 Significance of Surveyed Stormwater Costs in California ........................................... 63
10.2 Suggestions for Reporting Costs and Accomplishments .............................................. 63
10.3 TAG Recommendations for Cost Tracking .................................................................. 68
11.0 References......................................................................................................................... 69
12.0 Acronyms.......................................................................................................................... 73
LIST OF TABLES
NPDES Stormwater Cost Survey vii January 2005
LIST OF TABLES
Table 2-1. Example of Cost Information Collected for Each Cost Survey Category.................... 8
Table 3-1. Select Characteristics of the City of Corona .............................................................. 13
Table 3-2. City of Corona Cost Assigned to Cost Survey Categories .......................................... 14
Table 4-1. Select Characteristics of the City of Encinitas ........................................................... 19
Table 4-2. City of Encinitas Cost Assigned to Cost Survey Categories....................................... 20
Table 5-1. Select Characteristics of the City of Fremont.............................................................. 25
Table 5-2. City of Fremont Cost Assigned to Cost Survey Categories ........................................ 27
Table 6-1. Select Characteristics of the Fresno Metropolitan Area.............................................. 31
Table 6-2. Fresno-Clovis Metropolitan Area Cost Assigned to Cost Survey Categories............. 33
Table 7-1. Select Characteristics of the City of Sacramento ........................................................ 37
Table 7-2. City of Sacramento Cost Assigned to Cost Survey Categories................................... 38
Table 8-1. Select Characteristics of the City of Santa Clarita ...................................................... 43
Table 8-2. City of Santa Clarita Cost Assigned to Cost Survey Categories ................................. 44
Table 9-1. Number of Households for Surveyed Areas............................................................... 49
Table 9-2. Summary of Normalized Stormwater Costs for Municipalities ................................. 50
Table 9-3. New, Existing, and Enhanced Cost for Each City...................................................... 55
Table 9-4. Distribution of Aggregate Cost Category between New, Existing, and Enhanced Classifications1...................................................................................................................... 57
Table 9-5. Street Sweeping Statistics for Municipalities............................................................. 59
Table 9-6. Stormwater Costs per Household for Six1 Minimum Measures from the California Survey, the NAFSMA2 Phase II Survey, and the USEPA review of Phase I Annual Reports (USEPA, 1999) ..................................................................................................................... 61
LIST OF FIGURES
viii NPDES Stormwater Cost Survey January 2005
LIST OF FIGURES
Figure 2-1. Location of Municipal Areas Selected for the Cost Survey........................................ 6
Figure 2-2. Data Collection Methodology Flow Chart.................................................................. 9
Figure 3-1. Distribution of Corona Stormwater Costs among the Cost Survey Categories. ....... 15
Figure 4-1. Distribution of Encinitas Stormwater Costs Among the Cost Survey Categories. .... 21
Figure 5-1. Distribution of Fremont Stormwater Costs Among the Cost Survey Categories. .... 27
Figure 6-1. Distribution of Fresno-Clovis Metro Area Stormwater Costs Among the Cost Survey Categories ............................................................................................................................. 33
Figure 7-1. Distribution of Sacramento Stormwater Costs Among the Cost Survey Categories . 39
Figure 8-1. Distribution of Santa Clarita Stormwater Costs Among the Cost Survey Categories................................................................................................................................................ 45
Figure 9-1. Cost per Household Comparison of Each Surveyed City. ........................................ 51
Figure 9-2. Distribution of Aggregate Costs among Cost Categories ......................................... 53
Figure 9-3. Breakdown of Aggregate Costs into New, Existing, and Enhanced Costs............... 54
Figure 9-4. Breakdown of Enhanced Costs by Stormwater Activity........................................... 55
Figure 9-5. Breakdown of Existing Costs by Cost Category....................................................... 56
Figure 9-6. Breakdown of New Costs by Cost Category............................................................ 56
Figure 9-7. Comparison of Aggregate Cost per Household for All Costs and for New Costs.... 58
Figure 9-8. Breakdown of Pollution Prevention Costs by Activity. ............................................ 59
LIST OF APPENDICES
NPDES Stormwater Cost Survey ix January 2005
LIST OF APPENDICES
City of Corona Cost Calculations…………………..……………………………………… A-1
City of Encinitas Cost Calculations………….............................…………………………. B-1
City of Fremont Cost Calculations………......................………………………………….. C-1
Fresno-Clovis Metropolitan Area Cost Calculations……..………………………………… D-1
City of Sacramento Cost Calculations………………..……………………………………. E-1
City of Santa Clarita Cost Calculations………...…………………………………………. F-1
Calculations and Comparisons…………………..………………………………………… G-1
Alternative Approaches to Stormwater Quality Control……….………………………….. H-1
Scoping Memorandum…………………………………………………………………….. I-1
TAG Comments…………………………….……………………………………………… J-1

SECTIONONE Introduction
NPDES Stormwater Cost Survey 1 January 2005
1.0 INTRODUCTION
This report is funded by the California State Water Resources Control Board (SWRCB) under contract 02-189-250-0, “Survey of Costs to Develop, Implement, Maintain and Monitor Municipal Separate Storm Sewer System (MS4) Storm Water Management Programs and Description of Alternatives for Control of Stormwater Quality in Los Angeles County.”
1.1 BACKGROUND
The 1987 amendments to the federal Clean Water Act (CWA) added Section 402(p), which defined stormwater discharges from industrial activities and municipal systems as point sources subject to the National Pollutant Discharge Elimination System (NPDES) Permit Program. The CWA directed the United States Environmental Protection Agency (USEPA) to publish regulations to define the discharges subject to NPDES permits and to establish a framework for regulating these discharges. The stormwater regulations promulgated by USEPA established a two-phase approach for municipal systems. The first phase began in 1990 and addressed discharges from (MS4s) that serve populations greater than 100,000 people. The second phase began in 1999 and addressed discharges from MS4s that serve populations less than 100,000 and are located in urbanized areas. The State Water Resources Control Board and the Regional Water Quality Control Boards (RWQCBs) can apply the Phase I or Phase II rules to areas with smaller populations as needed to protect water quality.
The CWA and federal stormwater regulations require MS4s subject to NPDES permits to reduce the pollutants in stormwater discharges to the maximum extent practicable (MEP). The regulations require the implementation of best management practices (BMPs) to meet the MEP discharge standard. BMPs include both source controls and treatment measures. MS4s are to implement an effective combination of these BMPs to reduce pollutants in stormwater discharges. In California, MS4 permits also require permittees to reduce the discharge of pollutants so that water quality standards are met. However, the permits do not specify strict compliance with numeric water quality standards. Rather, the MS4 permits require the compliance with standards through an iterative approach. Permittees implement BMPs according to storm water management plans. (If the current level of effort does not achieve water quality standards, additional BMPs are implemented until compliance has been achieved).
The current costs to implement BMPs have been the basis for lawsuits and petitions challenging the California stormwater regulatory program. Additionally, some permittees contend that current MS4 permits necessitate the use of advanced water treatment to meet water quality standards, which would drastically escalate costs above current levels (Gordon, 2001). Neither the USEPA nor the SWRCB has estimated costs for the development and implementation of MS4 stormwater programs to achieve MEP. The SWRCB and RWQCBs wish to respond to the contention that the intent of the California stormwater program is to require all stormwater discharges to be treated with advanced treatment devices. This project addresses these issues through two tasks.
SECTIONONE Introduction
2 NPDES Stormwater Cost Survey January 2005
Task A – Documenting Stormwater Program Costs
Documenting costs of a subset of California MS4 stormwater programs that were identified by RWQCB staff as demonstrating meaningful progress toward MEP compliance will aid in approximating costs of permit compliance statewide. Making meaningful progress is considered implementing activities specifically presented in the SWMPs. Stormwater program expenditures by those municipalities were compiled. The cost data was analyzed and normalized to identify potential cost factors that can be used to estimate costs for other municipalities to achieve permit compliance. Although compliance with construction and industrial permits is discussed in stormwater permits, the compliance costs for these permits are not included in this report. This report does not address the benefits of permit compliance activities1.
Only municipal costs are documented; total societal costs are not. There are additional costs borne by developers (passed onto homeowners), businesses, industries and residents that are not addressed in Task A. The Task A was accomplished by personnel from the Office of Water Programs at CSUS.
Task B – Alternative Approaches to Stormwater Quality Control
Task B is an assessment of regulatory policy to determine the intent of stormwater regulation regarding advanced treatment. Alternatives for stormwater quality control that are believed to comply with the intent of the regulations are described and costs are estimated for the Los Angeles Regional Water Quality Control Board (LARWQCB) area. The intent of the regulation was determined by speaking with LARWQCB staff and reviewing past regulatory action. Task B was accomplished by faculty from the University of Southern California and the University of California Los Angeles. This task assumes the MS4 permitting process as it stands presently, using an iterative process of enhancing implementation of BMPs. This scenario may overlap with the Total Maximum Daily Load (TMDL) process, but it is not necessarily the same since the TMDL process address pollution sources other than stormwater.
1.2 REPORT ORGANIZATION
Task A is addressed in Sections 2 through 9. Section 2 presents the methodology for gathering, analyzing, and presenting cost information. Sections 3 through 8 present the NPDES-related stormwater costs and other relevant characteristics for the six municipal areas surveyed. The raw cost data and description of how program costs were developed are shown in Appendices A through F. In Section 9, normalized costs for each major stormwater program element are presented and compared between cities. Explanations for the observed differences are also offered. Appendix G contains the backup calculations for Section 9. Section 10 presents
1 A subcommittee of the California Stormwater Quality Association (CASQA) is working on developing guidelines for program effectiveness evaluation, which has an ultimate goal of quantifying changes in receiving water quality (the benefit) due to stormwater activities.
SECTIONONE Introduction
NPDES Stormwater Cost Survey 3 January 2005
recommendations for further cost reporting and analysis. References are in Section 11. Task B is included as Appendix H.

4 (blank) NPDES Stormwater Cost Survey January 2005
SECTIONTWO Methodology
NPDES Stormwater Cost Survey 5 January 2005
2.0 METHODOLOGY
The method for data collection, organization, and quality evaluation is presented in this section. Data sources are also described. Methodology and assumption for Task B are reviewed in the Executive Summary of the report found in Appendix H.
2.1 TECHNICAL ADVISORY GROUP
A technical advisory group (TAG) was formed to assist in the execution of this project. The TAG was comprised of one representative from USEPA, one from RWQCB, three from universities not associated with executing the study, one consultant, and one representative from the California Stormwater Quality Association (CASQA)2. TAG members reviewed and commented on each major phase of the study, including the initial city selection, initial scope of the study, initial results from the first city, and the interim draft report. A description of the TAG and their comments are included in Appendix K. The TAG did not review the work done for Task B (Appendix H).
2.2 CITY SELECTION
The following criteria were used in the selection process:
• nominated by RWQCB staff as having a good stormwater program, • a variety of geographic and hydrologic areas within California, • have a stormwater fund or equivalent that required the cities to track stormwater
costs, • a variety of populations, with at least one city below 100,000, and • a variety of income per population or household.
Initial nominations and selection recommendations were presented in a memorandum to the SWRCB (Appendix I). Subsequent discussion with cities and RWQCB staff refined the list. One nominee, Corona, was considered after the memorandum was submitted. All the cities nominated for the inland area of Southern California were not able to participate, so the RWQCB then nominated Corona. Corona was not initially considered because of a lack of familiarity with the progress of their stormwater program. Subsequent review established Corona as a nominee.
The following municipalities were selected and agreed to participate in the cost survey:
• Corona • Fresno-Clovis Metropolitan Area • Encinitas • Sacramento • Fremont • Santa Clarita
2 CASQA is a non-profit organization with mostly municipality membership. CASQA advises the California SWRCB on stormwater issues.
SECTIONTWO Methodology
6 NPDES Stormwater Cost Survey January 2005
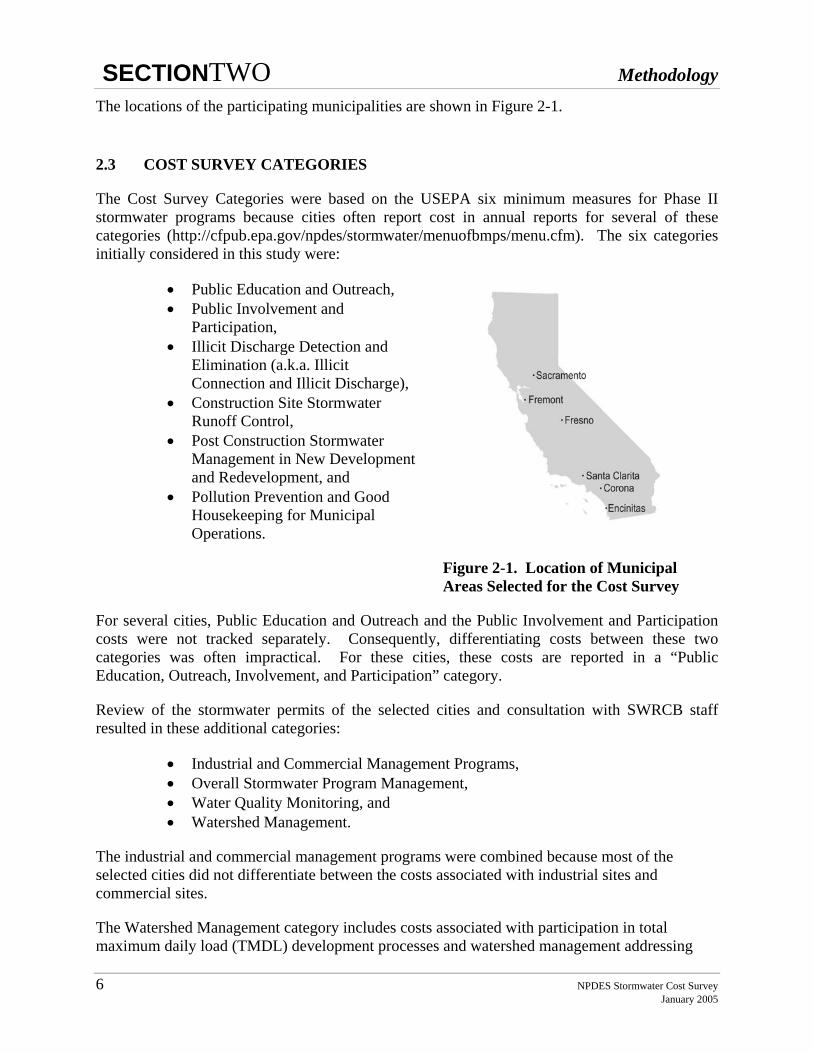
The locations of the participating municipalities are shown in Figure 2-1.
2.3 COST SURVEY CATEGORIES
The Cost Survey Categories were based on the USEPA six minimum measures for Phase II stormwater programs because cities often report cost in annual reports for several of these categories (http://cfpub.epa.gov/npdes/stormwater/menuofbmps/menu.cfm). The six categories initially considered in this study were:
• Public Education and Outreach, • Public Involvement and
Participation, • Illicit Discharge Detection and
Elimination (a.k.a. Illicit Connection and Illicit Discharge),
• Construction Site Stormwater Runoff Control,
• Post Construction Stormwater Management in New Development and Redevelopment, and
• Pollution Prevention and Good Housekeeping for Municipal Operations.
Figure 2-1. Location of Municipal Areas Selected for the Cost Survey
For several cities, Public Education and Outreach and the Public Involvement and Participation costs were not tracked separately. Consequently, differentiating costs between these two categories was often impractical. For these cities, these costs are reported in a “Public Education, Outreach, Involvement, and Participation” category.
Review of the stormwater permits of the selected cities and consultation with SWRCB staff resulted in these additional categories:
• Industrial and Commercial Management Programs, • Overall Stormwater Program Management, • Water Quality Monitoring, and • Watershed Management.
The industrial and commercial management programs were combined because most of the selected cities did not differentiate between the costs associated with industrial sites and commercial sites.
The Watershed Management category includes costs associated with participation in total maximum daily load (TMDL) development processes and watershed management addressing
SECTIONTWO Methodology
NPDES Stormwater Cost Survey 7 January 2005
303(d)3 pollutants. Most of the cities are not actively implementing TMDLs and costs reported in this category do not include TMDL implementation activities. Furthermore, existing TMDLs suggest stormwater compliance will be through enhancement to current permit compliance activities such as post-construction BMPs.
2.4 IDENTIFYING NEW, EXISTING, AND ENHANCED COSTS
All costs were identified as new, existing, or enhanced according to the extent that the activities existed before the first stormwater permit. New costs are for activities that are exclusively a result of compliance efforts with the stormwater permit. Existing costs are for activities that predated stormwater permits. Enhanced costs are for existing activities that were increased due to permit requirements. Enhanced costs are the total cost for impacted activities. It is not the increase in cost due to permit requirements. This number would have to be developed from 1990 baseline costs, and this is beyond the scope of this project.
2.5 DATA COLLECTION
Because costs for the 2003/2004 fiscal year were not available at the start of this survey, costs for the 2002/2003 fiscal year were collected.
Initially, a questionnaire was developed to facilitate the data collection effort. Questions were developed to capture cost data and descriptions of the stormwater program activities for each city. The questionnaire was organized by cost category and included questions for individual activities or BMPs within each cost category. The questionnaire was given to the city of Sacramento as a test case, but it proved difficult to use as the cost information and description of activities/BMPs available to city staff did not match well with those in the questionnaire. Consequently, the questionnaire was abandoned as the primary data collection tool, though it was shared with other cities as a guide to help staff understand what type of information was being sought.
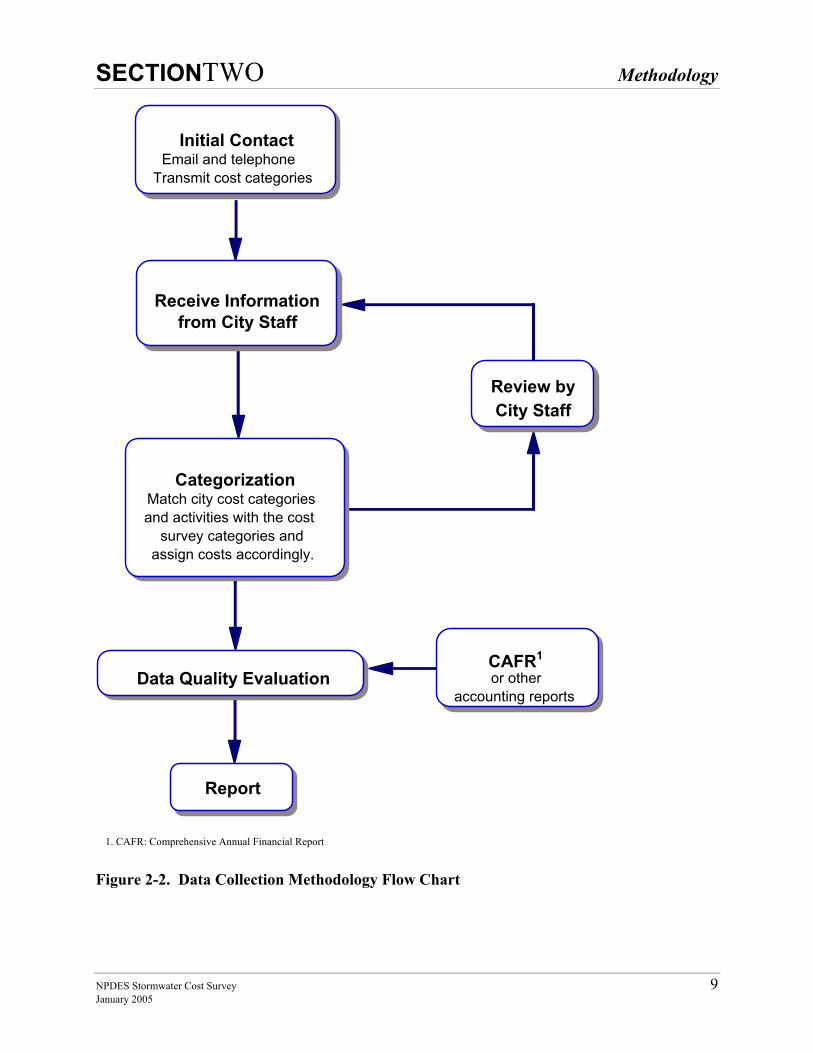
The data collection methodology is depicted in Figure 2-2. City staff members were contacted by email and with follow-up telephone conversations in which the purpose and scope of the study were described. As mentioned above, a copy of the questionnaire was sent as guidance material. City staff then submitted cost and activity data in whatever format was available. The documents that usually contained the most useful information were the city's annual stormwater report, cost spreadsheets submitted by city staff, the NPDES stormwater permit, and SWMPs, or Stormwater Quality Improvement Plans (SQIPs), or Drainage Area Master Plans (DAMPs).
The next step was to fit the information provided into the cost survey categories. This wasn’t always straightforward as there were significant differences among cities in the format and
3 The term 303(d) pollutants are used here to describe the pollutants in specific waters for which TMDLs are being developed according to Section 303(d) of the CWA.
SECTIONTWO Methodology
8 NPDES Stormwater Cost Survey January 2005
content of annual stormwater reports. For example, the annual stormwater report for one city was divided into two separate submittals, each covering one half of the year. The study team combined data from each section to represent the whole year. In another example, the annual stormwater reports of two cities did not contain costs. In these cases, cost and activity data was assembled from multiple alternate sources. After working through a variety of reporting formats, costs were allocated among the cost survey categories and entered into tables similar to Table 2-1. These tables were returned to the surveyed cities to give them an opportunity to comment on the allocation of costs. Follow up inquiries were also made when data was incomplete or missing. Data collection, cost allocation, and coordination with the surveyees’ continued until all substantial questions were answered. Coordination with city staff members usually resulted in adjustments that more accurately accounted for those stormwater activities related to permit compliance.
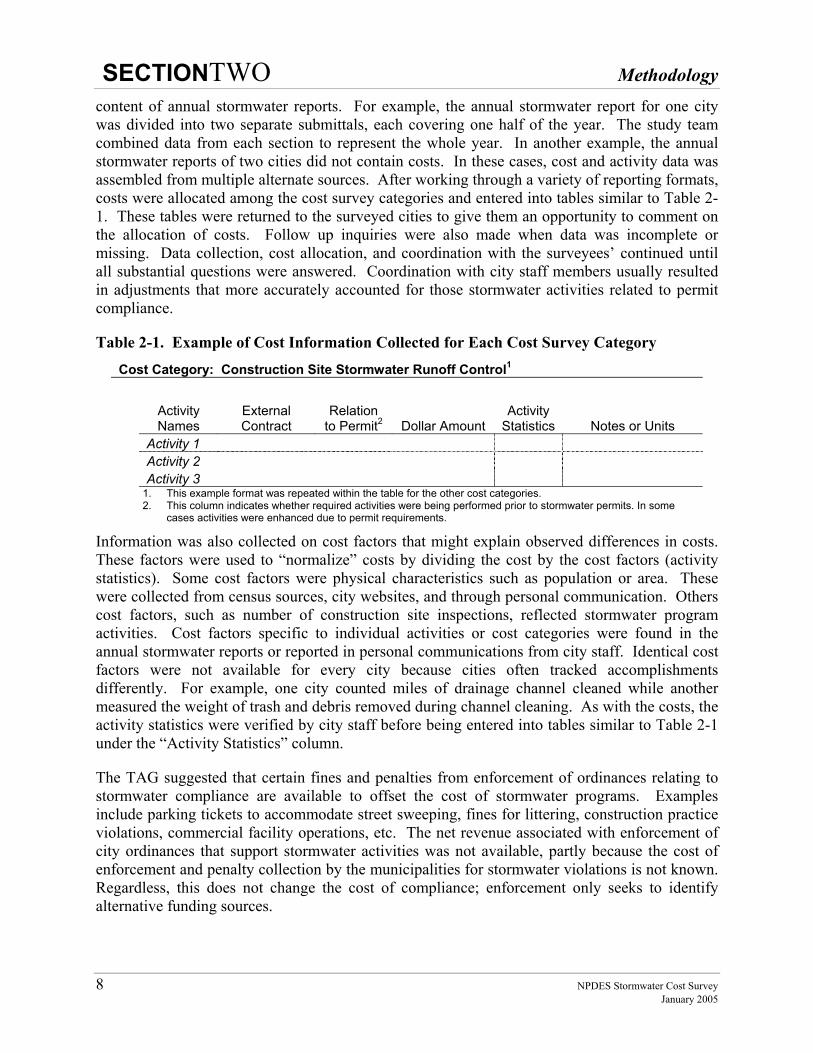
Table 2-1. Example of Cost Information Collected for Each Cost Survey Category
Cost Category: Construction Site Stormwater Runoff Control1
Activity Names
External Contract
Relation to Permit2 Dollar Amount
Activity Statistics Notes or Units
Activity 1 Activity 2 Activity 3
1. This example format was repeated within the table for the other cost categories. 2. This column indicates whether required activities were being performed prior to stormwater permits. In some
cases activities were enhanced due to permit requirements.
Information was also collected on cost factors that might explain observed differences in costs. These factors were used to “normalize” costs by dividing the cost by the cost factors (activity statistics). Some cost factors were physical characteristics such as population or area. These were collected from census sources, city websites, and through personal communication. Others cost factors, such as number of construction site inspections, reflected stormwater program activities. Cost factors specific to individual activities or cost categories were found in the annual stormwater reports or reported in personal communications from city staff. Identical cost factors were not available for every city because cities often tracked accomplishments differently. For example, one city counted miles of drainage channel cleaned while another measured the weight of trash and debris removed during channel cleaning. As with the costs, the activity statistics were verified by city staff before being entered into tables similar to Table 2-1 under the “Activity Statistics” column.
The TAG suggested that certain fines and penalties from enforcement of ordinances relating to stormwater compliance are available to offset the cost of stormwater programs. Examples include parking tickets to accommodate street sweeping, fines for littering, construction practice violations, commercial facility operations, etc. The net revenue associated with enforcement of city ordinances that support stormwater activities was not available, partly because the cost of enforcement and penalty collection by the municipalities for stormwater violations is not known. Regardless, this does not change the cost of compliance; enforcement only seeks to identify alternative funding sources.
SECTIONTWO Methodology
NPDES Stormwater Cost Survey 9 January 2005
Figure 2-2. Data Collection Methodology Flow Chart
Initial Contact Email and telephone
Transmit cost categories
Receive Information from City Staff
Categorization Match city cost categories and activities with the cost
survey categories and assign costs accordingly.
Review by City Staff
Data Quality EvaluationCAFR1 or other
accounting reports
Report
1. CAFR: Comprehensive Annual Financial Report
SECTIONTWO Methodology
10 NPDES Stormwater Cost Survey January 2005
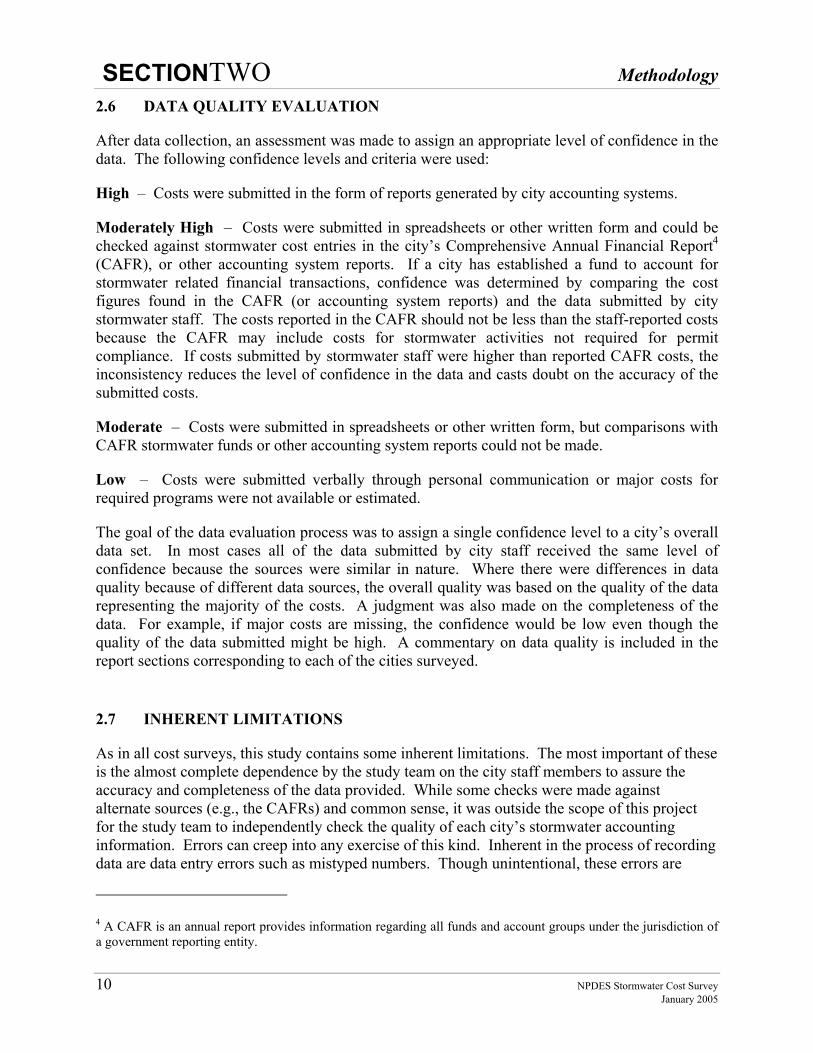
2.6 DATA QUALITY EVALUATION
After data collection, an assessment was made to assign an appropriate level of confidence in the data. The following confidence levels and criteria were used:
High – Costs were submitted in the form of reports generated by city accounting systems.
Moderately High – Costs were submitted in spreadsheets or other written form and could be checked against stormwater cost entries in the city’s Comprehensive Annual Financial Report4 (CAFR), or other accounting system reports. If a city has established a fund to account for stormwater related financial transactions, confidence was determined by comparing the cost figures found in the CAFR (or accounting system reports) and the data submitted by city stormwater staff. The costs reported in the CAFR should not be less than the staff-reported costs because the CAFR may include costs for stormwater activities not required for permit compliance. If costs submitted by stormwater staff were higher than reported CAFR costs, the inconsistency reduces the level of confidence in the data and casts doubt on the accuracy of the submitted costs.
Moderate – Costs were submitted in spreadsheets or other written form, but comparisons with CAFR stormwater funds or other accounting system reports could not be made.
Low – Costs were submitted verbally through personal communication or major costs for required programs were not available or estimated.
The goal of the data evaluation process was to assign a single confidence level to a city’s overall data set. In most cases all of the data submitted by city staff received the same level of confidence because the sources were similar in nature. Where there were differences in data quality because of different data sources, the overall quality was based on the quality of the data representing the majority of the costs. A judgment was also made on the completeness of the data. For example, if major costs are missing, the confidence would be low even though the quality of the data submitted might be high. A commentary on data quality is included in the report sections corresponding to each of the cities surveyed.
2.7 INHERENT LIMITATIONS
As in all cost surveys, this study contains some inherent limitations. The most important of these is the almost complete dependence by the study team on the city staff members to assure the accuracy and completeness of the data provided. While some checks were made against alternate sources (e.g., the CAFRs) and common sense, it was outside the scope of this project for the study team to independently check the quality of each city’s stormwater accounting information. Errors can creep into any exercise of this kind. Inherent in the process of recording data are data entry errors such as mistyped numbers. Though unintentional, these errors are
4 A CAFR is an annual report provides information regarding all funds and account groups under the jurisdiction of a government reporting entity.
SECTIONTWO Methodology
NPDES Stormwater Cost Survey 11 January 2005
sometimes not identified and resolved. Another potential source of error is an incomplete record. Sometimes things are forgotten and overall data quality suffers.
The study team thanks the staff members of the participating cities for their efforts to assure that the data provided are as correct and complete as possible. What errors may have crept into the data are certainly unintentional, and are not believed to be large enough to affect the major findings of the study.
2.8 DATA COMPARISONS TO OTHER STUDIES
A review of literature revealed several sources of cost information throughout the United States. The primary sources reviewed were the Rouge River Watershed project in Michigan, the National Association of Flood and Stormwater Management Agencies (NAFSMA) survey of Phase II municipalities, and the USEPA review of Phase I costs (USEPA, 2004). These costs are discussed in Section 9.6.

12 (blank) NPDES Stormwater Cost Survey January 2005
SECTIONTHREE City of Corona
NPDES Stormwater Cost Survey 13 January 2005
3.0 CITY OF CORONA
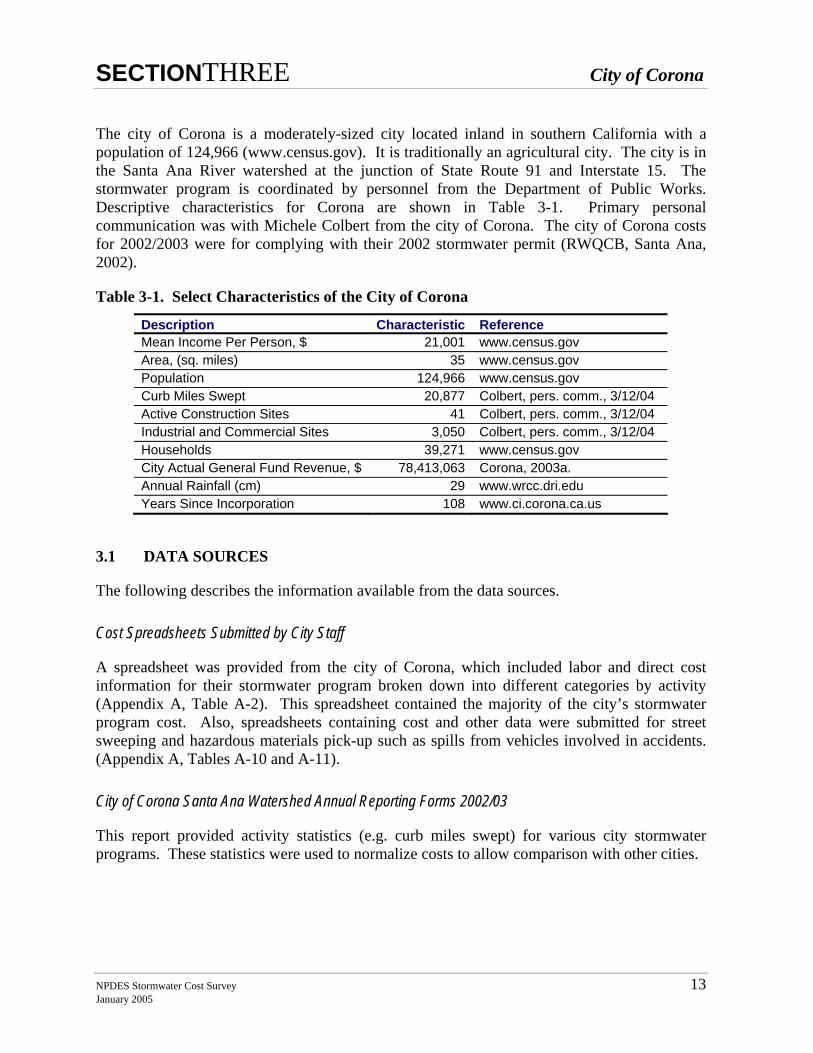
The city of Corona is a moderately-sized city located inland in southern California with a population of 124,966 (www.census.gov). It is traditionally an agricultural city. The city is in the Santa Ana River watershed at the junction of State Route 91 and Interstate 15. The stormwater program is coordinated by personnel from the Department of Public Works. Descriptive characteristics for Corona are shown in Table 3-1. Primary personal communication was with Michele Colbert from the city of Corona. The city of Corona costs for 2002/2003 were for complying with their 2002 stormwater permit (RWQCB, Santa Ana, 2002).
Table 3-1. Select Characteristics of the City of Corona
Description Characteristic Reference Mean Income Per Person, $ 21,001 www.census.gov Area, (sq. miles) 35 www.census.gov Population 124,966 www.census.gov Curb Miles Swept 20,877 Colbert, pers. comm., 3/12/04 Active Construction Sites 41 Colbert, pers. comm., 3/12/04 Industrial and Commercial Sites 3,050 Colbert, pers. comm., 3/12/04 Households 39,271 www.census.gov City Actual General Fund Revenue, $ 78,413,063 Corona, 2003a. Annual Rainfall (cm) 29 www.wrcc.dri.edu Years Since Incorporation 108 www.ci.corona.ca.us
3.1 DATA SOURCES
The following describes the information available from the data sources.
Cost Spreadsheets Submitted by City Staff
A spreadsheet was provided from the city of Corona, which included labor and direct cost information for their stormwater program broken down into different categories by activity (Appendix A, Table A-2). This spreadsheet contained the majority of the city’s stormwater program cost. Also, spreadsheets containing cost and other data were submitted for street sweeping and hazardous materials pick-up such as spills from vehicles involved in accidents. (Appendix A, Tables A-10 and A-11).
City of Corona Santa Ana Watershed Annual Reporting Forms 2002/03
This report provided activity statistics (e.g. curb miles swept) for various city stormwater programs. These statistics were used to normalize costs to allow comparison with other cities.
SECTIONTHREE City of Corona
14 NPDES Stormwater Cost Survey January 2005
Personal Communication: Interviews, Phone Calls, E-Mail
Personal communication with city of Corona staff provided additional stormwater program costs that augmented the data submitted in their cost spreadsheet. Through personal communication, city staff elaborated on what was accomplished for each cost submitted in their spreadsheet and commented on the allocation of costs among the cost survey categories.
Comprehensive Annual Financial Report (CAFR) 2002/03
The city of Corona has not established a fund to account for overall stormwater transactions, therefore no cost comparisons were made to CAFR figures.
Santa Ana Regional Drainage Area Management Plan (SAR-DAMP) 1993
This document describes the overall stormwater management strategies planned by the municipalities in the Santa Ana drainage area of Riverside County (Corona SAR-DAMP). While no cost figures were obtained from this document, it was used to verify that an activity was required by the permit.
3.2 COST DATA SUMMARY
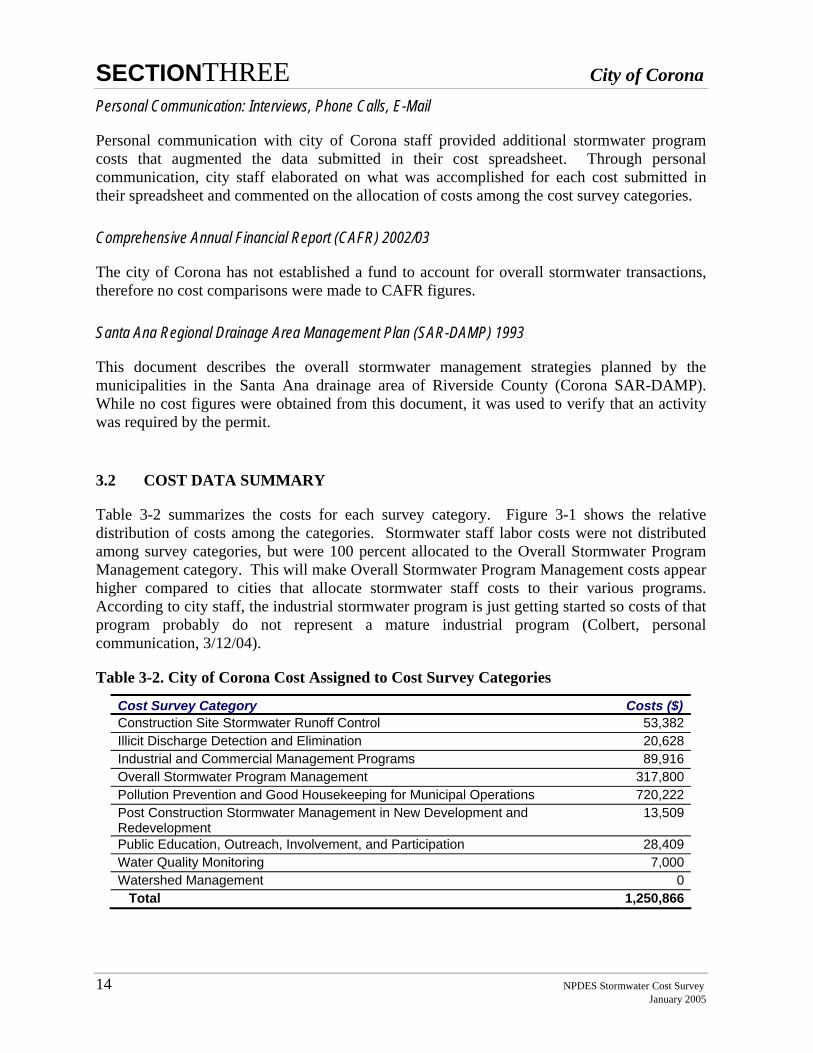
Table 3-2 summarizes the costs for each survey category. Figure 3-1 shows the relative distribution of costs among the categories. Stormwater staff labor costs were not distributed among survey categories, but were 100 percent allocated to the Overall Stormwater Program Management category. This will make Overall Stormwater Program Management costs appear higher compared to cities that allocate stormwater staff costs to their various programs. According to city staff, the industrial stormwater program is just getting started so costs of that program probably do not represent a mature industrial program (Colbert, personal communication, 3/12/04).
Table 3-2. City of Corona Cost Assigned to Cost Survey Categories
Cost Survey Category Costs ($) Construction Site Stormwater Runoff Control 53,382Illicit Discharge Detection and Elimination 20,628Industrial and Commercial Management Programs 89,916Overall Stormwater Program Management 317,800Pollution Prevention and Good Housekeeping for Municipal Operations 720,222Post Construction Stormwater Management in New Development and Redevelopment
13,509
Public Education, Outreach, Involvement, and Participation 28,409Water Quality Monitoring 7,000Watershed Management 0 Total 1,250,866
SECTIONTHREE City of Corona
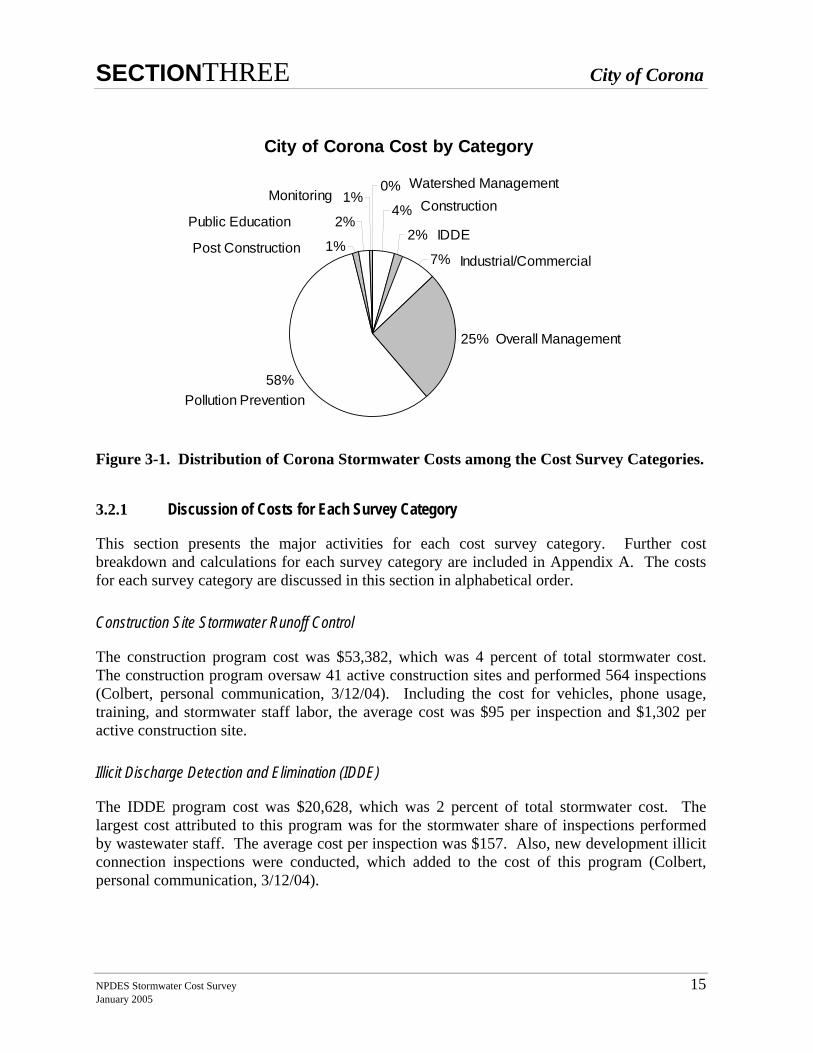
NPDES Stormwater Cost Survey 15 January 2005
City of Corona Cost by Category
4%
2%
7%
25%
58%
1%
2%
1%0%
Overall Management
Industrial/Commercial
IDDE
ConstructionWatershed Management
Post Construction
Public Education
Monitoring
Pollution Prevention
Figure 3-1. Distribution of Corona Stormwater Costs among the Cost Survey Categories.
3.2.1 Discussion of Costs for Each Survey Category
This section presents the major activities for each cost survey category. Further cost breakdown and calculations for each survey category are included in Appendix A. The costs for each survey category are discussed in this section in alphabetical order.
Construction Site Stormwater Runoff Control
The construction program cost was $53,382, which was 4 percent of total stormwater cost. The construction program oversaw 41 active construction sites and performed 564 inspections (Colbert, personal communication, 3/12/04). Including the cost for vehicles, phone usage, training, and stormwater staff labor, the average cost was $95 per inspection and $1,302 per active construction site.
Illicit Discharge Detection and Elimination (IDDE)
The IDDE program cost was $20,628, which was 2 percent of total stormwater cost. The largest cost attributed to this program was for the stormwater share of inspections performed by wastewater staff. The average cost per inspection was $157. Also, new development illicit connection inspections were conducted, which added to the cost of this program (Colbert, personal communication, 3/12/04).
SECTIONTHREE City of Corona
16 NPDES Stormwater Cost Survey January 2005
Industrial and Commercial Management Programs
The industrial and commercial program cost was $89,916, which was 7 percent of total stormwater cost. The industrial program had 600 inspections at an average cost of $134 per inspection.
Overall Stormwater Program Management
The overall management program cost was $317,800, which was 25 percent of total stormwater cost. The city was unable to distribute the staff cost among the cost survey categories so all of the stormwater staff cost was assigned to this category. Administrative service charges account for 25 percent of this category’s cost. The staff costs represent approximately 62 percent of the costs assigned to this category and 16 percent of total stormwater cost. The remaining 23 percent are for office supplies, reporting, and NPDES fee.
Pollution Prevention and Good Housekeeping for Municipal Operations
The municipal operations program cost was $720,222, which was 58 percent of total stormwater cost. The two primary activities in this category were street sweeping and drain line/channel cleaning. The average cost was $20 per curb mile swept and $8 per linear foot of drain lines and channels cleaned. Street sweeping and drain line and channel cleaning account for 33 percent and 20 percent of total stormwater cost respectively. City staff labor associated with these activities is reported in this category.
Post Construction Stormwater Management in New Development and Redevelopment
The post construction program cost was $13,509, which was 1 percent of total stormwater cost. Post construction cost was primarily for professional consulting services for BMP selection. Also, installation and maintenance of 8 storm drain inlet inserts cost $4,500, averaging $562 per insert per year.
Public Education, Outreach, Involvement, and Participation
The public education program cost was $28,409, which was 2 percent of total stormwater cost. Public education and outreach activities often incorporated public involvement and participation activities. This made differentiating cost between the categories impractical. Because of this, the two programs were combined.
Water Quality Monitoring
The monitoring program cost was $7,000, which was 0.6 percent of total stormwater cost. This cost was associated with the illicit discharge detection and elimination program.
SECTIONTHREE City of Corona
NPDES Stormwater Cost Survey 17 January 2005
Watershed Management
The city of Corona did not allocate any cost to this category. The effort was captured under other programs such as Overall Stormwater Program Management.
3.3 CONFIDENCE IN THE DATA
For the city of Corona, confidence in the data was moderate because most of the cost data submitted was via spreadsheets built, maintained, and updated by the city. However, as with most of the cities selected, the program costs provided could not be verified by city accounting system reports.
Since the city did not have a fund in place to account for overall stormwater related transactions, comparison of stormwater costs submitted by city staff with CAFR cost figures was not possible. This limited the level of confidence in the data to ‘moderate.’

18 (blank) NPDES Stormwater Cost Survey January 2005
SECTIONFOUR City of Encinitas
NPDES Stormwater Cost Survey 19 January 2005
4.0 CITY OF ENCINITAS
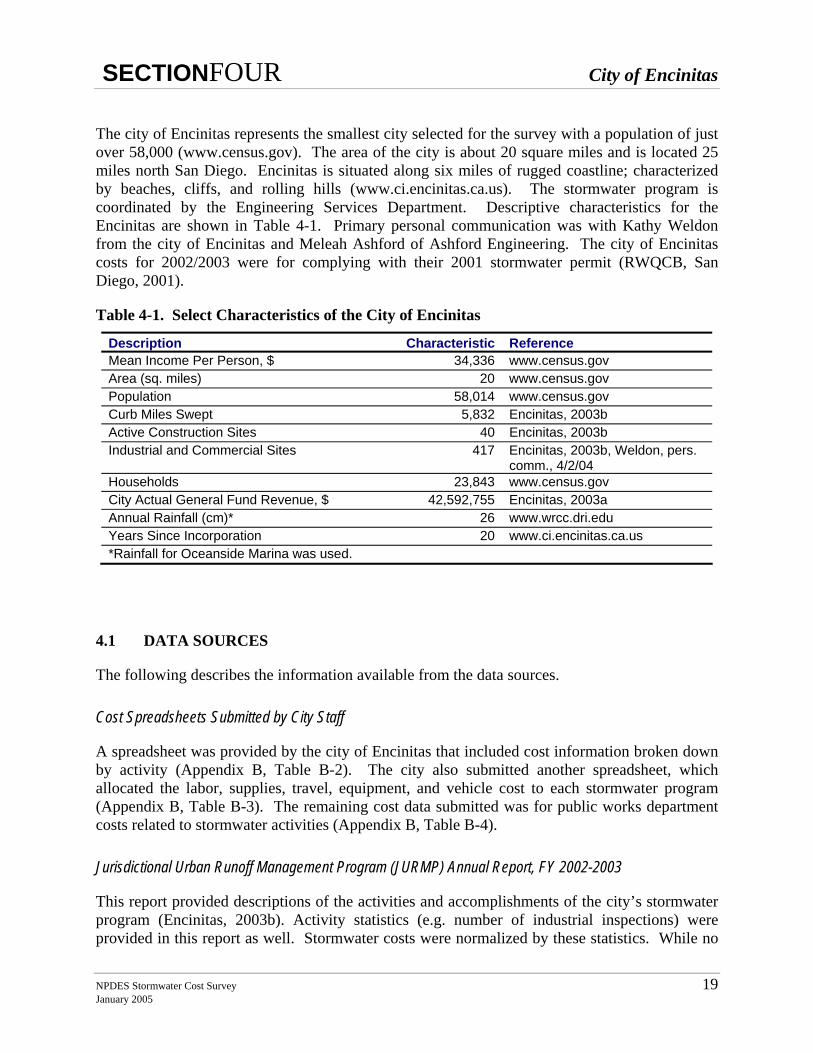
The city of Encinitas represents the smallest city selected for the survey with a population of just over 58,000 (www.census.gov). The area of the city is about 20 square miles and is located 25 miles north San Diego. Encinitas is situated along six miles of rugged coastline; characterized by beaches, cliffs, and rolling hills (www.ci.encinitas.ca.us). The stormwater program is coordinated by the Engineering Services Department. Descriptive characteristics for the Encinitas are shown in Table 4-1. Primary personal communication was with Kathy Weldon from the city of Encinitas and Meleah Ashford of Ashford Engineering. The city of Encinitas costs for 2002/2003 were for complying with their 2001 stormwater permit (RWQCB, San Diego, 2001).
Table 4-1. Select Characteristics of the City of Encinitas
Description Characteristic Reference Mean Income Per Person, $ 34,336 www.census.gov Area (sq. miles) 20 www.census.gov Population 58,014 www.census.gov Curb Miles Swept 5,832 Encinitas, 2003b Active Construction Sites 40 Encinitas, 2003b Industrial and Commercial Sites 417 Encinitas, 2003b, Weldon, pers.
comm., 4/2/04 Households 23,843 www.census.gov City Actual General Fund Revenue, $ 42,592,755 Encinitas, 2003a Annual Rainfall (cm)* 26 www.wrcc.dri.edu Years Since Incorporation 20 www.ci.encinitas.ca.us *Rainfall for Oceanside Marina was used.
4.1 DATA SOURCES
The following describes the information available from the data sources.
Cost Spreadsheets Submitted by City Staff
A spreadsheet was provided by the city of Encinitas that included cost information broken down by activity (Appendix B, Table B-2). The city also submitted another spreadsheet, which allocated the labor, supplies, travel, equipment, and vehicle cost to each stormwater program (Appendix B, Table B-3). The remaining cost data submitted was for public works department costs related to stormwater activities (Appendix B, Table B-4).
Jurisdictional Urban Runoff Management Program (JURMP) Annual Report, FY 2002-2003
This report provided descriptions of the activities and accomplishments of the city’s stormwater program (Encinitas, 2003b). Activity statistics (e.g. number of industrial inspections) were provided in this report as well. Stormwater costs were normalized by these statistics. While no
SECTIONFOUR City of Encinitas
20 NPDES Stormwater Cost Survey January 2005
cost figures were obtained from this document, it was used to verify that an activity was required for compliance with the permit.
Personal Communication: Interviews, Phone Calls, E-mail
Personal communication with the city of Encinitas staff provided additional stormwater program costs that augmented the data submitted in their cost spreadsheet. These costs were for stormwater activities performed by the department of public works. They also provided allocations of labor, supplies, travel, equipment, and vehicle to cost survey categories based on estimated percentages. Also, city staff elaborated on what was accomplished for each cost submitted in their spreadsheet and commented on the allocation of costs among the cost survey categories.
Comprehensive Annual Financial Report (CAFR) 2002/03
The city of Encinitas has not established a fund to account for overall stormwater transactions, so no comparisons on cost were made to CAFR figures. During fiscal year 2003/04, the city has since created such a fund (Ashford, personal communication, 4/2/04).
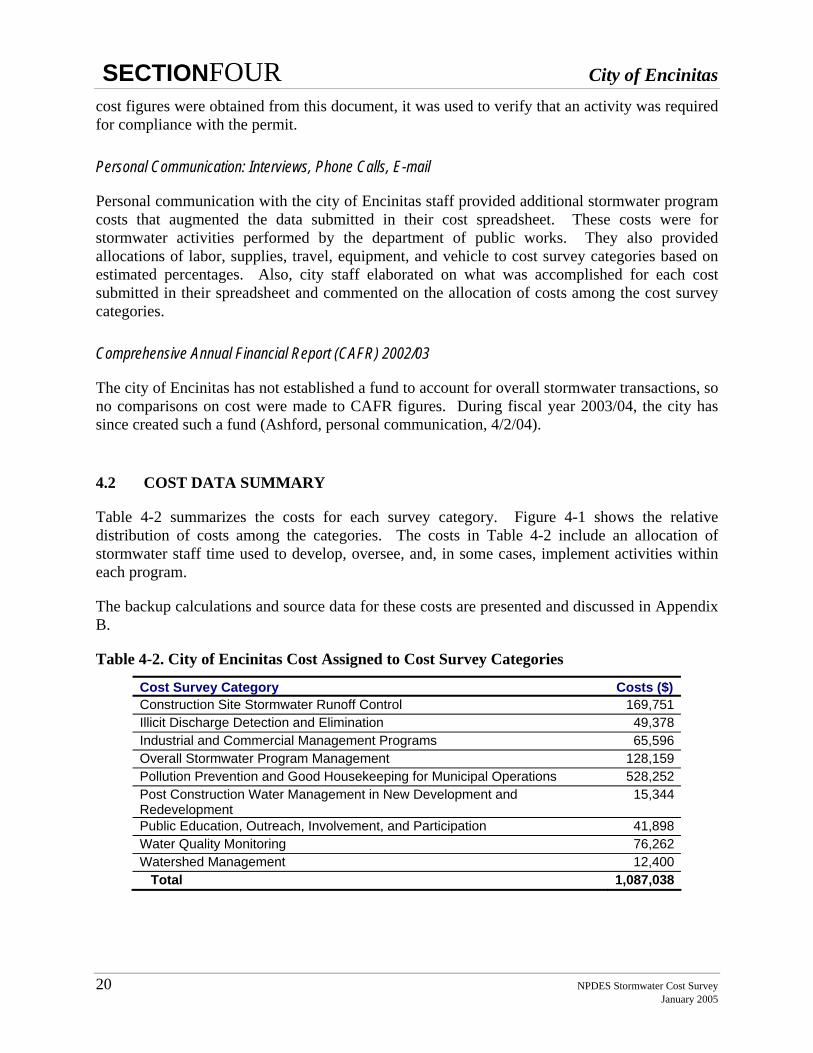
4.2 COST DATA SUMMARY
Table 4-2 summarizes the costs for each survey category. Figure 4-1 shows the relative distribution of costs among the categories. The costs in Table 4-2 include an allocation of stormwater staff time used to develop, oversee, and, in some cases, implement activities within each program.
The backup calculations and source data for these costs are presented and discussed in Appendix B.
Table 4-2. City of Encinitas Cost Assigned to Cost Survey Categories
Cost Survey Category Costs ($) Construction Site Stormwater Runoff Control 169,751Illicit Discharge Detection and Elimination 49,378Industrial and Commercial Management Programs 65,596Overall Stormwater Program Management 128,159Pollution Prevention and Good Housekeeping for Municipal Operations 528,252Post Construction Water Management in New Development and Redevelopment
15,344
Public Education, Outreach, Involvement, and Participation 41,898Water Quality Monitoring 76,262Watershed Management 12,400 Total 1,087,038
SECTIONFOUR City of Encinitas
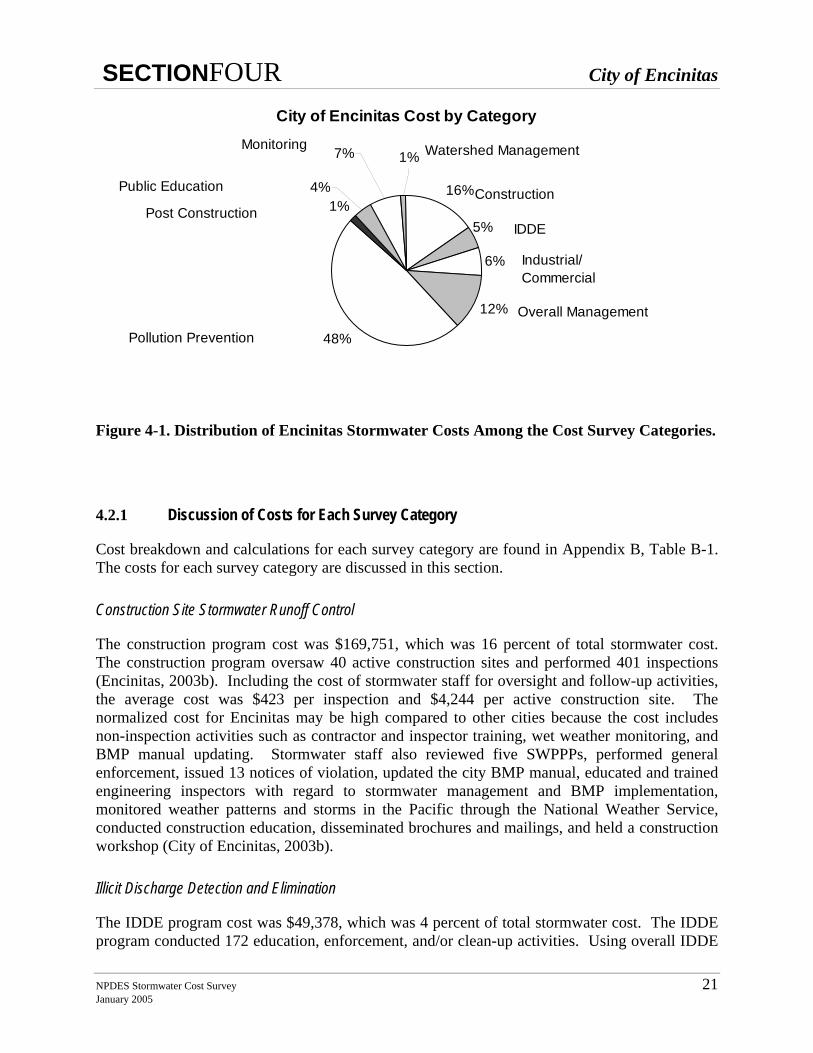
NPDES Stormwater Cost Survey 21 January 2005
City of Encinitas Cost by Category
16%
6%
12%
48%
1%4%
5%
1%7%
Overall Management
Industrial/ Commercial
IDDE
Construction
Monitoring
Public Education
Post Construction
Pollution Prevention
Watershed Management
Figure 4-1. Distribution of Encinitas Stormwater Costs Among the Cost Survey Categories.
4.2.1 Discussion of Costs for Each Survey Category
Cost breakdown and calculations for each survey category are found in Appendix B, Table B-1. The costs for each survey category are discussed in this section.
Construction Site Stormwater Runoff Control
The construction program cost was $169,751, which was 16 percent of total stormwater cost. The construction program oversaw 40 active construction sites and performed 401 inspections (Encinitas, 2003b). Including the cost of stormwater staff for oversight and follow-up activities, the average cost was $423 per inspection and $4,244 per active construction site. The normalized cost for Encinitas may be high compared to other cities because the cost includes non-inspection activities such as contractor and inspector training, wet weather monitoring, and BMP manual updating. Stormwater staff also reviewed five SWPPPs, performed general enforcement, issued 13 notices of violation, updated the city BMP manual, educated and trained engineering inspectors with regard to stormwater management and BMP implementation, monitored weather patterns and storms in the Pacific through the National Weather Service, conducted construction education, disseminated brochures and mailings, and held a construction workshop (City of Encinitas, 2003b).
Illicit Discharge Detection and Elimination
The IDDE program cost was $49,378, which was 4 percent of total stormwater cost. The IDDE program conducted 172 education, enforcement, and/or clean-up activities. Using overall IDDE
SECTIONFOUR City of Encinitas
22 NPDES Stormwater Cost Survey January 2005
cost, the average cost per activity was $287. From informal visual inspections, city staff received 76 “complaints,” and another 96 complaints were received via the city’s stormwater hotline.
Industrial and Commercial Management Programs
The industrial and commercial program cost was $65,596, which was 6 percent of total stormwater cost. This program had 266 inspections at an average cost of $247 per inspection. The normalized cost for Encinitas may be high compared to other cities because the cost includes non-inspection activities such as website updating, facility inventory, education, and enforcement actions (City of Encinitas, 2003b). The city has three industrial sites and 348 commercial sites. Stormwater staff updated the commercial facility inventory, provided BMP manuals and guidance, educated facility staff in regard to stormwater requirements and minimum BMPs, developed a grease program, and issued several enforcement actions (City of Encinitas, 2003b).
Overall Stormwater Program Management
The overall management program cost was $128,159, which was 12 percent of total stormwater cost. Developing a “clean water fee” cost $35,000 (Weldon, personal communication, 4/2/04). This fee pays for stormwater costs and is similar to stormwater fees assessed by other cities. This cost accounts for approximately 27 percent of this category’s cost. The other activities in this program were annual reporting and legal support for developing ordinances and plaintiff attorney fees. Costs in this category identified as possibly one-time were for the stormwater fee development, legal fees (ordinances and plaintiff attorneys), and grant writing.
Pollution Prevention and Good Housekeeping for Municipal Operations
The municipal operations program cost was $528,252, which was 49 percent of total stormwater cost. This category had three primary public works activities: cleaning sumps, inlets, and manholes; street sweeping; and cleaning drain lines and channels. Activity statistics were only available for street sweeping which was contracted out with minimal oversight (Weldon, personal communication, 4/2/04). The average cost was $20 per curb mile swept. The street sweeping cost is about 11 percent of total stormwater cost. Street sweeping cost does not include labor of the stormwater staff. This was because stormwater staff time was allocated to all municipal operations for stormwater and not to individual activities (e.g. street sweeping vs. channel cleaning). Other activities included in this program were trash pick-up, sediment disposal, and consulting services for oversight, strategic planning, and management.
Post Construction Stormwater Management in New Development and Redevelopment
The post construction program cost was $15,344, which was 1 percent of total stormwater cost. Post-construction cost was primarily for consulting and oversight of a special project to treat discharge to Moonlight Beach for bacteria. Also, installation and maintenance of 16 storm drain inserts cost $1,908, averaging $119 per insert per year. The cost associated with the “Moonlight Beach” project was possibly a one-time cost.
SECTIONFOUR City of Encinitas
NPDES Stormwater Cost Survey 23 January 2005
Public Education, Outreach, Involvement, and Participation
The public education program cost was $41,898, which was 4 percent of total stormwater cost. Public education and outreach activities often incorporated public involvement and participation activities. This made differentiating cost between the categories impractical. Because of this, the two programs were combined. The city of Encinitas had three watershed and beach clean-up activities (City of Encinitas, 2003b). Because the cost of outreach was not available separately and impression statistics were not available, outreach costs were not normalized.
Water Quality Monitoring
The monitoring program cost was $76,262, which was 7 percent of total stormwater cost. The cost was for collection, analysis, and contractor oversight of 48 dry weather bacteria samples (Weldon, personal communication, 4/2/04).
Watershed Management
The cost of this category was $12,400, which was 1 percent of total stormwater cost. These costs were for developing a one time watershed plan and participating in and hosting regional watershed meetings and workshops (Weldon, personal communication, 4/2/04).
4.3 CONFIDENCE IN THE DATA
For the city of Encinitas, confidence in the data was moderately high. This was because only a few cost figures submitted were verbal estimates without backup. Most of the cost data submitted was via spreadsheets built, maintained, and updated by the city. However, as with most of the cities selected, the program costs were provided but could not be verified by city accounting system reports.
For the fiscal year 2002/03, the city did not have a fund in place to account for overall stormwater related transactions. As such, comparison of stormwater costs submitted by city staff with CAFR cost figures was not possible, which did not allow for a higher level of confidence in the data.

24 (blank) NPDES Stormwater Cost Survey January 2005
SECTIONFIVE City of Fremont
NPDES Stormwater Cost Survey 25 January 2005
5.0 CITY OF FREMONT
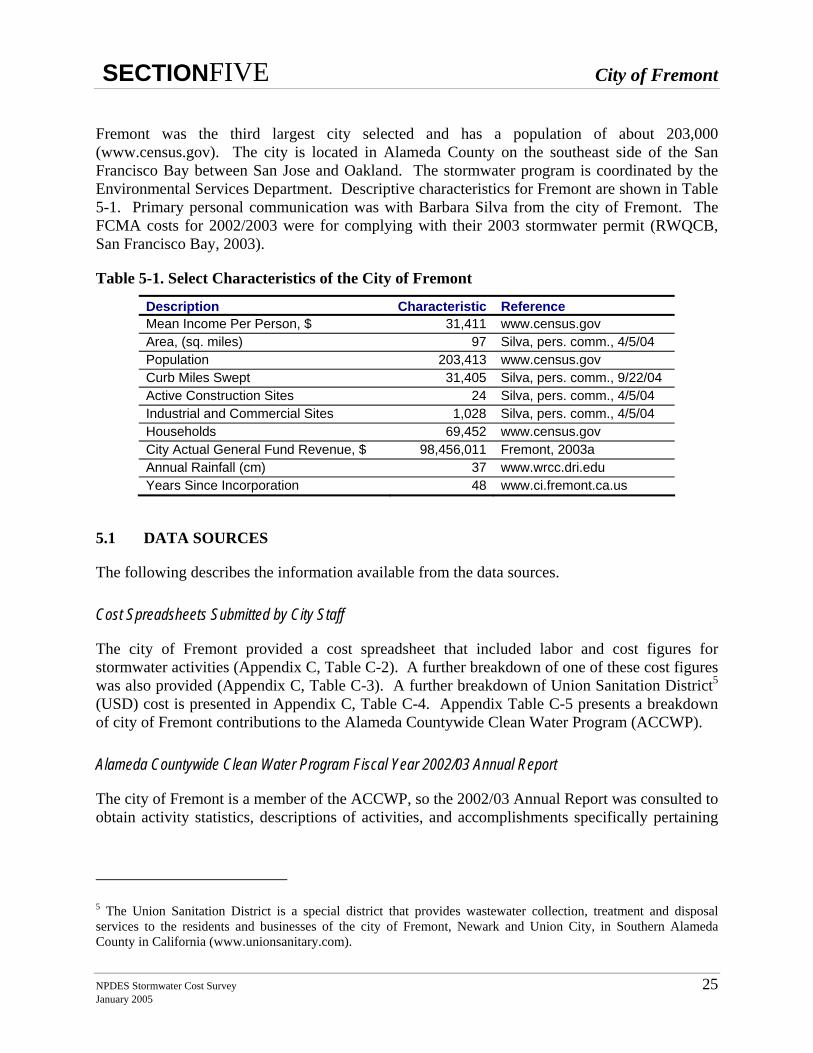
Fremont was the third largest city selected and has a population of about 203,000 (www.census.gov). The city is located in Alameda County on the southeast side of the San Francisco Bay between San Jose and Oakland. The stormwater program is coordinated by the Environmental Services Department. Descriptive characteristics for Fremont are shown in Table 5-1. Primary personal communication was with Barbara Silva from the city of Fremont. The FCMA costs for 2002/2003 were for complying with their 2003 stormwater permit (RWQCB, San Francisco Bay, 2003).
Table 5-1. Select Characteristics of the City of Fremont
Description Characteristic Reference Mean Income Per Person, $ 31,411 www.census.gov Area, (sq. miles) 97 Silva, pers. comm., 4/5/04 Population 203,413 www.census.gov Curb Miles Swept 31,405 Silva, pers. comm., 9/22/04 Active Construction Sites 24 Silva, pers. comm., 4/5/04 Industrial and Commercial Sites 1,028 Silva, pers. comm., 4/5/04 Households 69,452 www.census.gov City Actual General Fund Revenue, $ 98,456,011 Fremont, 2003a Annual Rainfall (cm) 37 www.wrcc.dri.edu Years Since Incorporation 48 www.ci.fremont.ca.us
5.1 DATA SOURCES
The following describes the information available from the data sources.
Cost Spreadsheets Submitted by City Staff
The city of Fremont provided a cost spreadsheet that included labor and cost figures for stormwater activities (Appendix C, Table C-2). A further breakdown of one of these cost figures was also provided (Appendix C, Table C-3). A further breakdown of Union Sanitation District5 (USD) cost is presented in Appendix C, Table C-4. Appendix Table C-5 presents a breakdown of city of Fremont contributions to the Alameda Countywide Clean Water Program (ACCWP).
Alameda Countywide Clean Water Program Fiscal Year 2002/03 Annual Report
The city of Fremont is a member of the ACCWP, so the 2002/03 Annual Report was consulted to obtain activity statistics, descriptions of activities, and accomplishments specifically pertaining
5 The Union Sanitation District is a special district that provides wastewater collection, treatment and disposal services to the residents and businesses of the city of Fremont, Newark and Union City, in Southern Alameda County in California (www.unionsanitary.com).
SECTIONFIVE City of Fremont
26 NPDES Stormwater Cost Survey January 2005
to the city of Fremont. As with other cities where relevant activity statistics were available, cost normalization was performed.
Personal Communication: Phone Calls, E-mail
Through personal communication, city staff provided detailed information regarding cost figures. City staff elaborated on what was accomplished for each cost submitted in their spreadsheet and commented on the allocation of costs among the cost survey categories.
Comprehensive Annual Financial Report (CAFR) 2002/03
During the 2002/03 fiscal year, the city of Fremont had a fund in place to account for overall stormwater related transactions. This fund is called the “Urban Runoff/Clean Water” fund (Fremont, 2003a). The cost figures in this fund were used for comparison purposes with costs submitted by city stormwater staff.
Alameda Countywide Clean Water Program, SWMP, July 2001-June 2008
The SWMP provided information regarding the structure, accomplishments, and recent developments of the program. It also gave information regarding objectives and tasks of each program component and specific tasks that the member agencies are required to perform (Fremont, 2003c). While no cost figures were obtained from this document, it was used to verify that an activity was required for compliance with the permit.
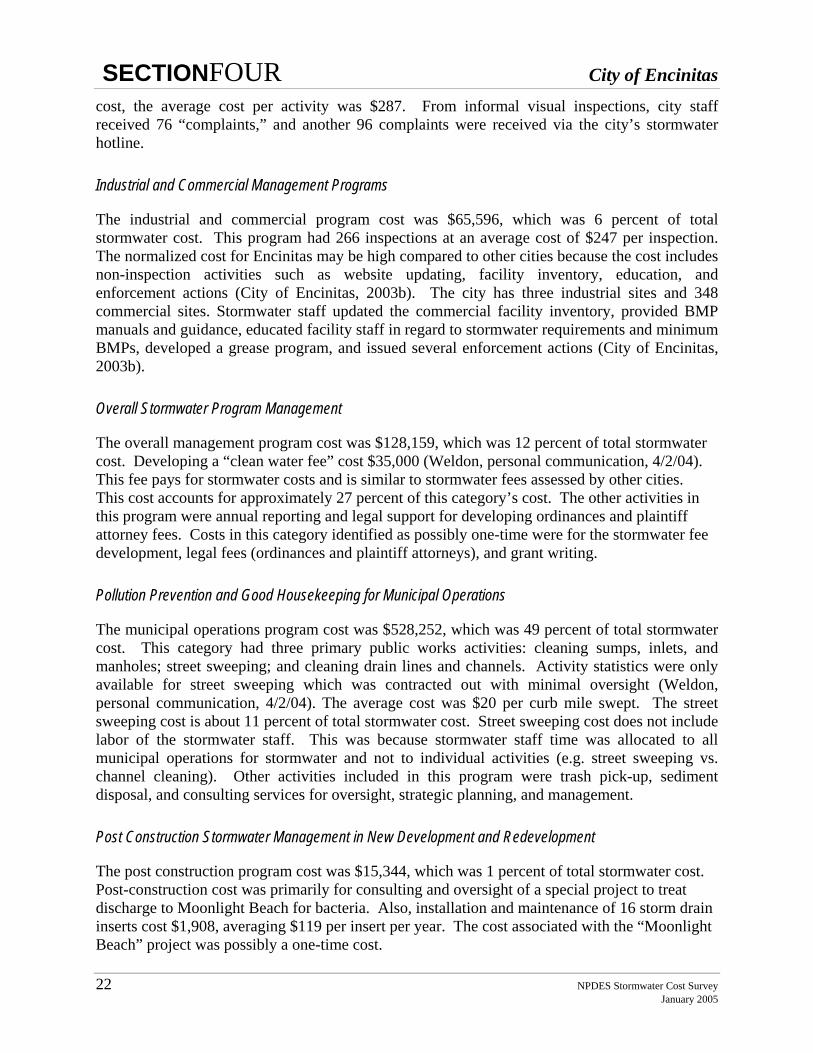
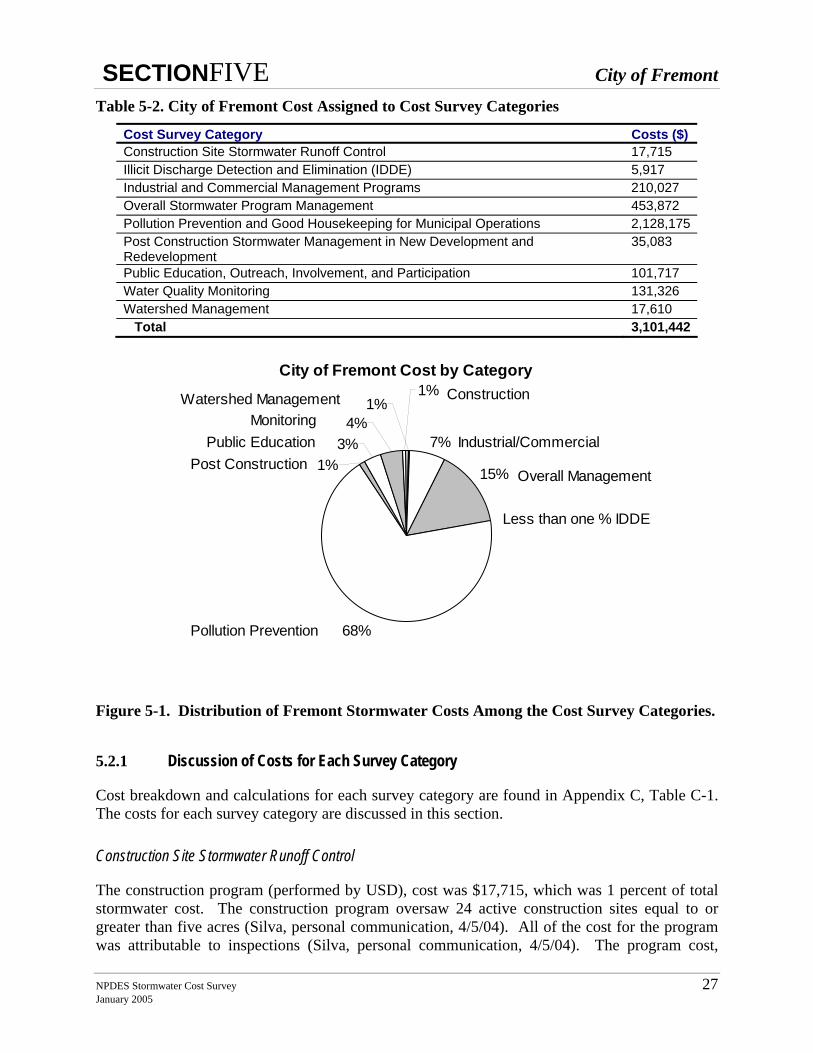
5.2 COST DATA SUMMARY
Table 5-2 summarizes the costs for each survey category. Figure 5-1 shows the relative distribution of costs among the categories. Stormwater staff labor costs for the city of Fremont were not distributed among survey categories, but were allocated to Overall Stormwater Program Management. This will make the costs in this category appear higher compared to cities that allocate stormwater staff costs to their various programs. Survey categories (excluding Overall Stormwater Program Management) that include costs or discussion in regard to “stormwater staff labor” only concerns ACCWP labor cost allocated to the city of Fremont. Fremont funded the USD to accomplish portions of the IDDE, industrial/commercial, construction, overall management, and public education programs.
SECTIONFIVE City of Fremont
NPDES Stormwater Cost Survey 27 January 2005
Table 5-2. City of Fremont Cost Assigned to Cost Survey Categories
Cost Survey Category Costs ($) Construction Site Stormwater Runoff Control 17,715 Illicit Discharge Detection and Elimination (IDDE) 5,917 Industrial and Commercial Management Programs 210,027 Overall Stormwater Program Management 453,872 Pollution Prevention and Good Housekeeping for Municipal Operations 2,128,175Post Construction Stormwater Management in New Development and Redevelopment
35,083
Public Education, Outreach, Involvement, and Participation 101,717 Water Quality Monitoring 131,326 Watershed Management 17,610 Total 3,101,442
City of Fremont Cost by Category
15%
68%
7%4%
1%
3%1%
1%
Overall Management
Industrial/Commercial
Less than one % IDDE
ConstructionWatershed ManagementMonitoring
Public EducationPost Construction
Pollution Prevention
Figure 5-1. Distribution of Fremont Stormwater Costs Among the Cost Survey Categories.
5.2.1 Discussion of Costs for Each Survey Category
Cost breakdown and calculations for each survey category are found in Appendix C, Table C-1. The costs for each survey category are discussed in this section.
Construction Site Stormwater Runoff Control
The construction program (performed by USD), cost was $17,715, which was 1 percent of total stormwater cost. The construction program oversaw 24 active construction sites equal to or greater than five acres (Silva, personal communication, 4/5/04). All of the cost for the program was attributable to inspections (Silva, personal communication, 4/5/04). The program cost,
SECTIONFIVE City of Fremont
28 NPDES Stormwater Cost Survey January 2005
normalized by construction sites, was $738 per active construction site greater than or equal to five acres.
Illicit Discharge Detection and Elimination
The IDDE program cost was $5,917, which was less than one percent of total stormwater cost. Most of the cost (86 percent) was for assistance to eliminate non-stormwater discharges and reporting. Stormwater staff labor cost represented the remaining 14 percent.
Industrial and Commercial Management Programs
The industrial and commercial program cost was $210,027, which was 7 percent of total stormwater cost. This program was performed by the USD, who performed 482 inspections with 91 follow-up actions of which 81 were enforcement actions. Not including documentation cost, the cost per inspection was $334.
Overall Stormwater Management Program
The overall management program cost was $453,872, which was 15 percent of total stormwater cost. Stormwater staff labor costs are included in this category. The labor costs (including overhead) represent about 69 percent of the cost attributed to this program. The other costs were for administrative services and supplies, permit fees, informational systems, and USD services.
Pollution Prevention and Good Housekeeping for Municipal Operations
The municipal operations program cost was $2,128,175, which was 69 percent of total stormwater cost. The two primary activities of this category were street sweeping, and litter and debris removal. The average cost was $61 per curb mile swept. For this category, street sweeping accounted for approximately 90 percent of the cost and 9 percent was attributable to litter debris and removal. Other activities performed by the city included cleaning drain lines and channels, inlets, cross culverts, and conduits, but costs were not available for these activities.
Post Construction Stormwater Management in New Development and Redevelopment
The post construction program cost was $35,083, which was 1 percent of total stormwater cost. This cost was for engineering, planning, and other city staff to research, track, and report information for the annual stormwater report. It was also for task force meetings to develop strategies for compliance with their permit regarding new development and redevelopment, brochure printing, and stormwater staff labor.
Public Education, Outreach, Involvement, and Participation
The public education program cost was $101,717, which was 3 percent of total stormwater cost. Program activities included production and distribution of citywide newsletters, 28 school outreach presentations, stormwater staff participation in public events, and distribution of
SECTIONFIVE City of Fremont
NPDES Stormwater Cost Survey 29 January 2005
brochures and fliers (Fremont, 2003b). USD was funded $25,897 to provide additional public education outreach services. Outreach materials promote an Integrated Pest Management program that provided businesses and nurseries with shelf displays and fact sheets.
Water Quality Monitoring
The monitoring program cost was $131,326, which was 4 percent of total stormwater cost. This cost was for multiple water quality sampling at two locations. Both chronic and acute toxicity tests were performed (Silva, personal communication, 4/5/04).
Watershed Management
The watershed management program cost was $17,610, which was 1 percent of total stormwater cost. Costs in this category were for developing a watershed study framework, assessment of pilot project activities, and stormwater staff labor (including overhead).
5.3 CONFIDENCE IN THE DATA
For the city of Fremont, confidence in the data was moderately high. Most of the cost data submitted was via spreadsheets built, maintained, and updated by the city. Approximately one-third of the city costs could be corroborated by the 2003/2004 CAFR figures.
The city of Fremont had a fund (Urban Runoff/Clean Water) presented in the CAFR that accounted for stormwater expenditures except street sweeping and litter/debris removal (Cote, 2004). Total expenditures and transfers out for the Urban Runoff/Clean Water fund were $1,234,790. Total stormwater costs submitted by city staff were $3,101,442 but this included $2,115,000 in street sweeping and litter/debris removal costs (Cote, 2004). Subtracting out $2,115,000 leaves $986,442 in stormwater costs compared to the $1,234,790 in the Urban Runoff/Clean Water fund. Because of water conveyance projects, it is expected that compliance costs would be less than this fund reports. The $2,115,000 could not be verified by CAFR figures because it was financed out of larger funds that did not have available breakdown. This cost was about 68 percent of the total stormwater cost.

30 (blank) NPDES Stormwater Cost Survey January 2005
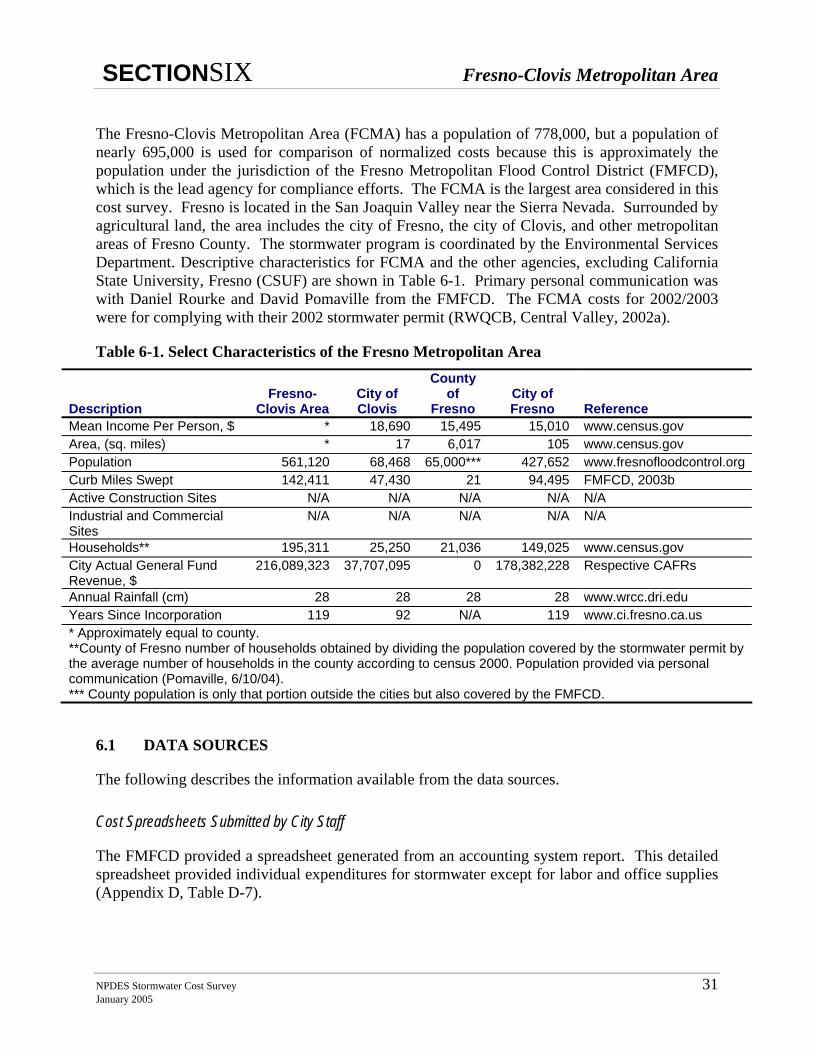
SECTIONSIX Fresno-Clovis Metropolitan Area
NPDES Stormwater Cost Survey 31 January 2005
6.0 FRESNO-CLOVIS METROPOLITAN AREA
The Fresno-Clovis Metropolitan Area (FCMA) has a population of 778,000, but a population of nearly 695,000 is used for comparison of normalized costs because this is approximately the population under the jurisdiction of the Fresno Metropolitan Flood Control District (FMFCD), which is the lead agency for compliance efforts. The FCMA is the largest area considered in this cost survey. Fresno is located in the San Joaquin Valley near the Sierra Nevada. Surrounded by agricultural land, the area includes the city of Fresno, the city of Clovis, and other metropolitan areas of Fresno County. The stormwater program is coordinated by the Environmental Services Department. Descriptive characteristics for FCMA and the other agencies, excluding California State University, Fresno (CSUF) are shown in Table 6-1. Primary personal communication was with Daniel Rourke and David Pomaville from the FMFCD. The FCMA costs for 2002/2003 were for complying with their 2002 stormwater permit (RWQCB, Central Valley, 2002a).
Table 6-1. Select Characteristics of the Fresno Metropolitan Area
Description Fresno-
Clovis Area City of Clovis
County of
Fresno City of Fresno Reference
Mean Income Per Person, $ * 18,690 15,495 15,010 www.census.gov Area, (sq. miles) * 17 6,017 105 www.census.gov Population 561,120 68,468 65,000*** 427,652 www.fresnofloodcontrol.orgCurb Miles Swept 142,411 47,430 21 94,495 FMFCD, 2003b Active Construction Sites N/A N/A N/A N/A N/A Industrial and Commercial Sites
N/A N/A N/A N/A N/A
Households** 195,311 25,250 21,036 149,025 www.census.gov City Actual General Fund Revenue, $
216,089,323 37,707,095 0 178,382,228 Respective CAFRs
Annual Rainfall (cm) 28 28 28 28 www.wrcc.dri.edu Years Since Incorporation 119 92 N/A 119 www.ci.fresno.ca.us * Approximately equal to county. **County of Fresno number of households obtained by dividing the population covered by the stormwater permit by the average number of households in the county according to census 2000. Population provided via personal communication (Pomaville, 6/10/04). *** County population is only that portion outside the cities but also covered by the FMFCD.
6.1 DATA SOURCES
The following describes the information available from the data sources.
Cost Spreadsheets Submitted by City Staff
The FMFCD provided a spreadsheet generated from an accounting system report. This detailed spreadsheet provided individual expenditures for stormwater except for labor and office supplies (Appendix D, Table D-7).
SECTIONSIX Fresno-Clovis Metropolitan Area
32 NPDES Stormwater Cost Survey January 2005
Fresno-Clovis Storm Water Quality Management Program, Annual Report FY 2002/2003
This report provided descriptions of the activities and accomplishments of the stormwater program. Activity statistics (e.g. number of construction site inspections) were provided in this report, but in most cases numbers were not available for each agency.
Fresno-Clovis Storm Water Quality Management Program (SWQMP), February 1999
The SWQMP presents information regarding objectives and tasks of each program component and specific tasks that the member agencies are required to perform. The report contained budgeted costs incurred by the cities, county, and university in lieu of actual expenditures. These costs were summarized in Appendix D, Table D-3. The cost figures were budgeted amounts and not actual expenditures. The document was also used to verify that an activity was required for compliance with the permit.
Personal Communication: Phone Calls, E-mail
Personal communication with the FMFCD staff provided additional stormwater program costs that augmented the data submitted in their cost spreadsheet. These costs were for labor, office supplies, and street sweeping (Appendix Table D-8). They also provided advice on how to allocate the submitted costs to the cost survey categories. FMFCD staff also advised on where the best available costs were compiled for the other agencies.
Comprehensive Annual Financial Report (CAFR) 2002/03 for the FMFCD, City of Clovis, City of Fresno, and County of Fresno
Except for the FMFCD, the Fresno area agencies had not established a fund to account for overall stormwater transactions, so no comparisons on cost were made to CAFR figures. The CAFR figures were used to determine the general fund revenue, which is considered a potential cost factor.
6.2 COST DATA SUMMARY
Table 6-2 summarizes the stormwater program costs for each cost survey category. Figure 6-1 shows the relative distribution of costs among the categories. Labor cost for the FMFCD staff to develop, oversee, and administer these programs was allocated to the Overall Stormwater Program Management category. The labor costs for the other agencies were allocated to the cost categories.
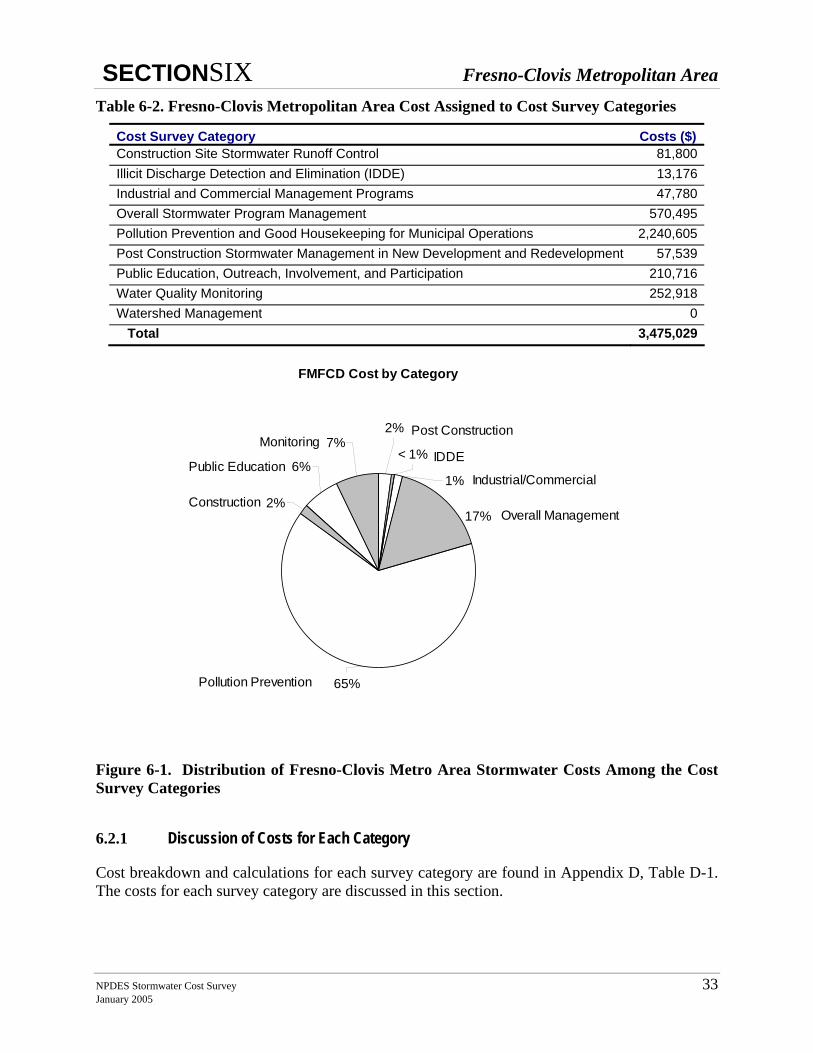
SECTIONSIX Fresno-Clovis Metropolitan Area
NPDES Stormwater Cost Survey 33 January 2005
Table 6-2. Fresno-Clovis Metropolitan Area Cost Assigned to Cost Survey Categories
Cost Survey Category Costs ($) Construction Site Stormwater Runoff Control 81,800Illicit Discharge Detection and Elimination (IDDE) 13,176Industrial and Commercial Management Programs 47,780Overall Stormwater Program Management 570,495Pollution Prevention and Good Housekeeping for Municipal Operations 2,240,605Post Construction Stormwater Management in New Development and Redevelopment 57,539Public Education, Outreach, Involvement, and Participation 210,716Water Quality Monitoring 252,918Watershed Management 0 Total 3,475,029
FMFCD Cost by Category
< 1%
1%
17%
2%
2%
6%
7%
65%Pollution Prevention
Overall Management
Industrial/Commercial
IDDE
Post ConstructionMonitoring
Public Education
Construction
Figure 6-1. Distribution of Fresno-Clovis Metro Area Stormwater Costs Among the Cost Survey Categories
6.2.1 Discussion of Costs for Each Category
Cost breakdown and calculations for each survey category are found in Appendix D, Table D-1. The costs for each survey category are discussed in this section.
SECTIONSIX Fresno-Clovis Metropolitan Area
34 NPDES Stormwater Cost Survey January 2005
Construction Site Stormwater Runoff Control
The construction program cost was $81,800, which was 2 percent of total stormwater cost. The annual stormwater report did not contain the number of inspections for the city of Fresno, so cost could not be normalized by this factor. The number of construction sites was only tracked for the FMFCD so this factor was not used. (FMFCD, 2003b).
Illicit Discharge Detection and Elimination (IDDE)
The IDDE program cost was $13,176, which was less than one percent of total stormwater cost. The number of inspections was not available.
Industrial and Commercial Management Programs
The industrial and commercial program cost was $47,480, which was 1 percent of total stormwater cost. Facilities in the Fresno-Clovis metropolitan area are primarily inspected by Fresno County hazardous waste inspectors, city of Fresno industrial wastewater inspectors, and city of Clovis fire inspectors (FMFCD, 2003b). The number of inspections was only available for the FMFCD so cost could not be normalized on this factor.
Overall Stormwater Program Management
The overall stormwater program management cost was $570,495, which was 16 percent of total stormwater cost. This cost includes the FMFCD staff costs for stormwater (does not include other FMFCD activities such as flood control), which accounted for 98 percent of the cost of this category. The staff costs attributed to stormwater activities were estimated as 11 percent of the total personnel expenses for the FMFCD. The same percentage was applied to obtain office administration costs (Pomaville, 2004). Other costs were for office expenses, office administration, training, and travel.
Pollution Prevention and Good Housekeeping for Municipal Operations
The cost of this program was $2,240,605, which was 64 percent of total stormwater cost. This includes $2,193,296 reported by the city of Clovis and city of Fresno for street sweeping 141,769 of the 142,411 curb miles swept by the agencies (FMFCD, 2003b).
Post Construction Stormwater Management in New Development and Redevelopment
The post construction program cost was $57,539, which was 2 percent of total stormwater cost. This cost was for contracting for maintenance of 8 basins, resulting in an average annual cost of $7,200 per basin.
SECTIONSIX Fresno-Clovis Metropolitan Area
NPDES Stormwater Cost Survey 35 January 2005
Public Education, Outreach, Involvement, and Participation
The cost of this program was $210,716, which was 6 percent of total stormwater cost. The Public Education and Outreach category was combined with the Public Involvement and Participation category because the county of Fresno and city of Clovis costs were combined (FMFCD, 1999). There was not a consistently reported activity statistic that could be used for normalization. FCMA agencies were involved in many outreach and participation activities such as public service announcements, brochures, BMP fact sheets, volunteer stenciling, special events, articles, clean-up activities, hotline, school programs, and business outreach (FMFCD, 2003b).
Water Quality Monitoring
The monitoring program cost was $252,918, which was 7 percent of total stormwater cost. The program funded monitoring plan development, sample collection, analysis, reporting, and a Water Environment Research Foundation (WERF) contribution. Only FMFCD reported monitoring costs.
Watershed Management
The Fresno area agencies did not allocate any cost to this category. This effort was captured under other programs such as Overall Stormwater Program Management.
6.3 CONFIDENCE IN THE DATA
For the Fresno-Clovis metropolitan area, confidence in the data was moderate because costs for the other agencies were taken from budgeted numbers out of the SWQMP (FMFCD, 1999). Additionally, baseline labor costs for the cities and county were less than $90,000 (Appendix D, Table D-3), which is approximately the annual cost of one person (salary and overhead). It seems unreasonable that this cost sufficiently covers the pre-existing stormwater labor cost in 1999 for these entities. The street sweeping costs provided for the city of Clovis were corroborated by the city’s 2002/03 CAFR within 1 percent.

36 (blank) NPDES Stormwater Cost Survey January 2005
SECTIONSEVEN City of Sacramento
NPDES Stormwater Cost Survey 37 January 2005
7.0 CITY OF SACRAMENTO
Surrounded by largely agricultural land, California’s capital city is located in the central valley at the conjunction of the Sacramento and American rivers. The city of Sacramento has a population just exceeding 400,000 (www.census.gov). The stormwater program is coordinated by the Department of Utilities. Descriptive characteristics for the city of Sacramento are shown in Table 7-1. Primary personal communication was with Bill Busath from the city of Sacramento. The city of Sacramento costs for 2002/2003 were for complying with their 2002 stormwater permit (RWQCB, Central Valley, 2002b).
Table 7-1. Select Characteristics of the City of Sacramento
Description Characteristic Reference Mean Income Per Person, $ 18,721 www.census.gov Area, (sq. miles) 99 www.census.gov Population 407,018 www.census.gov Curb Miles Swept 26,450 Table E-6 Active Construction Sites 417 Sacramento, 2003b Industrial and Commercial Sites N/A N/A Households 163,957 www.census.gov City Actual General Fund Revenue, $ 267,464,000 Sacramento, 2003a Annual Rainfall (cm) 46 www.wrcc.dri.edu Years Since Incorporation 154 www.cityofsacramento.org*Reporting these numbers started in fiscal year 2004/05 (Sacramento, 2003b)
7.1 DATA SOURCES
The following describes the information available from the data sources.
Cost Spreadsheets Submitted by City Staff
The staff provided two spreadsheets, which included cost data. One spreadsheet contained direct costs while the other contained labor costs. These spreadsheets represent the entirety of the city’s stormwater costs except for the verbal estimates for street sweeping and pump station cleaning activities. The direct and labor cost spreadsheets are presented in Appendix E, Tables E-2 and E-8 respectively. The labor costs as assigned to cost survey categories are presented in Table E-7.
City of Sacramento, Stormwater Management Program, 2002/03 Annual Report
This report provided activity statistics (e.g. curb miles swept) for various city stormwater programs. These statistics were used to normalize costs to allow comparison with other cities.
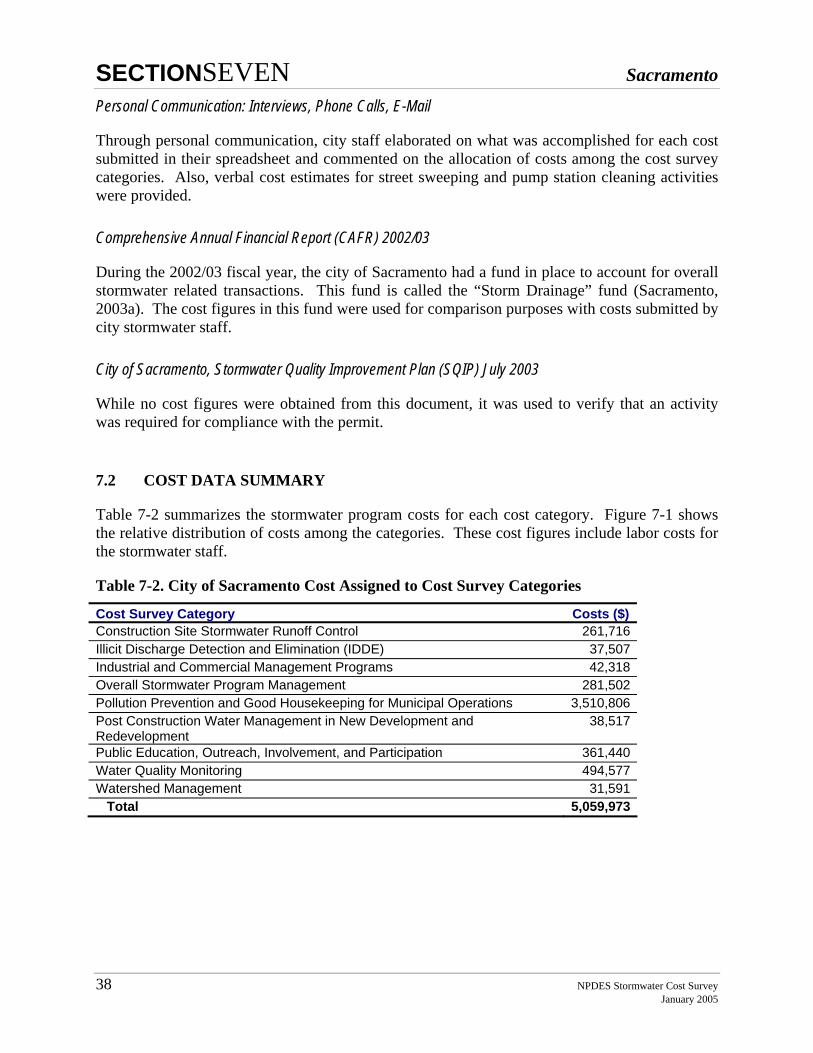
SECTIONSEVEN Sacramento
38 NPDES Stormwater Cost Survey January 2005
Personal Communication: Interviews, Phone Calls, E-Mail
Through personal communication, city staff elaborated on what was accomplished for each cost submitted in their spreadsheet and commented on the allocation of costs among the cost survey categories. Also, verbal cost estimates for street sweeping and pump station cleaning activities were provided.
Comprehensive Annual Financial Report (CAFR) 2002/03
During the 2002/03 fiscal year, the city of Sacramento had a fund in place to account for overall stormwater related transactions. This fund is called the “Storm Drainage” fund (Sacramento, 2003a). The cost figures in this fund were used for comparison purposes with costs submitted by city stormwater staff.
City of Sacramento, Stormwater Quality Improvement Plan (SQIP) July 2003
While no cost figures were obtained from this document, it was used to verify that an activity was required for compliance with the permit.
7.2 COST DATA SUMMARY
Table 7-2 summarizes the stormwater program costs for each cost category. Figure 7-1 shows the relative distribution of costs among the categories. These cost figures include labor costs for the stormwater staff.
Table 7-2. City of Sacramento Cost Assigned to Cost Survey Categories
Cost Survey Category Costs ($) Construction Site Stormwater Runoff Control 261,716 Illicit Discharge Detection and Elimination (IDDE) 37,507 Industrial and Commercial Management Programs 42,318 Overall Stormwater Program Management 281,502 Pollution Prevention and Good Housekeeping for Municipal Operations 3,510,806 Post Construction Water Management in New Development and Redevelopment
38,517
Public Education, Outreach, Involvement, and Participation 361,440 Water Quality Monitoring 494,577 Watershed Management 31,591 Total 5,059,973
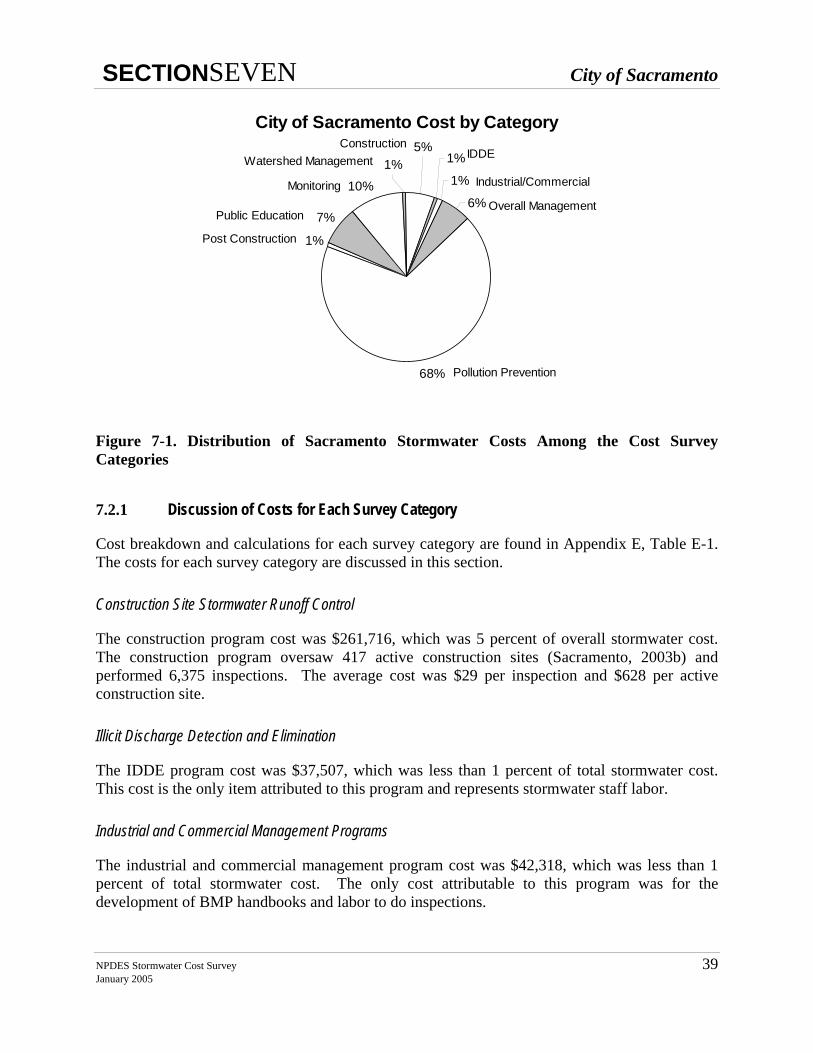
SECTIONSEVEN City of Sacramento
NPDES Stormwater Cost Survey 39 January 2005
City of Sacramento Cost by Category
1%
1%
6%
68%
1%
7%
10%
1%5%
Overall Management
ConstructionWatershed Management
Monitoring
Public Education
Post Construction
IDDE
Industrial/Commercial
Pollution Prevention
Figure 7-1. Distribution of Sacramento Stormwater Costs Among the Cost Survey Categories
7.2.1 Discussion of Costs for Each Survey Category
Cost breakdown and calculations for each survey category are found in Appendix E, Table E-1. The costs for each survey category are discussed in this section.
Construction Site Stormwater Runoff Control
The construction program cost was $261,716, which was 5 percent of overall stormwater cost. The construction program oversaw 417 active construction sites (Sacramento, 2003b) and performed 6,375 inspections. The average cost was $29 per inspection and $628 per active construction site.
Illicit Discharge Detection and Elimination
The IDDE program cost was $37,507, which was less than 1 percent of total stormwater cost. This cost is the only item attributed to this program and represents stormwater staff labor.
Industrial and Commercial Management Programs
The industrial and commercial management program cost was $42,318, which was less than 1 percent of total stormwater cost. The only cost attributable to this program was for the development of BMP handbooks and labor to do inspections.
SECTIONSEVEN Sacramento
40 NPDES Stormwater Cost Survey January 2005
Overall Stormwater Program Management
The overall management program cost was $281,501, which was 6 percent of total stormwater cost. Costs in this program were for office products, annual reporting, planning, mailing, CASQA fees, NPDES fee, and legal fees.
Pollution Prevention and Good Housekeeping for Municipal Operations
The municipal operations program cost was $3,510,806, which was 69 percent of total stormwater cost. The two primary activities for this category were street sweeping and pump station cleaning. The average cost was $50 per curb mile swept. Street sweeping and pump station costs are about 38 percent and 12 percent of total stormwater cost respectively. These percentages are based on the estimates provided by city staff and do not include labor cost allocated to oversee this program. Street sweeping costs were discounted because the city performed additional sweeping in their downtown area that was not permit required. This may be an unfair comparison to other permits that are vaguer about the sweeping requirements. In these programs (see Fresno-Clovis Metropolitan Area as an example), all sweeping costs were included because it was assumed that all sweeping was in compliance with the permit. The discounted amount for Sacramento’s street sweeping costs was $277,252.
Post Construction Stormwater Management in New Development and Redevelopment
The post construction program cost was $38,517, which was less than 1 percent of total stormwater cost. Post construction cost was primarily for stormwater staff labor and student intern labor associated with working with developers to assure deployment of appropriate post construction BMPs. In addition, $2,500 was spent for the development of BMP handbooks.
Public Education, Outreach, Involvement, and Participation
The public education and outreach program cost was $361,440, which was 7 percent of total stormwater cost. The largest cost for this program was labor, which included both stormwater staff and student internship labor. The total labor cost was approximately 45 percent of the total public education and outreach program cost. The cost of development of integrated pest management (IPM) was about 11 percent and television and newspaper advertisements constituted 19 percent and 5 percent, respectively.
Water Quality Monitoring
The monitoring program cost was $494,577, which was 10 percent of total stormwater cost. Modeling and data analysis accounted for $131,688. Sample collection and lab cost accounted for $303,077. Stormwater staff and student labor accounted for $59,812.
Watershed Management
The cost of this category was $31,591, which was less than 1 percent of total stormwater cost. The primary cost attributed to this category was for stormwater staff labor.
SECTIONSEVEN City of Sacramento
NPDES Stormwater Cost Survey 41 January 2005
7.3 CONFIDENCE IN THE DATA
For the city of Sacramento, confidence in the data was moderate. Several factors were considered in this assessment. The costs for street sweeping and pump station cleaning were estimated and represent approximately 34 percent of total stormwater program cost for the city. Since 34 percent of total stormwater cost was based on estimates, a higher level of confidence in the data could not be allowed. Secondly, the labor and direct cost data was submitted in spreadsheets built, maintained, and updated by the city staff with the labor costs being based on accounting system generated cost figures. The confidence in the data for Sacramento would be noticeably increased if 2003/04 data were considered (Busath, personal communication, 11/23/04). The city of Sacramento had a fund (Storm Drainage) set up to account for overall stormwater expenditures. Total expenditures for the Storm Drainage fund were $30,926,0006 (City of Sacramento, 2003a), while total stormwater costs submitted by city staff were $5,046,157. This difference is attributed to the expense for flood control and conveyance work not required by the NPDES permit. Differentiation of stormwater costs in the CAFR was not possible.
6 This figure represents the sum of operating expenses, interest expense, amortization of deferred charges, loss on disposition of fixed assets, and transfers out.

42 (blank) NPDES Stormwater Cost Survey January 2005
SECTIONEIGHT City of Santa Clarita
NPDES Stormwater Cost Survey 43 January 2005
8.0 CITY OF SANTA CLARITA
The city of Santa Clarita is a small to medium-sized city with a population of 151,088 (www.census.gov). The city lies approximately 25 miles from the Pacific coastline in the Santa Clara River watershed. The stormwater program is coordinated by the Field Services Department. Descriptive characteristics for the city of Santa Clarita are shown in Table 8-1. Primary personal communication was with Oliver Cramer and Travis Lange from the city of Santa Clarita. The city of Santa Clarita costs for 2002/2003 were for complying with their 2001 stormwater permit (RWQCB, Los Angeles, 2001).
Table 8-1. Select Characteristics of the City of Santa Clarita
Description Characteristic Reference Mean Income Per Person, $ 26,841 www.census.gov Area, (sq. miles) 48 www.census.gov Population 151,088 www.census.gov Curb Miles Swept 46,800 Cramer, pers. comm., 4/22/04 Active Construction Sites 64 Santa Clarita, 2003b Industrial and Commercial Sites 1,071 Santa Clarita, 2003b Households 52,442 www.census.gov City Actual General Fund Revenue, $ 61,659,874 Santa Clarita, 2003a Annual Rainfall (cm)1 33 www.wrcc.dri.edu Years Since Incorporation 17 www.santa-clarita.com 1. Dry Canyon Reservoir rain gage was used.
8.1 DATA SOURCES
The following describes the information available from the data sources.
Los Angeles County Municipal Storm Water Permit (Order 01-182) Individual Annual Report Form, Attachment U-4
This report was the primary source of cost data for the city of Santa Clarita. The report contained labor and direct cost information for the city’s stormwater program broken down into categories (Appendix F, Table F-1). The labor cost is described as “Administrative Costs” and were assigned to the Overall Stormwater Management category because the city was unable to distribute these costs among the programs. This report also provided activity statistics (e.g. curb miles swept) for various city stormwater programs. These statistics were used to normalize costs to allow comparison with other cities.
Personal Communication: Interviews, Phone Calls, E-Mail
Through personal communication, city staff elaborated on what was accomplished for each cost submitted in their spreadsheet and commented on the allocation of costs among the cost survey categories.
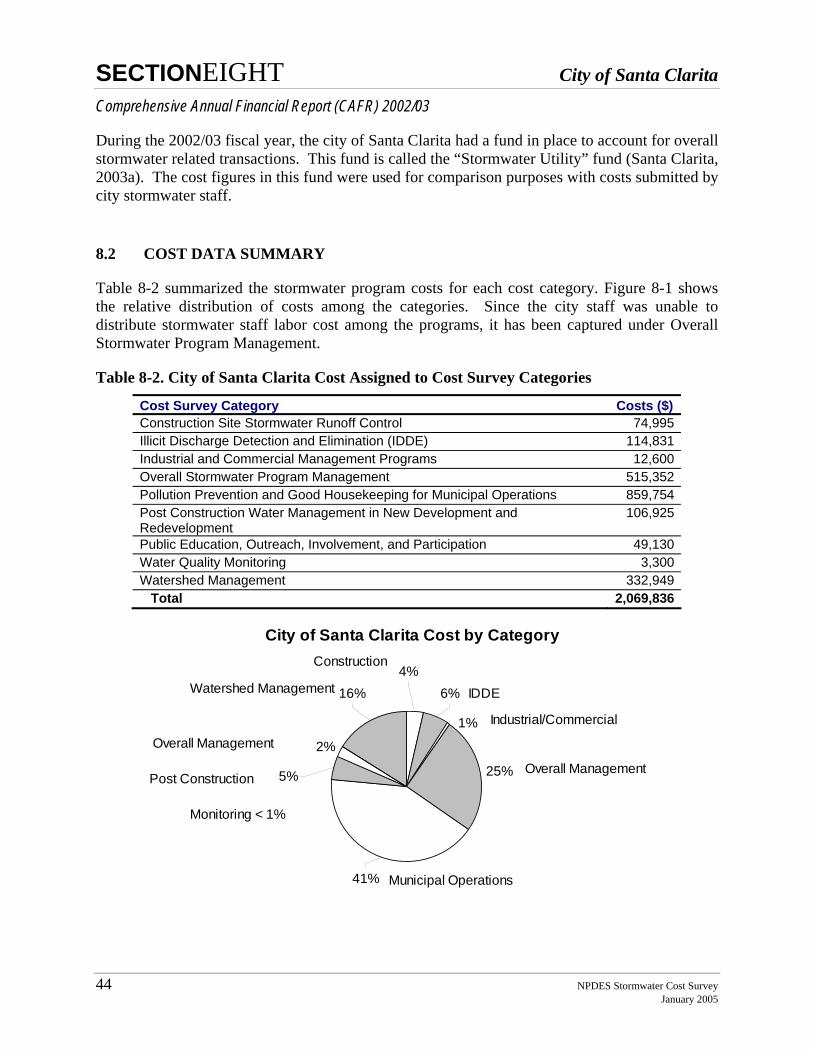
SECTIONEIGHT City of Santa Clarita
44 NPDES Stormwater Cost Survey January 2005
Comprehensive Annual Financial Report (CAFR) 2002/03
During the 2002/03 fiscal year, the city of Santa Clarita had a fund in place to account for overall stormwater related transactions. This fund is called the “Stormwater Utility” fund (Santa Clarita, 2003a). The cost figures in this fund were used for comparison purposes with costs submitted by city stormwater staff.
8.2 COST DATA SUMMARY
Table 8-2 summarized the stormwater program costs for each cost category. Figure 8-1 shows the relative distribution of costs among the categories. Since the city staff was unable to distribute stormwater staff labor cost among the programs, it has been captured under Overall Stormwater Program Management.
Table 8-2. City of Santa Clarita Cost Assigned to Cost Survey Categories
Cost Survey Category Costs ($) Construction Site Stormwater Runoff Control 74,995Illicit Discharge Detection and Elimination (IDDE) 114,831Industrial and Commercial Management Programs 12,600Overall Stormwater Program Management 515,352Pollution Prevention and Good Housekeeping for Municipal Operations 859,754Post Construction Water Management in New Development and Redevelopment
106,925
Public Education, Outreach, Involvement, and Participation 49,130Water Quality Monitoring 3,300Watershed Management 332,949 Total 2,069,836
City of Santa Clarita Cost by Category
25%
2%
5%
6%4%
16%
1%
41%
Monitoring < 1%
Overall Management
Watershed Management
Construction
IDDE
Industrial/Commercial
Overall Management
Post Construction
Municipal Operations
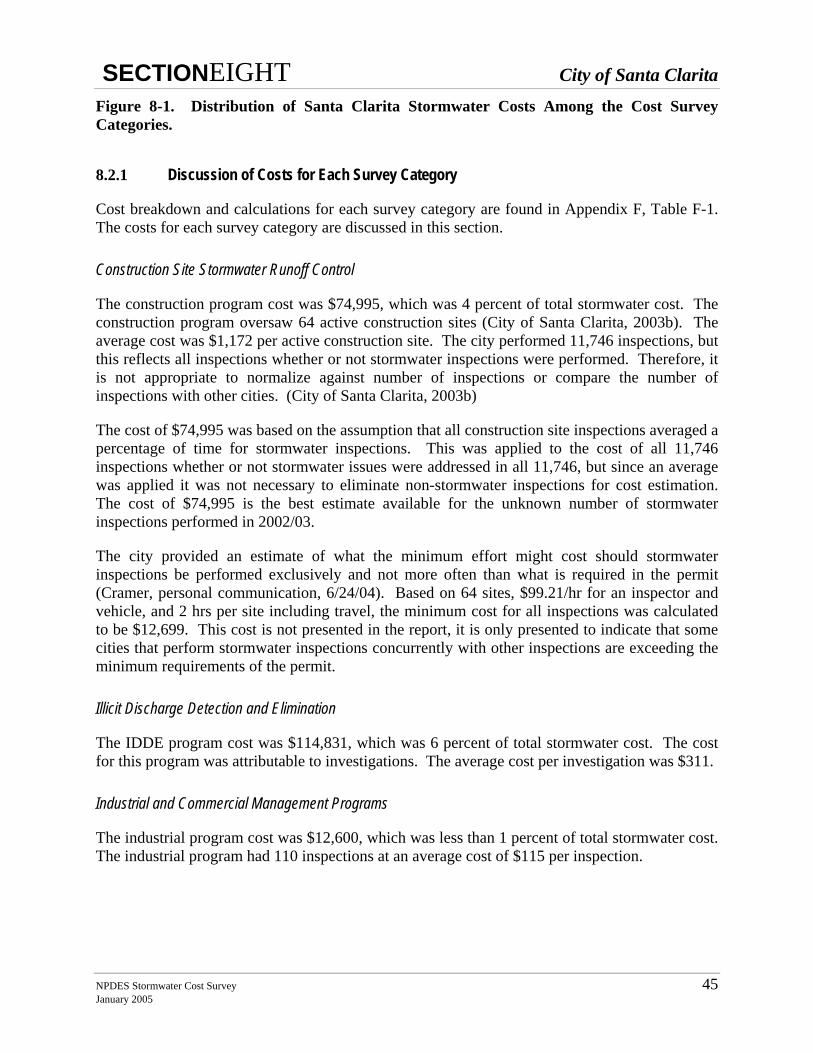
SECTIONEIGHT City of Santa Clarita
NPDES Stormwater Cost Survey 45 January 2005
Figure 8-1. Distribution of Santa Clarita Stormwater Costs Among the Cost Survey Categories.
8.2.1 Discussion of Costs for Each Survey Category
Cost breakdown and calculations for each survey category are found in Appendix F, Table F-1. The costs for each survey category are discussed in this section.
Construction Site Stormwater Runoff Control
The construction program cost was $74,995, which was 4 percent of total stormwater cost. The construction program oversaw 64 active construction sites (City of Santa Clarita, 2003b). The average cost was $1,172 per active construction site. The city performed 11,746 inspections, but this reflects all inspections whether or not stormwater inspections were performed. Therefore, it is not appropriate to normalize against number of inspections or compare the number of inspections with other cities. (City of Santa Clarita, 2003b)
The cost of $74,995 was based on the assumption that all construction site inspections averaged a percentage of time for stormwater inspections. This was applied to the cost of all 11,746 inspections whether or not stormwater issues were addressed in all 11,746, but since an average was applied it was not necessary to eliminate non-stormwater inspections for cost estimation. The cost of $74,995 is the best estimate available for the unknown number of stormwater inspections performed in 2002/03.
The city provided an estimate of what the minimum effort might cost should stormwater inspections be performed exclusively and not more often than what is required in the permit (Cramer, personal communication, 6/24/04). Based on 64 sites, $99.21/hr for an inspector and vehicle, and 2 hrs per site including travel, the minimum cost for all inspections was calculated to be $12,699. This cost is not presented in the report, it is only presented to indicate that some cities that perform stormwater inspections concurrently with other inspections are exceeding the minimum requirements of the permit.
Illicit Discharge Detection and Elimination
The IDDE program cost was $114,831, which was 6 percent of total stormwater cost. The cost for this program was attributable to investigations. The average cost per investigation was $311.
Industrial and Commercial Management Programs
The industrial program cost was $12,600, which was less than 1 percent of total stormwater cost. The industrial program had 110 inspections at an average cost of $115 per inspection.
SECTIONEIGHT City of Santa Clarita
46 NPDES Stormwater Cost Survey January 2005
Overall Stormwater Program Management
The overall management program cost was $515,352, which was 25 percent of total stormwater cost. All of the stormwater staff cost was assigned to this category. The staff costs (including overhead allocation) represent approximately 85 percent of the costs assigned to this category and 21 percent of total stormwater cost. The other cost was $76,520 for development planning.
Pollution Prevention and Good Housekeeping for Municipal Operations
The municipal operations program cost was $859,754, which was 42 percent of total stormwater cost. The two primary activities for this category were street sweeping and catch basin cleaning. The average cost was $12 per curb mile swept and $170 per basin cleaning. Street sweeping cost and catch basin cleaning cost are approximately 27 percent and 12 percent of total stormwater cost respectively.
Post Construction Stormwater Management in New Development and Redevelopment
The post construction program cost was $106,925, which was 5 percent of total stormwater cost. Post construction cost was primarily for capital costs, which included purchase of vehicles for catch basin cleaning and ICID equipment (Cramer, personal communication, 6/24/04).
Public Education, Outreach, Involvement, and Participation
The public education program cost was $49,130, which was 2 percent of total stormwater cost. Public education and outreach activities often incorporated public involvement and participation activities. This made differentiating cost between the categories impractical. Because of this, the two programs were combined.
Water Quality Monitoring
The monitoring program cost was $3,300, which was less than 1 percent of total stormwater cost. The total cost of monitoring was $3,300, which was for monitoring for diazinon at a single location (Cramer, personal communication, 6/24/04).
Watershed Management
The watershed management program cost was $332,949, which was 16 percent of total stormwater cost. This cost was for the stormwater share of GIS costs.
8.3 CONFIDENCE IN THE DATA
For the city of Santa Clarita, confidence in the data was high. The cost data was found in the annual reporting forms. Through personal communication (Cramer, personal communication, 4/22/04) with city staff, a couple of adjustments to these numbers were made. These figures were later verified by accounting system reports and comparisons to the CAFR.
SECTIONEIGHT City of Santa Clarita
NPDES Stormwater Cost Survey 47 January 2005
Since the city of Santa Clarita had a fund (Stormwater Utility) set up to account for overall stormwater expenditures, the level of confidence in the data was increased. This was because a comparison could be made between CAFR cost figures and those submitted by city staff. Total expenditures for the Stormwater Utility fund were $2,869,025, while total stormwater costs submitted by city staff in the annual reporting forms were $2,219,860. Non-stormwater compliance activities totaled $649,205, which exactly accounts for the difference. Because of this match with CAFR expenditures, the level of confidence in the data was increased.

48 (blank) NPDES Stormwater Cost Survey January 2005
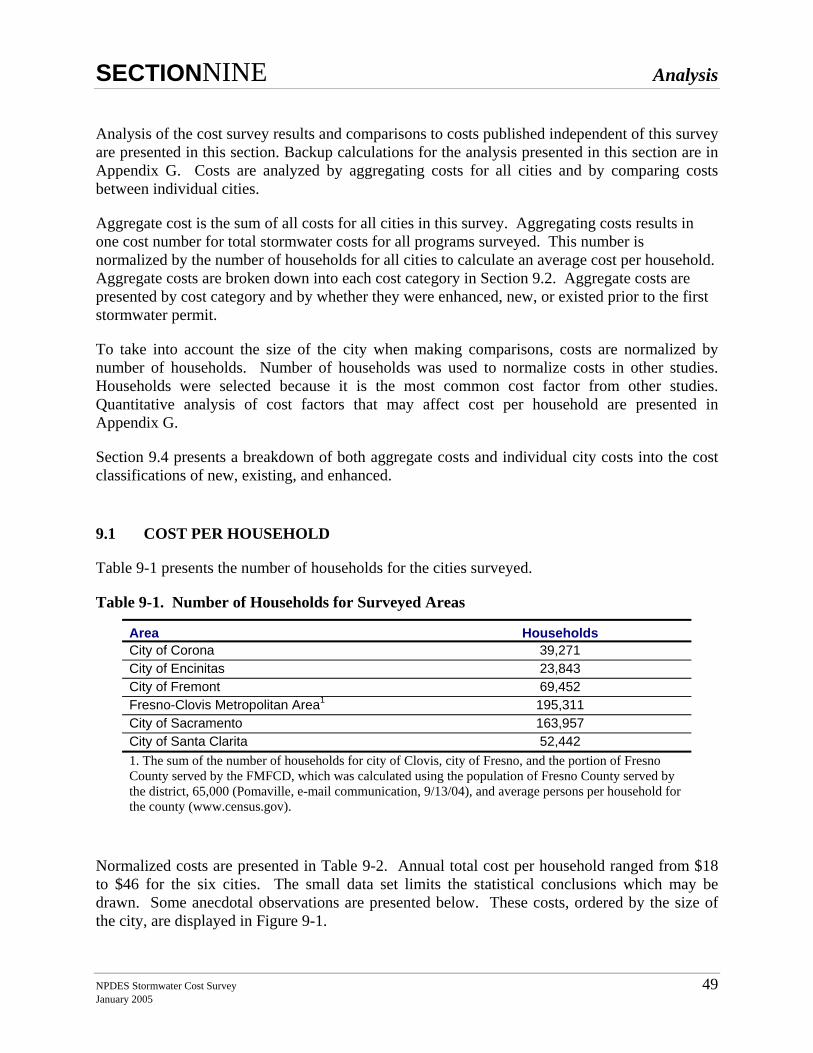
SECTIONNINE Analysis
NPDES Stormwater Cost Survey 49 January 2005
9.0 ANALYSIS
Analysis of the cost survey results and comparisons to costs published independent of this survey are presented in this section. Backup calculations for the analysis presented in this section are in Appendix G. Costs are analyzed by aggregating costs for all cities and by comparing costs between individual cities.
Aggregate cost is the sum of all costs for all cities in this survey. Aggregating costs results in one cost number for total stormwater costs for all programs surveyed. This number is normalized by the number of households for all cities to calculate an average cost per household. Aggregate costs are broken down into each cost category in Section 9.2. Aggregate costs are presented by cost category and by whether they were enhanced, new, or existed prior to the first stormwater permit.
To take into account the size of the city when making comparisons, costs are normalized by number of households. Number of households was used to normalize costs in other studies. Households were selected because it is the most common cost factor from other studies. Quantitative analysis of cost factors that may affect cost per household are presented in Appendix G.
Section 9.4 presents a breakdown of both aggregate costs and individual city costs into the cost classifications of new, existing, and enhanced.
9.1 COST PER HOUSEHOLD
Table 9-1 presents the number of households for the cities surveyed.
Table 9-1. Number of Households for Surveyed Areas
Area Households City of Corona 39,271 City of Encinitas 23,843 City of Fremont 69,452 Fresno-Clovis Metropolitan Area1 195,311 City of Sacramento 163,957 City of Santa Clarita 52,442 1. The sum of the number of households for city of Clovis, city of Fresno, and the portion of Fresno County served by the FMFCD, which was calculated using the population of Fresno County served by the district, 65,000 (Pomaville, e-mail communication, 9/13/04), and average persons per household for the county (www.census.gov).
Normalized costs are presented in Table 9-2. Annual total cost per household ranged from $18 to $46 for the six cities. The small data set limits the statistical conclusions which may be drawn. Some anecdotal observations are presented below. These costs, ordered by the size of the city, are displayed in Figure 9-1.
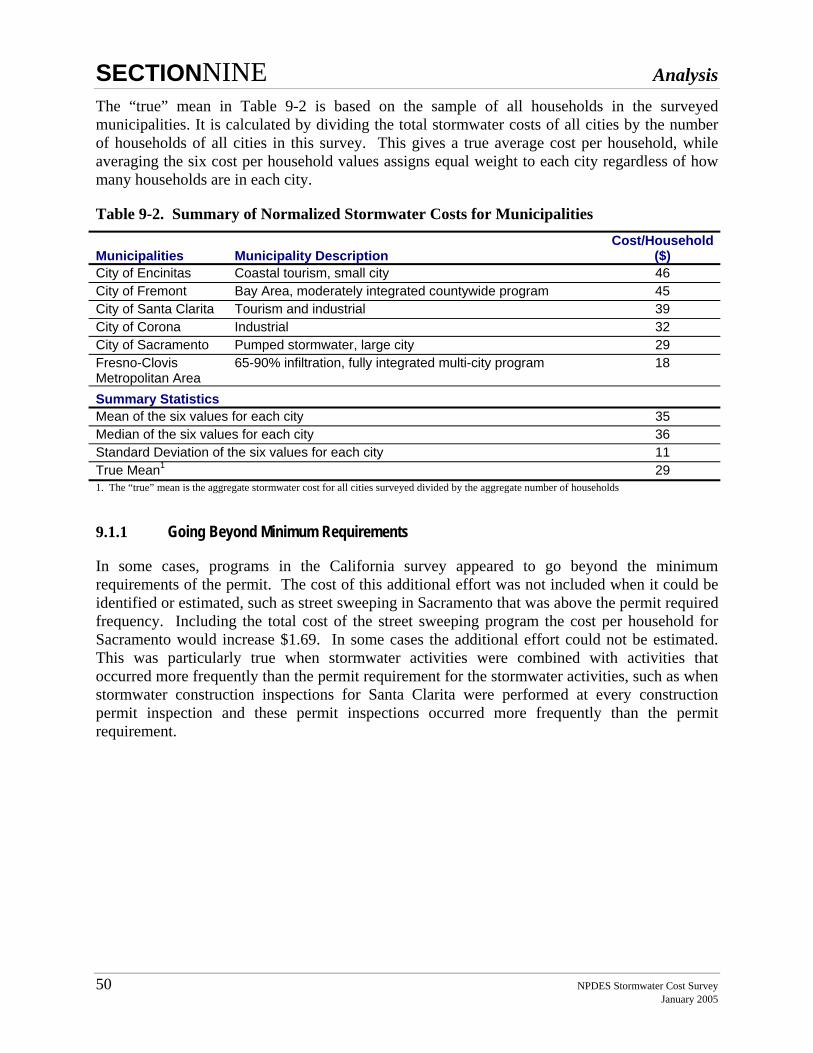
SECTIONNINE Analysis
50 NPDES Stormwater Cost Survey January 2005
The “true” mean in Table 9-2 is based on the sample of all households in the surveyed municipalities. It is calculated by dividing the total stormwater costs of all cities by the number of households of all cities in this survey. This gives a true average cost per household, while averaging the six cost per household values assigns equal weight to each city regardless of how many households are in each city.
Table 9-2. Summary of Normalized Stormwater Costs for Municipalities
Municipalities Municipality Description Cost/Household
($) City of Encinitas Coastal tourism, small city 46 City of Fremont Bay Area, moderately integrated countywide program 45 City of Santa Clarita Tourism and industrial 39 City of Corona Industrial 32 City of Sacramento Pumped stormwater, large city 29 Fresno-Clovis Metropolitan Area
65-90% infiltration, fully integrated multi-city program 18
Summary Statistics Mean of the six values for each city 35 Median of the six values for each city 36 Standard Deviation of the six values for each city 11 True Mean1 29 1. The “true” mean is the aggregate stormwater cost for all cities surveyed divided by the aggregate number of households
9.1.1 Going Beyond Minimum Requirements
In some cases, programs in the California survey appeared to go beyond the minimum requirements of the permit. The cost of this additional effort was not included when it could be identified or estimated, such as street sweeping in Sacramento that was above the permit required frequency. Including the total cost of the street sweeping program the cost per household for Sacramento would increase $1.69. In some cases the additional effort could not be estimated. This was particularly true when stormwater activities were combined with activities that occurred more frequently than the permit requirement for the stormwater activities, such as when stormwater construction inspections for Santa Clarita were performed at every construction permit inspection and these permit inspections occurred more frequently than the permit requirement.
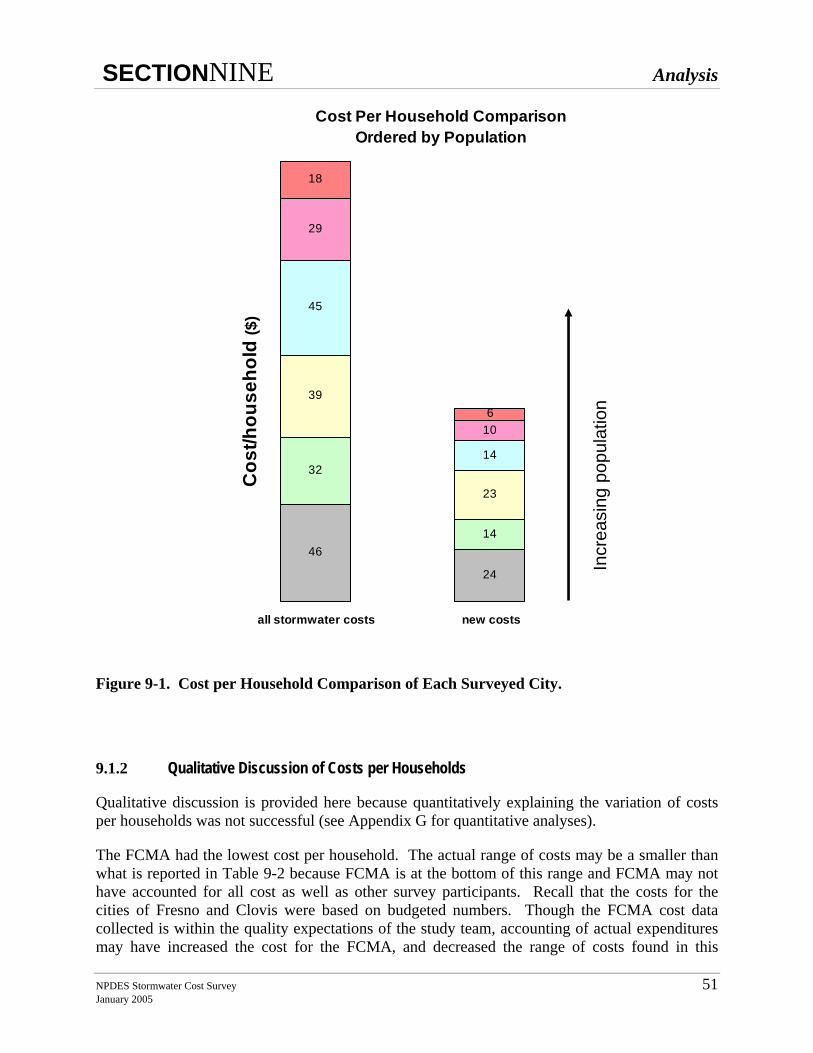
SECTIONNINE Analysis
NPDES Stormwater Cost Survey 51 January 2005
Cost Per Household ComparisonOrdered by Population
46
24
32
14
39
23
45
29
10
18
6
14
all stormwater costs new costs
Cos
t/hou
seho
ld ($
)
Incr
easi
ng p
opul
atio
n
Figure 9-1. Cost per Household Comparison of Each Surveyed City.
9.1.2 Qualitative Discussion of Costs per Households
Qualitative discussion is provided here because quantitatively explaining the variation of costs per households was not successful (see Appendix G for quantitative analyses).
The FCMA had the lowest cost per household. The actual range of costs may be a smaller than what is reported in Table 9-2 because FCMA is at the bottom of this range and FCMA may not have accounted for all cost as well as other survey participants. Recall that the costs for the cities of Fresno and Clovis were based on budgeted numbers. Though the FCMA cost data collected is within the quality expectations of the study team, accounting of actual expenditures may have increased the cost for the FCMA, and decreased the range of costs found in this
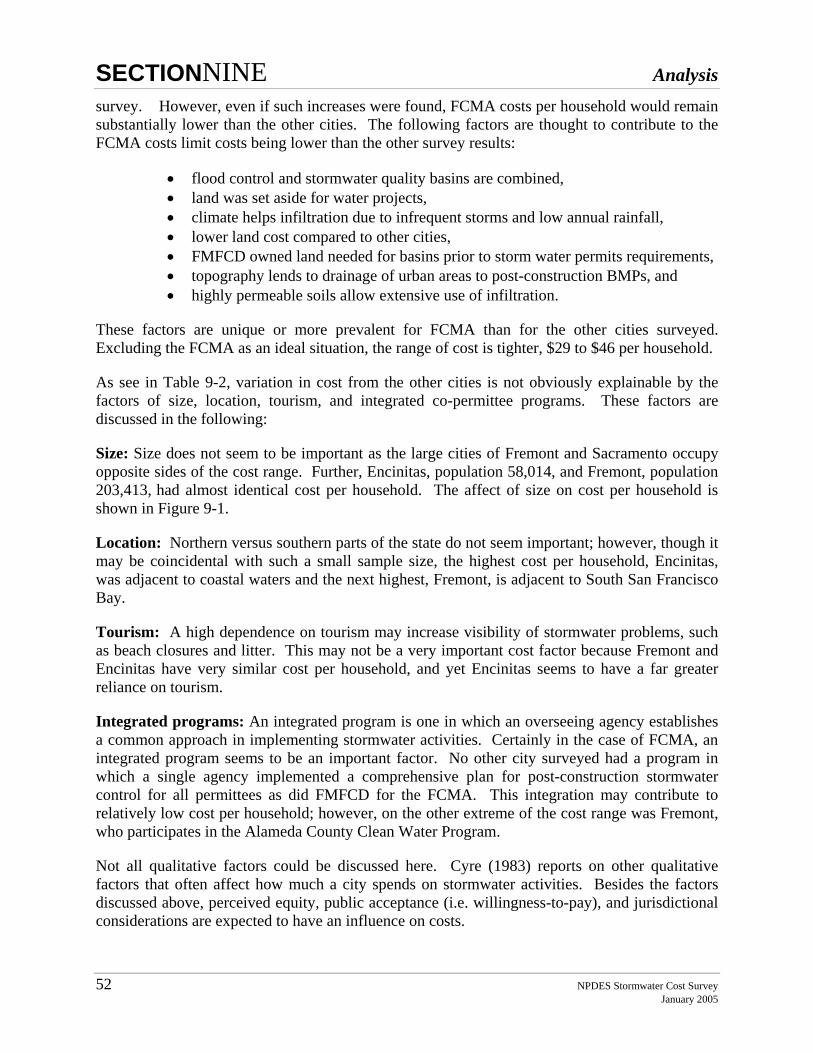
SECTIONNINE Analysis
52 NPDES Stormwater Cost Survey January 2005
survey. However, even if such increases were found, FCMA costs per household would remain substantially lower than the other cities. The following factors are thought to contribute to the FCMA costs limit costs being lower than the other survey results:
• flood control and stormwater quality basins are combined, • land was set aside for water projects, • climate helps infiltration due to infrequent storms and low annual rainfall, • lower land cost compared to other cities, • FMFCD owned land needed for basins prior to storm water permits requirements, • topography lends to drainage of urban areas to post-construction BMPs, and • highly permeable soils allow extensive use of infiltration.
These factors are unique or more prevalent for FCMA than for the other cities surveyed. Excluding the FCMA as an ideal situation, the range of cost is tighter, $29 to $46 per household.
As see in Table 9-2, variation in cost from the other cities is not obviously explainable by the factors of size, location, tourism, and integrated co-permittee programs. These factors are discussed in the following:
Size: Size does not seem to be important as the large cities of Fremont and Sacramento occupy opposite sides of the cost range. Further, Encinitas, population 58,014, and Fremont, population 203,413, had almost identical cost per household. The affect of size on cost per household is shown in Figure 9-1.
Location: Northern versus southern parts of the state do not seem important; however, though it may be coincidental with such a small sample size, the highest cost per household, Encinitas, was adjacent to coastal waters and the next highest, Fremont, is adjacent to South San Francisco Bay.
Tourism: A high dependence on tourism may increase visibility of stormwater problems, such as beach closures and litter. This may not be a very important cost factor because Fremont and Encinitas have very similar cost per household, and yet Encinitas seems to have a far greater reliance on tourism.
Integrated programs: An integrated program is one in which an overseeing agency establishes a common approach in implementing stormwater activities. Certainly in the case of FCMA, an integrated program seems to be an important factor. No other city surveyed had a program in which a single agency implemented a comprehensive plan for post-construction stormwater control for all permittees as did FMFCD for the FCMA. This integration may contribute to relatively low cost per household; however, on the other extreme of the cost range was Fremont, who participates in the Alameda County Clean Water Program.
Not all qualitative factors could be discussed here. Cyre (1983) reports on other qualitative factors that often affect how much a city spends on stormwater activities. Besides the factors discussed above, perceived equity, public acceptance (i.e. willingness-to-pay), and jurisdictional considerations are expected to have an influence on costs.
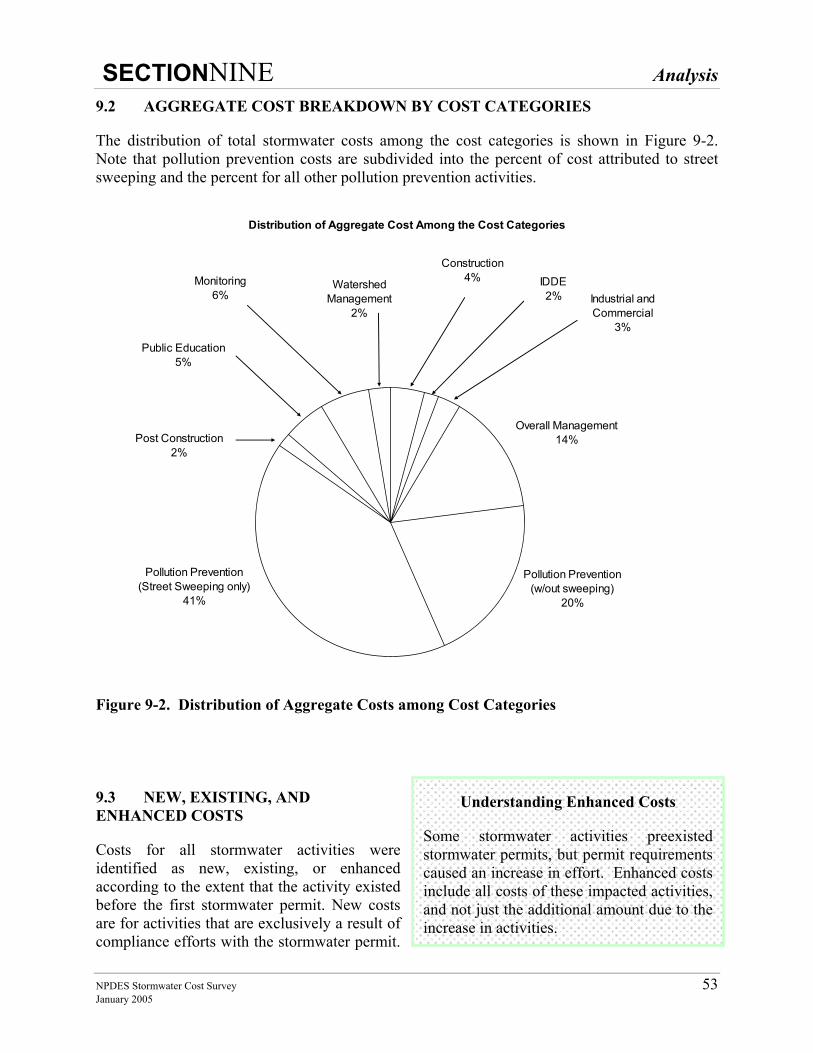
SECTIONNINE Analysis
NPDES Stormwater Cost Survey 53 January 2005
9.2 AGGREGATE COST BREAKDOWN BY COST CATEGORIES
The distribution of total stormwater costs among the cost categories is shown in Figure 9-2. Note that pollution prevention costs are subdivided into the percent of cost attributed to street sweeping and the percent for all other pollution prevention activities.
Distribution of Aggregate Cost Among the Cost Categories
Pollution Prevention (Street Sweeping only)
41%
Pollution Prevention (w/out sweeping)
20%
Industrial and Commercial
3%
IDDE2%
Watershed Management
2%
Monitoring6%
Public Education5%
Post Construction2%
Construction4%
Overall Management14%
Figure 9-2. Distribution of Aggregate Costs among Cost Categories
9.3 NEW, EXISTING, AND ENHANCED COSTS
Costs for all stormwater activities were identified as new, existing, or enhanced according to the extent that the activity existed before the first stormwater permit. New costs are for activities that are exclusively a result of compliance efforts with the stormwater permit.
Understanding Enhanced Costs
Some stormwater activities preexisted stormwater permits, but permit requirements caused an increase in effort. Enhanced costs include all costs of these impacted activities, and not just the additional amount due to the increase in activities.
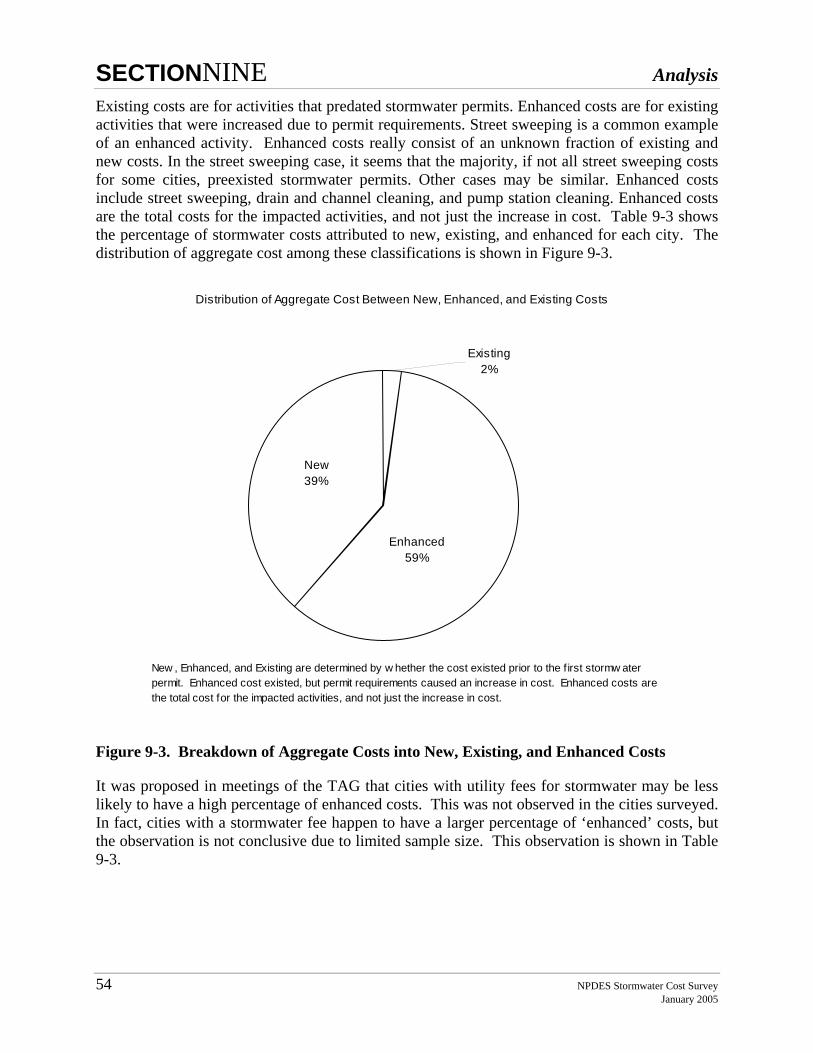
SECTIONNINE Analysis
54 NPDES Stormwater Cost Survey January 2005
Existing costs are for activities that predated stormwater permits. Enhanced costs are for existing activities that were increased due to permit requirements. Street sweeping is a common example of an enhanced activity. Enhanced costs really consist of an unknown fraction of existing and new costs. In the street sweeping case, it seems that the majority, if not all street sweeping costs for some cities, preexisted stormwater permits. Other cases may be similar. Enhanced costs include street sweeping, drain and channel cleaning, and pump station cleaning. Enhanced costs are the total costs for the impacted activities, and not just the increase in cost. Table 9-3 shows the percentage of stormwater costs attributed to new, existing, and enhanced for each city. The distribution of aggregate cost among these classifications is shown in Figure 9-3.
Distribution of Aggregate Cost Between New, Enhanced, and Existing Costs
New39%
Enhanced59%
Existing2%
New , Enhanced, and Existing are determined by w hether the cost existed prior to the f irst stormw ater permit. Enhanced cost existed, but permit requirements caused an increase in cost. Enhanced costs are the total cost for the impacted activities, and not just the increase in cost.
Figure 9-3. Breakdown of Aggregate Costs into New, Existing, and Enhanced Costs
It was proposed in meetings of the TAG that cities with utility fees for stormwater may be less likely to have a high percentage of enhanced costs. This was not observed in the cities surveyed. In fact, cities with a stormwater fee happen to have a larger percentage of ‘enhanced’ costs, but the observation is not conclusive due to limited sample size. This observation is shown in Table 9-3.
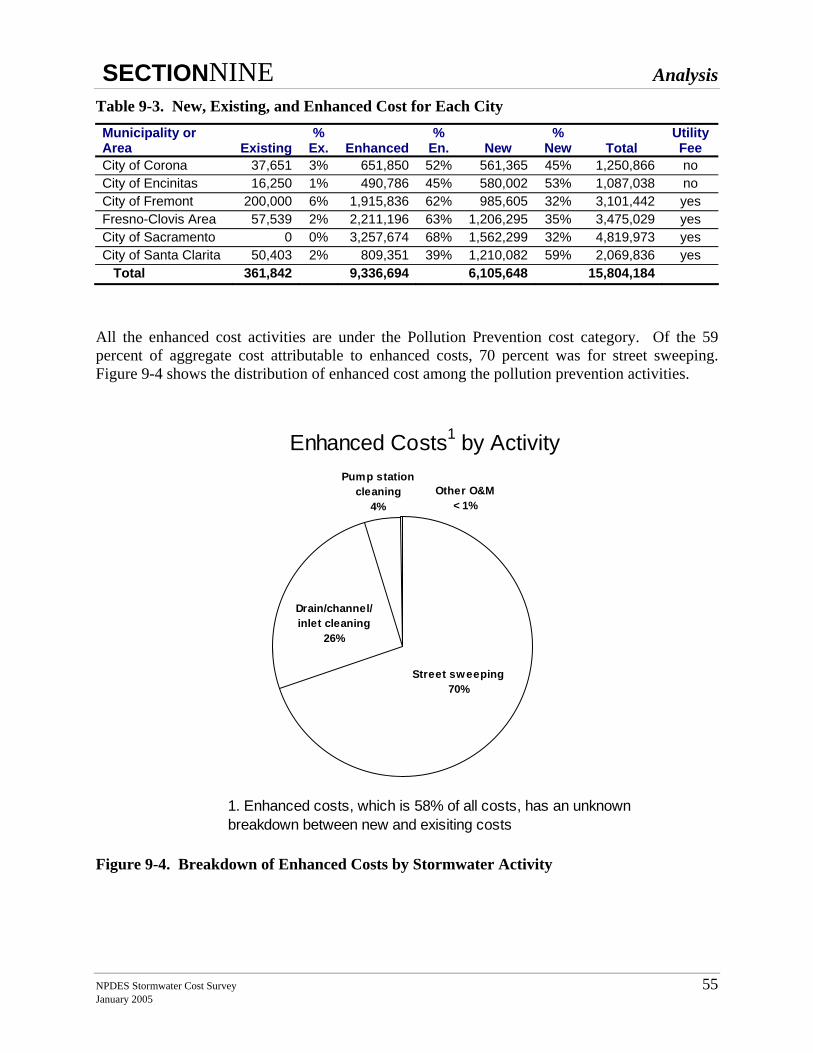
SECTIONNINE Analysis
NPDES Stormwater Cost Survey 55 January 2005
Table 9-3. New, Existing, and Enhanced Cost for Each City Municipality or Area Existing
% Ex. Enhanced
% En. New
% New Total
Utility Fee
City of Corona 37,651 3% 651,850 52% 561,365 45% 1,250,866 no City of Encinitas 16,250 1% 490,786 45% 580,002 53% 1,087,038 no City of Fremont 200,000 6% 1,915,836 62% 985,605 32% 3,101,442 yes Fresno-Clovis Area 57,539 2% 2,211,196 63% 1,206,295 35% 3,475,029 yes City of Sacramento 0 0% 3,257,674 68% 1,562,299 32% 4,819,973 yes City of Santa Clarita 50,403 2% 809,351 39% 1,210,082 59% 2,069,836 yes Total 361,842 9,336,694 6,105,648 15,804,184
All the enhanced cost activities are under the Pollution Prevention cost category. Of the 59 percent of aggregate cost attributable to enhanced costs, 70 percent was for street sweeping. Figure 9-4 shows the distribution of enhanced cost among the pollution prevention activities.
Drain/channel/inlet cleaning
26%
Pump station cleaning
4%
Street sweeping70%
Other O&M< 1%
Enhanced Costs1 by Activity
1. Enhanced costs, which is 58% of all costs, has an unknown breakdown between new and exisiting costs
Figure 9-4. Breakdown of Enhanced Costs by Stormwater Activity
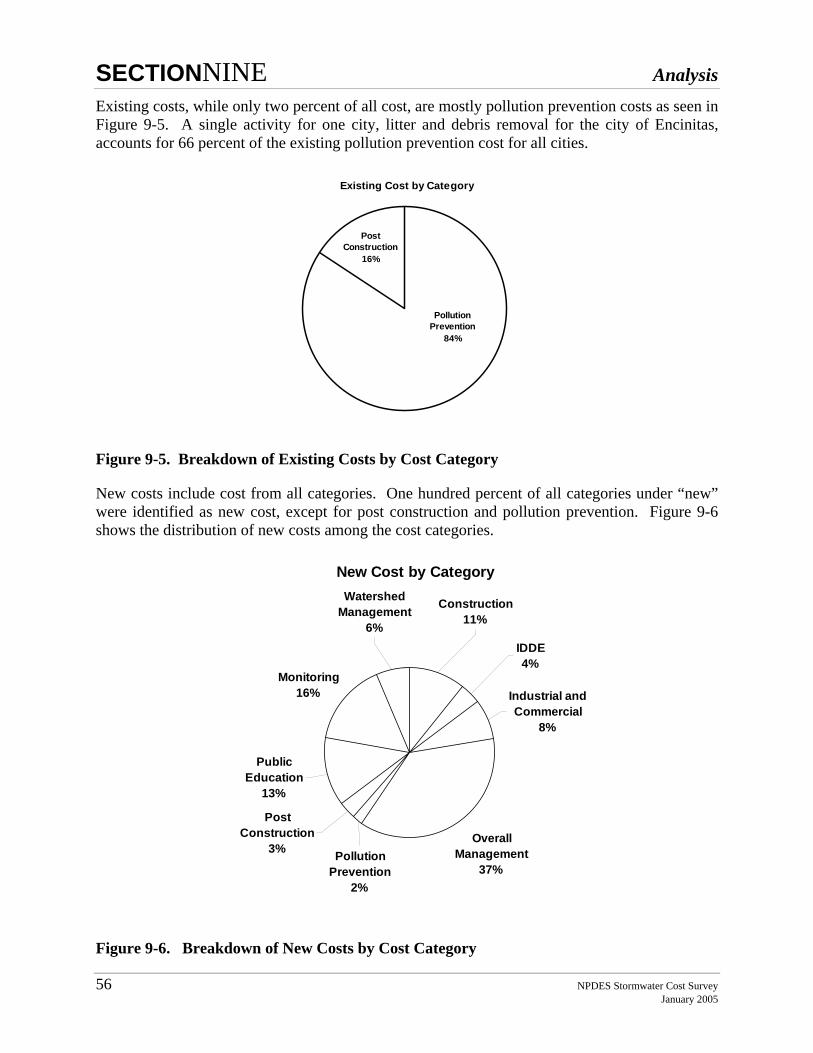
SECTIONNINE Analysis
56 NPDES Stormwater Cost Survey January 2005
Existing costs, while only two percent of all cost, are mostly pollution prevention costs as seen in Figure 9-5. A single activity for one city, litter and debris removal for the city of Encinitas, accounts for 66 percent of the existing pollution prevention cost for all cities.
Existing Cost by Category
Pollution Prevention
84%
Post Construction
16%
Figure 9-5. Breakdown of Existing Costs by Cost Category
New costs include cost from all categories. One hundred percent of all categories under “new” were identified as new cost, except for post construction and pollution prevention. Figure 9-6 shows the distribution of new costs among the cost categories.
New Cost by Category
Monitoring16%
Post Construction
3%Overall
Management37%
Pollution Prevention
2%
Public Education
13%
Watershed Management
6%
Industrial and Commercial
8%
IDDE4%
Construction11%
Figure 9-6. Breakdown of New Costs by Cost Category
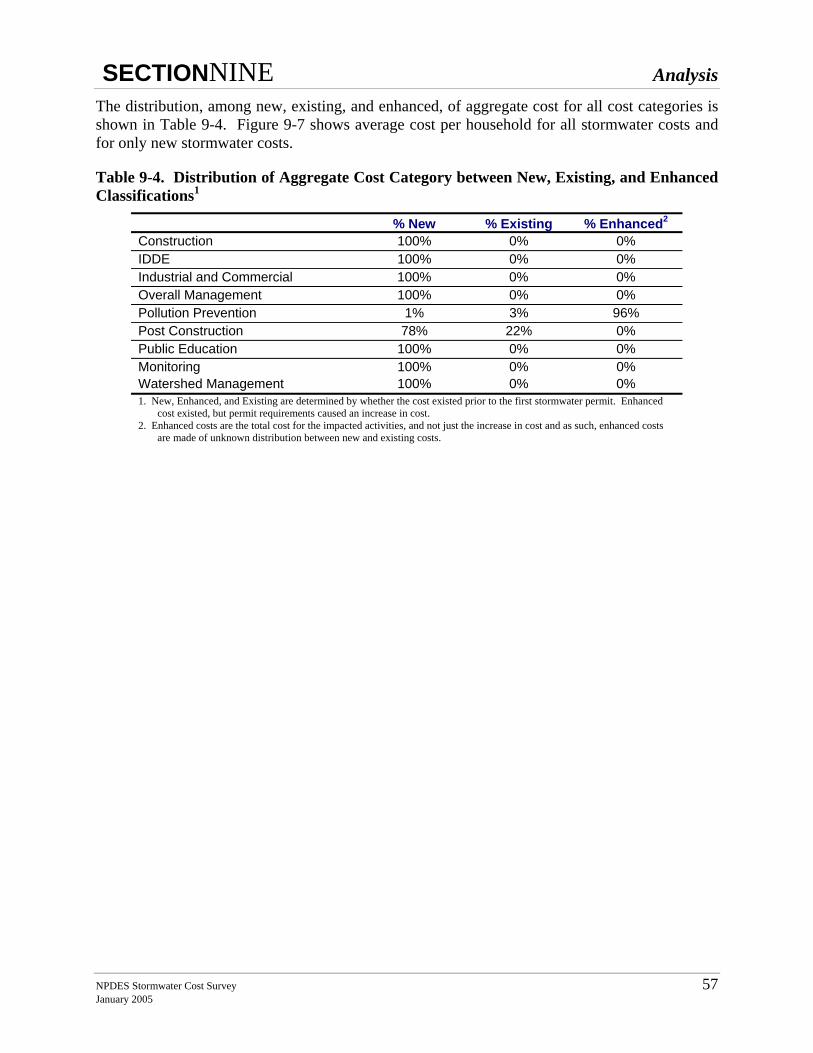
SECTIONNINE Analysis
NPDES Stormwater Cost Survey 57 January 2005
The distribution, among new, existing, and enhanced, of aggregate cost for all cost categories is shown in Table 9-4. Figure 9-7 shows average cost per household for all stormwater costs and for only new stormwater costs.
Table 9-4. Distribution of Aggregate Cost Category between New, Existing, and Enhanced Classifications1
% New % Existing % Enhanced2 Construction 100% 0% 0% IDDE 100% 0% 0% Industrial and Commercial 100% 0% 0% Overall Management 100% 0% 0% Pollution Prevention 1% 3% 96% Post Construction 78% 22% 0% Public Education 100% 0% 0% Monitoring 100% 0% 0% Watershed Management 100% 0% 0% 1. New, Enhanced, and Existing are determined by whether the cost existed prior to the first stormwater permit. Enhanced
cost existed, but permit requirements caused an increase in cost. 2. Enhanced costs are the total cost for the impacted activities, and not just the increase in cost and as such, enhanced costs
are made of unknown distribution between new and existing costs.
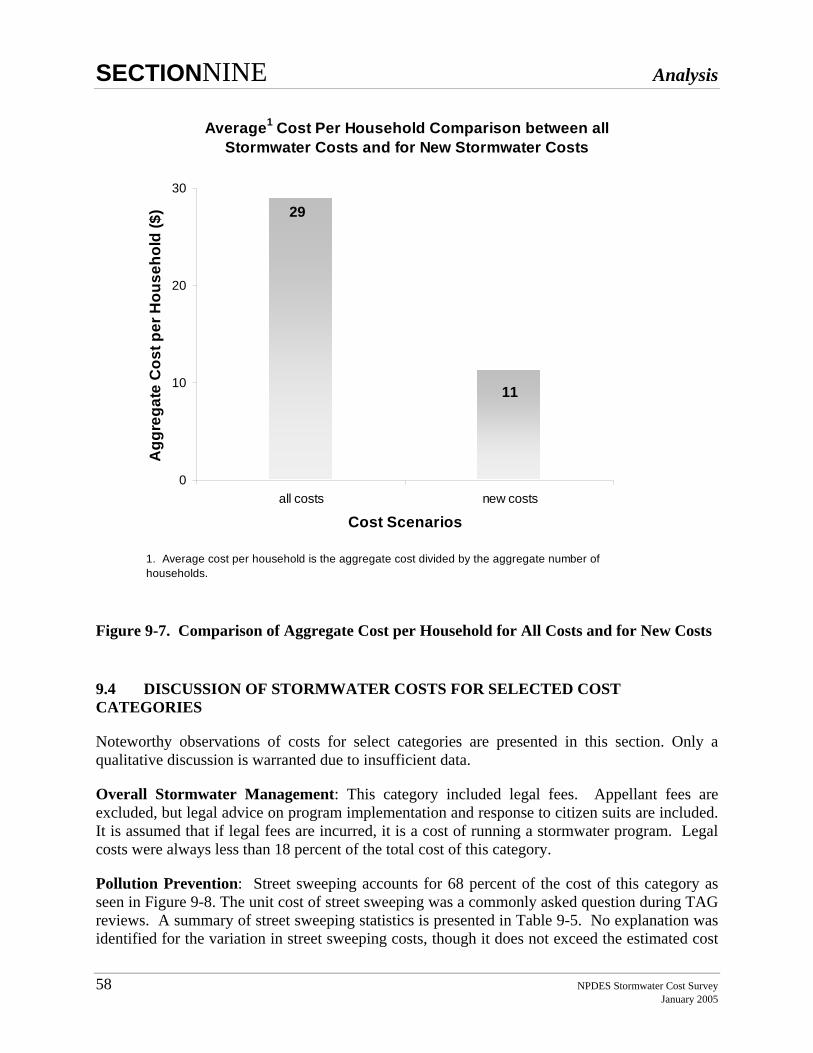
SECTIONNINE Analysis
58 NPDES Stormwater Cost Survey January 2005
Average1 Cost Per Household Comparison between all Stormwater Costs and for New Stormwater Costs
29
11
0
10
20
30
all costs new costs
Cost Scenarios
Agg
rega
te C
ost p
er H
ouse
hold
($)
1. Average cost per household is the aggregate cost divided by the aggregate number of households.
Figure 9-7. Comparison of Aggregate Cost per Household for All Costs and for New Costs
9.4 DISCUSSION OF STORMWATER COSTS FOR SELECTED COST CATEGORIES
Noteworthy observations of costs for select categories are presented in this section. Only a qualitative discussion is warranted due to insufficient data.
Overall Stormwater Management: This category included legal fees. Appellant fees are excluded, but legal advice on program implementation and response to citizen suits are included. It is assumed that if legal fees are incurred, it is a cost of running a stormwater program. Legal costs were always less than 18 percent of the total cost of this category.
Pollution Prevention: Street sweeping accounts for 68 percent of the cost of this category as seen in Figure 9-8. The unit cost of street sweeping was a commonly asked question during TAG reviews. A summary of street sweeping statistics is presented in Table 9-5. No explanation was identified for the variation in street sweeping costs, though it does not exceed the estimated cost
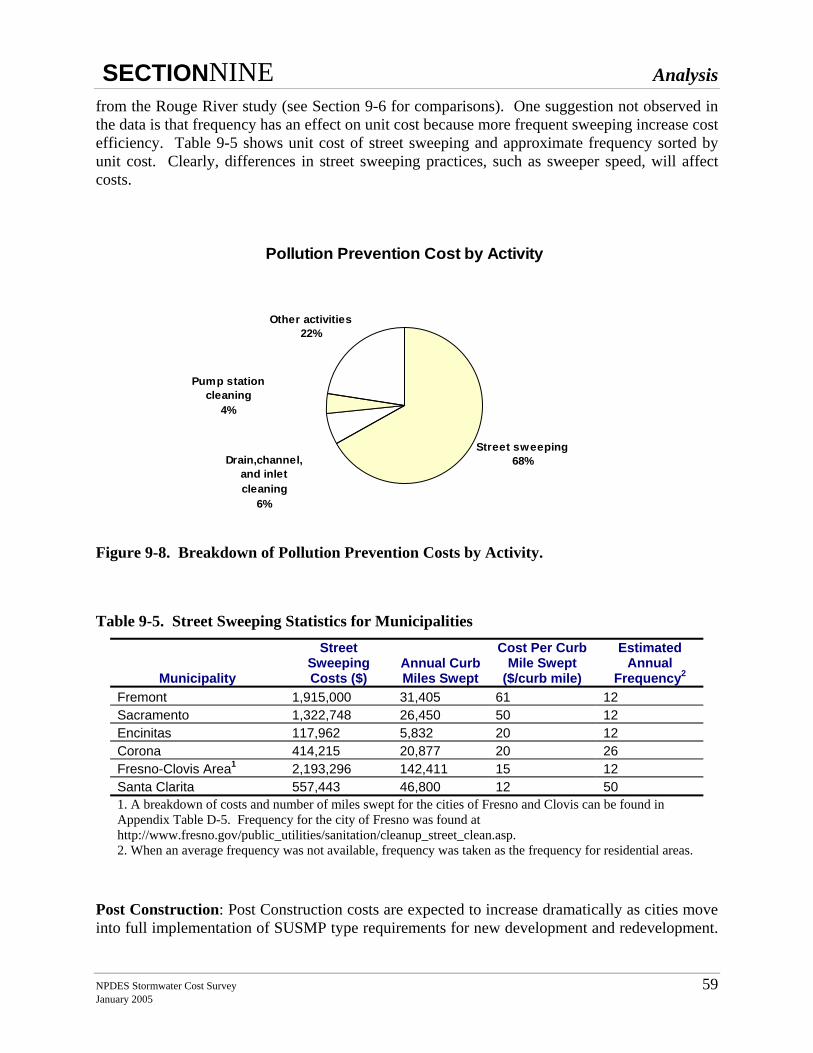
SECTIONNINE Analysis
NPDES Stormwater Cost Survey 59 January 2005
from the Rouge River study (see Section 9-6 for comparisons). One suggestion not observed in the data is that frequency has an effect on unit cost because more frequent sweeping increase cost efficiency. Table 9-5 shows unit cost of street sweeping and approximate frequency sorted by unit cost. Clearly, differences in street sweeping practices, such as sweeper speed, will affect costs.
Pollution Prevention Cost by Activity
Drain,channel, and inlet cleaning
6%
Other activities22%
Pump station cleaning
4%
Street sweeping68%
Figure 9-8. Breakdown of Pollution Prevention Costs by Activity.
Table 9-5. Street Sweeping Statistics for Municipalities
Municipality
Street Sweeping Costs ($)
Annual Curb Miles Swept
Cost Per Curb Mile Swept
($/curb mile)
Estimated Annual
Frequency2 Fremont 1,915,000 31,405 61 12 Sacramento 1,322,748 26,450 50 12 Encinitas 117,962 5,832 20 12 Corona 414,215 20,877 20 26 Fresno-Clovis Area1 2,193,296 142,411 15 12 Santa Clarita 557,443 46,800 12 50 1. A breakdown of costs and number of miles swept for the cities of Fresno and Clovis can be found in Appendix Table D-5. Frequency for the city of Fresno was found at http://www.fresno.gov/public_utilities/sanitation/cleanup_street_clean.asp. 2. When an average frequency was not available, frequency was taken as the frequency for residential areas.
Post Construction: Post Construction costs are expected to increase dramatically as cities move into full implementation of SUSMP type requirements for new development and redevelopment.
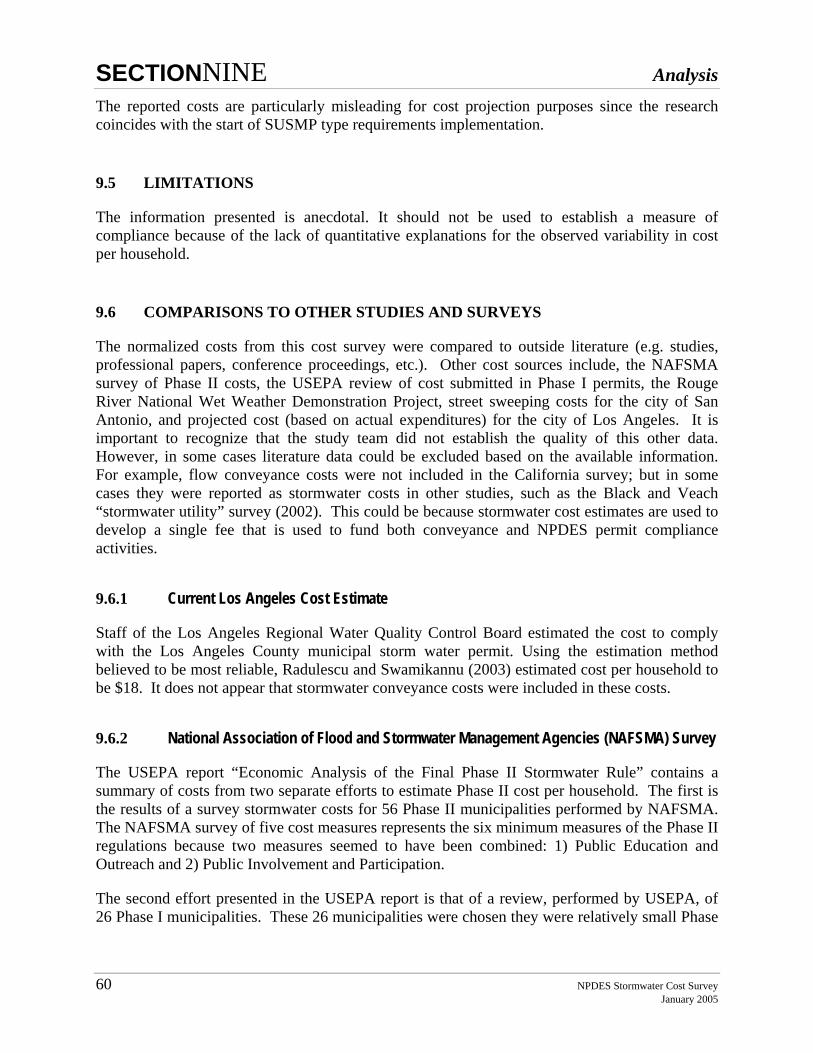
SECTIONNINE Analysis
60 NPDES Stormwater Cost Survey January 2005
The reported costs are particularly misleading for cost projection purposes since the research coincides with the start of SUSMP type requirements implementation.
9.5 LIMITATIONS
The information presented is anecdotal. It should not be used to establish a measure of compliance because of the lack of quantitative explanations for the observed variability in cost per household.
9.6 COMPARISONS TO OTHER STUDIES AND SURVEYS
The normalized costs from this cost survey were compared to outside literature (e.g. studies, professional papers, conference proceedings, etc.). Other cost sources include, the NAFSMA survey of Phase II costs, the USEPA review of cost submitted in Phase I permits, the Rouge River National Wet Weather Demonstration Project, street sweeping costs for the city of San Antonio, and projected cost (based on actual expenditures) for the city of Los Angeles. It is important to recognize that the study team did not establish the quality of this other data. However, in some cases literature data could be excluded based on the available information. For example, flow conveyance costs were not included in the California survey; but in some cases they were reported as stormwater costs in other studies, such as the Black and Veach “stormwater utility” survey (2002). This could be because stormwater cost estimates are used to develop a single fee that is used to fund both conveyance and NPDES permit compliance activities.
9.6.1 Current Los Angeles Cost Estimate
Staff of the Los Angeles Regional Water Quality Control Board estimated the cost to comply with the Los Angeles County municipal storm water permit. Using the estimation method believed to be most reliable, Radulescu and Swamikannu (2003) estimated cost per household to be $18. It does not appear that stormwater conveyance costs were included in these costs.
9.6.2 National Association of Flood and Stormwater Management Agencies (NAFSMA) Survey
The USEPA report “Economic Analysis of the Final Phase II Stormwater Rule” contains a summary of costs from two separate efforts to estimate Phase II cost per household. The first is the results of a survey stormwater costs for 56 Phase II municipalities performed by NAFSMA. The NAFSMA survey of five cost measures represents the six minimum measures of the Phase II regulations because two measures seemed to have been combined: 1) Public Education and Outreach and 2) Public Involvement and Participation.
The second effort presented in the USEPA report is that of a review, performed by USEPA, of 26 Phase I municipalities. These 26 municipalities were chosen they were relatively small Phase
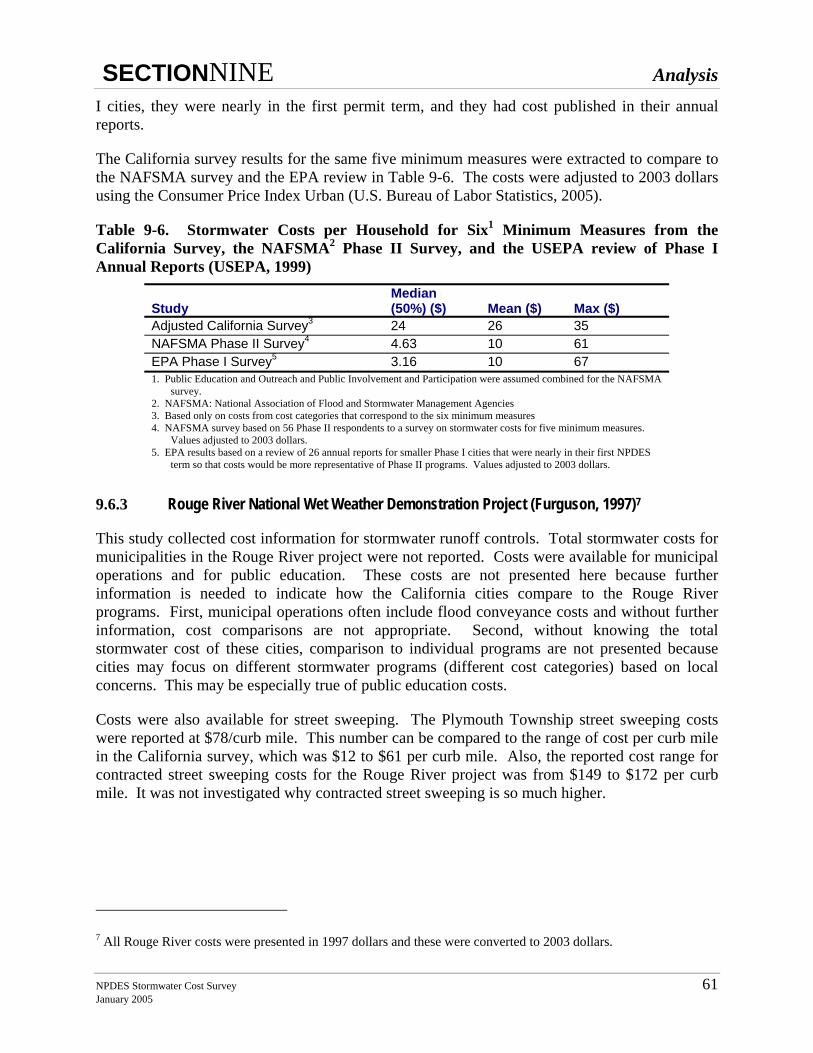
SECTIONNINE Analysis
NPDES Stormwater Cost Survey 61 January 2005
I cities, they were nearly in the first permit term, and they had cost published in their annual reports.
The California survey results for the same five minimum measures were extracted to compare to the NAFSMA survey and the EPA review in Table 9-6. The costs were adjusted to 2003 dollars using the Consumer Price Index Urban (U.S. Bureau of Labor Statistics, 2005).
Table 9-6. Stormwater Costs per Household for Six1 Minimum Measures from the California Survey, the NAFSMA2 Phase II Survey, and the USEPA review of Phase I Annual Reports (USEPA, 1999)
Study Median (50%) ($) Mean ($) Max ($)
Adjusted California Survey3 24 26 35 NAFSMA Phase II Survey4 4.63 10 61 EPA Phase I Survey5 3.16 10 67 1. Public Education and Outreach and Public Involvement and Participation were assumed combined for the NAFSMA
survey. 2. NAFSMA: National Association of Flood and Stormwater Management Agencies 3. Based only on costs from cost categories that correspond to the six minimum measures 4. NAFSMA survey based on 56 Phase II respondents to a survey on stormwater costs for five minimum measures.
Values adjusted to 2003 dollars. 5. EPA results based on a review of 26 annual reports for smaller Phase I cities that were nearly in their first NPDES
term so that costs would be more representative of Phase II programs. Values adjusted to 2003 dollars.
9.6.3 Rouge River National Wet Weather Demonstration Project (Furguson, 1997)7
This study collected cost information for stormwater runoff controls. Total stormwater costs for municipalities in the Rouge River project were not reported. Costs were available for municipal operations and for public education. These costs are not presented here because further information is needed to indicate how the California cities compare to the Rouge River programs. First, municipal operations often include flood conveyance costs and without further information, cost comparisons are not appropriate. Second, without knowing the total stormwater cost of these cities, comparison to individual programs are not presented because cities may focus on different stormwater programs (different cost categories) based on local concerns. This may be especially true of public education costs.
Costs were also available for street sweeping. The Plymouth Township street sweeping costs were reported at $78/curb mile. This number can be compared to the range of cost per curb mile in the California survey, which was $12 to $61 per curb mile. Also, the reported cost range for contracted street sweeping costs for the Rouge River project was from $149 to $172 per curb mile. It was not investigated why contracted street sweeping is so much higher.
7 All Rouge River costs were presented in 1997 dollars and these were converted to 2003 dollars.
SECTIONNINE Analysis
62 NPDES Stormwater Cost Survey January 2005
9.6.4 San Antonio Street Sweeping Costs
The city of San Antonio is reported to spend $3.5 million on street sweeping (Brazozowski, 2004). The city of San Antonio estimates that around 45,000 curb miles were swept (Martinez, 2004). This results in a cost per mile swept of $78. The highest cost per mile from the California survey was $61, indicating costs per mile from the survey are reasonable despite a wide range.
SECTIONTEN Closing
NPDES Stormwater Cost Survey 63 January 2005
10.0 CLOSING
This section discusses the significance of cost survey results and suggests standards for reporting cost and activities performed. These suggestions are meant to build the dataset necessary to make management decisions on stormwater program implementation.
10.1 SIGNIFICANCE OF SURVEYED STORMWATER COSTS IN CALIFORNIA
The range of 2002/03 fiscal year stormwater costs for the six municipal areas8 surveyed was $18 to $46 per household. This only provides a snap shot of costs in 2002/2003 of good California Stormwater programs. Costs will change as requirements change with each new permit.
A specific example of increasing permit requirements is TMDL compliance. TMDL costs are sometimes addressed within the implementation plans or the cost to achieve water quality objectives may already be addressed in 305 (b) reports9. Since TMDL requirements will be added to stormwater permits, these cost estimates are an indication of how permit compliance costs will be increasing. However, TMDL allocations may be distributed to a variety of sources besides stormwater, thus stormwater treatment will not bear the entire burden of restoring beneficial use to impaired waters.
Another factor affecting cost in the near term is the increased level of attention given to Standard Urban Stormwater Mitigation Plans (SUSMPs). Post-construction costs in particular are expected to increase significantly, but that cost may be borne by developers and contractors rather than municipalities.
Although compliance with construction and industrial permits is discussed in stormwater permits, the costs for municipalities to comply with these permits are not addressed in this report.
10.2 SUGGESTIONS FOR REPORTING COSTS AND ACCOMPLISHMENTS
Current variability in the organization and content of the data submitted by the cities indicates standards for reporting costs and stormwater activities are needed to allow accurate cost comparisons to be made between stormwater activities. This cost information is crucial in making management decisions regarding which stormwater activities should be implemented.
8 The Fresno-Clovis Metropolitan Area includes the stormwater costs of the cities of Fresno and Clovis.
9Even if TMDL plans do not address cost, Section 305 (b) states “each State shall prepare and submit….a report which shall include…an estimate of the environmental impact, the economic and social costs necessary to achieve the objective of this chapter in such State, including an estimate of the costs of implementing such programs”. First, assuming all 303 (d) listed waters are a subset of 305 (b) waters, it could be assumed that the CWA requires a cost analysis for TMDL implementation plans (which is interpreted as “each State shall prepare…”. Otherwise it seems to be required in the State’s “305(b) report”. Either way, analysis of the cost to restore water quality may be an ongoing requirement.
SECTIONTEN Closing
64 NPDES Stormwater Cost Survey January 2005
The following recommendations for cost reporting are only the first step in the process of developing consistent cost reporting. This process includes notifying cities of reporting goals, receiving feedback and data from the cities, reviewing reported costs for quality and consistency, and providing feedback to the cities.
10.2.1 Current Variability
In this survey, there seemed be inconsistent reporting and tracking of stormwater activities and associated costs. This could be from differences in the reporting requirements for each permit. The reasons for these differences were not investigated; however, some possibilities are discussed. One reason may be that interest in cost may vary between RWQCB jurisdictions. Also, cost tracking systems used by the cities may not be designed to accurately track stormwater costs by activity. According to a survey conducted in 2001-2002, only 50 percent of 122 surveyed stormwater utilities said that their accounting system permitted cost tracking by operating activity (e.g. inlet cleaning) (Black and Veatch, 2002). Also, Radulescu and Swamikannu (2003) note that current governmental accounting standards do not require a distinction of stormwater costs. This was confirmed by a review of these standards by the study team.
10.2.2 Proposed Data Tracking and Reporting
A separate fund to account for stormwater related expenditures would provide cities with a starting point for stormwater cost collection. Cities would be able to use this fund for stormwater related expenditures needed for annual stormwater report preparation. It is important that the fund distinguish between stormwater permit compliance costs and stormwater conveyance costs. Having a fund in place also means that the costs reported in the fund would be subject to independent audit on a yearly basis, which would increase the level of confidence in reported cost figures. Stormwater costs should be further broken down into stormwater programs.
For all programs, there are several costs that should be tracked for each cost category discussed below. The cost for labor of stormwater staff and benefits should be tracked for each program or allocated to each program on a reasonable basis. Direct costs (e.g. phone, field and office supplies, etc.) and depreciation costs (e.g. vehicles and equipment) should also be tracked for each program. Finally, overhead allocation for the entire stormwater program should be distributed to each cost category. Overhead allocation is often estimated by the cities as a straight percentage of labor cost and includes building fees, payroll, human resources, legal, administration, and other costs that provide ancillary support for stormwater activities.
As with costs, accomplishments should be tracked to support stormwater management decisions. The ultimate goal is to be able to compare cost benefit between stormwater programs and
Caution for Template Reporting Requirements
Some of the templates used in annual reports reviewed during the survey had yes/no questions for stormwater activities that discouraged quantification of accomplishments.
SECTIONTEN Closing
NPDES Stormwater Cost Survey 65 January 2005
activities10. Reporting accomplishments in terms of receiving water quality benefit is ideal, but currently unrealistic.
Suggested cost categories and what activities they cover are discussed in the following sections.
Construction Site Stormwater Runoff Control
Stormwater permits require cities to implement construction programs that minimize the negative impacts of construction on MS4 stormwater quality. This is commonly accomplished by establishing city ordinances that give the city the legal authority to implement to program. This is a parallel and separate effort from the statewide construction permit issued by the SWRCB. The construction program assists contractors and developers in following appropriate USEPA guidelines for construction sites. Cities accomplish this by instituting ordinances, inspecting sites and providing training to contractors and city inspectors. The USEPA activities that apply to construction sites are divided into four different categories: runoff control, sediment control, erosion control, and good housekeeping. Runoff control activities include minimizing clearing, stabilizing drainage ways, and installing check dams, berms, grass-lined channels, and riprap. The sediment control category includes installing perimeter controls, installing sediment trapping devices, installing drain inlet protection. Erosion control activities include stabilizing exposed soils, permanent seeding, installing sod, soil roughening, protecting steep slopes, geotextiles, gradient terraces, soil retention, temporary slope drain, protecting waterways, temporary stream crossings, vegetated buffers, phase construction, construction sequencing, and dust control (USEPA, 2004).
Cost of stormwater inspections at construction sites, the number of inspections performed, and the number of active construction sites should be tracked. Only inspections should be tracked when stormwater issues are being addressed by a part of the inspection. It is suspected that some building inspectors still count inspections toward stormwater for latter phases of projects, such as interior building work, that has little impact on stormwater. This should be avoided.
Cost of training provided to inspectors and contractors should be tracked, including the cost for the participating inspectors to attend the training. The number of person-hours trained should be tracked for stormwater staff inspectors because the city must pay for each city staff member attending training. For contractor training, the number of training hours provided (regardless of group size) should be reported because the cities do not pay for the contractors to attend as they do for city staff.
Illicit Discharge Detection and Elimination
The IDDE program seeks to identify and eliminate illicit discharges to the storm sewer system. This is done by inspecting connections to the storm sewer system and requiring landowners to remediate illegal discharges. Common IDDE problems include failing septic systems,
10 A subcommittee of the California Stormwater Quality Association (CASQA) is working on developing guidelines for program effectiveness evaluation.
SECTIONTEN Closing
66 NPDES Stormwater Cost Survey January 2005
industrial/business connections, recreational sewage, and sanitary sewer overflows. Costs relating to the activities of identifying illicit connections, wastewater connections to the storm drain system, and illegal dumping should be reported in this category (USEPA, 2004).
For the IDDE program, the cost of inspections for illicit connections and discharges to the stormwater drainage system and the number of inspections should be tracked. Like construction, it is difficult to account for stormwater costs because many activities performed by inspectors serve other purposes, such as inspection of the sanitary sewer system.
Cost of training provided to inspectors should be tracked, including the cost for the participating inspectors to attend the training. The number of person-hours trained should be tracked for stormwater staff inspectors in order to effectively allocate overhead cost.
Industrial and Commercial Management Programs
Similar to the construction program, the industrial and commercial program uses the development and enforcement of city ordinances to minimize pollution of MS4 stormwater. Examples of practices employed by facilities include good housekeeping such as covered material storage, emergency spill equipment, facility sweeping, no “hosing off” into storm drains, and secondary containment of industrial materials.
For the industrial and commercial program, the cost of inspections should be tracked as well as the number of industrial and commercial facilities. Also, the cost of training provided to inspectors should be tracked, including the cost for the participating inspectors to attend the training. The number of person-hours trained should be tracked for stormwater staff inspectors.
Overall Stormwater Program Management
The costs in this category are for stormwater staff costs that could not be allocated to the other cost categories. It includes costs associated with development and oversight of the entire stormwater program. Also, costs for management plans, NPDES fees, reporting, mail, legal support, travel, conferences, printing, producing manuals and handbooks, and other non-labor costs are included that could not be allocated. Normalization for this category is not practical because of the wide variety of activities, and because very few of these activities can be numerically quantified.
Pollution Prevention and Good Housekeeping for Municipal Operations
This program includes costs for source control activities relating to pet waste collection, automobile maintenance, vehicle washing, illegal dumping control, landscaping and lawn care, pest control, parking lot and street cleaning, roadway and bridge maintenance, septic system controls, storm drain system cleaning, and alternative discharge options for chlorinated water. Costs for materials management would be for alternative products, hazardous materials storage, road salt application and storage, spill response and prevention, used oil recycling, and materials management (USEPA, 2004).
SECTIONTEN Closing
NPDES Stormwater Cost Survey 67 January 2005
For this program, the cost for street sweeping and the number of curb miles swept should be tracked. Also, the cost for drain line and channel cleaning, pump station cleaning, and similar activities along with their associated activity statistics (e.g. lbs. of debris removed) should be tracked.
Post Construction Stormwater Management in New Development and Redevelopment
This program assures that private developers implement post-construction BMPs (treatment BMPs11 and permanent source control BMPs). This program also includes maintenance of post-construction BMPs on city-owned property. This cost is included, because unlike the construction and industrial programs, post-construction requirements are not regulated by a separate permit.
Treatment BMPs include ponds, dry extended detention ponds, wet ponds, infiltrations practices, basins, trenches, porous pavement, filtration practices, bio-retention, sand and organic filters, vegetative practices, stormwater wetland, grassed swales and filter strips, runoff pretreatment practices, catch basins and inserts, in-line storage, and manufactured products for stormwater inlets. Source control12 or source reduction BMPs include the following activities: experimental practices, alum injection, on-lot treatment, better site design, buffer zones, open space design, urban forestry, conservation easements, infrastructure planning, narrower residential streets, eliminating curbs and gutters, green parking, alternative turnarounds and pavers, BMP inspection and maintenance, ordinances for post construction runoff, and zoning (USEPA, 2004). If the city performs these activities in-house, the costs should be included in this category.
Public Education, Outreach, Involvement, and Participation
Education and outreach to homeowners would cover topics such as lawn and garden care, water conservation practices, pet waste, trash management, and proper disposal of hazardous waste. General outreach would include outreach relating to commercial activities, tailoring outreach programs to minority and disadvantaged communities and children, classroom education, and educational materials. Outreach relating to new development and existing development would include low impact development, educational displays, pamphlets, booklets, and utility stuffers, media, promotional giveaways, and pollution prevention for businesses. Relating to public involvement and participation, activities would include storm drain marking, stream cleanup and monitoring, volunteer monitoring, reforestation programs, wetland plantings, adopt-a-stream programs, watershed organization, stakeholder meetings, attitude surveys, and community hotlines (USEPA, 2004).
11 Treatment BMPs have been called structural BMPs, but the term ‘treatment BMP’ is preferred since source control BMPs often have structural components.
12 The USEPA defines these as “nonstructural”, but some source controls such as berms and material covers and many erosion controls are structural so the term source control or source reduction is used in this report.
SECTIONTEN Closing
68 NPDES Stormwater Cost Survey January 2005
It is unclear at this time of the utility of tracking specific costs of this program and how they may be related to water quality improvements.
Water Quality Monitoring
The program tracks costs related to monitoring or both stormwater and receiving water quality. These costs cover preparation of monitoring plans, sample collection, sampling equipment, laboratory analysis, data analysis, and reporting.
Watershed Management
This program can be used to track cost for watershed meetings, meeting with stakeholders, and development of watershed management plans. It may also be an appropriate category for coordination costs for TMDL planning.
Conclusion on Category Recommendations
It may prove that costs cannot be reported as suggested. Flexibility in compliance is an important aspect to cost effectiveness, however, too much flexibility in reporting requirements generates a useless dataset. At a minimum, it is suggested that annual reports throughout the state follow a standard format for cost reporting, whether the one suggested here is followed or not.
10.3 TAG RECOMMENDATIONS FOR COST TRACKING
The TAG proposes that if the permittees have a correct cost accounting/reporting system, they would be granted an additional quantity of points towards their receipt of a grant under a state/federal program; for example, Section 319(h) grants are evaluated on a point ranking system that is established by a state. If the cost accounting/reporting information were tabulated pursuant to the state's suggested format, that applicant would receive a bonus allotment equal to a boost in total points of approximately 15 percent. This would alert permittees to the benefit in competing for these grants as a prerequisite to establishing the appropriate cost accounting system. The proposed system would benefit from review and acceptance by the California League of Cities.
SECTIONELEVEN References
NPDES Stormwater Cost Survey 69 January 2005
11.0 REFERENCES Black and Veatch. 2002. “Stormwater Utility Survey: 2001-2002” brochure. Black and Veatch
Holding Company.
Brzozowski, Carol. 2004. “Street Sweeping”. Stormwater. July/August 2004.
City of Clovis. 2003a. “Comprehensive Annual Financial Report. 30 June 2003” http://www.ci.clovis.ca.us/ (01 June 2004).
City of Corona. 1993. “Santa Ana Regional Drainage Area Management Plan.” Corona, CA. February.
City of Corona. 2003a. “Comprehensive Annual Financial Report. 30 June 2003” http://www.ci.corona.ca.us/depts/finance/cafr03/index.cfm (18 March 2004)
City of Corona. 2003b. “Santa Ana Watershed NPDES Municipal Stormwater Permit. Annual Reporting Forms” Corona, CA. July
City of Corona. 2004a. “General Plan” http://www.ci.corona.ca.us/depts/planning/GPupdate/gp_list.cfm (10 April 2004)
City of Encinitas. 2003a. “Comprehensive Annual Financial Report. 30 June 2003” http://www.ci.encinitas.ca.us/City_Services/Finance/fin_report/city_fin_report.htm (18 March 2004)
City of Encinitas. 2003b. “City of Encinitas, Jurisdictional Urban Runoff Management Program (JURMP) Annual Report.” Encinitas, CA.
City of Encinitas. 2003c. “Land Use Element, City of Encinitas General Plan.”mhttp://www.ci.encinitas.ca.us/Public_Documents/General_Plan/general_plan.htm (10 April 2004)
City of Fremont. 2003a. “Comprehensive Annual Financial Report, 30 June 2003”mhttp://www.ci.fremont.ca.us/CityHall/Departments/Finance.htm (18 March 2004)
City of Fremont. 2003b. “Alameda Countywide Clean Water Program Fiscal Year 2002/03 Annual Report, Volume III of IV.” EOA, Inc. Oakland, CA. September.
City of Fremont. 2003c. “Alameda Countywide Clean Water Program Stormwater Quality Management Plan. July 2001 – June 2008.” EOA, Inc. Oakland, CA. Updated February.
City of Sacramento. 2003a. “Comprehensive Annual Financial Report, 30 June 2003”mhttp://www.cityofsacramento.org/cafr/ (07 June 2004)
City of Sacramento. 2003b. “Stormwater Management Program 2002/2003 Annual Report”
City of Sacramento. 2003c. “Stormwater Quality Improvement Plan.” Sacramento, CA. July.
SECTIONELEVEN References
70 NPDES Stormwater Cost Survey January 2005
City of Santa Clarita. 2003a. “Comprehensive Annual Financial Report. 30 June 2003” Santa Clarita, CA. http://www.santa-clarita.com/cityhall/admin/cafr/ (07 June 2004)
City of Santa Clarita. 2003b. “Los Angeles County Municipal Storm Water Permit (Order 01-182) Individual Annual Reporting Form, Attachment U-4.” Santa Clarita, CA.
County of Fresno. 2003. “Comprehensive Annual Financial Report, 30 June 2003” Fresno, CA. December.
Cyre, Hectore J. “New Options for Stormwater Financing.” American Public Works Association (APWA) Reporter. April 1983. http://stormwaterfinance.urbancenter.iupui.edu/PDFs/Cyre83.pdf
Devinny, Joseph, Sheldon Kamieniecki and Michael Stenstrom. 2004. Alternative Approaches to Stormwater Quality Control. USC Center for Sustainable Cities.
Fresno Metropolitan Flood Control District (FMFCD). 1999. “Fresno-Clovis Storm Water Quality Management Program.” Fresno, CA. February.
Fresno Metropolitan Flood Control District (FMFCD). 2003a. “Basic Financial Statements, Combining Fund Financial Statements and Supplemental Schedules, 30 June 2003.” Fresno, CA. December.
Fresno Metropolitan Flood Control District (FMFCD). 2003b. “Annual Report FY 2002-2003, Fresno-Clovis Storm Water Quality Management Program, Volume 1: Program Evaluations.” Fresno, CA. September.
Ferguson, Timothy et al. 1997. “Rouge River National Wet Weather Demonstration Project, 1st Edition” Wayne County, MI. July.
Garrison, Jessica. 2004. “Bond to Clean L.A. Waterways Advances” Los Angeles Times.mhttp://www.latimes.com/news/local/la-me-water8jul08,1,5202633.story (14 July 2004)
Gordon, Peter, John Kuprenas, Jiin-Jen Lee, James More, Harry Richardson, and Christopher Williamson. 2002. An Economic Impact Evaluation of Proposed Storm Water Treatment for Los Angeles County. University of Southern California. November 2002.
Larsen, Douglas, and Daniel Lew. 2003. “Clean Water in California: What Is It Worth?” http://www.agecon.ucdavis.edu/outreach/areupdatepdfs/UpdateV4N4/summer2001_2.pdf (18 August 2004)
Radulescu, Dan and Xavier Swamikannu. 2003. “Economics of Municipal Storm Water Programs” Los Angeles Regional Water Quality Control Board. January 2003 http://www.swrcb.ca.gov/rwqcb4/html/programs/stormwater/la_ms4_final.html
RWQCB, Central Valley (Regional Water Quality Control Board, Central Valley Region). 2002a. “Waste Discharge Requirements for Fresno Metropolitan Flood Control District,
SECTIONELEVEN References
NPDES Stormwater Cost Survey 71 January 2005
City of Fresno, City of Clovis, County of Fresno, and California State University Fresno” http://www.swrcb.ca.gov/stormwtr/docs/fresno_permit_5_01_048.pdf
RWQCB, Central Valley (Regional Water Quality Control Board, Central Valley Region). 2002b. “Waste Discharge Requirements for County of Sacramento and Cities of Citrus Heights, Elk Grove, Folsom, Galt, and Sacramento Storm Water Discharges From Municipal Separate Storm Systems Sacramento County (Order No. R5-2002-0206)” http://www.waterboards.ca.gov/centralvalley/adopted_orders/Sacramento/R5-2002-0206.pdf (18 March 2004)
RWQCB, Los Angeles (Regional Water Quality Control Board, Los Angeles Region). 2001. “Waste Discharge Requirements for Municipal Storm Water and Urban Runoff Discharges Within the County of Los Angeles, and the Incorporated Cities Therein, Except the City of Long Beach (Order No. 01-182)” (18 March 2004) http://www.swrcb.ca.gov/rwqcb4/html/programs/stormwater/la_ms4_final/FinalPermit.pdf
RWQCB, San Francisco Bay (Regional Water Quality Control Board, San Francisco Bay Region). 2003. “Alameda Countywide NPDES Municipal Stormwater Permit” San Francisco, Ca. http://www.swrcb.ca.gov/rwqcb2/Agenda/02-19-03/02-19-03-12finalto.doc (18 March 2004)
RWQCB, Santa Ana (Regional Water Quality Control Board, Santa Ana Region). 2002. “Waste Discharge Requirements for the Riverside County Flood Control and Water Conservation District, the County of Riverside, and the Incorporated Cities of Riverside County Within the Santa Ana Region Areawide Urban Runoff (Order No. R8-2002-0011)”, http://www.swrcb.ca.gov/rwqcb8/pdf/02-11.pdf (18 March 2004)
RWQCB (Regional Water Quality Control Board, San Diego Region). 2001. “Waste Discharge Requirements for Discharges of Urban Runoff from the Municipal Separate Storm Sewer Systems (MS4’s) Draining the Watersheds of the County of San Diego, the Incorporated Cities of San Diego County, and the San Diego Unified Port District (Order No. 2001-01)”. http://www.waterboards.ca.gov/sandiego/
U.S. Bureau of Labor Statistics. 2005. “Consumer Price Index Homepage”mhttp://www.bls.gov/cpi/home.htm
U.S. Census Bureau. 2003. “United States Census 2000” http://www.census.gov
USEPA. 2004. “National Menu of Best Management Practices for Stormwater Phase II” http://cfpub.epa.gov/npdes/stormwater/menuofbmps/menu.cfm (20 December 2004)

72 (blank) NPDES Stormwater Cost Survey January 2005
SECTIONTWELVE Acronyms
NPDES Stormwater Cost Survey 73 January 2005
12.0 ACRONYMS
ACCWP: Alameda Countywide Clean Water Program
BMP: best management practice13
CAFR: Comprehensive Annual Financial Report
CASQA: California Stormwater Quality Association
CFR: Code of Federal Regulations
CPR: Coalition for Practical Regulation
CSUF: California State University, Fresno
CSUS: California State University, Sacramento
CWA: Clean Water Act
DAMP: Drainage Area Master Plan
FCMA: Fresno-Clovis Metropolitan Area
FMFCD: Fresno Metropolitan Flood Control District
GIS: Geographic Information System
IDDE: Illicit Discharge Detection and Elimination
IPM: integrated pest management
JURMP: Jurisdictional Urban Runoff Management Program
LAFCD: Los Angeles Flood Control District
LARWQCB: Los Angeles Regional Water Quality Control Board
MEP: maximum extent practicable
MS4: Municipal Separate Storm Sewer System
NAFSMA: National Association of Flood and Stormwater Management Agencies
NPDES: National Pollutant Discharge Elimination System
13 BMP, as used in this report, refers to conventional BMPs that operate without power or operators. It does not include advanced treatment.
SECTIONTWELVE Acronyms
74 NPDES Stormwater Cost Survey January 2005
OWP: Office of Water Programs
RWQCB: Regional Water Quality Control Board
SAR-DAMP: Santa Ana Regional Drainage Area Management Plan
SQIP: Stormwater Quality Improvement Plan
SUSMP: Standard Urban Storm Water Mitigation Plan
SWMP: Storm Water Management Plan
SWPPP: Storm Water Pollution Prevention Plan
SWRCB: State Water Resource Control Board
TAG: technical advisory group
TMDL: total maximum daily load
UCLA: University of California, Los Angeles
USC: University of Southern California
USD: Union Sanitation District
USEPA: United States Environmental Protection Agency
WERF: Water Environment Research Foundation
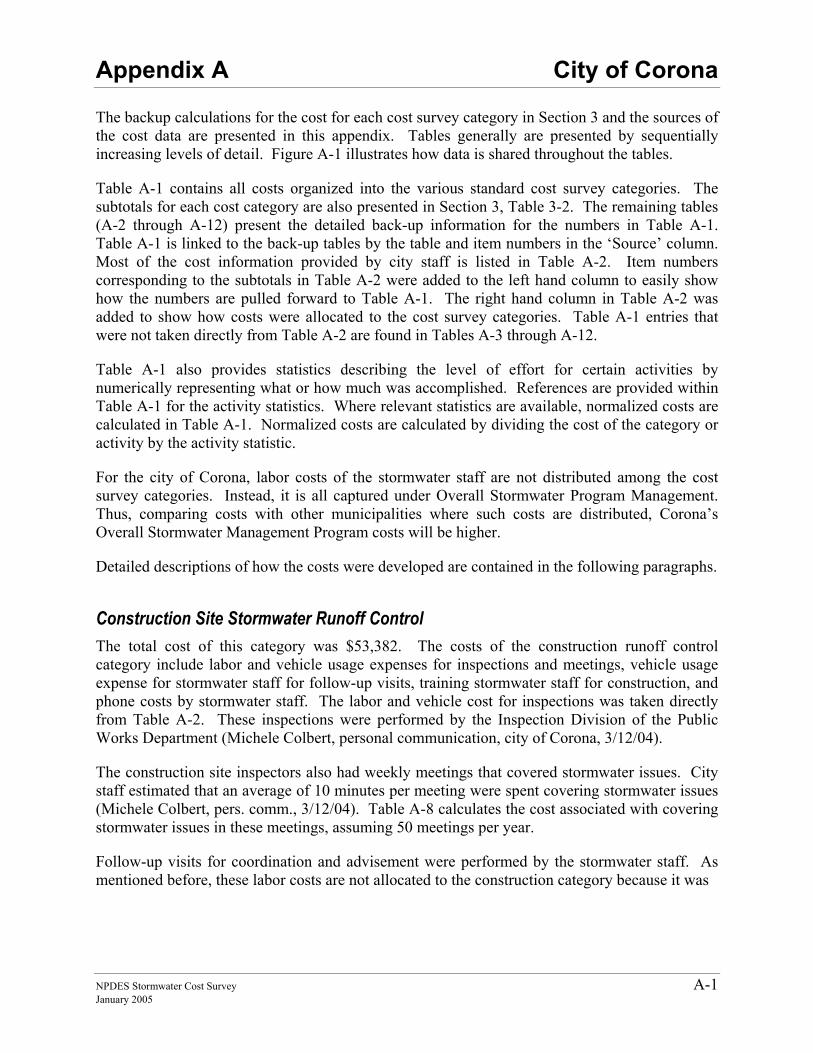
Appendix A City of Corona
NPDES Stormwater Cost Survey A-1 January 2005
APPENDIX A The backup calculations for the cost for each cost survey category in Section 3 and the sources of the cost data are presented in this appendix. Tables generally are presented by sequentially increasing levels of detail. Figure A-1 illustrates how data is shared throughout the tables.
Table A-1 contains all costs organized into the various standard cost survey categories. The subtotals for each cost category are also presented in Section 3, Table 3-2. The remaining tables (A-2 through A-12) present the detailed back-up information for the numbers in Table A-1. Table A-1 is linked to the back-up tables by the table and item numbers in the ‘Source’ column. Most of the cost information provided by city staff is listed in Table A-2. Item numbers corresponding to the subtotals in Table A-2 were added to the left hand column to easily show how the numbers are pulled forward to Table A-1. The right hand column in Table A-2 was added to show how costs were allocated to the cost survey categories. Table A-1 entries that were not taken directly from Table A-2 are found in Tables A-3 through A-12.
Table A-1 also provides statistics describing the level of effort for certain activities by numerically representing what or how much was accomplished. References are provided within Table A-1 for the activity statistics. Where relevant statistics are available, normalized costs are calculated in Table A-1. Normalized costs are calculated by dividing the cost of the category or activity by the activity statistic.
For the city of Corona, labor costs of the stormwater staff are not distributed among the cost survey categories. Instead, it is all captured under Overall Stormwater Program Management. Thus, comparing costs with other municipalities where such costs are distributed, Corona’s Overall Stormwater Management Program costs will be higher.
Detailed descriptions of how the costs were developed are contained in the following paragraphs.
Construction Site Stormwater Runoff Control The total cost of this category was $53,382. The costs of the construction runoff control category include labor and vehicle usage expenses for inspections and meetings, vehicle usage expense for stormwater staff for follow-up visits, training stormwater staff for construction, and phone costs by stormwater staff. The labor and vehicle cost for inspections was taken directly from Table A-2. These inspections were performed by the Inspection Division of the Public Works Department (Michele Colbert, personal communication, city of Corona, 3/12/04).
The construction site inspectors also had weekly meetings that covered stormwater issues. City staff estimated that an average of 10 minutes per meeting were spent covering stormwater issues (Michele Colbert, pers. comm., 3/12/04). Table A-8 calculates the cost associated with covering stormwater issues in these meetings, assuming 50 meetings per year.
Follow-up visits for coordination and advisement were performed by the stormwater staff. As mentioned before, these labor costs are not allocated to the construction category because it was
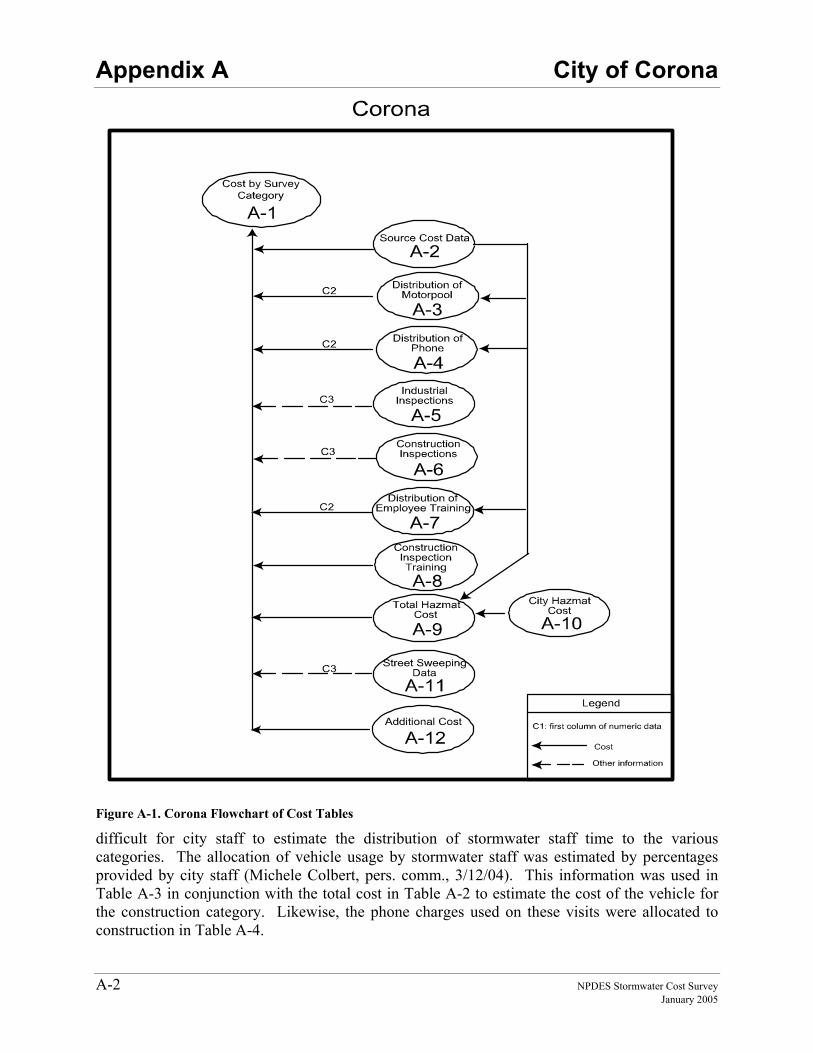
Appendix A City of Corona
A-2 NPDES Stormwater Cost Survey January 2005
Figure A-1. Corona Flowchart of Cost Tables
difficult for city staff to estimate the distribution of stormwater staff time to the various categories. The allocation of vehicle usage by stormwater staff was estimated by percentages provided by city staff (Michele Colbert, pers. comm., 3/12/04). This information was used in Table A-3 in conjunction with the total cost in Table A-2 to estimate the cost of the vehicle for the construction category. Likewise, the phone charges used on these visits were allocated to construction in Table A-4.
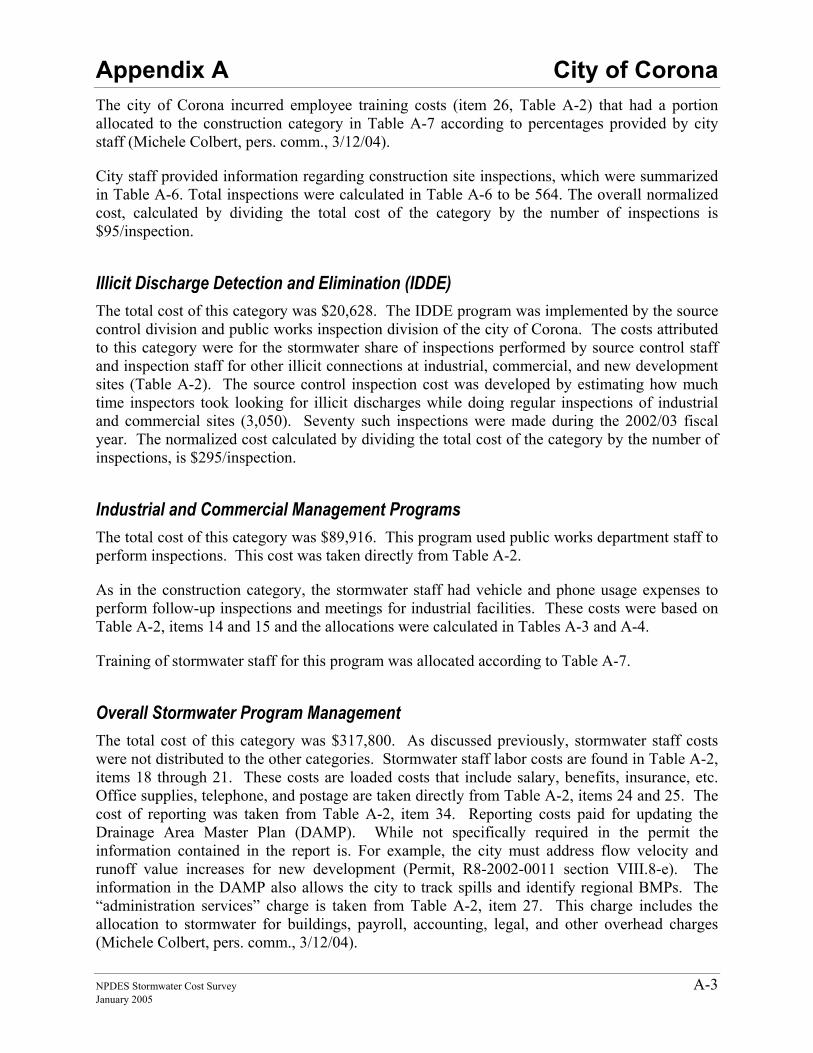
Appendix A City of Corona
NPDES Stormwater Cost Survey A-3 January 2005
The city of Corona incurred employee training costs (item 26, Table A-2) that had a portion allocated to the construction category in Table A-7 according to percentages provided by city staff (Michele Colbert, pers. comm., 3/12/04).
City staff provided information regarding construction site inspections, which were summarized in Table A-6. Total inspections were calculated in Table A-6 to be 564. The overall normalized cost, calculated by dividing the total cost of the category by the number of inspections is $95/inspection.
Illicit Discharge Detection and Elimination (IDDE) The total cost of this category was $20,628. The IDDE program was implemented by the source control division and public works inspection division of the city of Corona. The costs attributed to this category were for the stormwater share of inspections performed by source control staff and inspection staff for other illicit connections at industrial, commercial, and new development sites (Table A-2). The source control inspection cost was developed by estimating how much time inspectors took looking for illicit discharges while doing regular inspections of industrial and commercial sites (3,050). Seventy such inspections were made during the 2002/03 fiscal year. The normalized cost calculated by dividing the total cost of the category by the number of inspections, is $295/inspection.
Industrial and Commercial Management Programs The total cost of this category was $89,916. This program used public works department staff to perform inspections. This cost was taken directly from Table A-2.
As in the construction category, the stormwater staff had vehicle and phone usage expenses to perform follow-up inspections and meetings for industrial facilities. These costs were based on Table A-2, items 14 and 15 and the allocations were calculated in Tables A-3 and A-4.
Training of stormwater staff for this program was allocated according to Table A-7.
Overall Stormwater Program Management The total cost of this category was $317,800. As discussed previously, stormwater staff costs were not distributed to the other categories. Stormwater staff labor costs are found in Table A-2, items 18 through 21. These costs are loaded costs that include salary, benefits, insurance, etc. Office supplies, telephone, and postage are taken directly from Table A-2, items 24 and 25. The cost of reporting was taken from Table A-2, item 34. Reporting costs paid for updating the Drainage Area Master Plan (DAMP). While not specifically required in the permit the information contained in the report is. For example, the city must address flow velocity and runoff value increases for new development (Permit, R8-2002-0011 section VIII.8-e). The information in the DAMP also allows the city to track spills and identify regional BMPs. The “administration services” charge is taken from Table A-2, item 27. This charge includes the allocation to stormwater for buildings, payroll, accounting, legal, and other overhead charges (Michele Colbert, pers. comm., 3/12/04).
Appendix A City of Corona
A-4 NPDES Stormwater Cost Survey January 2005
Pollution Prevention and Good Housekeeping for Municipal Operations The total cost of this category was $720,222. The city of Corona contracted for street sweeping services for 2002/03. These costs are shown in Table A-2, items 1 and 2. The number of curb miles swept was provided by city staff as a stand-alone worksheet. This worksheet is reproduced in Table A-11. The personnel cost of $14,000 (Table A-2, item 2) represents labor cost for the city of Corona to oversee the street sweeping contractor. The cost per curb mile swept ($20) is calculated based on total street sweeping costs.
Drain line and channel cleaning was performed in-house. The equipment rental, labor, and vehicle rental costs are presented in Table A-2 (items 3, 4, and 5 respectively). The normalized cost for this activity is based on the sum of these three costs and the total linear feet of maintained channels and drain lines. The costs for each type of facility could not be separated. Twenty-nine percent of the total linear feet was drain pipe and 71 percent was channels (Corona, 2003a).
Corona also incurred costs for hazardous material spill response. Public works and fire departments incurred costs implementing this program. These costs are calculated in Table A-9 and are based on a stand-alone worksheet provided by city staff reproduced as Table A-10. The normalized costs for hazmat responses ($465/response) are based on the total costs divided by the total number of responses.
Cost for the maintenance of the storm drain geographic information system (GIS) was taken directly from Table A-2.
The allocation of stormwater staff training expenses related to this category are calculated in Table A-7, based on Table A-2, item 26.
The cost incurred by the fire department for implementing SWPPPs for its nine fire stations are taken directly from Table A-2, item 23.
Post Construction Stormwater Management in New Development and Redevelopment The total cost of this category was $13,509. The city staff identified two costs for this category. Both are taken directly from Table A-2. The professional services costs were for a consultant that advised the city on selection of post-construction BMPs. The drain inlet insert maintenance cost was for 8 drain inlet inserts. The normalized cost calculation gives an approximate cost per drain inlet insert of $563/insert. This normalized value is not expected to be useful in comparing program costs as part of this cost survey.
Public Education and Outreach and Public Involvement and Participation The total cost of these categories was $28,409. The city did not track these costs separately and dividing the costs would be an artificial exercise (Michele Colbert, pers. comm., 3/12/04). All the costs for these two categories were taken directly from Tables A-2 and A-12. The descriptions for these categories in the annual report did not contain statistics that would be
Appendix A City of Corona
NPDES Stormwater Cost Survey A-5 January 2005
useful for normalizing the costs of these categories. This was confirmed in the meetings with city staff.
Water Quality Monitoring The total cost of this category was $7,000. The cost incurred for monitoring was for ad hoc testing in support of the IDDE program. This cost can be found in Table A-2, item 31.
References City of Corona. 2003a. “Comprehensive Annual Financial Report, 30 June 2003”
http://www.ci.corona.ca.us/depts/finance/cafr03/index.cfm (18 March 2004)
City of Corona. 2003b. “Santa Ana Watershed NPDES Municipal Stormwater Permit. Annual Reporting Forms” Corona, CA. July
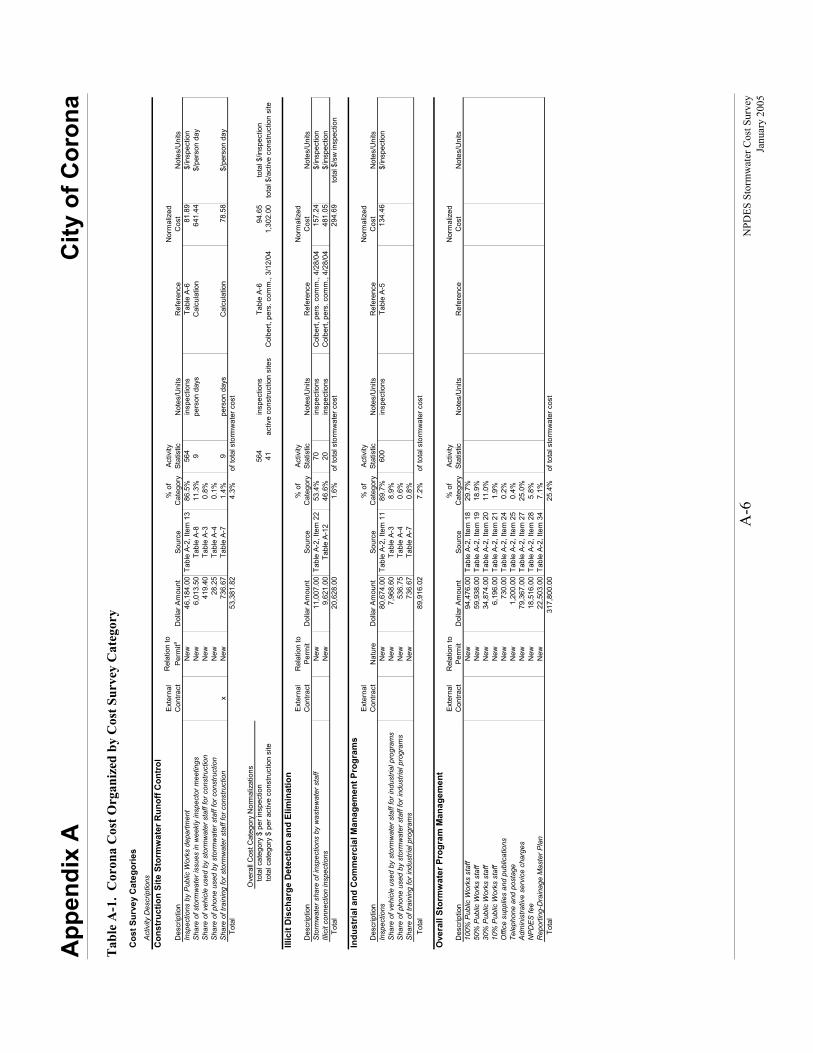
App
endi
x A
C
ity o
f Cor
ona
A
-6
NPD
ES S
torm
wat
er C
ost S
urve
y
Ja
nuar
y 20
05
Tab
le A
-1.
Cor
ona
Cos
t Org
aniz
ed b
y C
ost S
urve
y C
ateg
ory
Cos
t Sur
vey
Cat
egor
ies
Act
ivity
Des
crip
tions
Con
stru
ctio
n Si
te S
torm
wat
er R
unof
f Con
trol
Des
crip
tion
Ext
erna
l C
ontra
ctR
elat
ion
to
Perm
itaD
olla
r Am
ount
Sour
ce%
of
Cat
egor
yAc
tivity
St
atis
ticN
otes
/Uni
tsR
efer
ence
Nor
mal
ized
C
ost
Not
es/U
nits
Insp
ectio
ns b
y P
ublic
Wor
ks d
epar
tmen
tN
ew46
,184
.00
Tabl
e A-
2, It
em 1
386
.5%
564
insp
ectio
nsTa
ble
A-6
81.8
9$/
insp
ectio
nS
hare
of s
torm
wat
er is
sues
in w
eekl
y in
spec
tor m
eetin
gsN
ew6,
013.
50Ta
ble
A-8
11.3
%9
pers
on d
ays
Cal
cula
tion
641.
44$/
pers
on d
ayS
hare
of v
ehic
le u
sed
by s
torm
wat
er s
taff
for c
onst
ruct
ion
New
419.
40Ta
ble
A-3
0.8%
Sha
re o
f pho
ne u
sed
by s
torm
wat
er s
taff
for c
onst
ruct
ion
New
28.2
5Ta
ble
A-4
0.1%
Sha
re o
f tra
inin
g fo
r sto
rmw
ater
sta
ff fo
r con
stru
ctio
nx
New
736.
67Ta
ble
A-7
1.4%
9pe
rson
day
sC
alcu
latio
n78
.58
$/pe
rson
day
To
tal
53,3
81.8
24.
3%of
tota
l sto
rmw
ater
cos
t
Ove
rall
Cos
t Cat
egor
y N
orm
aliz
atio
ns
tota
l cat
egor
y $
per i
nspe
ctio
n56
4in
spec
tions
Tabl
e A
-694
.65
tota
l $/in
spec
tion
to
tal c
ateg
ory
$ pe
r act
ive
cons
truct
ion
site
41ac
tive
cons
truct
ion
site
sC
olbe
rt, p
ers.
com
m.,
3/12
/04
1,30
2.00
tota
l $/a
ctiv
e co
nstru
ctio
n si
te
Illic
it D
isch
arge
Det
ectio
n an
d El
imin
atio
n
Des
crip
tion
Ext
erna
l C
ontra
ctR
elat
ion
to
Per
mit
Dol
lar A
mou
ntSo
urce
% o
f C
ateg
ory
Activ
ity
Stat
istic
Not
es/U
nits
Ref
eren
ceN
orm
aliz
ed
Cos
tN
otes
/Uni
tsS
torm
wat
er s
hare
of i
nspe
ctio
ns b
y w
aste
wat
er s
taff
New
11,0
07.0
0Ta
ble
A-2,
Item
22
53.4
%70
insp
ectio
nsC
olbe
rt, p
ers.
com
m.,
4/28
/04
157.
24$/
insp
ectio
nIll
icit
conn
ectio
n in
spec
tions
New
9,62
1.00
Tabl
e A-
1246
.6%
20in
spec
tions
Col
bert,
per
s. c
omm
., 4/
28/0
448
1.05
$/in
spec
tion
To
tal
20,6
28.0
01.
6%29
4.69
tota
l $/s
w in
spec
tion
Indu
stria
l and
Com
mer
cial
Man
agem
ent P
rogr
ams
Des
crip
tion
Ext
erna
l C
ontra
ctN
atur
eD
olla
r Am
ount
Sour
ce%
of
Cat
egor
yAc
tivity
St
atis
ticN
otes
/Uni
tsR
efer
ence
Nor
mal
ized
C
ost
Not
es/U
nits
Insp
ectio
nsN
ew80
,674
.00
Tabl
e A-
2, It
em 1
189
.7%
600
insp
ectio
nsTa
ble
A-5
134.
46$/
insp
ectio
nS
hare
of v
ehic
le u
sed
by s
torm
wat
er s
taff
for i
ndus
trial
pro
gram
sN
ew7,
968.
60Ta
ble
A-3
8.9%
Sha
re o
f pho
ne u
sed
by s
torm
wat
er s
taff
for i
ndus
trial
pro
gram
sN
ew53
6.75
Tabl
e A-
40.
6%S
hare
of t
rain
ing
for i
ndus
trial
pro
gram
sN
ew73
6.67
Tabl
e A-
70.
8%
Tota
l89
,916
.02
7.2%
Ove
rall
Stor
mw
ater
Pro
gram
Man
agem
ent
Des
crip
tion
Ext
erna
l C
ontra
ctR
elat
ion
to
Per
mit
Dol
lar A
mou
ntSo
urce
% o
f C
ateg
ory
Activ
ity
Stat
istic
Not
es/U
nits
Ref
eren
ceN
orm
aliz
ed
Cos
tN
otes
/Uni
ts10
0% P
ublic
Wor
ks s
taff
New
94,4
76.0
0Ta
ble
A-2,
Item
18
29.7
%50
% P
ublic
Wor
ks s
taff
New
59,9
38.0
0Ta
ble
A-2,
Item
19
18.9
%30
% P
ublic
Wor
ks s
taff
New
34,8
74.0
0Ta
ble
A-2,
Item
20
11.0
%10
% P
ublic
Wor
ks s
taff
New
6,19
6.00
Tabl
e A-
2, It
em 2
11.
9%O
ffice
sup
plie
s an
d pu
blic
atio
nsN
ew73
0.00
Tabl
e A-
2, It
em 2
40.
2%Te
leph
one
and
post
age
New
1,20
0.00
Tabl
e A-
2, It
em 2
50.
4%A
dmin
istra
tive
serv
ice
char
ges
New
79,3
67.0
0Ta
ble
A-2,
Item
27
25.0
%N
PD
ES fe
eN
ew18
,516
.00
Tabl
e A-
2, It
em 2
85.
8%R
epor
ting-
Dra
inag
e M
aste
r Pla
nN
ew22
,503
.00
Tabl
e A-
2, It
em 3
47.
1%
Tota
l31
7,80
0.00
25.4
%
of to
tal s
torm
wat
er c
ost
of to
tal s
torm
wat
er c
ost
of to
tal s
torm
wat
er c
ost
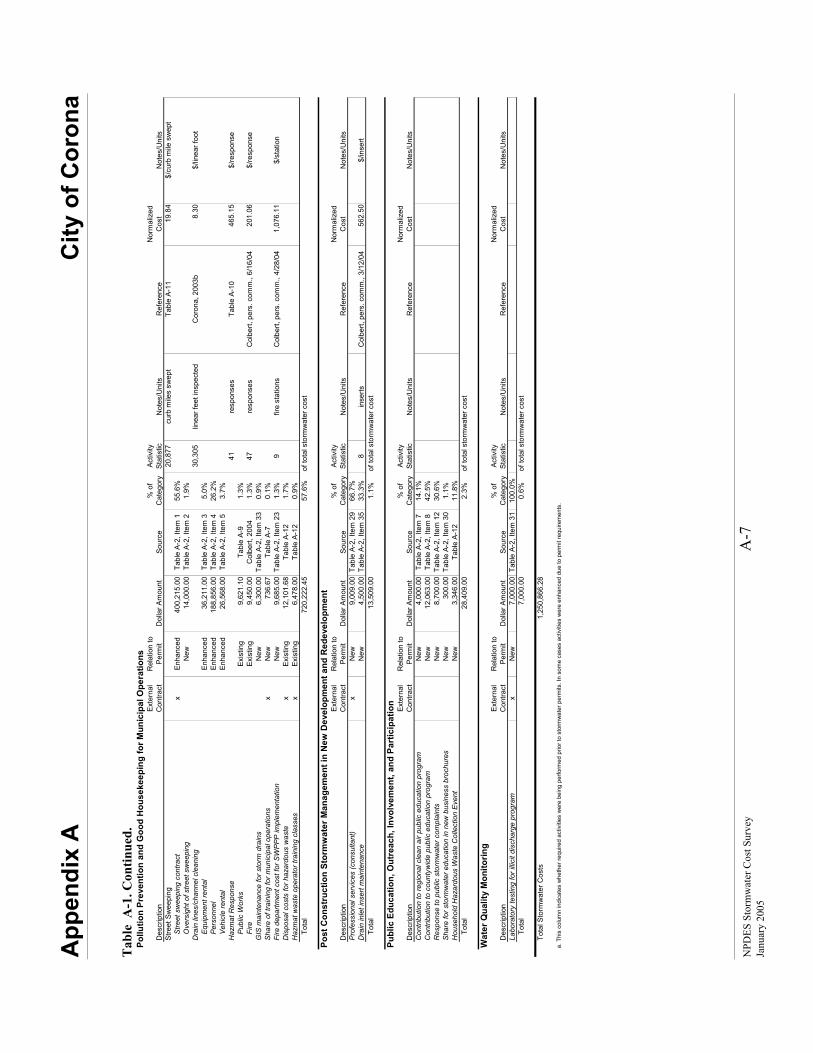
App
endi
x A
C
ity o
f Cor
ona
NPD
ES S
torm
wat
er C
ost S
urve
y A
-7
Ja
nuar
y 20
05
Tab
le A
-1. C
ontin
ued.
Po
llutio
n Pr
even
tion
and
Goo
d H
ouse
keep
ing
for M
unic
ipal
Ope
ratio
ns
Des
crip
tion
Ext
erna
l C
ontra
ctR
elat
ion
to
Per
mit
Dol
lar A
mou
ntSo
urce
% o
f C
ateg
ory
Activ
ity
Stat
istic
Not
es/U
nits
Ref
eren
ceN
orm
aliz
ed
Cos
tN
otes
/Uni
tsS
treet
Sw
eepi
ng20
,877
curb
mile
s sw
ept
Tabl
e A-
1119
.84
$/cu
rb m
ile s
wep
t
Stre
et s
wee
ping
con
tract
xEn
hanc
ed40
0,21
5.00
Tabl
e A-
2, It
em 1
55.6
%
Ove
rsig
ht o
f stre
et s
wee
ping
New
14,0
00.0
0Ta
ble
A-2,
Item
21.
9%D
rain
line
s/ch
anne
l cle
anin
g30
,305
linea
r fee
t ins
pect
edC
oron
a, 2
003b
8.30
$/lin
ear f
oot
E
quip
men
t ren
tal
Enha
nced
36,2
11.0
0Ta
ble
A-2,
Item
35.
0%
Per
sonn
el
Enha
nced
188,
856.
00Ta
ble
A-2,
Item
426
.2%
V
ehic
le re
ntal
Enha
nced
26,5
68.0
0Ta
ble
A-2,
Item
53.
7%H
azm
at R
espo
nse
41re
spon
ses
Tabl
e A-
1046
5.15
$/re
spon
se
Pub
lic W
orks
Ex
istin
g9,
621.
10Ta
ble
A-9
1.3%
Fi
re
Exis
ting
9,45
0.00
Col
bert,
200
41.
3%47
resp
onse
sC
olbe
rt, p
ers.
com
m.,
6/16
/04
201.
06$/
resp
onse
GIS
mai
nten
ance
for s
torm
dra
ins
New
6,30
0.00
Tabl
e A-
2, It
em 3
30.
9%S
hare
of t
rain
ing
for m
unic
ipal
ope
ratio
nsx
New
736.
67Ta
ble
A-7
0.1%
Fire
dep
artm
ent c
ost f
or S
WP
PP im
plem
enta
tion
New
9,68
5.00
Tabl
e A-
2, It
em 2
31.
3%9
fire
stat
ions
Col
bert,
per
s. c
omm
., 4/
28/0
41,
076.
11$/
stat
ion
Dis
posa
l cos
ts fo
r haz
ardo
us w
aste
xEx
istin
g12
,101
.68
Tabl
e A-
121.
7%H
azm
at w
aste
ope
rato
r tra
inin
g cl
asse
sx
Exis
ting
6,47
8.00
Tabl
e A-
120.
9%
Tota
l72
0,22
2.45
57.6
%
Post
Con
stru
ctio
n St
orm
wat
er M
anag
emen
t in
New
Dev
elop
men
t and
Red
evel
opm
ent
Des
crip
tion
Ext
erna
l C
ontra
ctR
elat
ion
to
Per
mit
Dol
lar A
mou
ntSo
urce
% o
f C
ateg
ory
Activ
ity
Stat
istic
Not
es/U
nits
Ref
eren
ceN
orm
aliz
ed
Cos
tN
otes
/Uni
tsP
rofe
ssio
nal s
ervi
ces
(con
sulta
nt)
xN
ew9,
009.
00Ta
ble
A-2,
Item
29
66.7
%D
rain
inle
t ins
ert m
aint
enan
ceN
ew4,
500.
00Ta
ble
A-2,
Item
35
33.3
%8
inse
rtsC
olbe
rt, p
ers.
com
m.,
3/12
/04
562.
50$/
inse
rt
Tota
l13
,509
.00
1.1%
Publ
ic E
duca
tion,
Out
reac
h, In
volv
emen
t, an
d Pa
rtic
ipat
ion
Des
crip
tion
Ext
erna
l C
ontra
ctR
elat
ion
to
Per
mit
Dol
lar A
mou
ntSo
urce
% o
f C
ateg
ory
Activ
ity
Stat
istic
Not
es/U
nits
Ref
eren
ceN
orm
aliz
ed
Cos
tN
otes
/Uni
tsC
ontri
butio
n to
regi
onal
cle
an a
ir pu
blic
edu
catio
n pr
ogra
mN
ew4,
000.
00Ta
ble
A-2,
Item
714
.1%
Con
tribu
tion
to c
ount
ywid
e pu
blic
edu
catio
n pr
ogra
mN
ew12
,063
.00
Tabl
e A-
2, It
em 8
42.5
%R
espo
nse
to p
ublic
sto
rmw
ater
com
plai
nts
New
8,70
0.00
Tabl
e A-
2, It
em 1
230
.6%
Sha
re fo
r sto
rmw
ater
edu
catio
n in
new
bus
ines
s br
ochu
res
New
300.
00Ta
ble
A-2,
Item
30
1.1%
Hou
seho
ld H
azar
dous
Was
te C
olle
ctio
n E
vent
New
3,34
6.00
Tabl
e A-
1211
.8%
To
tal
28,4
09.0
02.
3%
Wat
er Q
ualit
y M
onito
ring
Des
crip
tion
Ext
erna
l C
ontra
ctR
elat
ion
to
Per
mit
Dol
lar A
mou
ntSo
urce
% o
f C
ateg
ory
Activ
ity
Stat
istic
Not
es/U
nits
Ref
eren
ceN
orm
aliz
ed
Cos
tN
otes
/Uni
tsLa
bora
tory
test
ing
for i
llicit
disc
harg
e pr
ogra
mx
New
7,00
0.00
Tabl
e A-
2, It
em 3
110
0.0%
To
tal
7,00
0.00
0.6%
of to
tal s
torm
wat
er c
ost
Tota
l Sto
rmw
ater
Cos
ts1,
250,
866.
28
a. T
his
colu
mn
indi
cate
s w
heth
er re
quire
d ac
tiviti
es w
ere
bein
g pe
rform
ed p
rior t
o st
orm
wat
er p
erm
its. I
n so
me
case
s ac
tiviti
es w
ere
enha
nced
due
to p
erm
it re
quire
men
ts.
of to
tal s
torm
wat
er c
ost
of to
tal s
torm
wat
er c
ost
of to
tal s
torm
wat
er c
ost
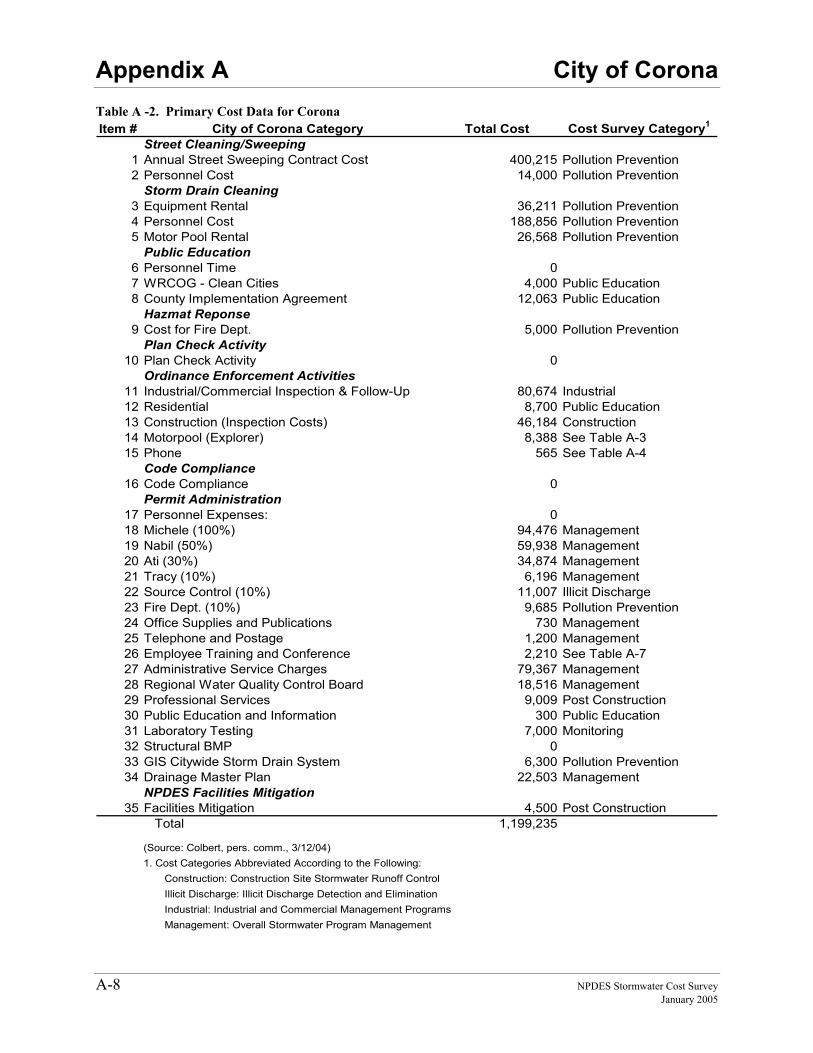
Appendix A City of Corona
A-8 NPDES Stormwater Cost Survey January 2005
Table A -2. Primary Cost Data for Corona Item # City of Corona Category Total Cost Cost Survey Category1
Street Cleaning/Sweeping1 Annual Street Sweeping Contract Cost 400,215 Pollution Prevention 2 Personnel Cost 14,000 Pollution Prevention
Storm Drain Cleaning3 Equipment Rental 36,211 Pollution Prevention 4 Personnel Cost 188,856 Pollution Prevention 5 Motor Pool Rental 26,568 Pollution Prevention
Public Education6 Personnel Time 07 WRCOG - Clean Cities 4,000 Public Education 8 County Implementation Agreement 12,063 Public Education
Hazmat Reponse9 Cost for Fire Dept. 5,000 Pollution Prevention
Plan Check Activity10 Plan Check Activity 0
Ordinance Enforcement Activities11 Industrial/Commercial Inspection & Follow-Up 80,674 Industrial12 Residential 8,700 Public Education13 Construction (Inspection Costs) 46,184 Construction14 Motorpool (Explorer) 8,388 See Table A-315 Phone 565 See Table A-4
Code Compliance16 Code Compliance 0
Permit Administration17 Personnel Expenses: 018 Michele (100%) 94,476 Management19 Nabil (50%) 59,938 Management20 Ati (30%) 34,874 Management21 Tracy (10%) 6,196 Management22 Source Control (10%) 11,007 Illicit Discharge23 Fire Dept. (10%) 9,685 Pollution Prevention24 Office Supplies and Publications 730 Management25 Telephone and Postage 1,200 Management26 Employee Training and Conference 2,210 See Table A-727 Administrative Service Charges 79,367 Management28 Regional Water Quality Control Board 18,516 Management29 Professional Services 9,009 Post Construction 30 Public Education and Information 300 Public Education31 Laboratory Testing 7,000 Monitoring32 Structural BMP 033 GIS Citywide Storm Drain System 6,300 Pollution Prevention34 Drainage Master Plan 22,503 Management
NPDES Facilities Mitigation35 Facilities Mitigation 4,500 Post Construction
Total 1,199,235
(Source: Colbert, pers. comm., 3/12/04)1. Cost Categories Abbreviated According to the Following: Construction: Construction Site Stormwater Runoff Control Illicit Discharge: Illicit Discharge Detection and Elimination Industrial: Industrial and Commercial Management Programs Management: Overall Stormwater Program Management
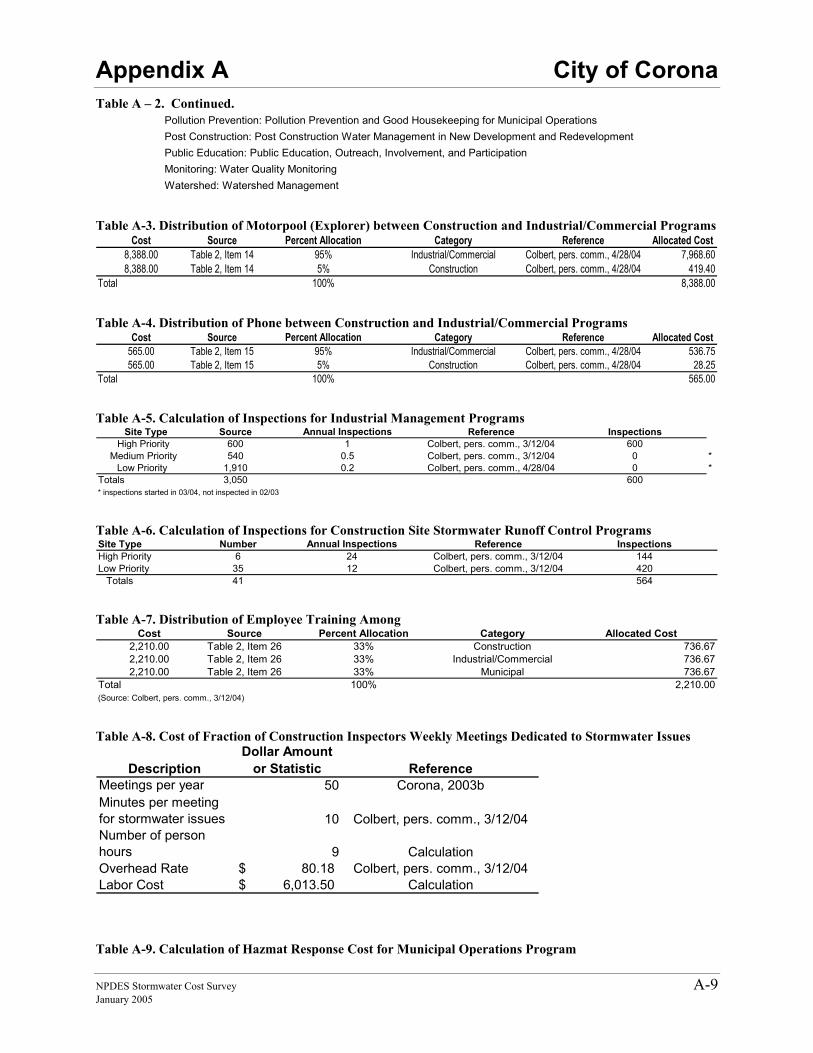
Appendix A City of Corona
NPDES Stormwater Cost Survey A-9 January 2005
Table A – 2. Continued. Pollution Prevention: Pollution Prevention and Good Housekeeping for Municipal Operations Post Construction: Post Construction Water Management in New Development and Redevelopment Public Education: Public Education, Outreach, Involvement, and Participation Monitoring: Water Quality Monitoring Watershed: Watershed Management
Table A-3. Distribution of Motorpool (Explorer) between Construction and Industrial/Commercial Programs Cost Source Percent Allocation Category Reference Allocated Cost
8,388.00 Table 2, Item 14 95% Industrial/Commercial Colbert, pers. comm., 4/28/04 7,968.608,388.00 Table 2, Item 14 5% Construction Colbert, pers. comm., 4/28/04 419.40
Total 100% 8,388.00
Table A-4. Distribution of Phone between Construction and Industrial/Commercial Programs Cost Source Percent Allocation Category Reference Allocated Cost
565.00 Table 2, Item 15 95% Industrial/Commercial Colbert, pers. comm., 4/28/04 536.75565.00 Table 2, Item 15 5% Construction Colbert, pers. comm., 4/28/04 28.25
Total 100% 565.00
Table A-5. Calculation of Inspections for Industrial Management Programs Site Type Source Annual Inspections Reference Inspections
High Priority 600 1 Colbert, pers. comm., 3/12/04 600Medium Priority 540 0.5 Colbert, pers. comm., 3/12/04 0 *
Low Priority 1,910 0.2 Colbert, pers. comm., 4/28/04 0 *Totals 3,050 600* inspections started in 03/04, not inspected in 02/03
Table A-6. Calculation of Inspections for Construction Site Stormwater Runoff Control Programs Site Type Number Annual Inspections Reference InspectionsHigh Priority 6 24 Colbert, pers. comm., 3/12/04 144Low Priority 35 12 Colbert, pers. comm., 3/12/04 420 Totals 41 564
Table A-7. Distribution of Employee Training Among Cost Source Percent Allocation Category Allocated Cost
2,210.00 Table 2, Item 26 33% Construction 736.672,210.00 Table 2, Item 26 33% Industrial/Commercial 736.672,210.00 Table 2, Item 26 33% Municipal 736.67
Total 100% 2,210.00(Source: Colbert, pers. comm., 3/12/04)
Table A-8. Cost of Fraction of Construction Inspectors Weekly Meetings Dedicated to Stormwater Issues
DescriptionDollar Amount
or Statistic ReferenceMeetings per year 50 Corona, 2003bMinutes per meeting for stormwater issues 10 Colbert, pers. comm., 3/12/04Number of person hours 9 CalculationOverhead Rate 80.18$ Colbert, pers. comm., 3/12/04Labor Cost 6,013.50$ Calculation
Table A-9. Calculation of Hazmat Response Cost for Municipal Operations Program
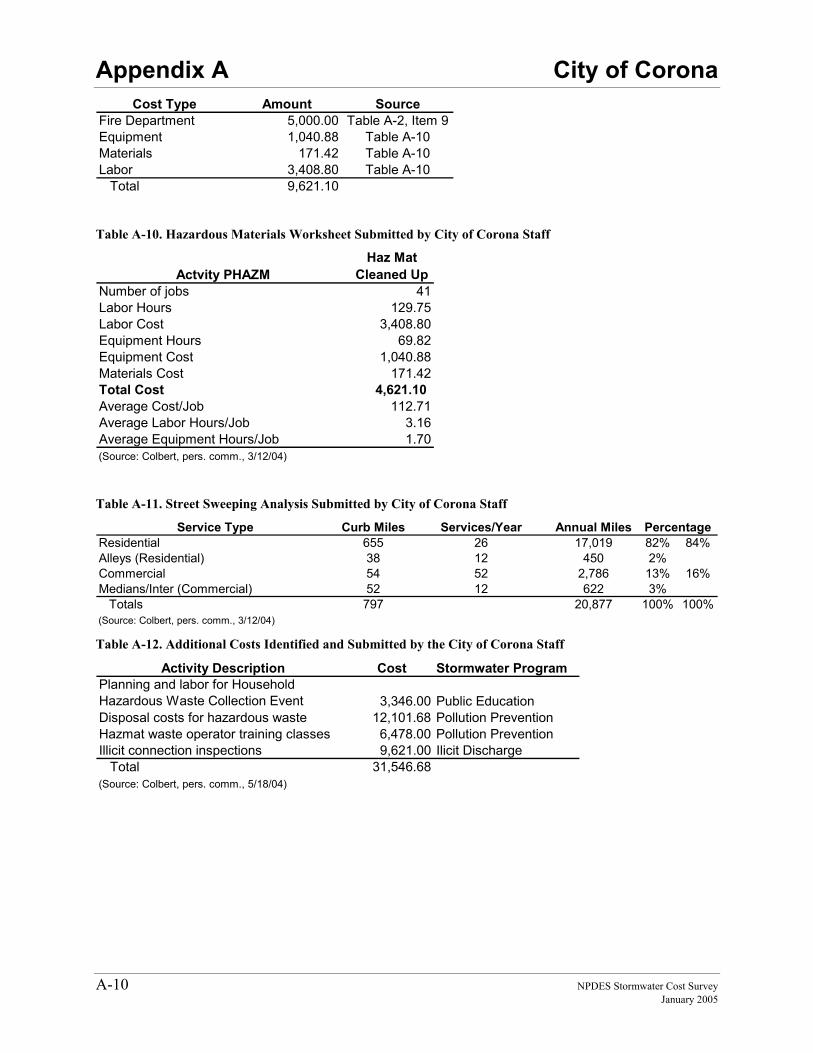
Appendix A City of Corona
A-10 NPDES Stormwater Cost Survey January 2005
Cost Type Amount SourceFire Department 5,000.00 Table A-2, Item 9Equipment 1,040.88 Table A-10Materials 171.42 Table A-10Labor 3,408.80 Table A-10 Total 9,621.10
Table A-10. Hazardous Materials Worksheet Submitted by City of Corona Staff
Actvity PHAZMHaz Mat
Cleaned UpNumber of jobs 41Labor Hours 129.75Labor Cost 3,408.80Equipment Hours 69.82Equipment Cost 1,040.88Materials Cost 171.42Total Cost 4,621.10Average Cost/Job 112.71Average Labor Hours/Job 3.16Average Equipment Hours/Job 1.70(Source: Colbert, pers. comm., 3/12/04)
Table A-11. Street Sweeping Analysis Submitted by City of Corona Staff
Service Type Curb Miles Services/Year Annual MilesResidential 655 26 17,019 82% 84%Alleys (Residential) 38 12 450 2%Commercial 54 52 2,786 13% 16%Medians/Inter (Commercial) 52 12 622 3% Totals 797 20,877 100% 100%(Source: Colbert, pers. comm., 3/12/04)
Percentage
Table A-12. Additional Costs Identified and Submitted by the City of Corona Staff
Activity Description Cost Stormwater ProgramPlanning and labor for Household Hazardous Waste Collection Event 3,346.00 Public EducationDisposal costs for hazardous waste 12,101.68 Pollution Prevention Hazmat waste operator training classes 6,478.00 Pollution Prevention Illicit connection inspections 9,621.00 Ilicit Discharge Total 31,546.68(Source: Colbert, pers. comm., 5/18/04)
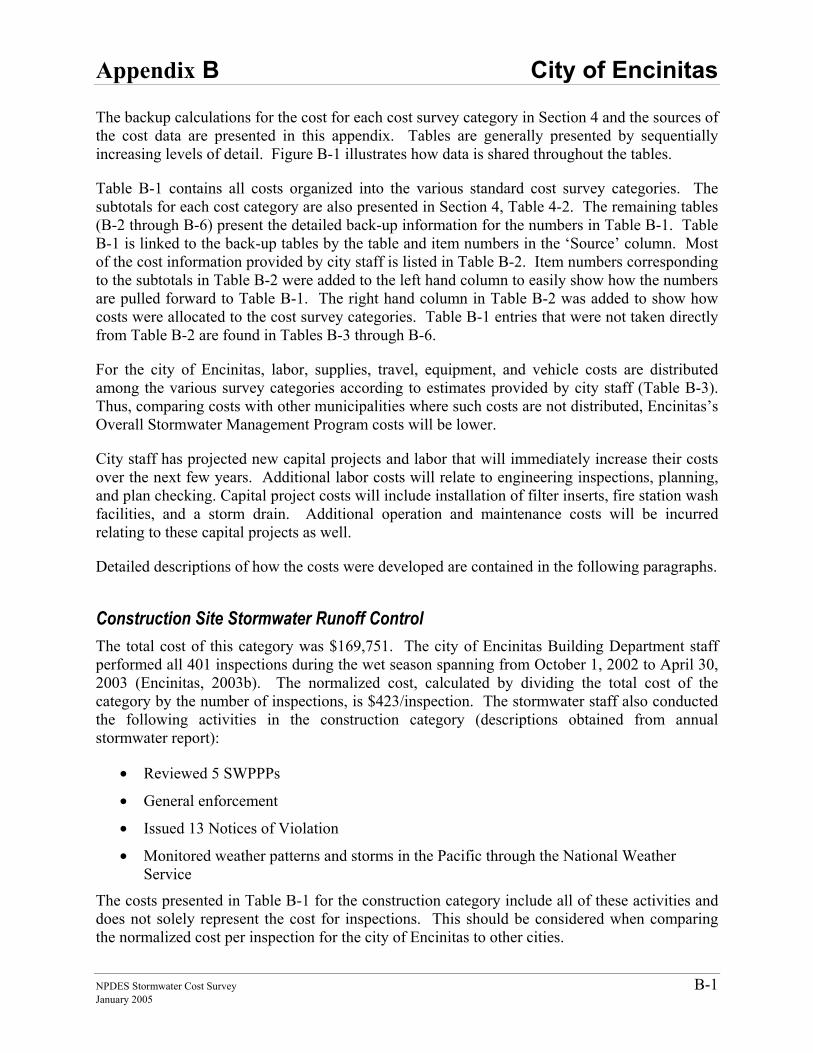
Appendix B City of Encinitas
NPDES Stormwater Cost Survey B-1 January 2005
APPENDIX B The backup calculations for the cost for each cost survey category in Section 4 and the sources of the cost data are presented in this appendix. Tables are generally presented by sequentially increasing levels of detail. Figure B-1 illustrates how data is shared throughout the tables.
Table B-1 contains all costs organized into the various standard cost survey categories. The subtotals for each cost category are also presented in Section 4, Table 4-2. The remaining tables (B-2 through B-6) present the detailed back-up information for the numbers in Table B-1. Table B-1 is linked to the back-up tables by the table and item numbers in the ‘Source’ column. Most of the cost information provided by city staff is listed in Table B-2. Item numbers corresponding to the subtotals in Table B-2 were added to the left hand column to easily show how the numbers are pulled forward to Table B-1. The right hand column in Table B-2 was added to show how costs were allocated to the cost survey categories. Table B-1 entries that were not taken directly from Table B-2 are found in Tables B-3 through B-6.
For the city of Encinitas, labor, supplies, travel, equipment, and vehicle costs are distributed among the various survey categories according to estimates provided by city staff (Table B-3). Thus, comparing costs with other municipalities where such costs are not distributed, Encinitas’s Overall Stormwater Management Program costs will be lower.
City staff has projected new capital projects and labor that will immediately increase their costs over the next few years. Additional labor costs will relate to engineering inspections, planning, and plan checking. Capital project costs will include installation of filter inserts, fire station wash facilities, and a storm drain. Additional operation and maintenance costs will be incurred relating to these capital projects as well.
Detailed descriptions of how the costs were developed are contained in the following paragraphs.
Construction Site Stormwater Runoff Control The total cost of this category was $169,751. The city of Encinitas Building Department staff performed all 401 inspections during the wet season spanning from October 1, 2002 to April 30, 2003 (Encinitas, 2003b). The normalized cost, calculated by dividing the total cost of the category by the number of inspections, is $423/inspection. The stormwater staff also conducted the following activities in the construction category (descriptions obtained from annual stormwater report):
• Reviewed 5 SWPPPs
• General enforcement
• Issued 13 Notices of Violation
• Monitored weather patterns and storms in the Pacific through the National Weather Service
The costs presented in Table B-1 for the construction category include all of these activities and does not solely represent the cost for inspections. This should be considered when comparing the normalized cost per inspection for the city of Encinitas to other cities.
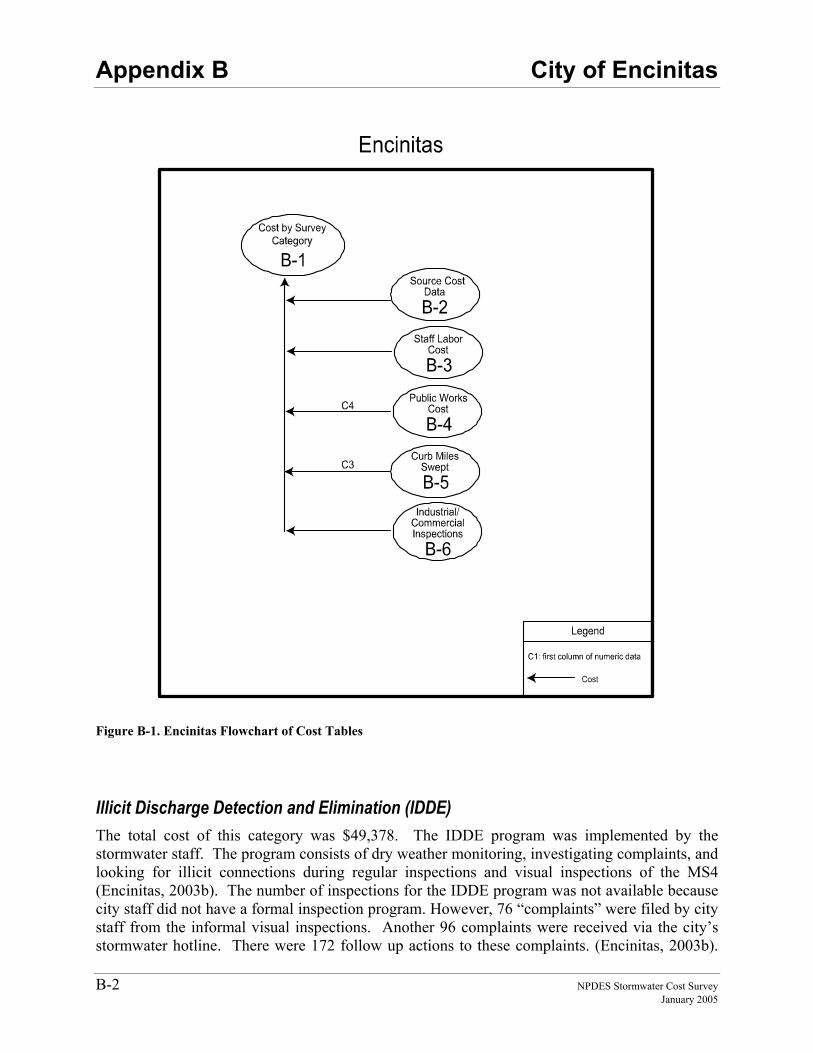
Appendix B City of Encinitas
B-2 NPDES Stormwater Cost Survey January 2005
Figure B-1. Encinitas Flowchart of Cost Tables
Illicit Discharge Detection and Elimination (IDDE) The total cost of this category was $49,378. The IDDE program was implemented by the stormwater staff. The program consists of dry weather monitoring, investigating complaints, and looking for illicit connections during regular inspections and visual inspections of the MS4 (Encinitas, 2003b). The number of inspections for the IDDE program was not available because city staff did not have a formal inspection program. However, 76 “complaints” were filed by city staff from the informal visual inspections. Another 96 complaints were received via the city’s stormwater hotline. There were 172 follow up actions to these complaints. (Encinitas, 2003b).
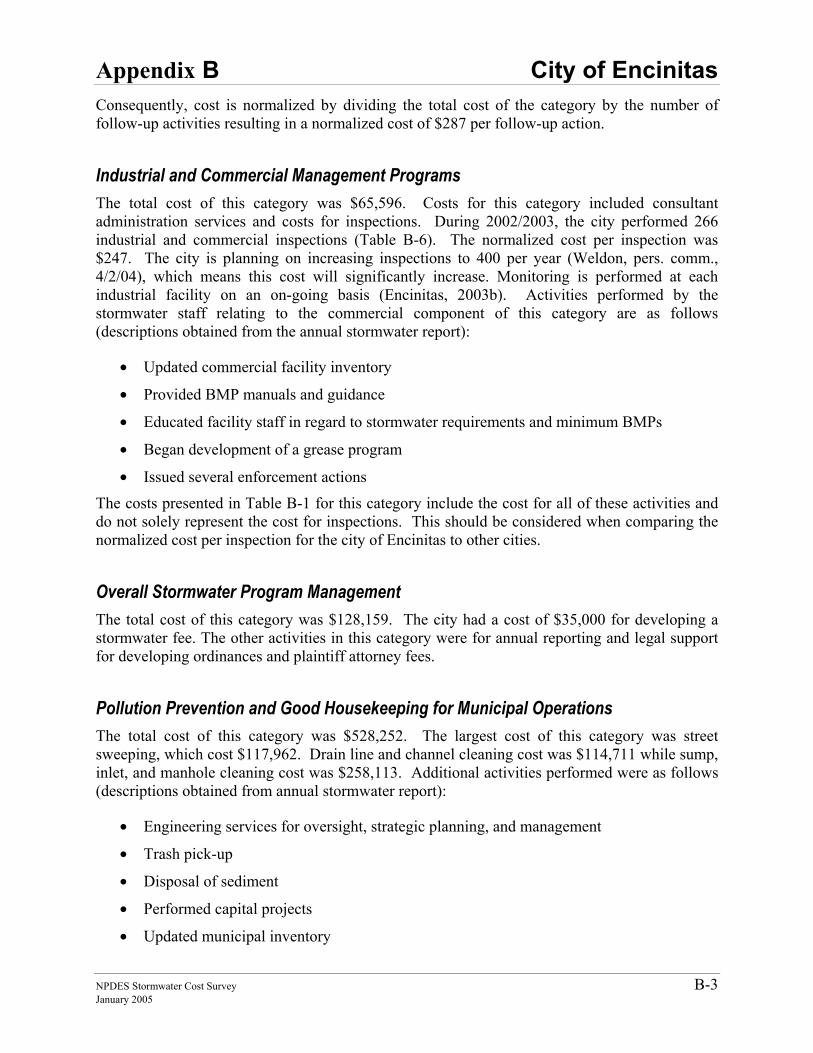
Appendix B City of Encinitas
NPDES Stormwater Cost Survey B-3 January 2005
Consequently, cost is normalized by dividing the total cost of the category by the number of follow-up activities resulting in a normalized cost of $287 per follow-up action.
Industrial and Commercial Management Programs The total cost of this category was $65,596. Costs for this category included consultant administration services and costs for inspections. During 2002/2003, the city performed 266 industrial and commercial inspections (Table B-6). The normalized cost per inspection was $247. The city is planning on increasing inspections to 400 per year (Weldon, pers. comm., 4/2/04), which means this cost will significantly increase. Monitoring is performed at each industrial facility on an on-going basis (Encinitas, 2003b). Activities performed by the stormwater staff relating to the commercial component of this category are as follows (descriptions obtained from the annual stormwater report):
• Updated commercial facility inventory
• Provided BMP manuals and guidance
• Educated facility staff in regard to stormwater requirements and minimum BMPs
• Began development of a grease program
• Issued several enforcement actions
The costs presented in Table B-1 for this category include the cost for all of these activities and do not solely represent the cost for inspections. This should be considered when comparing the normalized cost per inspection for the city of Encinitas to other cities.
Overall Stormwater Program Management The total cost of this category was $128,159. The city had a cost of $35,000 for developing a stormwater fee. The other activities in this category were for annual reporting and legal support for developing ordinances and plaintiff attorney fees.
Pollution Prevention and Good Housekeeping for Municipal Operations The total cost of this category was $528,252. The largest cost of this category was street sweeping, which cost $117,962. Drain line and channel cleaning cost was $114,711 while sump, inlet, and manhole cleaning cost was $258,113. Additional activities performed were as follows (descriptions obtained from annual stormwater report):
• Engineering services for oversight, strategic planning, and management
• Trash pick-up
• Disposal of sediment
• Performed capital projects
• Updated municipal inventory
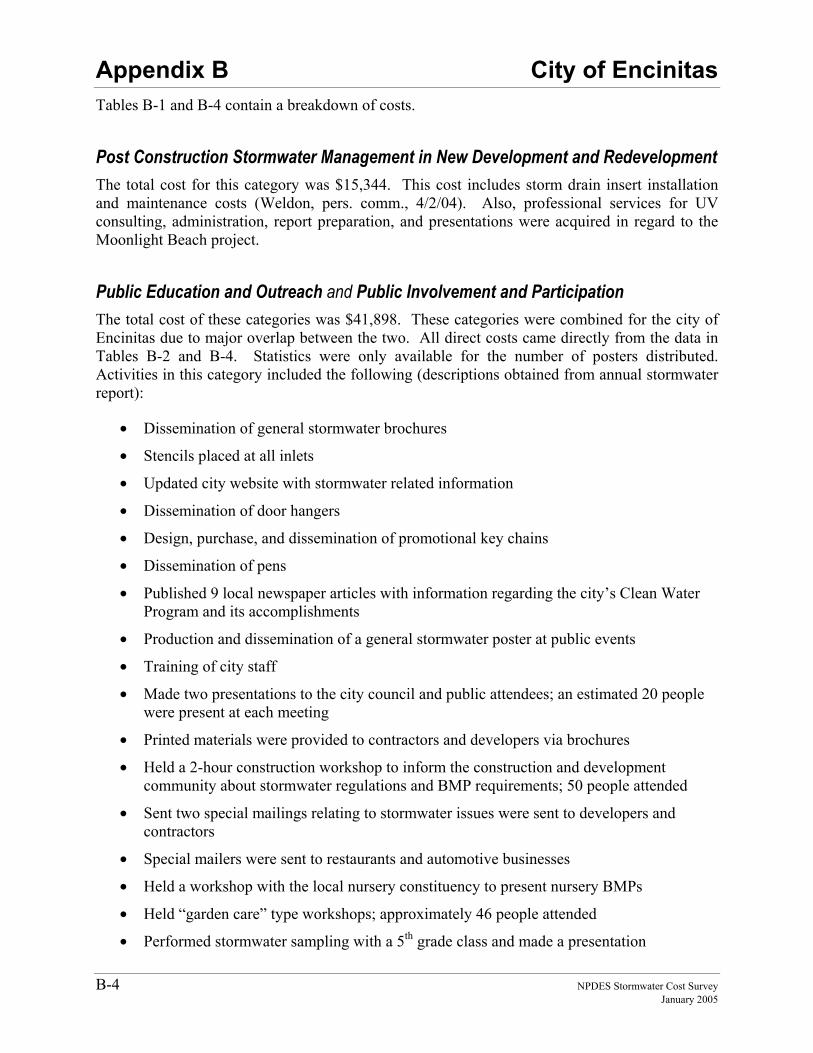
Appendix B City of Encinitas
B-4 NPDES Stormwater Cost Survey January 2005
Tables B-1 and B-4 contain a breakdown of costs.
Post Construction Stormwater Management in New Development and Redevelopment The total cost for this category was $15,344. This cost includes storm drain insert installation and maintenance costs (Weldon, pers. comm., 4/2/04). Also, professional services for UV consulting, administration, report preparation, and presentations were acquired in regard to the Moonlight Beach project.
Public Education and Outreach and Public Involvement and Participation The total cost of these categories was $41,898. These categories were combined for the city of Encinitas due to major overlap between the two. All direct costs came directly from the data in Tables B-2 and B-4. Statistics were only available for the number of posters distributed. Activities in this category included the following (descriptions obtained from annual stormwater report):
• Dissemination of general stormwater brochures
• Stencils placed at all inlets
• Updated city website with stormwater related information
• Dissemination of door hangers
• Design, purchase, and dissemination of promotional key chains
• Dissemination of pens
• Published 9 local newspaper articles with information regarding the city’s Clean Water Program and its accomplishments
• Production and dissemination of a general stormwater poster at public events
• Training of city staff
• Made two presentations to the city council and public attendees; an estimated 20 people were present at each meeting
• Printed materials were provided to contractors and developers via brochures
• Held a 2-hour construction workshop to inform the construction and development community about stormwater regulations and BMP requirements; 50 people attended
• Sent two special mailings relating to stormwater issues were sent to developers and contractors
• Special mailers were sent to restaurants and automotive businesses
• Held a workshop with the local nursery constituency to present nursery BMPs
• Held “garden care” type workshops; approximately 46 people attended
• Performed stormwater sampling with a 5th grade class and made a presentation
Appendix B City of Encinitas
NPDES Stormwater Cost Survey B-5 January 2005
• Presented the watershed model to a 3rd grade class; approximately 200 children participated in the presentation
• Initiated a collaborative workgroup of several cities in the North County to develop educational outreach products and approaches on a watershed basis
• Held commercial business workshops
• Participated in a public opinion survey
• Held several community events
Water Quality Monitoring The total cost for this category was $76,262. Costs were not normalized because they vary according to type of water quality analysis performed.
Watershed Management The total cost for this category was $12,400. These costs consisted of watershed plan development costs and stormwater staff labor costs.
References City of Encinitas, 2003. “City of Encinitas Stormwater Annual Report” 2003
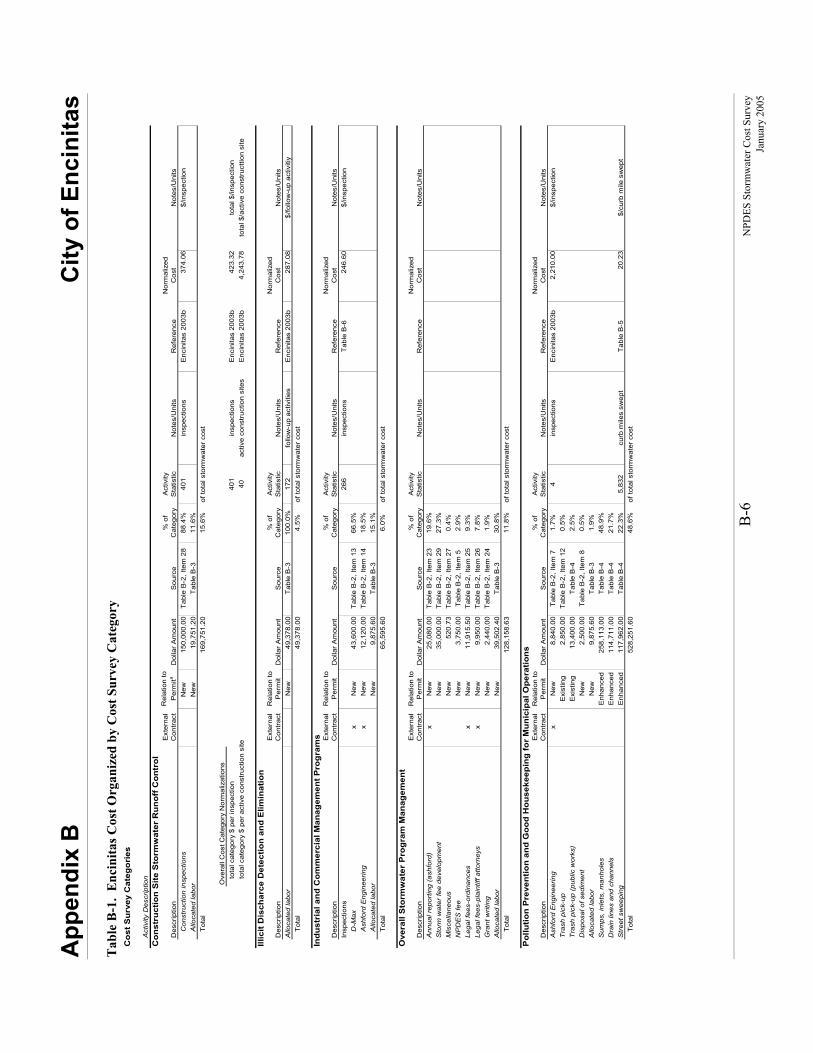
App
endi
x B
C
ity o
f Enc
inita
s
B
-6
NPD
ES S
torm
wat
er C
ost S
urve
y
Ja
nuar
y 20
05
Tab
le B
-1.
Enc
inita
s Cos
t Org
aniz
ed b
y C
ost S
urve
y C
ateg
ory
Cos
t Sur
vey
Cat
egor
ies
Act
ivity
Des
crip
tion
Con
stru
ctio
n S
ite S
torm
wat
er R
unof
f Con
trol
Des
crip
tion
Ext
erna
l C
ontr
act
Rel
atio
n to
P
erm
itaD
olla
r A
mou
ntS
ourc
e%
of
Cat
egor
yA
ctiv
ity
Sta
tistic
Not
es/U
nits
Ref
eren
ceN
orm
aliz
ed
Cos
tN
otes
/Uni
ts
Con
stru
ctio
n in
spec
tions
New
15
0,00
0.00
Tab
le B
-2, I
tem
28
88.4
%40
1in
spec
tions
Enc
inita
s 20
03b
374.
06$/
insp
ectio
n
Allo
cate
d la
bor
New
19
,751
.20
Tab
le B
-311
.6%
T
otal
169,
751.
2015
.6%
of to
tal s
torm
wat
er c
ost
Ove
rall
Cos
t Cat
egor
y N
orm
aliz
atio
ns
tota
l cat
egor
y $
per
insp
ectio
n
401
insp
ectio
nsE
ncin
itas
2003
b42
3.32
tota
l $/in
spec
tion
to
tal c
ateg
ory
$ pe
r ac
tive
cons
truc
tion
site
40ac
tive
cons
truc
tion
site
sE
ncin
itas
2003
b4,
243.
78to
tal $
/act
ive
cons
truc
ttion
site
Illic
it D
isch
arce
Det
ectio
n an
d E
limin
atio
n
Des
crip
tion
Ext
erna
l C
ontr
act
Rel
atio
n to
P
erm
itD
olla
r A
mou
ntS
ourc
e%
of
Cat
egor
yA
ctiv
ity
Sta
tistic
Not
es/U
nits
Ref
eren
ceN
orm
aliz
ed
Cos
tN
otes
/Uni
tsA
lloca
ted
labo
r N
ew49
,378
.00
Tab
le B
-310
0.0%
172
follo
w-u
p ac
tiviti
esE
ncin
itas
2003
b28
7.08
$/fo
llow
-up
activ
itiy
T
otal
49,3
78.0
04.
5%
Indu
stri
al a
nd C
omm
erci
al M
anag
emen
t Pro
gram
s
Des
crip
tion
Ext
erna
l C
ontr
act
Rel
atio
n to
P
erm
itD
olla
r A
mou
ntS
ourc
e%
of
Cat
egor
yA
ctiv
ity
Sta
tistic
Not
es/U
nits
Ref
eren
ceN
orm
aliz
ed
Cos
tN
otes
/Uni
tsIn
spec
tions
266
insp
ectio
nsT
able
B-6
246.
60$/
insp
ectio
n
D-M
axx
New
43,6
00.0
0T
able
B-2
, Ite
m 1
366
.5%
A
shfo
rd E
ngin
eerin
gx
New
12,1
20.0
0T
able
B-2
, Ite
m 1
418
.5%
A
lloca
ted
labo
rN
ew9,
875.
60T
able
B-3
15.1
%
Tot
al65
,595
.60
6.0%
Ove
rall
Sto
rmw
ater
Pro
gram
Man
agem
ent
Des
crip
tion
Ext
erna
l C
ontr
act
Rel
atio
n to
P
erm
itD
olla
r A
mou
ntS
ourc
e%
of
Cat
egor
yA
ctiv
ity
Sta
tistic
Not
es/U
nits
Ref
eren
ceN
orm
aliz
ed
Cos
tN
otes
/Uni
tsA
nnua
l rep
ortin
g (a
shfo
rd)
xN
ew25
,080
.00
Tab
le B
-2, I
tem
23
19.6
%S
torm
wat
er fe
e de
velo
pmen
tN
ew35
,000
.00
Tab
le B
-2, I
tem
29
27.3
%M
isce
llane
ous
New
520.
73T
able
B-2
, Ite
m 2
70.
4%N
PD
ES
fee
New
3,75
0.00
Tab
le B
-2, I
tem
52.
9%Le
gal f
ees-
ordi
nanc
esx
New
11,9
15.5
0T
able
B-2
, Ite
m 2
59.
3%Le
gal f
ees-
plai
ntiff
atto
rney
sx
New
9,95
0.00
Tab
le B
-2, I
tem
26
7.8%
Gra
nt w
ritin
gN
ew2,
440.
00T
able
B-2
, Ite
m 2
41.
9%A
lloca
ted
labo
rN
ew39
,502
.40
Tab
le B
-330
.8%
T
otal
128,
158.
6311
.8%
Pol
lutio
n P
reve
ntio
n an
d G
ood
Hou
seke
epin
g fo
r M
unic
ipal
Ope
ratio
ns
Des
crip
tion
Ext
erna
l C
ontr
act
Rel
atio
n to
P
erm
itD
olla
r A
mou
ntS
ourc
e%
of
Cat
egor
yA
ctiv
ity
Sta
tistic
Not
es/U
nits
Ref
eren
ceN
orm
aliz
ed
Cos
tN
otes
/Uni
tsA
shfo
rd E
ngin
eerin
gx
New
8,84
0.00
Tab
le B
-2, I
tem
71.
7%4
insp
ectio
nsE
ncin
itas
2003
b2,
210.
00$/
insp
ectio
nT
rash
pic
k-up
Exi
stin
g2,
850.
00T
able
B-2
, Ite
m 1
20.
5%T
rash
pic
k-up
(pu
blic
wor
ks)
Exi
stin
g13
,400
.00
Tab
le B
-42.
5%D
ispo
sal o
f sed
imen
tN
ew2,
500.
00T
able
B-2
, Ite
m 8
0.5%
Allo
cate
d la
bor
New
9,87
5.60
Tab
le B
-31.
9%S
umps
, inl
ets,
man
hole
s E
nhan
ced
258,
113.
00T
able
B-4
48.9
%D
rain
line
s an
d ch
anne
lsE
nhan
ced
114,
711.
00T
able
B-4
21.7
%S
tree
t sw
eepi
ngE
nhan
ced
117,
962.
00T
able
B-4
22.3
%5,
832
curb
mile
s sw
ept
Tab
le B
-520
.23
$/cu
rb m
ile s
wep
t
Tot
al52
8,25
1.60
48.6
%
of to
tal s
torm
wat
er c
ost
of to
tal s
torm
wat
er c
ost
of to
tal s
torm
wat
er c
ost
of to
tal s
torm
wat
er c
ost
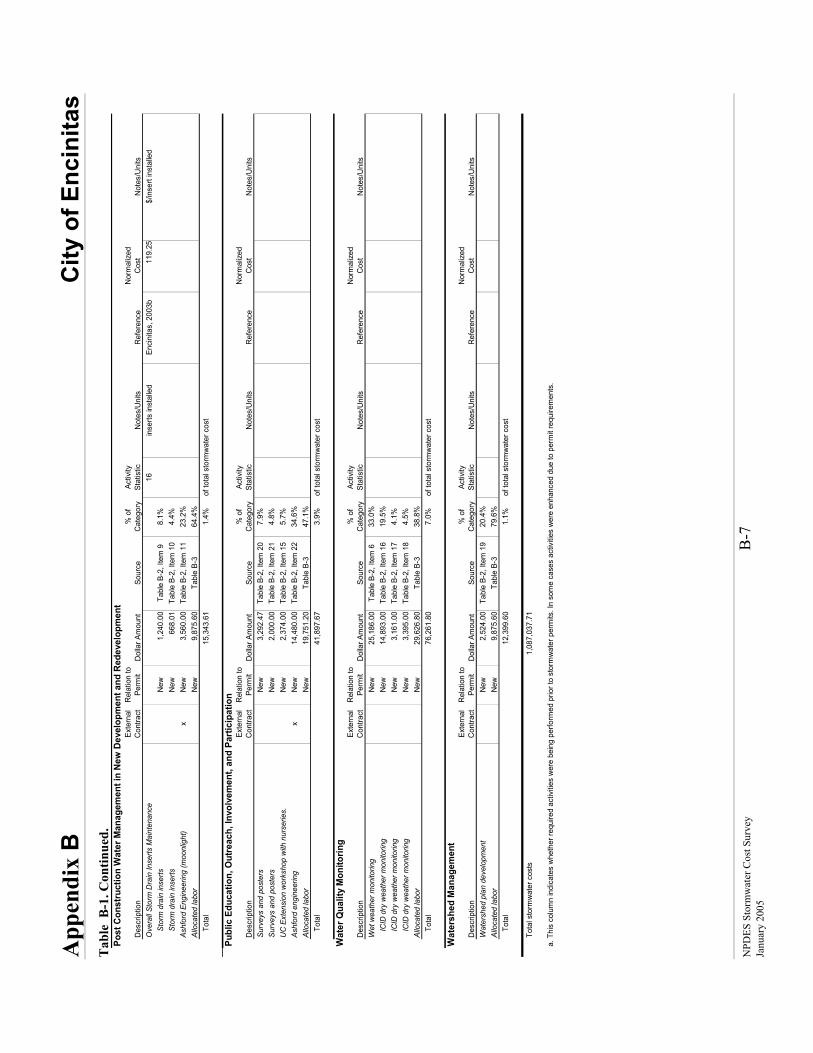
App
endi
x B
C
ity o
f Enc
inita
s
NPD
ES S
torm
wat
er C
ost S
urve
y B
-7
Ja
nuar
y 20
05
Tab
le B
-1. C
ontin
ued.
Po
st C
onst
ruct
ion
Wat
er M
anag
emen
t in
New
Dev
elop
men
t and
Red
evel
opm
ent
Des
crip
tion
Exte
rnal
C
ontra
ctR
elat
ion
to
Perm
itD
olla
r Am
ount
Sour
ce%
of
Cat
egor
yAc
tivity
St
atis
ticN
otes
/Uni
tsR
efer
ence
Nor
mal
ized
C
ost
Not
es/U
nits
Ove
rall
Stor
m D
rain
Inse
rts M
aint
enan
ce16
inse
rts in
stal
led
Enci
nita
s, 2
003b
119.
25$/
inse
rt in
stal
led
St
orm
dra
in in
serts
New
1,24
0.00
Tabl
e B-
2, It
em 9
8.1%
St
orm
dra
in in
serts
New
668.
01Ta
ble
B-2,
Item
10
4.4%
Ashf
ord
Engi
neer
ing
(moo
nlig
ht)
xN
ew3,
560.
00Ta
ble
B-2,
Item
11
23.2
%Al
loca
ted
labo
rN
ew9,
875.
60Ta
ble
B-3
64.4
%
Tota
l15
,343
.61
1.4%
Publ
ic E
duca
tion,
Out
reac
h, In
volv
emen
t, an
d Pa
rtici
patio
n
Des
crip
tion
Exte
rnal
C
ontra
ctR
elat
ion
to
Perm
itD
olla
r Am
ount
Sour
ce%
of
Cat
egor
yAc
tivity
St
atis
ticN
otes
/Uni
tsR
efer
ence
Nor
mal
ized
C
ost
Not
es/U
nits
Surv
eys
and
post
ers
New
3,29
2.47
Tabl
e B-
2, It
em 2
07.
9%Su
rvey
s an
d po
ster
sN
ew2,
000.
00Ta
ble
B-2,
Item
21
4.8%
UC
Ext
ensi
on w
orks
hop
with
nur
serie
s.
New
2,37
4.00
Tabl
e B-
2, It
em 1
55.
7%As
hfor
d en
gine
erin
gx
New
14,4
80.0
0Ta
ble
B-2,
Item
22
34.6
%Al
loca
ted
labo
r N
ew19
,751
.20
Tabl
e B-
347
.1%
To
tal
41,8
97.6
73.
9%
Wat
er Q
ualit
y M
onito
ring
Des
crip
tion
Exte
rnal
C
ontra
ctR
elat
ion
to
Perm
itD
olla
r Am
ount
Sour
ce%
of
Cat
egor
yAc
tivity
St
atis
ticN
otes
/Uni
tsR
efer
ence
Nor
mal
ized
C
ost
Not
es/U
nits
Wet
wea
ther
mon
itorin
gN
ew25
,186
.00
Tabl
e B-
2, It
em 6
33.0
%
ICID
dry
wea
ther
mon
itorin
gN
ew14
,893
.00
Tabl
e B-
2, It
em 1
619
.5%
IC
ID d
ry w
eath
er m
onito
ring
New
3,16
1.00
Tabl
e B-
2, It
em 1
74.
1%
ICID
dry
wea
ther
mon
itorin
gN
ew3,
395.
00Ta
ble
B-2,
Item
18
4.5%
Allo
cate
d la
bor
New
29,6
26.8
0Ta
ble
B-3
38.8
%
Tota
l76
,261
.80
7.0%
Wat
ersh
ed M
anag
emen
t
Des
crip
tion
Exte
rnal
C
ontra
ctR
elat
ion
to
Perm
itD
olla
r Am
ount
Sour
ce%
of
Cat
egor
yAc
tivity
St
atis
ticN
otes
/Uni
tsR
efer
ence
Nor
mal
ized
C
ost
Not
es/U
nits
Wat
ersh
ed p
lan
deve
lopm
ent
New
2,52
4.00
Tabl
e B-
2, It
em 1
920
.4%
Allo
cate
d la
bor
New
9,87
5.60
Tabl
e B-
379
.6%
To
tal
12,3
99.6
01.
1%
Tota
l sto
rmw
ater
cos
ts1,
087,
037.
71
a. T
his
colu
mn
indi
cate
s w
heth
er re
quire
d ac
tiviti
es w
ere
bein
g pe
rform
ed p
rior t
o st
orm
wat
er p
erm
its. I
n so
me
case
s ac
tiviti
es w
ere
enha
nced
due
to p
erm
it re
quire
men
ts.
of to
tal s
torm
wat
er c
ost
of to
tal s
torm
wat
er c
ost
of to
tal s
torm
wat
er c
ost
of to
tal s
torm
wat
er c
ost
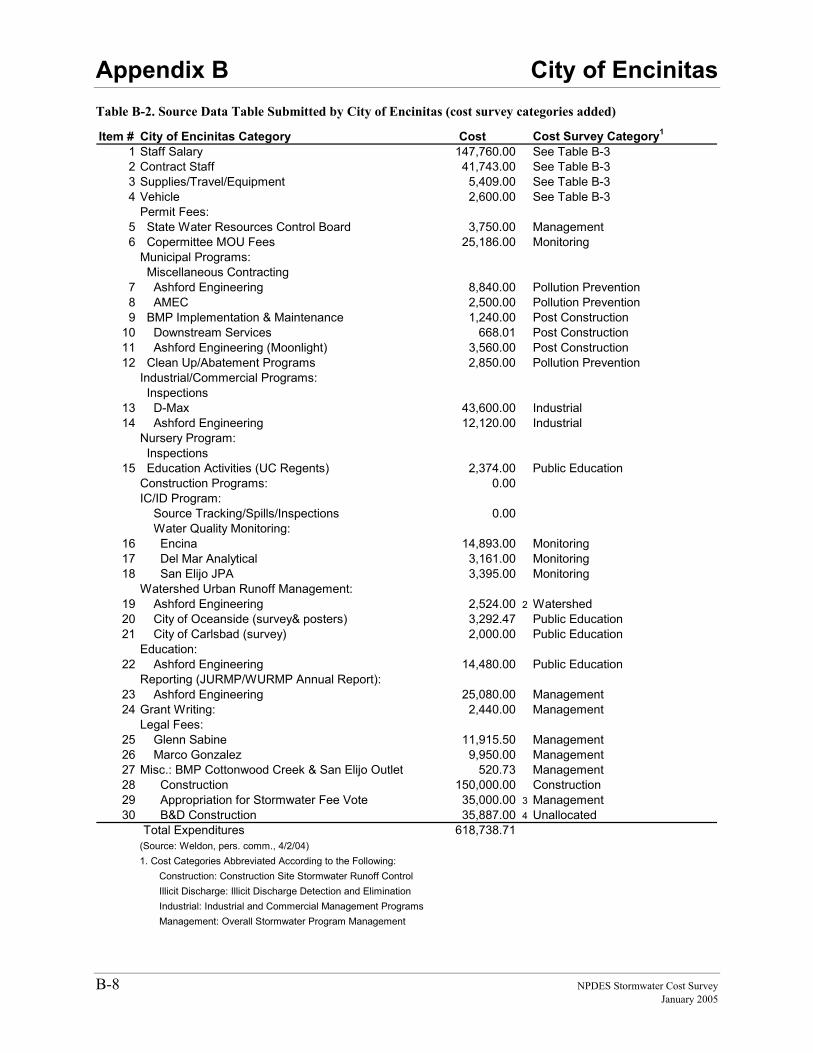
Appendix B City of Encinitas
B-8 NPDES Stormwater Cost Survey January 2005
Table B-2. Source Data Table Submitted by City of Encinitas (cost survey categories added)
Item # City of Encinitas Category Cost Cost Survey Category1
1 Staff Salary 147,760.00 See Table B-32 Contract Staff 41,743.00 See Table B-33 Supplies/Travel/Equipment 5,409.00 See Table B-34 Vehicle 2,600.00 See Table B-3
Permit Fees:5 State Water Resources Control Board 3,750.00 Management6 Copermittee MOU Fees 25,186.00 Monitoring
Municipal Programs: Miscellaneous Contracting
7 Ashford Engineering 8,840.00 Pollution Prevention 8 AMEC 2,500.00 Pollution Prevention 9 BMP Implementation & Maintenance 1,240.00 Post Construction
10 Downstream Services 668.01 Post Construction 11 Ashford Engineering (Moonlight) 3,560.00 Post Construction 12 Clean Up/Abatement Programs 2,850.00 Pollution Prevention
Industrial/Commercial Programs: Inspections
13 D-Max 43,600.00 Industrial 14 Ashford Engineering 12,120.00 Industrial
Nursery Program: Inspections
15 Education Activities (UC Regents) 2,374.00 Public EducationConstruction Programs: 0.00IC/ID Program: Source Tracking/Spills/Inspections 0.00 Water Quality Monitoring:
16 Encina 14,893.00 Monitoring17 Del Mar Analytical 3,161.00 Monitoring18 San Elijo JPA 3,395.00 Monitoring
Watershed Urban Runoff Management:19 Ashford Engineering 2,524.00 2 Watershed20 City of Oceanside (survey& posters) 3,292.47 Public Education21 City of Carlsbad (survey) 2,000.00 Public Education
Education:22 Ashford Engineering 14,480.00 Public Education
Reporting (JURMP/WURMP Annual Report):23 Ashford Engineering 25,080.00 Management24 Grant Writing: 2,440.00 Management
Legal Fees:25 Glenn Sabine 11,915.50 Management26 Marco Gonzalez 9,950.00 Management27 Misc.: BMP Cottonwood Creek & San Elijo Outlet 520.73 Management28 Construction 150,000.00 Construction29 Appropriation for Stormwater Fee Vote 35,000.00 3 Management30 B&D Construction 35,887.00 4 Unallocated
Total Expenditures 618,738.71(Source: Weldon, pers. comm., 4/2/04)1. Cost Categories Abbreviated According to the Following: Construction: Construction Site Stormwater Runoff Control Illicit Discharge: Illicit Discharge Detection and Elimination Industrial: Industrial and Commercial Management Programs Management: Overall Stormwater Program Management
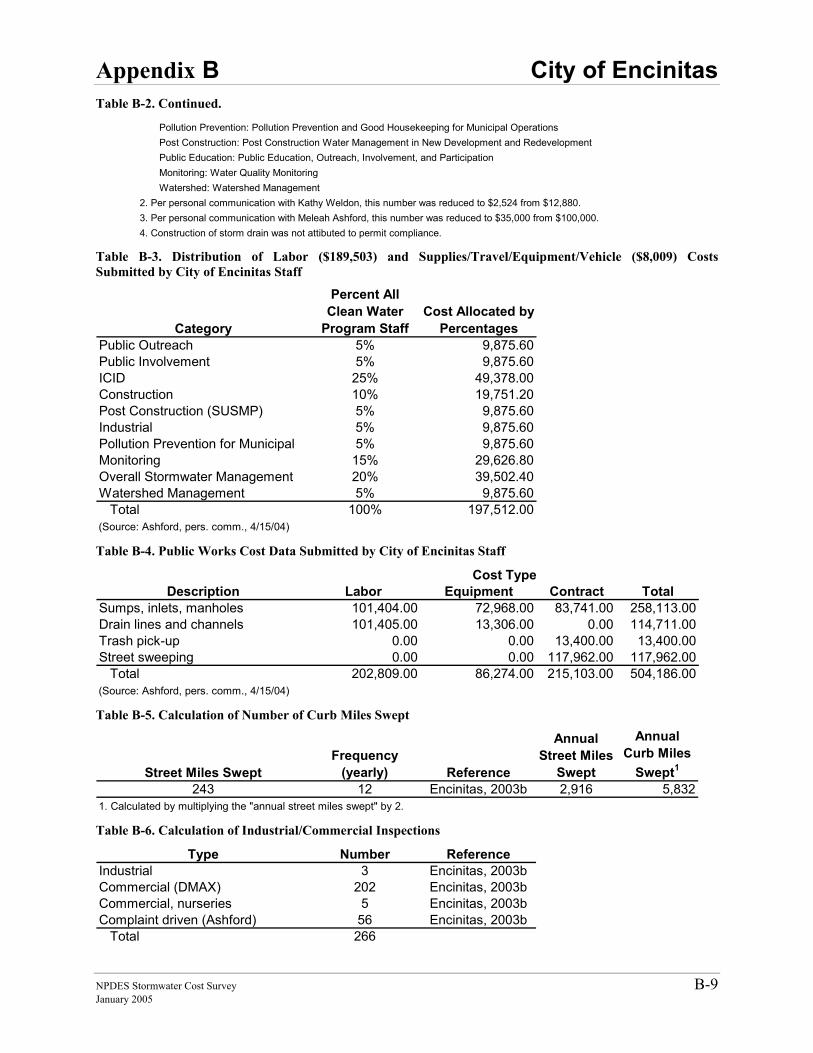
Appendix B City of Encinitas
NPDES Stormwater Cost Survey B-9 January 2005
Table B-2. Continued.
Pollution Prevention: Pollution Prevention and Good Housekeeping for Municipal Operations Post Construction: Post Construction Water Management in New Development and Redevelopment Public Education: Public Education, Outreach, Involvement, and Participation Monitoring: Water Quality Monitoring Watershed: Watershed Management2. Per personal communication with Kathy Weldon, this number was reduced to $2,524 from $12,880.3. Per personal communication with Meleah Ashford, this number was reduced to $35,000 from $100,000.4. Construction of storm drain was not attibuted to permit compliance.
Table B-3. Distribution of Labor ($189,503) and Supplies/Travel/Equipment/Vehicle ($8,009) Costs Submitted by City of Encinitas Staff
Category
Percent All Clean Water
Program StaffCost Allocated by
PercentagesPublic Outreach 5% 9,875.60Public Involvement 5% 9,875.60ICID 25% 49,378.00Construction 10% 19,751.20Post Construction (SUSMP) 5% 9,875.60Industrial 5% 9,875.60Pollution Prevention for Municipal 5% 9,875.60Monitoring 15% 29,626.80Overall Stormwater Management 20% 39,502.40Watershed Management 5% 9,875.60 Total 100% 197,512.00(Source: Ashford, pers. comm., 4/15/04) Table B-4. Public Works Cost Data Submitted by City of Encinitas Staff
Description Labor Equipment Contract TotalSumps, inlets, manholes 101,404.00 72,968.00 83,741.00 258,113.00Drain lines and channels 101,405.00 13,306.00 0.00 114,711.00Trash pick-up 0.00 0.00 13,400.00 13,400.00Street sweeping 0.00 0.00 117,962.00 117,962.00 Total 202,809.00 86,274.00 215,103.00 504,186.00(Source: Ashford, pers. comm., 4/15/04)
Cost Type
Table B-5. Calculation of Number of Curb Miles Swept
Street Miles SweptFrequency
(yearly) Reference
Annual Street Miles
Swept
Annual Curb Miles
Swept1
243 12 Encinitas, 2003b 2,916 5,8321. Calculated by multiplying the "annual street miles swept" by 2. Table B-6. Calculation of Industrial/Commercial Inspections
Type Number ReferenceIndustrial 3 Encinitas, 2003bCommercial (DMAX) 202 Encinitas, 2003bCommercial, nurseries 5 Encinitas, 2003bComplaint driven (Ashford) 56 Encinitas, 2003b Total 266

Appendix C City of Fremont
NPDES Stormwater Cost Survey C-1 January 2005
APPENDIX C The backup calculations for the cost for each cost survey category in Section 5 and the sources of the cost data are presented in this appendix. Tables generally are presented by sequentially increasing levels of detail. Figure C-1 illustrates how data is shared throughout the tables.
Table C-1 contains all costs organized into the various standard cost survey categories. The subtotals for each cost category are also presented in Section 5, Table 5-2. The remaining tables (C-2 through C-5) present the detailed back-up information for the numbers in Table C-1. Table C-1 is linked to the back-up tables by the table and item numbers in the ‘Source’ column. Most of the cost information provided by city staff is listed in Table C-2. Item numbers corresponding to the subtotals in Table C-2 were added to the left hand column to easily show how the numbers are pulled forward to Table C-1. The right hand column in Table C-2 was added to show how costs were allocated to the cost survey categories. Table C-1 entries that were not taken directly from Table C-2 are found in Tables C-3 through C-5.
Table C-1 also provides statistics describing the level of effort for certain activities by numerically representing what or how much was accomplished. References are provided within Table C-1 for the activity statistics. Where relevant statistics are available, normalized costs are calculated in Table C-1. Normalized costs are calculated by dividing the cost of the category or activity by the activity statistic.
For the city of Fremont, labor costs of the stormwater staff are not distributed among the various survey categories. Instead, it is all captured under Overall Stormwater Program Management. Thus, comparing costs with other municipalities where such costs are distributed, Fremont’s Overall Stormwater Management Program costs will be higher.
The Union Sanitation District (USD) is under contract with the city of Fremont to provide facility and illicit discharge services, construction inspections, public education, countywide clean water program meeting participation, reports, database, and vehicles. The breakdown of the USD cost is presented in Table C-4.
The contribution made to the Alameda County Clean Water Program (ACCWP) was allocated according to Table C-5. Table C-5 has the total cost of the ACCWP broken into stormwater program categories. ACCWP supports subcommittee meetings, legal advice, regulatory advice, agency education and information sharing. On the bottom of the table is the dollar amounts contributed from each of the participating agencies. Fremont contributed $339,990 out of the total ACCWP expenses of $2,342,113. The ratio of Fremont contribution to the total ACCWP program cost was used to determine the contribution Fremont made to the individual programs. This calculation is in the far right column of Table C-5.
Detailed descriptions of how the costs were developed are contained in the following paragraphs.
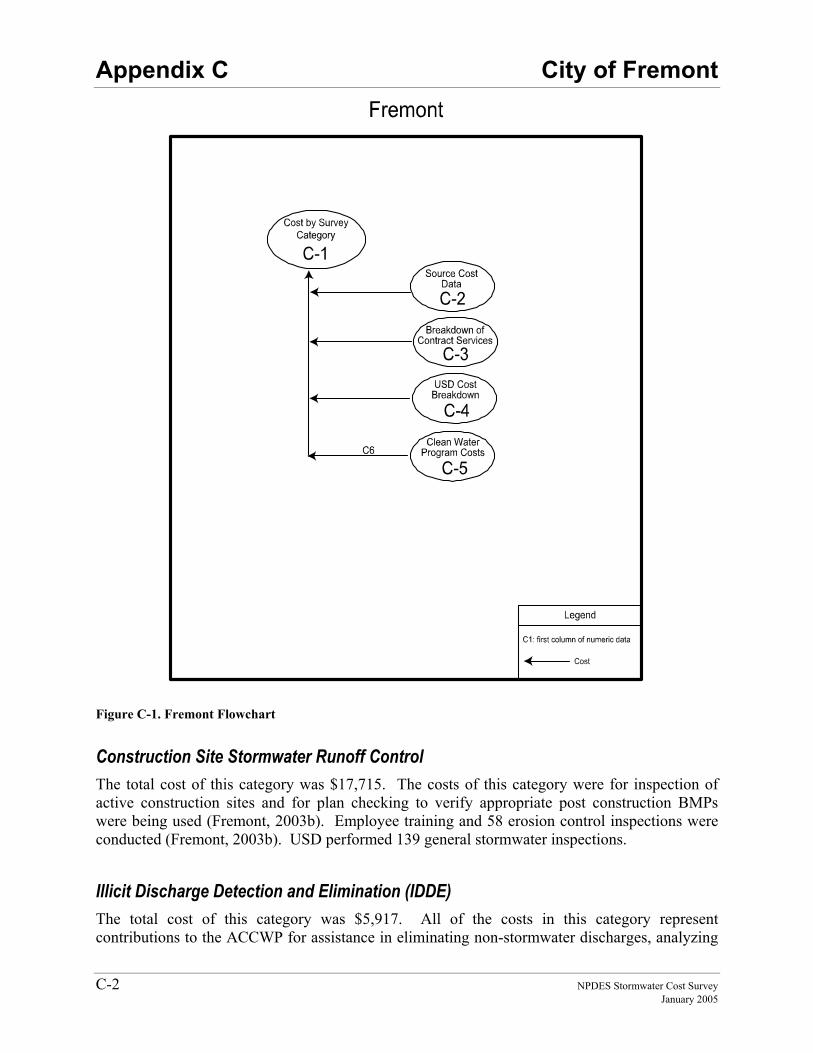
Appendix C City of Fremont
C-2 NPDES Stormwater Cost Survey January 2005
Figure C-1. Fremont Flowchart
Construction Site Stormwater Runoff Control The total cost of this category was $17,715. The costs of this category were for inspection of active construction sites and for plan checking to verify appropriate post construction BMPs were being used (Fremont, 2003b). Employee training and 58 erosion control inspections were conducted (Fremont, 2003b). USD performed 139 general stormwater inspections.
Illicit Discharge Detection and Elimination (IDDE) The total cost of this category was $5,917. All of the costs in this category represent contributions to the ACCWP for assistance in eliminating non-stormwater discharges, analyzing
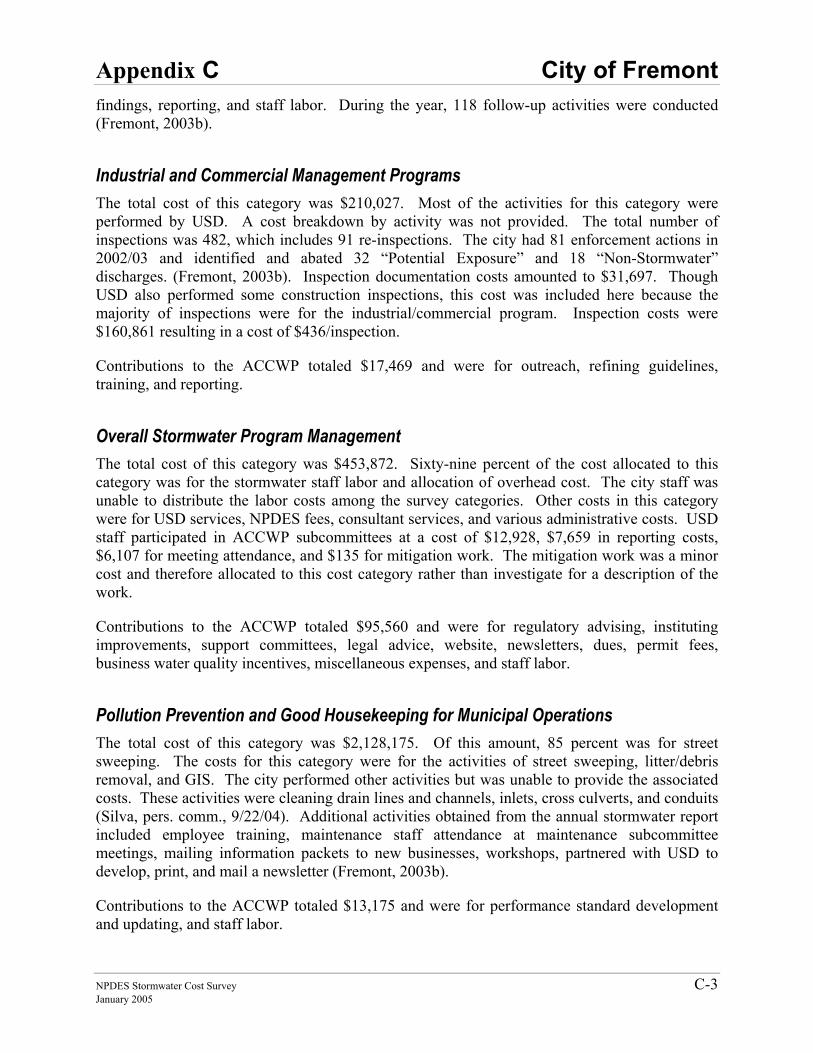
Appendix C City of Fremont
NPDES Stormwater Cost Survey C-3 January 2005
findings, reporting, and staff labor. During the year, 118 follow-up activities were conducted (Fremont, 2003b).
Industrial and Commercial Management Programs The total cost of this category was $210,027. Most of the activities for this category were performed by USD. A cost breakdown by activity was not provided. The total number of inspections was 482, which includes 91 re-inspections. The city had 81 enforcement actions in 2002/03 and identified and abated 32 “Potential Exposure” and 18 “Non-Stormwater” discharges. (Fremont, 2003b). Inspection documentation costs amounted to $31,697. Though USD also performed some construction inspections, this cost was included here because the majority of inspections were for the industrial/commercial program. Inspection costs were $160,861 resulting in a cost of $436/inspection.
Contributions to the ACCWP totaled $17,469 and were for outreach, refining guidelines, training, and reporting.
Overall Stormwater Program Management The total cost of this category was $453,872. Sixty-nine percent of the cost allocated to this category was for the stormwater staff labor and allocation of overhead cost. The city staff was unable to distribute the labor costs among the survey categories. Other costs in this category were for USD services, NPDES fees, consultant services, and various administrative costs. USD staff participated in ACCWP subcommittees at a cost of $12,928, $7,659 in reporting costs, $6,107 for meeting attendance, and $135 for mitigation work. The mitigation work was a minor cost and therefore allocated to this cost category rather than investigate for a description of the work.
Contributions to the ACCWP totaled $95,560 and were for regulatory advising, instituting improvements, support committees, legal advice, website, newsletters, dues, permit fees, business water quality incentives, miscellaneous expenses, and staff labor.
Pollution Prevention and Good Housekeeping for Municipal Operations The total cost of this category was $2,128,175. Of this amount, 85 percent was for street sweeping. The costs for this category were for the activities of street sweeping, litter/debris removal, and GIS. The city performed other activities but was unable to provide the associated costs. These activities were cleaning drain lines and channels, inlets, cross culverts, and conduits (Silva, pers. comm., 9/22/04). Additional activities obtained from the annual stormwater report included employee training, maintenance staff attendance at maintenance subcommittee meetings, mailing information packets to new businesses, workshops, partnered with USD to develop, print, and mail a newsletter (Fremont, 2003b).
Contributions to the ACCWP totaled $13,175 and were for performance standard development and updating, and staff labor.
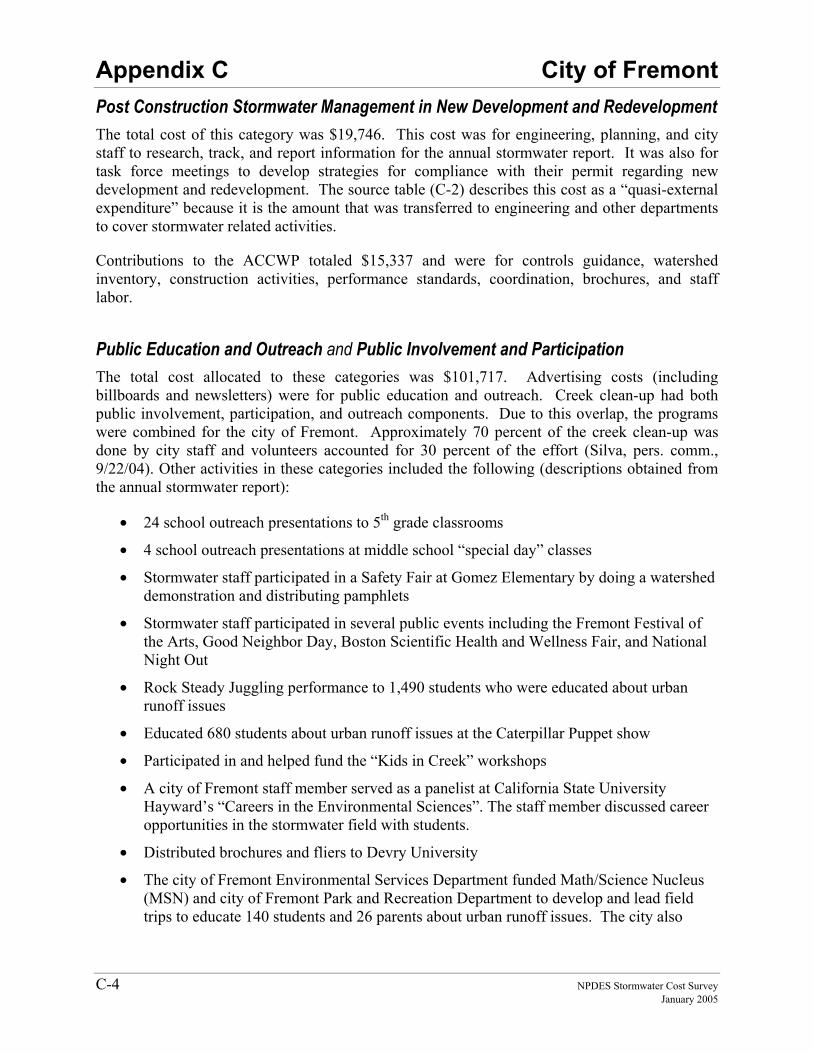
Appendix C City of Fremont
C-4 NPDES Stormwater Cost Survey January 2005
Post Construction Stormwater Management in New Development and Redevelopment The total cost of this category was $19,746. This cost was for engineering, planning, and city staff to research, track, and report information for the annual stormwater report. It was also for task force meetings to develop strategies for compliance with their permit regarding new development and redevelopment. The source table (C-2) describes this cost as a “quasi-external expenditure” because it is the amount that was transferred to engineering and other departments to cover stormwater related activities.
Contributions to the ACCWP totaled $15,337 and were for controls guidance, watershed inventory, construction activities, performance standards, coordination, brochures, and staff labor.
Public Education and Outreach and Public Involvement and Participation The total cost allocated to these categories was $101,717. Advertising costs (including billboards and newsletters) were for public education and outreach. Creek clean-up had both public involvement, participation, and outreach components. Due to this overlap, the programs were combined for the city of Fremont. Approximately 70 percent of the creek clean-up was done by city staff and volunteers accounted for 30 percent of the effort (Silva, pers. comm., 9/22/04). Other activities in these categories included the following (descriptions obtained from the annual stormwater report):
• 24 school outreach presentations to 5th grade classrooms
• 4 school outreach presentations at middle school “special day” classes
• Stormwater staff participated in a Safety Fair at Gomez Elementary by doing a watershed demonstration and distributing pamphlets
• Stormwater staff participated in several public events including the Fremont Festival of the Arts, Good Neighbor Day, Boston Scientific Health and Wellness Fair, and National Night Out
• Rock Steady Juggling performance to 1,490 students who were educated about urban runoff issues
• Educated 680 students about urban runoff issues at the Caterpillar Puppet show
• Participated in and helped fund the “Kids in Creek” workshops
• A city of Fremont staff member served as a panelist at California State University Hayward’s “Careers in the Environmental Sciences”. The staff member discussed career opportunities in the stormwater field with students.
• Distributed brochures and fliers to Devry University
• The city of Fremont Environmental Services Department funded Math/Science Nucleus (MSN) and city of Fremont Park and Recreation Department to develop and lead field trips to educate 140 students and 26 parents about urban runoff issues. The city also
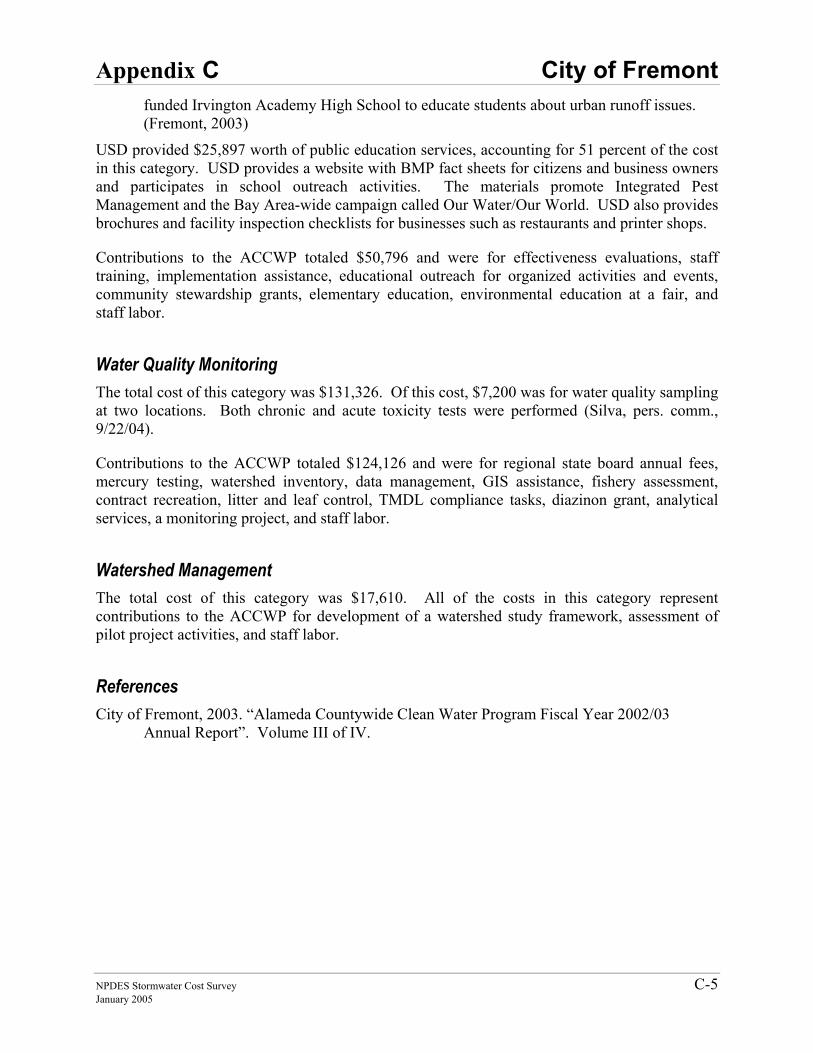
Appendix C City of Fremont
NPDES Stormwater Cost Survey C-5 January 2005
funded Irvington Academy High School to educate students about urban runoff issues. (Fremont, 2003)
USD provided $25,897 worth of public education services, accounting for 51 percent of the cost in this category. USD provides a website with BMP fact sheets for citizens and business owners and participates in school outreach activities. The materials promote Integrated Pest Management and the Bay Area-wide campaign called Our Water/Our World. USD also provides brochures and facility inspection checklists for businesses such as restaurants and printer shops.
Contributions to the ACCWP totaled $50,796 and were for effectiveness evaluations, staff training, implementation assistance, educational outreach for organized activities and events, community stewardship grants, elementary education, environmental education at a fair, and staff labor.
Water Quality Monitoring The total cost of this category was $131,326. Of this cost, $7,200 was for water quality sampling at two locations. Both chronic and acute toxicity tests were performed (Silva, pers. comm., 9/22/04).
Contributions to the ACCWP totaled $124,126 and were for regional state board annual fees, mercury testing, watershed inventory, data management, GIS assistance, fishery assessment, contract recreation, litter and leaf control, TMDL compliance tasks, diazinon grant, analytical services, a monitoring project, and staff labor.
Watershed Management The total cost of this category was $17,610. All of the costs in this category represent contributions to the ACCWP for development of a watershed study framework, assessment of pilot project activities, and staff labor.
References City of Fremont, 2003. “Alameda Countywide Clean Water Program Fiscal Year 2002/03
Annual Report”. Volume III of IV.
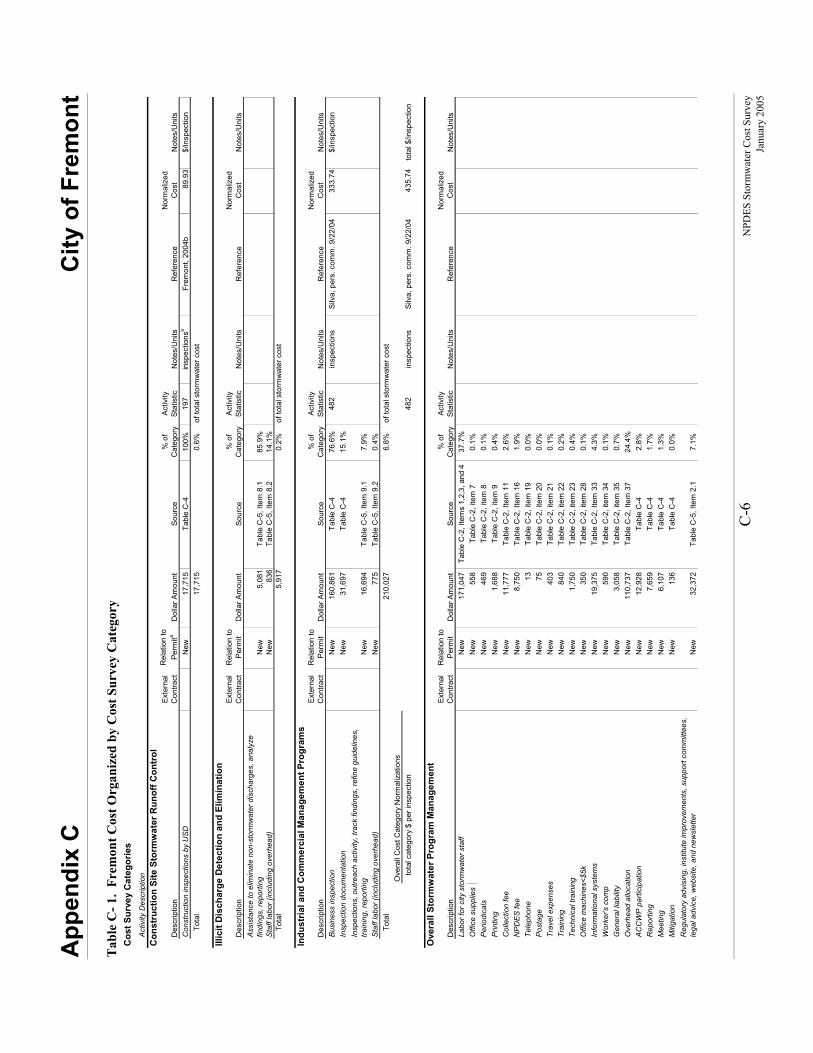
App
endi
x C
C
ity o
f Fre
mon
t
C
-6
NPD
ES S
torm
wat
er C
ost S
urve
y
Ja
nuar
y 20
05
Tab
le C
- 1.
Frem
ont C
ost O
rgan
ized
by
Cos
t Sur
vey
Cat
egor
y C
ost S
urve
y C
ateg
orie
sA
ctiv
ity D
escr
iptio
nC
onst
ruct
ion
Site
Sto
rmw
ater
Run
off C
ontr
ol
Des
crip
tion
Exte
rnal
C
ontra
ctR
elat
ion
to
Perm
itaD
olla
r Am
ount
Sour
ce%
of
Cat
egor
yAc
tivity
St
atis
ticN
otes
/Uni
tsR
efer
ence
Nor
mal
ized
C
ost
Not
es/U
nits
Con
stru
ctio
n in
spec
tions
by
US
DN
ew17
,715
Ta
ble
C-4
100%
197
insp
ectio
nsb
Frem
ont,
2004
b89
.93
$/in
spec
tion
To
tal
17,7
15
0.6%
Illic
it D
isch
arge
Det
ectio
n an
d El
imin
atio
n
Des
crip
tion
Exte
rnal
C
ontra
ctR
elat
ion
to
Per
mit
Dol
lar A
mou
ntSo
urce
% o
f C
ateg
ory
Activ
ity
Stat
istic
Not
es/U
nits
Ref
eren
ceN
orm
aliz
ed
Cos
tN
otes
/Uni
ts
New
5,08
1Ta
ble
C-5
, Ite
m 8
.185
.9%
Sta
ff la
bor (
incl
udin
g ov
erhe
ad)
New
836
Tabl
e C
-5, I
tem
8.2
14.1
%
Tota
l5,
917
0.2%
Indu
stria
l and
Com
mer
cial
Man
agem
ent P
rogr
ams
Des
crip
tion
Exte
rnal
C
ontra
ctR
elat
ion
to
Per
mit
Dol
lar A
mou
ntSo
urce
% o
f C
ateg
ory
Activ
ity
Stat
istic
Not
es/U
nits
Ref
eren
ceN
orm
aliz
ed
Cos
tN
otes
/Uni
tsB
usin
ess
insp
ectio
nN
ew16
0,86
1
Ta
ble
C-4
76.6
%48
2in
spec
tions
Silv
a, p
ers.
com
m. 9
/22/
0433
3.74
$/in
spec
tion
Insp
ectio
n do
cum
enta
tion
New
31,6
97
Tabl
e C
-415
.1%
New
16,6
94
Tabl
e C
-5, I
tem
9.1
7.9%
Sta
ff la
bor (
incl
udin
g ov
erhe
ad)
New
775
Ta
ble
C-5
, Ite
m 9
.20.
4%
Tota
l21
0,02
7
6.
8%O
vera
ll C
ost C
ateg
ory
Nor
mal
izat
ions
to
tal c
ateg
ory
$ pe
r ins
pect
ion
482
insp
ectio
nsSi
lva,
per
s. c
omm
. 9/2
2/04
435.
74to
tal $
/insp
ectio
n
Ove
rall
Stor
mw
ater
Pro
gram
Man
agem
ent
Des
crip
tion
Exte
rnal
C
ontra
ctR
elat
ion
to
Per
mit
Dol
lar A
mou
ntSo
urce
% o
f C
ateg
ory
Activ
ity
Stat
istic
Not
es/U
nits
Ref
eren
ceN
orm
aliz
ed
Cos
tN
otes
/Uni
tsLa
bor f
or c
ity s
torm
wat
er s
taff
New
171,
047
Tabl
e C
-2, I
tem
s 1,
2,3,
and
437
.7%
Offi
ce s
uppl
ies
New
558
Ta
ble
C-2
, ite
m 7
0.1%
Per
iodi
cals
New
469
Ta
ble
C-2
, ite
m 8
0.1%
Prin
ting
New
1,68
8
Ta
ble
C-2
, ite
m 9
0.4%
Col
lect
ion
fee
New
11,7
77
Tabl
e C
-2, I
tem
11
2.6%
NP
DE
S fe
eN
ew8,
750
Tabl
e C
-2, I
tem
16
1.9%
Tele
phon
eN
ew13
Ta
ble
C-2
, ite
m 1
90.
0%P
osta
geN
ew75
Ta
ble
C-2
, ite
m 2
00.
0%Tr
avel
exp
ense
sN
ew40
3
Tabl
e C
-2, i
tem
21
0.1%
Trai
ning
New
840
Ta
ble
C-2
, ite
m 2
20.
2%Te
chni
cal t
rain
ing
New
1,75
0
Ta
ble
C-2
, ite
m 2
30.
4%O
ffice
mac
hine
s<$5
kN
ew35
0
Tabl
e C
-2, i
tem
28
0.1%
Info
rmat
iona
l sys
tem
sN
ew19
,375
Ta
ble
C-2
, Ite
m 3
34.
3%W
orke
r's c
omp
New
590
Ta
ble
C-2
, ite
m 3
40.
1%G
ener
al li
abilit
yN
ew3,
058
Tabl
e C
-2, i
tem
35
0.7%
Ove
rhea
d al
loca
tion
New
110,
737
Tabl
e C
-2, I
tem
37
24.4
%A
CC
WP
par
ticip
atio
nN
ew12
,928
Ta
ble
C-4
2.8%
Rep
ortin
gN
ew7,
659
Tabl
e C
-41.
7%M
eetin
gN
ew6,
107
Tabl
e C
-41.
3%M
itiga
tion
New
136
Ta
ble
C-4
0.0%
New
32,3
72
Tabl
e C
-5, I
tem
2.1
7.1%
Ass
ista
nce
to e
limin
ate
non-
stor
mw
ater
dis
char
ges,
ana
lyze
fin
ding
s, re
porti
ng
Insp
ectio
ns, o
utre
ach
activ
ity, t
rack
find
ings
, ref
ine
guid
elin
es,
train
ing,
repo
rting
Reg
ulat
ory
advi
sing
, ins
titut
e im
prov
emen
ts, s
uppo
rt co
mm
ittee
s,
lega
l adv
ice,
web
site
, and
new
slet
ter
of to
tal s
torm
wat
er c
ost
of to
tal s
torm
wat
er c
ost
of to
tal s
torm
wat
er c
ost
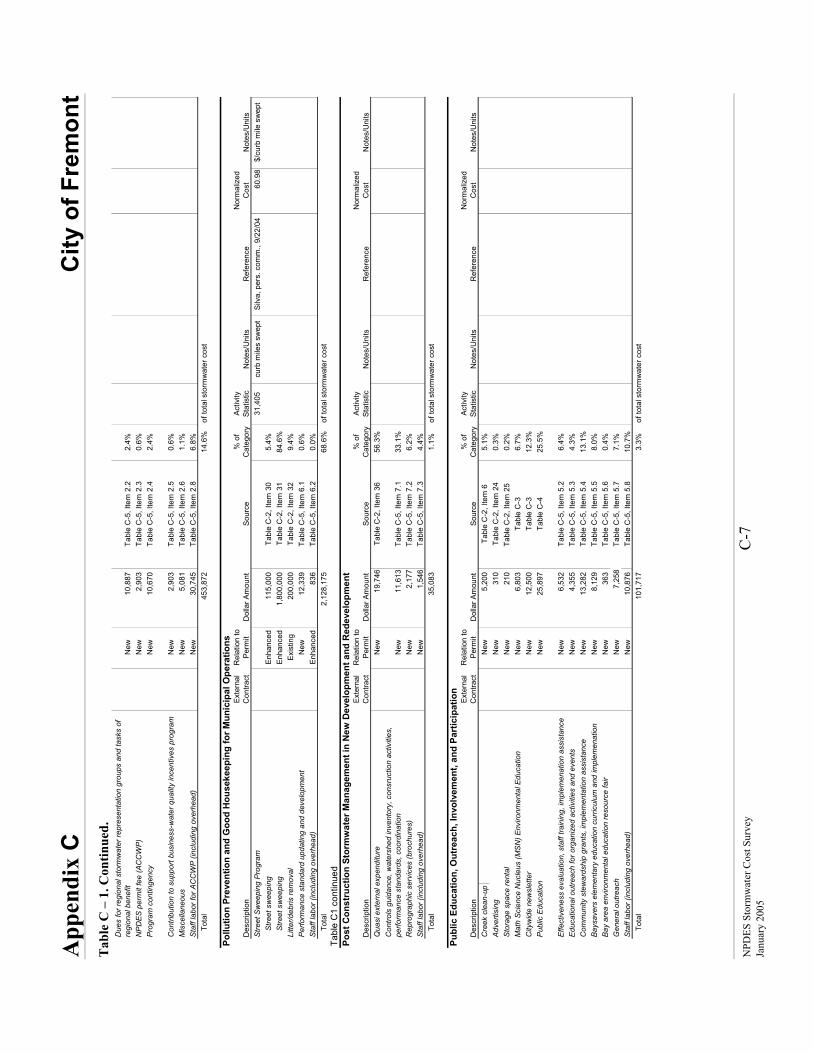
App
endi
x C
C
ity o
f Fre
mon
t
NPD
ES S
torm
wat
er C
ost S
urve
y C
-7
Ja
nuar
y 20
05
Tab
le C
– 1
. Con
tinue
d.
New
10,8
87
Tabl
e C
-5, I
tem
2.2
2.4%
NP
DE
S p
erm
it fe
e (A
CC
WP
)N
ew2,
903
Tabl
e C
-5, I
tem
2.3
0.6%
Pro
gram
con
tinge
ncy
New
10,6
70
Tabl
e C
-5, I
tem
2.4
2.4%
New
2,90
3
Ta
ble
C-5
, Ite
m 2
.50.
6%M
isce
llane
ous
New
5,08
1
Ta
ble
C-5
, Ite
m 2
.61.
1%S
taff
labo
r for
AC
CW
P (i
nclu
ding
ove
rhea
d)N
ew30
,745
Ta
ble
C-5
, Ite
m 2
.86.
8%
Tota
l45
3,87
2
14
.6%
Pollu
tion
Prev
entio
n an
d G
ood
Hou
seke
epin
g fo
r Mun
icip
al O
pera
tions
Des
crip
tion
Exte
rnal
C
ontra
ctR
elat
ion
to
Per
mit
Dol
lar A
mou
ntSo
urce
% o
f C
ateg
ory
Activ
ity
Stat
istic
Not
es/U
nits
Ref
eren
ceN
orm
aliz
ed
Cos
tN
otes
/Uni
tsS
treet
Sw
eepi
ng P
rogr
am31
,405
curb
mile
s sw
ept
Silv
a, p
ers.
com
m.,
9/22
/04
60.9
8$/
curb
mile
sw
ept
S
treet
sw
eepi
ngEn
hanc
ed11
5,00
0
Ta
ble
C-2
, Ite
m 3
05.
4%
Stre
et s
wee
ping
Enha
nced
1,80
0,00
0
Tabl
e C
-2, I
tem
31
84.6
%Li
tter/d
ebris
rem
oval
Exis
ting
200,
000
Tabl
e C
-2, I
tem
32
9.4%
Per
form
ance
sta
ndar
d up
datin
g an
d de
velo
pmen
tN
ew12
,339
Ta
ble
C-5
, Ite
m 6
.10.
6%S
taff
labo
r (in
clud
ing
over
head
)En
hanc
ed83
6
Tabl
e C
-5, I
tem
6.2
0.0%
To
tal
2,12
8,17
5
68.6
%Ta
ble
C1
cont
inue
dPo
st C
onst
ruct
ion
Stor
mw
ater
Man
agem
ent i
n N
ew D
evel
opm
ent a
nd R
edev
elop
men
t
Des
crip
tion
Exte
rnal
C
ontra
ctR
elat
ion
to
Per
mit
Dol
lar A
mou
ntSo
urce
% o
f C
ateg
ory
Activ
ity
Stat
istic
Not
es/U
nits
Ref
eren
ceN
orm
aliz
ed
Cos
tN
otes
/Uni
tsQ
uasi
ext
erna
l exp
endi
ture
New
19,7
46Ta
ble
C-2
, Ite
m 3
656
.3%
New
11,6
13Ta
ble
C-5
, Ite
m 7
.133
.1%
Rep
rogr
aphi
c se
rvic
es (b
roch
ures
)N
ew2,
177
Tabl
e C
-5, I
tem
7.2
6.2%
Sta
ff la
bor (
incl
udin
g ov
erhe
ad)
New
1,54
6Ta
ble
C-5
, Ite
m 7
.34.
4%
Tota
l35
,083
1.
1%
Publ
ic E
duca
tion,
Out
reac
h, In
volv
emen
t, an
d Pa
rtic
ipat
ion
Des
crip
tion
Exte
rnal
C
ontra
ctR
elat
ion
to
Per
mit
Dol
lar A
mou
ntSo
urce
% o
f C
ateg
ory
Activ
ity
Stat
istic
Not
es/U
nits
Ref
eren
ceN
orm
aliz
ed
Cos
tN
otes
/Uni
tsC
reek
cle
an-u
pN
ew5,
200
Tabl
e C
-2, I
tem
65.
1%A
dver
tisin
gN
ew31
0
Tabl
e C
-2, I
tem
24
0.3%
Sto
rage
spa
ce re
ntal
New
210
Ta
ble
C-2
, Ite
m 2
5 0.
2%M
ath
Sci
ence
Nuc
leus
(MS
N) E
nviro
nmen
tal E
duca
tion
New
6,80
3
Ta
ble
C-3
6.7%
City
wid
e ne
wsl
ette
rN
ew12
,500
Ta
ble
C-3
12.3
%P
ublic
Edu
catio
nN
ew25
,897
Ta
ble
C-4
25.5
%
New
6,53
2
Ta
ble
C-5
, Ite
m 5
.26.
4%E
duca
tiona
l out
reac
h fo
r org
aniz
ed a
ctiv
ities
and
eve
nts
New
4,35
5
Ta
ble
C-5
, Ite
m 5
.34.
3%C
omm
unity
ste
war
dshi
p gr
ants
, im
plem
enta
tion
assi
stan
ceN
ew13
,282
Ta
ble
C-5
, Ite
m 5
.413
.1%
Bay
save
rs e
lem
enta
ry e
duca
tion
curr
icul
um a
nd im
plem
enat
ion
New
8,12
9
Ta
ble
C-5
, Ite
m 5
.58.
0%B
ay a
rea
envi
ronm
enta
l edu
catio
n re
sour
ce fa
irN
ew36
3
Tabl
e C
-5, I
tem
5.6
0.4%
Gen
eral
out
reac
hN
ew7,
258
Tabl
e C
-5, I
tem
5.7
7.1%
Sta
ff la
bor (
incl
udin
g ov
erhe
ad)
New
10,8
76
Tabl
e C
-5, I
tem
5.8
10.7
%
Tota
l10
1,71
7
3.
3%
Con
trols
gui
danc
e, w
ater
shed
inve
ntor
y, c
onsr
uctio
n ac
tiviti
es,
perfo
rman
ce s
tand
ards
, coo
rdin
atio
n
Due
s fo
r reg
iona
l sto
rmw
ater
repr
esen
tatio
n gr
oups
and
task
s of
re
gion
al b
enef
it
Con
tribu
tion
to s
uppo
rt bu
sine
ss-w
ater
qua
lity
ince
ntiv
es p
rogr
am
Effe
ctiv
enes
s ev
alua
tion,
sta
ff tra
inin
g, im
plem
enat
ion
assi
stan
ce
of to
tal s
torm
wat
er c
ost
of to
tal s
torm
wat
er c
ost
of to
tal s
torm
wat
er c
ost
of to
tal s
torm
wat
er c
ost
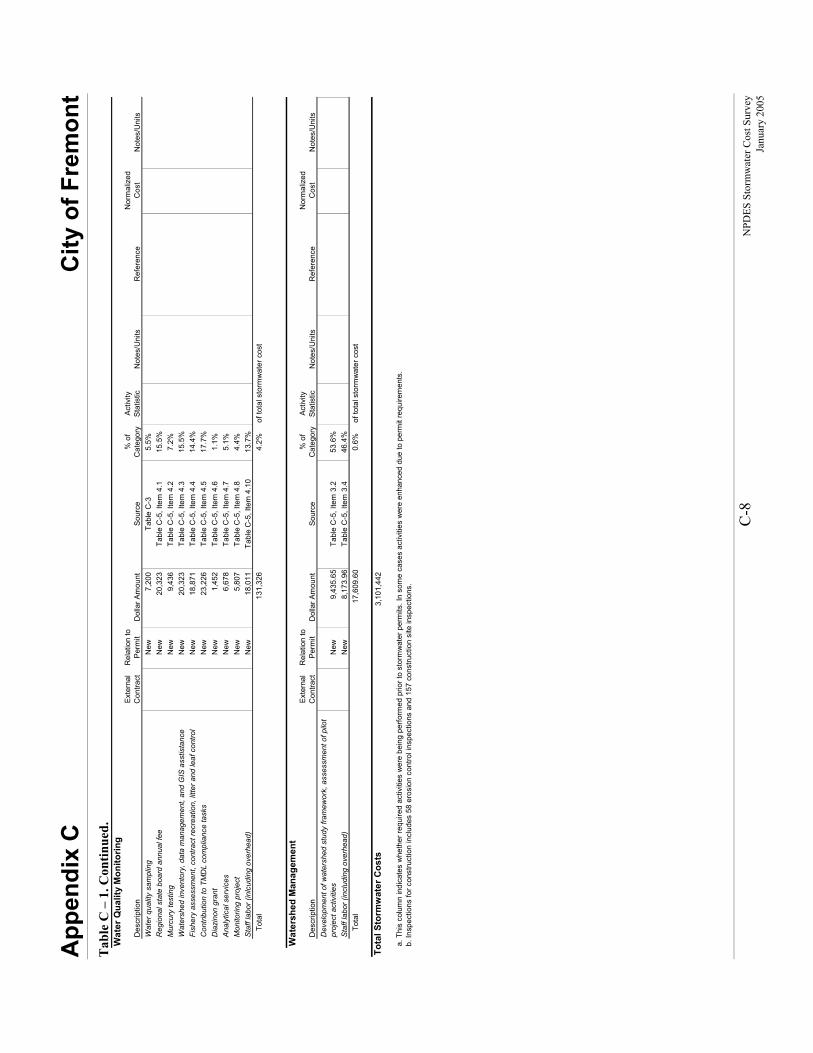
App
endi
x C
C
ity o
f Fre
mon
t
C
-8
NPD
ES S
torm
wat
er C
ost S
urve
y
Ja
nuar
y 20
05
Tab
le C
– 1
. Con
tinue
d.
Wat
er Q
ualit
y M
onito
ring
Des
crip
tion
Exte
rnal
C
ontra
ctR
elat
ion
to
Per
mit
Dol
lar A
mou
ntSo
urce
% o
f C
ateg
ory
Activ
ity
Stat
istic
Not
es/U
nits
Ref
eren
ceN
orm
aliz
ed
Cos
tN
otes
/Uni
tsW
ater
qua
lity
sam
plin
gN
ew7,
200
Tabl
e C
-35.
5%R
egio
nal s
tate
boa
rd a
nnua
l fee
New
20,3
23
Tabl
e C
-5, I
tem
4.1
15.5
%M
urcu
ry te
stin
gN
ew9,
436
Tabl
e C
-5, I
tem
4.2
7.2%
Wat
ersh
ed in
vent
ory,
dat
a m
anag
emen
t, an
d G
IS a
sstis
tanc
eN
ew20
,323
Ta
ble
C-5
, Ite
m 4
.315
.5%
Fish
ery
asse
ssm
ent,
cont
ract
recr
eatio
n, li
tter a
nd le
af c
ontro
lN
ew18
,871
Ta
ble
C-5
, Ite
m 4
.414
.4%
Con
tribu
tion
to T
MD
L co
mpl
ianc
e ta
sks
New
23,2
26
Tabl
e C
-5, I
tem
4.5
17.7
%D
iazi
non
gran
tN
ew1,
452
Tabl
e C
-5, I
tem
4.6
1.1%
Ana
lytic
al s
ervi
ces
New
6,67
8
Ta
ble
C-5
, Ite
m 4
.75.
1%M
onito
ring
proj
ect
New
5,80
7
Ta
ble
C-5
, Ite
m 4
.84.
4%S
taff
labo
r (in
lcud
ing
over
head
)N
ew18
,011
Ta
ble
C-5
, Ite
m 4
.10
13.7
%
Tota
l13
1,32
6
4.
2%
Wat
ersh
ed M
anag
emen
t
Des
crip
tion
Exte
rnal
C
ontra
ctR
elat
ion
to
Per
mit
Dol
lar A
mou
ntSo
urce
% o
f C
ateg
ory
Activ
ity
Stat
istic
Not
es/U
nits
Ref
eren
ceN
orm
aliz
ed
Cos
tN
otes
/Uni
ts
New
9,43
5.65
Tabl
e C
-5, I
tem
3.2
53.6
%S
taff
labo
r (in
clud
ing
over
head
)N
ew8,
173.
96Ta
ble
C-5
, Ite
m 3
.446
.4%
To
tal
17,6
09.6
00.
6%
Tota
l Sto
rmw
ater
Cos
ts3,
101,
442
a. T
his
colu
mn
indi
cate
s w
heth
er re
quire
d ac
tiviti
es w
ere
bein
g pe
rform
ed p
rior t
o st
orm
wat
er p
erm
its. I
n so
me
case
s ac
tiviti
es w
ere
enha
nced
due
to p
erm
it re
quire
men
ts.
b. In
spec
tions
for c
onst
ruct
ion
incl
udes
58
eros
ion
cont
rol i
nspe
ctio
ns a
nd 1
57 c
onst
ruct
ion
site
insp
ectio
ns.
of to
tal s
torm
wat
er c
ost
Dev
elop
men
t of w
ater
shed
stu
dy fr
amew
ork,
ass
essm
ent o
f pilo
t pr
ojec
t act
iviti
es
of to
tal s
torm
wat
er c
ost
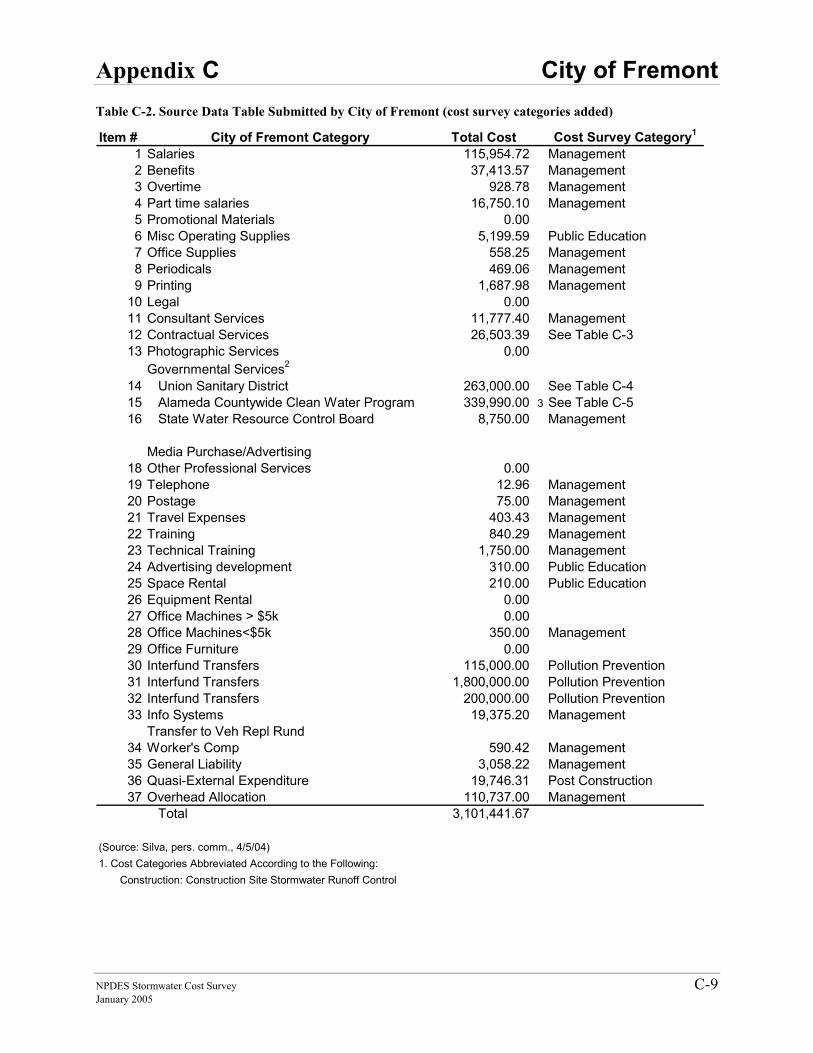
Appendix C City of Fremont
NPDES Stormwater Cost Survey C-9 January 2005
Table C-2. Source Data Table Submitted by City of Fremont (cost survey categories added)
Item # City of Fremont Category Total Cost Cost Survey Category1
1 Salaries 115,954.72 Management2 Benefits 37,413.57 Management3 Overtime 928.78 Management4 Part time salaries 16,750.10 Management5 Promotional Materials 0.006 Misc Operating Supplies 5,199.59 Public Education7 Office Supplies 558.25 Management8 Periodicals 469.06 Management9 Printing 1,687.98 Management
10 Legal 0.0011 Consultant Services 11,777.40 Management12 Contractual Services 26,503.39 See Table C-313 Photographic Services 0.00
Governmental Services2
14 Union Sanitary District 263,000.00 See Table C-415 Alameda Countywide Clean Water Program 339,990.00 3 See Table C-516 State Water Resource Control Board 8,750.00 Management
Media Purchase/Advertising18 Other Professional Services 0.0019 Telephone 12.96 Management20 Postage 75.00 Management21 Travel Expenses 403.43 Management22 Training 840.29 Management23 Technical Training 1,750.00 Management24 Advertising development 310.00 Public Education 25 Space Rental 210.00 Public Education 26 Equipment Rental 0.0027 Office Machines > $5k 0.0028 Office Machines<$5k 350.00 Management29 Office Furniture 0.0030 Interfund Transfers 115,000.00 Pollution Prevention 31 Interfund Transfers 1,800,000.00 Pollution Prevention32 Interfund Transfers 200,000.00 Pollution Prevention33 Info Systems 19,375.20 Management
Transfer to Veh Repl Rund34 Worker's Comp 590.42 Management35 General Liability 3,058.22 Management36 Quasi-External Expenditure 19,746.31 Post Construction37 Overhead Allocation 110,737.00 Management
Total 3,101,441.67
(Source: Silva, pers. comm., 4/5/04)1. Cost Categories Abbreviated According to the Following: Construction: Construction Site Stormwater Runoff Control
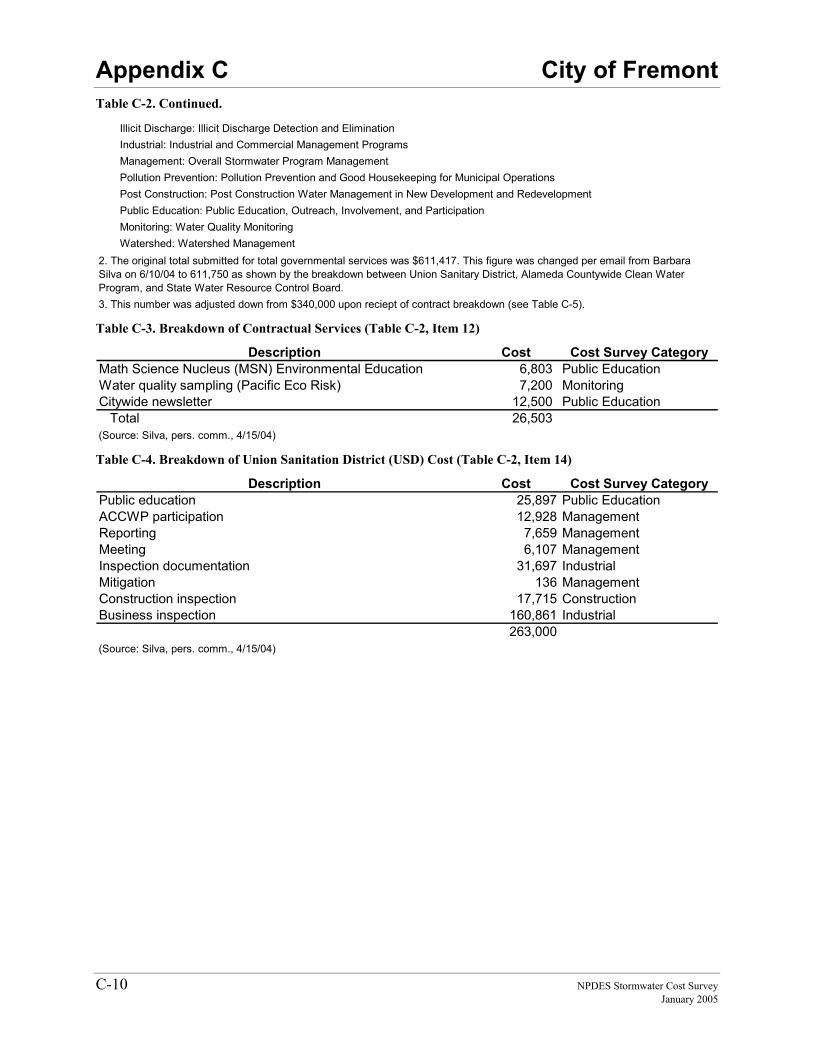
Appendix C City of Fremont
C-10 NPDES Stormwater Cost Survey January 2005
Table C-2. Continued.
Illicit Discharge: Illicit Discharge Detection and Elimination Industrial: Industrial and Commercial Management Programs Management: Overall Stormwater Program Management Pollution Prevention: Pollution Prevention and Good Housekeeping for Municipal Operations Post Construction: Post Construction Water Management in New Development and Redevelopment Public Education: Public Education, Outreach, Involvement, and Participation Monitoring: Water Quality Monitoring Watershed: Watershed Management
3. This number was adjusted down from $340,000 upon reciept of contract breakdown (see Table C-5).
2. The original total submitted for total governmental services was $611,417. This figure was changed per email from Barbara Silva on 6/10/04 to 611,750 as shown by the breakdown between Union Sanitary District, Alameda Countywide Clean Water Program, and State Water Resource Control Board.
Table C-3. Breakdown of Contractual Services (Table C-2, Item 12)
Description Cost Cost Survey CategoryMath Science Nucleus (MSN) Environmental Education 6,803 Public Education Water quality sampling (Pacific Eco Risk) 7,200 MonitoringCitywide newsletter 12,500 Public Education Total 26,503 (Source: Silva, pers. comm., 4/15/04) Table C-4. Breakdown of Union Sanitation District (USD) Cost (Table C-2, Item 14)
Description Cost Cost Survey CategoryPublic education 25,897 Public EducationACCWP participation 12,928 ManagementReporting 7,659 ManagementMeeting 6,107 ManagementInspection documentation 31,697 Industrial Mitigation 136 ManagementConstruction inspection 17,715 ConstructionBusiness inspection 160,861 Industrial
263,000(Source: Silva, pers. comm., 4/15/04)
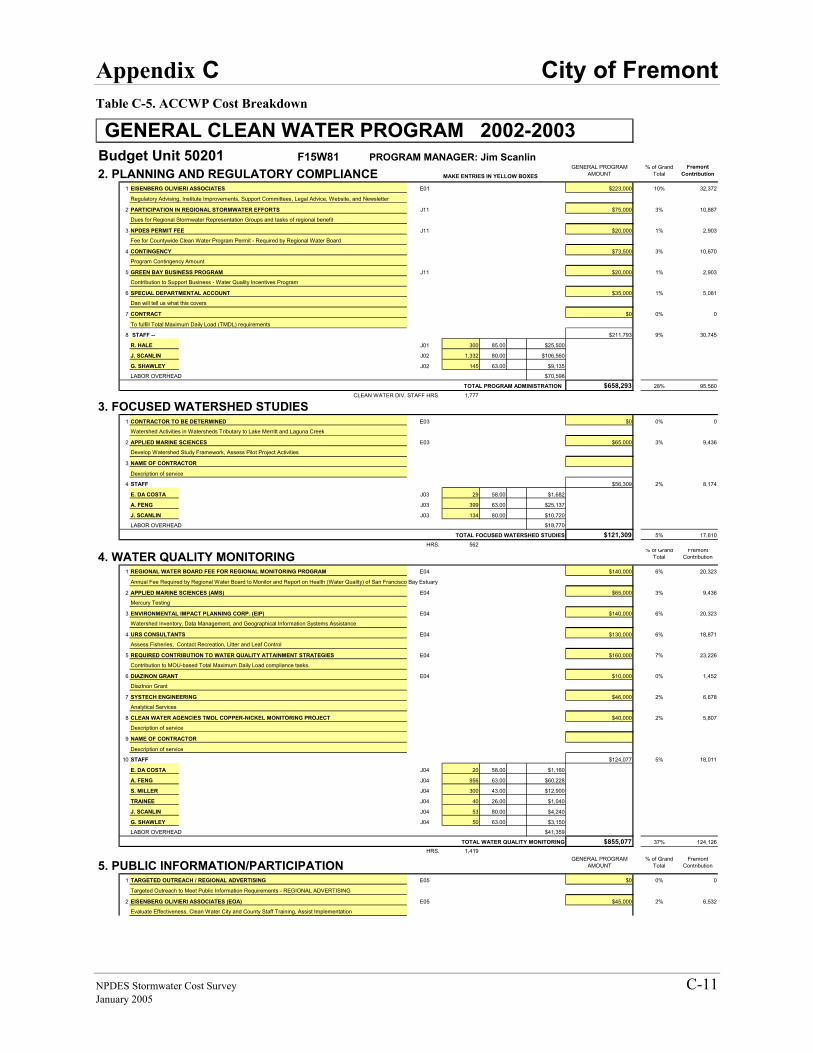
Appendix C City of Fremont
NPDES Stormwater Cost Survey C-11 January 2005
Table C-5. ACCWP Cost Breakdown
GENERAL CLEAN WATER PROGRAM 2002-2003Budget Unit 50201 F15W81 PROGRAM MANAGER: Jim Scanlin
2. PLANNING AND REGULATORY COMPLIANCE MAKE ENTRIES IN YELLOW BOXESGENERAL PROGRAM
AMOUNT% of Grand
TotalFremont
Contribution
1 EISENBERG OLIVIERI ASSOCIATES E01 $223,000 10% 32,372
Regulatory Advising, Institute Improvements, Support Committees, Legal Advice, Website, and Newsletter
2 PARTICIPATION IN REGIONAL STORMWATER EFFORTS J11 $75,000 3% 10,887
Dues for Regional Stormwater Representation Groups and tasks of regional benefit
3 NPDES PERMIT FEE J11 $20,000 1% 2,903
Fee for Countywide Clean Water Program Permit - Required by Regional Water Board
4 CONTINGENCY $73,500 3% 10,670
Program Contingency Amount
5 GREEN BAY BUSINESS PROGRAM J11 $20,000 1% 2,903
Contribution to Support Business - Water Quality Incentives Program
6 SPECIAL DEPARTMENTAL ACCOUNT $35,000 1% 5,081
Dan will tell us what this covers
7 CONTRACT $0 0% 0
To fulfill Total Maximum Daily Load (TMDL) requirements
8 STAFF -- $211,793 9% 30,745
R. HALE J01 300 85.00 $25,500
J. SCANLIN J02 1,332 80.00 $106,560
G. SHAWLEY J02 145 63.00 $9,135
LABOR OVERHEAD $70,598
TOTAL PROGRAM ADMINISTRATION $658,293 28% 95,560
CLEAN WATER DIV. STAFF HRS. 1,777
3. FOCUSED WATERSHED STUDIES1 CONTRACTOR TO BE DETERMINED E03 $0 0% 0
Watershed Activities in Watersheds Tributary to Lake Merritt and Laguna Creek
2 APPLIED MARINE SCIENCES E03 $65,000 3% 9,436
Develop Watershed Study Framework, Assess Pilot Project Activities
3 NAME OF CONTRACTOR
Dexcription of service
4 STAFF $56,309 2% 8,174
E. DA COSTA J03 29 58.00 $1,682
A. FENG J03 399 63.00 $25,137
J. SCANLIN J03 134 80.00 $10,720
LABOR OVERHEAD $18,770
TOTAL FOCUSED WATERSHED STUDIES $121,309 5% 17,610
HRS. 562
4. WATER QUALITY MONITORING% of Grand
TotalFremont
Contribution
1 REGIONAL WATER BOARD FEE FOR REGIONAL MONITORING PROGRAM E04 $140,000 6% 20,323
Annual Fee Required by Regional Water Board to Monitor and Report on Health (Water Quality) of San Francisco Bay Estuary
2 APPLIED MARINE SCIENCES (AMS) E04 $65,000 3% 9,436
Mercury Testing
3 ENVIRONMENTAL IMPACT PLANNING CORP. (EIP) E04 $140,000 6% 20,323
Watershed Inventory, Data Management, and Geographical Information Systems Assistance
4 URS CONSULTANTS E04 $130,000 6% 18,871
Assess Fisheries, Contact Recreation, Litter and Leaf Control
5 REQUIRED CONTRIBUTION TO WATER QUALITY ATTAINMENT STRATEGIES E04 $160,000 7% 23,226
Contribution to MOU-based Total Maximum Daily Load compliance tasks.
6 DIAZINON GRANT E04 $10,000 0% 1,452
DiazInon Grant
7 SYSTECH ENGINEERING $46,000 2% 6,678
Analytical Services
8 CLEAN WATER AGENCIES TMDL COPPER-NICKEL MONITORING PROJECT $40,000 2% 5,807
Dexcription of service
9 NAME OF CONTRACTOR
Dexcription of service
10 STAFF $124,077 5% 18,011
E. DA COSTA J04 20 58.00 $1,160
A. FENG J04 956 63.00 $60,228
S. MILLER J04 300 43.00 $12,900
TRAINEE J04 40 26.00 $1,040
J. SCANLIN J04 53 80.00 $4,240
G. SHAWLEY J04 50 63.00 $3,150
LABOR OVERHEAD $41,359
TOTAL WATER QUALITY MONITORING $855,077 37% 124,126HRS. 1,419
5. PUBLIC INFORMATION/PARTICIPATIONGENERAL PROGRAM
AMOUNT% of Grand
TotalFremont
Contribution
1 TARGETED OUTREACH / REGIONAL ADVERTISING E05 $0 0% 0
Targeted Outreach to Meet Public Information Requirements - REGIONAL ADVERTISING
2 EISENBERG OLIVIERI ASSOCIATES (EOA) E05 $45,000 2% 6,532
Evaluate Effectiveness, Clean Water City and County Staff Training, Assist Implementation
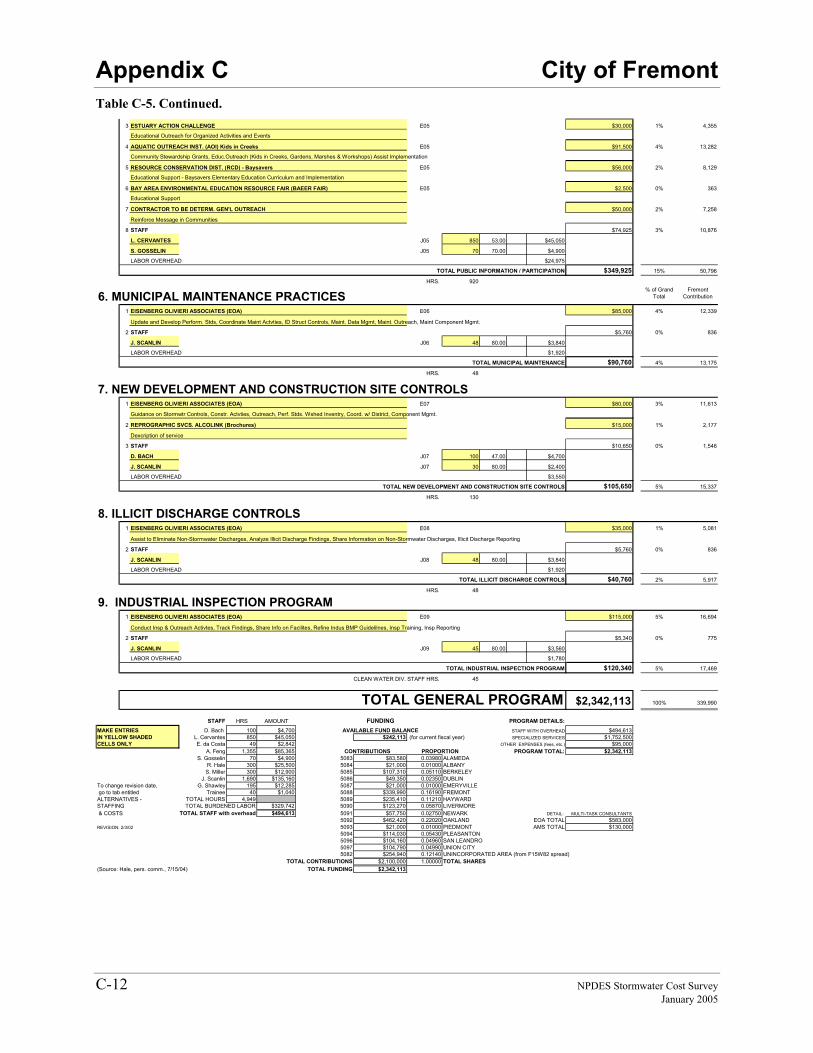
Appendix C City of Fremont
C-12 NPDES Stormwater Cost Survey January 2005
Table C-5. Continued. 3 ESTUARY ACTION CHALLENGE E05 $30,000 1% 4,355
Educational Outreach for Organized Activities and Events
4 AQUATIC OUTREACH INST. (AOI) Kids in Creeks E05 $91,500 4% 13,282
Community Stewardship Grants, Educ.Outreach (Kids in Creeks, Gardens, Marshes & Workshops) Assist Implementation
5 RESOURCE CONSERVATION DIST. (RCD) - Baysavers E05 $56,000 2% 8,129
Educational Support - Baysavers Elementary Education Curriculum and Implementation
6 BAY AREA ENVIRONMENTAL EDUCATION RESOURCE FAIR (BAEER FAIR) E05 $2,500 0% 363
Educational Support
7 CONTRACTOR TO BE DETERM. GEN'L OUTREACH $50,000 2% 7,258
Reinforce Message in Communities
8 STAFF $74,925 3% 10,876
L. CERVANTES J05 850 53.00 $45,050
S. GOSSELIN J05 70 70.00 $4,900
LABOR OVERHEAD $24,975
TOTAL PUBLIC INFORMATION / PARTICIPATION $349,925 15% 50,796
HRS. 920
6. MUNICIPAL MAINTENANCE PRACTICES% of Grand
TotalFremont
Contribution
1 EISENBERG OLIVIERI ASSOCIATES (EOA) E06 $85,000 4% 12,339
Update and Develop Perform. Stds, Coordinate Maint Actvties, ID Struct Controls, Maint. Data Mgmt, Maint. Outreach, Maint Component Mgmt.
2 STAFF $5,760 0% 836
J. SCANLIN J06 48 80.00 $3,840
LABOR OVERHEAD $1,920
TOTAL MUNICIPAL MAINTENANCE $90,760 4% 13,175
HRS. 48
7. NEW DEVELOPMENT AND CONSTRUCTION SITE CONTROLS1 EISENBERG OLIVIERI ASSOCIATES (EOA) E07 $80,000 3% 11,613
Guidance on Stormwtr Controls, Constr. Actvties, Outreach, Perf. Stds. Wshed Inventry, Coord. w/ District, Component Mgmt.
2 REPROGRAPHIC SVCS. ALCOLINK (Brochures) $15,000 1% 2,177
Dexcription of service
3 STAFF $10,650 0% 1,546
D. BACH J07 100 47.00 $4,700
J. SCANLIN J07 30 80.00 $2,400
LABOR OVERHEAD $3,550
TOTAL NEW DEVELOPMENT AND CONSTRUCTION SITE CONTROLS $105,650 5% 15,337
HRS. 130
8. ILLICIT DISCHARGE CONTROLS1 EISENBERG OLIVIERI ASSOCIATES (EOA) E08 $35,000 1% 5,081
Assist to Eliminate Non-Stormwater Discharges, Analyze Illicit Discharge Findings, Share Information on Non-Stormwater Discharges, Illicit Discharge Reporting
2 STAFF $5,760 0% 836
J. SCANLIN J08 48 80.00 $3,840
LABOR OVERHEAD $1,920
TOTAL ILLICIT DISCHARGE CONTROLS $40,760 2% 5,917
HRS. 48
9. INDUSTRIAL INSPECTION PROGRAM1 EISENBERG OLIVIERI ASSOCIATES (EOA) E09 $115,000 5% 16,694
Conduct Insp & Outreach Activtes, Track Findings, Share Info on Facilites, Refine Indus BMP Guidelilnes, Insp Training, Insp Reporting
2 STAFF $5,340 0% 775
J. SCANLIN J09 45 80.00 $3,560
LABOR OVERHEAD $1,780
TOTAL INDUSTRIAL INSPECTION PROGRAM $120,340 5% 17,469
CLEAN WATER DIV. STAFF HRS. 45
TOTAL GENERAL PROGRAM $2,342,113 100% 339,990
STAFF HRS AMOUNT FUNDING PROGRAM DETAILS:MAKE ENTRIES D. Bach 100 $4,700 AVAILABLE FUND BALANCE STAFF WITH OVERHEAD $494,613IN YELLOW SHADED L. Cervantes 850 $45,050 $242,113 (for current fiscal year) SPECIALIZED SERVICES $1,752,500CELLS ONLY E. da Costa 49 $2,842 OTHER EXPENSES (fees, etc.) $95,000
A. Feng 1,355 $85,365 CONTRIBUTIONS PROPORTION PROGRAM TOTAL: $2,342,113S. Gosselin 70 $4,900 5083 $83,580 0.03980 ALAMEDA
R. Hale 300 $25,500 5084 $21,000 0.01000 ALBANY S. Miller 300 $12,900 5085 $107,310 0.05110 BERKELEY
J. Scanlin 1,690 $135,160 5086 $49,350 0.02350 DUBLIN To change revision date, G. Shawley 195 $12,285 5087 $21,000 0.01000 EMERYVILLE go to tab entitled Trainee 40 $1,040 5088 $339,990 0.16190 FREMONT ALTERNATIVES - TOTAL HOURS 4,949 5089 $235,410 0.11210 HAYWARD STAFFING TOTAL BURDENED LABOR $329,742 5090 $123,270 0.05870 LIVERMORE & COSTS TOTAL STAFF with overhead $494,613 5091 $57,750 0.02750 NEWARK DETAIL: MULTI-TASK CONSULTANTS
5092 $462,420 0.22020 OAKLAND EOA TOTAL $583,000REVISION: 2/3/02 5093 $21,000 0.01000 PIEDMONT AMS TOTAL $130,000
5094 $114,030 0.05430 PLEASANTON 5096 $104,160 0.04960 SAN LEANDRO 5097 $104,790 0.04990 UNION CITY 5082 $254,940 0.12140 UNINCORPORATED AREA (from F15W82 spread)
TOTAL CONTRIBUTIONS $2,100,000 1.00000 TOTAL SHARES(Source: Hale, pers. comm., 7/15/04) TOTAL FUNDING $2,342,113
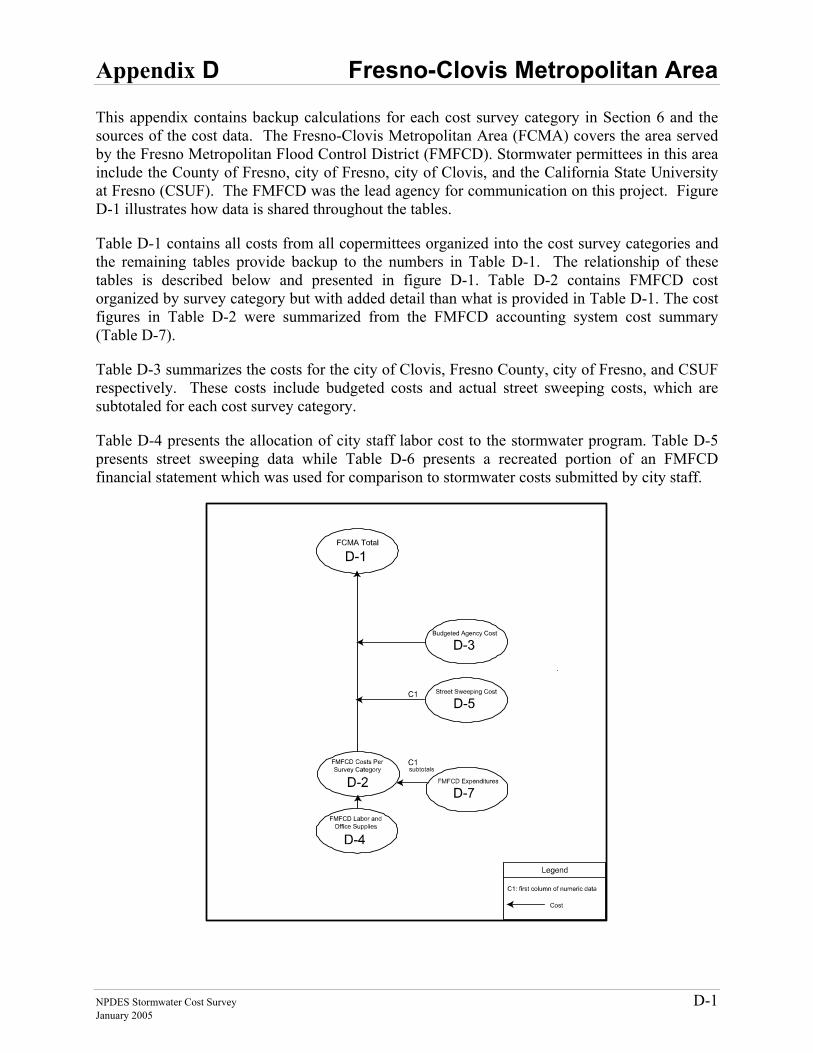
Appendix D Fresno-Clovis Metropolitan Area
NPDES Stormwater Cost Survey D-1 January 2005
APPENDIX D This appendix contains backup calculations for each cost survey category in Section 6 and the sources of the cost data. The Fresno-Clovis Metropolitan Area (FCMA) covers the area served by the Fresno Metropolitan Flood Control District (FMFCD). Stormwater permittees in this area include the County of Fresno, city of Fresno, city of Clovis, and the California State University at Fresno (CSUF). The FMFCD was the lead agency for communication on this project. Figure D-1 illustrates how data is shared throughout the tables.
Table D-1 contains all costs from all copermittees organized into the cost survey categories and the remaining tables provide backup to the numbers in Table D-1. The relationship of these tables is described below and presented in figure D-1. Table D-2 contains FMFCD cost organized by survey category but with added detail than what is provided in Table D-1. The cost figures in Table D-2 were summarized from the FMFCD accounting system cost summary (Table D-7).
Table D-3 summarizes the costs for the city of Clovis, Fresno County, city of Fresno, and CSUF respectively. These costs include budgeted costs and actual street sweeping costs, which are subtotaled for each cost survey category.
Table D-4 presents the allocation of city staff labor cost to the stormwater program. Table D-5 presents street sweeping data while Table D-6 presents a recreated portion of an FMFCD financial statement which was used for comparison to stormwater costs submitted by city staff.
Appendix D Fresno-Clovis Metropolitan Area
D-2 NPDES Stormwater Cost Survey January 2005
Figure D-1. Fresno-Clovis Metropolitan Area Flowchart
Other Agency Breakdown Table D-3 contains the budgeted costs contained in the SWQMP report (FMFCD, 1999). These costs are subtotaled for each cost survey category and the subtotals are brought forward to Table D-1. Except for the FMFCD, which submitted actual costs, the costs were taken from the 00/01 budget for the other agencies as presented in the SWMP published in 1999 (FMFCD, 1999). The 00/01 year was used because the implementation of the program under the new permit was delayed for two years. The SWMP assumed the permit would be adopted in 1999 and the first fiscal year of the new program would be 99/00. The permit was not adopted until 2001 and the first fiscal year implementing the new stormwater permit was 00/01. In 02/03, the program only had one year of development. Thus, the second year costs were taken from the SWMP to represent 02/03 costs on the advice of FMFCD staff. Table D-3 includes a ‘baseline’ cost element. This is for the staff labor of the programs as they already existed at the start of the new permit (Rourke, pers. comm., 6/25/04). Table D-3 also contains an added line item for actual street sweeping costs pulled forward from Table D-5.
Table D-5 contains the street sweeping data collected for the FCMA. Table D-9 also calculates street sweeping cost per mile and estimated sweeping frequency. It should be noted that the estimated frequency for the city of Clovis is nearly four times a week for all streets. This seemed high and it could not be verified with the city. The cost per mile was relatively low ($13), which indicates the costs may be accurate and only the total miles swept is in question.
Notes on Labor Cost For the FMFCD, the labor costs of the stormwater staff is not distributed among the various programs. Instead, it is all captured under Overall Stormwater Program Management. However, the labor costs from the other agencies within the FMFCD were able to distribute their labor among various programs. This should be considered when comparing costs to other municipalities where such costs are distributed.
Detailed descriptions of how the costs were developed are contained in the following paragraphs.
The reason we allocate FMFCD cost, but not other overall program costs for other cities is because the services provided by outside agencies (e.g. ACCWP to Fremont) are paid for by Fremont. FMFCD gets funds for stormwater directly from households “user fees”, “utility bills”. If FMFCD did not provide this “free” service, the cities would have to pay for them.
For agencies other than FMFCD, external contracting was not determined for each cost. It is only presented in the text of this appendix on a case-by-case basis. For FMFCD this information is presented in Table D-2.
Appendix D Fresno-Clovis Metropolitan Area
NPDES Stormwater Cost Survey D-3 January 2005
Construction Site Stormwater Runoff Control The total cost of this category was $81,800. The costs allocated for this category were only from the city of Clovis (Table D-2), county of Fresno (Table D-3), and the city of Fresno (Table D-4). No statistics were available that described the activity except for the city of Clovis. Clovis conducted 713 inspections at a cost of $29,600, which averages to $42 per inspection. The primary activities performed by each agency were plan reviews, site inspections, enforcement, and employee training. Other activities performed were as follows (source: annual stormwater report, FMFCD, 2003b):
• Identified 163 private detention basins and mailed pond maintenance and vector control fact sheets to pond owners
• Conducted 9 stormwater training workshops and safety tailgate sessions for general contractors, construction site superintendents, field inspectors, plan designers, and municipal regulators
• Increased construction sire inspections and follow-up inspection referrals to the District
• Reviewed construction site guidelines
• Sent out an “Action Alert” notifying area construction sites and companies of new Phase II regulations and schedules
• Included new regulations in training courses and site visits
• Modified the SWPPP to include sampling and analysis guidance
• The District conducted 48 inspections at 15 construction sites
Illicit Discharge Detection and Elimination (IDDE) The total cost of this category was $13,176. This cost was for investigation, inspection and enforcement. The costs for the FMFCD, county of Fresno, the city of Clovis, and the city of Fresno accounted for two percent, eight percent, eighty-two percent, and eight percent of the IDDE costs, respectively. Activities in this category included the following (source: annual stormwater report, FMFCD, 2003b):
• Field inspectors were trained to identify and report illegal disposals
• Fifty thousand paint sticks were distributed at 17 paint retailers throughout the permit area
• Recharged irrigation waters and nuisance flows
• Participated in Water Awareness Committee and P2 Committee
• Reviewed and revised referral procedures between the District and Copermittees
• Conducted inspector training via workshops and tailgates
• Conducted firefighter training
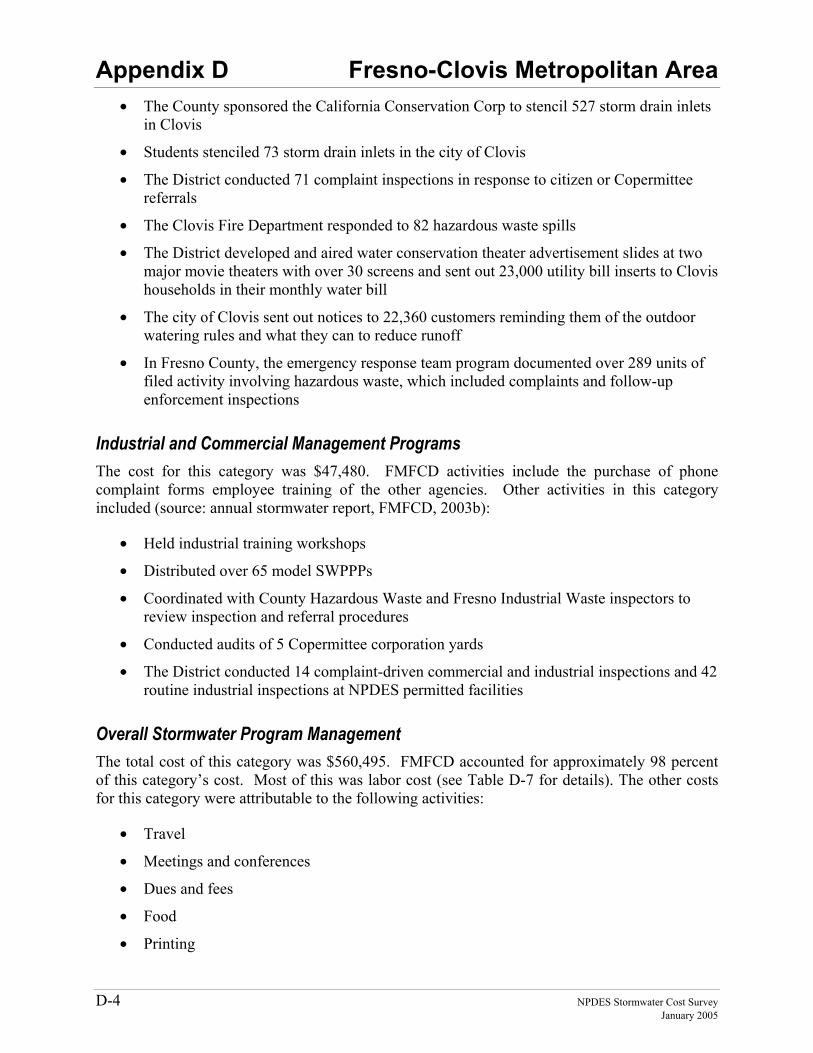
Appendix D Fresno-Clovis Metropolitan Area
D-4 NPDES Stormwater Cost Survey January 2005
• The County sponsored the California Conservation Corp to stencil 527 storm drain inlets in Clovis
• Students stenciled 73 storm drain inlets in the city of Clovis
• The District conducted 71 complaint inspections in response to citizen or Copermittee referrals
• The Clovis Fire Department responded to 82 hazardous waste spills
• The District developed and aired water conservation theater advertisement slides at two major movie theaters with over 30 screens and sent out 23,000 utility bill inserts to Clovis households in their monthly water bill
• The city of Clovis sent out notices to 22,360 customers reminding them of the outdoor watering rules and what they can to reduce runoff
• In Fresno County, the emergency response team program documented over 289 units of filed activity involving hazardous waste, which included complaints and follow-up enforcement inspections
Industrial and Commercial Management Programs The cost for this category was $47,480. FMFCD activities include the purchase of phone complaint forms employee training of the other agencies. Other activities in this category included (source: annual stormwater report, FMFCD, 2003b):
• Held industrial training workshops
• Distributed over 65 model SWPPPs
• Coordinated with County Hazardous Waste and Fresno Industrial Waste inspectors to review inspection and referral procedures
• Conducted audits of 5 Copermittee corporation yards
• The District conducted 14 complaint-driven commercial and industrial inspections and 42 routine industrial inspections at NPDES permitted facilities
Overall Stormwater Program Management The total cost of this category was $560,495. FMFCD accounted for approximately 98 percent of this category’s cost. Most of this was labor cost (see Table D-7 for details). The other costs for this category were attributable to the following activities:
• Travel
• Meetings and conferences
• Dues and fees
• Food
• Printing
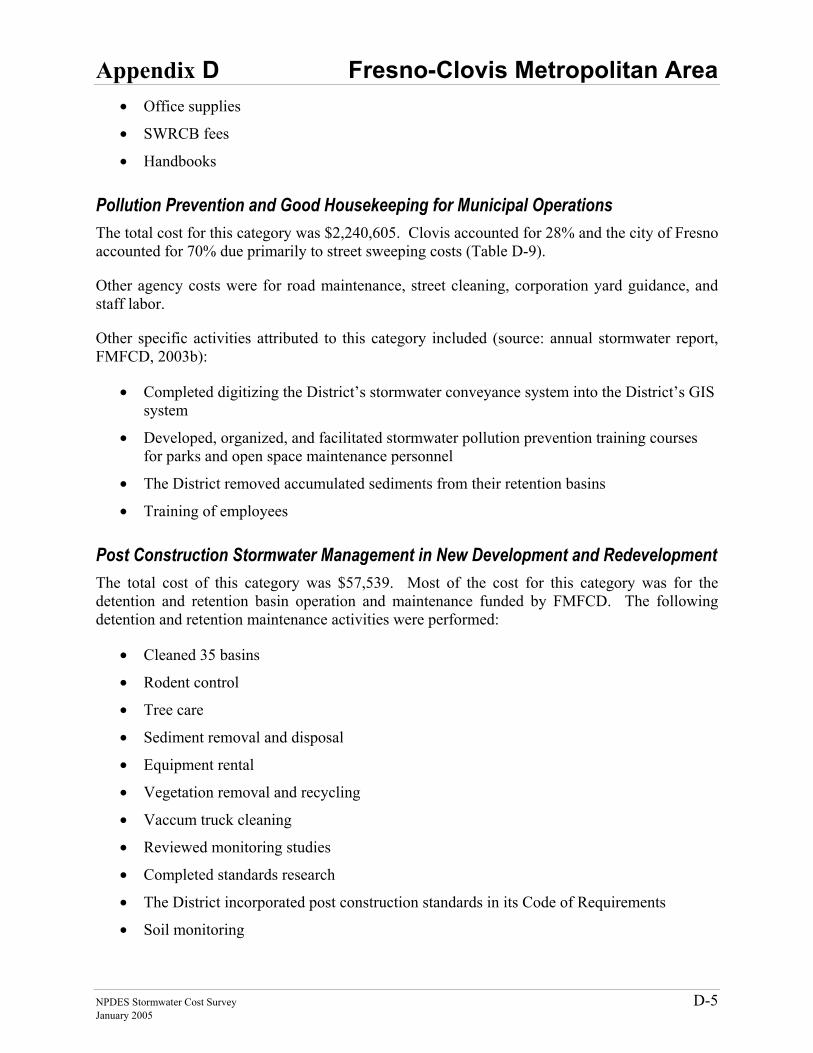
Appendix D Fresno-Clovis Metropolitan Area
NPDES Stormwater Cost Survey D-5 January 2005
• Office supplies
• SWRCB fees
• Handbooks
Pollution Prevention and Good Housekeeping for Municipal Operations The total cost for this category was $2,240,605. Clovis accounted for 28% and the city of Fresno accounted for 70% due primarily to street sweeping costs (Table D-9).
Other agency costs were for road maintenance, street cleaning, corporation yard guidance, and staff labor.
Other specific activities attributed to this category included (source: annual stormwater report, FMFCD, 2003b):
• Completed digitizing the District’s stormwater conveyance system into the District’s GIS system
• Developed, organized, and facilitated stormwater pollution prevention training courses for parks and open space maintenance personnel
• The District removed accumulated sediments from their retention basins
• Training of employees
Post Construction Stormwater Management in New Development and Redevelopment The total cost of this category was $57,539. Most of the cost for this category was for the detention and retention basin operation and maintenance funded by FMFCD. The following detention and retention maintenance activities were performed:
• Cleaned 35 basins
• Rodent control
• Tree care
• Sediment removal and disposal
• Equipment rental
• Vegetation removal and recycling
• Vaccum truck cleaning
• Reviewed monitoring studies
• Completed standards research
• The District incorporated post construction standards in its Code of Requirements
• Soil monitoring

Appendix D Fresno-Clovis Metropolitan Area
D-6 NPDES Stormwater Cost Survey January 2005
• Fence repair
The other agencies had no cost attributable to this category.
Public Education and Outreach and Public Involvement and Participation The total cost of this category was $210,716. Most of the $208,016 paid by FMFCD was for professional services, newspaper advertisements, utility bill inserts, and other miscellaneous costs. The other agency costs were for school education, staff labor, and coordination with other programs. Other activities performed were (source: annual stormwater report, FMFCD, 2003b):
• Developed and aired three new Public Service Announcements (English and Spanish) targeting pollution prevention and water awareness
• Completed seven Clean Storm Water Grants to community organizations focused on stormwater education
• Continued implementation of a community wide integrated pest management program
• Conducted numerous presentations to community groups and school programs
• Produced a new brochure
• Participated in the local Pollution Prevention Committee
• Provided training for local inspectors
• The District maintained active membership with WERF, participated with the National Association of Flood and Storm Water Managers Association, provided $10,000 to WERF for stormwater research initiatives, and provided comments to EPA though the Storm Water Quality Task Force
• Participated in 18 community and public education events
• Provided a public education display illustrating ways to manage solid waste to incorporated cities throughout the County
• Conducted tours of the American Avenue Landfill for fourth grade to college level students
• Developed training manuals, theater slides, bus signage, pond maintenance fact sheets, mosquito abatement, control, and home owner fact sheets to promote BMPs and the SWQMP program
• Updated public education and technical assistance outreach materials
• Developed and implemented IPM Point of Purchase program
• Awarded 20 grants totaling $20,000
• Provided teacher workshops
Appendix D Fresno-Clovis Metropolitan Area
NPDES Stormwater Cost Survey D-7 January 2005
Water Quality Monitoring The total cost of this category was $252,918. The costs were for the FMFCD for the following activities:
• Monitoring
• Consulting
• Phone usage
• Communications
• WERF subscription
The other agencies had no cost attributable to this category.
References FMFCD. 2003. “Annual Report FY 2002-2003, Fresno-Clovis Storm Water Quality
Management Program” Volume 1: Program Evaluations.
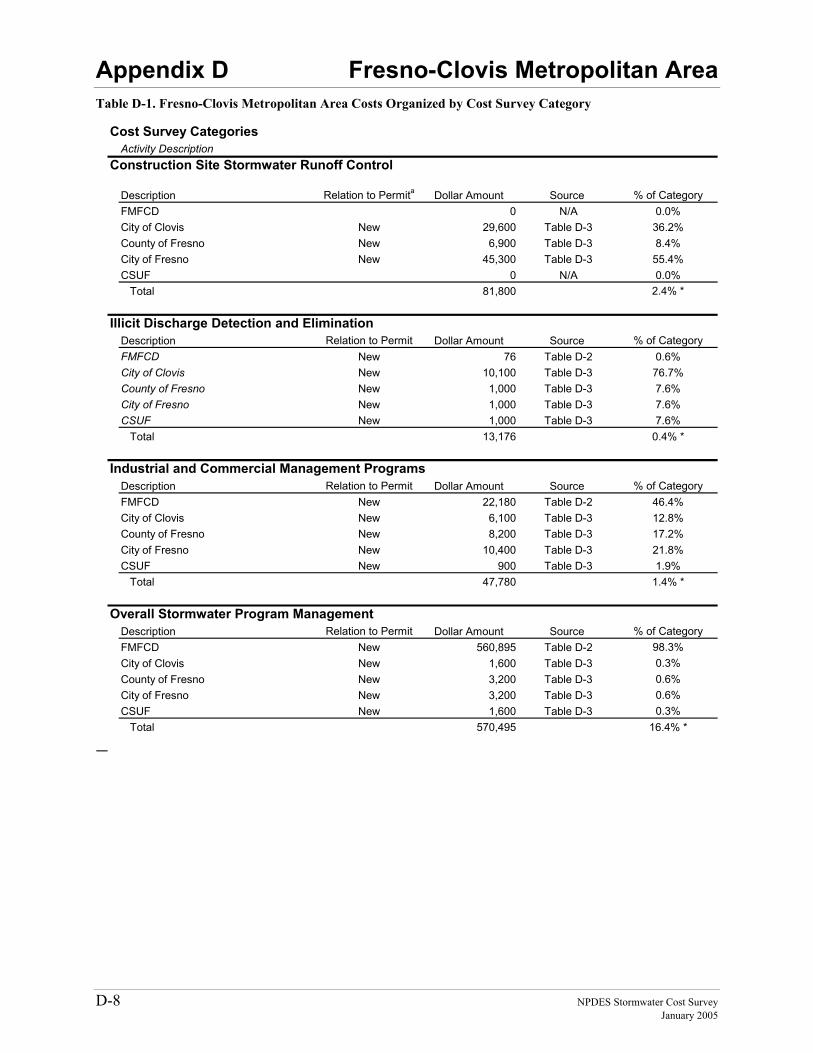
Appendix D Fresno-Clovis Metropolitan Area
D-8 NPDES Stormwater Cost Survey January 2005
Table D-1. Fresno-Clovis Metropolitan Area Costs Organized by Cost Survey Category
Cost Survey CategoriesActivity Description
Construction Site Stormwater Runoff Control
Description Relation to Permita Dollar Amount Source % of CategoryFMFCD 0 N/A 0.0%City of Clovis New 29,600 Table D-3 36.2%County of Fresno New 6,900 Table D-3 8.4%City of Fresno New 45,300 Table D-3 55.4%CSUF 0 N/A 0.0% Total 81,800 2.4% *
Illicit Discharge Detection and EliminationDescription Relation to Permit Dollar Amount Source % of CategoryFMFCD New 76 Table D-2 0.6%City of Clovis New 10,100 Table D-3 76.7%County of Fresno New 1,000 Table D-3 7.6%City of Fresno New 1,000 Table D-3 7.6%CSUF New 1,000 Table D-3 7.6% Total 13,176 0.4% *
Industrial and Commercial Management ProgramsDescription Relation to Permit Dollar Amount Source % of CategoryFMFCD New 22,180 Table D-2 46.4%City of Clovis New 6,100 Table D-3 12.8%County of Fresno New 8,200 Table D-3 17.2%City of Fresno New 10,400 Table D-3 21.8%CSUF New 900 Table D-3 1.9% Total 47,780 1.4% *
Overall Stormwater Program ManagementDescription Relation to Permit Dollar Amount Source % of CategoryFMFCD New 560,895 Table D-2 98.3%City of Clovis New 1,600 Table D-3 0.3%County of Fresno New 3,200 Table D-3 0.6%City of Fresno New 3,200 Table D-3 0.6%CSUF New 1,600 Table D-3 0.3% Total 570,495 16.4% *
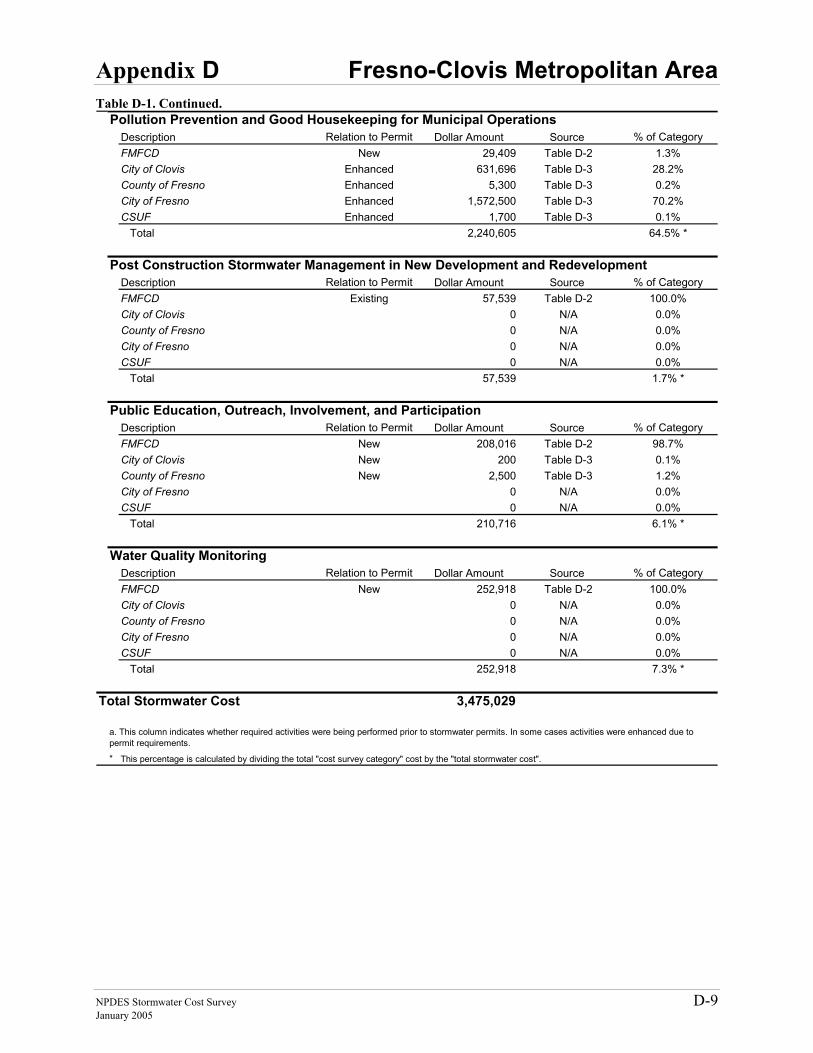
Appendix D Fresno-Clovis Metropolitan Area
NPDES Stormwater Cost Survey D-9 January 2005
Table D-1. Continued. Pollution Prevention and Good Housekeeping for Municipal Operations
Description Relation to Permit Dollar Amount Source % of CategoryFMFCD New 29,409 Table D-2 1.3%City of Clovis Enhanced 631,696 Table D-3 28.2%County of Fresno Enhanced 5,300 Table D-3 0.2%City of Fresno Enhanced 1,572,500 Table D-3 70.2%CSUF Enhanced 1,700 Table D-3 0.1% Total 2,240,605 64.5% *
Post Construction Stormwater Management in New Development and RedevelopmentDescription Relation to Permit Dollar Amount Source % of CategoryFMFCD Existing 57,539 Table D-2 100.0%City of Clovis 0 N/A 0.0%County of Fresno 0 N/A 0.0%City of Fresno 0 N/A 0.0%CSUF 0 N/A 0.0% Total 57,539 1.7% *
Public Education, Outreach, Involvement, and ParticipationDescription Relation to Permit Dollar Amount Source % of CategoryFMFCD New 208,016 Table D-2 98.7%City of Clovis New 200 Table D-3 0.1%County of Fresno New 2,500 Table D-3 1.2%City of Fresno 0 N/A 0.0%CSUF 0 N/A 0.0% Total 210,716 6.1% *
Water Quality MonitoringDescription Relation to Permit Dollar Amount Source % of CategoryFMFCD New 252,918 Table D-2 100.0%City of Clovis 0 N/A 0.0%County of Fresno 0 N/A 0.0%City of Fresno 0 N/A 0.0%CSUF 0 N/A 0.0% Total 252,918 7.3% *
Total Stormwater Cost 3,475,029
* This percentage is calculated by dividing the total "cost survey category" cost by the "total stormwater cost".
a. This column indicates whether required activities were being performed prior to stormwater permits. In some cases activities were enhanced due to permit requirements.
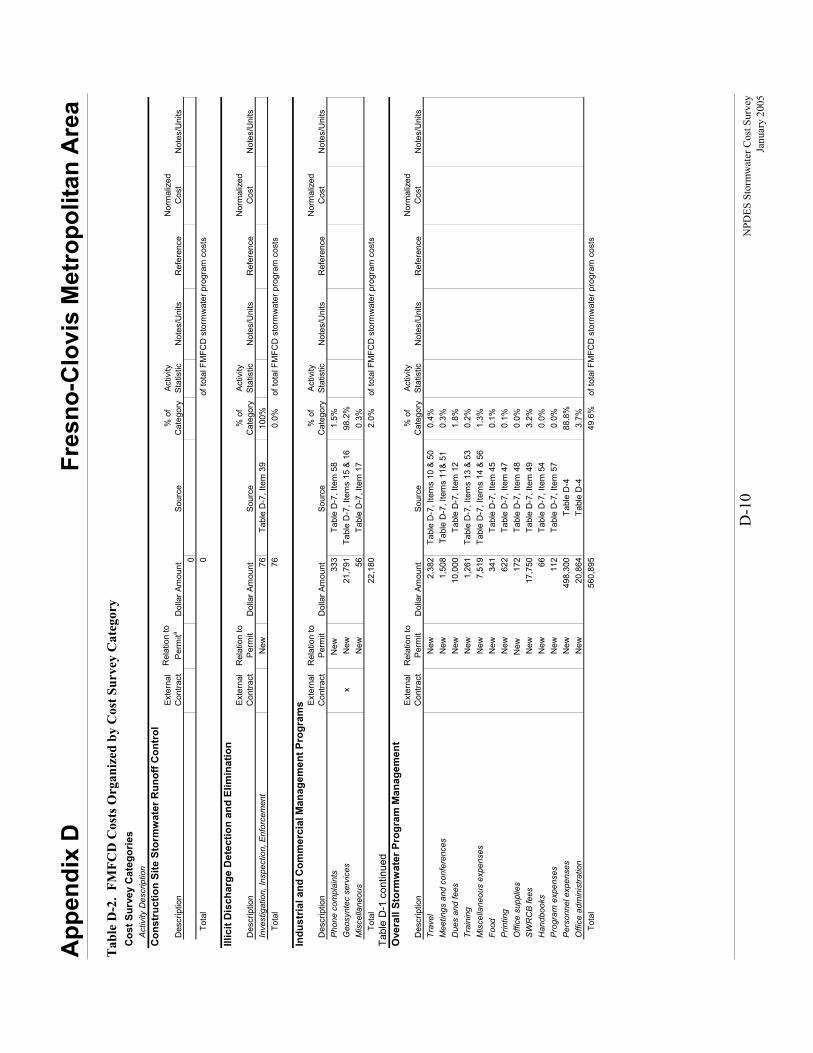
App
endi
x D
Fr
esno
-Clo
vis
Met
ropo
litan
Are
a
D
-10
NPD
ES S
torm
wat
er C
ost S
urve
y
Ja
nuar
y 20
05
Tab
le D
-2.
FMFC
D C
osts
Org
aniz
ed b
y C
ost S
urve
y C
ateg
ory
Cos
t Sur
vey
Cat
egor
ies
A
ctiv
ity D
escr
iptio
nC
onst
ruct
ion
Site
Sto
rmw
ater
Run
off C
ontr
ol
Des
crip
tion
Exte
rnal
C
ontra
ctR
elat
ion
to
Per
mita
Dol
lar A
mou
ntSo
urce
%
of
Cat
egor
yA
ctiv
ity
Stat
istic
Not
es/U
nits
Ref
eren
ceN
orm
aliz
ed
Cos
tN
otes
/Uni
ts0
To
tal
0of
tota
l FM
FCD
sto
rmw
ater
pro
gram
cos
ts
Illic
it D
isch
arge
Det
ectio
n an
d El
imin
atio
n
Des
crip
tion
Exte
rnal
C
ontra
ctR
elat
ion
to
Per
mit
Dol
lar A
mou
ntSo
urce
%
of
Cat
egor
yA
ctiv
ity
Stat
istic
Not
es/U
nits
Ref
eren
ceN
orm
aliz
ed
Cos
tN
otes
/Uni
tsIn
vest
igat
ion,
Insp
ectio
n, E
nfor
cem
ent
New
76Ta
ble
D-7
, Ite
m 3
910
0%
Tota
l76
0.0%
of to
tal F
MFC
D s
torm
wat
er p
rogr
am c
osts
Indu
stria
l and
Com
mer
cial
Man
agem
ent P
rogr
ams
Des
crip
tion
Exte
rnal
C
ontra
ctR
elat
ion
to
Per
mit
Dol
lar A
mou
ntSo
urce
%
of
Cat
egor
yA
ctiv
ity
Stat
istic
Not
es/U
nits
Ref
eren
ceN
orm
aliz
ed
Cos
tN
otes
/Uni
tsP
hone
com
plai
nts
New
33
3Ta
ble
D-7
, Ite
m 5
81.
5%G
eosy
ntec
ser
vice
sx
New
21,7
91Ta
ble
D-7
, Ite
ms
15 &
16
98.2
%M
isce
llane
ous
New
56Ta
ble
D-7
, Ite
m 1
70.
3%
Tota
l22
,180
2.0%
of to
tal F
MFC
D s
torm
wat
er p
rogr
am c
osts
Tabl
e D
-1 c
ontin
ued
Ove
rall
Stor
mw
ater
Pro
gram
Man
agem
ent
Des
crip
tion
Exte
rnal
C
ontra
ctR
elat
ion
to
Per
mit
Dol
lar A
mou
ntSo
urce
%
of
Cat
egor
yA
ctiv
ity
Stat
istic
Not
es/U
nits
Ref
eren
ceN
orm
aliz
ed
Cos
tN
otes
/Uni
tsTr
avel
N
ew2,
382
Tabl
e D
-7, I
tem
s 10
& 5
00.
4%M
eetin
gs a
nd c
onfe
renc
esN
ew1,
508
Tabl
e D
-7, I
tem
s 11
& 5
10.
3%D
ues
and
fees
New
10,0
00Ta
ble
D-7
, Ite
m 1
21.
8%Tr
aini
ngN
ew1,
261
Tabl
e D
-7, I
tem
s 13
& 5
30.
2%M
isce
llane
ous
expe
nses
New
7,51
9Ta
ble
D-7
, Ite
ms
14 &
56
1.3%
Food
New
341
Tabl
e D
-7, I
tem
45
0.1%
Prin
ting
New
622
Tabl
e D
-7, I
tem
47
0.1%
Offi
ce s
uppl
ies
New
17
2Ta
ble
D-7
, Ite
m 4
80.
0%S
WR
CB
fees
New
17,7
50Ta
ble
D-7
, Ite
m 4
93.
2%H
andb
ooks
New
66Ta
ble
D-7
, Ite
m 5
40.
0%P
rogr
am e
xpen
ses
New
112
Tabl
e D
-7, I
tem
57
0.0%
Per
sonn
el e
xpen
ses
New
498,
300
Tabl
e D
-488
.8%
Offi
ce a
dmin
istra
tion
New
20,8
64Ta
ble
D-4
3.7%
To
tal
560,
895
49
.6%
of to
tal F
MFC
D s
torm
wat
er p
rogr
am c
osts
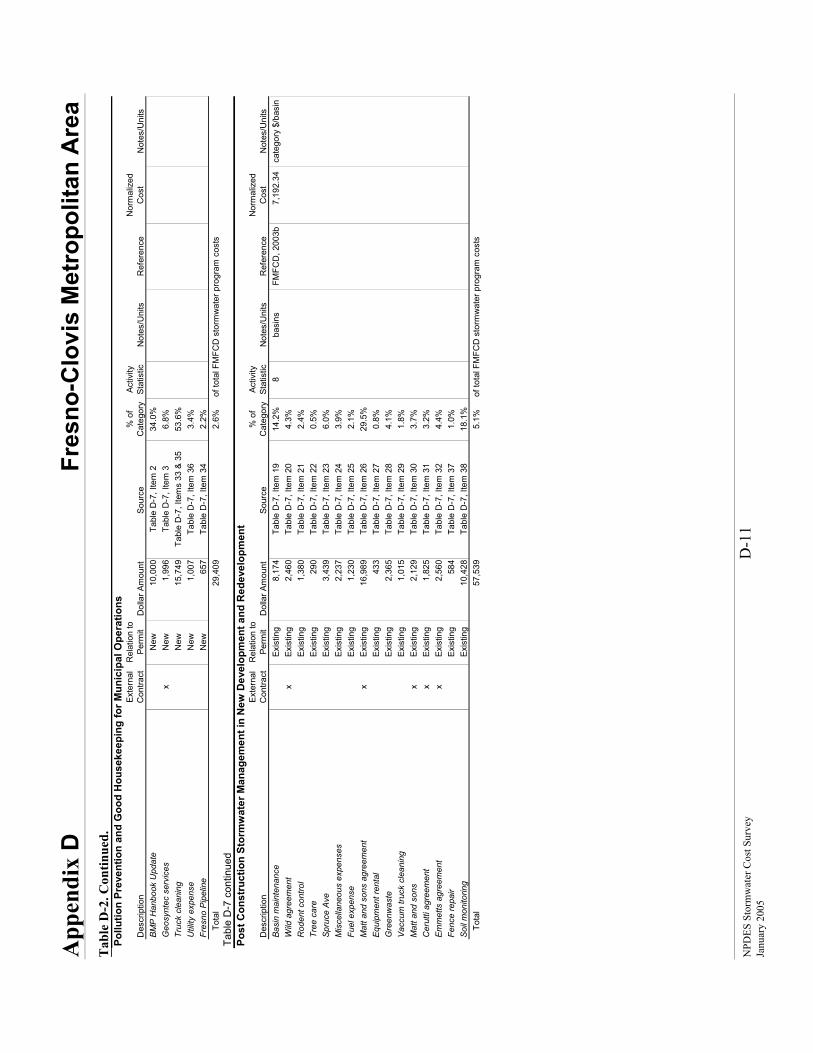
App
endi
x D
Fre
sno-
Clo
vis
Met
ropo
litan
Are
a
NPD
ES S
torm
wat
er C
ost S
urve
y D
-11
Ja
nuar
y 20
05
Tab
le D
-2. C
ontin
ued.
Po
llutio
n Pr
even
tion
and
Goo
d H
ouse
keep
ing
for M
unic
ipal
Ope
ratio
ns
Des
crip
tion
Ext
erna
l C
ontra
ctR
elat
ion
to
Perm
itD
olla
r Am
ount
Sour
ce
% o
f C
ateg
ory
Activ
ity
Stat
istic
Not
es/U
nits
Ref
eren
ceN
orm
aliz
ed
Cos
tN
otes
/Uni
tsBM
P H
anbo
ok U
pdat
eN
ew10
,000
Tabl
e D
-7, I
tem
234
.0%
Geo
synt
ec s
ervi
ces
xN
ew1,
996
Tabl
e D
-7, I
tem
36.
8%Tr
uck
clea
ning
New
15,7
49 T
able
D-7
, Ite
ms
33 &
35
53.6
%U
tility
exp
ense
New
1,00
7Ta
ble
D-7
, Ite
m 3
63.
4%Fr
esno
Pip
elin
eN
ew65
7Ta
ble
D-7
, Ite
m 3
42.
2%
Tota
l29
,409
2.6%
of to
tal F
MFC
D s
torm
wat
er p
rogr
am c
osts
Tabl
e D
-7 c
ontin
ued
Post
Con
stru
ctio
n St
orm
wat
er M
anag
emen
t in
New
Dev
elop
men
t and
Red
evel
opm
ent
Des
crip
tion
Ext
erna
l C
ontra
ctR
elat
ion
to
Perm
itD
olla
r Am
ount
Sour
ce
% o
f C
ateg
ory
Activ
ity
Stat
istic
Not
es/U
nits
Ref
eren
ceN
orm
aliz
ed
Cos
tN
otes
/Uni
tsBa
sin
mai
nten
ance
Exis
ting
8,17
4Ta
ble
D-7
, Ite
m 1
914
.2%
8ba
sins
FMFC
D, 2
003b
7,19
2.34
cate
gory
$/b
asin
Wild
agr
eem
ent
xEx
istin
g2,
460
Tabl
e D
-7, I
tem
20
4.3%
Rod
ent c
ontro
lEx
istin
g1,
380
Tabl
e D
-7, I
tem
21
2.4%
Tree
car
eEx
istin
g29
0Ta
ble
D-7
, Ite
m 2
20.
5%Sp
ruce
Ave
Exis
ting
3,43
9Ta
ble
D-7
, Ite
m 2
36.
0%M
isce
llane
ous
expe
nses
Exis
ting
2,23
7Ta
ble
D-7
, Ite
m 2
43.
9%Fu
el e
xpen
seEx
istin
g1,
230
Tabl
e D
-7, I
tem
25
2.1%
Mat
t and
son
s ag
reem
ent
xEx
istin
g16
,989
Tabl
e D
-7, I
tem
26
29.5
%Eq
uipm
ent r
enta
lEx
istin
g43
3Ta
ble
D-7
, Ite
m 2
70.
8%G
reen
was
teEx
istin
g2,
365
Tabl
e D
-7, I
tem
28
4.1%
Vacc
um tr
uck
clea
ning
Exis
ting
1,01
5Ta
ble
D-7
, Ite
m 2
91.
8%M
att a
nd s
ons
x
Exis
ting
2,12
9Ta
ble
D-7
, Ite
m 3
03.
7%C
erut
ti ag
reem
ent
xEx
istin
g1,
825
Tabl
e D
-7, I
tem
31
3.2%
Emm
etts
agr
eem
ent
xEx
istin
g2,
560
Tabl
e D
-7, I
tem
32
4.4%
Fenc
e re
pair
Exis
ting
584
Tabl
e D
-7, I
tem
37
1.0%
Soil
mon
itorin
gEx
istin
g10
,428
Tabl
e D
-7, I
tem
38
18.1
%
Tota
l57
,539
5.1%
of to
tal F
MFC
D s
torm
wat
er p
rogr
am c
osts
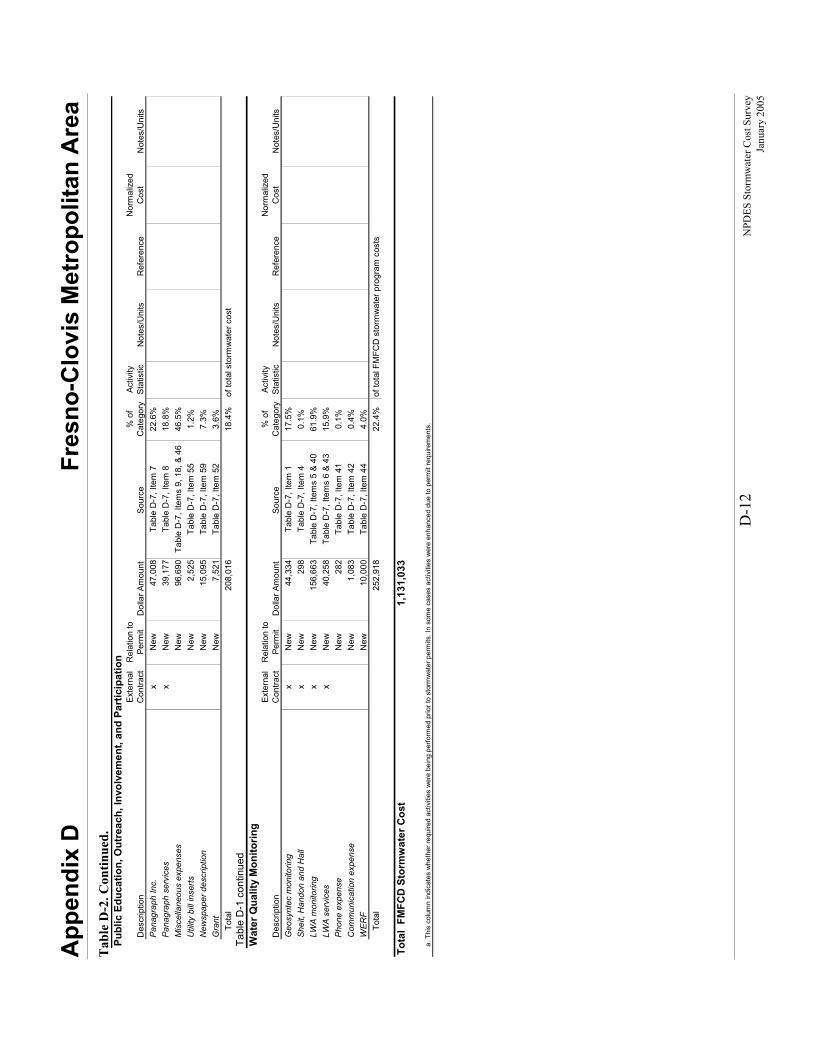
App
endi
x D
Fr
esno
-Clo
vis
Met
ropo
litan
Are
a
D
-12
NPD
ES S
torm
wat
er C
ost S
urve
y
Ja
nuar
y 20
05
Tab
le D
-2. C
ontin
ued.
Pu
blic
Edu
catio
n, O
utre
ach,
Invo
lvem
ent,
and
Part
icip
atio
n
Des
crip
tion
Ext
erna
l C
ontra
ctR
elat
ion
to
Perm
itD
olla
r Am
ount
Sour
ce
% o
f C
ateg
ory
Activ
ity
Stat
istic
Not
es/U
nits
Ref
eren
ceN
orm
aliz
ed
Cos
tN
otes
/Uni
tsPa
nagr
aph
Inc.
xN
ew47
,008
Tabl
e D
-7, I
tem
722
.6%
Pana
grap
h se
rvic
esx
New
39,1
77Ta
ble
D-7
, Ite
m 8
18.8
%M
isce
llane
ous
expe
nses
New
96,6
90Ta
ble
D-7
, Ite
ms
9, 1
8, &
46
46.5
%U
tility
bill
inse
rtsN
ew2,
525
Tabl
e D
-7, I
tem
55
1.2%
New
spap
er d
escr
iptio
nN
ew15
,095
Tabl
e D
-7, I
tem
59
7.3%
Gra
ntN
ew7,
521
Tabl
e D
-7, I
tem
52
3.6%
To
tal
208,
016
18.4
%of
tota
l sto
rmw
ater
cos
tTa
ble
D-1
con
tinue
dW
ater
Qua
lity
Mon
itorin
g
Des
crip
tion
Ext
erna
l C
ontra
ctR
elat
ion
to
Perm
itD
olla
r Am
ount
Sour
ce
% o
f C
ateg
ory
Activ
ity
Stat
istic
Not
es/U
nits
Ref
eren
ceN
orm
aliz
ed
Cos
tN
otes
/Uni
tsG
eosy
ntec
mon
itorin
gx
New
44,3
34Ta
ble
D-7
, Ite
m 1
17.5
%Sh
eit,
Han
don
and
Hal
lx
New
298
Tabl
e D
-7, I
tem
40.
1%LW
A m
onito
ring
xN
ew15
6,66
3Ta
ble
D-7
, Ite
ms
5 &
4061
.9%
LWA
ser
vice
sx
New
40,2
58Ta
ble
D-7
, Ite
ms
6 &
4315
.9%
Phon
e ex
pens
eN
ew28
2Ta
ble
D-7
, Ite
m 4
10.
1%C
omm
unic
atio
n ex
pens
eN
ew1,
083
Tabl
e D
-7, I
tem
42
0.4%
WER
FN
ew10
,000
Tabl
e D
-7, I
tem
44
4.0%
To
tal
252,
918
22.4
%of
tota
l FM
FCD
sto
rmw
ater
pro
gram
cos
ts
Tota
l FM
FCD
Sto
rmw
ater
Cos
t1,
131,
033
a. T
his
colu
mn
indi
cate
s w
heth
er re
quire
d ac
tiviti
es w
ere
bein
g pe
rform
ed p
rior t
o st
orm
wat
er p
erm
its. I
n so
me
case
s ac
tiviti
es w
ere
enha
nced
due
to p
erm
it re
quire
men
ts.
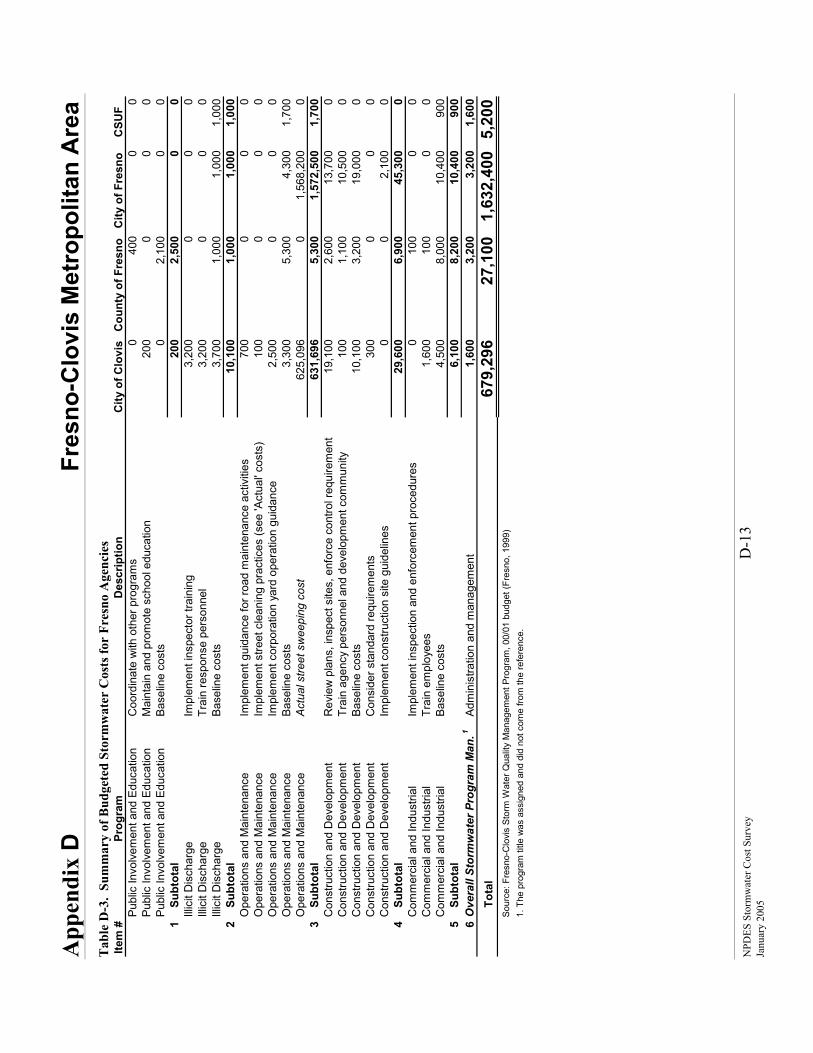
App
endi
x D
Fre
sno-
Clo
vis
Met
ropo
litan
Are
a
NPD
ES S
torm
wat
er C
ost S
urve
y D
-13
Ja
nuar
y 20
05
Tab
le D
-3.
Sum
mar
y of
Bud
gete
d St
orm
wat
er C
osts
for
Fres
no A
genc
ies
Item
#Pr
ogra
mD
escr
iptio
nC
ity o
f Clo
vis
Cou
nty
of F
resn
oC
ity o
f Fre
sno
CSU
FPu
blic
Invo
lvem
ent a
nd E
duca
tion
Coo
rdin
ate
with
oth
er p
rogr
ams
040
00
0Pu
blic
Invo
lvem
ent a
nd E
duca
tion
Mai
ntai
n an
d pr
omot
e sc
hool
edu
catio
n 20
00
00
Publ
ic In
volv
emen
t and
Edu
catio
nBa
selin
e co
sts
02,
100
00
1
Subt
otal
200
2,50
00
0Ill
icit
Dis
char
ge
Impl
emen
t ins
pect
or tr
aini
ng3,
200
00
0Ill
icit
Dis
char
ge
Trai
n re
spon
se p
erso
nnel
3,20
00
00
Illic
it D
isch
arge
Ba
selin
e co
sts
3,70
01,
000
1,00
01,
000
2
Subt
otal
10,1
001,
000
1,00
01,
000
Ope
ratio
ns a
nd M
aint
enan
ceIm
plem
ent g
uida
nce
for r
oad
mai
nten
ance
act
iviti
es70
00
00
Ope
ratio
ns a
nd M
aint
enan
ceIm
plem
ent s
treet
cle
anin
g pr
actic
es (s
ee 'A
ctua
l' co
sts)
100
00
0O
pera
tions
and
Mai
nten
ance
Impl
emen
t cor
pora
tion
yard
ope
ratio
n gu
idan
ce2,
500
00
0O
pera
tions
and
Mai
nten
ance
Ba
selin
e co
sts
3,30
05,
300
4,30
01,
700
Ope
ratio
ns a
nd M
aint
enan
ce
Act
ual s
treet
sw
eepi
ng c
ost
625,
096
01,
568,
200
03
Su
btot
al63
1,69
65,
300
1,57
2,50
01,
700
Con
stru
ctio
n an
d D
evel
opm
ent
Rev
iew
pla
ns, i
nspe
ct s
ites,
enf
orce
con
trol r
equi
rem
ent
19,1
002,
600
13,7
000
Con
stru
ctio
n an
d D
evel
opm
ent
Trai
n ag
ency
per
sonn
el a
nd d
evel
opm
ent c
omm
unity
100
1,10
010
,500
0C
onst
ruct
ion
and
Dev
elop
men
tBa
selin
e co
sts
10,1
003,
200
19,0
000
Con
stru
ctio
n an
d D
evel
opm
ent
Con
side
r sta
ndar
d re
quire
men
ts30
00
00
Con
stru
ctio
n an
d D
evel
opm
ent
Impl
emen
t con
stru
ctio
n si
te g
uide
lines
00
2,10
00
4
Subt
otal
29,6
006,
900
45,3
000
Com
mer
cial
and
Indu
stria
lIm
plem
ent i
nspe
ctio
n an
d en
forc
emen
t pro
cedu
res
010
00
0C
omm
erci
al a
nd In
dust
rial
Trai
n em
ploy
ees
1,60
010
00
0C
omm
erci
al a
nd In
dust
rial
Base
line
cost
s4,
500
8,00
010
,400
900
5
Subt
otal
6,10
08,
200
10,4
0090
06
Ove
rall
Stor
mw
ater
Pro
gram
Man
.1Ad
min
istra
tion
and
man
agem
ent
1,60
03,
200
3,20
01,
600
To
tal
679,
296
27,1
001,
632,
400
5,20
0So
urce
: Fre
sno-
Clo
vis
Stor
m W
ater
Qua
lity
Man
agem
ent P
rogr
am, 0
0/01
bud
get (
Fres
no, 1
999)
1. T
he p
rogr
am ti
tle w
as a
ssig
ned
and
did
not c
ome
from
the
refe
renc
e.
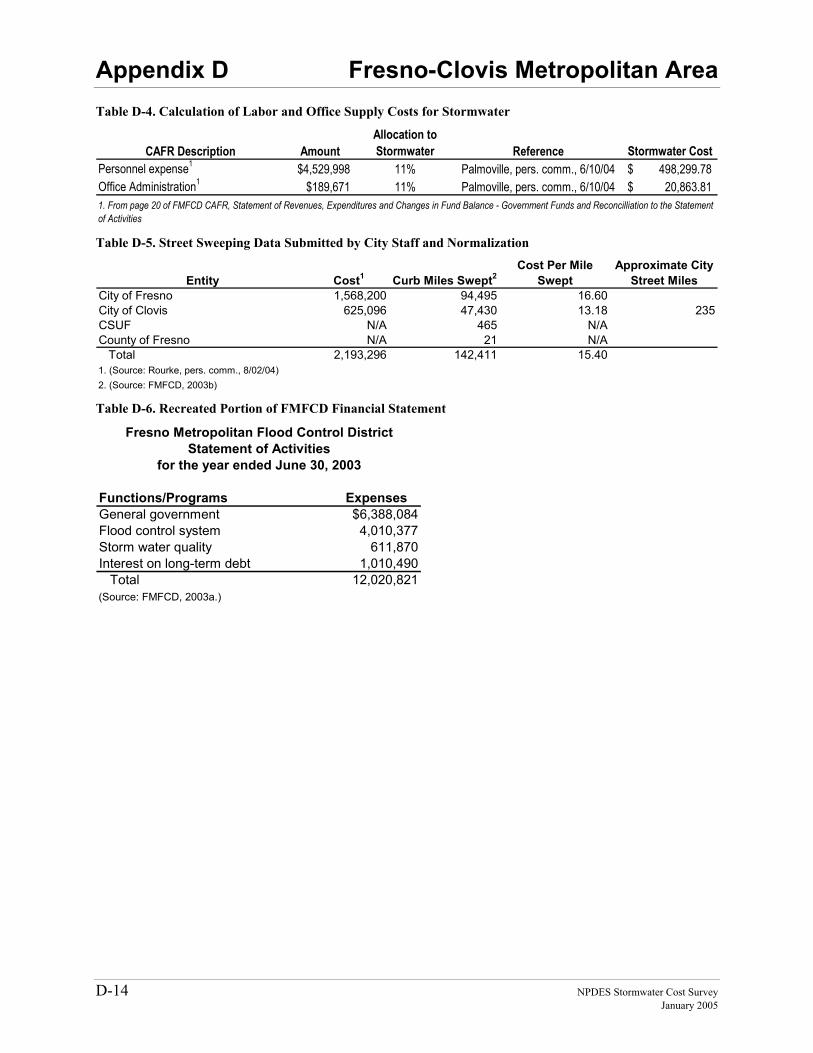
Appendix D Fresno-Clovis Metropolitan Area
D-14 NPDES Stormwater Cost Survey January 2005
Table D-4. Calculation of Labor and Office Supply Costs for Stormwater
CAFR Description AmountAllocation to Stormwater Reference Stormwater Cost
Personnel expense1 $4,529,998 11% Palmoville, pers. comm., 6/10/04 498,299.78$ Office Administration1 $189,671 11% Palmoville, pers. comm., 6/10/04 20,863.81$ 1. From page 20 of FMFCD CAFR, Statement of Revenues, Expenditures and Changes in Fund Balance - Government Funds and Reconcilliation to the Statement of Activities Table D-5. Street Sweeping Data Submitted by City Staff and Normalization
Entity Cost1 Curb Miles Swept2Cost Per Mile
SweptApproximate City
Street MilesCity of Fresno 1,568,200 94,495 16.60City of Clovis 625,096 47,430 13.18 235CSUF N/A 465 N/ACounty of Fresno N/A 21 N/A Total 2,193,296 142,411 15.401. (Source: Rourke, pers. comm., 8/02/04)2. (Source: FMFCD, 2003b) Table D-6. Recreated Portion of FMFCD Financial Statement
Functions/Programs ExpensesGeneral government $6,388,084Flood control system 4,010,377Storm water quality 611,870Interest on long-term debt 1,010,490 Total 12,020,821(Source: FMFCD, 2003a.)
Fresno Metropolitan Flood Control DistrictStatement of Activities
for the year ended June 30, 2003
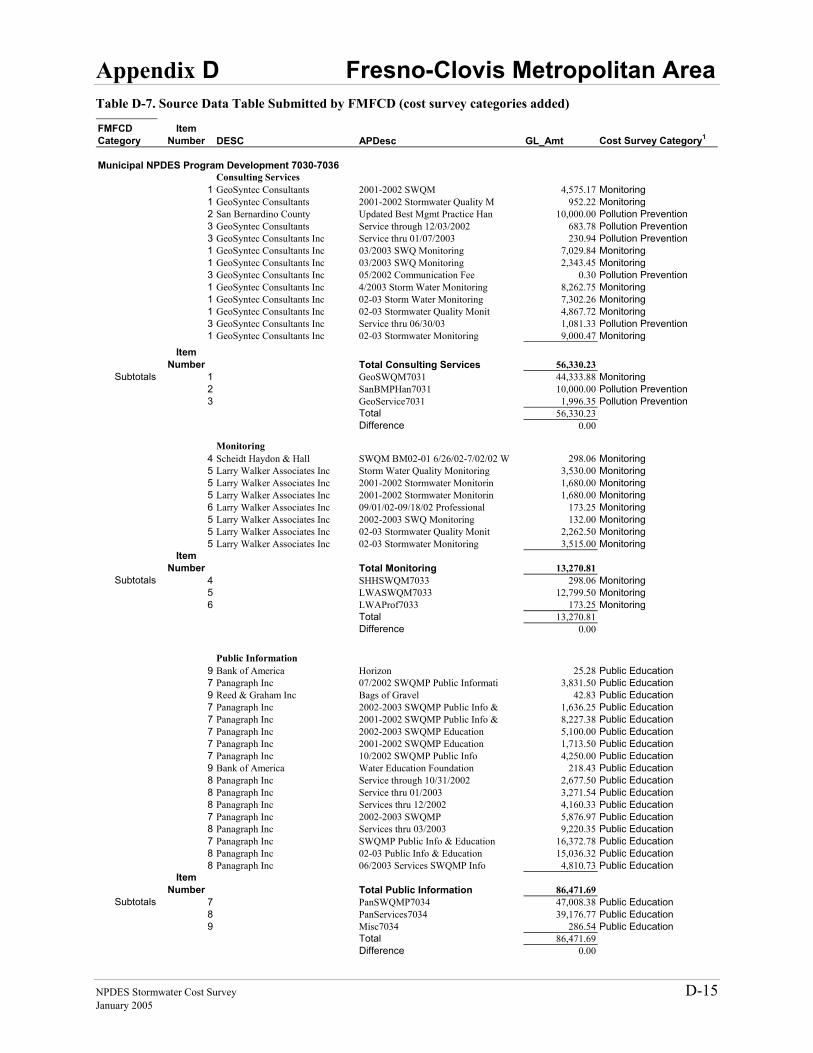
Appendix D Fresno-Clovis Metropolitan Area
NPDES Stormwater Cost Survey D-15 January 2005
Table D-7. Source Data Table Submitted by FMFCD (cost survey categories added)
FMFCD Category
Item Number DESC APDesc GL_Amt Cost Survey Category1
Municipal NPDES Program Development 7030-7036Consulting Services
1 GeoSyntec Consultants 2001-2002 SWQM 4,575.17 Monitoring1 GeoSyntec Consultants 2001-2002 Stormwater Quality M 952.22 Monitoring2 San Bernardino County Updated Best Mgmt Practice Han 10,000.00 Pollution Prevention 3 GeoSyntec Consultants Service through 12/03/2002 683.78 Pollution Prevention 3 GeoSyntec Consultants Inc Service thru 01/07/2003 230.94 Pollution Prevention 1 GeoSyntec Consultants Inc 03/2003 SWQ Monitoring 7,029.84 Monitoring1 GeoSyntec Consultants Inc 03/2003 SWQ Monitoring 2,343.45 Monitoring3 GeoSyntec Consultants Inc 05/2002 Communication Fee 0.30 Pollution Prevention 1 GeoSyntec Consultants Inc 4/2003 Storm Water Monitoring 8,262.75 Monitoring1 GeoSyntec Consultants Inc 02-03 Storm Water Monitoring 7,302.26 Monitoring1 GeoSyntec Consultants Inc 02-03 Stormwater Quality Monit 4,867.72 Monitoring3 GeoSyntec Consultants Inc Service thru 06/30/03 1,081.33 Pollution Prevention 1 GeoSyntec Consultants Inc 02-03 Stormwater Monitoring 9,000.47 Monitoring
Item Number Total Consulting Services 56,330.23
Subtotals 1 GeoSWQM7031 44,333.88 Monitoring2 SanBMPHan7031 10,000.00 Pollution Prevention 3 GeoService7031 1,996.35 Pollution Prevention
Total 56,330.23Difference 0.00
Monitoring4 Scheidt Haydon & Hall SWQM BM02-01 6/26/02-7/02/02 W 298.06 Monitoring5 Larry Walker Associates Inc Storm Water Quality Monitoring 3,530.00 Monitoring5 Larry Walker Associates Inc 2001-2002 Stormwater Monitorin 1,680.00 Monitoring5 Larry Walker Associates Inc 2001-2002 Stormwater Monitorin 1,680.00 Monitoring6 Larry Walker Associates Inc 09/01/02-09/18/02 Professional 173.25 Monitoring5 Larry Walker Associates Inc 2002-2003 SWQ Monitoring 132.00 Monitoring5 Larry Walker Associates Inc 02-03 Stormwater Quality Monit 2,262.50 Monitoring5 Larry Walker Associates Inc 02-03 Stormwater Monitoring 3,515.00 Monitoring
Item Number Total Monitoring 13,270.81
Subtotals 4 SHHSWQM7033 298.06 Monitoring5 LWASWQM7033 12,799.50 Monitoring6 LWAProf7033 173.25 Monitoring
Total 13,270.81Difference 0.00
Public Information9 Bank of America Horizon 25.28 Public Education 7 Panagraph Inc 07/2002 SWQMP Public Informati 3,831.50 Public Education 9 Reed & Graham Inc Bags of Gravel 42.83 Public Education 7 Panagraph Inc 2002-2003 SWQMP Public Info & 1,636.25 Public Education 7 Panagraph Inc 2001-2002 SWQMP Public Info & 8,227.38 Public Education 7 Panagraph Inc 2002-2003 SWQMP Education 5,100.00 Public Education 7 Panagraph Inc 2001-2002 SWQMP Education 1,713.50 Public Education 7 Panagraph Inc 10/2002 SWQMP Public Info 4,250.00 Public Education 9 Bank of America Water Education Foundation 218.43 Public Education 8 Panagraph Inc Service through 10/31/2002 2,677.50 Public Education 8 Panagraph Inc Service thru 01/2003 3,271.54 Public Education 8 Panagraph Inc Services thru 12/2002 4,160.33 Public Education 7 Panagraph Inc 2002-2003 SWQMP 5,876.97 Public Education 8 Panagraph Inc Services thru 03/2003 9,220.35 Public Education 7 Panagraph Inc SWQMP Public Info & Education 16,372.78 Public Education 8 Panagraph Inc 02-03 Public Info & Education 15,036.32 Public Education 8 Panagraph Inc 06/2003 Services SWQMP Info 4,810.73 Public Education
Item Number Total Public Information 86,471.69
Subtotals 7 PanSWQMP7034 47,008.38 Public Education 8 PanServices7034 39,176.77 Public Education 9 Misc7034 286.54 Public Education
Total 86,471.69Difference 0.00
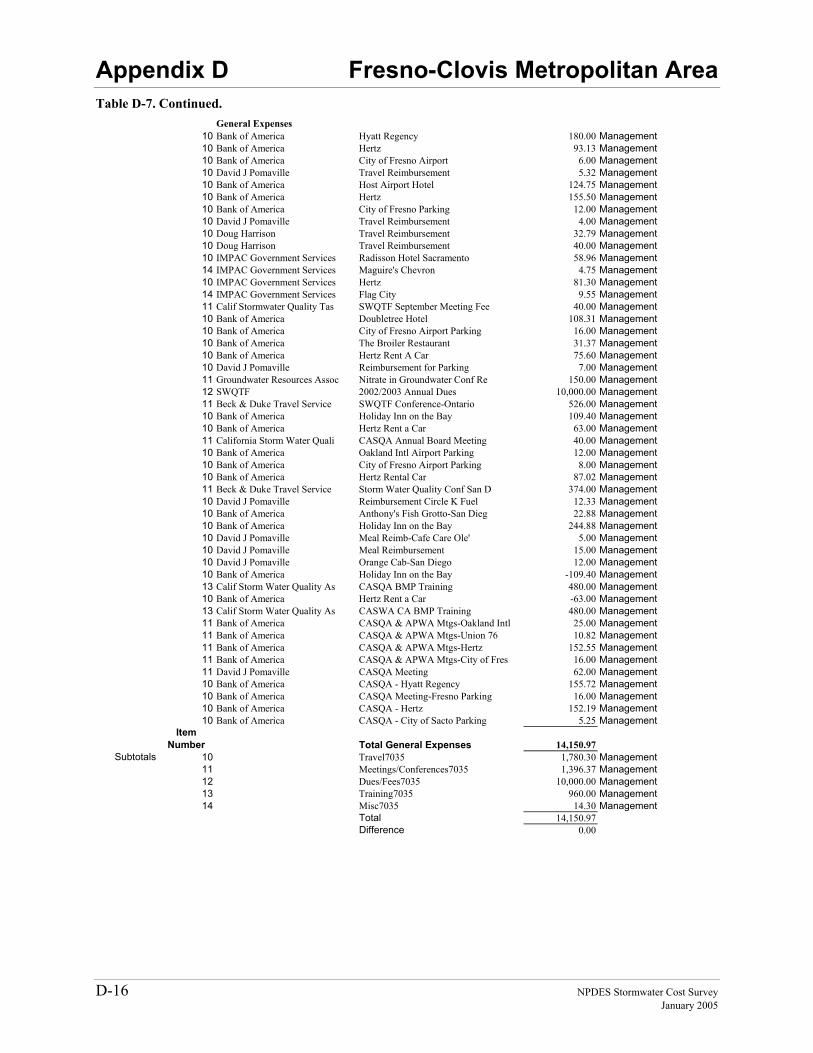
Appendix D Fresno-Clovis Metropolitan Area
D-16 NPDES Stormwater Cost Survey January 2005
Table D-7. Continued. General Expenses
10 Bank of America Hyatt Regency 180.00 Management10 Bank of America Hertz 93.13 Management10 Bank of America City of Fresno Airport 6.00 Management10 David J Pomaville Travel Reimbursement 5.32 Management10 Bank of America Host Airport Hotel 124.75 Management10 Bank of America Hertz 155.50 Management10 Bank of America City of Fresno Parking 12.00 Management10 David J Pomaville Travel Reimbursement 4.00 Management10 Doug Harrison Travel Reimbursement 32.79 Management10 Doug Harrison Travel Reimbursement 40.00 Management10 IMPAC Government Services Radisson Hotel Sacramento 58.96 Management14 IMPAC Government Services Maguire's Chevron 4.75 Management10 IMPAC Government Services Hertz 81.30 Management14 IMPAC Government Services Flag City 9.55 Management11 Calif Stormwater Quality Tas SWQTF September Meeting Fee 40.00 Management10 Bank of America Doubletree Hotel 108.31 Management10 Bank of America City of Fresno Airport Parking 16.00 Management10 Bank of America The Broiler Restaurant 31.37 Management10 Bank of America Hertz Rent A Car 75.60 Management10 David J Pomaville Reimbursement for Parking 7.00 Management11 Groundwater Resources Assoc Nitrate in Groundwater Conf Re 150.00 Management12 SWQTF 2002/2003 Annual Dues 10,000.00 Management11 Beck & Duke Travel Service SWQTF Conference-Ontario 526.00 Management10 Bank of America Holiday Inn on the Bay 109.40 Management10 Bank of America Hertz Rent a Car 63.00 Management11 California Storm Water Quali CASQA Annual Board Meeting 40.00 Management10 Bank of America Oakland Intl Airport Parking 12.00 Management10 Bank of America City of Fresno Airport Parking 8.00 Management10 Bank of America Hertz Rental Car 87.02 Management11 Beck & Duke Travel Service Storm Water Quality Conf San D 374.00 Management10 David J Pomaville Reimbursement Circle K Fuel 12.33 Management10 Bank of America Anthony's Fish Grotto-San Dieg 22.88 Management10 Bank of America Holiday Inn on the Bay 244.88 Management10 David J Pomaville Meal Reimb-Cafe Care Ole' 5.00 Management10 David J Pomaville Meal Reimbursement 15.00 Management10 David J Pomaville Orange Cab-San Diego 12.00 Management10 Bank of America Holiday Inn on the Bay -109.40 Management13 Calif Storm Water Quality As CASQA BMP Training 480.00 Management10 Bank of America Hertz Rent a Car -63.00 Management13 Calif Storm Water Quality As CASWA CA BMP Training 480.00 Management11 Bank of America CASQA & APWA Mtgs-Oakland Intl 25.00 Management11 Bank of America CASQA & APWA Mtgs-Union 76 10.82 Management11 Bank of America CASQA & APWA Mtgs-Hertz 152.55 Management11 Bank of America CASQA & APWA Mtgs-City of Fres 16.00 Management11 David J Pomaville CASQA Meeting 62.00 Management10 Bank of America CASQA - Hyatt Regency 155.72 Management10 Bank of America CASQA Meeting-Fresno Parking 16.00 Management10 Bank of America CASQA - Hertz 152.19 Management10 Bank of America CASQA - City of Sacto Parking 5.25 Management
Item Number Total General Expenses 14,150.97
Subtotals 10 Travel7035 1,780.30 Management11 Meetings/Conferences7035 1,396.37 Management12 Dues/Fees7035 10,000.00 Management13 Training7035 960.00 Management14 Misc7035 14.30 Management
Total 14,150.97Difference 0.00
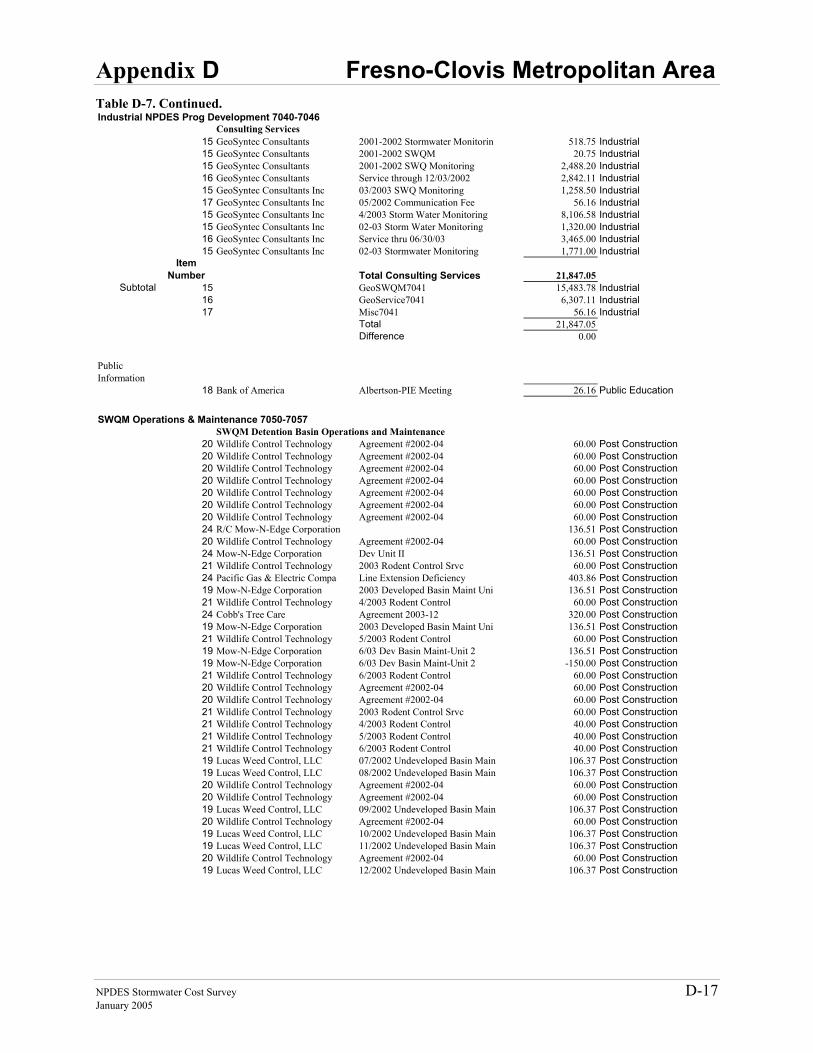
Appendix D Fresno-Clovis Metropolitan Area
NPDES Stormwater Cost Survey D-17 January 2005
Table D-7. Continued. Industrial NPDES Prog Development 7040-7046
Consulting Services15 GeoSyntec Consultants 2001-2002 Stormwater Monitorin 518.75 Industrial 15 GeoSyntec Consultants 2001-2002 SWQM 20.75 Industrial 15 GeoSyntec Consultants 2001-2002 SWQ Monitoring 2,488.20 Industrial 16 GeoSyntec Consultants Service through 12/03/2002 2,842.11 Industrial 15 GeoSyntec Consultants Inc 03/2003 SWQ Monitoring 1,258.50 Industrial 17 GeoSyntec Consultants Inc 05/2002 Communication Fee 56.16 Industrial 15 GeoSyntec Consultants Inc 4/2003 Storm Water Monitoring 8,106.58 Industrial 15 GeoSyntec Consultants Inc 02-03 Storm Water Monitoring 1,320.00 Industrial 16 GeoSyntec Consultants Inc Service thru 06/30/03 3,465.00 Industrial 15 GeoSyntec Consultants Inc 02-03 Stormwater Monitoring 1,771.00 Industrial
Item Number Total Consulting Services 21,847.05
Subtotal 15 GeoSWQM7041 15,483.78 Industrial 16 GeoService7041 6,307.11 Industrial 17 Misc7041 56.16 Industrial
Total 21,847.05Difference 0.00
Public Information
18 Bank of America Albertson-PIE Meeting 26.16 Public Education
SWQM Operations & Maintenance 7050-7057SWQM Detention Basin Operations and Maintenance
20 Wildlife Control Technology Agreement #2002-04 60.00 Post Construction 20 Wildlife Control Technology Agreement #2002-04 60.00 Post Construction 20 Wildlife Control Technology Agreement #2002-04 60.00 Post Construction 20 Wildlife Control Technology Agreement #2002-04 60.00 Post Construction 20 Wildlife Control Technology Agreement #2002-04 60.00 Post Construction 20 Wildlife Control Technology Agreement #2002-04 60.00 Post Construction 20 Wildlife Control Technology Agreement #2002-04 60.00 Post Construction 24 R/C Mow-N-Edge Corporation 136.51 Post Construction 20 Wildlife Control Technology Agreement #2002-04 60.00 Post Construction 24 Mow-N-Edge Corporation Dev Unit II 136.51 Post Construction 21 Wildlife Control Technology 2003 Rodent Control Srvc 60.00 Post Construction 24 Pacific Gas & Electric Compa Line Extension Deficiency 403.86 Post Construction 19 Mow-N-Edge Corporation 2003 Developed Basin Maint Uni 136.51 Post Construction 21 Wildlife Control Technology 4/2003 Rodent Control 60.00 Post Construction 24 Cobb's Tree Care Agreement 2003-12 320.00 Post Construction 19 Mow-N-Edge Corporation 2003 Developed Basin Maint Uni 136.51 Post Construction 21 Wildlife Control Technology 5/2003 Rodent Control 60.00 Post Construction 19 Mow-N-Edge Corporation 6/03 Dev Basin Maint-Unit 2 136.51 Post Construction 19 Mow-N-Edge Corporation 6/03 Dev Basin Maint-Unit 2 -150.00 Post Construction 21 Wildlife Control Technology 6/2003 Rodent Control 60.00 Post Construction 20 Wildlife Control Technology Agreement #2002-04 60.00 Post Construction 20 Wildlife Control Technology Agreement #2002-04 60.00 Post Construction 21 Wildlife Control Technology 2003 Rodent Control Srvc 60.00 Post Construction 21 Wildlife Control Technology 4/2003 Rodent Control 40.00 Post Construction 21 Wildlife Control Technology 5/2003 Rodent Control 40.00 Post Construction 21 Wildlife Control Technology 6/2003 Rodent Control 40.00 Post Construction 19 Lucas Weed Control, LLC 07/2002 Undeveloped Basin Main 106.37 Post Construction 19 Lucas Weed Control, LLC 08/2002 Undeveloped Basin Main 106.37 Post Construction 20 Wildlife Control Technology Agreement #2002-04 60.00 Post Construction 20 Wildlife Control Technology Agreement #2002-04 60.00 Post Construction 19 Lucas Weed Control, LLC 09/2002 Undeveloped Basin Main 106.37 Post Construction 20 Wildlife Control Technology Agreement #2002-04 60.00 Post Construction 19 Lucas Weed Control, LLC 10/2002 Undeveloped Basin Main 106.37 Post Construction 19 Lucas Weed Control, LLC 11/2002 Undeveloped Basin Main 106.37 Post Construction 20 Wildlife Control Technology Agreement #2002-04 60.00 Post Construction 19 Lucas Weed Control, LLC 12/2002 Undeveloped Basin Main 106.37 Post Construction
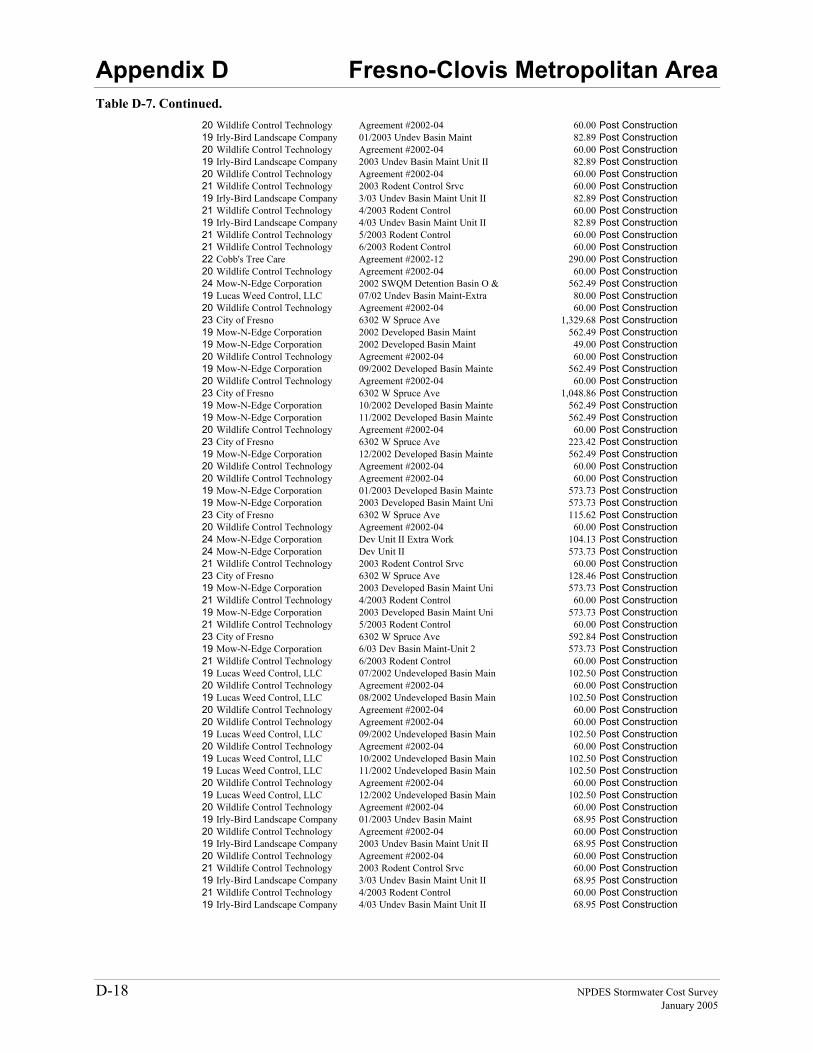
Appendix D Fresno-Clovis Metropolitan Area
D-18 NPDES Stormwater Cost Survey January 2005
Table D-7. Continued. 20 Wildlife Control Technology Agreement #2002-04 60.00 Post Construction 19 Irly-Bird Landscape Company 01/2003 Undev Basin Maint 82.89 Post Construction 20 Wildlife Control Technology Agreement #2002-04 60.00 Post Construction 19 Irly-Bird Landscape Company 2003 Undev Basin Maint Unit II 82.89 Post Construction 20 Wildlife Control Technology Agreement #2002-04 60.00 Post Construction 21 Wildlife Control Technology 2003 Rodent Control Srvc 60.00 Post Construction 19 Irly-Bird Landscape Company 3/03 Undev Basin Maint Unit II 82.89 Post Construction 21 Wildlife Control Technology 4/2003 Rodent Control 60.00 Post Construction 19 Irly-Bird Landscape Company 4/03 Undev Basin Maint Unit II 82.89 Post Construction 21 Wildlife Control Technology 5/2003 Rodent Control 60.00 Post Construction 21 Wildlife Control Technology 6/2003 Rodent Control 60.00 Post Construction 22 Cobb's Tree Care Agreement #2002-12 290.00 Post Construction 20 Wildlife Control Technology Agreement #2002-04 60.00 Post Construction 24 Mow-N-Edge Corporation 2002 SWQM Detention Basin O & 562.49 Post Construction 19 Lucas Weed Control, LLC 07/02 Undev Basin Maint-Extra 80.00 Post Construction 20 Wildlife Control Technology Agreement #2002-04 60.00 Post Construction 23 City of Fresno 6302 W Spruce Ave 1,329.68 Post Construction 19 Mow-N-Edge Corporation 2002 Developed Basin Maint 562.49 Post Construction 19 Mow-N-Edge Corporation 2002 Developed Basin Maint 49.00 Post Construction 20 Wildlife Control Technology Agreement #2002-04 60.00 Post Construction 19 Mow-N-Edge Corporation 09/2002 Developed Basin Mainte 562.49 Post Construction 20 Wildlife Control Technology Agreement #2002-04 60.00 Post Construction 23 City of Fresno 6302 W Spruce Ave 1,048.86 Post Construction 19 Mow-N-Edge Corporation 10/2002 Developed Basin Mainte 562.49 Post Construction 19 Mow-N-Edge Corporation 11/2002 Developed Basin Mainte 562.49 Post Construction 20 Wildlife Control Technology Agreement #2002-04 60.00 Post Construction 23 City of Fresno 6302 W Spruce Ave 223.42 Post Construction 19 Mow-N-Edge Corporation 12/2002 Developed Basin Mainte 562.49 Post Construction 20 Wildlife Control Technology Agreement #2002-04 60.00 Post Construction 20 Wildlife Control Technology Agreement #2002-04 60.00 Post Construction 19 Mow-N-Edge Corporation 01/2003 Developed Basin Mainte 573.73 Post Construction 19 Mow-N-Edge Corporation 2003 Developed Basin Maint Uni 573.73 Post Construction 23 City of Fresno 6302 W Spruce Ave 115.62 Post Construction 20 Wildlife Control Technology Agreement #2002-04 60.00 Post Construction 24 Mow-N-Edge Corporation Dev Unit II Extra Work 104.13 Post Construction 24 Mow-N-Edge Corporation Dev Unit II 573.73 Post Construction 21 Wildlife Control Technology 2003 Rodent Control Srvc 60.00 Post Construction 23 City of Fresno 6302 W Spruce Ave 128.46 Post Construction 19 Mow-N-Edge Corporation 2003 Developed Basin Maint Uni 573.73 Post Construction 21 Wildlife Control Technology 4/2003 Rodent Control 60.00 Post Construction 19 Mow-N-Edge Corporation 2003 Developed Basin Maint Uni 573.73 Post Construction 21 Wildlife Control Technology 5/2003 Rodent Control 60.00 Post Construction 23 City of Fresno 6302 W Spruce Ave 592.84 Post Construction 19 Mow-N-Edge Corporation 6/03 Dev Basin Maint-Unit 2 573.73 Post Construction 21 Wildlife Control Technology 6/2003 Rodent Control 60.00 Post Construction 19 Lucas Weed Control, LLC 07/2002 Undeveloped Basin Main 102.50 Post Construction 20 Wildlife Control Technology Agreement #2002-04 60.00 Post Construction 19 Lucas Weed Control, LLC 08/2002 Undeveloped Basin Main 102.50 Post Construction 20 Wildlife Control Technology Agreement #2002-04 60.00 Post Construction 20 Wildlife Control Technology Agreement #2002-04 60.00 Post Construction 19 Lucas Weed Control, LLC 09/2002 Undeveloped Basin Main 102.50 Post Construction 20 Wildlife Control Technology Agreement #2002-04 60.00 Post Construction 19 Lucas Weed Control, LLC 10/2002 Undeveloped Basin Main 102.50 Post Construction 19 Lucas Weed Control, LLC 11/2002 Undeveloped Basin Main 102.50 Post Construction 20 Wildlife Control Technology Agreement #2002-04 60.00 Post Construction 19 Lucas Weed Control, LLC 12/2002 Undeveloped Basin Main 102.50 Post Construction 20 Wildlife Control Technology Agreement #2002-04 60.00 Post Construction 19 Irly-Bird Landscape Company 01/2003 Undev Basin Maint 68.95 Post Construction 20 Wildlife Control Technology Agreement #2002-04 60.00 Post Construction 19 Irly-Bird Landscape Company 2003 Undev Basin Maint Unit II 68.95 Post Construction 20 Wildlife Control Technology Agreement #2002-04 60.00 Post Construction 21 Wildlife Control Technology 2003 Rodent Control Srvc 60.00 Post Construction 19 Irly-Bird Landscape Company 3/03 Undev Basin Maint Unit II 68.95 Post Construction 21 Wildlife Control Technology 4/2003 Rodent Control 60.00 Post Construction 19 Irly-Bird Landscape Company 4/03 Undev Basin Maint Unit II 68.95 Post Construction
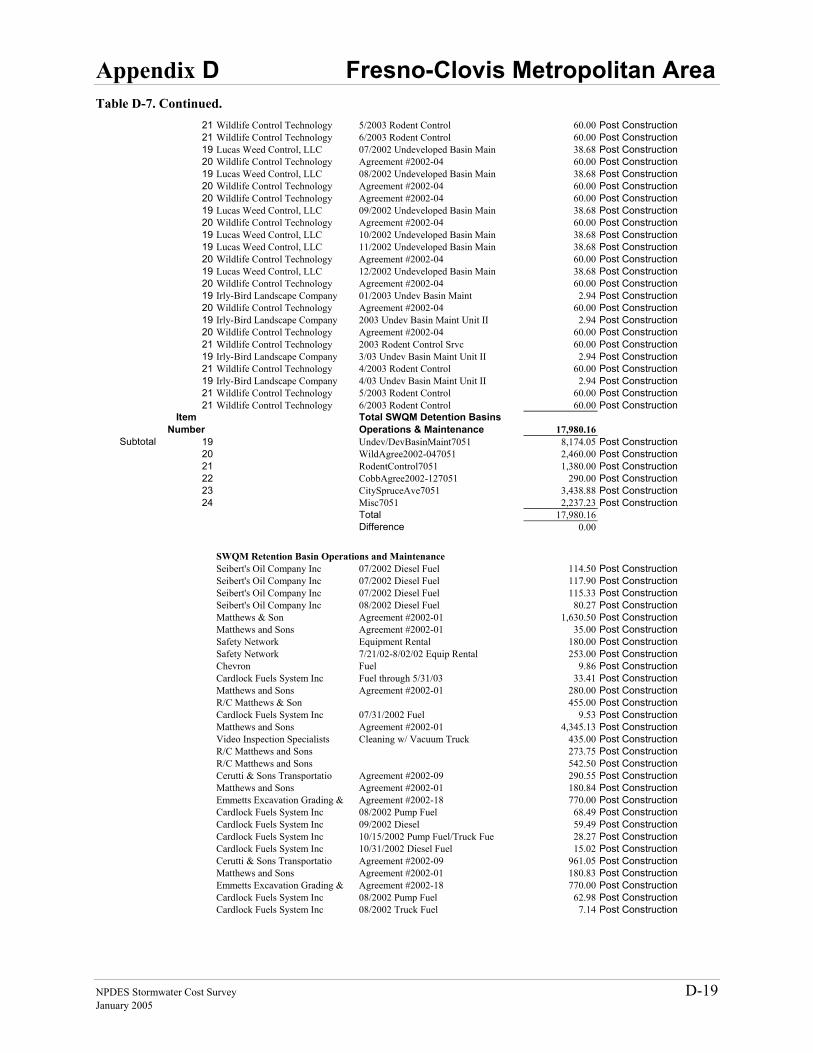
Appendix D Fresno-Clovis Metropolitan Area
NPDES Stormwater Cost Survey D-19 January 2005
Table D-7. Continued. 21 Wildlife Control Technology 5/2003 Rodent Control 60.00 Post Construction 21 Wildlife Control Technology 6/2003 Rodent Control 60.00 Post Construction 19 Lucas Weed Control, LLC 07/2002 Undeveloped Basin Main 38.68 Post Construction 20 Wildlife Control Technology Agreement #2002-04 60.00 Post Construction 19 Lucas Weed Control, LLC 08/2002 Undeveloped Basin Main 38.68 Post Construction 20 Wildlife Control Technology Agreement #2002-04 60.00 Post Construction 20 Wildlife Control Technology Agreement #2002-04 60.00 Post Construction 19 Lucas Weed Control, LLC 09/2002 Undeveloped Basin Main 38.68 Post Construction 20 Wildlife Control Technology Agreement #2002-04 60.00 Post Construction 19 Lucas Weed Control, LLC 10/2002 Undeveloped Basin Main 38.68 Post Construction 19 Lucas Weed Control, LLC 11/2002 Undeveloped Basin Main 38.68 Post Construction 20 Wildlife Control Technology Agreement #2002-04 60.00 Post Construction 19 Lucas Weed Control, LLC 12/2002 Undeveloped Basin Main 38.68 Post Construction 20 Wildlife Control Technology Agreement #2002-04 60.00 Post Construction 19 Irly-Bird Landscape Company 01/2003 Undev Basin Maint 2.94 Post Construction 20 Wildlife Control Technology Agreement #2002-04 60.00 Post Construction 19 Irly-Bird Landscape Company 2003 Undev Basin Maint Unit II 2.94 Post Construction 20 Wildlife Control Technology Agreement #2002-04 60.00 Post Construction 21 Wildlife Control Technology 2003 Rodent Control Srvc 60.00 Post Construction 19 Irly-Bird Landscape Company 3/03 Undev Basin Maint Unit II 2.94 Post Construction 21 Wildlife Control Technology 4/2003 Rodent Control 60.00 Post Construction 19 Irly-Bird Landscape Company 4/03 Undev Basin Maint Unit II 2.94 Post Construction 21 Wildlife Control Technology 5/2003 Rodent Control 60.00 Post Construction 21 Wildlife Control Technology 6/2003 Rodent Control 60.00 Post Construction
Item Number
Total SWQM Detention Basins Operations & Maintenance 17,980.16
Subtotal 19 Undev/DevBasinMaint7051 8,174.05 Post Construction 20 WildAgree2002-047051 2,460.00 Post Construction 21 RodentControl7051 1,380.00 Post Construction 22 CobbAgree2002-127051 290.00 Post Construction 23 CitySpruceAve7051 3,438.88 Post Construction 24 Misc7051 2,237.23 Post Construction
Total 17,980.16Difference 0.00
SWQM Retention Basin Operations and MaintenanceSeibert's Oil Company Inc 07/2002 Diesel Fuel 114.50 Post Construction Seibert's Oil Company Inc 07/2002 Diesel Fuel 117.90 Post Construction Seibert's Oil Company Inc 07/2002 Diesel Fuel 115.33 Post Construction Seibert's Oil Company Inc 08/2002 Diesel Fuel 80.27 Post Construction Matthews & Son Agreement #2002-01 1,630.50 Post Construction Matthews and Sons Agreement #2002-01 35.00 Post Construction Safety Network Equipment Rental 180.00 Post Construction Safety Network 7/21/02-8/02/02 Equip Rental 253.00 Post Construction Chevron Fuel 9.86 Post Construction Cardlock Fuels System Inc Fuel through 5/31/03 33.41 Post Construction Matthews and Sons Agreement #2002-01 280.00 Post Construction R/C Matthews & Son 455.00 Post Construction Cardlock Fuels System Inc 07/31/2002 Fuel 9.53 Post Construction Matthews and Sons Agreement #2002-01 4,345.13 Post Construction Video Inspection Specialists Cleaning w/ Vacuum Truck 435.00 Post Construction R/C Matthews and Sons 273.75 Post Construction R/C Matthews and Sons 542.50 Post Construction Cerutti & Sons Transportatio Agreement #2002-09 290.55 Post Construction Matthews and Sons Agreement #2002-01 180.84 Post Construction Emmetts Excavation Grading & Agreement #2002-18 770.00 Post Construction Cardlock Fuels System Inc 08/2002 Pump Fuel 68.49 Post Construction Cardlock Fuels System Inc 09/2002 Diesel 59.49 Post Construction Cardlock Fuels System Inc 10/15/2002 Pump Fuel/Truck Fue 28.27 Post Construction Cardlock Fuels System Inc 10/31/2002 Diesel Fuel 15.02 Post Construction Cerutti & Sons Transportatio Agreement #2002-09 961.05 Post Construction Matthews and Sons Agreement #2002-01 180.83 Post Construction Emmetts Excavation Grading & Agreement #2002-18 770.00 Post Construction Cardlock Fuels System Inc 08/2002 Pump Fuel 62.98 Post Construction Cardlock Fuels System Inc 08/2002 Truck Fuel 7.14 Post Construction
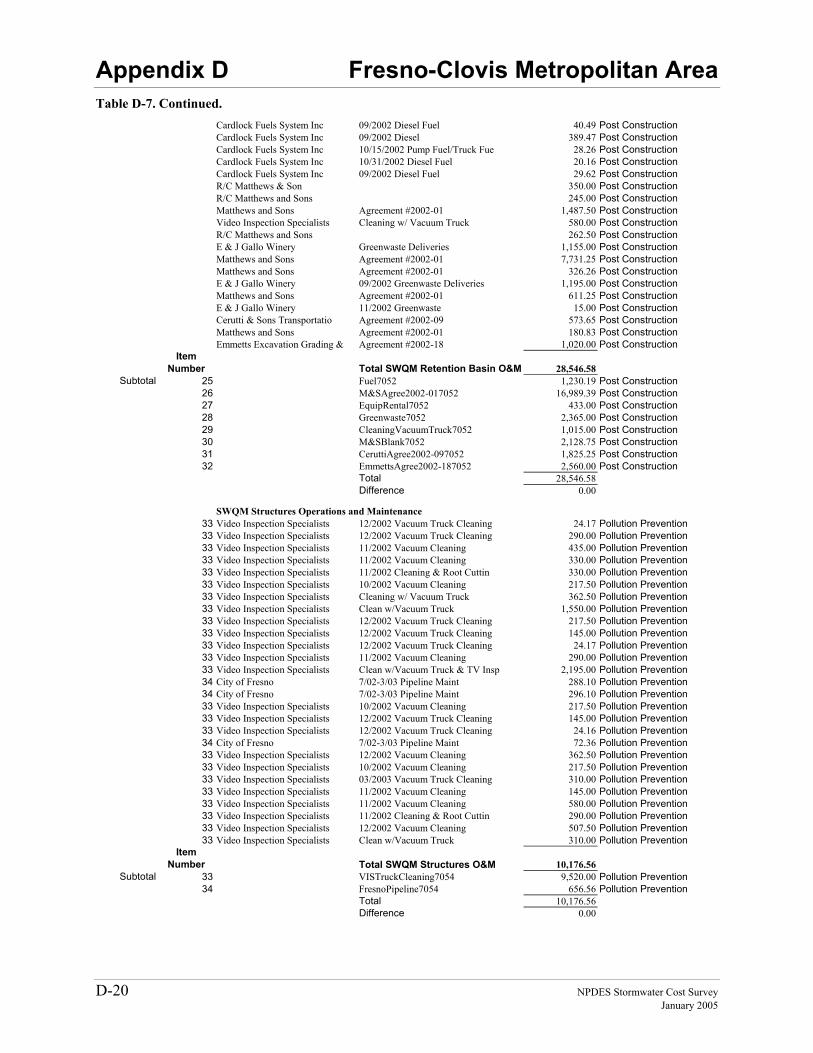
Appendix D Fresno-Clovis Metropolitan Area
D-20 NPDES Stormwater Cost Survey January 2005
Table D-7. Continued. Cardlock Fuels System Inc 09/2002 Diesel Fuel 40.49 Post Construction Cardlock Fuels System Inc 09/2002 Diesel 389.47 Post Construction Cardlock Fuels System Inc 10/15/2002 Pump Fuel/Truck Fue 28.26 Post Construction Cardlock Fuels System Inc 10/31/2002 Diesel Fuel 20.16 Post Construction Cardlock Fuels System Inc 09/2002 Diesel Fuel 29.62 Post Construction R/C Matthews & Son 350.00 Post Construction R/C Matthews and Sons 245.00 Post Construction Matthews and Sons Agreement #2002-01 1,487.50 Post Construction Video Inspection Specialists Cleaning w/ Vacuum Truck 580.00 Post Construction R/C Matthews and Sons 262.50 Post Construction E & J Gallo Winery Greenwaste Deliveries 1,155.00 Post Construction Matthews and Sons Agreement #2002-01 7,731.25 Post Construction Matthews and Sons Agreement #2002-01 326.26 Post Construction E & J Gallo Winery 09/2002 Greenwaste Deliveries 1,195.00 Post Construction Matthews and Sons Agreement #2002-01 611.25 Post Construction E & J Gallo Winery 11/2002 Greenwaste 15.00 Post Construction Cerutti & Sons Transportatio Agreement #2002-09 573.65 Post Construction Matthews and Sons Agreement #2002-01 180.83 Post Construction Emmetts Excavation Grading & Agreement #2002-18 1,020.00 Post Construction
Item Number Total SWQM Retention Basin O&M 28,546.58
Subtotal 25 Fuel7052 1,230.19 Post Construction 26 M&SAgree2002-017052 16,989.39 Post Construction 27 EquipRental7052 433.00 Post Construction 28 Greenwaste7052 2,365.00 Post Construction 29 CleaningVacuumTruck7052 1,015.00 Post Construction 30 M&SBlank7052 2,128.75 Post Construction 31 CeruttiAgree2002-097052 1,825.25 Post Construction 32 EmmettsAgree2002-187052 2,560.00 Post Construction
Total 28,546.58Difference 0.00
SWQM Structures Operations and Maintenance33 Video Inspection Specialists 12/2002 Vacuum Truck Cleaning 24.17 Pollution Prevention 33 Video Inspection Specialists 12/2002 Vacuum Truck Cleaning 290.00 Pollution Prevention 33 Video Inspection Specialists 11/2002 Vacuum Cleaning 435.00 Pollution Prevention 33 Video Inspection Specialists 11/2002 Vacuum Cleaning 330.00 Pollution Prevention 33 Video Inspection Specialists 11/2002 Cleaning & Root Cuttin 330.00 Pollution Prevention 33 Video Inspection Specialists 10/2002 Vacuum Cleaning 217.50 Pollution Prevention 33 Video Inspection Specialists Cleaning w/ Vacuum Truck 362.50 Pollution Prevention 33 Video Inspection Specialists Clean w/Vacuum Truck 1,550.00 Pollution Prevention 33 Video Inspection Specialists 12/2002 Vacuum Truck Cleaning 217.50 Pollution Prevention 33 Video Inspection Specialists 12/2002 Vacuum Truck Cleaning 145.00 Pollution Prevention 33 Video Inspection Specialists 12/2002 Vacuum Truck Cleaning 24.17 Pollution Prevention 33 Video Inspection Specialists 11/2002 Vacuum Cleaning 290.00 Pollution Prevention 33 Video Inspection Specialists Clean w/Vacuum Truck & TV Insp 2,195.00 Pollution Prevention 34 City of Fresno 7/02-3/03 Pipeline Maint 288.10 Pollution Prevention 34 City of Fresno 7/02-3/03 Pipeline Maint 296.10 Pollution Prevention 33 Video Inspection Specialists 10/2002 Vacuum Cleaning 217.50 Pollution Prevention 33 Video Inspection Specialists 12/2002 Vacuum Truck Cleaning 145.00 Pollution Prevention 33 Video Inspection Specialists 12/2002 Vacuum Truck Cleaning 24.16 Pollution Prevention 34 City of Fresno 7/02-3/03 Pipeline Maint 72.36 Pollution Prevention 33 Video Inspection Specialists 12/2002 Vacuum Cleaning 362.50 Pollution Prevention 33 Video Inspection Specialists 10/2002 Vacuum Cleaning 217.50 Pollution Prevention 33 Video Inspection Specialists 03/2003 Vacuum Truck Cleaning 310.00 Pollution Prevention 33 Video Inspection Specialists 11/2002 Vacuum Cleaning 145.00 Pollution Prevention 33 Video Inspection Specialists 11/2002 Vacuum Cleaning 580.00 Pollution Prevention 33 Video Inspection Specialists 11/2002 Cleaning & Root Cuttin 290.00 Pollution Prevention 33 Video Inspection Specialists 12/2002 Vacuum Cleaning 507.50 Pollution Prevention 33 Video Inspection Specialists Clean w/Vacuum Truck 310.00 Pollution Prevention
Item Number Total SWQM Structures O&M 10,176.56
Subtotal 33 VISTruckCleaning7054 9,520.00 Pollution Prevention 34 FresnoPipeline7054 656.56 Pollution Prevention
Total 10,176.56Difference 0.00
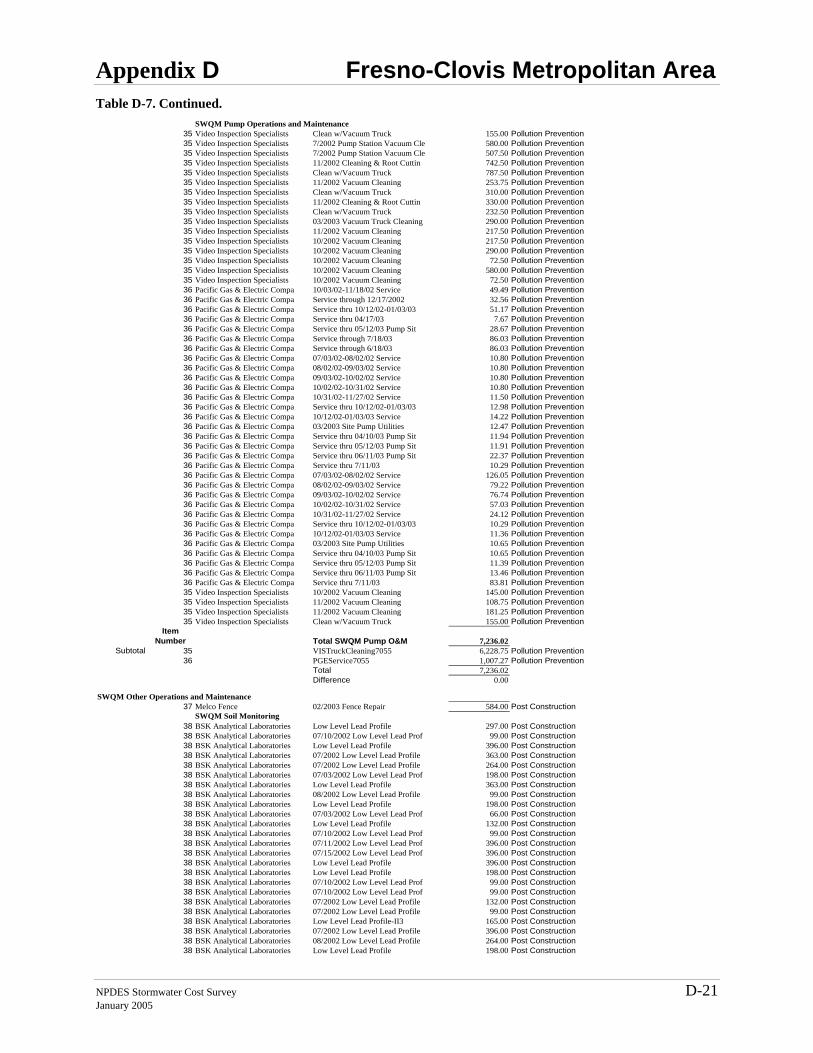
Appendix D Fresno-Clovis Metropolitan Area
NPDES Stormwater Cost Survey D-21 January 2005
Table D-7. Continued. SWQM Pump Operations and Maintenance
35 Video Inspection Specialists Clean w/Vacuum Truck 155.00 Pollution Prevention 35 Video Inspection Specialists 7/2002 Pump Station Vacuum Cle 580.00 Pollution Prevention 35 Video Inspection Specialists 7/2002 Pump Station Vacuum Cle 507.50 Pollution Prevention 35 Video Inspection Specialists 11/2002 Cleaning & Root Cuttin 742.50 Pollution Prevention 35 Video Inspection Specialists Clean w/Vacuum Truck 787.50 Pollution Prevention 35 Video Inspection Specialists 11/2002 Vacuum Cleaning 253.75 Pollution Prevention 35 Video Inspection Specialists Clean w/Vacuum Truck 310.00 Pollution Prevention 35 Video Inspection Specialists 11/2002 Cleaning & Root Cuttin 330.00 Pollution Prevention 35 Video Inspection Specialists Clean w/Vacuum Truck 232.50 Pollution Prevention 35 Video Inspection Specialists 03/2003 Vacuum Truck Cleaning 290.00 Pollution Prevention 35 Video Inspection Specialists 11/2002 Vacuum Cleaning 217.50 Pollution Prevention 35 Video Inspection Specialists 10/2002 Vacuum Cleaning 217.50 Pollution Prevention 35 Video Inspection Specialists 10/2002 Vacuum Cleaning 290.00 Pollution Prevention 35 Video Inspection Specialists 10/2002 Vacuum Cleaning 72.50 Pollution Prevention 35 Video Inspection Specialists 10/2002 Vacuum Cleaning 580.00 Pollution Prevention 35 Video Inspection Specialists 10/2002 Vacuum Cleaning 72.50 Pollution Prevention 36 Pacific Gas & Electric Compa 10/03/02-11/18/02 Service 49.49 Pollution Prevention 36 Pacific Gas & Electric Compa Service through 12/17/2002 32.56 Pollution Prevention 36 Pacific Gas & Electric Compa Service thru 10/12/02-01/03/03 51.17 Pollution Prevention 36 Pacific Gas & Electric Compa Service thru 04/17/03 7.67 Pollution Prevention 36 Pacific Gas & Electric Compa Service thru 05/12/03 Pump Sit 28.67 Pollution Prevention 36 Pacific Gas & Electric Compa Service through 7/18/03 86.03 Pollution Prevention 36 Pacific Gas & Electric Compa Service through 6/18/03 86.03 Pollution Prevention 36 Pacific Gas & Electric Compa 07/03/02-08/02/02 Service 10.80 Pollution Prevention 36 Pacific Gas & Electric Compa 08/02/02-09/03/02 Service 10.80 Pollution Prevention 36 Pacific Gas & Electric Compa 09/03/02-10/02/02 Service 10.80 Pollution Prevention 36 Pacific Gas & Electric Compa 10/02/02-10/31/02 Service 10.80 Pollution Prevention 36 Pacific Gas & Electric Compa 10/31/02-11/27/02 Service 11.50 Pollution Prevention 36 Pacific Gas & Electric Compa Service thru 10/12/02-01/03/03 12.98 Pollution Prevention 36 Pacific Gas & Electric Compa 10/12/02-01/03/03 Service 14.22 Pollution Prevention 36 Pacific Gas & Electric Compa 03/2003 Site Pump Utilities 12.47 Pollution Prevention 36 Pacific Gas & Electric Compa Service thru 04/10/03 Pump Sit 11.94 Pollution Prevention 36 Pacific Gas & Electric Compa Service thru 05/12/03 Pump Sit 11.91 Pollution Prevention 36 Pacific Gas & Electric Compa Service thru 06/11/03 Pump Sit 22.37 Pollution Prevention 36 Pacific Gas & Electric Compa Service thru 7/11/03 10.29 Pollution Prevention 36 Pacific Gas & Electric Compa 07/03/02-08/02/02 Service 126.05 Pollution Prevention 36 Pacific Gas & Electric Compa 08/02/02-09/03/02 Service 79.22 Pollution Prevention 36 Pacific Gas & Electric Compa 09/03/02-10/02/02 Service 76.74 Pollution Prevention 36 Pacific Gas & Electric Compa 10/02/02-10/31/02 Service 57.03 Pollution Prevention 36 Pacific Gas & Electric Compa 10/31/02-11/27/02 Service 24.12 Pollution Prevention 36 Pacific Gas & Electric Compa Service thru 10/12/02-01/03/03 10.29 Pollution Prevention 36 Pacific Gas & Electric Compa 10/12/02-01/03/03 Service 11.36 Pollution Prevention 36 Pacific Gas & Electric Compa 03/2003 Site Pump Utilities 10.65 Pollution Prevention 36 Pacific Gas & Electric Compa Service thru 04/10/03 Pump Sit 10.65 Pollution Prevention 36 Pacific Gas & Electric Compa Service thru 05/12/03 Pump Sit 11.39 Pollution Prevention 36 Pacific Gas & Electric Compa Service thru 06/11/03 Pump Sit 13.46 Pollution Prevention 36 Pacific Gas & Electric Compa Service thru 7/11/03 83.81 Pollution Prevention 35 Video Inspection Specialists 10/2002 Vacuum Cleaning 145.00 Pollution Prevention 35 Video Inspection Specialists 11/2002 Vacuum Cleaning 108.75 Pollution Prevention 35 Video Inspection Specialists 11/2002 Vacuum Cleaning 181.25 Pollution Prevention 35 Video Inspection Specialists Clean w/Vacuum Truck 155.00 Pollution Prevention
Item Number Total SWQM Pump O&M 7,236.02
Subtotal 35 VISTruckCleaning7055 6,228.75 Pollution Prevention 36 PGEService7055 1,007.27 Pollution Prevention
Total 7,236.02Difference 0.00
SWQM Other Operations and Maintenance 37 Melco Fence 02/2003 Fence Repair 584.00 Post Construction
SWQM Soil Monitoring38 BSK Analytical Laboratories Low Level Lead Profile 297.00 Post Construction 38 BSK Analytical Laboratories 07/10/2002 Low Level Lead Prof 99.00 Post Construction 38 BSK Analytical Laboratories Low Level Lead Profile 396.00 Post Construction 38 BSK Analytical Laboratories 07/2002 Low Level Lead Profile 363.00 Post Construction 38 BSK Analytical Laboratories 07/2002 Low Level Lead Profile 264.00 Post Construction 38 BSK Analytical Laboratories 07/03/2002 Low Level Lead Prof 198.00 Post Construction 38 BSK Analytical Laboratories Low Level Lead Profile 363.00 Post Construction 38 BSK Analytical Laboratories 08/2002 Low Level Lead Profile 99.00 Post Construction 38 BSK Analytical Laboratories Low Level Lead Profile 198.00 Post Construction 38 BSK Analytical Laboratories 07/03/2002 Low Level Lead Prof 66.00 Post Construction 38 BSK Analytical Laboratories Low Level Lead Profile 132.00 Post Construction 38 BSK Analytical Laboratories 07/10/2002 Low Level Lead Prof 99.00 Post Construction 38 BSK Analytical Laboratories 07/11/2002 Low Level Lead Prof 396.00 Post Construction 38 BSK Analytical Laboratories 07/15/2002 Low Level Lead Prof 396.00 Post Construction 38 BSK Analytical Laboratories Low Level Lead Profile 396.00 Post Construction 38 BSK Analytical Laboratories Low Level Lead Profile 198.00 Post Construction 38 BSK Analytical Laboratories 07/10/2002 Low Level Lead Prof 99.00 Post Construction 38 BSK Analytical Laboratories 07/10/2002 Low Level Lead Prof 99.00 Post Construction 38 BSK Analytical Laboratories 07/2002 Low Level Lead Profile 132.00 Post Construction 38 BSK Analytical Laboratories 07/2002 Low Level Lead Profile 99.00 Post Construction 38 BSK Analytical Laboratories Low Level Lead Profile-II3 165.00 Post Construction 38 BSK Analytical Laboratories 07/2002 Low Level Lead Profile 396.00 Post Construction 38 BSK Analytical Laboratories 08/2002 Low Level Lead Profile 264.00 Post Construction 38 BSK Analytical Laboratories Low Level Lead Profile 198.00 Post Construction

Appendix D Fresno-Clovis Metropolitan Area
D-22 NPDES Stormwater Cost Survey January 2005
Table D-7. Continued. 38 BSK Analytical Laboratories Low Level Lead Profile 198.00 Post Construction 38 BSK Analytical Laboratories 10/2002 Low Level Lead Profile 396.00 Post Construction 38 BSK Analytical Laboratories 11/2002 Low Level Lead Profile 99.00 Post Construction 38 BSK Analytical Laboratories 10/2002 Low Level Lead Profile 99.00 Post Construction 38 BSK Analytical Laboratories 11/2002 Low Level Lead Profile 99.00 Post Construction 38 BSK Analytical Laboratories 07/2002 Low Level Lead Profile 99.00 Post Construction 38 BSK Analytical Laboratories 09/2002 Low Level Lead Profile 297.00 Post Construction 38 BSK Analytical Laboratories 09/2002 Low Level Lead Profile 231.00 Post Construction 38 BSK Analytical Laboratories 08/2002 Low Level Lead Profile 396.00 Post Construction 38 BSK Analytical Laboratories 08/2002 Low Level Lead Profile 198.00 Post Construction 38 BSK Analytical Laboratories 09/2002 Low Level Lead Profile 198.00 Post Construction 38 BSK Analytical Laboratories 07/2002 Low Level Lead Profile 396.00 Post Construction 38 BSK Analytical Laboratories 07/2002 Low Level Lead Profile 297.00 Post Construction 38 BSK Analytical Laboratories 08/2002 Low Level Lead Profile 279.00 Post Construction 38 BSK Analytical Laboratories Low Level Lead Profile-Bal Due 18.00 Post Construction 38 BSK Analytical Laboratories 07/10/2002 Low Level Lead Prof 231.00 Post Construction 38 BSK Analytical Laboratories 07/2002 Low Level Lead Profile 231.00 Post Construction 38 BSK Analytical Laboratories 08/2002 Low Level Lead Profile 66.00 Post Construction 38 BSK Analytical Laboratories 09/2002 Low Level Lead Profile 198.00 Post Construction 38 BSK Analytical Laboratories 05/2002 Low Level Lead Profile 165.00 Post Construction 38 BSK Analytical Laboratories 08/2002 Low Level Lead Profile 297.00 Post Construction 38 BSK Analytical Laboratories 10/2002 Low Level Lead Profile 99.00 Post Construction 38 BSK Analytical Laboratories 11/2002 Low Level Lead Profile 99.00 Post Construction 38 BSK Analytical Laboratories 05/2002 Low Level Lead Profile 165.00 Post Construction 38 BSK Analytical Laboratories 05/2002 Low Level Lead Profile 165.00 Post Construction
Item Number
38 Total SWQM Soil Monitoring 10,428.00 Post Construction
Municipal NPDES Program Implementation 7060-7066Investigation, Inspection, Enforcement
39 Fotech Color Labs 08/2002 Photos 6.00 Illicit Discharge 39 Fotech Color Labs 07/2002 Photos 16.66 Illicit Discharge 39 Fotech Color Labs Photo Developing 53.83 Illicit Discharge
Item Number
39Total Investigation, Inspection, Enforcement 76.49 Illicit Discharge
Monitoring42 AirLink Communications 08/2002 IP Activation Fee 45.00 Monitoring41 AT&T Wireless Services 07/14/2002-08/13/2002 Services 26.18 Monitoring40 Larry Walker Associates Inc Storm Water Quality Monitoring 10,552.33 Monitoring41 AT&T Wireless Services 08/14/02-09/13/02 Service Peri 23.76 Monitoring42 AirLink Communications 07/24/02-08/23/02 Telemetry Fe 58.06 Monitoring40 Larry Walker Associates Inc 2002-2003 Stormwater Monitorin 1,823.85 Monitoring40 Larry Walker Associates Inc 2001-2002 Stormwater Monitorin 8,756.96 Monitoring40 Larry Walker Associates Inc 2001-2002 Stormwater Monitorin 3,192.74 Monitoring42 AirLink Communications 10/2002 Telemetry Monthly Fee 98.00 Monitoring41 AT&T Wireless Services 09/14/02-10/13/02 Service 23.35 Monitoring42 Airlink Communications Inc 09/24/02-10/23/02 Monthly Fee 98.00 Monitoring41 AT&T Wireless Services 10/14/02-11/13/02 Service 23.98 Monitoring43 Larry Walker Associates Inc 10/01/02-10/31/02 Professional 7,816.19 Monitoring43 Larry Walker Associates Inc 09/01/02-09/18/02 Professional 4,692.12 Monitoring40 Larry Walker Associates Inc 2002-2003 SWQ Monitoring 18,662.34 Monitoring42 Airlink Communications Inc Service through 11/23/2002 98.00 Monitoring41 AT&T Wireless Services Service through 12/13/2002 23.56 Monitoring41 AT&T Wireless Services Service thru 01/15/2003 23.46 Monitoring43 Larry Walker Associates Inc Service thru 12/31/2002 27,576.10 Monitoring42 Airlink Communications Inc Services thru 12/23/2002 98.00 Monitoring41 AT&T Wireless Services Service thru 02/13/03 25.75 Monitoring40 Larry Walker Associates Inc 2002-2003 SWQ Monitoring 17,728.24 Monitoring42 Airlink Communications Inc Service thru 01/23/03 98.00 Monitoring42 Airlink Communications Inc 02/23/03 Monthly Fee 98.00 Monitoring41 AT&T Wireless Services 03/15/03 Billing 23.61 Monitoring40 Larry Walker Associates Inc 02/2003 SWQ Monitoring 14,544.32 Monitoring
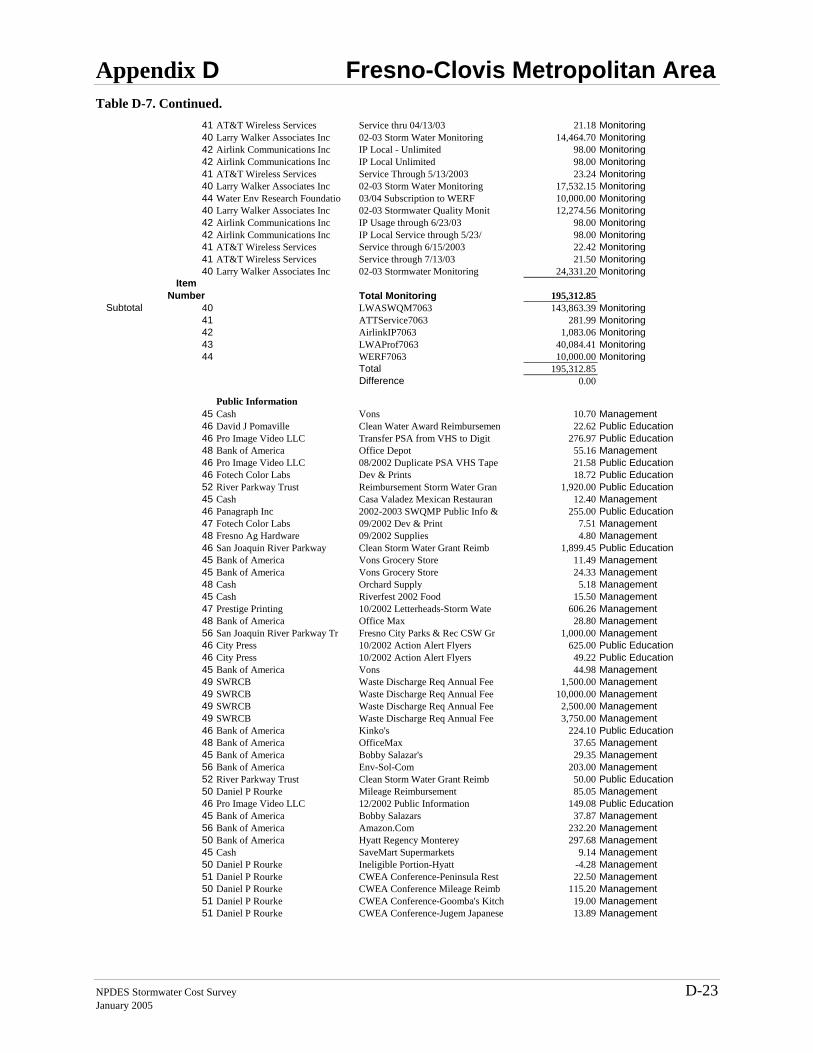
Appendix D Fresno-Clovis Metropolitan Area
NPDES Stormwater Cost Survey D-23 January 2005
Table D-7. Continued. 41 AT&T Wireless Services Service thru 04/13/03 21.18 Monitoring40 Larry Walker Associates Inc 02-03 Storm Water Monitoring 14,464.70 Monitoring42 Airlink Communications Inc IP Local - Unlimited 98.00 Monitoring42 Airlink Communications Inc IP Local Unlimited 98.00 Monitoring41 AT&T Wireless Services Service Through 5/13/2003 23.24 Monitoring40 Larry Walker Associates Inc 02-03 Storm Water Monitoring 17,532.15 Monitoring44 Water Env Research Foundatio 03/04 Subscription to WERF 10,000.00 Monitoring40 Larry Walker Associates Inc 02-03 Stormwater Quality Monit 12,274.56 Monitoring42 Airlink Communications Inc IP Usage through 6/23/03 98.00 Monitoring42 Airlink Communications Inc IP Local Service through 5/23/ 98.00 Monitoring41 AT&T Wireless Services Service through 6/15/2003 22.42 Monitoring41 AT&T Wireless Services Service through 7/13/03 21.50 Monitoring40 Larry Walker Associates Inc 02-03 Stormwater Monitoring 24,331.20 Monitoring
Item Number Total Monitoring 195,312.85
Subtotal 40 LWASWQM7063 143,863.39 Monitoring41 ATTService7063 281.99 Monitoring42 AirlinkIP7063 1,083.06 Monitoring43 LWAProf7063 40,084.41 Monitoring44 WERF7063 10,000.00 Monitoring
Total 195,312.85Difference 0.00
Public Information45 Cash Vons 10.70 Management46 David J Pomaville Clean Water Award Reimbursemen 22.62 Public Education 46 Pro Image Video LLC Transfer PSA from VHS to Digit 276.97 Public Education 48 Bank of America Office Depot 55.16 Management46 Pro Image Video LLC 08/2002 Duplicate PSA VHS Tape 21.58 Public Education 46 Fotech Color Labs Dev & Prints 18.72 Public Education 52 River Parkway Trust Reimbursement Storm Water Gran 1,920.00 Public Education 45 Cash Casa Valadez Mexican Restauran 12.40 Management46 Panagraph Inc 2002-2003 SWQMP Public Info & 255.00 Public Education 47 Fotech Color Labs 09/2002 Dev & Print 7.51 Management48 Fresno Ag Hardware 09/2002 Supplies 4.80 Management46 San Joaquin River Parkway Clean Storm Water Grant Reimb 1,899.45 Public Education 45 Bank of America Vons Grocery Store 11.49 Management45 Bank of America Vons Grocery Store 24.33 Management48 Cash Orchard Supply 5.18 Management45 Cash Riverfest 2002 Food 15.50 Management47 Prestige Printing 10/2002 Letterheads-Storm Wate 606.26 Management48 Bank of America Office Max 28.80 Management56 San Joaquin River Parkway Tr Fresno City Parks & Rec CSW Gr 1,000.00 Management46 City Press 10/2002 Action Alert Flyers 625.00 Public Education 46 City Press 10/2002 Action Alert Flyers 49.22 Public Education 45 Bank of America Vons 44.98 Management49 SWRCB Waste Discharge Req Annual Fee 1,500.00 Management49 SWRCB Waste Discharge Req Annual Fee 10,000.00 Management49 SWRCB Waste Discharge Req Annual Fee 2,500.00 Management49 SWRCB Waste Discharge Req Annual Fee 3,750.00 Management46 Bank of America Kinko's 224.10 Public Education 48 Bank of America OfficeMax 37.65 Management45 Bank of America Bobby Salazar's 29.35 Management56 Bank of America Env-Sol-Com 203.00 Management52 River Parkway Trust Clean Storm Water Grant Reimb 50.00 Public Education 50 Daniel P Rourke Mileage Reimbursement 85.05 Management46 Pro Image Video LLC 12/2002 Public Information 149.08 Public Education 45 Bank of America Bobby Salazars 37.87 Management56 Bank of America Amazon.Com 232.20 Management50 Bank of America Hyatt Regency Monterey 297.68 Management45 Cash SaveMart Supermarkets 9.14 Management50 Daniel P Rourke Ineligible Portion-Hyatt -4.28 Management51 Daniel P Rourke CWEA Conference-Peninsula Rest 22.50 Management50 Daniel P Rourke CWEA Conference Mileage Reimb 115.20 Management51 Daniel P Rourke CWEA Conference-Goomba's Kitch 19.00 Management51 Daniel P Rourke CWEA Conference-Jugem Japanese 13.89 Management
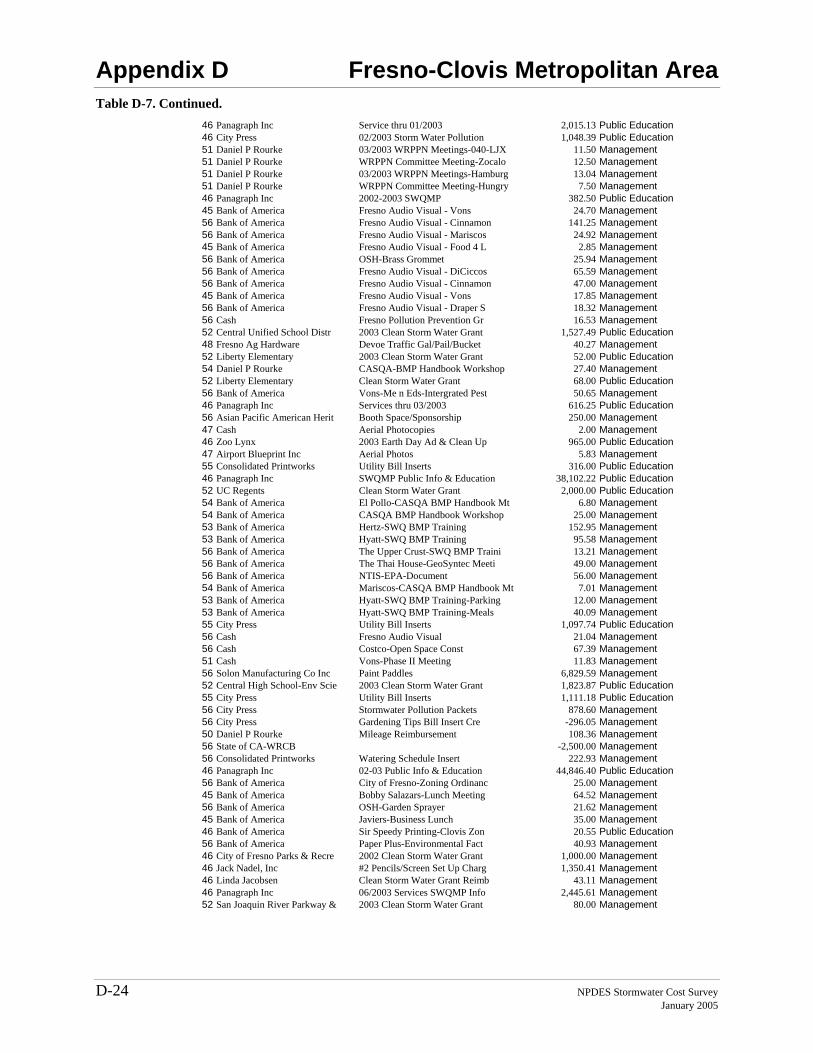
Appendix D Fresno-Clovis Metropolitan Area
D-24 NPDES Stormwater Cost Survey January 2005
Table D-7. Continued. 46 Panagraph Inc Service thru 01/2003 2,015.13 Public Education 46 City Press 02/2003 Storm Water Pollution 1,048.39 Public Education 51 Daniel P Rourke 03/2003 WRPPN Meetings-040-LJX 11.50 Management51 Daniel P Rourke WRPPN Committee Meeting-Zocalo 12.50 Management51 Daniel P Rourke 03/2003 WRPPN Meetings-Hamburg 13.04 Management51 Daniel P Rourke WRPPN Committee Meeting-Hungry 7.50 Management46 Panagraph Inc 2002-2003 SWQMP 382.50 Public Education 45 Bank of America Fresno Audio Visual - Vons 24.70 Management56 Bank of America Fresno Audio Visual - Cinnamon 141.25 Management56 Bank of America Fresno Audio Visual - Mariscos 24.92 Management45 Bank of America Fresno Audio Visual - Food 4 L 2.85 Management56 Bank of America OSH-Brass Grommet 25.94 Management56 Bank of America Fresno Audio Visual - DiCiccos 65.59 Management56 Bank of America Fresno Audio Visual - Cinnamon 47.00 Management45 Bank of America Fresno Audio Visual - Vons 17.85 Management56 Bank of America Fresno Audio Visual - Draper S 18.32 Management56 Cash Fresno Pollution Prevention Gr 16.53 Management52 Central Unified School Distr 2003 Clean Storm Water Grant 1,527.49 Public Education 48 Fresno Ag Hardware Devoe Traffic Gal/Pail/Bucket 40.27 Management52 Liberty Elementary 2003 Clean Storm Water Grant 52.00 Public Education 54 Daniel P Rourke CASQA-BMP Handbook Workshop 27.40 Management52 Liberty Elementary Clean Storm Water Grant 68.00 Public Education 56 Bank of America Vons-Me n Eds-Intergrated Pest 50.65 Management46 Panagraph Inc Services thru 03/2003 616.25 Public Education 56 Asian Pacific American Herit Booth Space/Sponsorship 250.00 Management47 Cash Aerial Photocopies 2.00 Management46 Zoo Lynx 2003 Earth Day Ad & Clean Up 965.00 Public Education 47 Airport Blueprint Inc Aerial Photos 5.83 Management55 Consolidated Printworks Utility Bill Inserts 316.00 Public Education 46 Panagraph Inc SWQMP Public Info & Education 38,102.22 Public Education 52 UC Regents Clean Storm Water Grant 2,000.00 Public Education 54 Bank of America El Pollo-CASQA BMP Handbook Mt 6.80 Management54 Bank of America CASQA BMP Handbook Workshop 25.00 Management53 Bank of America Hertz-SWQ BMP Training 152.95 Management53 Bank of America Hyatt-SWQ BMP Training 95.58 Management56 Bank of America The Upper Crust-SWQ BMP Traini 13.21 Management56 Bank of America The Thai House-GeoSyntec Meeti 49.00 Management56 Bank of America NTIS-EPA-Document 56.00 Management54 Bank of America Mariscos-CASQA BMP Handbook Mt 7.01 Management53 Bank of America Hyatt-SWQ BMP Training-Parking 12.00 Management53 Bank of America Hyatt-SWQ BMP Training-Meals 40.09 Management55 City Press Utility Bill Inserts 1,097.74 Public Education 56 Cash Fresno Audio Visual 21.04 Management56 Cash Costco-Open Space Const 67.39 Management51 Cash Vons-Phase II Meeting 11.83 Management56 Solon Manufacturing Co Inc Paint Paddles 6,829.59 Management52 Central High School-Env Scie 2003 Clean Storm Water Grant 1,823.87 Public Education 55 City Press Utility Bill Inserts 1,111.18 Public Education 56 City Press Stormwater Pollution Packets 878.60 Management56 City Press Gardening Tips Bill Insert Cre -296.05 Management50 Daniel P Rourke Mileage Reimbursement 108.36 Management56 State of CA-WRCB -2,500.00 Management56 Consolidated Printworks Watering Schedule Insert 222.93 Management46 Panagraph Inc 02-03 Public Info & Education 44,846.40 Public Education 56 Bank of America City of Fresno-Zoning Ordinanc 25.00 Management45 Bank of America Bobby Salazars-Lunch Meeting 64.52 Management56 Bank of America OSH-Garden Sprayer 21.62 Management45 Bank of America Javiers-Business Lunch 35.00 Management46 Bank of America Sir Speedy Printing-Clovis Zon 20.55 Public Education 56 Bank of America Paper Plus-Environmental Fact 40.93 Management46 City of Fresno Parks & Recre 2002 Clean Storm Water Grant 1,000.00 Management46 Jack Nadel, Inc #2 Pencils/Screen Set Up Charg 1,350.41 Management46 Linda Jacobsen Clean Storm Water Grant Reimb 43.11 Management46 Panagraph Inc 06/2003 Services SWQMP Info 2,445.61 Management52 San Joaquin River Parkway & 2003 Clean Storm Water Grant 80.00 Management
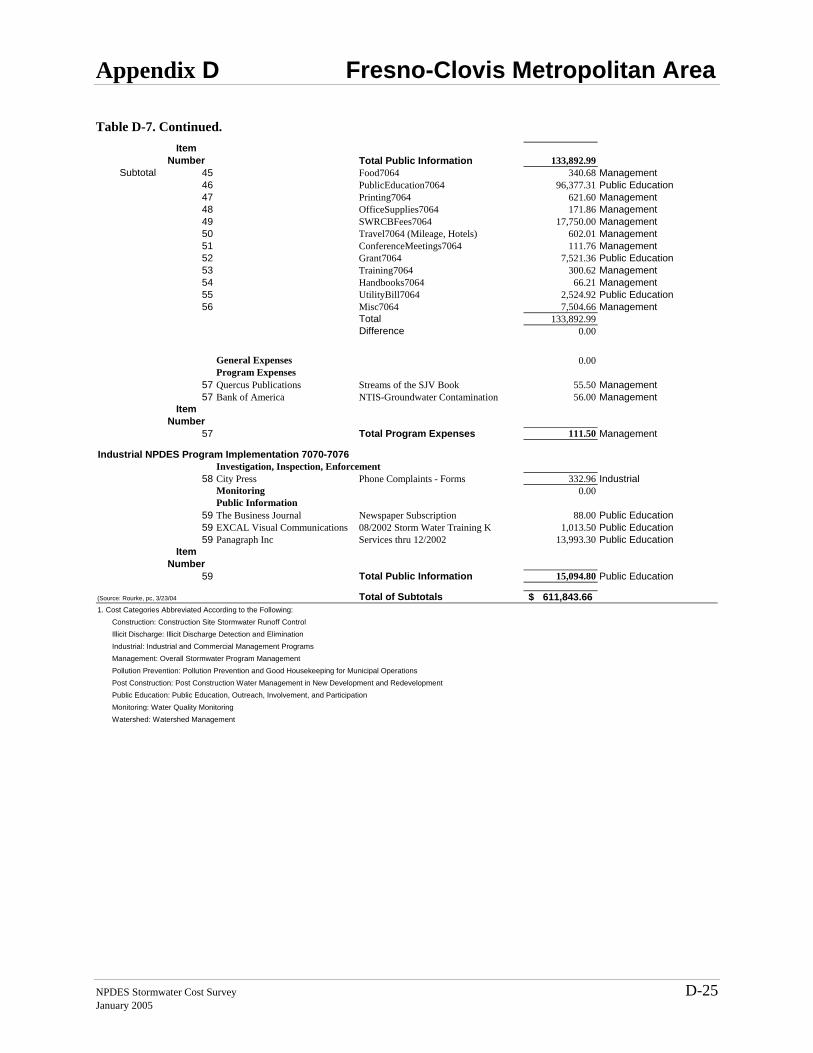
Appendix D Fresno-Clovis Metropolitan Area
NPDES Stormwater Cost Survey D-25 January 2005
Table D-7. Continued. Item
Number Total Public Information 133,892.99 Subtotal 45 Food7064 340.68 Management
46 PublicEducation7064 96,377.31 Public Education 47 Printing7064 621.60 Management48 OfficeSupplies7064 171.86 Management49 SWRCBFees7064 17,750.00 Management50 Travel7064 (Mileage, Hotels) 602.01 Management51 ConferenceMeetings7064 111.76 Management52 Grant7064 7,521.36 Public Education 53 Training7064 300.62 Management54 Handbooks7064 66.21 Management55 UtilityBill7064 2,524.92 Public Education 56 Misc7064 7,504.66 Management
Total 133,892.99Difference 0.00
General Expenses 0.00Program Expenses
57 Quercus Publications Streams of the SJV Book 55.50 Management57 Bank of America NTIS-Groundwater Contamination 56.00 Management
Item Number
57 Total Program Expenses 111.50 Management
Industrial NPDES Program Implementation 7070-7076Investigation, Inspection, Enforcement
58 City Press Phone Complaints - Forms 332.96 IndustrialMonitoring 0.00Public Information
59 The Business Journal Newspaper Subscription 88.00 Public Education 59 EXCAL Visual Communications 08/2002 Storm Water Training K 1,013.50 Public Education 59 Panagraph Inc Services thru 12/2002 13,993.30 Public Education
Item Number
59 Total Public Information 15,094.80 Public Education
(Source: Rourke, pc, 3/23/04 Total of Subtotals 611,843.66$ 1. Cost Categories Abbreviated According to the Following: Construction: Construction Site Stormwater Runoff Control Illicit Discharge: Illicit Discharge Detection and Elimination Industrial: Industrial and Commercial Management Programs Management: Overall Stormwater Program Management Pollution Prevention: Pollution Prevention and Good Housekeeping for Municipal Operations Post Construction: Post Construction Water Management in New Development and Redevelopment Public Education: Public Education, Outreach, Involvement, and Participation Monitoring: Water Quality Monitoring Watershed: Watershed Management

Appendix E City of Sacramento
NPDES Stormwater Cost Survey E-1 January 2005
APPENDIX E The backup calculations for the cost for each cost survey category in Section 7 and the sources of the cost data are presented in this appendix. Tables are generally presented by sequentially increasing levels of detail. Figure E-1 illustrates how data is shared throughout the tables.
Table E-1 contains all costs organized into the various standard cost survey categories. The subtotals for each cost category are also presented in Section 7, Table 7-2. The remaining tables (E-2 through E-9) present the detailed back-up information for the numbers in Table E-1. Table E-1 is linked to the back-up tables by the table and item numbers in the ‘Source’ column. Most of the cost information provided by city staff is listed in Table E-2. Item numbers corresponding to the subtotals in Table E-2 were added to the left hand column to easily show how the numbers are pulled forward to Table E-1. The right hand column in Table E-2 was added to show how costs were allocated to the cost survey categories. Table E-1 entries that were not taken directly from Table E-2 are found in Tables E-3 through E-9.
For the city of Sacramento, labor costs are distributed among the various cost survey categories according to labor cost spreadsheets provided by city staff (Table E-7). Thus, comparing costs with other municipalities where such costs are not distributed, Sacramento’s Overall Stormwater Management Program costs will be lower.
Detailed descriptions of how the costs were developed are contained in the following paragraphs.
Construction Site Stormwater Runoff Control The total cost for this category was $261,716. The costs for this category include labor, which was broken down into three categories: inspections, student interns, and all other activities. There was also cost identified for developing BMP handbooks (one time annual cost, but may occur at a time later than one year). Other activities performed included (descriptions obtained from annual stormwater report):
• Issued 144 grading permits
• Reviewed 68 SWPPPs
• Issued 384 enforcement actions
• Sent winterization letters to property owners with active construction sites to remind contractors to prepare their construction sites for the rainy season and to submit winterization certifications
• Developed a Microsoft Access database to track all stormwater inspections and enforcement actions for private development construction sites
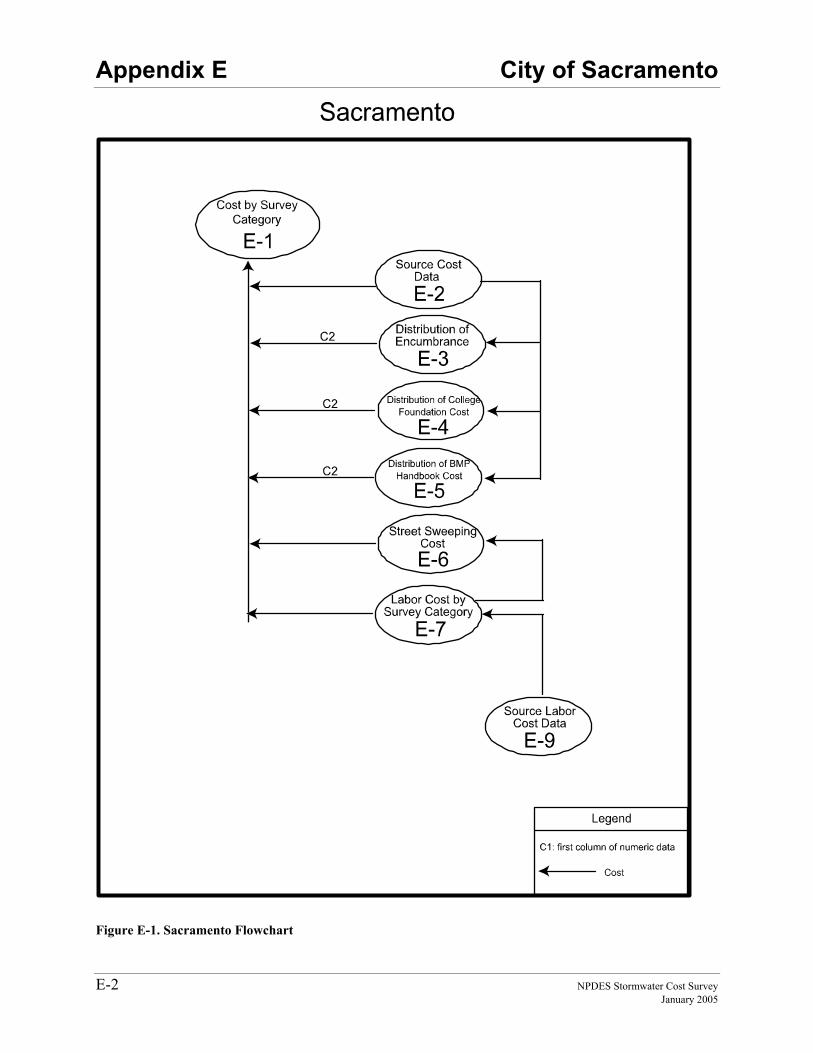
Appendix E City of Sacramento
E-2 NPDES Stormwater Cost Survey January 2005
Figure E-1. Sacramento Flowchart
Appendix E City of Sacramento
NPDES Stormwater Cost Survey E-3 January 2005
Illicit Discharge Detection and Elimination (IDDE) The total cost for this category was $37,507. Labor cost is the only cost allocated to this category. Activities performed included issuance of 55 enforcement actions and investigation of all 83 calls received involving suspected illicit discharge (Sacramento, 2003b).
Industrial and Commercial Management Programs The total cost for this category was $42,318. Approximately 94 percent of the cost was for stormwater staff labor. The other identified cost was for developing BMP handbooks (one time annual cost, but may occur at a time later than one year). Other activities included issuance of 41 enforcement actions, development of BMP brochures for the auto body, auto washing, and auto repair industry, and creation of a Clean Water Business Partner program for the mobile pressure washing industry (Sacramento, 2003b).
Overall Stormwater Program Management The total cost for this category was $281,501. Activities in this program were as follows:
• Office products
• Planning
• Annual reporting
• CASQA membership fees
• Mailing
• NPDES fees
• Legal fees
• Miscellaneous
• Stormwater staff labor
Pollution Prevention and Good Housekeeping for Municipal Operations The total cost for this category was $3,270,806. Most of the cost for this category was for the activities of street sweeping (40 percent), drainage system maintenance (46 percent), and pump station cleaning (13 percent).
Street sweeping costs were also estimated by city staff. Street sweeping cost was estimated at $1.6 million. Street sweeping costs included the cost of sweeping 3 percent of the core downtown area 7 extra times a month which is beyond the city’s permit requirement (Busath, pers. comm., 11/21/04). Due to this an annual required compliance cost was calculated for the city based on the $1.6 million estimate and permit required street sweeping frequencies (Table E-7). The calculated annual required compliance cost was $1,322,748.
Appendix E City of Sacramento
E-4 NPDES Stormwater Cost Survey January 2005
Sump, drain inlet, manhole, and drain line and channel cleaning performed by city staff was reported under the Field Services labor category in Table E-8. Equipment costs for this effort was not available, but was roughly estimated as 75 percent of the labor costs as a result of consultation with city staff. This brings the total cost for drainage system maintenance to $1,514,926.
Lastly, $2,500 was attributable to this category for development of BMP handbooks (one time cost, but may occur less frequent than annually due to updates). The city also performed inspection and maintenance of parking lots (Sacramento, 2003b).
Due to inaccurate use of labor codes by city personnel for pump station cleaning, these costs were estimated by the city of Sacramento staff rather than relying on accounting record reports (Busath, pers. comm., 11/21/03). The reported labor cost of $22,552 from Table E-8 was not used in this report. Pump station cleaning, including equipment costs, was estimated at $420,000 (Busath, pers. comm., 1/11/05).
Post Construction Stormwater Management in New Development and Redevelopment The total cost of this category was $38,517. The labor costs for this category were broken down in the same way as the Construction Site Stormwater Runoff Control category. There was also cost identified for development of BMP handbooks (one time annual cost, but may occur at a time later than one year)
Public Education, Outreach, Involvement, and Participation The total cost of this category was $361,440. The costs associated with this category were for the following activities:
• Developing Integrated Pest Management (IPM)
• Television
• Radio
• Billboard
• Newspaper
• Mailings
• Participation in public events
• Water Education Foundation grant
• Project development
• Agriculture outreach
• Pet outreach
• Elementary education
Appendix E City of Sacramento
NPDES Stormwater Cost Survey E-5 January 2005
• Student intern labor
• Stormwater staff labor
• University grant
Where activity statistics were available, normalized costs were calculated. Activity statistics were not available for each activity. Therefore, normalization based on total cost was not possible.
Water Quality Monitoring The total cost of this category was $494,577. Modeling and data analysis accounted for $131,688. Sample collection and lab cost was $303,077 and stormwater staff and student labor cost was $59,812.
Watershed Management The total cost of this category was $31,591, which was primarily for stormwater staff labor.
References City of Sacramento. 2003. “Stormwater Management Program 2002/2003 Annual Report”
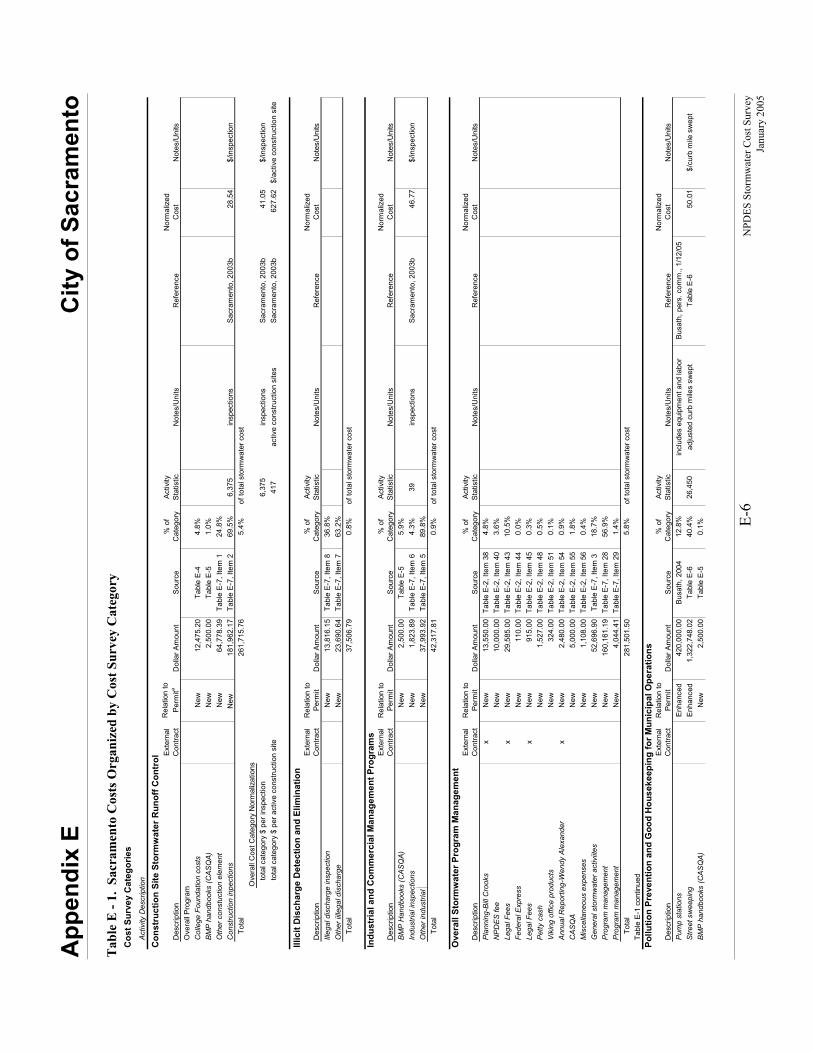
App
endi
x E
City
of S
acra
men
to
E-
6 N
PDES
Sto
rmw
ater
Cos
t Sur
vey
Janu
ary
2005
T
able
E -
1. S
acra
men
to C
osts
Org
aniz
ed b
y C
ost S
urve
y C
ateg
ory
Cos
t Sur
vey
Cat
egor
ies
Act
ivity
Des
crip
tion
Con
stru
ctio
n Si
te S
torm
wat
er R
unof
f Con
trol
Des
crip
tion
Ext
erna
l C
ontra
ctR
elat
ion
to
Perm
itaD
olla
r Am
ount
Sou
rce
% o
f C
ateg
ory
Act
ivity
S
tatis
ticN
otes
/Uni
tsR
efer
ence
Nor
mal
ized
C
ost
Not
es/U
nits
Ove
rall
Pro
gram
Col
lege
Fou
ndat
ion
cost
s
New
12,4
75.2
0Ta
ble
E-4
4.8%
BM
P h
andb
ooks
(CA
SQ
A)
N
ew2,
500.
00Ta
ble
E-5
1.0%
Oth
er c
onst
uctio
n el
emen
t
New
64,7
78.3
9Ta
ble
E-7
, Ite
m 1
24.8
%C
onst
ruct
ion
inpe
ctio
ns
New
18
1,96
2.17
Tabl
e E
-7, I
tem
269
.5%
6,37
5in
spec
tions
Sacr
amen
to, 2
003b
28.5
4$/
insp
ectio
n
Tota
l26
1,71
5.76
5.4%
Ove
rall
Cos
t Cat
egor
y N
orm
aliz
atio
ns
tota
l cat
egor
y $
per i
nspe
ctio
n6,
375
insp
ectio
nsSa
cram
ento
, 200
3b41
.05
$/in
spec
tion
to
tal c
ateg
ory
$ pe
r act
ive
cons
truct
ion
site
417
activ
e co
nstru
ctio
n si
tes
Sacr
amen
to, 2
003b
627.
62$/
activ
e co
nstru
ctio
n si
te
Illic
it D
isch
arge
Det
ectio
n an
d El
imin
atio
n
Des
crip
tion
Ext
erna
l C
ontra
ctR
elat
ion
to
Perm
itD
olla
r Am
ount
Sou
rce
% o
f C
ateg
ory
Act
ivity
S
tatis
ticN
otes
/Uni
tsR
efer
ence
Nor
mal
ized
C
ost
Not
es/U
nits
Illeg
al d
isch
arge
insp
ectio
n
New
13,8
16.1
5Ta
ble
E-7
, Ite
m 8
36.8
%O
ther
iille
gal d
isch
arge
N
ew23
,690
.64
Tabl
e E
-7, I
tem
763
.2%
Tota
l37
,506
.79
0.8%
Indu
stria
l and
Com
mer
cial
Man
agem
ent P
rogr
ams
Des
crip
tion
Ext
erna
l C
ontra
ctR
elat
ion
to
Perm
itD
olla
r Am
ount
Sou
rce
% o
f C
ateg
ory
Act
ivity
S
tatis
ticN
otes
/Uni
tsR
efer
ence
Nor
mal
ized
C
ost
Not
es/U
nits
BM
P H
andb
ooks
(CA
SQ
A)
N
ew2,
500.
00Ta
ble
E-5
5.9%
Indu
stria
l ins
pect
ions
N
ew1,
823.
89Ta
ble
E-7
, Ite
m 6
4.3%
39in
spec
tions
Sacr
amen
to, 2
003b
46.7
7$/
insp
ectio
nO
ther
indu
stria
l
New
37,9
93.9
2Ta
ble
E-7
, Ite
m 5
89.8
%
Tota
l42
,317
.81
0.9%
Ove
rall
Stor
mw
ater
Pro
gram
Man
agem
ent
Des
crip
tion
Ext
erna
l C
ontra
ctR
elat
ion
to
Perm
itD
olla
r Am
ount
Sou
rce
% o
f C
ateg
ory
Act
ivity
S
tatis
ticN
otes
/Uni
tsR
efer
ence
Nor
mal
ized
C
ost
Not
es/U
nits
Pla
nnin
g-B
ill C
rook
sx
New
13,5
50.0
0Ta
ble
E-2,
Item
38
4.8%
NP
DE
S fe
e
New
10,0
00.0
0Ta
ble
E-2,
Item
40
3.6%
Lega
l Fee
sx
New
29,5
85.0
0Ta
ble
E-2,
Item
43
10.5
%Fe
dera
l Exp
ress
N
ew11
0.00
Tabl
e E-
2, It
em 4
40.
0%Le
gal F
ees
xN
ew91
5.00
Tabl
e E-
2, It
em 4
50.
3%P
etty
cas
h
New
1,52
7.00
Tabl
e E-
2, It
em 4
80.
5%V
ikin
g of
fice
prod
ucts
N
ew32
4.00
Tabl
e E-
2, It
em 5
10.
1%A
nnua
l Rep
ortin
g-W
endy
Ale
xand
erx
New
2,48
0.00
Tabl
e E-
2, It
em 5
40.
9%C
AS
QA
N
ew5,
000.
00Ta
ble
E-2,
Item
55
1.8%
Mis
cella
neou
s ex
pens
es
New
1,10
8.00
Tabl
e E-
2, It
em 5
60.
4%G
ener
al s
torm
wat
er a
ctiv
iites
N
ew52
,696
.90
Tabl
e E
-7, I
tem
318
.7%
Pro
gram
man
agem
ent
N
ew16
0,16
1.19
Tabl
e E-
7, It
em 2
856
.9%
Pro
gram
man
agem
ent
N
ew4,
044.
41Ta
ble
E-7,
Item
29
1.4%
To
tal
281,
501.
505.
8%Ta
ble
E-1
con
tinue
dPo
llutio
n Pr
even
tion
and
Goo
d H
ouse
keep
ing
for M
unic
ipal
Ope
ratio
ns
Des
crip
tion
Ext
erna
l C
ontra
ctR
elat
ion
to
Perm
itD
olla
r Am
ount
Sou
rce
% o
f C
ateg
ory
Act
ivity
S
tatis
ticN
otes
/Uni
tsR
efer
ence
Nor
mal
ized
C
ost
Not
es/U
nits
Pum
p st
atio
ns
Enh
ance
d42
0,00
0.00
Busa
th, 2
004
12.8
%in
clud
es e
quip
men
t and
labo
rB
usat
h, p
ers.
com
m.,
1/12
/05
Stre
et s
wee
ping
E
nhan
ced
1,32
2,74
8.02
Tabl
e E
-640
.4%
26,4
50ad
just
ed c
urb
mile
s sw
ept
Tabl
e E
-650
.01
$/cu
rb m
ile s
wep
tB
MP
han
dboo
ks (C
AS
QA
)
New
2,50
0.00
Tabl
e E
-50.
1%
of to
tal s
torm
wat
er c
ost
of to
tal s
torm
wat
er c
ost
of to
tal s
torm
wat
er c
ost
of to
tal s
torm
wat
er c
ost
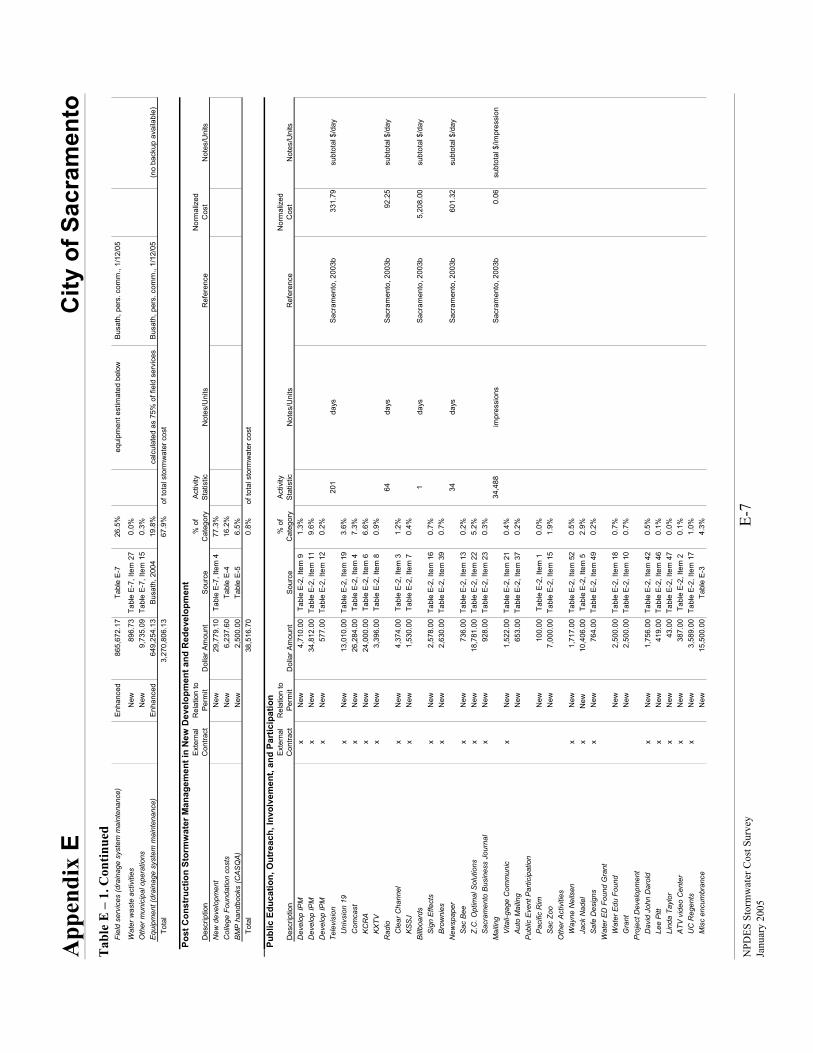
App
endi
x E
City
of S
acra
men
to
NPD
ES S
torm
wat
er C
ost S
urve
y E-
7
Janu
ary
2005
T
able
E –
1. C
ontin
ued
Fiel
d se
rvic
es (d
rain
age
syst
em m
aint
enan
ce)
E
nhan
ced
865,
672.
17Ta
ble
E-7
26.5
%eq
uipm
ent e
stim
ated
bel
owBu
sath
, per
s. c
omm
., 1/
12/0
5
Wat
er w
aste
act
iviti
es
New
896.
73Ta
ble
E-7,
Item
27
0.0%
Oth
er m
unic
ipal
ope
ratio
ns
New
9,73
5.09
Tabl
e E-
7, It
em 1
50.
3%E
quip
men
t (dr
aina
ge s
yste
m m
aint
enan
ce)
E
nhan
ced
649,
254.
13Bu
sath
, 200
419
.8%
calc
ulat
ed a
s 75
% o
f fie
ld s
ervi
ces
Bus
ath,
per
s. c
omm
., 1/
12/0
5(n
o ba
ckup
ava
ilabl
e)
Tota
l3,
270,
806.
1367
.9%
Post
Con
stru
ctio
n St
orm
wat
er M
anag
emen
t in
New
Dev
elop
men
t and
Red
evel
opm
ent
Des
crip
tion
Ext
erna
l C
ontra
ctR
elat
ion
to
Perm
itD
olla
r Am
ount
Sou
rce
% o
f C
ateg
ory
Act
ivity
S
tatis
ticN
otes
/Uni
tsR
efer
ence
Nor
mal
ized
C
ost
Not
es/U
nits
New
dev
elop
men
tN
ew29
,779
.10
Tabl
e E
-7, I
tem
477
.3%
Col
lege
Fou
ndat
ion
cost
sN
ew6,
237.
60Ta
ble
E-4
16.2
%B
MP
han
dboo
ks (C
AS
QA
)N
ew2,
500.
00Ta
ble
E-5
6.5%
To
tal
38,5
16.7
00.
8%
Publ
ic E
duca
tion,
Out
reac
h, In
volv
emen
t, an
d Pa
rtic
ipat
ion
Des
crip
tion
Ext
erna
l C
ontra
ctR
elat
ion
to
Perm
itD
olla
r Am
ount
Sou
rce
% o
f C
ateg
ory
Act
ivity
S
tatis
ticN
otes
/Uni
tsR
efer
ence
Nor
mal
ized
C
ost
Not
es/U
nits
Dev
elop
IPM
xN
ew4,
710.
00Ta
ble
E-2
, Ite
m 9
1.3%
Dev
elop
IPM
xN
ew34
,812
.00
Tabl
e E-
2, It
em 1
19.
6%D
evel
op IP
Mx
New
577.
00Ta
ble
E-2,
Item
12
0.2%
Tele
visi
on20
1da
ysS
acra
men
to, 2
003b
331.
79su
btot
al $
/day
U
nivs
ion
19x
New
13,0
10.0
0Ta
ble
E-2,
Item
19
3.6%
C
omca
stx
New
26,2
84.0
0Ta
ble
E-2
, Ite
m 4
7.3%
K
CR
Ax
New
24,0
00.0
0Ta
ble
E-2
, Ite
m 6
6.6%
K
XTV
xN
ew3,
396.
00Ta
ble
E-2
, Ite
m 8
0.9%
Rad
io64
days
Sac
ram
ento
, 200
3b92
.25
subt
otal
$/d
ay
Cle
ar C
hann
elx
New
4,37
4.00
Tabl
e E
-2, I
tem
31.
2%
KS
SJ
xN
ew1,
530.
00Ta
ble
E-2
, Ite
m 7
0.4%
Billb
oard
s1
days
Sac
ram
ento
, 200
3b5,
208.
00su
btot
al $
/day
S
ign
Effe
cts
xN
ew2,
578.
00Ta
ble
E-2,
Item
16
0.7%
B
row
nies
xN
ew2,
630.
00Ta
ble
E-2,
Item
39
0.7%
New
spap
er34
days
Sac
ram
ento
, 200
3b60
1.32
subt
otal
$/d
ay
Sac
Bee
xN
ew73
6.00
Tabl
e E-
2, It
em 1
30.
2%
Z.C
. Opt
imal
Sol
utio
nsx
New
18,7
81.0
0Ta
ble
E-2,
Item
22
5.2%
S
acra
men
to B
usin
ess
Jour
nal
xN
ew92
8.00
Tabl
e E-
2, It
em 2
30.
3%M
ailin
g34
,488
impr
essi
ons
Sacr
amen
to, 2
003b
0.06
subt
otal
$/im
pres
sion
V
itali-
gage
Com
mun
icx
New
1,52
2.00
Tabl
e E-
2, It
em 2
10.
4%
Aut
o M
ailin
gN
ew65
3.00
Tabl
e E-
2, It
em 3
70.
2%P
ublic
Eve
nt P
artic
ipat
ion
P
acifi
c R
imN
ew10
0.00
Tabl
e E
-2, I
tem
10.
0%
Sac
Zoo
New
7,00
0.00
Tabl
e E-
2, It
em 1
51.
9%O
ther
Act
iviti
es
Way
ne N
eils
enx
New
1,71
7.00
Tabl
e E-
2, It
em 5
20.
5%
Jack
Nad
elx
New
10
,406
.00
Tabl
e E
-2, I
tem
52.
9%
Saf
e D
esig
nsx
New
764.
00Ta
ble
E-2,
Item
49
0.2%
Wat
er E
D F
ound
Gra
nt
Wat
er E
du F
ound
New
2,50
0.00
Tabl
e E-
2, It
em 1
80.
7%
Gra
ntN
ew2,
500.
00Ta
ble
E-2,
Item
10
0.7%
Pro
ject
Dev
elop
men
t
Dav
id J
ohn
Dar
old
xN
ew1,
756.
00Ta
ble
E-2,
Item
42
0.5%
Le
e Pi
ttx
New
419.
00Ta
ble
E-2,
Item
46
0.1%
Li
nda
Tayl
orx
New
43.0
0Ta
ble
E-2,
Item
47
0.0%
A
TV v
ideo
Cen
ter
xN
ew38
7.00
Tabl
e E
-2, I
tem
20.
1%
UC
Reg
ents
xN
ew3,
589.
00Ta
ble
E-2,
Item
17
1.0%
M
isc
encu
mbr
ance
New
15,5
00.0
0Ta
ble
E-3
4.3%
of to
tal s
torm
wat
er c
ost
of to
tal s
torm
wat
er c
ost
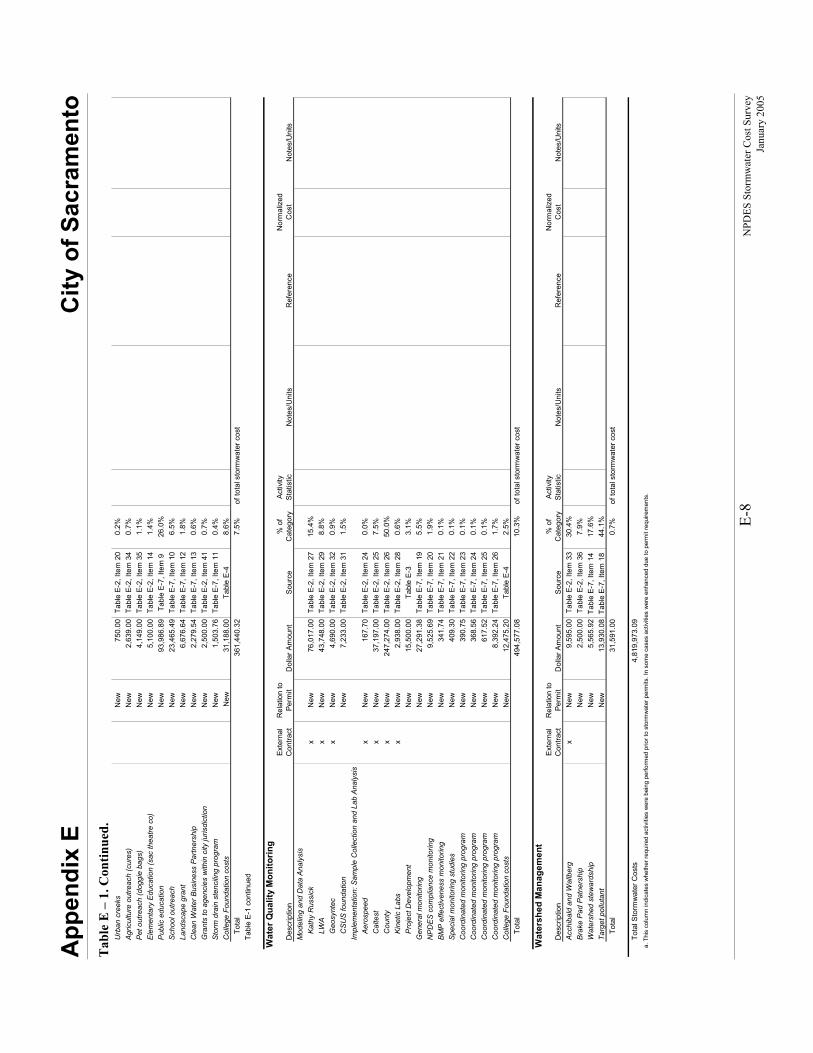
App
endi
x E
City
of S
acra
men
to
E-
8 N
PDES
Sto
rmw
ater
Cos
t Sur
vey
Janu
ary
2005
T
able
E –
1. C
ontin
ued.
U
rban
cre
eks
New
750.
00Ta
ble
E-2,
Item
20
0.2%
Agr
icul
ture
out
reac
h (c
ures
)N
ew2,
639.
00Ta
ble
E-2,
Item
34
0.7%
Pet
out
reac
h (d
oggi
e ba
gs)
New
4,14
9.00
Tabl
e E-
2, It
em 3
51.
1%E
lem
enta
ry E
duca
tion
(sac
thea
tre c
o)N
ew5,
100.
00Ta
ble
E-2,
Item
14
1.4%
Pub
lic e
duca
tion
New
93,9
86.8
9Ta
ble
E-7
, Ite
m 9
26.0
%S
choo
l out
reac
hN
ew23
,465
.49
Tabl
e E-
7, It
em 1
06.
5%La
ndsc
ape
gran
tN
ew6,
676.
64Ta
ble
E-7,
Item
12
1.8%
Cle
an W
ater
Bus
ines
s P
artn
ersh
ipN
ew2,
279.
54Ta
ble
E-7,
Item
13
0.6%
Gra
nts
to a
genc
ies
with
in c
ity ju
risdi
ctio
nN
ew2,
500.
00Ta
ble
E-2,
Item
41
0.7%
Sto
rm d
rain
ste
ncilin
g pr
ogra
mN
ew1,
503.
76Ta
ble
E-7,
Item
11
0.4%
Col
lege
Fou
ndat
ion
cost
s N
ew31
,188
.00
Tabl
e E
-48.
6%
Tota
l36
1,44
0.32
7.5%
Tabl
e E
-1 c
ontin
ued
Wat
er Q
ualit
y M
onito
ring
Des
crip
tion
Ext
erna
l C
ontra
ctR
elat
ion
to
Perm
itD
olla
r Am
ount
Sou
rce
% o
f C
ateg
ory
Act
ivity
S
tatis
ticN
otes
/Uni
tsR
efer
ence
Nor
mal
ized
C
ost
Not
es/U
nits
Mod
elin
g an
d D
ata
Ana
lysi
s
Kat
hy R
ussi
ckx
New
76,0
17.0
0Ta
ble
E-2,
Item
27
15.4
%
LWA
xN
ew43
,748
.00
Tabl
e E-
2, It
em 2
98.
8%
Geo
synt
ecx
New
4,69
0.00
Tabl
e E-
2, It
em 3
20.
9%
CS
US
foun
datio
nN
ew7,
233.
00Ta
ble
E-2,
Item
31
1.5%
Impl
emen
tatio
n: S
ampl
e C
olle
ctio
n an
d La
b A
naly
sis
A
eros
peed
xN
ew16
7.70
Tabl
e E-
2, It
em 2
40.
0%
Cal
test
x
New
37,1
97.0
0Ta
ble
E-2,
Item
25
7.5%
C
ount
yx
New
247,
274.
00Ta
ble
E-2,
Item
26
50.0
%
Kin
etic
Lab
sx
New
2,93
8.00
Tabl
e E-
2, It
em 2
80.
6%
Pro
ject
Dev
elop
men
tN
ew15
,500
.00
Tabl
e E
-33.
1%G
ener
al m
onito
ring
New
27,2
91.3
8Ta
ble
E-7,
Item
19
5.5%
NP
DE
S co
mpl
ianc
e m
onito
ring
New
9,52
5.69
Tabl
e E-
7, It
em 2
01.
9%B
MP
effe
ctiv
enes
s m
onito
ring
New
341.
74Ta
ble
E-7,
Item
21
0.1%
Spe
cial
mon
itorin
g st
udie
sN
ew40
9.30
Tabl
e E-
7, It
em 2
20.
1%C
oord
inat
ed m
onito
ring
prog
ram
New
390.
75Ta
ble
E-7,
Item
23
0.1%
Coo
rdin
ated
mon
itorin
g pr
ogra
mN
ew36
8.56
Tabl
e E-
7, It
em 2
40.
1%C
oord
inat
ed m
onito
ring
prog
ram
New
617.
52Ta
ble
E-7,
Item
25
0.1%
Coo
rdin
ated
mon
itorin
g pr
ogra
mN
ew8,
392.
24Ta
ble
E-7,
Item
26
1.7%
Col
lege
Fou
ndat
ion
cost
sN
ew12
,475
.20
Tabl
e E
-42.
5%
Tota
l49
4,57
7.08
10.3
%
Wat
ersh
ed M
anag
emen
t
Des
crip
tion
Ext
erna
l C
ontra
ctR
elat
ion
to
Perm
itD
olla
r Am
ount
Sou
rce
% o
f C
ateg
ory
Act
ivity
S
tatis
ticN
otes
/Uni
tsR
efer
ence
Nor
mal
ized
C
ost
Not
es/U
nits
Acc
hiba
ld a
nd W
allb
erg
xN
ew9,
595.
00Ta
ble
E-2,
Item
33
30.4
%B
rake
Pad
Pat
ners
hip
New
2,50
0.00
Tabl
e E-
2, It
em 3
67.
9%W
ater
shed
ste
war
dshi
pN
ew5,
565.
92Ta
ble
E-7
, Ite
m 1
4 17
.6%
Targ
et p
ollu
tant
New
13,9
30.0
8Ta
ble
E-7
, Ite
m 1
8 44
.1%
To
tal
31,5
91.0
00.
7%
Tota
l Sto
rmw
ater
Cos
ts4,
819,
973.
09a.
Thi
s co
lum
n in
dica
tes
whe
ther
requ
ired
activ
ities
wer
e be
ing
perfo
rmed
prio
r to
stor
mw
ater
per
mits
. In
som
e ca
ses
activ
ities
wer
e en
hanc
ed d
ue to
per
mit
requ
irem
ents
.
of to
tal s
torm
wat
er c
ost
of to
tal s
torm
wat
er c
ost
of to
tal s
torm
wat
er c
ost
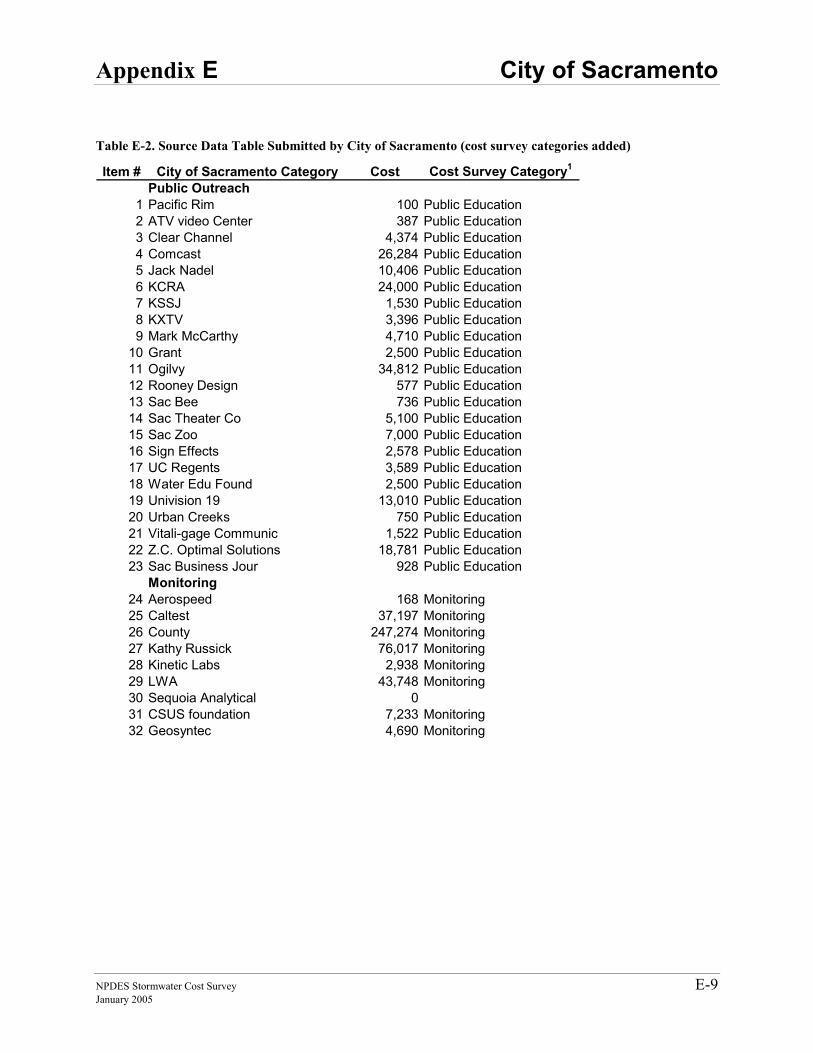
Appendix E City of Sacramento
NPDES Stormwater Cost Survey E-9 January 2005
Table E-2. Source Data Table Submitted by City of Sacramento (cost survey categories added)
Item # City of Sacramento Category Cost Cost Survey Category1
Public Outreach1 Pacific Rim 100 Public Education 2 ATV video Center 387 Public Education 3 Clear Channel 4,374 Public Education 4 Comcast 26,284 Public Education 5 Jack Nadel 10,406 Public Education 6 KCRA 24,000 Public Education 7 KSSJ 1,530 Public Education 8 KXTV 3,396 Public Education 9 Mark McCarthy 4,710 Public Education
10 Grant 2,500 Public Education 11 Ogilvy 34,812 Public Education 12 Rooney Design 577 Public Education 13 Sac Bee 736 Public Education 14 Sac Theater Co 5,100 Public Education 15 Sac Zoo 7,000 Public Education 16 Sign Effects 2,578 Public Education 17 UC Regents 3,589 Public Education 18 Water Edu Found 2,500 Public Education 19 Univision 19 13,010 Public Education 20 Urban Creeks 750 Public Education 21 Vitali-gage Communic 1,522 Public Education 22 Z.C. Optimal Solutions 18,781 Public Education 23 Sac Business Jour 928 Public Education
Monitoring 24 Aerospeed 168 Monitoring25 Caltest 37,197 Monitoring26 County 247,274 Monitoring27 Kathy Russick 76,017 Monitoring28 Kinetic Labs 2,938 Monitoring29 LWA 43,748 Monitoring30 Sequoia Analytical 031 CSUS foundation 7,233 Monitoring32 Geosyntec 4,690 Monitoring
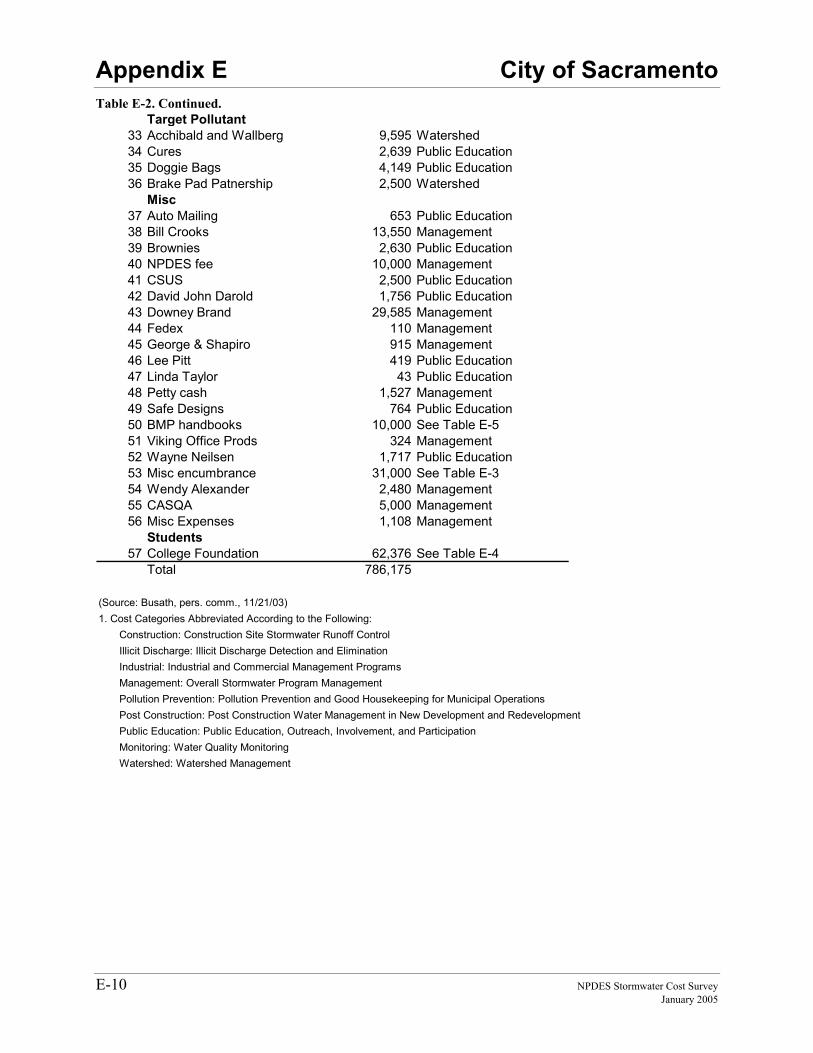
Appendix E City of Sacramento
E-10 NPDES Stormwater Cost Survey January 2005
Table E-2. Continued. Target Pollutant
33 Acchibald and Wallberg 9,595 Watershed 34 Cures 2,639 Public Education35 Doggie Bags 4,149 Public Education36 Brake Pad Patnership 2,500 Watershed
Misc37 Auto Mailing 653 Public Education38 Bill Crooks 13,550 Management39 Brownies 2,630 Public Education40 NPDES fee 10,000 Management41 CSUS 2,500 Public Education42 David John Darold 1,756 Public Education43 Downey Brand 29,585 Management44 Fedex 110 Management45 George & Shapiro 915 Management46 Lee Pitt 419 Public Education47 Linda Taylor 43 Public Education48 Petty cash 1,527 Management49 Safe Designs 764 Public Education50 BMP handbooks 10,000 See Table E-551 Viking Office Prods 324 Management52 Wayne Neilsen 1,717 Public Education53 Misc encumbrance 31,000 See Table E-354 Wendy Alexander 2,480 Management55 CASQA 5,000 Management56 Misc Expenses 1,108 Management
Students57 College Foundation 62,376 See Table E-4
Total 786,175
(Source: Busath, pers. comm., 11/21/03)1. Cost Categories Abbreviated According to the Following: Construction: Construction Site Stormwater Runoff Control Illicit Discharge: Illicit Discharge Detection and Elimination Industrial: Industrial and Commercial Management Programs Management: Overall Stormwater Program Management Pollution Prevention: Pollution Prevention and Good Housekeeping for Municipal Operations Post Construction: Post Construction Water Management in New Development and Redevelopment Public Education: Public Education, Outreach, Involvement, and Participation Monitoring: Water Quality Monitoring Watershed: Watershed Management
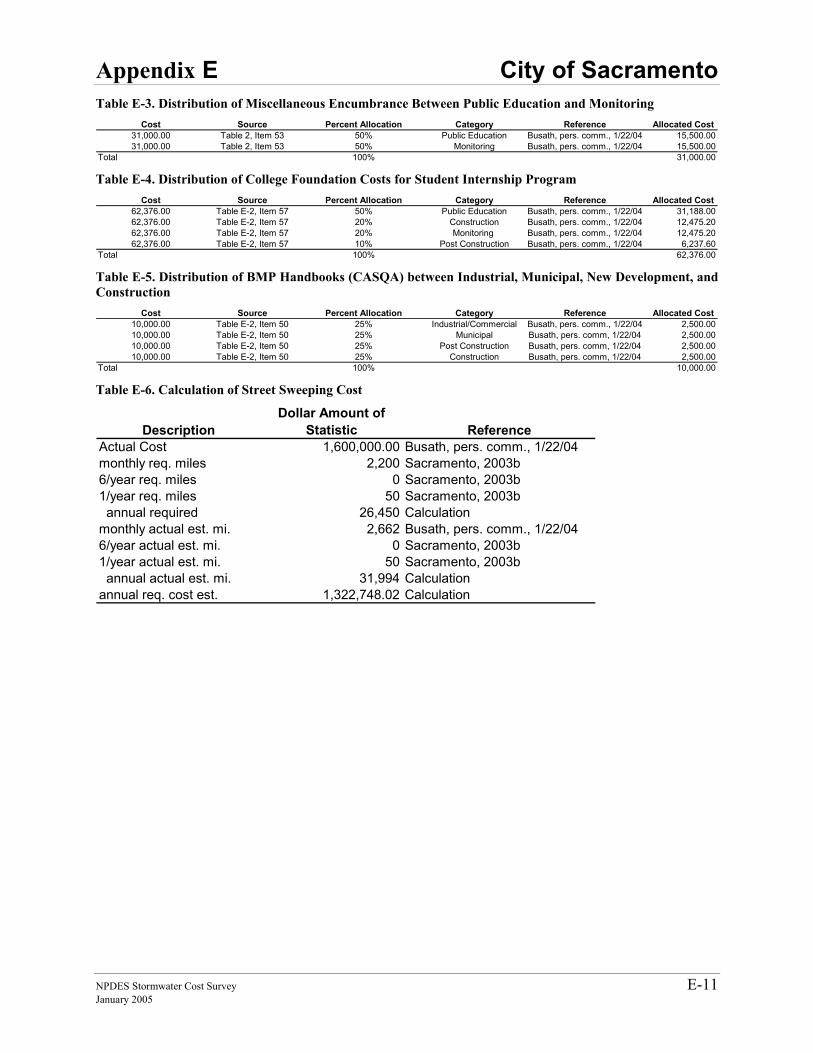
Appendix E City of Sacramento
NPDES Stormwater Cost Survey E-11 January 2005
Table E-3. Distribution of Miscellaneous Encumbrance Between Public Education and Monitoring Cost Source Percent Allocation Category Reference Allocated Cost
31,000.00 Table 2, Item 53 50% Public Education Busath, pers. comm., 1/22/04 15,500.0031,000.00 Table 2, Item 53 50% Monitoring Busath, pers. comm., 1/22/04 15,500.00
Total 100% 31,000.00 Table E-4. Distribution of College Foundation Costs for Student Internship Program
Cost Source Percent Allocation Category Reference Allocated Cost62,376.00 Table E-2, Item 57 50% Public Education Busath, pers. comm., 1/22/04 31,188.0062,376.00 Table E-2, Item 57 20% Construction Busath, pers. comm., 1/22/04 12,475.2062,376.00 Table E-2, Item 57 20% Monitoring Busath, pers. comm., 1/22/04 12,475.2062,376.00 Table E-2, Item 57 10% Post Construction Busath, pers. comm., 1/22/04 6,237.60
Total 100% 62,376.00 Table E-5. Distribution of BMP Handbooks (CASQA) between Industrial, Municipal, New Development, and Construction
Cost Source Percent Allocation Category Reference Allocated Cost10,000.00 Table E-2, Item 50 25% Industrial/Commercial Busath, pers. comm., 1/22/04 2,500.0010,000.00 Table E-2, Item 50 25% Municipal Busath, pers. comm, 1/22/04 2,500.0010,000.00 Table E-2, Item 50 25% Post Construction Busath, pers. comm, 1/22/04 2,500.0010,000.00 Table E-2, Item 50 25% Construction Busath, pers. comm, 1/22/04 2,500.00
Total 100% 10,000.00 Table E-6. Calculation of Street Sweeping Cost
DescriptionDollar Amount of
Statistic ReferenceActual Cost 1,600,000.00 Busath, pers. comm., 1/22/04monthly req. miles 2,200 Sacramento, 2003b6/year req. miles 0 Sacramento, 2003b1/year req. miles 50 Sacramento, 2003b annual required 26,450 Calculationmonthly actual est. mi. 2,662 Busath, pers. comm., 1/22/046/year actual est. mi. 0 Sacramento, 2003b1/year actual est. mi. 50 Sacramento, 2003b annual actual est. mi. 31,994 Calculationannual req. cost est. 1,322,748.02 Calculation
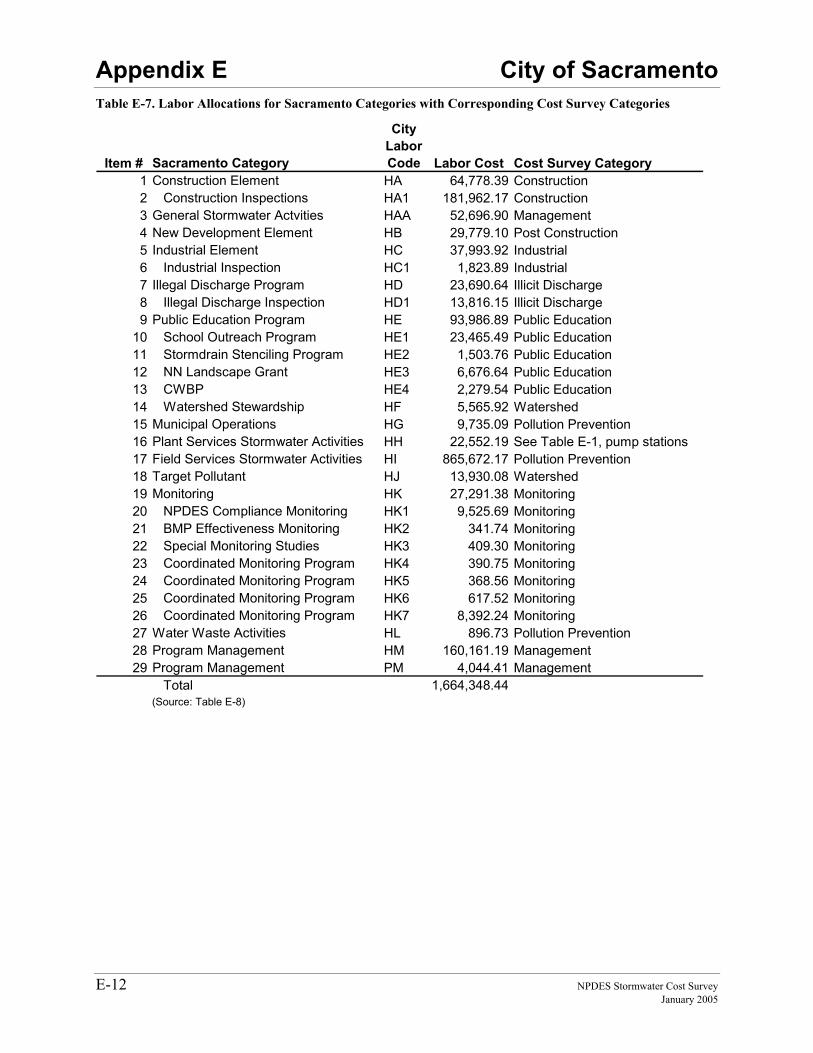
Appendix E City of Sacramento
E-12 NPDES Stormwater Cost Survey January 2005
Table E-7. Labor Allocations for Sacramento Categories with Corresponding Cost Survey Categories
Item # Sacramento Category
City Labor Code Labor Cost Cost Survey Category
1 Construction Element HA 64,778.39 Construction 2 Construction Inspections HA1 181,962.17 Construction 3 General Stormwater Actvities HAA 52,696.90 Management4 New Development Element HB 29,779.10 Post Construction5 Industrial Element HC 37,993.92 Industrial 6 Industrial Inspection HC1 1,823.89 Industrial 7 Illegal Discharge Program HD 23,690.64 Illicit Discharge 8 Illegal Discharge Inspection HD1 13,816.15 Illicit Discharge 9 Public Education Program HE 93,986.89 Public Education
10 School Outreach Program HE1 23,465.49 Public Education11 Stormdrain Stenciling Program HE2 1,503.76 Public Education12 NN Landscape Grant HE3 6,676.64 Public Education13 CWBP HE4 2,279.54 Public Education14 Watershed Stewardship HF 5,565.92 Watershed 15 Municipal Operations HG 9,735.09 Pollution Prevention 16 Plant Services Stormwater Activities HH 22,552.19 See Table E-1, pump stations17 Field Services Stormwater Activities HI 865,672.17 Pollution Prevention18 Target Pollutant HJ 13,930.08 Watershed 19 Monitoring HK 27,291.38 Monitoring20 NPDES Compliance Monitoring HK1 9,525.69 Monitoring21 BMP Effectiveness Monitoring HK2 341.74 Monitoring22 Special Monitoring Studies HK3 409.30 Monitoring23 Coordinated Monitoring Program HK4 390.75 Monitoring24 Coordinated Monitoring Program HK5 368.56 Monitoring25 Coordinated Monitoring Program HK6 617.52 Monitoring26 Coordinated Monitoring Program HK7 8,392.24 Monitoring27 Water Waste Activities HL 896.73 Pollution Prevention 28 Program Management HM 160,161.19 Management29 Program Management PM 4,044.41 Management
Total 1,664,348.44(Source: Table E-8)
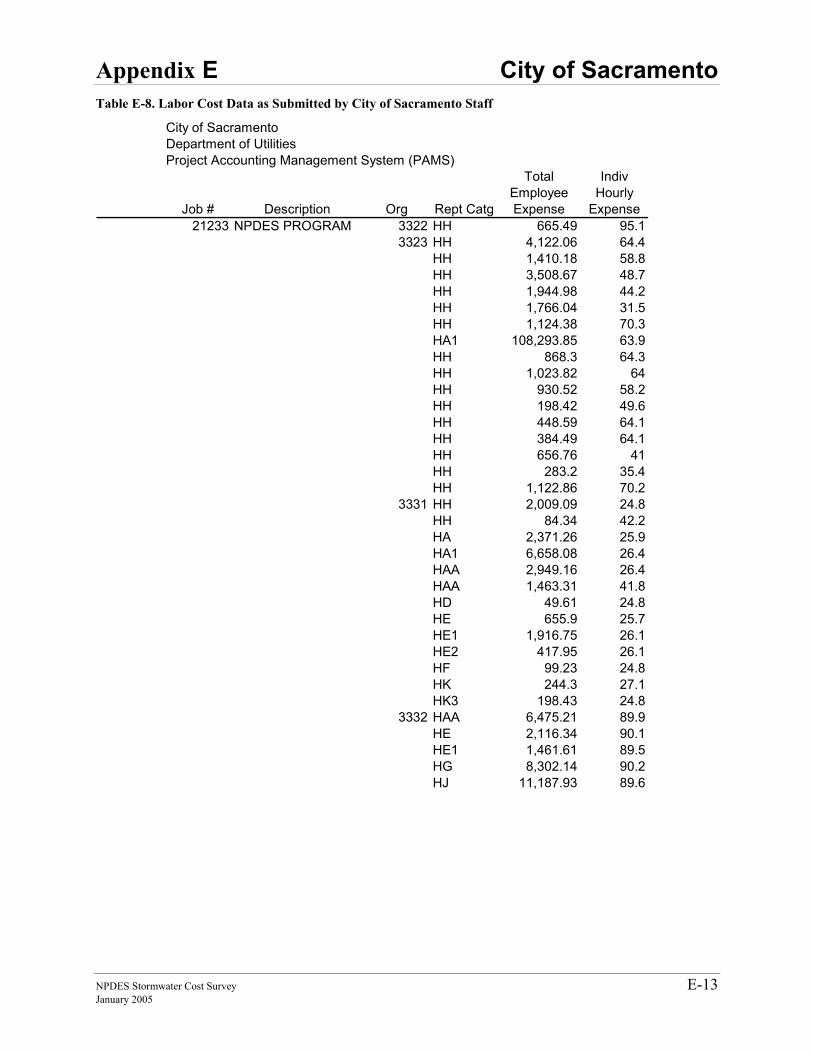
Appendix E City of Sacramento
NPDES Stormwater Cost Survey E-13 January 2005
Table E-8. Labor Cost Data as Submitted by City of Sacramento Staff
City of SacramentoDepartment of UtilitiesProject Accounting Management System (PAMS)
Job # Description Org Rept Catg
Total Employee Expense
Indiv Hourly
Expense21233 NPDES PROGRAM 3322 HH 665.49 95.1
3323 HH 4,122.06 64.4 HH 1,410.18 58.8 HH 3,508.67 48.7 HH 1,944.98 44.2 HH 1,766.04 31.5 HH 1,124.38 70.3 HA1 108,293.85 63.9 HH 868.3 64.3 HH 1,023.82 64 HH 930.52 58.2 HH 198.42 49.6 HH 448.59 64.1 HH 384.49 64.1 HH 656.76 41 HH 283.2 35.4 HH 1,122.86 70.2 3331 HH 2,009.09 24.8 HH 84.34 42.2 HA 2,371.26 25.9 HA1 6,658.08 26.4 HAA 2,949.16 26.4 HAA 1,463.31 41.8 HD 49.61 24.8 HE 655.9 25.7 HE1 1,916.75 26.1 HE2 417.95 26.1 HF 99.23 24.8 HK 244.3 27.1 HK3 198.43 24.8 3332 HAA 6,475.21 89.9 HE 2,116.34 90.1 HE1 1,461.61 89.5 HG 8,302.14 90.2 HJ 11,187.93 89.6
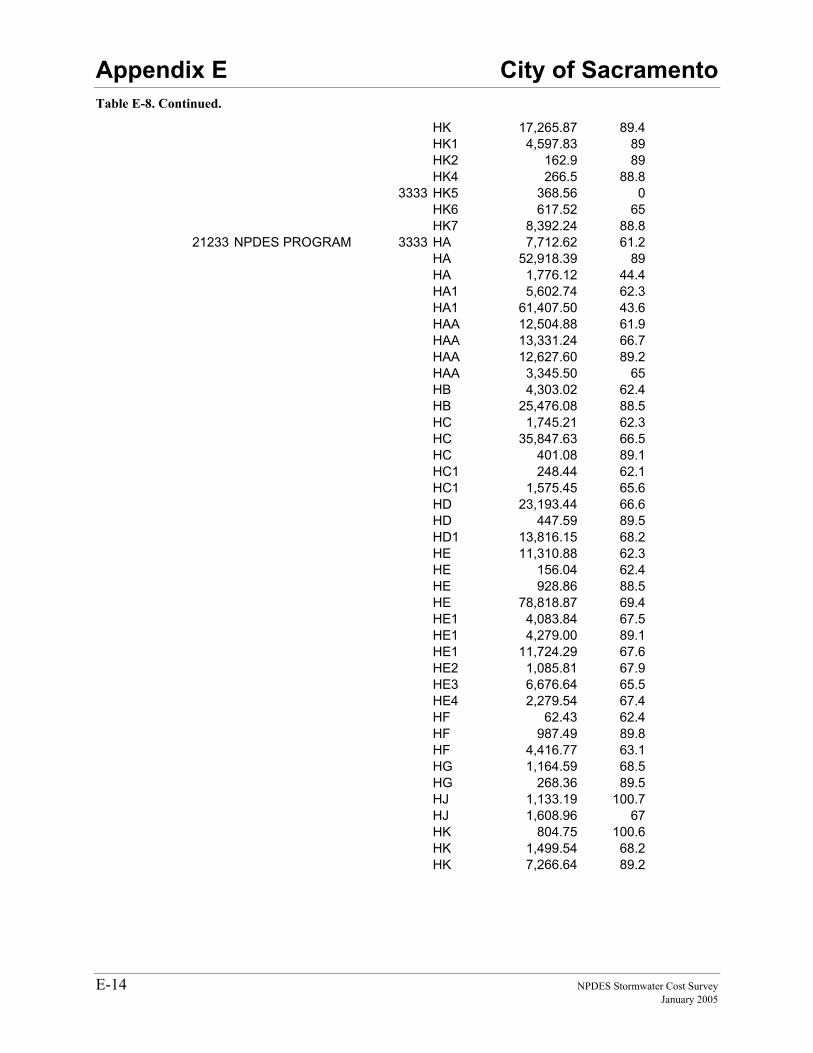
Appendix E City of Sacramento
E-14 NPDES Stormwater Cost Survey January 2005
Table E-8. Continued.
HK 17,265.87 89.4 HK1 4,597.83 89 HK2 162.9 89 HK4 266.5 88.8 3333 HK5 368.56 0 HK6 617.52 65 HK7 8,392.24 88.8
21233 NPDES PROGRAM 3333 HA 7,712.62 61.2 HA 52,918.39 89 HA 1,776.12 44.4 HA1 5,602.74 62.3 HA1 61,407.50 43.6 HAA 12,504.88 61.9 HAA 13,331.24 66.7 HAA 12,627.60 89.2 HAA 3,345.50 65 HB 4,303.02 62.4 HB 25,476.08 88.5 HC 1,745.21 62.3 HC 35,847.63 66.5 HC 401.08 89.1 HC1 248.44 62.1 HC1 1,575.45 65.6 HD 23,193.44 66.6 HD 447.59 89.5 HD1 13,816.15 68.2 HE 11,310.88 62.3 HE 156.04 62.4 HE 928.86 88.5 HE 78,818.87 69.4 HE1 4,083.84 67.5 HE1 4,279.00 89.1 HE1 11,724.29 67.6 HE2 1,085.81 67.9 HE3 6,676.64 65.5 HE4 2,279.54 67.4 HF 62.43 62.4 HF 987.49 89.8 HF 4,416.77 63.1 HG 1,164.59 68.5 HG 268.36 89.5 HJ 1,133.19 100.7 HJ 1,608.96 67 HK 804.75 100.6 HK 1,499.54 68.2 HK 7,266.64 89.2
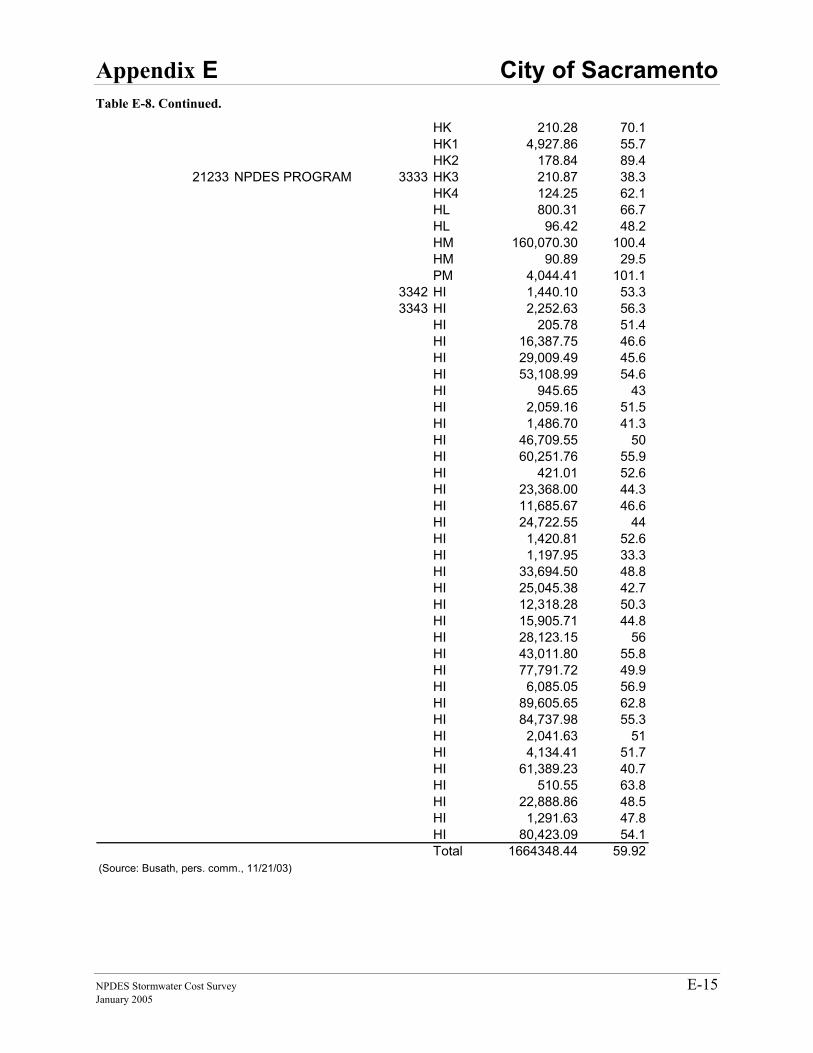
Appendix E City of Sacramento
NPDES Stormwater Cost Survey E-15 January 2005
Table E-8. Continued.
HK 210.28 70.1 HK1 4,927.86 55.7 HK2 178.84 89.4
21233 NPDES PROGRAM 3333 HK3 210.87 38.3 HK4 124.25 62.1 HL 800.31 66.7 HL 96.42 48.2 HM 160,070.30 100.4 HM 90.89 29.5 PM 4,044.41 101.1 3342 HI 1,440.10 53.3 3343 HI 2,252.63 56.3 HI 205.78 51.4 HI 16,387.75 46.6 HI 29,009.49 45.6 HI 53,108.99 54.6 HI 945.65 43 HI 2,059.16 51.5 HI 1,486.70 41.3 HI 46,709.55 50 HI 60,251.76 55.9 HI 421.01 52.6 HI 23,368.00 44.3 HI 11,685.67 46.6 HI 24,722.55 44 HI 1,420.81 52.6 HI 1,197.95 33.3 HI 33,694.50 48.8 HI 25,045.38 42.7 HI 12,318.28 50.3 HI 15,905.71 44.8 HI 28,123.15 56 HI 43,011.80 55.8 HI 77,791.72 49.9 HI 6,085.05 56.9 HI 89,605.65 62.8 HI 84,737.98 55.3 HI 2,041.63 51 HI 4,134.41 51.7 HI 61,389.23 40.7 HI 510.55 63.8 HI 22,888.86 48.5 HI 1,291.63 47.8 HI 80,423.09 54.1
Total 1664348.44 59.92(Source: Busath, pers. comm., 11/21/03)

Appendix F City of Santa Clarita
NPDES Stormwater Cost Survey F-1 January 2005
APPENDIX F The backup calculations for the cost for each cost survey category in Section 8 and the sources of the cost data are presented in this appendix. Tables are generally presented by sequentially increasing levels of detail. Figure F-1 illustrates how data is shared throughout the tables.
Table F-1 contains all costs organized into the various standard cost survey categories. The subtotals for each cost category are also presented in Section 8, Table 8-2. The remaining tables (F-2 through F-7) present the detailed back-up information for the numbers in Table F-1. Table F-1 is linked to the back-up tables by the table and item numbers in the ‘Source’ column. Most of the cost information provided by city staff is listed in Table F-2. Item numbers corresponding to the subtotals in Table F-2 were added to the left hand column to easily show how the numbers are pulled forward to Table F-1. The right hand column in Table F-2 was added to show how costs were allocated to the cost survey categories. Table F-1 entries that were not taken directly from Table F-2 are found in Tables F-3 through F-7.
For the city of Santa Clarita, labor costs of the stormwater staff are not distributed among the various survey categories. Instead, it is all captured under Overall Stormwater Program Management. Thus, comparing costs with other municipalities where such costs are distributed, Santa Clarita’s Overall Stormwater Management Program costs will be higher.
Detailed descriptions of how the costs were developed are contained in the following paragraphs.
Construction Site Stormwater Runoff Control The total cost of this category was $74,995. The only cost attributed to this category was for inspections. The city conducted 11,746 inspections, but this number reflects multiple inspections for various construction activities at the same site (Santa Clarita, 2003b). Since this number does not solely represent stormwater inspections, this should be considered when comparing these inspection statistics with that of the other cities. Therefore, cost was normalized per active construction site (64) (Santa Clarita, 2003b). Other activities in this category included:
• Development of pollution prevention handouts directly related to specific construction functions
• The city’s Environmental, Building and Safety, and Public Works inspectors completed site visits on a daily basis
• Cited contractors in the event of illicit connection detection
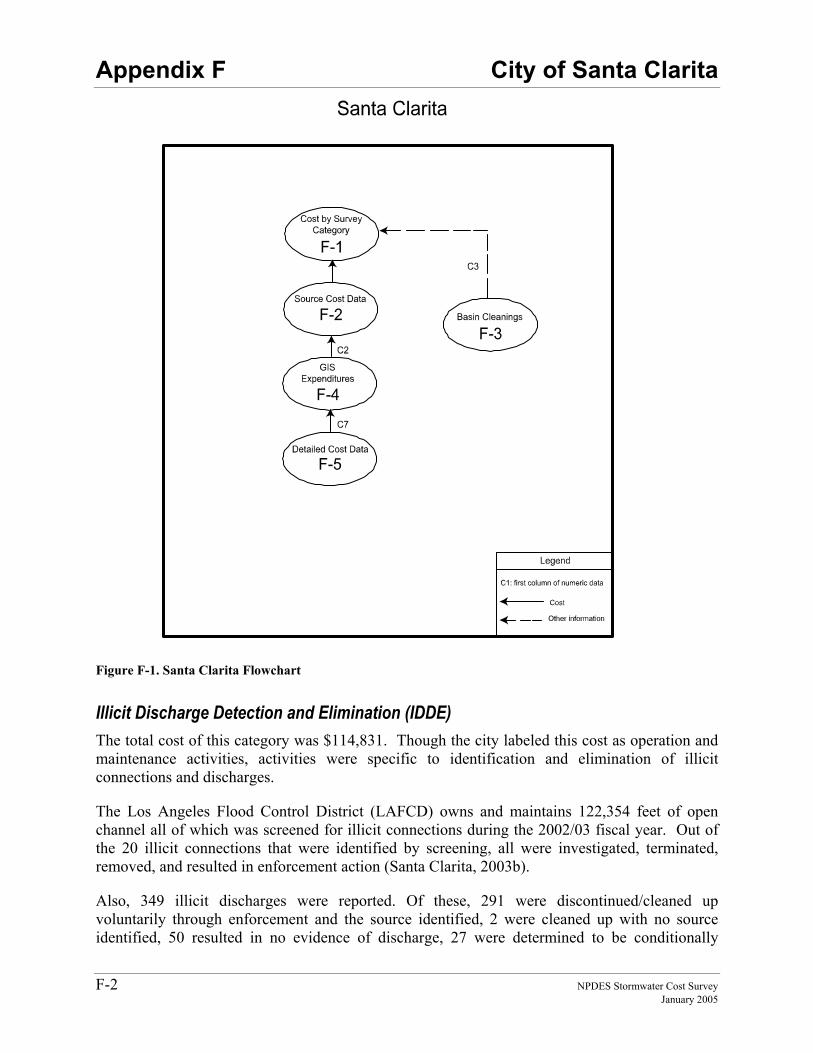
Appendix F City of Santa Clarita
F-2 NPDES Stormwater Cost Survey January 2005
Figure F-1. Santa Clarita Flowchart
Illicit Discharge Detection and Elimination (IDDE) The total cost of this category was $114,831. Though the city labeled this cost as operation and maintenance activities, activities were specific to identification and elimination of illicit connections and discharges.
The Los Angeles Flood Control District (LAFCD) owns and maintains 122,354 feet of open channel all of which was screened for illicit connections during the 2002/03 fiscal year. Out of the 20 illicit connections that were identified by screening, all were investigated, terminated, removed, and resulted in enforcement action (Santa Clarita, 2003b).
Also, 349 illicit discharges were reported. Of these, 291 were discontinued/cleaned up voluntarily through enforcement and the source identified, 2 were cleaned up with no source identified, 50 resulted in no evidence of discharge, 27 were determined to be conditionally
Appendix F City of Santa Clarita
NPDES Stormwater Cost Survey F-3 January 2005
exempt, and 305 resulted in enforcement action. (Santa Clarita, 2003b). Normalized cost is $311 per investigation of both illicit connections and illicit discharges (20+349). This includes all associated follow up activities performed by the city as described above.
Industrial and Commercial Management Programs The total cost of this category was $12,600. The only cost for this category was for inspection of industrial and commercial facilities. The city inspection staff performed 110 inspections during 2002/03. The city of Santa Clarita contracts with Los Angeles County of perform these inspections but are done by city staff (Cramer, pers. comm., 4/22/04). Enforcement actions were issued which included 17 verbal warnings and 4 notices to comply. (Santa Clarita, 2003b).
Overall Stormwater Program Management The total cost for this category was $515,352. These costs are for administrative activities and development planning. Stormwater staff time (including overhead allocation) used to oversee or implement the activities in the other cost categories accounted for $438,832. Overhead allocation (other supporting city functions, building, etc.) was $253,073. This number is described in the footnote to Table F-2. Development planning cost was $76,520. These costs were for activities the city does to insure developers are following SUSMP1 standards. Maintenance of the stormwater section of city’s website was also performed.
Pollution Prevention and Good Housekeeping for Municipal Operations The total cost for this category was $859,754. Activities performed in this category were for catch basin cleaning, trash pick-up, and street sweeping. The cost attributed to catch basin cleaning was $251,908. During 2002/03, 1,482 catch basins were cleaned (Table F-3). The cost attributed to street sweeping was $557,443. The city sweeps all streets once a week (Santa Clarita, 2003b). A total of 900 curb miles were swept per week in 2002/03 (Cramer, pers. comm., 4/22/04). Trash pick-up costs were $50,403 for the household hazardous waste program.
Post Construction Stormwater Management in New Development and Redevelopment The adjusted cost of this category was $106,925. The total cost for this category submitted by the city of Santa Clarita was $256,950. Of the cost, $97,813 was for vehicles for catch basin cleaning (Cramer, pers. comm., 4/22/04). These capital costs were recurring for other projects at an unknown interval and were assumed to be annual for the purposes of this survey. The remaining $9,112 was for maintenance and conveyance of one detention basin (Cramer, pers. comm., 4/22/04).
1 SUSMP: Standard Urban Storm Water Mitigation Plans (SUSMPs) are often referenced by permits. They set treatment requirements for new construction and redevelopment. (www.swrcb.ca.gov)
Appendix F City of Santa Clarita
F-4 NPDES Stormwater Cost Survey January 2005
Public Education and Outreach and Public Involvement and Participation The total cost for these categories was $49,130. These categories were combined for the city of Santa Clarita. This cost includes employee training to administer these categories. Activities in this category included:
• Storm drain stenciling: Out of the city owned 440 drain inlets, 45 were marked with a no dumping message
• Maintained stormwater hotline: The city received approximately 30 calls per day relating to trash, household hazardous waste, and stormwater (Cramer, pers. comm., 4/22/04)
• Print, television, radio, and other media: Approximately 5 million impressions were made (for the entire permitted area). A breakdown for Santa Clarita was not available
• School outreach: An environmental mascot visited schools and public events to educate attendees on stormwater issues. Children’s activity books were distributed at appearances. Flyers were distributed to promote the River Rally event
• Cooperated with the principal permittee to develop specific outreach programs to target pollutants in their area
• Distributed pollutant-specific materials
• Developed and distributed brochures and door hangers to specific residents
• Attended 4 workshop/community events to discuss stormwater pollution
Programs supported by the principal permittee were funded in part by a contribution from the city of Santa Clarita in the amount of $45,822. The remaining activities were performed by stormwater staff and that cost breakdown was not available.
Water Quality Monitoring The total cost of this category was $3,300 (Table F-2). This included monitoring for diazinon multiple times at one site (Cramer, pers. comm., 4/22/04).
Watershed Management The total cost of this category was $332,949. This cost was allocated to this category based on estimates from city staff. The staff estimated that 50 percent of GIS cost was attributable to stormwater activities (Table F-4).
References City of Santa Clarita. 2003. “Los Angeles County Municipal Storm Water Permit (Order 01-
182) Individual Annual Reporting Form, Attachment U-4”
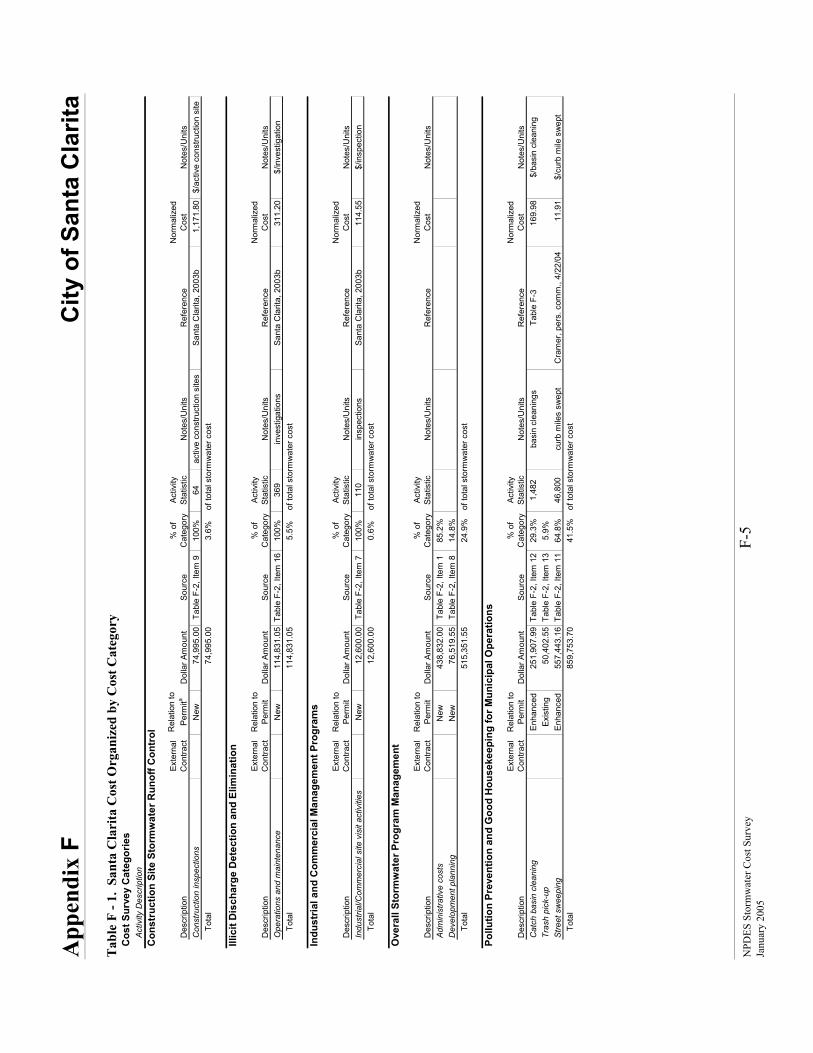
App
endi
x F
City
of S
anta
Cla
rita
NPD
ES S
torm
wat
er C
ost S
urve
y F-
5
Janu
ary
2005
T
able
F -
1. S
anta
Cla
rita
Cos
t Org
aniz
ed b
y C
ost C
ateg
ory
Cos
t Sur
vey
Cat
egor
ies
Activ
ity D
escr
iptio
nC
onst
ruct
ion
Site
Sto
rmw
ater
Run
off C
ontr
ol
Des
crip
tion
Exte
rnal
C
ontra
ctR
elat
ion
to
Perm
itaD
olla
r Am
ount
Sour
ce%
of
Cat
egor
yAc
tivity
St
atis
ticN
otes
/Uni
tsR
efer
ence
Nor
mal
ized
C
ost
Not
es/U
nits
Con
stru
ctio
n in
spec
tions
New
74,9
95.0
0Ta
ble
F-2,
Item
910
0%64
activ
e co
nstru
ctio
n si
tes
San
ta C
larit
a, 2
003b
1,17
1.80
$/ac
tive
cons
truct
ion
site
To
tal
74,9
95.0
03.
6%of
tota
l sto
rmw
ater
cos
t
Illic
it D
isch
arge
Det
ectio
n an
d El
imin
atio
n
Des
crip
tion
Exte
rnal
C
ontra
ctR
elat
ion
to
Perm
itD
olla
r Am
ount
Sour
ce%
of
Cat
egor
yAc
tivity
St
atis
ticN
otes
/Uni
tsR
efer
ence
Nor
mal
ized
C
ost
Not
es/U
nits
Ope
ratio
ns a
nd m
aint
enan
ceN
ew11
4,83
1.05
Tabl
e F-
2, It
em 1
610
0%36
9in
vest
igat
ions
Sant
a C
larit
a, 2
003b
311.
20$/
inve
stig
atio
n
Tota
l11
4,83
1.05
5.5%
of to
tal s
torm
wat
er c
ost
Indu
stria
l and
Com
mer
cial
Man
agem
ent P
rogr
ams
Des
crip
tion
Exte
rnal
C
ontra
ctR
elat
ion
to
Perm
itD
olla
r Am
ount
Sour
ce%
of
Cat
egor
yAc
tivity
St
atis
ticN
otes
/Uni
tsR
efer
ence
Nor
mal
ized
C
ost
Not
es/U
nits
Indu
stria
l/Com
mer
cial
site
vis
it ac
tiviti
esN
ew12
,600
.00
Tabl
e F-
2, It
em 7
100%
110
insp
ectio
nsS
anta
Cla
rita,
200
3b11
4.55
$/in
spec
tion
To
tal
12,6
00.0
00.
6%of
tota
l sto
rmw
ater
cos
t
Ove
rall
Stor
mw
ater
Pro
gram
Man
agem
ent
Des
crip
tion
Exte
rnal
C
ontra
ctR
elat
ion
to
Perm
itD
olla
r Am
ount
Sour
ce%
of
Cat
egor
yAc
tivity
St
atis
ticN
otes
/Uni
tsR
efer
ence
Nor
mal
ized
C
ost
Not
es/U
nits
Adm
inis
trativ
e co
sts
New
43
8,83
2.00
Tabl
e F-
2, It
em 1
85.2
%D
evel
opm
ent p
lann
ing
New
76
,519
.55
Tabl
e F-
2, It
em 8
14.8
%
Tota
l51
5,35
1.55
24.9
%of
tota
l sto
rmw
ater
cos
t
Pollu
tion
Prev
entio
n an
d G
ood
Hou
seke
epin
g fo
r Mun
icip
al O
pera
tions
Des
crip
tion
Exte
rnal
C
ontra
ctR
elat
ion
to
Perm
itD
olla
r Am
ount
Sour
ce%
of
Cat
egor
yAc
tivity
St
atis
ticN
otes
/Uni
tsR
efer
ence
Nor
mal
ized
C
ost
Not
es/U
nits
Cat
ch b
asin
cle
anin
gEn
hanc
ed25
1,90
7.99
Tabl
e F-
2, It
em 1
229
.3%
1,48
2ba
sin
clea
ning
sTa
ble
F-3
169.
98$/
basi
n cl
eani
ngTr
ash
pick
-up
Exis
ting
50,4
02.5
5Ta
ble
F-2,
Item
13
5.9%
Stre
et s
wee
ping
Enha
nced
557,
443.
16Ta
ble
F-2,
Item
11
64.8
%46
,800
curb
mile
s sw
ept
Cra
mer
, per
s. c
omm
., 4/
22/0
411
.91
$/cu
rb m
ile s
wep
t
Tota
l85
9,75
3.70
41.5
%of
tota
l sto
rmw
ater
cos
t
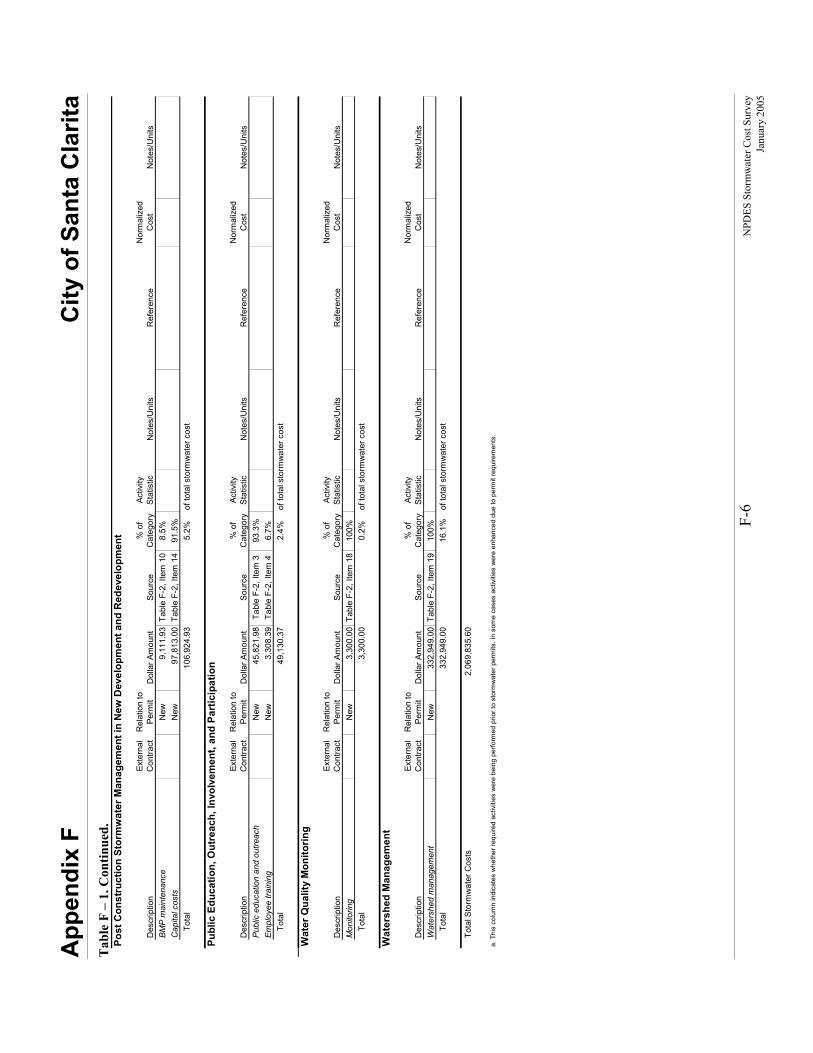
App
endi
x F
City
of S
anta
Cla
rita
F-
6 N
PDES
Sto
rmw
ater
Cos
t Sur
vey
Janu
ary
2005
T
able
F –
1. C
ontin
ued.
Po
st C
onst
ruct
ion
Stor
mw
ater
Man
agem
ent i
n N
ew D
evel
opm
ent a
nd R
edev
elop
men
t
Des
crip
tion
Exte
rnal
C
ontra
ctR
elat
ion
to
Perm
itD
olla
r Am
ount
Sour
ce%
of
Cat
egor
yAc
tivity
St
atis
ticN
otes
/Uni
tsR
efer
ence
Nor
mal
ized
C
ost
Not
es/U
nits
BMP
mai
nten
ance
New
9,11
1.93
Tabl
e F-
2, It
em 1
08.
5%C
apita
l cos
tsN
ew97
,813
.00
Tabl
e F-
2, It
em 1
491
.5%
To
tal
106,
924.
935.
2%of
tota
l sto
rmw
ater
cos
t
Publ
ic E
duca
tion,
Out
reac
h, In
volv
emen
t, an
d Pa
rtic
ipat
ion
Des
crip
tion
Exte
rnal
C
ontra
ctR
elat
ion
to
Perm
itD
olla
r Am
ount
Sour
ce%
of
Cat
egor
yAc
tivity
St
atis
ticN
otes
/Uni
tsR
efer
ence
Nor
mal
ized
C
ost
Not
es/U
nits
Publ
ic e
duca
tion
and
outre
ach
New
45,8
21.9
8Ta
ble
F-2,
Item
393
.3%
Empl
oyee
trai
ning
New
3,30
8.39
Tabl
e F-
2, It
em 4
6.7%
To
tal
49,1
30.3
72.
4%of
tota
l sto
rmw
ater
cos
t
Wat
er Q
ualit
y M
onito
ring
Des
crip
tion
Exte
rnal
C
ontra
ctR
elat
ion
to
Perm
itD
olla
r Am
ount
Sour
ce%
of
Cat
egor
yAc
tivity
St
atis
ticN
otes
/Uni
tsR
efer
ence
Nor
mal
ized
C
ost
Not
es/U
nits
Mon
itorin
gN
ew3,
300.
00Ta
ble
F-2,
Item
18
100%
To
tal
3,30
0.00
0.2%
of to
tal s
torm
wat
er c
ost
Wat
ersh
ed M
anag
emen
t
Des
crip
tion
Exte
rnal
C
ontra
ctR
elat
ion
to
Perm
itD
olla
r Am
ount
Sour
ce%
of
Cat
egor
yAc
tivity
St
atis
ticN
otes
/Uni
tsR
efer
ence
Nor
mal
ized
C
ost
Not
es/U
nits
Wat
ersh
ed m
anag
emen
tN
ew33
2,94
9.00
Tabl
e F-
2, It
em 1
910
0%
Tota
l33
2,94
9.00
16.1
%of
tota
l sto
rmw
ater
cos
t
Tota
l Sto
rmw
ater
Cos
ts2,
069,
835.
60
a. T
his
colu
mn
indi
cate
s w
heth
er re
quire
d ac
tiviti
es w
ere
bein
g pe
rform
ed p
rior t
o st
orm
wat
er p
erm
its. I
n so
me
case
s ac
tiviti
es w
ere
enha
nced
due
to p
erm
it re
quire
men
ts.
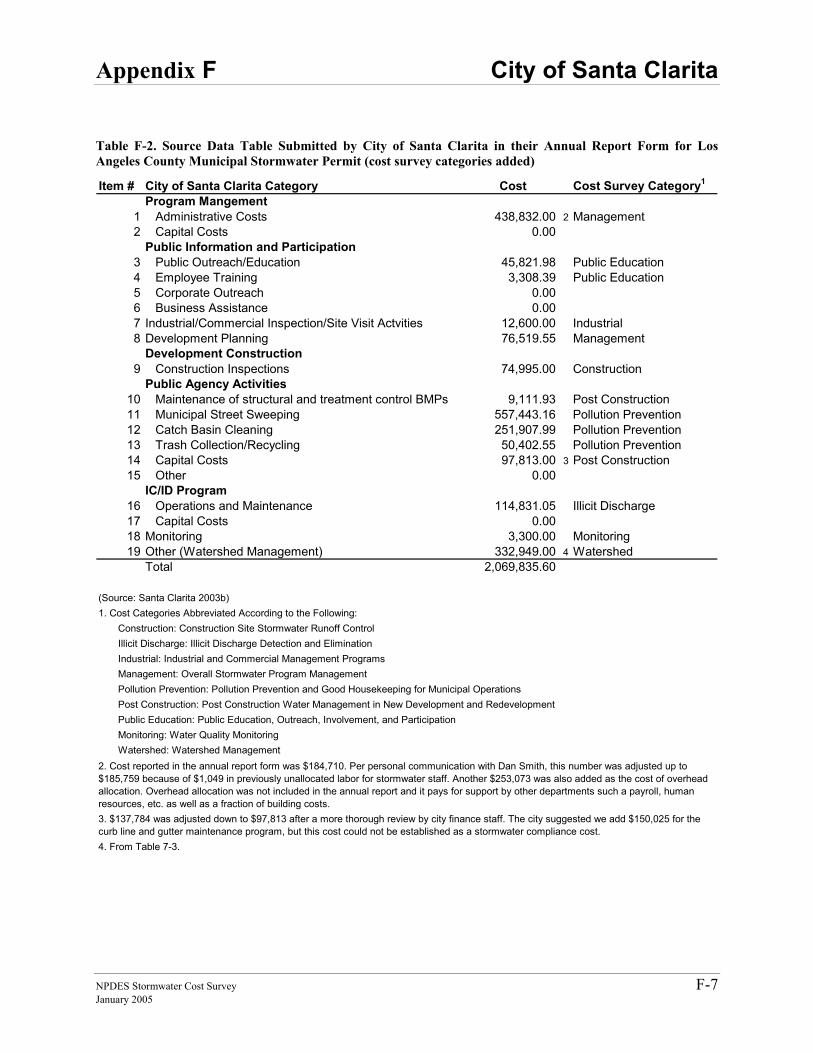
Appendix F City of Santa Clarita
NPDES Stormwater Cost Survey F-7 January 2005
Table F-2. Source Data Table Submitted by City of Santa Clarita in their Annual Report Form for Los Angeles County Municipal Stormwater Permit (cost survey categories added)
Item # City of Santa Clarita Category Cost Cost Survey Category1
Program Mangement1 Administrative Costs 438,832.00 2 Management2 Capital Costs 0.00
Public Information and Participation3 Public Outreach/Education 45,821.98 Public Education 4 Employee Training 3,308.39 Public Education 5 Corporate Outreach 0.006 Business Assistance 0.007 Industrial/Commercial Inspection/Site Visit Actvities 12,600.00 Industrial8 Development Planning 76,519.55 Management
Development Construction9 Construction Inspections 74,995.00 Construction
Public Agency Activities10 Maintenance of structural and treatment control BMPs 9,111.93 Post Construction 11 Municipal Street Sweeping 557,443.16 Pollution Prevention 12 Catch Basin Cleaning 251,907.99 Pollution Prevention13 Trash Collection/Recycling 50,402.55 Pollution Prevention14 Capital Costs 97,813.00 3 Post Construction 15 Other 0.00
IC/ID Program16 Operations and Maintenance 114,831.05 Illicit Discharge17 Capital Costs 0.0018 Monitoring 3,300.00 Monitoring19 Other (Watershed Management) 332,949.00 4 Watershed
Total 2,069,835.60
(Source: Santa Clarita 2003b)1. Cost Categories Abbreviated According to the Following: Construction: Construction Site Stormwater Runoff Control Illicit Discharge: Illicit Discharge Detection and Elimination Industrial: Industrial and Commercial Management Programs Management: Overall Stormwater Program Management Pollution Prevention: Pollution Prevention and Good Housekeeping for Municipal Operations Post Construction: Post Construction Water Management in New Development and Redevelopment Public Education: Public Education, Outreach, Involvement, and Participation Monitoring: Water Quality Monitoring Watershed: Watershed Management
4. From Table 7-3.
3. $137,784 was adjusted down to $97,813 after a more thorough review by city finance staff. The city suggested we add $150,025 for the curb line and gutter maintenance program, but this cost could not be established as a stormwater compliance cost.
2. Cost reported in the annual report form was $184,710. Per personal communication with Dan Smith, this number was adjusted up to $185,759 because of $1,049 in previously unallocated labor for stormwater staff. Another $253,073 was also added as the cost of overhead allocation. Overhead allocation was not included in the annual report and it pays for support by other departments such a payroll, human resources, etc. as well as a fraction of building costs.
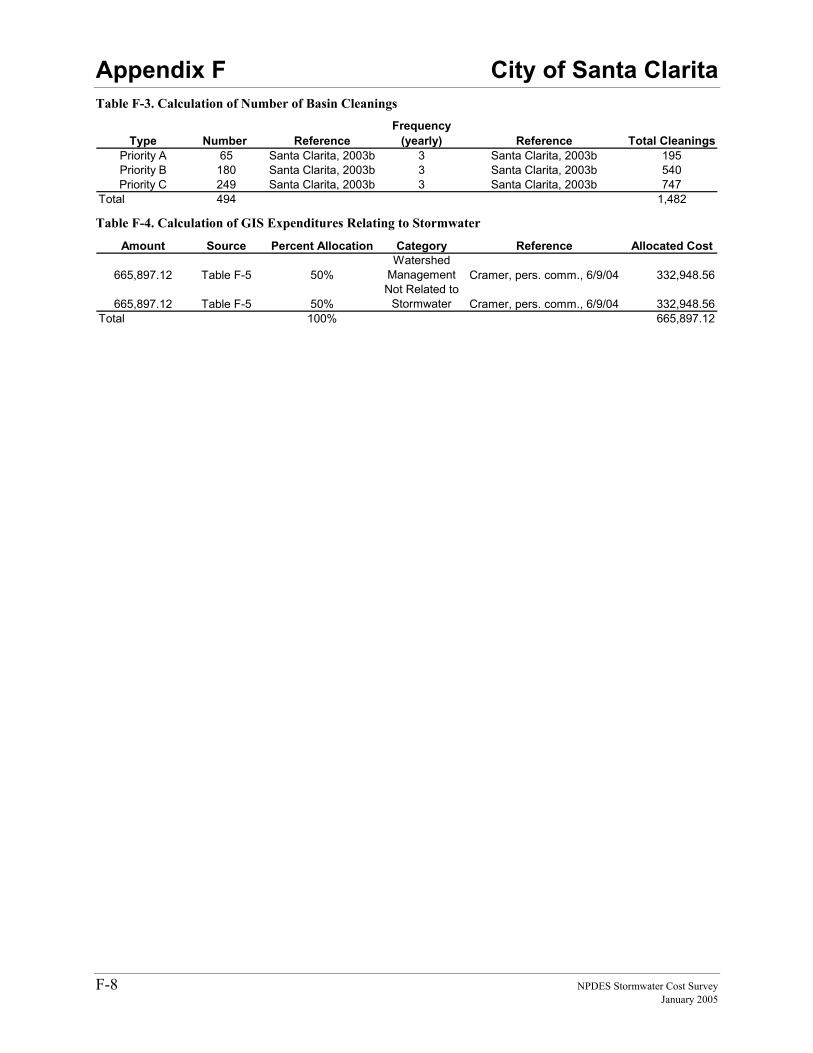
Appendix F City of Santa Clarita
F-8 NPDES Stormwater Cost Survey January 2005
Table F-3. Calculation of Number of Basin Cleanings
Type Number ReferenceFrequency
(yearly) Reference Total CleaningsPriority A 65 Santa Clarita, 2003b 3 Santa Clarita, 2003b 195Priority B 180 Santa Clarita, 2003b 3 Santa Clarita, 2003b 540Priority C 249 Santa Clarita, 2003b 3 Santa Clarita, 2003b 747
Total 494 1,482 Table F-4. Calculation of GIS Expenditures Relating to Stormwater
Amount Source Percent Allocation Category Reference Allocated Cost
665,897.12 Table F-5 50%Watershed
Management Cramer, pers. comm., 6/9/04 332,948.56
665,897.12 Table F-5 50%Not Related to
Stormwater Cramer, pers. comm., 6/9/04 332,948.56Total 100% 665,897.12
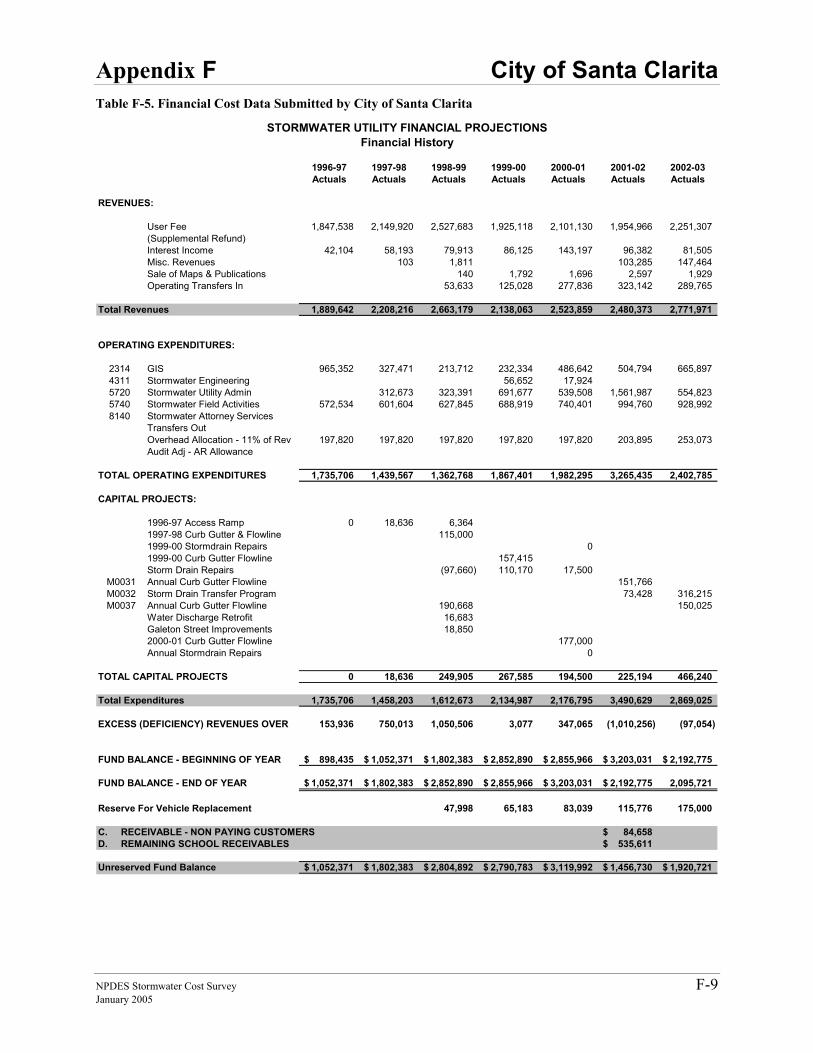
Appendix F City of Santa Clarita
NPDES Stormwater Cost Survey F-9 January 2005
Table F-5. Financial Cost Data Submitted by City of Santa Clarita
STORMWATER UTILITY FINANCIAL PROJECTIONSFinancial History
1996-97 1997-98 1998-99 1999-00 2000-01 2001-02 2002-03Actuals Actuals Actuals Actuals Actuals Actuals Actuals
REVENUES:
User Fee 1,847,538 2,149,920 2,527,683 1,925,118 2,101,130 1,954,966 2,251,307(Supplemental Refund)Interest Income 42,104 58,193 79,913 86,125 143,197 96,382 81,505Misc. Revenues 103 1,811 103,285 147,464Sale of Maps & Publications 140 1,792 1,696 2,597 1,929Operating Transfers In 53,633 125,028 277,836 323,142 289,765
Total Revenues 1,889,642 2,208,216 2,663,179 2,138,063 2,523,859 2,480,373 2,771,971
OPERATING EXPENDITURES:
2314 GIS 965,352 327,471 213,712 232,334 486,642 504,794 665,8974311 Stormwater Engineering 56,652 17,9245720 Stormwater Utility Admin 312,673 323,391 691,677 539,508 1,561,987 554,8235740 Stormwater Field Activities 572,534 601,604 627,845 688,919 740,401 994,760 928,9928140 Stormwater Attorney Services
Transfers OutOverhead Allocation - 11% of Rev 197,820 197,820 197,820 197,820 197,820 203,895 253,073Audit Adj - AR Allowance
TOTAL OPERATING EXPENDITURES 1,735,706 1,439,567 1,362,768 1,867,401 1,982,295 3,265,435 2,402,785
CAPITAL PROJECTS:
1996-97 Access Ramp 0 18,636 6,3641997-98 Curb Gutter & Flowline 115,0001999-00 Stormdrain Repairs 01999-00 Curb Gutter Flowline 157,415Storm Drain Repairs (97,660) 110,170 17,500
M0031 Annual Curb Gutter Flowline 151,766M0032 Storm Drain Transfer Program 73,428 316,215M0037 Annual Curb Gutter Flowline 190,668 150,025
Water Discharge Retrofit 16,683Galeton Street Improvements 18,8502000-01 Curb Gutter Flowline 177,000Annual Stormdrain Repairs 0
TOTAL CAPITAL PROJECTS 0 18,636 249,905 267,585 194,500 225,194 466,240
Total Expenditures 1,735,706 1,458,203 1,612,673 2,134,987 2,176,795 3,490,629 2,869,025
153,936 750,013 1,050,506 3,077 347,065 (1,010,256) (97,054)
FUND BALANCE - BEGINNING OF YEAR 898,435$ 1,052,371$ 1,802,383$ 2,852,890$ 2,855,966$ 3,203,031$ 2,192,775$
FUND BALANCE - END OF YEAR 1,052,371$ 1,802,383$ 2,852,890$ 2,855,966$ 3,203,031$ 2,192,775$ 2,095,721
Reserve For Vehicle Replacement 47,998 65,183 83,039 115,776 175,000
C. RECEIVABLE - NON PAYING CUSTOMERS 84,658$ D. REMAINING SCHOOL RECEIVABLES 535,611$
Unreserved Fund Balance 1,052,371$ 1,802,383$ 2,804,892$ 2,790,783$ 3,119,992$ 1,456,730$ 1,920,721$
EXCESS (DEFICIENCY) REVENUES OVER

Appendix G Calculations and Comparisons
NPDES Stormwater Cost Survey G-1 January 2005
APPENDIX G Section G-1 of this appendix contains backup calculations for certain results in Section 9 and additional cost analysis that did not prove useful, but is presented here to demonstrate their lack of utility (Section G-1). This is particularly true of regressions of normalized cost versus cost factors. Section G-2 of this appendix contains analysis of future cost to compare various cost scenarios using equivalent annual cost.
To compare costs from years greater than a year different from the year of this study (2003 dollars), the Consumer Price Index Urban (CPIU) was used (U.S. Bureau of Labor Statistics, 2005). CPIU was used because it is a common measure of inflation, it was similar to the Engineering News Review Construction Cost Index (CCI) from the Engineering News Record (ENR), yet CPIU reflects more broadly on how inflation than the CCI. As an example of similarity between the two indices, the CPIU adjustment factor from 1998 to 2003 agreed with the CCI to three significant figures. Because CPIU was similar to the ENR CCI and for consistency, CPIU was used to adjust both construction costs (e.g. treatment plant) and city stormwater costs that fund mostly non-construction activities such as inspection programs and maintenance of city infrastructure.
G.1 COST SURVEY ANALYSIS
This section contains costs normalized by both number of households and population. Since cost per households is the most common in the literature, several regressions against this parameter are also presented in this section.
Survey Category Costs per Household Table G-1 presents survey category costs normalized by households.
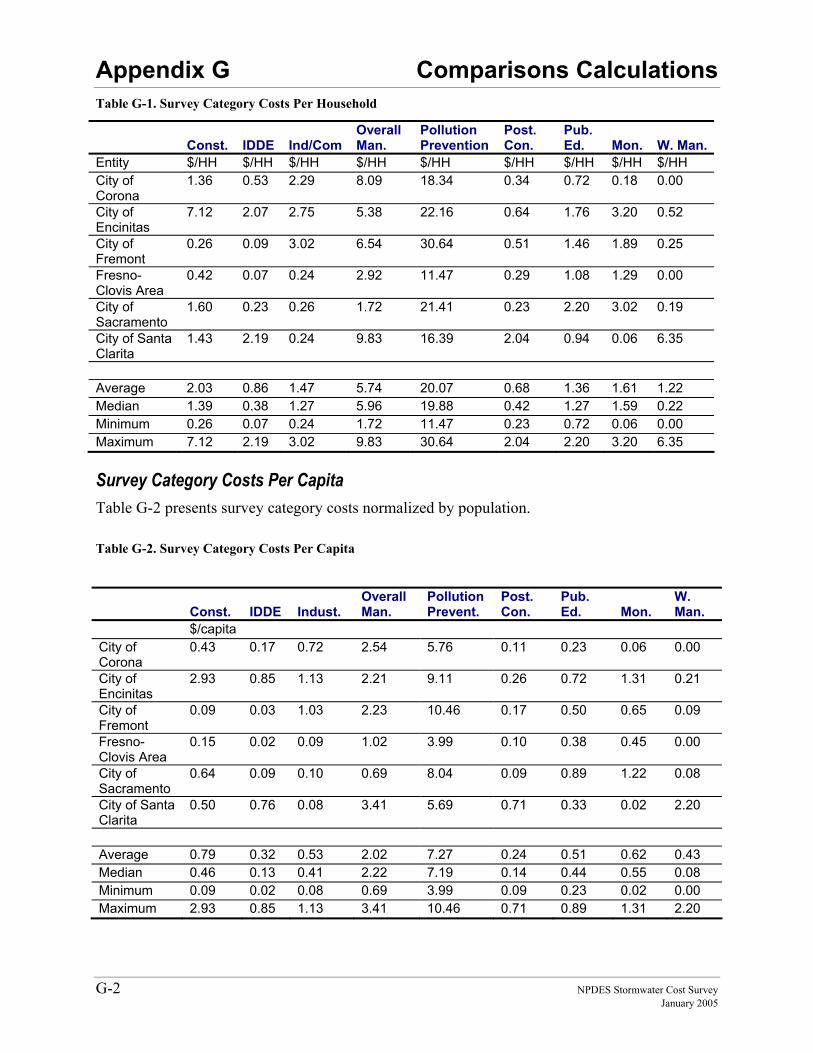
Appendix G Comparisons Calculations
G-2 NPDES Stormwater Cost Survey January 2005
Table G-1. Survey Category Costs Per Household
Survey Category Costs Per Capita Table G-2 presents survey category costs normalized by population.
Table G-2. Survey Category Costs Per Capita
Const. IDDE Ind/ComOverall Man.
Pollution Prevention
Post. Con.
Pub. Ed. Mon. W. Man.
Entity $/HH $/HH $/HH $/HH $/HH $/HH $/HH $/HH $/HH City of Corona
1.36 0.53 2.29 8.09 18.34 0.34 0.72 0.18 0.00
City of Encinitas
7.12 2.07 2.75 5.38 22.16 0.64 1.76 3.20 0.52
City of Fremont
0.26 0.09 3.02 6.54 30.64 0.51 1.46 1.89 0.25
Fresno-Clovis Area
0.42 0.07 0.24 2.92 11.47 0.29 1.08 1.29 0.00
City of Sacramento
1.60 0.23 0.26 1.72 21.41 0.23 2.20 3.02 0.19
City of Santa Clarita
1.43 2.19 0.24 9.83 16.39 2.04 0.94 0.06 6.35
Average 2.03 0.86 1.47 5.74 20.07 0.68 1.36 1.61 1.22 Median 1.39 0.38 1.27 5.96 19.88 0.42 1.27 1.59 0.22 Minimum 0.26 0.07 0.24 1.72 11.47 0.23 0.72 0.06 0.00 Maximum 7.12 2.19 3.02 9.83 30.64 2.04 2.20 3.20 6.35
Const. IDDE Indust. Overall Man.
Pollution Prevent.
Post. Con.
Pub. Ed. Mon.
W. Man.
$/capita City of Corona
0.43 0.17 0.72 2.54 5.76 0.11 0.23 0.06 0.00
City of Encinitas
2.93 0.85 1.13 2.21 9.11 0.26 0.72 1.31 0.21
City of Fremont
0.09 0.03 1.03 2.23 10.46 0.17 0.50 0.65 0.09
Fresno-Clovis Area
0.15 0.02 0.09 1.02 3.99 0.10 0.38 0.45 0.00
City of Sacramento
0.64 0.09 0.10 0.69 8.04 0.09 0.89 1.22 0.08
City of Santa Clarita
0.50 0.76 0.08 3.41 5.69 0.71 0.33 0.02 2.20
Average 0.79 0.32 0.53 2.02 7.27 0.24 0.51 0.62 0.43 Median 0.46 0.13 0.41 2.22 7.19 0.14 0.44 0.55 0.08 Minimum 0.09 0.02 0.08 0.69 3.99 0.09 0.23 0.02 0.00 Maximum 2.93 0.85 1.13 3.41 10.46 0.71 0.89 1.31 2.20
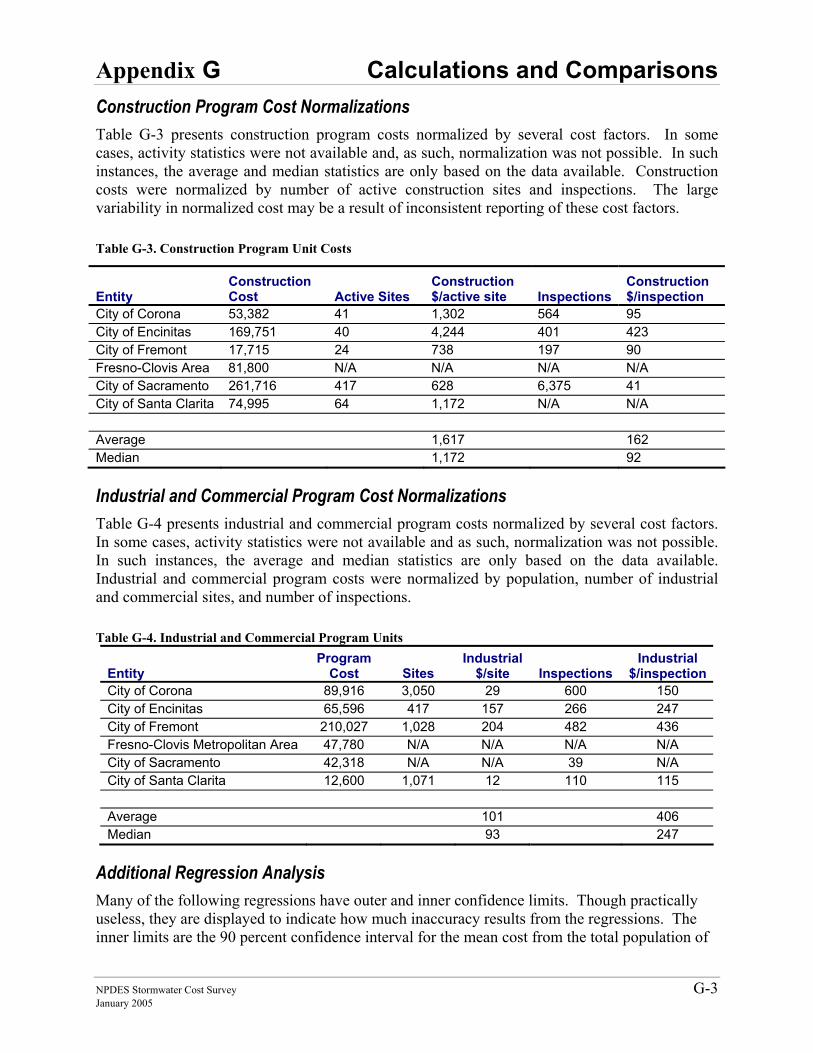
Appendix G Calculations and Comparisons
NPDES Stormwater Cost Survey G-3 January 2005
Construction Program Cost Normalizations Table G-3 presents construction program costs normalized by several cost factors. In some cases, activity statistics were not available and, as such, normalization was not possible. In such instances, the average and median statistics are only based on the data available. Construction costs were normalized by number of active construction sites and inspections. The large variability in normalized cost may be a result of inconsistent reporting of these cost factors.
Table G-3. Construction Program Unit Costs
Industrial and Commercial Program Cost Normalizations Table G-4 presents industrial and commercial program costs normalized by several cost factors. In some cases, activity statistics were not available and as such, normalization was not possible. In such instances, the average and median statistics are only based on the data available. Industrial and commercial program costs were normalized by population, number of industrial and commercial sites, and number of inspections.
Table G-4. Industrial and Commercial Program Units
Entity Program
Cost Sites Industrial
$/site Inspections Industrial
$/inspectionCity of Corona 89,916 3,050 29 600 150 City of Encinitas 65,596 417 157 266 247 City of Fremont 210,027 1,028 204 482 436 Fresno-Clovis Metropolitan Area 47,780 N/A N/A N/A N/A City of Sacramento 42,318 N/A N/A 39 N/A City of Santa Clarita 12,600 1,071 12 110 115 Average 101 406 Median 93 247
Additional Regression Analysis Many of the following regressions have outer and inner confidence limits. Though practically useless, they are displayed to indicate how much inaccuracy results from the regressions. The inner limits are the 90 percent confidence interval for the mean cost from the total population of
Entity Construction Cost Active Sites
Construction $/active site Inspections
Construction $/inspection
City of Corona 53,382 41 1,302 564 95 City of Encinitas 169,751 40 4,244 401 423 City of Fremont 17,715 24 738 197 90 Fresno-Clovis Area 81,800 N/A N/A N/A N/A City of Sacramento 261,716 417 628 6,375 41 City of Santa Clarita 74,995 64 1,172 N/A N/A Average 1,617 162 Median 1,172 92
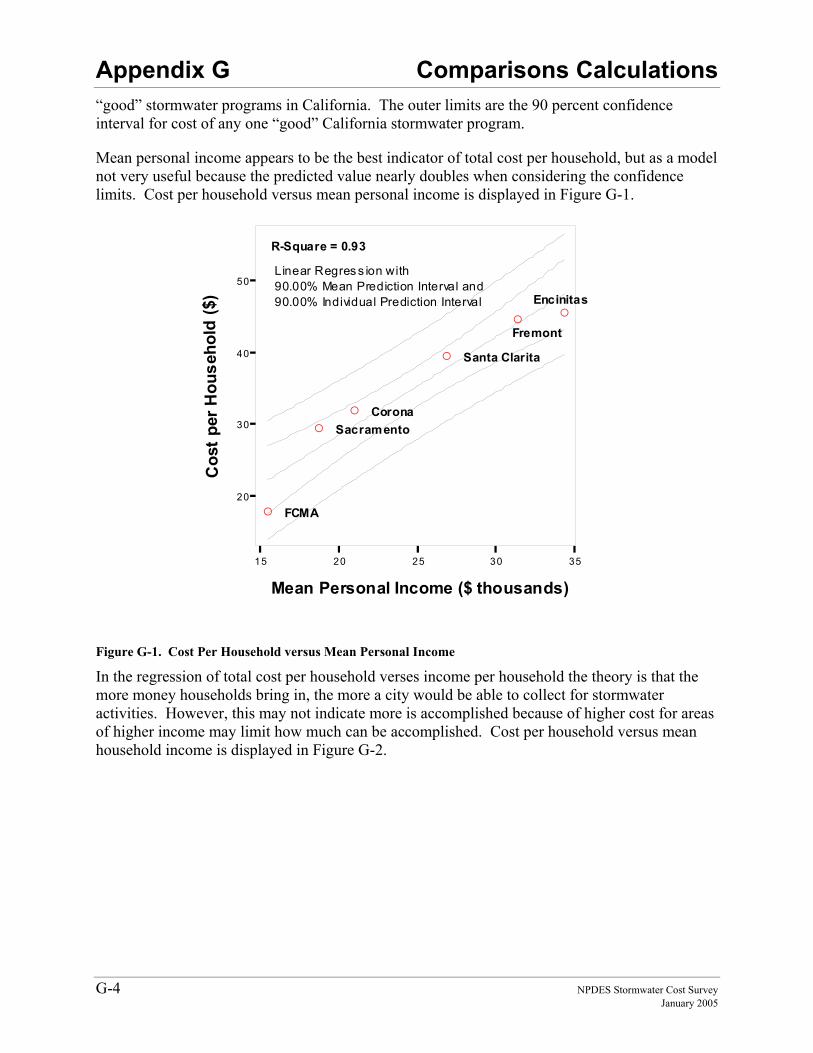
Appendix G Comparisons Calculations
G-4 NPDES Stormwater Cost Survey January 2005
“good” stormwater programs in California. The outer limits are the 90 percent confidence interval for cost of any one “good” California stormwater program.
Mean personal income appears to be the best indicator of total cost per household, but as a model not very useful because the predicted value nearly doubles when considering the confidence limits. Cost per household versus mean personal income is displayed in Figure G-1.
Linear Regres s ion with90.00% Mean Prediction Interval and90.00% Individual Prediction Interval
15 20 25 30 35
Mean Personal Income ($ thousands)
20
30
40
50
Cos
t per
Hou
seho
ld ($
)
A
AA
A
A
A
Corona
Encinitas
Fremont
FCMA
Sacramento
Santa Clarita
R-Square = 0.93
Figure G-1. Cost Per Household versus Mean Personal Income
In the regression of total cost per household verses income per household the theory is that the more money households bring in, the more a city would be able to collect for stormwater activities. However, this may not indicate more is accomplished because of higher cost for areas of higher income may limit how much can be accomplished. Cost per household versus mean household income is displayed in Figure G-2.
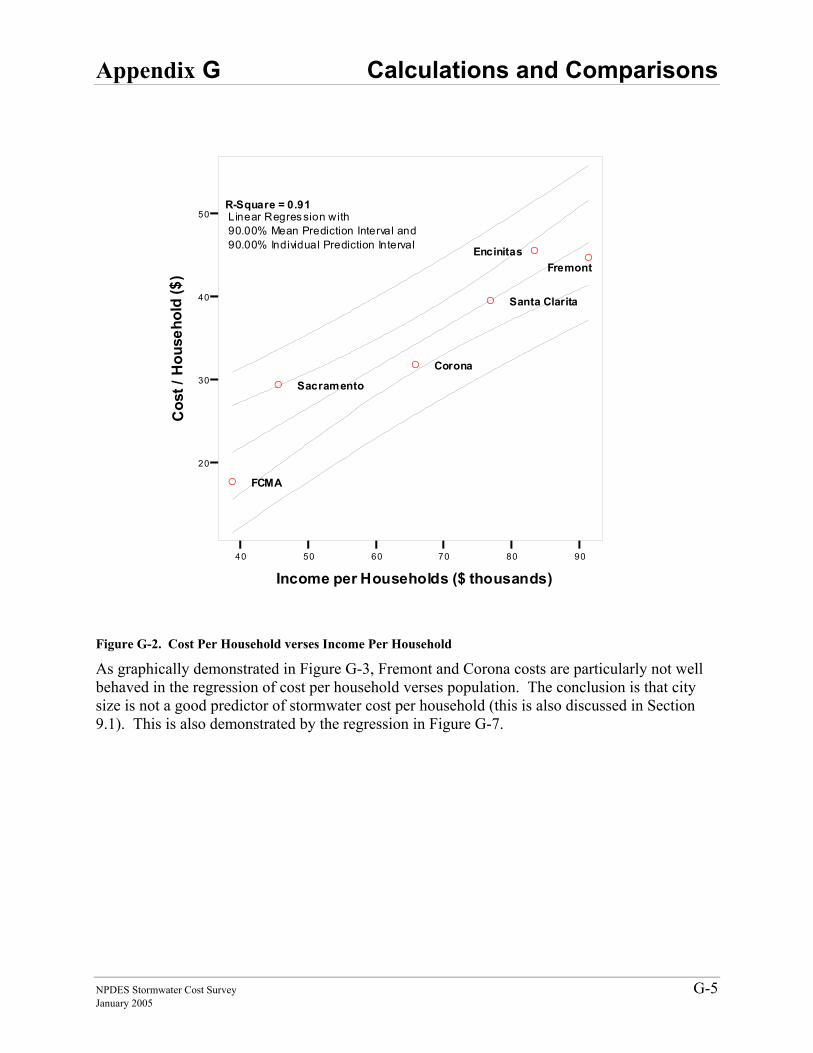
Appendix G Calculations and Comparisons
NPDES Stormwater Cost Survey G-5 January 2005
Linear Regression with90.00% Mean Prediction Interval and90.00% Individual Prediction Interval
40 50 60 70 80 90
Income per Households ($ thousands)
20
30
40
50
Cos
t / H
ouse
hold
($)
A
AA
A
A
A
Corona
EncinitasFremont
FCMA
Sacramento
Santa Clarita
R-Square = 0.91
Figure G-2. Cost Per Household verses Income Per Household
As graphically demonstrated in Figure G-3, Fremont and Corona costs are particularly not well behaved in the regression of cost per household verses population. The conclusion is that city size is not a good predictor of stormwater cost per household (this is also discussed in Section 9.1). This is also demonstrated by the regression in Figure G-7.
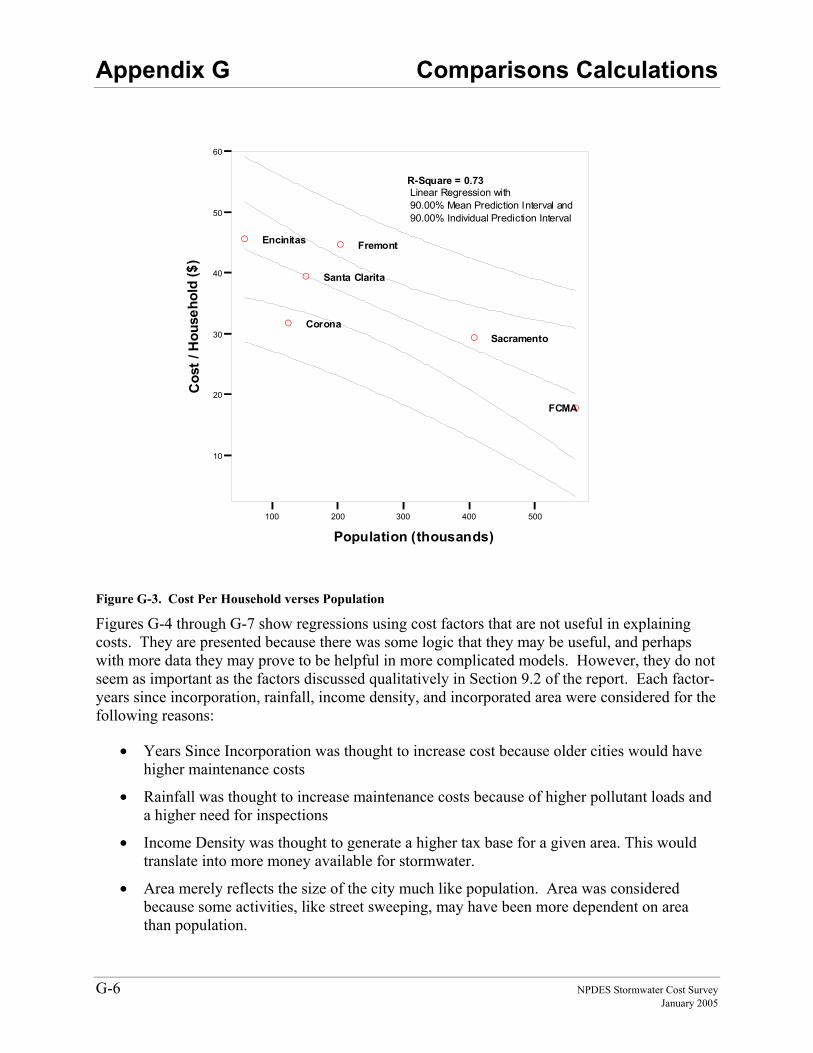
Appendix G Comparisons Calculations
G-6 NPDES Stormwater Cost Survey January 2005
Linear Regression with90.00% Mean Prediction Interval and90.00% Individual Prediction Interval
100 200 300 400 500
Population (thousands)
10
20
30
40
50
60
Cos
t / H
ouse
hold
($)
A
AA
A
A
A
Corona
Encinitas Fremont
FCMA
Sacramento
Santa Clarita
R-Square = 0.73
Figure G-3. Cost Per Household verses Population
Figures G-4 through G-7 show regressions using cost factors that are not useful in explaining costs. They are presented because there was some logic that they may be useful, and perhaps with more data they may prove to be helpful in more complicated models. However, they do not seem as important as the factors discussed qualitatively in Section 9.2 of the report. Each factor- years since incorporation, rainfall, income density, and incorporated area were considered for the following reasons:
• Years Since Incorporation was thought to increase cost because older cities would have higher maintenance costs
• Rainfall was thought to increase maintenance costs because of higher pollutant loads and a higher need for inspections
• Income Density was thought to generate a higher tax base for a given area. This would translate into more money available for stormwater.
• Area merely reflects the size of the city much like population. Area was considered because some activities, like street sweeping, may have been more dependent on area than population.
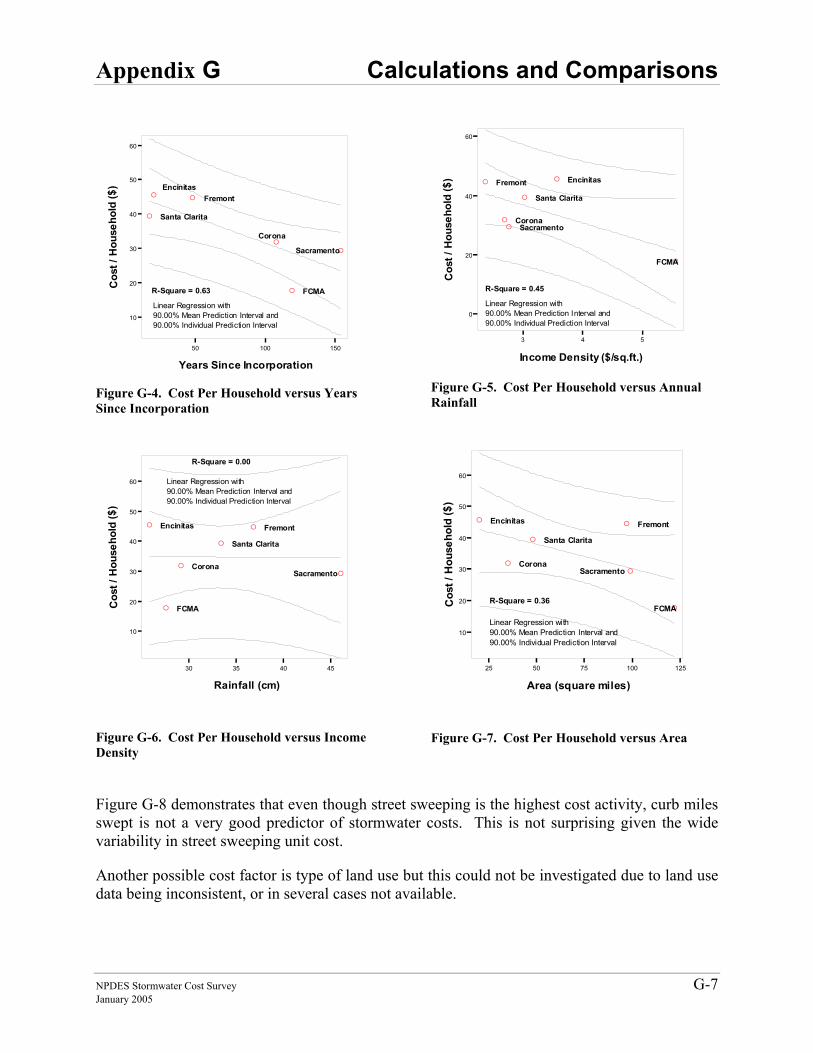
Appendix G Calculations and Comparisons
NPDES Stormwater Cost Survey G-7 January 2005
Linear Regression with90.00% Mean Prediction Interval and90.00% Individual Prediction Interval
50 100 150
Years Since Incorporation
10
20
30
40
50
60
Cos
t / H
ouse
hold
($)
A
A A
A
A
A
Corona
EncinitasFremont
FCMA
Sacramento
Santa Clarita
R-Square = 0.63
Figure G-4. Cost Per Household versus Years Since Incorporation
Linear Regression with90.00% Mean Prediction Interval and90.00% Individual Prediction Interval
30 35 40 45
Rainfall (cm)
10
20
30
40
50
60
Cos
t / H
ouse
hold
($)
A
A A
A
A
A
Corona
Encinitas Fremont
FCMA
Sacramento
Santa Clarita
R-Square = 0.00
Figure G-6. Cost Per Household versus Income Density
Linear Regression with90.00% Mean Prediction Interval and90.00% Individual Prediction Interval
3 4 5
Income Density ($/sq.ft.)
0
20
40
60
Cos
t / H
ouse
hold
($)
A
AA
A
A
A
Corona
EncinitasFremont
FCMA
Sacramento
Santa Clarita
R-Square = 0.45
Figure G-5. Cost Per Household versus Annual Rainfall
Linear Regression with90.00% Mean Prediction Interval and90.00% Individual Prediction Interval
25 50 75 100 125
Area (square miles)
10
20
30
40
50
60
Cos
t / H
ouse
hold
($)
A
A A
A
A
A
Corona
Encinitas Fremont
FCMA
Sacramento
Santa Clarita
R-Square = 0.36
Figure G-7. Cost Per Household versus Area
Figure G-8 demonstrates that even though street sweeping is the highest cost activity, curb miles swept is not a very good predictor of stormwater costs. This is not surprising given the wide variability in street sweeping unit cost.
Another possible cost factor is type of land use but this could not be investigated due to land use data being inconsistent, or in several cases not available.
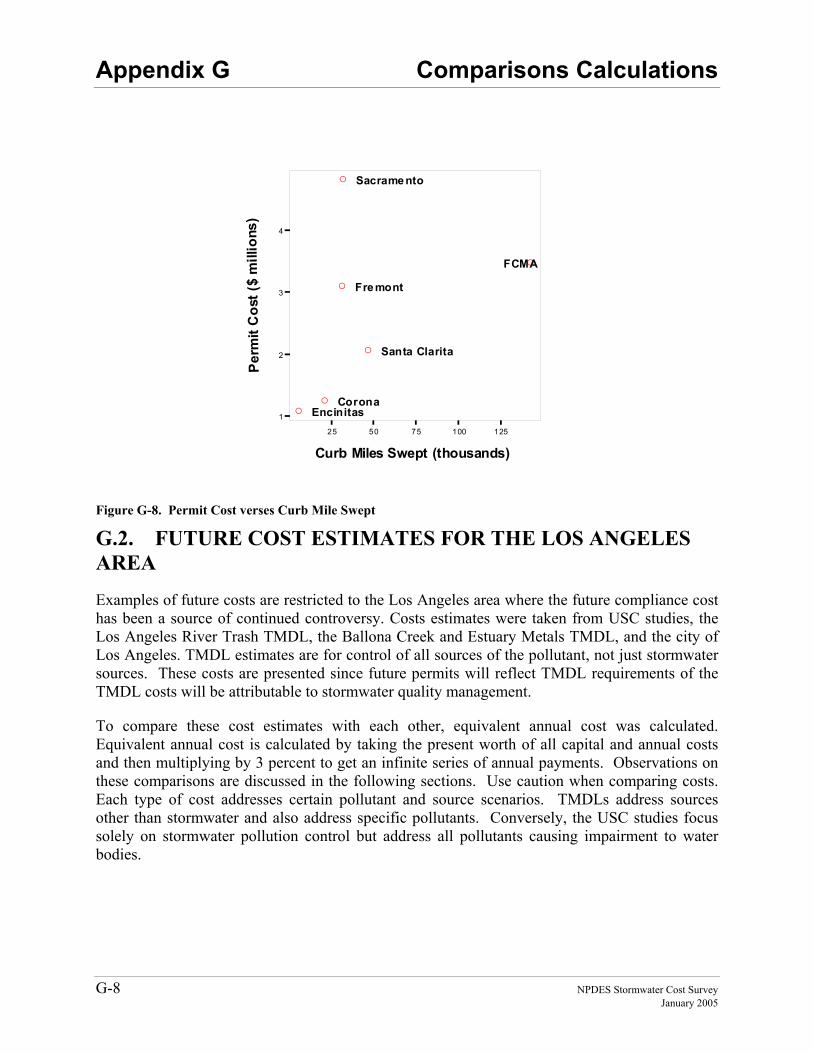
Appendix G Comparisons Calculations
G-8 NPDES Stormwater Cost Survey January 2005
25 50 75 100 125
Curb Miles Swept (thousands)
1
2
3
4
Perm
it C
ost (
$ m
illio
ns)
AA
A
A
A
A
CoronaEncinitas
Fremont
FCMA
Sacramento
Santa Clarita
Figure G-8. Permit Cost verses Curb Mile Swept
G.2. FUTURE COST ESTIMATES FOR THE LOS ANGELES AREA
Examples of future costs are restricted to the Los Angeles area where the future compliance cost has been a source of continued controversy. Costs estimates were taken from USC studies, the Los Angeles River Trash TMDL, the Ballona Creek and Estuary Metals TMDL, and the city of Los Angeles. TMDL estimates are for control of all sources of the pollutant, not just stormwater sources. These costs are presented since future permits will reflect TMDL requirements of the TMDL costs will be attributable to stormwater quality management.
To compare these cost estimates with each other, equivalent annual cost was calculated. Equivalent annual cost is calculated by taking the present worth of all capital and annual costs and then multiplying by 3 percent to get an infinite series of annual payments. Observations on these comparisons are discussed in the following sections. Use caution when comparing costs. Each type of cost addresses certain pollutant and source scenarios. TMDLs address sources other than stormwater and also address specific pollutants. Conversely, the USC studies focus solely on stormwater pollution control but address all pollutants causing impairment to water bodies.
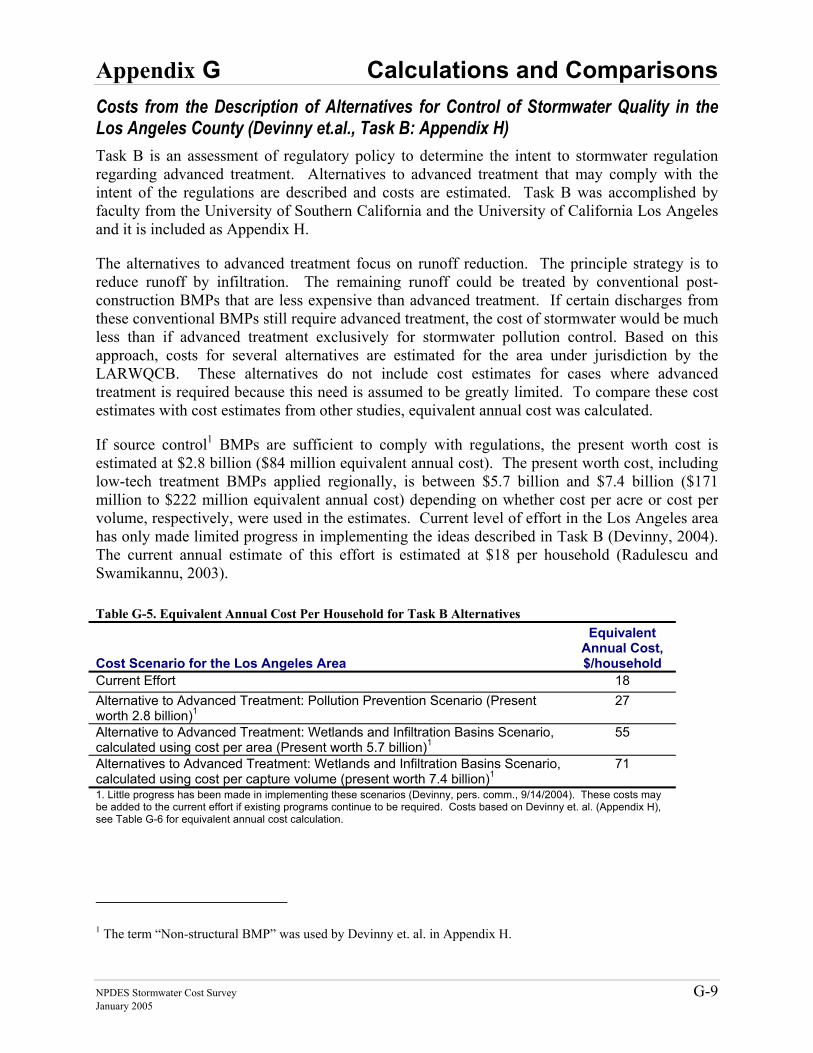
Appendix G Calculations and Comparisons
NPDES Stormwater Cost Survey G-9 January 2005
Costs from the Description of Alternatives for Control of Stormwater Quality in the Los Angeles County (Devinny et.al., Task B: Appendix H) Task B is an assessment of regulatory policy to determine the intent to stormwater regulation regarding advanced treatment. Alternatives to advanced treatment that may comply with the intent of the regulations are described and costs are estimated. Task B was accomplished by faculty from the University of Southern California and the University of California Los Angeles and it is included as Appendix H.
The alternatives to advanced treatment focus on runoff reduction. The principle strategy is to reduce runoff by infiltration. The remaining runoff could be treated by conventional post-construction BMPs that are less expensive than advanced treatment. If certain discharges from these conventional BMPs still require advanced treatment, the cost of stormwater would be much less than if advanced treatment exclusively for stormwater pollution control. Based on this approach, costs for several alternatives are estimated for the area under jurisdiction by the LARWQCB. These alternatives do not include cost estimates for cases where advanced treatment is required because this need is assumed to be greatly limited. To compare these cost estimates with cost estimates from other studies, equivalent annual cost was calculated.
If source control1 BMPs are sufficient to comply with regulations, the present worth cost is estimated at $2.8 billion ($84 million equivalent annual cost). The present worth cost, including low-tech treatment BMPs applied regionally, is between $5.7 billion and $7.4 billion ($171 million to $222 million equivalent annual cost) depending on whether cost per acre or cost per volume, respectively, were used in the estimates. Current level of effort in the Los Angeles area has only made limited progress in implementing the ideas described in Task B (Devinny, 2004). The current annual estimate of this effort is estimated at $18 per household (Radulescu and Swamikannu, 2003).
Table G-5. Equivalent Annual Cost Per Household for Task B Alternatives
Cost Scenario for the Los Angeles Area
Equivalent Annual Cost, $/household
Current Effort 18 Alternative to Advanced Treatment: Pollution Prevention Scenario (Present worth 2.8 billion)1
27
Alternative to Advanced Treatment: Wetlands and Infiltration Basins Scenario, calculated using cost per area (Present worth 5.7 billion)1
55
Alternatives to Advanced Treatment: Wetlands and Infiltration Basins Scenario, calculated using cost per capture volume (present worth 7.4 billion)1
71
1. Little progress has been made in implementing these scenarios (Devinny, pers. comm., 9/14/2004). These costs may be added to the current effort if existing programs continue to be required. Costs based on Devinny et. al. (Appendix H), see Table G-6 for equivalent annual cost calculation.
1 The term “Non-structural BMP” was used by Devinny et. al. in Appendix H.
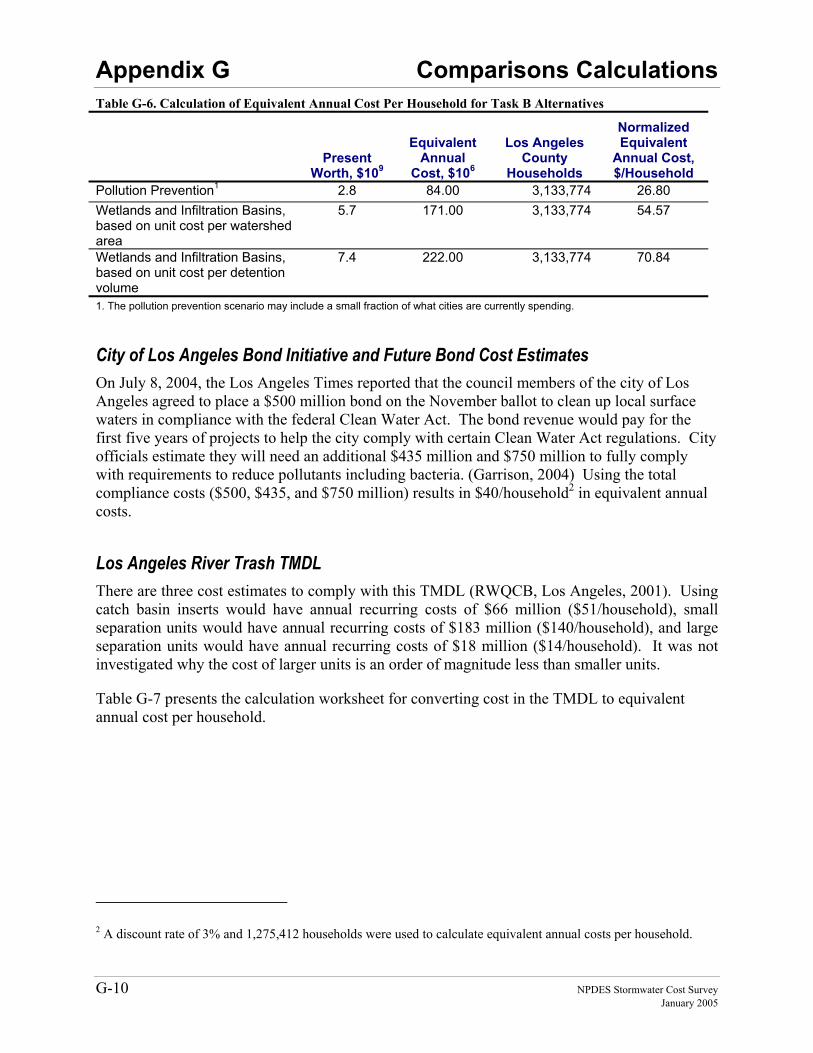
Appendix G Comparisons Calculations
G-10 NPDES Stormwater Cost Survey January 2005
Table G-6. Calculation of Equivalent Annual Cost Per Household for Task B Alternatives
Present
Worth, $109
Equivalent Annual
Cost, $106
Los Angeles County
Households
Normalized Equivalent
Annual Cost, $/Household
Pollution Prevention1 2.8 84.00 3,133,774 26.80 Wetlands and Infiltration Basins, based on unit cost per watershed area
5.7 171.00 3,133,774 54.57
Wetlands and Infiltration Basins, based on unit cost per detention volume
7.4 222.00 3,133,774 70.84
1. The pollution prevention scenario may include a small fraction of what cities are currently spending.
City of Los Angeles Bond Initiative and Future Bond Cost Estimates On July 8, 2004, the Los Angeles Times reported that the council members of the city of Los Angeles agreed to place a $500 million bond on the November ballot to clean up local surface waters in compliance with the federal Clean Water Act. The bond revenue would pay for the first five years of projects to help the city comply with certain Clean Water Act regulations. City officials estimate they will need an additional $435 million and $750 million to fully comply with requirements to reduce pollutants including bacteria. (Garrison, 2004) Using the total compliance costs ($500, $435, and $750 million) results in $40/household2 in equivalent annual costs.
Los Angeles River Trash TMDL There are three cost estimates to comply with this TMDL (RWQCB, Los Angeles, 2001). Using catch basin inserts would have annual recurring costs of $66 million ($51/household), small separation units would have annual recurring costs of $183 million ($140/household), and large separation units would have annual recurring costs of $18 million ($14/household). It was not investigated why the cost of larger units is an order of magnitude less than smaller units.
Table G-7 presents the calculation worksheet for converting cost in the TMDL to equivalent annual cost per household.
2 A discount rate of 3% and 1,275,412 households were used to calculate equivalent annual costs per household.
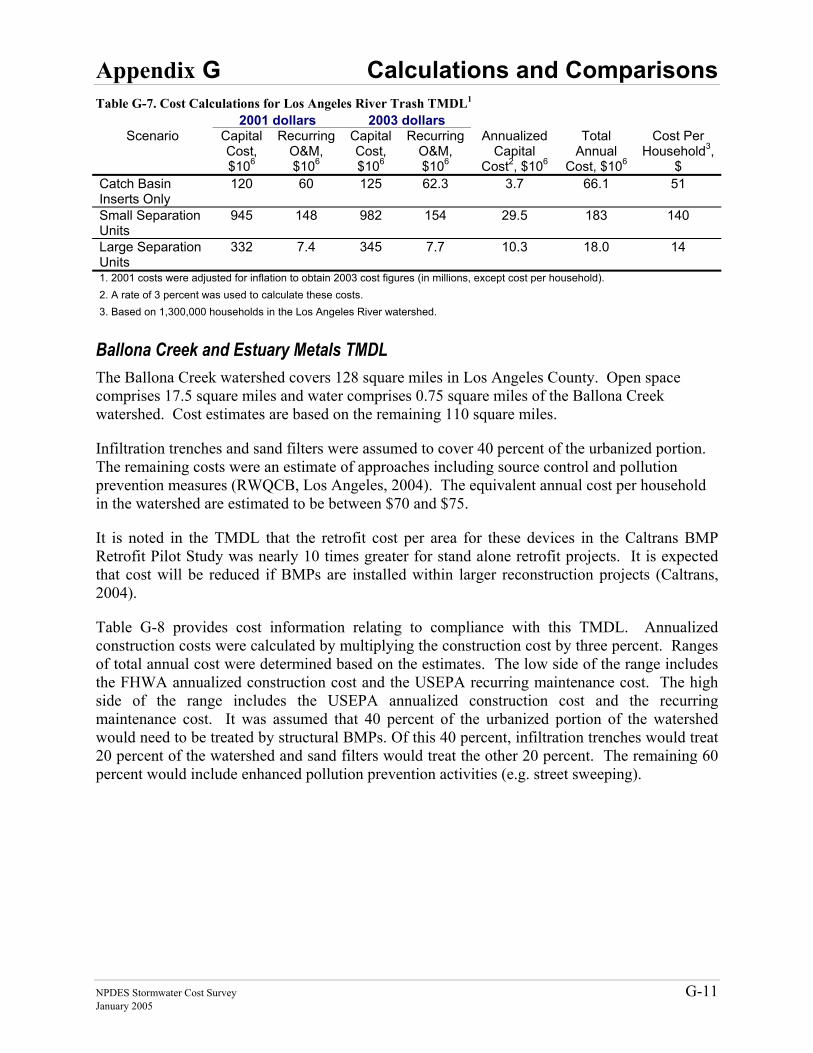
Appendix G Calculations and Comparisons
NPDES Stormwater Cost Survey G-11 January 2005
Table G-7. Cost Calculations for Los Angeles River Trash TMDL1 2001 dollars 2003 dollars
Scenario Capital Cost, $106
Recurring O&M, $106
Capital Cost, $106
Recurring O&M, $106
Annualized Capital
Cost2, $106
Total Annual
Cost, $106
Cost Per Household3,
$ Catch Basin Inserts Only
120 60 125 62.3 3.7 66.1 51
Small Separation Units
945 148 982 154 29.5 183 140
Large Separation Units
332 7.4 345 7.7 10.3 18.0 14
1. 2001 costs were adjusted for inflation to obtain 2003 cost figures (in millions, except cost per household). 2. A rate of 3 percent was used to calculate these costs. 3. Based on 1,300,000 households in the Los Angeles River watershed.
Ballona Creek and Estuary Metals TMDL The Ballona Creek watershed covers 128 square miles in Los Angeles County. Open space comprises 17.5 square miles and water comprises 0.75 square miles of the Ballona Creek watershed. Cost estimates are based on the remaining 110 square miles.
Infiltration trenches and sand filters were assumed to cover 40 percent of the urbanized portion. The remaining costs were an estimate of approaches including source control and pollution prevention measures (RWQCB, Los Angeles, 2004). The equivalent annual cost per household in the watershed are estimated to be between $70 and $75.
It is noted in the TMDL that the retrofit cost per area for these devices in the Caltrans BMP Retrofit Pilot Study was nearly 10 times greater for stand alone retrofit projects. It is expected that cost will be reduced if BMPs are installed within larger reconstruction projects (Caltrans, 2004).
Table G-8 provides cost information relating to compliance with this TMDL. Annualized construction costs were calculated by multiplying the construction cost by three percent. Ranges of total annual cost were determined based on the estimates. The low side of the range includes the FHWA annualized construction cost and the USEPA recurring maintenance cost. The high side of the range includes the USEPA annualized construction cost and the recurring maintenance cost. It was assumed that 40 percent of the urbanized portion of the watershed would need to be treated by structural BMPs. Of this 40 percent, infiltration trenches would treat 20 percent of the watershed and sand filters would treat the other 20 percent. The remaining 60 percent would include enhanced pollution prevention activities (e.g. street sweeping).
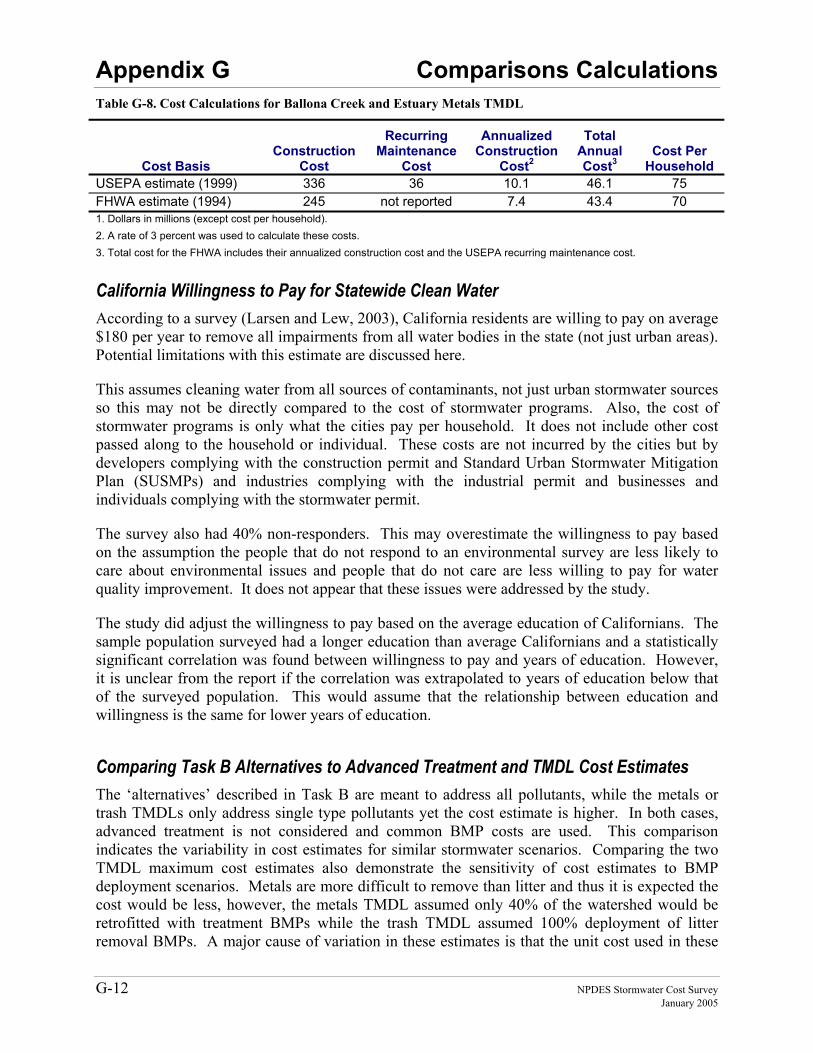
Appendix G Comparisons Calculations
G-12 NPDES Stormwater Cost Survey January 2005
Table G-8. Cost Calculations for Ballona Creek and Estuary Metals TMDL
Cost Basis Construction
Cost
Recurring Maintenance
Cost
Annualized Construction
Cost2
Total Annual Cost3
Cost Per Household
USEPA estimate (1999) 336 36 10.1 46.1 75 FHWA estimate (1994) 245 not reported 7.4 43.4 70 1. Dollars in millions (except cost per household). 2. A rate of 3 percent was used to calculate these costs. 3. Total cost for the FHWA includes their annualized construction cost and the USEPA recurring maintenance cost.
California Willingness to Pay for Statewide Clean Water According to a survey (Larsen and Lew, 2003), California residents are willing to pay on average $180 per year to remove all impairments from all water bodies in the state (not just urban areas). Potential limitations with this estimate are discussed here.
This assumes cleaning water from all sources of contaminants, not just urban stormwater sources so this may not be directly compared to the cost of stormwater programs. Also, the cost of stormwater programs is only what the cities pay per household. It does not include other cost passed along to the household or individual. These costs are not incurred by the cities but by developers complying with the construction permit and Standard Urban Stormwater Mitigation Plan (SUSMPs) and industries complying with the industrial permit and businesses and individuals complying with the stormwater permit.
The survey also had 40% non-responders. This may overestimate the willingness to pay based on the assumption the people that do not respond to an environmental survey are less likely to care about environmental issues and people that do not care are less willing to pay for water quality improvement. It does not appear that these issues were addressed by the study.
The study did adjust the willingness to pay based on the average education of Californians. The sample population surveyed had a longer education than average Californians and a statistically significant correlation was found between willingness to pay and years of education. However, it is unclear from the report if the correlation was extrapolated to years of education below that of the surveyed population. This would assume that the relationship between education and willingness is the same for lower years of education.
Comparing Task B Alternatives to Advanced Treatment and TMDL Cost Estimates The ‘alternatives’ described in Task B are meant to address all pollutants, while the metals or trash TMDLs only address single type pollutants yet the cost estimate is higher. In both cases, advanced treatment is not considered and common BMP costs are used. This comparison indicates the variability in cost estimates for similar stormwater scenarios. Comparing the two TMDL maximum cost estimates also demonstrate the sensitivity of cost estimates to BMP deployment scenarios. Metals are more difficult to remove than litter and thus it is expected the cost would be less, however, the metals TMDL assumed only 40% of the watershed would be retrofitted with treatment BMPs while the trash TMDL assumed 100% deployment of litter removal BMPs. A major cause of variation in these estimates is that the unit cost used in these
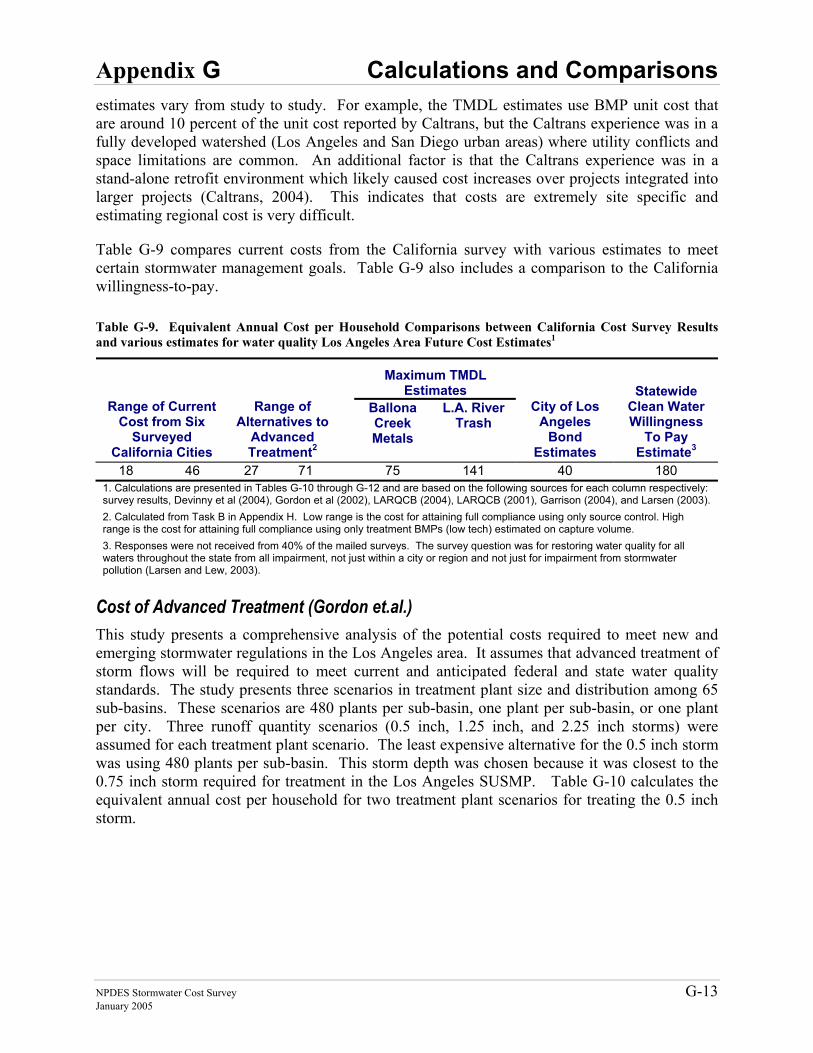
Appendix G Calculations and Comparisons
NPDES Stormwater Cost Survey G-13 January 2005
estimates vary from study to study. For example, the TMDL estimates use BMP unit cost that are around 10 percent of the unit cost reported by Caltrans, but the Caltrans experience was in a fully developed watershed (Los Angeles and San Diego urban areas) where utility conflicts and space limitations are common. An additional factor is that the Caltrans experience was in a stand-alone retrofit environment which likely caused cost increases over projects integrated into larger projects (Caltrans, 2004). This indicates that costs are extremely site specific and estimating regional cost is very difficult.
Table G-9 compares current costs from the California survey with various estimates to meet certain stormwater management goals. Table G-9 also includes a comparison to the California willingness-to-pay.
Table G-9. Equivalent Annual Cost per Household Comparisons between California Cost Survey Results and various estimates for water quality Los Angeles Area Future Cost Estimates1
Maximum TMDL Estimates
Range of Current Cost from Six
Surveyed California Cities
Range of Alternatives to
Advanced Treatment2
Ballona Creek Metals
L.A. River Trash
City of Los Angeles
Bond Estimates
Statewide Clean Water Willingness
To Pay Estimate3
18 46 27 71 75 141 40 180 1. Calculations are presented in Tables G-10 through G-12 and are based on the following sources for each column respectively: survey results, Devinny et al (2004), Gordon et al (2002), LARQCB (2004), LARQCB (2001), Garrison (2004), and Larsen (2003). 2. Calculated from Task B in Appendix H. Low range is the cost for attaining full compliance using only source control. High range is the cost for attaining full compliance using only treatment BMPs (low tech) estimated on capture volume. 3. Responses were not received from 40% of the mailed surveys. The survey question was for restoring water quality for all waters throughout the state from all impairment, not just within a city or region and not just for impairment from stormwater pollution (Larsen and Lew, 2003).
Cost of Advanced Treatment (Gordon et.al.) This study presents a comprehensive analysis of the potential costs required to meet new and emerging stormwater regulations in the Los Angeles area. It assumes that advanced treatment of storm flows will be required to meet current and anticipated federal and state water quality standards. The study presents three scenarios in treatment plant size and distribution among 65 sub-basins. These scenarios are 480 plants per sub-basin, one plant per sub-basin, or one plant per city. Three runoff quantity scenarios (0.5 inch, 1.25 inch, and 2.25 inch storms) were assumed for each treatment plant scenario. The least expensive alternative for the 0.5 inch storm was using 480 plants per sub-basin. This storm depth was chosen because it was closest to the 0.75 inch storm required for treatment in the Los Angeles SUSMP. Table G-10 calculates the equivalent annual cost per household for two treatment plant scenarios for treating the 0.5 inch storm.
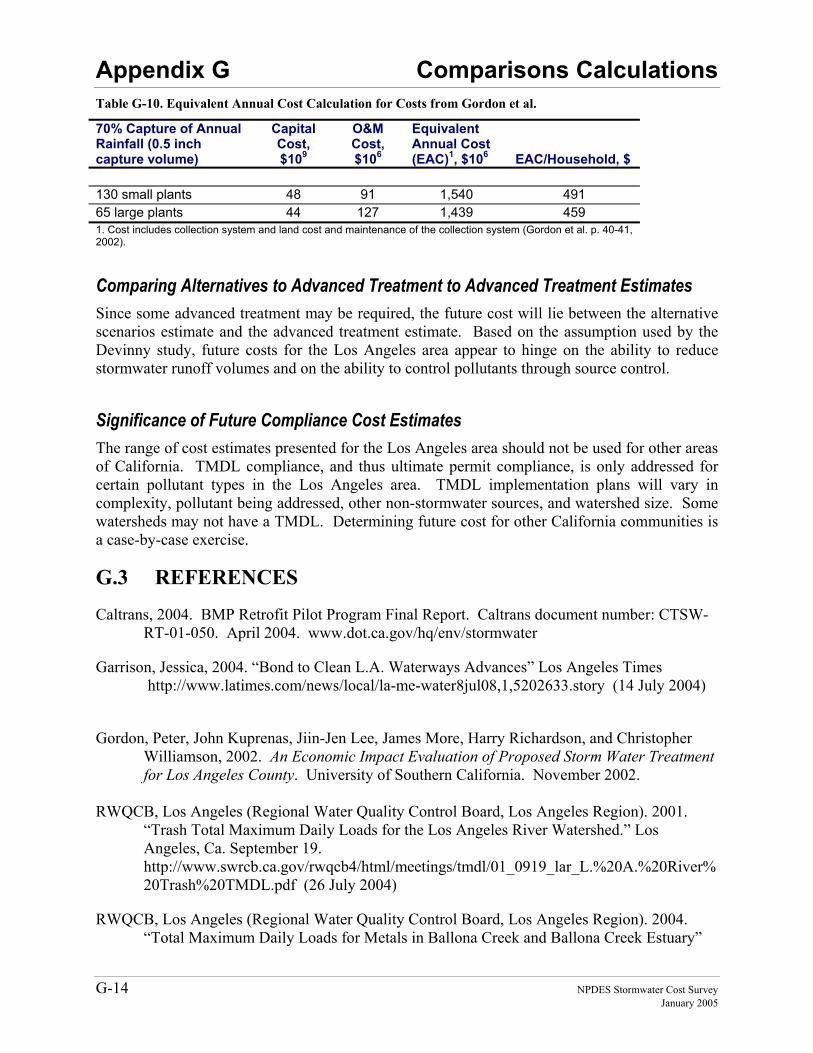
Appendix G Comparisons Calculations
G-14 NPDES Stormwater Cost Survey January 2005
Table G-10. Equivalent Annual Cost Calculation for Costs from Gordon et al.
70% Capture of Annual Rainfall (0.5 inch capture volume)
Capital Cost, $109
O&M Cost, $106
Equivalent Annual Cost (EAC)1, $106 EAC/Household, $
130 small plants 48 91 1,540 491 65 large plants 44 127 1,439 459 1. Cost includes collection system and land cost and maintenance of the collection system (Gordon et al. p. 40-41, 2002).
Comparing Alternatives to Advanced Treatment to Advanced Treatment Estimates Since some advanced treatment may be required, the future cost will lie between the alternative scenarios estimate and the advanced treatment estimate. Based on the assumption used by the Devinny study, future costs for the Los Angeles area appear to hinge on the ability to reduce stormwater runoff volumes and on the ability to control pollutants through source control.
Significance of Future Compliance Cost Estimates The range of cost estimates presented for the Los Angeles area should not be used for other areas of California. TMDL compliance, and thus ultimate permit compliance, is only addressed for certain pollutant types in the Los Angeles area. TMDL implementation plans will vary in complexity, pollutant being addressed, other non-stormwater sources, and watershed size. Some watersheds may not have a TMDL. Determining future cost for other California communities is a case-by-case exercise.
G.3 REFERENCES
Caltrans, 2004. BMP Retrofit Pilot Program Final Report. Caltrans document number: CTSW-RT-01-050. April 2004. www.dot.ca.gov/hq/env/stormwater
Garrison, Jessica, 2004. “Bond to Clean L.A. Waterways Advances” Los Angeles Times http://www.latimes.com/news/local/la-me-water8jul08,1,5202633.story (14 July 2004)
Gordon, Peter, John Kuprenas, Jiin-Jen Lee, James More, Harry Richardson, and Christopher Williamson, 2002. An Economic Impact Evaluation of Proposed Storm Water Treatment for Los Angeles County. University of Southern California. November 2002.
RWQCB, Los Angeles (Regional Water Quality Control Board, Los Angeles Region). 2001.
“Trash Total Maximum Daily Loads for the Los Angeles River Watershed.” Los Angeles, Ca. September 19. http://www.swrcb.ca.gov/rwqcb4/html/meetings/tmdl/01_0919_lar_L.%20A.%20River%20Trash%20TMDL.pdf (26 July 2004)
RWQCB, Los Angeles (Regional Water Quality Control Board, Los Angeles Region). 2004. “Total Maximum Daily Loads for Metals in Ballona Creek and Ballona Creek Estuary”
Appendix G Calculations and Comparisons
NPDES Stormwater Cost Survey G-15 January 2005
(12 July 2004) http://www.swrcb.ca.gov/rwqcb4/html/meetings/tmdl/tmdl_ws_ballona_creek.html#04_0712 (26 July 2004)
U.S. Bureau of Labor Statistics. 2005. “Consumer Price Index Homepage”mhttp://www.bls.gov/cpi/home.htm

Appendix H Task B
Alternative Approaches to Stormwater Quality Control
Prepared for the Los Angeles Regional Water Quality Control Board
Joseph S. Devinny
Professor, Civil and Environmental Engineering University of Southern California
Los Angeles, California
Sheldon Kamieniecki Professor, Political Science
University of Southern California Los Angeles, California
Michael Stenstrom
Professor, Civil and Environmental Engineering University of California at Los Angeles
Los Angeles, California
2004
Appendix H Task B
2
Executive Summary .............................................................................................................6 Introduction........................................................................................................................11
Runoff ...........................................................................................................................11 Pollutants.......................................................................................................................12 Runoff Sources and Quality ..........................................................................................13
Streets .......................................................................................................................13 Exposed Commercial Activity .................................................................................13 Construction Sites ....................................................................................................13 Residences................................................................................................................13 Commercial Rooftops...............................................................................................14 Parking Lots and Landscaping .................................................................................14
Assessment of Regulatory Policy ......................................................................................15 Overview of Policy and Regulation Theory .................................................................15
Stormwater Regulation and Regulatory Intent.........................................................18 California Law..........................................................................................................18 The Evolution of Water Pollution Control ...............................................................18 The Stormwater Permit ............................................................................................20
Regulatory Mechanisms................................................................................................20 Policy Implementation ..................................................................................................21 Previous Actions by the LA Regional Water Board .....................................................23 Implementation of Regional Solutions .........................................................................24 Trading Schemes...........................................................................................................24
Description of Alternative Approaches .............................................................................25 Infiltration .....................................................................................................................25 Source Control ..............................................................................................................26
Industrial Releases....................................................................................................26 Trash Management ...................................................................................................26 Street Cleaning .........................................................................................................26 Pesticide Substitutions .............................................................................................27 Trace Metals.............................................................................................................27 Control of Automotive-Related Sources ..................................................................27 Control of Bacteria ...................................................................................................28
Improved Enforcement..................................................................................................29 Detention and BMP Treatment .....................................................................................29
Stormwater Detention Basins...................................................................................29 Sanitary Treatment of Dry Weather Flows ..............................................................30 Treatment Wetlands .................................................................................................30 BMP Treatment of Flows from Problem Watersheds such as Industrial Areas.......31 Partial Treatment in Curbside Units.........................................................................31
Public Outreach and Education.....................................................................................31 Good Housekeeping for Municipal Operations ............................................................31 Combined Approaches for Stormwater Quality Management......................................32 Streets............................................................................................................................32 Alleys for Public Use and Infiltration ...........................................................................34 Exposed Commercial Activity ......................................................................................34
Appendix H Task B
3
Construction Sites .........................................................................................................34 Residences.....................................................................................................................34 Low-flow Treatment in Wastewater Treatment Plants .................................................35 Capture and Use of Rooftop Runoff .............................................................................36 Parking Lots and Landscaping......................................................................................36 River Greening..............................................................................................................38 Infiltration in Residential Streets ..................................................................................38 Infiltration in Parks .......................................................................................................38 Public Facilities.............................................................................................................39
Primary Benefits of Runoff Quality Control .....................................................................40 Fishing...........................................................................................................................40 Swimming .....................................................................................................................40 Boating ..........................................................................................................................40 Noncontact Recreation and Nonconsumptive Wildlife Uses........................................40 Reduced Illness from Contaminated Seafood...............................................................40 Reduced Illness from Swimming in Contaminated Waters ..........................................41 Enhanced Esthetic Values.............................................................................................41 Preservation of Natural Ecosystems .............................................................................41
Secondary Benefits of Stormwater Quality Control ..........................................................42 Groundwater Restoration ..............................................................................................42 Flood Control ................................................................................................................42 Increased Parkland and Wildlife Habitat ......................................................................43 Improved Property Values from Trash Control ............................................................43 Reduction in Harbor Sedimentation..............................................................................44 Improved Public Health ................................................................................................44
Regional Programs Designed for Stormwater Quality Control .........................................45 Area-Wide Systems.......................................................................................................45
Sun Valley ................................................................................................................45 San Diego Creek.......................................................................................................46 Murray City, Utah, Golf Course and Wetlands........................................................46 Fresno Metropolitan Flood Control District ............................................................47
Individual Systems........................................................................................................47 Long Lake Retrofit, Littleton, Massachusetts ..........................................................47 Tule Pond, Alameda, California...............................................................................47 Treasure lsland, San Francisco Bay .........................................................................47 Herrerra Study of Stormwater Regulations Costs ....................................................48 Dover Mall, Delaware ..............................................................................................48 Oakland Park Industrial Area, Florida .....................................................................48 Clear Lake Packed Bed Wetland Filter System .......................................................48 Sand Filters in Alexandria, Virginia ........................................................................48 Compost Filter Facility, Hillsboro, Oregon .............................................................49 Infiltration Trenches.................................................................................................49 Infiltration Basins.....................................................................................................49 Bioretention Areas....................................................................................................49 Detention and Retention Wetlands...........................................................................49 Detention Vaults.......................................................................................................50
Appendix H Task B
4
Underground Sand Filters ........................................................................................50 Surface Sand Filters .................................................................................................50 Dry Swales and Filter Strips.....................................................................................50 Results from the ASCE-EPA BMP Database ..........................................................50
Estimates of Costs and Recommended Approach .............................................................52 Cost Estimates...............................................................................................................52 Economies of Scale .......................................................................................................57 Overall Costs of Stormwater Quality Control...............................................................60
Non-structural BMPs................................................................................................61 Wetlands and Infiltration Basins: Estimate Based on Cost per Square Mile of Watershed.................................................................................................................64 Wetlands and Infiltration Basins: Estimate Based on Needed Retention Capacity .65 Wetlands and Infiltration Basins: Estimation of Total Costs from the APWA Study65 Wetlands and Infiltration Basins: An “Upper Bound” Provided by the Sun Valley Study.........................................................................................................................66
Overall Benefits of Stormwater Quality Control ..........................................................66 The Esthetic Value of a Clean Ocean.......................................................................66 Ecosystem Services ..................................................................................................67 Additional Water Supply..........................................................................................68 Flood Control ...........................................................................................................68 Property Value Improvements from Greenspace and Water....................................69 Improved Property Values from Trash Control .......................................................70 Cost Savings from Reduced Dredging .....................................................................70 Cost Savings from Improved Public Health.............................................................70 Summary of predicted costs and benefits.................................................................70
Recommendations for Action .......................................................................................73 Outreach ...................................................................................................................73 Data Collection and Planning...................................................................................73 Administrative Structure ..........................................................................................73 Funding.....................................................................................................................74 Changes in Building Codes ......................................................................................74 Purchase of High-Efficiency Street Sweeping Equipment ......................................75 Investigation of Coliform Sources ...........................................................................75
Acknowledgements .......................................................................................................75 References .....................................................................................................................76
Appendix I. Best Management Practices for Construction Sites.......................................79 Mark Clearing Limits....................................................................................................79 Establish Construction Access ......................................................................................79 Control Flow Rates .......................................................................................................80 Install Sediment Controls..............................................................................................80 Stabilize Soils................................................................................................................81 Protect Slopes................................................................................................................83 Protect Drain Inlets .......................................................................................................84 Stabilize Channels And Outlets ....................................................................................84 Control Pollutants .........................................................................................................84 Control De-Watering.....................................................................................................85
Appendix H Task B
5
Maintain BMPs .............................................................................................................85 Manage the Project........................................................................................................85
Appendix II. Estimation of Costs for Controlling sediment releases at construction sites86
Appendix H Task B
6
EXECUTIVE SUMMARY Background
A recent, widely debated study entitled An Economic Impact Evaluation of Proposed Storm Water Treatment for Los Angeles County projects extremely high costs for compliance with stormwater quality regulations (Gordon et al., 2002). These estimates followed from the study’s fundamental assumption that the only way to comply with water quality regulations is to capture most or all of the flow and subject it to advanced treatment, and to do so at rates equal to peak runoff rates. In contrast, this report shows that there are far less expensive approaches available that, should they be implemented, will achieve high levels of compliance with current federal water quality standards.
Alternatives Considered
This report reviews present federal and state regulations and regulatory policy to determine whether advanced ultrafiltration treatment of the entire runoff flow is required to meet water quality standards, or whether compliance can be achieved through the widespread adoption of the various “best management practices” (BMPs) more commonly used for runoff quality control. The work identified and analyzed alternative measures that can be employed to meet present federal and state water quality standards. Particular attention was paid to strategies that concern ground water recharge, pollutant source control, and runoff detention, capture, and BMP treatment.
The report reviews possible approaches for controlling runoff water quality in the Los Angeles Region (the jurisdiction of the Los Angles Regional Water Quality Control Board) and presents a conceptual regional plan, including rough cost estimates. The study pursued a broad approach, providing an evaluation of total costs and benefits for the region, including those for municipalities, businesses, and individuals. The objective of the study was to outline a complete solution to stormwater quality problems, i.e., the plan is intended to meet the requirements of the stormwater permit and Total Maximum Daily Loads and provide acceptable water quality for the area. The alternatives of best management practices (BMPs) for control of individual pollutants (source control), and if necessary, a regional system of wetlands and infiltration facilities to provide final treatment and groundwater replenishment were chosen. These will be much cheaper than advanced treatment plants, and will provide benefits whose value exceeds costs. Assumptions Made for Determining Costs
Following the review of possible remedial actions for stormwater pollution, a conceptual plan for the Los Angeles Region was developed. It was predicated on the following assumptions:
Appendix H Task B
7
Because source control is always cheaper than cleaning polluted water, efforts should begin with preventing the release of pollutants to runoff. This includes measures like litter control, improved street cleaning, improved industrial housekeeping and others. Such approaches may constitute sufficient control for runoff coming from residential areas, so that these areas will require no further action.
For new residential development, anecdotal information indicates that landscaping that captures and infiltrates the first-flush storm will be of comparable cost to traditional landscaping, and should therefore be used. For commercial construction, costs may be higher, and adequate regional facilities might be substituted.
Where non-structural BMPs will not be adequate, or where implementation is very expensive, efforts must expand to include regional wetlands and stormwater parks (multiple-use infiltration basins).
Large portions of the Los Angeles Region are already built out to various degrees, constraining available stormwater management solutions. This report assumes that 1000 square miles can be characterized as “low density”, and that these regions can be served by a combination of source control, treatment wetlands, and infiltration systems. Another 1000 square miles is “high density” and can be served by source control and infiltration systems. About 50 square miles are “extremely high density” (such as downtown areas) and will require more sophisticated infiltration or treatment devices that occupy smaller areas. Estimated Costs
Total costs for compliance with runoff water quality regulations were predicted to be between $2.8 billion (if non-structural systems are sufficient for the entire region) to between $5.7 billion and $7.4 billion (if regional treatment or infiltration systems must also be constructed throughout the entire area). It is likely that regional systems will be required for at least some, but not all, of the area, so that the final costs will be somewhere between these extremes. • Enforcement of littering, pet waste, and chemical use ordinances is expected to cost
about $9 million per year. • Public education will cost about $5 million per year. A program to detect and prevent
illicit discharges to the system will cost about $80 million per year at first, but can be reduced to much lower levels as compliance is achieved.
• Increased cleaning of storm drains will be needed if regional solutions are not used,
and will cost about $27 million per year. • Trash discharges to receiving waters can be controlled by installing screening devices
on catch basins, enforcing litter laws, and improving street cleaning services. Estimates are that the immediate cost of instituting these measures will be about $600 million over the Los Angeles Region.
Appendix H Task B
8
• During periods of low flow, runoff water should be diverted to existing wastewater treatment plants. Construction costs for this effort will be about $28 million.
• Trash control and removal of particulates and their associated pollutants can be
facilitated by improved street cleaning. It is expected that this will cost $7.5 million per year more than current street cleaning programs, with a present worth of $250 million.
• On-site BMPs required for individual firms might cost about $240 million. Costs
associated with compliance with the ¾-inch rule for new construction will be a modest fraction of construction costs.
• With regard to structural BMPs, total costs (regional wetlands and infiltration
systems) were first estimated by determining the costs per square mile of drainage area incurred at other sites, and multiplying by the area over which they will be applied. Wetlands for the “low density” areas were estimated to cost $420,000 per square mile of drainage area, for a total cost of $420 million. Infiltration systems for the “high density” areas were estimated to cost $3.7 million per square mile of drainage, for a total cost of $3.7 billion. More sophisticated treatment BMPs (such as sediment traps and oil adsorbers) for the “extremely dense” areas were estimated to cost $33 million per square mile of drainage, for a total of $1.7 billion. Thus total new facilities costs are $5.8 billion.
• A second method for estimating structural BMP costs utilized costs per acre-foot of
retention capacity as determined by the Los Angeles County Department of Public Works Sun Valley Project. Presuming that runoff from a ¾-inch storm must be captured in the low-density, high density, and extremely high density areas with runoff coefficients of 0.4, 0.6, and 1.0, costs are $53,000, $98,000, and $470,000 per acre-foot, respectively. The overall facilities cost estimate using this method is $4.0 billion.
Estimated Benefits
There are substantial benefits to the examined approaches that extend beyond the value of stormwater quality control. Reductions in pollutant releases will improve public health and neighborhood livability. Restoration of the hydrologic cycle will replenish groundwater reservoirs, reduce flood risks, and provide greenspace for recreation and wildlife habitat. It was determined that the total value of benefits from the alternatives for runoff quality control described will exceed the costs. Total benefits for the non-structural stormwater quality control programs in the Los Angeles Region are estimated at $5.6 billion. Implementation of the non-structural and regional measures throughout the Los Angeles Region would have benefits worth $18 billion. • Reduced need for flood control is expected to save about $400 million.
Appendix H Task B
9
• Property value increases from additional greenspace and bodies of water are expected to amount to $5 billion over the Los Angeles region.
• Additional groundwater supplies created by infiltration will have a current worth of about $7.2 billion.
• “Willingness to pay” surveys in similar circumstances suggest that the public amenity
value of avoiding stormwater pollution of local bodies of water is about $2.5 billion. • Cleaner streets are worth about $950 million. • Improved beach tourism will bring in about $100 million. • Preservation of the nature’s services in the marine coastal zone, such as nutrient
recycling and chemical maintenance of the atmosphere, is worth about $2 billion. • Reduction of sedimentation in local harbors will save $330 million. • Improvements in public health associated with reduced exposure to fine particles
from streets are likely significant, but could not be quantified. Recommendations for Immediate Action Municipalities that have the responsibility for meeting runoff quality regulations should take some immediate steps. • Outreach programs, explaining to citizens the need for runoff quality control and
discouraging illegal discharges such as littering, should begin. • Data should be collected on the stormwater discharges from subwatersheds to
determine what BMPs are workable, and general plans should be updated to include policies that promote stormwater control.
• An administrative structure should be established which includes the relevant
stakeholders and funding agencies for each watershed (such as watershed councils). • Funding plans should be developed. • Building codes that work against runoff quality control should be changed
immediately—in particular, all parking lots built from now on should also be stormwater infiltration systems.
• All new street cleaning equipment should be high-quality vacuuming systems.
Appropriate agencies should be encouraged to use the latest microbiological
Appendix H Task B
10
techniques to investigate sources of pathogenic organisms in runoff, so that mitigation efforts can be optimally designed.
Appendix H Task B
11
INTRODUCTION
This report identifies and analyzes alternatives for control of stormwater runoff in Los Angeles County. A recent, widely debated study entitled, An Economic Impact Evaluation of Proposed Storm Water Treatment for Los Angeles County projects extremely high costs for compliance with stormwater quality regulations (Gordon et al., 2002). These estimates followed from the study’s fundamental assumption that the only way to comply with water quality regulations is to capture most or all of the flow and subject it to advanced treatment, and to do so at rates equal to peak runoff rates. As this report shows, however, there are far less expensive approaches that, if implemented, can achieve high levels of compliance with current federal water quality standards.
A broad approach was taken: an evaluation was made of total costs and benefits for the region, including those for municipalities, businesses, and individuals. A complete solution to stormwater quality problems was considered—that is, the plan is intended to meet the requirements of the stormwater permit and Total Maximum Daily Load and provide acceptable water quality for the area. The recommendations for steps to be taken are not limited to the Los Angeles Regional Water Quality Control Board (LA Regional Water Board). Action by other governmental agencies will also be required. The study begins with a brief description of runoff sources and contaminants. A review of present federal and state regulations and regulatory policy to was done to determine whether advanced ultrafiltration treatment of the entire runoff flow will be required, or whether compliance can be achieved through the widespread adoption of the various “best management practices” (BMPs) more commonly used for runoff quality control. The study then identifies and analyzes alternative measures that can be employed to meet present federal and state water quality standards. Particular attention is paid to strategies that facilitate ground water recharge, source control measures, storm water detention and capture, and BMP treatment. While prevailing uncertainties make an overall cost estimate only approximate at this time, costs of specific approaches are illustrated with examples. Financial benefits, such as those regarding groundwater replenishment, more appealing beach environments, improved public health, and the creation of additional urban green space, are also addressed in the report. Clearly, water is a scarce resource in this region of the country, and economic evaluations of different management techniques for stormwater runoff must also consider the benefits of improved water quality and water supply as well as flood control. Prior to reviewing federal and state water quality regulation and policy, this study provides an overview of more general policy and regulation theory.
Runoff
The bulk of urban runoff is generated during rainfall events, and can properly be termed stormwater. This flow is extremely irregular, especially in Southern California, where most days are dry, and measurable rain occurs on average of only 32 days per year. Total rainfall in the area is modest, averaging about 16 inches per year. A large storm in this area might drop as much as three inches of rainfall in 24 hours, but this is
Appendix H Task B
12
still much less intense than typical rainfall events in other states, such as those on the East Coast.
Even so, high flows and flooding do occur in Southern California because of the topography. Water from large watersheds drains into local rivers, and slopes are steep, so that rainfall is rapidly collected and concentrated.
Water also enters the storm drains from non-rainfall sources. Sprinklers left on overnight, car washing, and hoses used to clean sidewalks and driveways generate smaller streams sometimes called nuisance flows. These flow in the storm drain system all year, and with residual stream flows (and in a some areas, recycled wastewater), constitute dry-weather flow. The terms “stormwater” and “runoff” are often used interchangeably. However, it is important in some cases to recognize the difference—stormwater arrives suddenly in huge amounts, while nuisance flows are much smaller and run all year.
Urbanization of the landscape substantially changes the amount and composition of runoff. Because less water infiltrates (percolates) into soils, the total amount of runoff is increased. Because the water runs off pavement more rapidly, it is concentrated to make peak flows higher. Recharge of groundwater is reduced, and the shallow groundwater that feeds some streams dries up, so surface flows decrease in some areas. Surface flows may increase during dry weather in other areas because of nuisance flows from over-irrigation and car washing. In general, the storage and buffering effects of soils and groundwater reservoirs are reduced. Runoff flowing through vegetation, or entering and leaving shallow groundwater, is subject to the effects of filtration and biodegradation, which has a considerable purifying effect. Water runoff from pavement is not cleaned, and indeed is contaminated by whatever dirt and pollutants are on the pavement.
Pollutants
The cities of Southern California use “separate” systems, meaning stormwater is collected apart from the wastewater generated by toilets and showers. The wastewater enters a closed network of pipes and is carried to treatment plants. Stormwater may initially flow in underground conduits, but eventually passes to open flood control channels, rivers, and the ocean. This storm water drainage system is called a Municipal Separate Storm Sewer System (MS4). Runoff pollutants are different in nature from those in sewage. Pathogens are present, but in far smaller concentrations, as are nutrients such as phosphorus and nitrogen. There may be more petroleum hydrocarbons, dust, sediments, and settled air pollutants in runoff, but total organic content in runoff is usually much lower than in wastewater.
The pollutant load of stormwater varies greatly with location. The water contains pollutants that wash off rooftops, parking lots, industrial facilities, and the streets. Pollutants may also be discharged illegally, when individuals pour motor oil into the storm drains or industries release toxic pollutants.
Water flowing in the streets picks up trash, dust, dirt and other materials that have been deposited on the pavement. The dust includes fine particles of rubber from tire wear, settled air pollutants, trace metals from brake pads and other mechanical sources, and pet feces. Cars drip motor oil onto the pavement and the early flows of fall may carry a petroleum sheen.
Appendix H Task B
13
Stormwater quality protection measures may be placed in three general categories. Infiltration allows percolation of the water into the ground, relying on the soil to remove pollutants from the replenishing groundwater and eliminating the discharge to runoff. Source control measures prevent the release of pollutants, so that the water is never contaminated. Treatment systems remove the pollutants from the stormwater before it reaches the ocean.
Runoff Sources and Quality
Stormwater and runoff come from a great variety of sources and carry a varied suite of pollutants. There are many approaches to the task of protecting receiving waters, and the best choice depends on stormwater source and quality. Runoff from a residential area of single-family homes, for example, is unlikely to carry industrial pollutants, but may have small amounts of oil and grease from roads, microbiological contamination from pet feces., and dissolved nutrients from fertilizers. These are readily removed by filtration in soil, so groundwater recharge, with its additional benefit of replenishing aquifers, is a good choice. Runoff from construction sites is less likely to carry harmful microorganisms, but may have heavy loads of sediment. The best choice here is to use dikes, detention ponds, and other measures to allow the sediment to settle out of the water before it is percolated to groundwater or released to storm drains. The dispersed and difficult-to-control pollutants of urban commercial areas may best be dealt with by providing regional solutions, such as parkland designed to serve simultaneously as a flood control basin, a groundwater recharge site, and a sedimentation basin for large amounts of water.
Streets Streets, particularly those in dense commercial areas, are the most difficult source
of urban runoff to manage. They receive litter, dust and dirt, air pollutant particulates, pet feces, occasional human waste, trace metals and oil from cars, various illegal discharges, and other pollutants. Because they are the first part of the stormwater collection and transport system, they receive and pass on pollutants that are carried away from parking lots, commercial establishments, and industries.
Exposed Commercial Activity Manufacturing and other commercial activities, even those dealing with
hazardous materials, have no effect on stormwater quality if the work is carried out under cover. However, for some large-scale activities, such as oil refining, this is not practical. Rain falling on machinery, materials, or contaminated surfaces can pick up pollutants. Measures can be taken to cover individual activities, or treatment systems can be installed to clean the water before release.
Construction Sites Frequently, the first step taken in construction of new facilities is to clear the land
of vegetation and pavement. The exposed soil is highly vulnerable to erosion by rainfall, and the movement of trucks and machinery can “track” soil to the adjacent streets.
Residences Single-family homes are a source of some pollutants. Roof runoff will contain
dust, bird feces and settled air pollutants. Runoff from gardens may contain pesticides
Appendix H Task B
14
and fertilizers. Occasionally, homeowners will (illegally) dispose motor oil or paint waste into storm drains. For the most part, however, runoff from neighborhoods of single-family homes is relatively less polluted (if household toxics such as pesticides are properly used). Multiple-family residences produce many of the same pollutants, but typically have a higher ratio of rooftop and impervious surface to permeable landscaping, so that more water runs off.
Commercial Rooftops Roof runoff from commercial facilities may be slightly polluted with air pollutant
dusts, bird droppings, hydrocarbons from roof tar, and occasionally, some trace metals from rooftop machinery. The contaminants present may be very similar to those found on residential roofs, but handling the runoff may be more difficult because commercial areas have a high ratio of roof area to land area, and often have little landscaping.
Parking Lots and Landscaping A significant fraction of urban land is devoted to parking lots. Parking lots are
commonly polluted by litter, heavy metals from auto-parts and road wear, and by oil leaking from cars. Spilled food is present near establishments that sell food, and pet feces, bird droppings, and settled air pollutants will also be present, and all of these can be washed away in the runoff. Virtually all parking lots are designed for rapid drainage to the street or storm drain. Indeed, where grass or other plantings are present, these are commonly surrounded by curbs that prevent flow of the water from the lot into the soil. Many designs, in fact, promote runoff from the vegetation to the pavement.
Appendix H Task B
15
ASSESSMENT OF REGULATORY POLICY
Overview of Policy and Regulation Theory
This report, in identifying and assessing BMPs, takes a strategic regulatory planning approach to managing stormwater runoff in Los Angeles County. Strategic regulatory planning involves a close examination of the legislative goals concerning the given policy. The ultimate end of strategic regulatory planning is to control behavior through methods that agree with legislative goals and societal values regarding the issues at hand. Thus, a strategic approach demands careful consideration first of whether enforcement is appropriate; and second, if enforcement is appropriate, to what degree should the parties involved be pressured to comply; and third, how coercive should the regulatory devices be? Compliance with existing laws and regulations, in this case the provisions of the federal Clean Water Act and state law, is a major goal of the strategic regulatory planning process.
How compliance is defined can vary markedly depending upon the actors involved and the policymaking context. In this sense "compliance" means the degree to which members of a target group conform to the directives of an agency, court, legislative body, or some other governmental agency. One way to determine whether members of a target group are in compliance with an environmental law is to monitor levels of pollution on a regular basis. We assume that the greater the number of individuals and firms that are in compliance with rules, the more likely pollution will decrease in a given locality.
When legislators pass laws, they generally expect them to be vigorously enforced and fully obeyed. Only idealists, however, actually believe that this is possible or even necessary in all cases. Political and economic factors usually force policymakers to take a more realistic approach to enforcement by setting a desired and attainable level of compliance prior to program implementation. At this stage, policymakers must consider whether 100 percent compliance is necessary. If not, they must determine what degree of compliance is needed in order to meet environmental quality goals. While the desired degree of compliance is often only a rough estimate, several factors must be kept in mind. Policymakers must take into account, for example, the extent to which members of a target group are making a “reasonable” effort to change their behavior and follow the law.
If it is either unrealistic or undesirable to aim for total compliance on the part of the target population, a clear decision rule must be formulated concerning enforcement priorities. In a policy area where polluters vary a great deal in size and how much they pollute, for example, it is commonly most prudent to concentrate enforcement efforts on the largest polluters. If firms are roughly the same size and pollute about the same amount, however, alternative guidelines for identification and discrimination must be set. For example, will businesses be selected randomly for monitoring and inspection? Is systematic enforcement, perhaps based on location, possible? Or, is self-regulation the preferable approach? The decision rule should relate to the strategic goals, resources, and motivations of all those involved. Further considerations include the legal authority
Appendix H Task B
16
for enforcement, the resources of the enforcement agency, and the fragmentation of the enforcement agency (or agencies).
In the ex post review/revision stage, policymakers determine the effectiveness of the regulatory program after it has been implemented. Feedback and evaluation are used to assess program performance. Legislative goals are used as a guide in determining whether regulatory approaches are succeeding or failing.
If policymakers determine that the program goals are still desirable, they will continue the same course of action. If they determine that the goals are being met, they will either maintain present enforcement levels or perhaps decrease enforcement efforts. The latter decision should only be made if policymakers believe they can save time and money and feel reasonably certain that compliance rates will not suffer. Appropriate and immediate action is required, of course, if the objectives are no longer desirable or if the objectives are not being achieved. In nearly every case, the aim of policy revision will be improvement in compliance and environmental quality. According to Ingram, the implementation phase of a statutory program “should contribute toward policy improvement or the evolution toward more tractable problems for which there are more doable and agreeable responses.” (1990:476) Realization of the statutory goal, therefore, is not the only way to gauge the success of program implementation.
The conceptual perspective for the selection of BMPs analyzed in this report relies on Lowi's (1964) policy classification scheme, with further elaboration by Salisbury (1968). Lowi classifies policies as distributive (non zero-sum policies in which nearly everyone benefits), redistributive (policies that approach zero-sum, in which some benefit and some lose), and regulatory (policies that also tend toward zero-sum, and in which government prescribes rules of behavior for particular groups). Salisbury added a critical dimension to Lowi's typology by identifying self-regulation policies as a fourth policy type. Self-regulation policies are frequently offered as a noncoercive alternative by sectors of society targeted for external regulation, and they are invariably non zero-sum. These policies also impose constraints upon a group, but are perceived only to increase, not decrease, the beneficial options to a particular segment of the population.
Under this classification scheme, policies are either self-regulatory or regulatory. Thus, the Lowi and Salisbury typologies suggest that regulatory policies are either noncoercive (through self-regulation) or coercive (through direct command-and-control regulation). In the real world, however, regulatory devices tend to fall at different points along a continuum of coerciveness. In other words, devices intended to control behavior tend to vary according to their restrictiveness. Non-coercive approaches (through self-regulation) occupy one end of the continuum while coercive approaches (through direct command-and-control regulation) occupy the other end.
Conceptualizing regulation in these terms provides water quality policymakers a flexible framework in which to assess alternative regulatory mechanisms. Water quality policymakers have a menu of regulatory approaches from which to choose, and careful thought must be given as to which regulatory devices are best suited to control stormwater runoff without being unnecessarily harsh. If members of the target population (e.g., citizens, small businesses, municipalities, etc.) unanimously believe that stormwater regulations and deadlines are too restrictive and unfair, they will likely ignore what they are being told to do. At the same time, if regulatory devices are too weak and not sufficiently coercive to lead to improvement in water quality, then efforts to control
Appendix H Task B
17
stormwater runoff will fail. Water quality policymakers, therefore, must be familiar with the target population and possess considerable information before they select the most appropriate regulatory mechanisms that embody the level of coercion necessary to achieve an optimum degree of compliance.
Cost is a second dimension that characterizes regulatory mechanisms. Cost here refers to the amount of money government must spend to administer a particular regulatory approach (cost to the regulated community will be considered later). In general, the most coercive activities (e.g., imprisoning polluters) require the greatest government involvement and therefore are more expensive to administer than the least coercive activities (e.g., economic incentives). Limited government revenues obviously make this an important variable. This is especially the case in current government efforts to control stormwater pollution.
The total cost and coerciveness of the selected regulatory program represent the overall government effort necessary to attain compliance and control water pollution. Compliance can be achieved in varying degrees and is best conceptualized along a continuum ranging from avoidance to adherence. Under optimal conditions (e.g., a harmonious political environment), policymakers will be able to use the least coercive enforcement techniques (e.g., reporting by firms and municipalities and formal compliance tracking) at the least cost to achieve full compliance. The expectation is that least coercive mechanisms are always preferable to more coercive mechanisms if only because the former devices are more cost-effective. In contrast, extremely restrictive enforcement arrangements (e.g., court injunctions) will necessitate direct government involvement and thus require substantial cost. Under ideal conditions, therefore, policymakers will select regulatory devices that are the least coercive and least costly and that lead to compliant behavior.
Unfortunately for policymakers, optimal conditions are rare. Many times the conditions that do exist (e.g., a lack of agency funds or a small staff) tend to diminish the effectiveness of the least coercive approaches, often to the point where the outcomes are in danger of moving toward avoidance behavior. In order to prevent outcomes from moving in this direction, policymakers must select techniques, either singularly or in combination, that are affordable and sufficiently coercive to produce compliant behavior.
Naturally, policymaking is a dynamic process and circumstances tend to change over time. Decision makers are continuously gauging the potential impact of given conditions on regulatory mechanisms and making adjustments as they see fit. Eventually, they may be forced to adopt expensive and restrictive approaches that will result in compliant behavior in an attempt to prevent outcomes from moving toward avoidance behavior. When accurate information is available and incorporated into deliberations, policymakers usually will achieve the greatest level of compliance possible with the least effort and expense regardless of the conditions that exist at the time. This underscores the importance of obtaining the most accurate data available as changes occur over time.
In a pluralist, multi-level system like the United States, some communities may favor avoidance behavior in the face of unpopular regulations. While such situations may arise from time to time, in most cases policymakers will want their regulatory devices to achieve the highest level of compliance possible under given conditions.
Appendix H Task B
18
Stormwater Regulation and Regulatory Intent The federal Clean Water Act utilizes two approaches to managing water quality: technology-based requirements and national water quality standards. Section 303(d) of the Act integrates these two approaches by stipulating that states make a list of water bodies that are not attaining standards after the technology-based rules are implemented. For water bodies on this list, as well as where the U.S. Environmental Protection Agency (EPA) Administrator believes appropriate, the states are to formulate TMDLs which must account for all sources of the contaminants that forced the listing of the water bodies. Under federal law, TMDLs must account for contributions from point sources (federally permitted discharges) and pollution from nonpoint sources. The U.S. EPA must review and approve the list of contaminated waters and every TMDL. In the event that the U.S. EPA does not approve the list of impaired water bodies or a TMDL, the Agency must establish them for the state. (www.swrcb.ca.gov/tmdl/background.html, July 15, 2003)
The Clean Water Act does not specifically require the adoption of TMDLs. Instead, Section 303(d), Section 303(e), and their provisions stipulate TMDLs be included in water quality plans. The U.S. EPA has adopted rules (40 CFR 122) requiring that the National Pollutant Discharge Elimination System (NPDES) permits be modified to be consistent with all approved TMDLs. An NPDES permit outlines specific limits of pollution for a particular discharger. Nearly all the states, including California, are permitted to administer the NPDES permit program. (U.S. EPA administers the permit system in the remaining states.) Implementation plans are to be formulated along with the TMDLs.
California Law California effectuates the provisions under the Clean Water Act principally
through institutions and procedures set out in certain provisions of the California Water Code, including those of the California Porter-Cologne Water Quality Control Act. These provisions established the State Water Resources Control Board (SWRCB) within the California Environmental Protection Agency to develop and implement state policy for water quality control.
The Porter-Cologne Act also established nine California Regional Water Quality Control Boards that operate under the authority of the SWRCB. Each Regional Board is comprised of nine members and an executive officer appointed by the members of each board. The Regional Boards develop and adopt water quality control plans for all areas within their region. The SWRCB formulates, adopts, and revises general procedures for the development, adoption, and execution of water quality plans by the Regional Boards. It reviews these plans and either approves them or returns them for revision and resubmission. Water quality plans do not become effective until the SWRCB endorses the plans, followed by approval by the California Office of Administrative Law.
The Evolution of Water Pollution Control During the 1970s, policymakers considered point source pollution to be the
biggest threat to the water quality of the nation’s inland lakes, rivers, and streams. (www.swrcb.ca.gov/tmdl/background.html, July 15, 2003) The Clean Water Act established a number of programs to address point sources of pollution, and most federal money went to formulate and implement point source controls. California pursued the same approach in its effort to improve the state’s water quality. In addition, the State and
Appendix H Task B
19
Regional Boards implement smaller scale corrective actions for nonpoint source pollution as permitted under the Porter-Cologne Act.
A major goal of the Clean Water Act was to expand treatment of wastewaters. According to Rosenbaum (2002), all treatment plants in operation before July 1, 1977 were required to have “secondary treatment” levels. All treatment facilities, regardless of age, were required to have “the best practicable treatment technology” by July 1, 1983. The Act also appropriated 18 billion dollars between 1973 and 1975 to assist local communities in building necessary wastewater treatment facilities. The federal government paid for 75 percent of the capital cost for building the new facilities. Programs focusing on treatment facilities resulted in significant improvements in water quality by the late 1980s.
Concerns over the nation’s water quality arose again due to the growing impacts of nonpoint source pollution, and environmental groups looked to the TMDL requirements to ameliorate continuing water quality problems. A series of lawsuits ensued to force regulators to adopt an aggressive approach to TMDL development. Thus far, over 40 lawsuits have been filed throughout the nation, most of them by environmental groups. (www.swrcb.ca.gov/tmdl/background.html, July 15, 2003) The lawsuits are commonly filed against the U.S. EPA due to its responsibility to approve TMDLs. Several of them have led to negotiated settlements and consent decrees that are overseen by the courts. At present, California is operating under three consent decrees covering most of the North Coast Region, the entire Los Angeles Region, and Newport Bay and its tributaries in the Santa Ana Region.
TMDLs in California are established either by the Regional Boards or by the U.S. EPA. Those established by the Regional Boards are designed as Basin Plan amendments and include implementation rules. Those formulated by the U.S. EPA normally contain the total waste load allocations as required by Section 303(d), but do not include extensive implementation rules, primarily because U.S. EPA implementation of nonpoint source pollution control strategies are generally confined to education and outreach in accordance with CWA Section 319. (www.swrcb.ca.gov/tmdl/background.html, July 15, 2003) Presently, TMDLs are required for all waters and pollutants on the 303(d) list and must consider and include allocations to both point sources and nonpoint sources of contaminants. The limitations in a TMDL may be other than “daily load” limits. There also can be multiple TMDLs on a specific body of water, or there can be one TMDL that focuses on many contaminants. Current examples of TMDLs in the Los Angeles Region include the trash TMDLs for the Ballona Creek and Wetland, Los Angeles River Watershed, and East Fork San Gabriel River, and the wet-weather bacteria TMDL for the Santa Monica Bay Beaches. At this time the Section 303(d) list contains over 1,400 water body/pollutant combinations. Based on this list, the State Board estimates that about 800 TMDLs are needed. The Regional Boards are now developing over 120 TMDLs, with several addressing multiple pollutants. (www.swrcb.ca.gov/tmdl/background.html, July 15, 2003)
Concerns over implementation have become a significant issue in the formulation of TMDLs. (www.swrcb.ca.gov/tmdl/background.html, July 15, 2003) Although these concerns generally fall outside the provisions of Section 303(d), they are nevertheless important to achieving water quality improvements as a result of the establishment of TMDLs. While it is possible to conduct technical assessments of total load without
Appendix H Task B
20
considering implementation issues, one must address the possible mechanisms by which pollution can be reduced in determining allocations to various sources. Considering different implementation options can help analysts avoid adopting allocation schemes that are far more costly than necessary or, even worse, unachievable. The TMDL strategy in California seeks to engage the public and cultivate an understanding of watershed issues. It relies on an adaptive process that matches management capabilities with scientific knowledge and information.
The Stormwater Permit The Los Angeles Regional Water Quality Control Board (LA Regional Water
Board) has adopted a NPDES permit containing waste discharge requirements for MS4 discharges within the County of Los Angeles (with the City of Long Beach excluded because it is covered under a separate MS4 permit). The main intent of the Permit is to reduce significantly the amount of various pollutants contained in stormwater runoff. The County of Los Angeles has identified seven critical industrial and commercial sources of contamination: 1. wholesale trade (scrap recycling, automobile dismantling), 2. automotive repair/parking, 3. fabricated metal products, 4. motor freight, 5. chemical and allied products, 6. automotive dealers/gasoline stations, and 7. primary metal products. The priority industrial sectors and automobile repair facilities/ gas stations (two of the commercial sectors) on the list contribute substantial concentrations of heavy metals to stormwater. Overall, the Permit is intended to establish and implement a timely, comprehensive, cost-effective stormwater pollution control program to reduce the discharge of pollutants in stormwater to the Maximum Extent Practicable (MEP) from the permitted regions in the County of Los Angeles to the waters of the U.S. subject to the jurisdiction of the Permittees and also meet water quality standards. BMPs must be identified and implemented to reduce the discharge of pollutants in stormwater to the MEP and also meet water quality standards.
The Permit has established an iterative process that allows municipalities in Los Angeles County to measure noncompliance, test alternative BMPs, and consult County and regional water quality authorities. Thus, the Permit provides a mechanism to make adjustments to the required BMPs as necessary to ensure their adequate performance. According to the U.S. EPA, “Water quality-based effluent limits for NPDES-regulated stormwater discharges that implement wasteload allocations in TMDLs may be expressed in the form of BMPs under specified circumstances….If BMPs alone adequately implement wasteload allocations, then additional controls are not necessary.” (U.S. EPA, Memorandum, November 22, 2002, p.2)
Regulatory Mechanisms
Pollution control regulations can range from programs that prescribe very specifically what the regulated community is to do, to programs that only set goals and leave the community to find the best methods to reach the goals. Programs of the first kind are often criticized by the regulated community for lack of flexibility—the standard complaint is “This approach does not work well for our particular case. We could do this in another way and accomplish the goals for a lower price”. Programs of the second kind provide flexibility, but are often criticized for vagueness: “We don’t know how to do this. We are not sure what we have to do to come into compliance”.
Appendix H Task B
21
The stormwater management program is clearly of the second type, and it should be so. Stormwater quality control is an extremely complex issue, influencing, if not everything under the sun, then everything under the rain. The best means of compliance will certainly differ from city to city, depending on land uses, land prices, and a host of physical characteristics of the landscape. It is likely that, as the nation engages the problem, new approaches will be developed. Entrepreneurs will develop new devices and methods as others are tried and discarded. Strict specification of methods at this time might well eliminate approaches that are more economical and effective, so a flexible approach is best.
However, an inevitable side effect of maintaining flexibility is that the regulated community faces an unsettling level of uncertainty. Mayors and city councils faced with planning future infrastructure and future budgets are understandably uncomfortable facing mandatory water quality goals without specified means of reaching those goals. This level of uncertainty will decline as plans are developed and experience with water quality control measures accumulates.
There is a historical precedent for this approach in the program for control of air pollution in Southern California. Like stormwater pollution, it is generated by a very large number of sources with varying compositions and emissions rates. Many of the sources are difficult to monitor and regulate. Implementation of pollution controls has been accompanied by intense political controversy. Even so, air pollution control efforts have been relatively successful—pollution levels and their associated health effects have declined. While costs have been high and some high-polluting marginally profitable businesses have closed or left the area, it is also clearly true that the economy of the area has not collapsed, as some predicted. Few people would suggest that we should return to days when taking a deep breath was literally painful.
Policy Implementation
Our research indicates that the LA Regional Water Board is strongly committed to abating pollution from stormwater runoff as effectively and inexpensively as possible. The U.S. EPA supports the LA Regional Water Board’s efforts to require individual municipalities in Los Angeles County to adopt necessary BMPs to control stormwater runoff. Federal and state policymakers along with environmental group leaders believe that BMPs, if widely and strategically implemented, can significantly reduce stormwater pollution and improve water quality throughout Los Angeles County. Given the proven effectiveness of BMPs in different areas of the country (and the world), the LA Regional Water Board does not envision the need to build new advanced treatment plants throughout the region, and indeed has expressed the specific intent that such plants should not be required. Advanced treatment is viewed as an absolute last resort given the huge expense it would entail and the confidence policymakers and environmental leaders have in the ability of BMPs to reduce pollution significantly and allow the region to meet federal clean water standards. The authors of this report concur with this position. Some municipal leaders in Los Angeles County have asked why they should be forced to adopt BMPs when there is a possibility that advanced wastewater treatment plants will ultimately be required. Even if advanced treatment plants are necessary in the future, which is highly unlikely, the adoption of BMPs will dramatically reduce the amount of water and the mass of pollutants these plants will treat. This will reduce pollution
Appendix H Task B
22
treatment costs and improve the effectiveness and ability of plants to handle large volumes of water during heavy rain periods. That is, BMPs will be used as part of any program to build advanced treatment plants because the much cheaper BMPs will reduce the costs of the very expensive advanced treatment plants. Implementing BMPs now will be a good investment even in the unlikely event that an advanced treatment plant is required.
The LA Regional Water Board has focused some efforts on reducing trash in stormwater runoff, and it has adopted a “zero trash” rule to achieve this goal. The Board does not expect all communities to eliminate every single piece of trash from inclusion in stormwater runoff. Instead, the Board policy is that communities in Los Angeles County make reasonable efforts to prevent trash from entering storm drains. “Trash” is defined as materials larger than ½ cm, so municipalities can comply with this regulation by installing ½-cm screening devices on their catch basins, by enforcing litter laws already on the books and by conducting street sweeping in areas where trash tends to accumulate. Public education about littering and the installation and maintenance of catch basin devices can provide substantial progress in preventing garbage from entering storm drains.
In order to avoid a costly court battle with state water pollution policymakers, the County and City of Los Angeles have recently agreed to spend $168 million to reduce by half the amount of trash that collects in the 51-mile-long Los Angeles River (McGreevy and Weiss, 2003). In addition, the City of Los Angeles agreed to drop its lawsuit against state policymakers over the overall plan to abate polluted stormwater runoff. The agreement settles a lawsuit filed by the city and county that opposed the LA Regional Water Board’s requirement to reduce trash entering the river 10 percent annually over the next 10 years. The LA Regional Water Board officials negotiated the deal, which requires the city and county to reduce rubbish going into the river and Ballona Creek 50 percent by September 2008, at which point state regulators will consider whether further rules are necessary. The agreement also provides local officials more flexibility in trying less-costly approaches of reducing trash. Environmental groups such as Heal the Bay, Santa Monica BayKeeper, and Friends of the L.A. River applauded the agreement. Rather than spend money on litigation, county and city officials will allocate funds to improve water quality.
Clearly, all communities in Los Angeles County will have to share the financial burden in helping to reduce contamination from stormwater runoff. This may require many communities to modify their budget priorities.
As long as communities make a reasonable, good faith effort to address stormwater pollution issues, it is unlikely that federal and state officials will take legal action. Thus far, this has been the case. Failure to make such an effort, however, will certainly result in legal action against violators. Moreover, environmental groups can choose to file lawsuits against federal and state officials if they do not continue to pursue polluters. Such action will lead to costly delays in meeting federal water quality standards and will likely lead to even more draconian measures given present federal and state law and previous judicial decisions.
Appendix H Task B
23
Previous Actions by the LA Regional Water Board
The impacts on water quality and the heightened risks to public health from MS4 discharges that affect receiving waters across the U.S. and in Los Angeles County and its coastline have been well studied and documented. Accordingly, the LA Regional Water Board has taken a number of significant actions to control such discharges (LARWQCB, 2001)
In 1990, the LA Regional Water Board adopted Order No. 90-079, the Los Angeles County MS4 Permit. That permit required the Los Angeles County Flood Control District, the County of Los Angeles, and the incorporated municipalities in Los Angeles County to implement stormwater pollution controls including updating ordinances, optimizing existing pollutant controls such as street sweeping, construction site controls, and others. The Regional Board required all Permittees to adopt at least 13 specific BMPs for consistency across the County. The 1990 permit was executed on a system wide basis due to the highly interconnected storm drain system serving a population substantially larger than 100,000 residents. At this point, the region was committed to MEP standards—cleaning up stormwater to the maximum extent practicable.
On July 15, 1996 the LA Regional Water Board issued Order No. 96-054 that updated the 1990 permit. The 1996 Los Angeles County MS4 permit required model programs be formulated and implemented by the Permittees for Public Information and Public Participation, Industrial/Commercial Activities, Development Construction, Illicit Connections and Illicit Discharges, Public Agency Activities, and Development Planning. These model programs will change with time as more data on stormwater impacts are collected and become available.
On January 31, 2001 the Los Angeles County Department of Public Works formerly requested to renew their MS4 permit in the form of an ROWD for the County of Los Angeles and the incorporated cities, except the City of Long Beach. This request began the process of reissuance of the permit, which entered into its third permit term. On the same day the Los Angeles County Flood Control District submitted an ROWD. The Regional Board staff invested considerable time and effort in providing opportunities for public participation and comment. Over 30 meetings, two workshops, and many outreach activities were conducted to allow the public, Permittees, and other interested parties enough opportunity to participate in the development of permit requirements and language prior to consideration by the Regional Board for adoption. The reissued MS4 permit committed the region to meeting water quality standards based on the State Water Resources Control Board’s precedential Orders.
Implementation of the MS4 permit requirements should reduce pollutants in stormwater in a cost-effective manner. The adoption of BMPs should also reduce pollutant discharges and enhance the quality of surface water.
The final steps of the regulatory process are now under way—TMDLs for the various impaired water bodies of the region are being promulgated.
Overall, it is clear that the LA Regional Water Board does not intend to require that municipalities build advanced treatment plants: indeed, they have publicly expressed the sentiment that they oppose this solution.
Appendix H Task B
24
Implementation of Regional Solutions
A regional infiltration and BMP treatment system, in combination with source control of trash, pesticides, and trace metals, can substitute for individual site controls on land parcels within the drainage area. This could take the form of “Local Equivalent Area Drainages”, implementing regional solutions that would achieve better results than the application of new source controls, which, in built up areas, will have significant effects only over the long term during which existing structures are rebuilt.
Funding for regional solutions may pose a challenge because of Proposition 13 and other restrictions on tax policy. The challenge however is not insurmountable if property-owners and voters become adequately informed and educated. Nevertheless, regional solutions may significantly shift administrative and cost burdens for water quality protection from businesses and development firms to local government.
Trading Schemes
“Cap and trade” systems, in which regulatory agencies set a cap on the amount of pollution allowable and allow trading of discharge rights within the constraints of the cap, have been successful in several fields. A group of municipalities, for example, might assign discharge rights to landowners within a watershed such that total releases meet the constraints of the TMDLs. They could then allow trading in the discharge rights, so that those who can reduce discharges at least cost are the first to do so, and the overall cost of meeting the TMDL is minimized. Municipalities themselves, as owners of parks and open space, might be able to develop regional solutions and fund them through sales of discharge rights to others.
Stormwater pollution control may be particularly amenable to this approach because the costs of control are highly site-specific. In many cases, there may be considerable economy in applying regional solutions in the best possible sites rather than controlling every site individually.
Appendix H Task B
25
DESCRIPTION OF ALTERNATIVE APPROACHES
Infiltration
Before the City of Los Angeles was established, most of the rain that fell in the region evaporated or percolated into the soil. The groundwater was continually replenished and runoff flows were small. As population grew, impermeable surfaces such as paved roads, parking lots, and rooftops covered more and more of the land. Residences, commercial facilities, and roads were designed to shed water as rapidly as possible. Historical measurements of discharges to the Los Angeles River at Firestone Boulevard indicate that runoff has increased from 5% to 45% of rainfall. This change adversely affected stormwater quality in two ways. First it increased the amount of stormwater flow, magnifying the cost of any measures to control quality (and also requiring ever more costly flood control measures). Second, water that flowed directly to streams and the ocean no longer benefited from the purifying action of soil and vegetation, which can remove particulates through physical filtering, sequester some chemicals by adsorption, and destroy organic and biological contaminants by biodegradation.
Any program for remediation of stormwater contamination should reverse this trend, reducing the load of both water and pollutants on other parts of the system. At the same time, pollution of groundwater must be avoided. However, infiltration will benefit from the very considerable capacity of soils to filter particles, adsorb contaminants, and biodegrade organic materials. A relative estimate of the magnitude of the problem may be made by comparison with examples of leaking underground storage tanks at gasoline stations. In many cases, spills of tens or hundreds of gallons of gasoline are now being handled by “intrinsic remediation”—allowing natural biodegradation to degrade the hydrocarbons. The acceptability of this approach has been supported by extensive research. Hydrocarbon infiltration with stormwater will involve far lower concentrations of hydrocarbon, and will mostly be the higher-molecular-weight compounds that are much less mobile in soils than gasoline.
We can also compare stormwater infiltration to the effects of septic tanks. These systems infiltrate sewage that has received only a modest degree of treatment. Yet they are still in use in the Los Angeles Region, and indeed are the primary waste disposal method for 15% of households in the U.S. Groundwater contamination from septic tanks has occurred, but most are considered effective and safe waste disposal systems.
This comparison suggests that the relatively low concentrations of pollutants in common stormwater, with appropriate controls on sources of specific contaminants, will not pose a significant threat to groundwater quality.
The permeability of soils in the Los Angeles basin varies from place to place. Beneath the Whittier Narrows spreading basins, for example, sand and gravel deposits allow very high rates of infiltration. In other areas, clay-rich soils reduce rates of infiltration. However, the historically low rates of runoff indicate that infiltration is capable of handling the bulk of the rainfall in the Los Angeles Region. Many areas routinely considered as having poor infiltration rates will never the less be useful as multi-purpose infiltration systems. A soccer field, for example, can be used as an
Appendix H Task B
26
infiltration basin at little additional cost, and will make a valuable contribution even if infiltration rates are low in comparison to those in spreading basins.
Source Control
Industrial Releases Industrial discharges can be controlled by a vigorous program of source
identification and control. Businesses have a fundamental responsibility to do their work without contaminating their neighborhoods, and in the great majority of cases can do so without significant interference with their activities.
Trash Management Many businesses and some homeowners contribute a disproportionate amount of
trash to the urban burden. Paper waste often accumulates in the parking lots of fast food outlets and strip malls, where it can wash into the street during rainstorms. Inadequate dumpsters and garbage cans are overloaded so that trash spills into the streets. Poorly covered trucks can allow trash to fly out on the streets. In addition, citizens throw trash from their cars onto the streets (it has been estimated that as much as 60% of trash on freeways by weight is cigarette butts). All of these practices are illegal, but enforcement is currently rare and weak. While perfect compliance with anti-litter laws is not expected, there could certainly be major improvements through enforcement. Much of the cost of such efforts could be recovered through fines, with the satisfying result that those causing the problem would be paying for cleaning it up.
Municipalities are responsible for the trash deposited on their streets, and most will respond by installing screens on catch basins. These are sometimes referred to as catch basin “inserts”. They will have half-centimeter openings and will be designed to collect trash during periods of low or modest flow, but to bypass the flow during heavy storms or if they are clogged. This will avoid local flooding that would be caused by clogging.
Street Cleaning Trash that escapes enforcement efforts can be collected by street cleaning before
it reaches the storm drains. Enhanced street cleaning is likely to be necessary as cities install half-centimeter screens on their catch basins. Trash that is now washed out of sight (at least until it reaches the beaches) will accumulate on the screens and possibly clog them. More effective and more frequent street cleaning will reduce this problem.
A major fraction of the pollutants in stormwater runoff are adsorbed on particles—this is particularly true of trace metals and pesticides, which are significant contributors to impairment of the receiving waters. Some of this particulate matter can be removed from streets by higher-quality street vacuuming equipment, which collects the dirt much as a vacuum cleaner does. This equipment is more expensive to purchase and operate, but it would make a significant contribution to reducing chemical pollutants in stormwater.
The Port of Seattle has tested high-quality street sweepers as a cleanup method in its container storage area (FHWA, 2003). The approach was successful, removing one-third to one-half of particulates and their associated pollutants. While the equipment is somewhat more expensive than simple sweepers to purchase, operations costs are about
Appendix H Task B
27
the same. The fine particles carry a significant portion of the pollutants, but they constitute only a small portion of the total mass of material on the streets, so their collection and disposal does not significantly increase costs. Such street cleaning may be more effective in Southern California, where the long dry season allows dust to accumulate for many months.
As explained in detail later, there would be substantial secondary benefits associated with improved street cleaning. Neighborhoods would look better, and residents would be exposed to less resuspended road dust, which dirties buildings and may have significant negative health effects.
Some investigators have also proposed street washing, using recycled water. If this were done during dry weather, and all of the dry-weather flow were being collected for treatment in wastewater treatment plants, street pollutants would be kept out of the rivers.
Pesticide Substitutions Many of the receiving waters in the Los Angeles Region are impaired by
pesticides, particularly Diazinon and Chlorpyrifos. The approach to this pollution should be the same as it has been historically for other pesticides that threatened environmental quality. None has ever been dealt with by treating contaminated waters. Those who use the pesticides should be responsible for ensuring that no water pollution results from that use. Pesticides that cannot be properly managed by appropriate use protocols such as labeling or use rules enforcement and which have an inherent tendency to persist in the environment should be banned. Pesticide controls are instituted by the state and federal governments, so additional political effort will be needed if a bans on specific compounds are required.
We presume that these pesticides are used in many cases because they are currently the most economical approach to insect control, and that substitution of another method would involve some cost. However, there are many possible alternatives, including use of more readily degraded pesticides, insect-resistant strains of plants, biological control with natural insect predators, and others. There are many examples of success with such integrated pest management (IPM), particularly at golf courses (NRDC, 1999). In some cases owners were pleased to find that costs actually declined when they switched from pesticide-dominated approaches to IPM.
Trace Metals Trace metals enter stormwater as rain drains from industrial operations,
transportation land uses, and other sources. Brake pad wear on cars produces a fine dust of copper. Zinc is released when galvanized equipment contacts the water. Trace metals in stormwater can be controlled by covering machinery and materials that release trace metals, by capturing and treating runoff from large industrial operations and transportation land uses, and by developing alternative materials for brake pads (research is currently under way on this objective).
Control of Automotive-Related Sources Motor vehicles and related facilities are the source of many types of runoff
pollutants, including hydrocarbons from oil and fuel leaks, and road wear. Vacuum street cleaning is effective in dealing with particle-bound hydrocarbons left on the street,
Appendix H Task B
28
and infiltration can effectively deal with hydrocarbons that are transported or deposited off the street surface.
Control of Bacteria Bacterial contamination in stormwater is typically measured as counts of
“coliform” bacteria, a category that contains many species of bacteria. While very few of the coliforms cause disease, some of these species are very abundant in human waste, and so detection of the group has long been used as a marker for sewage pollution. Efforts to interrupt the fecal-oral transmission of disease have commonly taken the elimination of coliforms from water as a surrogate for judging efforts to prevent the spread of the microorganisms that do cause disease. Where coliform counts in drinking water have been reduced (in much of the industrialized world) transmission of water-borne disease has indeed been largely eliminated. Thus the use of coliform counts as a marker for disease control has been remarkably successful. In some cases, a more specific test for “fecal coliforms” is used, because the test is an indicator of contamination by warm-blooded animals, including humans. While we have always counted coliforms, the real concern is pathogens—microorganisms that can cause disease. For sewage pollution, the association between the two has been strong, and controlling coliforms has been equivalent to controlling disease. The situation for stormwater, however, may be far more complex. Because there are many non-human sources of coliforms, it is possible that the test for their presence may be positive even when no human pathogens are present.
The sources of the coliforms found in stormwater remain uncertain. Pet wastes certainly include bacteria that test positive as coliforms, but the degree to which pet wastes constitute a disease threat is uncertain. Wild mammals, such as raccoons, possums, skunks and coyotes, may contribute when their wastes are left on paved surfaces. It has been proposed that fecal matter from homeless people denied access to restrooms may be a source, but there has been no study confirming this. In less developed areas with poor soil infiltration conditions, it is likely that poorly operated septic tanks and illegal disposal of gray water are contributing to the coliform counts detected in runoff. If septic tanks are the source, strict enforcement of waste control ordinances is appropriate. If homeless people are the source, provision of restroom facilities would be far cheaper than any imaginable stormwater treatment system (as well as being more humane). If pet feces are the source, the only approach is, through public outreach and enforcement, to press people to clean up after their pets. It must be expected, however, that such an approach will not be 100% effective. The contribution of wild animals seems uncontrollable.
Because the sources and significance of the coliform counts remain uncertain, it is important that research on the topic be pursued immediately. The recent development of genetic techniques for precise and rapid identification of bacterial species now provides the tool needed to provide the information needed to develop effective policies.
Coliforms, and presumably the associated human pathogens, are substantially reduced in treatment wetlands. Infiltration of course removes them from runoff flows, and adsorption on soils and biodegradation are effective at protecting groundwater. Water storage, because it holds coliforms in an environment for which they are not adapted, and because it allows settling of particles to which they may be attached, has
Appendix H Task B
29
some beneficial effect. Disinfection, using chlorine, chloramines, or ultraviolet light is possible, but relatively expensive.
Water Quality Control Board Rules allow for 17 exceedences of the coliform limit per year. There are about 32 days per year of significant rainfall in the region, so it has been anticipated that exceedences during the heavy winter storms will be difficult to control, and will be allowed.
Improved Enforcement
It is important that source control efforts include genuine and credible enforcement. Rules that are widely ignored, of course, will not help clean up runoff water, and a considerable fraction of runoff contaminants come from illicit discharges or disposal. Trash is an obvious example—littering is already illegal, so 100% of the trash in stormwater represents illegal release.
The Environmental Protection agency describes an example in which improved enforcement of existing law was effective (USEPA, 1999):
“…during a 12-month period, the Houston, Texas, Public Utilities Department identified 132 sources of discharges leading to Buffalo Bayou, the local drinking water source, with estimated flow rates ranging from 0.3 to 31.5 liters per second. Houston’s program involved monthly sampling from bridge crossings; analysis of samples for carbonaceous biochemical oxygen demand, ammonia and nitrate nitrogen, pH, TSS, DO, temperature, fecal coliform, and chlorine residual; comparison of samples to baseline flow concentrations; weekly sampling of temperature, dissolved oxygen (DO), and fecal coliform in stream reaches suspected of contamination; boat sampling to identify the contaminating outfalls along the reach; and, finally, a land-based search to pinpoint the source. Of the flows identified during the program, 85% were due to broken or clogged wastewater lines and 10% were due to illicit connections (Glanton et al., 1992). Eight months after an illicit discharge detection and elimination program began, fecal bacteria log mean concentration was reduced from 20,000 colonies/100mL to 2,000 colonies/100ml.”
Thus, in this example, a 90% reduction in bacterial contamination resulted from a careful enforcement program alone.
Detention and BMP Treatment
Stormwater Detention Basins Many of the problems of stormwater management are associated with its very
irregular rate of flow. During dry periods runoff flow rates are so low that the water can be handled by existing sanitary wastewater treatment systems. During rainstorms, the water comes so fast that municipalities have had difficulty doing anything beyond avoiding floods.
The first step toward dealing with this problem is to increase infiltration—substantial reductions in the peak flow rates are possible. The second approach is to provide storage systems that will hold water back during the peak flow periods. Detention basins will reduce peak flows, collect trash, provide quiet water for settlement of particles and their associated pollutants, and promote infiltration. Analysis of the
Appendix H Task B
30
National BMP Database (Strecker et al., 2003) shows that detention basins infiltrate an average of 30% of the water they receive.
The primary difficulty with this approach is the shortage of available sites to construct large reservoirs. The topography of the Los Angeles area does not include any deep canyons in lower reaches of the rivers that could easily be made into reservoirs. Moreover, virtually all of the land is already occupied by other uses and would accordingly be very expensive to acquire.
This means that detention basins must be conceived as a distributed network of smaller systems, with each serving multiple uses. A useful model is the Sepulveda Dam Recreational Area, which retains water during storms to prevent downstream flooding. For the great majority of the days in the year, the basin is mostly empty, and serves as a park and a wildlife refuge.
A rough estimate of the general feasibility of a regional-park-based approach can be calculated. The City of Los Angeles currently has about 5% of its area in parks (Wolch et al., 2002) and it is reasonable to presume that at least a similar fraction is park throughout the LA Region. Thus, moving the rainfall from adjacent developed areas to the parks would constitute concentration of the flow by a factor of 20 (20 acres of land would drain to 1 acre of park). If the runoff coefficient for the developed areas is 0.5, a rainfall of ¾ inch would thus put 8 inches of water in the parks. This is less than the 24-inch depth of flooding assumed for the stormwater parks planned in the Sun Valley project, suggesting that this approach is feasible on the large scale in terms of the amount of land required.
This calculation is quite approximate: the runoff coefficient is uncertain, and several other factors are poorly known. Never the less, the calculation suggests that a joint program could simultaneously provide the region with needed parks and needed stormwater infiltration capacity.
Sanitary Treatment of Dry Weather Flows During dry weather, small flows are present in the stormwater system as a result
of overwatering of lawns, car washing, and other discharges. This modest amount of water can be collected and passed through existing wastewater treatment plants, which commonly have more than enough excess capacity for this purpose. Because the dry season in Southern California is very long, this would prevent runoff pollution of the oceans for much of the year.
Where this is done, street washing with recycled water would be possible. Collecting and treating the contaminants during dry periods would leave the streets clean for the rainstorms, when the water cannot be collected.
Treatment Wetlands Wetlands remove many pollutants from the water that passes through them. The
low flow velocities allow sediments to settle, removing particulates and any pollutants that are adsorbed on them. Algae and rooted plants absorb nitrate and phosphate as they grow. Vigorous microbiological activity degrades organic chemicals, as microbial predators consume disease organisms. These observations suggest that wetlands can be constructed to serve as treatment systems for stormwater and dry weather runoff. While this approach requires dedication of land, it has the considerable secondary benefit of providing riparian wildlife habitat and esthetic values.
Appendix H Task B
31
A system of treatment wetlands has been designed for the San Diego Creek Watershed that drains to Newport Bay, in Orange County, California. The system will serve an area of 120 square miles, and is expected to cost in the low tens of millions of dollars. It is expected to meet the low-flow nitrogen TMDL, the phosphorus TMDL during most years, and the fecal coliform TMDL during low flows.
A similar system has been constructed to provide stormwater quality protection for the Ballona Wetlands Watershed in the City of Los Angeles.
BMP Treatment of Flows from Problem Watersheds such as Industrial Areas If source control is not successful for some industrial areas, it may be necessary to
collect the runoff water and use more sophisticated BMP treatment. These might best be constructed as private facilities serving a consortium of local industries, and funded by them for the purpose. A public/private partnership could be created, perhaps with public loan guarantees. Past experience with business improvement districts could serve as a model.
Partial Treatment in Curbside Units Many proprietary devices have been developed for treatment of runoff as it enters
curbside catch basins. These generally remove trash from the flow, and may also collect sediments. Some include adsorbants to remove hydrocarbons and trace metals. They have the disadvantage that they are designed to bypass during higher volume wet-weather flows. All require some degree of maintenance, and some are expensive to install. Trash and sediment must be removed on a regular basis, and adsorbants must be replaced when they are exhausted. Never the less, they may be useful for treatment of problem dry weather flows in specific areas, such as industrial or commercial zones.
Public Outreach and Education
Much of the pollution in runoff water arises from actions of individuals—litter is discarded in the street, for example, or pesticides are used carelessly in a residential garden. This pollutant load can be reduced by educating citizens and urging them to behave in a way that protects water quality.
An effort in Oregon, conducted by the Tillamook Bay Rural Clean Water Project, was made to educate local farmers about the steps they could take to protect local streams. This involved personal visits, tours of successful BMPs, newsletters, and presentations (USEPA, 1999). Four years after the program began, bacterial concentrations dropped 40% to 60% in Tillamook Bay and 50% to 80% in local rivers. Thus in some cases significant progress can be made at very low cost through public education.
Good Housekeeping for Municipal Operations
While the behavior of individual citizens may be difficult to control, municipalities have far more control over their own operations. Efforts can be made to avoid careless use of pesticides and fertilizers on municipal facilities. Such steps have modest, but measurable impacts. An EPA report notes (USEPA, 1999):
“…the City of Bellevue, Washington, found that street cleaning three times a week removed about only 10% of urban runoff pollutants; catch basin cleaning
Appendix H Task B
32
twice a year was estimated to be about 25% effective” (Pitt and Bissonnette, 1984).
Combined Approaches for Stormwater Quality Management
A general classification of rainfall receivers and appropriate methods for dealing with runoff they produce is shown in Figure 1. While the approach it describes is quite general, and other mixes of alternatives are possible, it shows one set of measures that can be used to control stormwater pollution.
Streets
The first step in reducing pollutants on streets is to restrict pollutant discharges from adjacent properties. Source control measures should prevent the release of industrial pollutants and construction sites should be managed to contain sediments. Litter laws and pet dropping collection laws should be enforced, although it must be acknowledged that it is not possible to prevent these inputs entirely. To stop litter from entering the storm drains, cities should install half-centimeter screens on their catch basins. The use of such screens will require diligent street cleaning, to ensure that the drains are not blocked during storms. In Southern California, rains mostly occur during a well-defined season, and frequently weather reports give two or three days warning of major storms. Cities should develop contingency plans for rapid-response street cleaning when storms are coming, to minimize stormwater contamination and the chances of flooding caused by clogged screens.
In some areas, where runoff water quality is relatively good, the streets themselves might be used as groundwater recharge facilities, by converting unused alleys to park/detention basins or by using permeable pavements.
It remains likely, however, that much street runoff will be of marginal quality. For the immediate future, it is also likely that a major portion of runoff from other sources will be initially discharged to streets, so that efforts to make use of stormwater as a water resource will require collection, and a degree of treatment before infiltration.
In most cases, this can be done with regional solutions. Water from storm drains can be collected in detention basins and wetlands, where sedimentation and biological activity will reduce pollutant load, and groundwater recharge can occur. The detention basins will serve as parks during the greater part of the year when water is not present, and the wetlands will double as much-needed wildlife habitat.
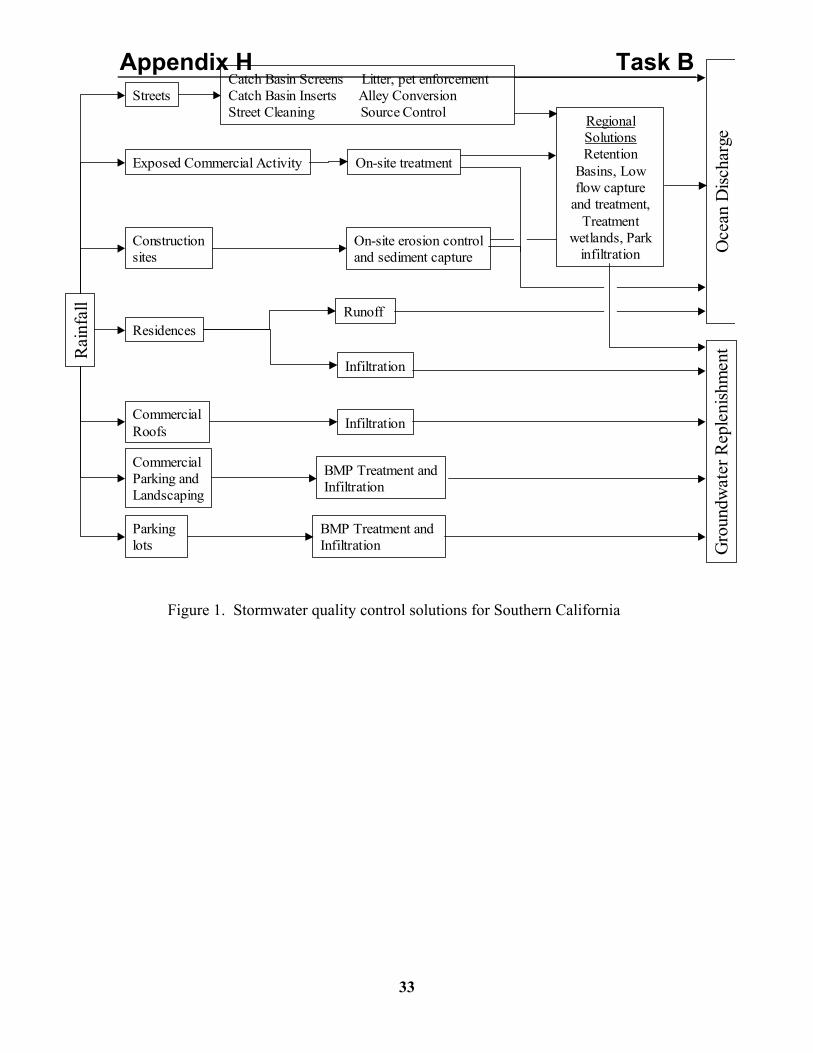
Appendix H Task B
33
Figure 1. Stormwater quality control solutions for Southern California
Residences
Streets
Parking lots
Constructionsites
CommercialRoofs
CommercialParking andLandscaping
Rai
nfal
l
Infiltration
Runoff
Catch Basin Screens Litter, pet enforcementCatch Basin Inserts Alley ConversionStreet Cleaning Source Control
On-site erosion controland sediment capture
Exposed Commercial Activity
Infiltration
On-site treatment
Gro
undw
ater
Rep
leni
shm
ent
BMP Treatment and Infiltration
BMP Treatment andInfiltration
Oce
an D
ischa
rge
Regional SolutionsRetention
Basins, Low flow capture
and treatment, Treatment
wetlands, Park infiltration
Appendix H Task B
34
Alleys for Public Use and Infiltration
Some alleys in urban areas are no longer necessary for access purposes. Indeed, many have become nuisance areas because of illicit trash disposal and criminal activity. Many of these could be gated and converted to small parks, with keys provided for local residents. They could simultaneously serve as infiltration facilities or as bioswales. There are currently 2.3 square miles of alleys in Los Angeles, for example. While many must be retained for access purposes, the fraction that could be converted could constitute a significant stormwater retention and infiltration resource. Alleys maintained for access might be candidates for partial or permeable pavements.
Similar approaches could be used for power line rights-of-way.
Exposed Commercial Activity
Very often the cheapest approach to stormwater quality control for exposed commercial activities is simply to cover them. Stormwater will thereafter come in contact only with the rooftop, and runoff will be much less polluted and more easily dealt with. However, for some large-scale activities, such as oil refining, it is not physically possible to provide a roof. For others, such as auto dismantling, the large area needed and the relatively low value of the activity may mean that a roof is not financially possible. Such facilities must be required to collect and treat runoff from their facilities, and indeed this is already being done in many cases. While there certainly are costs involved, it has generally proven possible, through a combination of better housekeeping, substitution of non-polluting materials, and simple on-site treatment processes, to solve these problems. Requirements for on-site treatment are advantageous because the cost of such treatment is borne by the business that produces the pollutant, providing incentives for conversion to less-polluting products and methods. Consequently, green manufacturing will become increasingly common.
Construction Sites
Release of sediments from construction sites can be ameliorated if the construction crew provides erosion control measures, such as maintaining vegetation or spraying exposed soil with polymer stabilizers, and an adequate on-site retention pond for rainfall, along with dikes, silt fences, and appropriate vehicle entrance construction to prevent runoff. Detention allows the sediments to settle out and the exposed soils can function effectively for groundwater recharge. It is anticipated that the costs of these measures will be small in comparison to construction costs. A more detailed list of best management practices for construction sites appears in Appendix I.
Residences
In most cases, homes and the surrounding landscaping have been designed to facilitate rapid runoff. It is necessary that water not pool in depths sufficient to flood houses, and ponding is viewed with irritation, even if it is harmless and temporary. However, single-family homes typically are surrounded with a significant area of land that could serve well for infiltration. Commonly, the land is planted or covered with
Appendix H Task B
35
grass. The runoff from landscaping and residential rooftops typically contains only small amounts of pollutants that are readily removed by percolation through the root zone.
Landscaping for the typical single-family home could be arranged to infiltrate all of the rainfall that it receives (except, perhaps, in the most severe storms). Lawns a few inches below surrounding sidewalks could serve as infiltration ponds, gardens could receive roof runoff, and downspouts could conduct runoff to dry wells. Because the water would have had very little contact with pollutants, such infiltration would be an excellent addition to groundwater resources.
However, very few residences are arranged in this manner and, indeed, building codes often specify features that promote rapid runoff to the street. Building codes should be changed to utilize single-family homes as recharge sites. It is anticipated, however, that the effect on runoff will be seen only slowly in built-up areas as old homes are gradually replaced. Retrofit of existing homes will be expensive and politically difficult, but for new construction, single-family homes could be made to produce essentially zero discharge at little or no additional cost.
Xeriscaping—planting with native and other drought-tolerant plants—can also help to provide space for water infiltration, and it reduces watering and therefore the chance of irrigation runoff. Such landscaping also requires less fertilizer and pesticide, and so reduces incidental contamination.
In many cases, cities may be able to take interim steps to reduce runoff from homes. They have control over the “city strip” land that lies between the sidewalk and the gutter. It would be possible to institute a program of replacing the lawns after minor excavation, so that these areas would lie below the sidewalk and curb and serve as runoff detention and percolation basins.
Where infiltration is not possible, much residential runoff may be acceptable for direct discharge to the ocean, as long as it is not contaminated first by passing through polluted streets. More contaminated water can be conveyed to regional water cleanup and recharge facilities.
Low-flow Treatment in Wastewater Treatment Plants
Wastewater treatment plants are built with excess capacity in order to handle
increased flow during rainy weather. While sanitary systems are designed to exclude stormwater, holes in manhole covers, leaks in piping, and illegal connections all allow the entry of some water during rainstorms. The flow is a very small portion of the rainwater, but can produce a significant increase in the much smaller sanitary flows—sometimes up to 50%. Treatment plants are designed with excess capacity to handle these peak loads.
This excess capacity can be used to treat dry weather runoff during periods when there is no rain. While these flows are not, by definition, stormwater, and indeed are governed by a separate set of regulations, dry weather runoff is often a significant contributor to impairment of receiving waters and its treatment would contribute to the objectives of stormwater control. It is also possible to use this capacity in concert with “street washing”. In this approach, tank trucks filled with recycled water could be used to wash the streets, particularly in the months before the first rain of the fall. Contaminants removed from the streets and drains by the washing would be treated in the
Appendix H Task B
36
wastewater plants, leaving the streets far cleaner when the rains came. At present, municipal street cleaning is a prohibited activity where it results in flows to the storm drain system.
This treatment approach for dry weather runoff could also treat runoff from small rainstorms.
It is likely that all of dry weather runoff could be treated for much of the Los Angeles Region. Such a step would eliminate essentially all runoff pollutants in the areas where this is possible. Because this approach uses capacity that is already in place, the cost for this alternative is low.
This approach would be particularly significant for control of coliforms. Sanitary treatment of dry weather flows would eliminate coliforms through much of the year. Rain occurs during only 32 days of the year, on average (Some of these storms are so small that the runoff could still be treated. On the other hand, untreatably high levels of runoff typically continue for a few days after a major storm). The LA Regional Water Board allows variances for 17 days of wet weather flow during the year. Thus it seems likely that dry weather runoff treatment at wastewater treatment plants, plus some degree of source control, plus the variances, will be sufficient to bring most areas into compliance with the bacteria rules. Further study, including some basic research on the sources of coliforms, is necessary to confirm this.
In considering the acceptability of this approach, it is important to note that beach use declines during wet weather, so that closures during the variance days would have a small effect on overall beach use and public health.
Capture and Use of Rooftop Runoff
In many cases, the pollutants from commercial rooftops, like those from residential roofs, could be readily removed by soil infiltration. With appropriate controls to avoid specific pollutants from commercial activities, roof runoff could be used for groundwater recharge. Designs exist for infiltration planters, in which the planter has high sides that allow it to function as a reservoir, and an open bottom that allows infiltrating water to pass into the soil. Risks of groundwater pollution could be mitigated through the use of biologically active and adsorbant soils. Commercial rooftops are commonly associated with large parking areas, which could be adapted for infiltration. Such efforts will be more difficult than those for homes, because most commercial facilities have a higher ratio of roof area to land area. In some cases it may be possible to store runoff for future irrigation use.
The Washington State Department of Ecology (2001) has developed a decision tree for dealing with downspout discharges. For lots larger than 22,000 square feet, it specifies either dispersion or infiltration systems for runoff. For smaller lots on suitable soil, infiltration systems are required. Where soils do not readily accept infiltration, surface dispersion may be appropriate. If water quality is good and infiltration and dispersal are not possible, disposal to the storm drains is accepted.
Parking Lots and Landscaping
Parking areas occupy a very large amount of land in Southern California, and accordingly represent a significant opportunity for improvement in stormwater
Appendix H Task B
37
management. Construction costs for parking lots are far smaller per square foot than those for buildings, so that alterations are cheaper. They are reconstructed more frequently, so that requirements applying to new construction or reconstruction will propagate through the parking lot inventory much more rapidly than those for buildings.
In most cases, parking lots could serve as sites for rainwater infiltration. Trash can be collected on grates and be disposed of properly by the lot owners. The curbs around plantings (which are often necessary to avoid damage to the plants from cars) can be slotted so that water passes through them to infiltrate in the planter soils. Planted areas must be below grade, so that they collect and temporarily store water, and could be expanded, utilizing more space where cars don’t actually park, such as the areas between and behind the parking bumpers. In some areas, permeable pavements could be used. Collected water could be passed to leach fields built under the parking lot.
An example of this sort of development is provided by the 6-acre parking lot of the Oregon Museum of Science and Industry (NRDC, 1999). It had originally been proposed as a traditional design, with water draining to catch basins, storm drains, and eventually the Willamette River. At the request of the Portland Bureau of Environmental Services, it was redesigned to use vegetated medians and landscaping as swales and linear wetlands. The parking lot is now able to infiltrate the water from a storm of 0.83 inches in 24 hours. Overall construction costs for the revised design were actually lower, because of the reduced costs for catch basins and drains.
Pervious pavements have also been developed so that even the space where cars are parked can be used for infiltration.
There is some concern over whether infiltration from parking lots will pollute underlying aquifers. Sediments, hydrocarbons, and trace metals are likely to be present in parking lot runoff from ordinary commercial establishments. But all of these are generally well retained on soils, particularly if the soils are selected to serve this purpose. Adsorbent materials might be added as a surface layer, to further retain hydrocarbons and trace metals.
It will be necessary to develop new guidelines for parking lots. The public and lot owners will not tolerate flooding that requires them to wade to their cars, so detention and infiltration systems will have to be carefully designed. Overflow will occur in extreme storms, and the lot and remediation areas should be designed so that the excess water flows to the street without impeding access to parked vehicles. Redesigned lots can be required for any new construction or for major renovations, but complete retrofit of all lots is likely to be too expensive for political acceptance.
This will require some additional maintenance. If adsorbants are included in the recharge areas to help control hydrocarbon infiltration, for example, these will have to be renewed from time to time. Regular trash collection will be required.
It is anticipated that most parking lots could become zero runoff areas, contributing substantially to water conservation and pollutant remediation. Further, very large parking lots, such as those at “big box” stores and shopping malls, could be reconstructed as stormwater infiltration facilities serving surrounding neighborhoods. In a cap and trade system, the lots would become financial opportunities for the retailers.
Appendix H Task B
38
River Greening
The Los Angeles Region has become infamous for its historical conversion of rivers to concrete-lined flood control channels. While these have served the purpose of moving water rapidly to the ocean and avoiding flooding, they have also prevented infiltration in the riverbed. For this and many other reasons, advocates have proposed “greening” the river. This would involve widening the river at some points and replacing the steep concrete walls with gently sloping vegetated shores. Parks and wildlife habitat could be developed alongside the river, designed such that they would flood when the river is high. This would allow infiltration to occur, and by providing temporary storage, would decrease peak flood flows. In many areas it may be possible to replace the concrete bottoms of rivers with permeable surfaces.
The Sepulveda Dam Recreation Area is an excellent example of such a facility. It stores water during heavy rains, but serves as a park and wildlife refuge during the greater part of the year when it is not flooded. It promotes infiltration of water during rain events.
Certainly, any such modifications of the rivers must be designed carefully so that flood risk is not increased. But this is clearly possible. Indeed, increased infiltration and storage capacity along the river will reduce peak flows and therefore the frequency of floods, and reduce the associated costs.
Infiltration in Residential Streets
Many areas in Southern California are primarily residential, and runoff from these areas is only moderately polluted—it could be used for direct infiltration without treatment. In newly developed areas, homes could be designed so the runoff is near zero. However, many areas are currently already built out. In these, preventing runoff to the street would be expensive. In many cases, it may be possible to install infiltration devices in the public streets.
Infiltration in Parks
Public parks, in most cases consisting predominantly of grassy areas, are already contributing to groundwater infiltration. However, some portions still contribute to runoff, and could be regraded to collect water rather than shedding it. Indeed, many could be rebuilt to serve as groundwater infiltration systems serving surrounding areas. Playgrounds could be sunk below surrounding areas in order to collect water during rainfall events. Designs would have to include provision for infiltration at acceptable rates—water left standing for days could become a nuisance. In some areas, soil conditions might preclude this approach.
During the few days after water is collected and before it percolates, that area of the park will be unavailable for other uses. However, parks are little used during rainy weather in any case, and detention will only occur on a few days each year, so the interference will be minimal.
Public Facilities
Runoff from public facilities could be reduced by many of the measures previously discussed. Parking lots could be used for infiltration and rooftop runoff could

Appendix H Task B
39
go to planters serving as infiltration systems. Retrofit of government facilities could begin more quickly than for individual homes, as part of the effort required to meet regulations.
Appendix H Task B
40
PRIMARY BENEFITS OF RUNOFF QUALITY CONTROL The immediate purpose of runoff quality control is protection of the receiving
waters. In the Los Angeles Region, this refers primarily to rivers, coastal wetlands, bays, and the ocean. Many benefits are definable.
Fishing
Pollutants in stormwater can adversely affect fishing. Commercial fishing is a small and declining industry in the waters local to Southern California, but sportfishing remains a significant activity, bringing income to coastal businesses and providing recreational opportunity for many people. Cleanup of stormwater will preserve and enhance this activity by ensuring that fish are safe for consumption and by preserving fish breeding grounds in estuaries.
Swimming
Ocean swimming, as part of a visit to the beach, is a recreational activity enjoyed by millions of people each year in Southern California. It attracts tourists who contribute substantially to coastal economies. It is discouraged if trash litters the beach or if fear of disease discourages water contact. It is prevented entirely in the event of beach closures, which are a common result of polluted stormwater runoff.
Boating
Powerboats and sailboats are widely used in Southern California and represent a substantial industry in manufacture, maintenance, provision of slips, and various associated shoreside activities. Polluted waters, particularly in the form of trash, can significantly degrade the quality of the boating experience.
Noncontact Recreation and Nonconsumptive Wildlife Uses
Some recreational activities involve bodies of water without contact: sitting or bicycle riding along rivers or lake shores are examples. These activities are seriously degraded if the water produces bad odors or is littered with trash. A stormwater quality program will protect and enhance these uses.
Observation of wildlife is often a valuable part of the outdoor experience. Continuation of this activity requires water quality sufficient to support birds and animals and the plants and insects that they eat. Many migratory birds are dependent on local bodies of water for their sustenance during their yearly movements.
Reduced Illness from Contaminated Seafood
Some illnesses are transmitted through consumption of contaminated seafood. Control of the microbiological quality of runoff waters will reduce the extent of such illnesses.
Appendix H Task B
41
Reduced Illness from Swimming in Contaminated Waters
Recent studies have indicated that people swimming near storm drains are more likely to contract waterborne diseases than those swimming far from storm drains. Microbiological control of runoff quality, particularly through sanitary treatment of dry weather flows, could reduce the incidence of these diseases.
Enhanced Esthetic Values
The trash cleanup associated with stormwater quality control will improve the appearance of our harbors, rivers, streets, and commercial establishments. Esthetic enjoyment of wildlife habitats such as wetlands, in particular, is hindered if trash is present.
Preservation of Natural Ecosystems
Polluted urban runoff damages natural ecosystems in many ways: toxic material can sicken or kill organisms, trash can choke marine mammals or birds, additional turbidity can prevent the penetration of light necessary for seaweed growth, sediment can bury habitats and prevent attachment of organisms to rocky surfaces, and nutrients can fertilize overgrowth of mosses and plankton. This damage can be prevented by stormwater quality control, and is one of the prime reasons for the program.
Appendix H Task B
42
SECONDARY BENEFITS OF STORMWATER QUALITY CONTROL Urban runoff comes from a huge variety of sources and contacts much of the
environment around us. The efforts made to clean up runoff, which have the primary purpose of preventing water pollution in receiving waters, will have many secondary benefits and these should be included in any cost-benefit analysis. Indeed, some of these benefits are so substantial that they suggest the agencies responsible for the resources in question should also be providing financial support for runoff quality control efforts.
Groundwater Restoration
Total rainfall in the Los Angeles basin in an average year is equal to about half of the amount used for drinking water supply. It is strange indeed that we pollute this water and discharge it to the ocean even as we import ecologically, politically, and financially expensive water from the Colorado River, Northern California, and the Owens Valley. The primary difficulty in making productive use of this water is the lack of storage capacity. Rainfalls are infrequent but intense: most of the time there is no rainfall available for use, but occasionally it is so abundant that it causes flooding. Surface water reservoirs are the traditional solution to this problem—water is stored during the rainy season to prevent floods and becomes available for valuable uses the weather is dry. But there are few workable sites for large, year-round surface water reservoirs in the Los Angeles area. Groundwater aquifers, however, can also serve as water reservoirs, being drawn down in the dry season and replenished during the wet season. Infiltration will constitute a use of this storage capacity, reducing future dependence on outside sources of water and avoiding expensive alternatives like desalination of seawater. Because environmental and political factors may make increasing water imports impossible at any price, better utilization of local rainfall through the use of the groundwater reservoirs may be necessary for future growth.
Improvement of groundwater supplies within Southern California would save money now spent on imported water, and would save the concomitant external costs of the environmental impact on source areas. It would also reduce political friction with source areas. Ultimately, it may be the only economically and politically feasible method by which the water supply in Southern California can be increased, and as such, it may be the key to continued development in the area.
Flood Control
As the fraction of the Los Angeles Region occupied by impermeable surface has increased, the amount of water runoff has also increased, putting an ever-growing load on the flood control system. A recent project improved flood control for the lower Los Angeles River by increasing the height of the dikes on the channels, at a cost of about $200 million. Future increases in channel capacity would be even more expensive—not only will the walls have to be made higher, several bridges will have to be raised. Increased infiltration will reduce runoff, reducing the maintenance costs on the system and eliminating the need for further capacity increases.
The possible magnitude of the impact can be judged by considering the case of the San Gabriel Valley. Runoff from the valley is mostly captured in spreading basins in
Appendix H Task B
43
the Whittier Narrows area and used for groundwater recharge. This makes the runoff coefficient for the valley overall 5%. In the urbanized areas of Los Angeles, the value is about 40%. Thus if the urbanized area were as well controlled as the San Gabriel Valley, runoff could decrease by a factor of eight. Flood risks would essentially disappear.
Increased Parkland and Wildlife Habitat
The regional alternatives for stormwater quality control include the development of parks and wetlands. The parks would serve as detention basins and infiltration facilities, but would be used for that purpose only during rainy periods, which comprise about 32 days per year in Southern California. During the rest of the year, these areas could serve the typical purposes for which parks are built, acting as recreational sites, playgrounds, soccer and baseball fields, and wildlife habitat. Because people are less likely to engage in these activities during rainstorms in any case, the conflict between the uses will be small. The Los Angeles area is notably short of public parks in comparison to other major cities, particularly in its poorer neighborhoods (Wolch et al., 2002). Because it is likely that residents will demand more park space in the future, the development of areas for dual use is particularly valuable. Ideally, the cost of development could be borne by both agencies intent on improving stormwater quality and by those responsible for parks and recreation. The planned redevelopment of the Corn Fields site in Los Angeles, for example, might provide a detention basin as well as the new park that is being planned.
Wetlands must be kept wet all year, but can withstand flooding during the rainy season. Thus reestablishment of these habitats, which have been largely lost in the Los Angeles Region, could simultaneously serve the purposes of wildlife restoration, flood control, and stormwater quality control. In many cases, it will be possible to develop wetlands within existing channels, reducing the need for additional land purchases.
Some of the parks and wetlands could be created as a part of river greening projects, and so would also serve the purposes of reestablishing esthetically appealing naturalistic rivers.
Improved Property Values from Trash Control
Often one of the most powerful visual cues that gives a visitor the perception of a “bad” neighborhood is the presence of trash on the streets. One approach to reducing pollutant discharge to storm drains will be improved enforcement of litter laws and additional street cleaning. These will have the secondary benefit of improving the appearance and livability of streets throughout the area. The “broken windows” campaigns of many police departments—indicating that improving the appearance of neighborhoods reduces crime—suggests that apparently cosmetic changes can have substantial benefits for neighborhoods. Certainly property values in a neighborhood with clean streets will be higher than they would if the streets are routinely littered with trash.
Reduction in Harbor Sedimentation
Sediments carried by runoff are moved because the water moves rapidly, and because small particles remain suspended in the low-salt-content chemical environment of fresh water. When runoff enters bays and harbors, however, the velocity of the water
Appendix H Task B
44
is slowed, allowing the particles to settle to the bottom. The higher salt content of marine waters promotes flocculation of the small particles, so that most of them will also settle to the bottom. The deposited sediment fills channels, blocking the passage of ships and recreational boats, and filling areas set aside for preservation of aquatic ecosystems. Ultimately, harbor dredging is required, and frequently the collected sediment has been contaminated, so that it requires special handling. Dredging associated with storm drains in Los Angeles Harbor, for example, costs between $1 million and $3 million per year. Sedimentation in Upper Newport Bay is considered a significant threat to its function as a wildlife refuge. Stormwater quality control measures would avoid sediments discharges or remove it from the runoff, ameliorating these problems for downstream communities.
Improved Public Health
A significant portion of exposure to particulate air pollutants arises when small particles are resuspended from roadways by traffic and wind. Tire dust, settled air pollutant particles, pet feces, particles with adsorbed trace metals and trash are pounded into fine powder and lifted into the air. Such resuspension includes an ultrafine particle fraction, which is most dangerous to human health. More frequent street cleaning, particularly using vacuum bag type cleaners, would reduce public exposure to fine materials carrying trace metals, hydrocarbons, and microorganisms. Some public health improvement is likely, but its magnitude cannot be estimated.
Appendix H Task B
45
REGIONAL PROGRAMS DESIGNED FOR STORMWATER QUALITY CONTROL
While there has been a substantial amount of work on individual facilities for runoff quality control, such as detention ponds and grassy swales, there have been only a few studies that have tried to determine the regional cost and effectiveness for a system of these “green solutions”. It is important to ask whether it is possible to create an overall program within realistic constraints of land availability and costs that will bring the watershed into compliance with regulations.
We have sought descriptions of example projects that include overall costs and the area of land that drains to the facility, so that cost per square mile of area served can be calculated. In a few cases, these are area-wide systems that are the best evidence that an overall solution is possible. In others, they are single installations, for which we make the assumption that duplication is possible—ten facilities like the one described could be built to serve ten times the area. Because economies of scale are important in determining facility design and even regulatory policy, we have taken special interest in some sources that describe how the size of the drainage area (and the necessary BMP treatment facility) affects cost per square mile. Finally, we have included examples that have actually been built and tested, and others that have only been designed. While data for the latter may be less reliable, most systems perform as designed, and these designed-but-not-built systems provide some of the most useful results.
The chosen examples are described briefly below, and listed in Table 2. Results useful for determining the relationship between facility size and cost per square mile are plotted in Figures 2 and 3.
Area-Wide Systems
Sun Valley The Sun Valley project was funded by Los Angeles County to develop an
alternative approach for flood control and runoff quality management for the Sun Valley district. This is an urbanized area with considerable industrial development that currently does not have storm drains. It is consequently frequently plagued with flooding. The project was undertaken to determine whether there was an approach to flood control other than simply building storm drains.
Four alternative plans were produced, designed to maximize infiltration, to maximize water conservation and wildlife habitat, to maximize stormwater reuse by industry, and emphasizing conveyence to traditional storm drains. Notably, an alternative that maximized the use of onsite BMPs was rejected as too expensive. The components of the plans included industrial reuse, infiltration basins in parks, tree planting and mulching, infiltration in parking lots, and infiltration in vaults beneath the streets.
Because the emphasis of this project was flood control rather than water quality control, the hydraulic control objectives were quite stringent: the system was designed to collect and infiltrate all of the water produced by a 50-year, 96 hour storm. This means that the runoff from the area, if the project is built, will be reduced to near zero. Thus, this project, which includes flood control and water quality control, constitutes an “upper
Appendix H Task B
46
bound” estimate on the costs for water quality control. Achieving such complete collection and infiltration would certainly substantially exceed water quality goals, and costs for a stormwater quality control system in an area with storm drains already in place would certainly be lower.
San Diego Creek A project supported by the Irvine Ranch Water District and Orange County and
performed by Geosyntec Consultants has developed a plan for natural treatment systems—wetlands and stormwater detention ponds—for the San Diego Creek watershed. This watershed occupies 120 square miles of developed land that drains into Newport Bay. Newport Bay has been designated as impaired, requiring that stormwater discharges be cleaned up.
Geosyntec proposed a plan consisting of 44 facilities, including ponds and wetlands constructed within existing drainage channels or built outside. These are typically facilities with both deeper open water and shallow water supporting emergent vegetation (such as cattails).
Water quality improvements expected from the system are described in the report (Strecker et al., 2002): “The NTS Plan is estimated to achieve total nitrogen (TN) TMDL for base flows and reduce in-stream TN concentration below current standards at most locations. Total phosphorous TMDL targets would be met in all but the wettest years. The fecal coliform TMDL would be met during the dry season, but not all wet season base flow conditions, and not under storm conditions. The NTS Plan is not designed to meet the sediment TMDL, but would capture, on average, about 1,9000 tons/yr (1,724,000 kg/yr) of sediment from urban areas. The wetlands are estimated to remove 11% of the total copper and lead, and 18% of the total zinc in storm runoff. The NTS provides a cost-effective alternative to routing dry-weather flows to the sanitary treatment system.”
While final budget numbers were not provided, it was anticipated that the first 13 treatment sites would be constructed for $12 million, and that the overall cost would be substantially less that the $60 million anticipated for low-flow sanitary treatment. This value is listed as the upper bound of cost in Table 2. For comparison of cost vs. unit drainage area size, it was presumed that the average area served by each of the 44 facilities was 120 mi2/44 = 2.7 mi2.
Constructed wetlands will collect any trash that enters the storm drain, and should be effective at reducing concentrations of coliform organisms, hydrocarbons, particles, and the suite of pollutants associated with particles. They may constitute a complete control system if they are combined with vigorous source control for metals and pesticides and storm drain screens to minimize the trash loading.
Murray City, Utah, Golf Course and Wetlands Officials in Murray City recognized an opportunity when the interstate highway I-
215 was being built. They agreed to take soil from the excavation and runoff water from the freeway to make a golf course. The links, with an associated string of settling ponds, accept and treat all of the drain water from the eastbound lanes of 4.5 miles of the freeway (NRDC, 1999; Hill, 2003). The golf course has been a commercial success, and now produces $900,000 in revenue against $450,000 in operating and maintenance costs each year. The city has created other treatment wetlands for essentially all of the runoff
Appendix H Task B
47
from the City and from the westbound lanes of the freeway. The total cost of these wetlands has been less than $1,000,000. Overall, if the golf course infiltration system and the other wetlands are considered as a single stormwater control system, it pays for itself. Because this is an unusual circumstance, for calculation we ignored the income from the golf course, and presume the wetlands cost $1,000,000 and serve the area of Murray City, which is 9.5 mi2.
Fresno Metropolitan Flood Control District The Fresno Metropolitan Flood Control District serves the area including and
surrounding the city of Fresno. It operates 130 infiltration basins that drain a region of about 120 square miles devoted to agriculture, residential areas, and urban landscape (NRDC, 1999; Pomaville, 2003). Some of the basins are turfed and serve as parks, while others are bare and serve seasonal infiltration needs. The basins succeed in infiltrating 80% to 90% of the stormwater in their drainage areas, and only 2% enters a receiving water without receiving some degree of treatment. To protect groundwater, the District also instituted a program of industrial inspections. While monitoring is still done to check for pollution of the San Joaquin River, the District anticipates no additional infrastructure will be necessary to meet water quality control regulations. For calculations, the unit area for each basin was assumed to be 1 mi2.
Individual Systems
Long Lake Retrofit, Littleton, Massachusetts Geosyntec Consultants also designed a low-impact-development program for
Littleton, Massachusetts (Roy et al., 2003). The 1.5-square-mile watershed that contains the town drains into Long Lake, which has been subject to eutrophication and other water quality problems associated with urban runoff. The storm drain system collects water at 200 catch basins and releases it to the lake through 18 outfalls. The plan for mitigation of the problem includes a treatment wetland, grass and vegetated swales, bioretention cells (swales with underdrains), rain gardens, rain barrels, and an outreach program to promote source control for fertilizers.
The total budget for the project is estimated at $630,000, or $420,000 per square mile.
Tule Pond, Alameda, California The Tule Ponds project is a group of three treatment wetlands that was
constructed using information developed in the Demonstration Urban Storm Water Treatment Marsh in the early 1980s. It receives urban runoff, passing it through the three ponds in series and discharging it to an existing natural pond. It serves a drainage area of 0.8 square miles and cost $360,000, for a cost of $450,000 per square mile.
Treasure lsland, San Francisco Bay Treasure Island is an artificial island of 403 acres in San Francisco Bay that was
used for many years as a Navy base. It has recently been converted to residential use. A treatment wetland is planned as the means for stormwater quality control. It is anticipated that wetland construction will cost $800,000 to $ 1,100,000 (Bachand, 2003), or $1.2 million to $1.7 million per square mile. However, the island is a tourist destination, and it has been estimated that the increase in visitor spending associated with
Appendix H Task B
48
the wetland could be $4 million to $11 million (Fine, 2003). It was also estimated that the overall value of the project could be twice these values.
Herrerra Study of Stormwater Regulations Costs As a part of the effort to determine the costs of complying with stormwater
regulations in Western Washington, Herrerra Environmental Consultants (2001) prepared designs for typical projects needed to contain and treat stormwater on site in small projects of new construction. In both cases, the systems were planned for a 1.7-inch rainfall. The first hypothetical project was a ten-acre residential development with 40 individual home sites. It was presumed that runoff from the homes would be collected in a detention pond. Construction of the permanent facilities was determined to cost $240,000 to $230,000, depending on the quality of soils. This is about $15 million per square mile.
The second hypothetical site was a restaurant built on a one-acre site, with the area not occupied by the building used as a parking lot. Runoff was to be collected in subsurface infiltration vaults. Costs were determined to be $280,000 or $570,000, depending on the permeability of the soil, or $175 million to $356 million.
Dover Mall, Delaware The Dover Mall has 30 acres of parking lot or otherwise impermeable surface.
Runoff drains to a wetland that is sized to retain a 1-inch rainfall (NRDC, 1999). It includes a forebay that allows containment of exceptional spills. The total project cost was $171,000 (although much of this was defrayed by in-kind donations). The wetland is considered a considerable esthetic resource. The cost was $3.5 million per square mile.
Oakland Park Industrial Area, Florida A BMP treatment system was developed for five acres of Oakland Park that
included auto repair shops, paint shops and plating facilities. A short treatment train was developed, including a trash removal basin and absorbent media. The system cost $261,000, and was successful in removing 71% to 95% of oil and grease, along with all trash and most sediment. Costs were $33 million per square mile of drainage.
Clear Lake Packed Bed Wetland Filter System Clear Lake, in Orlando, Florida, receives runoff water from 121 acres of nearby
urban land and water quality in the lake has deteriorated significantly as a result of pollution. Packed beds, consisting of 10 filter beds composed of crushed concrete or granite media with growing aquatic plants, allow removal of sediments and nutrients. An initial wet detention pond is used to contain the first flush. The system cost $917,646. In calculations, the system was considered a single installation treating 121 acres of drainage. Costs were $4.6 million per square mile.
Sand Filters in Alexandria, Virginia Two sand filters were built to treat runoff from an airport parking lot near
National Airport in Alexandria, Virginia. The area drained was 1.95 acres, and the filters cost $40,000. While some initial problems with anaerobic conditions were encountered, the filters eventually achieved good treatment. The cost, calculated from the data reported by FHWA (2003), was $12.9 million per square mile.
Appendix H Task B
49
Compost Filter Facility, Hillsboro, Oregon A compost filter was constructed to decontaminate water upstream of a grassy
swale. The treatment train received water from a five-lane highway, draining a total area of 74 acres. The 1200-square-foot filter contained 120 cubic yards of compost and was constructed and filled for $13,700. The cost, not including the swale, was thus $110,000 per square mile of drainage area.
Infiltration Trenches The Federal Highway Administration (FHWA 2003) has estimated the costs for
constructing infiltration trenches as CA = 1317 × V(0.63) where C is the cost in dollars and V is the volume in cubic meters. Calculations for this report are made assuming the need to provide detention for a ¾-inch storm. For one square mile (2.6 × 10⁶ m2), a ¾-in rainstorm will produce 5×10⁴ m3 of water. The cost per square mile is equal to the cost for each trench divided by the drainage area it serves, or Cmi2 = CA/A = (1/A) × 1317 × V(0.63) = 1.2 × 10⁶ × A(-0.37). The total cost for these systems thus declines as each system becomes larger—there are economies of scale. Costs for land are not included, but it is likely that trenches could be installed in land also used for other purposes. In some cases it might be necessary to collect more than ¾ inch of rain. On the other hand, the calculation assumes that no infiltration occurs in the trench during the storm. Also, this presumes that the runoff coefficient for the area served is 1.0—thus the typical systems described could treat a ¾-inch storm on totally impervious area or a 1.5-inch storm on an area with a runoff coefficient of 0.5, which is a commonly observed value. Thus the total seems a reasonable approximation.
Infiltration Basins The Federal Highway Administration (FHWA 2003) has estimated costs for
construction of open infiltration basins (dry basins) as C = (V/0.02832)(0.69), where C is the cost in dollars and V is the volume in cubic meters. As for the infiltration trenches, it is assumed the basins will be designed to treat a ¾-inch storm in an impervious drainage. Thus the cost per square mile is Cmi2 = CA/A = (1/A) × (V/0.02832)(0.69) = 204,000 × A(-
0.31). Costs for land are not included, and would be substantial. However, the basins could be used for other purposes for much of the year. Again, the systems assumed could treat a 1.5-inch storm in a drainage area with a runoff coefficient of 0.5.
Bioretention Areas Stormwater can be collected in areas filled with highly permeable soils and
planted with trees and other vegetation. Water that infiltrates is filtered by contact with the soils and may continue to move downward to replenish the groundwater. Much of it will also be taken up by the vegetation and returned to the atmosphere through evapotranspiration. The FHWA (2003) cost estimate for these bioretention areas is $10,000 per impervious acre, or $6.2 million per square mile of impervious watershed. Bioretention areas can readily serve multiple purposes as wildlife habitat and parks.
Detention and Retention Wetlands The Federal Highway Commission Report (FHWA, 2003) has provided a general
formula describing the cost of detention ponds as a function of size. Costs were estimated as CA = 168×V(0.699), where CA is the cost in dollars and V is the volume of the pond in cubic meters. The cost per square mile is Cmi2 = CA/A = (1/A) × 168 × V(0.699) =
Appendix H Task B
50
324,000 × A(-0.301). Land costs are not included, but these areas can serve other purposes during the larger part of the year when the weather is dry—they can be parks, wildlife areas, and playing fields.
Detention Vaults In highly urbanized areas, water can be detained in underground vaults, which
may be made of concrete or of corrugated steel pipe. Such systems primarily store water to avoid flooding or excessive hydraulic load on downstream systems, but some sedimentation may occur. This provides marginal treatment, but also requires that the vaults be cleaned out on a regular basis. The FHWA estimate for costs of such systems is C = 38.1×(V/0.02832)(0.6816). Cost per square mile of drainage area is Cmi2 = (1/A) × 38.1 × (V/0.02832)(0.6816) = 690,000 × A(-0.3184).
Underground Sand Filters Sand filters are quite effective at removing particulates from urban stormwater,
and are commonly employed upstream of other systems in order to protect them from excessive sedimentation. They can be installed underground in densely urban areas, but are correspondingly expensive. The FHWA estimate for such systems is $10,000 to $14,000 per impervious acre served, or $8.7 million per square mile. Here we have chosen the upper estimate because costs are likely to be high in the Los Angeles area.
Surface Sand Filters Sand filters may also be constructed at the surface, which reduces their cost.
However, they occupy a relative large amount of land area, and cannot contribute to a secondary use. There are strong economies of scale. For facilities serving more than 5 impervious acres, the FHWA estimate of cost is $3,400 per acre or $2.1 million per square mile.
Dry Swales and Filter Strips A vegetated dry swale is an area of land shaped so that stormwater flows through
it in a broad, relative flat stream. Flow through the grass removes sediments from the water. At the same time, significant amounts of infiltration may occur. It may be necessary to prepare the soils to maximize infiltration before the grass is planted. Swales can be used for other purposes during the periods when it is not raining. The FHWA estimate of construction costs for swales is $1500 per impervious acre, or $930,000 per square mile.
Filter strips are similar installations, in which the water flows as a flat sheet. The FHWA estimate of constructions costs for filter strips is $2000 per acre or $1,240,000 per square mile.
Results from the ASCE-EPA BMP Database A cooperative effort of the American Society of Civil Engineers and the U.S.
Environmental Protection Agency has compiled data on the success of best management practices. Data were carefully vetted, put as much as possible in common format, and arranged so that they could be searched according to several parameters. Several searches of the database were done to gather data for this study.
A search for dry detention basins, serving watersheds of 0-100,000 acres, with 0-30 in annual rainfall, produced 17 responses, of which only four included cost data. All
Appendix H Task B
51
of the four were associated with freeways and served small watersheds of 1-14 acres. This may be the reason why costs were exceptionally high.
A search for wetlands, serving watersheds of 0-100,000 acres, with 0-30 in annual rainfall, produced 10 responses, only one of which included cost data. Costs for this facility were exceptionally low. It was described as a “natural” wetland, perhaps implying that much of the system was already in place before construction was done.
A search for wetlands, draining 0-100,000 acres, with 0-30 in annual rainfall, produced 9 responses, including 6 with cost data. These also served very small watersheds, and costs per square mile were very high.
A search for hydrodynamic devices serving 0-100,000 acres, in areas of 0-30 in annual rainfall, produced 12 responses, including 8 with cost data. Costs ranged from $344,000 per square mile to $86 million per square mile, showing very strong economies of scale.
A search for grassy swales serving 0-100,000 acres, in areas of 0-30 in rainfall, produced 26 responses, including 7 with cost data. The cost per square mile ranged from $12 million to $341 million, and showed strong economies of scale. This was a surprising result—grassy swales are very simple and cheaply constructed systems—but it reflects the fact that each installation serves only very small areas.
Appendix H Task B
52
ESTIMATES OF COSTS AND RECOMMENDED APPROACH Ultimately, stormwater pollution is a symptom of two anthropogenic changes: we
are releasing pollutants into our local environment, and we have disrupted the hydrologic cycle of the Los Angeles Region by covering the soil with impervious surfaces. These changes have other symptoms as well. Local pollution impairs health, damages the esthetic quality of life, and reduces property values. Reducing infiltration increases runoff rates and the risk of flooding, and at the same time, reduces recharge of groundwater resources. Finally, impervious surfaces cannot support vegetation, and we suffer the loss of natural habitat, recreational areas, and aesthetic value of green space.
Cost Estimates
The solution proposed in the report by Gordon et al. (2002)—advanced treatment plants to clean up stormwater after it has entered the storm drains—constitutes treatment of a single symptom without correction of the fundamental problem. It is expensive, and has little benefit beyond the single objective of protecting receiving waters. A more fundamental approach—eliminating pollutant releases and restoring the hydrologic cycle—is cheaper. Further, because it will mitigate all of the effects of pollution and hydrologic disruption, it will have benefits whose value exceeds the costs.
While a rudimentary cost-benefit analysis is attempted here, the limitations of such an approach should be kept in mind. Many costs and benefits are difficult to evaluate—the psychological benefit to citizens who live on a clean street rather than a trashy one, for example, or the long term effects on local business of a general perception of regulatory burdens. In past cost-benefit analyses, it has been common that costs and benefits that are difficult to measure have been assumed to be zero, certainly producing misleading results. It remains true that two good-faith investigators can produce quite different cost-benefit results, especially for a complex problem like stormwater quality control. Assumptions may depend greatly on the value system of the investigators. A recent cost-benefit study was criticized, for example, because it put a lower value on the lives of elderly persons. This is reasonable in the sense that the death of and older person represents fewer years of life lost, and less loss of earnings, and it is a common presumption in cost-benefit studies. However, there was outrage among those who felt that this approach was offensive to the elderly and the general principle that we all have equal rights.
In this particular study, because the costs and expenditures are of many different kinds, it was necessary to use a variety of estimation methods. The results are necessarily approximate, and comparisons among them must be viewed with caution. To use technical terms, contingent valuation studies are included with benefits transfer estimates, and results from various investigators are combined. We anticipate that these steps may be criticized, but we hope that we can provide a framework approach that can be improved and refined as further research is done.
Finally, cost-benefit analysis frequently ignores the issues that arise because the costs and benefits are not borne by the same parties. One might suggest that pollution should not be cleaned up if the cost of doing so exceeds the benefits of relief from the pollution. But it is commonly the case that the polluter who is saving money is not the
Appendix H Task B
53
same person who is suffering from the effects of the pollution. Does your neighbor have the right to throw his trash in your yard if he can show that it saves him more money than it costs you? The principle of “polluter pays” has a satisfying moral aspect and it also puts the incentives right—the parties with the ability to reduce pollution are given the motivation to find a way to do so.
For these reasons, and because in this short study the numbers are particularly only estimates, we present our cost benefit analysis with the caution that more precise and detailed assessments are desperately needed.
Cost estimates have been prepared by examining case studies. Reports were chosen where information was available for both the total cost of the system described and the land area served, or the initial stormwater retention volume, in order to calculate the cost of stormwater management per square mile of watershed. Several assumptions and caveats must be observed:
1. In the cost-per-square-mile calculations, no attempt was made to adjust costs on the basis of the amount of rainfall in the watershed. Sufficient data were generally not available for this purpose. In most cases, data came from areas where annual rainfalls are greater than in Los Angeles, and this may cause the cost estimates to be high.
2. In the cost-per-square mile calculation, the cost data were not available in a uniform format. It was not possible to calculate an accurate “present worth” including operations and maintenance costs for each case. In some cases operations and maintenance data were included, while in others they were not. In most cases operations and maintenance costs are low in comparison to installation costs, and they would be further reduced by discounting to present worth. Never the less, this may cause the cost estimates to be low.
3. Installation costs may vary depending on the slope of the land, the nature of the soils, depth to water table, local labor costs, and a wide variety of other factors that change with locality. No attempt was made to adjust the costs for these factors, and this may make the estimates high or low.
4. It is presumed that the systems described will be sufficient, in conjunction with source control efforts, to comply with water quality regulations. There was no case reported in which the quality control efforts were described as failing, or for which regulators asked for additional measures after the systems were complete. However, few data were shown for after-construction water quality, and most of the systems have not been in place for enough time to allow long-term assessment. The degree of success for source control efforts, while likely to be substantial, cannot be guaranteed.
5. Several of the projects described have been designed, but not implemented. It is assumed that they will perform as designed. In the case of the Federal Highway Administration formulas, these are regression results rather than individual case results.
6. It is likely that implementation in the Los Angeles area would involve projects that are larger than most of those listed. There likely will be economies of scale. This may cause the cost estimates to be high.
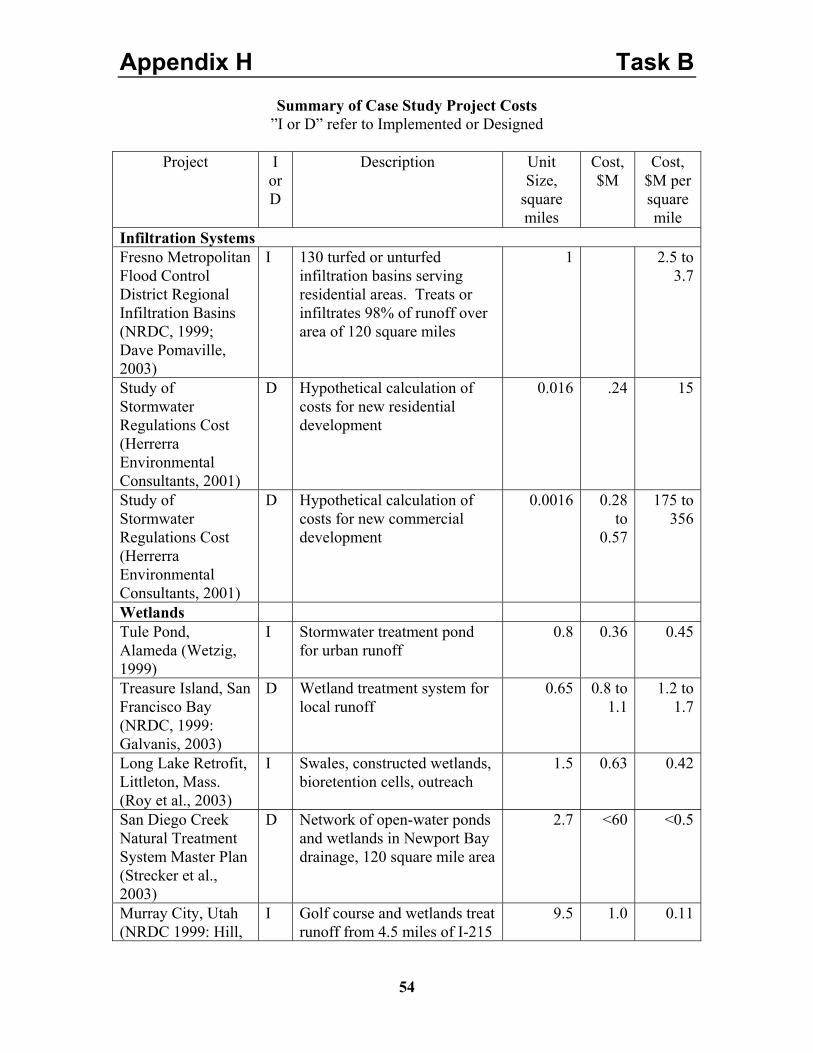
Appendix H Task B
54
Summary of Case Study Project Costs ”I or D” refer to Implemented or Designed
Project I
or D
Description Unit Size,
square miles
Cost, $M
Cost, $M per square mile
Infiltration Systems Fresno Metropolitan Flood Control District Regional Infiltration Basins (NRDC, 1999; Dave Pomaville, 2003)
I 130 turfed or unturfed infiltration basins serving residential areas. Treats or infiltrates 98% of runoff over area of 120 square miles
1 2.5 to 3.7
Study of Stormwater Regulations Cost (Herrerra Environmental Consultants, 2001)
D Hypothetical calculation of costs for new residential development
0.016 .24 15
Study of Stormwater Regulations Cost (Herrerra Environmental Consultants, 2001)
D Hypothetical calculation of costs for new commercial development
0.0016 0.28 to
0.57
175 to 356
Wetlands Tule Pond, Alameda (Wetzig, 1999)
I Stormwater treatment pond for urban runoff
0.8 0.36 0.45
Treasure Island, San Francisco Bay (NRDC, 1999: Galvanis, 2003)
D Wetland treatment system for local runoff
0.65 0.8 to 1.1
1.2 to 1.7
Long Lake Retrofit, Littleton, Mass. (Roy et al., 2003)
I Swales, constructed wetlands, bioretention cells, outreach
1.5 0.63 0.42
San Diego Creek Natural Treatment System Master Plan (Strecker et al., 2003)
D Network of open-water ponds and wetlands in Newport Bay drainage, 120 square mile area
2.7 <60 <0.5
Murray City, Utah (NRDC 1999: Hill,
I Golf course and wetlands treat runoff from 4.5 miles of I-215
9.5 1.0 0.11
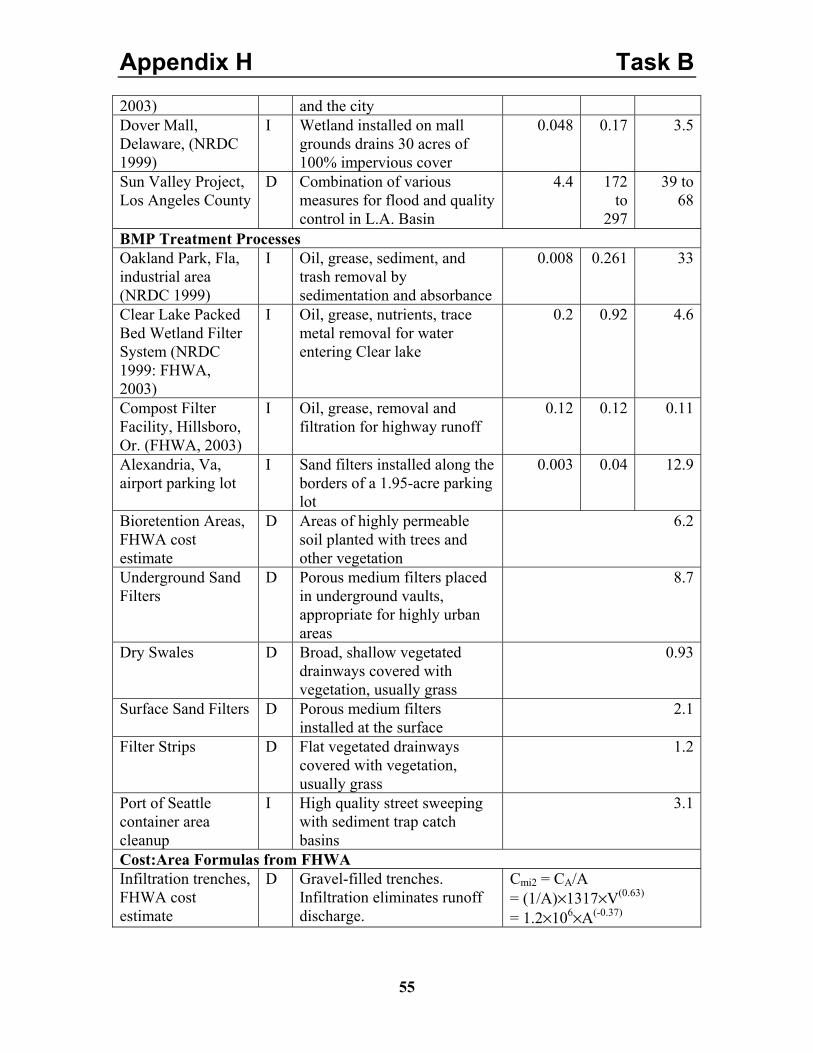
Appendix H Task B
55
2003) and the city Dover Mall, Delaware, (NRDC 1999)
I Wetland installed on mall grounds drains 30 acres of 100% impervious cover
0.048 0.17 3.5
Sun Valley Project, Los Angeles County
D Combination of various measures for flood and quality control in L.A. Basin
4.4 172 to
297
39 to 68
BMP Treatment Processes Oakland Park, Fla, industrial area (NRDC 1999)
I Oil, grease, sediment, and trash removal by sedimentation and absorbance
0.008 0.261 33
Clear Lake Packed Bed Wetland Filter System (NRDC 1999: FHWA, 2003)
I Oil, grease, nutrients, trace metal removal for water entering Clear lake
0.2 0.92 4.6
Compost Filter Facility, Hillsboro, Or. (FHWA, 2003)
I Oil, grease, removal and filtration for highway runoff
0.12 0.12 0.11
Alexandria, Va, airport parking lot
I Sand filters installed along the borders of a 1.95-acre parking lot
0.003 0.04 12.9
Bioretention Areas, FHWA cost estimate
D Areas of highly permeable soil planted with trees and other vegetation
6.2
Underground Sand Filters
D Porous medium filters placed in underground vaults, appropriate for highly urban areas
8.7
Dry Swales D Broad, shallow vegetated drainways covered with vegetation, usually grass
0.93
Surface Sand Filters D Porous medium filters installed at the surface
2.1
Filter Strips D Flat vegetated drainways covered with vegetation, usually grass
1.2
Port of Seattle container area cleanup
I High quality street sweeping with sediment trap catch basins
3.1
Cost:Area Formulas from FHWA Infiltration trenches, FHWA cost estimate
D Gravel-filled trenches. Infiltration eliminates runoff discharge.
Cmi2 = CA/A = (1/A)×1317×V(0.63) = 1.2×10⁶×A(-0.37)
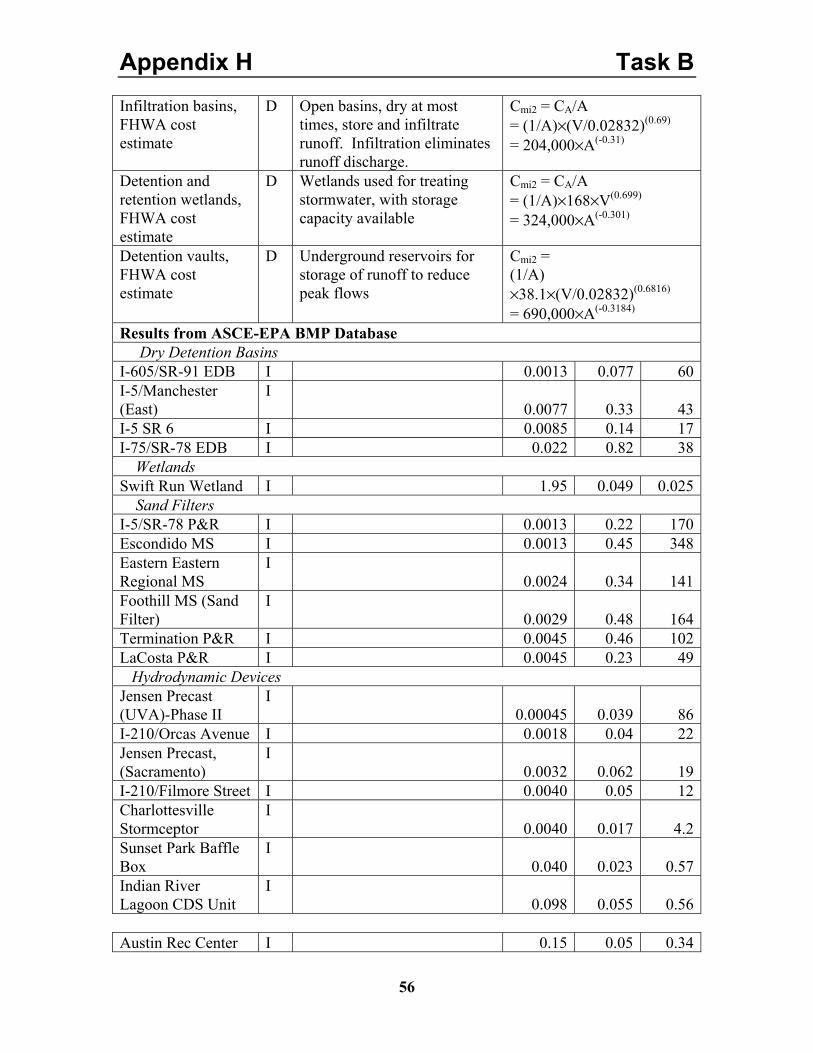
Appendix H Task B
56
Infiltration basins, FHWA cost estimate
D Open basins, dry at most times, store and infiltrate runoff. Infiltration eliminates runoff discharge.
Cmi2 = CA/A = (1/A)×(V/0.02832)(0.69) = 204,000×A(-0.31)
Detention and retention wetlands, FHWA cost estimate
D Wetlands used for treating stormwater, with storage capacity available
Cmi2 = CA/A = (1/A)×168×V(0.699)
= 324,000×A(-0.301)
Detention vaults, FHWA cost estimate
D Underground reservoirs for storage of runoff to reduce peak flows
Cmi2 = (1/A) ×38.1×(V/0.02832)(0.6816)
= 690,000×A(-0.3184) Results from ASCE-EPA BMP Database Dry Detention Basins I-605/SR-91 EDB I 0.0013 0.077 60I-5/Manchester (East)
I 0.0077 0.33 43
I-5 SR 6 I 0.0085 0.14 17I-75/SR-78 EDB I 0.022 0.82 38 Wetlands Swift Run Wetland I 1.95 0.049 0.025 Sand Filters I-5/SR-78 P&R I 0.0013 0.22 170Escondido MS I 0.0013 0.45 348Eastern Eastern Regional MS
I 0.0024 0.34 141
Foothill MS (Sand Filter)
I 0.0029 0.48 164
Termination P&R I 0.0045 0.46 102LaCosta P&R I 0.0045 0.23 49 Hydrodynamic Devices Jensen Precast (UVA)-Phase II
I 0.00045 0.039 86
I-210/Orcas Avenue I 0.0018 0.04 22Jensen Precast, (Sacramento)
I 0.0032 0.062 19
I-210/Filmore Street I 0.0040 0.05 12Charlottesville Stormceptor
I 0.0040 0.017 4.2
Sunset Park Baffle Box
I 0.040 0.023 0.57
Indian River Lagoon CDS Unit
I 0.098 0.055 0.56
Austin Rec Center I 0.15 0.05 0.34
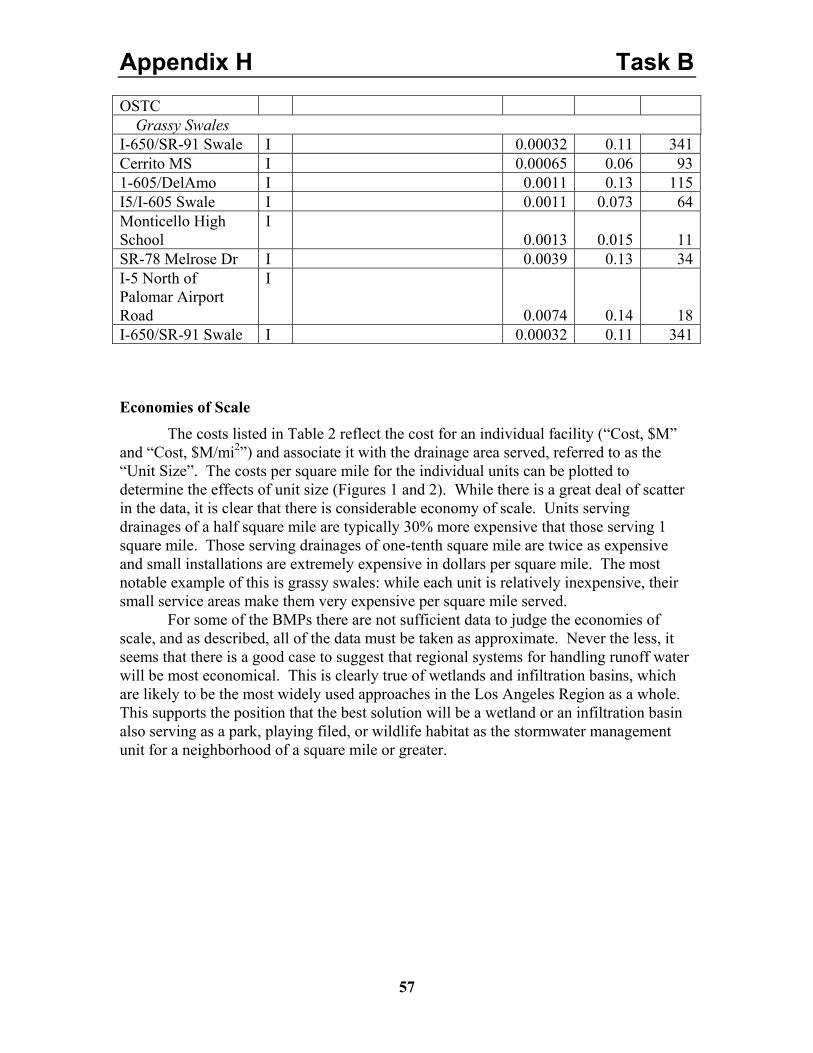
Appendix H Task B
57
OSTC Grassy Swales I-650/SR-91 Swale I 0.00032 0.11 341Cerrito MS I 0.00065 0.06 931-605/DelAmo I 0.0011 0.13 115I5/I-605 Swale I 0.0011 0.073 64Monticello High School
I 0.0013 0.015 11
SR-78 Melrose Dr I 0.0039 0.13 34I-5 North of Palomar Airport Road
I
0.0074 0.14 18I-650/SR-91 Swale I 0.00032 0.11 341
Economies of Scale
The costs listed in Table 2 reflect the cost for an individual facility (“Cost, $M” and “Cost, $M/mi2”) and associate it with the drainage area served, referred to as the “Unit Size”. The costs per square mile for the individual units can be plotted to determine the effects of unit size (Figures 1 and 2). While there is a great deal of scatter in the data, it is clear that there is considerable economy of scale. Units serving drainages of a half square mile are typically 30% more expensive that those serving 1 square mile. Those serving drainages of one-tenth square mile are twice as expensive and small installations are extremely expensive in dollars per square mile. The most notable example of this is grassy swales: while each unit is relatively inexpensive, their small service areas make them very expensive per square mile served.
For some of the BMPs there are not sufficient data to judge the economies of scale, and as described, all of the data must be taken as approximate. Never the less, it seems that there is a good case to suggest that regional systems for handling runoff water will be most economical. This is clearly true of wetlands and infiltration basins, which are likely to be the most widely used approaches in the Los Angeles Region as a whole. This supports the position that the best solution will be a wetland or an infiltration basin also serving as a park, playing filed, or wildlife habitat as the stormwater management unit for a neighborhood of a square mile or greater.
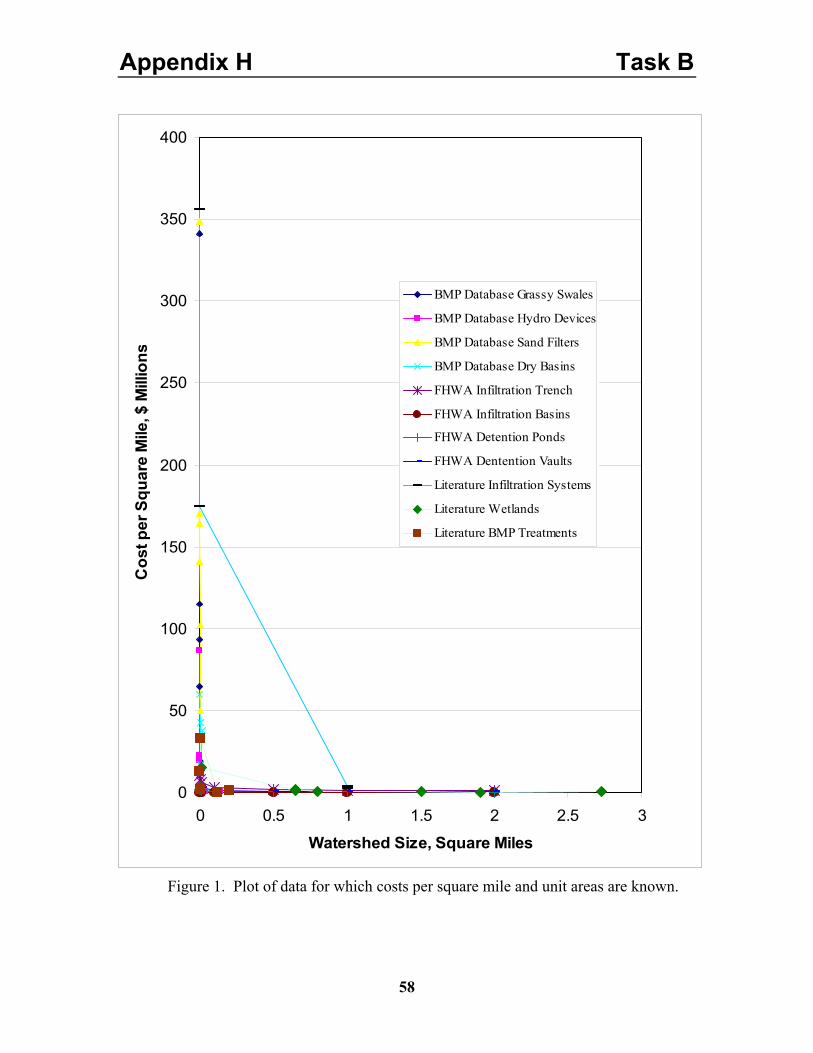
Appendix H Task B
58
Figure 1. Plot of data for which costs per square mile and unit areas are known.
0
50
100
150
200
250
300
350
400
0 0.5 1 1.5 2 2.5 3
Watershed Size, Square Miles
Cos
t per
Squ
are
Mile
, $ M
illio
ns
BMP Database Grassy Swales
BMP Database Hydro Devices
BMP Database Sand Filters
BMP Database Dry Basins
FHWA Infiltration Trench
FHWA Infiltration Basins
FHWA Detention Ponds
FHWA Dentention Vaults
Literature Infiltration Systems
Literature Wetlands
Literature BMP Treatments
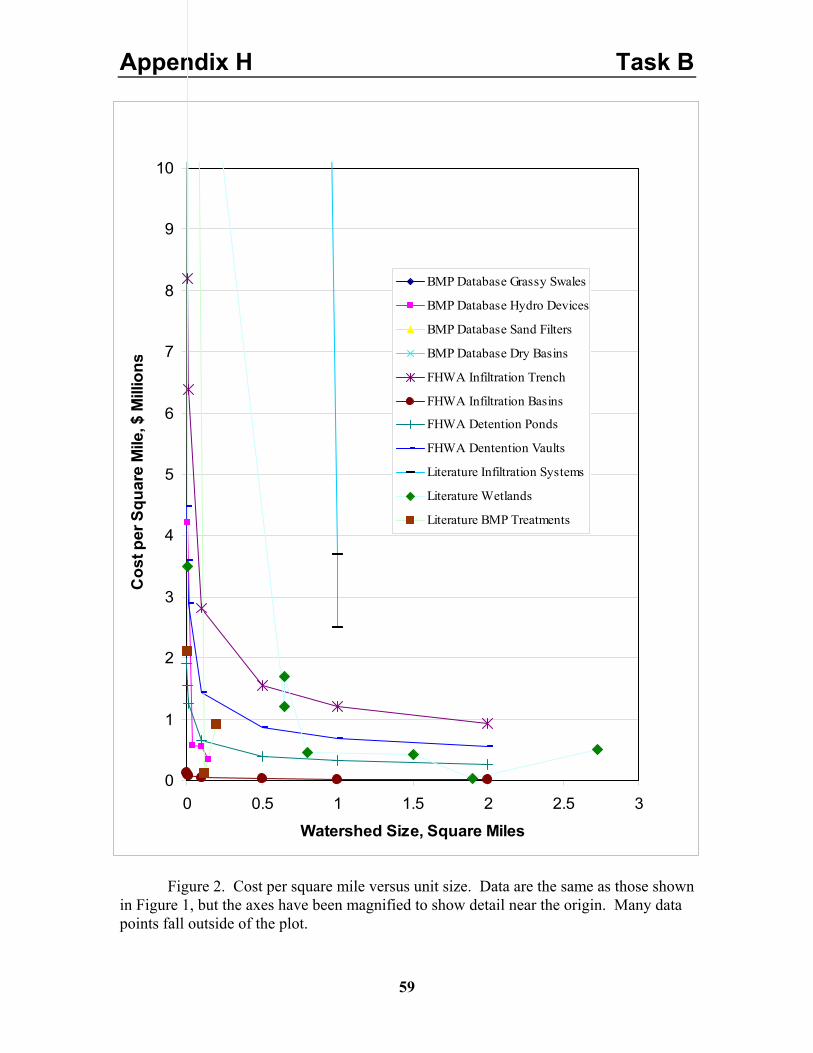
Appendix H Task B
59
Figure 2. Cost per square mile versus unit size. Data are the same as those shown
in Figure 1, but the axes have been magnified to show detail near the origin. Many data points fall outside of the plot.
0
1
2
3
4
5
6
7
8
9
10
0 0.5 1 1.5 2 2.5 3
Watershed Size, Square Miles
Cos
t per
Squ
are
Mile
, $ M
illio
ns
BMP Database Grassy Swales
BMP Database Hydro Devices
BMP Database Sand Filters
BMP Database Dry Basins
FHWA Infiltration Trench
FHWA Infiltration Basins
FHWA Detention Ponds
FHWA Dentention Vaults
Literature Infiltration Systems
Literature Wetlands
Literature BMP Treatments
Appendix H Task B
60
Overall Costs of Stormwater Quality Control
It remains very difficult to produce an estimate of the total costs for complying with regulations in the Los Angeles Region. While there is substantial information on individual units that have been designed or implemented elsewhere, local factors are likely to make costs different in the Region. In most cases, it seems likely that costs in the Los Angeles Region will be higher than those reported elsewhere because land and labor costs are higher. Therefore, where a range of values is given, we have chosen the higher numbers.
This difficulty is compounded by the great variability in the data reported. To give just one example, the Federal Highway Administration formula estimates the cost of an infiltration basin needed to serve one square mile as $200,000. At the other extreme, the Herrerra Consultants report said that a detention/infiltration system for a residential area would cost $15 million per square mile. In preparing our total estimate, we have avoided using data that seem like outliers in comparison to the general run of the data.
The results compiled suggest two possible scenarios for stormwater quality control. The first approach is to rely on non-structural BMPs, such as programs to reduce littering, control pet waste, collect trash, prevent release of pollutants, and clean existing drains. This approach is less expensive because it involves no construction. However, there remains considerable doubt whether it will be sufficient to meet stormwater quality goals expressed as TMDLs (Total Maximum Daily Loads). Control of pollutant release will be only partial—we cannot expect that everyone will comply with the rules—and the amount of runoff will be reduced only slightly.
The second scenario presumes implementation of non-structural BMPs (except storm drain cleaning) and construction of a network of wetlands and infiltration basins sufficient to capture the first three-quarters of an inch of rainfall, which typically carries the bulk of the pollutants. These relatively simple installations are not likely to be sufficient without complementary measures to reduce releases of coliforms, trace metals, fertilizers and toxic organics. Wetlands help to remove these, but will not be effective if inputs are too high. Infiltration avoids all pollutant discharge, because it prevents release of the water, but it is necessary to protect groundwater quality, so once again, inputs must be restricted. The wetlands and infiltration basins would be designed to have sufficient retention capacity to hold the first ¾ inch of rainfall—this “first flush” carries most of the pollutants, but pollutant discharges must be sufficiently reduced so that subsequent flows can be discharged directly to storm drains.
In combination with the non-structural BMPs, wetlands and infiltration basins (designed as “stormwater parks”) are likely to bring stormwater quality into compliance. This system will be more expensive, but it also carries greater secondary benefits: the region will gain much-needed greenspace, property values will be improved, and most important, it will substantially increase the availability of groundwater.
It is our recommendation that the responsible municipalities and agencies in the region begin at once on assessing stormwater quality on a neighborhood basis and implementing the non-structural controls. As the success of these measures is measured, it will become apparent whether the structural BMPs are needed. It seems certain that they will be needed in some areas, but they may not be needed throughout the region. Thus our estimate of costs ranges from a minimum budget needed for the non-structural
Appendix H Task B
61
BMPs to a maximum representing the cost of an area-wide system of wetlands and infiltration basins. The following section provides the details of how the cost estimates were prepared.
Non-structural BMPs An estimate of costs for non-structural BMPs has been prepared by the American
Public Works Association (APWA, 1992). They defined five levels of BMPs that might be workable, with the appropriate level depending on the stringency of discharge requirements and the success of the individual measures. Their analysis included ten source control measures with cost data, and has been used as the starting point for the analysis here. Our treatment of each measure is described in the following paragraphs.
No littering ordinance. Litter laws are in place in the region, but there is a need for far more vigorous public education and enforcement. The APWA study determined that each municipality would spend $20,000 to put an enforcement program in place, and hire a half time person to manage the program ($30,000 per year). There are about a hundred municipalities in the Los Angeles Region, so this implies a startup cost of $200,000 and yearly costs of $3 million. Some officers will be necessary, but it is assumed that their pay will be covered by revenue from fines. Total costs are estimated to be $3 million plus the present worth of $3 million per year at 3%, or $103 million.
Pet waste ordinance. APWA predicted that the effort to control pet waste would be similar to that for litter, and estimated the same costs.
Chemical use and storage ordinance. APWA determined that a program to control the use and storage of chemicals would be similar is scope and cost to that for litter or pet waste. The same costs are estimated here. This would include the cost of programs to bring auto dismantlers and other local businesses into compliance.
Recycling programs. APWA predicted less trash would be discarded if convenient recycling programs were in place. Because these currently exist in most Los Angeles Region cities, and are justified by other concerns, no additional costs are estimated for this purpose.
Public education programs. Developing public support for stormwater quality control and explaining the need for citizen action will be vital to its success. The APWA determined a program costing $275,000 in each municipality would be necessary. However, it would be confusing and unnecessarily duplicative to have each of the one hundred municipalities in the Los Angeles Region conduct its own program. We instead assume a single program will be funded at the level of $5 million per year, which is approximately the current rate of expenditure. It also seems likely that education will not be needed indefinitely—to the degree that the message is successful, it will certainly become ingrained after perhaps ten years of advertising. We therefore estimate a total of $50 million for public education.
Vacant lot cleanup programs. This function will be part of the improved trash collection program, so funds are not separately allocated.
Spill prevention ordinance. APWA determined a separate program would be necessary to reduce the frequency of chemical spills and facilitate their rapid cleanup. This function has largely been overtaken by hazardous waste management regulations, and so is estimated to require no additional costs here.
Appendix H Task B
62
Program to prevent illicit discharges. APWA determined that vigorous efforts would be needed to find and eliminate illicit discharges to the storm drain system. We agree that this will be necessary to avoid loads of non-biodegradable pollutants, such as trace metals, on treatment wetlands and infiltration basins, and to prevent excessive loading of organic contaminants and coliforms. APWA predicted a cost of $4 per acre of watershed to start, and $50 per acre per year thereafter in order to deploy and monitor sampling devices and to trace down points of discharge. For the 2,050 square miles in which stormwater protection is needed, this amounts to $6.5 million in capital expenses and $80 million per year in ongoing costs. We expect however, that many illicit connections will be found at first, and that after these are eliminated, only a small program will be needed to detect new illicit connections. We therefore estimate that the ongoing costs will continue for only five years, totaling $407 million.
Improved cleaning of storm drains. During dry periods, storm drains collect trash from illicit dumping and wind blown litter (we expect no trash will enter through the catch basins because screens will be installed). Sediments also accumulate in the channels. Releases to the rivers and ocean could be reduced by a summer program of storm drain cleaning. The APWA estimates such a program can be put in place for $21 per acre per year, or about $27 million per year over the area of concern. The present worth of $27 million per year is $900 million (assuming an interest rate of 3%). No storm drain cleaning is expected for the wetlands and infiltration scenarios, on the presumption that trash and sediments will be removed from the water before it enters the drains.
Trash control. Trash must be removed from the runoff. A settlement agreement on Trash TMDL between the LA Regional Water Board and the City of Los Angeles includes spending of $168 million to reduce trash releases by 50% in five years. Cleaning up the region required removing all of the trash from an urban area more than twice the size of the city. Thus the estimate of $600 million seems reasonable.
Low flow treatment. One of the best steps, in terms of water quality benefits per dollar, is to use excess capacity in the wastewater treatment plants for treatment of low flows. This will keep the rivers and oceans clean for most of the year at little additional cost. The City of Los Angeles estimates the cost of building the necessary diversion structures at $14 million (Kharaghani, 2003). The urban region is about twice the size of the city, so we have estimated a total cost of $28 million. This does not include operation costs. While there will be modest cost increases associated with the greater flows, the biggest costs are associated with the installed treatment capacity, which is already in place.
Improved street sweeping. The APWA report determined that sweeping should be improved by increasing its frequency. Research results developed since the APWA report suggest that more frequent sweeping with traditional brush machines produces only a modest improvement. However, changing to vacuum sweepers is effective, and can remove up to 50% of particulate pollutants.
The upgrade of street sweeping in the region will require purchasing new vacuum-type sweepers to replace those currently in use. There are about 400 street sweeping machines in use, which must be replaced once every four years, so 100 machines will be purchased each year. Vacuum machines cost about $150,000 rather than the $75,000 for standard machines. Thus the additional costs of higher quality
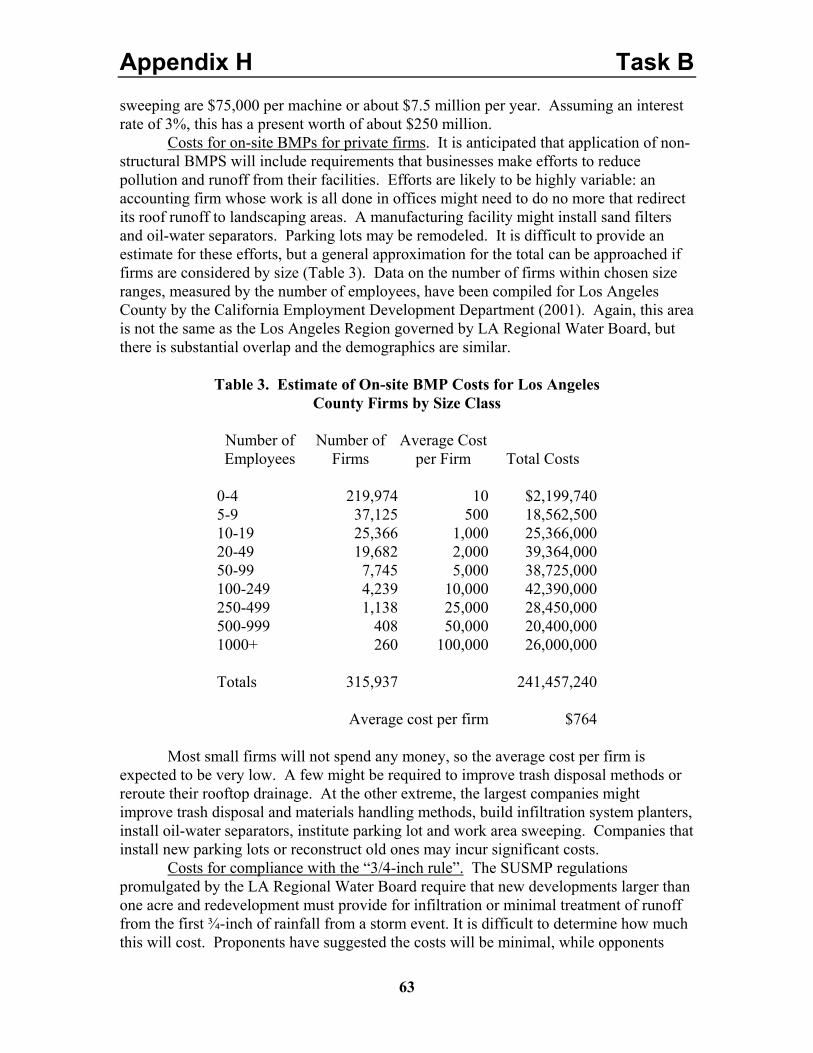
Appendix H Task B
63
sweeping are $75,000 per machine or about $7.5 million per year. Assuming an interest rate of 3%, this has a present worth of about $250 million.
Costs for on-site BMPs for private firms. It is anticipated that application of non-structural BMPS will include requirements that businesses make efforts to reduce pollution and runoff from their facilities. Efforts are likely to be highly variable: an accounting firm whose work is all done in offices might need to do no more that redirect its roof runoff to landscaping areas. A manufacturing facility might install sand filters and oil-water separators. Parking lots may be remodeled. It is difficult to provide an estimate for these efforts, but a general approximation for the total can be approached if firms are considered by size (Table 3). Data on the number of firms within chosen size ranges, measured by the number of employees, have been compiled for Los Angeles County by the California Employment Development Department (2001). Again, this area is not the same as the Los Angeles Region governed by LA Regional Water Board, but there is substantial overlap and the demographics are similar.
Table 3. Estimate of On-site BMP Costs for Los Angeles
County Firms by Size Class
Number of Employees
Number of Firms
Average Cost per Firm Total Costs
0-4 219,974 10 $2,199,7405-9 37,125 500 18,562,50010-19 25,366 1,000 25,366,00020-49 19,682 2,000 39,364,00050-99 7,745 5,000 38,725,000100-249 4,239 10,000 42,390,000250-499 1,138 25,000 28,450,000500-999 408 50,000 20,400,0001000+ 260 100,000 26,000,000 Totals 315,937 241,457,240 Average cost per firm $764
Most small firms will not spend any money, so the average cost per firm is
expected to be very low. A few might be required to improve trash disposal methods or reroute their rooftop drainage. At the other extreme, the largest companies might improve trash disposal and materials handling methods, build infiltration system planters, install oil-water separators, institute parking lot and work area sweeping. Companies that install new parking lots or reconstruct old ones may incur significant costs.
Costs for compliance with the “3/4-inch rule”. The SUSMP regulations promulgated by the LA Regional Water Board require that new developments larger than one acre and redevelopment must provide for infiltration or minimal treatment of runoff from the first ¾-inch of rainfall from a storm event. It is difficult to determine how much this will cost. Proponents have suggested the costs will be minimal, while opponents
Appendix H Task B
64
have predicted high costs. Experts contacted during this study were of the general opinion that landscaping designed to infiltrate the runoff from a ¾-inch storm would be different, but not significantly more expensive, than traditional landscaping. On the other hand, engineers in the discipline believe that most builders are choosing treatment systems rather than infiltration. The stormwater control costs will likely be a small fraction of building costs. Ultimately, we have concluded that there are not sufficient data to make a numerical cost estimate. The costs are therefore described here only as “modest”, and further study is recommended.
Wetlands and Infiltration Basins: Estimate Based on Cost per Square Mile of Watershed The land within the Los Angeles Region varies from lightly settled areas, like the
upper reaches of the Santa Clara River Watershed or the Santa Monica Mountains, through neighborhoods of single family homes with yards, to the extremely dense development of downtown Los Angeles or the Wilshire District. There are about 1,375 square miles of incorporated cities in Los Angeles County. The region of the LA Regional Water Board includes parts of Ventura County, and parts of both counties that are not incorporated are never the less populated. To evaluate the possible alternatives for runoff control, we have conceptually divided the 3,100-square-mile region that is under the jurisdiction of the Los Angeles Regional Water Quality Control Board into four parts 1000 square miles is estimated to be of “low density”, requiring some runoff BMP treatment, but having sufficient land for development of treatment wetlands or infiltration systems. 1,000 square miles is estimated to be “high density” requiring infiltration systems but excluding wetlands. 50 square miles is estimated to be extremely dense downtown development, requiring some more sophisticated BMP treatment systems. The remainder of the region is considered rural, and we presume the only cost is for source control outreach and enforcement. These definitions and numbers are approximate, but there is also flexibility in the applicability of the various technologies.
For the low density urban areas, we assume some combination of infiltration systems and treatment wetlands will be constructed. The range of reported costs for treatment wetlands runs from $110,000 per square mile for Murray City, Utah, to $1.7 million per square mile for the Treasure Island wetland in San Francisco. The San Diego Creek wetland system seems an excellent example—it is designed for a populated region of Orange County that is quite similar to many areas in Los Angeles County. However, it is specifically designed to treat low flows only, and the total cost of the system has not been provided (except that it is less than $500,000 per square mile). The Long Lake retrofit also seems like an appropriate example. It uses a mix of wetland, infiltration and biological BMPs in an urban residential area, and has a well-established cost of $420,000 per square mile. We have therefore used this value in our total estimate of $420 million for the low density areas.
In areas of high density housing, where yards are small, or in industrial areas with large roof and parking areas, runoff coefficients are higher and there is less land available. Here it seems likely that infiltration systems will be necessary. The best example for comparison is the Fresno Metropolitan Flood Control District, which installed 130 basins over an area of 120 square miles, with many of the facilities dedicated to multiple uses as parks and playing fields. Cost estimates for the system range from $2.5 million to $3.7 million per square mile. While a similar system built in
Appendix H Task B
65
the Los Angeles Region could take advantage of existing parks, power line rights-of-way, parking lots, and other available land, it seems appropriate to use the higher number because land here will be more expensive. Thus we estimate cost in these areas to be $3.7 million per square mile for a total of $3.7 billion.
In extremely dense areas, neither wetlands nor infiltration systems will be possible. Pollutant loads, despite source control efforts, will be considerable in the near future. Underground sand filters, sediment traps, oil and grease adsorbants and other more elaborate treatment BMPs will be needed. The lowest-cost processes are filter strips, dry swales and bioretention areas, but these require space that is unlikely to be available (the Hillsboro, Oregon compost filter, at $110,000 per square mile is considered an outlier). Even the Alexandria, Virginia airport parking lot solution is unlikely to be workable because so much of the parking area is in multi-level structures in downtown areas. This combination of more pollutants and less space suggests that the Oakland Park, Florida system for treating industrial runoff is the best case example. Its cost was equivalent to $33 million per square mile, for a total of $1.65 billion over the extremely dense urban area.
Together, this approach estimates that the total BMP facilities cost will be about $5.7 billion.
Wetlands and Infiltration Basins: Estimate Based on Needed Retention Capacity Investigators working on the Sun Valley Project (Los Angeles County
Department of Public Works, 2003, Figure 4-3 of page 4-8) have designed several BMPs and provided carefully calculated cost estimates. These are recent figures, reduced to present worth, and reflecting the local conditions in the urban Los Angeles Region. They provide costs in terms of dollars per acre-foot of stormwater storage capacity for several BMPs. Three examples have been chosen for consideration here: Stonehurst Park and Wentworth Park (which simply lower the park level to two feet below the surrounding area so that they serve as infiltration basins, or “stormwater parks”), and storage in below-street infiltration vaults. A system that stores the runoff from a ¾-inch storm will comply with SUSMP requirements. In the low density areas, it is estimated that the runoff coefficient is 0.4. In the high density areas, it is estimated to be 0.6, and in the extremely dense areas it is estimated to be 1.0.
We estimate that the low-density areas can be served at the Stonehurst Park price, the high density areas can be served at the Wentworth Park price, and the extremely dense areas can be served by street infiltration vaults. This approach to estimating the total cost is completely independent of the first approach, but the final estimate of $4.0 billion for BMP facilities is reasonably similar.
Wetlands and Infiltration Basins: Estimation of Total Costs from the APWA Study The APWA study produced total estimates for costs for the nation for five
scenarios for stormwater quality control. One estimate was for a system of detention basins and wetlands, as is being proposed for the structural BMPs described here. They estimated that a national system would cost $91 billion. For 260 million people in the United States, this is about $350 per capita. For the 10 million people in the Los Angeles Region, this produces an estimate of $3.5 billion. The APWA anticipated maintenance costs for detention and retention basins at about 1% of the construction cost per year. Discounted to present worth, this increases the total cost by 33%, or $1.2 billion. APWA
Appendix H Task B
66
numbers thus indicate a total cost of $4.7 billion. This estimate is similar to those shown for the entries in Table 3 for facilities costs for alternatives B and C.
Wetlands and Infiltration Basins: An “Upper Bound” Provided by the Sun Valley Study The Sun Valley study developed a detailed design for a 4.4 square mile watershed
that currently has no storm drains. It was designed to contain the water from a 50-year, 3-day storm—14.8 inches of rain—using stormwater parks and below-street infiltration vaults. Because this approach will infiltrate essentially all of the rain that runs off from the area, and because the design criterion of 14.8 inches greatly exceeds the ¾ inch assumed here, it unquestionably constitutes a plan that would overcomply with the strictest imaginable stormwater quality control regulations. Further, because it is a complete and detailed design, it is essentially certain that it can be built for the cost estimated. Figures are recent, and reflect the costs of construction in the Southern California area.
The costs determined can therefore serve as an “upper bound” multiple benefit expenditure that a municipality could imaginable be required to incur—while there is every reason to suppose that the easier goal of stormwater quality control can be done for a much lower cost. The low cost alternative described was $171 million for 4.4 square miles, or $39 million per square mile. For the 1050 square miles of the high density and extremely dense urban Los Angeles Region, this would result in a cost of $41 billion. Wetlands for the low-density areas and trash control for the entire region would add about $1 billion more. Thus we can say with great certainty that no alternative more expensive than $42 billion will be needed.
Overall Benefits of Stormwater Quality Control
The Esthetic Value of a Clean Ocean Much of the value of living near clean streams and a pollution-free ocean is
difficult to quantify. People enjoy the view, they like watching wildlife, and they prefer vegetation and sand and water to pavement. Some efforts to place a dollar value on these benefits have been made by the EPA (1999) and others (Kramer, 2003; Soderqvist, 2000; Whitehead, et al., 2000).
Soderqvist asked residents in the area of the Stockholm archipelago how much they were willing to pay in order to reduce eutrophication of the nearby ocean. The effects of oceanic eutrophication are relatively subtle—less obvious than floating trash or debris washed up on the beach. He determined the willingness to pay to be between $54 and $90 per person.
Whitehead investigated resident willingness to pay for reduction of eutrophication of the Neuse River Basin in North Carolina. He found 44,000 landowners were willing to pay about $76 each for the water quality improvement.
Kramer surveyed people in the area of the Catawba River in North and South Carolina, asking about willingness to pay for improved water. The average result was $139 per taxpayer.
The EPA surveyed people across the U.S., asking about their willingness to pay for the various services associated with improvements in fresh water quality. They found people willing to pay $210 per household for improvement of water quality sufficient to support boating, $158 for the further improvement sufficient to support fishing, $177 for
Appendix H Task B
67
further improvement sufficient to allow swimming, and $158 for improvement sufficient to support natural aquatic life. Of the total of $703, however, only 67% was ascribed to local water quality improvement, while the rest was associated with improvement nationwide. Assuming 2.5 persons per household, this results in an estimate of $188 per person for willingness to pay for local freshwater improvements, similar to the estimate by Kramer for the Catawba River.
We have chosen the EPA estimate for freshwater improvements: the higher estimate seems reasonable because freshwater resources in the LA basin are generally in very poor condition, and because we have ignored the national effect (their results indicated that people throughout the nation were willing to pay for improvements throughout the nation—we are not counting the willingness of people outside the LA Region to pay for improvements here, and that number is not zero). Adding this to a mid-range value of the Soderqvist estimate for improvements in ocean water quality produces a result of $260 per person. This seems a quite reasonable value. 9.5 million people live in the Los Angeles Region, so this value indicates a total willingness to pay, based solely on the value of living in a region of clean waters, of about $2.5 billion.
Larsen and Kew (2003) have surveyed residents of California to determine their total willingness to pay for removing all impairments from bodies of water in the state. They determined that the average willingness to pay was $15.46 per month. Assuming 2.5 persons per household, this is $6.18 per person per month. For 9.5 million residents in the Los Angeles Region, this is $58.7 million per month, with a present worth of $23 billion. This represents the value of removing all impairments—including those caused by wastewater pollution, shoreside development, pollution from boats, and others. Our estimate for stormwater pollution alone is about one-tenth of this. Thus the Larsen and Kew results suggest our estimate is reasonable and conservative.
General support for these numbers was found in a survey done for the Packard Foundation performed by Mark Baldassare (Weisse, 2003). He determined that seven of ten Californians are concerned about the decline in coastal resources. Sixty-nine percent said the condition of the coastline is very important to their quality of life, and 75% visit the coast at least several times each year. Seventy-two percent favor reducing stormwater pollution, even if the cost leads to higher utility bills.
Ecosystem Services A primary purpose of stormwater quality control is protection of nearshore marine
ecosystems. These ecosystems provide humanity with a wide variety of services, ranging from educational opportunity to fish resources to chemical maintenance of the atmosphere. While the effort to value such ecosystem services is necessarily difficult and approximate, some studies have been made. Costanza, et al. (1997) in an article published in the respected journal Nature, assessed the value of coastal ecosystems at $12 trillion per year worldwide. The World Resources Institute estimates that there are 1.6 million kilometers of coastline (measured at a resolution of 1 kilometer). If we assume that stormwater discharges from the Los Angeles Region affect about 100 miles, or 160 kilometers of coastline, this is 0.01% of the world’s total, suggesting that the value of local coastal resources is $1.2 billion per year. Assuming an interest rate of 3%, this income stream has a present worth of $40 billion. Finally, we can make the general
Appendix H Task B
68
approximation that stormwater pollution reduces the services provided by the local coastal ecosystem by 5%. This suggests that the value of lost services is $2 billion.
This number is quite approximate. It must secondly be interpreted thoughtfully because it includes services such as nutrient cycling and maintenance of the atmosphere, which are of undoubted value to the world, but which do not show up in the daily budgets of local citizens or local municipalities. The services are nevertheless quite real and quite valuable, and should be included in the accounting.
Additional Water Supply Infiltration of stormwater will add to area groundwater reserves. These are a
valuable resource that currently provides a substantial fraction of the Los Angeles Region water supply. Water that is infiltrated from the stormwater quality control system will add to local resources, reducing the need for imported water. We assumed that water will be collected from 2050 square miles. Rainfall ranges from 12 to 16 inches per year in the region, and infiltration is from 2 to 8 inches per year. It is conservative to assume that installation of a distributed system of infiltration basins will increase infiltration in this area by an average of 3 inches per year, corresponding to collection of four storms of ¾ inches (or a larger number of smaller storms). Thus total infiltration will be 300,000 acre-feet per year. Some of this may be unrecoverable, having entered contaminated or otherwise unusable aquifers. However, even this will contribute to reducing the problems of seawater intrusion. We estimate that about 90% or 270,000 acre-feet of the infiltrated water will be available.
Current importation costs are about $450 per acre-foot. However, current supply shortages are forcing serious consideration of desalination as an alternative source because political and environmental factors preclude significant increases in importation. We predict that continued growth in the Los Angeles Region will require that water be obtained from such high-cost sources, so we have used $800 per acre-foot as the value of the infiltrated ground water. Further, even if water is available for $450 per-acre foot, this is only the marginal financial cost of import—the true life cycle cost, including environmental impacts in source areas, is surely much higher. 270,000 acre-feet of water per year at $800 per acre-foot amounts to $216 million per year. The present worth of this income stream is $7.2 billion.
The appropriate number is highly dependent on assumptions: if conservation measures are effective and growth is slow, desalination might not be necessary. However if we include the costs of political friction with source areas, and the environmental impact of water transfers on those areas—that is, the full life-cycle cost of imported water, even the cost estimate of $800 per acre-foot may be low.
Flood Control The flood control system in Los Angeles County is currently designed to cope
with runoff from areas with a runoff coefficient on the order of 0.5. Stormwater quality control measures could substantially reduce this number—currently the coefficient for the San Gabriel Valley, measured below the spreading grounds at Whittier Narrows, is 0.05. Calculations suggest that the recent Army Corps of Engineers project that raised the embankments along the lower Los Angeles River have eliminated the 100-year flood plain for now, and property owners have correspondingly been relieved of flood insurance costs of $20 million or $30 million per year. However, if development
Appendix H Task B
69
continues to increase the runoff coefficient of the region, progressively more expensive projects will be required—it is likely that further protection would require rebuilding many bridges. Alternatively, flood insurance will once again be necessary, and uninsured properties will be at risk. It is perhaps reasonable to presume that infiltration systems will avoid the cost of the next embankment project, which could easily costs twice as much as the one just completed, or $400 million.
A second estimate can be developed this way: The National Flood Insurance Program says there are 25,620 policies held in Los Angeles County with an average premium of $550, for a total yearly cost of $14 million. The present worth at 3% is $466 million. Presumably, most but not all of this could be avoided with a complete stowmwater quality control system. Thus the estimate of $400 million seems reasonable.
Property Value Improvements from Greenspace and Water Certainly additional parks and other greenspace would add to property values.
Developers frequently add central lakes or greenspace to large developments, demonstrating their belief that the value of the land for additional housing is less than its value as an amenity. In a study compiled in 1995, the U.S. EPA said (U.S. EPA, 1995):
“People have a strong emotional attachment to water, arising from its aesthetic qualities--tranquility, coolness, and beauty. As a result, most waterbodies within developments can be used as marketing tools to set the tone for entire projects (Tourbier and Westmacott, 1992). A recent study conducted by the National Association of Home Builders indicates that "whether a beach, pond, or stream, the proximity to water raises the value of a home by up to 28 percent." A 1991 American Housing Survey conducted by the Department of Housing and Urban Development and the Department of Commerce also concurs that "when all else is equal, the price of a home located within 300 feet from a body of water increases by up to 27.8 percent" (NAHB, 1993). Dick Dillingham, President of the National Association of Realtors' Residential Sales Council, declares, "Water makes a difference . . . there is such a very small supply of properties that can claim a water location and it is something you cannot add" (Lehman, 1994).”
Homes overlooking the new wetlands and greenspace will see the greatest increase in property values. Those farther away will appreciate less. A study reported by Fairfax County, Virginia, (Environmental Coordinating Committee, 2003) interpreted the EPA results and concluded that an aesthetically valuable pond raises the value of nearby houses by $10,000 each. In Los Angeles County, the median home is valued at about $400,000, so a $10,000 increase is about 2.5%, which seems a reasonable number. Demographic data for Los Angeles County (This is not the same as the Los Angeles Region governed by the Water Quality Control Board, but there is considerable overlap, and the demographics are quite similar) indicate there are 3.27 million homes, of which 47.9%, or 1.55 million, are owner-occupied. We expect that about one-third of these, or 500,000 homes, would benefit from additional greenspace in a complete stormwater control system (the others could be too remote, or might already have sufficient greenspace). Increasing the value of each home by $10,000 provides a total benefit of $5 billion.
Appendix H Task B
70
Improved Property Values from Trash Control Enforcement of litter laws and improved street cleaning would improve the
appearance of our neighborhoods. It is believed that the esthetic improvement would have a value to individuals at least equal to the esthetic benefits of a cleaner ocean, so we have valued this at $100 per person, for a total of $950 million.
Cost Savings from Reduced Dredging Costs for sediment dredging and disposal in area harbors range from about $10
per ton, when the sediment is clean and a nearby disposal site is available, to $30 per ton when the sediment is contaminated or the disposal site is distant. Disposal of sediments classified as toxic may cost $100 per ton. Personnel at Los Angeles Harbor estimate that about 40% of currently dredged sediment is contaminated, and occasional loads are toxic. In general, acceptable disposal sites are becoming harder to find, so distant sites are likely to be the rule. Thus, an estimate for future sediment removal of $30 per ton is reasonable. The Environmental Protection Agency has estimated overall costs and effectiveness for sediment control at construction sites, and the results indicate that preventing the runoff of a ton of sediment costs from $69 to $86 (Appendix II). Therefore, the savings associated with alleviation of harbor sedimentation alone offset about a third of the costs of construction site measures. Savings for Los Angeles Harbor will be about $3 million per year. Regional savings will be about $10 million, with a present worth of $330 million.
To cite another example, it is estimated that the San Joaquin Marsh wetland preserve collects 50,000 tons of sediment per year. Assuming a removal cost of $30 per ton, the benefit for Newport Bay, which is just downstream, is $1.5 million per year.
Cost Savings from Improved Public Health Sufficient data do not exist for estimating the value of benefits from reduced
exposure to air pollutants. Certainly fine particles are an important part of the causes of health impairment, and experts agree that resuspension of road dust is an important contributor to fine particle exposure at street level where we live. They also contribute substantially to settlement of dust and dirt on buildings, requiring cleaning expenses. However, estimates of the magnitude of this effect are not currently possible.
Summary of predicted costs and benefits Table 3 presents a summary of the estimated costs and benefits. Three estimates
are included. In the first (A), non-structural BMPs are presumed to be the only measures employed. In the second (B), wetlands and infiltration basins are assumed, and the costs are estimated on a cost-per-square-mile basis. The third set of columns (C) again describes the wetlands and infiltration basins scenario, but makes cost estimates on a per-acre-foot-detention basis. The second and third estimates also presume implementation of the non-structural BMPs, except for storm drain cleaning.
Benefits differ because implementation on non-structural BMPs does not produce property increases associated with greenspace, does not significantly increase groundwater supply, and does not reduce harbor sedimentation.
The costs of stormwater quality control are significant. Non-structural BMPs alone will cost $2.6 billion. Structural systems, including wetlands and infiltration basins, will cost between $5.7 billion and $7.4 billion. However, it should be noted that these costs will be borne over a period of many years—probably ten years at least. More
Appendix H Task B
71
importantly, the benefits of these expenditures considerably exceed their costs. For the non-structural BMPs alone, the benefit-to-cost ratio is 1.9. For the structural approach the estimates are 2.5 and 3.3. Control of pollution and reestablishment of the hydrologic cycle will produce a greener city with higher property values, better esthetics, cleaner rivers and a cleaner ocean, and a larger and more stable water supply.
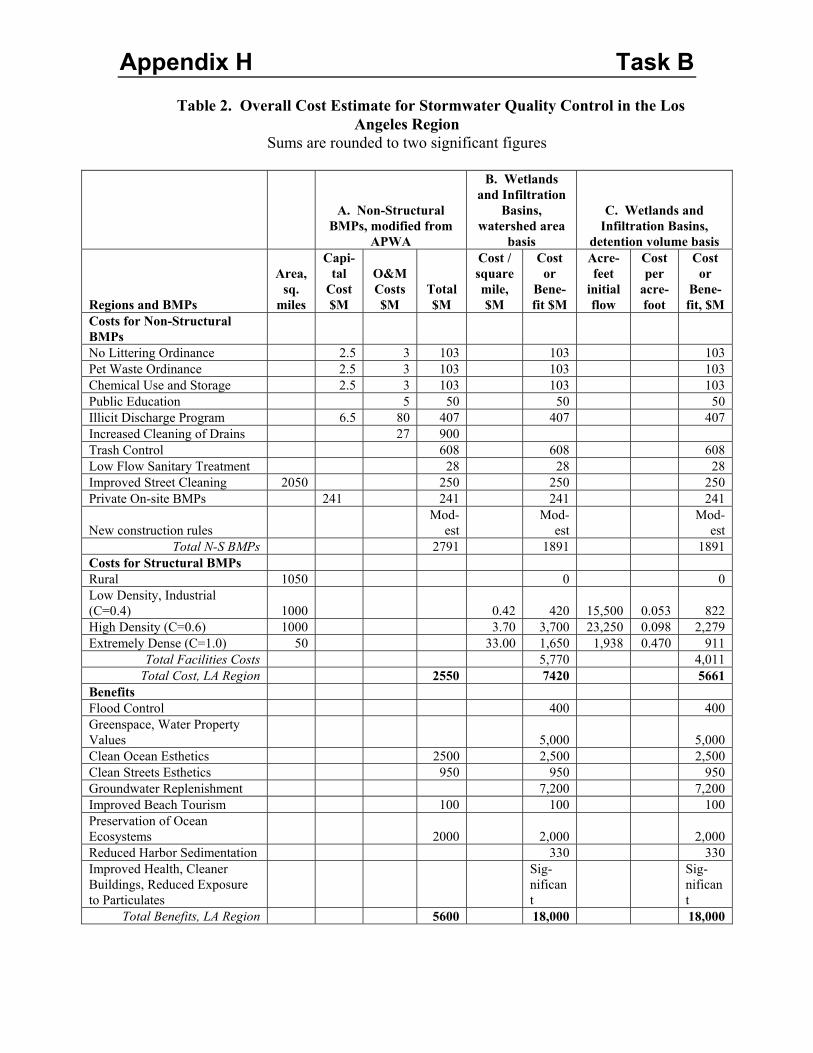
Appendix H Task B
Table 2. Overall Cost Estimate for Stormwater Quality Control in the Los Angeles Region
Sums are rounded to two significant figures
A. Non-Structural BMPs, modified from
APWA
B. Wetlands and Infiltration
Basins, watershed area
basis
C. Wetlands and Infiltration Basins,
detention volume basis
Regions and BMPs
Area, sq.
miles
Capi-tal
Cost $M
O&M Costs $M
Total $M
Cost / square mile, $M
Cost or
Bene-fit $M
Acre-feet
initial flow
Cost per
acre-foot
Cost or
Bene-fit, $M
Costs for Non-Structural BMPs No Littering Ordinance 2.5 3 103 103 103 Pet Waste Ordinance 2.5 3 103 103 103 Chemical Use and Storage 2.5 3 103 103 103 Public Education 5 50 50 50 Illicit Discharge Program 6.5 80 407 407 407 Increased Cleaning of Drains 27 900 Trash Control 608 608 608 Low Flow Sanitary Treatment 28 28 28 Improved Street Cleaning 2050 250 250 250 Private On-site BMPs 241 241 241 241
New construction rules Mod-
est Mod-
est Mod-
est Total N-S BMPs 2791 1891 1891
Costs for Structural BMPs Rural 1050 0 0 Low Density, Industrial (C=0.4) 1000 0.42 420 15,500 0.053 822 High Density (C=0.6) 1000 3.70 3,700 23,250 0.098 2,279 Extremely Dense (C=1.0) 50 33.00 1,650 1,938 0.470 911
Total Facilities Costs 5,770 4,011 Total Cost, LA Region 2550 7420 5661
Benefits Flood Control 400 400 Greenspace, Water Property Values 5,000 5,000 Clean Ocean Esthetics 2500 2,500 2,500 Clean Streets Esthetics 950 950 950 Groundwater Replenishment 7,200 7,200 Improved Beach Tourism 100 100 100 Preservation of Ocean Ecosystems 2000 2,000 2,000 Reduced Harbor Sedimentation 330 330 Improved Health, Cleaner Buildings, Reduced Exposure to Particulates
Sig-nificant
Sig-nificant
Total Benefits, LA Region 5600 18,000 18,000
Appendix H Task B
Recommendations for Action
The results developed here indicate that a distributed approach to stormwater quality control, employing non-structural BMPS with a system of wetlands and infiltration basins will achieve stormwater quality compliance and will be far cheaper than advanced treatment plants. It is recommended that the responsible organizations begin immediately with the non-structural measures, analyze their effectiveness, and add wetlands and infiltration systems as necessary to achieve the goal of protecting the rivers and coastal zones of the Los Angeles Region. Our results indicate that the benefit-to-cost ratio for the non-structural BMPs is about two, and for the larger effort is about 3. Thus both the beginning effort and the full response represent good investments for the people of the region.
Outreach Municipalities that are finding themselves responsible for stormwater cleanup
should act immediately to lay the groundwork for comprehensive programs. Outreach programs should be developed to inform the public of the problems and of what they can do to help with the solution. Vigorous efforts to reduce littering, for example, will reduce costs in subsequent steps as programs develop. Current regulations controlling release of sediments from construction sites should be enforced and supplemented with contractor education efforts.
Data Collection and Planning Municipalities should immediately begin the process of determining the extent
and nature of their individual stormwater quality problems. Many may find, for example, that stormwater from neighborhoods of single-family homes can be discharged to rivers or infiltrated with little or no treatment. Early identification and elimination of problem sources might greatly reduce later expenditures on treatment systems—the programs of thorough data collection and vigorous enforcement described earlier were notably effective at reducing pollutant concentrations in discharges and cost very little. It will certainly be a tragedy if we build expensive treatment systems to solve a problem that can be eliminated with a citation.
Municipalities should also immediately assess their property holdings. Cities frequently own substantial amounts of land, and some of this will be appropriate for stormwater control facilities. Purchasing programs should be developed immediately, so that cities can take advantage of opportunities for economical land acquisition as they arise.
Administrative Structure Adding to the daunting technical and financial problems, the distributed approach
for stormwater control requires that problems be solved by a holistic effort for each sub-watershed. The boundaries of sub-watersheds do not correspond to political boundaries, and cities will be forced to cooperate in ways that have never been required before. Further, controlling local pollution releases and restoring the hydrologic cycle involve issues that have traditionally be dealt with by an astonishing variety of agencies. If we imagine controlling the runoff quality of a sub-watershed by installing a park/infiltration system with associated wetlands, for example, efforts should include the sanitation
Appendix H Task B
74
districts for the cities overlapping the sub-watershed (because of stormwater quality control), the Water Replenishment District (because of groundwater infiltration), the County Flood Control District (because the park will contribute to flood control and reduce the cost of downstream facilities), parks departments (because a recreational area will result), and wildlife agencies (governing the habitat created). It is reasonable to expect, moreover, that each of these agencies will contribute to the funding necessary for construction and maintenance. It is likely that, with appropriate apportionment, such a facility will have a favorable cost/benefit ratio for each of the agencies involved. It is certain that gaining the cooperation and contributions of all of these agencies will be extremely difficult. It may be appropriate that legislation be passed at the state level to provide a means for bringing these agencies together.
Funding While runoff quality can be controlled by methods significantly cheaper than the
massive construction of advanced treatment plants, the cost remains significant, and comes at a time when state and local governments are desperately short of funds. It is reasonable to suggest that funding should come from those who contribute to the problem, so that the taxation system mimics a market—assigning costs to the activity that generates them. Hundreds of municipal stormwater utilities, for example, have instituted a tax that is proportional to the number of square feet of impermeable surface on the land. An extension to this approach is to give property-owners fee rebates for installing BMPs that lower runoff quantity or increase water quality. This approach, or others that encourage owners to reduce their runoff, could fund the solution even as they reduce the magnitude of the problem. Certainly fines for littering should be used to fund litter law enforcement in the way that parking fines fund parking enforcement. Efforts to control illegal discharges could be at least partially supported by fines of those making the discharges. All of these approaches would be consistent with the principle that the polluter should pay, and would provide incentives that would contribute to stormwater cleanup.
A “cap and trade” system would be one means of approaching the funding dilemma. If all landowners were given the choice of either purchasing tradable discharge allowances or cleaning up runoff, a free-market trading system would allow owners to trade these allowances and in the process assign stormwater runoff reduction to owners who are able to cheaply install BMPs. This system, or a combined stormwater utility fee with BMP credits, would tend to produce the lowest cost solution overall. A study under way in Cincinnati, Ohio, suggests that such systems could be successful (Thurston et al., 2003).
Changes in Building Codes This study indicates that parking lots constitute a significant resource for
promoting stormwater infiltration. Building codes should be amended immediately to require that all new or reconstructed parking lots be designed to infiltrate the water that they collect. While there will be costs associated with the infiltration systems, the work described above indicates that much—and often all—of these costs can be offset by reduced costs for curbs and drainage systems.
Appendix H Task B
75
Very large facilities, such as those for malls, should be considered sites for installation of subsurface infiltration vaults that could receive water from surrounding areas as well. These could be installed in sections, to minimize disruption to the commercial establishments. A mechanism could be established by which the site owners are compensated for the costs of handling the runoff.
Other building codes should be changed to encourage on-site infiltration of water rather than rapid drainage to the street. It may also be appropriate to consider limitations on the use of architectural copper sheeting, which can release copper ions to stormwater, and on the use of galvanized materials, which can release zinc.
Purchase of High-Efficiency Street Sweeping Equipment Improved street sweeping seems very likely to be an important part of future
stormwater programs. It can remove 30 to 50 percent of the particulate-associated pollutants, substantially reducing the load on downstream systems. It will have the secondary benefits of improving neighborhood appearance and reducing the exposure to air pollutants at street level. Municipalities should make the decision now to purchase only high-efficiency vacuum sweepers as they make routine replacements of their street cleaning machinery.
Investigation of Coliform Sources Additional studies, particularly employing newly available methods for rapid
identification of microorganisms, should be done to determine the sources of pathogenic organisms in stormwater.
Acknowledgements
This report was prepared with the financial support of the Los Angeles Regional Water Quality Board and the State Water Resources Control Board, and assistance from Susan Cloke, Dennis Dickerson, and Xavier Swamikannu. Bowman Cutter and Bob Vos provided critical reviews. Arash Bina performed library searches and summarized some source documents.
Appendix H Task B
76
References
American Society of Civil Engineers. 2003. International Stormwater Best Management
practices (BMP) Database, http://www.bmpdatabase.org/index.htm . APWA, 1992. A Study of Nationwide Costs to implement Municipal Stormwater Best
Management Practices. American Public Works Association, Southern California Chapter. May. James M. Montgomery.
Bachand, P.A.M., 2003. Considerations of Costs and Benefits for Various Wetland Types on Treasure Island. http://www.lib.berkeley.edu/WRCA/bayfund/pdfs/01_17Considerations.pdf
California Employment Development Department, 2001. California Size of Business Report, 2001. Third Quarter Payroll and Number of Businesses by Size Category, Classified by County for California, Third Quarter, 2001. http://www.calmis.cahwnet.gov/FILE/INDSIZE/1SFCORU.HTM
Costanza, R. R. d’Arge, R. de Groot, S. Farber, M. Grasso, B. Hannon, K. Limburg, S. Naeem, R.V. O’Neill, J. Paruelo, R.G. Raskin, P. Sutton, and M. van den Belt, 1997. The value of the world’s ecosystem services and natural capital. Nature, 387:253-260.
Environmental Coordinating Committee, 2003. The role of regional ponds in Fairfax County’s Watershed Management. Fairfax County, Virginia, http://www.co.fairfax.va.us/gov/dpwes/Watersheds/ponds.htm.
FHWA, 2003. Stormwater Best Management Practices in an Ultra-Urban Setting: Selection and Monitoring, http://www.fhwa.dot.gov/environment/ultraurb/5mcs9.htm
Fine, J.D., 2003. The Economic Benefits of Treasure Island Wetlands. http://www.lib.berkeley.edu/WRCA/bayfund/pdfs/01_17EconomicBenefits.pdf
Galvanis, Ruth, 2003. Personal Communication. Director, Treasure Islands Wetlands Project.
Glanton, T., M.T. Garrett, and B. Gology. 1992. The Illicit Connection: Is It the Problem? Water Environment & Technology. 4(9):63-68.
Herrera Environmental Consultants, Inc., 2001. Cost Analysis: Washington Department of Ecology Year 2001 Minimum Requirements for Stormwater Management in Western Washington. Washington State Department of Ecology and the Washington State Department of Transportation, August 30.
Hill, D, 2003. Personal Communication. Public Services Director, Public Services Department, Murray, Utah.
Kharaghani, Sharam, 2003. Los Angeles Bureau of Sanitation, Personal communication. Kramer, R.A., 2003. “Putting a Price on Water Quality”,
http://www.env.duke.edu/news/ar99/ar99-kramer2.html, Duke University Larsen, D.M., and D.K. Lew, 2003. Clean Water in California: What is it Worth?
Department of Agricultural and Resource Economics, University of California at Davis, Davis, California.Lehman, H. J. 1994, January 8. Study Finds Environment Affects a Home's Value. The Washington Post. p. E, 1:4. (Reference from U.S. EPA, 1995)
Appendix H Task B
77
Los Angeles County Department of Public Works, 2003. Draft Sun Valley Watershed Management Plan, Los Angeles, California.
Los Angeles Regional Water Quality Control Board, 2001. Fact sheet/Staff Report for the County of Los Angeles Municipal Storm Water MPDES Permit (CAS004001), Order No. 01-182. 54 pp.
N. Gardiner, C. Paulson, and G. Hoag, 2003. Regional solutions for treating stormwater in Los Angeles County: a macrofeasibility study. Brown and Caldwell, The Construction Industry Coalition on Water Quality, April, 15 pp.
NAHB. 1993. Housing Economics. National Association of Home Builders, Washington, DC. (Reference from U.S. EPA, 1995)
NRDC (Natural Resources Defense Council), 1999. Stormwater Strategies: Community Responses to Stormwater Pollution. http://www.nrdc.org/water/pollution/storm/stoinx.asp , and on CD, NRDC, New York, NY.
Pomaville, Dave, 2003. Environmental Resources Manager, Fresno Metropolitan Flood Control District. Personal communication.
Roy, S.P., M.M. Quigley, and S. Danos, 2003. A Retrofit for Long Lake, Civil Engineering, April. pp74-79.
Shane, M.A., nd T.E. Graedel, 2000. “Urban Sustainability Metrics: a Provisional Set”, Journal of Environmental Planning and Management. 43(5):643-663.
Soderqvist http://www.beijer.kva.se/publications/pdf-archive/artdisc128.pdf Soderqvist, T., and H. Scharin, 2000. The Regional Willingness to Pay for a Reduced
Eutrophication in the Stockholm Archipelago. Beijer Discussion Paper No. 128, Beijer Internation Institute of Ecological Economics, Stockholm, Sweden.
Strecker, E., P. Mangarella, N. Brandt, T. Hesse, R. Muneepeerakul, K. Rathfelder, and M. Leisenring, 2002. Development of the San Diego Creek Natural Treatment System, Geosyntec Consultants, Portland, Oregon. 19 pp.
Strecker, E.W., P. Mangarella, N. Brandt, T. Hesse, R Muneepeerakul, K. Rathfelder, and M. Leisenring, 2003. Development of the San Diego Creek Natural Treatment System. Proceedings of the National Conference on Urban Storm Water: Enhancing Programs at the Local Level. February 17-20, Chicago, IL. Office of Research and Development, United States Environmental Protection Agency, EPA/625/C-03/003. pp 470-488.
Thurston, H., B. Lemberg, and H. Goddard, 2003. “Shepherd Creek, Cincinnati, OH Using Tradable Credits to Control Excess Stormwater Runoff. http://www.epa.gov/ORD/NRMRL/std/seb/tradeablecredits.htm
Tourbier, J. T., and R. Westmacott. 1992. Lakes and Ponds. 2d ed. The Urban Land Institute, Washington, DC. (Reference from U.S. EPA, 1995)
U.S. EPA, 1995. Economic Benefits of Runoff Controls, Office of Wetlands, Oceans and Watersheds (4503F), EPA 841-S-95-002, September.
USEPA Office of Wastewater Management, 1999. Economic Analysis of the Phase II Storm Water Rule. Washington, D.C.
Washington State Department of Ecology, Water Quality Program, August, 2001. Stormwater Management Manual for Western Washington, Publication Numbers 99-11 through 99-15, Department of Printing, Olympia WA 98507-0789.
Appendix H Task B
78
Weiss, K.R., 2003. “The State; coastline a Top Priority, Poll Finds; A proenvironment consensus emerges as a majority of Californians support protecting the state’s beaches, even if it costs them more”. Los Angeles Times, November 13.
Wetzig, R., 2003. Personal Communication. Alameda Countywide Clean Water Program.
Wolch, J., J.P. Wilson, and J. Fehrenback, 2002. Parks and Park Funding in Los Angeles: An Equity Mapping Analysis, Sustainable Cities Program and GIS Research Laboratory, University of Southern California, Los Angeles. 30 pp.
Appendix H Task B
79
APPENDIX I. BEST MANAGEMENT PRACTICES FOR CONSTRUCTION SITES
(Adapted from the Washington State Department of Ecology Water Quality Program, 2001).
The 12 Elements of Storm Water Pollution Prevention Plan (SWPPP):
Mark Clearing Limits
Prior to beginning land disturbing activities all clearing limits, sensitive areas and their buffers, and trees that are to be preserved shall be clearly marked, both in the field and on the plans, to prevent damage and offsite impacts.
Preserving Natural Vegetation The purpose of preserving natural vegetation is to reduce erosion wherever
practicable. Limiting site disturbance is the single most effective method for reducing erosion.
Buffer Zones An undisturbed area or strip of natural vegetation or an established suitable
planting will provide a living filter to reduce soil erosion and runoff velocities. High Visibility Plastic or Metal Fence, Stake and Wire Fence Fencing is intended to: (1) restrict clearing to approved limits; (2) prevent
disturbance of sensitive areas, their buffers; (3) limit construction traffic to designated construction entrances or roads; and, (4) protect areas where marking with survey tape may not provide adequate protection.
Establish Construction Access
To minimize the tracking of sediment onto public roads and into surface waters: Stabilized Construction Entrance Construction entrances are stabilized to reduce the amount of sediment
transported onto paved roads by vehicles or equipment by constructing a stabilized pad of quarry spalls at entrances to construction sites.
Wheel Wash Wheel washes reduce the amount of sediment transported onto paved roads by
motor vehicles. Construction Road/Parking Area Stabilization
Appendix H Task B
80
Stabilizing subdivision roads, parking areas, and other onsite vehicle transportation routes immediately after grading reduces erosion caused by construction traffic or runoff.
Control Flow Rates
Properties and waterways downstream from development sites shall be protected from erosion due to increases in the volume, velocity, and peak flow rate of stormwater runoff from the project site.
Sediment Trap A sediment trap is a small temporary ponding area with a gravel outlet used to
collect and store sediment from sites cleared and/or graded during construction. Temporary Sediment Pond Sediment ponds remove sediment from runoff originating from disturbed areas of
the site. Sediment ponds are typically designed to remove sediment no smaller than medium silt (0.02 mm).
Install Sediment Controls
Straw Bale Barrier To decrease the velocity of sheet flows and intercept and detain small amounts of
sediment from disturbed areas of limited extent, preventing sediment from leaving the site.
Brush Barrier The purpose of brush barriers is to reduce the transport of coarse sediment from a
construction site by providing a temporary physical barrier to sediment and reducing the runoff velocities of overland flow.
Gravel Filter Berm A gravel filter berm is constructed on rights-of-way or traffic areas within a
construction site to retain sediment by using a filter berm of gravel or crushed rock. Silt Fence Use of a silt fence reduces the transport of coarse sediment from a construction
site by providing a temporary physical barrier to sediment and reducing the runoff velocities of overland flow.
Vegetated Strip Vegetated strips reduce the transport of coarse sediment from a construction site
by providing a temporary physical barrier to sediment and reducing the runoff velocities of overland flow.
Straw Wattles
Appendix H Task B
81
Straw wattles are temporary erosion and sediment control barriers consisting of straw that is wrapped in biodegradable tubular plastic or similar encasing material. They reduce the velocity and can spread the flow of rill and sheet runoff, and can capture and retain sediment.
Sediment Trap A sediment trap is a small temporary ponding area with a gravel outlet used to
collect and store sediment from sites cleared and/or graded during construction.
Temporary Sediment Pond Sediment ponds remove sediment from runoff originating from disturbed areas of
the site. Sediment ponds are typically designed to remove sediment no smaller than medium silt (0.02 mm).
Construction Stormwater Chemical Treatment Turbidity is difficult to control once fine particles are suspended in stormwater
runoff from a construction site. Sedimentation ponds are effective at removing larger particulate matter by gravity settling, but are ineffective at removing smaller particulates such as clay and fine silt. Sediment ponds are typically designed to remove sediment no smaller than medium silt (0.02 mm). Chemical treatment may be used to reduce the turbidity of stormwater runoff.
Construction Stormwater Filtration Filtration removes sediment from runoff originating from disturbed areas of the
site.
Stabilize Soils
Exposed and unworked soils shall be stabilized by application of effective BMPs that protect the soil from the erosive forces of raindrops, flowing water, and wind.
Temporary and Permanent Seeding Seeding is intended to reduce erosion by stabilizing exposed soils. A well-
established vegetative cover is one of the most effective methods of reducing erosion.
Mulching The purpose of mulching soils is to provide immediate temporary protection from
erosion. Mulch also enhances plant establishment by conserving moisture, holding fertilizer, seed, and topsoil in place, and moderating soil temperatures.
Nets and Blankets Erosion control nets and blankets are intended to prevent erosion and hold seed
and mulch in place on steep slopes and in channels so that vegetation can become well established. In addition, some nets and blankets can be used to permanently reinforce turf to protect drainage ways during high flows.
Plastic Covering
Appendix H Task B
82
Plastic covering provides immediate, short-term erosion protection to slopes and disturbed areas.
Sodding The purpose of sodding is to establish permanent turf for immediate erosion
protection and to stabilize drainage ways where concentrated overland flow will occur. Topsoiling Addition of topsoil will provide a suitable growth medium for final site
stabilization with vegetation. While not a permanent cover practice in itself, topsoiling is an integral component of providing permanent cover in those areas where there is an unsuitable soil surface for plant growth. Native soils and disturbed soils that have been organically amended not only retain much more stormwater, but they also serve as effective biofilters for urban pollutants and, by supporting more vigorous plant growth, reduce the water, fertilizer and pesticides needed to support installed landscapes. Topsoil does not include any subsoils but only the material from the top several inches, including organic debris.
Polyacrylamide for Soil Erosion Protection Polyacrylamide (PAM) is used on construction sites to prevent soil erosion.
Applying PAM to bare soil in advance of a rain event significantly reduces erosion and controls sediment in two ways. First, PAM increases the soil’s available pore volume, thus increasing infiltration through flocculation and reducing the quantity of stormwater runoff. Second, it increases flocculation of suspended particles and aids in their deposition, thus reducing stormwater runoff turbidity and improving water quality.
Surface Roughening Surface roughening aids in the establishment of vegetative cover, reduces runoff
velocity, increases infiltration, and provides for sediment trapping through the provision of a rough soil surface.
Gradient Terraces Gradient terraces reduce erosion damage by intercepting surface runoff and
conducting it to a stable outlet at a non-erosive velocity.
Dust Control Dust control prevents wind transport of dust from disturbed soil surfaces onto
roadways, drainage ways, and surface waters.
Small Project Construction Stormwater Pollution Prevention To prevent the discharge of sediment and other pollutants to the maximum extent
practicable from small construction projects.
Protect Slopes
Design, construct, and phase cut and fill slopes in a manner that will minimize erosion, considering soil type and its potential for erosion.
Appendix H Task B
83
Temporary and Permanent Seeding Seeding is intended to reduce erosion by stabilizing exposed soils. A well-
established vegetative cover is one of the most effective methods of reducing erosion. Surface Roughening Surface roughening aids in the establishment of vegetative cover, reduces runoff
velocity, increases infiltration, and provides for sediment trapping through the provision of a rough soil surface.
Gradient Terraces Gradient terraces reduce erosion damage by intercepting surface runoff and
conducting it to a stable outlet at a non-erosive velocity.
Interceptor Dike and Swale Provide a ridge of compacted soil, or a ridge with an upslope swale, at the top or
base of a disturbed slope or along the perimeter of a disturbed construction area to convey stormwater. Using the dike and/or swale to intercept the runoff from unprotected areas and direct it to areas where erosion can be controlled. This can prevent storm runoff from entering the work area or sediment-laden runoff from leaving the construction site.
Grass-Lined Channels Channels lined with grass can convey runoff without erosion, and will provide
some degree of treatment and infiltration.
Pipe Slope Drains Piping can be used to convey stormwater anytime water needs to be diverted
away from or over bare soil to prevent gullies, channel erosion, and saturation of slide-prone soils.
Subsurface Drains Drains below the surface can intercept, collect, and convey ground water to a
satisfactory outlet. These can be a perforated pipe or conduit below the ground surface. The perforated pipe provides a dewatering mechanism to drain excessively wet soils, provide a stable base for construction, improve stability of structures with shallow foundations, or to reduce hydrostatic pressure to improve slope stability.
Level Spreader To provide a temporary outlet for dikes and diversions consisting of an excavated
depression constructed at zero grade across a slope. To convert concentrated runoff to sheet flow and release it onto areas stabilized by existing vegetation or an engineered filter strip.
Check Dams Construction of small dams across a swale or ditch reduces the velocity of
concentrated flow and dissipates energy at the check dam.
Appendix H Task B
84
Triangular Silt Dike (Geotextile-Encased Check Dam) Triangular silt dikes may be used as check dams, for perimeter protection, for
temporary soil stockpile protection, for drop inlet protection, or as a temporary interceptor dike.
Protect Drain Inlets
Storm drain inlets operable during construction shall be protected so that stormwater runoff does not enter the conveyance system without first being filtered or treated to remove sediment.
Storm Drain Inlet Protection To prevent coarse sediment from entering drainage systems prior to permanent
stabilization of the disturbed area:
Stabilize Channels And Outlets
Temporary on-site conveyance channels shall be designed, constructed, and stabilized to prevent erosion from the expected flow velocity of a 2-year, 24-hour frequency storm for the developed condition.
Channel Lining Lining will protect erodible channels by providing a channel liner using either
blankets or riprap. Outlet Protection Outlet protection prevents scour at conveyance outlets and minimizes the
potential for downstream erosion by reducing the velocity of concentrated stormwater flows.
Control Pollutants
All pollutants, including waste materials and demolition debris, that occur on site during construction shall be handled and disposed of in a manner that does not cause contamination of stormwater.
Concrete Handling Concrete work can generate process water and slurry that contain fine particles
and high pH, both of which can violate water quality standards in the receiving water. Concrete handling is intended to minimize and eliminate concrete process water and slurry from entering waters of the state.
Sawcutting and Surfacing Pollution Prevention Sawcutting and surfacing operations generate slurry and process water that
contain fine particles and high pH (concrete cutting), both of which can violate the water quality standards in the receiving water. Collection of this water is intended to minimize and eliminate process water and slurry from entering waters of the State.
Appendix H Task B
85
Control De-Watering
Foundation, vault, and trench de-watering water shall be discharged into a controlled conveyance system prior to discharge to a sediment pond.
Maintain BMPs
Temporary and permanent erosion and sediment control BMPs shall be maintained and repaired as needed to assure continued performance of their intended function. Maintenance and repair shall be conducted in accordance with BMPs.
Manage the Project
Development projects shall be phased where feasible in order to prevent, to the maximum extent practicable, the transport of sediment from the development site during construction. Revegetation of exposed areas and maintenance of that vegetation shall be an integral part of the clearing activities for any phase.
Appendix H Task B
86
APPENDIX II. ESTIMATION OF COSTS FOR CONTROLLING SEDIMENT RELEASES AT CONSTRUCTION SITES
EPA described the costs of the Phase II program in Chapter 4 of the economic analysis (U.S. EPA, 1995). This appendix is a summary of that description, and the figures presented come from that document. The costs were divided into 4 categories: municipal costs, construction costs, federal costs and state costs. Each of these was considered separately.
Construction costs: Construction costs were described in parts 4-8 to 4-25. All the cost calculations
are based on 1998 dollar value. Because the Phase II program targets construction areas of 1 to 5 acres of land,
the cost analysis are done for these land sizes. EPA divided the construction costs into two parts. The first part requires the owners and operators of construction sites disturbing one to five acres of land to plan and implement erosion and sediment control BMPs. The second part requires the implementation of post-construction stormwater runoff controls on construction sites located in Phase II municipalities.
Erosion and sediment control costs EPA developed a national level cost estimate for implementing erosion and
sediment controls on sites that disturb between one and 5 acres. EPA estimated a per site compliance cost for sites of one, three, and five acres and multiplied the cost by the total number of Phase II construction starts expected to incur incremental cost in these size categories to obtain a national cost estimate. EPA used construction start data from fourteen municipalities and 1994 Census Bureau construction permit data to estimate the number of construction starts disturbing between one and five acres of land. Of the estimated 129,675 construction starts likely to incur incremental costs, EPA expects that 110,223 (85%) will require erosion and sediment controls to comply with the regulation.
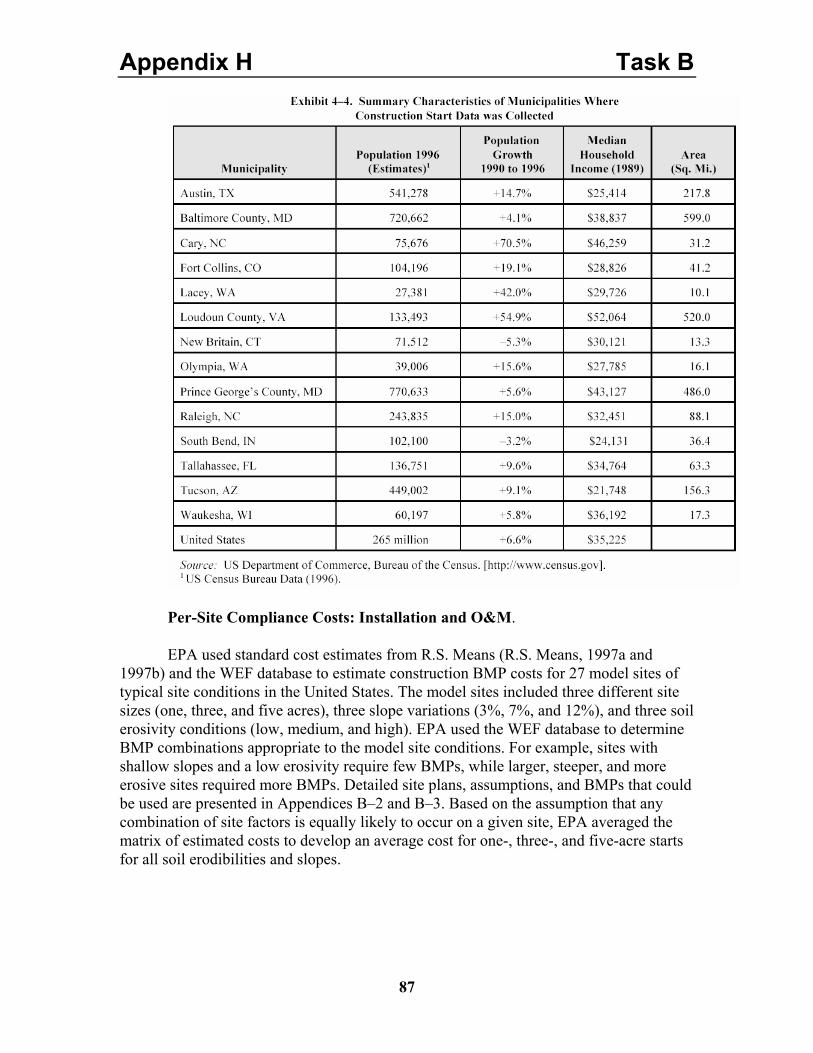
Appendix H Task B
87
Per-Site Compliance Costs: Installation and O&M. EPA used standard cost estimates from R.S. Means (R.S. Means, 1997a and
1997b) and the WEF database to estimate construction BMP costs for 27 model sites of typical site conditions in the United States. The model sites included three different site sizes (one, three, and five acres), three slope variations (3%, 7%, and 12%), and three soil erosivity conditions (low, medium, and high). EPA used the WEF database to determine BMP combinations appropriate to the model site conditions. For example, sites with shallow slopes and a low erosivity require few BMPs, while larger, steeper, and more erosive sites required more BMPs. Detailed site plans, assumptions, and BMPs that could be used are presented in Appendices B–2 and B–3. Based on the assumption that any combination of site factors is equally likely to occur on a given site, EPA averaged the matrix of estimated costs to develop an average cost for one-, three-, and five-acre starts for all soil erodibilities and slopes.
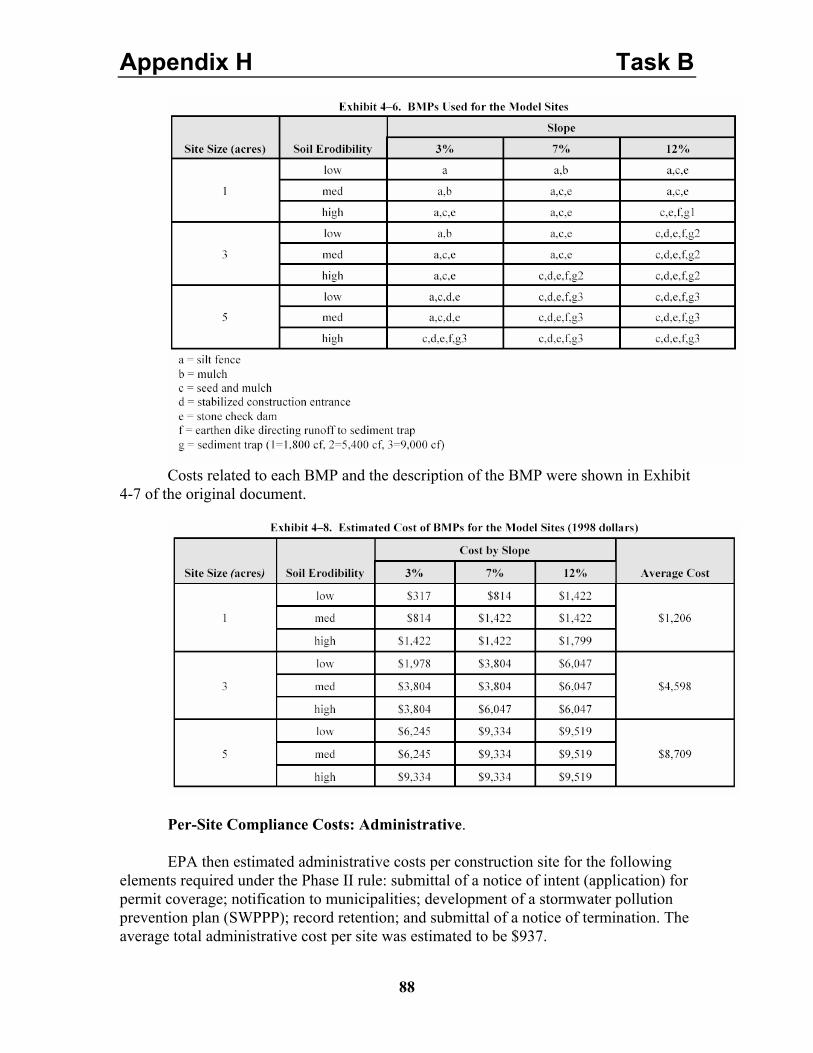
Appendix H Task B
88
Costs related to each BMP and the description of the BMP were shown in Exhibit
4-7 of the original document.
Per-Site Compliance Costs: Administrative. EPA then estimated administrative costs per construction site for the following
elements required under the Phase II rule: submittal of a notice of intent (application) for permit coverage; notification to municipalities; development of a stormwater pollution prevention plan (SWPPP); record retention; and submittal of a notice of termination. The average total administrative cost per site was estimated to be $937.
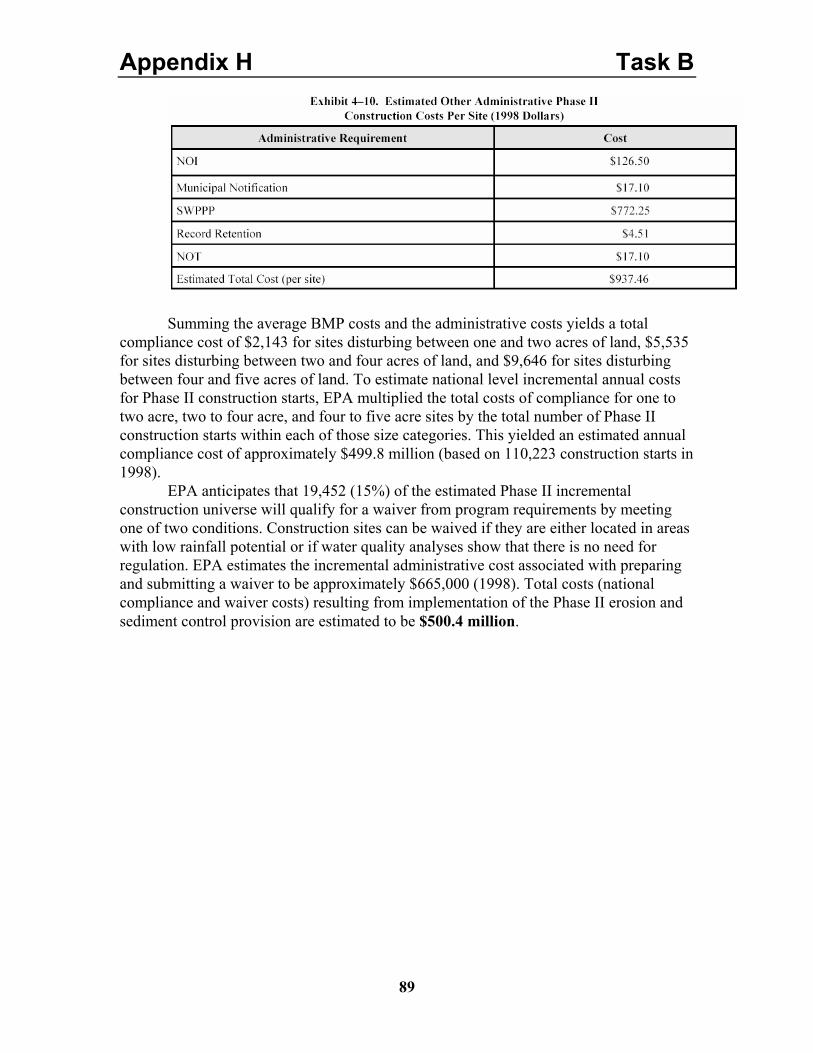
Appendix H Task B
89
Summing the average BMP costs and the administrative costs yields a total
compliance cost of $2,143 for sites disturbing between one and two acres of land, $5,535 for sites disturbing between two and four acres of land, and $9,646 for sites disturbing between four and five acres of land. To estimate national level incremental annual costs for Phase II construction starts, EPA multiplied the total costs of compliance for one to two acre, two to four acre, and four to five acre sites by the total number of Phase II construction starts within each of those size categories. This yielded an estimated annual compliance cost of approximately $499.8 million (based on 110,223 construction starts in 1998).
EPA anticipates that 19,452 (15%) of the estimated Phase II incremental construction universe will qualify for a waiver from program requirements by meeting one of two conditions. Construction sites can be waived if they are either located in areas with low rainfall potential or if water quality analyses show that there is no need for regulation. EPA estimates the incremental administrative cost associated with preparing and submitting a waiver to be approximately $665,000 (1998). Total costs (national compliance and waiver costs) resulting from implementation of the Phase II erosion and sediment control provision are estimated to be $500.4 million.
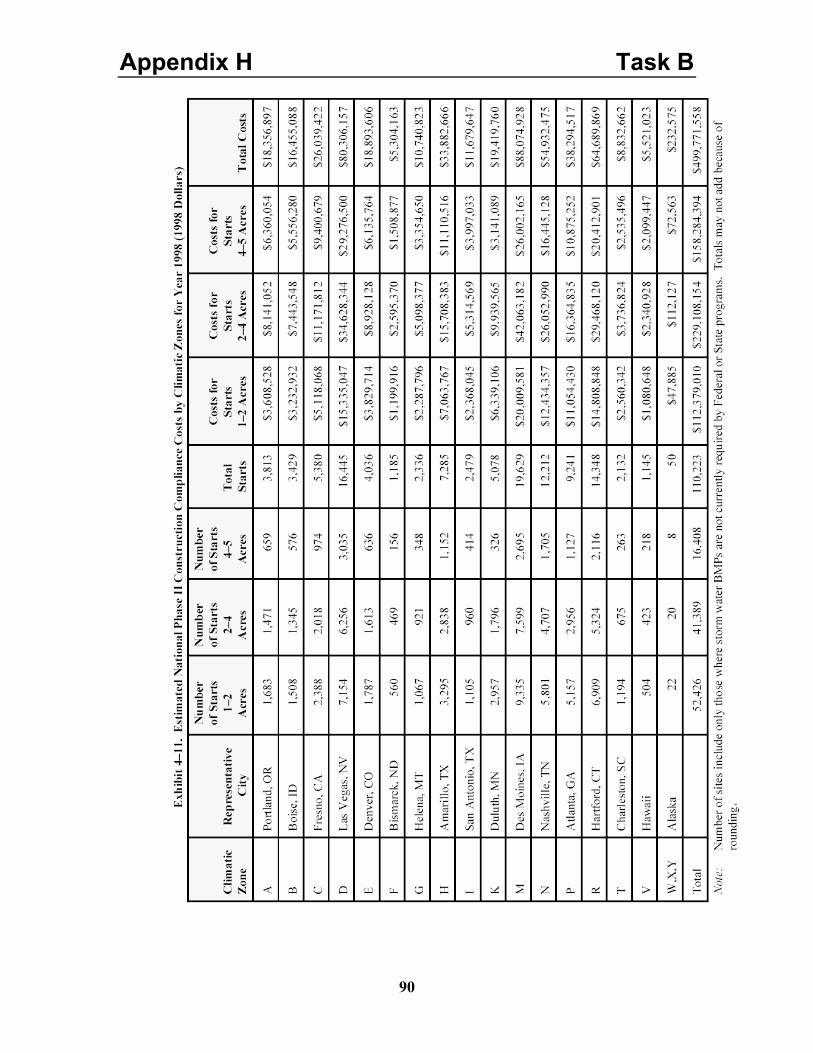
Appendix H Task B
90
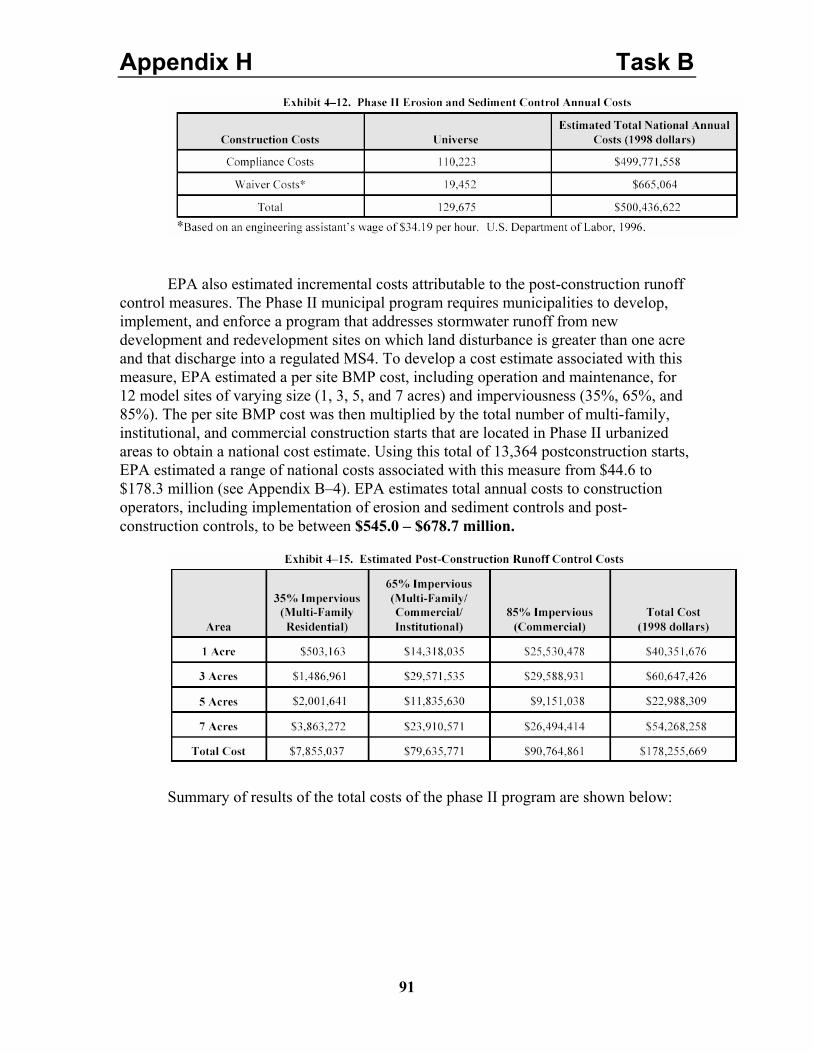
Appendix H Task B
91
EPA also estimated incremental costs attributable to the post-construction runoff
control measures. The Phase II municipal program requires municipalities to develop, implement, and enforce a program that addresses stormwater runoff from new development and redevelopment sites on which land disturbance is greater than one acre and that discharge into a regulated MS4. To develop a cost estimate associated with this measure, EPA estimated a per site BMP cost, including operation and maintenance, for 12 model sites of varying size (1, 3, 5, and 7 acres) and imperviousness (35%, 65%, and 85%). The per site BMP cost was then multiplied by the total number of multi-family, institutional, and commercial construction starts that are located in Phase II urbanized areas to obtain a national cost estimate. Using this total of 13,364 postconstruction starts, EPA estimated a range of national costs associated with this measure from $44.6 to $178.3 million (see Appendix B–4). EPA estimates total annual costs to construction operators, including implementation of erosion and sediment controls and post-construction controls, to be between $545.0 – $678.7 million.
Summary of results of the total costs of the phase II program are shown below:
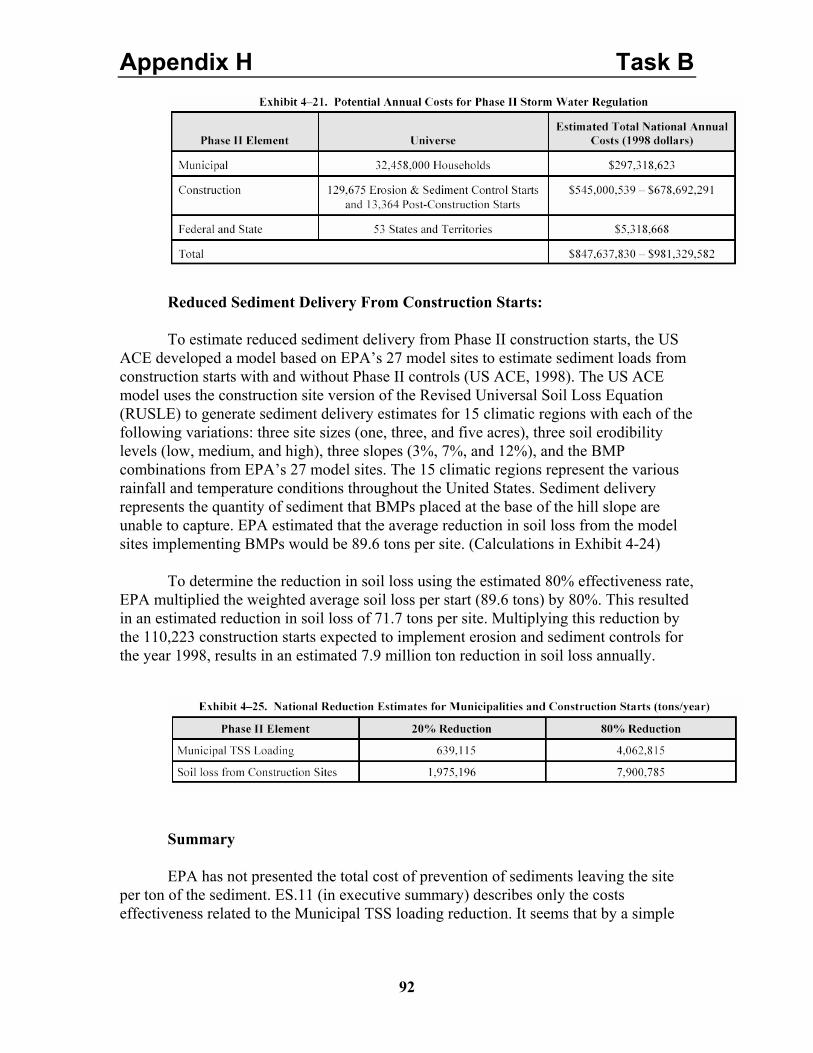
Appendix H Task B
92
Reduced Sediment Delivery From Construction Starts: To estimate reduced sediment delivery from Phase II construction starts, the US
ACE developed a model based on EPA’s 27 model sites to estimate sediment loads from construction starts with and without Phase II controls (US ACE, 1998). The US ACE model uses the construction site version of the Revised Universal Soil Loss Equation (RUSLE) to generate sediment delivery estimates for 15 climatic regions with each of the following variations: three site sizes (one, three, and five acres), three soil erodibility levels (low, medium, and high), three slopes (3%, 7%, and 12%), and the BMP combinations from EPA’s 27 model sites. The 15 climatic regions represent the various rainfall and temperature conditions throughout the United States. Sediment delivery represents the quantity of sediment that BMPs placed at the base of the hill slope are unable to capture. EPA estimated that the average reduction in soil loss from the model sites implementing BMPs would be 89.6 tons per site. (Calculations in Exhibit 4-24)
To determine the reduction in soil loss using the estimated 80% effectiveness rate,
EPA multiplied the weighted average soil loss per start (89.6 tons) by 80%. This resulted in an estimated reduction in soil loss of 71.7 tons per site. Multiplying this reduction by the 110,223 construction starts expected to implement erosion and sediment controls for the year 1998, results in an estimated 7.9 million ton reduction in soil loss annually.
Summary EPA has not presented the total cost of prevention of sediments leaving the site
per ton of the sediment. ES.11 (in executive summary) describes only the costs effectiveness related to the Municipal TSS loading reduction. It seems that by a simple
Appendix H Task B
93
calculation from the two former exhibits (4-24 and 4-25) that the total cost assuming 80% reduction in the sediments would be between $69 - $86 per ton of sediment.

Appendix I Scoping Memo
Contract: 02.189.250.0 Page 1 of 3
MEMORANDUM Date: August 15, 2003 To: Pamela Barksdale, State Water Resource Control
Board
From: Brian Currier 7801 Folsom Boulevard, Suite 102 Sacramento, CA 95826
Subject: Scope for the storm water cost survey
This memorandum presents additional information and recommendations in order to proceed with Task A of the “Survey of Costs to Develop, Implement, Maintain and Monitor Municipal Separate Storm Sewer System (MS4) Stormwater Management Programs (SWMP) and Description of Alternatives for Control of Stormwater Quality in Los Angeles County” (See Attachment A). A presentation of candidate municipalities, corresponding demographics, and recommendations for the six municipalities to be surveyed are presented herein. Nomination of Municipalities The identification of candidate municipalities began with a conference call on June 23, 2003 with the State Water Resources Control Board and representatives from interested Regional Water Quality Control Boards. The scope and intent of the study was shared with the conference call participants. The Regional Boards then nominated municipalities within their jurisdiction that appear are complying with their permits and are taking appropriate steps toward meeting water quality objectives. Some nominees were subsequently eliminated upon further discussion with either the municipality or the regional board. The remaining municipalities are presented in Table 1 along with a limited set of city characteristics.
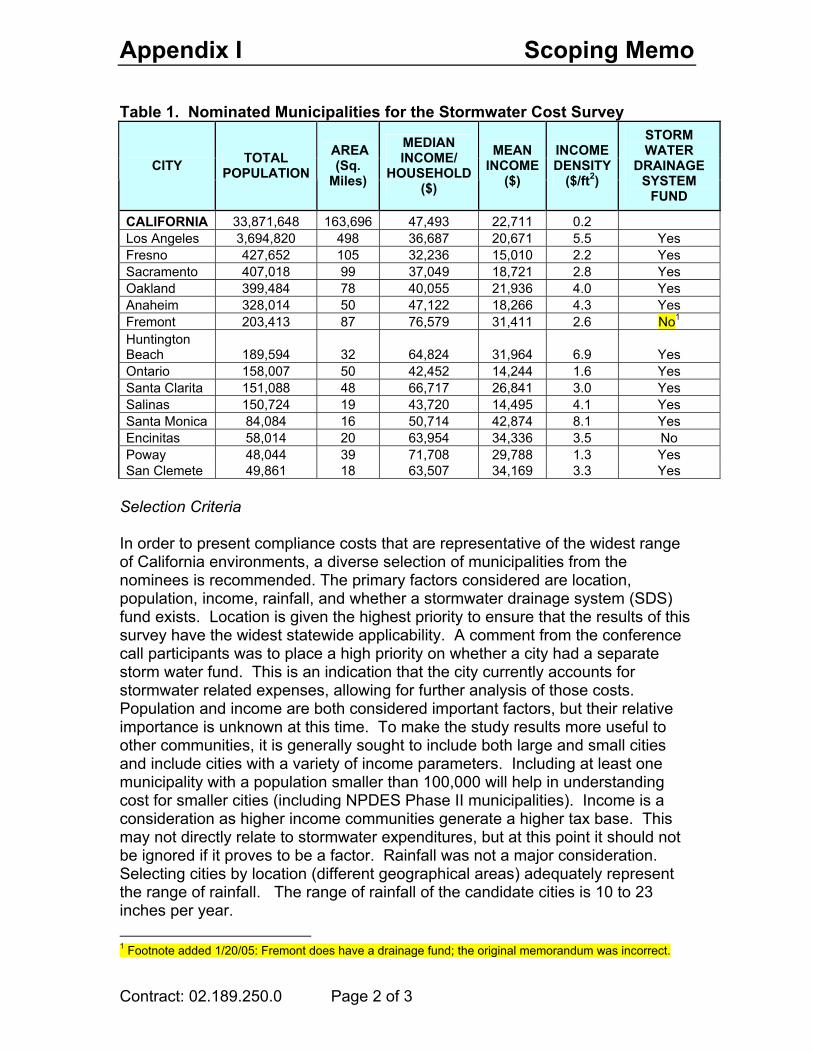
Appendix I Scoping Memo
Contract: 02.189.250.0 Page 2 of 3
Table 1. Nominated Municipalities for the Stormwater Cost Survey
CITY TOTAL POPULATION
AREA (Sq.
Miles)
MEDIAN INCOME/
HOUSEHOLD ($)
MEAN INCOME
($)
INCOME DENSITY
($/ft2)
STORM WATER
DRAINAGE SYSTEM
FUND
CALIFORNIA 33,871,648 163,696 47,493 22,711 0.2 Los Angeles 3,694,820 498 36,687 20,671 5.5 Yes Fresno 427,652 105 32,236 15,010 2.2 Yes Sacramento 407,018 99 37,049 18,721 2.8 Yes Oakland 399,484 78 40,055 21,936 4.0 Yes Anaheim 328,014 50 47,122 18,266 4.3 Yes Fremont 203,413 87 76,579 31,411 2.6 No1 Huntington Beach 189,594 32 64,824 31,964 6.9 Yes Ontario 158,007 50 42,452 14,244 1.6 Yes Santa Clarita 151,088 48 66,717 26,841 3.0 Yes Salinas 150,724 19 43,720 14,495 4.1 Yes Santa Monica 84,084 16 50,714 42,874 8.1 Yes Encinitas 58,014 20 63,954 34,336 3.5 No Poway 48,044 39 71,708 29,788 1.3 Yes San Clemete 49,861 18 63,507 34,169 3.3 Yes
Selection Criteria In order to present compliance costs that are representative of the widest range of California environments, a diverse selection of municipalities from the nominees is recommended. The primary factors considered are location, population, income, rainfall, and whether a stormwater drainage system (SDS) fund exists. Location is given the highest priority to ensure that the results of this survey have the widest statewide applicability. A comment from the conference call participants was to place a high priority on whether a city had a separate storm water fund. This is an indication that the city currently accounts for stormwater related expenses, allowing for further analysis of those costs. Population and income are both considered important factors, but their relative importance is unknown at this time. To make the study results more useful to other communities, it is generally sought to include both large and small cities and include cities with a variety of income parameters. Including at least one municipality with a population smaller than 100,000 will help in understanding cost for smaller cities (including NPDES Phase II municipalities). Income is a consideration as higher income communities generate a higher tax base. This may not directly relate to stormwater expenditures, but at this point it should not be ignored if it proves to be a factor. Rainfall was not a major consideration. Selecting cities by location (different geographical areas) adequately represent the range of rainfall. The range of rainfall of the candidate cities is 10 to 23 inches per year. 1 Footnote added 1/20/05: Fremont does have a drainage fund; the original memorandum was incorrect.
Appendix I Scoping Memo
Contract: 02.189.250.0 Page 3 of 3
Selection Recommendations In considering location, the state can be divided into three sections: north, central, and south. For this exercise, the dividing lines are roughly south of San Jose and north of Santa Clarita. Each section is further distinguished between coastal and inland areas. Thus, one coastal and one inland municipality can be recommended from each section. For Northern California, Fremont, Oakland, and Sacramento are nominated. Sacramento is the only inland city and it has a storm water fund. For coastal areas, Oakland has the advantage over Fremont because of its storm water fund. Oakland also offers a higher population density compared to Sacramento and Fremont. Based on these observations Sacramento and Oakland are recommended for the cost survey, if Oakland can overcome some timing issues regarding availability of staff time to support this project. If not Fremont could be substituted. For Central California, Salinas and Fresno are nominated. They are ideal for location (coastal vs. inland), size (151,000 vs. 428,000), and income density (4$/ft2 vs. 2$/ft2). Therefore, Salinas and Fresno are recommended for the cost survey. For Southern California, the selection is a bit more complex. San Clemente, Anaheim, Huntington Beach, Ontario, Santa Clarita, Santa Monica, Encinitas and Poway are nominated. Because smaller size communities have not been selected anywhere in California it is recommended that one of the two municipalities in Southern California be smaller (i.e. San Clemente, Santa Monica, Encinitas, or Poway). Encinitas (pop 58,000), is recommended based on their small size and upon the strong recommendation by the San Diego Regional Board. Ontario is the furthest inland, followed by Santa Clarita. The Regional Board highly recommends Ontario, and it also has a stormwater fund. Ontario’s willingness to participate has not been confirmed, but their staff that was initially contacted suggested participation may not be a problem. Encinitas and Ontario are recommended for the cost survey. Although it was not used as a criterion in the above process, income characteristics vary adequately among the recommended municipalities. Final selection of municipalities will be made after further consultation with you and the Technical Advisory Group. Please call me with any comments or questions at (916) 278-8109.

Appendix J TAG Comments
NPDES Stormwater Cost Survey J-1 January 2005
APPENDIX J This appendix contains a description of the Technical Advisory Group (TAG), written TAG comments, and action items from the final meeting with the TAG. In the action items, the study team condensed all applicable TAG comments each affected section of the report. Additional notes that did not result in changes to the report are listed after the action items.
TECHNICAL ADVISORY GROUP MEMBERS
Dr. Steven Frates is a Senior Fellow at the Rose Institute of State and Local Government at Claremont McKenna College. Dr. Frates has extensive experience in public policy analysis, with particular emphasis on local government finance. He has served as an assistant in municipal government, as the executive director of a major metropolitan taxpayer association, and on the California Constitutional Revision Commission. Dr. Frates has been a faculty member at the University of Colorado and the University of Southern California, and has lectured at other universities and colleges. Dr. Jay Lund, is Professor of Civil and Environmental Engineering at the University of California in Davis. Dr. Lund’s research involves application of systems analysis, economic, and management methods to infrastructure and public works problems. His recent work is primarily in water resources and environmental system engineering. While most of this work involves the application of economics, optimization, and simulation modeling, his interests also include more qualitative policy, planning, and management studies. His work has applied contemporary methods in cost-effectiveness and benefit-cost analysis to evaluate stormwater quality control measures, including both their costs and their likely water quality benefits. Dr. Lund is a past editor of the ASCE Journal of Water Resources Planning and Management and is a member of the International Water Academy.
Dr. Bowman Cutter is a professor of water resources management at U.C. Riverside in the Department of Environmental Sciences. His research examines cost-effective water pollution regulation, environmental federalism, and state and local environmental enforcement efforts. Current projects examine the effect of water pricing on water pollution and analyzing the cost-effectiveness of using stormwater to recharge Los Angeles area aquifers. He currently serves on the Southern California Association of Government’s Water Policy Task Force.
Eugene Bromley is an environmental engineer with the Environmental Protection Agency. Mr. Bromley has 25 years experience in water quality protection. As stormwater coordinator in EPA Region 9, Mr. Bromley provides expertise to the stormwater programs in California, Arizona, Nevada, and Hawaii. In California, he participates with the California Stormwater Quality Association, giving updates on EPA policy and projects that could affect the members of CASQA.
Dan Radulescu is a senior engineer with the L.A. Regional Water Quality Control Board, MS4 stormwater permit coordinator. Mr. Radulescu has a P.E. registration in civil engineering with the state of California. Mr. Radulescu has extensive experience with stormwater implementation costs and levels of compliance. He was the primary author of a report that reviewed and analyzed stormwater budget data submitted to the Regional Board by L.A. Region permittees.
Appendix J TAG Comments
J-2 NPDES Stormwater Cost Survey January 2005
Robert Hale is a Supervising Scientist for the Alameda County Public Works, Clean Water Division. Mr. Hale is on the Board of Directors for the California Stormwater Quality Association, where he also serves as an Executive Program Committee member. He has many years of experience with stormwater programs, from his work with Alameda County and from his participation and consultation with other stormwater programs throughout the state.
Steven Sedgwick is an environmental engineer with Camp Dresser & McKee Inc. Mr. Sedgwick has more than 35 years of experience in comprehensive drainage and stormwater planning, stormwater utility evaluations, feasibility studies, pilot plant investigations, regional water resources planning, river basin planning, water and wastewater facilities design, land application and site-specific studies, value engineering and engineering assistance during construction.
TECHNICAL ADVISORY GROUP COMMENTS
• GENERAL COMMENTS: For the 2002-3 data, I think that you did an excellent job of collecting and analyzing fragmented and somewhat non-commensurate data in order to look at the costs from two years ago. I also appreciate the depth of thought that went into your discussion of possible future costs (regardless of the shortcomings mentioned above). The nature of the available information has, I think, necessarily limited your ability to predict accurately the magnitude of costs associated with the recently added permit requirements. As a result, the report would seem to be most useful as a baseline or starting point for future cost documentation efforts. (Hale)
• GENERAL COMMENTS: First, we want to commend the research team for their outstanding job to find, if not some definitive answers, at least the right questions regarding this difficult subject of the relationship between costs and the MS4 permits implementation. It is difficult because MEP is not a clearly defined standard, MS4 permits language depend strongly on the local conditions and the willingness of the local communities to implement those requirements to protect water quality in the existing fiscal conditions. There is little guidance, if any, on this subject, and the estimates on the stormwater program implementation varies wildly depending on the initial premises for the study. Another difficult component is to determine a direct relationship between costs and water quality improvements. If we have any comments, they are triggered by the complex nature of the subject and not necessarily because of any shortcomings of the research itself. As we said, very few nationwide studies are focusing on this subject and even U.S. EPA has provided very little guidance on the subject. We also want to point out that this study focuses on the costs, and not necessarily on the benefits in water quality from the measures implemented due to MS4 permits. Therefore the reader of the study must keep in mind that there is an additional dimension of the economic equation when assessing the implications of MS4 permits costs to give a balanced view of the whole issue. (Dan)
• GENERAL COMMENTS: Due to inherent limitations, the research did not evaluate the impact in funding options, Stormwater Utility Fee vs. General Fund. Cities that rely on the General Fund to cover costs of compliance face different challenges than those with a separate, stable and dedicated funding mechanism. It is also true that municipalities funding their storm water MS4 permit costs through General Fund have a higher tendency to apply pre-existing programs, such as street sweeping, trash collection, storm
Appendix J TAG Comments
NPDES Stormwater Cost Survey J-3 January 2005
drain maintenance, etc., and their costs to the mandatory costs of compliance. In their case, it is even more difficult to discern the origin of costs in pre-existing, new, enhanced, in the absence of clear guidelines. In extreme instances, in some cases of municipalities depending on General Fund and pre-existing programs, contingent on how the requirements of the permit and costs are interpreted, the cost of compliance can vary from low hundreds of thousand dollars to a high dozen million dollars (!) per year for the same small municipality. A number of municipalities even pointed out this discrepancy, based on different interpretations, in their annual reports. This lack of guidance also fuels the debate of the correct impact of MS4 permit compliance costs that can vary from single to hundreds of dollars(!) per household per year. Obviously there is a significant difference from manageable to exorbitant costs. Unless there are clear guidelines and transparency on how to determine the correct compliance costs with MS4 permit requirements we will face this debate from reasonable to exorbitant for years to come.
• WATER QUALITY (Sect. 3) Review major water quality problems that SW Program addresses for each city (Lund)
• IDENTIFYING TRUE COSTS: Establish a 1990 costs baseline and then determine what are the true additional costs due to the stormwater regulations by comparing the 1990 baseline with the data investigated (2002-03). One example is to use per capita costs: if in 1990, the city was spending $10/y/capita for street sweeping, in 2002 the cost (in dollars adjusted for inflation) would be (e.g.)$14/y/capita. Then determine the portion attributable to the SWMP implementation and MS4 permit compliance. Only this type of transparent analysis will reveal the true additional costs, new financial burden, mandated by the existing MS4 permits. This type of analysis may add new findings to the one identified presently in the study. This approach should be used for street sweeping, catch basins and storm drain system, trash collection, hazardous waste recycling programs, flood control component of the city’s overall stormwater management, etc…
How these facts impact the conclusion of the research?
These types of observations are very important since they reveal the significant importance of such expenditures, such as street sweeping, in the make up of the attributed costs for compliance with the MS4 permits.
This is even more necessary for cities that depend solely on General Fund money to comply with the MS4 permit requirements. Many pre-existing, well-established programs, in some cities, count now as “exorbitant” MS4 permit costs compliance, when the only change was to move the expense from one column into another in the cities financial reports. (Dan)
• COST/DATA REPORTING: We suggest that a better option for reporting is to use GASB or similar standardized approaches to costs and infrastructure inventory may be a better way to assure transparency. The ways suggested by the research to report cost data seem reasonable, but if this effort can be tied to an existing standardized approach, such as GASB, that may be very valuable since it will provide for consistency statewide and even nationwide. It may be that GASB does not cover all reporting categories. The reporting may use a hybrid between the existing GASB itemization and the approach suggested by the research. An additional approach maybe to lobby the GAS Board to make changes in the accounting rules to allow for water quality itemization. (Dan)
Appendix J TAG Comments
J-4 NPDES Stormwater Cost Survey January 2005
• COST ALLOCATION BY CATEGORY: I would replace the regressions with the interesting analyses contained in appendix G as a starting point. First look at how much the variation in the cost of each program component contributes to the overall cost variation. It appears that the variation in the Municipal category is the biggest driver. However, what I am not sure is whether that is because categories are not consistent across cities and different cities place different costs in the municipal category. Please comment on that possibility. It looks like the variation in overall management is the second biggest driver of the overall cost variation. Again, please comment on whether this is due to “true” cost differences or category-confusion. A very rough statistical methodology to tease this out is to find out the correlation coefficients between each of these two categories and each of the other categories. If you find some strong negative correlations, this is an indicator that really the cost differences are just due to category confusion. In the end this may be a topic that calls for a more qualitative answer. I would like to see a discussion of, taking into account what you know about data quality, whether you think the high cost/household cities tend to have higher costs across the board, or whether their higher costs are generally due to having higher costs in one category or another. From the data, the latter appears to be true, but I don’t have a sense of the data quality and how the categories are affected by cost-shifting. (Cutter)
• BUDGET/COST ALLOCATION: (table 6.2) Can percentages of cost assignment add up to 100% to show how the total budget is allocated? (Lund)
• INDUSTRIAL PROGRAM COST PER INSPECTION AND SITE, AND THE EQUIVALENT NUMBERS FOR THE CONSTRUCTION PROGRAM COSTS. Both these programs have almost order of magnitude differences in costs. Please write up the reasons for these differences more thoroughly. I suspect that some of the reason for these large cost differences is cost-category confusion. You should indicate whether you think that is the case, and then indicate which citie(s)’ normalized inspection costs you judge to be most satisfactory and why. I know this is going out on a limb, but few observations call for a more qualitative analysis. The large cost ranges diminishes the amount of information in the report and an indication of where the cost numbers likely lie for your best data cases would add quite a bit. (Cutter)
• STREET SWEEPING COSTS: Another possible angle to examine the overall cost range is to break out street-sweeping vs. non-street-sweeping expenditures, since street sweeping seems to be the largest element of the biggest category, and see what the cost/household ranges are in this breakdown. Then you could comment on whether street-sweeping costs are the big driver behind cost differences. Further, you could remark on whether it appears that some communities are doing more street-sweeping than necessary to comply with their permit (do we have a curb miles swept and total curb miles for each city?).(Cutter)
• STREET SWEEPING COSTS: (Table 9.3) Explain street sweeping unit and $cost/curb mile swept variability, in particular the low/high values. (Lund)
• STREET SWEEPING COSTS: On page 52, the paragraph just above the Table 9-5, states: “cost savings can be realized if cities are allowed to focus on the most cost effective programs rather the following overly prescriptive permit requirements.” For example, since street sweeping is the most significant share of the stormwater costs maybe it
Appendix J TAG Comments
NPDES Stormwater Cost Survey J-5 January 2005
should be determined if this program is also cost effective the way it is performed presently. This is one avenue to improve the cost-effectiveness relationship. Why spend a significant amount of money if the impact may be insignificant? Some studies in the literature suggest that fact. Secondly, the permits are “overly prescriptive” in many instances due to Permittees specific request to the Regional Board for clarification and guidance in the permits on what they are required to accomplish, when and how. (Dan)
• WATERSHED MANAGEMENT COSTS (Sect. 8 ,Pg. 44) Elaborate on watershed management cost (Lund)
• TMDL COSTS: We strongly recommend the inclusion of TMDL portion of the report in a separate attachment or appendix. The TMDLs cost review were not part of this proposal. The costs vary in a wide range, based on various assumptions and scenarios, none of the cities are currently implementing TMDLs via a MS4 permit. We believe that the inclusion of TMDL discussion in the body of the main report will confuse things. The job of accurately estimating TMDLs implementation costs is complex and open to many interpretations. It is opportune to present various ranges and costs under the research done up to date but we are a long way to agreeing on one set of values. Therefore we believe that the TMDL research on future costs should be included in an Appendix to the report. (Dan)
• TMDL COSTS: p.55 section headed Adding future costs…This is pretty unclear, either expand it or drop it. I think you mean to say something like if current cost estimates are X, and TMDL estimated costs are Y, total costs should be something less than X+Y since current and TMDL expenditures overlap. But I am not quite sure that is what you mean. (Cutter)
• LAND ACQUISITION COSTS: The Advanced Treatment (Gordon, et al.) discussion mentions that land costs were included in that $37 billion cost estimate. However, Section 9 draws in part from Appendix H. Most of the discussions of treatment system examples in the Appendix do not make it clear whether land acquisition costs were included in the cost figures given. In my view, this omission tends to weaken the credibility of the figures used. In the case of the Tule Ponds (the one with which I am most familiar) the $360,000 cost figure does not include any consideration of land costs. The site was, and is owned by the Flood Control District so no purchase price is included. The Authors do touch on the subject when they mention in some examples how land necessary for other purposes (e.g., parking lots) can be put to dual use for stormwater treatment (which makes land acquisition unnecessary). However, the dollar figures given for the various systems need to include mention of whether land costs were included and what they might be if the were not. This is especially true (as you point out) in densely populated urban areas. In the Tule Ponds case, if land were to be purchased on the open market in the center of Fremont, the total cost of the project would be an order of magnitude higher. On the issue of land costs being lower in less densely populated areas (a point that the report makes). In the San Francisco Bay Area, the need for treatment is greatest in densely urbanized areas and almost non-existent in rural areas. In our area, population density tends to increase as one moves toward the Bay. Since stormwater can't really be pumped uphill to treatment facilities, our need for such facilities tends to
Appendix J TAG Comments
J-6 NPDES Stormwater Cost Survey January 2005
be greatest exactly where land prices are highest. This limits our flexibility in locating treatment facilities based on land costs. (Hale)
• DUAL BENEFITS: It is not clear how to account for dual benefit activities. In the case of city of Sacramento, pump station cleaning may be attributable also to maintaining the hydraulic integrity of the system, a water quantity, flood control issue, not necessarily due to water quality concerns. (Dan)
• DATA ANALYSIS: More can be done on the attempts to define what factors lead to higher or lower costs for total costs as well as element by element. The first step is to relegate the various regression analyses to appendices or to drop them altogether. Seven observations are not sufficient for a statistical analysis. This is evidenced by the confidence intervals in Figure 1, which appear to be below zero for three cities. However, there is even less information in this regression than it first appears. Comparing aggregate stormwater spending to aggregate household income is somewhat misleading because they are both driven simply by the overall size of the city. A better regression would be per-household stormwater spending on household mean or median income. I suspect the R2 would be quite a bit less and the confidence intervals correspondingly greater. My recommendation is to simply drop the regressions from the body of the report. (Cutter)
• DATA ANALYSIS: (Section 9.1) Analysis seems simplistic. Should cost be related to the problem, which might be proportional to population or level of economic activity? Cost/ HH values need to be further explained. (Lund)
• DATA ANALYSIS: p.52 2nd par. Sentence beginning with: The present worth cost… please explain this sentence further, why is there such a large cost range? Explain to the reader why the cost-per-acre and cost-per-volume estimated difference and the range in the land prices. You can do this in a footnote. (Cutter)
• DATA ANALYSIS: Explain rainfall as the best indicator for cost (Lund)
• VARIABILITY IN COSTS AMONG CITIES: I would like a final summing up in the report of why the overall cost/household range is large. Again, this will probably have to be more qualitative, but I think that is fine. I would like the reader to come away with a sense of why one city has costs almost three times larger on a per-household basis. That qualitative analysis should think through the following questions: 1) even within the category of cities with good stormwater programs are some cities doing a lot more activities than others?; 2) If so, is the extra activity necessitated by say, greater amounts of construction or other factors? Are some cities in the midst of infrastructure activities so that you would expect say a three year average of stormwater costs to be in a much closer range? Perhaps you will conclude that the cost differences are really inexplicable given what you know. If so, that in itself is interesting and you should suggest further avenues for research into hypotheses suggested by your experience in this project and explain why this research does not give insight into the reasons behind the large cost range. (Cutter)
Appendix J TAG Comments
NPDES Stormwater Cost Survey J-7 January 2005
TAG MEETING NOTES FROM DECEMBER 14, 2004:
Action Items
1. Clarify that, beyond the objectives identified in the report and contract, this report also serves as a step toward establishing cost numbers to be used in budgeting and cost/benefit evaluations. Note that this report does not address the benefits of those permit required stormwater activities that are assumed to improve water quality. Note that the reports use as a budgeting tool may only be timely for Phase II permittees. Location of Change: pg ES-1, Section “Task A”; Section 1, section “Task A”
2. Double check consistency of classifying costs (e.g. existing, enhanced, new). Add discussion defining these terms and discuss the likelihood that enhanced cost is, for the most part, pre-existing. Display graphically. Note any differences between the accounting practices of cities with a SW utility fee and those without, especially regarding the amount of the costs that are ‘existing’ or ‘enhanced’. If apparent from the study, discuss the relative importance of having a fee versus having a designated fund, without a fee to fund it. Location of Change: Figure 9.4 and Section 2.5 and additions to Section 9.1, p49.
3. Replace the regressions in report with qualitative discussion on cost differences between cities. List major water quality control strategies and affected water bodies for each city. This may help explain some cost variation. Explain differences in cost between cities qualitatively. (e.g. Fresno low because joint use facilities, permeable soils, available land). Note any large infrastructure campaigns of the cities. Move regressions to appendix with the note that we tried various correlations but a model was not successfully developed, partly due to the small sample size. Only do regressions on normalized cost, not aggregate costs, which are only a surrogate for city size. Include a note in the body of the report that the failure of the regressions was expected due to small sample size and that the regressions are presented in an appendix as anecdotal information. Location of Change: Discussion additions and modifications to Section 9.1, Deleted regression figures in ES and section 9.
4. Move TMDL and future cost discussion from Section 9 to an appendix. Add a note to the appendix and executive summary that Task B research was done assuming the MS4 permitting process as it stands presently, using an iterative process of enhancing implementation of BMPs. This scenario may overlap with TMDL process, but it is not necessarily the same. TMDLs may be folded in MS4 permit as allocations, as appropriate, depending on the impairments to receiving waters. Note that the costs for LA may be specific for LA only and are difficult to extend to other areas with
Appendix J TAG Comments
J-8 NPDES Stormwater Cost Survey January 2005
different characteristics. Location of Change: Note added to Introduction and modified discussion moved to appendix G
5. Downplay comparisons between TMDL costs, which are future costs that are variously estimated, and MS4 permit compliance costs incurred by the cities surveyed costs. TMDL cost estimates are total costs and not the cost to the cities exclusively. Similarly, note that Gordon costs are city-only costs. Take Gordon costs out of table in Executive Summary and discuss in the text. Location of Change: Section 9 future cost discussion, including TMDLs, modified and moved to Appendix G. Gordon costs taken from ES table and moved to text
6. Add TAG comment section in Section 10 on cost tracking benefits. Propose that if the permittees have a correct cost accounting/reporting system, they would be granted an additional quantity of points towards their receipt of a grant under a state/federal program; for example, Section 319(h) grants are evaluated on a point ranking system that is established by a state. If the cost accounting/reporting information were tabulated pursuant to the state's suggested format, that applicant would receive a bonus allotment equal to a boost in total points of approximately 15 percent. This would alert that permittee to the benefit in competing for these grants as a pre-requisite to establishing the appropriate cost accounting system. The proposed system would benefit from review and acceptance by the California League of Cities. Note the process in developing consistent cost reporting in the region and the associated benefit to the city with developing and justifying stormwater utility fees. Note that our recommendations for cost reporting are only the first step in this process of developing consistent cost reporting. This process includes notifying cities of reporting goals, identifying whether costs are minor and local and applicable to other cities, review reported costs for quality and consistency, and provide feedback to the cities. Identify appropriate categories with definitions to allow clarification between differences; with appropriate definitions, the individual entities could probably better assist the permittees to understand the benefit of reporting costs in a correct fashion. For example, a reported cost item may be illegal discharge elimination and would have clarified definitions to differentiate between end-of-pipe actions, in-pipe actions, source identification, and source detection. Location of Change: Discussion added to Section 10.2 and 10.3, pages 51 and 56. Regressions moved to Appendix G.
7. Make sure legal fees are properly discussed. Appellant fees are excluded, but legal advice on program implementation and response to citizen suits are included. We assume that if legal fees are incurred, it is part of the cost of doing business. This is not an assumption that all lawsuits are frivolous and therefore attorney fees are justified expenses. Neither is it an assumption that all legal advice is to challenge the lawsuit rather than to acquiesce to the demands of the lawsuit. Location of Change: See discussion in section 9.5
Appendix J TAG Comments
NPDES Stormwater Cost Survey J-9 January 2005
8. Append all written TAG comments to the report. Location of Change: See Appendix J.
9. Report cost without existing and enhanced ‘big-ticket’ items such as street sweeping trash collection, storm drain maintenance, drain line cleaning, channel cleaning, and pump station cleaning, recycling, hazardous waste roundups, etc. Note that an unknown portion of an “enhanced” cost is appropriate to count toward the additional financial burden of permit compliance. Also, include a suggestion that a three years average, 1987-1990, may be used as a baseline cost to figure out “enhancement” portion costs based on the post 1990 MS4 permit requirements and caveat that unit cost for sweeping varies. Note that sweeping is an enhanced cost and the majority of effort pre-existed the first stormwater permits. Also caveat that all programs may still have hidden costs that could not be identified by the cities. An example is backup equipment for street sweeping, but note that these costs are also preexisting. Location of Change: See section 9.4 for added discussion of existing and enhanced costs and see Section 2.5 for discussion of using baseline costs.
10. Consider using pie charts for each city to show distribution of costs among categories. Location of Change: See individual city sections (sections 3-8)
11. Note that Post Construction costs are expected to increase as cities move into full implementation of SUSMP type requirements for new development and redevelopment. Note that the reported costs are particularly misleading for cost projection purposes since the research coincides with the start of SUSMP type requirements implementation. Location of Change: Section 9.5, Qualitative Discussion of Stormwater Costs for Selected Cost Categories
Additional meeting notes
1. Cities may try to push as much general fund expenses as possible to stormwater a fee, but public response to fees helps balance cost. [I believed we discussed that cities successful in passing a SW fee were very transparent in the process, limited in scope, and going to great lengths to tie the SW fee to activities and capital investments related directly to water quality enhancements and benefits. Probably is not a bad idea to put some positive “lessons learned” from those successful cases in passing a SW fee.] (Dan)
2. GASB 34 may not be a realistic method to encourage cost reporting, especially on the short term. [is there a way to move this idea at a national level? That GASB can develop some standards for such a purpose, or add to an existing one?] (Dan).
3. Hamilton County, Ohio costs were not captured till 2001, for Phase II non-Cincinnati areas. Took two years to establish more consistent cost reporting. The cost had been
Appendix J TAG Comments
J-10 NPDES Stormwater Cost Survey January 2005
accounted for from 2001 through 2003 for Phase II cities, but that even these costs were "too vague" to allow appropriate interpretation by all 44 permittees. When CDM conducted the next evaluation required to establish a charge for these functional activities, CDM had to more precisely define the activities and quantify the level of effort for each action (Steve).
4. Wisconsin and Florida: cities are given points for having a fee, points awarded if utility charges are above $3.50 (80), below (40), and none (0). Points are a criterion for grant applications. Expand the last sentence to read “This approach would assure that permittees competing for grants would receive between 15 and 20 percent bonus points in the priority ranking system utilized by these states to award grants” (Steve).
5. Average cost per billing unit is $2.92/month for all stormwater including flood. Only for cities with stormwater fund/fee. Insert “Based upon evaluations conducted for stormwater utilities charging a stormwater user fee as of December 31, 2003, the total monthly charge per residential dwelling unit was $2.92/month. The services provided for this fee included all components that a given jurisdiction was incorporating into the stormwater management program, but could have been augmented/supplemented with additional monies from other sources that weren't clear in the writer's review. However, greater than 75 percent of those systems reviewed included some costs for quantity management in this fee.” (Steve). [See my comment at first point, it seems that a focused SW quality fee will be on average much less that $3/month/billing unit. city of LA with its current $18/yr/household seems to be right there, at the average.] (Dan)