Embed Size (px)
Citation preview
APPROVED: Barney Venables, Major Professor Kent D. Chapman, Committee Member Duane B. Huggett, Committee Member Arthur J. Goven, Chair of the Department
of Biological Sciences Michael Monticino, Dean of the Robert B.
Toulouse School of Graduate Studies
NSAID EFFECT ON PROSTANOIDS IN FISHES: PROSTAGLANDIN E2 LEVELS IN
BLUNTNOSE MINNOWS (Pimephales notatus) EXPOSED TO IBUPROFEN
Khageshor Bhandari
Thesis Prepared for the Degree of
MASTER OF SCIENCE
UNIVERSITY OF NORTH TEXAS
August 2009
Bhandari, Khageshor. NSAID effect on prostanoids in fishes: Prostaglandin E2
levels in bluntnose minnows (Pimephales notatus) exposed to ibuprofen. Master of
Science (Biochemistry), August 2009, 64 pp., 10 tables, 11 illustrations, references, 59
titles.
Prostanoids are oxygenated derivatives of arachidonic acid with a wide range of
physiological effects in vertebrates including modulation of inflammation and innate
immune responses. Nonsteroidal anti-inflammatory drugs (NSAIDs) act through
inhibition of cyclooxygenase (COX) conversion of arachidonic acid to prostanoids. In
order to better understand the potential of environmental NSAIDS for interruption of
normal levels COX products in fishes, we developed an LC/MS/MS-based approach for
tissue analysis of 7 prostanoids. Initial studies examining muscle, gut and gill
demonstrated that prostaglandin E2 (PGE2) was the most abundant of the measured
prostanoids in all tissues and that gill tissue had the highest and most consistent
concentrations of PGE2. After short-term 48-h laboratory exposures to concentrations of
5, 25, 50 and 100 ppb ibuprofen, 50.0ppb and 100.0 ppb exposure concentrations
resulted in significant reduction of gill tissue PGE2 concentration by approximately 30%
and 80% respectively. The lower exposures did not result in significant reductions when
compared to unexposed controls. Measured tissue concentrations of ibuprofen
indicated that this NSAID had little potential for bioaccumulation (BCF 1.3) and the IC50
of ibuprofen for inhibition of PGE2 production in gill tissue was calculated to be 0.4 μM.
Short-term laboratory exposure to ibuprofen did not result in significant alteration of
concentrations of PGE2 at environmentally relevant concentrations.

ii
Copyright 2009
by
Khageshor Bhandari
iii
ACKNOWLEDGEMENTS
I would like to sincerely thank Dr. Barney Venables for agreeing to be my
research supervisor and guiding me throughout the project. His warm spirit, deep sense
of caring for his students, and willingness to be available at any time will be long
remembered. He not only taught me environmental chemistry/analytical technique but
also some important aspects of life. I would also like to thank Dr. Kent Chapman who
inspired me to learn advanced cell biology and research techniques in biological
seminar. This inspiration led me to realizations about myself that ultimately enhanced
my learning ability. I also thank him for being on my thesis committee. I would like to
thank Dr. Duane Huggett for serving as a member of my research committee and for his
support in the aquatic lab. Their comments, suggestions, and encouragement played
important roles toward the completion of this project.
Special thanks to all my classmates, staff, and faculty of the Biological Science
Department at UNT for helping me to accomplish this goal. I would like to thank my
friends, Prem Adhikari and Rudra Gnawali who inspired me all the time. Many thanks to
Thomas Venables (manager of TRAC laboratory, who helped me whenever needed) for
providing highly flexible job and helping me to accomplish this goal. Gopi Nallani,
Vatsala Vadapalli, Peter Paulos who helped me whenever needed.
My deepest gratitude to my parents Narayan Bhandari (late) and Purnakala
Bhandari, for their prayers. Lastly, I am forever grateful to my wife Anubha, son Ashim
and daughter Ausha. Anubha from the beginning has encouraged me down this road.
Ashim and Ausha are not only are my children but also my inspirers. Thank you for the
prayers, patience, and understanding.
iv
TABLE OF CONTENTS
Page ACKNOWLEDGEMENTS ............................................................................................... iii LIST OF TABLES............................................................................................................vi LIST OF FIGURES.........................................................................................................vii ABBREVIATIONS USED .............................................................................................. viii MOLECULAR STRUCTURES OF DIFFERENT PROSTANOIDS, IBUPROFEN AND ARACHIDONIC ACID......................................................................................................ix Chapters
1. INTRODUCTION ....................................................................................... 1
1.1 Objectives and Hypothesis.............................................................. 1 2. BACKGROUNDS AND LITERATURE REVIEW........................................ 4
2.1 Cyclooxygenases (COX)................................................................. 4
2.1.1 Types of Cyclooxygenases................................................... 4
2.1.2 Intracellular Localizations of COX ........................................ 5
2.2 Prostanoids/Eicosanoids................................................................. 5
2.2.1 The Mechanism of Prostaniods Biosynthesis ....................... 6
2.2.2 Mechanism of Prostaniods Biological Activity....................... 9
2.2.3 Biological Role of Prostanoids............................................ 11
2.2.4 Levels of Prostanoids in Animals........................................ 14
2.3 Nonsteroidal Anti-inflammation Drugs (NSAIDs)........................... 15
2.3.1 Mechanism of NSAIDs on COX.......................................... 16
2.3.2 Side Effect of NSAIDs ........................................................ 16
2.3.3 Level of NSAIDs in the Environment .................................. 17
2.4 Bluntnose Minnows ....................................................................... 18 3. INTRODUCTION TO MATERIALS AND METHODS............................... 19
3.1 Materials ....................................................................................... 19
3.2 Methods ........................................................................................ 19
3.2.1 Control Fish and Treatment Exposures.............................. 19
v
3.2.2 Tissue Extraction for Eicosanoids and Ibuprofen ............... 20
3.2.3 Determination of Lipids Weight........................................... 21
3.2.4 LC-ESI/MS/MS Analysis for Eicosanoids ........................... 21
3.2.5 Ibuprofen Re-extraction from Tissue samples and Sample Cleanup.............................................................................. 24
3.2.6 Ibuprofen Extraction from Control and Exposure Water Samples ............................................................................. 25
3.2.7 Derivatization of Ibuprofen.................................................. 26
3.2.8 Extraction of Derivatized Ibuprofen .................................... 26
3.2.9 GC/MS Analysis of Ibuprofen ............................................. 27
3.3 Statistics Used .............................................................................. 27 4. RESULT................................................................................................... 29
4.1 Chromatogram of Prostanoids in LC/MS/MS ................................ 29
4.2 Calibration Curve of LC/MS/MS .................................................... 29
4.3 Calibration Curve and Chromatogram of Ibuprofen in GC/MS ...... 31
4.4 Nominal Checks of Water in Exposure Tanks for Ibuprofen.......... 33
4.5 Quality Control .............................................................................. 34
4.6 PGE2 Concentration in Gill Tissue of Exposure Groups and Corresponding Controls ................................................................ 36
4.7 Gill Tissue Concentration of Ibuprofen and Bioconcentration Factor (BCF) ............................................................................................ 42
4.8 IC50 Value of Ibuprofen in Inhibition of PGE2 Production in Gill Tissue ........................................................................................... 48
5. DISCUSSION .......................................................................................... 50
REFERENCES.............................................................................................................. 57
vi
LIST OF TABLES
Page 1. Retention times and characteristic molecular and transition ions for 9 prostanoids
examined............................................................................................................ 23
2. Measured checks of nominal water concentration for Ibuprofen......................... 33
3. Quality control samples for recovery of prostaglandins ...................................... 35
4. Quality control samples for recovery of ibuprofen............................................... 36
5. Quantified amount of PGE2 in gill tissue of bluntnose minnow by fresh tissue weights, by lipids weights and normalized percentages relatives to their respective controls.............................................................................................. 37
6. Statistical summary data of % PGE2 production in each exposure set compared to their corresponding averaged control values in gill tissue of bluntnose minnow (based on fresh tissue weight)............................................................................ 39
7. Quantified gill tissue concentrations of ibuprofen in bluntnose minnows (based on fresh tissue weight.............................................................................................. 43
8. Statistical summary data of quantified bio-concentration of ibuprofen in gill tissue of bluntnose minnows (based on fresh tissue weight) ........................................ 44
9. Statistical summary data of Bio-concentration factor (BCF) of ibuprofen in gill tissue of bluntnose minnows (based on fresh tissue weight) .............................. 45
10. Relationship between % inhibition of PGE2 production by ibuprofen and micro molar concentration of ibuprofen ........................................................................ 48
vii
LIST OF FIGURES
Page
1. Biosynthetic routes for generation of some prostanoids and effect of NSAIDs (ibuprofen) on prostanoids.................................................................................... 8
2. Chromatogram of 7 different prostanoids using LC/MS/MS ............................... 29
3. Eight-point calibration curve of LC/MS/MS for PGE2 ......................................... 30
4. Nine-point calibration curve of GC/MS for ibuprofen .......................................... 31
5. Extracted-ion chromatograms for ibuprofen analysis using GC/MS ................... 32
6. Bar graphs of % PGE2 production in each exposure set compared to averaged values of their corresponding controls in gill tissue of bluntnose minnows (based on fresh tissue weight)........................................................................................ 40
7. Bar graphs of % PGE2 production in each exposure set compared to averaged values of their corresponding controls in gill tissue of bluntnose minnows (based on lipids weight).................................................................................................. 41
8. Bar graphs of % PGE2 production in each exposure set compared to the averaged values of their corresponding controls in gill tissue of bluntnose minnows (based on fresh tissue weight). The control bar is the average and SD of all the control samples expressed as a percentage of their own group mean ........................................................................................................................... 42
9. Bar graphs of bioconcentration of ibuprofen in gill tissue of bluntnose minnows (based on fresh tissue weight)............................................................................ 46
10. Bar graphs of bioconcentration of ibuprofen in gill tissue of bluntnose minnows (based on lipids weight)...................................................................................... 47
11. Estimation of % inhibition of PGE2 production by micro molar concentration (based on fresh tissue weight) of ibuprofen in gill tissue of bluntnose minnows ........................................................................................................................... 49
viii
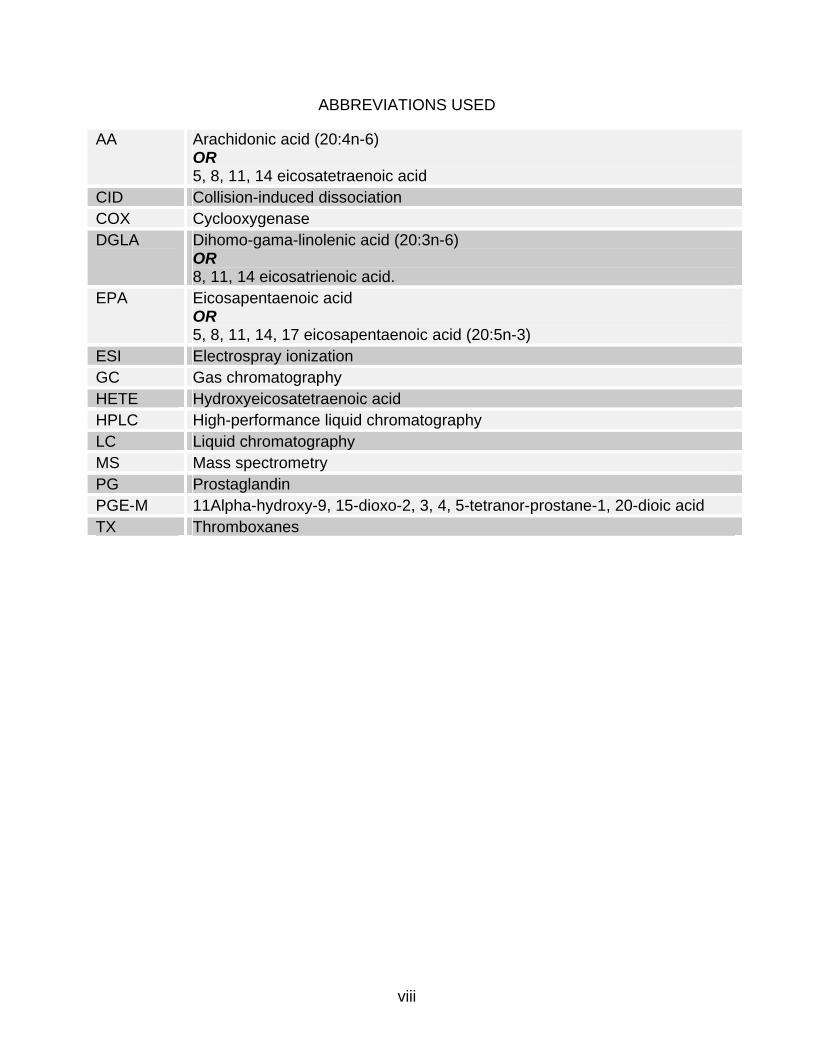
ABBREVIATIONS USED
AA Arachidonic acid (20:4n-6) OR 5, 8, 11, 14 eicosatetraenoic acid
CID Collision-induced dissociation COX Cyclooxygenase DGLA Dihomo-gama-linolenic acid (20:3n-6)
OR 8, 11, 14 eicosatrienoic acid.
EPA Eicosapentaenoic acid OR 5, 8, 11, 14, 17 eicosapentaenoic acid (20:5n-3)
ESI Electrospray ionization GC Gas chromatography HETE Hydroxyeicosatetraenoic acid HPLC High-performance liquid chromatography LC Liquid chromatography MS Mass spectrometry PG Prostaglandin PGE-M 11Alpha-hydroxy-9, 15-dioxo-2, 3, 4, 5-tetranor-prostane-1, 20-dioic acid TX Thromboxanes
ix
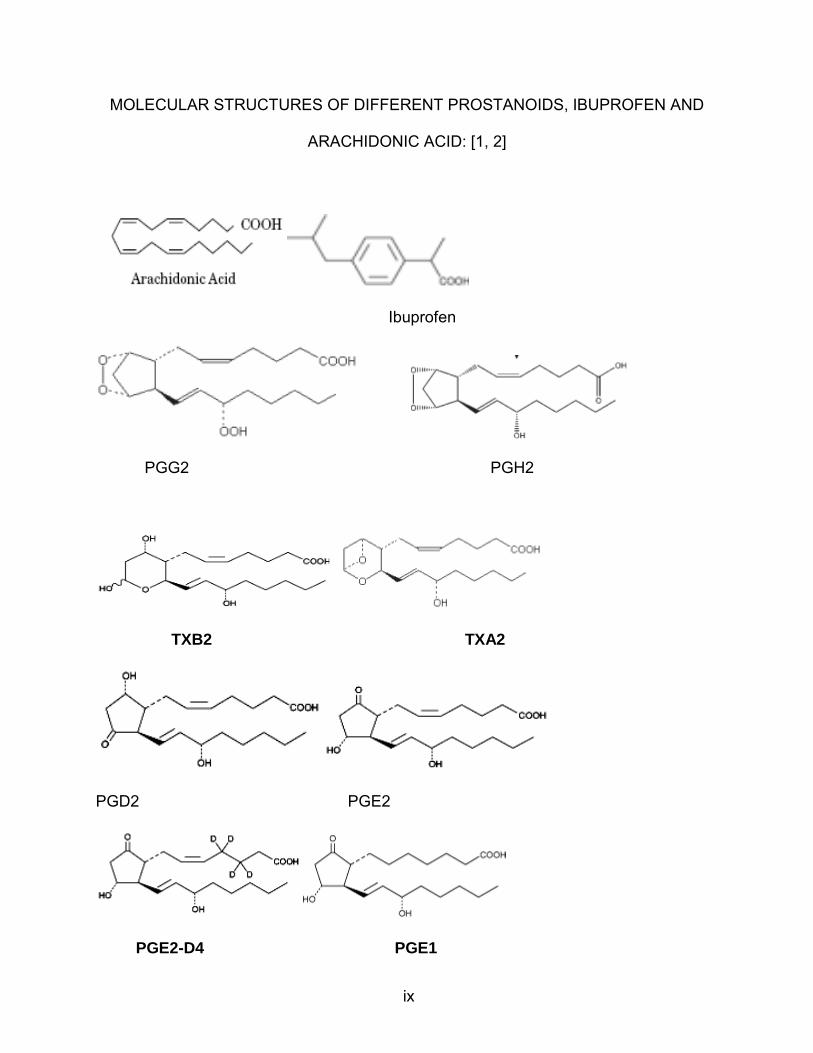
MOLECULAR STRUCTURES OF DIFFERENT PROSTANOIDS, IBUPROFEN AND
ARACHIDONIC ACID: [1, 2]
Ibuprofen
PGG2 PGH2
TXB2 TXA2
PGD2 PGE2
PGE2-D4 PGE1
x
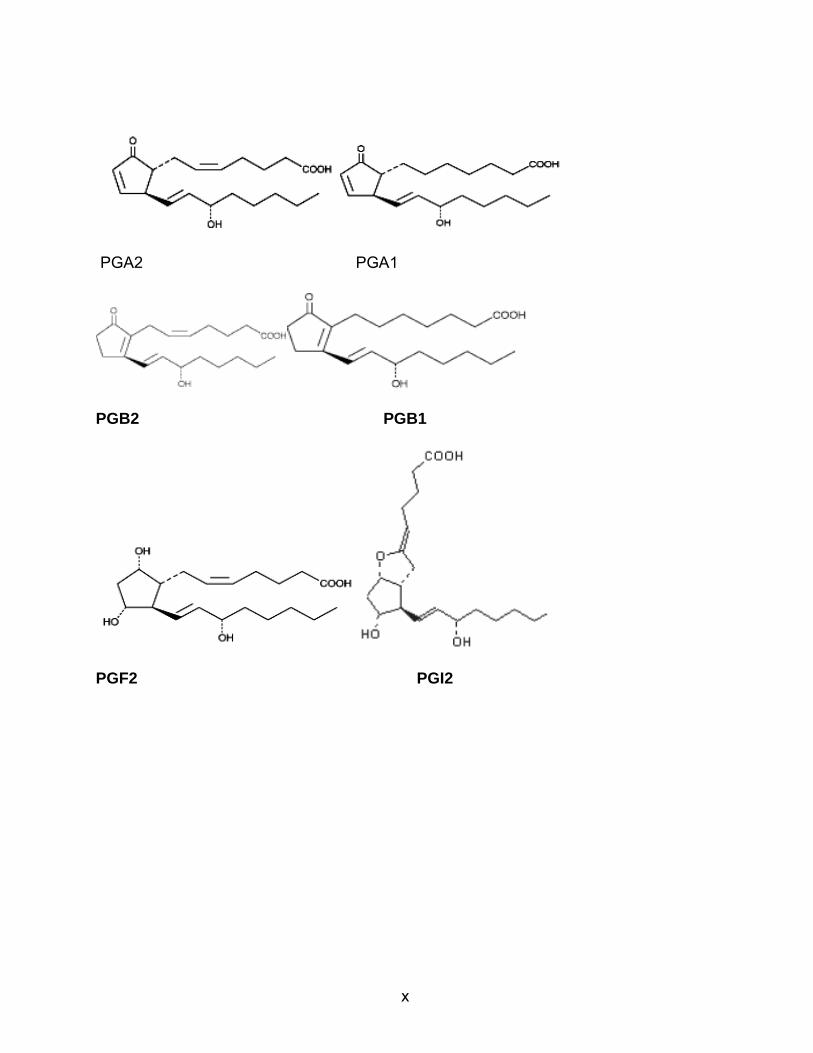
PGA2 PGA1
PGB2 PGB1
PGF2 PGI2
1
CHAPTER 1
INTRODUCTION
Non-steroidal ant i-inflammatory dr ugs (NSAIDs) ar e am ong t he m ost ab undant
environmental pharmaceutical contaminants. Widespread appearance of NSAIDs in the
aquatic environment is due to their high volume of consumption (about 50,000 tons a
year) and t heir incomplete r emoval dur ing w astewater t reatment [3]. Environmental
concentrations of NSAIDs are frequently dominated by ibuprofen and are reported in the
low ppb r ange (see Background Literature Review section) in f inal effluents of sewage
treatment plants (STPs). The NSAID mode of action involves modulation of eicosanoid
metabolism. Eicosanoids act as autocrine or paracrine signaling molecules [4] and can
play important r oles i n m any physiological act ivities in practically every animal organ,
tissue and cell [1, 5, 6]. Although much is known about the pharmacological effects of
NSAIDs in mammalian models, relatively little is known regarding their potential effects
on t he al teration o f ei cosanoid metabolism i n aquatic lower v ertebrates and
invertebrates that may be ex posed in wastewater receiving st reams. A wide range of
studies indicate t hat eicosanoids play cr itical si gnaling r oles in de fense r esponse,
reproduction an d pr edator-prey i nteraction i n t hese or ganisms [7]. This study was
conducted t o beg in t o under stand p otential risk of env ironmental N SAID ex posure i n
freshwater fish by establishing t he r elationships between exposure co ncentration a nd
(1) bioconcentration and (2) inhibition of eicosanoid production in gill tissue of bluntnose
minnows, Pimephales notatus.
1.1 Objectives and Hypotheses
The bluntnose m innow, a small, slow g rowing, w idely di stributed species o f
2
temperate f reshwater belonging t o t he cy prinid family and one of t he most co mmon
freshwater f ish i n t he Eastern U .S., was used t o examine t he p otential effects of t he
NSAID i buprofen on selected ei cosanoids in f ishes. This represents the f irst di rect
laboratory examination o f t he i mmediate downstream molecular t argets of N SAID
exposure i n a co ntext r elevant t o env ironmental ex posure o f an aq uatic vertebrate
typical of wastewater receiving streams.
Objective 1: Develop a single generalized extraction procedure that would permit trace
quantitative recovery of the NSAID ibuprofen and a broad range of ecosanoids from fish
tissue.
Objective 2: Develop (a) a l iquid ch romatography / mass spectrometry (LC/MS)-based
instrumental analysis for commonly occurring eicosanoids to establish the predominant
molecular sp ecies present i n bl untnose m innow g ill t issue and (b) a gas
chromatography/mass sp ectrometry (GC/MS)-based instrumental a nalysis for
ibuprofen. The g oal was for i nstrumental analyses developed i n O bjective 2 t o be
capable of sharing the single extraction procedure developed in Objective 1.
Objective 3: Determine t he bioconcentration o f i buprofen i n bluntnose m innow gill
tissue after a 48-h exposure to environmental ibuprofen concentrations of 5, 25, 50 and
100µg/L.
Objective 4: Evaluate t he do minance o f i ndividual eicosanoid species in bl untnose
minnow g ill t issue and q uantify t he d ominant ei cosanoid b efore and after a 48 -h
exposure to environmental ibuprofen concentrations of 5, 25, 50 and100 µg/L.
3
Objective 5: E stimation o f g ill t issue I C50
Objective 6: Conduct a literature review of NSAIDs’ distribution in the environment and
their known physiological effects with an emphasis on fish eicosanoids.
for i buprofen s uppression o f do minant
eicosanoids found in bluntnose minnow.
To achieve the goals of this project, an optimized tissue extraction scheme and
two di fferent isotope di lution m ass spectrometry m ethods were developed. Liquid
chromatography/electrospray i onization- tandem mass spectrometry (L C/ESI-MS/MS)
was used t o identify and q uantify eicosanoids, an d g as chromatography-mass
spectrometry (GC-MS) was used to identify and quantify ibuprofen.
4
CHAPTER 2
BACKGROUND AND LITERATURE REVIEW
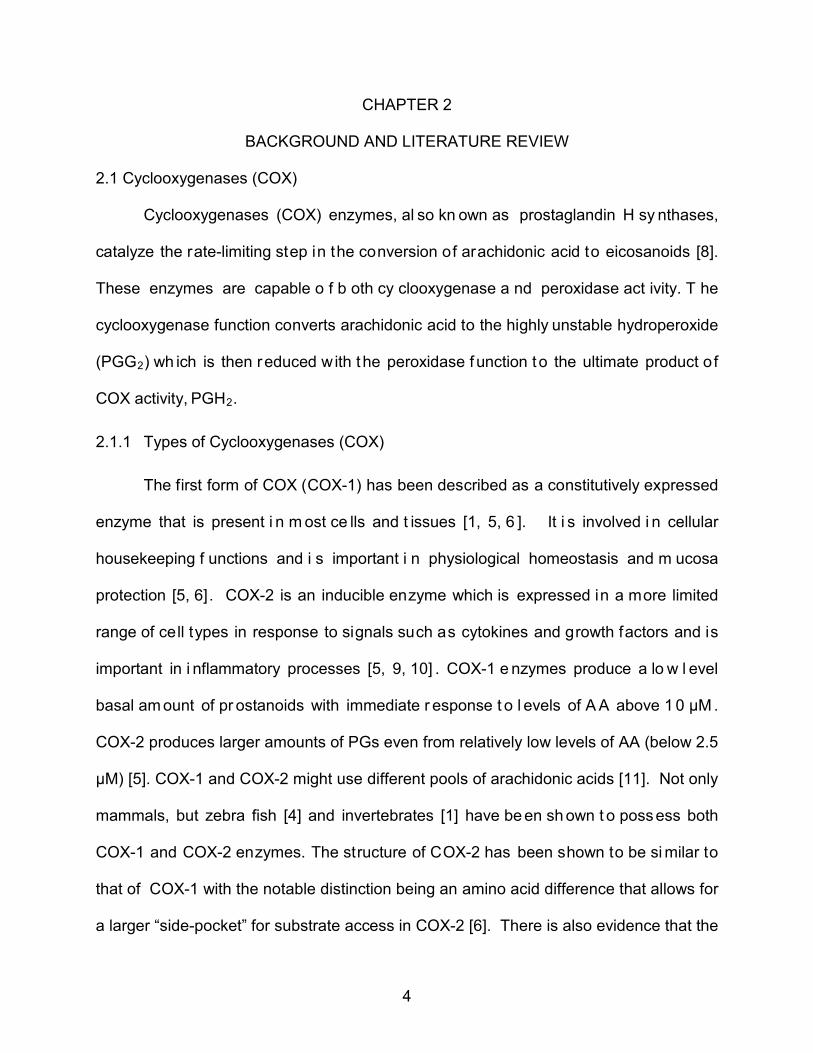
2.1 Cyclooxygenases (COX)
Cyclooxygenases (COX) enzymes, al so kn own as prostaglandin H sy nthases,
catalyze the rate-limiting step in the conversion of arachidonic acid to eicosanoids [8].
These enzymes are capable o f b oth cy clooxygenase a nd peroxidase act ivity. T he
cyclooxygenase function converts arachidonic acid to the highly unstable hydroperoxide
(PGG2) wh ich is then reduced with the peroxidase f unction to the ultimate product o f
COX activity, PGH2
2.1.1 Types of Cyclooxygenases (COX)
.
The first form of COX (COX-1) has been described as a constitutively expressed
enzyme that is present i n m ost ce lls and t issues [1, 5, 6 ]. It i s involved i n cellular
housekeeping f unctions and i s important i n physiological homeostasis and m ucosa
protection [5, 6]. COX-2 is an inducible enzyme which is expressed in a more limited
range of cell types in response to signals such as cytokines and growth factors and is
important in i nflammatory processes [5, 9, 10] . COX-1 e nzymes produce a lo w l evel
basal am ount of pr ostanoids with immediate r esponse t o l evels of A A above 1 0 µM .
COX-2 produces larger amounts of PGs even from relatively low levels of AA (below 2.5
µM) [5]. COX-1 and COX-2 might use different pools of arachidonic acids [11]. Not only
mammals, but zebra fish [4] and invertebrates [1] have be en sh own t o possess both
COX-1 and COX-2 enzymes. The structure of COX-2 has been shown to be si milar to
that of COX-1 with the notable distinction being an amino acid difference that allows for
a larger “side-pocket” for substrate access in COX-2 [6]. There is also evidence that the
5
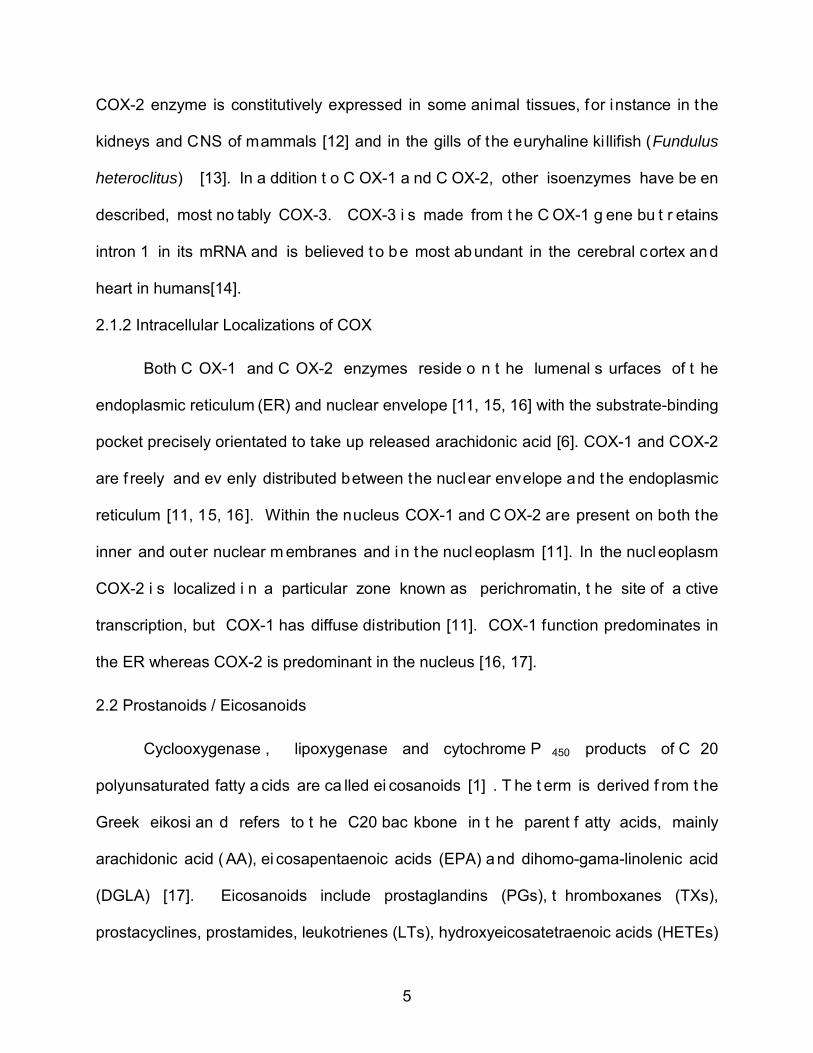
COX-2 enzyme is constitutively expressed in some animal tissues, for instance in the
kidneys and CNS of mammals [12] and in the gills of the euryhaline ki llifish (Fundulus
2.1.2 Intracellular Localizations of COX
heteroclitus) [13]. In a ddition t o C OX-1 a nd C OX-2, other isoenzymes have be en
described, most no tably COX-3. COX-3 i s made from t he C OX-1 g ene bu t r etains
intron 1 in its mRNA and is believed t o be most abundant in the cerebral cortex and
heart in humans[14].
Both C OX-1 and C OX-2 enzymes reside o n t he lumenal s urfaces of t he
endoplasmic reticulum (ER) and nuclear envelope [11, 15, 16] with the substrate-binding
pocket precisely orientated to take up released arachidonic acid [6]. COX-1 and COX-2
are f reely and ev enly distributed between the nuclear envelope and the endoplasmic
reticulum [11, 15, 16]. Within the nucleus COX-1 and C OX-2 are present on both the
inner and outer nuclear m embranes and i n t he nucl eoplasm [11]. In the nucleoplasm
COX-2 i s localized i n
2.2 Prostanoids / Eicosanoids
a particular zone known as perichromatin, t he site of a ctive
transcription, but COX-1 has diffuse distribution [11]. COX-1 function predominates in
the ER whereas COX-2 is predominant in the nucleus [16, 17].
Cyclooxygenase , lipoxygenase and cytochrome P 450 products of C 20
polyunsaturated fatty a cids are ca lled ei cosanoids [1] . T he t erm is derived f rom t he
Greek eikosi an d refers to t he C20 bac kbone in t he parent f atty acids, mainly
arachidonic acid ( AA), ei cosapentaenoic acids (EPA) a nd dihomo-gama-linolenic acid
(DGLA) [17]. Eicosanoids include prostaglandins (PGs), t hromboxanes (TXs),
prostacyclines, prostamides, leukotrienes (LTs), hydroxyeicosatetraenoic acids (HETEs)
6
and the products of the cytochrome P 450 pathway that can convert C20 fatty acids to
hydroxylated der ivatives. Prostanoids are a su bclass of eicosanoids including
prostaglandins, pr ostacyclines and t hromboxanes [2]. All prostanoids have similar
structures being composed of 20 carbon atoms containing a cyclic ring, a t rans-double
bond between C-13 and C-14, a hydroxyl group at C-15 and carboxylic group at C-1
[17]. Prostanoids were f irst discovered in the 1930s by von Euler and colleagues, who
found a s ubstance p roduced by t he
2.2.1 The Mechanisms of Prostanoid Biosynthesis
prostate g land t hat ca used sm ooth m uscle
contraction. They named the compound prostaglandin.
The COX enzymatic pathway is the main mechanism of prostanoid synthesis and
is initiated by the release o f C20 polyunsaturated fatty a cids from t he pl asma
membranes into the cytoplasm by phospholipase A2 [5, 18]. Nearly all mammalian cell
types have the biosynthetic machinery t o produce a t l east one type o f prostanoid [1].
Prostanoids derived from arachidonic acid are termed 2-series, while those derived from
DGLA and EPA are termed 1- and 3-series respectively [2, 19] . 2-series prostanoids
are the m ost pr edominantly formed in m ammals (including hu mans) because
arachidonic acid i s the m ost ab undant among t hose pr ecursor fatty aci ds [17]. Final
product o f C OX, P GH2 m ight be sy nthesized i n t he l umen of t he e ndoplasmic
reticulum (ER) and di ffuses through the ER membrane [20]. PGH2 is also an unstable
compound w ith a hal f-life o f ~ 10 m in i n aq ueous solution [21], and is subsequently
converted to primary more polar prostanoids including PGE2, PGD2, PGF2α, PGI2 and
TxA2 by sp ecific PG synthases (such a s PGES, PG DS,PGFS,PGIS a nd TXAS
respectively) that are localized on the cytoplasmic face of the ER [20] in a cell-specific
7
fashion [1, 5 , 6 , 1 8]. Prostacyclin s ynthase i s expressed i n endot helial and smooth
muscle c ells, t hromboxane sy nthase i s found mainly i n pl atelets and macrophages,
PGF synthase is found in the uterus, and two types of PGD synthases are present in
brain an d mast c ells [6]. Two P GE sy nthases, microsomal P GE sy nthase ( mPGES)
and cy tosolic PGE syn thase ( cPGES), are ex pressed in the brain, ki dney, v ascular
smooth-muscle, g astric epithelium, and platelets of h umans[6] and t hese t wo PGESs
are also found in zebra fish [21].
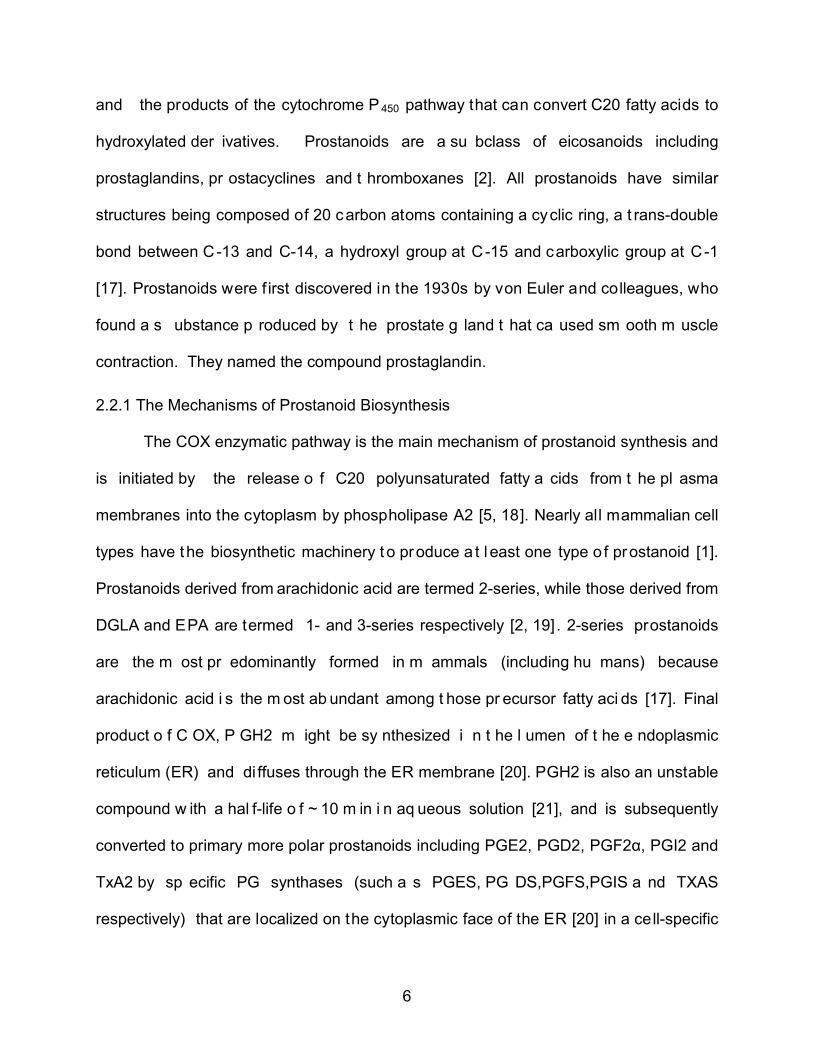
Primary pr ostanoids ar e ch anged t o o ther pr ostanoids by non -enzymatic
pathways. PGJ2 is the metabolite of PGD2 [22], TXB2 is the product of TXA2 [5] and
PGA2 is the product of PGE2 [23], which is also changed to PGB2.
8
Figure1. Biosynthetic routes for generation of some prostanoids and effect of NSAIDs
(ibuprofen) on prostanoids production.
Non-enzymatic peroxidation of arachidonic acid and other fatty acids pathways
can also produce prostanoid-like su bstances in vivo t hat are t ermed i soprostanes.
Isoprostanes are considered to be r eliable markers of oxidant st ress status and have
been l inked t o i nflammation, i schemia-reperfusion, di abetes, ca rdiovascular di sease,
reproductive disorders and di abetes [2]. F inally t he opportunistic fungal pat hogen,
9
Cryptococcus neoformans, ca n al so pr oduce authentic prostaglandin E 2 w ithout a
Cyclooxygenase [24].
2.2.2 Mechanisms of Prostanoid Biological Activity
Prostanoids are sy nthesized i ntracellularly and may exit t he si te of pr oduction
across the ce ll m embrane by a) very slow passi ve di ffusion driven by pH and t he
membrane potential (prostanoid pKa is approximately 5) [20] or b) by active transport
through the ATP-dependent efflux t ransporter multi-drug resistance protein 4 (MRP4)
[25]. Cellular in flux o f prostanoids through t he l ipid bi layers of t he ce ll or or ganelle
membranes is facilitated v ia the t ransmembrane pr ostaglandin t ransporter ( PGT)
protein [26].
Prostaglandin t ransporter (PGT) has been i dentified i n various tissues such as
brain, l iver, kidney, l ung, smooth m uscle and en dothelial ce lls [27]. Efficiency of
prostanoid binding to PGT is significantly decreased when the COO− anionic group (C-
1) is protonated or t he 15 -OH g roup i s changed [20]. PGT has been i dentified for
different roles su ch a s the release o f newly s ynthesized prostanoids from the si te o f
production, transepithelial transport of prostanoids, and the termination of signaling by
clearing prostanoids from circulation [26]. Prostaglandin t ransport protein (PGT) is a
lactate/prostaglandin exchanger [20], which exchanges lactate for different prostanoids
with varying affinities (PGE1~PGE2~PGF2 >PGD2>>TXB2) [20, 27]. PGT acts against
the net cellular efflux of prostanoids via passive di ffusion and so the accumulation o f
prostanoids intracellularly i s directly r elated t o the c ellular lactate g radient [20].
Because i n most c ells the l actate g radient i s outwardly di rected, P GT m ediates net
prostanoid uptake [25].
10
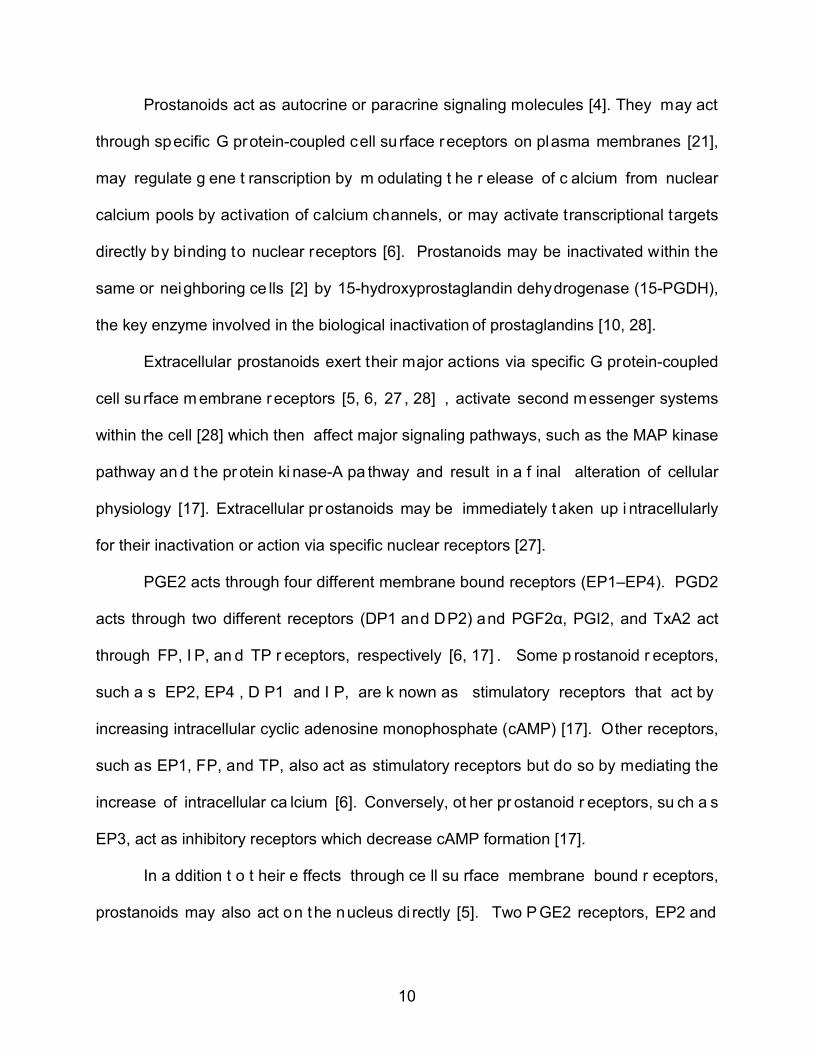
Prostanoids act as autocrine or paracrine signaling molecules [4]. They may act
through specific G protein-coupled cell su rface receptors on plasma membranes [21],
may regulate g ene t ranscription by m odulating t he r elease of c alcium from nuclear
calcium pools by activation of calcium channels, or may activate transcriptional targets
directly by binding to nuclear receptors [6]. Prostanoids may be inactivated within the
same or neighboring ce lls [2] by 15-hydroxyprostaglandin dehydrogenase (15-PGDH),
the key enzyme involved in the biological inactivation
Extracellular prostanoids exert their major actions via specific G protein-coupled
cell su rface m embrane receptors [5, 6, 27 , 28] , activate second messenger
of prostaglandins [10, 28].
PGE2 acts through four different membrane bound receptors (EP1–EP4). PGD2
acts through two different receptors (DP1 and DP2) and PGF2α, PGI2, and TxA2 act
through FP, I P, an d TP r eceptors, respectively [6, 17] . Some p rostanoid r eceptors,
such a s EP2, EP4 , D P1 and I P, are k nown as stimulatory receptors that act by
increasing intracellular cyclic adenosine monophosphate (cAMP) [17]. Other receptors,
such as EP1, FP, and TP, also act as stimulatory receptors but do so by mediating the
increase of intracellular ca lcium [6]. Conversely, ot her pr ostanoid r eceptors, su ch a s
EP3, act as inhibitory receptors which decrease cAMP formation [17].
systems
within the cell [28] which then affect major signaling pathways, such as the MAP kinase
pathway an d t he pr otein ki nase-A pa thway and result in a f inal alteration of cellular
physiology [17]. Extracellular pr ostanoids may be immediately t aken up i ntracellularly
for their inactivation or action via specific nuclear receptors [27].
In a ddition t o t heir e ffects through ce ll su rface membrane bound r eceptors,
prostanoids may also act on the nucleus di rectly [5]. Two P GE2 receptors, EP2 and
11
EP4, have been found in the nuclear envelope as well as in the cell membrane and the
Peroxisome P roliferator-Activated R eceptors have been demonstrated t o be nuclear
receptors for PGD2 and PGI2 [5].
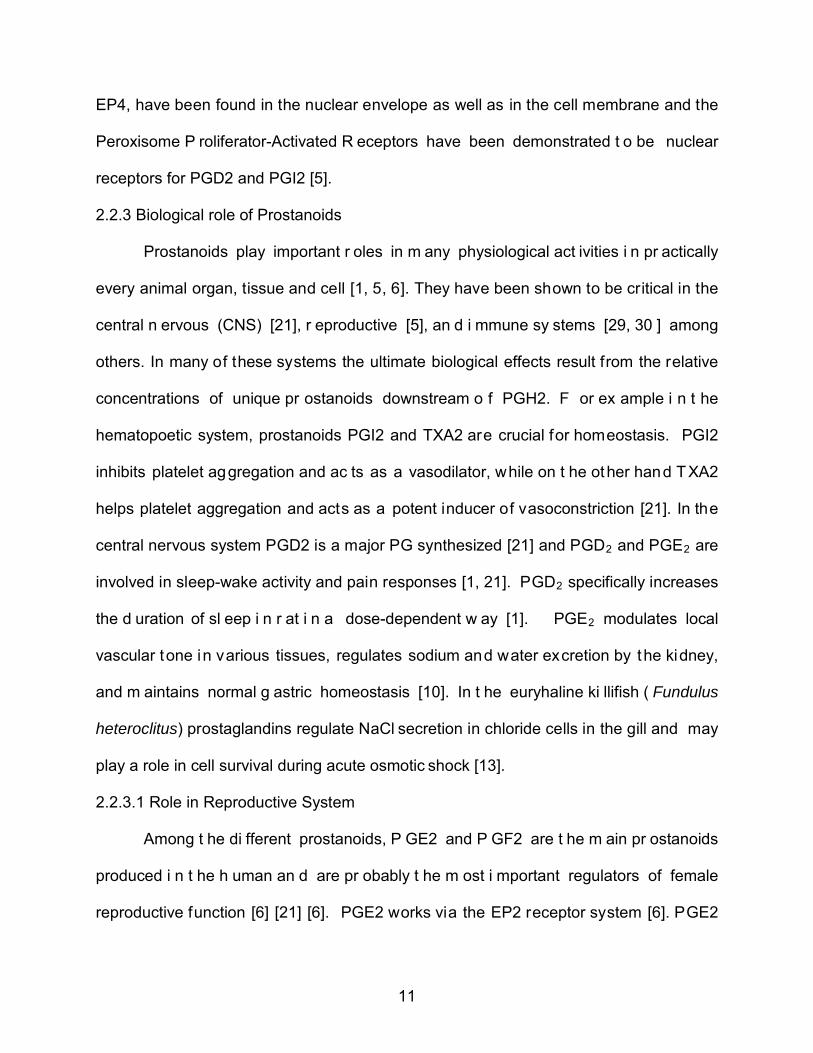
2.2.3 Biological role of Prostanoids
Prostanoids play important r oles in m any physiological act ivities i n pr actically
every animal organ, tissue and cell [1, 5, 6]. They have been shown to be critical in the
central n ervous (CNS) [21], r eproductive [5], an d i mmune sy stems [29, 30 ] among
others. In many of these systems the ultimate biological effects result from the relative
concentrations of unique pr ostanoids downstream o f PGH2. F or ex ample i n t he
hematopoetic system, prostanoids PGI2 and TXA2 are crucial for homeostasis. PGI2
inhibits platelet aggregation and ac ts as a vasodilator, while on t he other hand TXA2
helps platelet aggregation and acts as a potent inducer of vasoconstriction [21]. In the
central nervous system PGD2 is a major PG synthesized [21] and PGD2 and PGE2 are
involved in sleep-wake activity and pain responses [1, 21]. PGD2 specifically increases
the d uration of sl eep i n r at i n a dose-dependent w ay [1]. PGE2 modulates local
vascular tone in various tissues, regulates sodium and water excretion by the kidney,
and m aintains normal g astric homeostasis [10]. In t he euryhaline ki llifish ( Fundulus
heteroclitus) prostaglandins regulate NaCl secretion in chloride cells in the gill and may
play a role in cell survival during acute osmotic
2.2.3.1 Role in Reproductive System
shock [13].
Among t he di fferent prostanoids, P GE2 and P GF2 are t he m ain pr ostanoids
produced i n t he h uman an d are pr obably t he m ost i mportant regulators of female
reproductive function [6] [21] [6]. PGE2 works via the EP2 receptor system [6]. PGE2
12
targets smooth muscle cells,
2.2.3.2 Role in Immune System
causing their contraction or relaxation and also increases
vascular endot helial g rowth f actor A ( VEGF-A) pr oduction i n hu man airway sm ooth
muscle ce lls (HASMC) [31]. PGF2α has a well-recognized role for inducing labor and
delivering pups during parturition [6]. D isruption of COX-1 or COX-2 genes in female
mice reduced r eproductive e fficiency a nd COX-2 nul l mice s uffered from m ultiple
failures in reproductive processes [5]. Not only PGE2 and PGF2, but PGD2 and PGI2
as well, have important roles in embryonic development of zebra fish [21]. In embryonic
development of zebra fish, COX-1 der ived prostaglandins are required for two distinct
stages of development, dur ing gastrulation and segmentation [6] and ovarian-derived
prostaglandins are involved in the regulation of oocyte maturation and ovulation [32].
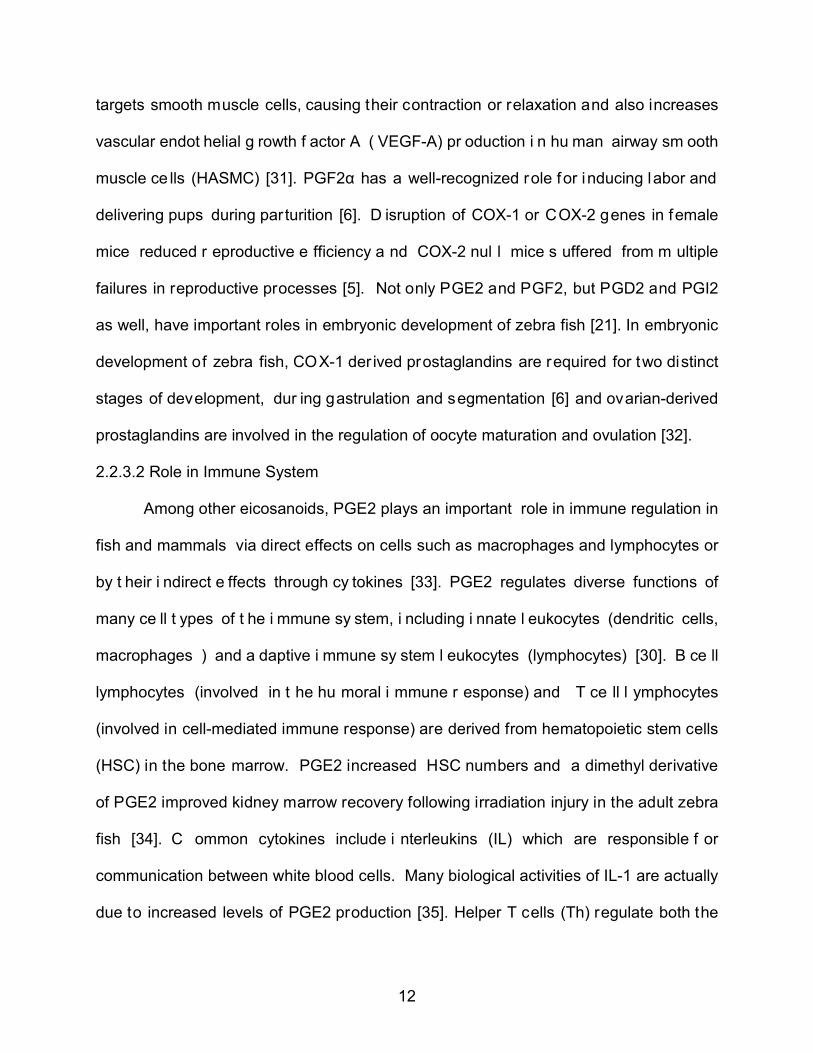
Among other eicosanoids, PGE2 plays an important role in immune regulation in
fish and mammals via direct effects on cells such as macrophages and lymphocytes or
by t heir i ndirect e ffects through cy tokines [33]. PGE2 regulates diverse functions of
many ce ll t ypes of t he i mmune sy stem, i ncluding i nnate l eukocytes (dendritic cells,
macrophages ) and a daptive i mmune sy stem l eukocytes (lymphocytes) [30]. B ce ll
lymphocytes (involved in t he hu moral i mmune r esponse) and T ce ll l ymphocytes
(involved in cell-mediated immune response) are derived from hematopoietic stem cells
(HSC) in the bone marrow. PGE2 increased HSC numbers and a dimethyl derivative
of PGE2 improved kidney marrow recovery following irradiation injury in the adult zebra
fish [34]. C ommon cytokines include i nterleukins (IL) which are responsible f or
communication between white blood cells. Many biological activities of IL-1 are actually
due to increased levels of PGE2 production [35]. Helper T cells (Th) regulate both the
13
innate and a daptive immune responses and help to determine which types of immune
responses the body will make to a particular pathogen and PGE2 inhibits the production
of T h1 cy tokines, su ch as interleukin ( IL)-2, IL -12, an d interferon ( IFN)-gamma, but
PGE2 has no effect or enhances production of Th2 cytokines, such as IL-4, IL-5, and IL-
10. [29]. Splenic PGE2-releasing m acrophages (PGE2-MØ) r egulate t he sh ift of
immune r esponse from Th1 ( that i mmunity t hat pl ay an i mportant r ole i n the
development o f pr otective i mmunity ag ainst i ntracellular i nfections) t o Th2 i n mice
treated with heat-killed (HK) –BCG (Mycobacterium Bovis bacillus Calmette-Guerin) and
that s hift of i mmune response may be r elated t o a utoimmune di seases [35]. The
PGE2/EP4 pathway c ould b e i nvolved i n t he l ymphoid c ell fate d ecision a nd has a
novel role in controlling T cell development of zebra fish embryos [30].
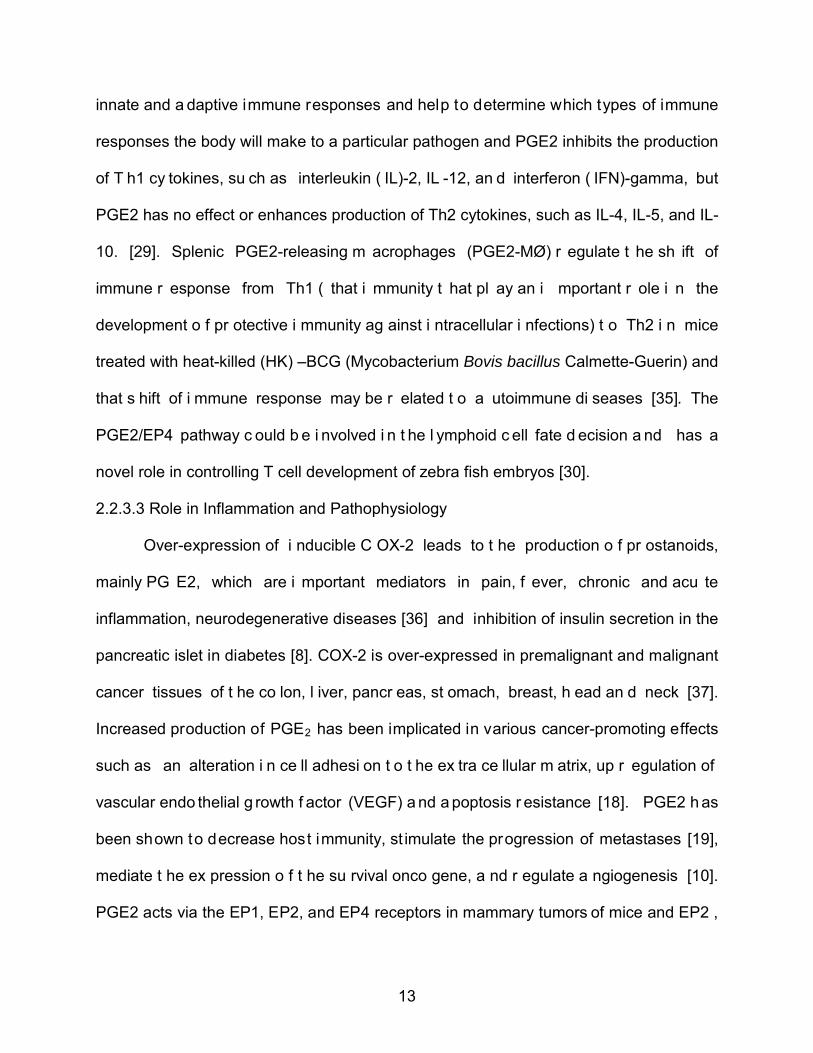
2.2.3.3 Role in Inflammation and Pathophysiology
Over-expression of i nducible C OX-2 leads to t he production o f pr ostanoids,
mainly PG E2, which are i mportant mediators in pain, f ever, chronic and acu te
inflammation, neurodegenerative diseases [36] and inhibition of insulin secretion in the
pancreatic islet in diabetes [8]. COX-2 is over-expressed in premalignant and malignant
cancer tissues of t he co lon, l iver, pancr eas, st omach, breast, h ead an d neck [37].
Increased production of PGE2 has been implicated in various cancer-promoting effects
such as an alteration i n ce ll adhesi on t o t he ex tra ce llular m atrix, up r egulation of
vascular endo thelial g rowth f actor (VEGF) a nd a poptosis r esistance [18]. PGE2 h as
been shown to decrease host immunity, st imulate the progression of metastases [19],
mediate t he ex pression o f t he su rvival onco gene, a nd r egulate a ngiogenesis [10].
PGE2 acts via the EP1, EP2, and EP4 receptors in mammary tumors of mice and EP2 ,
14
EP4 and FP receptors (the receptor for PGF2
In contrast to an increased risk of cancer due to COX-2 over expression, some
prostanoids inhibit COX-2 activity and i nduce apoptosis, inhibit proliferation and exhibit
) are also expressed in human prostate
cancer ce lls [28]. Thromboxane s ynthase ( TXS) expression is also u p-regulated i n
tumors which i ndicates that not o nly P GE2 but T XA2 al so has an i mportant r ole i n
cancer [38]. Surgical removal of a brain tumor reduced high levels of PGE2 [39] and
the prostaglandin pathway may be a novel target for the treatment of various cancers,
including prostate cancer [28].
anti-tumor activity in human cancer cells [examples include 15d-PGJ2 (15-deoxy-12,14-
prostaglandin J2 the ultimate metabolite of PGD2) in breast cancer cells [22] and PGI2
[38] and P GA2 [23] in lung cancer cells]. PGD2
2.2.4 Levels of Prostanoids in Animals
may be i nvolved in ant i-inflammatory
processes [9] .
PGE2 is the major prostanoid found in invertebrates [1] as well as in vertebrate
animals such as humans [10] and fish [40]. Studies have reported di fferent l evels of
PGE2 to be the dominant prostanoid (9.1 ng/g t issue [40] and 26 ng/g t issue [32]) in
whole body of adult zebra fish. Not only PGE2 but other prostanoids, such as 6-keto
PGF1α (the stable hydrolysis product of PGI2) and TXB2 ( non-enzymatic metabolite
product of T XA2) w ere a lso reported at detectable l evels (0.33 ng /g and 0. 08 ng /g
respectively) in whole body of adult zebra fish [40]. Levels of PGE2 and PGF2α were
not detectable in follicles of control zebra fish, but these t issues can pr oduce PGE2
and PGF2α in response to AA in a concentration-dependent manner [32]. In embryonic
development of zebra fish, embryonic homogenate synthesized different prostanoids at
15
different levels [PGE2~PGD2 (~40%), PGF2 (~12%) and TXB2 (~5%)] from exogenous
PGH2 just after fertilization and some of t hose levels were ch anged si gnificantly 120
hours post-fertilization [PGE2(~35%), P GD2 (~10%), P GF2(~20%), and TXB2(~20%)]
[21]. In heal thy humans similar l evels of PGE2 h ave been found. C oncentrations of
PGE-M ( urinary metabolite of PGE2
2.3 Nonsteroidal Anti-inflammatory Drugs (NSAIDs)
) in healthy humans is nearly twofold greater in men
(10.4 ng/mg) than in women (6.0 ng/mg) [10].
NSAIDs are antipyretic, analgesic and anti-inflammatory drugs which are used to
reduce pain, fever and inflammation [41]. Today NSAIDs, mainly COX-2 inhibitors, are
also used as anti-cancer drugs [8, 18, 42]. From a hi storical viewpoint, aspirin was the
first NSAID and it has been used for more than 100 years with therapeutic benefits. The
overall worldwide pr oduction o f N SAIDs is abou t 50, 000 t ons a y ear and t he most
prominent over-the-counter drugs are asprin, Motrin ( ibuprofen), Advil (ibuprofen) and
Aleve (naproxen). NSAIDs are the most commonly prescribed medications in the United
States. Over 100 millions prescriptions are written annually for NSAIDs, which is 4% of
the total prescription volume in US (National prescription audit, 2002). The term "non-
steroidal" i s used to d istinguish t hese drugs from st eroids because t hese dr ugs also
have a similar eicosanoids-depressing, anti-inflammatory action.
In t he 1 970s, V ane, Samuelson and B ergstrom pr oved that as pirin and ot her
NSAIDs block the b iosynthesis of pr ostaglandins [41]. NSAIDs not onl y i nhibit
prostanoids production by C OX but i t al so i nhibits expression o f COX and stimulate
nuclear r eceptors of pr ostanoids [43]. NSAIDs including i buprofen [43] and
indomethacin [25] inhibit prostanoind efflux transporter (MRP4) to release prostanoids
16
from site of production. It seems clear that NSAIDs have very important role to control
the effect of prostanoids.
2.3.1 Mechanism of NSAIDs on COX
NSAIDs inhibit cyclooxygenases (COX) enzymes which are key enzymes in the
conversion o f ar achidonic acid t o prostanoids. NSAIDs have di fferent mechanisms to
inhibit COX e nzymes [44]. Aspirin, wh ich covalently bi nds to COX, is a selective
irreversible i nhibitor of C OX-1 at l ow dose but a nonselective i rreversible i nhibitor of
COX at high dose while flurbiprofen and indomethacin inhibit COX via ionic interactions
between their carboxylic function and the arginine residue of the enzyme and are slow,
time-dependent, reversible, nonselective inhibitors of C OX [41]. Ibuprofen, wh ich
competes with the substrate [arachidonate or peroxyacid intermediate (PGG2) [44]] of
COX at the catalytic center, is a reversible nonselective competitive inhibitor [1] [41] .
IC50 values of ibuprofen have been reported as 3.3 µM [5] and 4.75 ± 0.5 µM [41] for
COX-1 and 37 µM [5] and more than 30 µM [41] for COX-2 in human. Vioxx (rofecoxib)
and ce lebrex ( celecoxib), which ar e v ery weak competitive i nhibitors of C OX-1, are
slow, t ime-dependent i rreversible i nhibitors o f C OX-2 [10, 41] [5]. Acetaminophen
inhibits COX-3 [14] and C OX w hich ar e pr esent i n br ain [12]. Finally, non-selective
NSAIDs also inhibit COX in zebrafish ovaries which are involved in the regulation of
oocyte maturation and ovulation [32].
2.3.2 Side effect of NSAIDs
Although all cl assic NSAIDs inhibit b oth COX-1 and C OX-2, b eneficial anti-
analgesic and ant i-inflammatory effects of NSAIDs are due to the inhibition of COX-2
[41]. Total inhibition of all prostanoid biosynthesis by NSAIDs provides quick relief from
17
symptoms but may i nduce unw anted si de e ffects [5]. F or ex ample gastrointestinal
toxicity and mild bl eeding di athesis are a r esult o f t he i nhibition o f C OX-1 [41] and
NSAIDs, including aspirin, can have important effects in gastro duodenal injury, such as
ulcers and a g reater r isk of GI bl eeding [45]. Vioxx was withdrawn from the m arket
because i t has severe si de e ffects associated w ith COX-2 inhibition such as heart
failure and infertility [5].
2.3.3 Levels of NSAIDs in the Environment
Pharmaceutical r esidues, including NSAIDs, are on e o f t he m ost ab undant
groups of environmental co ntaminants. Widespread ap pearance of N SAIDs in t he
aquatic environment i s due to their hi gh volume o f consumption and their i ncomplete
removal dur ing w astewater t reatment. During primary and se condary treatment at
sewage treatment plants (STP), ibuprofen (which has a dissociation constant (pKa) in
the range of 4.4-4.9, and a log Kow in the range o f 3.8-4.0) was removed with more
than 90% efficiency [46], but amide-type p harmaceuticals, such as ketoprofen and
naproxen, showed poor removal (<50% efficiency), which is probably due to their lower
hydrophobicity (log Kow<3)[3].
NSAIDs (Ibuprofen) concentrations have been r eported from 3.3 ( 3.0) p pb to
4.8(4.2) ppb in f inal effluents of STPs in the UK with a maximum value of 27.6 (27.3)
[47, 4 8]. V alues of 13.2 ( 7.7) ppb to 10 0 (33.8) ppb have been r eported i n raw
influent[47]. Studies in Canada have reported concentrations of NSAIDs (Ibuprofen)
ranging f rom 1.0 ppb to14.5 (6.7) ppb in f inal ef fluent of STP [49, 50] and in Sweden
effluent co ncentrations of N SAIDs have b een reported up t o 7 .1 pp b [51]. Lower
18
concentrations of NSAIDs [Aspirin 7.3ppb and ibuprofen 0.7 ppb] were reported in the
influent of a STP in Tokyo [3].
Current studies demonstrate that pharmaceutical drugs are ca pable of
bioconcentration. The bioconcentration factor for ibuprofen from water to blood plasma
of rainbow t rout was 9 during short-term static exposure of a high concentration (520
ppb) in an aquarium[46] .
2.4 Bluntnose Minnow
Bluntnose Minnows (Pimephales notatus) are a small and slow growing species
of temperate freshwater belonging t o the c yprinid f amily. Bluntnose M innows have
been used as physiological models to an alyze growth dy namics of w hite m yotomal
muscle fibers [52], histochemical ch aracterization of myotomal m uscle [53] and i n a
variety of bioaccumulation and aquatic toxicity studies[54] . Bluntnose minnows are one
of the most common freshwater fish in the Eastern U.S.
19
CHAPTER 3
INTRODUCTION TO MATERIALS AND METHODS
To ach ieve t he g oals mentioned i n the obj ective se ction o f t his proposal, two
different mass spectrometry methods were applied after a si ngle extraction procedure
designed t o ca pture both N SAIDs and ei cosanoids. Liquid ch romatography/electro
spray i onization- tandem mass spectrometry (LC/ESI-MS/MS) was u sed to study a nd
quantify prostanoids, and gas chromatography-mass spectrometry (GC-MS) was used
to quantify ibuprofen. Prostanoids are lipid mediator endogenous compounds that can
vary among i ndividual animals with si ze, c ondition, stress and ot her factors, so 15
replicates were required in each group to minimize variability. Prostanoids are light and
thermally se nsitive so co ld co nditions w ere maintained up t o the t ime of an alysis o f
prostanoids by LC/ESI-MS/MS. After completion of prostanoid analysis, ibuprofen was
analyzed by GC/MS from same sample preparation at room temperature.
3.1 Materials
Prostaglandins standards PGE2, P GD2, P GF2, PGE1, PG A2, P GB2, PGB1,
PGA1, TXB2 and deuterated internal standard PGE2-D4 were purchased from Cayman
chemical company. Ibuprofen standard and deuterated internal standard, ibuprofen-D3,
were purchased from Toronto Research Chemical Inc, ON, Canada. A ll HPLC grade
solvents, phosphate buffered sa line ( PBS), ethylene-diamine-tetraacetic acid ( EDTA),
butylated hydroxyl toluene (BHT) and citric acid were purchased from Sigma. Bluntnose
minnows were purchased from Pond King Inc, Gainesville, TX.
3.2 Methods
3.2.1 Control Fish and Treatment Exposures
20
Control a nd treatment ( 100.0 p pb, 50 .0ppb 25. 0 p pb and 5.0 p pb i buprofen)
groups of 45-60 bluntnose minnows each were subjected to a static 48 hour exposure in
14 l iter and 60 l iter t anks without f eeding. D e-chlorinated tap water from th e C ity o f
Denton, Texas was used to dilute high concentration ibuprofen (5,000 ppm in methanol)
to the different exposure level concentrations in each tank. Methanol was also added to
control t anks for equivalent so lvent e ffect. Immediately f ollowing exposure euthanized
fish were dissected for removal of gill tissue.
3.2.2 Tissue Extraction for Eicosanoids and Ibuprofen
Approximately 100 m g g ill t issue/replicate (each r eplicate c onsisted o f 2 -3
animals’ combined gill tissue) was transferred to a pre-weighed bead beater plastic vial
with 2.5 mm glass and silica beads and a fresh tissue weight was taken. A fterwards,
3.0 ml o f 1: 1 hexane: et hyl acetate extraction so lvent, 0.5ml P BS bu ffer w ith 1 mM
EDTA, 150µl of 1% BHT ( to prevent free radical per oxidation of prostaglandins) a nd
150 µl 1N ci tric acid were added t o ex tract ei cosanoids [19, 5 5] and i buprofen. B oth
internal st andards, d4 -PGE2 ( 250ppb i n f inal v olume) and d3 -IBU ( 500 ppb i n final
volume) were added to mixture at the time of homogenization. Tissue homogenization
was performed with Mini bead beater-TM
Homogenate mixtures were t ransferred t o labeled 10 m l g lass test t ubes that
were kept on i ce. T he bead b eater v ial was rinsed with 2.0 ml hexane: ethyl acetate
(1:1, v /v) e xtraction so lvent and c ollected i n t he same t est t ubes. P rostaglandins and
(Biospec products). Approximately 3 rounds of
agitation w ere per formed on eac h sa mple w ith duration of one minute per round.
Approximately f ive m inute w aiting i ntervals w ere use d b etween ag itation r ounds t o
prevent excessive heating of the extract.
21
ibuprofen were extracted by vortexing each sample for two minutes followed by storage
for 4 to 8 hours at 4 o
3.2.3 Determination of Lipid weights
C [19, 55]. Samples were centrifuged at 1800XG [19, 55] for 10
min at minimum l ight levels to reduce the potential for photo and thermal degradation
[55] and then the upper organic layer was transferred to an 8.0 ml glass vial. The lower
aqueous layer was extracted, re-vortexed and re-centrifuged one more time with 3.0 ml
of ex traction so lvent. T he r esulting or ganic l ayer was then c ombined w ith t he i nitial
organic layer.
The organic extracts were dried under nitrogen at room temperature and then re-
solubilized i n 0. 5 mL extraction so lvent ( 1:1 hexane: ethyl ace tate). S amples were
transferred to p re-weighed a uto-sampler v ials via 0. 22 µM filter ( 13 mm M illex-GV)
syringe dr iven f ilter, to remove insoluble material, and then re-dried under ni trogen at
room t emperature t o m easure l ipid w eights. F ilters and sy ringes were r insed w ith
extraction so lvent and t hat r insed so lvent ( perhaps containing so me i buprofen) w as
collected in different labeled test-tubes for later analysis of ibuprofen.
3.2.4 LC-ESI/MS/MS Analysis for Eicosanoids
After t aking l ipid w eights, final ex tracts were r econstituted i n 100 µl of 3 0%
acetonitrile (ACN) and 70% water with 5 mM ammonium acetate. Most of the time this
final extract was cloudy due to insoluble precipitate and was again filtered using a 0.22
µM syringe dr iven f ilter ( 13 m m M illex-GV) be fore LC /MS i njection. A s a mentioned
previously, filters and syringes were rinsed again with extraction solvent and collected in
the same labeled test-tube for later analysis of ibuprofen. Eight µL of clean sample were
injected into the LC-ESI/MS/MS in negative ion mode for prostanoid analyses. For the
22
liquid chromatography, an A gilent 1100 binary pump (Agilent Technologies, Palo Alto,
CA) was used, together with a reverse phase C18 column ( 2.1mm X 150 mm with 5µM
Zorbax Extend).
LC-ESI/MS/MS method was setup using dry hot Nitrogen gas flow at 350 o
The LC-ESI/MS/MS method was further optimized by using multi reaction mode
(MRM) and creating five different windows in which the first and last windows diverted
LC e ffluent to waste and the ot her t hree w indows were use d for anal ysis of different
prostanoids. T he s econd w indow was used for TXB2 w ith a co llision i nduced
dissociated (CID) energy 0.5, the third window was used for PGF2, PGE2, PGE2-D4,
PGD2 and PGE1 with CID energy 0.8, and finally the forth window was used for PGA2,
C and
8 L /min, n ebulizer pr essure 30 psi, capillary cu rrent appr oximately 26 nA, pump f low
300 µL/min in normal flow mode and a total run time of 30 minutes. Gradient elution of
water with 5 m M ammonium acetate ( pump-A) and 95 % ac etonitrile w ith 5 mM
ammonium acetate (pump-B) was set up to separate the different prostanoids on the C-
18 co lumn. G radient el ution st arted from 30% pu mp-B for t he first m inute t hen
increased linearly to 50% at 10 minutes, 55% at 15 minutes, 100% at 15.1 minutes then
remained constant un til minute 20. F inally t he flow was reduced to 30 % pump-B in
order t o re-equilibrate t he co lumn to st arting co nditions. The LC-ESI/MS/MS m ethod
was optimized using the following parameters, Capillary voltage (3500 V), Skimmer ( -
40.0V), Capillary Exit (-116.1 V), Trap drive (43.9), End plate offset (-500V), Lens 1 (5.0
V), Le ns 2 ( 60.0V), I CC ion t rap w as o n and se t t o scan 190 to 3 75 M /Z with a
maximum accumulation time of 50 ms, sample averaging of 5 and a target ion count of
30000.
23
PGB2, PGA1 and PGB1 with C ID energy 1.0. The absolute retention t imes of these
compounds varied slightly, so the capturing times of al l three analyzing windows were
changed and opt imized at each time of an alysis. T he or der of prostanoid elution
remained co nstant. M olecular ions (M-H)- were isolated a nd t he most a bundant
fragment i on w as detected i n e ach a nalyzing window. Information on t he t entative
retention times, molecular ions, and relative abundance of transition ions are presented
in Table 1.
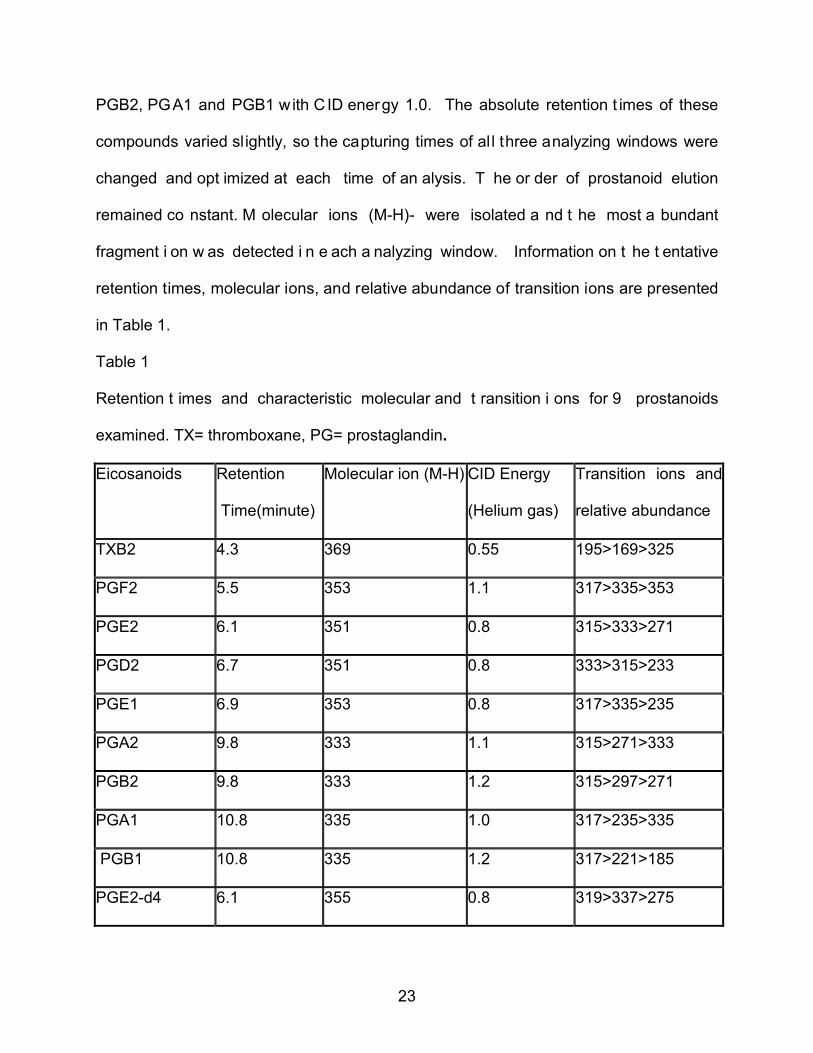
Table 1
Retention t imes and characteristic molecular and t ransition i ons for 9 prostanoids
examined. TX= thromboxane, PG= prostaglandin.
Eicosanoids Retention
Time(minute)
Molecular ion (M-H) CID Energy
(Helium gas)
Transition ions and
relative abundance
TXB2 4.3 369 0.55 195>169>325
PGF2 5.5 353 1.1 317>335>353
PGE2 6.1 351 0.8 315>333>271
PGD2 6.7 351 0.8 333>315>233
PGE1 6.9 353 0.8 317>335>235
PGA2 9.8 333 1.1 315>271>333
PGB2 9.8 333 1.2 315>297>271
PGA1 10.8 335 1.0 317>235>335
PGB1 10.8 335 1.2 317>221>185
PGE2-d4 6.1 355 0.8 319>337>275
24
3.2.5 Ibuprofen Re-extraction from Tissue samples and Sample Clean-up
Two different methods were used to re-extract ibuprofen from the tissue samples
and for sample clean-up.
3.2.5.1 First Method
After LC/MS analysis each final extract was transferred to the corresponding 10.0
ml t est t ube co ntaining the ex traction so lvent f rom the syringe and filter r inses
generated during LC/MS preparation. Samples were then acidified (pH<2.0) with 200 µl
1N hydrochloric acid (HCl) solution. Ibuprofen was re-extracted for 30 minutes to 1 hour
with 5.0 ml 1:1 hexane: ethyl acetate and 1.5 ml MQ water after vortexing each sample
for two minutes [19, 55] . Samples were then centrifuged at 1800XG for 10 min and the
upper organic layer was transferred to 8.0 ml glass vial. The lower aqueous layer was
re-extracted one more t ime w ith 3. 0 m l ex traction so lvent, r e-vortexed, re-centrifuged
and t he r esulting or ganic layer w as combined w ith t he i nitial or ganic layer and t hen
dried completely under ni trogen. E xtracts were then resolubilized in 100µl methylene
chloride and transferred to a new auto sampler vial af ter filtration through 0.22 micron
syringe driven filter (13 mm Millex-GV) in preparation for HPLC/GPC cleanup.
Ibuprofen was isolated from high molecular weight lipids by HPLC/gel permeation
chromatography ( GPC) cleanup usi ng a n A gilent 110 0 bi nary pum p ( Agilent
Technologies, Palo Alto, CA) with A.T.1200 series fraction collector and 350 X 21.2 mm
GPC co lumn (Phennomenex) w ith m ethylene ch loride i socratic m obile phase ( 4.5
mL/min). Most of the lipids elute before 10.5 min and ibuprofen (M.W. 206.3, monitored
at 2 26 n m) el uted ar ound 14 .0 m in. T hat r etention t ime w as compared to a G PC
calibration r eference st andard ( corn oi l el utes around 9 .8 m inutes, pht halate el utes
25
around 1 3.2 minutes and s ulphur el utes around 22 .2 minutes with co lumn pr essure
approximately 65 psi ). T he i buprofen fraction ( 13.5 mL) w as collected bet ween 13
minutes to 16 minutes and ev aporated t o dryness using ni trogen g as at 40 o
3.2.5.2 Second Method
C in
preparation for derivatization.
Collected extraction s olvent ( hexane: ethyl ace tate) use d for sy ringe and filter
rinsing during preparation for LC/MS analyses of Prostanoids was dried using nitrogen
gas at 40 o C and reconstituted in 500 µl of 30% acetonitrile (ACN) and 70% water with
5 mM ammonium acetate. Most of the ibuprofen (pKa is 4.4-4.9) was dissolved in this
polar, weakly acidic (pH 5 -6) so lvent, h owever l ipids remained as an insoluble
precipitate an d w ere r emoved by f iltration u sing 0. 22u filter ( 13 mm M illex-GV). The
above cl ean filtrate a nd final cl ean ex tract a fter LC /MS a nalysis were co mbined and
transferred to 10.0 ml test tube and acidified (pH<2.0) with 200 µl 1N hydrochloric acid
(HCl) so lution. I buprofen w as re-extracted f or 30 m inutes to 1 hour w ith 5. 0 m l 1: 1
hexane: ethyl acetate and 1.5 ml MQ water after vortexing each sample for two minutes
[19, 55] . Samples were centrifuged at 1800XG for 10 min and then the upper organic
layer was transferred to a cl ean 8.0 m l g lass vial. Low er layer was re-extracted one
more time with 3.0 ml extraction solvent, and both organic phases were combined and
evaporated to dryness using nitrogen gas at 40o
3.2.6 Ibuprofen Extraction from Control and Exposure Water Samples
C in preparation for derivatization.
Immediately prior to exposure and again immediately after animal exposure 1.0
ml to 5.0 ml water samples, depending on the different exposure group, were removed
and extracted in order to verify exposure concentrations. Samples were acidified with 1
26
molar HCL [3, 49, 56 -58] and ex tracted w ith 4. 0 m l 1: 1 hex ane and et hyl ace tate
extraction solvent. Internal standard d3-IBU (500 ppb in final volume) was added to the
mixture at the time of extraction and ibuprofen was extracted for 30 minutes to 1 hour at
room temperature after vortexing each sample for two minutes [19, 55]. Samples were
centrifuged at 180 0XG [19, 55 ] for 10 min an d t hen the up per or ganic layer was
transferred t o an 8.0 ml g lass vial. Lower aqueous layer was re-extracted one more
time w ith 4. 0 ml ex traction solvent a nd b oth or ganic phases were co mbined an d
evaporated to dryness in preparation for derivatization.
3.2.7 Derivatization of Ibuprofen
Above dried samples were dissolved in 500 µL of extraction solvent, transferred
to a 1. 5 ml auto sampler vial and ev aporated to dryness using nitrogen gas at 40 o C.
Ibuprofen was incubated with 50 µl of 14% boron trifluoride (BF3) in methanol [3, 49, 56]
at 8 5 o
3.2.8 Extraction of Derivatized Ibuprofen
C for t wo h ours [49] to form t he m ethyl der ivative. A pproximately 50 µl
acetonitrile, which acts as a co-solvent and also forms adducts with boron trifluoride (a
convenient w ay t o ut ilize B F3 as a L ewis acid as a c atalyst was added t o sa mples
before starting derivatization.
Derivatized ibuprofen was allowed to cool to room temperature and then 1.0 ml
MQ water was added and the ent ire contents immediately t ransferred to 8.0 m l g lass
vial containing 2.0 ml 1:1 hexane and ethyl acetate extraction solvent. The above 1.5 ml
auto sa mpler v ial w as rinsed t wice w ith 1. 0 ml ex traction solvent and onc e w ith M Q
water. Derivatized ibuprofen was back-extracted after vortexing for one minute [49] and
allowing enoug h t ime for se paration o f t he t wo phase s. The u pper or ganic layer was
27
transferred to a clean 8mL vial and the lower aqueous layer was re-extracted one more
time with 3.0 ml of 1:1 hexane/ethyl acetate extraction solvent and the resulting organic
phase was transferred to the same vial. The combined organic phases were then dried
under nitrogen, resolubilized in 500 µL extraction solvent and t ransferred to clean auto
sampler vial. Finally, the organic extract was dried under nitrogen and resolubilized in a
final volume of 100 µl hexane in preparation for GC/MS injection.
3.2.9 GC/MS Analysis of Ibuprofen
Sample analysis was conducted using a 6890 N GC (Agilent Technologies) with
a 5973 inert (Agilent Technologies) mass spectrometer. The GC/MS method was setup
using the following parameters: injector temperature 260ºC in splitless injection mode,
the column was an EC-5 30 m, 0.25 mm i.d., 0.25 µm f ilm from Alltech, with the oven
programmed temperature g radient o f 10 o C / min from 40 -200 o C dur ing 3 t o 19
minutes and 15 o C /min up to 300 o
3. Statistics used
C for a final cleanup of the column. Carrier gas was
helium at a co nstant inlet pr essure o f 8.0 psi , flow in co lumn w as 1.2 m l/min and
average velocity of 40 cm/sec. 2 µLs of the final ibuprofen extract was injected into the
GC/MS an d the mass spectrometer was operated in the single ion monitoring mode
set for m/z 161 (100%) as the target quantification ion with confirming ions 220 (21.7%)
, 177 ( 32.0%), 117( 27.8%) for native i buprofen a nd m/z 164 (100%) as the t arget
quantification ion with confirming ion 223 (19.8%) for the internal standard deuterated
ibuprofen. Ibuprofen eluted around 17.4 min in the 30.67 minute total run time.
Unpaired t-test and one way analysis of variance (ANOVA) with Tukey-Kramer-
Multiple comparisons test and Student-Newman-Keuls Multiple comparisons test were
28
used i n t his project using t he st atistical so ftware Graph P ack. These st atistics w ere
used to determine whether t he concentration o f P GE2 a nd i buprofen i n di fferent
exposure samples and t heir co rresponding controls were significantly di fferent or not.
ANOVA and unpaired t-test both have a nul l hypothesis that all the population means
are equal or that there is no significant difference between the population means. Both
assume generally that all data are normally distributed. If the null hypothesis is rejected,
there is a significant difference in the population means. ANOVA allows us to analyze
mean differences between two or more groups but unpaired t-test is only for two groups
with smaller si ze popul ation. Unpaired t-test (each m ember of one s ample ar e
independent of each member of the other sample) can used for equal sample sizes and
equal variance or unequal sample sizes and equal variance or unequal sample sizes
and unequal variance
. The significance limit (probability level) was 0.05 (P<0.05).
29
CHAPTER 4
RESULTS
4.1 Chromatogram of Prostanoids in LC/MS/MS
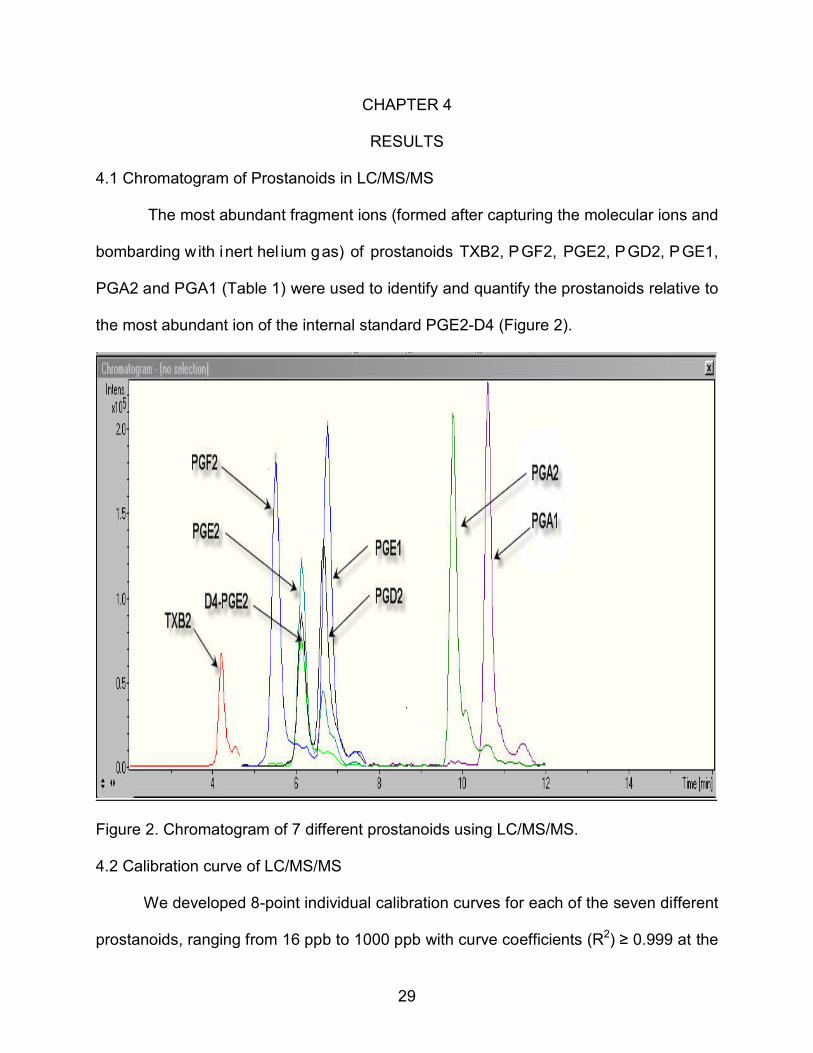
The most abundant fragment ions (formed after capturing the molecular ions and
bombarding with inert hel ium gas) of prostanoids TXB2, PGF2, PGE2, PGD2, PGE1,
PGA2 and PGA1 (Table 1) were used to identify and quantify the prostanoids relative to
the most abundant ion of the internal standard PGE2-D4 (Figure 2).
Figure 2. Chromatogram of 7 different prostanoids using LC/MS/MS.
4.2 Calibration curve of LC/MS/MS
We developed 8-point individual calibration curves for each of the seven different
prostanoids, ranging from 16 ppb to 1000 ppb with curve coefficients (R2) ≥ 0.999 at the
30
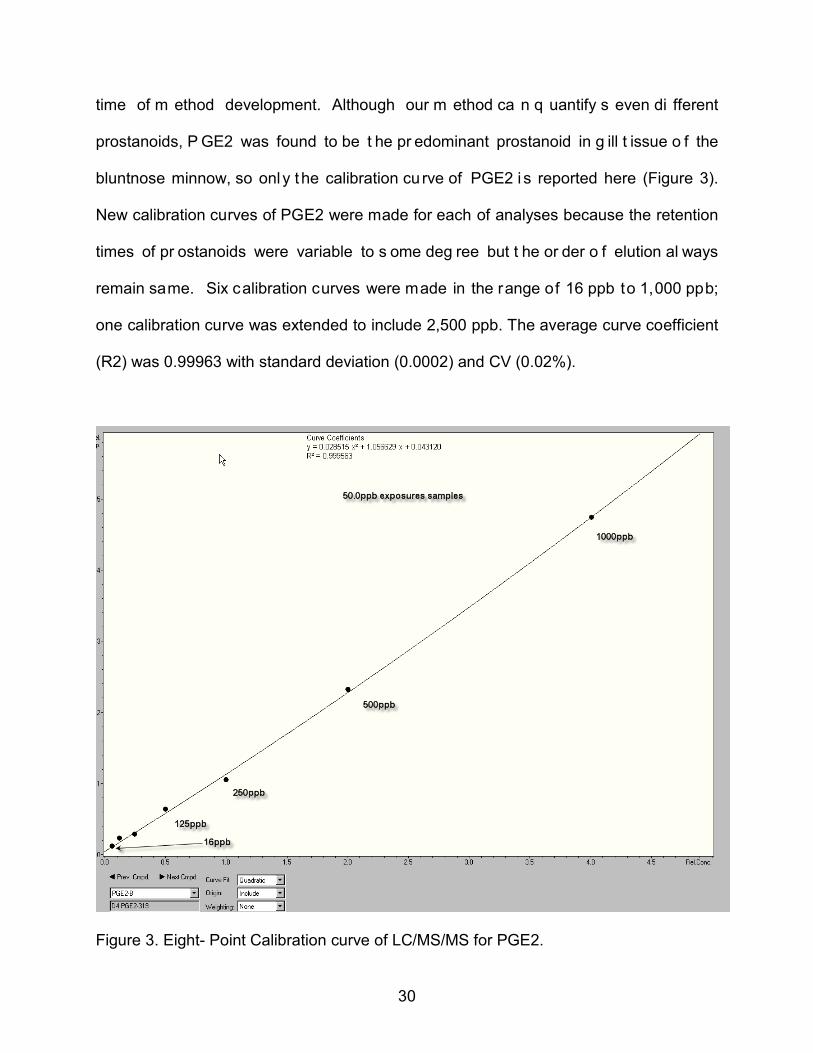
time of m ethod development. Although our m ethod ca n q uantify s even di fferent
prostanoids, P GE2 was found to be t he pr edominant prostanoid in g ill t issue o f the
bluntnose minnow, so only the calibration cu rve of PGE2 i s reported here (Figure 3).
New calibration curves of PGE2 were made for each of analyses because the retention
times of pr ostanoids were variable to s ome deg ree but t he or der o f elution al ways
remain same. Six calibration curves were made in the range of 16 ppb to 1,000 ppb;
one calibration curve was extended to include 2,500 ppb. The average curve coefficient
(R2) was 0.99963 with standard deviation (0.0002) and CV (0.02%).
Figure 3. Eight- Point Calibration curve of LC/MS/MS for PGE2.
31
4.3 Calibration curve and Chromatogram of Ibuprofen in GC/MS
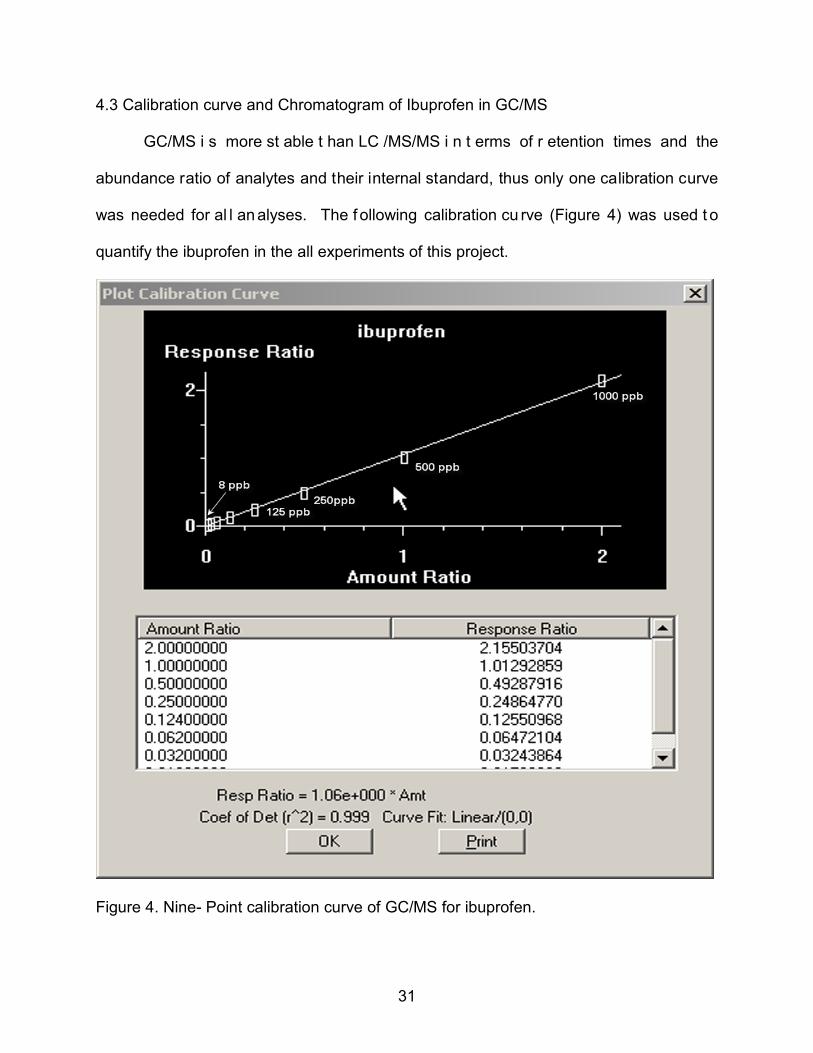
GC/MS i s more st able t han LC /MS/MS i n t erms of r etention times and the
abundance ratio of analytes and their internal standard, thus only one calibration curve
was needed for al l an alyses. The f ollowing calibration cu rve (Figure 4) was used t o
quantify the ibuprofen in the all experiments of this project.
Figure 4. Nine- Point calibration curve of GC/MS for ibuprofen.
32
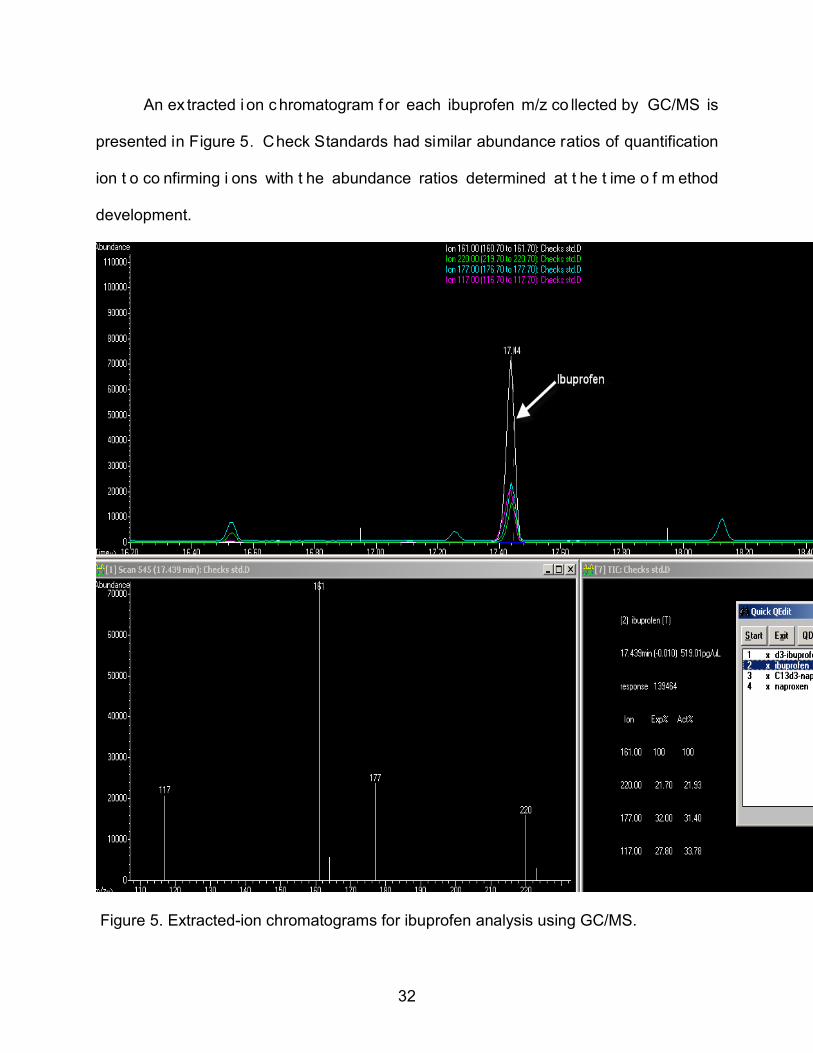
An ex tracted i on c hromatogram f or each ibuprofen m/z co llected by GC/MS is
presented in Figure 5. Check Standards had similar abundance ratios of quantification
ion t o co nfirming i ons with t he abundance ratios determined at t he t ime o f m ethod
development.
Figure 5. Extracted-ion chromatograms for ibuprofen analysis using GC/MS.
33
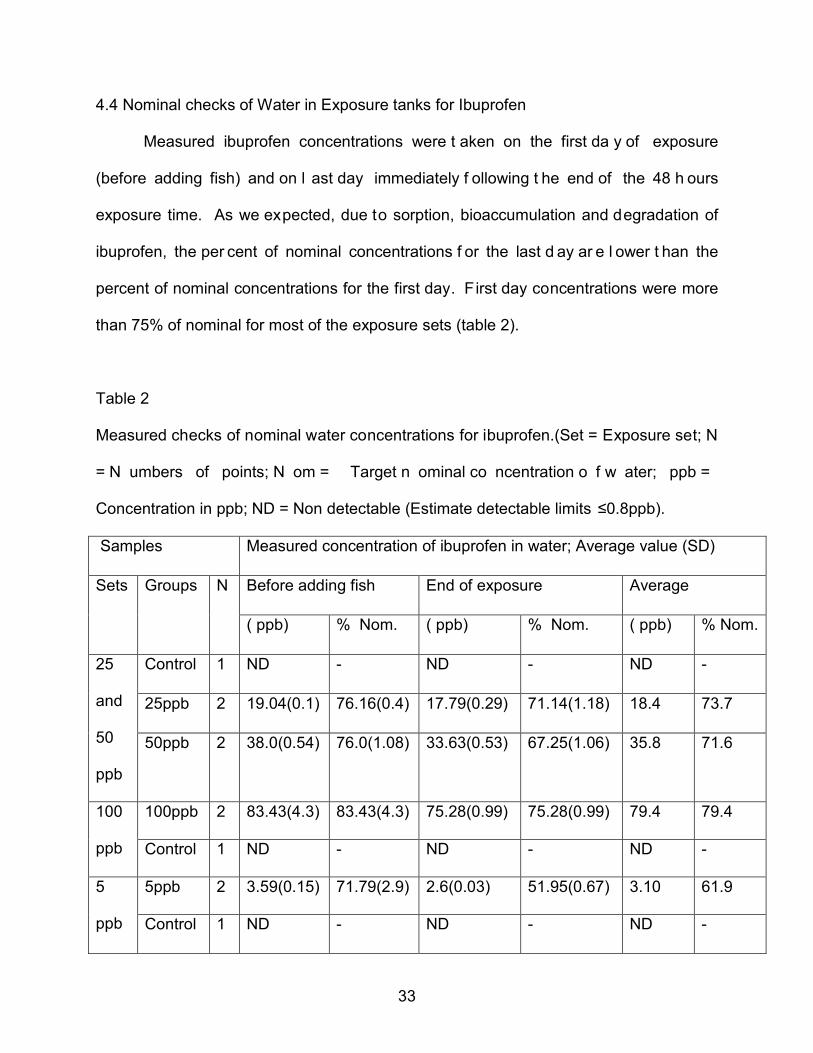
4.4 Nominal checks of Water in Exposure tanks for Ibuprofen
Measured ibuprofen concentrations were t aken on the first da y of exposure
(before adding fish) and on l ast day immediately f ollowing t he end of the 48 h ours
exposure time. As we expected, due to sorption, bioaccumulation and degradation of
ibuprofen, the per cent of nominal concentrations f or the last d ay ar e l ower t han the
percent of nominal concentrations for the first day. First day concentrations were more
than 75% of nominal for most of the exposure sets (table 2).
Table 2
Measured checks of nominal water concentrations for ibuprofen.(Set = Exposure set; N
= N umbers of points; N om = Target n ominal co ncentration o f w ater; ppb =
Concentration in ppb; ND = Non detectable (Estimate detectable limits ≤0.8ppb).
Samples Measured concentration of ibuprofen in water; Average value (SD)
Sets Groups N Before adding fish End of exposure Average
( ppb) % Nom. ( ppb) % Nom. ( ppb) % Nom.
25
and
50
ppb
Control 1 ND - ND - ND -
25ppb 2 19.04(0.1) 76.16(0.4) 17.79(0.29) 71.14(1.18) 18.4 73.7
50ppb 2 38.0(0.54) 76.0(1.08) 33.63(0.53) 67.25(1.06) 35.8 71.6
100
ppb
100ppb 2 83.43(4.3) 83.43(4.3) 75.28(0.99) 75.28(0.99) 79.4 79.4
Control 1 ND - ND - ND -
5
ppb
5ppb 2 3.59(0.15) 71.79(2.9) 2.6(0.03) 51.95(0.67) 3.10 61.9
Control 1 ND - ND - ND -
34
4.5 Quality Control
Our pr eliminary r esults indicated that g ill had the most and f illet the l east
abundance of PGE2 among g ill, g ut an d fillet t issue of fishes (zebra fish, f athead
minnows and bluntnose minnows), so fillet t issue of bluntnose minnows were used for
quality co ntrol sa mples. Quality co ntrol sa mples (method bl ank, method bl ank spike,
control f illet samples and co ntrol fillet sa mples spiked) w ere processed similarly to
samples and samples were spiked at the in itial sample preparation step to check the
efficiency of methods for extraction of prostanoids and ibuprofen. Calibration standards
were used at the t ime of sample quantification o f prostanoids and ibuprofen by mass
spectrometry (in interval o f ≤10 samples) to check the accuracy and stability of these
methods. Those results are given in Tables 3 and 4.
35
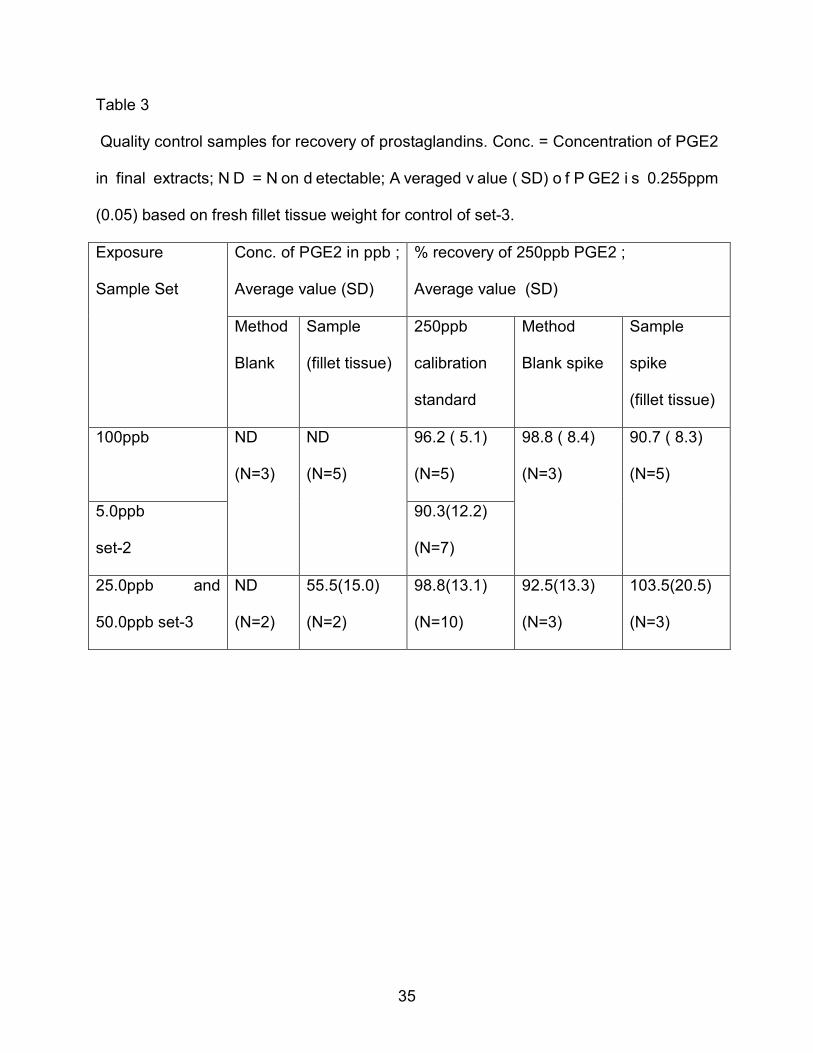
Table 3
Quality control samples for recovery of prostaglandins. Conc. = Concentration of PGE2
in final extracts; N D = N on d etectable; A veraged v alue ( SD) o f P GE2 i s 0.255ppm
(0.05) based on fresh fillet tissue weight for control of set-3.
Exposure
Sample Set
Conc. of PGE2 in ppb ;
Average value (SD)
% recovery of 250ppb PGE2 ;
Average value (SD)
Method
Blank
Sample
(fillet tissue)
250ppb
calibration
standard
Method
Blank spike
Sample
spike
(fillet tissue)
100ppb
ND
(N=3)
ND
(N=5)
96.2 ( 5.1)
(N=5)
98.8 ( 8.4)
(N=3)
90.7 ( 8.3)
(N=5)
5.0ppb
set-2
90.3(12.2)
(N=7)
25.0ppb and
50.0ppb set-3
ND
(N=2)
55.5(15.0)
(N=2)
98.8(13.1)
(N=10)
92.5(13.3)
(N=3)
103.5(20.5)
(N=3)
36
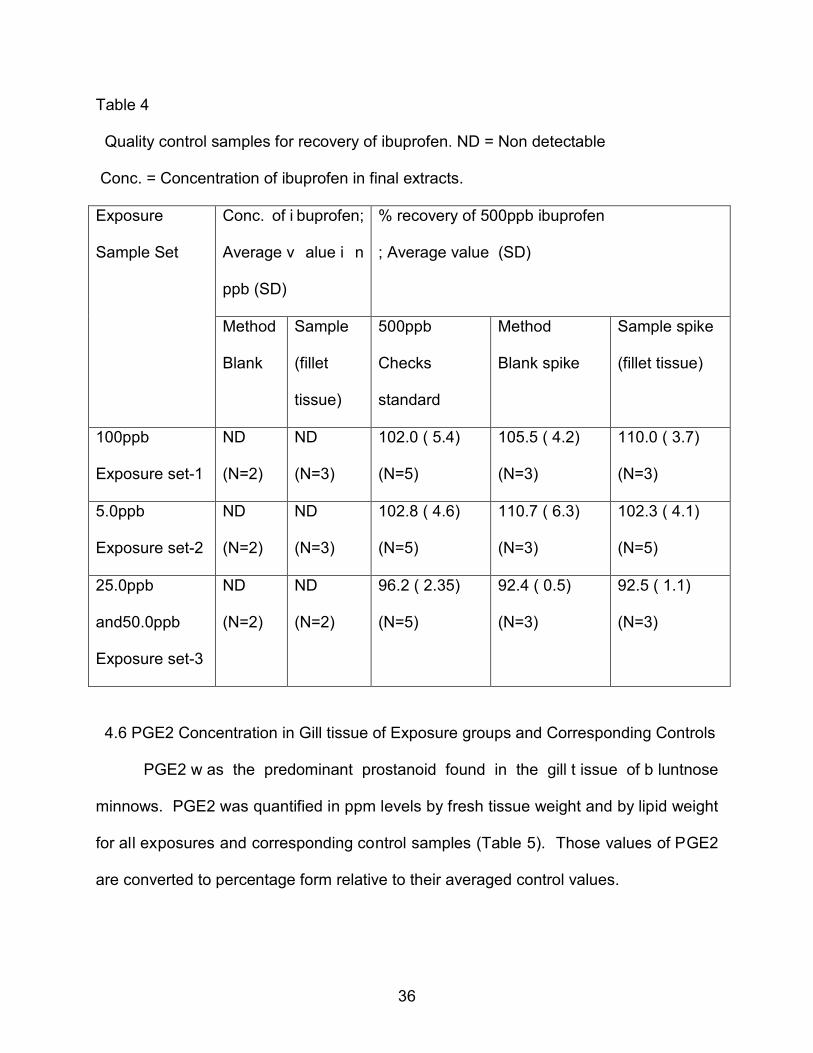
Table 4
Quality control samples for recovery of ibuprofen. ND = Non detectable
Conc. = Concentration of ibuprofen in final extracts.
Exposure
Sample Set
Conc. of i buprofen;
Average v alue i n
ppb (SD)
% recovery of 500ppb ibuprofen
; Average value (SD)
Method
Blank
Sample
(fillet
tissue)
500ppb
Checks
standard
Method
Blank spike
Sample spike
(fillet tissue)
100ppb
Exposure set-1
ND
(N=2)
ND
(N=3)
102.0 ( 5.4)
(N=5)
105.5 ( 4.2)
(N=3)
110.0 ( 3.7)
(N=3)
5.0ppb
Exposure set-2
ND
(N=2)
ND
(N=3)
102.8 ( 4.6)
(N=5)
110.7 ( 6.3)
(N=3)
102.3 ( 4.1)
(N=5)
25.0ppb
and50.0ppb
Exposure set-3
ND
(N=2)
ND
(N=2)
96.2 ( 2.35)
(N=5)
92.4 ( 0.5)
(N=3)
92.5 ( 1.1)
(N=3)
4.6 PGE2 Concentration in Gill tissue of Exposure groups and Corresponding Controls
PGE2 w as the predominant prostanoid found in the gill t issue of b luntnose
minnows. PGE2 was quantified in ppm levels by fresh tissue weight and by lipid weight
for all exposures and corresponding control samples (Table 5). Those values of PGE2
are converted to percentage form relative to their averaged control values.
37
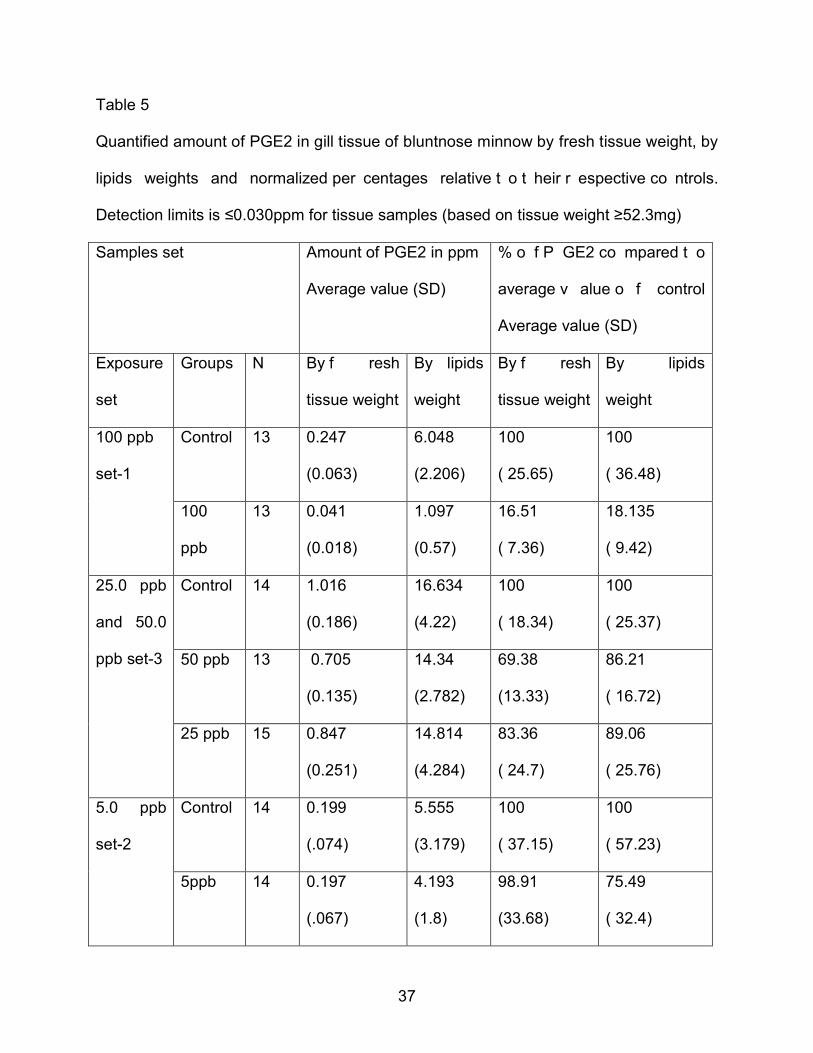
Table 5
Quantified amount of PGE2 in gill tissue of bluntnose minnow by fresh tissue weight, by
lipids weights and normalized per centages relative t o t heir r espective co ntrols.
Detection limits is ≤0.030ppm for tissue samples (based on tissue weight ≥52.3mg)
Samples set
Amount of PGE2 in ppm
Average value (SD)
% o f P GE2 co mpared t o
average v alue o f control
Average value (SD)
Exposure
set
Groups N By f resh
tissue weight
By lipids
weight
By f resh
tissue weight
By lipids
weight
100 ppb
set-1
Control 13 0.247
(0.063)
6.048
(2.206)
100
( 25.65)
100
( 36.48)
100
ppb
13 0.041
(0.018)
1.097
(0.57)
16.51
( 7.36)
18.135
( 9.42)
25.0 ppb
and 50.0
ppb set-3
Control 14 1.016
(0.186)
16.634
(4.22)
100
( 18.34)
100
( 25.37)
50 ppb 13 0.705
(0.135)
14.34
(2.782)
69.38
(13.33)
86.21
( 16.72)
25 ppb 15 0.847
(0.251)
14.814
(4.284)
83.36
( 24.7)
89.06
( 25.76)
5.0 ppb
set-2
Control 14 0.199
(.074)
5.555
(3.179)
100
( 37.15)
100
( 57.23)
5ppb 14 0.197
(.067)
4.193
(1.8)
98.91
(33.68)
75.49
( 32.4)
38
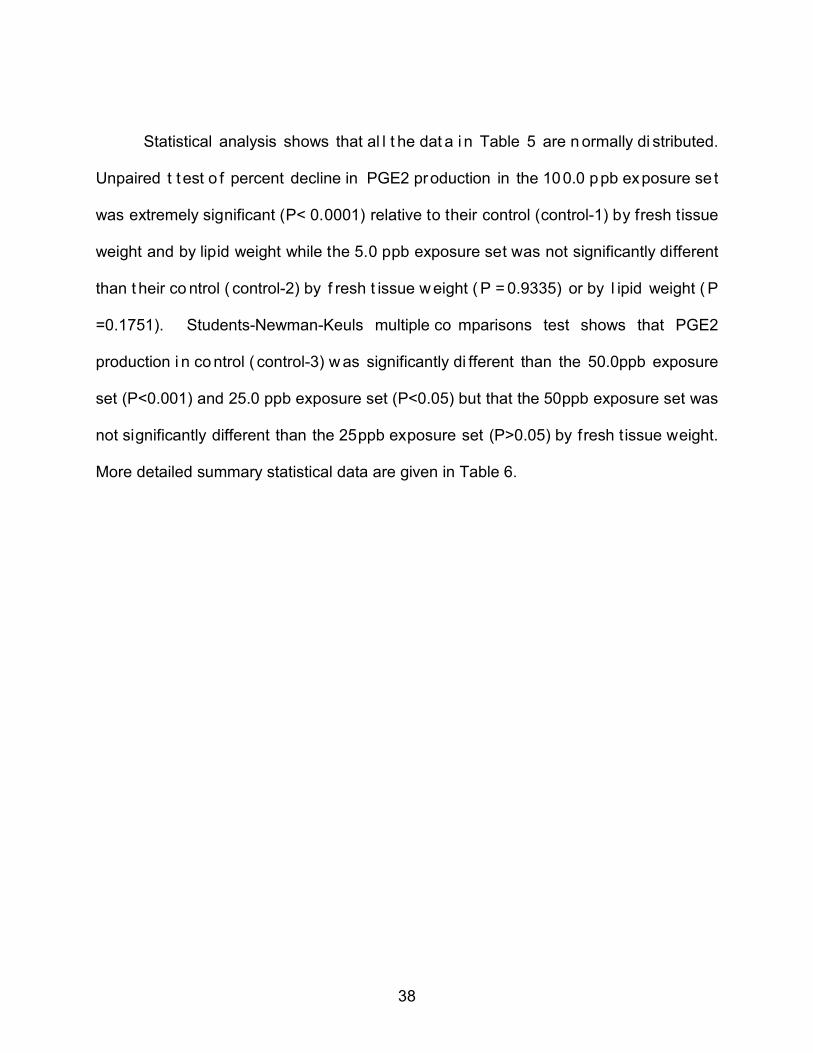
Statistical analysis shows that al l t he dat a i n Table 5 are n ormally di stributed.
Unpaired t t est o f percent decline in PGE2 production in the 100.0 ppb exposure se t
was extremely significant (P< 0.0001) relative to their control (control-1) by fresh tissue
weight and by lipid weight while the 5.0 ppb exposure set was not significantly different
than t heir co ntrol ( control-2) by f resh t issue w eight ( P = 0.9335) or by l ipid weight ( P
=0.1751). Students-Newman-Keuls multiple co mparisons test shows that PGE2
production i n co ntrol ( control-3) w as significantly di fferent than the 50.0ppb exposure
set (P<0.001) and 25.0 ppb exposure set (P<0.05) but that the 50ppb exposure set was
not significantly different than the 25ppb exposure set (P>0.05) by fresh tissue weight.
More detailed summary statistical data are given in Table 6.
39
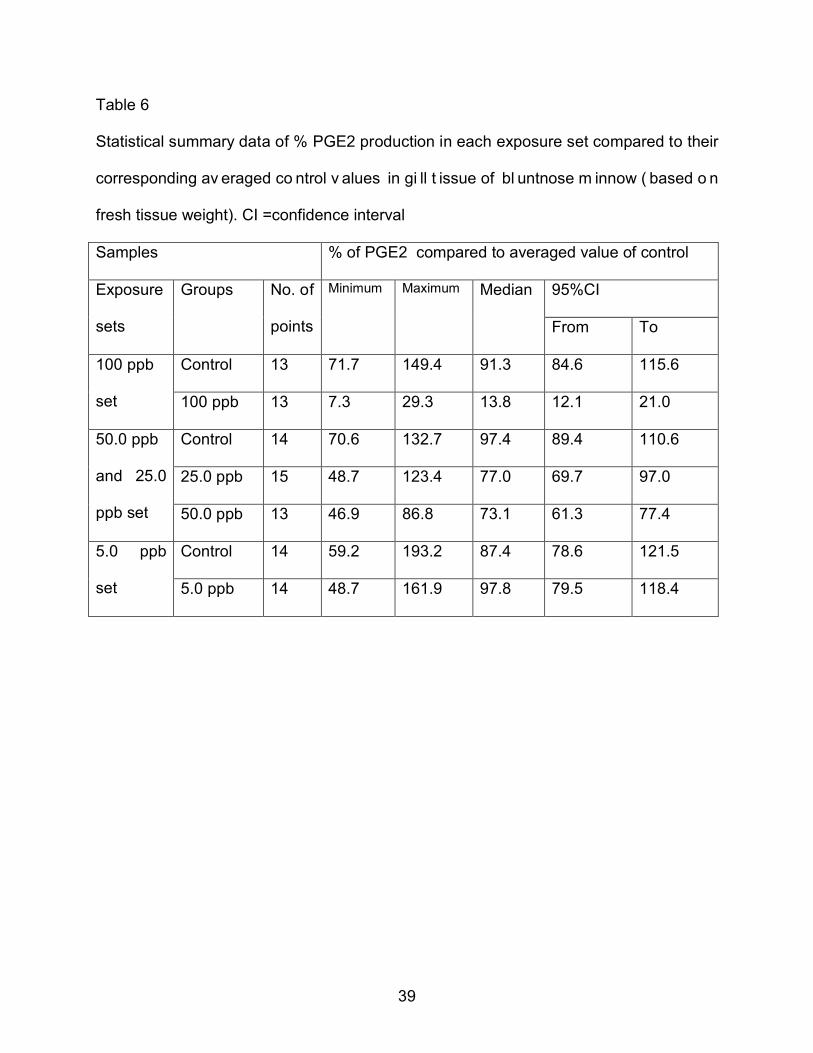
Table 6
Statistical summary data of % PGE2 production in each exposure set compared to their
corresponding av eraged co ntrol v alues in gi ll t issue of bl untnose m innow ( based o n
fresh tissue weight). CI =confidence interval
Samples % of PGE2 compared to averaged value of control
Exposure
sets
Groups
No. of
points
Minimum Maximum Median 95%CI
From To
100 ppb
set
Control 13 71.7 149.4 91.3 84.6 115.6
100 ppb 13 7.3 29.3 13.8 12.1 21.0
50.0 ppb
and 25.0
ppb set
Control 14 70.6 132.7 97.4 89.4 110.6
25.0 ppb 15 48.7 123.4 77.0 69.7 97.0
50.0 ppb 13 46.9 86.8 73.1 61.3 77.4
5.0 ppb
set
Control 14 59.2 193.2 87.4 78.6 121.5
5.0 ppb 14 48.7 161.9 97.8 79.5 118.4
40
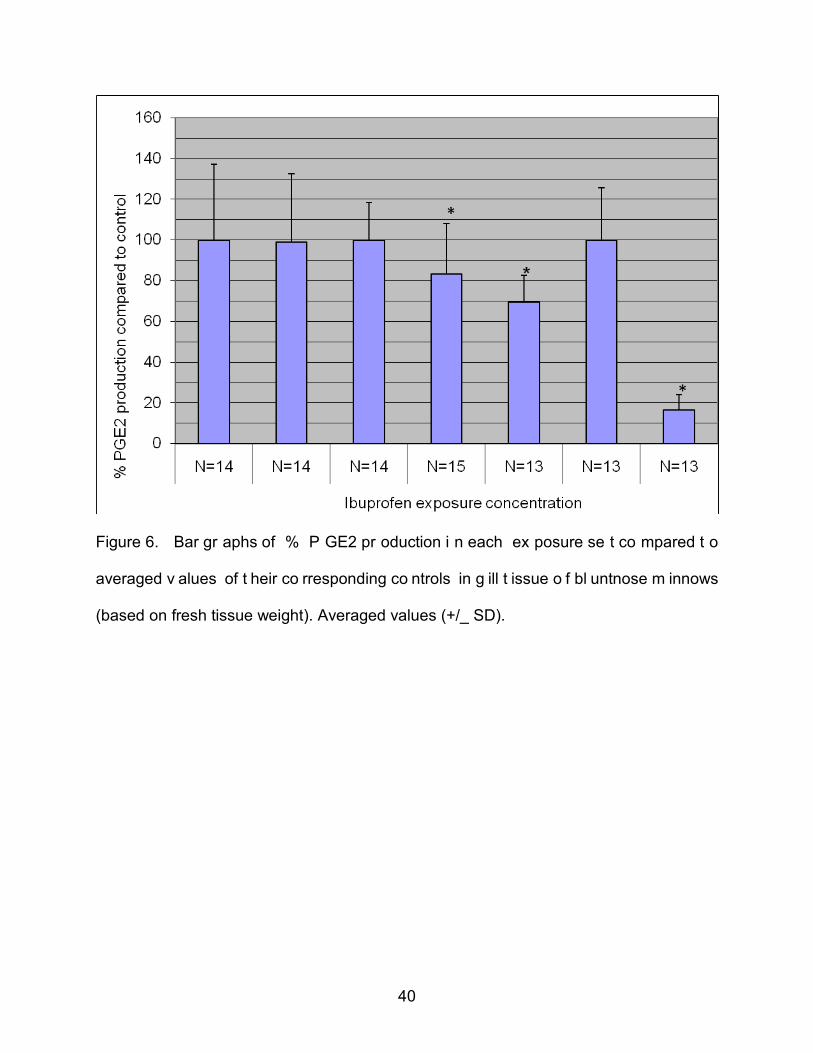
Figure 6. Bar gr aphs of % P GE2 pr oduction i n each ex posure se t co mpared t o
averaged v alues of t heir co rresponding co ntrols in g ill t issue o f bl untnose m innows
(based on fresh tissue weight). Averaged values (+/_ SD).
41
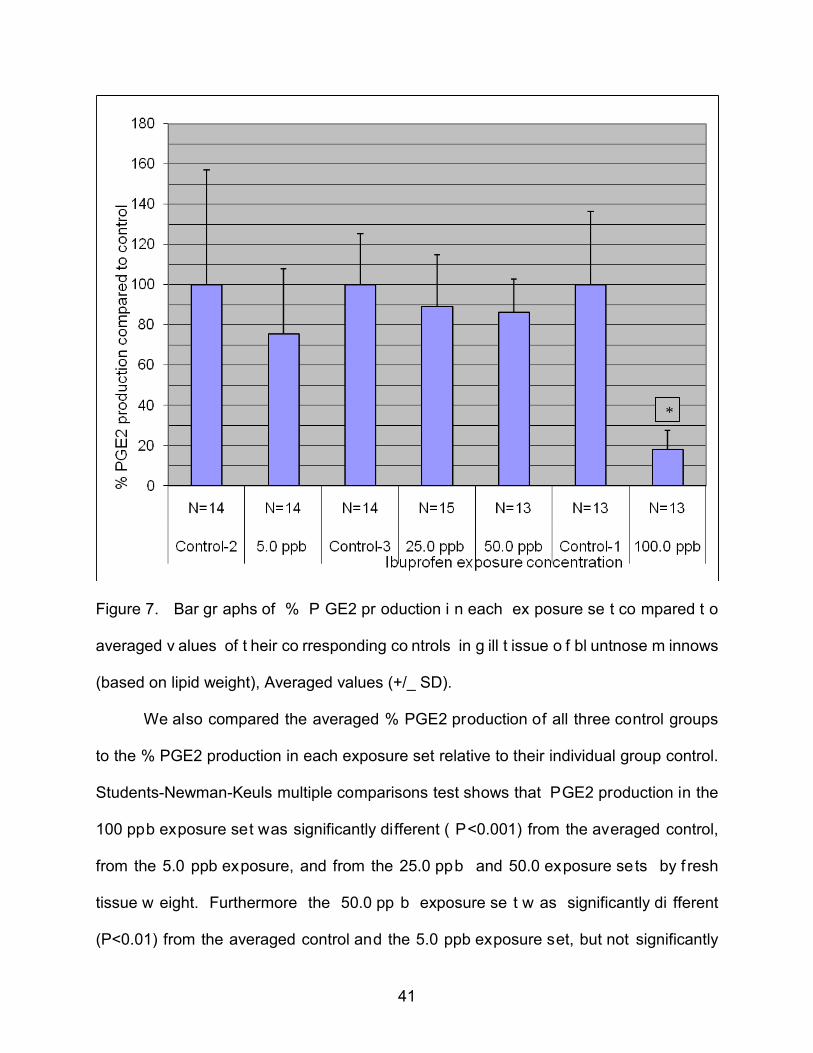
Figure 7. Bar gr aphs of % P GE2 pr oduction i n each ex posure se t co mpared t o
averaged v alues of t heir co rresponding co ntrols in g ill t issue o f bl untnose m innows
(based on lipid weight), Averaged values (+/_ SD).
We also compared the averaged % PGE2 production of all three control groups
to the % PGE2 production in each exposure set relative to their individual group control.
Students-Newman-Keuls multiple comparisons test shows that PGE2 production in the
100 ppb exposure set was significantly different ( P<0.001) from the averaged control,
from the 5.0 ppb exposure, and from the 25.0 ppb and 50.0 exposure sets by f resh
tissue w eight. Furthermore the 50.0 pp b exposure se t w as significantly di fferent
(P<0.01) from the averaged control and the 5.0 ppb exposure set, but not significantly
*
42
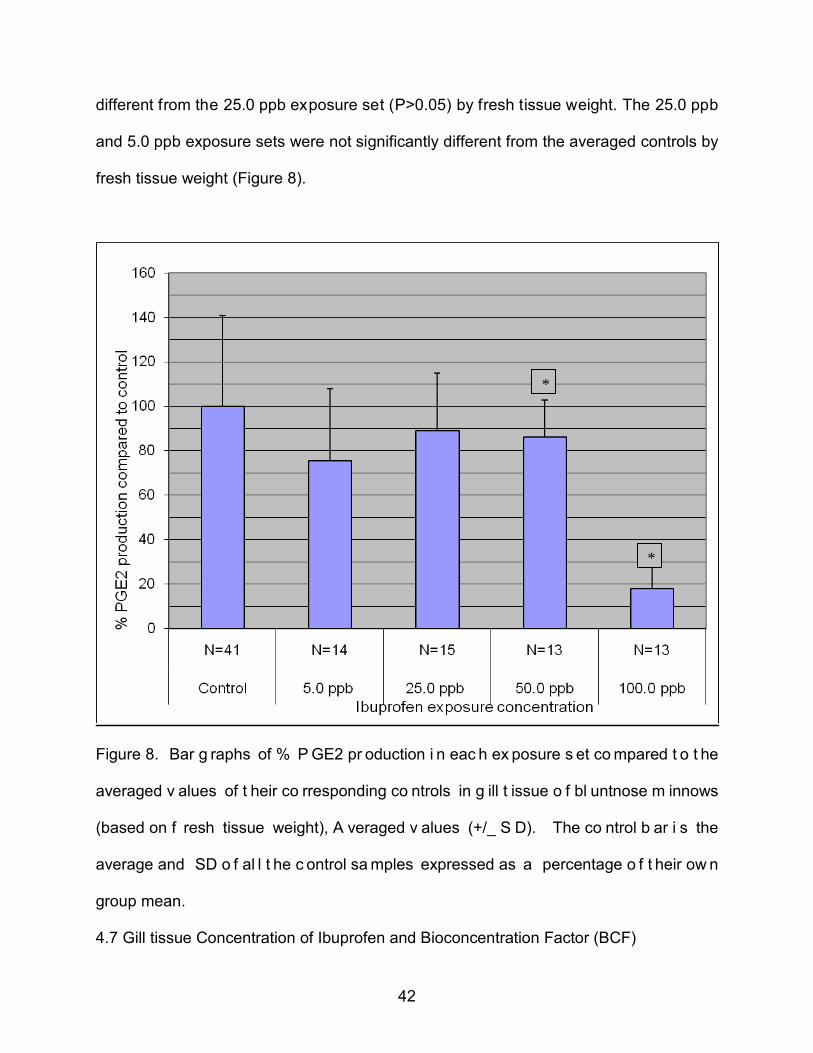
different from the 25.0 ppb exposure set (P>0.05) by fresh tissue weight. The 25.0 ppb
and 5.0 ppb exposure sets were not significantly different from the averaged controls by
fresh tissue weight (Figure 8).
Figure 8. Bar g raphs of % P GE2 pr oduction i n eac h ex posure s et co mpared t o t he
averaged v alues of t heir co rresponding co ntrols in g ill t issue o f bl untnose m innows
(based on f resh tissue weight), A veraged v alues (+/_ S D). The co ntrol b ar i s the
average and SD o f al l t he c ontrol sa mples expressed as a percentage o f t heir ow n
group mean.
4.7 Gill tissue Concentration of Ibuprofen and Bioconcentration Factor (BCF)
*
*
43
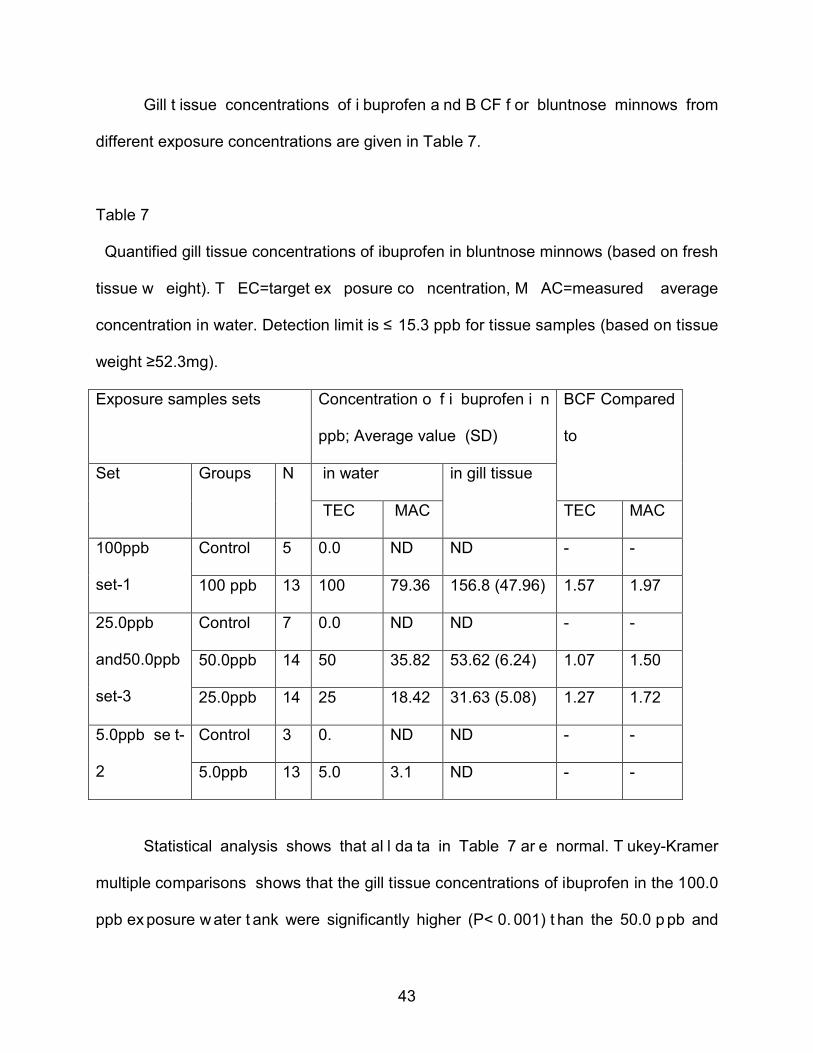
Gill t issue concentrations of i buprofen a nd B CF f or bluntnose minnows from
different exposure concentrations are given in Table 7.
Table 7
Quantified gill tissue concentrations of ibuprofen in bluntnose minnows (based on fresh
tissue w eight). T EC=target ex posure co ncentration, M AC=measured average
concentration in water. Detection limit is ≤ 15.3 ppb for tissue samples (based on tissue
weight ≥52.3mg).
Exposure samples sets
Concentration o f i buprofen i n
ppb; Average value (SD)
BCF Compared
to
Set Groups N in water in gill tissue
TEC MAC TEC MAC
100ppb
set-1
Control 5 0.0 ND ND - -
100 ppb 13 100 79.36 156.8 (47.96) 1.57 1.97
25.0ppb
and50.0ppb
set-3
Control 7 0.0 ND ND - -
50.0ppb 14 50 35.82 53.62 (6.24) 1.07 1.50
25.0ppb 14 25 18.42 31.63 (5.08) 1.27 1.72
5.0ppb se t-
2
Control 3 0. ND ND - -
5.0ppb 13 5.0 3.1 ND - -
Statistical analysis shows that al l da ta in Table 7 ar e normal. T ukey-Kramer
multiple comparisons shows that the gill tissue concentrations of ibuprofen in the 100.0
ppb ex posure w ater t ank were significantly higher (P< 0. 001) t han the 50.0 p pb and
44
25.0 ppb exposure tanks, but the concentration in the 50.0 ppb exposure tank was not
significantly di fferent (P > 0. 05) t han the 25. 0 p pb ex posure t ank. M ore d etailed
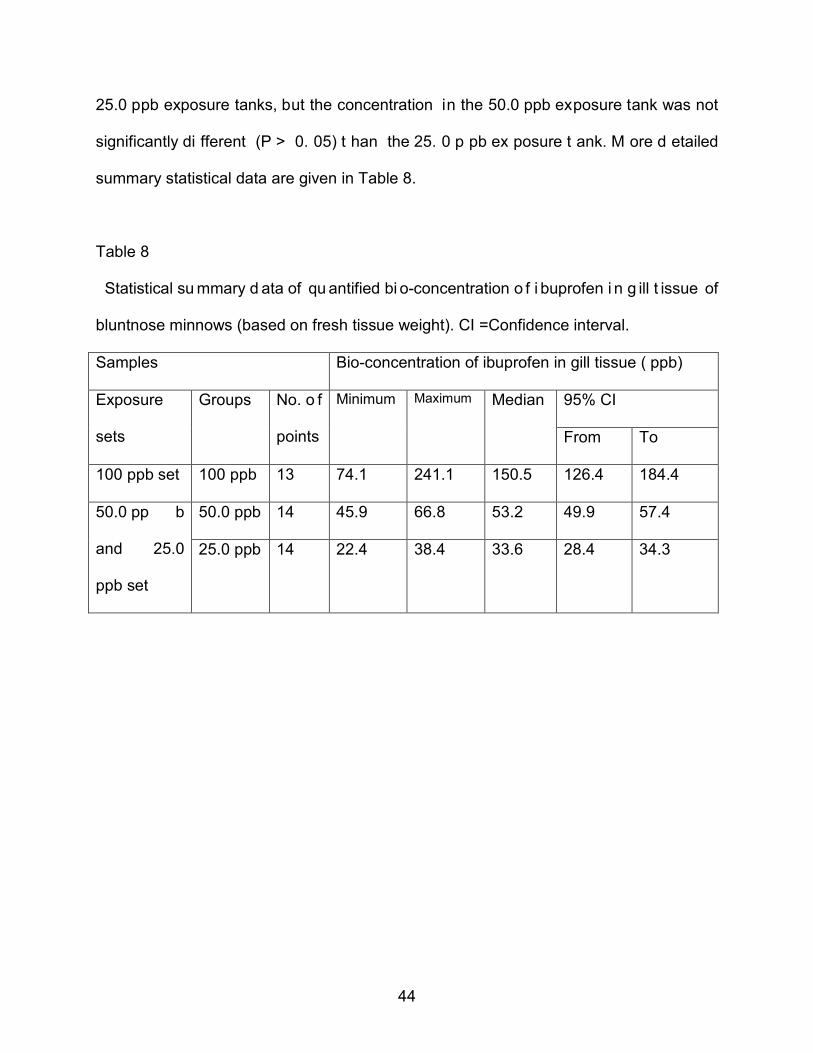
summary statistical data are given in Table 8.
Table 8
Statistical su mmary d ata of qu antified bi o-concentration o f i buprofen i n g ill t issue of
bluntnose minnows (based on fresh tissue weight). CI =Confidence interval.
Samples Bio-concentration of ibuprofen in gill tissue ( ppb)
Exposure
sets
Groups
No. o f
points
Minimum Maximum Median 95% CI
From To
100 ppb set 100 ppb 13 74.1 241.1 150.5 126.4 184.4
50.0 pp b
and 25.0
ppb set
50.0 ppb 14 45.9 66.8 53.2 49.9 57.4
25.0 ppb 14 22.4 38.4 33.6 28.4 34.3
45
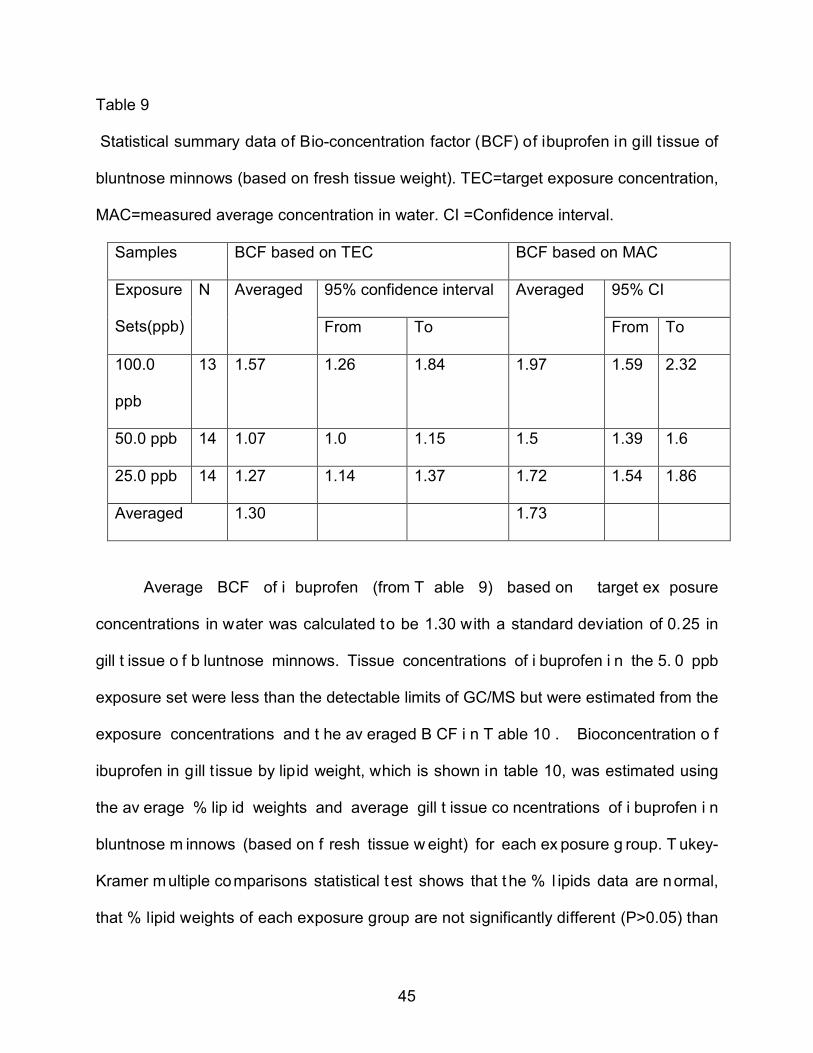
Table 9
Statistical summary data of Bio-concentration factor (BCF) of ibuprofen in gill tissue of
bluntnose minnows (based on fresh tissue weight). TEC=target exposure concentration,
MAC=measured average concentration in water. CI =Confidence interval.
Samples BCF based on TEC BCF based on MAC
Exposure
Sets(ppb)
N Averaged 95% confidence interval Averaged 95% CI
From To From To
100.0
ppb
13 1.57 1.26 1.84 1.97 1.59 2.32
50.0 ppb 14 1.07 1.0 1.15 1.5 1.39 1.6
25.0 ppb 14 1.27 1.14 1.37 1.72 1.54 1.86
Averaged 1.30 1.73
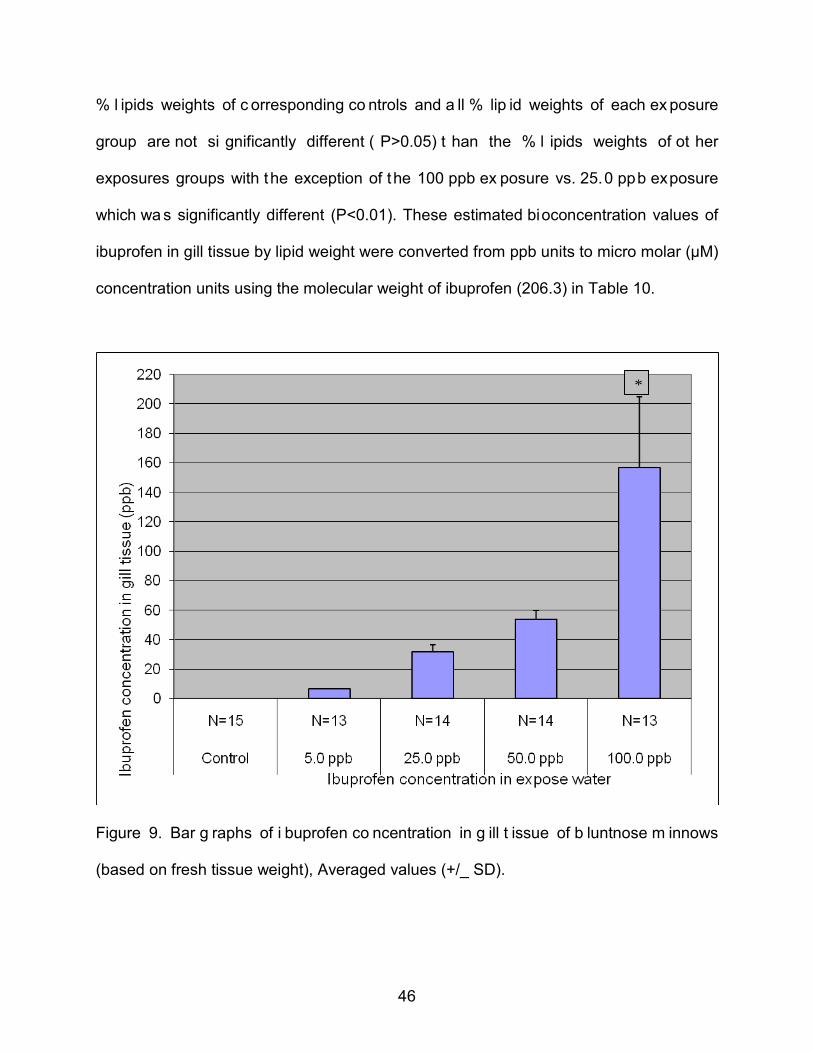
Average BCF of i buprofen (from T able 9) based on target ex posure
concentrations in water was calculated to be 1.30 with a standard deviation of 0.25 in
gill t issue o f b luntnose minnows. Tissue concentrations of i buprofen i n the 5. 0 ppb
exposure set were less than the detectable limits of GC/MS but were estimated from the
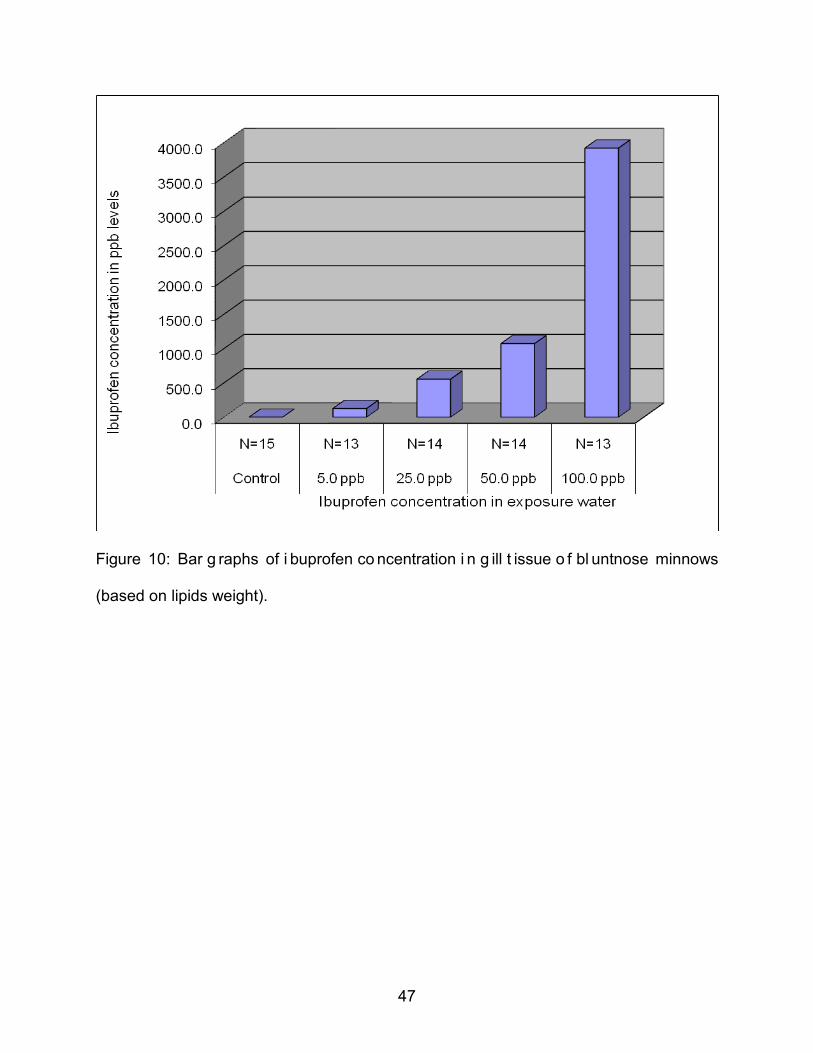
exposure concentrations and t he av eraged B CF i n T able 10 . Bioconcentration o f
ibuprofen in gill t issue by lipid weight, which is shown in table 10, was estimated using
the av erage % lip id weights and average gill t issue co ncentrations of i buprofen i n
bluntnose m innows (based on f resh tissue w eight) for each ex posure g roup. T ukey-
Kramer multiple comparisons statistical t est shows that t he % l ipids data are normal,
that % lipid weights of each exposure group are not significantly different (P>0.05) than
46
% l ipids weights of c orresponding co ntrols and a ll % lip id weights of each ex posure
group are not si gnificantly different ( P>0.05) t han the % l ipids weights of ot her
exposures groups with the exception of the 100 ppb ex posure vs. 25.0 ppb exposure
which wa s significantly different (P<0.01). These estimated bioconcentration values of
ibuprofen in gill tissue by lipid weight were converted from ppb units to micro molar (µM)
concentration units using the molecular weight of ibuprofen (206.3) in Table 10.
Figure 9. Bar g raphs of i buprofen co ncentration in g ill t issue of b luntnose m innows
(based on fresh tissue weight), Averaged values (+/_ SD).
*
47
Figure 10: Bar g raphs of i buprofen co ncentration i n g ill t issue o f bl untnose minnows
(based on lipids weight).
48
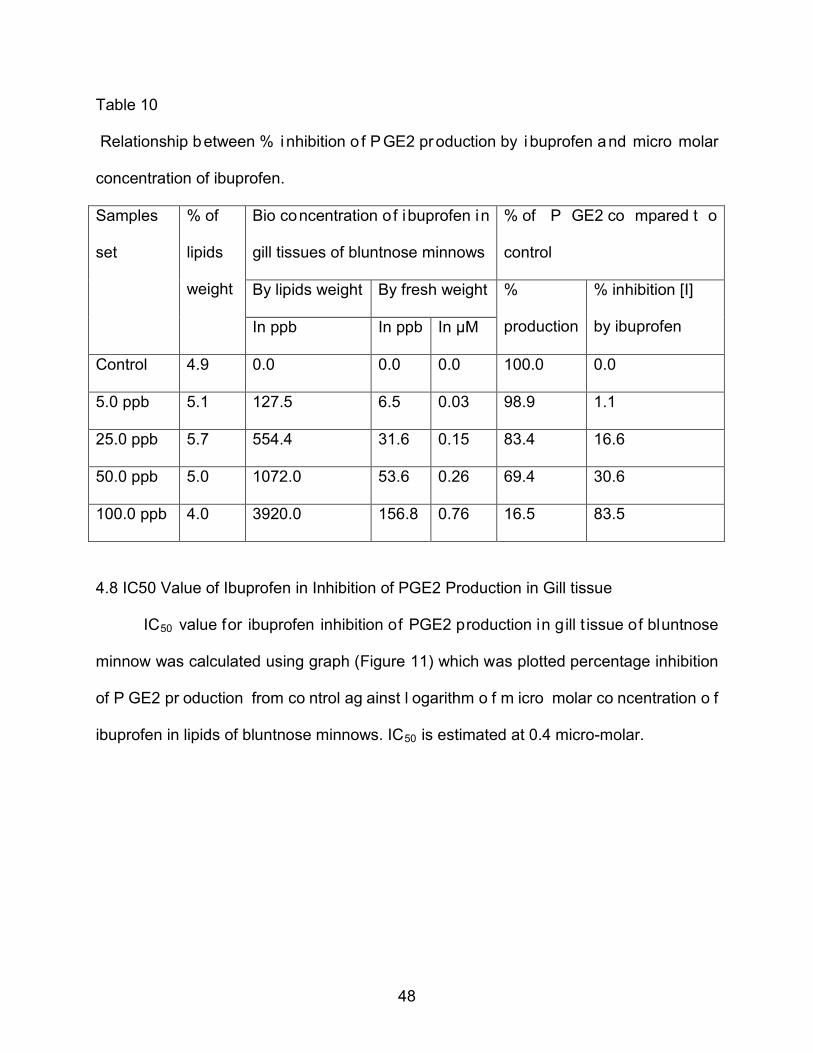
Table 10
Relationship between % i nhibition o f P GE2 production by i buprofen and micro molar
concentration of ibuprofen.
Samples
set
% of
lipids
weight
Bio concentration of ibuprofen in
gill tissues of bluntnose minnows
% of P GE2 co mpared t o
control
By lipids weight By fresh weight %
production
% inhibition [I]
by ibuprofen In ppb In ppb In µM
Control 4.9 0.0 0.0 0.0 100.0 0.0
5.0 ppb 5.1 127.5 6.5 0.03 98.9 1.1
25.0 ppb 5.7 554.4 31.6 0.15 83.4 16.6
50.0 ppb 5.0 1072.0 53.6 0.26 69.4 30.6
100.0 ppb 4.0 3920.0 156.8 0.76 16.5 83.5
4.8 IC50 Value of Ibuprofen in Inhibition of PGE2 Production in Gill tissue
IC50 value for ibuprofen inhibition of PGE2 production in gill t issue of bluntnose
minnow was calculated using graph (Figure 11) which was plotted percentage inhibition
of P GE2 pr oduction from co ntrol ag ainst l ogarithm o f m icro molar co ncentration o f
ibuprofen in lipids of bluntnose minnows. IC50 is estimated at 0.4 micro-molar.
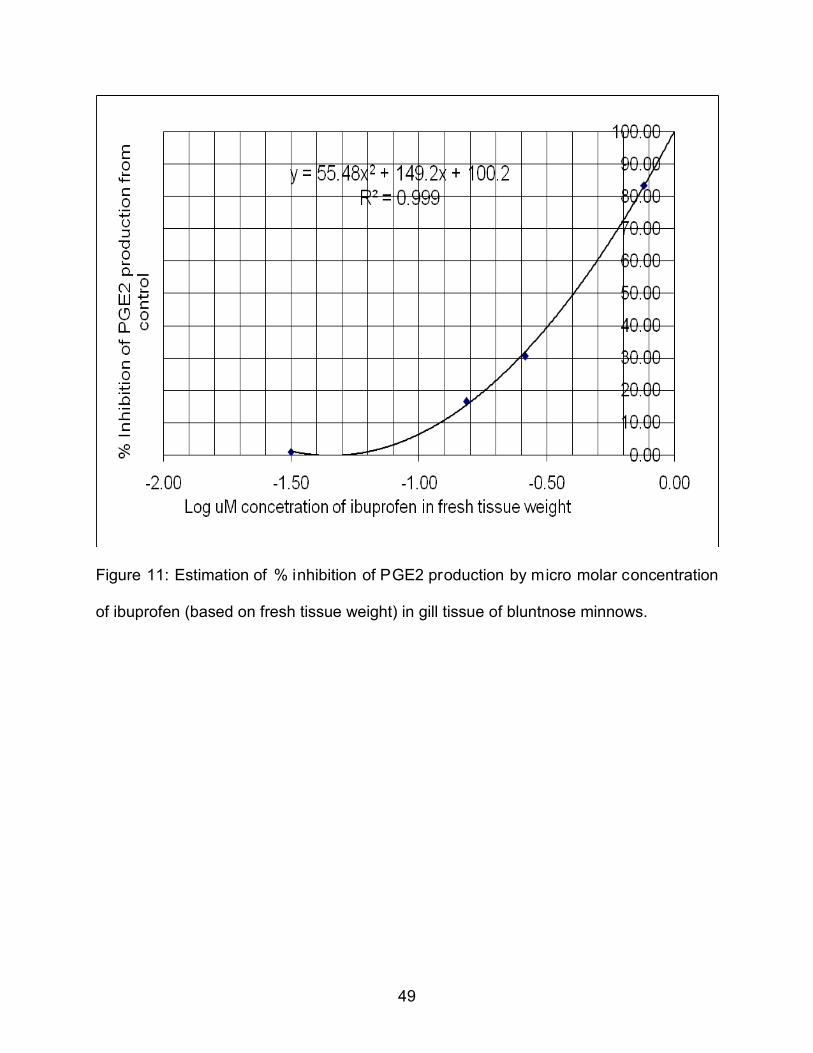
49
Figure 11: Estimation of % inhibition of PGE2 production by micro molar concentration
of ibuprofen (based on fresh tissue weight) in gill tissue of bluntnose minnows.
50
CHAPTER 5
DISCUSSION
We developed a g eneral pur pose method for t he simultaneous extraction o f a
wide variety of aci dic compounds such a s prostanoids and i buprofen from s mall
amounts (~100mg) of fish t issue sa mples using hexane: ethyl ace tate ( 1:1, v /v)
extraction solvent. Two different isotope dilution mass spectrometry methods were used
to identify and quantify the different compounds in this project. Target compounds were
identified by co mparing the r etention t imes and mass spectrum t o kn own st andards
under the same conditions of standard analysis. Compounds were quantified using the
abundance ratio of the quantifying ion of the target compounds relative to a deuterated
internal standard. T his quantification scheme increases accuracy because t he
abundance ratio o f ions remains constant even i f w e l ose so me sa mple i n sa mple
preparation s teps. D euterated standards ( which h ave si milar ch emical pr operties and
slightly di fferent masses than t heir un deuterated analogs) al so help t o c onfirm t he
identity of compounds by establishing relative retention t imes. LC/MS/MS was used to
study and q uantify prostanoids in a range f rom 16 ppb t o 1 000 ppb w ith quadratic
calibration curves with curve coefficients > 0.999. This method was successful not only
for t issue samples (sample sp ike recovery f rom 90.7% to 103.5 %) but also for water
samples as well (blank spike r ecovery f rom 92. 5% t o 98 .8%). G C/MS was used t o
quantify ibuprofen in a range from 8 ppb to 1000 ppb with a linear calibration curve with
a curve coefficient ≥0.999. This method was also successful for both tissue samples
(sample spike recovery from 92.5% to 110 %) and water samples (blank spike recovery
from 92.4% to 110.7 %).
51
The ov erall su ccess of t he m ethods was based on ca reful pr eservation of t he
analytes throughout the analytical process. Fish t issue samples were homogenized in
ice-cold phosphate bu ffered s aline with B HT ( to pr event free r adical per oxidation of
prostanoids) and EDTA (to prevent oxidation of prostanoids). Samples were acidified to
lower pH with citric acid to prevent i onization o f prostanoids (pKa~5) and i buprofen
(pKa=4.4-4.9) and this increased the efficiency of extraction with extraction solvent from
the homogenized t issue sa mple by be ad beater. F inal ex tracts were r econstituted i n
30% ace tonitrile ( ACN) and 70% w ater with 5 m M am monium acetate ( pH~6) and
cloudy the insoluble precipitate was filtered. This is a very easy method to cleanup the
compounds of interest from lipids. Clean extracts were injected to LC/MS via a reverse
phase C18 column where different prostanoids were separated with gradient elution of
water with 5 mM a mmonium ace tate ( pump-A) and 95 % ac etonitrile w ith 5 mM
ammonium acetate (pump-B). The most polar prostanoids (TXB2) eluted first and the
most hydrophobic ones (PGA1~PGB1) eluted last from the C18 column. Decreasing the
pH of t he mobile phase sh ifts the equilibrium of p rostanoids towards their protonated
form. This helps to increase the chromatographic separation of analytes when using a
C-18 column, but the un-ionized form of the compounds cannot be detected efficiently
by the negative ion mode ion trap mass spectrometer. Though ionized prostanoids are
more readily analyzed by ion trap LC/MS/MS, but they have low affinity for a non-polar
column so it is hard to achieve optimized chromatographic separation of these analytes
on the C-18 c olumn. We tr ied d ifferent ratios of 95% ace tonitrile and w ater ( both
containing 5mM ammonium acetate), from 100% to 30%, to find a suitable solvent ratio
for the final sample extract and f inally chose a composition of 30% of A CN and 70%
52
water, w hich ca n di ssolve acidic compounds and also allows for better separation o f
prostanoids on the C18 column than other compositions.
Even t hough w e dev eloped LC /MS/MS m ethods for ni ne di fferent pr ostanoids
(Table 1), w e w ere successful i n s eparating and q uantifying only seven di fferent
prostanoids with this method. PGE1 and PGD2 eluted at almost the same time but we
succeeded i n quantifying both prostanoids using di fferent quantification fragment i ons
(Table 1). P GA2 and P GB2 el ute a t ex actly sa me t ime and also have the same
fragment quantifying ions, so a single broad peak was obtained due t o the co-elution
and consequently, only one of prostanoids could be included in the ca libration so we
used PGA2 for further quantification purposes. Similar to PGA2 and PGB2, we had a
co-eluting broad pe ak f rom PGA1 and PGB1 an d o nly P GA1 w as used for further
quantification p urposes. P rostanoids ar e l ight and t hermally se nsitive so i ce co ld
conditions were m aintained up t o t he t ime of a nalysis of pr ostanoids by LC/MS/MS.
Afterwards ibuprofen was re-extracted from same sample prep at room temperature and
analyzed by GC/MS.
Two different methods were used to re-extract ibuprofen from the samples (same
sample prep used for prostanoid analysis) and for sample clean-up. A s mentioned in
the methods section, the second m ethod (in which sample l ipids w ere removed by
filtration before extraction of ibuprofen) has similar efficiency of ibuprofen extraction to
the first method (in which lipids are removed by GPC after extraction of ibuprofen). The
GPC cl eanup method co nsumed more methylene ch loride, needs more sa mple
preparation steps and is very t edious compared to the f iltration cleanup method. The
first method i s good for al l t ypes of co mpounds which h ave di fferences in m olecular
53
weight but the second i s good for only m ore polar organic compounds, su ch as
ibuprofen (pKa=4.4-4.9) which can ionize ≥ 90% in slightly acidic buffer ( pH ~6). The
second m ethod, which w as also g ood for t he pr ostanoid cleanup pr ocess, was
adequate for ibuprofen extraction and cleanup as indicated by the fact that most of all
the replicates from this method gave very consistent and reliable abundance of internal
standard. In both methods we used 1 normal/molar hydrochloric acid (HCl) to acidify
(pH<2.0) the samples, but our preliminary result suggest that 1N citric acid is also good
to acidify samples. Similar to tissue samples water samples can also be acidified by 1
normal/molar hydrochloric acid (HCl) or 1 normal citric acid at the time of extraction but
we continued to use hydrochloric acid, which follows other studies ([3, 49, 56-58]. We
tried di fferent w ays to ex tract i buprofen from w ater b ut w e g ot b etter extraction
efficiency in allowing an equilibration time of about 30 minutes for each sample at room
temperature after vortexing for two minutes. Samples were centrifuged at 1800XG to
get better separation between aqueous and organic phases. Different temperatures and
times were t ried to derivatize ibuprofen with 14% BF3 in methanol, and in agreement
with V erenitch [49] we f ound t hat two hours der ivatization at 8 5 o C, gave the best
result. We tried the derivatization process with and without acetonitrile as a co-solvent
and we g ot bet ter r esults with A CN a nd continued t his optimized m ethod for further
sample pr eparation steps. D erivatized i buprofen w as allowed t o co ol t o r oom
temperature before b ack extraction but we encountered trouble when we r efrigerated
the samples before back extraction (most of the samples had very weak abundance of
internal standards). This might have been due to a reversal of the methylation reaction
of i buprofen. Finally, w e got bet ter r esults for the back e xtraction o f d erivatized
54
ibuprofen i n t he liquid-liquid ex traction w ith 1: 1 hexane and et hyl ace tate extraction
solvent and MQ water than with hexane and MQ water composition which was used by
Verenitch [49].
We found P GE2 was the major prostanoid in gill tissue of bluntnose minnows
which was also the case for the whole body of adult zebra fish [32, 40]. The levels of
PGE2 found were about 0.2 µg/g t issue in g ill t issue o f bluntnose minnows and that
value was significantly higher than previously reported levels of PGE2 (9.1 ng/g tissue
[40] and 2 6 ng /g t issue [32]) i n w hole b ody of adult zebra fish. T he fish g ill is a
multifunctional or gan responsible for r espiration, osmoregulation, aci d bas e balance,
ionic regulation, nitrogenous
We f ound five t imes higher v alues of P GE2 (about 1 .0 µg/g t issue) in the gill
tissues of the control set associated with the 25.0 ppb and 50.0 ppb exposures. These
groups were stored at -20
wastes excretion, and metabolism of circulating hormones
[59]. This might be the reason for having significantly higher concentrations of PGE2 in
the gill of the bluntnose compared to whole body concentrations reported for adult zebra
fish.
0C f or 24hrs immediately following eut hanization pr ior to
removal of gill tissue. This was in contrast to the controls of the other two sets (5.0 ppb
and 100.0 ppb) which were di ssected for r emoval o f gill t issue immediately a fter
euthanization. We also found detectable levels of PGE2 in the associated control fillet
tissues (which were used for QC samples of 25.0 ppb and 50.0 ppb exposure set ) but
which was nondetectable in the other sets ( 5.0 ppb and 100.0 ppb). This may indicate
that overall prostanoid concentration might be sensitive to sample handling immediately
following euthanization.
55
Bioconcentration of drugs (toxins), which is directly related to hydrophobicity and
biological hal f-life (metabolism/excretion) of th ose drugs, is a c hronic poisoning t hat
might be lethal over time, even if environmental levels of those toxins are very low. The
partition coefficient (P) of ibuprofen has been reported (Log Pow is 3.97[58] and Log
Kow i s 3.8 [46]) and indicates that ibuprofen has relatively high hydrophobicity an d
should bioconcentrate in g ill t issue in its protonated f orm. However, w e estimated a
very low bioconcentration factor (1.3) of ibuprofen in g ill t issue of bluntnose minnows,
indicating that ibuprofen is relatively hydrophilic at our neutral exposure pH and has little
chance to bioconcentrate.
We estimated the IC50
In conclusion, in the gill t issues of bluntnose minnows, which were calculated to
have a B CF f or i buprofen o f about 1.3, we would pr edict t hat the upp er end of
environmental concentration f or NSAIDs concentrations would r esult i n significant
inhibition of COX-1, though perhaps not COX-2. Significant inhibition of COX activity in
gill t issue does not a ppear l ikely at the lower end of reported enviromental N SAIDs
concentrations (final concentration in effluent of STP ~ 5.0 ppb). Thus, for the ibuprofen
alone, the risk of significant target interactions in fish gills appears to be low. BCFs for
ibuprofen are different in different tissues and have been reported as high as 9 in blood
plasma o f r ainbow t rout [46] and t he l iver might be expected t o be higher yet. This
of ibuprofen for inhibition of PGE2 production in gill tissue
of bluntnose minnows to be 0.4 µM based on fresh tissue weight. Our IC50 estimate is
lower than the reported IC50 values of ibuprofen for human COX-1 (3.3 µM [5] and 4.75
± 0.5 µM [41]) and is much lower than the reported IC50 values for human COX-2 (37
µM ) [5].
56
might result in the effective inhibition of both COX-1 and COX-2 in some tissues at the
upper l evels of reported environmental concentration o f t otal NSAIDs and inhibition
COX-1 at l ower l evels. Further st udies of different t issues under conditions of f ield
exposure in wastewater treatment plant receiving streams will be required to reveal the
potential inhibitory role of NSAIDs for eicosanoid production in an ecologically realistic
context.
57
REFERENCE
1. Rowley, A.F., et al., Prostaglandins in non-insectan invertebrates: recent insights
and unsolved problems, Journal of Experimental Biology 208 (2005)3-14.
2. Masoodi, M . and A. Nicolaou, Li pidomic analysis of t wenty-seven prostanoids
and i soprostanes by l iquid ch romatography/electrospray t andem
mass spectrometry, RCM 20(2006) 3023-3029.
3. Nakada, N ., et al ., Pharmaceutical c hemicals and e ndocrine di srupters in
municipal w astewater i n T okyo and t heir r emoval du ring act ivated sl udge
treatment, Water Research 40 (2006) 3297-3303.
4. Prescott, S.M. and H.J. Yost, The COXes of Danio: From mechanistic model to
experimental therapeutics, PNAS 99(2002) 9084-9086.
5. Fortier, M .A., e t a l., A p ostgenomic integratred v iew of pr ostaglandins in
reproduction: i mplications for ot her bo dy sy stems, Journal of p hysiology and
Pharmacology 59(2008) 65-89.
6. Cha, Y .I., L. S olnica-Krezel, and R .N. DuBois, F ishing f or prostanoids:
Deciphering t he d evelopmental functions of cy clooxygenase-derived
prostaglandins, Developmental Biology 289 (2006) 263-272.
7. Stanley, D .W., E icosanoids i n Invertebrate S ignal Transduction S ystems,
Princeton University Press, New Jersey ,2000, pp. 188-234.
8. Shanmugam, N ., et al., I ncreased ex pression o f cy clooxygenase-2 i n hum an
pancreatic islets treated with high glucose or l igands of the advanced glycation
endproduct-specific receptor ( AGER) and i n i slets from di abetic mice,
diabetologia 49( 2006) 100-107.
58
9. Schmidt, R., O. Coste, and G. Geisslinger, LC-MS/MS-analysis of prostaglandin
E2 a nd D 2 i n microdialysis samples of r ats, J. Chromatogr. B Analyt T echnol
Biomed Life Sci. 826( 2005) 188-97.
10. Murphey, L.J., et al., Quantification of the major urinary metabolite of PGE2 by a
liquid ch romatographic/mass spectrometric assay: det ermination of
cyclooxygenase-specific PGE2
11. Parfenova, H., et al., Dynamics of nuclear localization sites for COX-2 in vascular
endothelial cells, Am J. Physiol. Cell Physio. 281(2001) C166-C178.
synthesis in healthy humans and those with lung
cancer, Analytical Biochemistry 334 (2004) 266-275.
12. Warner, T.D. a nd J. A. M itchell, C yclooxygenase-3 (C OX-3): F illing in the g aps
toward a COX continuum, Proc. Natl. Acad. Sci. U S A 99(2002) 13371-13373.
13. Choe, K.P., et al ., COX2 in a e uryhaline teleost, Fundulus heteroclitus: pr imary
sequence, di stribution, l ocalization, and potential function i n g ills during sa linity
acclimation, Journal of Experimental Biology 209(2006) 1696-1708.
14. Chandrasekharan, N .V., et al ., COX-3, a cy clooxygenase-1 variant i nhibited by
acetaminophen a nd o ther an algesic/antipyretic drugs: C loning, st ructure, a nd
expression, Proc. Natl. Acad. Sci. U S A 99 (2002) 13926-13931.
15. Spencer, A.G., et al., Subcellular Localization of Prostaglandin Endoperoxide H
Synthases-1 and -2 by Immunoelectron Microscopy, J. B iol. Chem. 273 (1998)
9886-9893.
16. Morita, I., et al., Different Intracellular Locations for Prostaglandin Endoperoxide
H Synthase-1 and -2, The journal o f B iological C hemistry 270 (1995) 10902-
10908.
59
17. Bos, C.L., et al., Prostanoids and prostanoid receptors in signal transduction, The
International Journal of Biochemistry and Cell Biology 36(2004) 1187-1205.
18. Brown, J.R. and R.N. DuBois, COX-2: A Molecular Target for Colorectal Cancer
Prevention, Journal of Clinical Oncology 23(2005) 2840-2855.
19. Yang, B ., e t a l., Quantitative h igh-performance l iquid ch romatography/
electrospray i onization t andem m ass spectrometric a nalysis o f 2 - and 3 -series
prostaglandins in cu ltured t umor c ells, A nalytical B iochemistry 308( 2002)168-
177.
20. Schuster, V .L., Prostaglandin t ransport, Prostaglandins and O ther Li pid
Mediators 68(2002) 633-647.
21. Yeh, H .-C. and W. W ang, P rofiling of p rostanoids in zebrafish e mbryonic
development, Prostaglandins, L eukotrienes and E ssential F atty A cids 75(2006)
397-402.
22. Badawi, A .F. an d M .Z. B adr, E xpression o f cyclooxygenase-2 a nd per oxisome
proliferator-activated r eceptor-gamma a nd l evels of prostaglandin E 2 a nd 15-
deoxy-Delta12,14-prostaglandin J2 i n h uman br east ca ncer a nd m etastasis,
International Journal of Cancer 103( 2003) 84-90.
23. Yang, X ., et al ., P rostaglandin A 2
24. Erb-Downward, J. R. and G .B. H uffnagle, Cryptococcus ne oformans Produces
Authentic Prostaglandin E 2 w ithout a C yclooxygenase, Eukaryot. Ce ll 6 (2007)
346-350.
-mediated Stabilization o f p21 mRNA through
an E RK-dependent P athway Requiring t he RNA -binding P rotein H uR, B iol.
Chem.279 (2004) 49298-49306.
60
25. Reid, G., e t a l., T he hum an m ultidrug resistance pr otein MRP4 f unctions as a
prostaglandin efflux transporter and i s inhibited by nonsteroidal antiinflammatory
drugs, Proc. Natl. Acad .Sci. U S A 100(2003) 9244-9249.
26. Choi, K ., e t al ., E xpression a nd l ocalization of prostaglandin t ransporter i n
Alzheimer di sease brains and age-matched co ntrols, Jo urnal o f
Neuroimmunology 195(2008) 81-87.
27. Scafidi, S., et al ., P rostaglandin transporter ex pression i n m ouse br ain during
development and in response to hypoxia, Neuroscience 146(2007) 1150-1157.
28. Swami, S ., et al ., C alcitriol and G enistein A ctions to I nhibit t he P rostaglandin
Pathway: Potential Combination Therapy to Treat P rostate Cancer, J. Nutr.137
(2007) 205S-210S.
29. Shibata, Y., et al., Splenic PGE2-releasing macrophages regulates Th1 and Th2
immune r esponses in m ice t reated w ith h eat-killed B CG, J. Leukoc. Biol.78
(2005) 1281-1290.
30. Villablanca, E .J., et al ., A brogation o f P rostaglandin E 2/EP4 S ignaling I mpairs
the D evelopment o f r ag1+ Ly mphoid P recursors in the Thymus o f Z ebrafish
Embryos, The Journal of Immunology 179 (2007) 357-364.
31. Bradbury, D ., et al ., V ascular E ndothelial G rowth F actor I nduction by
Prostaglandin E 2 i n Human A irway S mooth M uscle C ells Is Mediated by
E Prostanoid EP2/EP4 Receptors and SP-1 Transcription Factor Binding Sites,
J. Biol. Chem. 280( 2005) 29993-30000.
61
32. Lister, A.L. and G.V.D. Kraak, An investigation into the role of prostaglandins in
zebrafish oocyte m aturation an d ov ulation, General an d C omparative
Endocrinology 159 (2008) 46-57.
33. Rowley, A.F., et al., Eicosanoids and their role in immune modulation in fish, Fish
and Shellfish Immunology 5(1995) 549-567.
34. North, T .E., et al ., P rostaglandin E 2 r egulates vertebrate hae matopoietic stem
cell homeostasis, nature 447(2007) 1007-1011.
35. Shao, J. and H. Sheng, Prostaglandin E2 Induces the Expression of IL-1{alpha}
in Colon Cancer Cells, The Journal of Immunology 178(2007) 4097-4103.
36. Ishikawa, T.-o. and H.R. Herschman, Two inducible, functional cyclooxygenase-2
genes are present in the rainbow trout genome, Journal of Cellular Biochemistry
102(2007) 1486-1492.
37. Subbaramaiah, K. and A.J. Dannenberg, Cyclooxygenase 2: a molecular target
for cancer pr evention and t reatment, Trends in P harmacological S ciences 24
(2003) 96-102.
38. Cathcart, M.-C., et al., Altered expression profiles of prostaglandin synthases in
lung cancer: potential therapeutic stategies and targets for intervention, Journal
of Thoracic Oncology 2(2007) S468-S469.
39. Loh, J.-K., et al., The Alteration of Prostaglandin E2 Levels in Patients with Brain
Tumors before and after Tumor Removal, Journal of Neuro-Oncology 57(2002).
147-150.
40. Grosser, T ., e t al ., Developmental expression o f f unctional cyclooxygenases in
zebrafish, Proc. Natl. Acad. Sci. U S A 99(2002) 8418-8423.
62
41. Dannhardt, G. and W. K iefer, C yclooxygenase i nhibitors – current status and
future prospects, European Journal of Medicinal Chemistry 36(2001) 109-126.
42. Maier, T.J., et al ., C yclooxygenase-2 (C OX-2)-dependent an d -independent
anticarcinogenic effects of ce lecoxib i n hum an co lon ca rcinoma ce lls,
Biochemical Pharmacology 67(2004) 1469-1478.
43. Warner, T.D. a nd J. A. M itchell, N onsteroidal ant iinflammatory dr ugs inhibiting
prostanoids efflux: A s easy a s A BC, Proc. Natl. Acad. Sci .U S A 100( 2003)
9108-9110.
44. Garret, R .H. a nd C .M. Gr isham, Biochemistry: l ipids Biosynthesis, Thomson
Brooks/Cole, California, 2005, pp. 785-792.
45. Dincer, D., et al., NSAID-related upper gastrointestinal bleeding: are risk factors
considered during prophylaxis, International Journal of Clinical Practice 60(2006)
546-548.
46. Brown, J.R., et al., Variations in bioconcentration of human pharmaceuticals from
sewage e ffluents into f ish bl ood pl asma, Environmental T oxicology and
Pharmacology 24(2007) 267-274.
47. Roberts, P.H. and K.V. Thomas, The occurrence of selected pharmaceuticals in
wastewater effluent and surface waters of the lower Tyne catchment, Science of
The Total Environment 356(2006) 143-153.
48. Ashton, D ., M. H ilton, an d K .V. Thomas, I nvestigating t he e nvironmental
transport of human pharmaceuticals to streams in the United Kingdom, Science
of The Total Environment 333(2004) 167-184.
63
49. Verenitch, S.S., C.J. Lowe, and A. Mazumder, Determination of acidic drugs and
caffeine in municipal wastewaters and receiving waters by gas chromatography–
ion trap tandem mass spectrometry, Journal of Chromatography A 1116( 2006)
193-203.
50. Gagné, F., C. Blaise, and C. André, Occurrence of pharmaceutical products in a
municipal e ffluent a nd t oxicity t o r ainbow t rout ( Oncorhynchus mykiss)
hepatocytes ,Ecotoxicology and Environmental Safety 64(2006) 329-336.
51. Bendz, D., et al., Occurrence and fate of pharmaceutically active compounds in
the env ironment, a case st udy: H öje River i n S weden, J ournal of H azardous
Materials 122(2005) 195-204.
52. Weatherley, A .H. an d H .S. G ill, G rowth dy namics o f w hite myotomal m uscle
fibres in the bluntnose minnow, Pimephales notatus Rafinesque, and comparison
with rainbow trout, Salmo gairdneri Richardson, Journal of Fish Biology 25(2006)
13-24.
53. Gill, H .S., A.H. Weatherley, and T. Bhesania, H istochemical characterization of
myotomal m uscle i n t he bl untnose m innow, P imephales notatus R afinesque,
Journal of Fish Biology 21 (2006) 205-214.
54. Brix, K.V., D.K. DeForest, and W.J. Adams, Assessing acute and chronic copper
risks to fresh water aquatic life using species sensitivity distributions for different
taxonomic groups, Environmental Toxicology and Chemistry 20(2001)1846-1856.
55. Yang, P., e t al ., D etermination o f e ndogenous tissue i nflammation pr ofiles by
LC/MS/MS: C OX- and LO X-derived bi oactive l ipids, Prostaglandins Leukot.
Essent. Fatty Acids 75 (2006) 385-95.
64
56. Caviglioli, G ., et al ., I dentification o f d egradation pr oducts of Ibuprofen ar ising
from ox idative and t hermal t reatments, Journal o f P harmaceutical an d
Biomedical Analysis 30(2002) 499-509.
57. Hilton, M.J. and K.V. Thomas, Determination of selected human pharmaceutical
compounds in e ffluent and su rface w ater sa mples by high-performance l iquid
chromatography–electrospray t andem mass spectrometry, Journal o f
Chromatography A 1015 (2003) 129-141.
58. Antonić, J. and E. Heath, Determination of NSAIDs in r iver sediment samples,
Analytical and Bioanalytical Chemistry 387(2007) 1337-1342.
59. Evans, D .H., P .M. P iermarini, and K .P. C hoe, T he M ultifunctional F ish G ill:
Dominant Site o f G as E xchange, O smoregulation, A cid-Base Regulation, and
Excretion of Nitrogenous Waste, Physiol. Rev.85( 2005) 97-177.

![Review Article Current Perspectives in NSAID-Induced ... · reducing the NSAID-induced gastropathy [ ].... Acid Suppressants. Acid increases NSAID-induced mucosal injury and gastric](https://img.pdfslide.net/doc/110x75/60b703eed9b43379f63b197c/review-article-current-perspectives-in-nsaid-induced-reducing-the-nsaid-induced.jpg)