Embed Size (px)
Citation preview
12thEuropean LS-DYNA Conference 2019, Koblenz, Germany
© 2019 Copyright by DYNAmore GmbH
Numerical modelling of honeycomb structure subjected to blast loading
Magda STANCZAK1,2, Teresa FRAS1, Ludovic BLANC1, Piotr PAWLOWSKI3,1, Alexis RUSINEK2
1French-German Research Institute of Saint-Louis (ISL), Saint-Louis, France 2 LEM3 Laboratory, Lorraine University, Metz, France
3Institute of Fundamental Technological Research Polish Academy of Sciences, Warsaw, Poland
The main objective of this study is related to the modeling of an aluminum thin-walled honeycomb structure under blast loading. The blast test is performed by means of an explosively driven shock tube (EDST). A planar shock wave is generated by a small amount of an explosive charge detonated in front of the tube. The honeycomb core is compressed by a movement of the steel plate located at the end of the tube. In the experiment, the honeycomb deformation is recorded by a high-speed camera and the absorbed loading by the structure is measured by a force sensor fixed on the rear sample face.
The simulation of the material behavior is carried out using the Lagrangian approach implemented in LS-DYNA, ver. R9.0.1. The shock pressure generated by the explosion is recalculated to define the force applied to the plate being in contact (*AUTOMATIC_SURFACE_TO_SURFACE with friction) with the
honeycomb and causing its deformation. The honeycomb is meshed by shell elements with a default formulation ELFORM: BELYTSCHKO-TSAY. The front plate is assumed as a rigid body to induce
a uniform deformation of the honeycomb structure modeled using *MAT_SIMPLIFIED_JOHNSON_COOK
098 with parameters published in, [1-2]. The simulations are performed for different number of unit cells
to define the honeycomb, from a single cell to fifty-three cells, aiming to indicate a minimal cell number required to model properly the entire structure. A dependence of numerical results on the mesh size, unit cell dimensions, friction conditions and the strain rate has been verified. The comparison between values of the load absorbed by the sample crushed numerically and experimentally shows a good agreement providing an insight into mechanisms of blast wave absorption by honeycomb structures. Such an analysis may be further applicable in development of advanced cellular structures applied to dissipate blast energy. *KEYWORDS: honeycomb, energy-absorbing structure, blast modelling
1 Introduction
Thin-wall aluminium honeycomb structures are commonly used as energy absorbers, mainly in the aeronautic and automotive industry, [3]. Honeycomb cells buckle and fold under a load in a uniform way which reduces the load transferred to the main structure. As thin-walled aluminium honeycombs are characterized by a high strength-to-weight ratio and are obtained by inexpensive and simple manufacturing techniques. They are considered as the most reliable, efficient and practical energy absorbing structures, [4-5].
Numerous studies devoted to analyse behaviour of honeycombs have been published and reported since the ‘80s, when honeycombs started to become popular and used for different applications, [6-8]. Ashby and Gibson [3] studied basic properties of these structures and proposed fundamental equations describing their behaviour in a wide range of loading conditions. Wierzbicki [5] developed a model describing mechanisms of creating folds relating the crushing force and the wave length of the local folding wave to the wall thickness and diameter of the cell. Dynamic and static properties of an aluminium honeycomb under compressive loading were investigated by Langseth and Hopperstad [9]. Yamashota and Gotoh [10] as well as Jeyasingh [11] focused on numerical models that allowed a visualisation of lobes creation mechanism related to the process of buckling.
Honeycombs are efficient also as a part of blast protective systems, as the mechanism of their plastic deformation may absorb efficiently an explosive energy, [12-13]. Figure 1 presents the honeycomb structure compressed during an explosive test. The energy is fully absorbed by the structure before it is fully compressed. Characteristic folds of the honeycomb cells may be also noticed.
12thEuropean LS-DYNA Conference 2019, Koblenz, Germany
© 2019 Copyright by DYNAmore GmbH
Fig.1: Honeycomb sample compressed in an explosive test.
This paper discusses the mechanisms of mitigation of a blast wave formed in an explosive driven shock tube, [14].The structure subjected to a blast load is the aforementioned thin-walled aluminum honeycomb structure. The numerical study performed in the LS-DYNA explicit solver R9.0.1 is an analysis of parameters influencing the simulation of the honeycomb. The influence of a mesh, parameters of the material model, friction and finally, a number of cells in the modelled structure on the results is investigated. The study aims to obtain a reliable simulation of the performed test, due to which the effect of an explosive wave may be analyzed and evaluated.
2 Experimental configuration
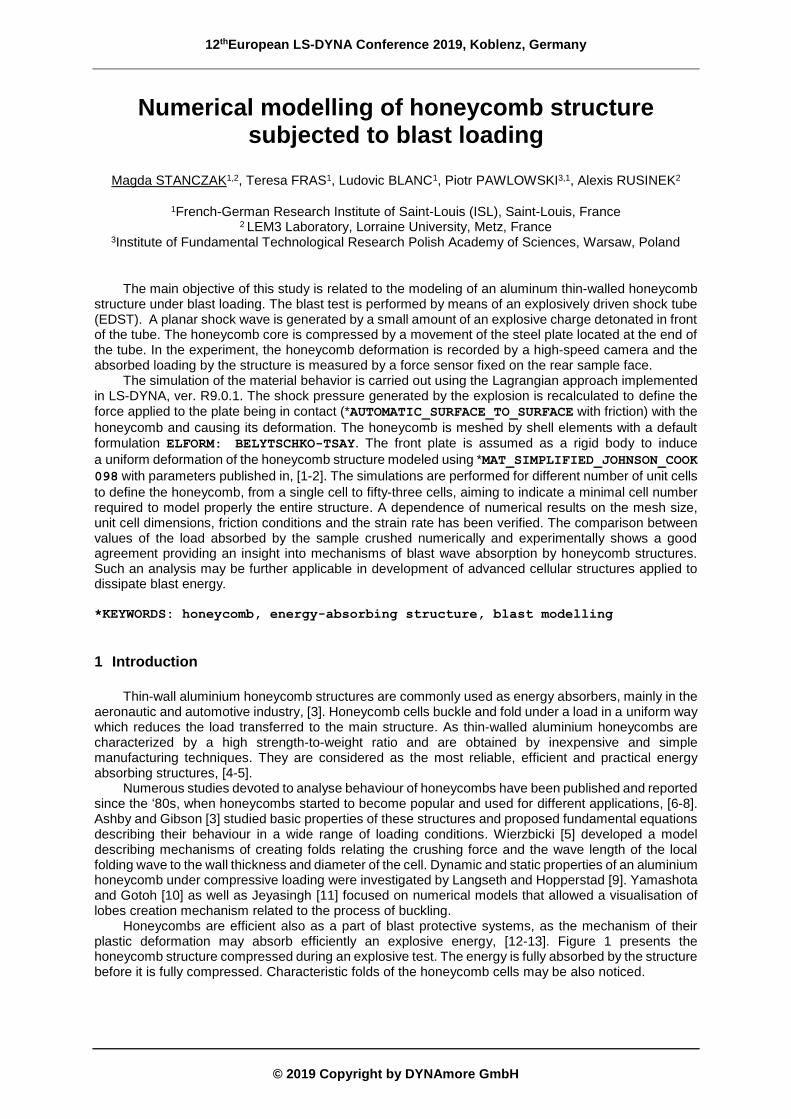
The discussed honeycomb is made with the aluminium alloy AA3003 and consists of 53 cells. The structure has the height of 50 mm and covers the area based on a square 100 x 100 mm. Theoretically, the unit cells have a hexagonal shape with a length of 7 mm and a wall thickness of 0.15 mm. The real dimensions are significantly different than the ideal ones used during numerical simulations, as it is challenging to manufacture such a structure with assumed geometrical properties. However, during numerical simulations we can assume that the unit cell dimensions corresponds to an average values.
Fig.2: Scheme of the Explosive Driven Shock Tube, [14].
The blast experiment is carried out by means of an explosive driven shock tube (EDST) which is
shown in Figure 1, [14]. Its length is 1750 mm and the internal cross-section is 80 x 80 mm2. A 50 g charge of C4 is placed 5 cm in front of the tube. The shock wave generated by an explosion propagates in the tube and loads uniformly the front plate, which during its movement compresses a crushable structure. The structure stores the energy of the blast and transmits it to the rear plate, which is recorded by a force sensor, Fig. 2. During experiment, a high-speed camera Shimadzu HPV-1 with 16000 fps and an exposure time of 8 μs is used to record the tests that provides information about the front plate displacement. The force sensor (PCB 206C with the sensitivity 13.5 mV/kN and a frequency range
Charge
12thEuropean LS-DYNA Conference 2019, Koblenz, Germany
© 2019 Copyright by DYNAmore GmbH
0.3 mHz–40 kHz) delivers the load-time function of the experiment, while through the recording and an image analysis, the displacement-time of the front plate during the compression of the crushable cores obtained, [14]. During experiment, one of the most important factors evaluating the efficiency of an energy-absorbing structure is the amount of load transferred on time to the force sensor located behind it.
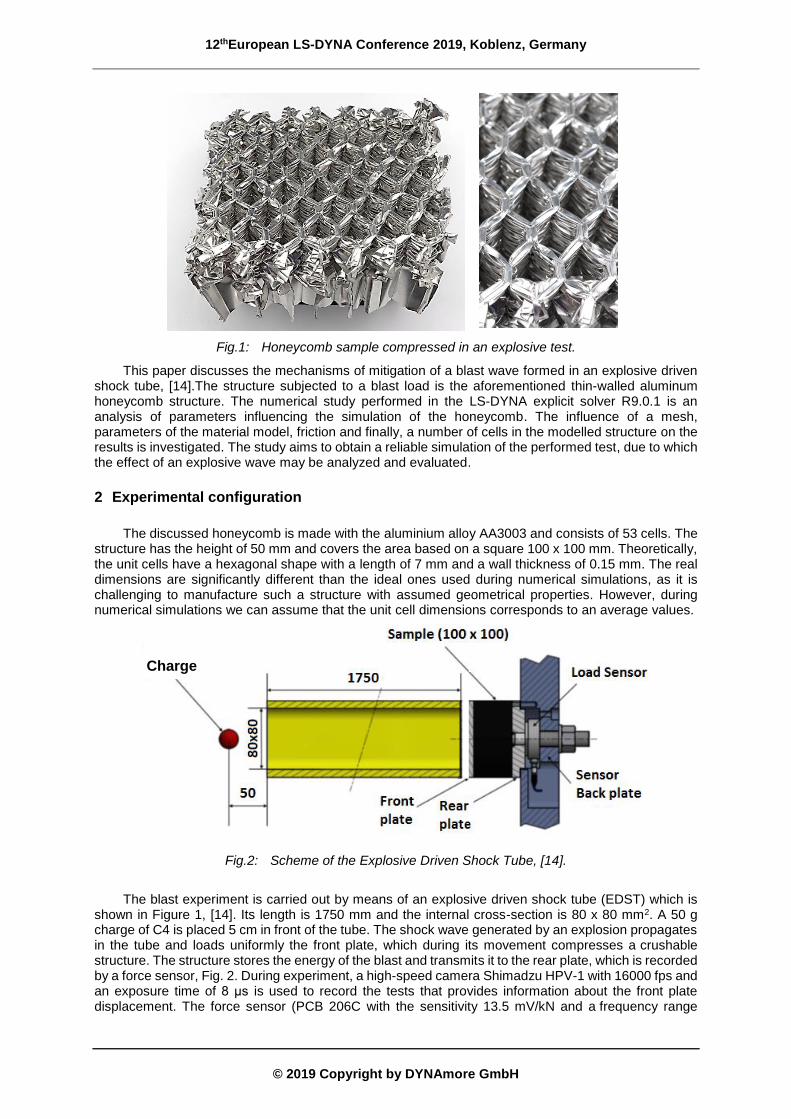
The behaviour of a honeycomb structure during a compression loading caused by an explosion is characterized by three phases which may be distinguished in the stress-strain curve, Fig. 3. The curve presents the linear elastic region which ends in a plastic buckling and the visible peak of stresses. The initial phase is followed by the plateau, where fluctuating stresses represent plastic yielding and buckling of the cells. At the plateau regime, stresses may be approximated by a constant value at one level. Densification occurs when the material has been significantly compressed and is identified by a sharp rise in stress, [3, 14].
Fig.3: Cellular material compressed by an explosive wave, based on [3, 15-16].
The structure is not directly affected by the explosive wave, its deformation is a result of the movement of the front plate accelerated by the wave caused by a detonation in front of the tube. In consequence, the numerical simulation of the sample behaviour may be performed using the Lagrangian approach, which is described in the further sections.
3 Numerical simulation of the performed explosive test
To simulate the explosive test discussed above, a model is created with the front and rear plates and the core – the honeycomb structure, Fig. 4. The front and rear plates are cuboids with dimensions 100 x 100 x 8 mm. To reduce a number of elements and to optimize the time of calculation, both plates are coarsely meshed with default solid cuboid elements with the dimensions 2 x 2 x 2 mm, thus each plate has only 10 000 elements.
To ensure that the entire surface of the compressed core is loaded uniformly, the material of the plate is described by the *MAT_Rigid 020 material model, [17]. In order to impose displacement of the
front plate, a set of nodes is chosen on its upper surface, which area is equal to the internal cross-section of the shock tube. To each node the force is applied calculated from the pressure measured during the experiment. The bottom surface of the rear plate is fully constrained to block its displacement and to induce the compete embedding.
12thEuropean LS-DYNA Conference 2019, Koblenz, Germany
© 2019 Copyright by DYNAmore GmbH
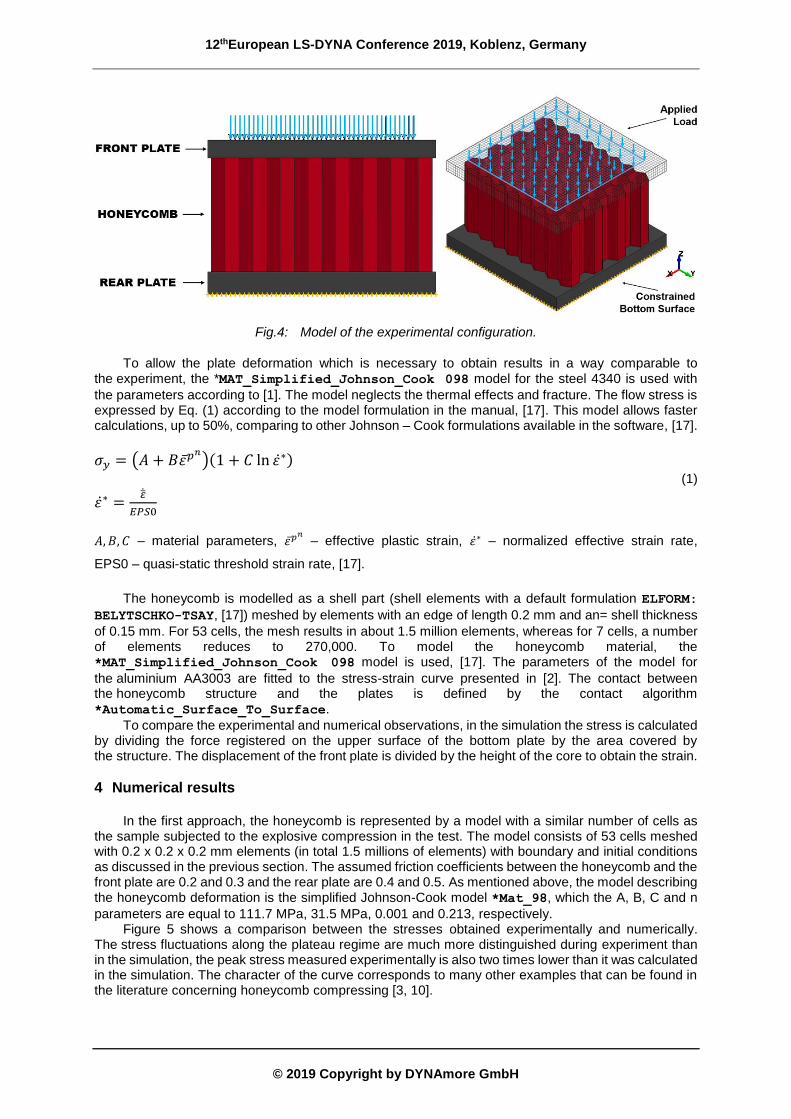
Fig.4: Model of the experimental configuration.
To allow the plate deformation which is necessary to obtain results in a way comparable to the experiment, the *MAT_Simplified_Johnson_Cook 098 model for the steel 4340 is used with
the parameters according to [1]. The model neglects the thermal effects and fracture. The flow stress is expressed by Eq. (1) according to the model formulation in the manual, [17]. This model allows faster calculations, up to 50%, comparing to other Johnson – Cook formulations available in the software, [17].
𝜎𝑦 = (𝐴 + 𝐵𝜀̅𝑝𝑛)(1 + 𝐶 ln 𝜀̇∗)
(1)
𝜀̇∗ =�̇̅�
𝐸𝑃𝑆0
𝐴, 𝐵, 𝐶 – material parameters, 𝜀 ̅𝑝𝑛 – effective plastic strain, 𝜀̇∗ – normalized effective strain rate,
EPS0 – quasi-static threshold strain rate, [17].
The honeycomb is modelled as a shell part (shell elements with a default formulation ELFORM:
BELYTSCHKO-TSAY, [17]) meshed by elements with an edge of length 0.2 mm and an= shell thickness
of 0.15 mm. For 53 cells, the mesh results in about 1.5 million elements, whereas for 7 cells, a number of elements reduces to 270,000. To model the honeycomb material, the *MAT_Simplified_Johnson_Cook 098 model is used, [17]. The parameters of the model for
the aluminium AA3003 are fitted to the stress-strain curve presented in [2]. The contact between the honeycomb structure and the plates is defined by the contact algorithm *Automatic_Surface_To_Surface.
To compare the experimental and numerical observations, in the simulation the stress is calculated by dividing the force registered on the upper surface of the bottom plate by the area covered by the structure. The displacement of the front plate is divided by the height of the core to obtain the strain.
4 Numerical results
In the first approach, the honeycomb is represented by a model with a similar number of cells as the sample subjected to the explosive compression in the test. The model consists of 53 cells meshed with 0.2 x 0.2 x 0.2 mm elements (in total 1.5 millions of elements) with boundary and initial conditions as discussed in the previous section. The assumed friction coefficients between the honeycomb and the front plate are 0.2 and 0.3 and the rear plate are 0.4 and 0.5. As mentioned above, the model describing the honeycomb deformation is the simplified Johnson-Cook model *Mat_98, which the A, B, C and n
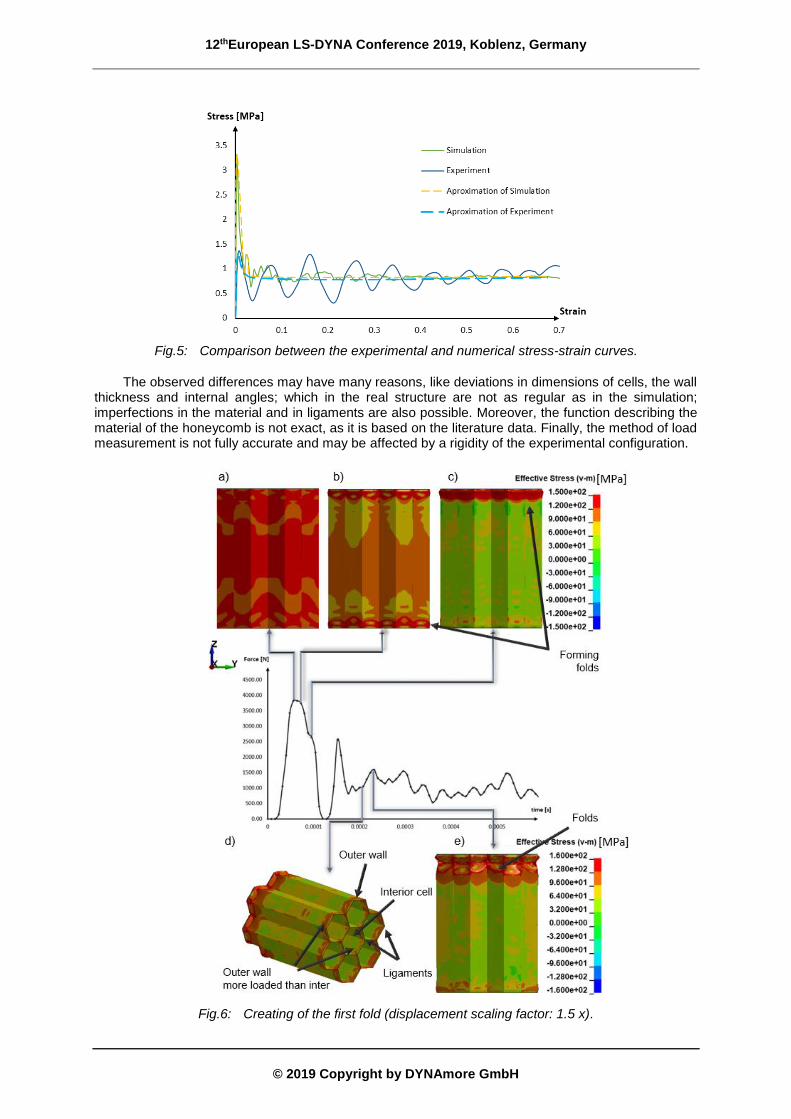
parameters are equal to 111.7 MPa, 31.5 MPa, 0.001 and 0.213, respectively. Figure 5 shows a comparison between the stresses obtained experimentally and numerically.
The stress fluctuations along the plateau regime are much more distinguished during experiment than in the simulation, the peak stress measured experimentally is also two times lower than it was calculated in the simulation. The character of the curve corresponds to many other examples that can be found in the literature concerning honeycomb compressing [3, 10].
12thEuropean LS-DYNA Conference 2019, Koblenz, Germany
© 2019 Copyright by DYNAmore GmbH
Fig.5: Comparison between the experimental and numerical stress-strain curves.
The observed differences may have many reasons, like deviations in dimensions of cells, the wall thickness and internal angles; which in the real structure are not as regular as in the simulation; imperfections in the material and in ligaments are also possible. Moreover, the function describing the material of the honeycomb is not exact, as it is based on the literature data. Finally, the method of load measurement is not fully accurate and may be affected by a rigidity of the experimental configuration.
Fig.6: Creating of the first fold (displacement scaling factor: 1.5 x).
12thEuropean LS-DYNA Conference 2019, Koblenz, Germany
© 2019 Copyright by DYNAmore GmbH
Despite not fully accurate modelling of the load transferred to the back plate, the simulation results in generally correct character of the curve and presents mechanism of fold creation. The observed damage mechanism of honeycomb core under compression is the formation of lobes during loading which may be explained by a plastic hinge theory, [5]. Both in the experiment and in the simulation, the folds are strongly compressed and very thin.
Before forming the first fold, the stresses concentrate both at the bottom and at the top of the honeycomb structure in the direction of the load application as indicated in Fig. 6a and 6b. The outer walls are less stiff comparing to the interior cells and the ligaments between 3 walls. In consequence, the outer walls are more loaded and the stresses concentrate firstly on them leading to their bending and then to formation of a fold, Fig 6d. When the fold is forming, the force in the Z direction decreases decomposing to other directions and the fold is the most strained part of the structure, Fig. 6c. The force collected from the nodes of the upper surface of the bottom plate shows the response of the honeycomb structure. A reason of fluctuations in the calculated force is formation of folds not at the same level, Fig. 6e.
4.1. Parametric study
To ensure consistency of the numerical results, an influence of several parameters affecting calculations is verified. A short discussion concluding observations is provided in the following points.
A number of cells in the honeycomb structure
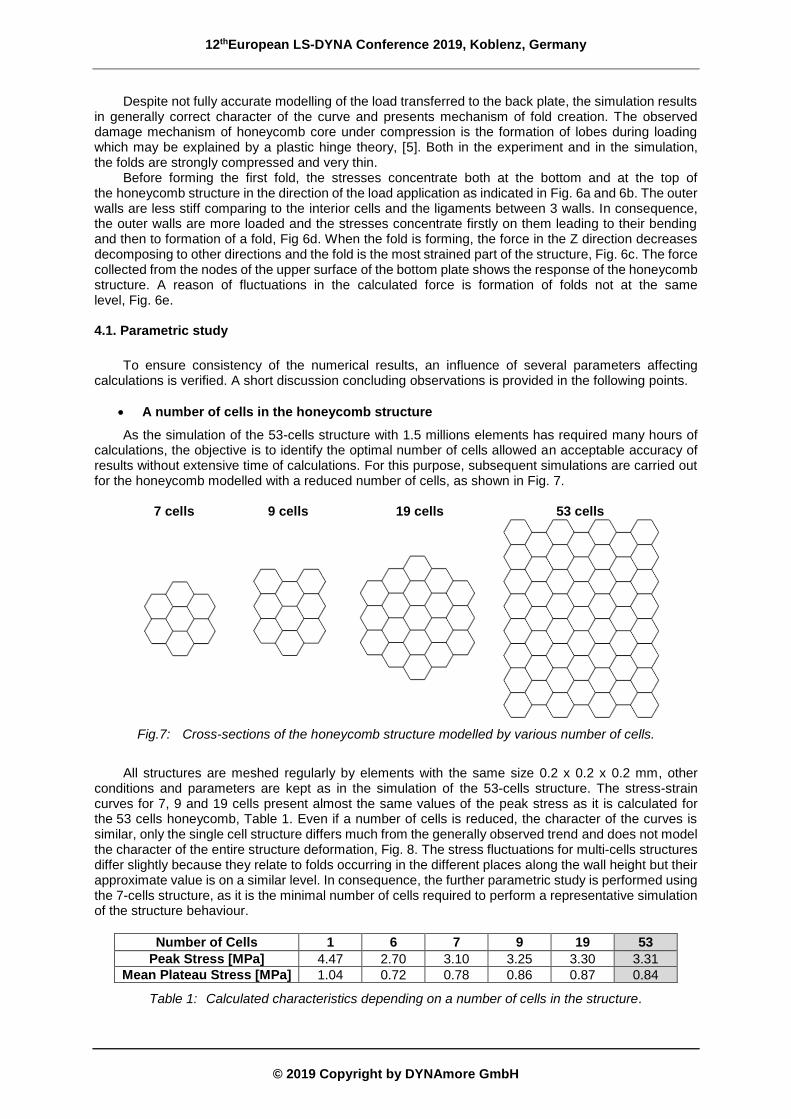
As the simulation of the 53-cells structure with 1.5 millions elements has required many hours of calculations, the objective is to identify the optimal number of cells allowed an acceptable accuracy of results without extensive time of calculations. For this purpose, subsequent simulations are carried out for the honeycomb modelled with a reduced number of cells, as shown in Fig. 7.
7 cells 9 cells 19 cells 53 cells
Fig.7: Cross-sections of the honeycomb structure modelled by various number of cells.
All structures are meshed regularly by elements with the same size 0.2 x 0.2 x 0.2 mm, other
conditions and parameters are kept as in the simulation of the 53-cells structure. The stress-strain curves for 7, 9 and 19 cells present almost the same values of the peak stress as it is calculated for the 53 cells honeycomb, Table 1. Even if a number of cells is reduced, the character of the curves is similar, only the single cell structure differs much from the generally observed trend and does not model the character of the entire structure deformation, Fig. 8. The stress fluctuations for multi-cells structures differ slightly because they relate to folds occurring in the different places along the wall height but their approximate value is on a similar level. In consequence, the further parametric study is performed using the 7-cells structure, as it is the minimal number of cells required to perform a representative simulation of the structure behaviour.
Number of Cells 1 6 7 9 19 53
Peak Stress [MPa] 4.47 2.70 3.10 3.25 3.30 3.31
Mean Plateau Stress [MPa] 1.04 0.72 0.78 0.86 0.87 0.84
Table 1: Calculated characteristics depending on a number of cells in the structure.
12thEuropean LS-DYNA Conference 2019, Koblenz, Germany
© 2019 Copyright by DYNAmore GmbH
Fig.8: Comparison of the stress-strain curves calculated for the compressed honeycomb structure modelled by different number of cells.
A difference between the mean plateau stresses calculated for 7 cells and 53 cells is less than 6% and maximum stress less than 10%, but the time of calculation is reduced by 20 times. Further reduction of a number of cells in the honeycomb introduces larger errors, Table 1.
Mesh size
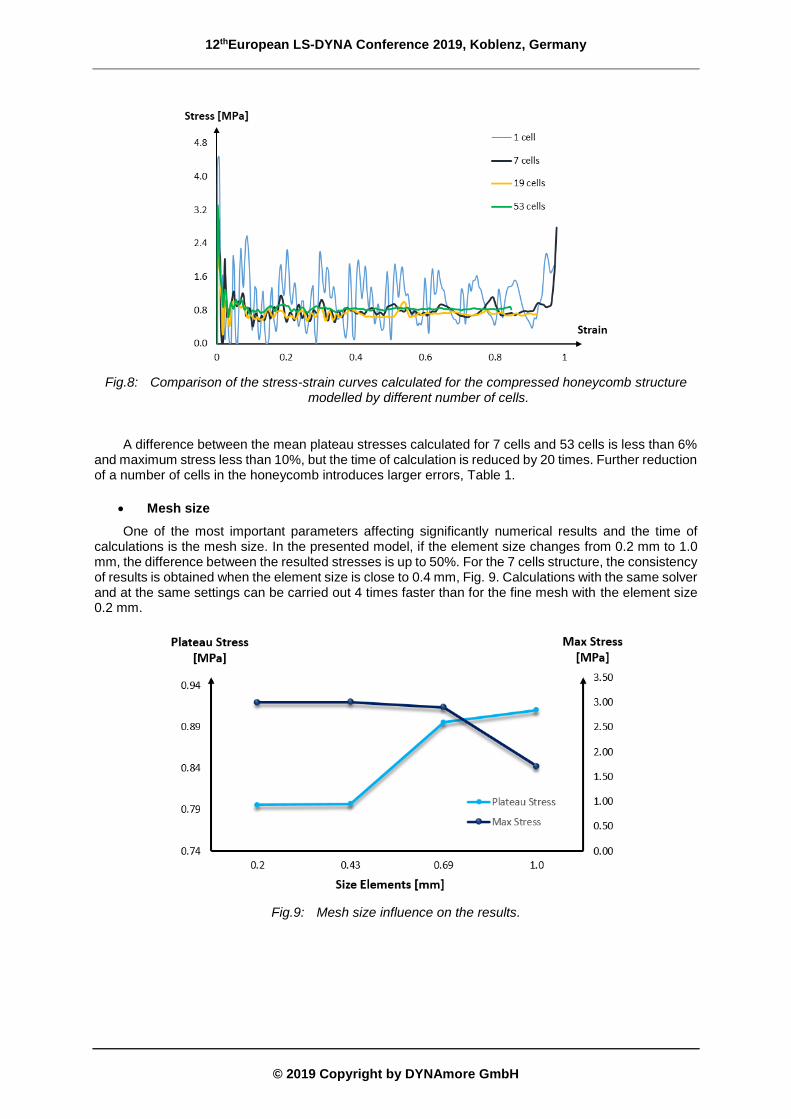
One of the most important parameters affecting significantly numerical results and the time of calculations is the mesh size. In the presented model, if the element size changes from 0.2 mm to 1.0 mm, the difference between the resulted stresses is up to 50%. For the 7 cells structure, the consistency of results is obtained when the element size is close to 0.4 mm, Fig. 9. Calculations with the same solver and at the same settings can be carried out 4 times faster than for the fine mesh with the element size 0.2 mm.
Fig.9: Mesh size influence on the results.
12thEuropean LS-DYNA Conference 2019, Koblenz, Germany
© 2019 Copyright by DYNAmore GmbH
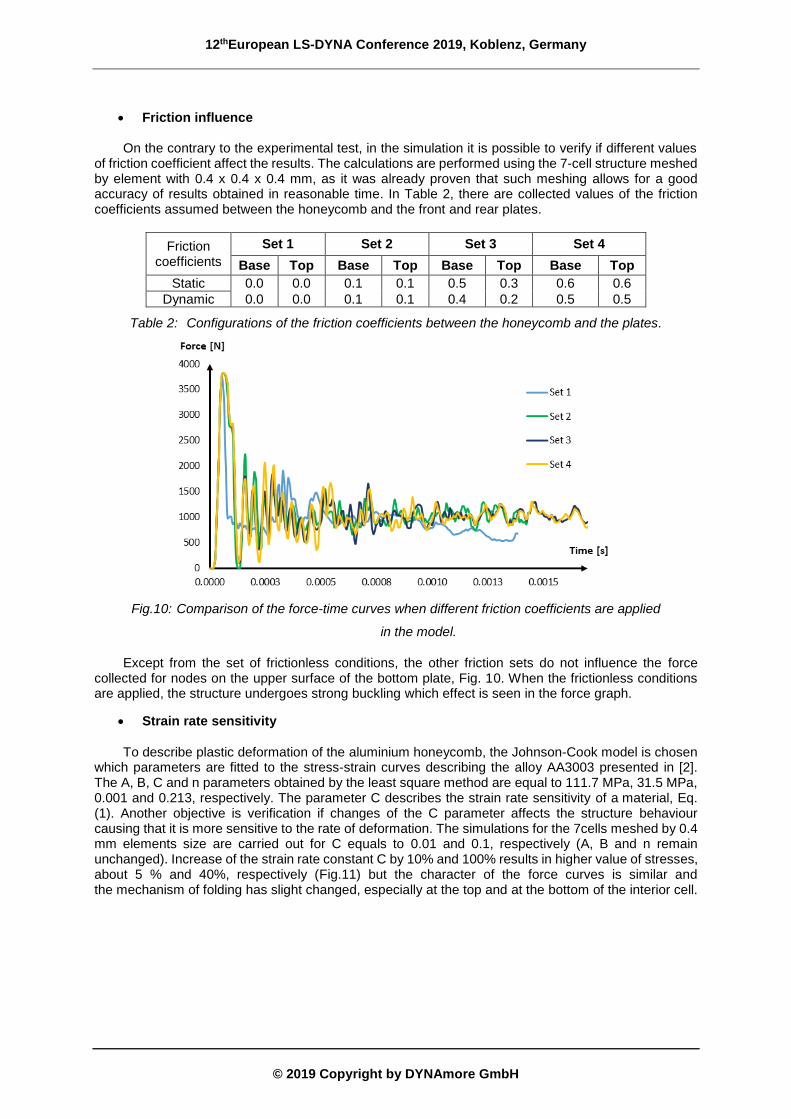
Friction influence
On the contrary to the experimental test, in the simulation it is possible to verify if different values of friction coefficient affect the results. The calculations are performed using the 7-cell structure meshed by element with 0.4 x 0.4 x 0.4 mm, as it was already proven that such meshing allows for a good accuracy of results obtained in reasonable time. In Table 2, there are collected values of the friction coefficients assumed between the honeycomb and the front and rear plates.
Friction coefficients
Set 1 Set 2 Set 3 Set 4
Base Top Base Top Base Top Base Top
Static 0.0 0.0 0.1 0.1 0.5 0.3 0.6 0.6
Dynamic 0.0 0.0 0.1 0.1 0.4 0.2 0.5 0.5
Table 2: Configurations of the friction coefficients between the honeycomb and the plates.
Fig.10: Comparison of the force-time curves when different friction coefficients are applied
in the model.
Except from the set of frictionless conditions, the other friction sets do not influence the force collected for nodes on the upper surface of the bottom plate, Fig. 10. When the frictionless conditions are applied, the structure undergoes strong buckling which effect is seen in the force graph.
Strain rate sensitivity
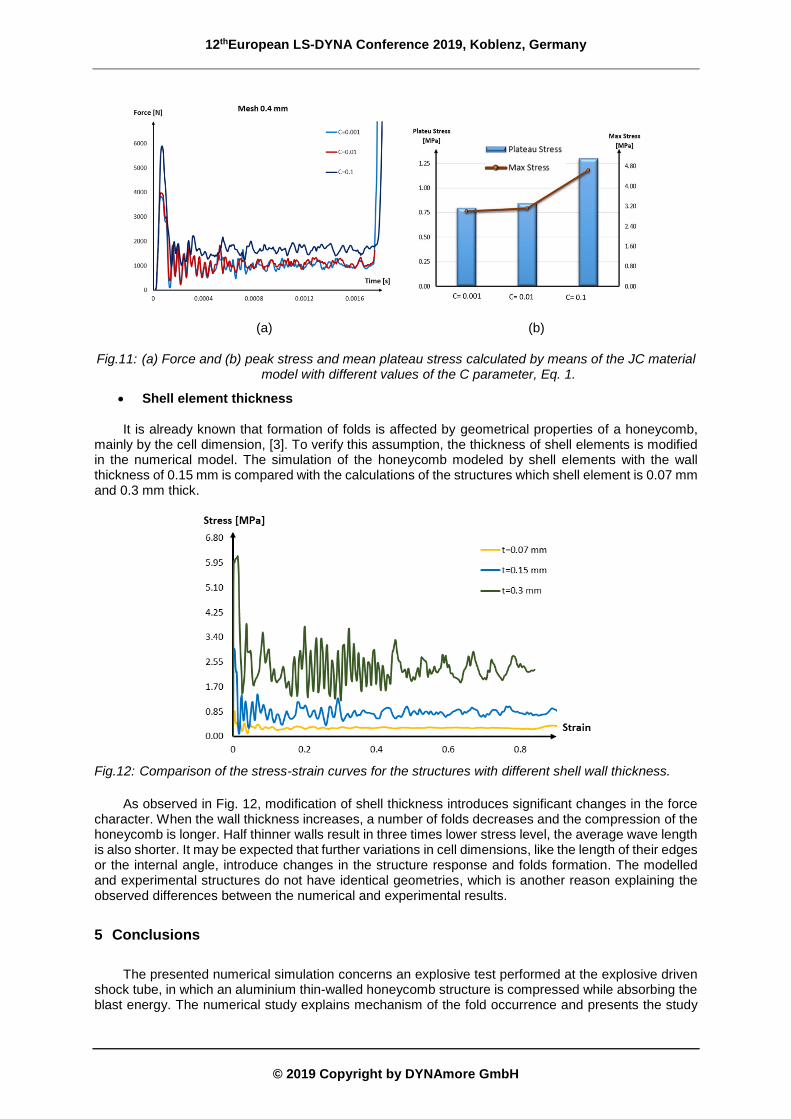
To describe plastic deformation of the aluminium honeycomb, the Johnson-Cook model is chosen which parameters are fitted to the stress-strain curves describing the alloy AA3003 presented in [2]. The A, B, C and n parameters obtained by the least square method are equal to 111.7 MPa, 31.5 MPa, 0.001 and 0.213, respectively. The parameter C describes the strain rate sensitivity of a material, Eq. (1). Another objective is verification if changes of the C parameter affects the structure behaviour causing that it is more sensitive to the rate of deformation. The simulations for the 7cells meshed by 0.4 mm elements size are carried out for C equals to 0.01 and 0.1, respectively (A, B and n remain unchanged). Increase of the strain rate constant C by 10% and 100% results in higher value of stresses, about 5 % and 40%, respectively (Fig.11) but the character of the force curves is similar and the mechanism of folding has slight changed, especially at the top and at the bottom of the interior cell.
12thEuropean LS-DYNA Conference 2019, Koblenz, Germany
© 2019 Copyright by DYNAmore GmbH
(a) (b)
Fig.11: (a) Force and (b) peak stress and mean plateau stress calculated by means of the JC material model with different values of the C parameter, Eq. 1.
Shell element thickness
It is already known that formation of folds is affected by geometrical properties of a honeycomb, mainly by the cell dimension, [3]. To verify this assumption, the thickness of shell elements is modified in the numerical model. The simulation of the honeycomb modeled by shell elements with the wall thickness of 0.15 mm is compared with the calculations of the structures which shell element is 0.07 mm and 0.3 mm thick.
Fig.12: Comparison of the stress-strain curves for the structures with different shell wall thickness.
As observed in Fig. 12, modification of shell thickness introduces significant changes in the force character. When the wall thickness increases, a number of folds decreases and the compression of the honeycomb is longer. Half thinner walls result in three times lower stress level, the average wave length is also shorter. It may be expected that further variations in cell dimensions, like the length of their edges or the internal angle, introduce changes in the structure response and folds formation. The modelled and experimental structures do not have identical geometries, which is another reason explaining the observed differences between the numerical and experimental results.
5 Conclusions
The presented numerical simulation concerns an explosive test performed at the explosive driven
shock tube, in which an aluminium thin-walled honeycomb structure is compressed while absorbing the blast energy. The numerical study explains mechanism of the fold occurrence and presents the study
12thEuropean LS-DYNA Conference 2019, Koblenz, Germany
© 2019 Copyright by DYNAmore GmbH
on several parameters which affects simulations. It has been proven that the selected type of the contact, the material model and the boundary conditions provide consistent results. Basing on the simulation, the minimum number of cells is determined that allows modelling of the whole structure with an acceptable accuracy in the short calculation time.
The observed differences between the numerical and experimental results may be a consequence of the measurement method applied in the test, the imprecise parameters of the materials as well as geometrical inaccuracies. Despite certain discrepancies, the presented study may be used to optimize honeycomb structures applied to attenuate explosive wave. Moreover, it can be helpful in prototyping other cellular structures tested by means of the discussed experimental technique.
6 References
[1] Rashed A., Babaluo A. A., Yazdani M., Parvin P. H., “Investigation on high-velocity impact performance of multi-layered alumina ceramic armours with polymeric interlayers”, Journal of Composite Materials, 2015, 6
[2] Nemat-Nasser Sia, Amini M.R., Choi J.Y., Isaacs J., “Experimental and computational evaluation of compressive response of single and hex-arrayed aluminium tubes”, Journal of Mechanics of Material and Structures, Volume 2, N° 10, 2007, 1910
[3] Ashby M.F., Gibson L.J., “Cellular Solids: Structure and Properties, Second Edition”, Cambridge University Press, 1997, 93-174
[4] Wu E., Jiang W.S., “Axial crush of metallic honeycombs” International Journal of Impact Engineering, Vol. 19, No.5-6, 1997, 439-56
[5] Wierzbicki T., “Crushing analysis of metal honeycomb”, International Journal of Impact Engineering, Vol. 1, No.2, 1983 March, 157-74
[6] Bernard M.L., “Impact resistance and damage tolerance of composite sandwich plates.” TELAC report 87-11. S.M thesis, MIT, 1987
[7] Goldsmith W., Sackman J-L.,“Experimental study of energy absorption in impact on sandwich plates.” International Journal Impact Engineering, Vol. 12, No.2, 1992, 241-62
[8] Jamjian M., Goldsmith W., Sackman J.L., (1994) “Response of an infinite plate on a honeycomb foundation to a rigid cylindrical impactor.” International Journal of Impact Engineering, Vol.15, No. 3, 1994, 183-200
[9] Langseth M., Hopperstad O.S. “Static and Dynamic Axial Crushing of Square Thin-walled Aluminum Extrusions”, International Journal of Impact Engineering, Vol. 18, No.7-8, 1996, 948-968
[10] Yamashita M., Gotoh M., “Impact behaviour of honeycomb structures with various cell specifications — numerical simulation and experiment”, International Journal of Impact Engineering, Vol. 32, 2005, 618-30
[11] Jeyasingh V. M. A., “Analytical modelling of metallic honeycomb for energy absorption and validation with FEA”, Thesis (Ph.D.)--Wichita State University, College of Engineering, Dept. of Mechanical Engineering, 2005 May
[12] Lee D.K., O’Toole B., “Energy Absorbing Sandwich Structures Under Blast Loading”, 8th International LS-DYNA Users Conference, 2011
[13] Bornstein H., Ackland K., “Evaluation of energy absorbing materials under blast loading”, WIT Transactions on Engineering Sciences, Vol 77, 2013 WIT Press, 125-136
[14] Blanc L., Sturtzer M.-O., Schunck T., Eckenfels D., Legendre J.-F. “Blast wave mitigation using multi-phase solid material in a sandwich cladding”, The Hague, NL, September 23-28, 2018
[15] Xia Y., Wu Ch., Liu Z.-X., Yuan Y., “Protective effect of graded density aluminium foam on Rc slab under blast loading – an experimental study”, Construction and Building Materials, 2016, 209-222
[16] http://www.mse.mtu.edu/~drjohn/my4150/honey/h1.html, accessed 25.03.2019 [17] “LS–Dyna Keyword user’s manual. Volume II. Material Model”, Livermore Software Technology
Corporation, 2016 August, 485-487