Embed Size (px)
Citation preview
NUMERICAL STUDY OF DYNAMIC BEHAVIORS OF
CONCRETE UNDER VARIOUS STRAIN RATES
H.M.An1, L.Liu2*
Abstract As the dynamic behavior of the concrete is different from that under static load, this research focuses
on the study of dynamic responses of concrete by simulating the split Hopkinson pressure bar (SHPB) test. Finite
element code LS-DYNA is used for modeling the dynamic behaviors of concrete. Three continuous models are
reviewed and the Holmquist-Johnson-Cook model (HJC) is introduced in detail. The HJC model which has been
implemented in LS-DYNA is used to represent the concrete properties. The SHPB test model is established and
a few stress waves are applied to the incident bar to simulate the dynamic concrete behaviors. The stress-strain
curves are obtained. The stress distributions are analyzed. The crack initiation and propagation process are
described. It is concluded that: the HJC model can modeling the entire process of the fracture initiation and
fragmentation; the compressive of the concrete is significantly influenced by the strain rates.
Keywords: Dynamic behavior of concrete, Holmquist-Johnson-Cook model (HJC), split Hopkinson pressure bar (SHPB), fracture and fragmentation
1. INTRODUCTION
Concrete is widely used as construction material in many engineering projects, e.g. underground
excavation projects. The concrete might be experiencing dynamic loads during its breaking
processes. Sources of dynamic loads include explosion, impact and seismic events [1]. As the
response of the concrete under dynamic loading are different from that under static loading, the
impact responses of concrete are widely studied. In addition, it is essential to study the dynamic
behaviors of the concrete under impact loading. On one hand, it is imperative to study the dynamic
fracture and fragmentation of concrete to prevent damage, fracture, failure, and collapse of geo-
structures.
1 Lecturer, PhD., Eng., Kunming University of Science and Technology, Faculty of Public Security and Emergency
Management, 650093, Kunming, China. 2* A/Prof., PhD., Eng., Kunming University of Science and Technology, Faculty of Land Resource Engineering,
650093, Kunming. Corresponding author (L.Liu):Email [email protected]
On the other hand, it is essential to break geo-structures in a number of engineering applications by
dynamic loads[2]. The widely used method to study the dynamic response of the concrete and
similar brittle materials is Split-Hopkinson Pressure Bar [3-7]. Sukontasukkul, Nimityongskul et al.
(2004) have studied the effect of strain rate on the damage of concrete [8]. They concluded that the
specimens subjected to impact loading were found to suffer higher damage than those subjected to
static loading. Dai, Xia et al. (2011) used the split Hopkinson pressure bar (SHPB) apparatus to
measure the dynamic mode-I rock fracture parameters. Besides experimental study the dynamic
behaviors of the concrete, many numerical methods are used to simulate the fracture initiation and
propagation of the concrete and rock. Currently, there are a variety of numerical codes and
constitutive models used to analyze the dynamic behaviors of concrete. The widely accepted models
of modeling dynamic behaviors of concrete are the Holmquist-Johnson-Cook model (HJC), the
Taylor-Chen-Kuszmaul model (TCK) and the Riedel-Thoma-Hiermaier (RTH) [9].In terms of the
HJC model, most of the important material parameters of concrete have been considered, such as
hydrostatic pressure, strain rate, and compressive damage, to describe the compressive damage
under large strain and high rate[10]. The HJC model represents a good compromise between
simplicity and accuracy for large-scale computations[9]. As for the HJC mode, it considered the
tensile stress, microcrack density, and volume strain and it is capable of characterizing the dynamic
fracture of concrete in tension and predicting the brittle tensile failure and the cracking growth of
concrete[11]. RHT model was established on the basis of the HJC model by replacing its porous
EOS model with Herrman`s porous model, and by considering the stress tensor by building
up the yield meridian plane with a cap, different tensile, and compressive meridians [9]. As for the
numerical codes used for analyzing the dynamic responses of concrete, Bush (2010) evaluated the
accuracy of four analysis codes and five concrete constitute models[12]. Two Lagrangian analysis
programs, EPIC and LS-DYNA, as well as Eulerian code, CTH, are compared in his work[12]. The
concrete models evaluated in his work include Holmquist Johnson Cook, Brittle Failure Kinetics,
Osborn, Karagozian and Case, and Drucker-Prager[12].Liu et al.(2012) using a three-dimensional
finite element code LS-DYNA to simulate the rigid 12.6mm diameter kinetic energy ogive-nosed
projectile impact on plain and fibre reinforced concrete [9]. A combined dynamic constitutive
model is used to describe the compressive and tensile damage of concrete, which is implemented in
the finite element code LS-DYNA [9].
22 H.M. An, L. Liu
In the study, the concrete sample on a dynamic test by Split-Hopkinson Pressure Bar is simulated.
The strain rate effect of concrete is compared and the stress distribution was obtained. The concrete
fracture and fragment under different strain rates were compared.
2. MATERIAL MODEL
As mentioned in the introduction section, the Holmquist-Johnson-Cook model (HJC), Taylor-Chen-
Kuszmaul model (TCK) and Riedel-Thoma-Hiermaier (RTH) are the mainly used model for study
the dynamic behavior of concrete. In the TCK model, the dynamic compressive behavior of
concrete material is simply described by elastic-perfect plastic constitutive equation[13]. In
addition, the RHT model is similar to the HJC model in terms of strain rate effect and damage
variables. Most importantly, the HJC model comprises most of important material parameters for
concrete such as hydrostatic strain, strain rate, and compressive damage, to describe the dynamic
behavior of concrete under large strain and high rate[10]. Thus the HJC model was used in this
study to simulate the dynamic response of concrete. The HJC model is a computational constitutive
mode for concrete subjected to large strain, high-strain rate and high pressure[14]. The model can
be expressed in Eq.(2.1).
(2.1)
where, A is the normalized cohesive strength, B is the normalized pressure hardening coefficient, N
is the pressure hardening exponent, C is the strain rate coefficient, D is damage. , and are
normalized stress, pressure and strain rate, respectively. They are normalized quasi-static uniaxial
compressive strength and can be expressed as follows.
(2.2)
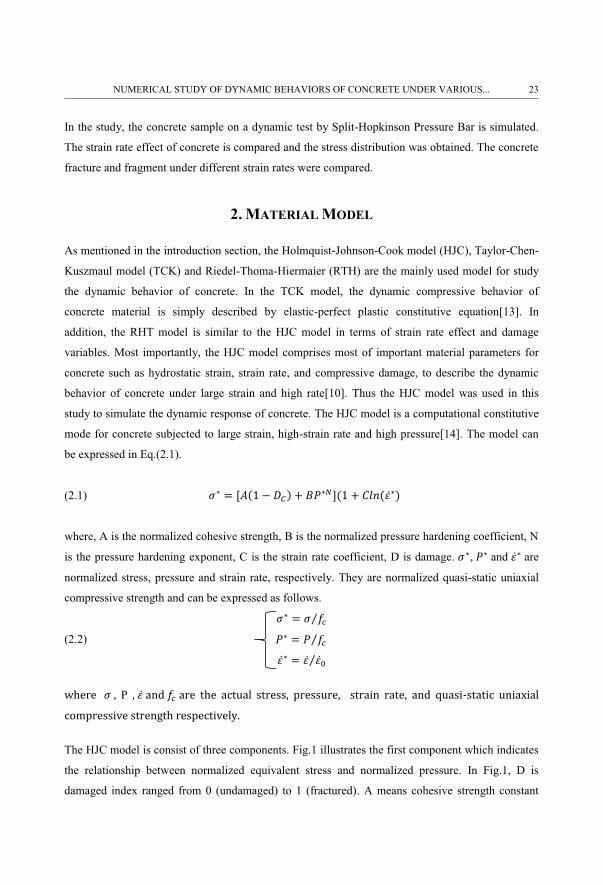
The HJC model is consist of three components. Fig.1 illustrates the first component which indicates
the relationship between normalized equivalent stress and normalized pressure. In Fig.1, D is
damaged index ranged from 0 (undamaged) to 1 (fractured). A means cohesive strength constant
NUMERICAL STUDY OF DYNAMIC BEHAVIORS OF CONCRETE UNDER VARIOUS... 23
while B indicates the normalized pressure hardening coefficient. In addition, C is the strain rate
constant and is the maximum strength which is normalized by quasi-static uniaxial
compressive strength.
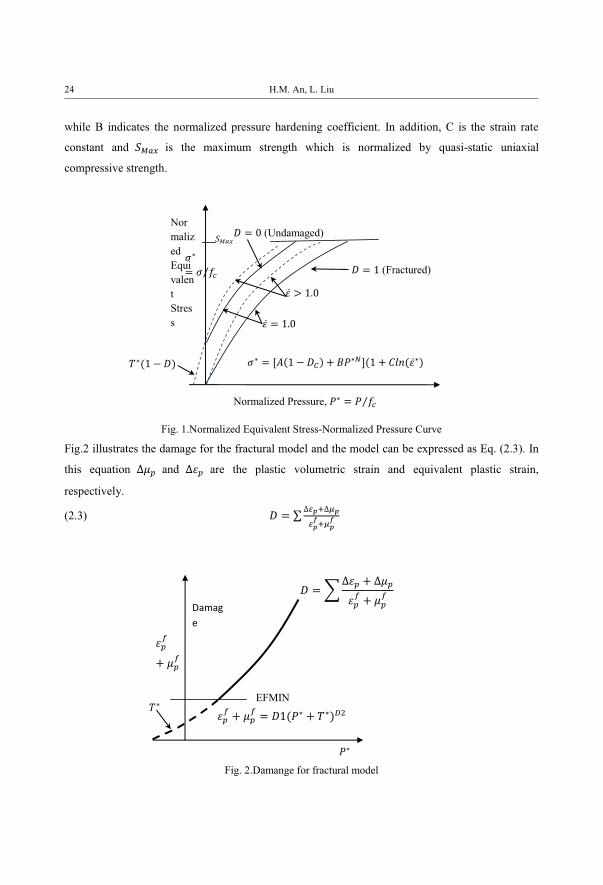
Fig. 1.Normalized Equivalent Stress-Normalized Pressure Curve
Fig.2 illustrates the damage for the fractural model and the model can be expressed as Eq. (2.3). In
this equation and are the plastic volumetric strain and equivalent plastic strain,
respectively.
(2.3)
Fig. 2.Damange for fractural model
(Undamaged)
(Fractured)
NormalizedEquivalentStress
Normalized Pressure,
EFMIN
Damage
24 H.M. An, L. Liu
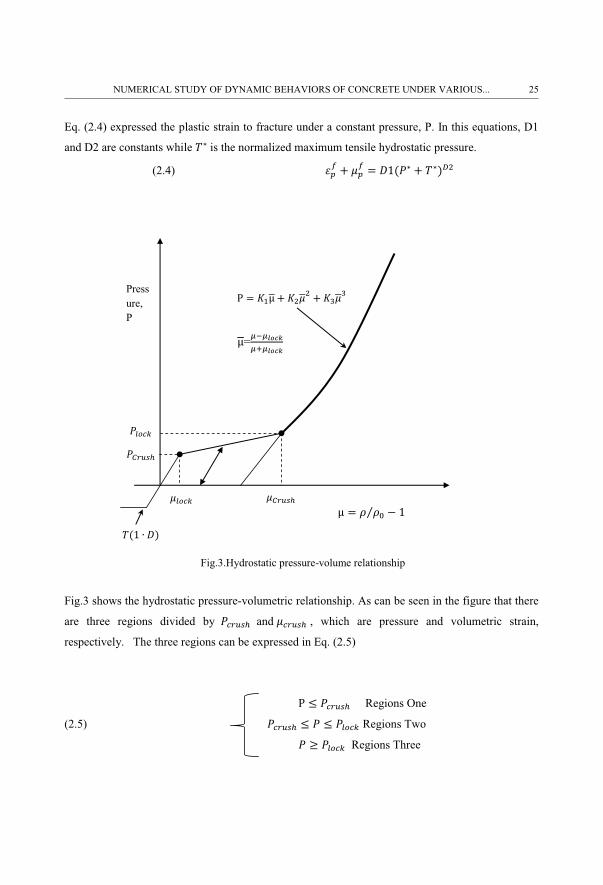
Eq. (2.4) expressed the plastic strain to fracture under a constant pressure, P. In this equations, D1
and D2 are constants while is the normalized maximum tensile hydrostatic pressure.
(2.4)
Fig.3.Hydrostatic pressure-volume relationship
Fig.3 shows the hydrostatic pressure-volumetric relationship. As can be seen in the figure that there
are three regions divided by and , which are pressure and volumetric strain,
respectively. The three regions can be expressed in Eq. (2.5)
Regions One
(2.5) Regions Two
Regions Three
Pressure, P
=
NUMERICAL STUDY OF DYNAMIC BEHAVIORS OF CONCRETE UNDER VARIOUS... 25
It can be seen from Fig.3 that Regions One is the linear elastic region while Region Two is referred
to as the transition region. In the Regions Two, the air voids will be compressed out from the
concrete gradually. If the loading is released, the unloading path is interpolated from the adjacent
regions[10].
As for Region Three, the concrete is fully dense as the air voids are pressed out in Region Two. The
pressure in this region can be expressed as Eq. (2.6)
(2.6)
where the modified volumetric strain = , the standard volumetric strain . In
addition, , , are constants
3. NUMERICAL MODELING THE DYNAMIC CONCRETE FRACTURE
AND FRAGMENTATION PROCESS
3.1. NUMERICAL MODEL AND CHJ PARAMETERS
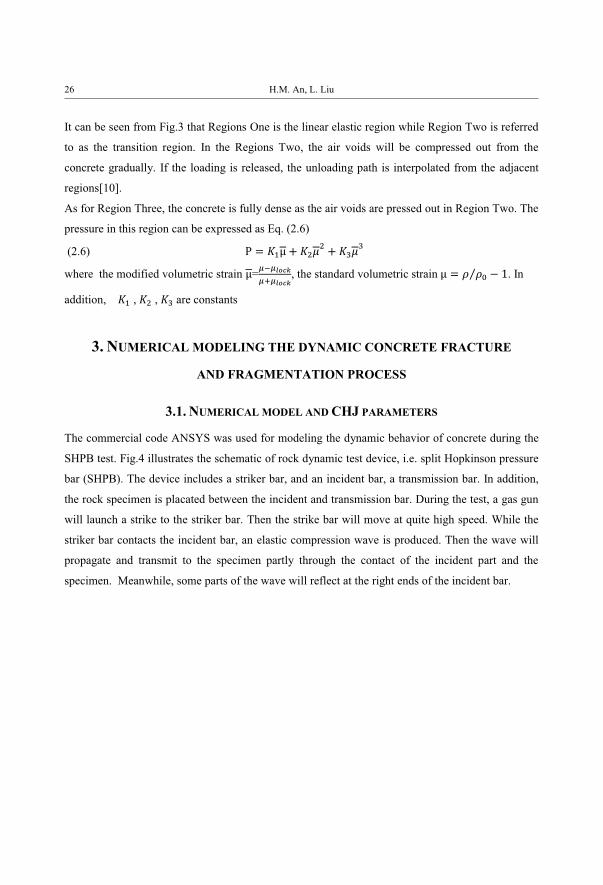
The commercial code ANSYS was used for modeling the dynamic behavior of concrete during the
SHPB test. Fig.4 illustrates the schematic of rock dynamic test device, i.e. split Hopkinson pressure
bar (SHPB). The device includes a striker bar, and an incident bar, a transmission bar. In addition,
the rock specimen is placated between the incident and transmission bar. During the test, a gas gun
will launch a strike to the striker bar. Then the strike bar will move at quite high speed. While the
striker bar contacts the incident bar, an elastic compression wave is produced. Then the wave will
propagate and transmit to the specimen partly through the contact of the incident part and the
specimen. Meanwhile, some parts of the wave will reflect at the right ends of the incident bar.
26 H.M. An, L. Liu
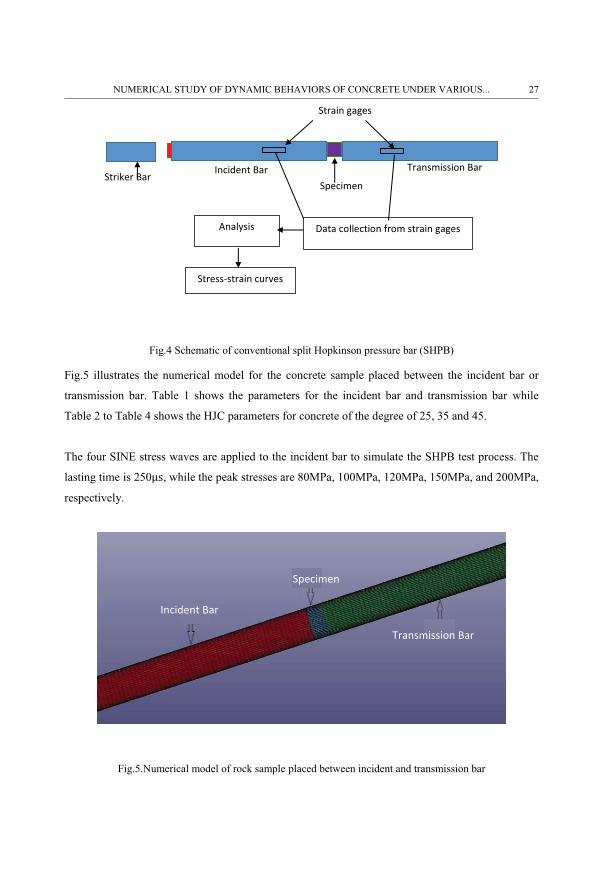
Fig.4 Schematic of conventional split Hopkinson pressure bar (SHPB)
Fig.5 illustrates the numerical model for the concrete sample placed between the incident bar or
transmission bar. Table 1 shows the parameters for the incident bar and transmission bar while
Table 2 to Table 4 shows the HJC parameters for concrete of the degree of 25, 35 and 45.
The four SINE stress waves are applied to the incident bar to simulate the SHPB test process. The
lasting time is 250 , while the peak stresses are 80MPa, 100MPa, 120MPa, 150MPa, and 200MPa,
respectively.
Fig.5.Numerical model of rock sample placed between incident and transmission bar
Transmission Bar
Specimen
Incident Bar
Striker Bar Incident Bar
Specimen
Transmission Bar
Data collection from strain gages Analysis
Stress-strain curves
Strain gages
NUMERICAL STUDY OF DYNAMIC BEHAVIORS OF CONCRETE UNDER VARIOUS... 27
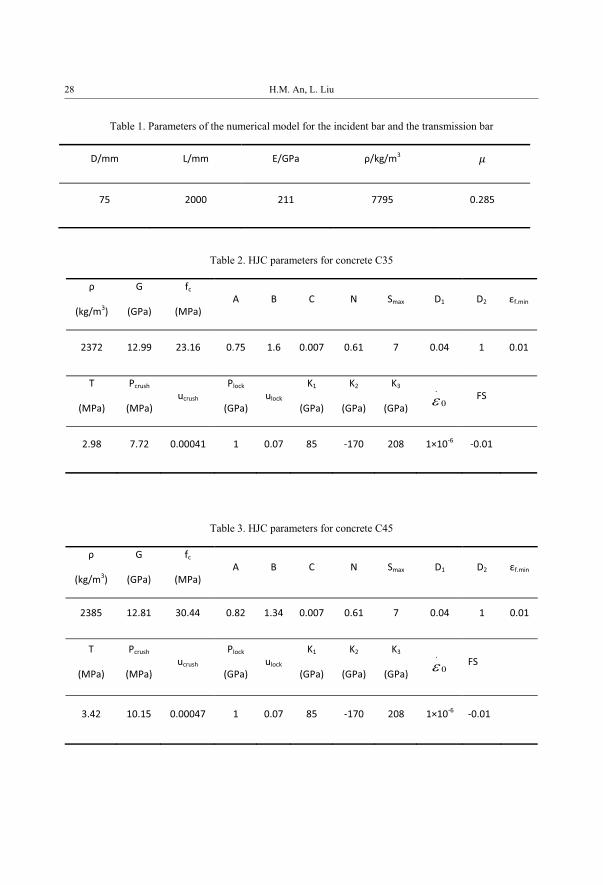
Table 1. Parameters of the numerical model for the incident bar and the transmission bar
D/mm L/mm E/GPa ρ/kg/m3
75 2000 211 7795 0.285
Table 2. HJC parameters for concrete C35
ρ
(kg/m3)
G
(GPa)
fc
(MPa) A B C N Smax D1 D2 εf.min
2372 12.99 23.16 0.75 1.6 0.007 0.61 7 0.04 1 0.01
T
(MPa)
Pcrush
(MPa) ucrush
Plock
(GPa) ulock
K1
(GPa)
K2
(GPa)
K3
(GPa)
.
0� FS
2.98 7.72 0.00041 1 0.07 85 -170 208 1×10⁻⁶ -0.01
Table 3. HJC parameters for concrete C45
ρ
(kg/m3)
G
(GPa)
fc
(MPa) A B C N Smax D1 D2 εf.min
2385 12.81 30.44 0.82 1.34 0.007 0.61 7 0.04 1 0.01
T
(MPa)
Pcrush
(MPa) ucrush
Plock
(GPa) ulock
K1
(GPa)
K2
(GPa)
K3
(GPa)
.
0� FS
3.42 10.15 0.00047 1 0.07 85 -170 208 1×10⁻⁶ -0.01
28 H.M. An, L. Liu
3.2. NUMERICAL MODELING OF DYNAMIC CONCRETE FRACTURE
PROCESS
3.2.1. STRESS-STRAIN CURVES UNDER VARIOUS STRAIN RATES
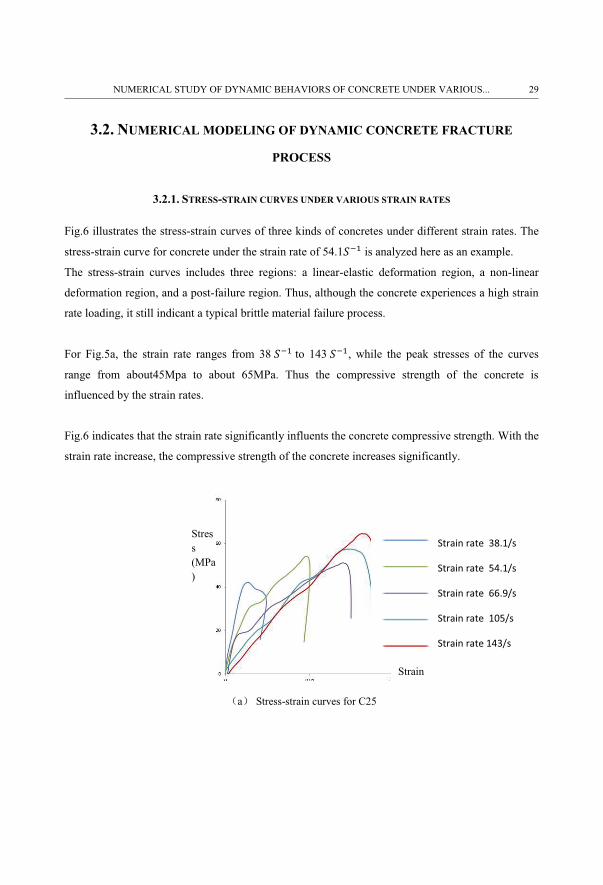
Fig.6 illustrates the stress-strain curves of three kinds of concretes under different strain rates. The
stress-strain curve for concrete under the strain rate of 54.1 is analyzed here as an example.
The stress-strain curves includes three regions: a linear-elastic deformation region, a non-linear
deformation region, and a post-failure region. Thus, although the concrete experiences a high strain
rate loading, it still indicant a typical brittle material failure process.
For Fig.5a, the strain rate ranges from 38 to 143 , while the peak stresses of the curves
range from about45Mpa to about 65MPa. Thus the compressive strength of the concrete is
influenced by the strain rates.
Fig.6 indicates that the strain rate significantly influents the concrete compressive strength. With the
strain rate increase, the compressive strength of the concrete increases significantly.
a Stress-strain curves for C25
Stress(MPa)
Strain
Strain rate 38.1/s
Strain rate 54.1/s
Strain rate 66.9/s
Strain rate 105/s
Strain rate 143/s
NUMERICAL STUDY OF DYNAMIC BEHAVIORS OF CONCRETE UNDER VARIOUS... 29
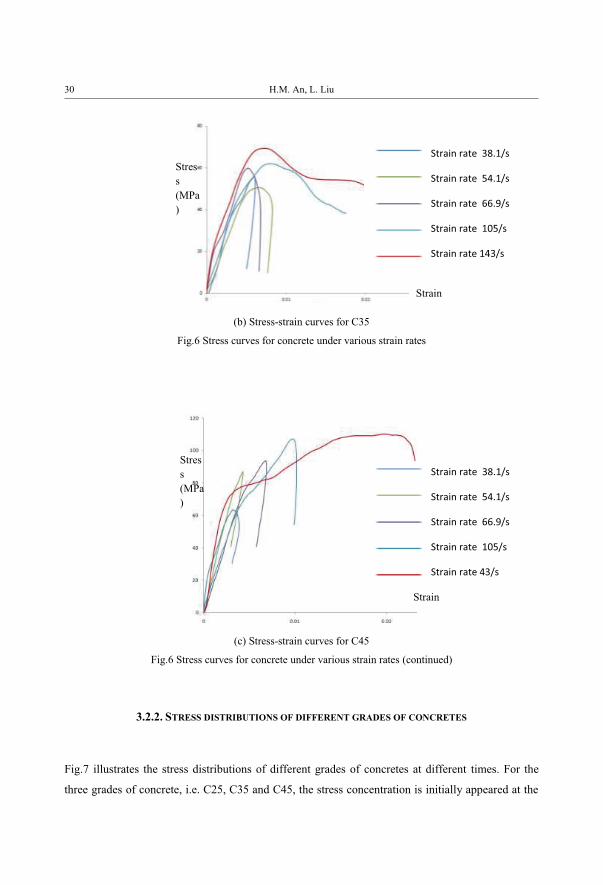
(b) Stress-strain curves for C35
Fig.6 Stress curves for concrete under various strain rates
(c) Stress-strain curves for C45
Fig.6 Stress curves for concrete under various strain rates (continued)
3.2.2. STRESS DISTRIBUTIONS OF DIFFERENT GRADES OF CONCRETES
Fig.7 illustrates the stress distributions of different grades of concretes at different times. For the
three grades of concrete, i.e. C25, C35 and C45, the stress concentration is initially appeared at the
Stress(MPa)
Stress(MPa)
Strain
Strain
Strain rate 38.1/s
Strain rate 54.1/s
Strain rate 66.9/s
Strain rate 105/s
Strain rate 143/s
Strain rate 38.1/s
Strain rate 54.1/s
Strain rate 66.9/s
Strain rate 105/s
Strain rate 43/s
30 H.M. An, L. Liu
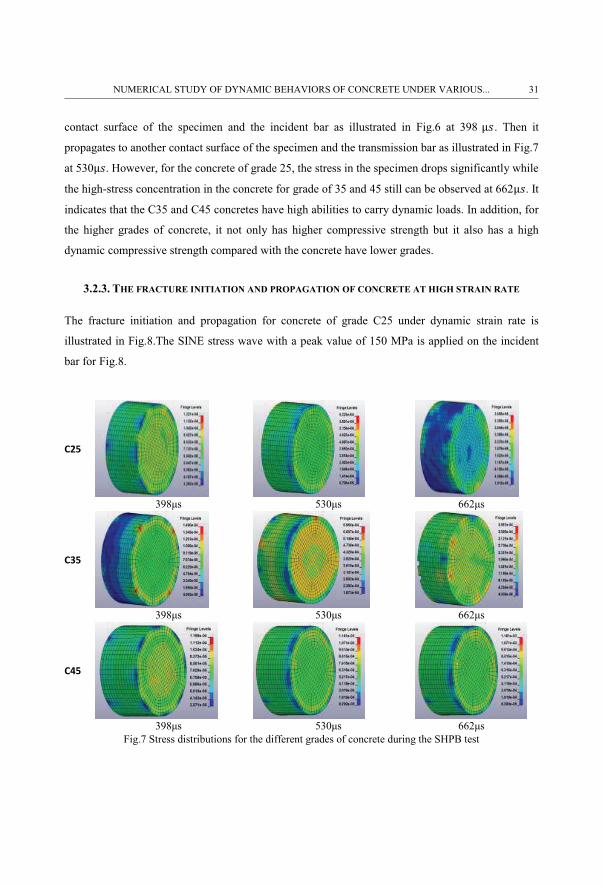
contact surface of the specimen and the incident bar as illustrated in Fig.6 at 398 . Then it
propagates to another contact surface of the specimen and the transmission bar as illustrated in Fig.7
at 530 . However, for the concrete of grade 25, the stress in the specimen drops significantly while
the high-stress concentration in the concrete for grade of 35 and 45 still can be observed at 662 . It
indicates that the C35 and C45 concretes have high abilities to carry dynamic loads. In addition, for
the higher grades of concrete, it not only has higher compressive strength but it also has a high
dynamic compressive strength compared with the concrete have lower grades.
3.2.3. THE FRACTURE INITIATION AND PROPAGATION OF CONCRETE AT HIGH STRAIN RATE
The fracture initiation and propagation for concrete of grade C25 under dynamic strain rate is
illustrated in Fig.8.The SINE stress wave with a peak value of 150 MPa is applied on the incident
bar for Fig.8.
C25
398μs 530μs 662μs
C35
398μs 530μs 662μs
C45
398μs 530μs 662μs
Fig.7 Stress distributions for the different grades of concrete during the SHPB test
NUMERICAL STUDY OF DYNAMIC BEHAVIORS OF CONCRETE UNDER VARIOUS... 31
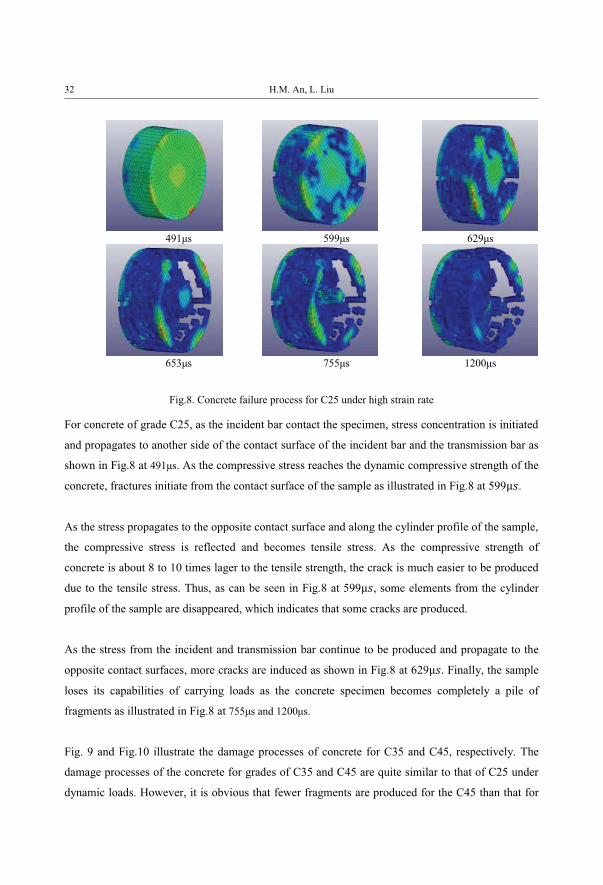
491μs 599μs 629μs
653μs 755μs 1200μs
Fig.8. Concrete failure process for C25 under high strain rate
For concrete of grade C25, as the incident bar contact the specimen, stress concentration is initiated
and propagates to another side of the contact surface of the incident bar and the transmission bar as
shown in Fig.8 at 491μs. As the compressive stress reaches the dynamic compressive strength of the
concrete, fractures initiate from the contact surface of the sample as illustrated in Fig.8 at 599 .
As the stress propagates to the opposite contact surface and along the cylinder profile of the sample,
the compressive stress is reflected and becomes tensile stress. As the compressive strength of
concrete is about 8 to 10 times lager to the tensile strength, the crack is much easier to be produced
due to the tensile stress. Thus, as can be seen in Fig.8 at 599 , some elements from the cylinder
profile of the sample are disappeared, which indicates that some cracks are produced.
As the stress from the incident and transmission bar continue to be produced and propagate to the
opposite contact surfaces, more cracks are induced as shown in Fig.8 at 629 . Finally, the sample
loses its capabilities of carrying loads as the concrete specimen becomes completely a pile of
fragments as illustrated in Fig.8 at 755μs and 1200μs.
Fig. 9 and Fig.10 illustrate the damage processes of concrete for C35 and C45, respectively. The
damage processes of the concrete for grades of C35 and C45 are quite similar to that of C25 under
dynamic loads. However, it is obvious that fewer fragments are produced for the C45 than that for
32 H.M. An, L. Liu
C25 under the same loading. Thus C45 has a higher capability of carrying load. It indicates that the
compressive strength of a higher degree of concrete is higher than that of a lower degree of
concrete.
515μs 593μs 659μs
845μs 989μs 1200μs
Fig.9. Concrete failure process for C35 under high strain rate
503μs 545μs 635μs
785μs 1013μs 1200μs
Fig.10. Concrete failure process for C45 under high strain rate
NUMERICAL STUDY OF DYNAMIC BEHAVIORS OF CONCRETE UNDER VARIOUS... 33
4. CONCLUSIONS
Concrete is widely used in modern society as one of the most important construction material. In
many projects, concrete might experience dynamic loading. As the dynamic behavior of the
concrete is quite different from that under static loading, this research focuses on the study of
dynamic response of concrete by simulation the split Hopkinson pressure bar (SHPB) test. LS-
DYNA code, which is a finite element method software, is used for modeling of the stress
propagation, crack initiation and propagation for samples in the SHPB test. Three continuous
models for modeling the concrete dynamic behavior are reviewed. Among them, the Holmquist-
Johnson-Cook model (HJC) is selected for representing the properties of concrete. Then, the HJC
model comprises the stress-pressure model, the damage model and the equation of state, which are
introduced in detail. The SHPB test model is established, which includes incident bar, concrete
specimen, and the transmission bar. Three stress waves are applied on the incident bar to simulate
the concrete behavior under various strain rates. Three grades of concretes, i.e. C25, C35, and C45,
are chosen for the dynamic modeling and the concrete properties of the concretes are from the
experimental test. The stress-strain curves for the concrete specimen under various strain rates are
obtained. The stress distributions are analyzed. The crack initiation and propagation processed at
high strain rates are described. It is concluded that:
� The HJC model implemented in LS-DYNA can model the concrete behavior under impact
loads.
� The stress-strain curves under various strain rates illustrate a typical brittle material failure
process and the comparison of those curves for the same grade of concrete indicates that the
influence of the strain rate on the dynamic strength of the concrete.
� A comparison of the curves for three grades of concrete, i.e. C25, C35, C45, indicates that
the concrete with a higher degree, e.g. C45, can undertake a higher load.
� The stress propagation and crack initiation and propagation are achieved for different
concrete under various strain rates. Fewer fragments are produced for higher degree of
concrete, which indicates the high degree of concrete has a higher capability of carrying
load.
34 H.M. An, L. Liu
ACKNOWLEDGMENTS
This research presented in this study is partly supported by the following foundations and
organizations: Research Start-up Fund for Talent of Kunming University of Science and
Technology, Grant No. KKSY201867017), National science foundation of China (Grant number:
11862010),
Program for Innovative Research Team (in Science and Technology) in University of Yunnan Provi
nce, and Yunnan Key Laboratory of Sino-German Blue Mining and Utilization of Special
Underground Space, which are of greatly appreciated. Moreover, the authors would like to thanks
the anonymous reviewers for their valuable comments and constructive suggestion.
REFERENCES
1. Zhao, J., et al., Rock dynamics research related to cavern development for ammunition storage. Tunnelling and Underground Space Technology, 1999. 14(4): p. 513-526.
2. Liu, H., Y. Kang, and P. Lin, Hybrid finite-discrete element modeling of geomaterials fracture and fragment muck-piling. International Journal of Geotechnical Engineering, 2013.
3. Kumar, A., The effect of stress rate and temperature on the strength of basalt and granite. Geophysics, 1968. 33(3): p. 501-510.
4. Bazant, Z.P., S.-p. Bai, and R. Gettu, Fracture of rock: effect of loading rate. Engineering Fracture Mechanics,1993. 45: p. 393-393.
5. Blanton, T. Effect of strain rates from 10-2 to 10 sec-1 in triaxial compression tests on three rocks. in International Journal of Rock Mechanics and Mining Sciences & Geomechanics Abstracts. 1981. Elsevier.
6. Johnson, G., et al., Numerical Algorithms in a Lagrangian Hydrocode. 1997, DTIC Document. 7. Li, X., T. Lok, and J. Zhao, Dynamic characteristics of granite subjected to intermediate loading rate. Rock
Mechanics and Rock Engineering, 2005. 38(1): p. 21-39.8. Sukontasukkul, P., P. Nimityongskul, and S. Mindess, Effect of loading rate on damage of concrete. Cement
and Concrete Research, 2004. 34(11): p. 2127-2134. 9. Lu, G., X. Li, and K. Wang, A numerical study on the damage of projectile impact on concrete targets.
Computers & Concrete, 2012. 9(1): p. 21-33. 10. Holqmuist, T., G. Johnson, and W. Cook. A computational constitutive model for concrete subjected to large
strains, high strain rate, and high pressures. in 14th international symposium on ballistics. 1993. 11. Taylor, L.M., E.-P. Chen, and J.S. Kuszmaul, Microcrack-induced damage accumulation in brittle rock under
dynamic loading. Computer methods in applied mechanics and engineering, 1986. 55(3): p. 301-320. 12. Bush, B.M., Analytical evaluation of concrete penetration modeling techniques. 2010.13. Zhou, X., et al., Numerical prediction of concrete slab response to blast loading. International Journal of
Impact Engineering, 2008. 35(10): p. 1186-1200. 14. Kwak, H. and H. Gang, A bi-axial model for concrete under high-strain rate conditions. Materials
characterisation, 2015: p. 319-330.
LIST OF FIGURES AND TABLES:
Fig. 1.Normalized Equivalent Stress-Normalized Pressure Curve
Fig. 2.Damange for fractural model
Fig. 3.Hydrostatic pressure-volume relationship
NUMERICAL STUDY OF DYNAMIC BEHAVIORS OF CONCRETE UNDER VARIOUS... 35
Fig. 4 Schematic of conventional split Hopkinson pressure bar (SHPB)
Fig. 5.Numerical model of rock sample placed between incident and transmission bar
Fig. 6 Stress curves for concrete under various strain rates
Fig. 7 Stress distributions for the different grades of concrete during the SHPB test
Fig. 8. Concrete failure process for C25 under high strain rate
Fig. 9. Concrete failure process for C35 under high strain rate
Fig. 10. Concrete failure process for C45 under high strain rate
Table 1. Parameters of the numerical model for the incident bar and the transmission bar
Table 2. HJC parameters for concrete C35
Table 3. HJC parameters for concrete C45
Received 24.12.2018
Revised 02.10.2019
36 H.M. An, L. Liu