Embed Size (px)
Citation preview

NURSING CARE OF THE PATIENT WITH
HEMATOLOGIC/NEOPLASTIC DISORDERS
Presented by: Mary Lesperance, MSN, ARNP-C

LEARNING OBJECTIVES
• Define anemia, causation & diagnosis
• Define cancer• List types of cancer & understand
methods for detection and diagnosis

OBJECTIVES (2)
• Describe classification systems for cancer.
• Discuss treatment options and and how they are chosen
• Identify classifications of chemotherapeutic agents and administration

OBJECTIVES (3)
• Explain role of nurse in prevention and detection of cancer
• Describe complications that can occur • Describe nursing management of patient
receiving therapy

Nursing Responsibility
• Importance of knowledge – Education – Support– Care

HEMATOLOGY
ANEMIAS

ANEMIA• Greek: “Without blood”• Qualative or quantative deficiency of hemoglobin in
RBC• Carries O2 from lungs-tissues
• Causes: – blood loss– blood destruction (hemolysis)– Deficient red blood cell production– Lack of iron in body

ANEMIA
• Most common ww deficiency disease– WHO 1/3 ww population
• Iron deficiency anemia most common hematologic disease of infants and children US & WW
– Low iron 2o cow’s milk (iron-poor & interferes with absorption in gut)

Effects
• Children: Development delays & behavior disturbances (May be irreversible after age 4)
• Adults: May be subtle or dramatic– Pica (dirt, paper, wax, ice, hair)– Pallor, weakness, fatigue, general malaise, poor
concentration– Severe: body compensation – increased cardiac,
palpitations, sweatiness, heart failure (not enough hgb = not enough O2 circulating)

S/S R/T ANEMIA
• Fatigue• Shortness of breath• Ataxia• Headache• Coldness in hands and feet• Pale Skin• Decreased concentration

LABORATORY - Anemia• Hemoglobin (Hgb)• Hematocrit (Hct)• Red blood cell (RBC)* (Micro vs Macro)• Serum ferritin• Serum iron• Total iron-binding capacity (TIBC)• Reticulocytes• Methylmalonic acid (vitamin B 12)• Homocysteine

LABORATORY - CBC
• Hemoglobin – – Measures 02 capacity of blood– Low levels usually indicate anemia– Lacks specificity to reflect body iron stores
• Hematocrit – – % of volume of blood occupied by RBCs– Less accurate than Hgb:
• Falsely elevated in hyperglycemia & dehydration• Time & temperature sensitive

BIOLOGY - Hgb
• Protein in the RBC’s – • Iron-rich• Iron is one of building
blocks of Hgb
• Polypectide chain • Heme (red)• Iron (blue)• Alpha/beta chains
HGB MOLOCULE

SERUM IRON
• Measures amount of iron in blood• Does not fall until iron stores (serum ferritin) are
depleted• Diagnostic value lower
– Day to day fluctuations– Increases with ingestion– Decreases due to infection, inflammation, malignancy– Need to look at other values (TIBC)

SERUM FERRITIN
• Serum Ferritin (one of most useful est. of total iron stores)– Intracellular – stored in tissues– Plasma/Serum – released into blood– High - sign of increased stores, Low usually due to
iron deficiency– High can be due to malignancies, infection and/or
inflammation, many transfusions

TOTAL IRON-BINDING CAPACITY (TIBC)
• Measure of amt of iron that transferrin can carry
• Increases with iron deficiency (body tries to capture more)
• Diagnostic:– High: iron deficiency, normal pregnancy– Low: inflammation, infection, malignant tumors,
malnutrition

SERUM IRON
• Iron (red) stored inside ferritin and absorbed in duodenum
• (why slow-release may be ineffective to prevent upset stomach, but slow release won’t be absorbed as well)

TRANSFERRINTransfers iron to areas requiring

FOLIC ACID + VITAMIN B12
• Folic Acid – DNA synthesis of RBCs• Vitamin B12 – transports folic acid from serum
to RBC• B12 Def Folic Def
– Methylmalonic acid Elev. Normal– Homocysteine level Normal or Elevated– Elev.

SICKLE CELL ANEMIA• Autosomal recessive genetic disease
• Protective of malaria – most died in 20’s– High infant death “ogbanjes” – “children who come and go”
• 340,000 born each year ww – majority in belt around Med. Sea (Greece, Italy, Saudi, Africa)– Nigeria >100,000/yr – 75% die between 1-5
• US – 85% reach 18; few live past 50– 1/500 African-American births; 1, 1000-1400 Hispanic
(lots of notes in ppt)

Sickle cell conditions are inherited from parents in much the same way as blood type, hair color and texture, eye color and other physical traits. The types of hemoglobin a person makes in the red blood cells depend upon what hemoglobin genes the person inherits from his or her parents. Like most genes, hemoglobin genes are inherited in two sets…one from each parent.
If one parent has Sickle Cell Anemia and the other is Normal, all of the children will have sickle cell trait. (Most people with sickle cell trait are healthy.If one parent has Sickle Cell Anemia and the other has Sickle Cell Trait, there is a 50% chance (or 1 out of 2) of having a baby with either sickle cell disease or sickle cell trait with each pregnancy. When both parents have Sickle Cell Trait, they have a 25% chance (1 of 4) of having a baby with sickle cell disease with each pregnancy.

SICKLE CELL DISEASE
• Most common in US:– Hgb SS (sickle cell anemia)– Hgb SC disease– Hgb sickle beta-thalessemia
• Causes deoxygenation of heme – hydrophobic interactions – distorting RBC into ‘sickle’ shape – stiff & sticky – form clumps.
• See notes on next page)

• People with sickle cell conditions make a different form of hemoglobin A called hemoglobin S (S stands for sickle). Red blood cells containing mostly hemoglobin S do not live as long as normal red blood cells (normally about 16 days). They also become stiff, distorted in shape and have difficulty passing through the body’s small blood vessels. When sickle-shaped cells block small blood vessels, less blood can reach that part of the body. Tissue that does not receive a normal blood flow eventually becomes damaged. This is what causes the complications of sickle cell disease .

SICKLE CELL ANEMIA
• Present @ birth – s/s usually after 4 mos.– (testing @ birth, genetic testing)– Pneumonia and infections major cause of death in children
with Sickle Cell Anemia– Other – meningitis, influenza, hepatitis
• S/S vary from mild to severe• Sickle Cell trait (AS) is an inherited condition in which both
hemoglobin A and S are produced in the red blood cells, always more A than S. Sickle cell trait is not a type of sickle cell disease. People with sickle cell trait are generally healthy.

Complications
• Low RBCs• Pain Episodes• Strokes• Increased infections• Leg ulcers• Bone damage• Jaundice• Gallstones• (pain is most common side
effect)
• Delayed growth• Lung blockage• Kidney damage• Priapism• Sequestration in liver
or spleen• Eye damage

The sickle cells also block the flow of blood through vessels resulting in lung tissue damage (acute chest syndrome), pain episodes (arms, legs, chest and abdomen), stroke and priapism (painful prolonged erection). It also causes damage to most organs including the spleen, kidneys and liver. Damage to the spleen makes sickle cell disease patients, especially young children, easily overwhelmed by certain bacterial infections

S/S R/T Pain
• Chronic or Acute/Sudden Pain –• Almost all have painful crisis @ some point
– Sickled RBCs “clump” in bloodstream
– Major cause of hospitalization, E.D. visits
– Pain for hours to days

Prevention/Relief of Symptoms
• Goals1. Relieve pain2. Prevent infections (prophylactic pcn)3. Prevent eye damage; strokes4. Control complications

Medications
• Hydroxuria– Chemotherapy w/ multiple side effects that go
along with chemo: N/V/A, stomatitis, diarrhea, etc.– Improved growth– Prevents organ damage– Decreases need for transfusions– Hydroxyurea –
• Improved growth, prevents organ damage, decreases need for transfusions, (side effects)
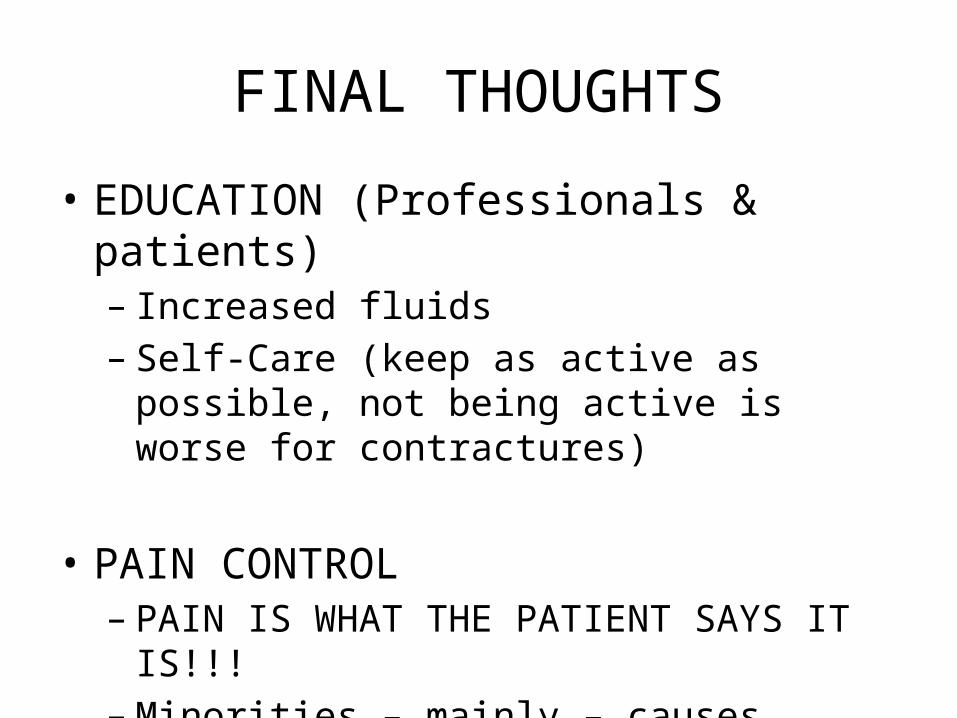
FINAL THOUGHTS
• EDUCATION (Professionals & patients)– Increased fluids– Self-Care (keep as active as possible, not being
active is worse for contractures)
• PAIN CONTROL– PAIN IS WHAT THE PATIENT SAYS IT IS!!!– Minorities – mainly – causes issues

Cancer Statistics 2006
A Presentation From the American Cancer Society
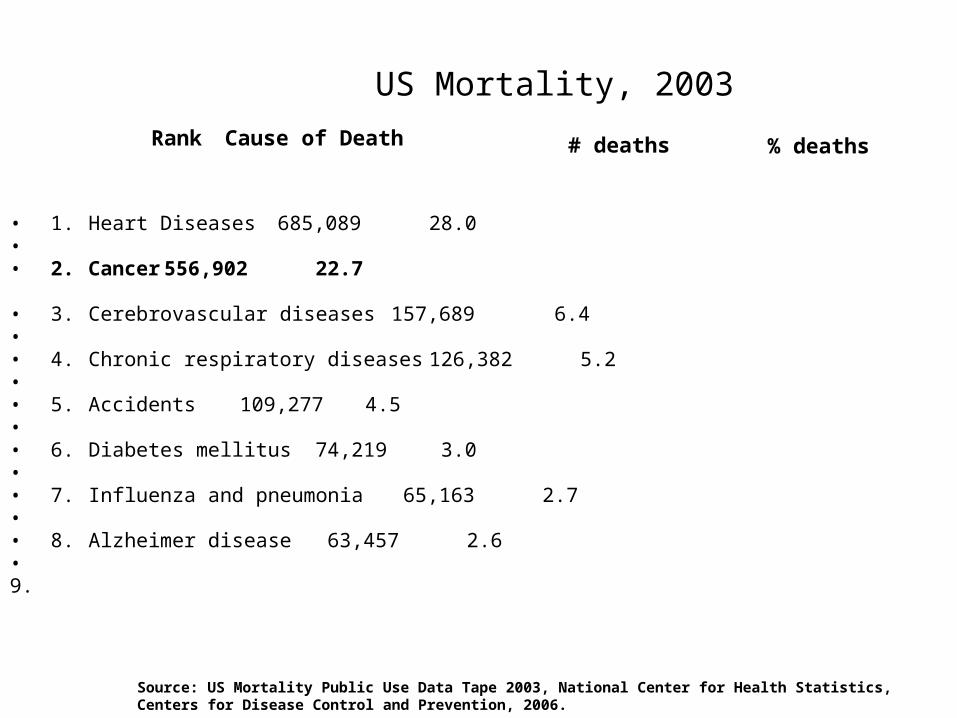
US Mortality, 2003
• 1. Heart Diseases 685,089 28.0• • 2. Cancer 556,902 22.7
• 3. Cerebrovascular diseases 157,689 6.4• • 4. Chronic respiratory diseases 126,382 5.2• • 5. Accidents 109,277 4.5• • 6. Diabetes mellitus 74,219 3.0• • 7. Influenza and pneumonia 65,163 2.7• • 8. Alzheimer disease 63,457 2.6• 9.
Source: US Mortality Public Use Data Tape 2003, National Center for Health Statistics, Centers for Disease Control and Prevention, 2006.
Rank Cause of Death # deaths % deaths

2008 Estimated US Cancer Cases*
*Excludes basal and squamous cell skin cancers and in situ carcinomas except urinary bladder.
Source: American Cancer Society, Cancer Facts & Figures 2007. .
Men720,280 Women
679,510 26% Breast 14% Lung &
bronchus 10% Colon &
rectum 6% Uterine
corpus 4%Non-Hodgkin
lymphoma
4% Melanoma of skin
4% Thyroid 3%Ovary 3% Kidney 3% Leukemia 23% All Other
Sites
Prostate 25%
Lung & bronchus 15%
Colon & rectum 10%
Urinary bladder 7%
Melanoma of skin 5%
Non-Hodgkin 5% lymphoma
Kidney 4%
Oral cavity 3%
Leukemia 3%
Pancreas 3%
All Other Sites 20%

Now we will turn our attention to the number of new cancers anticipated in the US this year. It is estimated that almost 1.4 million new cases of cancer will be diagnosed in 2006. Cancers of the prostate and breast will be the most frequently diagnosed cancers in men and women, respectively, followed by lung and colorectal cancers both in men and in women.

2006 Estimated US Cancer Deaths*
ONS=Other nervous system.Source: American Cancer Society, 2006.
Men291,270
Women273,560 26% Lung & bronchus
15% Breast 10% Colon & rectum 6% Pancreas 6% Ovary 4% Leukemia 3% Non-Hodgkin
lymphoma 3% Uterine 2% Multiple myeloma 2% Brain/ONS 23% All other sites
Lung & bronchus 31%
Colon & rectum 10%
Prostate 9%
Pancreas 6%
Leukemia 4%
Liver & intrahepatic 4%bile duct
Esophagus 4%
Non-Hodgkin 3% lymphoma
Urinary bladder 3%
Kidney 3%
All other sites 23%

Lung cancer is, by far, the most common fatal cancer in men (31%), followed by colon & rectum (10%), and prostate (9%). In women, lung (26%), breast (15%), and colon & rectum (10%) are the leading sites of cancer death.

Change in the US Death Rates* by Cause, 1950 & 2003
* Age-adjusted to 2000 US standard population.Sources: 1950 Mortality Data - CDC/NCHS, NVSS, Mortality Revised.2003 Mortality Data: US Mortality Public Use Data Tape, 2003, NCHS, Centers for Disease Control and Prevention, 2006
21.9
180.7
48.1
586.8
193.9
53.3
190.1
231.6
0
100
200
300
400
500
600
HeartDiseases
CerebrovascularDiseases
Pneumonia/Influenza
Cancer
1950
2003
Rate Per 100,000

Cancer Death Rates*, by Race and Ethnicity, US,1998-2002
242.5
148.0159.7164.5
194.3
99.4113.8 111.0
339.4
171.4
0
50
100
150
200
250
300
350
400
White AfricanAmerican
Asian/PacificIslander
AmericanIndian/ Alaskan
Native
Hispanic†
Men Women
*Per 100,000, age-adjusted to the 2000 US standard population.†Hispanic is not mutually exclusive from whites, African Americans, Asian/Pacific Islanders, and American Indians/Alaska Natives.Source: American Cancer Society, Cancer Facts & Figures 2007.

Overall, cancer death rates are higher in men than women in every racial and ethnic group. African American men and women have the highest rates of cancer mortality. Asian and Pacific Islander men and women have the lowest cancer death rates, about half the rate of African American men and women, respectively.
Note: Rates for populations other than white and African American may be affected by problems in ascertaining race/ethnicity information from medical records. This is likely to result in reported death rates that are lower than true death rates.

0
50
100
150
200
250
300
350
400
450
500
1975 1978 1981 1984 1987 1990 1993 1996 1999 2002
African American men
White men
African American women
White women
Rate Per 100,000
Cancer Death Rates* by Sex and Race, US, 1975-2002
*Age-adjusted to the 2000 US standard population.Source: Surveillance, Epidemiology, and End Results Program, 1975-2002, Division of Cancer Control andPopulation Sciences, National Cancer Institute, 2005.

Tobacco Use in the US, 1900-2002
0
500
1000
1500
2000
2500
3000
3500
4000
4500
5000
1900
1905
1910
1915
1920
1925
1930
1935
1940
1945
1950
1955
1960
1965
1970
1975
1980
1985
1990
1995
2000
Year
Per
Cap
ita C
igare
tte C
on
su
mp
tio
n
0
10
20
30
40
50
60
70
80
90
100
Ag
e-A
dju
ste
d L
un
g C
an
cer
Death
Rate
s*
*Age-adjusted to 2000 US standard population. Source: Death rates: US Mortality Public Use Tapes, 1960-2002, US Mortality Volumes, 1930-1959, National Center for Health Statistics, Centers for Disease Control and Prevention, 2005. Cigarette consumption: US Department of Agriculture, 1900-2002.
Per capita cigarette consumption
Male lung cancer death rate
Female lung cancer death rate

The last set of slides describes at the prevalence of cancer risk factors, such as tobacco use and physical inactivity, and the prevalence of cancer screening, such as use of mammography. Tobacco use is a major preventable cause of death, particularly from lung cancer. The year 2004 marks the anniversary of the release of the first Surgeon General’s report on Tobacco and Health, which initiated a decline of per capita cigarette smoking in the United States. As a result of the cigarette smoking epidemic, lung cancer death rates showed a steady increase through 1990, then began to decline among men. The lung cancer death rate among US women, who began regular cigarette smoking later than men, continues to increase slightly.

Childhood Cancer
• #1 cause of death by disease children & adolescents
• 12,000 dx In U.S. every year; over 3000 will die from it
• One in 300 Americans will develop cancer before age of 20
• Median age of adults – 67• Median age of children – 6 (NCI)

Cancer Incidence & Death Rates* in Children 0-14 Years, 1975-2002
0
2
4
6
8
10
12
14
16
18
1975 1978 1981 1984 1987 1990 1993 1996 1999 2002
Incidence
Mortality
Rate Per 100,000
*Age-adjusted to the 2000 Standard population.Source: Surveillance, Epidemiology, and End Results Program, 1975-2002, Division of Cancer Control and Population Sciences, National Cancer Institute, 2005.

Trends in Survival, Children 0-14 Years, All Sites Combined1974-2001
*5-year relative survival rates, based on follow up of patients through 2002.Source: Surveillance, Epidemiology, and End Results Program, 1975-2002, Division of Cancer Control andPopulation Sciences, National Cancer Institute, 2005.
79.2
78.6
78.3
55.1
55.5
56.8
5 - Year Relative Survival Rates *AgeYear ofDiagnosis
1974 - 1976
1995 -
2001
1974 - 1976
1995 - 2001
0 - 4
Years
1974 - 1976
1995 -
2001
5 - 9
Years
10 - 14
Years

The 5-year relative survival rate for all three age groups increased significantly between the mid 1970s and late 1990s. For example, the 5-year relative survival rate increased from 55.1% in 1974-76 to 79.2% in 1995-2001 for cases diagnosed among children 10-14 years old.
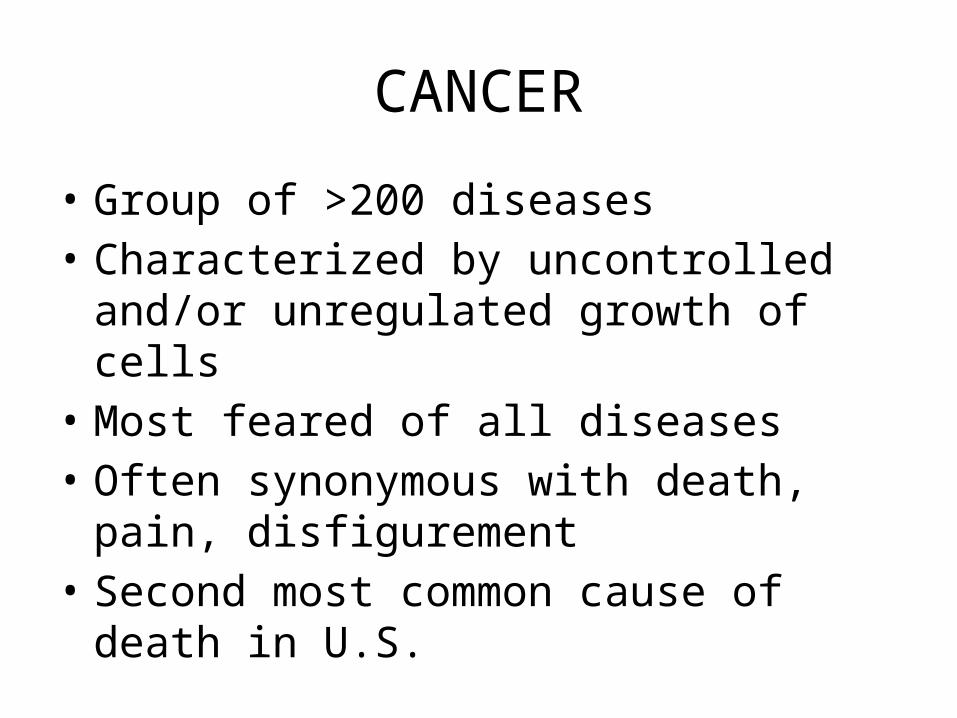
CANCER
• Group of >200 diseases • Characterized by uncontrolled and/or
unregulated growth of cells• Most feared of all diseases• Often synonymous with death, pain,
disfigurement• Second most common cause of death in U.S.

Normal Cellular Proliferation
• Stem Cell – all cells from fertilized ova • Differentiate (very, very important! Test
question) – Predetermined – Mature functioning cell of only that tissue– Stable and orderly progression– Respects boundaries and territory– Degenerates and dies

APOPTOSIS
• Equilibrium between cell growth and death• Pro-apoptotic vs. anti-apoptotic stimuli
• Programmed cell death• Remove old, dead, unwanted

MUTATION
• Mutation– Single gene theory – clonal evolution/mutation
• Genetic and/or environmental and/or virus damages DNA
– Age (77% >55) lifelong accumulations of DNA mutations – may be unable to repair all or cell-mediated immunity reduced
– Proto-ononcogens – regulate normal processes (passed from prev. generations & may be over/under expressed)
– Tumor suppressor genes (p53) may be abnormal (supresses tumors)

Cancer Causes
• 78-80% may be environmental/external• Viruses• Hormones• Radiation• Chemicals• Hereditary Factors• Unknown Factors
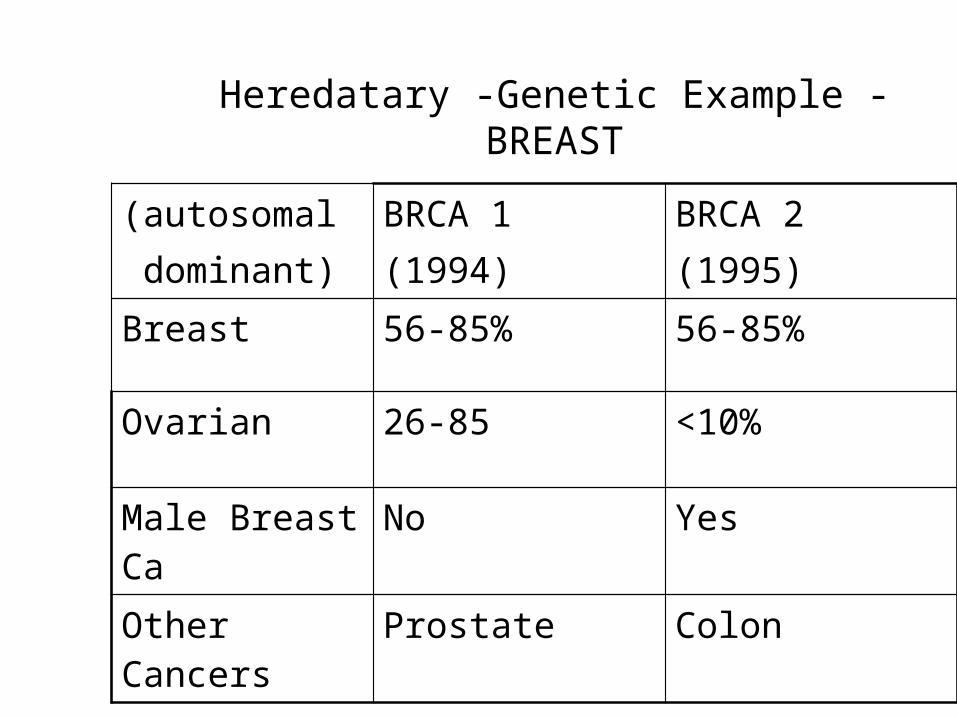
Heredatary -Genetic Example - BREAST
(autosomal dominant)
BRCA 1(1994)
BRCA 2(1995)
Breast 56-85% 56-85%
Ovarian 26-85 <10%
Male Breast Ca
No Yes
Other Cancers Prostate Colon

KNOWN CARCINOGENS– Alcohol Liver, esophagus, mouth– Hair Dyes Bladder– Radiation Bone marrow, thyroid, etc– Pesticides Lung– Tobacco Lung, esophagus, mouth
pharynx, larynx, pancreas,bladder, kidney, liver,stomach, colon, leukemia
– Sun Skin, eyes

Defect in Proliferation
Any of previous may occur and cause:
• UNREGULATED GROWTH
• UNREGULATED PROLIFERATION
• DE-DIFFERATION

• Eventually form visible mass/tumor (Primary)• May break off and lodge elsewhere
(Metastasis)

Benign vs Malignant
EncapsulatedDifferentiatedMetastasisRecurrenceVascularityGrowthCell
MalignantRarePoorlyFrequentFrequentModerate to MarkedInfilt//expansiveAbnormal, become more unlike parent cell
BenignUsuallyPartiallyAbsentRareSlightExpansiveFairly normal

Some Causes• Alcohol
– Synergistic with smoking (oral, pharynx, larynx, esophagus, liver & anemias!)
• Radiation– External Beam– Sun
• Viral – HPV – cervical dysplasia– HPV – SCC - Head & neck **New** – HBV – hepatoma

Cause/Prevention
• Tobacco– 30% of cancers– 90% Lung cancers
• Diet– Colon Cancer & fiber intake– Breast cancer and too much fat intake– Fruits and vegetables protective

Screening - USHPTF
• PAP (yearly) • Breast: CBE (clinical breast exam),
Mammogram, SBE• FOB (fecal occult blood)• Colonoscopy• Testicular • Skin
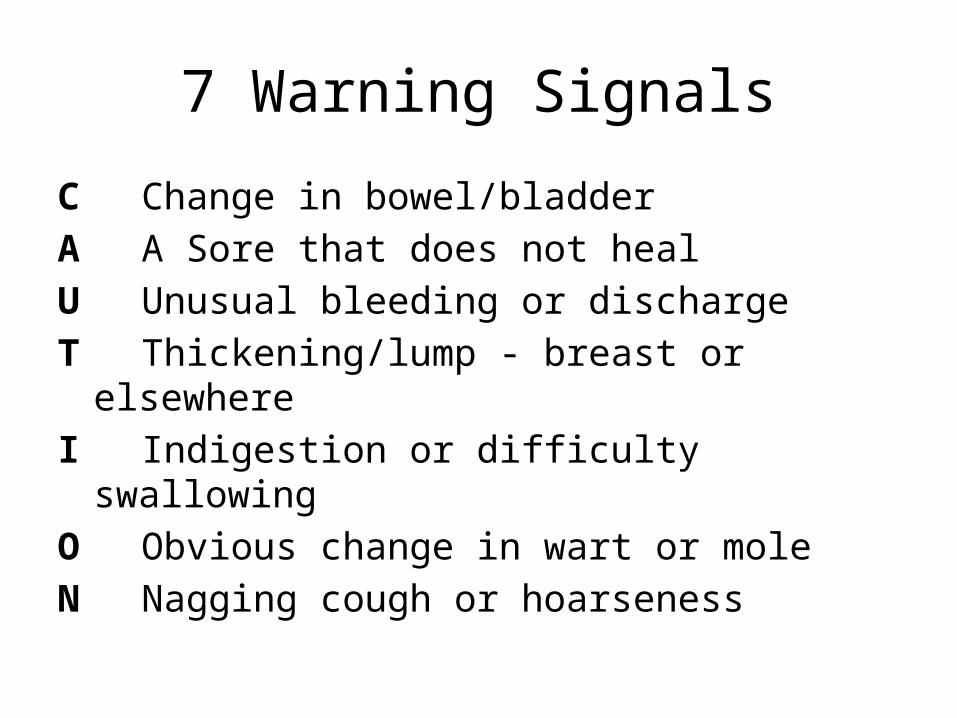
7 Warning Signals
C Change in bowel/bladderA A Sore that does not heal U Unusual bleeding or dischargeT Thickening/lump - breast or elsewhereI Indigestion or difficulty swallowingO Obvious change in wart or moleN Nagging cough or hoarseness

The ABCDEs of Melanoma Diagnosis
AsymmetryAsymmetry One half of the lesion is shaped differently than the otherOne half of the lesion is shaped differently than the other
BorderBorderThe border of the lesion is irregular, blurred, or ragged
The border of the lesion is irregular, blurred, or ragged
ColorColor Inconsistent pigmentation, with varying shades of brown and blackInconsistent pigmentation, with varying shades of brown and black
DiameterDiameter>6 mm, or a progressive change in size
>6 mm, or a progressive change in sizeEvolutionEvolution
History of change in the lesionHistory of change in the lesionPhotos courtesy of the American Cancer Society.

TYPES OF CANCER
& CANCER STAGING

T.C. - CASE STUDY
• 47 YOCF• Married – 19 years, 1 son• RN• PMHx – Hep C• PSHx –
• tubal ligation – 1994• Liver bx 1997• C-Spine surgery following MCA with chronic pain• R & L meniscus repairs ’97 & ‘05

TC – Case Study #2
Present Complaint• 9/2006 – developed severe LLQ abd pain –
– CT Scan showed ovarian cysts – advised to get transvaginal ultrasound.
• 11/06 – Persistent LLQ pain: Ascites + CA-125: 882 (0-35)
• Laporatomy, TAH,BSO :

TC – Cast Study - Diagnosis
• Dx: STAGE IIIb left ovarian cancer, high-grade papillary serous cystadenocardinoma with ascites, omental deposits and involvement of 1 pelvic lymph node.

TC – Case Study – Treatment
• Ports:– Intraperitoneal – Central intravenous
• Chemotherapy: cisplatin & Taxol intraperitoneal & I.V. Taxol X 6, day 1, 8, 15 (Completed 4/29/2007)

T.C. – Follow up
• Remove ports• Q 3 mo CT Scans and Tumor markers• Negative in July and October 2007• February, 2008 – increased fatigue
– CT: Nodes to chest, abdomen, pelvis– CA125 increased (69)
• Back to treatment

TC - Treatment
• Taxotere- Cisplatin – d 1, 8, 15– Allergic reaction on 2nd cycle – hypoxia, flushing,
edema – (no more cisplatin!)• Held for severe anemia & blood transfusions• Restarted Gemcitibine/Taxotere
– Decreased to 2 weeks, then every other with neupogen supplement.

TC - Current
• Last chemo 3/04/09• Ca125 – 43.6
• Palliative Study – Intervention ARNP
• Just took her to Hospice this past week… she just turned 50 yrs of age

TYPES OF CANCERS
• HEMATOLOGICAL – (Leukemias, Myelomas, etc.)
• LYMPH – (Hodgkin's, Lymphomas)
• SOLID TUMORS– Brain, Lung, Breast, Sarcomas, GI/Colon, Kidneys,
etc.

Definitions
• CARCINOMA- starts from Skin & Epithelial
• ADENOCARCINOMA - Glands
• SARCOMAS - connective tissue, muscle, bone & fat
• LYMPHOMAS & LEUKEMIAS – - lymph & hematopoietic system

Types & Sites
• Same cancer very different– Adenocarcinoma – (came from the gland, but it is
now in lung/pancreas– Glandular origin – different sites
• Sites with different cancers; i.e., Kidney– renal cell (most common)– Wilm’s tumor (usually children)– Transitional cell (similar to bladder cancer)

Metastasis
• Angiogenesis – (cuts off blood supply, lots of side effects)– new blood supply > 2mm
• Motility– Travel from primary
• Cell Adhesion– Proteins mediate adhesion
• Proteolytic enzymes– Secrete to cross barriers
• Immunogenicity (strong & immune)

Laboratory
• Hematology - anemia, blasts, lymphs, etc.• Chemistry - Kidney, Liver, • Tumor Markers
– PSA* - CA 72-4 - CA 15-3– CEA - CA 50 - AFP– CA 125* - CA 19-9– *Screening + monitoring– CA125 = if # going down we know the chemo is
working

MORE LABORATORY
• Cytology,• Bone marrow examination, • Biopsy results

Biopsy Open or Needle
• Breast• Liver• Fat aspirate• Bone Marrow Biopsy• Anywhere tumor can be easily accessed• OR• EUS (Endoscopic Ultrasound)• Other – with surgical excision

Sentinel Node Biopsy
• Used with original surgical removal of tumor• Lymphatics do not always follow anatomical
patterns – must map• Mapping of lymphatics to find sentinel node• radiocolloid + intraoperative blue dye
improves accuracy of mapping

Primary vs Metastatic
• Liver Cancer (call it the original)
• Brain Cancer
• Bone Cancer
• Lymph

Lymphatic Metastases
• Spread first through afferent channels• Sentinel Lymph Node is first node along those
channels• SLNs are immuno-suppressed and proven to
be sites of early metastases (signal lymph nodes)
• Removal of all nodes difficult, impossible to bx all & cause many patient problems


Cancer Staging
• Very important to treatment choices
– Describes how far cancer has spread
– Place with similar prognosis and treatment in the same staging group

STAGING
• Recurrent (locally vs distant)• Stage 0 In situ (still in original cell)
• Stage I limited to tissue of origin
• Stage II limited local spread• Stage III extensive local & regional
spread
• Stage IV metastasis

TNM STAGING
• Define I through IV Grouping• Specific to each cancer, but ---
• T – Tumor (T0 – T4)• N – Lymph Nodes (N0 – N4)• M – Metastasis (M0 or M1)

Overall
– Definitions different for each cancer, (some have IIa, IIb)
– Some IIIa vs IIIb huge difference– Stage IV in some cancers curable, treatable; others
not– Leukemia, lymphomas, hematological
• Defined by blood count, extent of bone marrow involvement or presence/absence of symptoms.
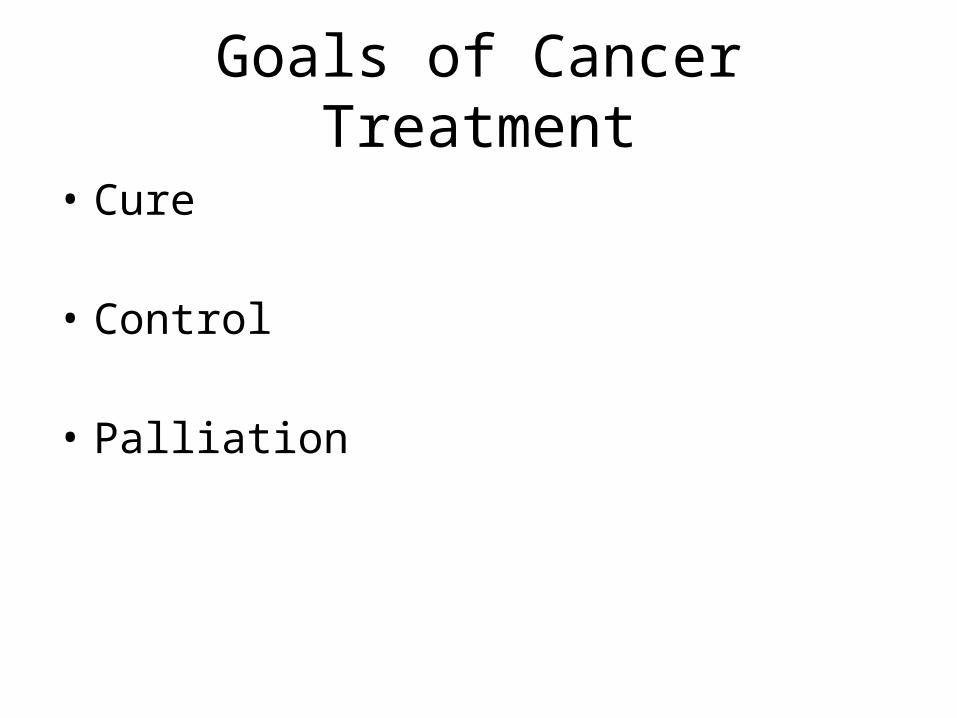
Goals of Cancer Treatment
• Cure
• Control
• Palliation

Treatment Options
• Dependent upon – Diagnosis– Staging
• Biopsy results• Radiological Studies
– CT, MRI, PET
• Laboratory Tests
– Pt age, physical condition, prognosis. preferences

Treatment Options
• Team decision with strong patient/family input• Protocols dependent upon diagnosis and staging and
history• All research based and approved by FDA or under
research protocol • Dependent upon patient age, health, prognosis• Best treatment often research protocol
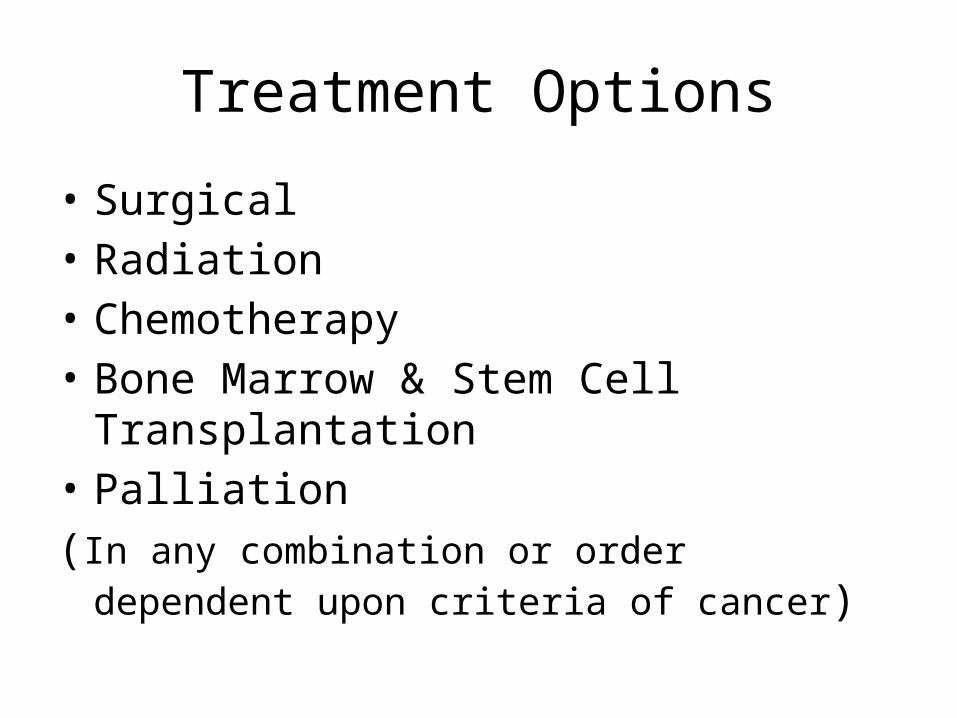
Treatment Options
• Surgical• Radiation• Chemotherapy• Bone Marrow & Stem Cell Transplantation• Palliation(In any combination or order dependent upon criteria
of cancer)

Surgical
• Diagnosis/Staging• Cure/Control
– Margin of tissue to cure, preventive, debulking,lumpectomy, thyroidectomy, resection (ostomy for palliation or cure)
• Palliation of symptoms• Rehabilitation
– Reconstruction, continent ostomies

Radiation Therapy
• External, Internal, brachy, seeds• Cure
– Alone and in combination• Control
– For periods of time• Palliation
– Pain, obstruction, compression, bleeding

Chemotherapy
• Primary– No other effective treatment available– Induction (leukemias, etc)
• Neoadjuvant – Prior to alternative treatment
• Adjuvant– Systemic therapy along with surgery, radiation, etc.
(Concurrently or sequentially)

Chemotherapy
• Fairly recent (1950’s – nitrogen mustard)• Not completely understood• Need to know cell biology• Cell cycle made up of five phases
– Time for different cellular processes that result in reproduction or death of cell

Cancer Drugs
• Alkylating Agents• Anti-Tumor Antibiotics• Antimetabolites• Plant Derivatives• Hormones and Hormone Inhibitors• Angiogenesis inhibitors

PRINCIPLES OF COMBINATION DRUGS
• Drugs with single agent activity• Avoid drugs with overlapping toxicities• Administer at optimal dose and schedule (as
determined by clinical trials)• At regular intervals and minimize time
between cycles

Cell Cycle
• Only some cells actively proliferating• 5 Phases – periods for cellular processes
– G1 – RNA & protein synthesis– S - DNA replicated (short)– G2 – after DNA & before cell division– M - Mitosis (cell division)– G0 - resting (dormant)


Anti-metabolitesMethotrexate, 5FU; Mercaptopurine, cytarabine, topetecan
Biologic Response modulators:Asparaginase; Pegaspargase
Non Cell Cycle Specific:
Alkylating agents; anti-tumor antibiotics; hormones, hormone inhibitors
Plant DerivativesVincristineVinblastine Bleomycin,
Etopaside, Paclitaxel

Common Toxicities
(FRIENDLY FIRE)
• Myelosuppression– Can be life threatening (neutropenia)
• Nausea & Vomiting– Causes of stopping therapy (much better now)
• Mucous Membrane Ulceration– Alimentary tract (Diarrhea also)
• Alopecia

Toxicities - Myelosuppression
• Most common dose-limiting side effect• (Try to give the most we can w/out infection)
– WBC/ANC – Neutropenia –– Infection Risk
• Instruct in precautions – vegetables, fruit, crowds
– Take temperature 2X day• Antibiotics??

Myelosuppression - Thrombocytopenia
– Decreased Platelet Count – at risk for bleeding– Monitor bleeding, bruising, petechiae– No IM injections; pressure for SQ, etc.– No aspirin, no rectal suppositories– Soft toothbrush, no water picks, dental floss– Electric shaving devices – no razors– Safety important

ANEMIA - Symptoms
• Easily fatigued, weakness, listlessness• Dyspnea on exertion• Pallor (conjunctiva, nail beds)• Decreased thought processes• Headache, dizziness• Hypotension• Tachycardia• Tachypnea

Nursing Interventions
• Assessment/Instruction/monitoring/– Mouth Care– Regular medication administration of anti-emetics, anti-diarrheals– Analgesics– Skin Care
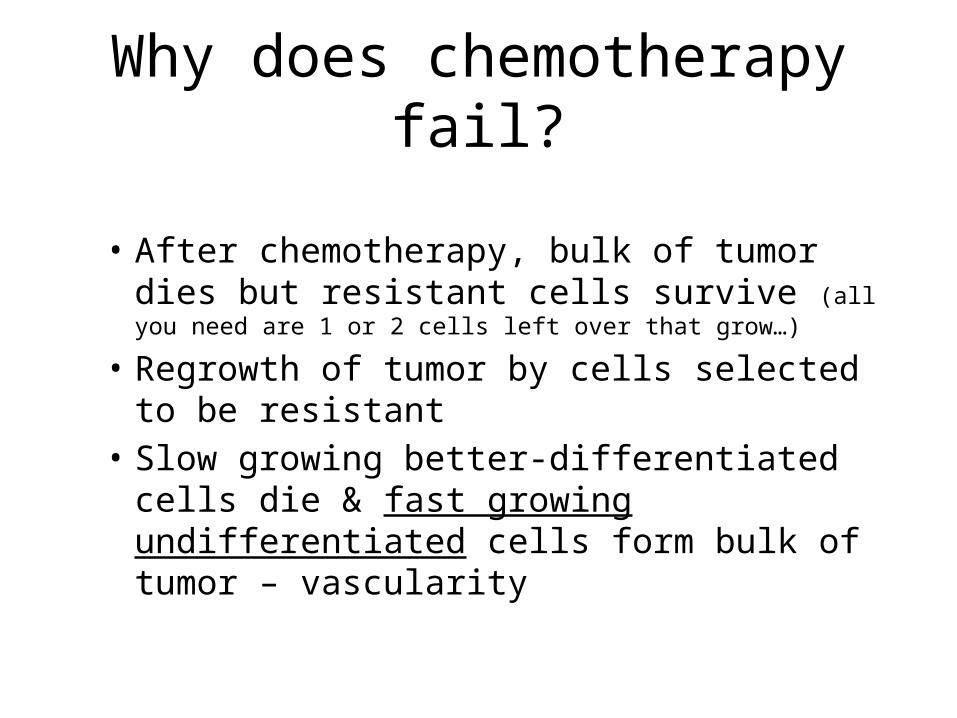
Why does chemotherapy fail?
• After chemotherapy, bulk of tumor dies but resistant cells survive (all you need are 1 or 2 cells left over that grow…)
• Regrowth of tumor by cells selected to be resistant
• Slow growing better-differentiated cells die & fast growing undifferentiated cells form bulk of tumor – vascularity

PROGRESSION
• Side-effects of chemotherapy/treatment do not all disappear
• Chemotherapy resistance
• Tumor regrows – (doubling time)

PROGRESSION
• Tumor Necrosis Factor – (Inflammatory response)
– Cytokines (small protein hormones made by WBCs (neutrophils, eisonphils, lymphocites, etc – increase immune response) – causes fever
– Cause inflammation– Increases resting energy expenditure– Increases urinary nitrogen – Decreases Protein
• Cachexia – all side effects - Death

Late Effects
• CNS - thought, sight, hearing• Immune – • Cardiovascular – anthracyclines injure the heart• Pulmonary – fibrosis• Gastrointestinal• Renal• Endocrine - Reproductive• Musculoskeletal• Second Malignancy

CANCER FREE – THEN WHAT?
• 10,000,000 Cancer Survivors• Where do we go from here• Pediatric• Adult

Other thoughts
• Physical• Psychosocial• Financial• Stigma