Embed Size (px)
Citation preview
NUTRITION ASSESSMENT REPORT
MIDDLE AND LOWER SHABELLE IDPs, AGROPASTORAL AND RIVERINE LIVELIHOOD SYSTEMS
SHABELLE VALLEY REGIONS, SOMALIA
Food Security Analysis Unit (FSAU/FAO) United Nation Children Funds (UNICEF)
November 2008
Shabelle IDPs, Agropastoral and Riverine Nutrition Assessments Report – November 2008…….. FAO/FSAU, UNICEF, WFP & Partners
2
Table of Contents Page
ACKNOWLEDGEMENTS ……………………………………………………………………………………………………………...… 3
EXECUTIVE SUMMARY ……………………………………………………………………………………………………………….…. 4
SUMMARY OF FINDINGS ……………………………………………………………………………………………………………….. 7
1.0 INTRODUCTION ………………………………………………………………………………………………………………………. 8
2.0 OBJECTIVES …………………………………………………………………………………………………………………………… 10
3.0 METHODOLOGY …………………………………………………………………………………………………………………….. 11
4.0 ASSESSMENT RESULTS ………………………………………………………………………………………………………….. 12
4.1 Household Characteristics of Study Population …………………………………………………………….. 12
4.2 Access to Water, Sanitation and Health Facility …………………………………………………………… 13
4.3 Household Food Security ………………………………………………………………………………………………. 14
4.4 Morbidity, Health Programmes and Health Seeking Behaviour…………………………………… 17
4.5 Feeding Practices ………………………………………………………………………………………………………….. 18
4.6 Nutrition Situation ……………………………………………………………………………………………………… 20
4.7 Mortality …………………………………………………………………………………………………………………………… 24
4.8 Qualitative Information …………………………………………………………………………………………………… 25
5. DISCUSSION ……………………………………………………………………………………………………………………………. 27
6. RECOMMENDATIONS ……………………………………………………………………………………………………………… 29
7. APPENDICES …………………………………………………………………………………………………………………………… 30
8. REFERENCES …………………………………………………………………………………………………………………………. 45
Shabelle IDPs, Agropastoral and Riverine Nutrition Assessments Report – November 2008…….. FAO/FSAU, UNICEF, WFP & Partners
3
Acknowledgement The FSAU acknowledges the participation of UNICEF, WFP, COSV, CARE, Mercy USA, INTERSOS, SRCS,
Muslim Aid, SACIID, TRG, ZAMZAM, SHAWO and New Ways in the nutrition assessments. FSAU provided one
assessment coordinator and three supervisors; led in the training of the assessment team, coordinated data
collection, entry and analysis; funded the personnel expenses for the local NGOs, questionnaires and
stationery; and produced the report. UNICEF funded assessment vehicles and provided the anthropometric
equipment. WFP provided one supervisor and one vehicle. COSV, CARE, Mercy USA, INTERSOS, SRCS,
Muslim Aid, TRG, ZAMZAM, SHAWO and New Ways all participated in the assessments by providing some of
the supervisors, team leaders, nurses and/or enumerators. The contribution of the local authorities for
ensuring the survey teams security during the fieldwork is gratefully appreciated.
The data could not have been obtained without the co-operation and support of the communities assessed,
especially the mothers and caregivers who took time off their busy schedules to respond to the
interviewers. Their involvement is highly appreciated.
FSAU also expresses their sincere appreciation to the entire assessment team for the high level of
commitment and diligence demonstrated during all stages of the assessment.
Shabelle IDPs, Agropastoral and Riverine Nutrition Assessments Report – November 2008…….. FAO/FSAU, UNICEF, WFP & Partners
4
EXECUTIVE SUMMARY Lower and Middle Shabelle regions are amongst the most highly populated regions in Southern Somalia, with over 1.2 million persons in twelve districts (UNDP 2005 population figures). Shabelle valley also bears the highest proportion (36%) of acute malnutrition caseloads in Somalia with about 75,740 children wasted (WHZ<-2 or oedema) based on the 2008 consolidated caseload estimation extrapolated from survey data. The regions support a total of seven livelihood zones namely Central Regions Agropastoral, Shabelle Riverine, Southern Agropastoral, Southern Inland Pastoral, Lower and Middle Shabelle Agropastoral Rainfed, Lower and Middle Shabelle Irrigated and South East Pastoral. The Riverine and Agro pastoral livelihood zones are dominant (See Map 1). Shabelle has in the recent past (from February 2007) experienced multiple shocks and intense armed conflict with devastating effects including trade disruptions, massive displacement, four previous seasons of below normal cereal production, hyper inflation, reduced labor earnings and education. The nutrition situation has however improved in Shabelle regions in the last two seasons, the mitigating factors mainly being a favorable off-season crop harvest and substantial humanitarian response including food and cash transfer, increased access to safe water and sanitation facilities in the IDP settlements, which has facilitated control of acute watery diarrhea. Between 1st and 11th November 2008, FSAU and partners1 conducted three inter-agency nutrition assessments in IDPs2, Agropastoral and Riverine Livelihood Zones in Middle and Lower Shabelle Regions in Southeast Somalia. This was in response to the need to monitor the levels of acute malnutrition for the different livelihoods and to inform on the intervention responses for the region following a series of shocks that led to Serious to Critical nutrition levels in earlier assessments conducted since May 2007 (Fig 2). The main objective of the survey was to determine the level of wasting among children aged 6-59 months and analyze the possible factors contributing to malnutrition, such as dietary diversity, morbidity, care practices and assess the mortality rates in the specific livelihood systems in the regions. Using a two-stage PPS sampling methodology, 25, 26 and 25 clusters were selected for both nutrition and mortality assessments from the IDPs settlements, Agro pastoral and riverine livelihoods respectively. A total of 1986 children (667 from IDPs, 681 from agro pastoral and 638 from riverine livelihoods) aged 6-59 months were assessed from 373; 382 and 374 households, respectively. Results indicate that the nutrition situation is Serious (GAM rate of 10-15%) in the three assessments showing a significant improvement among the agropastoral and IDP populations from the Critical levels recorded in the last assessment in May 2008, but no statistically significant change in the riverine population. The retrospective crude and U5 mortality rates (CMR and U5MR) were similar to the May ’08 studies, indicating acceptable levels in two of the three assessments and alert in the other (Table 1.1). Shabelle IDPs in Afgoye corridor and Merka reported a GAM rate (weight for height <-2 Z score or oedema) of 12.3% (9.7-15.5) and SAM rate of 2.8% (1.7-4.8%) with seven (1.0%) cases of oedema. This indicates a slight improvement from the previous GAM rate of 15.0% (11.5-18.4%), but a significant increase in the proportion of severely malnourished children from the 1.0% (0.2-1.8) including four (0.5%) oedema cases reported in the May 2008 assessment3. The deterioration in SAM rates is likely as a result of continuing influx of IDPs from Mogadishu. Although the GAM results appear lower than the rates reported among the IDP population assessed in May 2008, and indicates a general improvement from critical levels experienced over the previous one year to serious levels, the change is not statistically significant (p>0.05). In addition, 90-day retrospective mortality assessments reported respective Crude and Under Five year mortality rates of 0.70 (0.37-1.34) and 1.69 (0.90-3.17) among the IDPS which indicate below alert levels according to WHO classification and no change from CMR and U5MR of 0.96 (0.12-1.81) and 1.47 (0.96-1.99) respectively reported in the previous assessment.
1 UNICEF, WFP, COSV, CARE, Mercy USA, INTERSOS, ZAMZAM, TRG, SACIID, SRCS, Muslim Aid, SHAWO and New Ways 2 There were about 488,088 internally displaced persons in the Afgoye corridor and in Merka during the assessment (OCHA, Nov ’08. 3 FSAU Nutrition Update, June 2008.
Shabelle IDPs, Agropastoral and Riverine Nutrition Assessments Report – November 2008…….. FAO/FSAU, UNICEF, WFP & Partners
5
Shabelle Agropastoral reported a GAM rate of 12.5% (CI: 10.6-14.6) and a SAM rate of 2.2% (1.3-3.6) including three (0.4%) oedema cases. These results indicate an improvement to a serious nutrition situation from the Critical level of acute malnutrition in the May 2008 assessment, where a GAM rate of 18.1% (14.4-21.8) and a SAM rate of 3.5% (1.7-5.3) including seven oedema cases (0.9%) were reported. The Crude and U5 Mortality rates of 0.91 (0.16-1.34) and 1.78 (1.05-2.98) respectively, among the agro pastoral population in Shabelle regions are acceptable according WHO standards. Shabelle Riverine Assessment reported a GAM rate of 10.8% (8.6-13.5) and a SAM rate of 2.5% (1.4-4.4) that included seven (1.1%) oedema cases, indicating no significant change from the May 2008 assessment which reported a GAM rate of 13.7% (9.6-17.7) and SAM rate of 3.8% (1.8-5.9) including two (0.3%) oedema cases. The Crude and under five year mortality rates of 1.01 (0.66-1.55) and 2.15 (1.17-3.94) were reported respectively, both levels above the alert threshold of 1/10,000/day and 2/10,000/day (WHO standards) and illustrating an underlying acute crisis in these regions. Diarrheal diseases, birth complications and physical injuries were reported as the main causes of death. The proportions of children who had suffered from one or more communicable childhood diseases during the two weeks prior to the assessment were 47.8%, 37.7% and 48.9% in the assessed IDPs, agropastoral and riverine populations respectively. As shown on Table 1, the incidence of reported diarrhoea in IDPs, Agropastoral and Riverine populations (21.0%; 13.7% and 15.5% respectively) in the two weeks prior to the assessment were high. High incidences of ARI (27.0%, 21.3% and 27.1% respectively) and febrile illnesses (22.9%, 16.3% and 18.0% in the IDPs, Agropastoral and Riverine populations respectively) were also reported in the three assessments. These levels were consistent with seasonal morbidity patterns recorded from the health facilities. Rapid Diagnostic Tests (RDT) conducted for malaria however reported very low (<1%) prevalence rates of 0.6% (N=1310), 0.1% (N=1612) and 0.8% (N=1257) positive for Plasmodium falciparum in the IDP, agropastoral and riverine population respectively. Analysis has shown strong association between acute malnutrition and morbidity rates. Children who were reported to have been ill within two weeks prior to the assessment were more likely to be acutely malnourished (p<0.05). For example, in the riverine livelihood, children who had reportedly fallen ill were nearly 3 times more likely to be acutely malnourished than those who were well (RR=2.84; CI: 1.54-5.26), and children who reportedly had diarrhoea were nearly 3.2 times more likely to be acutely malnourished than those who did not reportedly have diarrhoea (RR=3.2; CI: 1.72-6.10). Past studies have shown that vitamin A greatly improves the immunity of individuals; hence reduce the disease burden of a population. However, as shown in table 3, Vitamin A supplementation as well as polio and measles immunization status, were far below the WHO recommended coverage of 95%. While diseases continue to predispose children to malnutrition, concern remains on access to safe water, sanitation, access to health services and low coverage of health programmes and poor child care and feeding practices. With the exception of the IDPs, very low proportion of the households had access to safe drinking water (11.0% and 27.5%), sanitation facilities (28.8% and 48.1%) or health facilities (20.7% and 26.2%) in agropastoral and riverine respectively. Even though interventions targeting the IDP population have significantly improved access to safe drinking water (74.5%), improved sanitation facilities (89.0%) and health facilities (55.2%) sustained efforts are required to provide further improvements and to mitigate the risks to morbidity and malnutrition. Although good Deyr ’08/09 rains were reported in the Shabelle regions resulting into favourable food security indicators such as improved milk consumption, dietary diversity and increased agricultural produce (off-season yield) among the riverine and agropastoral populations, the prices for foods and other essential commodities, though declining are still high, limiting access by the poor households. Dietary diversity was reportedly high among all the three livelihood groups (96.0%, 92.4% and 97.6% in IDPs, agropastoral and riverine groups respectively). Overall, the Shabelle IDPs, agropastoral and riverine populations have reported a sustained or improved nutrition situation. The improved dietary diversity across the three livelihood groups is undoubtedly a
Shabelle IDPs, Agropastoral and Riverine Nutrition Assessments Report – November 2008…….. FAO/FSAU, UNICEF, WFP & Partners
6
contributing factor. Other influences include a controlled AWD outbreak and humanitarian support, such as cash-for-work and food assistance programmes. However, issues of child care and feeding practices continue to compromise the nutritional status of children, as is access to sanitation and safe water in the agropastoral and riverine populations. The IDP population, despite showing a slight improvement in the nutrition levels, still face a precarious situation. This demonstrates the need for continued support to the IDPs who recently fled the increased civil insecurity in Mogadishu and surrounding areas. Specific recommendations include: Immediate Interventions
• Improving coverage for health programmes, especially for measles vaccination and vitamin A supplementation. Vigorous campaigns are required in the Shabelle regions especially among the agropastoral and riverine communities.
• Rehabilitation of acutely malnourished children through selective feeding programs and active case finding until household food security is restored and critical public health issues are addressed. All options to address this through effective and non-damaging measures need to be considered. Capacity building of the existing health facilities and the community to manage acutely malnourished children could be explored.
• There is need to focus on programmes that improve and sustain dietary diversity and consumption of micronutrient rich foods. Food distribution for pulses and micronutrient enriched oil could help improve dietary diversity especially among the IDPs.
• Intervention programmes on water, sanitation and hygiene practices including health education are essential.
Long term Interventions
• Rehabilitation/protection of water systems including the well and water catchments (such as capping of wells) in anticipation of seasonal flooding. The community should be trained on sanitation of the water systems
• There is need for establishment or strengthening of health facilities and satellite services especially in rural villages where there are no health facilities
• Intensifying health and nutrition education activities at the household level to address care concerns, targeting mothers, and other caregivers. The main areas of focus should include promoting exclusive breastfeeding, appropriate infant and young child feeding, dietary diversification, and improvements in household hygiene including health care practices.
• Peace building and conflict resolution remain the most crucial factors for the restoring and sustaining livelihoods in the Shabelle regions and Somalia as a whole, including returning of the displaced persons back to their homes. Efforts being made within and outside the Shabelle region to this effect are greatly encouraged.
Shabelle IDPs, Agropastoral and Riverine Nutrition Assessments Report – November 2008…….. FAO/FSAU, UNICEF, WFP & Partners
7
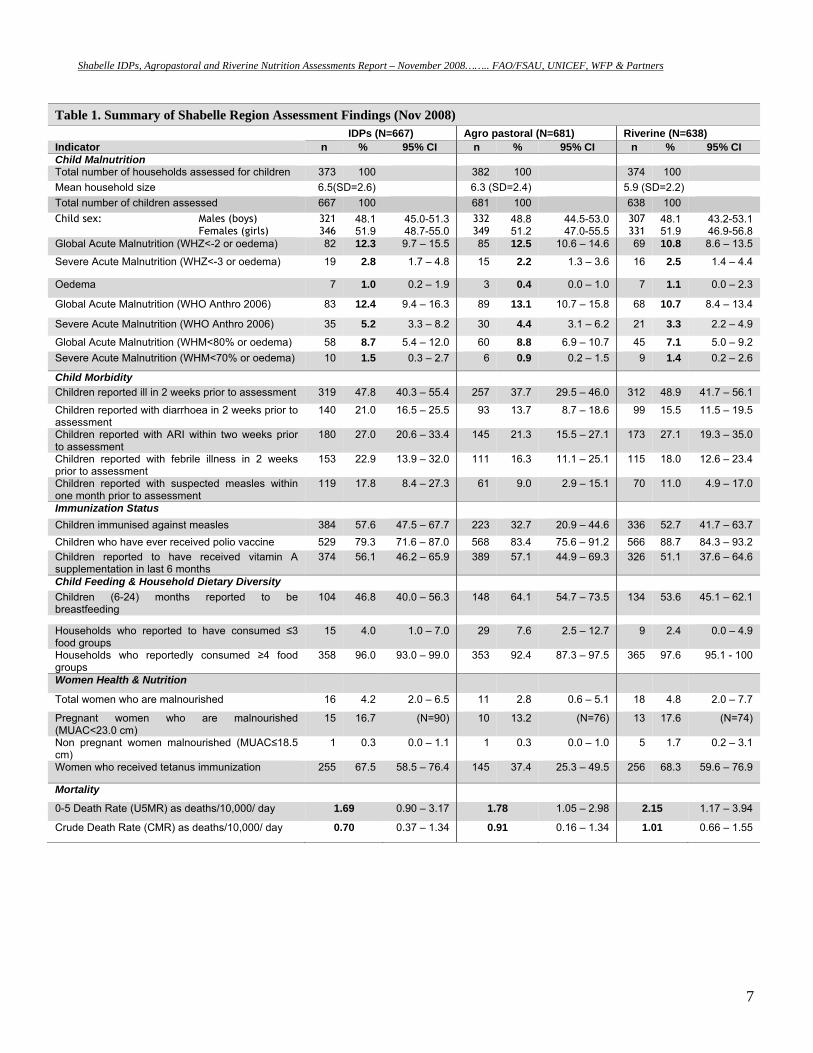
Table 1. Summary of Shabelle Region Assessment Findings (Nov 2008) IDPs (N=667) Agro pastoral (N=681) Riverine (N=638) Indicator n % 95% CI n % 95% CI n % 95% CI Child Malnutrition Total number of households assessed for children 373 100 382 100 374 100 Mean household size 6.5(SD=2.6) 6.3 (SD=2.4) 5.9 (SD=2.2) Total number of children assessed 667 100 681 100 638 100 Child sex: Males (boys) Females (girls)
321 346
48.1 51.9
45.0-51.3 48.7-55.0
332 349
48.8 51.2
44.5-53.0 47.0-55.5
307 331
48.1 51.9
43.2-53.1 46.9-56.8
Global Acute Malnutrition (WHZ<-2 or oedema) 82 12.3 9.7 – 15.5 85 12.5 10.6 – 14.6 69 10.8 8.6 – 13.5
Severe Acute Malnutrition (WHZ<-3 or oedema) 19 2.8 1.7 – 4.8 15 2.2 1.3 – 3.6 16 2.5 1.4 – 4.4
Oedema 7 1.0 0.2 – 1.9 3 0.4 0.0 – 1.0 7 1.1 0.0 – 2.3
Global Acute Malnutrition (WHO Anthro 2006) 83 12.4 9.4 – 16.3 89 13.1 10.7 – 15.8 68 10.7 8.4 – 13.4
Severe Acute Malnutrition (WHO Anthro 2006) 35 5.2 3.3 – 8.2 30 4.4 3.1 – 6.2 21 3.3 2.2 – 4.9
Global Acute Malnutrition (WHM<80% or oedema) 58 8.7 5.4 – 12.0 60 8.8 6.9 – 10.7 45 7.1 5.0 – 9.2 Severe Acute Malnutrition (WHM<70% or oedema) 10 1.5 0.3 – 2.7 6 0.9 0.2 – 1.5 9 1.4 0.2 – 2.6
Child Morbidity Children reported ill in 2 weeks prior to assessment 319 47.8 40.3 – 55.4 257 37.7 29.5 – 46.0 312 48.9 41.7 – 56.1
Children reported with diarrhoea in 2 weeks prior to assessment
140 21.0 16.5 – 25.5 93 13.7 8.7 – 18.6 99 15.5 11.5 – 19.5
Children reported with ARI within two weeks prior to assessment
180 27.0 20.6 – 33.4 145 21.3 15.5 – 27.1 173 27.1 19.3 – 35.0
Children reported with febrile illness in 2 weeks prior to assessment
153 22.9 13.9 – 32.0 111 16.3 11.1 – 25.1 115 18.0 12.6 – 23.4
Children reported with suspected measles within one month prior to assessment
119 17.8 8.4 – 27.3 61 9.0 2.9 – 15.1 70 11.0 4.9 – 17.0
Immunization Status Children immunised against measles 384 57.6 47.5 – 67.7 223 32.7 20.9 – 44.6 336 52.7 41.7 – 63.7 Children who have ever received polio vaccine 529 79.3 71.6 – 87.0 568 83.4 75.6 – 91.2 566 88.7 84.3 – 93.2 Children reported to have received vitamin A supplementation in last 6 months
374 56.1 46.2 – 65.9 389 57.1 44.9 – 69.3 326 51.1 37.6 – 64.6
Child Feeding & Household Dietary Diversity Children (6-24) months reported to be breastfeeding
104 46.8 40.0 – 56.3 148 64.1 54.7 – 73.5 134 53.6 45.1 – 62.1
Households who reported to have consumed ≤3 food groups
15 4.0 1.0 – 7.0 29 7.6 2.5 – 12.7 9 2.4 0.0 – 4.9
Households who reportedly consumed ≥4 food groups
358 96.0 93.0 – 99.0 353 92.4 87.3 – 97.5 365 97.6 95.1 - 100
Women Health & Nutrition
Total women who are malnourished 16 4.2 2.0 – 6.5 11 2.8 0.6 – 5.1 18 4.8 2.0 – 7.7
Pregnant women who are malnourished (MUAC<23.0 cm)
15 16.7 (N=90) 10 13.2 (N=76) 13 17.6 (N=74)
Non pregnant women malnourished (MUAC≤18.5 cm)
1 0.3 0.0 – 1.1 1 0.3 0.0 – 1.0 5 1.7 0.2 – 3.1
Women who received tetanus immunization 255 67.5 58.5 – 76.4 145 37.4 25.3 – 49.5 256 68.3 59.6 – 76.9
Mortality
0-5 Death Rate (U5MR) as deaths/10,000/ day 1.69 0.90 – 3.17 1.78 1.05 – 2.98 2.15 1.17 – 3.94
Crude Death Rate (CMR) as deaths/10,000/ day 0.70 0.37 – 1.34 0.91 0.16 – 1.34 1.01 0.66 – 1.55
Shabelle IDPs, Agropastoral and Riverine Nutrition Assessments Report – November 2008…….. FAO/FSAU, UNICEF, WFP & Partners
8
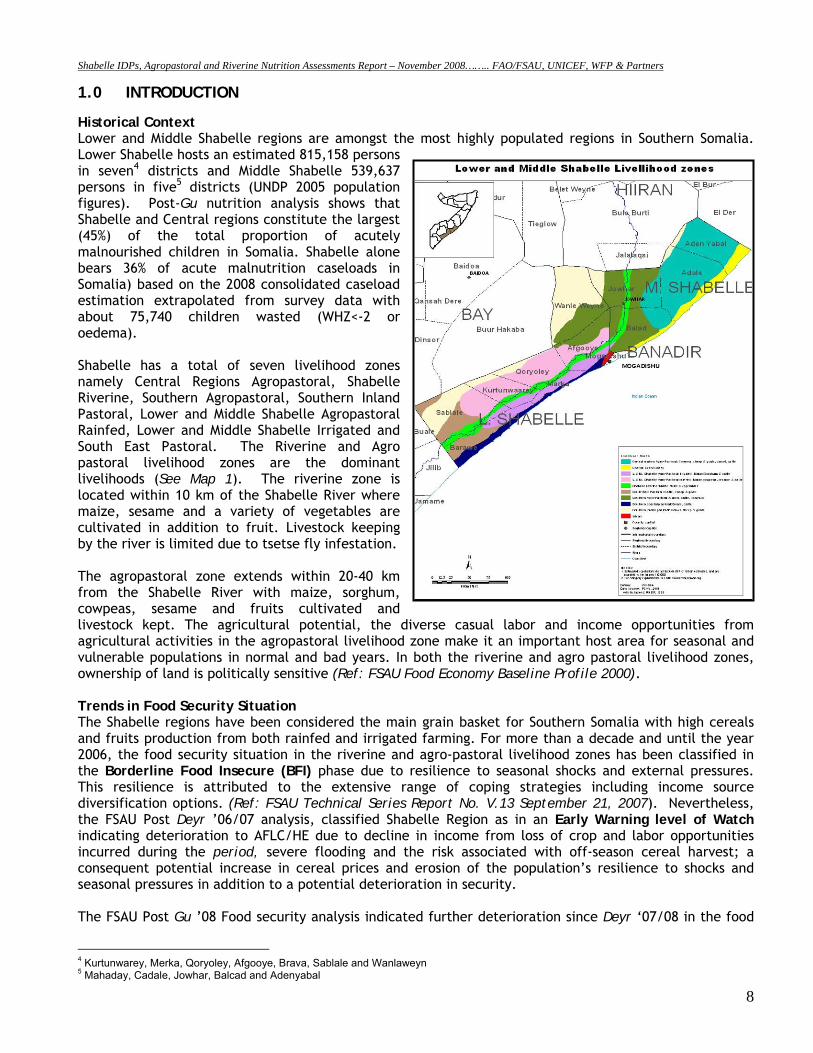
1.0 INTRODUCTION Historical Context Lower and Middle Shabelle regions are amongst the most highly populated regions in Southern Somalia. Lower Shabelle hosts an estimated 815,158 persons in seven4 districts and Middle Shabelle 539,637 persons in five5 districts (UNDP 2005 population figures). Post-Gu nutrition analysis shows that Shabelle and Central regions constitute the largest (45%) of the total proportion of acutely malnourished children in Somalia. Shabelle alone bears 36% of acute malnutrition caseloads in Somalia) based on the 2008 consolidated caseload estimation extrapolated from survey data with about 75,740 children wasted (WHZ<-2 or oedema). Shabelle has a total of seven livelihood zones namely Central Regions Agropastoral, Shabelle Riverine, Southern Agropastoral, Southern Inland Pastoral, Lower and Middle Shabelle Agropastoral Rainfed, Lower and Middle Shabelle Irrigated and South East Pastoral. The Riverine and Agro pastoral livelihood zones are the dominant livelihoods (See Map 1). The riverine zone is located within 10 km of the Shabelle River where maize, sesame and a variety of vegetables are cultivated in addition to fruit. Livestock keeping by the river is limited due to tsetse fly infestation. The agropastoral zone extends within 20-40 km from the Shabelle River with maize, sorghum, cowpeas, sesame and fruits cultivated and livestock kept. The agricultural potential, the diverse casual labor and income opportunities from agricultural activities in the agropastoral livelihood zone make it an important host area for seasonal and vulnerable populations in normal and bad years. In both the riverine and agro pastoral livelihood zones, ownership of land is politically sensitive (Ref: FSAU Food Economy Baseline Profile 2000). Trends in Food Security Situation The Shabelle regions have been considered the main grain basket for Southern Somalia with high cereals and fruits production from both rainfed and irrigated farming. For more than a decade and until the year 2006, the food security situation in the riverine and agro-pastoral livelihood zones has been classified in the Borderline Food Insecure (BFI) phase due to resilience to seasonal shocks and external pressures. This resilience is attributed to the extensive range of coping strategies including income source diversification options. (Ref: FSAU Technical Series Report No. V.13 September 21, 2007). Nevertheless, the FSAU Post Deyr ’06/07 analysis, classified Shabelle Region as in an Early Warning level of Watch indicating deterioration to AFLC/HE due to decline in income from loss of crop and labor opportunities incurred during the period, severe flooding and the risk associated with off-season cereal harvest; a consequent potential increase in cereal prices and erosion of the population’s resilience to shocks and seasonal pressures in addition to a potential deterioration in security. The FSAU Post Gu ’08 Food security analysis indicated further deterioration since Deyr ‘07/08 in the food
4 Kurtunwarey, Merka, Qoryoley, Afgooye, Brava, Sablale and Wanlaweyn 5 Mahaday, Cadale, Jowhar, Balcad and Adenyabal
Shabelle IDPs, Agropastoral and Riverine Nutrition Assessments Report – November 2008…….. FAO/FSAU, UNICEF, WFP & Partners
9
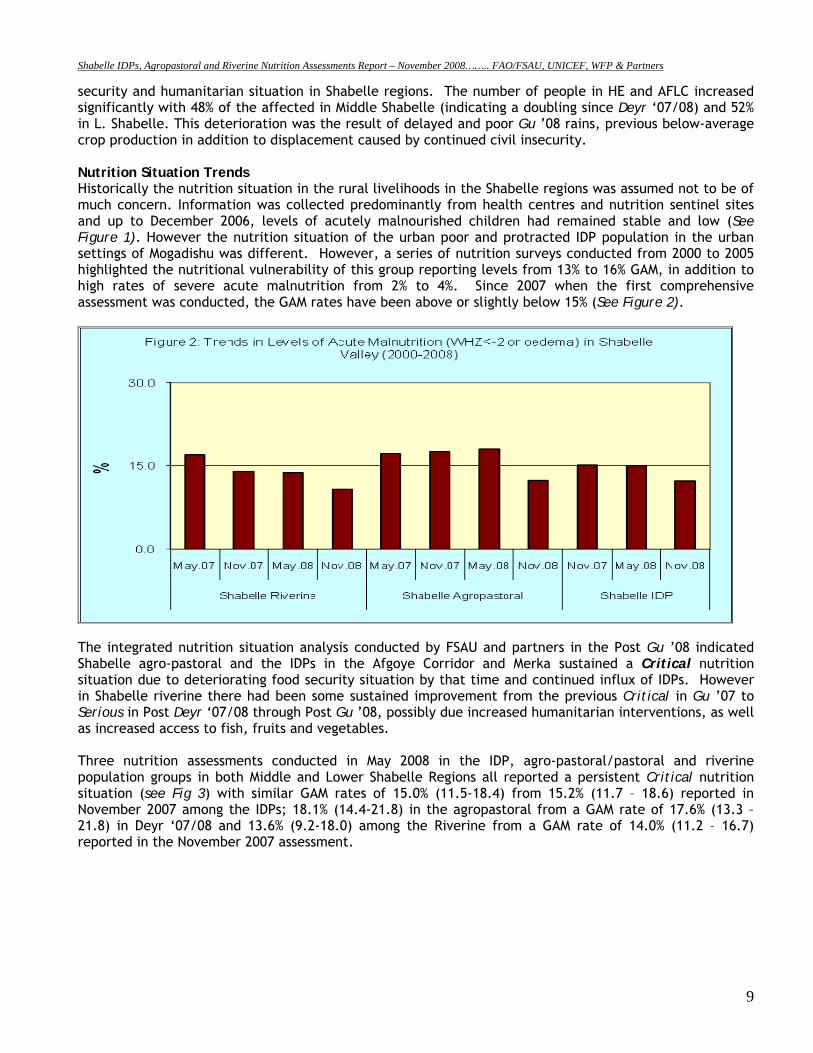
security and humanitarian situation in Shabelle regions. The number of people in HE and AFLC increased significantly with 48% of the affected in Middle Shabelle (indicating a doubling since Deyr ‘07/08) and 52% in L. Shabelle. This deterioration was the result of delayed and poor Gu ’08 rains, previous below-average crop production in addition to displacement caused by continued civil insecurity. Nutrition Situation Trends Historically the nutrition situation in the rural livelihoods in the Shabelle regions was assumed not to be of much concern. Information was collected predominantly from health centres and nutrition sentinel sites and up to December 2006, levels of acutely malnourished children had remained stable and low (See Figure 1). However the nutrition situation of the urban poor and protracted IDP population in the urban settings of Mogadishu was different. However, a series of nutrition surveys conducted from 2000 to 2005 highlighted the nutritional vulnerability of this group reporting levels from 13% to 16% GAM, in addition to high rates of severe acute malnutrition from 2% to 4%. Since 2007 when the first comprehensive assessment was conducted, the GAM rates have been above or slightly below 15% (See Figure 2).
The integrated nutrition situation analysis conducted by FSAU and partners in the Post Gu ’08 indicated Shabelle agro-pastoral and the IDPs in the Afgoye Corridor and Merka sustained a Critical nutrition situation due to deteriorating food security situation by that time and continued influx of IDPs. However in Shabelle riverine there had been some sustained improvement from the previous Critical in Gu ’07 to Serious in Post Deyr ‘07/08 through Post Gu ’08, possibly due increased humanitarian interventions, as well as increased access to fish, fruits and vegetables. Three nutrition assessments conducted in May 2008 in the IDP, agro-pastoral/pastoral and riverine population groups in both Middle and Lower Shabelle Regions all reported a persistent Critical nutrition situation (see Fig 3) with similar GAM rates of 15.0% (11.5-18.4) from 15.2% (11.7 – 18.6) reported in November 2007 among the IDPs; 18.1% (14.4-21.8) in the agropastoral from a GAM rate of 17.6% (13.3 – 21.8) in Deyr ‘07/08 and 13.6% (9.2-18.0) among the Riverine from a GAM rate of 14.0% (11.2 – 16.7) reported in the November 2007 assessment.
Shabelle IDPs, Agropastoral and Riverine Nutrition Assessments Report – November 2008…….. FAO/FSAU, UNICEF, WFP & Partners
10
2.0 ASSESSMENT OBJECTIVES The overall objective of the three livelihood-based assessments was to establish the extent and severity of acute malnutrition, determine the causes of malnutrition and to monitor the trends of acute malnutrition in Middle and Lower Shabelle regions. Specific Objectives were:
1. To estimate the level of acute malnutrition and nutritional oedema among children aged 6-59 months in the three livelihood groups of IDPs, Agropastoral and Riverine in Middle and Lower Shabelle regions.
2. To estimate the level of acute malnutrition among women aged 15-49 years in the three livelihood groups of IDPs, Agropastoral and Riverine in Shabelle valley.
3. To identify factors influencing nutrition status of the children in the three livelihood groups of IDPs, Agropastoral and Riverine in Middle and Lower Shabelle regions.
4. To estimate the prevalence of some common diseases (measles, diarrhoea, febrile illnesses, malaria and ARI) in the three livelihood groups of IDPs, Agropastoral and Riverine in Shabelle valley.
5. To estimate the measles and polio vaccination and Vitamin A supplementation coverage among children in the three livelihood groups of IDPs, Agropastoral and Riverine in the Shabelle regions.
6. To estimate the crude and under-five mortality rates in the three livelihood groups of IDPs, Agropastoral and Riverine in Middle and Lower Shabelle regions.
Shabelle IDPs, Agropastoral and Riverine Nutrition Assessments Report – November 2008…….. FAO/FSAU, UNICEF, WFP & Partners
11
3.0 METHODOLOGY Three cross-sectional assessments (using PPS) were conducted concurrently between 1st and 11th November 2008, among the Agropastoral, and Riverine populations of in Middle and Lower Shabelle Regions and among the IDPs in Merka and settlements along the Mogadishu - Afgoye road. A separate and fourth assessment was conducted at the same time among the riverine rural populations of Lower and Middle Shabelle using Lot Quality Assurance Sampling Methodology (reported separately). Respective sample sizes (number of households and number of children) were calculated using the Epiinfo/Ena 2008 software after considering the population size, estimated prevalence and desired precision. A list of all villages within each of the assessed livelihoods in the regions with their respective populations6 formed a sampling frame and was used to construct cumulative population figures for the assessment area from which 25-26 clusters were randomly drawn for each livelihood zone (Appendix 4). Selection of respondents within the village was done randomly from a list of eligible names. Where these were not available, the number of households in the village was estimated from the population figures (the total population divided by the mean household size to get the interval, n). Starting from a random household, every nth household was selected and all eligible children (aged 6-59 months) in that household measured. Retrospective mortality data was collected from all the households in each cluster from each livelihood including even those that did not have children aged 6-59 months. Quantitative data was collected through a standard household questionnaire for nutrition assessments in Somalia (see appendix 2). Retrospective mortality data for 90 days prior to the assessments and Rapid Diagnostic Test for malaria was also collected among the study households using the standard questionnaires (see appendix 3 and 4 respectively). Qualitative data was collected through focus group discussions and key informant interviews to provide further understanding of possible factors influencing nutritional status. A four-day training of enumerators and supervisors was conducted covering interview techniques, sampling procedure, inclusion and exclusion criteria, sources and reduction of errors, taking measurements (height, weight and MUAC), undertaking malaria RDTs, standardisation of questions in the questionnaire, levels of precision required in measurements, diagnosis of oedema and measles, verification of deaths within households, handling of equipment and the general courtesy during the assessment. Standardisation of measurement and pre-testing of the questionnaires and equipment were carried out in a village in Merka town not selected as a cluster for the actual IDP assessment. Quality of data was also ensured through (i) monitoring of fieldwork by coordination team, (ii) crosschecking of filled questionnaires on daily basis, recording of observations; and confirmation of measles, severe malnutrition and death cases by supervisors. All households sampled were visited and recorded including empty ones (iii) daily review was undertaken with the teams to address any difficulties encountered, (iv) progress evaluation was carried out according to the time schedule and progress reports shared with partners on regular basis, (v) continuous data cleaning and plausibility checks (vi) monitoring accuracy of equipment (weighing scales) by regularly measuring objects of known weights and (vii) continuous reinforcement of good practices. All measurements were loudly shouted by both the enumerators reading and recording them to reduce errors during recording. Household and child data was entered, processed (including cleaning) and analysed using EPI6 software. Mortality data was entered and CMR and U5MR generated in ENA software.
6 UNDP population estimates, 2005
Shabelle IDPs, Agropastoral and Riverine Nutrition Assessments Report – November 2008…….. FAO/FSAU, UNICEF, WFP & Partners
12
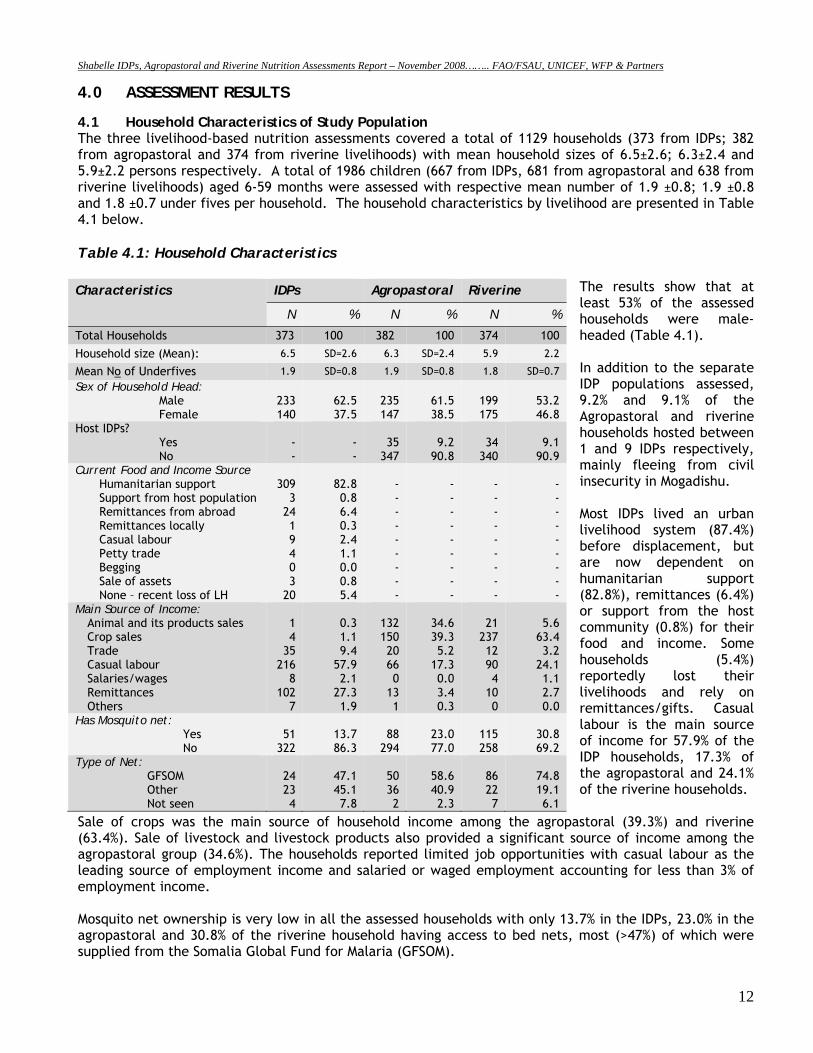
4.0 ASSESSMENT RESULTS 4.1 Household Characteristics of Study Population The three livelihood-based nutrition assessments covered a total of 1129 households (373 from IDPs; 382 from agropastoral and 374 from riverine livelihoods) with mean household sizes of 6.5±2.6; 6.3±2.4 and 5.9±2.2 persons respectively. A total of 1986 children (667 from IDPs, 681 from agropastoral and 638 from riverine livelihoods) aged 6-59 months were assessed with respective mean number of 1.9 ±0.8; 1.9 ±0.8 and 1.8 ±0.7 under fives per household. The household characteristics by livelihood are presented in Table 4.1 below. Table 4.1: Household Characteristics
The results show that at least 53% of the assessed households were male-headed (Table 4.1). In addition to the separate IDP populations assessed, 9.2% and 9.1% of the Agropastoral and riverine households hosted between 1 and 9 IDPs respectively, mainly fleeing from civil insecurity in Mogadishu. Most IDPs lived an urban livelihood system (87.4%) before displacement, but are now dependent on humanitarian support (82.8%), remittances (6.4%) or support from the host community (0.8%) for their food and income. Some households (5.4%) reportedly lost their livelihoods and rely on remittances/gifts. Casual labour is the main source of income for 57.9% of the IDP households, 17.3% of the agropastoral and 24.1% of the riverine households.
Sale of crops was the main source of household income among the agropastoral (39.3%) and riverine (63.4%). Sale of livestock and livestock products also provided a significant source of income among the agropastoral group (34.6%). The households reported limited job opportunities with casual labour as the leading source of employment income and salaried or waged employment accounting for less than 3% of employment income. Mosquito net ownership is very low in all the assessed households with only 13.7% in the IDPs, 23.0% in the agropastoral and 30.8% of the riverine household having access to bed nets, most (>47%) of which were supplied from the Somalia Global Fund for Malaria (GFSOM).
Characteristics IDPs Agropastoral Riverine
N % N % N %
Total Households 373 100 382 100 374 100
Household size (Mean): 6.5 SD=2.6 6.3 SD=2.4 5.9 2.2
Mean No of Underfives 1.9 SD=0.8 1.9 SD=0.8 1.8 SD=0.7 Sex of Household Head:
Male Female
233 140
62.5 37.5
235 147
61.5 38.5
199 175
53.2 46.8
Host IDPs? Yes No
- -
- -
35
347
9.2
90.8
34
340
9.1
90.9 Current Food and Income Source
Humanitarian support Support from host population Remittances from abroad Remittances locally Casual labour Petty trade Begging Sale of assets None – recent loss of LH
309
3 24 1 9 4 0 3
20
82.8 0.8 6.4 0.3 2.4 1.1 0.0 0.8 5.4
- - - - - - - - -
- - - - - - - - -
- - - - - - - - -
- - - - - - - - -
Main Source of Income: Animal and its products sales Crop sales Trade Casual labour Salaries/wages Remittances Others
1 4
35 216
8 102
7
0.3 1.1 9.4
57.9 2.1
27.3 1.9
132 150 20 66 0
13 1
34.6 39.3 5.2
17.3 0.0 3.4 0.3
21
237 12 90 4
10 0
5.6
63.4 3.2
24.1 1.1 2.7 0.0
Has Mosquito net: Yes No
51
322
13.7 86.3
88
294
23.0 77.0
115 258
30.8 69.2
Type of Net: GFSOM Other Not seen
24 23 4
47.1 45.1 7.8
50 36 2
58.6 40.9 2.3
86 22 7
74.8 19.1 6.1
Shabelle IDPs, Agropastoral and Riverine Nutrition Assessments Report – November 2008…….. FAO/FSAU, UNICEF, WFP & Partners
13
4.2 Households Access to Water, Sanitation and Health Facilities
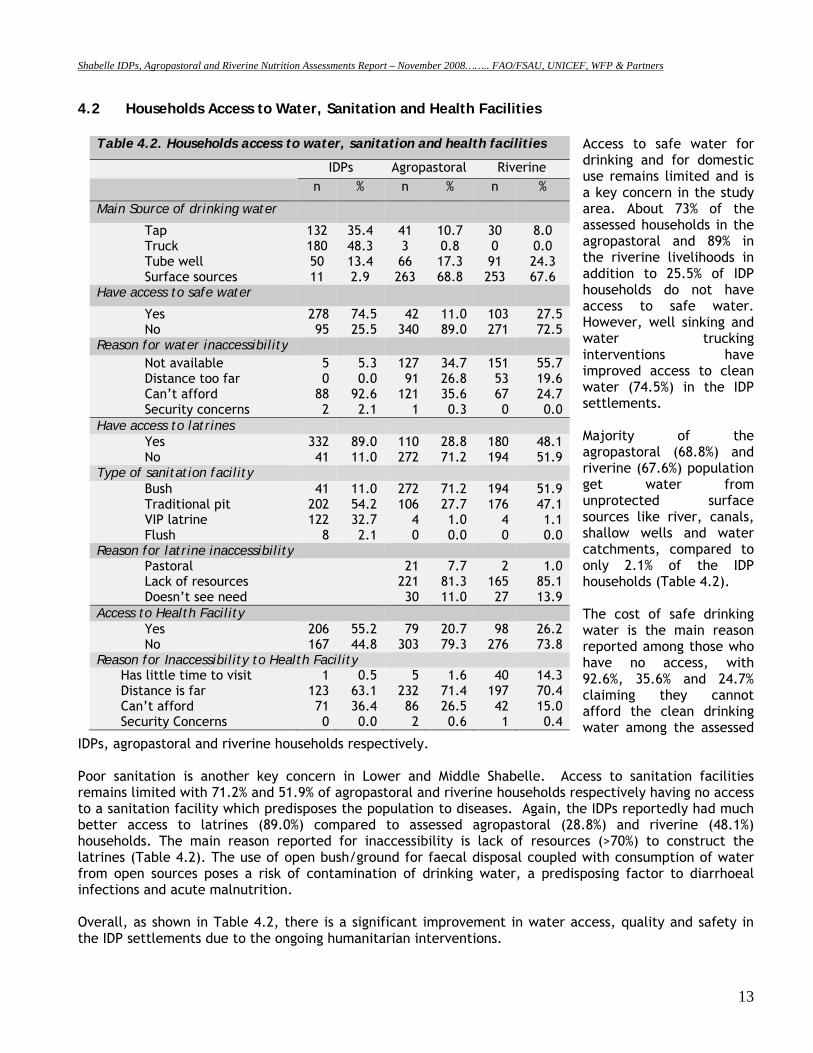
Access to safe water for drinking and for domestic use remains limited and is a key concern in the study area. About 73% of the assessed households in the agropastoral and 89% in the riverine livelihoods in addition to 25.5% of IDP households do not have access to safe water. However, well sinking and water trucking interventions have improved access to clean water (74.5%) in the IDP settlements. Majority of the agropastoral (68.8%) and riverine (67.6%) population get water from unprotected surface sources like river, canals, shallow wells and water catchments, compared to only 2.1% of the IDP households (Table 4.2). The cost of safe drinking water is the main reason reported among those who have no access, with 92.6%, 35.6% and 24.7% claiming they cannot afford the clean drinking water among the assessed
IDPs, agropastoral and riverine households respectively. Poor sanitation is another key concern in Lower and Middle Shabelle. Access to sanitation facilities remains limited with 71.2% and 51.9% of agropastoral and riverine households respectively having no access to a sanitation facility which predisposes the population to diseases. Again, the IDPs reportedly had much better access to latrines (89.0%) compared to assessed agropastoral (28.8%) and riverine (48.1%) households. The main reason reported for inaccessibility is lack of resources (>70%) to construct the latrines (Table 4.2). The use of open bush/ground for faecal disposal coupled with consumption of water from open sources poses a risk of contamination of drinking water, a predisposing factor to diarrhoeal infections and acute malnutrition. Overall, as shown in Table 4.2, there is a significant improvement in water access, quality and safety in the IDP settlements due to the ongoing humanitarian interventions.
Table 4.2. Households access to water, sanitation and health facilities
IDPs Agropastoral Riverine n % n % n %
Main Source of drinking water
Tap Truck Tube well Surface sources
132 180 50 11
35.4 48.3 13.4 2.9
41 3 66 263
10.7 0.8 17.3 68.8
30 0 91 253
8.0 0.0 24.3 67.6
Have access to safe water
Yes No
278 95
74.5 25.5
42 340
11.0 89.0
103 271
27.5 72.5
Reason for water inaccessibility Not available Distance too far Can’t afford Security concerns
5 0
88 2
5.3 0.0
92.6 2.1
127 91
121 1
34.7 26.8 35.6 0.3
151 53 67 0
55.7 19.6 24.7 0.0
Have access to latrines Yes No
332 41
89.0 11.0
110 272
28.8 71.2
180 194
48.1 51.9
Type of sanitation facility Bush Traditional pit VIP latrine Flush
41 202 122
8
11.0 54.2 32.7 2.1
272 106
4 0
71.2 27.7 1.0 0.0
194 176
4 0
51.9 47.1 1.1 0.0
Reason for latrine inaccessibility Pastoral Lack of resources Doesn’t see need
21 221 30
7.7 81.3 11.0
2 165 27
1.0 85.1 13.9
Access to Health Facility Yes No
206 167
55.2 44.8
79 303
20.7 79.3
98 276
26.2 73.8
Reason for Inaccessibility to Health Facility Has little time to visit Distance is far Can’t afford Security Concerns
1 123 71 0
0.5 63.1 36.4 0.0
5 232 86 2
1.6 71.4 26.5 0.6
40 197 42 1
14.3 70.4 15.0 0.4
Shabelle IDPs, Agropastoral and Riverine Nutrition Assessments Report – November 2008…….. FAO/FSAU, UNICEF, WFP & Partners
14
4.3 Household Food Security 4.3.1 Food Consumption
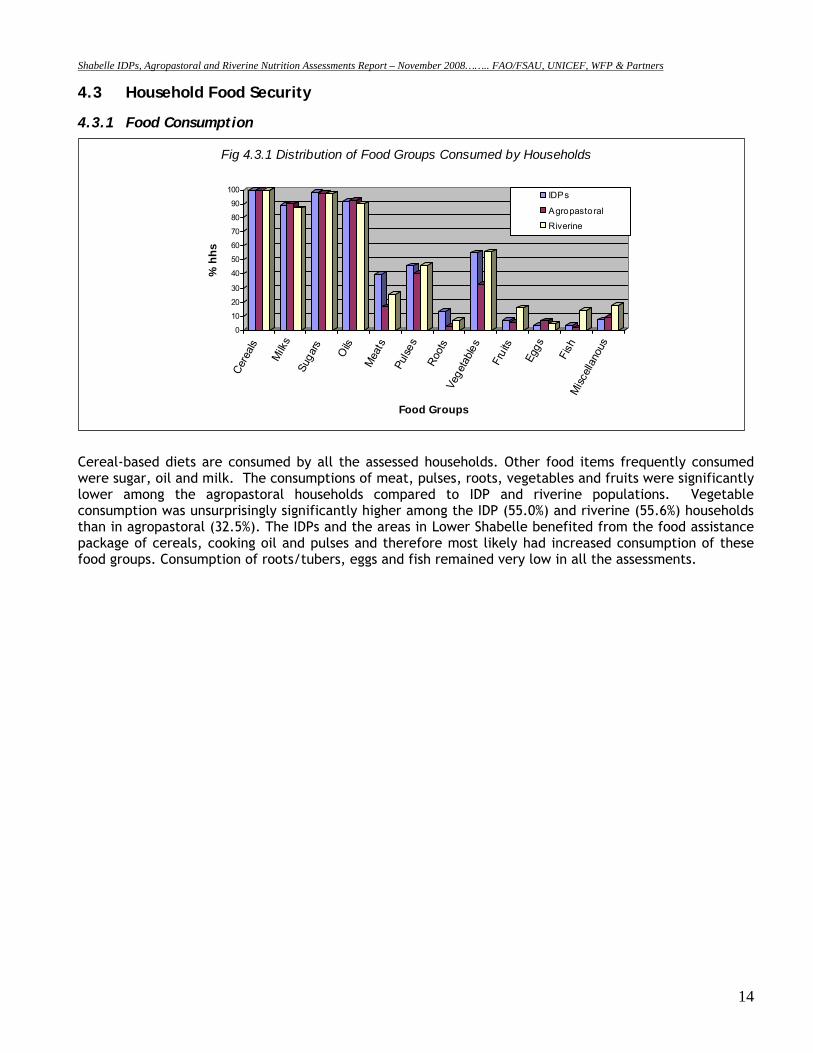
Cereal-based diets are consumed by all the assessed households. Other food items frequently consumed were sugar, oil and milk. The consumptions of meat, pulses, roots, vegetables and fruits were significantly lower among the agropastoral households compared to IDP and riverine populations. Vegetable consumption was unsurprisingly significantly higher among the IDP (55.0%) and riverine (55.6%) households than in agropastoral (32.5%). The IDPs and the areas in Lower Shabelle benefited from the food assistance package of cereals, cooking oil and pulses and therefore most likely had increased consumption of these food groups. Consumption of roots/tubers, eggs and fish remained very low in all the assessments.
0
10
20
30
40
50
60
70
80
90
100
% h
hs
Cere
als
Milk
sSu
gars
Oils
Mea
tsPu
lses
Root
sVe
geta
bles
Frui
ts
Eggs
Fish
Misc
ellan
ous
Food Groups
Fig 4.3.1 Distribution of Food Groups Consumed by Households
IDPs
Agropastoral
Riverine
Shabelle IDPs, Agropastoral and Riverine Nutrition Assessments Report – November 2008…….. FAO/FSAU, UNICEF, WFP & Partners
15
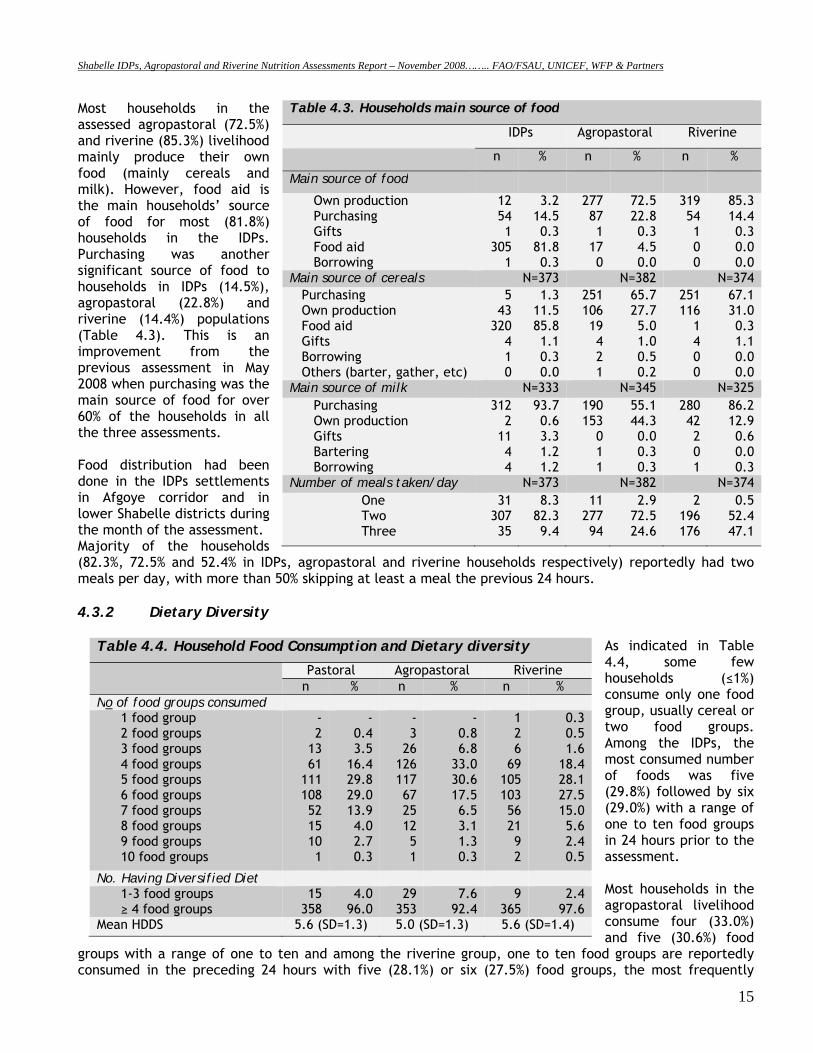
Most households in the assessed agropastoral (72.5%) and riverine (85.3%) livelihood mainly produce their own food (mainly cereals and milk). However, food aid is the main households’ source of food for most (81.8%) households in the IDPs. Purchasing was another significant source of food to households in IDPs (14.5%), agropastoral (22.8%) and riverine (14.4%) populations (Table 4.3). This is an improvement from the previous assessment in May 2008 when purchasing was the main source of food for over 60% of the households in all the three assessments. Food distribution had been done in the IDPs settlements in Afgoye corridor and in lower Shabelle districts during the month of the assessment. Majority of the households (82.3%, 72.5% and 52.4% in IDPs, agropastoral and riverine households respectively) reportedly had two meals per day, with more than 50% skipping at least a meal the previous 24 hours. 4.3.2 Dietary Diversity
As indicated in Table 4.4, some few households (≤1%) consume only one food group, usually cereal or two food groups. Among the IDPs, the most consumed number of foods was five (29.8%) followed by six (29.0%) with a range of one to ten food groups in 24 hours prior to the assessment. Most households in the agropastoral livelihood consume four (33.0%) and five (30.6%) food
groups with a range of one to ten and among the riverine group, one to ten food groups are reportedly consumed in the preceding 24 hours with five (28.1%) or six (27.5%) food groups, the most frequently
Table 4.3. Households main source of food
IDPs Agropastoral Riverine
n % n % n %
Main source of food
Own production Purchasing Gifts Food aid Borrowing
12 54 1
305 1
3.2 14.5 0.3
81.8 0.3
277 87 1
17 0
72.5 22.8 0.3 4.5 0.0
319 54 1 0 0
85.3 14.4 0.3 0.0 0.0
Main source of cereals N=373 N=382 N=374 Purchasing Own production Food aid Gifts Borrowing Others (barter, gather, etc)
5 43
320 4 1 0
1.3 11.5 85.8 1.1 0.3 0.0
251 106 19 4 2 1
65.7 27.7 5.0 1.0 0.5 0.2
251 116
1 4 0 0
67.1 31.0 0.3 1.1 0.0 0.0
Main source of milk N=333 N=345 N=325 Purchasing Own production Gifts Bartering Borrowing
312 2
11 4 4
93.7 0.6 3.3 1.2 1.2
190 153
0 1 1
55.1 44.3 0.0 0.3 0.3
280 42 2 0 1
86.2 12.9 0.6 0.0 0.3
Number of meals taken/day N=373 N=382 N=374 One Two Three
31 307 35
8.3 82.3 9.4
11 277 94
2.9 72.5 24.6
2 196 176
0.5 52.4 47.1
Table 4.4. Household Food Consumption and Dietary diversity
Pastoral Agropastoral Riverine n % n % n %
No of food groups consumed 1 food group 2 food groups 3 food groups 4 food groups 5 food groups 6 food groups 7 food groups 8 food groups 9 food groups 10 food groups
- 2
13 61
111 108 52 15 10 1
- 0.4 3.5
16.4 29.8 29.0 13.9 4.0 2.7 0.3
- 3
26 126 117 67 25 12 5 1
- 0.8 6.8
33.0 30.6 17.5 6.5 3.1 1.3 0.3
1 2 6
69 105 103 56 21 9 2
0.3 0.5 1.6
18.4 28.1 27.5 15.0 5.6 2.4 0.5
No. Having Diversified Diet 1-3 food groups ≥ 4 food groups
15 358
4.0 96.0
29 353
7.6 92.4
9 365
2.4 97.6
Mean HDDS 5.6 (SD=1.3) 5.0 (SD=1.3) 5.6 (SD=1.4)
Shabelle IDPs, Agropastoral and Riverine Nutrition Assessments Report – November 2008…….. FAO/FSAU, UNICEF, WFP & Partners
16
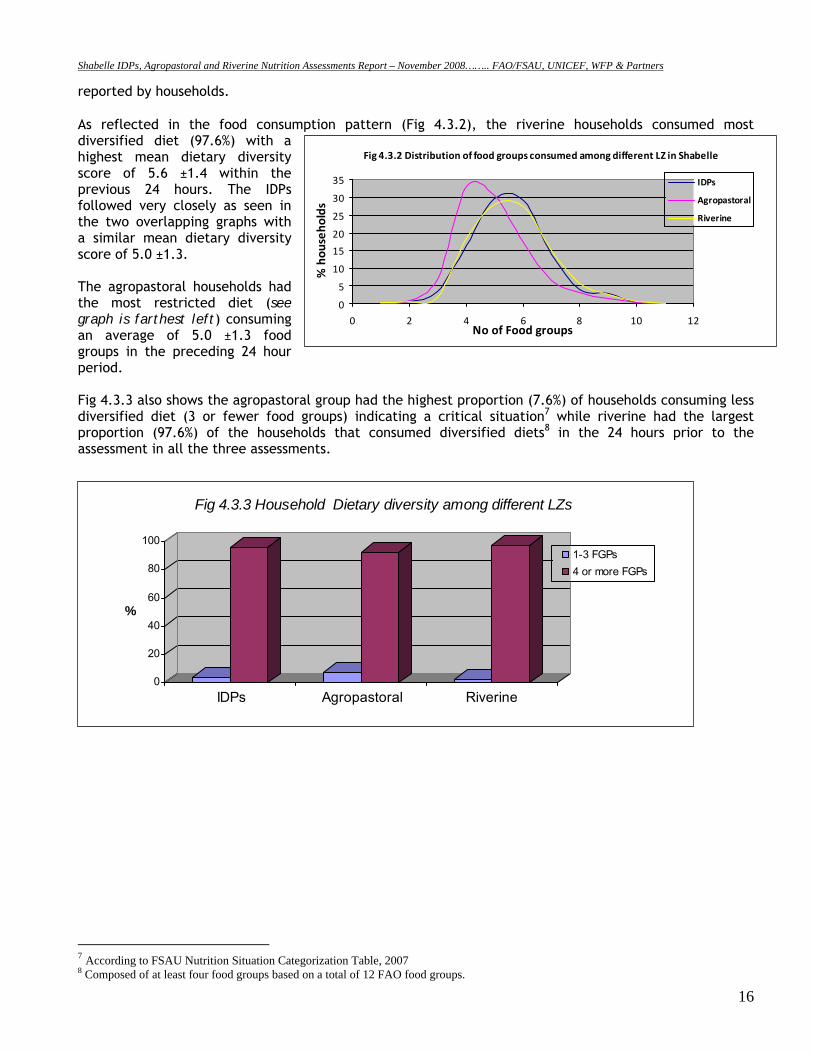
reported by households. As reflected in the food consumption pattern (Fig 4.3.2), the riverine households consumed most diversified diet (97.6%) with a highest mean dietary diversity score of 5.6 ±1.4 within the previous 24 hours. The IDPs followed very closely as seen in the two overlapping graphs with a similar mean dietary diversity score of 5.0 ±1.3. The agropastoral households had the most restricted diet (see graph is farthest left) consuming an average of 5.0 ±1.3 food groups in the preceding 24 hour period. Fig 4.3.3 also shows the agropastoral group had the highest proportion (7.6%) of households consuming less diversified diet (3 or fewer food groups) indicating a critical situation7 while riverine had the largest proportion (97.6%) of the households that consumed diversified diets8 in the 24 hours prior to the assessment in all the three assessments.
7 According to FSAU Nutrition Situation Categorization Table, 2007 8 Composed of at least four food groups based on a total of 12 FAO food groups.
0
20
40
60
80
100
%
IDPs Agropastoral Riverine
Fig 4.3.3 Household Dietary diversity among different LZs
1-3 FGPs4 or more FGPs
Fig 4.3.2 Distribution of food groups consumed among different LZ in Shabelle
0
5
10
15
20
25
30
35
0 2 4 6 8 10 12No of Food groups
% hou
seho
lds
IDPs
Agropastoral
Riverine
Shabelle IDPs, Agropastoral and Riverine Nutrition Assessments Report – November 2008…….. FAO/FSAU, UNICEF, WFP & Partners
17
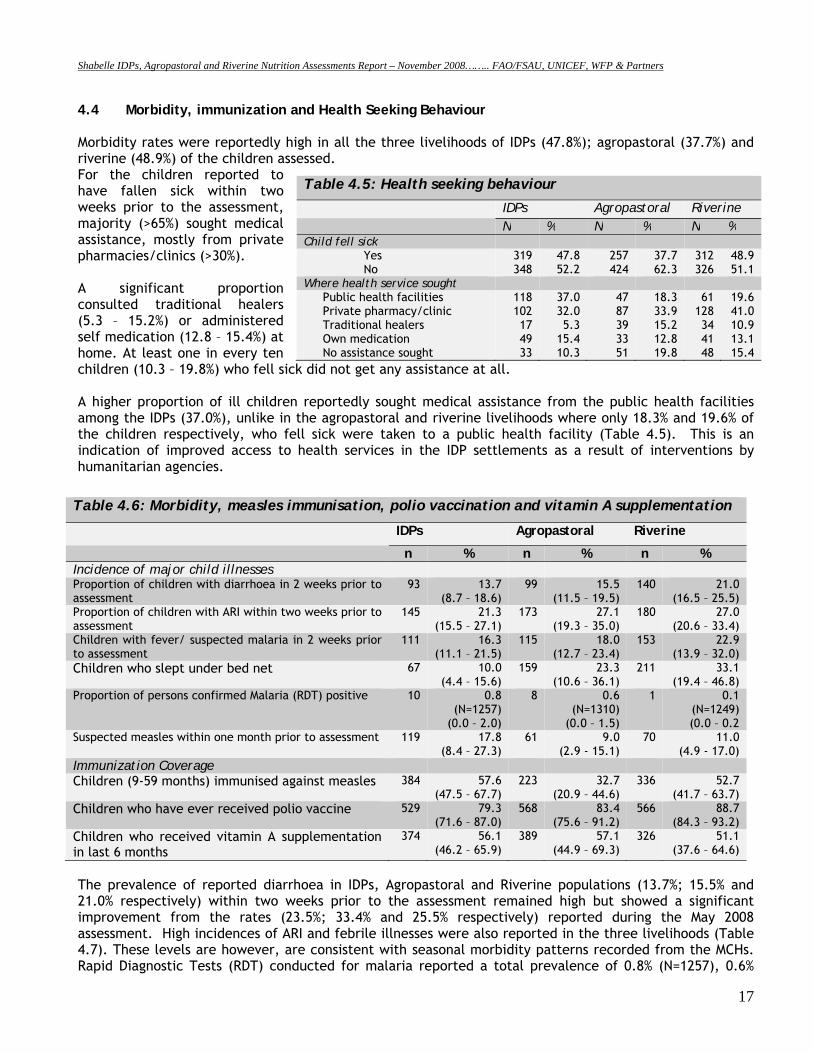
4.4 Morbidity, immunization and Health Seeking Behaviour Morbidity rates were reportedly high in all the three livelihoods of IDPs (47.8%); agropastoral (37.7%) and riverine (48.9%) of the children assessed. For the children reported to have fallen sick within two weeks prior to the assessment, majority (>65%) sought medical assistance, mostly from private pharmacies/clinics (>30%). A significant proportion consulted traditional healers (5.3 – 15.2%) or administered self medication (12.8 – 15.4%) at home. At least one in every ten children (10.3 – 19.8%) who fell sick did not get any assistance at all. A higher proportion of ill children reportedly sought medical assistance from the public health facilities among the IDPs (37.0%), unlike in the agropastoral and riverine livelihoods where only 18.3% and 19.6% of the children respectively, who fell sick were taken to a public health facility (Table 4.5). This is an indication of improved access to health services in the IDP settlements as a result of interventions by humanitarian agencies.
Table 4.6: Morbidity, measles immunisation, polio vaccination and vitamin A supplementation
IDPs Agropastoral Riverine
n % n % n % Incidence of major child illnesses Proportion of children with diarrhoea in 2 weeks prior to assessment
93 13.7 (8.7 – 18.6)
99 15.5 (11.5 – 19.5)
140 21.0 (16.5 – 25.5)
Proportion of children with ARI within two weeks prior to assessment
145 21.3 (15.5 – 27.1)
173 27.1 (19.3 – 35.0)
180 27.0 (20.6 – 33.4)
Children with fever/ suspected malaria in 2 weeks prior to assessment
111 16.3 (11.1 – 21.5)
115 18.0 (12.7 – 23.4)
153 22.9 (13.9 – 32.0)
Children who slept under bed net 67 10.0 (4.4 – 15.6)
159 23.3 (10.6 – 36.1)
211 33.1 (19.4 – 46.8)
Proportion of persons confirmed Malaria (RDT) positive 10 0.8 (N=1257)
(0.0 – 2.0)
8 0.6 (N=1310)
(0.0 – 1.5)
1 0.1 (N=1249) (0.0 – 0.2
Suspected measles within one month prior to assessment 119
17.8 (8.4 – 27.3)
61 9.0 (2.9 - 15.1)
70 11.0 (4.9 - 17.0)
Immunization Coverage Children (9-59 months) immunised against measles 384 57.6
(47.5 – 67.7) 223 32.7
(20.9 – 44.6) 336 52.7
(41.7 – 63.7) Children who have ever received polio vaccine 529 79.3
(71.6 – 87.0) 568 83.4
(75.6 – 91.2) 566 88.7
(84.3 – 93.2) Children who received vitamin A supplementation in last 6 months
374 56.1 (46.2 – 65.9)
389 57.1 (44.9 – 69.3)
326 51.1 (37.6 – 64.6)
The prevalence of reported diarrhoea in IDPs, Agropastoral and Riverine populations (13.7%; 15.5% and 21.0% respectively) within two weeks prior to the assessment remained high but showed a significant improvement from the rates (23.5%; 33.4% and 25.5% respectively) reported during the May 2008 assessment. High incidences of ARI and febrile illnesses were also reported in the three livelihoods (Table 4.7). These levels are however, are consistent with seasonal morbidity patterns recorded from the MCHs. Rapid Diagnostic Tests (RDT) conducted for malaria reported a total prevalence of 0.8% (N=1257), 0.6%
Table 4.5: Health seeking behaviour
IDPs Agropastoral Riverine N % N % N % Child fell sick
Yes No
319 348
47.8 52.2
257 424
37.7 62.3
312 326
48.9 51.1
Where health service sought Public health facilities Private pharmacy/clinic Traditional healers Own medication No assistance sought
118 102 17 49 33
37.0 32.0 5.3
15.4 10.3
47 87 39 33 51
18.3 33.9 15.2 12.8 19.8
61 128 34 41 48
19.6 41.0 10.9 13.1 15.4
Shabelle IDPs, Agropastoral and Riverine Nutrition Assessments Report – November 2008…….. FAO/FSAU, UNICEF, WFP & Partners
18
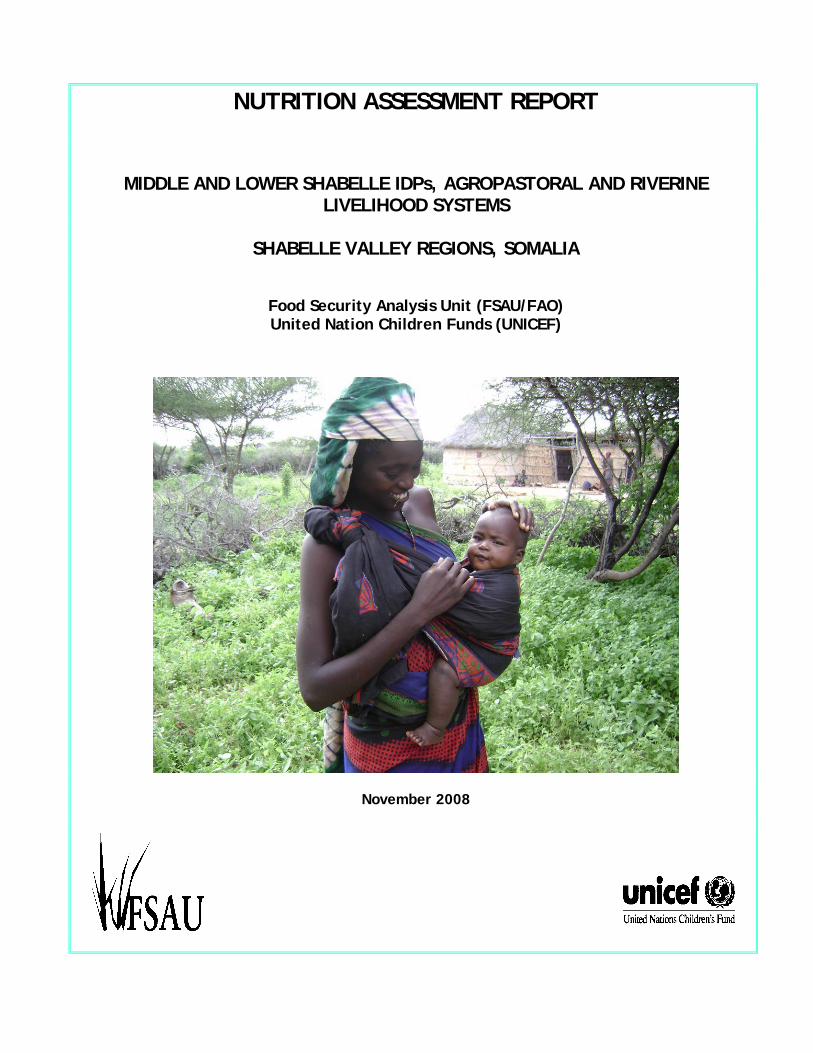
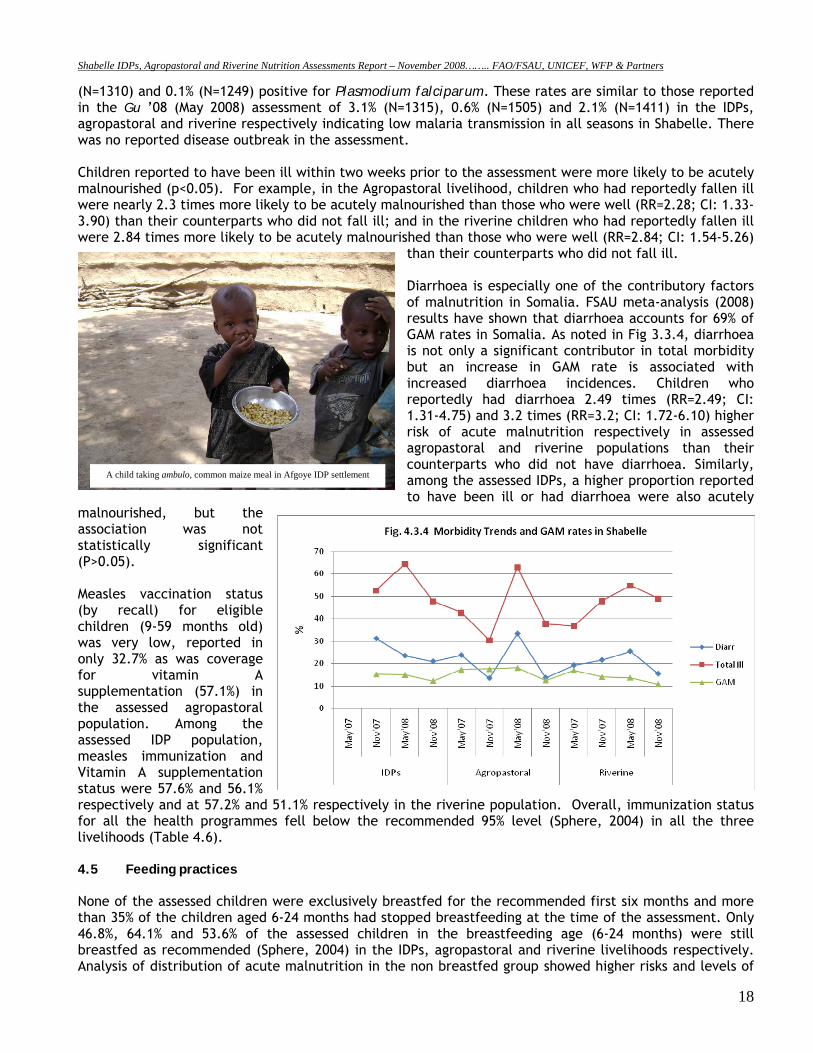
A child taking ambulo, common maize meal in Afgoye IDP settlement
(N=1310) and 0.1% (N=1249) positive for Plasmodium falciparum. These rates are similar to those reported in the Gu ’08 (May 2008) assessment of 3.1% (N=1315), 0.6% (N=1505) and 2.1% (N=1411) in the IDPs, agropastoral and riverine respectively indicating low malaria transmission in all seasons in Shabelle. There was no reported disease outbreak in the assessment. Children reported to have been ill within two weeks prior to the assessment were more likely to be acutely malnourished (p<0.05). For example, in the Agropastoral livelihood, children who had reportedly fallen ill were nearly 2.3 times more likely to be acutely malnourished than those who were well (RR=2.28; CI: 1.33-3.90) than their counterparts who did not fall ill; and in the riverine children who had reportedly fallen ill were 2.84 times more likely to be acutely malnourished than those who were well (RR=2.84; CI: 1.54-5.26)
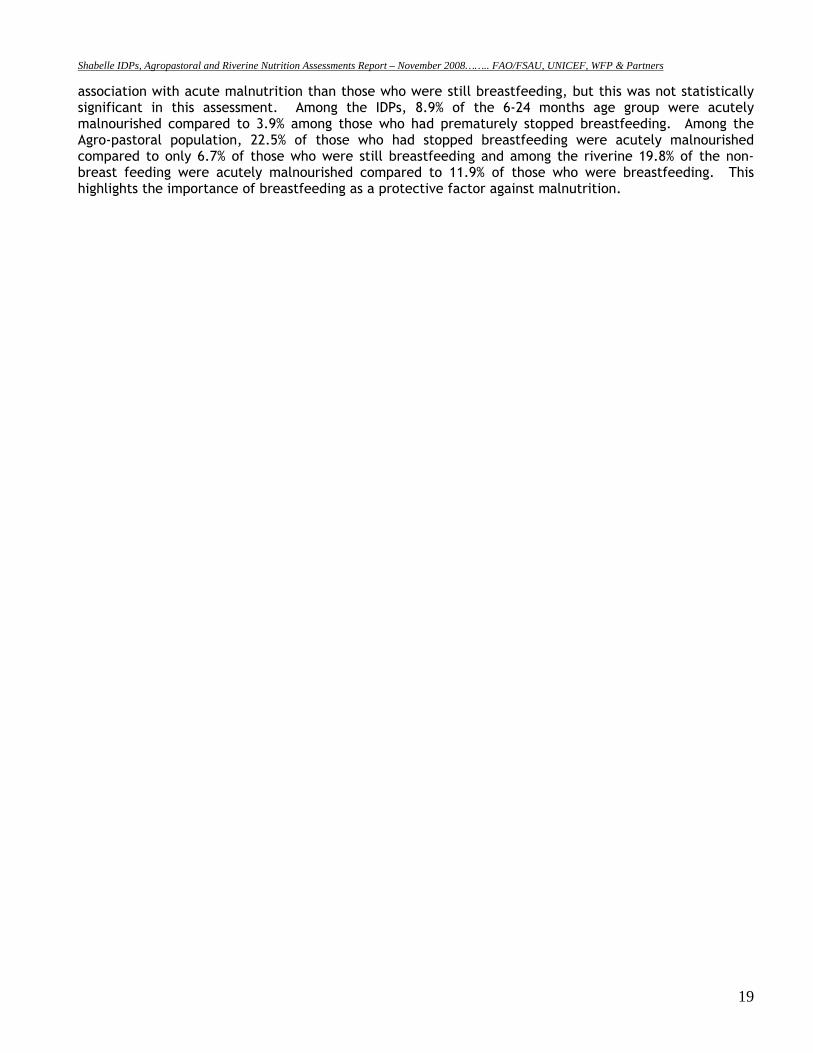
than their counterparts who did not fall ill. Diarrhoea is especially one of the contributory factors of malnutrition in Somalia. FSAU meta-analysis (2008) results have shown that diarrhoea accounts for 69% of GAM rates in Somalia. As noted in Fig 3.3.4, diarrhoea is not only a significant contributor in total morbidity but an increase in GAM rate is associated with increased diarrhoea incidences. Children who reportedly had diarrhoea 2.49 times (RR=2.49; CI: 1.31-4.75) and 3.2 times (RR=3.2; CI: 1.72-6.10) higher risk of acute malnutrition respectively in assessed agropastoral and riverine populations than their counterparts who did not have diarrhoea. Similarly, among the assessed IDPs, a higher proportion reported to have been ill or had diarrhoea were also acutely
malnourished, but the association was not statistically significant (P>0.05). Measles vaccination status (by recall) for eligible children (9-59 months old) was very low, reported in only 32.7% as was coverage for vitamin A supplementation (57.1%) in the assessed agropastoral population. Among the assessed IDP population, measles immunization and Vitamin A supplementation status were 57.6% and 56.1% respectively and at 57.2% and 51.1% respectively in the riverine population. Overall, immunization status for all the health programmes fell below the recommended 95% level (Sphere, 2004) in all the three livelihoods (Table 4.6). 4.5 Feeding practices None of the assessed children were exclusively breastfed for the recommended first six months and more than 35% of the children aged 6-24 months had stopped breastfeeding at the time of the assessment. Only 46.8%, 64.1% and 53.6% of the assessed children in the breastfeeding age (6-24 months) were still breastfed as recommended (Sphere, 2004) in the IDPs, agropastoral and riverine livelihoods respectively. Analysis of distribution of acute malnutrition in the non breastfed group showed higher risks and levels of
Shabelle IDPs, Agropastoral and Riverine Nutrition Assessments Report – November 2008…….. FAO/FSAU, UNICEF, WFP & Partners
19
association with acute malnutrition than those who were still breastfeeding, but this was not statistically significant in this assessment. Among the IDPs, 8.9% of the 6-24 months age group were acutely malnourished compared to 3.9% among those who had prematurely stopped breastfeeding. Among the Agro-pastoral population, 22.5% of those who had stopped breastfeeding were acutely malnourished compared to only 6.7% of those who were still breastfeeding and among the riverine 19.8% of the non-breast feeding were acutely malnourished compared to 11.9% of those who were breastfeeding. This highlights the importance of breastfeeding as a protective factor against malnutrition.
Shabelle IDPs, Agropastoral and Riverine Nutrition Assessments Report – November 2008…….. FAO/FSAU, UNICEF, WFP & Partners
20
4.6 Nutrition Status 4.6.1 Acute Malnutrition by Livelihoods A total of 1986 children aged 6-59 months were assessed from 1129 households for the three livelihoods (population groups). In the IDP assessment a total of 667 children, 48.1% boys and 51.9% girls (sex ratio = 0.93) aged 6-59 months were assessed from 373 households (mean household size = 6.5 ± 2.6). In the agropastoral livelihood, 681 children (48.8% boys and 51.2% girls; sex ratio 0.95) were assessed from 382 households (mean household size = 6.3 ± 2.4) while 638 children (48.1% of them boys and 51.9% girls; sex ratio 0.93) were assessed from 374 sampled households (mean household size = 5.9 ± 2.2). The results indicate that the nutrition situation is Serious (GAM rate of 10-15%) according to WHO classification, in the three assessments showing a significant improvement among the agropastoral and IDP populations from the Critical levels recorded in the last assessment in May 2008, but no statistically significant change in the riverine population. Shabelle IDPs in Afgoye corridor and Merka reported a GAM rate (weight for height <-2 Z score or oedema) of 12.3% (9.7-15.5) and SAM rate of 2.8% (1.7-4.8%) with seven (1.0%) cases of oedema. This indicates a slight improvement from the previous GAM rate of 15.0% (11.5-18.4%), but a significant increase in the proportion of severely malnourished children from the 1.0% (0.2-1.8) including four (0.5%) oedema cases reported in the May 2008 assessment9. The deterioration in SAM rates is likely as a result of continuing influx of IDPs from Mogadishu. Although the GAM results appear lower than the rates reported among the IDP population assessed in May 2008 and indicates a general improvement from critical levels experienced over the previous one year to serious levels, the change is not statistically significant (p>0.05). Shabelle Agropastoral reported a GAM rate of 12.5% (CI: 10.6-14.6) and a SAM rate of 2.2% (1.3-3.6) including three (0.4%) oedema cases. These results indicate an improvement to serious nutrition situation from the Critical level of acute malnutrition in the May 2008 assessment, where a GAM rate of 18.1% (14.4-21.8) and a SAM rate of 3.5% (1.7-5.3) including seven oedema cases (0.9%) were reported. Shabelle Riverine Assessment reported a GAM rate of 10.8% (8.6-13.5) and a SAM rate of 2.5% (1.4-4.4) that included seven (1.1%) oedema cases, indicating no significant change from the May 2008 assessment which reported a GAM rate of 13.7% (9.6-17.7) and SAM rate of 3.8% (1.8-5.9) including two (0.3%) oedema cases. A summary of the findings for the acute malnutrition rates is given in Table 4.7.
9 FSAU Nutrition Update, June 2008.
Shabelle IDPs, Agropastoral and Riverine Nutrition Assessments Report – November 2008…….. FAO/FSAU, UNICEF, WFP & Partners
21
Table 4.7: Summary of Malnutrition rates by Livelihood systems Malnutrition rates IDPs (N=667) Agro pastoral (N=681) Riverine (N=638) I n % 95% CI n % 95% CI n % 95% CI Global Acute Malnutrition (WHZ<-2 or oedema) 82 12.3 9.7 – 15.5 85 12.5 10.6 – 14.6 69 10.8 8.6 – 13.5
Severe Acute Malnutrition (WHZ<-3 or oedema) 19 2.8 1.7 – 4.8 15 2.2 1.3 – 3.6 16 2.5 1.4 – 4.4
Oedema 7 1.0 0.2 – 1.9 3 0.4 0.0 – 1.0 7 1.1 0.0 – 2.3 Global Acute Malnutrition (WHO Anthro 2006) 83 12.4 9.4 – 16.3 89 13.1 10.7 – 15.8 68 10.7 8.4 – 13.4
Severe Acute Malnutrition (WHO Anthro 2006) 35 5.2 3.3 – 8.2 30 4.4 3.1 – 6.2 21 3.3 2.2 – 4.9
Global Acute Malnutrition (WHM<80% or oedema) 58 8.7 5.4 – 12.0 60 8.8 6.9 – 10.7 45 7.1 5.0 – 9.2
Severe Acute Malnutrition (WHM<70% or oedema) 10 1.5 0.3 – 2.7 6 0.9 0.2 – 1.5 9 1.4 0.2 – 2.6
Proportion of stunted children (HAZ<-2 216 32.4 27.2 – 37.6 208 30.5 23.7 – 37.3 213 33.4 25.2 – 41.3
Proportion of underweight children (WAZ<-2) 217 32.5 23.8 – 41.2 220 32.3 26.1 – 38.6 200 31.3 25.2 – 37.5
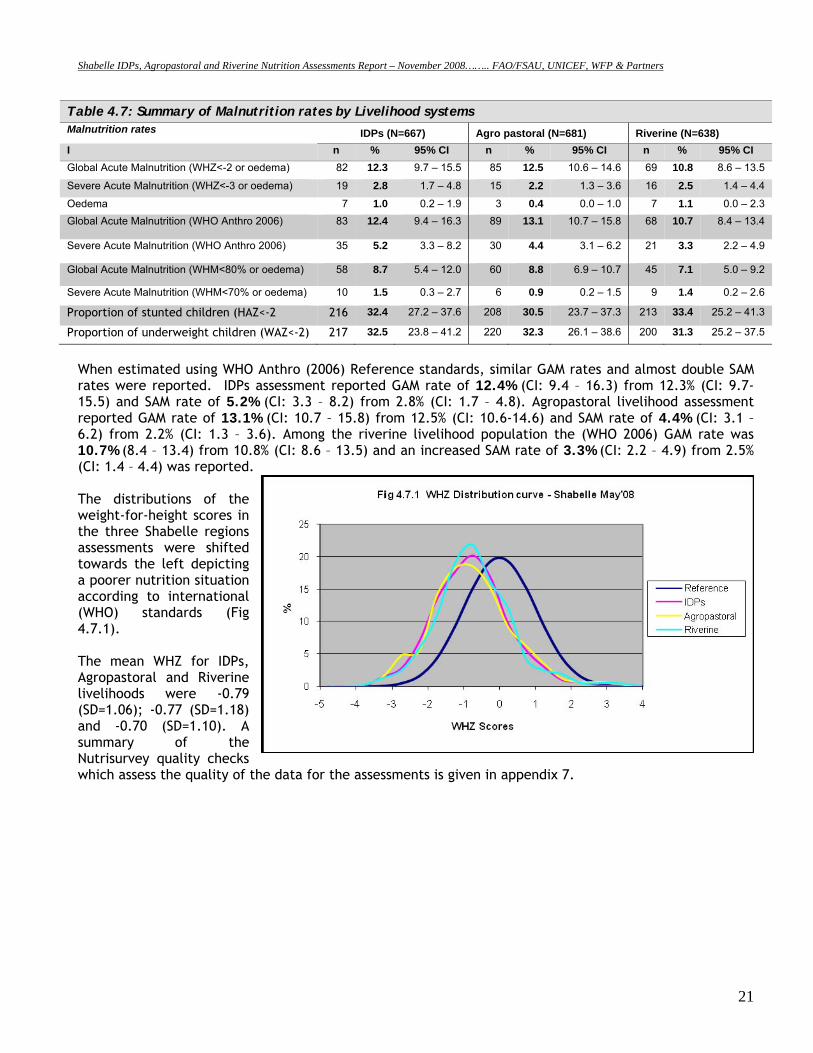
When estimated using WHO Anthro (2006) Reference standards, similar GAM rates and almost double SAM rates were reported. IDPs assessment reported GAM rate of 12.4% (CI: 9.4 – 16.3) from 12.3% (CI: 9.7-15.5) and SAM rate of 5.2% (CI: 3.3 – 8.2) from 2.8% (CI: 1.7 – 4.8). Agropastoral livelihood assessment reported GAM rate of 13.1% (CI: 10.7 – 15.8) from 12.5% (CI: 10.6-14.6) and SAM rate of 4.4% (CI: 3.1 – 6.2) from 2.2% (CI: 1.3 – 3.6). Among the riverine livelihood population the (WHO 2006) GAM rate was 10.7% (8.4 – 13.4) from 10.8% (CI: 8.6 – 13.5) and an increased SAM rate of 3.3% (CI: 2.2 – 4.9) from 2.5% (CI: 1.4 – 4.4) was reported. The distributions of the weight-for-height scores in the three Shabelle regions assessments were shifted towards the left depicting a poorer nutrition situation according to international (WHO) standards (Fig 4.7.1). The mean WHZ for IDPs, Agropastoral and Riverine livelihoods were -0.79 (SD=1.06); -0.77 (SD=1.18) and -0.70 (SD=1.10). A summary of the Nutrisurvey quality checks which assess the quality of the data for the assessments is given in appendix 7.
Shabelle IDPs, Agropastoral and Riverine Nutrition Assessments Report – November 2008…….. FAO/FSAU, UNICEF, WFP & Partners
22
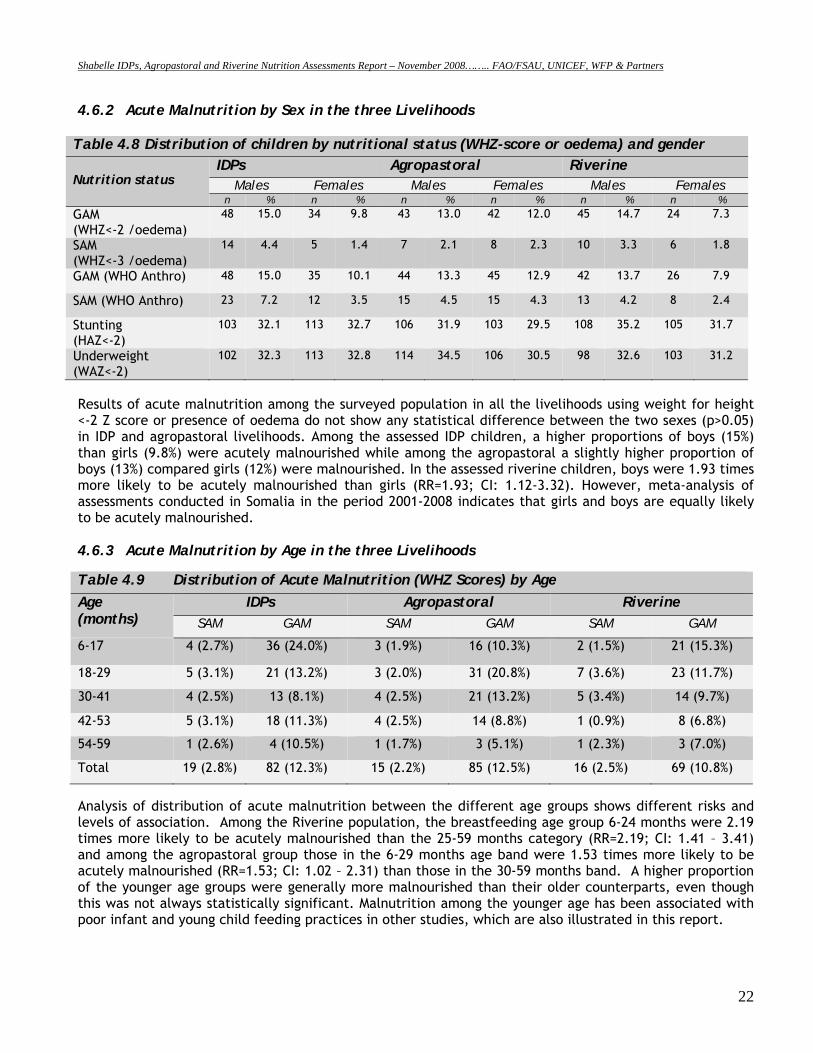
4.6.2 Acute Malnutrition by Sex in the three Livelihoods
Table 4.8 Distribution of children by nutritional status (WHZ-score or oedema) and gender Nutrition status
IDPs Agropastoral Riverine Males Females Males Females Males Females
n % n % n % n % n % n % GAM (WHZ<-2 /oedema)
48 15.0 34 9.8 43 13.0 42 12.0 45 14.7 24 7.3
SAM (WHZ<-3 /oedema)
14
4.4 5 1.4 7 2.1 8 2.3 10 3.3 6 1.8
GAM (WHO Anthro) 48 15.0 35 10.1 44 13.3 45 12.9 42 13.7 26 7.9
SAM (WHO Anthro) 23 7.2 12 3.5 15 4.5 15 4.3 13 4.2 8 2.4
Stunting (HAZ<-2)
103 32.1 113 32.7 106 31.9 103 29.5 108 35.2 105 31.7
Underweight (WAZ<-2)
102 32.3 113 32.8 114 34.5 106 30.5 98 32.6 103 31.2
Results of acute malnutrition among the surveyed population in all the livelihoods using weight for height <-2 Z score or presence of oedema do not show any statistical difference between the two sexes (p>0.05) in IDP and agropastoral livelihoods. Among the assessed IDP children, a higher proportions of boys (15%) than girls (9.8%) were acutely malnourished while among the agropastoral a slightly higher proportion of boys (13%) compared girls (12%) were malnourished. In the assessed riverine children, boys were 1.93 times more likely to be acutely malnourished than girls (RR=1.93; CI: 1.12-3.32). However, meta-analysis of assessments conducted in Somalia in the period 2001-2008 indicates that girls and boys are equally likely to be acutely malnourished. 4.6.3 Acute Malnutrition by Age in the three Livelihoods Table 4.9 Distribution of Acute Malnutrition (WHZ Scores) by Age Age (months)
IDPs Agropastoral Riverine SAM GAM SAM GAM SAM GAM
6-17 4 (2.7%) 36 (24.0%) 3 (1.9%) 16 (10.3%) 2 (1.5%) 21 (15.3%)
18-29 5 (3.1%) 21 (13.2%) 3 (2.0%) 31 (20.8%) 7 (3.6%) 23 (11.7%)
30-41 4 (2.5%) 13 (8.1%) 4 (2.5%) 21 (13.2%) 5 (3.4%) 14 (9.7%)
42-53 5 (3.1%) 18 (11.3%) 4 (2.5%) 14 (8.8%) 1 (0.9%) 8 (6.8%)
54-59 1 (2.6%) 4 (10.5%) 1 (1.7%) 3 (5.1%) 1 (2.3%) 3 (7.0%)
Total 19 (2.8%) 82 (12.3%) 15 (2.2%) 85 (12.5%) 16 (2.5%) 69 (10.8%)
Analysis of distribution of acute malnutrition between the different age groups shows different risks and levels of association. Among the Riverine population, the breastfeeding age group 6-24 months were 2.19 times more likely to be acutely malnourished than the 25-59 months category (RR=2.19; CI: 1.41 – 3.41) and among the agropastoral group those in the 6-29 months age band were 1.53 times more likely to be acutely malnourished (RR=1.53; CI: 1.02 – 2.31) than those in the 30-59 months band. A higher proportion of the younger age groups were generally more malnourished than their older counterparts, even though this was not always statistically significant. Malnutrition among the younger age has been associated with poor infant and young child feeding practices in other studies, which are also illustrated in this report.
Shabelle IDPs, Agropastoral and Riverine Nutrition Assessments Report – November 2008…….. FAO/FSAU, UNICEF, WFP & Partners
23
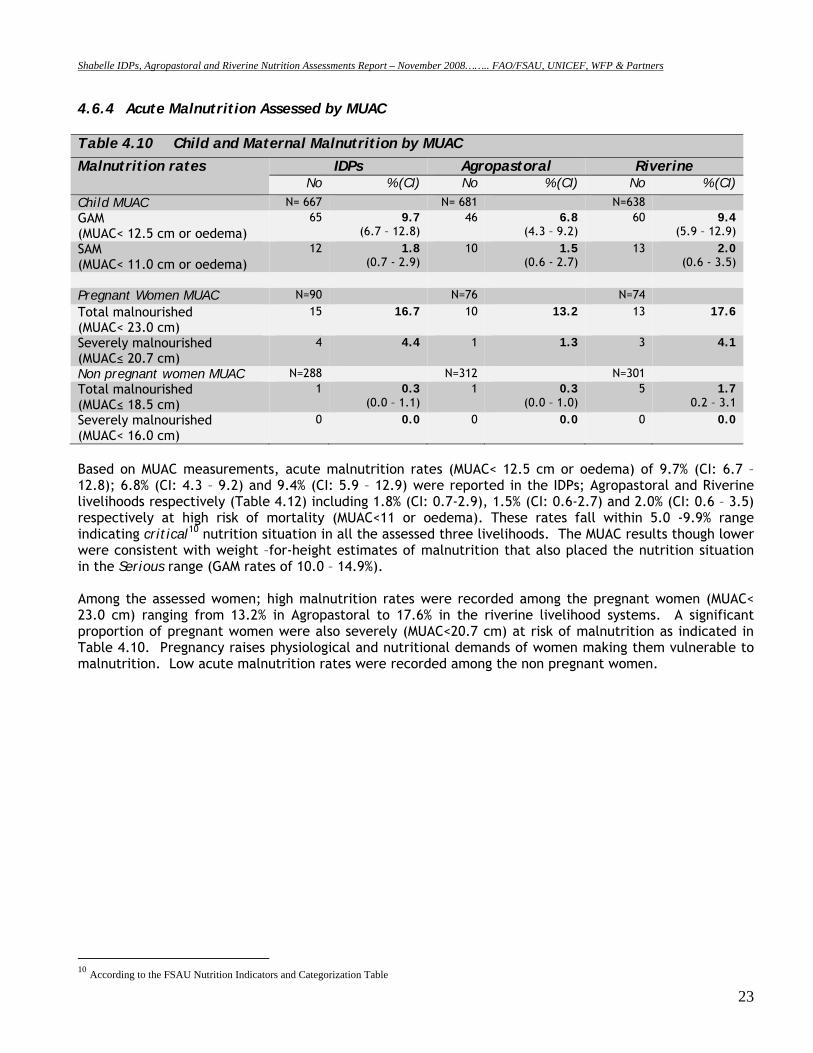
4.6.4 Acute Malnutrition Assessed by MUAC Table 4.10 Child and Maternal Malnutrition by MUAC
Malnutrition rates IDPs Agropastoral Riverine No % (CI) No % (CI) No % (CI)
Child MUAC N= 667 N= 681 N=638 GAM (MUAC< 12.5 cm or oedema)
65 9.7 (6.7 – 12.8)
46 6.8 (4.3 – 9.2)
60 9.4 (5.9 – 12.9)
SAM (MUAC< 11.0 cm or oedema)
12 1.8 (0.7 - 2.9)
10 1.5 (0.6 - 2.7)
13 2.0 (0.6 - 3.5)
Pregnant Women MUAC N=90 N=76 N=74 Total malnourished (MUAC< 23.0 cm)
15 16.7
10 13.2
13 17.6
Severely malnourished (MUAC≤ 20.7 cm)
4 4.4
1 1.3
3 4.1
Non pregnant women MUAC N=288 N=312 N=301 Total malnourished (MUAC≤ 18.5 cm)
1 0.3 (0.0 – 1.1)
1 0.3 (0.0 – 1.0)
5 1.7 0.2 – 3.1
Severely malnourished (MUAC< 16.0 cm)
0 0.0
0 0.0
0 0.0
Based on MUAC measurements, acute malnutrition rates (MUAC< 12.5 cm or oedema) of 9.7% (CI: 6.7 – 12.8); 6.8% (CI: 4.3 – 9.2) and 9.4% (CI: 5.9 – 12.9) were reported in the IDPs; Agropastoral and Riverine livelihoods respectively (Table 4.12) including 1.8% (CI: 0.7-2.9), 1.5% (CI: 0.6-2.7) and 2.0% (CI: 0.6 – 3.5) respectively at high risk of mortality (MUAC<11 or oedema). These rates fall within 5.0 -9.9% range indicating critical10 nutrition situation in all the assessed three livelihoods. The MUAC results though lower were consistent with weight –for-height estimates of malnutrition that also placed the nutrition situation in the Serious range (GAM rates of 10.0 – 14.9%). Among the assessed women; high malnutrition rates were recorded among the pregnant women (MUAC< 23.0 cm) ranging from 13.2% in Agropastoral to 17.6% in the riverine livelihood systems. A significant proportion of pregnant women were also severely (MUAC<20.7 cm) at risk of malnutrition as indicated in Table 4.10. Pregnancy raises physiological and nutritional demands of women making them vulnerable to malnutrition. Low acute malnutrition rates were recorded among the non pregnant women.
10 According to the FSAU Nutrition Indicators and Categorization Table
Shabelle IDPs, Agropastoral and Riverine Nutrition Assessments Report – November 2008…….. FAO/FSAU, UNICEF, WFP & Partners
24
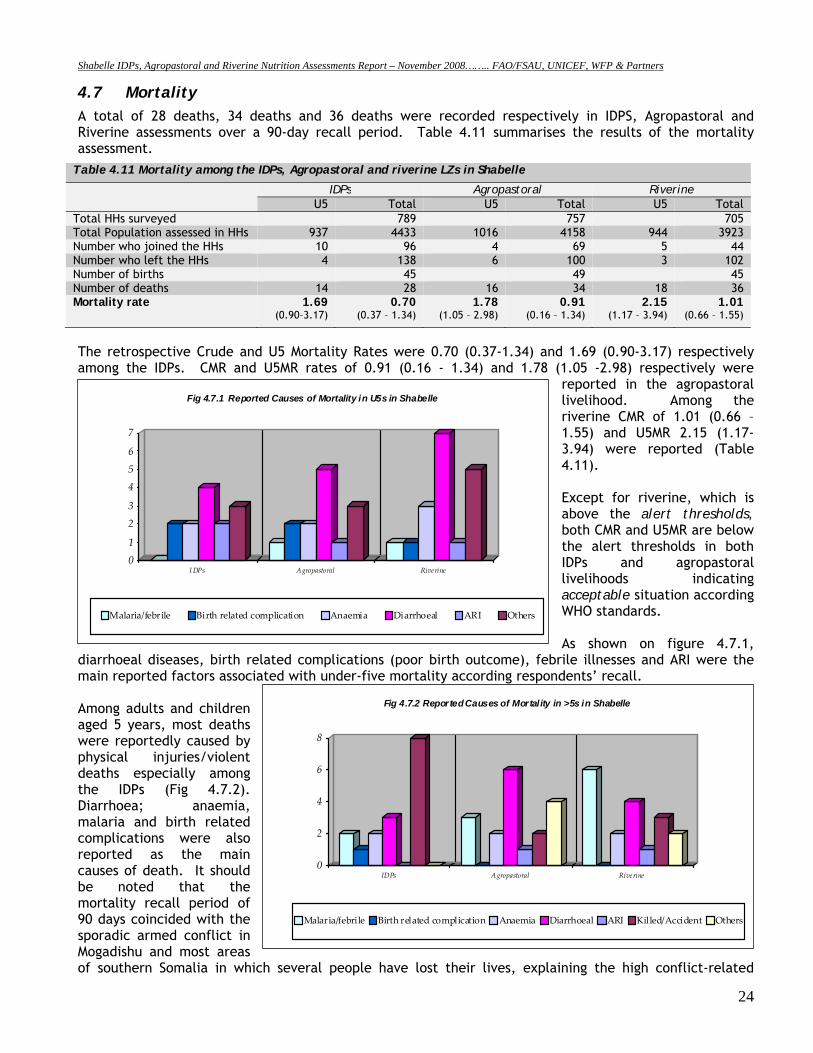
4.7 Mortality
A total of 28 deaths, 34 deaths and 36 deaths were recorded respectively in IDPS, Agropastoral and Riverine assessments over a 90-day recall period. Table 4.11 summarises the results of the mortality assessment.
Table 4.11 Mortality among the IDPs, Agropastoral and riverine LZs in Shabelle
IDPs Agropastoral Riverine U5 Total U5 Total U5 Total
Total HHs surveyed 789 757 705 Total Population assessed in HHs 937 4433 1016 4158 944 3923 Number who joined the HHs 10 96 4 69 5 44 Number who left the HHs 4 138 6 100 3 102 Number of births 45 49 45 Number of deaths 14 28 16 34 18 36 Mortality rate 1.69
(0.90–3.17) 0.70
(0.37 – 1.34) 1.78
(1.05 – 2.98) 0.91
(0.16 – 1.34) 2.15
(1.17 – 3.94) 1.01
(0.66 – 1.55)
The retrospective Crude and U5 Mortality Rates were 0.70 (0.37-1.34) and 1.69 (0.90-3.17) respectively among the IDPs. CMR and U5MR rates of 0.91 (0.16 - 1.34) and 1.78 (1.05 -2.98) respectively were
reported in the agropastoral livelihood. Among the riverine CMR of 1.01 (0.66 – 1.55) and U5MR 2.15 (1.17-3.94) were reported (Table 4.11). Except for riverine, which is above the alert thresholds, both CMR and U5MR are below the alert thresholds in both IDPs and agropastoral livelihoods indicating acceptable situation according WHO standards. As shown on figure 4.7.1,
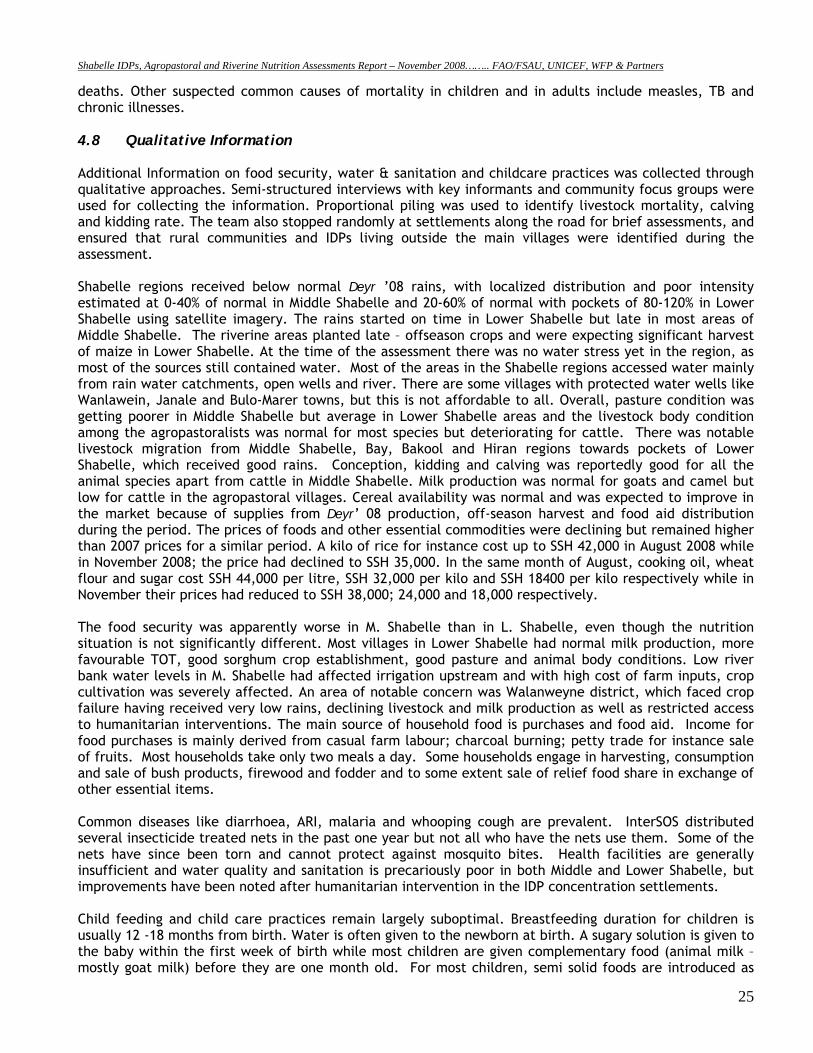
diarrhoeal diseases, birth related complications (poor birth outcome), febrile illnesses and ARI were the main reported factors associated with under-five mortality according respondents’ recall. Among adults and children aged 5 years, most deaths were reportedly caused by physical injuries/violent deaths especially among the IDPs (Fig 4.7.2). Diarrhoea; anaemia, malaria and birth related complications were also reported as the main causes of death. It should be noted that the mortality recall period of 90 days coincided with the sporadic armed conflict in Mogadishu and most areas of southern Somalia in which several people have lost their lives, explaining the high conflict-related
01
23
456
7
IDPs Agropastoral Riverine
Fig 4.7.1 Reported Causes of Mortality in U5s in Shabelle
Malaria/febrile Birth related complication Anaemia Diarrhoeal ARI Others
0
2
4
6
8
IDPs Agropastoral Riverine
Fig 4.7.2 Reported Causes of Mortality in >5s in Shabelle
Malaria/febrile Birth related complication Anaemia Diarrhoeal ARI Killed/Accident Others
Shabelle IDPs, Agropastoral and Riverine Nutrition Assessments Report – November 2008…….. FAO/FSAU, UNICEF, WFP & Partners
25
deaths. Other suspected common causes of mortality in children and in adults include measles, TB and chronic illnesses. 4.8 Qualitative Information Additional Information on food security, water & sanitation and childcare practices was collected through qualitative approaches. Semi-structured interviews with key informants and community focus groups were used for collecting the information. Proportional piling was used to identify livestock mortality, calving and kidding rate. The team also stopped randomly at settlements along the road for brief assessments, and ensured that rural communities and IDPs living outside the main villages were identified during the assessment. Shabelle regions received below normal Deyr ’08 rains, with localized distribution and poor intensity estimated at 0-40% of normal in Middle Shabelle and 20-60% of normal with pockets of 80-120% in Lower Shabelle using satellite imagery. The rains started on time in Lower Shabelle but late in most areas of Middle Shabelle. The riverine areas planted late – offseason crops and were expecting significant harvest of maize in Lower Shabelle. At the time of the assessment there was no water stress yet in the region, as most of the sources still contained water. Most of the areas in the Shabelle regions accessed water mainly from rain water catchments, open wells and river. There are some villages with protected water wells like Wanlawein, Janale and Bulo-Marer towns, but this is not affordable to all. Overall, pasture condition was getting poorer in Middle Shabelle but average in Lower Shabelle areas and the livestock body condition among the agropastoralists was normal for most species but deteriorating for cattle. There was notable livestock migration from Middle Shabelle, Bay, Bakool and Hiran regions towards pockets of Lower Shabelle, which received good rains. Conception, kidding and calving was reportedly good for all the animal species apart from cattle in Middle Shabelle. Milk production was normal for goats and camel but low for cattle in the agropastoral villages. Cereal availability was normal and was expected to improve in the market because of supplies from Deyr’ 08 production, off-season harvest and food aid distribution during the period. The prices of foods and other essential commodities were declining but remained higher than 2007 prices for a similar period. A kilo of rice for instance cost up to SSH 42,000 in August 2008 while in November 2008; the price had declined to SSH 35,000. In the same month of August, cooking oil, wheat flour and sugar cost SSH 44,000 per litre, SSH 32,000 per kilo and SSH 18400 per kilo respectively while in November their prices had reduced to SSH 38,000; 24,000 and 18,000 respectively. The food security was apparently worse in M. Shabelle than in L. Shabelle, even though the nutrition situation is not significantly different. Most villages in Lower Shabelle had normal milk production, more favourable TOT, good sorghum crop establishment, good pasture and animal body conditions. Low river bank water levels in M. Shabelle had affected irrigation upstream and with high cost of farm inputs, crop cultivation was severely affected. An area of notable concern was Walanweyne district, which faced crop failure having received very low rains, declining livestock and milk production as well as restricted access to humanitarian interventions. The main source of household food is purchases and food aid. Income for food purchases is mainly derived from casual farm labour; charcoal burning; petty trade for instance sale of fruits. Most households take only two meals a day. Some households engage in harvesting, consumption and sale of bush products, firewood and fodder and to some extent sale of relief food share in exchange of other essential items. Common diseases like diarrhoea, ARI, malaria and whooping cough are prevalent. InterSOS distributed several insecticide treated nets in the past one year but not all who have the nets use them. Some of the nets have since been torn and cannot protect against mosquito bites. Health facilities are generally insufficient and water quality and sanitation is precariously poor in both Middle and Lower Shabelle, but improvements have been noted after humanitarian intervention in the IDP concentration settlements. Child feeding and child care practices remain largely suboptimal. Breastfeeding duration for children is usually 12 -18 months from birth. Water is often given to the newborn at birth. A sugary solution is given to the baby within the first week of birth while most children are given complementary food (animal milk – mostly goat milk) before they are one month old. For most children, semi solid foods are introduced as
Shabelle IDPs, Agropastoral and Riverine Nutrition Assessments Report – November 2008…….. FAO/FSAU, UNICEF, WFP & Partners
26
early as 3-4 months of age and solid foods like rice or canjera are introduced at the age of 8-12 months. Main foods given to infants (1 – 12 years) are goat milk 3 to 4 times a day in most cases and sometimes canjero or rice mixed with sugar and oil/butter and porridge (flour + sugar + oil). Food insecurity/hunger, close pregnancy intervals and sometimes ill health are the major constraints to breastfeeding of young children below two years. However cultural beliefs sometimes also negatively affect breastfeeding as highlighted in the FSAU KAP study. Lack of safe water, cooking & storage facilities and too much domestic work for women were mentioned as the main hindrances to food preparation and storage. Women have to travel long distances at times (during dry spells) or spend a lot of time away from home and do not have enough time to prepare food.
Shabelle IDPs, Agropastoral and Riverine Nutrition Assessments Report – November 2008…….. FAO/FSAU, UNICEF, WFP & Partners
27
5.0 Discussion Results from the three nutrition assessments (IDPS, Agropastoral and Riverine Livelihoods) conducted in the Shabelle regions between 1st and 11th November 2008, by FSAU and partners, indicate that the nutrition situation is Serious (GAM rate of 10-15%) in the three population groups showing a significant improvement among the agropastoral and IDP populations from the Critical levels recorded in the last assessment in May 2008, but no statistically significant change in the riverine population. The retrospective crude and U5 mortality rates (CMR and U5MR) were similar to the May ’08 studies, indicating acceptable levels in two of the three assessments. The improvement in nutrition situation is the result of the humanitarian efforts in food aid, food-for-work, cash-for-work, healthcare and water & sanitation interventions together with some improved food security indicators. Shabelle IDPs in Afgoye corridor and Merka reported a GAM rate (weight for height <-2 Z score or oedema) of 12.3% (9.7-15.5) and a SAM rate of 2.8% (1.7-4.8%) with seven (1.0%) cases of oedema. This indicates a slight improvement from the previous GAM rate of 15.0% (11.5-18.4%), but a significant increase in the proportion of severely malnourished children from the 1.0% (0.2-1.8) including four (0.5%) oedema cases reported in the May 2008 assessment11. The deterioration in SAM rates is likely as a result of continuing influx of IDPs from Mogadishu. Although the GAM results appear lower than the rates reported among the IDP population assessed in May 2008 and indicates a general improvement from critical levels experienced over the previous one year to serious levels, the change is however not statistically significant (p>0.05). In addition, the respective Crude and under five year mortality rates of 0.70 (0.37-1.34) and 1.69 (0.90-3.17) among the IDPS indicated below alert levels, according to WHO classification and no change from CMR and U5MR of 0.96 (0.12-1.81) and 1.47 (0.96-1.99) respectively reported in the previous assessment. Shabelle Agropastoral reported a GAM rate of 12.5% (CI: 10.6-14.6) and a SAM rate of 2.2% (1.3-3.6) including three (0.4%) oedema cases. These results indicate an improvement to Serious nutrition situation from the Critical level of acute malnutrition in the May 2008 assessment, where a GAM rate of 18.1% (14.4-21.8) and a SAM rate of 3.5% (1.7-5.3) including seven oedema cases (0.9%) were reported. The Crude and U5 Mortality rates of 0.91 (0.16-1.34) and 1.78 (1.05-2.98) respectively, among the agro pastoral population in Shabelle regions were acceptable according WHO standards. Shabelle Riverine Assessment reported a GAM rate of 10.8% (8.6-13.5) and a SAM rate of 2.5% (1.4-4.4) that included seven (1.1%) oedema cases, indicating no significant change from the May 2008 assessment which reported a GAM rate of 13.7% (9.6-17.7) and a SAM rate of 3.8% (1.8-5.9) including two (0.3%) oedema cases. The Crude and under five year mortality rates of 1.01 (0.66-1.55) and 2.15 (1.17-3.94) were reported respectively, both levels above the alert threshold levels of 1/10,000/day and 2/10,000/day and indicating an alert situation (WHO standards) and illustrating an underlying acute crisis in these regions. The proportions of children reported to have suffered from one or more communicable childhood diseases during the two weeks prior to the assessment were 47.8%, 37.7% and 48.9 in the assessed IDPs, agropastoral and riverine populations respectively. As shown on Table 1, the incidence of reported diarrhoea in IDPs, Agropastoral and Riverine populations (21.0%; 13.7% and 15.5% respectively) in the two weeks prior to the assessment were high. High incidences of ARI (27.0%, 21.3% and 27.1% respectively) and febrile illnesses (22.9%, 16.3% and 18.0% in the IDPs, Agropastoral and Riverine populations respectively) were also reported in the three livelihoods. These levels were consistent with seasonal morbidity patterns recorded from the health facilities. Rapid Diagnostic Tests (RDT) conducted for malaria however reported very low (<1%) prevalence rates of 0.6% (N=1310), 0.1% (N=1612) and 0.8% (N=1257) positive for Plasmodium falciparum respectively. Analysis has shown significant association between acute malnutrition and morbidity rates. Children who were reported to have been ill within two weeks prior to the assessment were more likely to be acutely malnourished (p<0.05). For example, in the riverine livelihood, children who had reportedly fallen ill were nearly 3 times more likely to be acutely
11 FSAU Nutrition Update, June 2008.
Shabelle IDPs, Agropastoral and Riverine Nutrition Assessments Report – November 2008…….. FAO/FSAU, UNICEF, WFP & Partners
28
malnourished than those who were well (RR=2.84; CI: 1.54-5.26), and children who reportedly had diarrhoea were nearly 3.2 times more likely to be acutely malnourished than those who did not reportedly have diarrhoea (RR=3.2; CI: 1.72-6.10). Past studies have shown that vitamin A greatly improves the immunity of individuals; hence reduce the disease burden of a population. However, as shown in table 3, Vitamin A supplementation as well as polio and measles immunization status, were far below the WHO recommended coverage of 95%. While diseases continue to predispose children to malnutrition, concern remains on access to safe water, sanitation, access to health services and low coverage of health programmes and poor child care and feeding practices. With the exception of the IDPs, very low proportion of the households had access to safe drinking water (11.0% and 27.5%), sanitation facilities (28.8% and 48.1%) and health facilities (20.7% and 26.2%) in agropastoral and riverine respectively. Even though interventions targeting the IDP population have significantly improved access to safe drinking water (74.5%), latrines (89.0%) and health facilities, (55.2%) sustained efforts are required to provide further improvements and to mitigate the risks to morbidity and malnutrition. Although good deyr ’08/09 rains were reported in the Shabelle regions resulting into favourable food security indicators such as improved milk consumption, dietary diversity and increased agricultural produce (off-season yield) among the riverine and agropastoral populations, the prices for foods and other essential commodities, though declining are still high, limiting access by the poor households. Dietary diversity was reportedly high among all the three livelihood groups (96.0%, 92.4% and 97.6% in IDPs, agropastoral and riverine groups respectively). The food security was apparently worse in M. Shabelle than in L. Shabelle, even though the nutrition situation is not significantly different. Most villages in Lower Shabelle had normal milk production, more favourable TOT, good sorghum crop establishment, good pasture and animal body conditions. Low river bank water levels in M. Shabelle had affected irrigation upstream and with high cost of farm inputs, crop cultivation was severely affected. An area of notable concern was Walanweyne district, which besides reporting high numbers of malnourished children was faced with crop failure having received very low rains, declining livestock and milk production as well as restricted access to humanitarian interventions. The main source of household food is purchases and food aid. Income for food purchases is mainly derived from casual farm labour; charcoal burning; petty trade for instance sale of fruits. Most households take only two meals a day. Some households engage in harvesting, consumption and sale of bush products, firewood and fodder and to some extent sale of relief food share in exchange of other essential items. In conclusion, the Shabelle IDPs, agropastoral and riverine populations have reported a sustained or improved nutrition situation. The improved dietary diversity across the three livelihood groups is undoubtedly a contributing factor. Other influences include a controlled AWD outbreak and humanitarian support, such as cash-for-work and food assistance programmes. However, issues of child care and feeding practices continue to compromise the nutritional status of children, as is access to sanitation and safe water in the agropastoral and riverine populations. Insecurity, unemployment, stressed livelihoods, poor child feeding, poor access to water and sanitation and poor access to health services remain the main underlying causes of malnutrition in the Shabelle regions. The IDP population, despite showing a slight improvement in the nutrition levels, still face a precarious situation. This demonstrates the need for continued support to the IDPs who recently fled the increased civil insecurity in Mogadishu and surrounding areas.
Shabelle IDPs, Agropastoral and Riverine Nutrition Assessments Report – November 2008…….. FAO/FSAU, UNICEF, WFP & Partners
29
6. 0 Recommendations The serious nutrition, health and food security situation in Shabelle calls for intervention efforts to address both immediate life saving needs in addition to developing longer term strategies to enhance the provision of basic services, sustainable strategies for livelihood support and social protection mechanisms. Specific recommendations include: Immediate Interventions
• Improving coverage for health programmes, especially for measles vaccination and vitamin A
supplementation. Vigorous campaigns are required in the Shabelle regions especially among the agropastoral and riverine communities.
• Rehabilitation of acutely malnourished children through selective feeding programs and active case finding until household food security is restored and critical public health issues are addressed. All options to address this through effective and non-damaging measures need to be considered. Capacity building of the existing health facilities and the community to manage acutely malnourished children could be explored.
• There is need to focus on programmes that improve and sustain dietary diversity and consumption of micronutrient rich foods. Food distribution for pulses and micronutrient enriched oil could help improve dietary diversity especially among the IDPs.
• Intervention programmes on water, sanitation and hygiene practices including health education are essential.
Long term Interventions
• Rehabilitation/protection of water systems including the well and water catchments (such as capping of wells) in anticipation of seasonal flooding. The community should be trained on sanitation of the water systems
• There is need for establishment or strengthening of health facilities and satellite services especially in rural villages where there are no health facilities
• Intensifying health and nutrition education activities at the household level to address care concerns, targeting mothers, and other caregivers. The main areas of focus should include promoting exclusive breastfeeding, appropriate infant and young child feeding, dietary diversification, and improvements in household hygiene including health care practices.
• Peace building and conflict resolution remain the most crucial factors for the restoring and sustaining livelihoods in the Shabelle regions and Somalia as a whole, including returning of the displaced persons back to their homes. Efforts being made within and outside the Shabelle region to this effect are greatly encouraged.
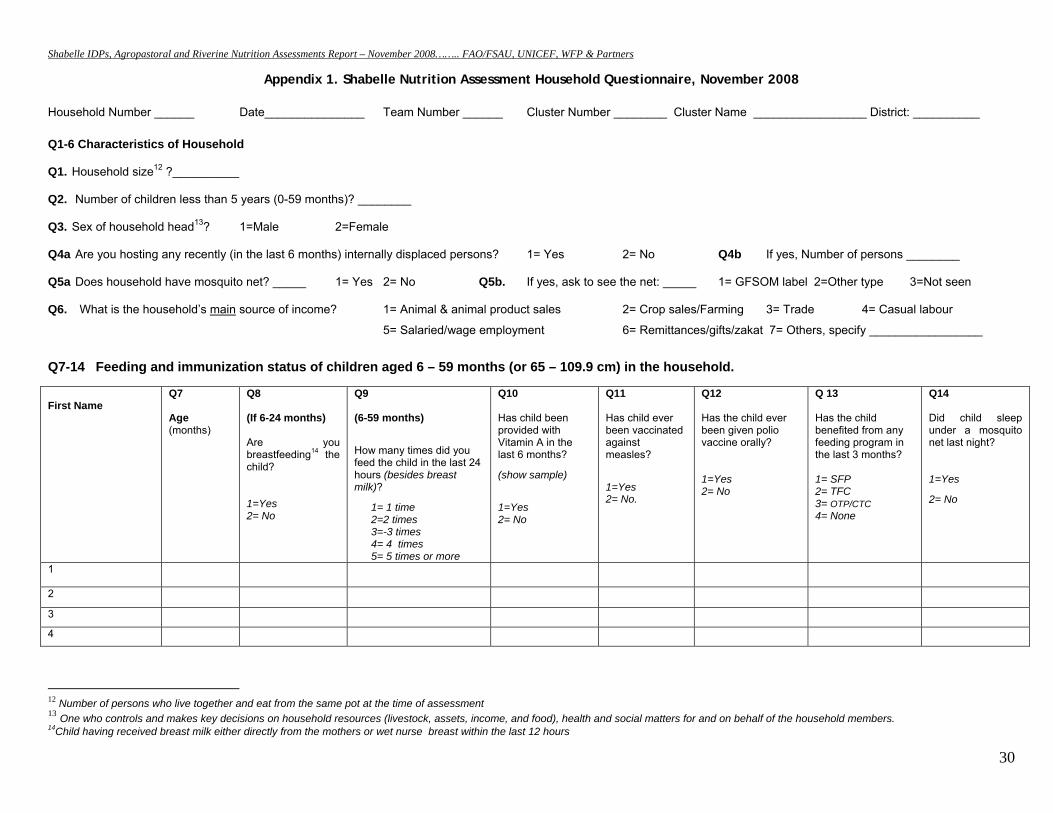
Shabelle IDPs, Agropastoral and Riverine Nutrition Assessments Report – November 2008…….. FAO/FSAU, UNICEF, WFP & Partners
30
Appendix 1. Shabelle Nutrition Assessment Household Questionnaire, November 2008
Household Number ______ Date_______________ Team Number ______ Cluster Number ________ Cluster Name _________________ District: __________
Q1-6 Characteristics of Household
Q1. Household size12 ?__________
Q2. Number of children less than 5 years (0-59 months)? ________
Q3. Sex of household head13? 1=Male 2=Female
Q4a Are you hosting any recently (in the last 6 months) internally displaced persons? 1= Yes 2= No Q4b If yes, Number of persons ________
Q5a Does household have mosquito net? _____ 1= Yes 2= No Q5b. If yes, ask to see the net: _____ 1= GFSOM label 2=Other type 3=Not seen
Q6. What is the household’s main source of income? 1= Animal & animal product sales 2= Crop sales/Farming 3= Trade 4= Casual labour
5= Salaried/wage employment 6= Remittances/gifts/zakat 7= Others, specify _________________
Q7-14 Feeding and immunization status of children aged 6 – 59 months (or 65 – 109.9 cm) in the household. First Name
Q7 Age (months)
Q8 (If 6-24 months) Are you breastfeeding14 the child? 1=Yes 2= No
Q9 (6-59 months)
How many times did you feed the child in the last 24 hours (besides breast milk)?
1= 1 time 2=2 times 3=-3 times 4= 4 times 5= 5 times or more
Q10 Has child been provided with Vitamin A in the last 6 months?
(show sample)
1=Yes 2= No
Q11 Has child ever been vaccinated against measles?
1=Yes 2= No.
Q12 Has the child ever been given polio vaccine orally? 1=Yes 2= No
Q 13 Has the child benefited from any feeding program in the last 3 months? 1= SFP 2= TFC 3= OTP/CTC 4= None
Q14 Did child sleep under a mosquito net last night? 1=Yes
2= No
1
2
3
4
12 Number of persons who live together and eat from the same pot at the time of assessment 13 One who controls and makes key decisions on household resources (livestock, assets, income, and food), health and social matters for and on behalf of the household members. 14Child having received breast milk either directly from the mothers or wet nurse breast within the last 12 hours
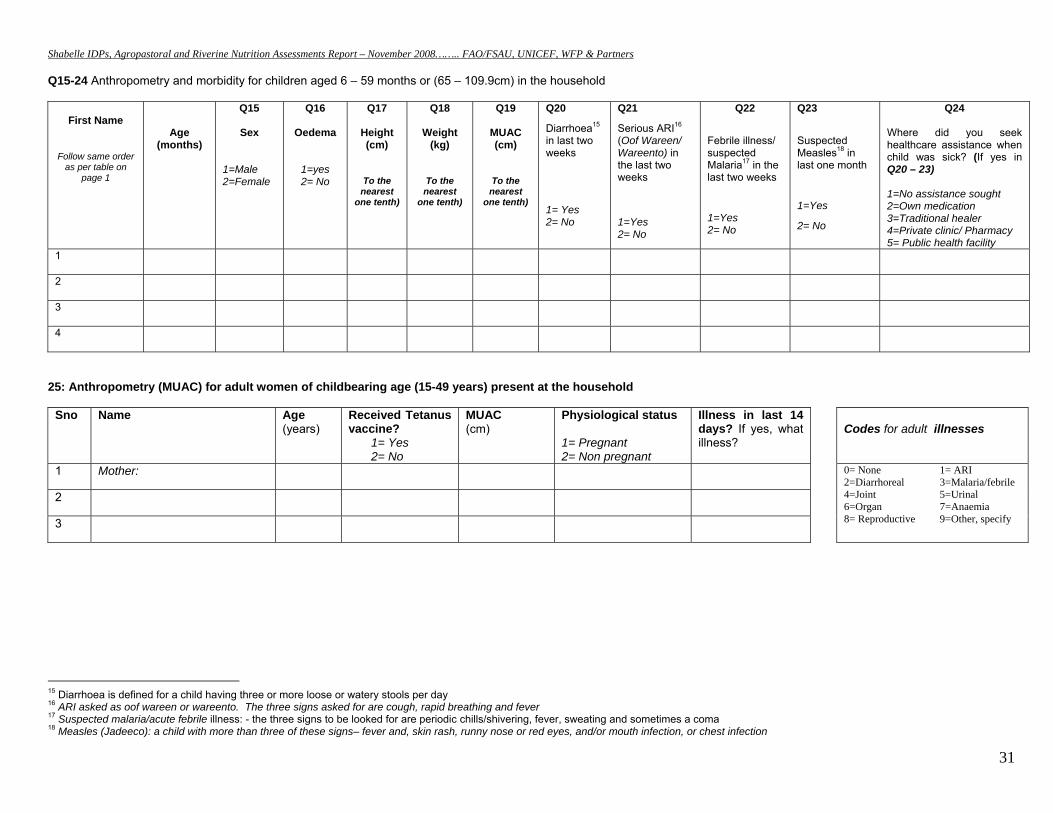
Shabelle IDPs, Agropastoral and Riverine Nutrition Assessments Report – November 2008…….. FAO/FSAU, UNICEF, WFP & Partners
31
Q15-24 Anthropometry and morbidity for children aged 6 – 59 months or (65 – 109.9cm) in the household
First Name
Follow same order as per table on
page 1
Age (months)
Q15
Sex
1=Male 2=Female
Q16
Oedema
1=yes 2= No
Q17
Height (cm)
To the nearest
one tenth)
Q18
Weight (kg)
To the nearest
one tenth)
Q19
MUAC (cm)
To the nearest
one tenth)
Q20
Diarrhoea15 in last two weeks
1= Yes 2= No
Q21
Serious ARI16 (Oof Wareen/ Wareento) in the last two weeks
1=Yes 2= No
Q22
Febrile illness/ suspected Malaria17 in the last two weeks
1=Yes 2= No
Q23
Suspected Measles18 in last one month
1=Yes
2= No
Q24 Where did you seek healthcare assistance when child was sick? (If yes in Q20 – 23) 1=No assistance sought 2=Own medication 3=Traditional healer 4=Private clinic/ Pharmacy 5= Public health facility
1 2 3 4
25: Anthropometry (MUAC) for adult women of childbearing age (15-49 years) present at the household
Sno Name Age (years)
Received Tetanus vaccine?
1= Yes 2= No
MUAC(cm)
Physiological status 1= Pregnant 2= Non pregnant
Illness in last 14 days? If yes, what illness?
Codes for adult illnesses
1 Mother: 0= None 1= ARI 2=Diarrhoreal 3=Malaria/febrile 4=Joint 5=Urinal 6=Organ 7=Anaemia 8= Reproductive 9=Other, specify
2
3
15 Diarrhoea is defined for a child having three or more loose or watery stools per day 16 ARI asked as oof wareen or wareento. The three signs asked for are cough, rapid breathing and fever 17 Suspected malaria/acute febrile illness: - the three signs to be looked for are periodic chills/shivering, fever, sweating and sometimes a coma 18 Measles (Jadeeco): a child with more than three of these signs– fever and, skin rash, runny nose or red eyes, and/or mouth infection, or chest infection
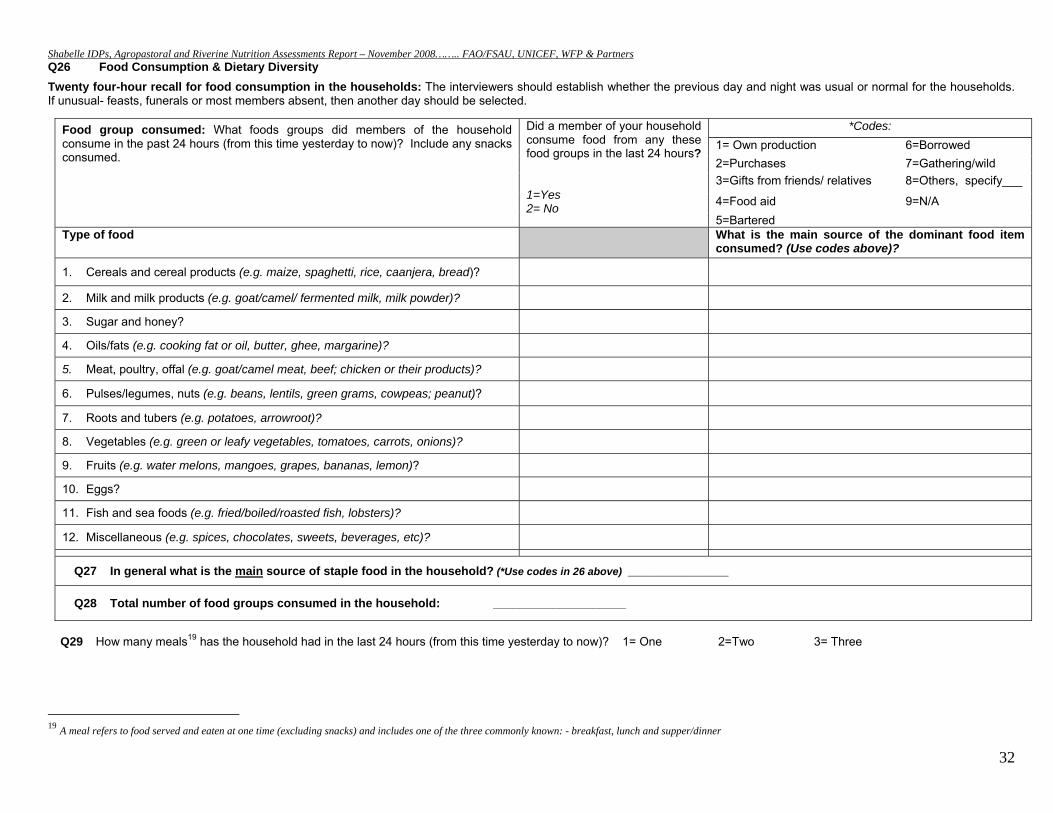
Shabelle IDPs, Agropastoral and Riverine Nutrition Assessments Report – November 2008…….. FAO/FSAU, UNICEF, WFP & Partners
32
Q26 Food Consumption & Dietary Diversity
Twenty four-hour recall for food consumption in the households: The interviewers should establish whether the previous day and night was usual or normal for the households. If unusual- feasts, funerals or most members absent, then another day should be selected.
Q29 How many meals19 has the household had in the last 24 hours (from this time yesterday to now)? 1= One 2=Two 3= Three
19 A meal refers to food served and eaten at one time (excluding snacks) and includes one of the three commonly known: - breakfast, lunch and supper/dinner
Food group consumed: What foods groups did members of the household consume in the past 24 hours (from this time yesterday to now)? Include any snacks consumed.
Did a member of your household consume food from any these food groups in the last 24 hours? 1=Yes 2= No
*Codes: 1= Own production 6=Borrowed 2=Purchases 7=Gathering/wild 3=Gifts from friends/ relatives 8=Others, specify___
4=Food aid 9=N/A 5=Bartered
Type of food What is the main source of the dominant food item consumed? (Use codes above)?
1. Cereals and cereal products (e.g. maize, spaghetti, rice, caanjera, bread)?
2. Milk and milk products (e.g. goat/camel/ fermented milk, milk powder)?
3. Sugar and honey?
4. Oils/fats (e.g. cooking fat or oil, butter, ghee, margarine)?
5. Meat, poultry, offal (e.g. goat/camel meat, beef; chicken or their products)?
6. Pulses/legumes, nuts (e.g. beans, lentils, green grams, cowpeas; peanut)?
7. Roots and tubers (e.g. potatoes, arrowroot)?
8. Vegetables (e.g. green or leafy vegetables, tomatoes, carrots, onions)?
9. Fruits (e.g. water melons, mangoes, grapes, bananas, lemon)?
10. Eggs?
11. Fish and sea foods (e.g. fried/boiled/roasted fish, lobsters)?
12. Miscellaneous (e.g. spices, chocolates, sweets, beverages, etc)?
Q27 In general what is the main source of staple food in the household? (*Use codes in 26 above) _________________
Q28 Total number of food groups consumed in the household: ____________________
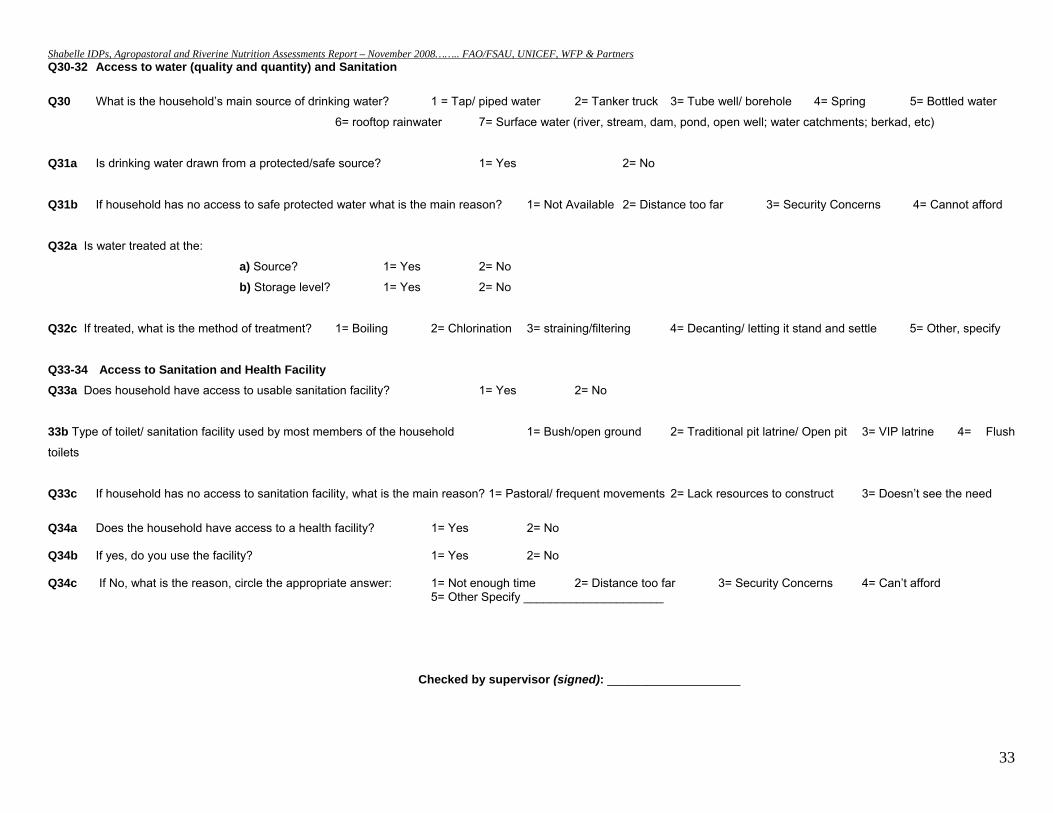
Shabelle IDPs, Agropastoral and Riverine Nutrition Assessments Report – November 2008…….. FAO/FSAU, UNICEF, WFP & Partners
33
Q30-32 Access to water (quality and quantity) and Sanitation Q30 What is the household’s main source of drinking water? 1 = Tap/ piped water 2= Tanker truck 3= Tube well/ borehole 4= Spring 5= Bottled water
6= rooftop rainwater 7= Surface water (river, stream, dam, pond, open well; water catchments; berkad, etc)
Q31a Is drinking water drawn from a protected/safe source? 1= Yes 2= No
Q31b If household has no access to safe protected water what is the main reason? 1= Not Available 2= Distance too far 3= Security Concerns 4= Cannot afford
Q32a Is water treated at the:
a) Source? 1= Yes 2= No
b) Storage level? 1= Yes 2= No
Q32c If treated, what is the method of treatment? 1= Boiling 2= Chlorination 3= straining/filtering 4= Decanting/ letting it stand and settle 5= Other, specify
Q33-34 Access to Sanitation and Health Facility Q33a Does household have access to usable sanitation facility? 1= Yes 2= No
33b Type of toilet/ sanitation facility used by most members of the household 1= Bush/open ground 2= Traditional pit latrine/ Open pit 3= VIP latrine 4= Flush
toilets
Q33c If household has no access to sanitation facility, what is the main reason? 1= Pastoral/ frequent movements 2= Lack resources to construct 3= Doesn’t see the need
Q34a Does the household have access to a health facility? 1= Yes 2= No Q34b If yes, do you use the facility? 1= Yes 2= No Q34c If No, what is the reason, circle the appropriate answer: 1= Not enough time 2= Distance too far 3= Security Concerns 4= Can’t afford 5= Other Specify _____________________
Checked by supervisor (signed): ____________________
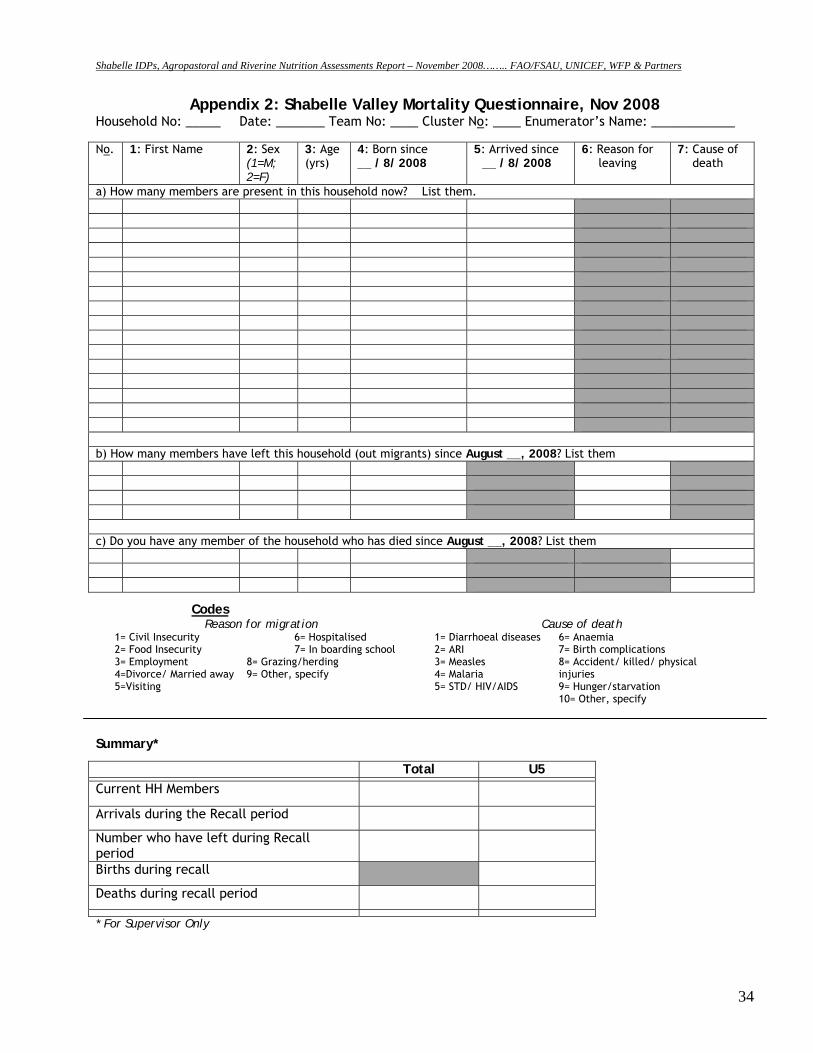
Shabelle IDPs, Agropastoral and Riverine Nutrition Assessments Report – November 2008…….. FAO/FSAU, UNICEF, WFP & Partners
34
Appendix 2: Shabelle Valley Mortality Questionnaire, Nov 2008 Household No: _____ Date: _______ Team No: ____ Cluster No: ____ Enumerator’s Name: ____________ No. 1: First Name 2: Sex
(1=M; 2=F)
3: Age (yrs)
4: Born since __ / 8/ 2008
5: Arrived since __ / 8/ 2008
6: Reason for leaving
7: Cause of death
a) How many members are present in this household now? List them. b) How many members have left this household (out migrants) since August __, 2008? List them c) Do you have any member of the household who has died since August __, 2008? List them
Codes Reason for migration Cause of death
1= Civil Insecurity 6= Hospitalised 2= Food Insecurity 7= In boarding school 3= Employment 8= Grazing/herding 4=Divorce/ Married away 9= Other, specify 5=Visiting
1= Diarrhoeal diseases 2= ARI 3= Measles 4= Malaria 5= STD/ HIV/AIDS
6= Anaemia 7= Birth complications 8= Accident/ killed/ physical injuries 9= Hunger/starvation 10= Other, specify
Summary*
Total U5
Current HH Members
Arrivals during the Recall period
Number who have left during Recall period
Births during recall
Deaths during recall period
* For Supervisor Only
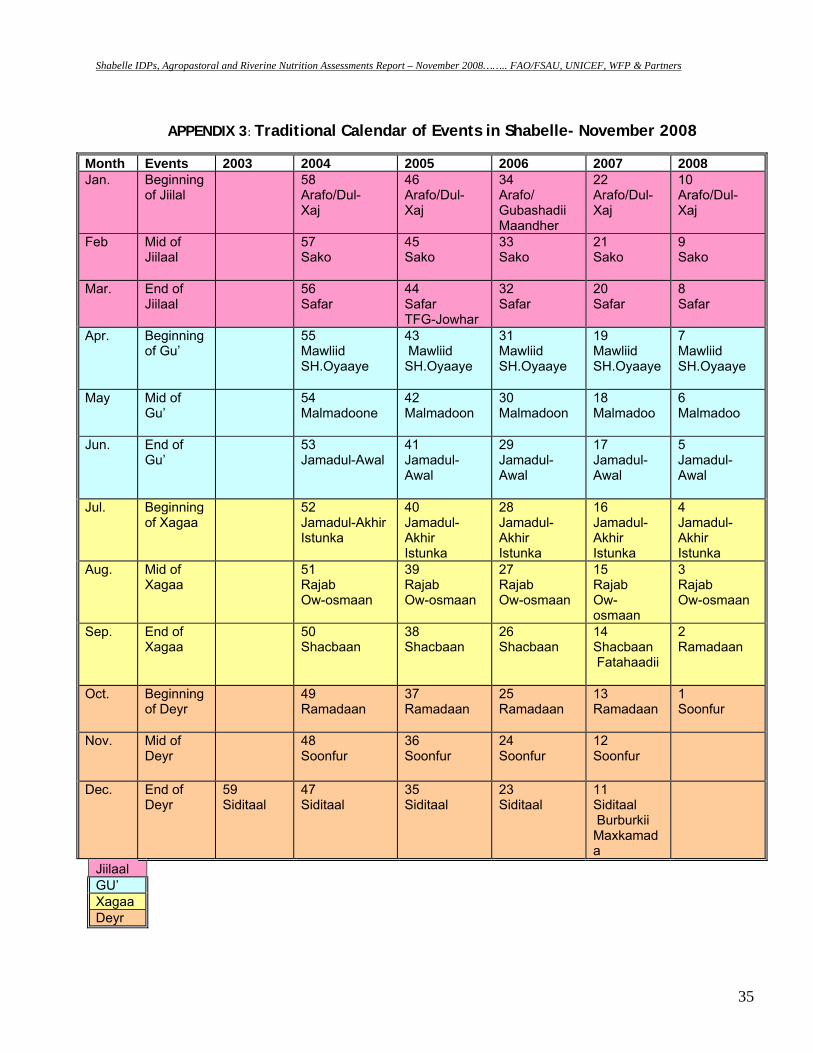
Shabelle IDPs, Agropastoral and Riverine Nutrition Assessments Report – November 2008…….. FAO/FSAU, UNICEF, WFP & Partners
35
APPENDIX 3: Traditional Calendar of Events in Shabelle- November 2008
Month Events 2003 2004 2005 2006 2007 2008 Jan. Beginning
of Jiilal 58
Arafo/Dul- Xaj
46 Arafo/Dul- Xaj
34 Arafo/ Gubashadii Maandher
22 Arafo/Dul- Xaj
10 Arafo/Dul- Xaj
Feb Mid of Jiilaal
57 Sako
45 Sako
33 Sako
21 Sako
9 Sako
Mar. End of Jiilaal
56 Safar
44 Safar TFG-Jowhar
32 Safar
20 Safar
8 Safar
Apr. Beginning of Gu’
55 Mawliid SH.Oyaaye
43 Mawliid SH.Oyaaye
31 Mawliid SH.Oyaaye
19 Mawliid SH.Oyaaye
7 Mawliid SH.Oyaaye
May Mid of Gu’
54 Malmadoone
42 Malmadoon
30 Malmadoon
18 Malmadoo
6 Malmadoo
Jun.
End of Gu’
53 Jamadul-Awal
41 Jamadul-Awal
29 Jamadul- Awal
17 Jamadul- Awal
5 Jamadul- Awal
Jul. Beginning of Xagaa
52 Jamadul-Akhir Istunka
40 Jamadul-Akhir Istunka
28 Jamadul-Akhir Istunka
16 Jamadul-Akhir Istunka
4 Jamadul-Akhir Istunka
Aug. Mid of Xagaa
51 Rajab Ow-osmaan
39 Rajab Ow-osmaan
27 Rajab Ow-osmaan
15 Rajab Ow-osmaan
3 Rajab Ow-osmaan
Sep. End of Xagaa
50 Shacbaan
38 Shacbaan
26 Shacbaan
14 Shacbaan Fatahaadii
2 Ramadaan
Oct. Beginning of Deyr
49 Ramadaan
37 Ramadaan
25 Ramadaan
13 Ramadaan
1 Soonfur
Nov. Mid of Deyr
48 Soonfur
36 Soonfur
24 Soonfur
12 Soonfur
Dec. End of Deyr
59 Siditaal
47 Siditaal
35 Siditaal
23 Siditaal
11 Siditaal Burburkii Maxkamada
Jiilaal GU’ Xagaa Deyr
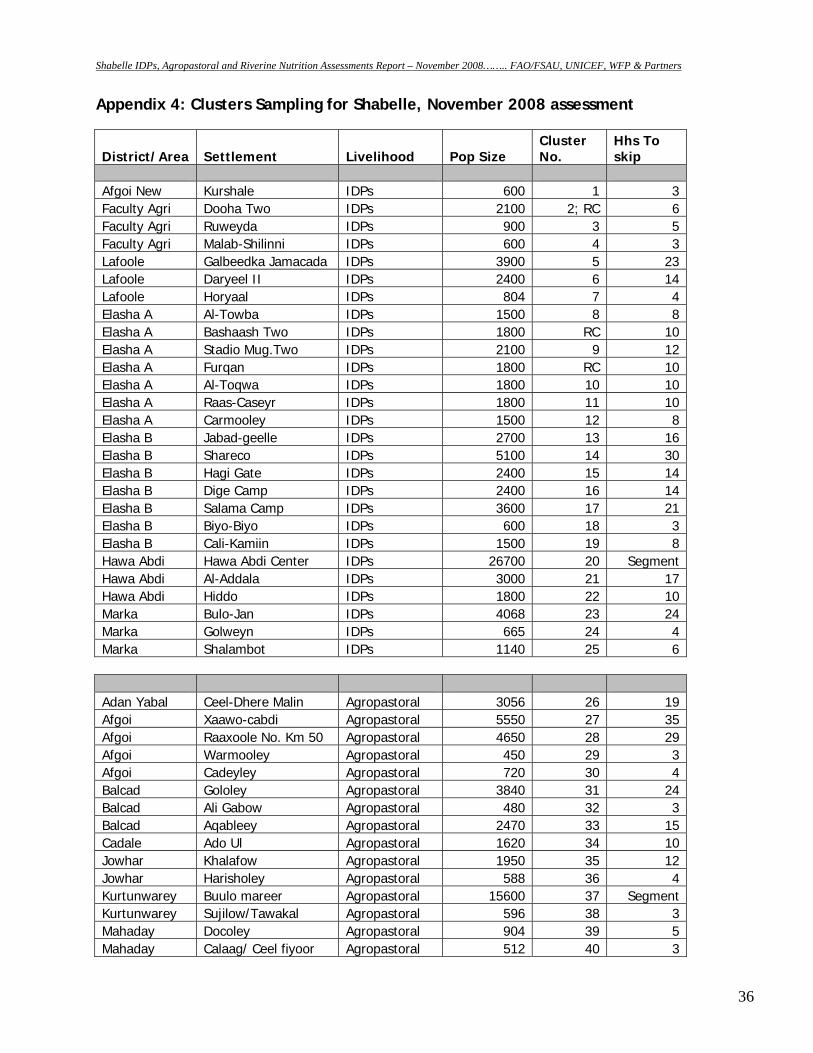
Shabelle IDPs, Agropastoral and Riverine Nutrition Assessments Report – November 2008…….. FAO/FSAU, UNICEF, WFP & Partners
36
Appendix 4: Clusters Sampling for Shabelle, November 2008 assessment
District/Area Settlement Livelihood Pop Size Cluster No.
Hhs To skip
Afgoi New Kurshale IDPs 600 1 3Faculty Agri Dooha Two IDPs 2100 2; RC 6Faculty Agri Ruweyda IDPs 900 3 5Faculty Agri Malab-Shilinni IDPs 600 4 3Lafoole Galbeedka Jamacada IDPs 3900 5 23Lafoole Daryeel II IDPs 2400 6 14Lafoole Horyaal IDPs 804 7 4Elasha A Al-Towba IDPs 1500 8 8Elasha A Bashaash Two IDPs 1800 RC 10Elasha A Stadio Mug.Two IDPs 2100 9 12Elasha A Furqan IDPs 1800 RC 10Elasha A Al-Toqwa IDPs 1800 10 10Elasha A Raas-Caseyr IDPs 1800 11 10Elasha A Carmooley IDPs 1500 12 8Elasha B Jabad-geelle IDPs 2700 13 16Elasha B Shareco IDPs 5100 14 30Elasha B Hagi Gate IDPs 2400 15 14Elasha B Dige Camp IDPs 2400 16 14Elasha B Salama Camp IDPs 3600 17 21Elasha B Biyo-Biyo IDPs 600 18 3Elasha B Cali-Kamiin IDPs 1500 19 8Hawa Abdi Hawa Abdi Center IDPs 26700 20 SegmentHawa Abdi Al-Addala IDPs 3000 21 17Hawa Abdi Hiddo IDPs 1800 22 10Marka Bulo-Jan IDPs 4068 23 24Marka Golweyn IDPs 665 24 4Marka Shalambot IDPs 1140 25 6 Adan Yabal Ceel-Dhere Malin Agropastoral 3056 26 19Afgoi Xaawo-cabdi Agropastoral 5550 27 35Afgoi Raaxoole No. Km 50 Agropastoral 4650 28 29Afgoi Warmooley Agropastoral 450 29 3Afgoi Cadeyley Agropastoral 720 30 4Balcad Gololey Agropastoral 3840 31 24Balcad Ali Gabow Agropastoral 480 32 3Balcad Aqableey Agropastoral 2470 33 15Cadale Ado Ul Agropastoral 1620 34 10Jowhar Khalafow Agropastoral 1950 35 12Jowhar Harisholey Agropastoral 588 36 4Kurtunwarey Buulo mareer Agropastoral 15600 37 SegmentKurtunwarey Sujilow/Tawakal Agropastoral 596 38 3Mahaday Docoley Agropastoral 904 39 5Mahaday Calaag/ Ceel fiyoor Agropastoral 512 40 3
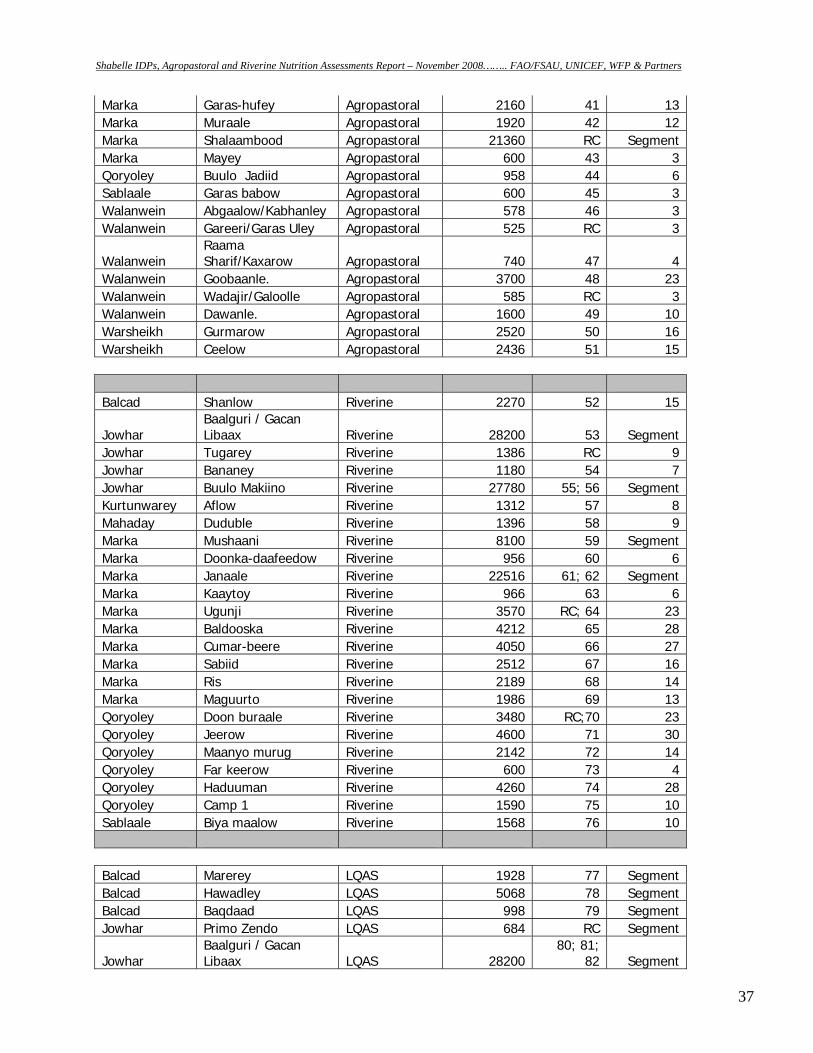
Shabelle IDPs, Agropastoral and Riverine Nutrition Assessments Report – November 2008…….. FAO/FSAU, UNICEF, WFP & Partners
37
Marka Garas-hufey Agropastoral 2160 41 13Marka Muraale Agropastoral 1920 42 12Marka Shalaambood Agropastoral 21360 RC SegmentMarka Mayey Agropastoral 600 43 3Qoryoley Buulo Jadiid Agropastoral 958 44 6Sablaale Garas babow Agropastoral 600 45 3Walanwein Abgaalow/Kabhanley Agropastoral 578 46 3Walanwein Gareeri/Garas Uley Agropastoral 525 RC 3
Walanwein Raama Sharif/Kaxarow Agropastoral 740 47 4
Walanwein Goobaanle. Agropastoral 3700 48 23Walanwein Wadajir/Galoolle Agropastoral 585 RC 3Walanwein Dawanle. Agropastoral 1600 49 10Warsheikh Gurmarow Agropastoral 2520 50 16Warsheikh Ceelow Agropastoral 2436 51 15 Balcad Shanlow Riverine 2270 52 15
Jowhar Baalguri / Gacan Libaax Riverine 28200 53 Segment
Jowhar Tugarey Riverine 1386 RC 9Jowhar Bananey Riverine 1180 54 7Jowhar Buulo Makiino Riverine 27780 55; 56 SegmentKurtunwarey Aflow Riverine 1312 57 8Mahaday Duduble Riverine 1396 58 9Marka Mushaani Riverine 8100 59 SegmentMarka Doonka-daafeedow Riverine 956 60 6Marka Janaale Riverine 22516 61; 62 SegmentMarka Kaaytoy Riverine 966 63 6Marka Ugunji Riverine 3570 RC; 64 23Marka Baldooska Riverine 4212 65 28Marka Cumar-beere Riverine 4050 66 27Marka Sabiid Riverine 2512 67 16Marka Ris Riverine 2189 68 14Marka Maguurto Riverine 1986 69 13Qoryoley Doon buraale Riverine 3480 RC;70 23Qoryoley Jeerow Riverine 4600 71 30Qoryoley Maanyo murug Riverine 2142 72 14Qoryoley Far keerow Riverine 600 73 4Qoryoley Haduuman Riverine 4260 74 28Qoryoley Camp 1 Riverine 1590 75 10Sablaale Biya maalow Riverine 1568 76 10
Balcad Marerey LQAS 1928 77 SegmentBalcad Hawadley LQAS 5068 78 SegmentBalcad Baqdaad LQAS 998 79 SegmentJowhar Primo Zendo LQAS 684 RC Segment
Jowhar Baalguri / Gacan Libaax LQAS 28200
80; 81; 82 Segment
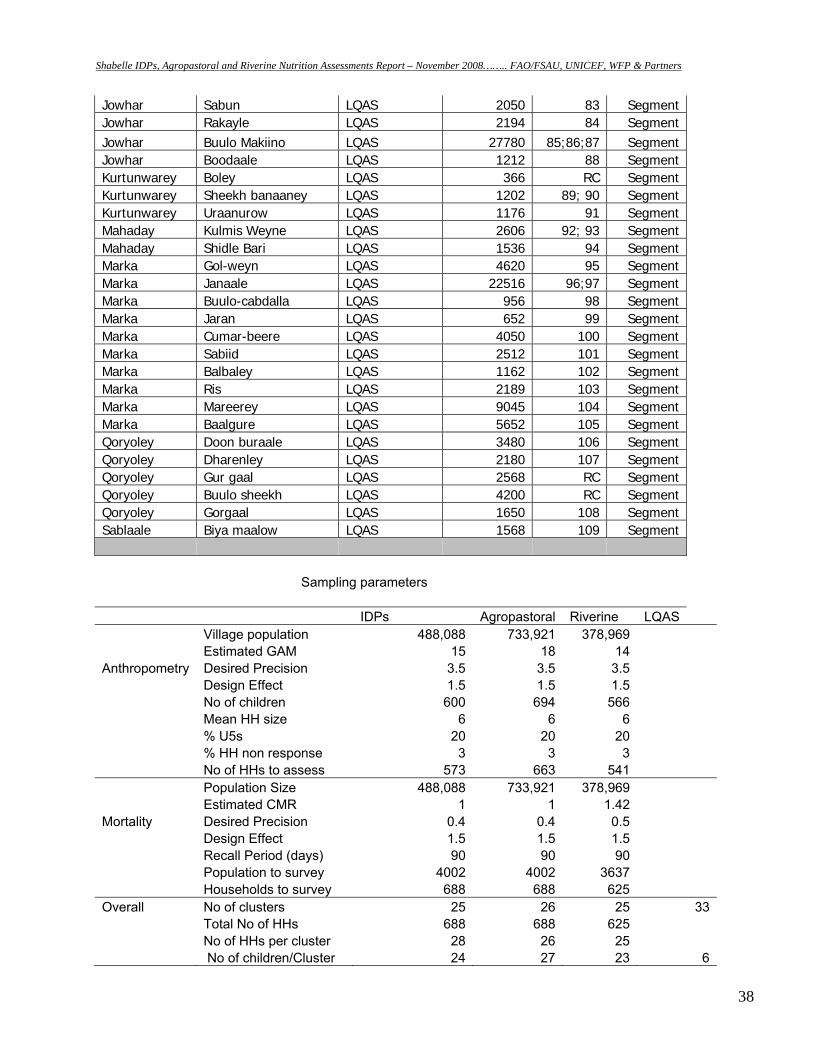
Shabelle IDPs, Agropastoral and Riverine Nutrition Assessments Report – November 2008…….. FAO/FSAU, UNICEF, WFP & Partners
38
Jowhar Sabun LQAS 2050 83 SegmentJowhar Rakayle LQAS 2194 84 SegmentJowhar Buulo Makiino LQAS 27780 85;86;87 SegmentJowhar Boodaale LQAS 1212 88 SegmentKurtunwarey Boley LQAS 366 RC SegmentKurtunwarey Sheekh banaaney LQAS 1202 89; 90 SegmentKurtunwarey Uraanurow LQAS 1176 91 SegmentMahaday Kulmis Weyne LQAS 2606 92; 93 SegmentMahaday Shidle Bari LQAS 1536 94 SegmentMarka Gol-weyn LQAS 4620 95 SegmentMarka Janaale LQAS 22516 96;97 SegmentMarka Buulo-cabdalla LQAS 956 98 SegmentMarka Jaran LQAS 652 99 SegmentMarka Cumar-beere LQAS 4050 100 SegmentMarka Sabiid LQAS 2512 101 SegmentMarka Balbaley LQAS 1162 102 SegmentMarka Ris LQAS 2189 103 SegmentMarka Mareerey LQAS 9045 104 SegmentMarka Baalgure LQAS 5652 105 SegmentQoryoley Doon buraale LQAS 3480 106 SegmentQoryoley Dharenley LQAS 2180 107 SegmentQoryoley Gur gaal LQAS 2568 RC SegmentQoryoley Buulo sheekh LQAS 4200 RC SegmentQoryoley Gorgaal LQAS 1650 108 SegmentSablaale Biya maalow LQAS 1568 109 Segment
Sampling parameters IDPs Agropastoral Riverine LQAS
Village population 488,088 733,921 378,969 Estimated GAM 15 18 14
Anthropometry Desired Precision 3.5 3.5 3.5 Design Effect 1.5 1.5 1.5 No of children 600 694 566 Mean HH size 6 6 6 % U5s 20 20 20 % HH non response 3 3 3
No of HHs to assess 573 663 541 Population Size 488,088 733,921 378,969 Estimated CMR 1 1 1.42
Mortality Desired Precision 0.4 0.4 0.5 Design Effect 1.5 1.5 1.5 Recall Period (days) 90 90 90 Population to survey 4002 4002 3637
Households to survey 688 688 625 Overall No of clusters 25 26 25 33
Total No of HHs 688 688 625 No of HHs per cluster 28 26 25
No of children/Cluster 24 27 23 6
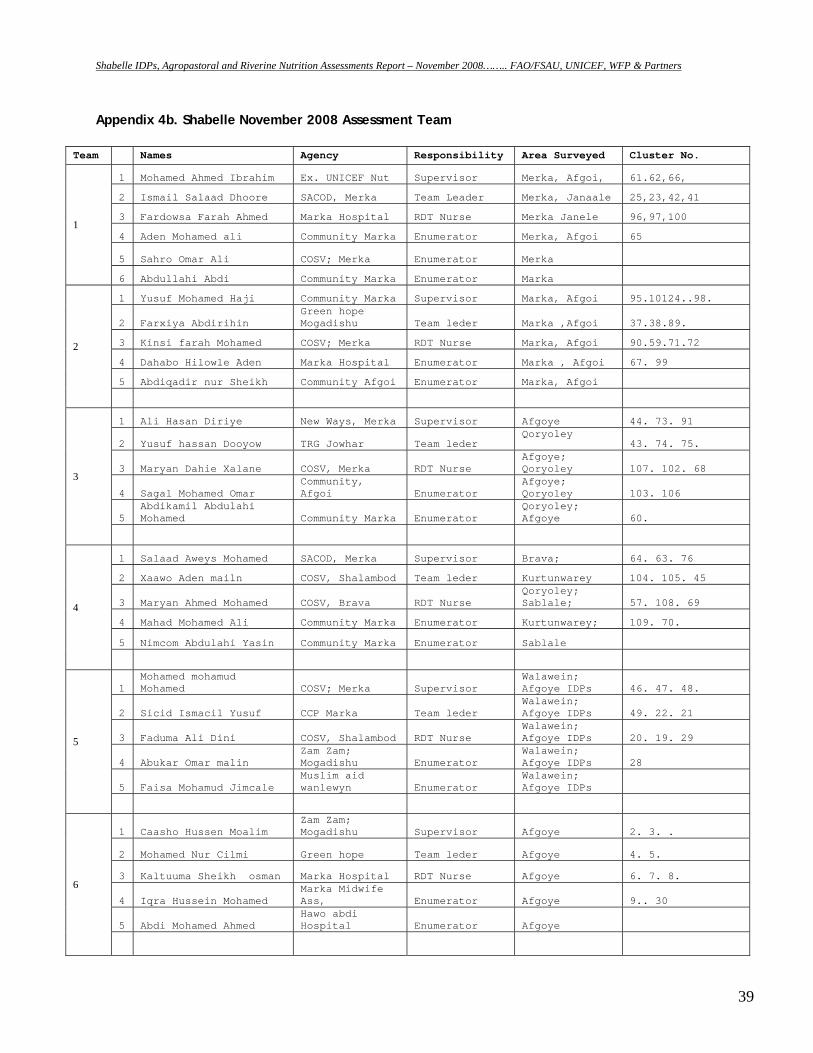
Shabelle IDPs, Agropastoral and Riverine Nutrition Assessments Report – November 2008…….. FAO/FSAU, UNICEF, WFP & Partners
39
Appendix 4b. Shabelle November 2008 Assessment Team
Team Names Agency Responsibility Area Surveyed Cluster No.
1
1 Mohamed Ahmed Ibrahim Ex. UNICEF Nut Supervisor Merka, Afgoi, 61.62,66,
2 Ismail Salaad Dhoore SACOD, Merka Team Leader Merka, Janaale 25,23,42,41
3 Fardowsa Farah Ahmed Marka Hospital RDT Nurse Merka Janele 96,97,100
4 Aden Mohamed ali Community Marka Enumerator Merka, Afgoi 65
5 Sahro Omar Ali COSV; Merka Enumerator Merka
6 Abdullahi Abdi Community Marka Enumerator Marka
2
1 Yusuf Mohamed Haji Community Marka Supervisor Marka, Afgoi 95.10124..98.
2 Farxiya Abdirihin Green hope Mogadishu Team leder Marka ,Afgoi 37.38.89.
3 Kinsi farah Mohamed COSV; Merka RDT Nurse Marka, Afgoi 90.59.71.72
4 Dahabo Hilowle Aden Marka Hospital Enumerator Marka , Afgoi 67. 99
5 Abdiqadir nur Sheikh Community Afgoi Enumerator Marka, Afgoi
3
1 Ali Hasan Diriye New Ways, Merka Supervisor Afgoye 44. 73. 91
2 Yusuf hassan Dooyow TRG Jowhar Team leder Qoryoley
43. 74. 75.
3 Maryan Dahie Xalane COSV, Merka RDT Nurse Afgoye; Qoryoley 107. 102. 68
4 Sagal Mohamed Omar Community, Afgoi Enumerator
Afgoye; Qoryoley 103. 106
5 Abdikamil Abdulahi Mohamed Community Marka Enumerator
Qoryoley; Afgoye 60.
4
1 Salaad Aweys Mohamed SACOD, Merka Supervisor Brava; 64. 63. 76
2 Xaawo Aden mailn COSV, Shalambod Team leder Kurtunwarey 104. 105. 45
3 Maryan Ahmed Mohamed COSV, Brava RDT Nurse Qoryoley; Sablale; 57. 108. 69
4 Mahad Mohamed Ali Community Marka Enumerator Kurtunwarey; 109. 70.
5 Nimcom Abdulahi Yasin Community Marka Enumerator Sablale
5
1 Mohamed mohamud Mohamed COSV; Merka Supervisor
Walawein; Afgoye IDPs 46. 47. 48.
2 Sicid Ismacil Yusuf CCP Marka Team leder Walawein; Afgoye IDPs 49. 22. 21
3 Faduma Ali Dini COSV, Shalambod RDT Nurse Walawein; Afgoye IDPs 20. 19. 29
4 Abukar Omar malin Zam Zam; Mogadishu Enumerator
Walawein; Afgoye IDPs 28
5 Faisa Mohamud Jimcale Muslim aid wanlewyn Enumerator
Walawein; Afgoye IDPs
6
1 Caasho Hussen Moalim Zam Zam; Mogadishu Supervisor Afgoye 2. 3. .
2 Mohamed Nur Cilmi Green hope Team leder Afgoye 4. 5.
3 Kaltuuma Sheikh osman Marka Hospital RDT Nurse Afgoye 6. 7. 8.
4 Iqra Hussein Mohamed Marka Midwife Ass, Enumerator Afgoye 9.. 30
5 Abdi Mohamed Ahmed Hawo abdi Hospital Enumerator Afgoye
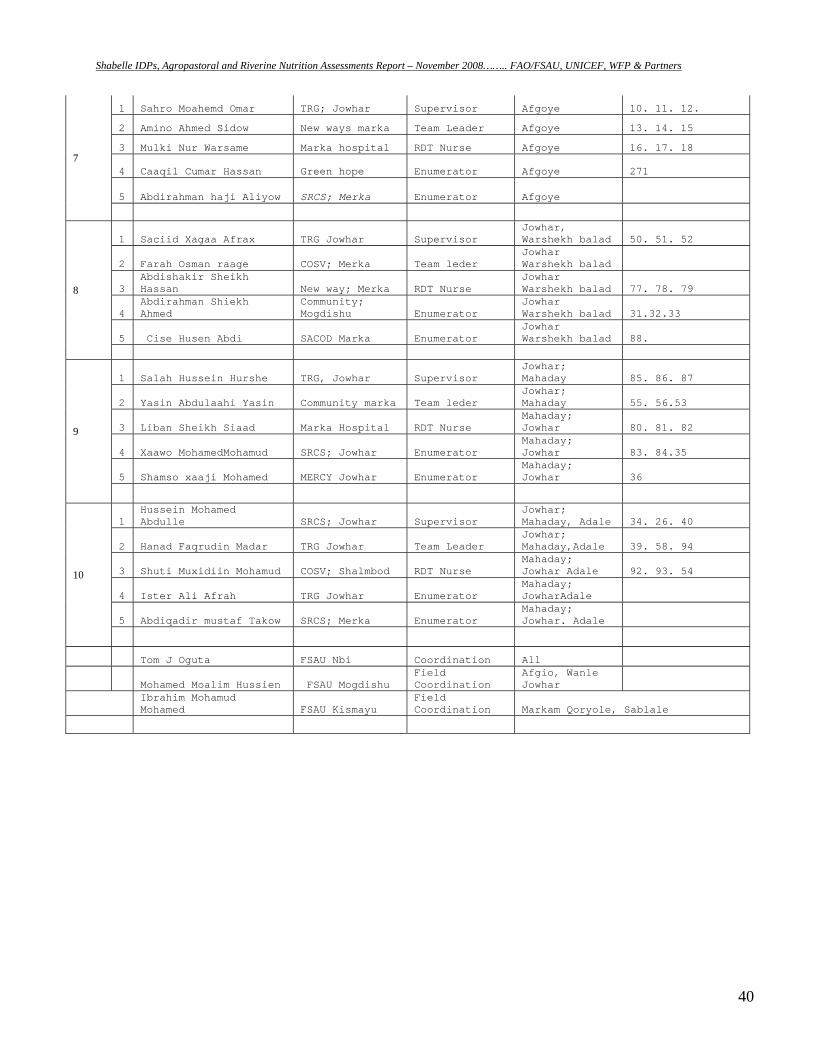
Shabelle IDPs, Agropastoral and Riverine Nutrition Assessments Report – November 2008…….. FAO/FSAU, UNICEF, WFP & Partners
40
7
1 Sahro Moahemd Omar TRG; Jowhar Supervisor Afgoye 10. 11. 12.
2 Amino Ahmed Sidow New ways marka Team Leader Afgoye 13. 14. 15
3 Mulki Nur Warsame Marka hospital RDT Nurse Afgoye 16. 17. 18
4 Caaqil Cumar Hassan Green hope Enumerator Afgoye 271
5 Abdirahman haji Aliyow SRCS; Merka Enumerator Afgoye
8
1 Saciid Xagaa Afrax TRG Jowhar Supervisor Jowhar, Warshekh balad 50. 51. 52
2 Farah Osman raage COSV; Merka Team leder Jowhar Warshekh balad
3 Abdishakir Sheikh Hassan New way; Merka RDT Nurse
Jowhar Warshekh balad 77. 78. 79
4 Abdirahman Shiekh Ahmed
Community; Mogdishu Enumerator
Jowhar Warshekh balad 31.32.33
5 Cise Husen Abdi SACOD Marka Enumerator Jowhar Warshekh balad 88.
9
1 Salah Hussein Hurshe TRG, Jowhar Supervisor Jowhar; Mahaday 85. 86. 87
2 Yasin Abdulaahi Yasin Community marka Team leder Jowhar; Mahaday 55. 56.53
3 Liban Sheikh Siaad Marka Hospital RDT Nurse Mahaday; Jowhar 80. 81. 82
4 Xaawo MohamedMohamud SRCS; Jowhar Enumerator Mahaday; Jowhar 83. 84.35
5 Shamso xaaji Mohamed MERCY Jowhar Enumerator Mahaday; Jowhar 36
10
1 Hussein Mohamed Abdulle SRCS; Jowhar Supervisor
Jowhar; Mahaday, Adale 34. 26. 40
2 Hanad Faqrudin Madar TRG Jowhar Team Leader Jowhar; Mahaday,Adale 39. 58. 94
3 Shuti Muxidiin Mohamud COSV; Shalmbod RDT Nurse Mahaday; Jowhar Adale 92. 93. 54
4 Ister Ali Afrah TRG Jowhar Enumerator Mahaday; JowharAdale
5 Abdiqadir mustaf Takow SRCS; Merka Enumerator Mahaday; Jowhar. Adale
Tom J Oguta FSAU Nbi Coordination All
Mohamed Moalim Hussien FSAU Mogdishu Field Coordination
Afgio, Wanle Jowhar
Ibrahim Mohamud Mohamed FSAU Kismayu
Field Coordination Markam Qoryole, Sablale
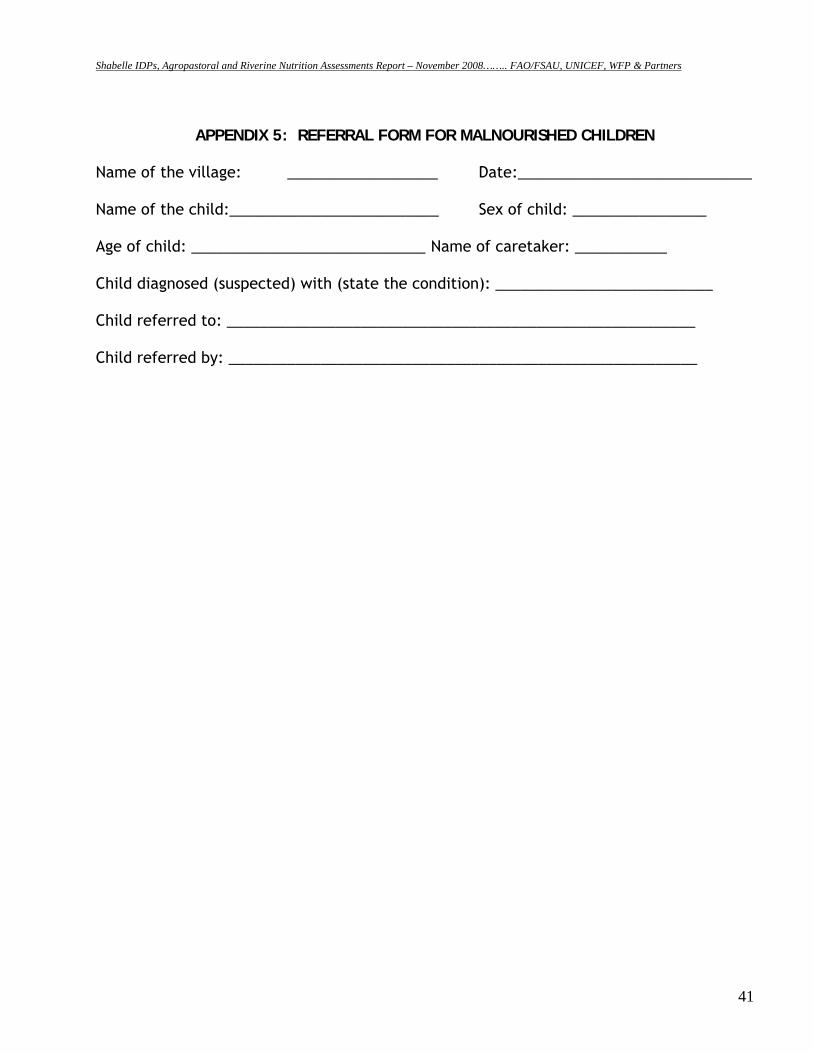
Shabelle IDPs, Agropastoral and Riverine Nutrition Assessments Report – November 2008…….. FAO/FSAU, UNICEF, WFP & Partners
41
APPENDIX 5: REFERRAL FORM FOR MALNOURISHED CHILDREN Name of the village: __________________ Date:____________________________ Name of the child:_________________________ Sex of child: ________________ Age of child: ____________________________ Name of caretaker: ___________ Child diagnosed (suspected) with (state the condition): __________________________ Child referred to: ________________________________________________________ Child referred by: ________________________________________________________
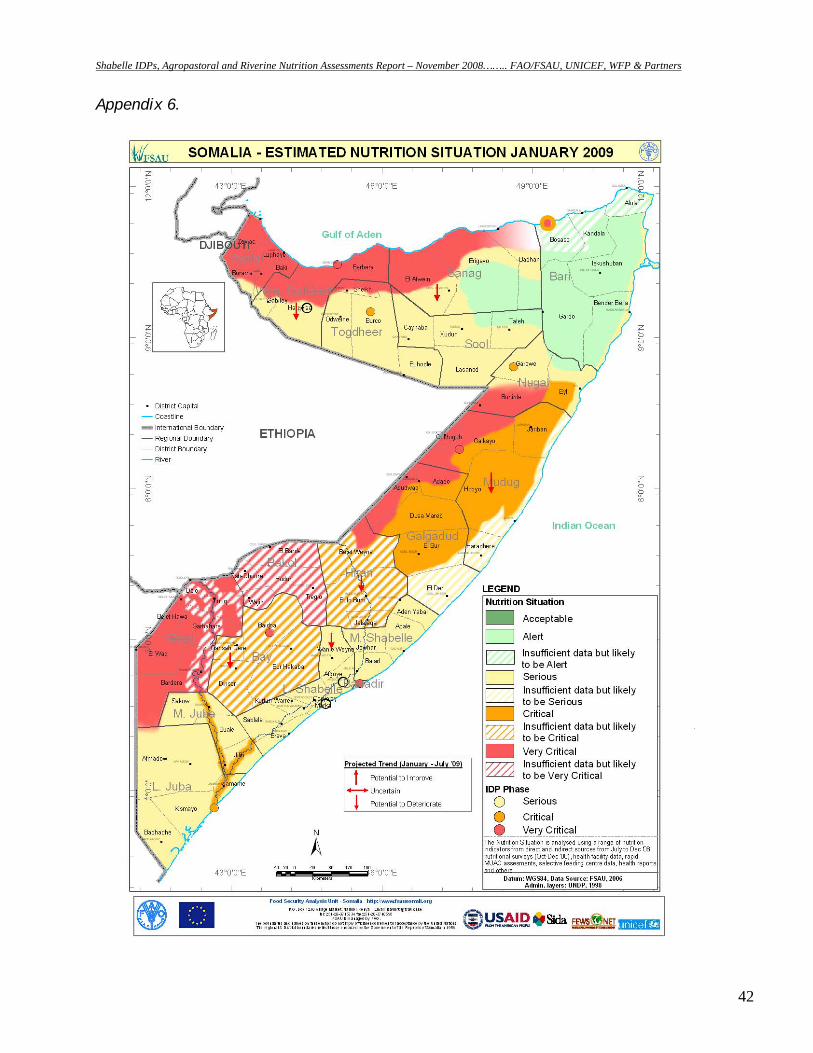
Shabelle IDPs, Agropastoral and Riverine Nutrition Assessments Report – November 2008…….. FAO/FSAU, UNICEF, WFP & Partners
42
Appendix 6.
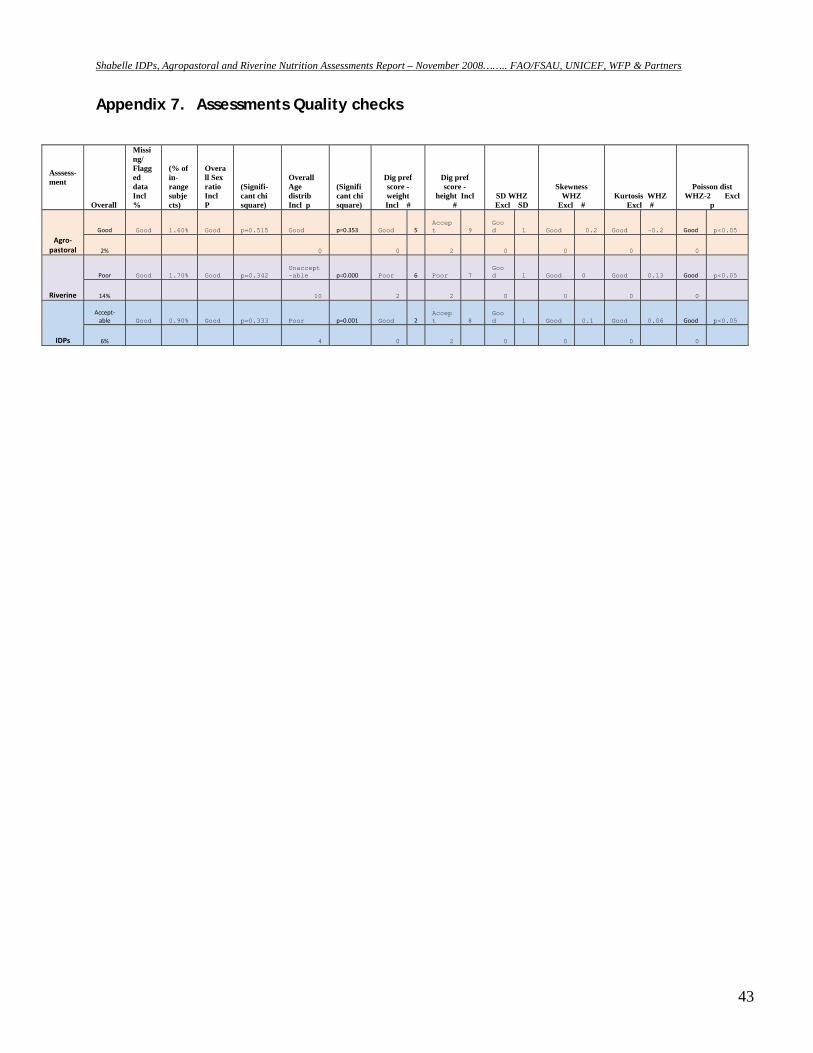
Shabelle IDPs, Agropastoral and Riverine Nutrition Assessments Report – November 2008…….. FAO/FSAU, UNICEF, WFP & Partners
43
Appendix 7. Assessments Quality checks
Asssess-ment
Overall
Missing/ Flagged data Incl %
(% of in-range subjects)
Overall Sex ratio Incl P
(Signifi-cant chi square)
Overall Age distrib Incl p
(Significant chi square)
Dig pref score - weight Incl #
Dig pref score -
height Incl #
SD WHZ Excl SD
Skewness WHZ
Excl # Kurtosis WHZ
Excl #
Poisson dist WHZ-2 Excl
p
Agro‐pastoral
Good Good 1.60% Good p=0.515 Good p=0.353 Good 5 Accept 9
Good 1 Good 0.2 Good -0.2 Good p<0.05
2% 0 0 2 0 0 0 0
Riverine
Poor Good 1.70% Good p=0.342 Unaccept-able p=0.000 Poor 6 Poor 7
Good 1 Good 0 Good 0.13 Good p<0.05
14% 10 2 2 0 0 0 0
IDPs
Accept‐able Good 0.90% Good p=0.333 Poor p=0.001 Good 2
Accept 8
Good 1 Good 0.1 Good 0.06 Good p<0.05
6% 4 0 2 0 0 0 0
Shabelle IDPs, Agropastoral and Riverine Nutrition Assessments Report – November 2008…….. FAO/FSAU, UNICEF, WFP & Partners
44
REFERENCES FSAU Monthly Nutrition Update, November 2007. FSAU Monthly Nutrition Update, January 2008 FSAU 2008 Post Gu Analysis, August 2008 FSAU, September 2002: Food Utilization in Somalia FSAU, October 2006: Nutrition Training Manual: A guide to data collection, analysis, interpretation and use. FSAU, April 2004: Dietary Diversity in Somalia SACB: Nutrition assessment guidelines for Somalia. SC, UK (2004). Emergency Nutrition Assessment. Guidelines for field workers Standardized Monitoring and Assessment of Relief and Transition (SMART). Standardizing. Assessment methodology. Technical Series. July 23 – 26, 2002. Washington, DC. Sphere Guidelines, 2004. Humanitarian Charter and Minimum standards in Disaster Response. Sphere Project WHO, 1995: Guide on rapid nutritional assessment in emergencies WHO, Anthro 2005. Growth reference curves. FSAU Food Security Press Release, October 2007