Embed Size (px)
Citation preview
2020Preliminary Budget


The Government Finance Officers Association of the United States and Canada (GFOA) presented a Distinguished Budget Presentation Award to the Port of Seattle for its annual budget for the fiscal year beginning January 1, 2019.
In order to receive this award, a governmental unit must publish a budget document that meets program criteria as a policy document, as an operations guide, as a financial plan, and as a communications device.
This award is only valid for a period of one year. We believe that our current budget continues to conform to the requirements of the program, and we are submitting it to the GFOA to determine its eligibility for another award.

Port of Seattle"
DATE: October 18, 2019 TO: Port Commission FROM: Stephen P. Metruck, Executive Director :>P� SUBJECT: Port of Seattle Preliminary 2020 Budget
I am pleased to submit the Port's proposed 2020 Budget, which identifies the plans, programs and resources needed to respond to the unprecedented growth in our business gateways as well as advance key initiatives focused on operational efficiency, environmental sustainability, community engagement, economic development and equity, diversity and inclusion. The Preliminary 2020 budget is aligned with the Port's Century Agenda strategies, our 2020 goals and is fiscally responsible. My approach in preparing the budget was to use a "zero-base" mindset to reduce unnecessary spending, use greater discipline in developing realistic spending plans, identify potential cost savings along with new budget requests and incorporate a staff vacancy factor to reduce budget variances that we typically experience due to routine personnel turnover freeing up funds to meet other needs.
The budget includes total operating revenues of $813 million, an 8% increase over the 2019 budget, and total operating expenses are $472 million, a 3.6% increase over 2019. Budgeted Net Operating Income is $342 million, 14.6% above 2019. Key drivers of the operating budget include innovation, sustainability, safety and security, customer service, organizational effectiveness and equity.
The Capital Investment Plan (CIP), which amounts to $3.4 billion over the next five years, continues our commitment to investing in regional infrastructure to grow our transportation gateways, create jobs and stimulate economic development. Signature projects at Sea-Tac International Airport include completion of the International Arrivals Facility and North Satellite expansion/renovation, baggage system optimization and preliminary design of projects related to the Sustainable Airport Master Plan. The Maritime and Economic Developm�nt Division CIP advances the Port's Waterfront Strategy with significant investments in a new Cruise Terminal at Terminal 46, Terminal 91 uplands development, habitat restoration, and development at Fishermen's Terminal. In addition to its CIP, the Port is also investing $184 million over the next five years in the Northwest Seaport Alliance capital program, which includes modernizing Terminal 5 to make it one of the most efficient container terminals on the West Coast. The CIP also includes $107 million of additional funding primarily for preservation of critical maritime infrastructure.
I would like to acknowledge Port staff for their substantial efforts in developing the preliminary budget and associated materials-their work is greatly appreciated. I look forward to the Commission's review and discussion of the proposed budget and obtaining your continued input and comments.

Port of Seattle 2020 Budget
i
TABLE OF CONTENTS
I. Executive Summary I-1 II. Port View
A. The Port of Seattle II-1 B. History of the Port of Seattle II-1 C. Facilities and Services II-1 D. Long Range Plan II-4 E. Commissioners and Officers II-8 F. Organization Chart II-9
III. Budget Overview
A. Financial Overview III-1 B. Operating Budget Overview III-1 C. Budget Overview-Staffing III-5 D. Capital Budget Overview III-7 E. Tax Levy III-8
IV. Aviation Division
A. 2020 Budget Summary IV-1 B. Financial Forecast IV-3 C. Division Description/Business Assessment IV-4 D. Operating Budget Summary IV-6 E. Staffing IV-23 F. Capital Budget IV-28 G. Aviation Division Operating Statistics IV-39
V. Maritime Division
A. 2020 Budget Summary V-1 B. Financial Forecast V-3 C. Division Description/Business Assessment V-3 D. Operating Budget Summary V-9 E. Staffing V-14 F. Capital Budget V-15 G. Maritime Division Operating Statistics V-16
VI. Economic Development Division
A. 2020 Budget Summary VI-1 B. Financial Forecast VI-3 C. Division Description/Business Assessment VI-3 D. Operating Budget Summary VI-16 E. Staffing VI-21 F. Capital Budget VI-22
VII. Central Services
A. 2020 Budget Summary VII-1 B. Central Services Description VII-1 C. Key Functions and Responsibilities VII-2 D. Operating Budget Summary VII-15

Port of Seattle 2020 Budget
ii
E. Staffing VII-20 F. Capital Budget VII-22 G. Financial and FTE Summary VII-22
VIII. Tax Levy
A. Tax At A Glance VIII-1 B. Tax Levy Sources VIII-1 C. Tax Levy Uses VIII-3 D. General Obligation Capacity VIII-7 E. Taxpayer Effect VIII-8 F. County Property Tax Comparison VIII-8
IX. Capital Improvement Plan IX-1 X. Draft Plan of Finance X-1 XI. Statutory Budget
A. Introduction XI-1 B. Statutory Budget Highlights XI-1 C. Resolution XI-2 D. Tax Levy Calculation Sheet XI-6 E. Forecasted Cash Flow Summary XI-8
XII. The Northwest Seaport Alliance (NWSA) XII-1
XIII. Appendices
A. Budget Policy, Process and Calendar XIII-1 1. Operating Budget XIII-1 2. Capital Budget XIII-7
B. Financial Management Policies XIII-10 1. Key Financial Tools XIII-10 2. Financial Policies and Description of Major Funds XIII-11 3. Revenue and Expense Assumptions XIII-18
C. Business Assessment XIII-19 1. Local Economy and Outlook XIII-19 2. Economic Impact XIII-21 3. Fun/Fast Facts about the Port XIII-23
D. Bond Amortization Schedules XIII-30 E. Other Detailed Expenditures XIII-34 F. Glossary of Terms Used XIII-35 G. Acronyms and Abbreviations XIII-43
Port of Seattle 2020 Budget
iii
LIST OF TABLES Table I-1 2020 Budget Summary I-6 Table I-2 Cash Flow Summary I-7 Table III-1 Port of Seattle Financial Forecast III-1 Table III-2 Revenues, Expenses, and Net Assets III-2 Table III-3 Revenues and Expenses by Account Category III-3 Table III-4 Port Staffing by Division III-6 Table III-5 Capital Budget III-7 Table IV-1 Aviation Cash Flow Summary IV-1 Table IV-2 Aviation Financial Forecast IV-3 Table IV-3 Aviation Key Measures IV-3 Table IV-4 Aviation Revenue by Account IV-19 Table IV-5 Aviation Operating & Maintenance Expenses by Account IV-20 Table IV-6 Aviation Revenue and Expense by Business Group/Department IV-21 Table IV-7 Aviation Staffing IV-23 Table IV-8 Aviation Capital Budget Summary IV-37 Table IV-9 Aviation Operating Statistics IV-38 Table V-1 Maritime Cash Flow Summary V-1 Table V-2 Maritime Financial Forecast V-3 Table V-3 Maritime Revenue by Account V-11 Table V-4 Maritime Operating & Maintenance Expenses by Account V-12 Table V-5 Maritime Revenue and Expense by Business Group/Department V-13 Table V-6 Maritime Staffing V-14 Table V-7 Maritime Capital Budget Summary V-15 Table V-8 Maritime Operating Statistics V-16 Table VI-1 Economic Development Cash Flow Summary VI-1 Table VI-2 Economic Development Financial Forecast VI-3 Table VI-3 Economic Development Revenue by Account VI-18 Table VI-4 Economic Development Operating & Maintenance Expenses By Account VI-19 Table VI-5 Economic Development Revenue and Expenses By Department VI-20 Table VI-6 Economic Development Staffing VI-21 Table VI-7 Economic Development Capital Budget Summary VI-22 Table VII-1 Central Services 2020 Budget Summary VII-1 Table VII-2 Central Services Expense by Department VII-18 Table VII-3 Central Services Revenues and Expenses by Account VII-19 Table VII-4 Central Services Staffing VII-20 Table VII-5 Central Services Capital Budget VII-22 Table VII-6 Financial and FTE Summary VII-22 Table VIII-1 Sources and Uses of Tax Levy VIII-4 Table VIII-2 Existing G.O. Bonds Debt Service By Projects and Group VIII-5 Table VIII-3 Uses of Transportation and Infrastructure Fund VIII-6 Table IX-1 Capital Improvement Plan IX-1 Table IX-2 Aviation Capital Improvement Plan IX-2
Port of Seattle 2020 Budget
iv
Table IX-3 Maritime Capital Improvement Plan IX-3 Table IX-4 Economic Development Capital Improvement Plan IX-5 Table IX-5 Central Services Capital Improvement Plan IX-6 Table IX-6 NWSA Capital Improvement Plan IX-7 Table IX-7 Public Expense Projects IX-8 Table XI-1 Tax Levy Calculation Sheet XI-6 Table XI-2 Forecasted Cash Flow Summary XI-8 Table C-1 Summary Forecast XIII-20 Table C-2 State Employment by Industry XIII-20 Table C-3 Top 10 Public Companies in Washington XIII-21 Table D-1 Bond Amortization Schedules for 2019 XIII-30 Table D-2 Bond Amortization Schedules for 2020 XIII-32 Table E-1 Promotional Hosting by Division XIII-34
Port of Seattle 2020 Budget
v
LIST OF FIGURES
Figure I-1 Sources of Cash I-8 Figure I-2 Uses of Cash I-8 Figure II-1 Facility Map II-3 Figure II-2 Organization Chart II-9 Figure III-1 Operating Revenues by Source: 2020 III-4 Figure III-2 Operating Expenses by Usage: 2020 III-4 Figure III-3 Port Staffing by Division III-6 Figure III-4 Committed Capital Budget III-7 Figure III-5 Tax Levy vs. Millage Rate 2009-2020 III-8 Figure IV-1 Aviation Sources of Cash IV-2 Figure IV-2 Aviation Uses of Cash IV-2 Figure IV-3 Aviation Revenue by Account IV-19 Figure IV-4 Aviation Expense by Account IV-20 Figure IV-5 Aviation Division Committed Capital Budget IV-37 Figure V-1 Maritime Sources of Cash V-2 Figure V-2 Maritime Uses of Cash V-2 Figure V-3 Maritime Revenue by Account V-11 Figure V-4 Maritime Expense by Account V-12 Figure V-5 Maritime Committed Capital Budget V-15 Figure VI-1 Economic Development Sources of Cash VI-2 Figure VI-2 Economic Development Uses of Cash VI-2 Figure VI-3 Economic Development Revenue by Account VI-18 Figure VI-4 Economic Development Expense by Account VI-19 Figure VI-5 Economic Development Capital Budget VI-22 Figure VII-1 Central Services Expense by Account VII-20 Figure VIII-1 Actual Tax Levy vs. Maximum Allowable Levy 1991-2020 VIII-2 Figure VIII-2 Tax Levy vs. Millage Rate 2009-2020 VIII-2 Figure VIII-3 2019 Percentage of Tax Levies By Taxing District VIII-8 Figure XI-1 Sources of Cash VIII-9 Figure XI-2 Uses of Cash VIII-9 Figure A-1 Operating Budget Process Flow Chart XIII-5 Figure A-2 Capital Budget Process Flow Chart XIII-8

Port of Seattle 2020 Budget
vi
BUDGET DOCUMENT OVERVIEW
This document contains the operating, capital and statutory budgets, Long Range Plan, and draft plan of finance for the Port of Seattle and is organized as follows: • Section I, Executive Summary, provides key business outlook, key budget drivers, budget highlights,
and budget summary.
• Section II, Port View, contains the Port’s history, facilities and services, long range plans, commissioners and officers, and organizational chart.
• Section III, Overview, presents the five-year financial forecast and outlines the Port’s operating and non-operating budget, capital budget, and tax levy.
• Sections IV through VI feature the Operating Division summaries for Aviation, Maritime, and Economic Development, respectively. Each Division section present a discussion of the 2019 budget and five-year financial forecast for each business group as well as operating budget, staffing, and capital budget. The operating budget is presented by business groups/departments and by major revenue and expense accounts.
• Section VII, Central Services, presents descriptions of each department as well as summaries of operating budgets, staffing, and capital budgets.
• Section VIII, Tax Levy, provides a detailed presentation and discussion of tax levy sources and uses including interaction between general purpose levy and general obligation debt capacity.
• Section IX, Capital Improvement Plan (CIP), provides detailed discussion and a summary page presenting the total CIP by business group and by division. A listing of the projects by business group and division is provided at the end of the section.
• Section X, Draft Plan of Finance, includes an overview of the funded CIP, a discussion of the airport and non-airport funding plan, financing initiatives and capital planning resources.
• Section XI, Statutory Budget, which is submitted to King County Council and King County Assessor, provides an introduction, budget highlights and resolution, and tax levy calculation.
• Section XII, NWSA, contains overview, budget message, business outlook, budget details, capital investment plan and environmental stewardship and planning for the Northwest Seaport Alliance (NWSA).
• Section XIII, Appendices, includes detailed information regarding the budget and financial policies, business assessment, bond amortization schedules, other detailed expenditures, a glossary of terms, and acronyms used.
I. EX
EC
UT
IVE
SUM
MA
RY
I. EXECUTIVE SUMMARY

Port of Seattle 2020 Budget Executive Summary
I-1
EXECUTIVE SUMMARY
OVERVIEW
The 2020 budget responds to the needs of the Port’s businesses, customers and community stakeholders. This budget will also help the Port prepare for future growth through strategic investments in regional infrastructure, facilities, transportation, environmental sustainability, community programs, and economic development initiatives. In addition to expanding services, this budget invests in projects that will preserve existing assets as well as generate new revenues to fund future infrastructure and improvements to Port assets. This budget strengthens the safety and security of the Port and the traveling public, improves customer service at Port facilities and accommodates the organizational needs for growing operations. With this budget, the Port will leverage the economic strength of the Puget Sound region to create opportunities that will span generations, increase support for small and disadvantaged businesses, expand job opportunities in the aviation and maritime industries, support workforce development, promote equity and protect and improve regional environmental and community health. This budget also helps the Port build organizational capability, efficiency and effectiveness through innovation and advances the Century Agenda strategies and objectives. The Port is in a strong financial position heading into 2020. Prudent and proactive budget management enables the Port to be a responsible steward of public resources and provide investments that enhance the economic vitality of the Puget Sound region. PORT BUSINESS OUTLOOK • Seattle-Tacoma International Airport (Sea-Tac) has experienced significant growth in the past few years.
The Airport anticipates continued passenger growth of 3 percent on top of 4 percent forecasted growth in 2019 for a total of 53.3 million passengers in 2020. This translates into a compound annual growth rate of 7.4 percent and a total passenger growth of 53.5 percent since 2013.
• The Cruise business continues to grow. The Maritime division is forecasting a record 1.3 million cruise passengers in 2020, an 8.8 percent increase over this year. The Port continues to be the leading West Coast cruise port in passenger volumes.
• Grain volume is forecast to be 3.0 million metric tons in 2020, down 16 percent from the 2019 budget due to the current trade environment and tariffs that have dampened agricultural exports.
• The average Shilshole Bay Marina occupancy rate is forecast to be 95 percent, consistent with 2019 while Fishing and Commercial Operations occupancy rates are forecast to average 86 percent, the same as 2019.
• Commercial Properties are expected to remain strong at 95 percent occupancy at the end of 2020.
Below is a summary of the key financial results under the 2020 budget: • Total operating revenues are budgeted at $813.3 million, $60.1 million or 8.0 percent over the 2019
budget. • Total operating expenses are budgeted at $471.6 million, $16.6 million or 3.6 percent over 2019. • Net operating income before depreciation is budgeted at $341.7 million, $43.5 million or 14.6 percent
over 2019. • The 2020 capital budget is $640.5 million and the five-year capital improvement plan is over $3.4
billion.
Port of Seattle 2020 Budget Executive Summary
I-2
2020 KEY INITIATIVES AND BUDGET DRIVERS • Continue to improve customer service for the Airport and Maritime businesses. • Continue to enhance the safety and security of the traveling public, employees, and Port facilities. • Implement the Airport and waterfront capital development programs to reduce congestion, improve
service for our customers, and prepare for the region’s needs for the future. • Foster financial sustainability by growing Port operating revenues. • Continue the Sustainable Airport Master Plan (SAMP) environmental review and preliminary planning. • Continue implementation of the Ground Transportation Access Plan (GTAP), Airport Dining and Retail
Master (ADR) Plan, Infrastructure Systems Master Plan, and Main Terminal Optimization Plan for the Airport.
• Advance the new Cruise Terminal at Pier 46 and Terminal 91 Uplands Development. • Complete modernization of Bell Harbor International Conference Center. • Advance environmental initiatives to ensure the long-term sustainability of Port operations and the
region. • Add resources to implement Port Commission priorities on Equity, Diversity and Inclusion. • Continue to invest in workforce development programs and partnerships to develop a talent pipeline for
Port-related industries. • Support Diversity in Contracting to create opportunities for small and disadvantaged businesses in the
region. • Promote and support tourism development throughout Washington state using Tourism Grants and the
Spotlight Airport Advertising program. • Implement cooperative marketing and promotional efforts in countries identified to have strong Alaskan
cruise demand and “cruise-and-stay” potential. • Implement maritime innovation initiatives and identify a permanent location for a maritime innovation
center. • Continue high school and college internship programs to increase opportunities for local students. • Expand community engagement programs to increase awareness of the Port’s contribution to regional
economic vitality and to strengthen relationships with surrounding communities. • Continue to build internal capabilities through innovation, employee training and development, and
process improvements. You can find the budget summary and highlights in the next few pages, and the budget details in various sections of the budget document. AVIATION DIVISION Current capacity constraints at the Airport create operational challenges as the numbers of flights and passengers continue to grow. Several large capital projects are under development to meet the growing needs of the airport and work continues with environmental review and preliminary planning for the Sustainable Airport Master Plan (SAMP) in 2020. The airport is also adding significant resources to continue to improve customer service and to enhance the safety and security of the traveling public. Passenger growth at in recent years has propelled Sea-Tac Airport to the eighth busiest airport in the United States. The regional economy remains strong, contributing to the passenger growth at Sea-Tac. Growth picked up in 2018 to 6.2 percent after 2.6 percent in 2017. The budget for 2020 is for passenger growth of 3 percent.
Port of Seattle 2020 Budget Executive Summary
I-3
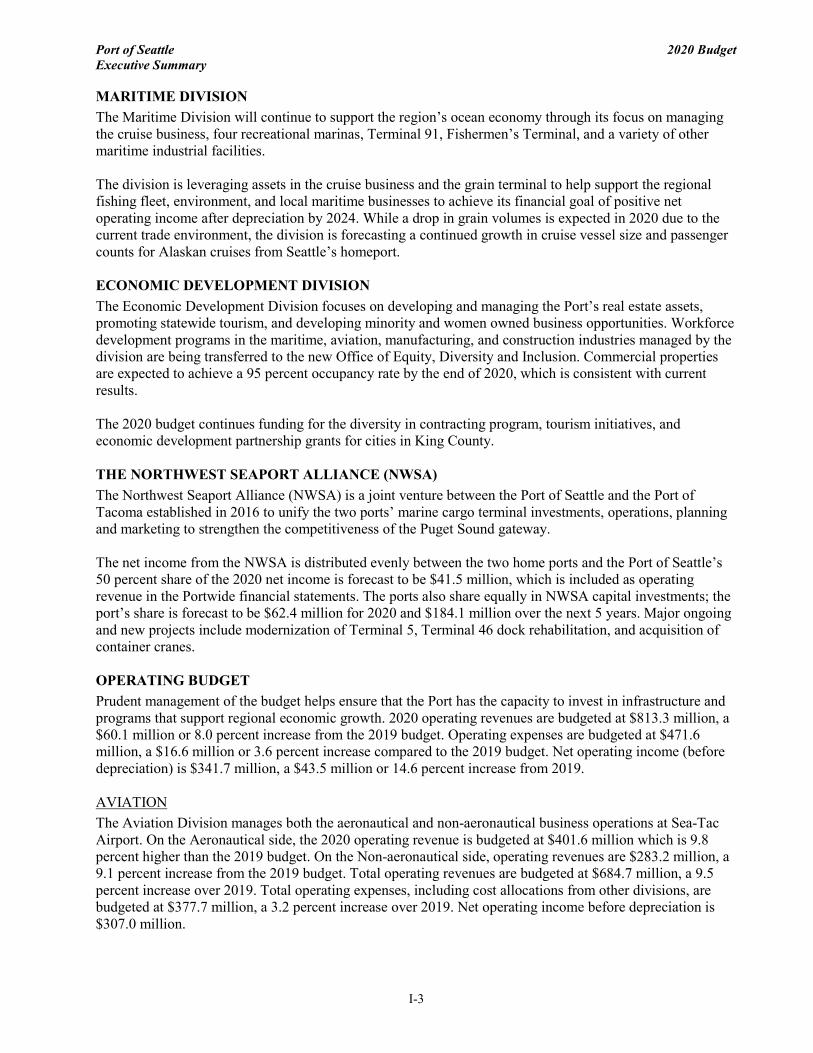
MARITIME DIVISION The Maritime Division will continue to support the region’s ocean economy through its focus on managing the cruise business, four recreational marinas, Terminal 91, Fishermen’s Terminal, and a variety of other maritime industrial facilities. The division is leveraging assets in the cruise business and the grain terminal to help support the regional fishing fleet, environment, and local maritime businesses to achieve its financial goal of positive net operating income after depreciation by 2024. While a drop in grain volumes is expected in 2020 due to the current trade environment, the division is forecasting a continued growth in cruise vessel size and passenger counts for Alaskan cruises from Seattle’s homeport. ECONOMIC DEVELOPMENT DIVISION The Economic Development Division focuses on developing and managing the Port’s real estate assets, promoting statewide tourism, and developing minority and women owned business opportunities. Workforce development programs in the maritime, aviation, manufacturing, and construction industries managed by the division are being transferred to the new Office of Equity, Diversity and Inclusion. Commercial properties are expected to achieve a 95 percent occupancy rate by the end of 2020, which is consistent with current results. The 2020 budget continues funding for the diversity in contracting program, tourism initiatives, and economic development partnership grants for cities in King County. THE NORTHWEST SEAPORT ALLIANCE (NWSA) The Northwest Seaport Alliance (NWSA) is a joint venture between the Port of Seattle and the Port of Tacoma established in 2016 to unify the two ports’ marine cargo terminal investments, operations, planning and marketing to strengthen the competitiveness of the Puget Sound gateway. The net income from the NWSA is distributed evenly between the two home ports and the Port of Seattle’s 50 percent share of the 2020 net income is forecast to be $41.5 million, which is included as operating revenue in the Portwide financial statements. The ports also share equally in NWSA capital investments; the port’s share is forecast to be $62.4 million for 2020 and $184.1 million over the next 5 years. Major ongoing and new projects include modernization of Terminal 5, Terminal 46 dock rehabilitation, and acquisition of container cranes. OPERATING BUDGET Prudent management of the budget helps ensure that the Port has the capacity to invest in infrastructure and programs that support regional economic growth. 2020 operating revenues are budgeted at $813.3 million, a $60.1 million or 8.0 percent increase from the 2019 budget. Operating expenses are budgeted at $471.6 million, a $16.6 million or 3.6 percent increase compared to the 2019 budget. Net operating income (before depreciation) is $341.7 million, a $43.5 million or 14.6 percent increase from 2019. AVIATION The Aviation Division manages both the aeronautical and non-aeronautical business operations at Sea-Tac Airport. On the Aeronautical side, the 2020 operating revenue is budgeted at $401.6 million which is 9.8 percent higher than the 2019 budget. On the Non-aeronautical side, operating revenues are $283.2 million, a 9.1 percent increase from the 2019 budget. Total operating revenues are budgeted at $684.7 million, a 9.5 percent increase over 2019. Total operating expenses, including cost allocations from other divisions, are budgeted at $377.7 million, a 3.2 percent increase over 2019. Net operating income before depreciation is $307.0 million.
Port of Seattle 2020 Budget Executive Summary
I-4
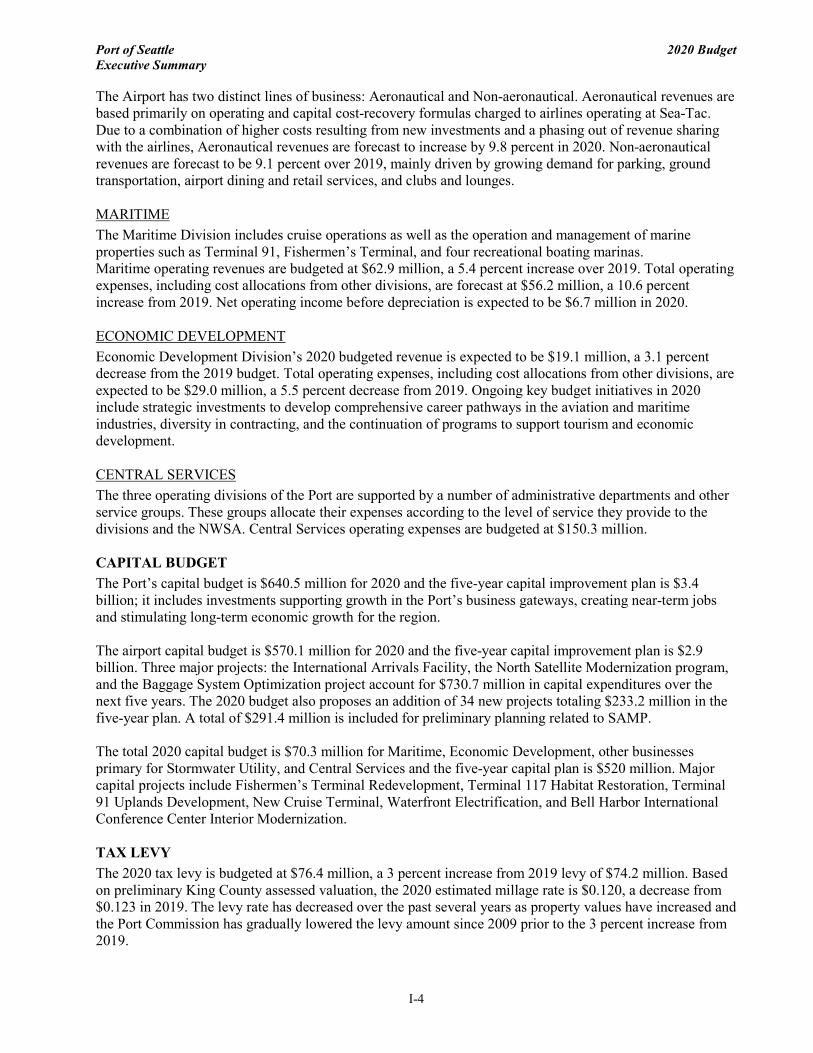
The Airport has two distinct lines of business: Aeronautical and Non-aeronautical. Aeronautical revenues are based primarily on operating and capital cost-recovery formulas charged to airlines operating at Sea-Tac. Due to a combination of higher costs resulting from new investments and a phasing out of revenue sharing with the airlines, Aeronautical revenues are forecast to increase by 9.8 percent in 2020. Non-aeronautical revenues are forecast to be 9.1 percent over 2019, mainly driven by growing demand for parking, ground transportation, airport dining and retail services, and clubs and lounges. MARITIME The Maritime Division includes cruise operations as well as the operation and management of marine properties such as Terminal 91, Fishermen’s Terminal, and four recreational boating marinas. Maritime operating revenues are budgeted at $62.9 million, a 5.4 percent increase over 2019. Total operating expenses, including cost allocations from other divisions, are forecast at $56.2 million, a 10.6 percent increase from 2019. Net operating income before depreciation is expected to be $6.7 million in 2020. ECONOMIC DEVELOPMENT Economic Development Division’s 2020 budgeted revenue is expected to be $19.1 million, a 3.1 percent decrease from the 2019 budget. Total operating expenses, including cost allocations from other divisions, are expected to be $29.0 million, a 5.5 percent decrease from 2019. Ongoing key budget initiatives in 2020 include strategic investments to develop comprehensive career pathways in the aviation and maritime industries, diversity in contracting, and the continuation of programs to support tourism and economic development. CENTRAL SERVICES The three operating divisions of the Port are supported by a number of administrative departments and other service groups. These groups allocate their expenses according to the level of service they provide to the divisions and the NWSA. Central Services operating expenses are budgeted at $150.3 million. CAPITAL BUDGET The Port’s capital budget is $640.5 million for 2020 and the five-year capital improvement plan is $3.4 billion; it includes investments supporting growth in the Port’s business gateways, creating near-term jobs and stimulating long-term economic growth for the region. The airport capital budget is $570.1 million for 2020 and the five-year capital improvement plan is $2.9 billion. Three major projects: the International Arrivals Facility, the North Satellite Modernization program, and the Baggage System Optimization project account for $730.7 million in capital expenditures over the next five years. The 2020 budget also proposes an addition of 34 new projects totaling $233.2 million in the five-year plan. A total of $291.4 million is included for preliminary planning related to SAMP. The total 2020 capital budget is $70.3 million for Maritime, Economic Development, other businesses primary for Stormwater Utility, and Central Services and the five-year capital plan is $520 million. Major capital projects include Fishermen’s Terminal Redevelopment, Terminal 117 Habitat Restoration, Terminal 91 Uplands Development, New Cruise Terminal, Waterfront Electrification, and Bell Harbor International Conference Center Interior Modernization. TAX LEVY The 2020 tax levy is budgeted at $76.4 million, a 3 percent increase from 2019 levy of $74.2 million. Based on preliminary King County assessed valuation, the 2020 estimated millage rate is $0.120, a decrease from $0.123 in 2019. The levy rate has decreased over the past several years as property values have increased and the Port Commission has gradually lowered the levy amount since 2009 prior to the 3 percent increase from 2019.

Port of Seattle 2020 Budget Executive Summary
I-5
2020 BUDGET HIGHLIGHTS The Port strives to maintain a strong financial position while continuing to make investments that retain and attract customers, create jobs, provide community benefits, and help position the Port for future growth. • Total revenues are budgeted at $1,098.4 million, which include $813.3 million of operating revenues and
$285.1 million of non-operating revenues. With $600 million of expected proceeds in 2020 from the anticipated sale of revenue bonds, total sources of funds are forecast to be $1.70 billion.
• Operating revenues are budgeted at $813.3 million, a $60.1 million or 8.0% increase from the 2019 budget. The $401.5 million of Aeronautical revenues are based on cost recovery. Airport Non-Aeronautical revenues are budgeted to be $283.2 million, $23.6 million or 9.1% increase from 2019 budget mainly due to higher revenues from Public Parking, Ground Transportation, Airport Dining and Retail, Airport Commercial Properties, and Airport Clubs & Lounges.
• Non-Airport revenues are projected to be $128.6 million, a $470 thousand or 0.4% increase from the
2019 budget. Higher revenues from Cruise and Conference & Event Centers are partially offset by $2.1 million reduction in the NWSA Distributable Revenue.
• Total Expenses are budgeted at $849.8 million, which include $471.6 million of operating expenses,
$179.1 million of depreciation expenses, and $199.1 million of non-operating expenses, the majority of which are comprised of interest and principal on outstanding bonds.
• Operating expenses are $471.6 million for the 2020 budget, a $16.6 million or 3.6% increase from the 2019 budget mainly due to: o $15.8 million in net payroll increases for existing staff and new staffing; o $12.4 million in non-payroll increase for contractual increases, third party management expenses
(more than offset by higher operating revenues), and a variety of new and expanded strategic initiatives in 2020.
o The non-payroll increase is partially offset by a $11.6 million reduction in Environmental Remediation Expenses from 2019.
• The 2020 operating budget includes the following:
o $12.9 million in expenditures for environmental stewardship; o $19.3 million in planning for future airport facilities to meet the strong growth in passenger volumes; o $2.7 million to enhance safety and security for the traveling public and Port facilities; o $5.2 million to improve customer service at Sea-Tac Airport, and $1.2 million on the Port valet
program, which allows cruise passengers to remotely check their luggage upon disembarkation for delivery at the airport;
o $2.9 million for Workforce Development to support job-training programs, the regional Career Connected Learning initiative, and Port internships;
o $1.6 million for the new Office of Equity, Diversity and Inclusion, which also manages the Workforce Development noted above.
o $2.6 million to promote and support statewide tourism initiatives and $1.0 million in grants to support economic development initiatives in King County cities.
• The Port’s budgeted net operating income before depreciation is $341.7 million, a $43.5 million or
14.6% increase from the 2019 budget.Net operating income after depreciation is $162.7 million, $33.1 million or 25.5% higher than the 2019 budget.
Port of Seattle 2020 Budget Executive Summary
I-6
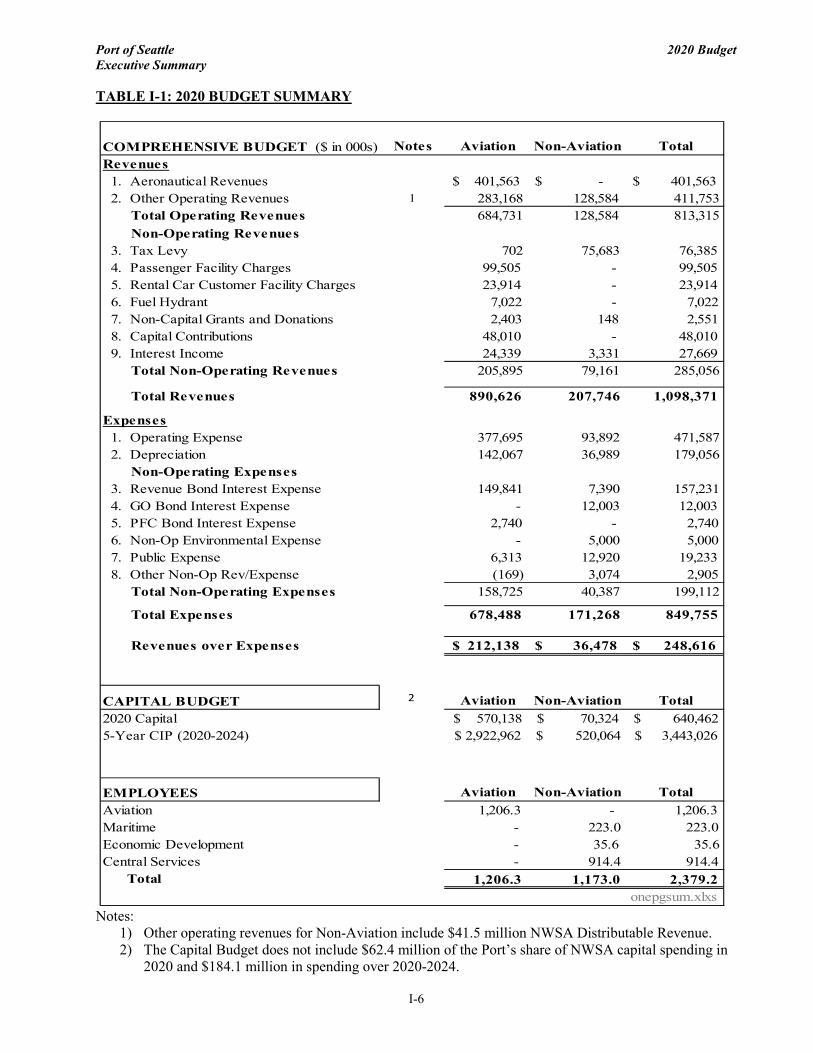
TABLE I-1: 2020 BUDGET SUMMARY
Notes:
1) Other operating revenues for Non-Aviation include $41.5 million NWSA Distributable Revenue. 2) The Capital Budget does not include $62.4 million of the Port’s share of NWSA capital spending in
2020 and $184.1 million in spending over 2020-2024.
COMPREHENSIVE BUDGET ($ in 000s) Notes Aviation Non-Aviation Total Revenues 1. Aeronautical Revenues 401,563$ -$ 401,563$ 2. Other Operating Revenues 1 283,168 128,584 411,753 Total Operating Revenues 684,731 128,584 813,315 Non-Operating Revenues 3. Tax Levy 702 75,683 76,385 4. Passenger Facility Charges 99,505 - 99,505 5. Rental Car Customer Facility Charges 23,914 - 23,914 6. Fuel Hydrant 7,022 - 7,022 7. Non-Capital Grants and Donations 2,403 148 2,551 8. Capital Contributions 48,010 - 48,010 9. Interest Income 24,339 3,331 27,669 Total Non-Operating Revenues 205,895 79,161 285,056
Total Revenues 890,626 207,746 1,098,371
Expenses 1. Operating Expense 377,695 93,892 471,587 2. Depreciation 142,067 36,989 179,056 Non-Operating Expenses 3. Revenue Bond Interest Expense 149,841 7,390 157,231 4. GO Bond Interest Expense - 12,003 12,003 5. PFC Bond Interest Expense 2,740 - 2,740 6. Non-Op Environmental Expense - 5,000 5,000 7. Public Expense 6,313 12,920 19,233 8. Other Non-Op Rev/Expense (169) 3,074 2,905 Total Non-Operating Expenses 158,725 40,387 199,112
Total Expenses 678,488 171,268 849,755
Revenues over Expenses 212,138$ 36,478$ 248,616$
CAPITAL BUDGET 2 Aviation Non-Aviation Total 2020 Capital $ 570,138 $ 70,324 $ 640,462 5-Year CIP (2020-2024) $ 2,922,962 $ 520,064 $ 3,443,026
EMPLOYEES Aviation Non-Aviation Total Aviation 1,206.3 - 1,206.3 Maritime - 223.0 223.0 Economic Development - 35.6 35.6 Central Services - 914.4 914.4 Total 1,206.3 1,173.0 2,379.2
onepgsum.xlxs
Port of Seattle 2020 Budget Executive Summary
I-7
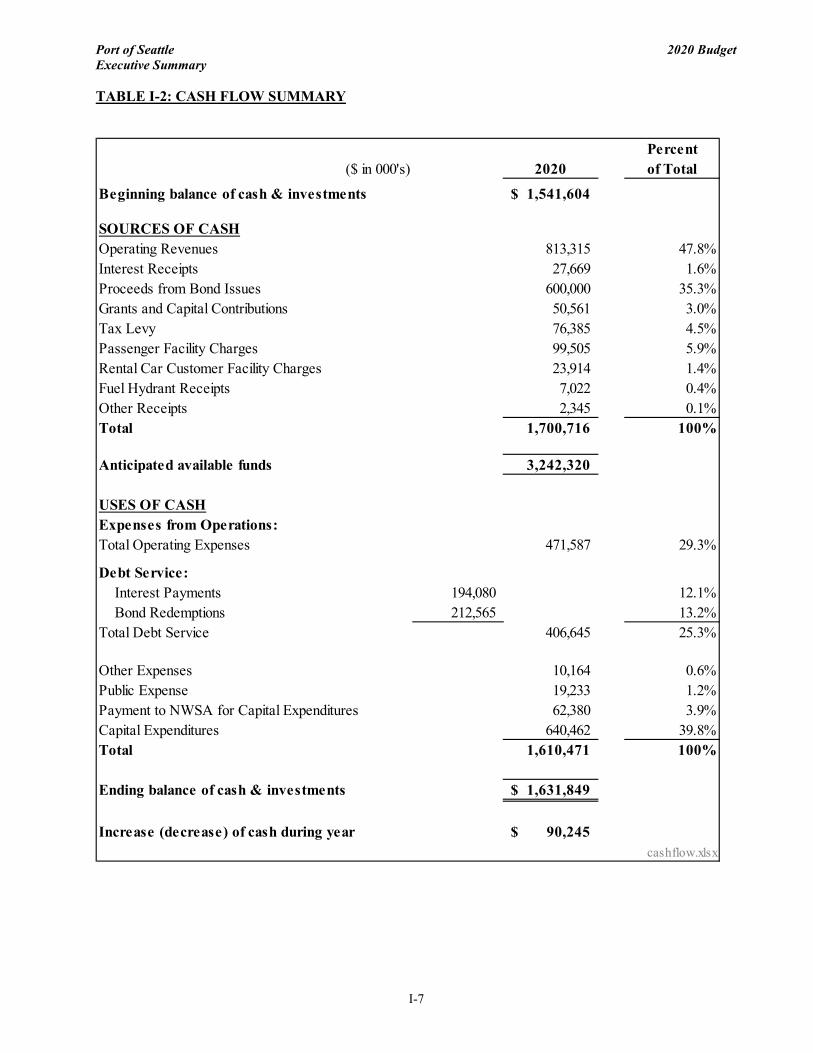
TABLE I-2: CASH FLOW SUMMARY
Percent ($ in 000's) 2020 of Total
Beginning balance of cash & investments 1,541,604$
SOURCES OF CASHOperating Revenues 813,315 47.8%Interest Receipts 27,669 1.6%Proceeds from Bond Issues 600,000 35.3%Grants and Capital Contributions 50,561 3.0%Tax Levy 76,385 4.5%Passenger Facility Charges 99,505 5.9%Rental Car Customer Facility Charges 23,914 1.4%Fuel Hydrant Receipts 7,022 0.4%Other Receipts 2,345 0.1%Total 1,700,716 100%
Anticipated available funds 3,242,320
USES OF CASHExpenses from Operations:Total Operating Expenses 471,587 29.3%
Debt Service: Interest Payments 194,080 12.1% Bond Redemptions 212,565 13.2%Total Debt Service 406,645 25.3%
Other Expenses 10,164 0.6%Public Expense 19,233 1.2%Payment to NWSA for Capital Expenditures 62,380 3.9%Capital Expenditures 640,462 39.8%Total 1,610,471 100%
Ending balance of cash & investments 1,631,849$
Increase (decrease) of cash during year 90,245$ cashflow.xlsx

Port of Seattle 2020 Budget Executive Summary
I-8
FIGURE I-1: SOURCES OF CASH ($ in 000’s)
FIGURE I-2: USES OF CASH ($ in 000’s)
II. PO
RT
VIE
WII. PORT VIEW


Port of Seattle 2020 Budget Port View
II-1
A. THE PORT OF SEATTLE The Port of Seattle, (the “Port”), is a public enterprise with unique authority operating in an international, market-driven environment. The Port provides services to its customers in order to return benefits to the citizens of King County, giving careful consideration to the economic, social, and environmental implications of its decisions. The Port is now comprised of three operating divisions, namely Aviation, Maritime, and Economic Development. The Aviation Division manages the Seattle-Tacoma International Airport, (“Sea-Tac”). The Maritime Division manages cruise, grain, commercial and recreational marinas, and industrial properties connected with maritime businesses. The Economic Development Division manages the Port’s real estate portfolio, and plans and facilitates the development of selected real estate assets, tourism, small business and workforce development. Central Services provides high quality and cost-effective professional and technical services to the divisions and supports the overall goals of the Port; it also delivers capital projects and provides technical services in support of the financial plans and infrastructure needs of the Port. In August of 2015, the Port of Seattle and the Port of Tacoma formed the Northwest Seaport Alliance (NWSA), which unifies the two ports’ marine cargo terminal investments, operations, planning, and marketing. The goals for combining the two ports’ cargo terminal operations include strengthening the Puget Sound gateway, making the region more competitive in the global economy, attracting more marine cargo, and creating new jobs in the region. Together, the ports can more efficiently deploy the significant investments each port has devoted to infrastructure, and speak with a stronger voice on pressing regional and industry-related issues. B. HISTORY OF THE PORT OF SEATTLE Founded in 1911 by a vote of the people as a special purpose government, the Port of Seattle’s mission is to promote economic opportunities and quality of life in the region by advancing trade, travel, and commerce in an equitable, accountable, and environmentally responsible manner. The Port was established in an effort by citizens to ensure public ownership of the Seattle harbor. The Port of Seattle was the first autonomous municipal corporation in the United States specifically tasked to develop harbor and Port facilities to encourage commerce. The Port opened Fishermen’s Terminal in 1912, its first warehouse in 1915 and began working on the creation of Harbor Island. Since then, the Port has developed numerous properties including construction of the Seattle-Tacoma International Airport in 1949. The Port’s mission hasn’t changed over the years, but its scope of services has expanded considerably. The Port continues to upgrade and modernize its facilities to meet current and future market demands. The Port has added container terminals, a grain terminal, cruise terminals, marinas, public parks, and viewpoints and has contributed significantly to the development of public amenities along Seattle’s waterfront. C. PORT OF SEATTLE FACILITIES AND SERVICES The Aviation Division operates Sea-Tac Airport which is located on 2,800 acres sixteen miles south of downtown Seattle. The airport includes 3 runways that are 11,900 feet, 9,425 feet, and 8,500 feet in length and a subway system linking the concourses. Sea-Tac is the 8th busiest U.S. airport as measured by total passengers in 2018 and compared to other large airports, it has relatively high originations and destinations traffic.
Port of Seattle 2020 Budget Port View
II-2
The Maritime Division operates 2 cruise vessel terminals with a total of 3 berths. The division also manages a fully automated grain terminal and Fishermen’s Terminal, which is home to the North Pacific factory trawler fishing fleet as well as other general-purpose maritime facilities. In addition, the Maritime Division leases industrial property connected with these cruise, cargo, and factory trawler fishing businesses. The Economic Development Division manages the Port’s holdings in commercial real estate, developable property, tourism, small business opportunities, and workforce development in the maritime and aviation industries. This allows the Maritime and Aviation divisions to concentrate on their core businesses. The NWSA, as a Port Development Authority (PDA), is a separate legal entity from the two home ports, and acts as the exclusive manager and operator of the container, break-bulk, auto and some bulk terminals in Seattle and Tacoma. The NWSA is the fourth-largest trade gateway in North America, behind the ports of Los Angeles and Long Beach, the Port of New York/New Jersey, and the Port of Savannah. It is the first alliance of its kind in North America, and offers shorter U.S. - to-Asia transits, as well as a deep connection to Alaska. The airport, cruise business, marinas, Fishermen’s Terminal, grain terminals, and certain industrial real estate, such as the Northwest Innovation Works and Puget Sound Energy facilities, and Terminal 91 uplands, remain outside the Alliance.
Port of Seattle 2020 Budget Port View
II-3
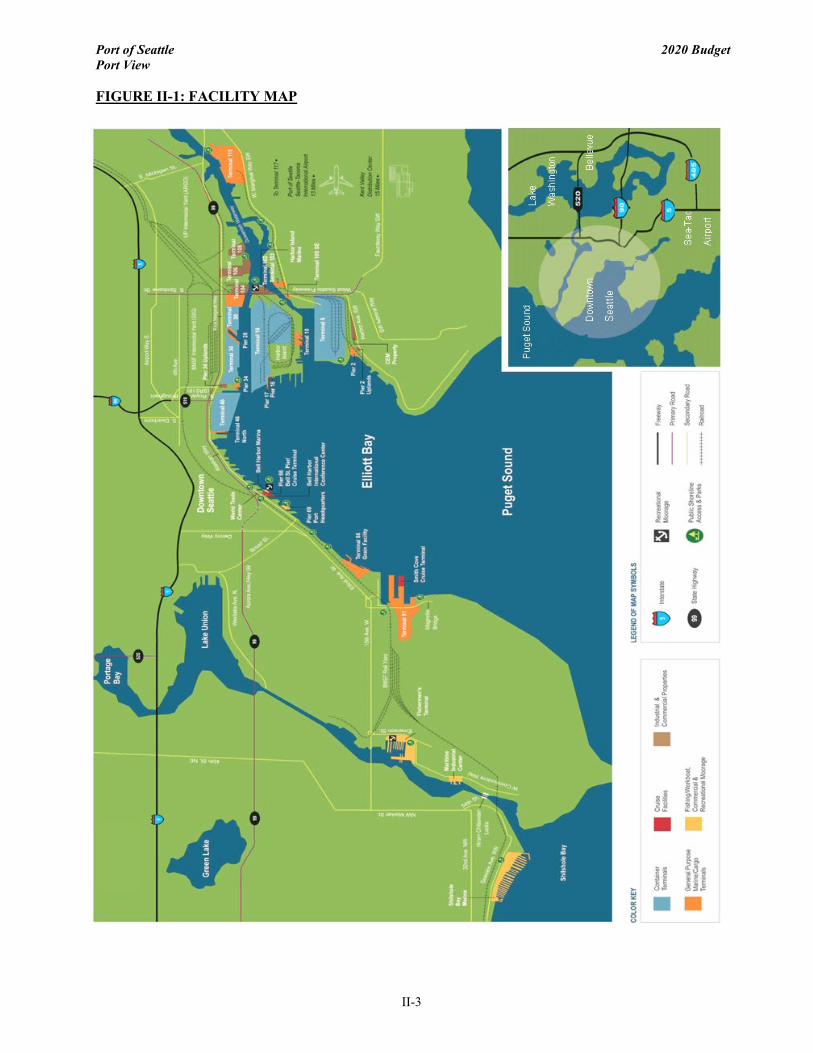
FIGURE II-1: FACILITY MAP

Port of Seattle 2020 Budget Port View
II-4
D. LONG RANGE PLAN
In 2012, the Port celebrated 100 years of service to the Puget Sound region by creating a comprehensive, strategic initiative to guide Port priorities for the next quarter century. That initiative is the Century Agenda. The Century Agenda aligns the Port’s and objectives across all divisions and departments as they address evolving challenges with innovative solutions.
For more than 100 years the Port has generated jobs and growth for King County and the greater region by advancing trade and commerce, promoting industrial growth, and stimulating economic development. The Port leverages its real estate, capital assets and financial capabilities to engage and improve the Puget Sound Region as an anchor institution and it brings those resources to bear in accomplishing the goals established by the Century Agenda.
Two years prior to the centennial, the Commission launched an extensive public engagement effort and formed a Century Agenda Committee to guide the Port’s long-range vision. More than 1,000 people attended over 60 events and engagements to help develop what are now known as Strategies and Objectives, along with a proposed Mission and Commitment. Each year since, the Port staff has identified action plans that are incorporated in the Port business plans and budget to advance progress towards achieving the Century Agenda Vision, Strategies (Pg. 6), and Objectives (Pg. 9).
Since its inception, the Century Agenda has remained the cornerstone of the Port’s long-term strategic planning. The Strategies and Objectives set forward in the Century Agenda are reviewed every five years to ensure it remains a living document and that the aspirational aims it sets forth are aligned to and reflective of the current landscape and the Port’s vision for the future.

Port of Seattle 2020 Budget Port View
II-5

Port of Seattle 2020 Budget Port View
II-6
ANNUAL CENTURY AGENDA AND PORTWIDE GOAL PLANNING PROCESS
Port of Seattle 2020 Budget Port View
II-7
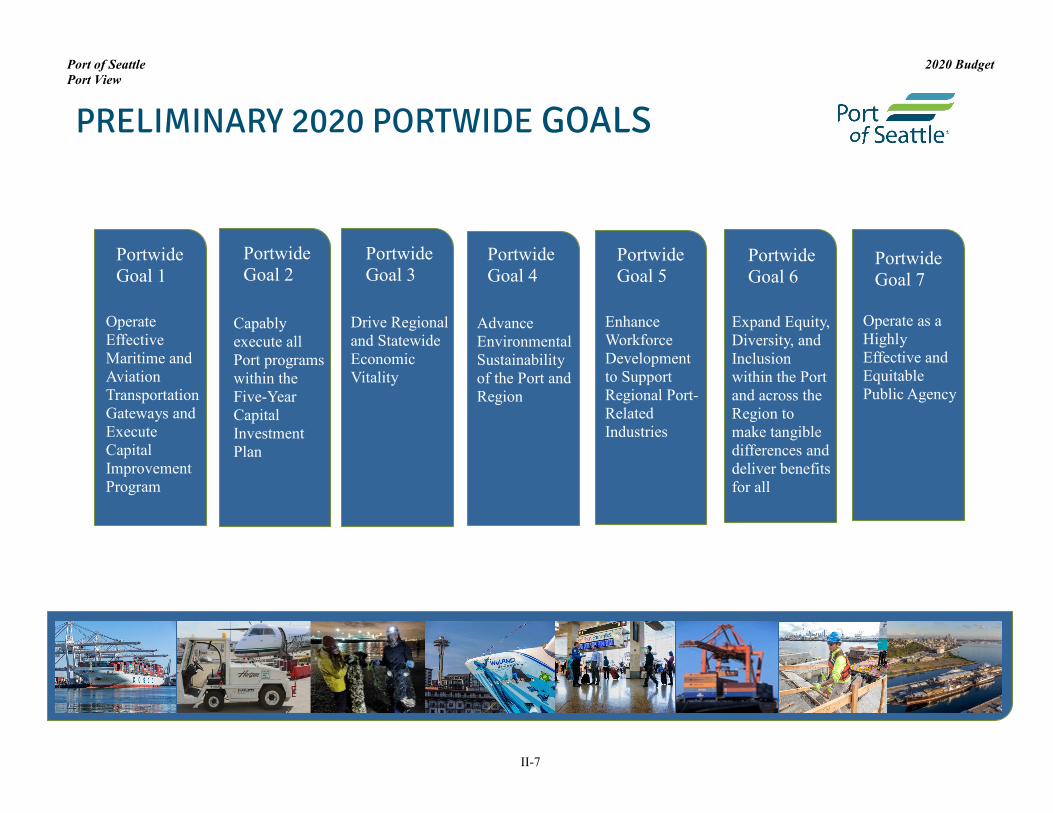
Portwide Goal 1
Operate Effective Maritime and Aviation Transportation Gateways and Execute Capital Improvement Program
Portwide Goal 2
PRELIMINARY 2020 PORTWIDE GOALS
Capably execute all Port programs within the Five-Year Capital Investment Plan
Drive Regional and Statewide Economic Vitality
Portwide Goal 3
Portwide Goal 4
Portwide Goal 5
Portwide Goal 6
Expand Equity, Diversity, and Inclusion within the Port and across the Region to make tangible differences and deliver benefits for all
Portwide Goal 7
Operate as a Highly Effective and Equitable Public Agency
Advance Environmental Sustainability of the Port and Region
Enhance Workforce Development to Support Regional Port-Related Industries
Port of Seattle 2020 Budget Port view
II-8
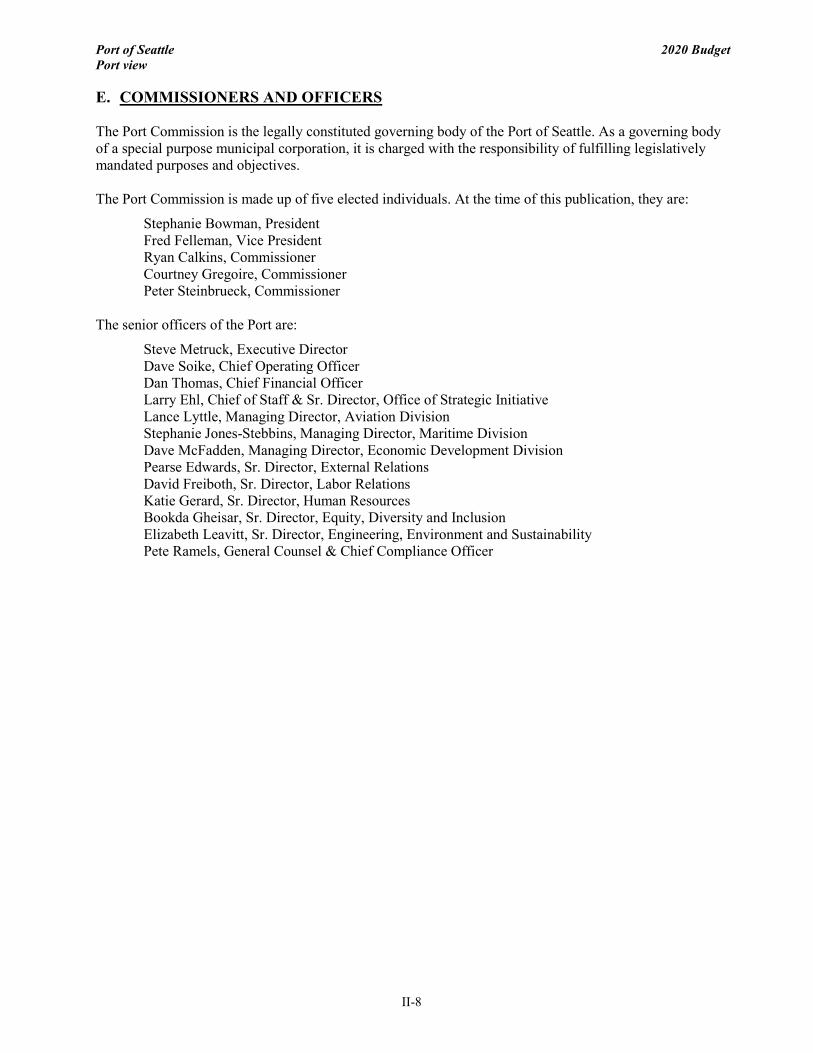
E. COMMISSIONERS AND OFFICERS The Port Commission is the legally constituted governing body of the Port of Seattle. As a governing body of a special purpose municipal corporation, it is charged with the responsibility of fulfilling legislatively mandated purposes and objectives. The Port Commission is made up of five elected individuals. At the time of this publication, they are:
Stephanie Bowman, President Fred Felleman, Vice President Ryan Calkins, Commissioner Courtney Gregoire, Commissioner Peter Steinbrueck, Commissioner
The senior officers of the Port are:
Steve Metruck, Executive Director Dave Soike, Chief Operating Officer Dan Thomas, Chief Financial Officer Larry Ehl, Chief of Staff & Sr. Director, Office of Strategic Initiative Lance Lyttle, Managing Director, Aviation Division Stephanie Jones-Stebbins, Managing Director, Maritime Division Dave McFadden, Managing Director, Economic Development Division Pearse Edwards, Sr. Director, External Relations David Freiboth, Sr. Director, Labor Relations Katie Gerard, Sr. Director, Human Resources Bookda Gheisar, Sr. Director, Equity, Diversity and Inclusion Elizabeth Leavitt, Sr. Director, Engineering, Environment and Sustainability Pete Ramels, General Counsel & Chief Compliance Officer
Port of Seattle 2020 Budget Port view
II-9
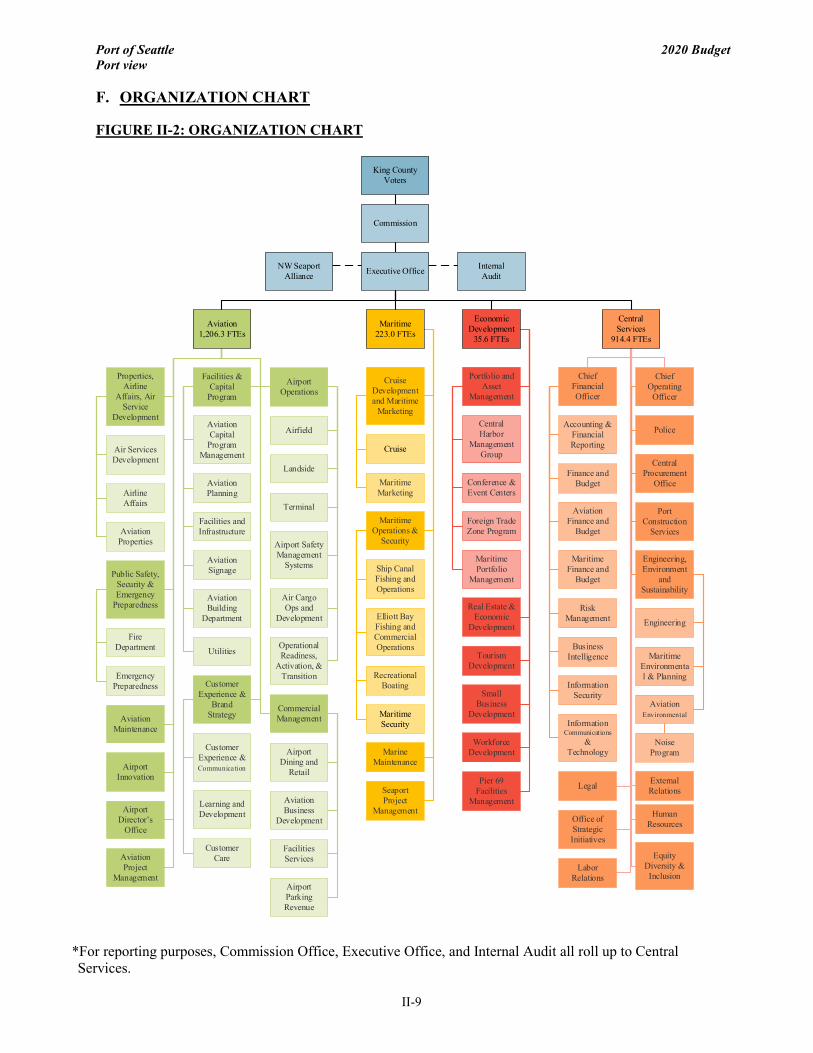
F. ORGANIZATION CHART FIGURE II-2: ORGANIZATION CHART
King County
Voters
Commission
InternalAuditExecutive OfficeNW Seaport
Alliance
Aviation1,206.3 FTEs
Maritime223.0 FTEs
Economic Development
35.6 FTEs
Central Services
914.4 FTEs
Facilities & Capital
Program
Aviation Capital
Program Management
Aviation Planning
Facilities and Infrastructure
Aviation Building
Department
Utilities
Commercial Management
Airport Operations
Airfield
Landside
Terminal
Public Safety, Security & Emergency
Preparedness
Fire Department
Emergency Preparedness Customer
Experience & Brand
Strategy
Cruise Development and Maritime
Marketing
Recreational Boating
Marine Maintenance
Maritime Security
Maritime Marketing
Portfolio and Asset
Management
Central Harbor
Management Group
Conference & Event Centers
Foreign Trade Zone Program
Maritime Portfolio
Management
Real Estate & Economic
Development
Tourism Development
Small Business
Development
Workforce Development
Pier 69 Facilities
Management
Airport Dining and
Retail
Chief Operating
Officer
Port Construction
Services
Chief Financial Officer
Aviation Project
Management
Police
Seaport Project
Management
Engineering, Environment
and Sustainability
Accounting & Financial Reporting
Equity Diversity & Inclusion
Central Procurement
Office
Aviation Environmental
Noise Program
Finance and Budget
Aviation Finance and
BudgetMaritime
Operations & Security
Maritime Finance and
Budget
Risk Management
Business Intelligence
Information Security
Information Communications
& Technology
Maritime Environmental & Planning
Legal External Relations
Human Resources
Labor Relations
Office of Strategic Initiatives
Aviation Maintenance
Aviation Signage
Elliott Bay Fishing and Commercial Operations
Cruise
Ship Canal Fishing and Operations
Airport Innovation
Airport Director’s
Office
Engineering
Airport Safety Management
Systems
Air Cargo Ops and
Development
Operational Readiness,
Activation, & Transition
Aviation Business
Development
Facilities Services
Airport Parking Revenue
Customer Experience & Communica tion
Customer Care
Learning and Development
Properties, Airline
Affairs, Air Service
Development
Air Services Development
Airline Affairs
Aviation Properties
*For reporting purposes, Commission Office, Executive Office, and Internal Audit all roll up to Central Services.

Port of Seattle 2020 Budget Port view
II-10
This page intentionally left blank.

III. BU
DG
ET
OV
ER
VIE
W
III. BUDGET OVERVIEW


Port of Seattle 2020 Budget Budget Overview
: Budover.doc : 10/21/2019 III-1
BUDGET OVERVIEW
A. FINANCIAL OVERVIEW Table III-1 below is a summary of the combined financial forecasts of the Port’s operating divisions, which can be found in Sections IV, V and VI. TABLE III-1: PORT OF SEATTLE FINANCIAL FORECAST
Notes: 1) Includes revenue from Central Services, Stormwater Utility & Elimination and corresponding offset to allocated
charges from Central Services departments. 2) See Section IX for details of Capital Improvement Plan. B. OPERATING BUDGET OVERVIEW
The 2020 budget comprises of total operating revenues of $813.3 million and total operating expenses of $471.6 million. Net Operating Income before depreciation calculates to $341.7 million. Net Operating Income after depreciation is budgeted at $162.7 million.
• Aviation Division’s operating revenues are $684.7 million, a $59.6 million or 9.5% increase from 2019 budget. Total airport operating expenses are budgeted at $377.7 million. This represents a $11.6 million or 3.2% increase compared to the 2019 budget. Net operating income before depreciation is $307.0 million.
• Maritime Division’s operating revenues are $62.9 million and total operating expenses including Central Services costs are $56.2 million. Net operating income before depreciation is $6.8 million.
• Economic Development Division’s operating revenues are $19.1 million while total operating expenses including Central Services costs are $29.0 million. Net operating loss before depreciation is $9.9 million.
• Operating expenses for Central Services are $150.3 million for 2020.
($ in 000's) CompoundBudget Budget Forecast Growth
OPERATING BUDGET Notes 2019 2020 2021 2022 2023 2024 2020 - 2024
Aeronautical Revenue 365,604$ 401,563$ 441,471$ 483,165$ 501,485$ 527,764$ 7.1%Portwide Non-Aeronautical Revenue 1 343,741 370,253 391,066 403,854 431,073 446,884 4.8%NWSA Distributable Revenue 43,911 41,500 35,400 45,850 48,250 51,400 5.5% Total Operating Revenues 753,255 813,315 867,937 932,868 980,808 1,026,048 6.0%
Total Operating & Maintenance Expenses 1 454,986 471,587 501,341 520,295 540,478 563,734 4.6%
Net Operating Income Before Depreciation 298,269 341,728 366,596 412,573 440,330 462,314 7.8%
Total Depreciation Expense 168,676 179,056 Net Operating Income after Depreciation 129,593$ 162,672$
Total2020 - 2024
Committed Capital Budget 912,626$ 681,691$ 494,542$ 340,629$ 206,131$ 140,810$ 1,863,803$ Business Plan Prospective 88,811 57,837 199,500 312,267 433,191 576,428 1,579,223CIP Cashflow Adjustment Reserve 0 (99,066) 34,000 20,066 25,000 20,000 0 TOTAL CIP 2 1,001,437$ 640,462$ 728,042$ 672,962$ 664,322$ 737,238$ 3,443,026$
POSBPFOR.XLS
Port of Seattle 2020 Budget Budget Overview
: Budover.doc : 10/21/2019 III-2
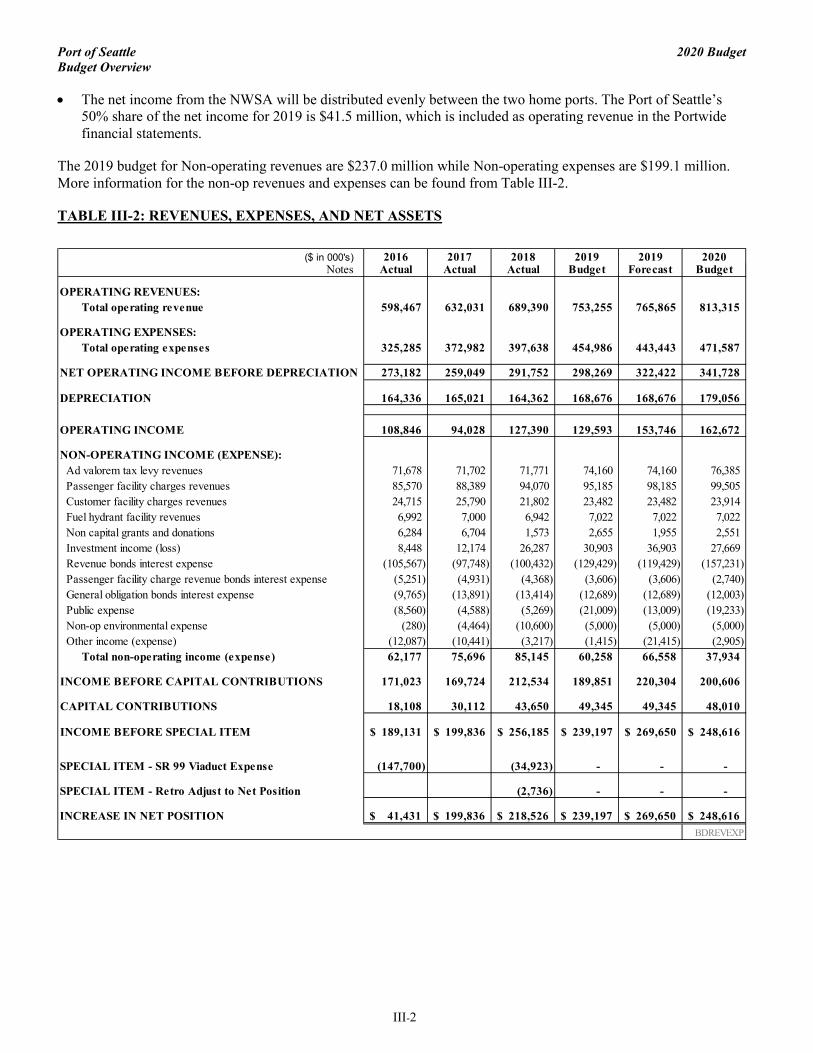
• The net income from the NWSA will be distributed evenly between the two home ports. The Port of Seattle’s 50% share of the net income for 2019 is $41.5 million, which is included as operating revenue in the Portwide financial statements.
The 2019 budget for Non-operating revenues are $237.0 million while Non-operating expenses are $199.1 million. More information for the non-op revenues and expenses can be found from Table III-2.
TABLE III-2: REVENUES, EXPENSES, AND NET ASSETS
($ in 000's) 2016 2017 2018 2019 2019 2020 Notes Actual Actual Actual Budget Forecast Budget
OPERATING REVENUES: Total operating revenue 598,467 632,031 689,390 753,255 765,865 813,315
OPERATING EXPENSES: Total operating expenses 325,285 372,982 397,638 454,986 443,443 471,587
NET OPERATING INCOME BEFORE DEPRECIATION 273,182 259,049 291,752 298,269 322,422 341,728
DEPRECIATION 164,336 165,021 164,362 168,676 168,676 179,056
OPERATING INCOME 108,846 94,028 127,390 129,593 153,746 162,672
NON-OPERATING INCOME (EXPENSE): Ad valorem tax levy revenues 71,678 71,702 71,771 74,160 74,160 76,385 Passenger facility charges revenues 85,570 88,389 94,070 95,185 98,185 99,505 Customer facility charges revenues 24,715 25,790 21,802 23,482 23,482 23,914 Fuel hydrant facility revenues 6,992 7,000 6,942 7,022 7,022 7,022 Non capital grants and donations 6,284 6,704 1,573 2,655 1,955 2,551 Investment income (loss) 8,448 12,174 26,287 30,903 36,903 27,669 Revenue bonds interest expense (105,567) (97,748) (100,432) (129,429) (119,429) (157,231) Passenger facility charge revenue bonds interest expense (5,251) (4,931) (4,368) (3,606) (3,606) (2,740) General obligation bonds interest expense (9,765) (13,891) (13,414) (12,689) (12,689) (12,003) Public expense (8,560) (4,588) (5,269) (21,009) (13,009) (19,233) Non-op environmental expense (280) (4,464) (10,600) (5,000) (5,000) (5,000) Other income (expense) (12,087) (10,441) (3,217) (1,415) (21,415) (2,905) Total non-operating income (expense) 62,177 75,696 85,145 60,258 66,558 37,934
INCOME BEFORE CAPITAL CONTRIBUTIONS 171,023 169,724 212,534 189,851 220,304 200,606
CAPITAL CONTRIBUTIONS 18,108 30,112 43,650 49,345 49,345 48,010
INCOME BEFORE SPECIAL ITEM 189,131$ 199,836$ 256,185$ 239,197$ 269,650$ 248,616$
SPECIAL ITEM - SR 99 Viaduct Expense (147,700) (34,923) - - -
SPECIAL ITEM - Retro Adjust to Net Position (2,736) - - -
INCREASE IN NET POSITION 41,431$ 199,836$ 218,526$ 239,197$ 269,650$ 248,616$ BDREVEXP
Port of Seattle 2020 Budget Budget Overview
: Budover.doc : 10/21/2019 III-3
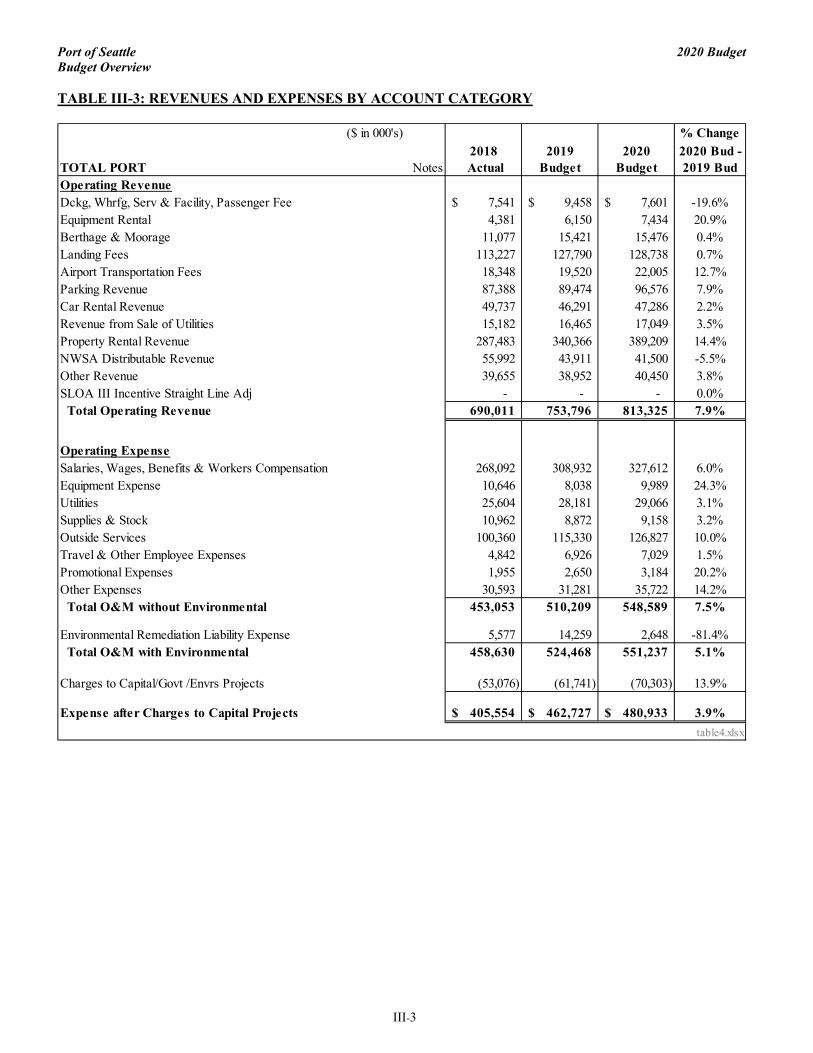
TABLE III-3: REVENUES AND EXPENSES BY ACCOUNT CATEGORY
($ in 000's) % Change2018 2019 2020 2020 Bud -
TOTAL PORT Notes Actual Budget Budget 2019 BudOperating RevenueDckg, Whrfg, Serv & Facility, Passenger Fee 7,541$ 9,458$ 7,601$ -19.6%Equipment Rental 4,381 6,150 7,434 20.9%Berthage & Moorage 11,077 15,421 15,476 0.4%Landing Fees 113,227 127,790 128,738 0.7%Airport Transportation Fees 18,348 19,520 22,005 12.7%Parking Revenue 87,388 89,474 96,576 7.9%Car Rental Revenue 49,737 46,291 47,286 2.2%Revenue from Sale of Utilities 15,182 16,465 17,049 3.5%Property Rental Revenue 287,483 340,366 389,209 14.4%NWSA Distributable Revenue 55,992 43,911 41,500 -5.5%Other Revenue 39,655 38,952 40,450 3.8%SLOA III Incentive Straight Line Adj - - - 0.0% Total Operating Revenue 690,011 753,796 813,325 7.9%
Operating ExpenseSalaries, Wages, Benefits & Workers Compensation 268,092 308,932 327,612 6.0%Equipment Expense 10,646 8,038 9,989 24.3%Utilities 25,604 28,181 29,066 3.1%Supplies & Stock 10,962 8,872 9,158 3.2%Outside Services 100,360 115,330 126,827 10.0%Travel & Other Employee Expenses 4,842 6,926 7,029 1.5%Promotional Expenses 1,955 2,650 3,184 20.2%Other Expenses 30,593 31,281 35,722 14.2% Total O&M without Environmental 453,053 510,209 548,589 7.5%
Environmental Remediation Liability Expense 5,577 14,259 2,648 -81.4% Total O&M with Environmental 458,630 524,468 551,237 5.1%
Charges to Capital/Govt /Envrs Projects (53,076) (61,741) (70,303) 13.9%
Expense after Charges to Capital Projects 405,554$ 462,727$ 480,933$ 3.9%table4.xlsx

Port of Seattle 2020 Budget Budget Overview
: Budover.doc : 10/21/2019 III-4
FIGURE III-1: REVENUES BY SOURCE: 2020 ($ in 000’s)
FIGURE III-2: EXPENSES BY USAGE: 2020 ($ in 000’s)
Port of Seattle 2020 Budget Budget Overview
: Budover.doc : 10/21/2019 III-5
C. BUDGET OVERVIEW - STAFFING The 2020 budget includes a total of 2,379.2 Full-Time Equivalent (FTE) positions, an increase of 5.5% compared to the 2019 budget. As part of the 2019 organizational realignment, Aviation Project Management Group (AV PMG) and Seaport Project Management Group (PMG) were transferred from Central Services to Aviation and Maritime divisions, respectively. However, the 2018 Actual and 2019 Budget totals were restated to reflect the current organizational structure. Key staffing changes include: • Aviation Division FTEs will increase by 38.8 or 3.3% for 2020 budget. Major changes that occurred in 2019
include the transfer of AV PMG from Central Services, several mid-year additions as well as elimination of vacant positions resulting in a net reduction of 14.3 compared to the approved 2019 budget. A total of 53.0 new FTEs is proposed for 2020, majority of which will be in Aviation Maintenance.
• The Maritime Division FTEs will increase by 34.0 or 18% for 2020. The biggest change in 2019 was the transfer of Seaport PMG from Central Services; however, the 2018 Actual and 2019 Budget baseline were adjusted to reflect the current organizational tree. Therefore, the 2019 changes reflect a net increase of 3.5 over the 2019 approved budget. The proposed 2020 FTE for Maritime is 30.5 which includes: (1) additions from Cruise, Maritime Administration, Marine Maintenance, Seaport PMG, and Stormwater Utility; (2) staff reduction; (3) conversion of 24 craft/labor emergency hires to regular FTEs.
• Economic Development Division FTEs will decrease by 0.4 or 1.1% for 2020. In 2019, Economic Development transferred 1.0 FTE to Maritime division and 2.0 FTES to Central Services, and added 2.0 FTEs in Diversity in Contracting resulting in a 2019 baseline decrease of 1.0 FTE. A total of 0.6 FTE is proposed for 2020, an addition of a part-time position in Portfolio Management Administration.
• Central Services FTEs will increase by 51.8 or 6.0% in 2020. Among the key changes that occurred in 2019 include the transfers of AV PMG and Seaport PMG to the divisions, elimination of Capital Development Administration, and mid-year approvals. The sum of these changes resulted in a 2019 baseline increase of 20.0 FTEs. A total of 35 new FTEs is proposed for 2020 to implement and support Portwide goals.
More information for each of these categories is provided in the Aviation, Maritime, Economic Development, and Central Services sections of this document (Sections IV to VII).

Port of Seattle 2020 Budget Budget Overview
: Budover.doc : 10/21/2019 III-6
TABLE III-4: PORT STAFFING BY DIVISION
Note: 1) Aviation & Seaport PMGs were moved from Central Services to the Aviation & Maritime divisions,
respectively, as part of the 2019 organizational realignment. The 2018 Actual and 2019 Budget totals for Aviation, Maritime and Central Services were adjusted to reflect the current 2020 organizational structure.
FIGURE III-3: PORT STAFFING BY DIVISION:
PORT STAFFING(Full-Time Equivalent Positions) % Change
2018 2019 2019 2020 20 Bud- 20 Bud-Division Notes Actual Budget Est. Act. Budget 19 Bud 19 Est.Aviation 1,113.4 1,167.5 1,153.3 1,206.3 3.3% 4.6%Maritime 188.0 189.0 192.5 223.0 18.0% 15.8%Economic Development 35.0 36.0 35.0 35.6 -1.1% 1.7%Central Services 836.6 862.6 882.6 914.4 6.0% 3.6% Total FTE's 1 2,173.0 2,255.1 2,263.3 2,379.2 5.5% 5.1%
FTE.XLS
Port of Seattle 2020 Budget Budget Overview
: Budover.doc : 10/21/2019 III-7
D. CAPITAL BUDGET OVERVIEW For the Port to meet the waterborne and air transportation needs of the region and to serve its customers, it must invest in the acquisition, development, and maintenance of long-term assets. For an organization as large and diverse as the Port, this requires comprehensive long-term capital planning which synthesizes the existing and anticipated business environment, careful estimates of customer demand for facilities, available resources, and the priorities of the organization.
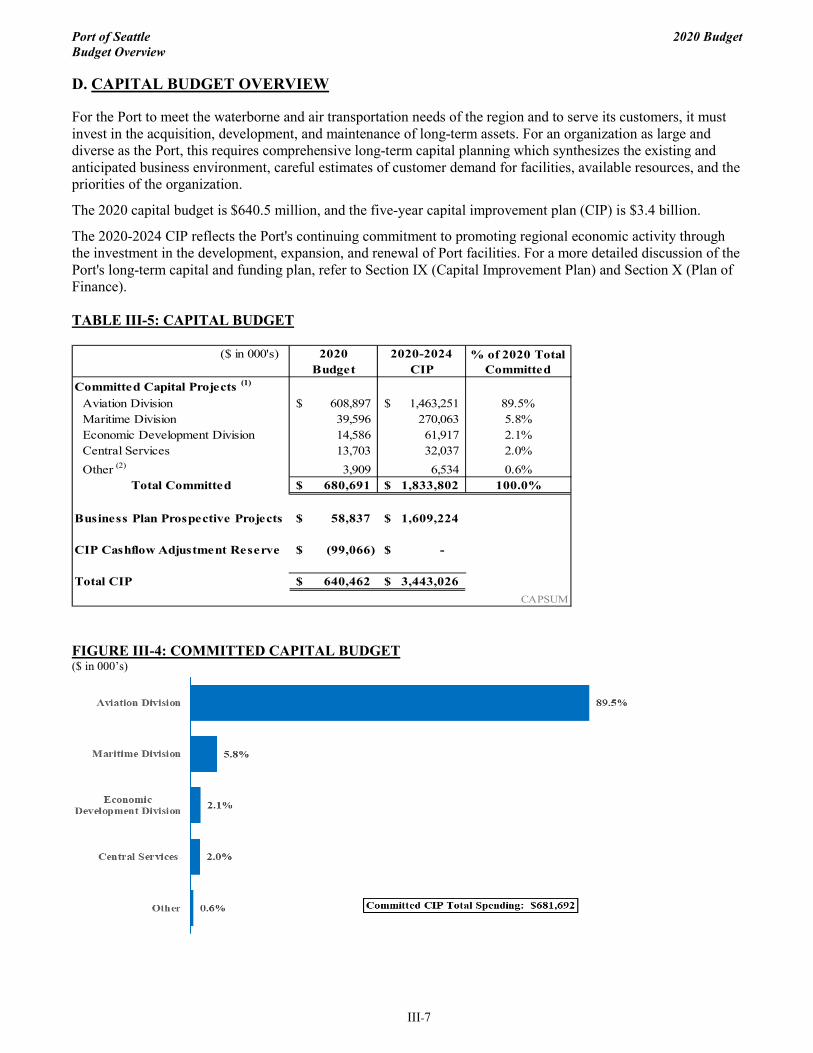
The 2020 capital budget is $640.5 million, and the five-year capital improvement plan (CIP) is $3.4 billion.
The 2020-2024 CIP reflects the Port's continuing commitment to promoting regional economic activity through the investment in the development, expansion, and renewal of Port facilities. For a more detailed discussion of the Port's long-term capital and funding plan, refer to Section IX (Capital Improvement Plan) and Section X (Plan of Finance). TABLE III-5: CAPITAL BUDGET
FIGURE III-4: COMMITTED CAPITAL BUDGET ($ in 000’s)
($ in 000's) 2020 2020-2024Budget CIP
Committed Capital Projects (1)
Aviation Division 608,897$ 1,463,251$ 89.5%Maritime Division 39,596 270,063 5.8%Economic Development Division 14,586 61,917 2.1%Central Services 13,703 32,037 2.0%Other (2) 3,909 6,534 0.6%
Total Committed 680,691$ 1,833,802$ 100.0%
Business Plan Prospective Projects 58,837$ 1,609,224$
CIP Cashflow Adjustment Reserve (99,066)$ -$
Total CIP 640,462$ 3,443,026$ CAPSUM
% of 2020 Total Committed
Port of Seattle 2020 Budget Budget Overview
: Budover.doc : 10/21/2019 III-8
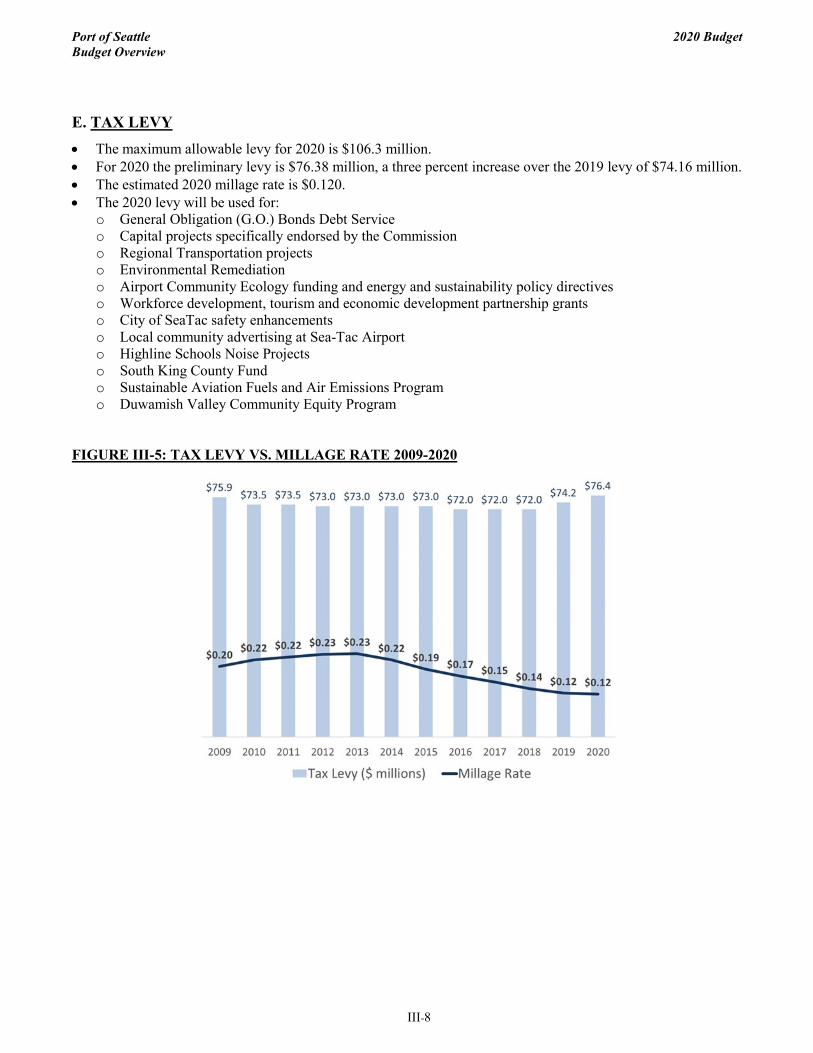
E. TAX LEVY • The maximum allowable levy for 2020 is $106.3 million. • For 2020 the preliminary levy is $76.38 million, a three percent increase over the 2019 levy of $74.16 million. • The estimated 2020 millage rate is $0.120. • The 2020 levy will be used for:
o General Obligation (G.O.) Bonds Debt Service o Capital projects specifically endorsed by the Commission o Regional Transportation projects o Environmental Remediation o Airport Community Ecology funding and energy and sustainability policy directives o Workforce development, tourism and economic development partnership grants o City of SeaTac safety enhancements o Local community advertising at Sea-Tac Airport o Highline Schools Noise Projects o South King County Fund o Sustainable Aviation Fuels and Air Emissions Program o Duwamish Valley Community Equity Program
FIGURE III-5: TAX LEVY VS. MILLAGE RATE 2009-2020

IV. AVIA
TIO
N
IV. AVIATION

Port of Seattle 2020 Budget Aviation
IV-1
AVIATION DIVISION
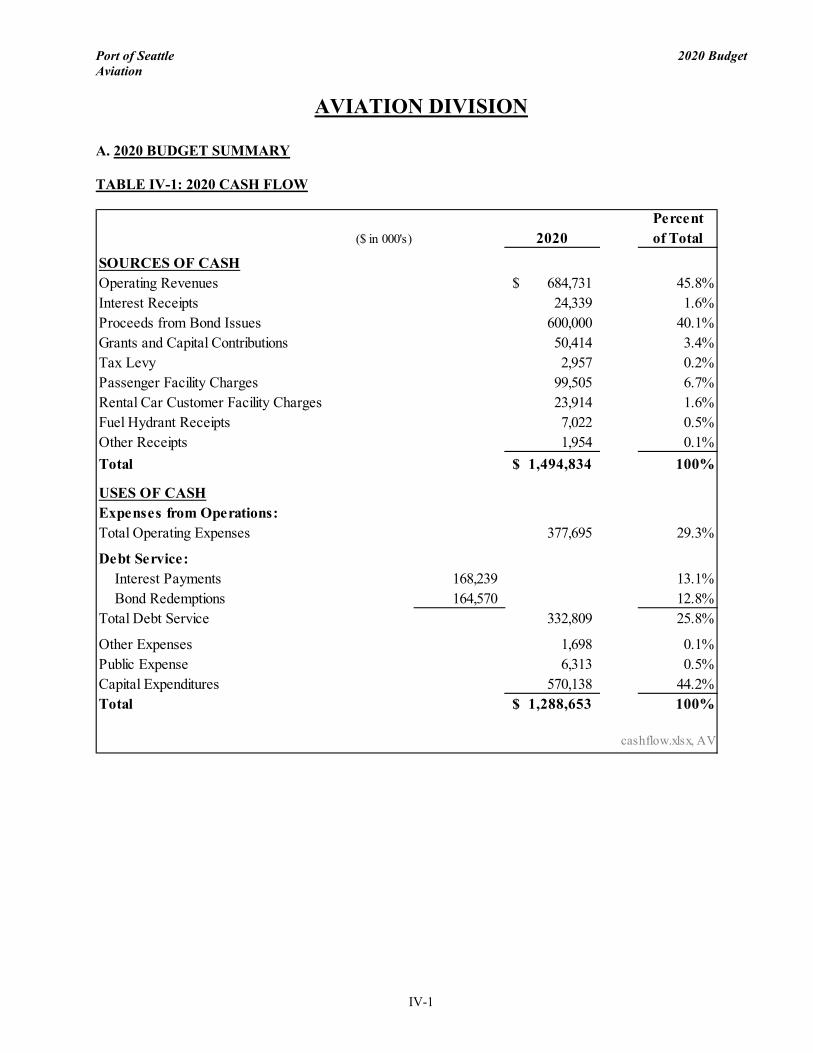
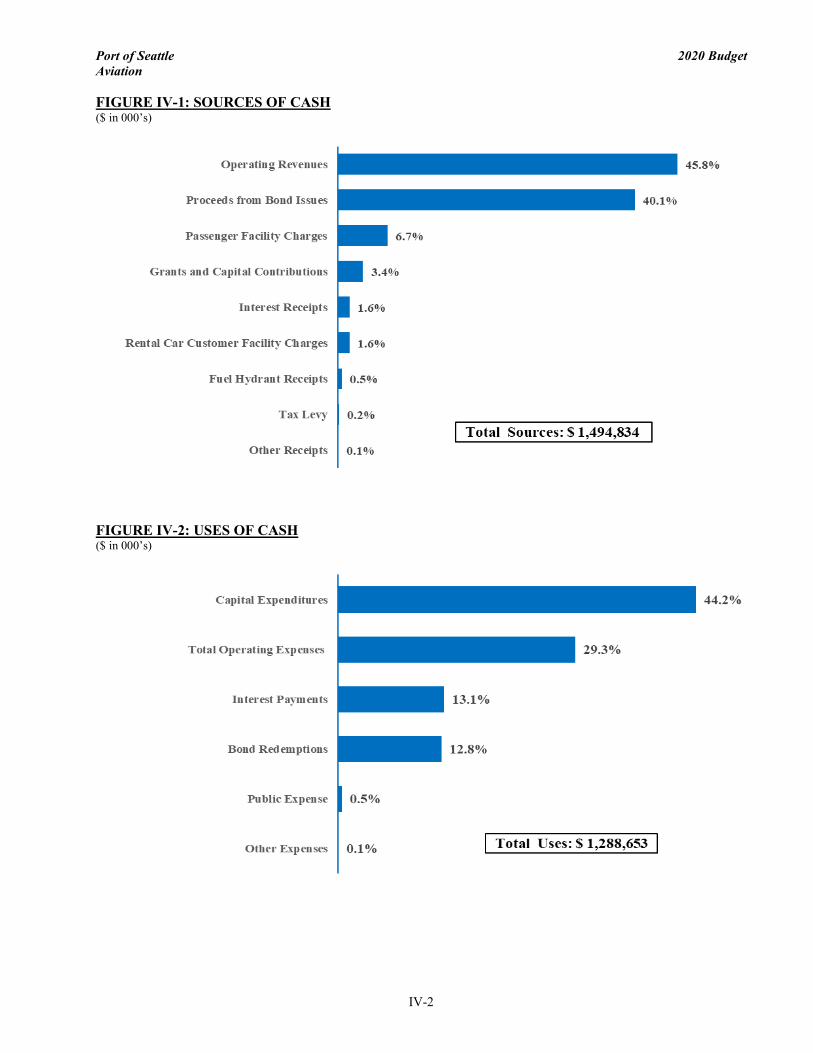
A. 2020 BUDGET SUMMARY TABLE IV-1: 2020 CASH FLOW
Percent ($ in 000's) 2020 of Total
SOURCES OF CASHOperating Revenues 684,731$ 45.8%Interest Receipts 24,339 1.6%Proceeds from Bond Issues 600,000 40.1%Grants and Capital Contributions 50,414 3.4%Tax Levy 2,957 0.2%Passenger Facility Charges 99,505 6.7%Rental Car Customer Facility Charges 23,914 1.6%Fuel Hydrant Receipts 7,022 0.5%Other Receipts 1,954 0.1%Total 1,494,834$ 100%
USES OF CASHExpenses from Operations:Total Operating Expenses 377,695 29.3%
Debt Service: Interest Payments 168,239 13.1% Bond Redemptions 164,570 12.8%Total Debt Service 332,809 25.8%
Other Expenses 1,698 0.1%Public Expense 6,313 0.5%Capital Expenditures 570,138 44.2%Total 1,288,653$ 100%
cashflow.xlsx, AV
Port of Seattle 2020 Budget Aviation
IV-2
FIGURE IV-1: SOURCES OF CASH ($ in 000’s)
FIGURE IV-2: USES OF CASH ($ in 000’s)
Port of Seattle 2020 Budget Aviation
IV-3
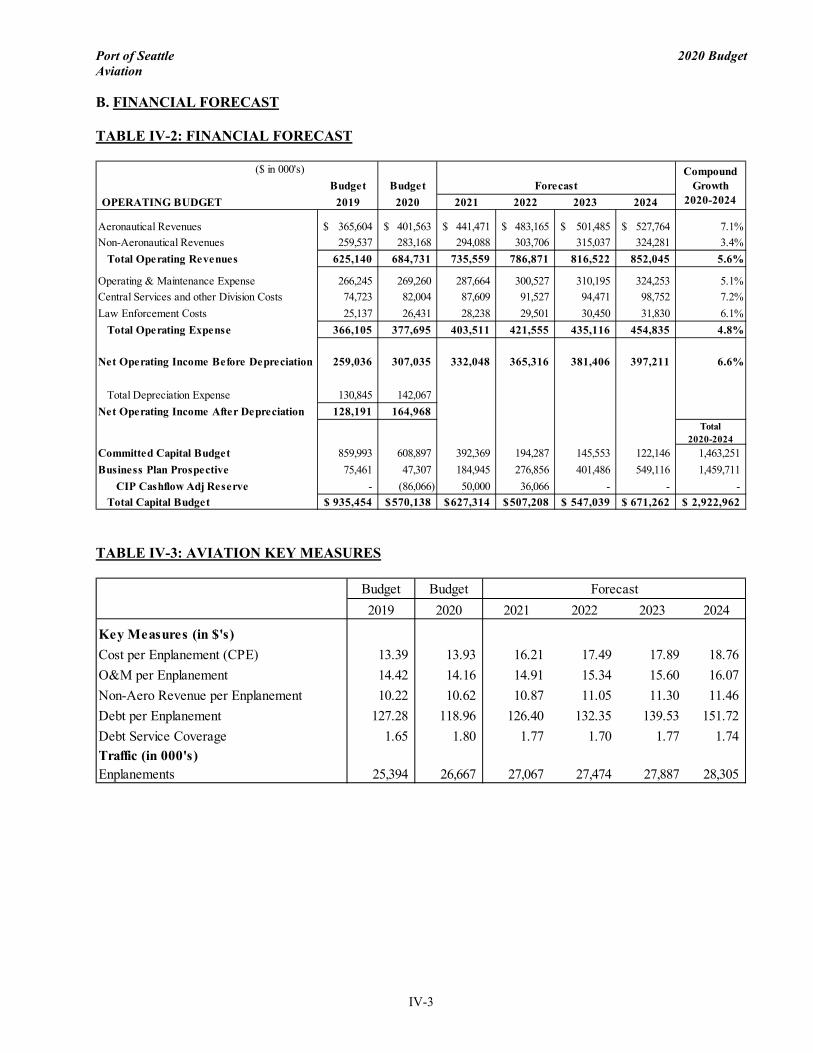
B. FINANCIAL FORECAST TABLE IV-2: FINANCIAL FORECAST
TABLE IV-3: AVIATION KEY MEASURES
($ in 000's) Budget Budget
OPERATING BUDGET 2019 2020 2021 2022 2023 2024
Aeronautical Revenues 365,604$ 401,563$ 441,471$ 483,165$ 501,485$ 527,764$ 7.1%Non-Aeronautical Revenues 259,537 283,168 294,088 303,706 315,037 324,281 3.4% Total Operating Revenues 625,140 684,731 735,559 786,871 816,522 852,045 5.6%
Operating & Maintenance Expense 266,245 269,260 287,664 300,527 310,195 324,253 5.1%Central Services and other Division Costs 74,723 82,004 87,609 91,527 94,471 98,752 7.2%Law Enforcement Costs 25,137 26,431 28,238 29,501 30,450 31,830 6.1% Total Operating Expense 366,105 377,695 403,511 421,555 435,116 454,835 4.8%
Net Operating Income Before Depreciation 259,036 307,035 332,048 365,316 381,406 397,211 6.6%
Total Depreciation Expense 130,845 142,067 Net Operating Income After Depreciation 128,191 164,968
Total 2020-2024
Committed Capital Budget 859,993 608,897 392,369 194,287 145,553 122,146 1,463,251 Business Plan Prospective 75,461 47,307 184,945 276,856 401,486 549,116 1,459,711
CIP Cashflow Adj Reserve - (86,066) 50,000 36,066 - - - Total Capital Budget 935,454$ 570,138$ 627,314$ 507,208$ 547,039$ 671,262$ 2,922,962$
CompoundGrowth
2020-2024Forecast
Budget Budget Forecast2019 2020 2021 2022 2023 2024
Key Measures (in $'s)Cost per Enplanement (CPE) 13.39 13.93 16.21 17.49 17.89 18.76 O&M per Enplanement 14.42 14.16 14.91 15.34 15.60 16.07 Non-Aero Revenue per Enplanement 10.22 10.62 10.87 11.05 11.30 11.46 Debt per Enplanement 127.28 118.96 126.40 132.35 139.53 151.72 Debt Service Coverage 1.65 1.80 1.77 1.70 1.77 1.74 Traffic (in 000's)Enplanements 25,394 26,667 27,067 27,474 27,887 28,305
Port of Seattle 2020 Budget Aviation
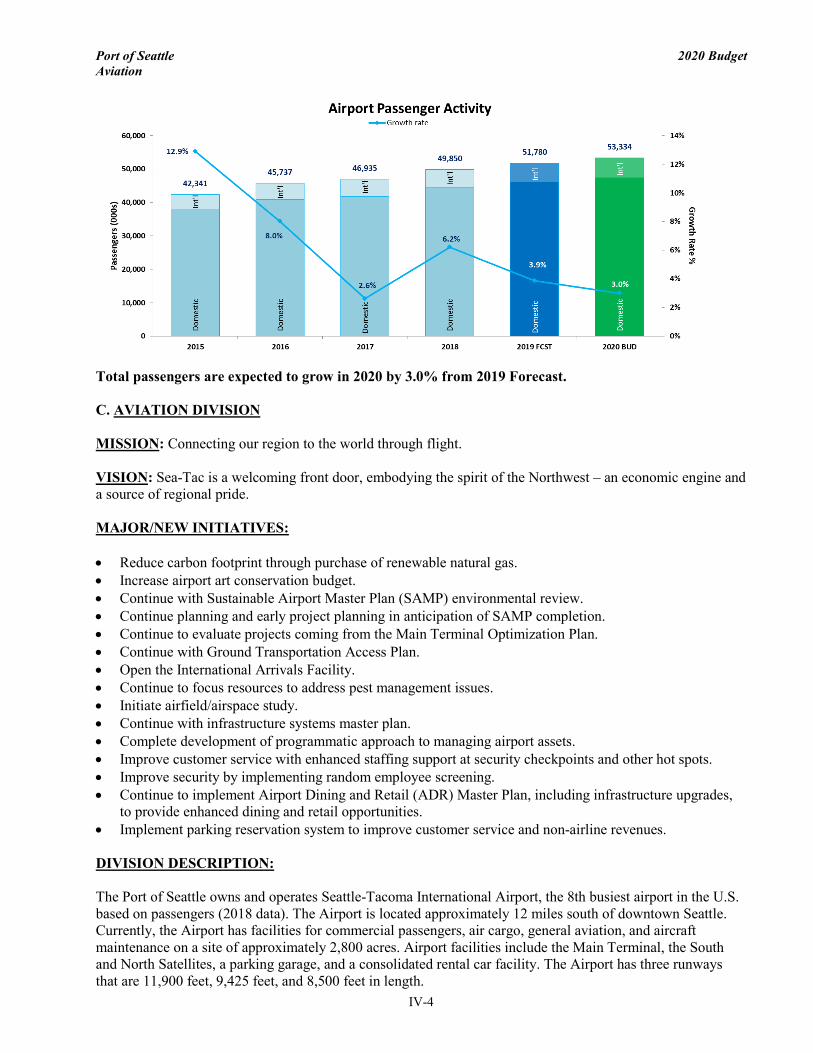
IV-4
Total passengers are expected to grow in 2020 by 3.0% from 2019 Forecast. C. AVIATION DIVISION MISSION: Connecting our region to the world through flight. VISION: Sea-Tac is a welcoming front door, embodying the spirit of the Northwest – an economic engine and a source of regional pride. MAJOR/NEW INITIATIVES: • Reduce carbon footprint through purchase of renewable natural gas. • Increase airport art conservation budget. • Continue with Sustainable Airport Master Plan (SAMP) environmental review. • Continue planning and early project planning in anticipation of SAMP completion. • Continue to evaluate projects coming from the Main Terminal Optimization Plan. • Continue with Ground Transportation Access Plan. • Open the International Arrivals Facility. • Continue to focus resources to address pest management issues. • Initiate airfield/airspace study. • Continue with infrastructure systems master plan. • Complete development of programmatic approach to managing airport assets. • Improve customer service with enhanced staffing support at security checkpoints and other hot spots. • Improve security by implementing random employee screening. • Continue to implement Airport Dining and Retail (ADR) Master Plan, including infrastructure upgrades,
to provide enhanced dining and retail opportunities. • Implement parking reservation system to improve customer service and non-airline revenues. DIVISION DESCRIPTION: The Port of Seattle owns and operates Seattle-Tacoma International Airport, the 8th busiest airport in the U.S. based on passengers (2018 data). The Airport is located approximately 12 miles south of downtown Seattle. Currently, the Airport has facilities for commercial passengers, air cargo, general aviation, and aircraft maintenance on a site of approximately 2,800 acres. Airport facilities include the Main Terminal, the South and North Satellites, a parking garage, and a consolidated rental car facility. The Airport has three runways that are 11,900 feet, 9,425 feet, and 8,500 feet in length.
Port of Seattle 2020 Budget Aviation
IV-5
INDUSTRY ASSESSMENT: Industry consolidation has left three major legacy carriers: American, United, and Delta. Together with Southwest, these four airlines dominate the U.S. market. The next tier of airlines is composed of Alaska, JetBlue, and Hawaiian. Ultra-low-cost carriers such as Spirit, Frontier, and Allegiant make up another group, although these carriers have a very small presence at Sea-Tac airport. Continued economic growth in the United States and relatively low oil prices over the past five years have contributed to a period of exceptional profitability for the U.S. airline industry. Consolidation has also contributed to industry profitability by reducing competition on many routes. In 2019, the price of oil has fluctuated within a range that has remained below the 2018 high. Some airlines (particularly American and Southwest) have been impacted by the grounding of the Boeing 737 MAX. Still mid-year 2019 earnings reports from major airlines show the industry remains profitable. Sea-Tac is a hub for both Alaska and Delta. Through August of 2019, Alaska accounts for 48.9% of passengers at Sea-Tac, while Delta accounts for 24.6%. BUSINESS ASSESSMENT/DRIVERS: Passenger growth at in recent years has propelled Sea-Tac Airport to the 8th busiest airport in the United States. The regional economy remains strong, contributing to the passenger growth at Sea-Tac. Growth picked up in 2018 to 6.2% after 2.6% in 2017. Passenger growth for 2019 is anticipated to be 4%. The budget for 2020 is for passenger growth of 3%. Sea-Tac has been successful in attracting new international services in 2019 with the addition of Cathay Pacific, Japan Airlines and Singapore Airlines. The International Arrivals Facility is expected to open in August of 2020, providing additional capacity to process arriving international passengers. With increasing passenger growth and constrained facilities (landside and terminal), the airport will focus on a combination of addressing immediate customer service priorities through enhanced staffing for peak periods and planning future facilities. CHALLENGES AND OPPORTUNITIES: • Optimize use of terminal space and facilities. The Port completed the Main Terminal Optimization Plan
that identified a number of potential projects to increase capacity and efficiency in the existing terminal. • Continue the implementation of automated security lane equipment to increase passenger throughput at
security checkpoints. • Improve customer service in congested facilities, during construction. • Improve airfield safety in spice of increased traffic/utilization. • Add future terminal/gate capacity. • Balance investment in existing facilities while preserving capital capacity for facility growth. • Maintain debt service coverage levels: increase non-aeronautical revenues and manage cost growth.
Port of Seattle 2020 Budget Aviation
IV-6
D. 2020 OPERATING BUDGET SUMMARY Background
From a financial perspective, the Aviation Division has two sides to its business: Aeronautical and Non-aeronautical. On the Aeronautical side, where airline rates are set to recover costs, the Port’s goal is to manage costs. The primary measure of an airport’s cost to the airlines is the airline cost per enplanement (CPE). The “costs” include the operating and maintenance costs attributable to the airfield and the airline share of the terminal operating and maintenance costs (based on the percentage of revenue producing space split between airlines and other Port tenants), as well as the corresponding capital costs (either debt service or equity amortization). The Port does not charge airlines for the capital costs of any asset funded by Passenger Facility Charges (PFCs) or grants. On the Non-aeronautical side of the business, the primary goal is to increase cash flow as measured by net operating income (NOI). The net cash flow can be used to directly fund capital improvements and build up cash reserves to meet liquidity targets. In prior years, this cash flow also provided the vast majority of the revenue sharing that was credited to the signatory airlines in accordance with the terms of the Signatory and Lease and Operating Agreement (SLOA). Under the terms of the current SLOA, which went into effect on 1/1/2018, of the net cash flow available for debt service that exceeds 125% of debt service (if any), 40% was credited to the signatory airlines in 2018. That percentage declined to 20% in 2019 and revenue sharing was eliminated effective 1/1/2020. Under the prior SLOA (effective 1/1/2013 – 12/31/2017) revenue sharing was set at 50% for all five years of that agreement. The change in revenue sharing percentage under the current SLOA reflects the airport’s focus on directly funding capital improvements and building up cash reserves to meet liquidity targets during a period of increased capital investment. Overview of Major Changes in 2020 Budget
The 2020 Budget reflects an expected steady growth of 3.0% in enplanements for the year, which builds on an expected growth of 4.0% in 2019, and actual growth of 6.4% in the 2018 calendar year. This activity growth and a strong regional economy has stimulated passenger spending for parking, other ground transportation modes, terminal dining and retail, and increased demand in common-use clubs/lounges. The multi-year Sustainable Airport Master Plan continues to be refined, and planning efforts will shift toward implementation of the multiple projects identified during the master planning process. 2020 will also see a continued ramp up in the airport capital program. Revenues
2020 Budget non-aeronautical revenues are up $23.6M, or 9.1%, over the 2019 budget due to anticipated growth across all major non-airline units due to growing passenger volume and improving economy. Strong growth expected in public parking, airport dining & retail, ground transportation, clubs & lounges, and commercial properties, with more modest growth expected in Rental Car activity. Aeronautical rate base revenues are budgeted to increase by 4.6%, which reflects increases in both capital and operating costs, as well as reflecting the impact of the elimination of revenue sharing in 2020. Under the current SLOA agreement, the revenue sharing percentage decreased from 40% in 2018 to 20% in 2019, and revenue sharing is eliminated starting in 2020.
Port of Seattle 2020 Budget Aviation
IV-7
Operating Expense Drivers
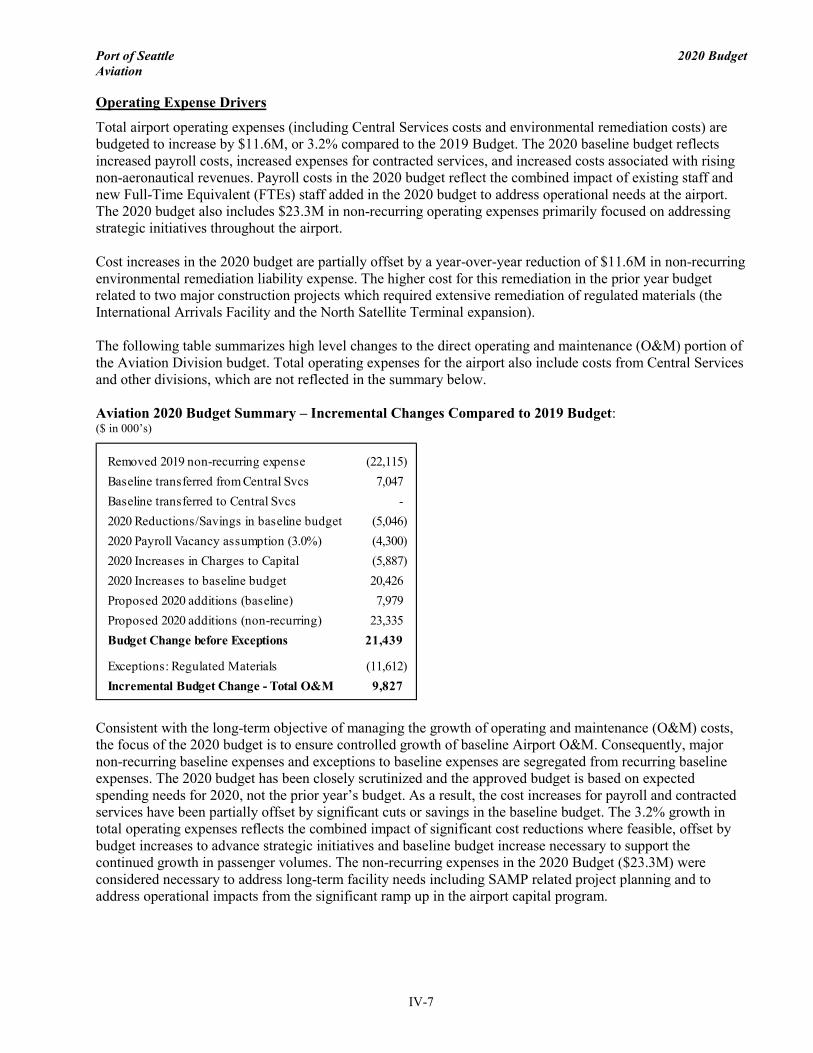
Total airport operating expenses (including Central Services costs and environmental remediation costs) are budgeted to increase by $11.6M, or 3.2% compared to the 2019 Budget. The 2020 baseline budget reflects increased payroll costs, increased expenses for contracted services, and increased costs associated with rising non-aeronautical revenues. Payroll costs in the 2020 budget reflect the combined impact of existing staff and new Full-Time Equivalent (FTEs) staff added in the 2020 budget to address operational needs at the airport. The 2020 budget also includes $23.3M in non-recurring operating expenses primarily focused on addressing strategic initiatives throughout the airport. Cost increases in the 2020 budget are partially offset by a year-over-year reduction of $11.6M in non-recurring environmental remediation liability expense. The higher cost for this remediation in the prior year budget related to two major construction projects which required extensive remediation of regulated materials (the International Arrivals Facility and the North Satellite Terminal expansion). The following table summarizes high level changes to the direct operating and maintenance (O&M) portion of the Aviation Division budget. Total operating expenses for the airport also include costs from Central Services and other divisions, which are not reflected in the summary below. Aviation 2020 Budget Summary – Incremental Changes Compared to 2019 Budget: ($ in 000’s)
Consistent with the long-term objective of managing the growth of operating and maintenance (O&M) costs, the focus of the 2020 budget is to ensure controlled growth of baseline Airport O&M. Consequently, major non-recurring baseline expenses and exceptions to baseline expenses are segregated from recurring baseline expenses. The 2020 budget has been closely scrutinized and the approved budget is based on expected spending needs for 2020, not the prior year’s budget. As a result, the cost increases for payroll and contracted services have been partially offset by significant cuts or savings in the baseline budget. The 3.2% growth in total operating expenses reflects the combined impact of significant cost reductions where feasible, offset by budget increases to advance strategic initiatives and baseline budget increase necessary to support the continued growth in passenger volumes. The non-recurring expenses in the 2020 Budget ($23.3M) were considered necessary to address long-term facility needs including SAMP related project planning and to address operational impacts from the significant ramp up in the airport capital program.
Removed 2019 non-recurring expense (22,115) Baseline transferred from Central Svcs 7,047 Baseline transferred to Central Svcs - 2020 Reductions/Savings in baseline budget (5,046) 2020 Payroll Vacancy assumption (3.0%) (4,300) 2020 Increases in Charges to Capital (5,887) 2020 Increases to baseline budget 20,426 Proposed 2020 additions (baseline) 7,979 Proposed 2020 additions (non-recurring) 23,335 Budget Change before Exceptions 21,439
Exceptions: Regulated Materials (11,612) Incremental Budget Change - Total O&M 9,827
Port of Seattle 2020 Budget Aviation
IV-8
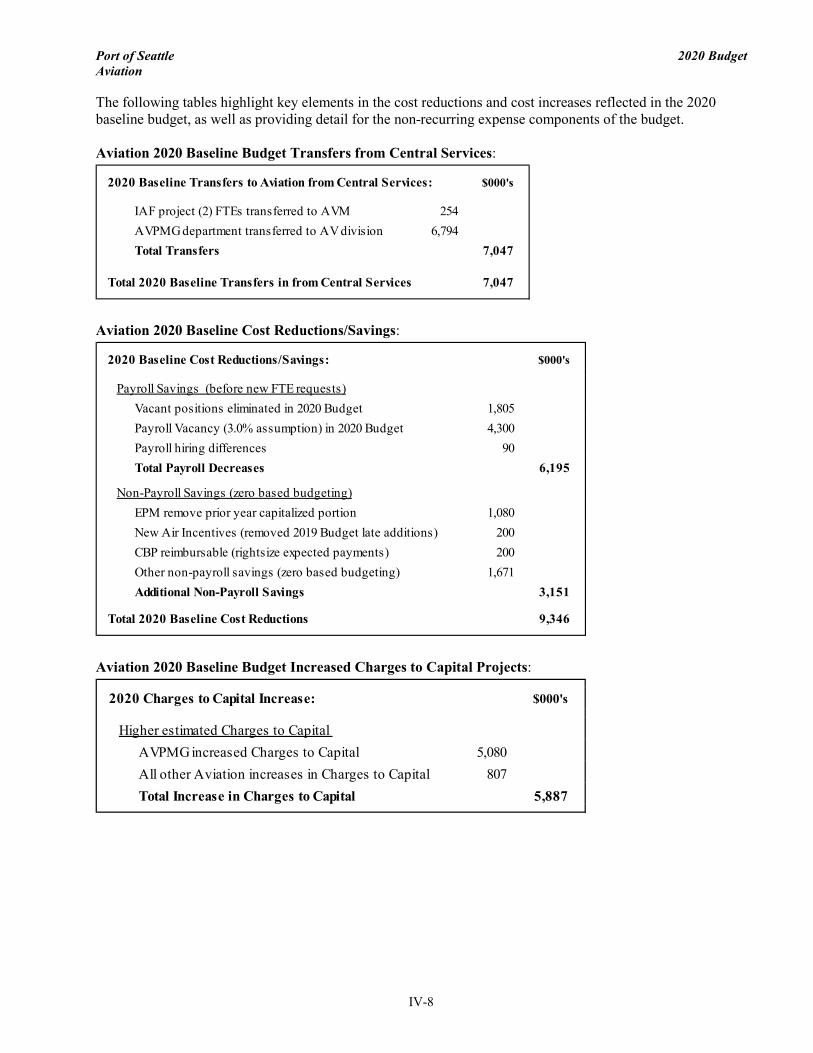
The following tables highlight key elements in the cost reductions and cost increases reflected in the 2020 baseline budget, as well as providing detail for the non-recurring expense components of the budget. Aviation 2020 Baseline Budget Transfers from Central Services:
Aviation 2020 Baseline Cost Reductions/Savings:
Aviation 2020 Baseline Budget Increased Charges to Capital Projects:
2020 Baseline Transfers to Aviation from Central Services: $000's
IAF project (2) FTEs transferred to AVM 254 AVPMG department transferred to AV division 6,794 Total Transfers 7,047
Total 2020 Baseline Transfers in from Central Services 7,047
2020 Baseline Cost Reductions/Savings: $000's
Payroll Savings (before new FTE requests)Vacant positions eliminated in 2020 Budget 1,805 Payroll Vacancy (3.0% assumption) in 2020 Budget 4,300 Payroll hiring differences 90 Total Payroll Decreases 6,195
Non-Payroll Savings (zero based budgeting)EPM remove prior year capitalized portion 1,080 New Air Incentives (removed 2019 Budget late additions) 200 CBP reimbursable (rightsize expected payments) 200 Other non-payroll savings (zero based budgeting) 1,671 Additional Non-Payroll Savings 3,151
Total 2020 Baseline Cost Reductions 9,346
2020 Charges to Capital Increase: $000's
Higher estimated Charges to Capital AVPMG increased Charges to Capital 5,080 All other Aviation increases in Charges to Capital 807 Total Increase in Charges to Capital 5,887

Port of Seattle 2020 Budget Aviation
IV-9
Aviation 2020 Baseline Budget Cost Increases:
2020 Baseline Cost Increases: $000's
Payroll Increases (before new FTE requests)Non-Represented payroll & benefits increase (3.9% average) 1,740 Represented pay & benefits increase (per labor agreements) 4,943 Annualized new FTE's approved in 2019 Budget 2,418 Annualized new FTE's approved during 2019 2,838 Job evaluation outcomes 692 Total Baseline Payroll Increases 12,632
Non-Aero costs related to revenue growth Clubs & Lounges - higher demand/increased volume 1,174 Advertising increase (100% paid by Tenant Mktg fund) 290 Non-Aero Credit Card fee increase 44 Non-Aero B&O tax increase 150 Total Non-Aero Cost Increases due to growth 1,657
Contractual & Formulaic Non-Payroll Cost IncreasesAVPMG Outside Svc (right-sized for 2020 expense projects) 3,239 Taxi curbside management contract (full year estimate) 739 AVM - Janitorial contract increase 807 AVM - Baggage System data reporting (BROCK) contract 140 All other AV Maintenance contracts 83 Lost & Found ( new contract in 2019) 404 Aeronautical B&O tax increase 53 Other Non-Payroll Increases (zero based budgeting) 672 Total Contractual & Formulaic Increases 6,137
Total 2020 Baseline Cost Increases 20,426
Port of Seattle 2020 Budget Aviation
IV-10
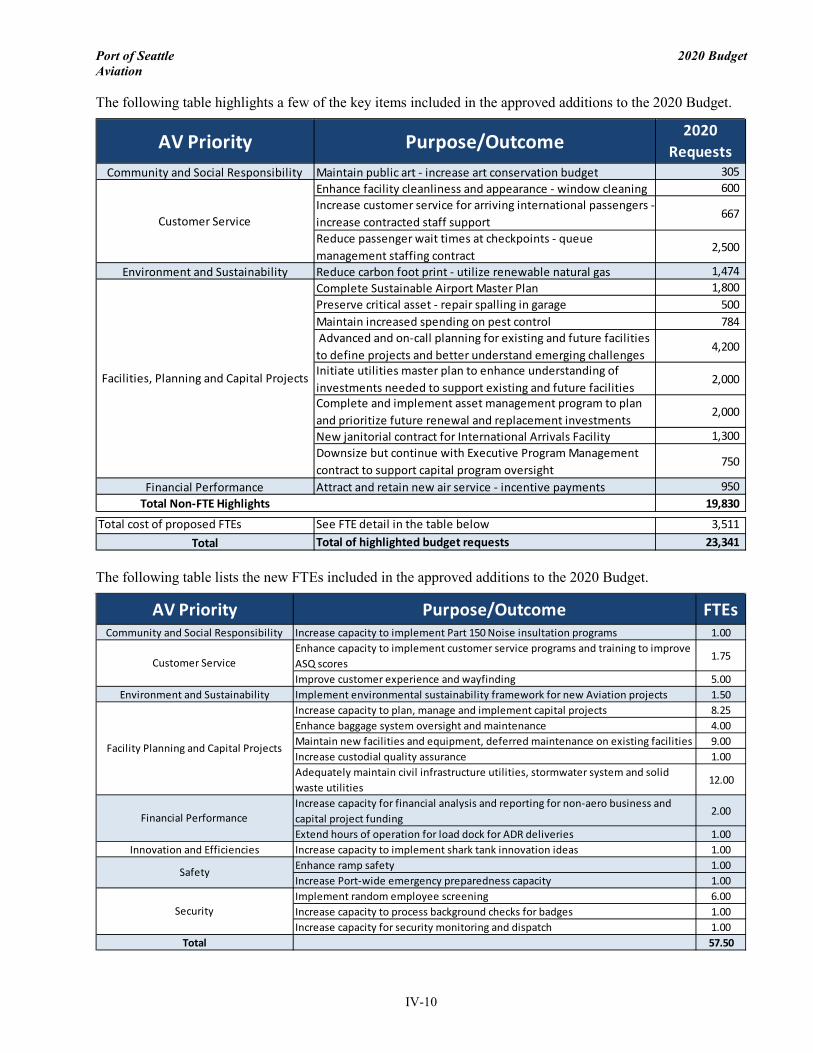
The following table highlights a few of the key items included in the approved additions to the 2020 Budget.
The following table lists the new FTEs included in the approved additions to the 2020 Budget.
Community and Social Responsibility Maintain public art - increase art conservation budget 305 Enhance facility cleanliness and appearance - window cleaning 600 Increase customer service for arriving international passengers - increase contracted staff support
667
Reduce passenger wait times at checkpoints - queue management staffing contract
2,500
Environment and Sustainability Reduce carbon foot print - utilize renewable natural gas 1,474 Complete Sustainable Airport Master Plan 1,800 Preserve critical asset - repair spalling in garage 500 Maintain increased spending on pest control 784 Advanced and on-call planning for existing and future facilities to define projects and better understand emerging challenges
4,200
Initiate utilities master plan to enhance understanding of investments needed to support existing and future facilities
2,000
Complete and implement asset management program to plan and prioritize future renewal and replacement investments
2,000
New janitorial contract for International Arrivals Facility 1,300 Downsize but continue with Executive Program Management contract to support capital program oversight
750
Financial Performance Attract and retain new air service - incentive payments 950 Total Non-FTE Highlights 19,830
Total cost of proposed FTEs See FTE detail in the table below 3,511 Total Total of highlighted budget requests 23,341
AV Priority Purpose/Outcome 2020 Requests
Customer Service
Facilities, Planning and Capital Projects
Community and Social Responsibility Increase capacity to implement Part 150 Noise insultation programs 1.00Enhance capacity to implement customer service programs and training to improve ASQ scores
1.75
Improve customer experience and wayfinding 5.00Environment and Sustainability Implement environmental sustainability framework for new Aviation projects 1.50
Increase capacity to plan, manage and implement capital projects 8.25Enhance baggage system oversight and maintenance 4.00Maintain new facilities and equipment, deferred maintenance on existing facilities 9.00Increase custodial quality assurance 1.00Adequately maintain civil infrastructure utilities, stormwater system and solid waste utilities
12.00
Increase capacity for financial analysis and reporting for non-aero business and capital project funding
2.00
Extend hours of operation for load dock for ADR deliveries 1.00Innovation and Efficiencies Increase capacity to implement shark tank innovation ideas 1.00
Enhance ramp safety 1.00Increase Port-wide emergency preparedness capacity 1.00Implement random employee screening 6.00Increase capacity to process background checks for badges 1.00Increase capacity for security monitoring and dispatch 1.00
Total 57.50
Safety
Security
AV Priority Purpose/Outcome FTEs
Customer Service
Facility Planning and Capital Projects
Financial Performance
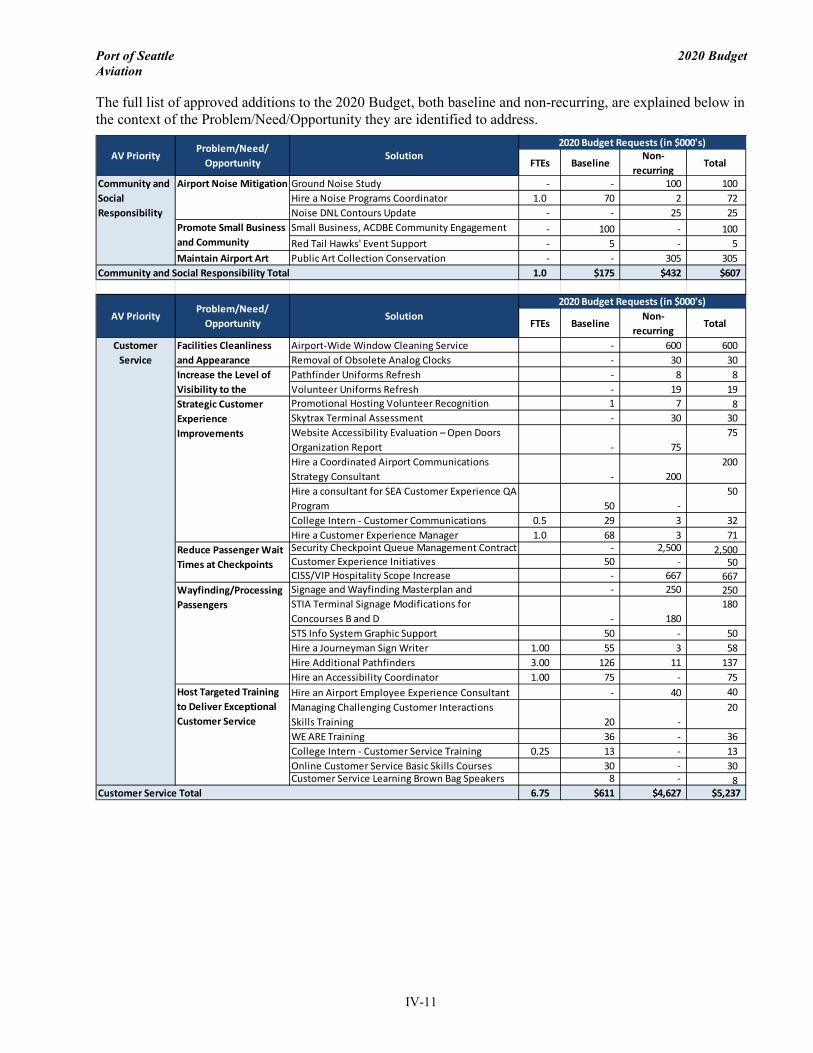
Port of Seattle 2020 Budget Aviation
IV-11
The full list of approved additions to the 2020 Budget, both baseline and non-recurring, are explained below in the context of the Problem/Need/Opportunity they are identified to address.
FTEs BaselineNon-
recurringTotal
Ground Noise Study - - 100 100Hire a Noise Programs Coordinator 1.0 70 2 72Noise DNL Contours Update - - 25 25Small Business, ACDBE Community Engagement - 100 - 100Red Tail Hawks' Event Support - 5 - 5
Maintain Airport Art Public Art Collection Conservation - - 305 3051.0 $175 $432 $607
FTEs BaselineNon-
recurringTotal
Airport-Wide Window Cleaning Service - 600 600Removal of Obsolete Analog Clocks - 30 30Pathfinder Uniforms Refresh - 8 8Volunteer Uniforms Refresh - 19 19Promotional Hosting Volunteer Recognition 1 7 8Skytrax Terminal Assessment - 30 30Website Accessibility Evaluation – Open Doors Organization Report - 75
75
Hire a Coordinated Airport Communications Strategy Consultant - 200
200
Hire a consultant for SEA Customer Experience QA Program 50 -
50
College Intern - Customer Communications 0.5 29 3 32Hire a Customer Experience Manager 1.0 68 3 71Security Checkpoint Queue Management Contract - 2,500 2,500Customer Experience Initiatives 50 - 50CISS/VIP Hospitality Scope Increase - 667 667Signage and Wayfinding Masterplan and - 250 250STIA Terminal Signage Modifications for Concourses B and D - 180
180
STS Info System Graphic Support 50 - 50Hire a Journeyman Sign Writer 1.00 55 3 58Hire Additional Pathfinders 3.00 126 11 137Hire an Accessibility Coordinator 1.00 75 - 75Hire an Airport Employee Experience Consultant - 40 40Managing Challenging Customer Interactions Skills Training 20 -
20
WE ARE Training 36 - 36College Intern - Customer Service Training 0.25 13 - 13Online Customer Service Basic Skills Courses 30 - 30Customer Service Learning Brown Bag Speakers 8 - 8
6.75 $611 $4,627 $5,237
Wayfinding/Processing Passengers
Host Targeted Training to Deliver Exceptional Customer Service
Customer Service Total
Community and Social Responsibility Total
AV PriorityProblem/Need/
OpportunitySolution
2020 Budget Requests (in $000's)
Customer Service
Facilities Cleanliness and AppearanceIncrease the Level of Visibility to the Strategic Customer Experience Improvements
Reduce Passenger Wait Times at Checkpoints
AV PriorityProblem/Need/
OpportunitySolution
2020 Budget Requests (in $000's)
Community and Social Responsibility
Airport Noise Mitigation
Promote Small Business and Community
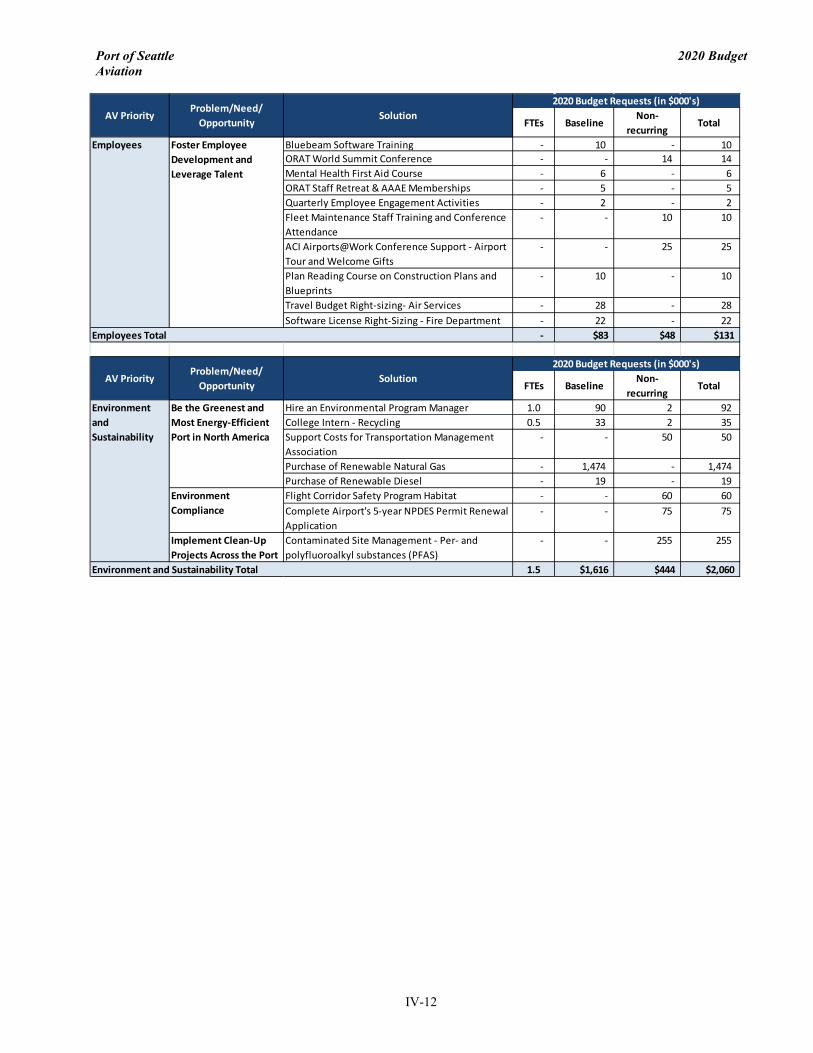
Port of Seattle 2020 Budget Aviation
IV-12
FTEs BaselineNon-
recurringTotal
Bluebeam Software Training - 10 - 10ORAT World Summit Conference - - 14 14Mental Health First Aid Course - 6 - 6ORAT Staff Retreat & AAAE Memberships - 5 - 5Quarterly Employee Engagement Activities - 2 - 2Fleet Maintenance Staff Training and Conference Attendance
- - 10 10
ACI Airports@Work Conference Support - Airport Tour and Welcome Gifts
- - 25 25
Plan Reading Course on Construction Plans and Blueprints
- 10 - 10
Travel Budget Right-sizing- Air Services - 28 - 28Software License Right-Sizing - Fire Department - 22 - 22
- $83 $48 $131
FTEs BaselineNon-
recurringTotal
Hire an Environmental Program Manager 1.0 90 2 92College Intern - Recycling 0.5 33 2 35Support Costs for Transportation Management Association
- - 50 50
Purchase of Renewable Natural Gas - 1,474 - 1,474Purchase of Renewable Diesel - 19 - 19Flight Corridor Safety Program Habitat - - 60 60Complete Airport's 5-year NPDES Permit Renewal Application
- - 75 75
Implement Clean-Up Projects Across the Port
Contaminated Site Management - Per- and polyfluoroalkyl substances (PFAS)
- - 255 255
1.5 $1,616 $444 $2,060
Environment and Sustainability
Be the Greenest and Most Energy-Efficient Port in North America
Environment Compliance
Environment and Sustainability Total
2020 Budget Requests (in $000's)
Employees Foster Employee Development and Leverage Talent
Employees Total
AV PriorityProblem/Need/
OpportunitySolution
2020 Budget Requests (in $000's)
AV PriorityProblem/Need/
OpportunitySolution
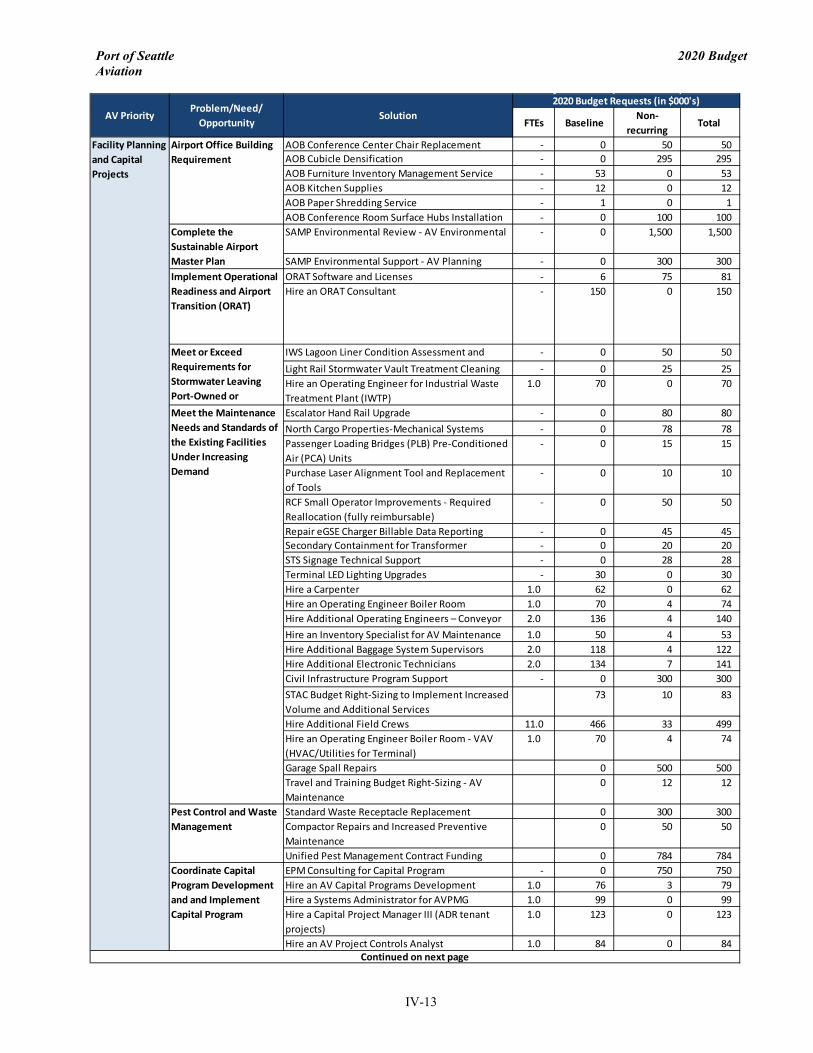
Port of Seattle 2020 Budget Aviation
IV-13
FTEs BaselineNon-
recurringTotal
AOB Conference Center Chair Replacement - 0 50 50AOB Cubicle Densification - 0 295 295AOB Furniture Inventory Management Service - 53 0 53AOB Kitchen Supplies - 12 0 12AOB Paper Shredding Service - 1 0 1AOB Conference Room Surface Hubs Installation - 0 100 100SAMP Environmental Review - AV Environmental - 0 1,500 1,500
SAMP Environmental Support - AV Planning - 0 300 300ORAT Software and Licenses - 6 75 81Hire an ORAT Consultant - 150 0 150
IWS Lagoon Liner Condition Assessment and - 0 50 50Light Rail Stormwater Vault Treatment Cleaning - 0 25 25Hire an Operating Engineer for Industrial Waste Treatment Plant (IWTP)
1.0 70 0 70
Escalator Hand Rail Upgrade - 0 80 80North Cargo Properties-Mechanical Systems - 0 78 78Passenger Loading Bridges (PLB) Pre-Conditioned Air (PCA) Units
- 0 15 15
Purchase Laser Alignment Tool and Replacement of Tools
- 0 10 10
RCF Small Operator Improvements - Required Reallocation (fully reimbursable)
- 0 50 50
Repair eGSE Charger Billable Data Reporting - 0 45 45Secondary Containment for Transformer - 0 20 20STS Signage Technical Support - 0 28 28Terminal LED Lighting Upgrades - 30 0 30Hire a Carpenter 1.0 62 0 62Hire an Operating Engineer Boiler Room 1.0 70 4 74Hire Additional Operating Engineers – Conveyor 2.0 136 4 140Hire an Inventory Specialist for AV Maintenance 1.0 50 4 53Hire Additional Baggage System Supervisors 2.0 118 4 122Hire Additional Electronic Technicians 2.0 134 7 141Civil Infrastructure Program Support - 0 300 300STAC Budget Right-Sizing to Implement Increased Volume and Additional Services
73 10 83
Hire Additional Field Crews 11.0 466 33 499Hire an Operating Engineer Boiler Room - VAV (HVAC/Utilities for Terminal)
1.0 70 4 74
Garage Spall Repairs 0 500 500Travel and Training Budget Right-Sizing - AV Maintenance
0 12 12
Standard Waste Receptacle Replacement 0 300 300Compactor Repairs and Increased Preventive Maintenance
0 50 50
Unified Pest Management Contract Funding 0 784 784EPM Consulting for Capital Program - 0 750 750Hire an AV Capital Programs Development 1.0 76 3 79Hire a Systems Administrator for AVPMG 1.0 99 0 99Hire a Capital Project Manager III (ADR tenant projects)
1.0 123 0 123
Hire an AV Project Controls Analyst 1.0 84 0 84
Facility Planning and Capital Projects
Continued on next page
Pest Control and Waste Management
Coordinate Capital Program Development and and Implement Capital Program
Meet the Maintenance Needs and Standards of the Existing Facilities Under Increasing Demand
2020 Budget Requests (in $000's)
Airport Office Building Requirement
Complete the Sustainable Airport Master PlanImplement Operational Readiness and Airport Transition (ORAT)
Meet or Exceed Requirements for Stormwater Leaving Port-Owned or
AV PriorityProblem/Need/
OpportunitySolution

Port of Seattle 2020 Budget Aviation
IV-14
FTEs BaselineNon-
recurringTotal
Facility Planning Airfield/Airspace Study - 0 250 250Building Dept - Consultant Design Review & Field Inspection Services
- 0 220 220
Controls service for new systems installed for Baggage Optimization
- 0 50 50
Deep Well Injection Geotechnical Study - 0 300 300IAF Simulation Support - 0 99 99Utilities Master Planning - 0 2,000 2,000Hire an Associate Planner 1.0 67 3 71Hire a Fire Protection Engineer 1.0 75 3 78On Call Capital Programs Planning - SSAT, Roadmaps and Business Case Development
- 0 700 700
Advanced Planning on Facilities, The Main Terminal Optimization Plan (MTOP), Sustainable Airport Master Plan(SAMP) and Ground Transportation Access Plan (GTAP)
- 0 2,300 2,300
Landscape Master Plan Rehab Projects - 0 291 291On-call Planning on Emerging Issues - 0 950 950Hire a Custodial Quality Assurance Specialist 1.0 58 4 62Pressure Washing of Lower and Upper Drives Concrete Structures
- 50 0 50
Zone 5 (IAF) Custodial Service Contract - 1,300 0 1,300Hire a Painter (IAF) 1.0 49 0 49Hire a Painter (Cargo) 1.0 49 0 49Hire a Carpenter(Cargo) 1.0 62 0 62Hire an Operating Engineer Boiler Room - Cargo 1.0 70 4 74Connectivity/Software Licenses for CBP in IAF - 220 0 220Cargo Facility Maintenance (Outside Svcs) - 0 250 250Infrastructure Nomenclature System Implications - 0 20 20Landside Pavement Management Program - 0 100 100Neighborhood Field Office Training Room - 0 50 50STS Tunnel Integrity Study - 0 125 125College Intern - Architecture 0.25 14 3 17Hire an Architect - Facilities and Infrastructure 1.0 73 4 77Asset Management Program Implementation - 0 2,000 2,000Continuous Commissioning for Testing and Balancing services
- 100 0 100
Asset Management System for Fire Department - 27 0 2734.25 $4,097 $15,216 $19,313
FTEs BaselineNon-
recurringTotal
ADR - Kiosk Program Upkeep and Repair - 0 150 150SEA Visitor Pass Program E Secure Fee - 0 40 40Hire a Temporary Staffing for Pre-Book Parking - 0 225 225Hire a Financial Analyst II - Grants and Capital 1.0 70 2 72Hire a Sr. Financial Systems & Business Analyst - Financial Report Efficiency
1.0 82 2 84
Hire a Load Dock Coordinator - Volume Increase and Extended Hours
1.0 45 0 45
Hire a Consultant to Develop Business Case for New Non-Aero Revenue (Tenant Broadband
- 0 75 75
Hire a Consultant to Implement Driver Outreach Added Taxi Pilot Program
- 0 86 86
Air Service Development New Air Service Incentive Program - Joint Promotional Funds
- 0 950 950
3.0 $197 $1,530 $1,727
2020 Budget Requests (in $000's)Continued from prior page
AV Priority
Financial Performance Total
Facility Planning and Capital Projects Total
AV PriorityProblem/Need/
OpportunitySolution
2020 Budget Requests (in $000's)
Financial Performance
Keep Airline Costs Competitive Through Increase Non-Aeronautical Revenue and Improve Capital Business Process
Enhance Facility Cleanliness
Maintain New Facilities
Strategic Asset Management
Planning for Future Facilities Needs
Problem/Need/ Opportunity
Solution

Port of Seattle 2020 Budget Aviation
IV-15
FTEs BaselineNon-
recurringTotal
Critical Asset Monitoring (CAM) IoT Pilot Project - 0 199 199 Equipment - 50 0 50Crowdsourced Innovation Software - 50 0 50Innovation Consulting Funding - 0 100 100Hire an Innovation Program Manager 1.0 86 4 89Hire a Consultant for STIA Key Access System Evaluation
- 0 50 50
1.0 $186 $353 $538
FTEs BaselineNon-
recurringTotal
GSE Inspection Auditing Services - 50 0 50Certified Service Provide Program(CSPP) Implementation Consultation Services
- 0 50 50
Hire a Certified Service Provide Program(CSPP) Manager
1.0 77 3 80
Ramp Tower Contract Staffing Increase for Air Traffic Demand
- 220 0 220
Fire Department - Bunker Gear Replacement - 0 45 45Completion of Tow/Taxi Virtual Reality for E-Learning Development
- 0 75 75
Targeted Safety Subject Matter Expertise Training - 0 50 50Safety Act Certification - 0 100 100Horizon Air - Follow Up Items After Action Report - 0 25 25Firearm Tracking Software - 3 0 3Origami Software Licensing and Integration Plug-Ins
- 10 5 15
Smoke Control Systems Testing - 190 0 190Public Access AEDs Replacement - 0 35 35
Reduce Wildlife Strikes Increase for Consolidated Wildlife Contracts - 0 100 100Hire an Emergency Preparedness Coordinator 1.0 64 3 66FAA Regulatory Triennial Exercise - 0 135 135
2.0 $613 $626 $1,239
FTEs BaselineNon-
recurringTotal
Airport Security Awareness Training - 25 0 25Employee Screening Equipment Maintenance - 51 0 51Hire a Sr. Operations Controller for Airport Communications Center
1.0 49 3 53
Hire a Consultant to Evaluate Physical Security of Airport Substations
- 0 53 53
Hire a Background Checking Specialist - Increased Volume and Requests
1.0 51 4 55
Hire Additional Employee Screeners - Implement Random Unpredictable Screening
6.0 224 0 224
8.0 $400 $60 $460
2020 Budget Requests - Total Proposed 57.5 $7,979 $23,335 $31,313
Security Total
Safety Total
AV PriorityProblem/Need/
OpportunitySolution
2020 Budget Requests (in $000's)
Security Enhance Overall Security at the Airport by Staffing Increase, Training and Equipment Maintenance
Innovation and Efficiencies Total
AV PriorityProblem/Need/
OpportunitySolution
2020 Budget Requests (in $000's)
Safety Continuously Improve Safety of Airport Operations Area
Facility Life-Safety Enhancements
Prepare for Emergencies
AV PriorityProblem/Need/
OpportunitySolution
2020 Budget Requests (in $000's)
Innovation and Efficiencies
Keep Up the Pace with the Rapid Growth of the Leverage Employee Innovation to Solve Business Challenges

Port of Seattle 2020 Budget Aviation
IV-16
Aeronautical Business
Aeronautical Cost Drivers – Rate Base Only
(1) O&M, Debt Service Gross, and Amortization do not include commercial area costs or the international incentive expenses Aero Highlights (Change compared to 2019 Budget):
• Operating Expenses increased by $5.8M – significant year-over-year increases include: o Aero direct O&M increase of $1.8M (of which a majority of the increases are driven by new non-
recurring costs): Payroll increase of $4.8M – includes both payroll increases within existing positions as well as
new airport FTE’s added in the 2020 budget. Outside Services Contract increases of $4.9M – Advanced Planning for major projects, On-Call
Planning, Queue Management Support for Security Checkpoints, International Support Services, Customer Service Support and other related initiatives, and Pest Management.
Other Expense increases of $3.7M – includes Promotional Incentives for new airlines, Renewable Natural Gas, and other general expenses.
ERL $11.6M decrease – Contaminated Soils & Asbestos – NSAT & IAF. o Other Division Allocations increase of $4.0M, including:
2017 2018 2019 2019 2020 Budget Change Budget vs Forecast$ in 000's Actual Actual Budget Forecast Budget $ % $ %Revenues:Airfield Movement Area 108,638 116,703 130,873 129,230 132,233 1,360 1.0% 3,003 2.3%Airfield Apron Area 16,771 15,627 19,714 12,295 22,017 2,303 11.7% 9,723 79.1%Terminal Rents 155,431 169,318 203,319 211,805 213,048 9,729 4.8% 1,243 0.6%Federal Inspection Services (FIS) 18,612 16,226 14,521 14,297 18,167 3,647 25.1% 3,870 27.1%Total Rate Base Revenues 299,452 317,874 368,426 367,627 385,466 17,039 4.6% 17,838 4.9%
Airfield Commercial Area 10,574 10,257 12,859 13,116 16,097 3,238 25.2% 2,981 22.7%Subtotal before Revenue Sharing 310,026 328,131 381,286 380,743 401,563 20,277 5.3% 20,819 5.5%
Revenue Sharing (42,311) (36,863) (15,682) (16,637) - (15,682) -100.0% (16,637) -100.0%Other Prior Year Revenues (26) - - - - - NA - NATotal Aeronautical Revenues 267,690 291,268 365,604 364,106 401,563 35,959 9.8% 37,456 10.3%
Total Aeronautical Expenses 195,414 211,101 243,102 241,821 249,030 5,929 2.4% 7,210 3.0%
Net Operating Income 72,276 80,167 122,502 122,286 152,532 30,030 24.5% 30,247 24.7%
Debt Service (86,564) (91,673) (109,343) (113,820) (121,410) 12,066 11.0% 7,590 6.7%Net Cash Flow (14,288) (11,506) 13,159 8,466 31,123 17,964 136.5% 22,657 267.6%
2018 2019 2019 2020
$ in 000's Actual Budget Forecast Budget $ % $ %O&M (1) 206,076 237,387 235,076 243,203 5,816 2.5% 8,128 3.5%Debt Service Gross 115,419 136,513 137,696 174,455 37,942 27.8% 36,759 26.7%Debt Service PFC Offset (32,987) (33,045) (33,060) (62,998) (29,953) 90.6% (29,938) 90.6% Net Debt Service 82,432 103,468 104,636 111,457 7,989 7.7% 6,821 6.5%Amortization 32,371 30,121 30,583 32,326 2,206 7.3% 1,743 5.7%Space Vacancy (2,132) (1,521) (1,609) (493) 1,029 -67.6% 1,116 -69.4%TSA Operating Grant and Other (873) (1,028) (1,059) (1,028) 0 0.0% 30 -2.9%Rate Base Revenues 317,874 368,426 367,627 385,466 17,039 4.6% 17,838 4.9%Commercial area 10,257 12,859 13,116 16,097 3,238 25.2% 2,981 22.7%Total Aero Revenues 328,131 381,286 380,743 401,563 20,277 5.3% 20,819 5.5%
Impact on Aero Revenues
Budget Change
Impact on Aero Revenues
Budget vs Forecast

Port of Seattle 2020 Budget Aviation
IV-17
Central Services Increase of $3.7M. Other Divisions Increase of $397K.
• Debt Service up $8.0M: o Debt Service increase primarily due to - Perimeter Intrusion Detect System $946K, Surface Area
Management System $740K, SD Pond Bird Deterrent Improvement $322K, Remote Aircraft Deicing $686K, Hardstand Equipment Purchase 2019 $375K, Checked Bag Recap/Optimization $147K, Additional Baggage Makeup Space IAF $1.3M, and Safedock Upgrade & Expansion $1.5M.
• Amortization (use of Airport Development Funds [ADF]) up $2.2M: o Amortization increase due to – Debt Service exclusions $793K, new assets added to Concourse C
Roof CR-1, 2 & 3 $149K; STIA Telecom Conc B $66K, CUSS Ticket Counters $56K and others $172K; 2018 Public Expenses for Vandelande Screening Lanes $366K and IAF FAA Fiber Optic Cable Replacement in 2018 $240k; and others $364k.
• Space vacancy - $1.0M increase due to a decrease in unrecovered vacant space (down from 12k sq. ft. to 3k sq. ft.) cost in the Public Accessible offices and VIP lounges.
Non-Aeronautical Business
Non-Aero Highlights (Change compared to 2019 Budget):
• Operating Revenue increased by $23.6M – 2020 Budget anticipates growth across all major non-airline units due to growing passenger volume and improving economy.
• Operating Expenses up $5.6M – significant year-over-year increases include: o Payroll increase includes non-aero share of 53 new airport FTE’s added in the 2020 budget. o Costs related to non-aero revenue growth such as increased utilization of Port-owned airport lounges
and the implementation of new parking pre-booking pilot program in late-2019. o Non-Aero share of: Customer Service initiatives such as seasonal customer service staff to facilitate efficient
passenger flow through increasingly congested passenger terminals. Environment & Sustainability initiatives such as utilizing renewable natural gas to reduce the
carbon footprint from employee parking and rental car busing operations. Continuation of SAMP-related planning & environmental review costs. Increased charges from Central Services and other divisions
2017 2018 2018 2019 2019 2020 Budget Change$ in 000's Actual Budget Actual Budget Forecast Budget $ %
Non-Aero RevenuesPublic Parking 75,106 78,572 80,212 82,350 84,072 89,485 7,135 8.7%Airport Dining & Retail 54,611 54,759 59,021 59,484 59,962 66,145 6,661 11.2%Rental Cars 45,691 50,857 53,569 50,079 51,703 51,149 1,071 2.1%Ground Transportation 15,684 16,884 18,772 19,734 20,706 22,299 2,565 13.0%Commercial Properties 18,042 14,706 15,434 14,219 15,471 16,660 2,441 17.2%Port Common Use Lounges 5,041 5,630 6,802 8,520 10,329 10,536 2,015 23.7%Other Non-Aero Revenue 22,627 23,378 23,896 25,150 26,188 26,894 1,744 6.9%Total Non-Aero Revenues 236,803 244,786 257,707 259,537 268,431 283,168 23,632 9.1%
Total Non-Aero Expenses 103,702 117,925 107,748 123,003 121,283 128,665 5,662 4.6%
Net Operating Income 133,101 126,861 149,959 136,534 147,148 154,503 17,970 13.2%Less: CFC Surplus (2,750) (7,142) (6,157) (3,993) (4,769) (4,128) 135 3.4%Adjusted Non-Aero NOI 130,351 119,719 143,802 132,540 142,379 150,375 17,835 13.5%
Debt Service (44,495) (45,752) (44,545) (49,352) (49,093) (50,064) 712 1.4%Net Cash Flow 85,856 73,967 99,257 83,188 93,287 100,311 17,123 20.6%
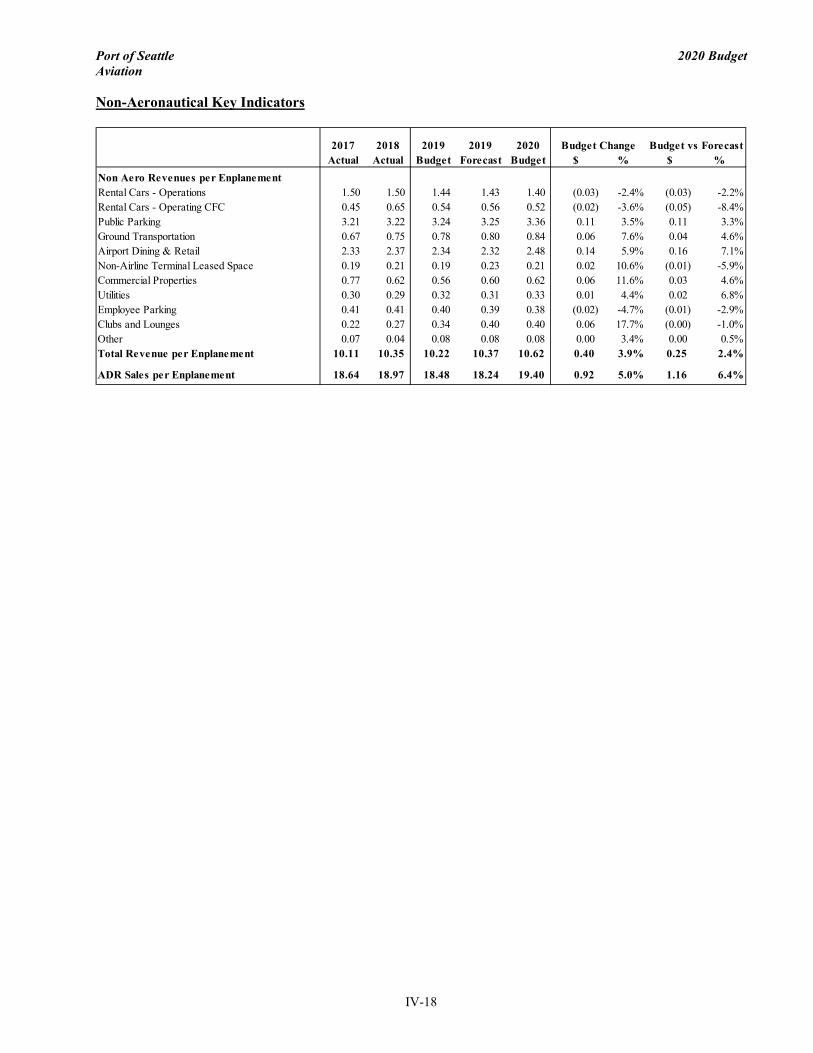
Port of Seattle 2020 Budget Aviation
IV-18
Non-Aeronautical Key Indicators
2017 2018 2019 2019 2020Actual Actual Budget Forecast Budget $ % $ %
Non Aero Revenues per EnplanementRental Cars - Operations 1.50 1.50 1.44 1.43 1.40 (0.03) -2.4% (0.03) -2.2%Rental Cars - Operating CFC 0.45 0.65 0.54 0.56 0.52 (0.02) -3.6% (0.05) -8.4%Public Parking 3.21 3.22 3.24 3.25 3.36 0.11 3.5% 0.11 3.3%Ground Transportation 0.67 0.75 0.78 0.80 0.84 0.06 7.6% 0.04 4.6%Airport Dining & Retail 2.33 2.37 2.34 2.32 2.48 0.14 5.9% 0.16 7.1%Non-Airline Terminal Leased Space 0.19 0.21 0.19 0.23 0.21 0.02 10.6% (0.01) -5.9%Commercial Properties 0.77 0.62 0.56 0.60 0.62 0.06 11.6% 0.03 4.6%Utilities 0.30 0.29 0.32 0.31 0.33 0.01 4.4% 0.02 6.8%Employee Parking 0.41 0.41 0.40 0.39 0.38 (0.02) -4.7% (0.01) -2.9%Clubs and Lounges 0.22 0.27 0.34 0.40 0.40 0.06 17.7% (0.00) -1.0%Other 0.07 0.04 0.08 0.08 0.08 0.00 3.4% 0.00 0.5%Total Revenue per Enplanement 10.11 10.35 10.22 10.37 10.62 0.40 3.9% 0.25 2.4%
ADR Sales per Enplanement 18.64 18.97 18.48 18.24 19.40 0.92 5.0% 1.16 6.4%
Budget Change Budget vs Forecast
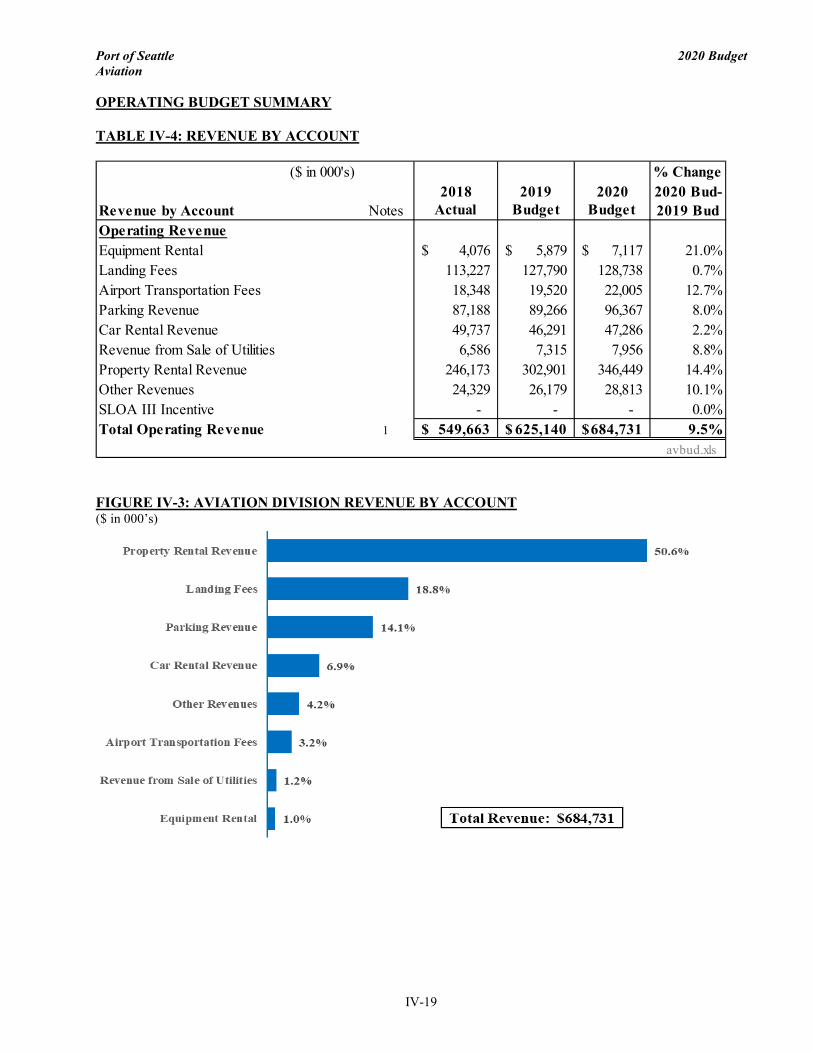
Port of Seattle 2020 Budget Aviation
IV-19
OPERATING BUDGET SUMMARY TABLE IV-4: REVENUE BY ACCOUNT
FIGURE IV-3: AVIATION DIVISION REVENUE BY ACCOUNT ($ in 000’s)
($ in 000's) % Change2018 2019 2020 2020 Bud-
Revenue by Account Notes Actual Budget Budget 2019 BudOperating RevenueEquipment Rental 4,076$ 5,879$ 7,117$ 21.0%Landing Fees 113,227 127,790 128,738 0.7%Airport Transportation Fees 18,348 19,520 22,005 12.7%Parking Revenue 87,188 89,266 96,367 8.0%Car Rental Revenue 49,737 46,291 47,286 2.2%Revenue from Sale of Utilities 6,586 7,315 7,956 8.8%Property Rental Revenue 246,173 302,901 346,449 14.4%Other Revenues 24,329 26,179 28,813 10.1%SLOA III Incentive - - - 0.0%Total Operating Revenue 1 549,663$ 625,140$ 684,731$ 9.5%
avbud.xls
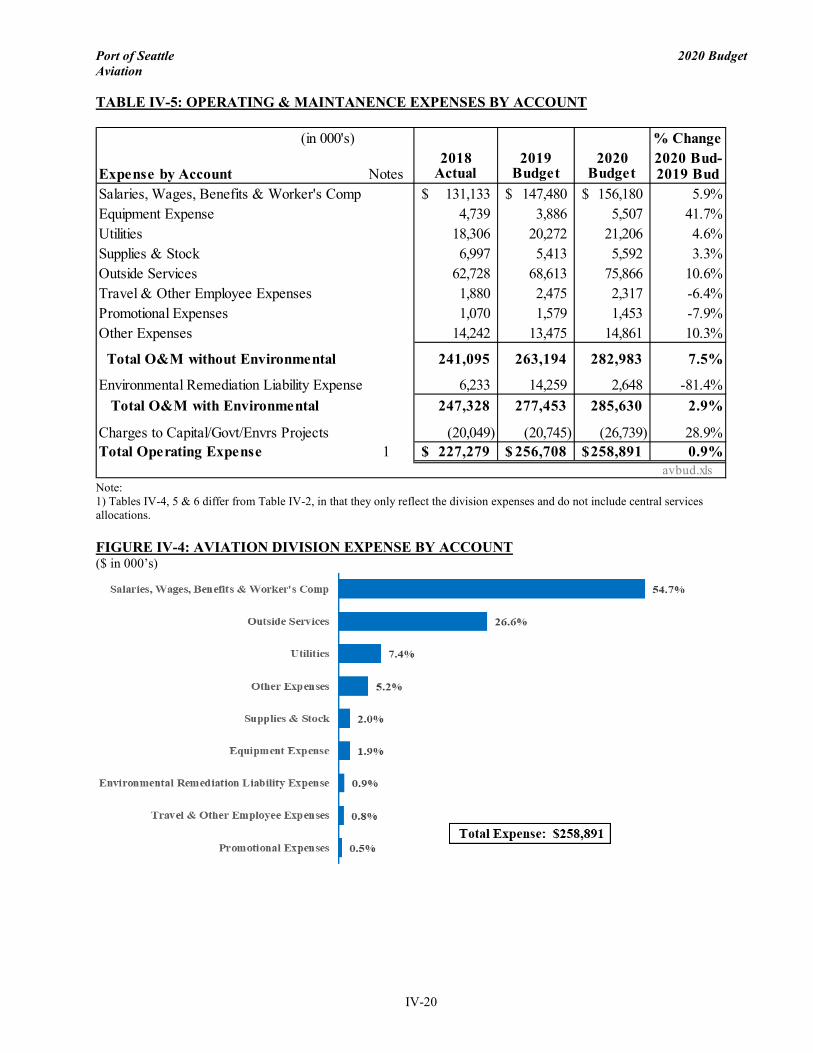
Port of Seattle 2020 Budget Aviation
IV-20
TABLE IV-5: OPERATING & MAINTANENCE EXPENSES BY ACCOUNT
Note: 1) Tables IV-4, 5 & 6 differ from Table IV-2, in that they only reflect the division expenses and do not include central services allocations. FIGURE IV-4: AVIATION DIVISION EXPENSE BY ACCOUNT ($ in 000’s)
(in 000's) % Change2018 2019 2020 2020 Bud-
Expense by Account Notes Actual Budget Budget 2019 BudSalaries, Wages, Benefits & Worker's Comp 131,133$ 147,480$ 156,180$ 5.9%Equipment Expense 4,739 3,886 5,507 41.7%Utilities 18,306 20,272 21,206 4.6%Supplies & Stock 6,997 5,413 5,592 3.3%Outside Services 62,728 68,613 75,866 10.6%Travel & Other Employee Expenses 1,880 2,475 2,317 -6.4%Promotional Expenses 1,070 1,579 1,453 -7.9%Other Expenses 14,242 13,475 14,861 10.3%
Total O&M without Environmental 241,095 263,194 282,983 7.5%
Environmental Remediation Liability Expense 6,233 14,259 2,648 -81.4% Total O&M with Environmental 247,328 277,453 285,630 2.9%
Charges to Capital/Govt/Envrs Projects (20,049) (20,745) (26,739) 28.9%Total Operating Expense 1 227,279$ 256,708$ 258,891$ 0.9%
avbud.xls
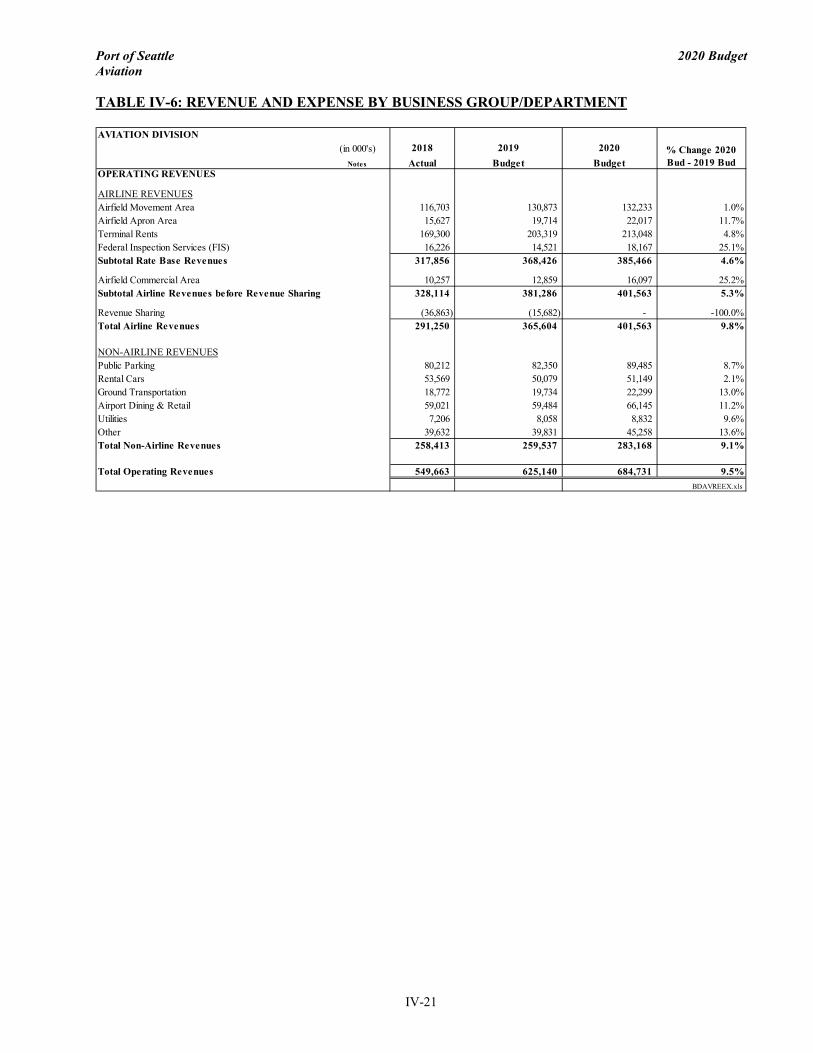
Port of Seattle 2020 Budget Aviation
IV-21
TABLE IV-6: REVENUE AND EXPENSE BY BUSINESS GROUP/DEPARTMENT
(in 000's) 2018 2019 2020Notes Actual Budget Budget
OPERATING REVENUES
AIRLINE REVENUESAirfield Movement Area 116,703 130,873 132,233 1.0%Airfield Apron Area 15,627 19,714 22,017 11.7%Terminal Rents 169,300 203,319 213,048 4.8%Federal Inspection Services (FIS) 16,226 14,521 18,167 25.1%Subtotal Rate Base Revenues 317,856 368,426 385,466 4.6%
Airfield Commercial Area 10,257 12,859 16,097 25.2%Subtotal Airline Revenues before Revenue Sharing 328,114 381,286 401,563 5.3%
Revenue Sharing (36,863) (15,682) - -100.0%Total Airline Revenues 291,250 365,604 401,563 9.8%
NON-AIRLINE REVENUESPublic Parking 80,212 82,350 89,485 8.7%Rental Cars 53,569 50,079 51,149 2.1%Ground Transportation 18,772 19,734 22,299 13.0%Airport Dining & Retail 59,021 59,484 66,145 11.2%Utilities 7,206 8,058 8,832 9.6%Other 39,632 39,831 45,258 13.6%Total Non-Airline Revenues 258,413 259,537 283,168 9.1%
Total Operating Revenues 549,663 625,140 684,731 9.5%BDAVREEX.xls
AVIATION DIVISION% Change 2020 Bud - 2019 Bud

Port of Seattle 2020 Budget Aviation
IV-22
(in 000's) 2018 2019 2020Notes Actual Budget Budget
EXPENSES BEFORE CHARGES TO CAP/GOVT/ENVRS PROJECTS
BUSINESS UNITSAirport Operations 40,360 45,446 51,311 12.9%Commercial Management 12,714 13,018 15,816 21.5%Utilities 20,103 22,704 23,550 3.7%Business Units 73,177 81,168 90,677 11.7%
AVIATION SERVICESAviation Director's Office 1,358 1,804 2,412 33.7%Capital Development 2,544 4,597 2,962 -35.6%Airport Innovation 569 1,112 1,119 0.7%Fire Department 16,232 18,163 19,391 6.8%Aviation Planning 4,611 6,598 4,829 -26.8%Customer Service 2,766 8,072 6,079 -24.7%Airport Security 17,279 18,717 20,720 10.7%Aviation Project Management Group (AVPMG) 21,008 20,856 24,568 17.8%Aviation Maintenance 86,214 89,190 98,537 10.5%Aviation Services 152,581 169,107 180,617 6.8%
AVIATION FACILITIESAV Facilities & Infrastructure 4,493 8,414 10,906 29.6%Aviation Signage 514 677 1,038 53.4%Airport Building Department 1,330 1,619 1,750 8.1%Aviation Facilities 6,337 10,709 13,695 27.9%
Aviation Risks Expense 3,640 2,209 2,294 3.9%Aviation Environmental Remediation Liability 6,233 14,259 2,648 -81.4%Aviation Capital to Expense 5,361 - - n/a Payroll Vacancy Assumption () - (4,300) n/a Total Expenses Before Charges to Cap/Govt/Envrs Projects 247,328 277,453 285,630 2.9%
CHARGES TO CAPITAL/GOVT /ENVRS PROJECTS (20,049) (20,745) (26,739) 28.9%
EXPENSES AFTER CHARGES TO CAP/GOVT/ENVRS PROJECTS
BUSINESS UNITSAirport Operations 40,112 45,446 51,311 12.9%Commercial Management 12,714 13,018 15,816 21.5%Utilities 20,100 22,704 23,550 3.7%Business Units 72,926 81,168 90,677 11.7%
AVIATION SERVICESAviation Director's Office 1,358 1,804 2,412 33.7%Capital Development 2,423 3,365 2,771 -17.6%Airport Innovation 569 1,112 1,119 0.7%Fire Department 15,876 17,596 18,723 6.4%Aviation Planning 4,611 6,598 4,829 -26.8%Customer Service 2,766 8,072 6,079 -24.7%Airport Security 16,217 18,082 18,700 3.4%Aviation Project Management Group (AVPMG) 4,876 6,794 5,426 -20.1%Aviation Maintenance 84,159 86,404 95,686 10.7%Aviation Services 132,854 149,826 155,745 4.0%
AVIATION FACILITIESAV Facilities & Infrastructure 3,643 7,486 9,868 31.8%Aviation Signage 442 636 906 42.5%Airport Building Department 650 1,123 1,053 -6.2%Aviation Facilities 4,735 9,245 11,827 27.9%
Aviation Operating & Maintenance Expense 210,516 240,239 258,249 7.5%
Aviation Risks Expense 3,640 2,209 2,294 3.9%Aviation Environmental Remediation Liability 6,233 14,259 2,648 -81.4%Aviation Capital to Expense 6,891 - - n/a Payroll Vacancy Assumption () - (4,300) n/a Total Operating Expense 227,279 256,708 258,891 0.9%
BDAVREEX.xls
AVIATION DIVISION% Change 2020 Bud - 2019 Bud

Port of Seattle 2020 Budget Aviation
IV-23
E. STAFFING Table IV-7 outlines the full-time equivalent staffing (FTEs) for the Aviation division. The Aviation 2020 Budget is based on 1,206.3 FTEs, which is 3.3% higher than the 2019 Budget (restated to reflect the transfer of Aviation Project Management group from Central Services to the Aviation division). TABLE IV-7: AVIATION DIVISION STAFFING
STAFFING % Change(Full-Time Equivalent Positions) 2018 2019 2019 2020 2020 Bud vsBUSINESS GROUP/DEPARTMENT Actual Budget Est. Act. Budget 2019 BudAIRPORT OPERATIONS Aeronautical Business Group 77.8 86.8 87.8 89.8 3.5% Landside Business Group 145.1 148.1 149.1 150.1 1.4%Airport Operations 222.9 234.9 236.9 239.9 2.1%
COMMERCIAL MANAGEMENT Aviation Properties 11.5 12.5 14.5 14.5 16.0% Airport Dining & Retail 8.5 9.5 9.7 9.7 2.6% AV Commercial Management 3.3 3.3 4.3 4.3 30.8% Parking Revenue Management 2.0 3.0 3.0 3.0 0.0% AV Commercial Mgmt & Analysis 2.0 2.0 2.0 2.0 0.0% Airport Office Building Mgmt 9.4 9.5 9.5 9.5 0.0% Utilities 4.0 4.0 4.0 4.0 0.0%Commercial Management 40.6 43.7 46.9 46.9 7.4%
AVIATION SERVICES Airport Director's Office 6.0 6.5 8.3 8.3 26.9% Customer Service 32.3 46.3 33.3 37.3 -19.5% Airport Innovation 4.0 4.0 4.0 5.0 25.0% Capital Dev Prog Mgmt 7.0 7.0 7.0 7.0 0.0% Fire Department 90.5 99.5 100.5 101.5 2.0% Planning 5.5 5.5 5.5 5.5 0.0% Airport Security 210.0 210.5 204.0 212.0 0.7% Maintenance 396.0 409.0 407.0 434.0 6.1% Aviation Project Management 62.0 61.8 62.0 65.0 5.3%Total Aviation Services 813.3 850.0 831.5 875.5 3.0%
FACILITIES Facilities & Infrastructure 24.8 26.0 25.0 31.0 19.2% AV Signage 4.0 5.0 5.0 5.0 0.0% Aviation Building Department 8.0 8.0 8.0 8.0 0.0%Total Facilities 36.8 39.0 38.0 44.0 12.8%TOTAL AVIATION DIVISION 1,113.4 1,167.5 1,153.28 1,206.28 3.3%
FTE.XLS
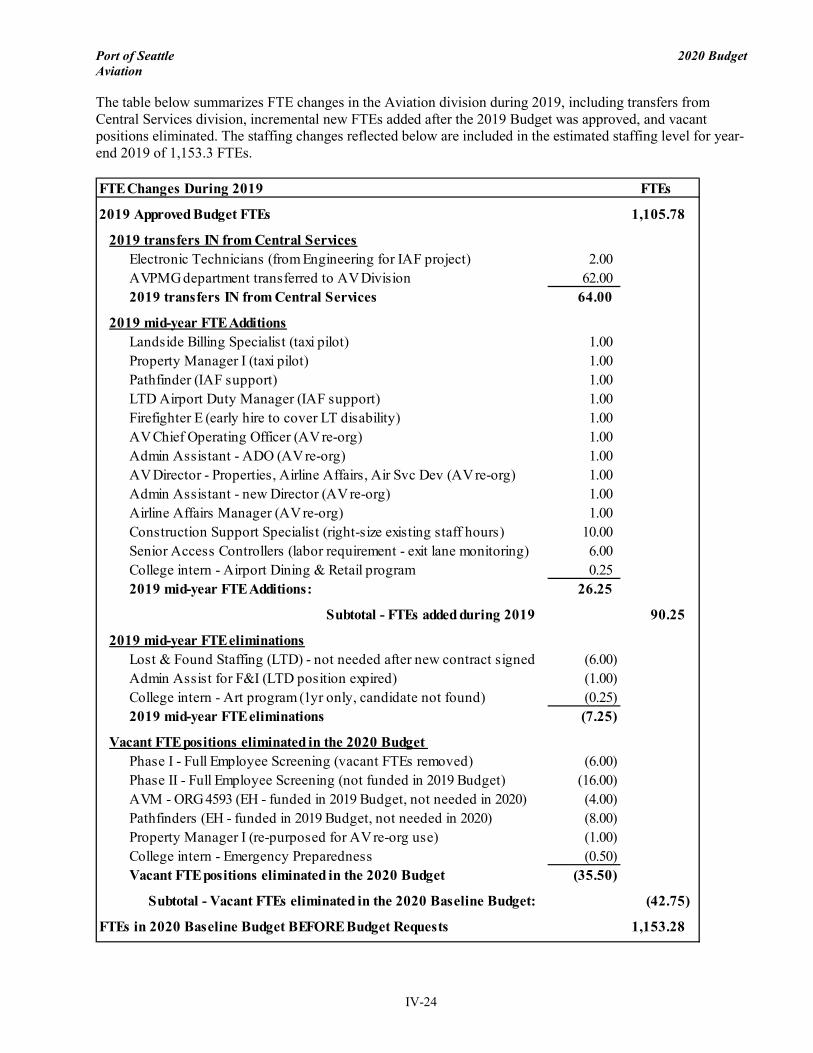
Port of Seattle 2020 Budget Aviation
IV-24
The table below summarizes FTE changes in the Aviation division during 2019, including transfers from Central Services division, incremental new FTEs added after the 2019 Budget was approved, and vacant positions eliminated. The staffing changes reflected below are included in the estimated staffing level for year-end 2019 of 1,153.3 FTEs.
FTE Changes During 2019 FTEs
2019 Approved Budget FTEs 1,105.78
2019 transfers IN from Central ServicesElectronic Technicians (from Engineering for IAF project) 2.00AVPMG department transferred to AV Division 62.002019 transfers IN from Central Services 64.00
2019 mid-year FTE AdditionsLandside Billing Specialist (taxi pilot) 1.00Property Manager I (taxi pilot) 1.00Pathfinder (IAF support) 1.00LTD Airport Duty Manager (IAF support) 1.00Firefighter E (early hire to cover LT disability) 1.00AV Chief Operating Officer (AV re-org) 1.00Admin Assistant - ADO (AV re-org) 1.00AV Director - Properties, Airline Affairs, Air Svc Dev (AV re-org) 1.00Admin Assistant - new Director (AV re-org) 1.00Airline Affairs Manager (AV re-org) 1.00Construction Support Specialist (right-size existing staff hours) 10.00Senior Access Controllers (labor requirement - exit lane monitoring) 6.00College intern - Airport Dining & Retail program 0.252019 mid-year FTE Additions: 26.25
Subtotal - FTEs added during 2019 90.25
2019 mid-year FTE eliminationsLost & Found Staffing (LTD) - not needed after new contract signed (6.00)Admin Assist for F&I (LTD position expired) (1.00)College intern - Art program (1yr only, candidate not found) (0.25)2019 mid-year FTE eliminations (7.25)
Vacant FTE positions eliminated in the 2020 Budget Phase I - Full Employee Screening (vacant FTEs removed) (6.00)Phase II - Full Employee Screening (not funded in 2019 Budget) (16.00)AVM - ORG 4593 (EH - funded in 2019 Budget, not needed in 2020) (4.00)Pathfinders (EH - funded in 2019 Budget, not needed in 2020) (8.00)Property Manager I (re-purposed for AV re-org use) (1.00)College intern - Emergency Preparedness (0.50)Vacant FTE positions eliminated in the 2020 Budget (35.50)
Subtotal - Vacant FTEs eliminated in the 2020 Baseline Budget: (42.75)
FTEs in 2020 Baseline Budget BEFORE Budget Requests 1,153.28

Port of Seattle 2020 Budget Aviation
IV-25
Full-Time Equivalent Staff Positions (FTEs)
2020 Proposed Budget FTEs FTEs %
2019 Approved Budget 1,105.78
2019 FTE Transfers between divisions (net zero impact to total FTEs)2019 FTE transfers IN from Central Services 64.00
2019 FTE Transfers 64.00
2019 Adjusted Baseline 1,169.78
2019 Changes in FTEs during the year2019 mid-year FTE additions 26.25Vacant FTEs eliminated during 2019 (42.75)
2019 Mid-year Changes in FTEs (16.50) -1.4%
Proposed New FTEs in 2020 Budget: 52.00 4.4%Aviation Maintenance FTEs 27.00Aviation Security FTEs 8.00Customer Service FTE's 4.00Terminal Operations FTE's 2.00Landside Operations FTEs 1.00Fire Department FTEs 1.00Capital Development/Facilities & Infrastructure FTE's 3.00Aviation Planning FTEs 1.00Aviation Sign Shop FTEs 1.00Aviation Innovation FTEs 1.00AVPMG FTEs 3.00
New Intern FTE's - College/Graduate 1.00 0.1%Proposed Increase in 2020 Budget FTEs 53.00
2020 Budget Proposed FTEs 1,206.28 3.1%plus: Central Services FTE's direct charged 100% to airport 43.252020 Budget FTE's - in Aviation division budget 1,249.53
Note: percent changes compared to 2019 Approved Budget after internal FTE transfers
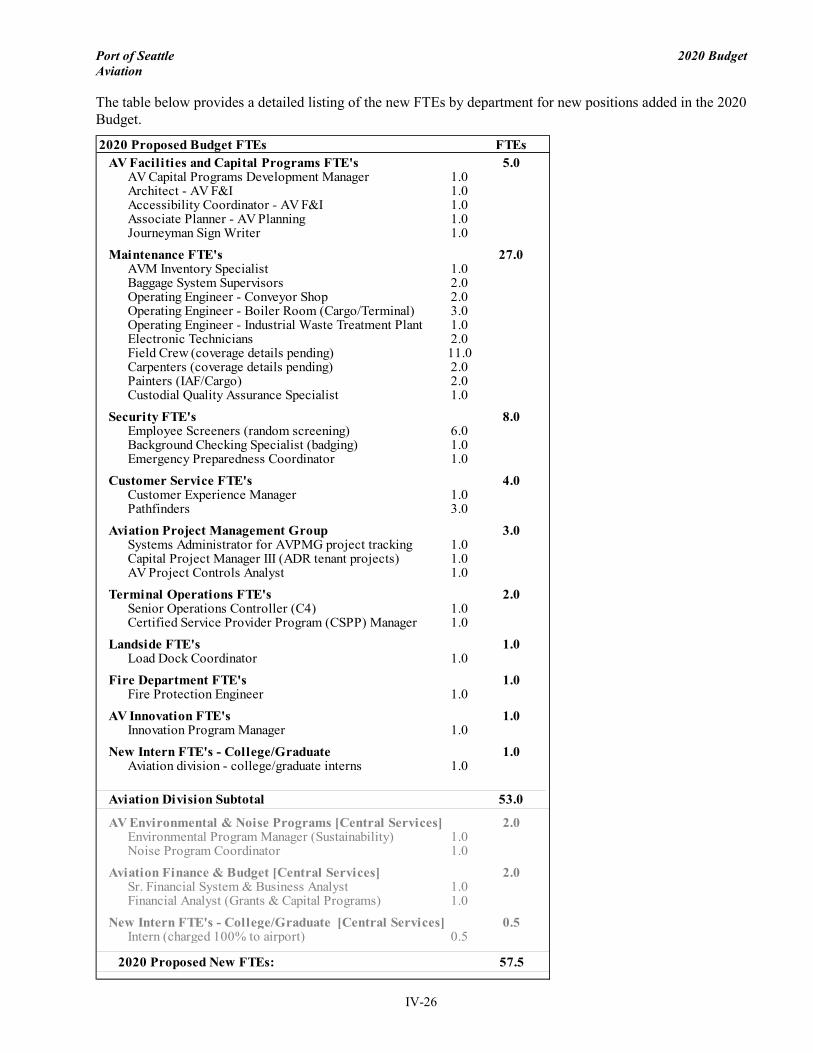
Port of Seattle 2020 Budget Aviation
IV-26
The table below provides a detailed listing of the new FTEs by department for new positions added in the 2020 Budget.
2020 Proposed Budget FTEs FTEsAV Facilities and Capital Programs FTE's 5.0
AV Capital Programs Development Manager 1.0Architect - AV F&I 1.0Accessibility Coordinator - AV F&I 1.0Associate Planner - AV Planning 1.0Journeyman Sign Writer 1.0
Maintenance FTE's 27.0AVM Inventory Specialist 1.0Baggage System Supervisors 2.0Operating Engineer - Conveyor Shop 2.0Operating Engineer - Boiler Room (Cargo/Terminal) 3.0Operating Engineer - Industrial Waste Treatment Plant 1.0Electronic Technicians 2.0Field Crew (coverage details pending) 11.0Carpenters (coverage details pending) 2.0Painters (IAF/Cargo) 2.0Custodial Quality Assurance Specialist 1.0
Security FTE's 8.0Employee Screeners (random screening) 6.0Background Checking Specialist (badging) 1.0Emergency Preparedness Coordinator 1.0
Customer Service FTE's 4.0Customer Experience Manager 1.0Pathfinders 3.0
Aviation Project Management Group 3.0Systems Administrator for AVPMG project tracking 1.0Capital Project Manager III (ADR tenant projects) 1.0AV Project Controls Analyst 1.0
Terminal Operations FTE's 2.0Senior Operations Controller (C4) 1.0Certified Service Provider Program (CSPP) Manager 1.0
Landside FTE's 1.0Load Dock Coordinator 1.0
Fire Department FTE's 1.0Fire Protection Engineer 1.0
AV Innovation FTE's 1.0Innovation Program Manager 1.0
New Intern FTE's - College/Graduate 1.0Aviation division - college/graduate interns 1.0
Aviation Division Subtotal 53.0
AV Environmental & Noise Programs [Central Services] 2.0Environmental Program Manager (Sustainability) 1.0Noise Program Coordinator 1.0
Aviation Finance & Budget [Central Services] 2.0Sr. Financial System & Business Analyst 1.0Financial Analyst (Grants & Capital Programs) 1.0
New Intern FTE's - College/Graduate [Central Services] 0.5Intern (charged 100% to airport) 0.5
2020 Proposed New FTEs: 57.5
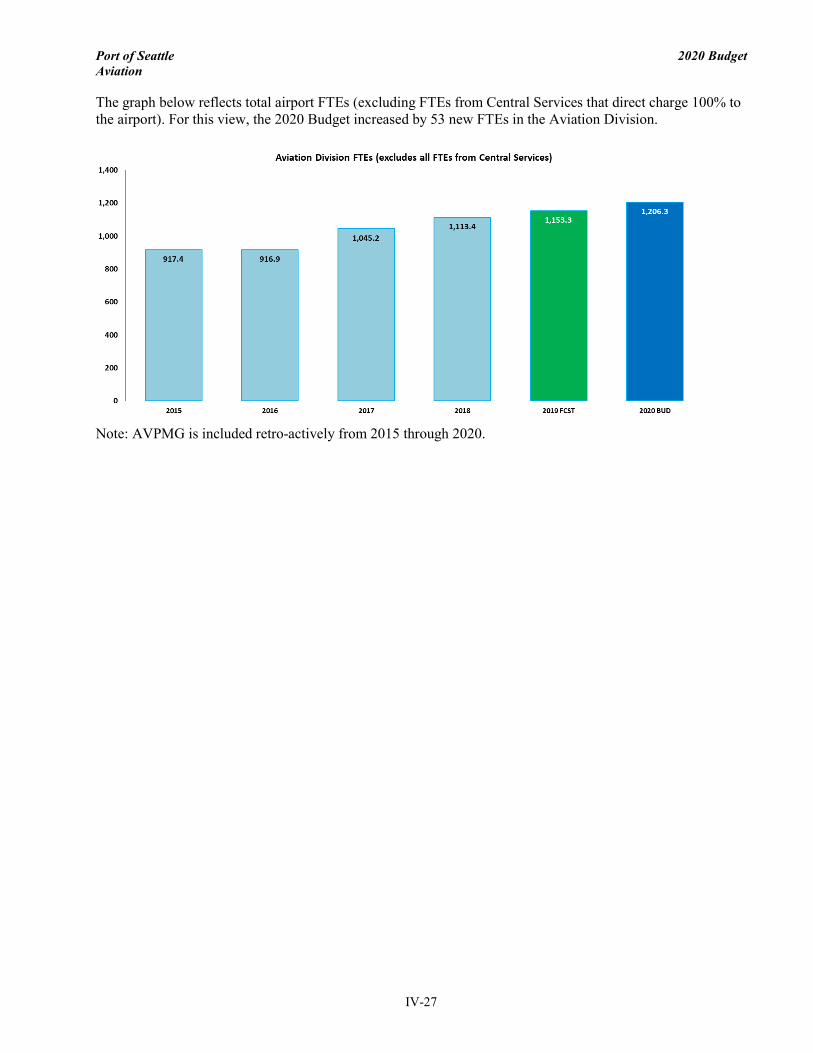
Port of Seattle 2020 Budget Aviation
IV-27
The graph below reflects total airport FTEs (excluding FTEs from Central Services that direct charge 100% to the airport). For this view, the 2020 Budget increased by 53 new FTEs in the Aviation Division.
Note: AVPMG is included retro-actively from 2015 through 2020.

Port of Seattle 2020 Budget Aviation
IV-28
F. CAPITAL BUDGET The business assessment at the beginning of this section provides the context for the following capital budget for the Aviation Division. The Aviation Division’s capital plan for 2020 – 2024 calls for spending of $2.9B. Three major projects account for $730.6M of the spending: North Satellite Renovation & North Satellite Transit Station Lobbies, Baggage Recapitalization/Optimization, and the International Arrivals Facility. Thirty-four projects, totaling $233.2M of spending through 2024 were proposed for inclusion as “business plan prospective.” A total of $291.4M is included for the preliminary planning and design of the Sustainable Airport Master Plan (SAMP). A total of $680M remains in the Reserve Capital Improvement Projects (CIPs), which is undesignated future spending that will account for undefined future projects or budget increases to existing projects. The CIP Cash Management Reserve is implemented for the 2020 budget to adjust the cash-flow to reflect projects’ spending trends.
• Three major projects account for $731M. • Proposing 34 new projects totaling $233M spending through 2024. • Budget includes place-holder spending for undefined future projects (called “Allowance CIPs”): $680M. • Proposing SAMP preliminary planning/design spending of $291M through 2024 ($300M total). • Besides preliminary planning/design funds, budget does not include potential projects to be identified by
Sustainable Airport Master Plan (SAMP).
2019FCST 2020 2021 2022 2023 2024
2020 - 24 TOTAL
Three Major ProjectsInternational Arrivals Facility 338,500 207,000 9,133 - - - 216,133 NSAT 133,086 134,800 105,470 9,988 - - 250,258 Baggage Optimization 25,565 44,300 55,000 55,000 55,000 55,000 264,300 Subtotal - Three Major Projects 497,151 386,100 169,603 64,988 55,000 55,000 730,692 Other Capital Projects 154,977 250,291 309,456 192,527 141,294 94,066 987,633 SAMP Preliminary Planning / Design 5,600 16,000 76,500 94,750 68,000 36,200 291,450 Proposed New Projects 1,863 3,813 21,755 38,877 82,746 85,996 233,188 CIPs Reserves - - - 80,000 200,000 400,000 680,000
Subtotal 659,591 656,204 577,314 471,142 547,039 671,262 2,922,962
CIP Cash Management Reserve - (86,066) 50,000 36,066
Total Proposed CIP 659,591 570,138 627,314 507,208 547,039 671,262 2,922,962
Cash Flows (Figures in $000s)
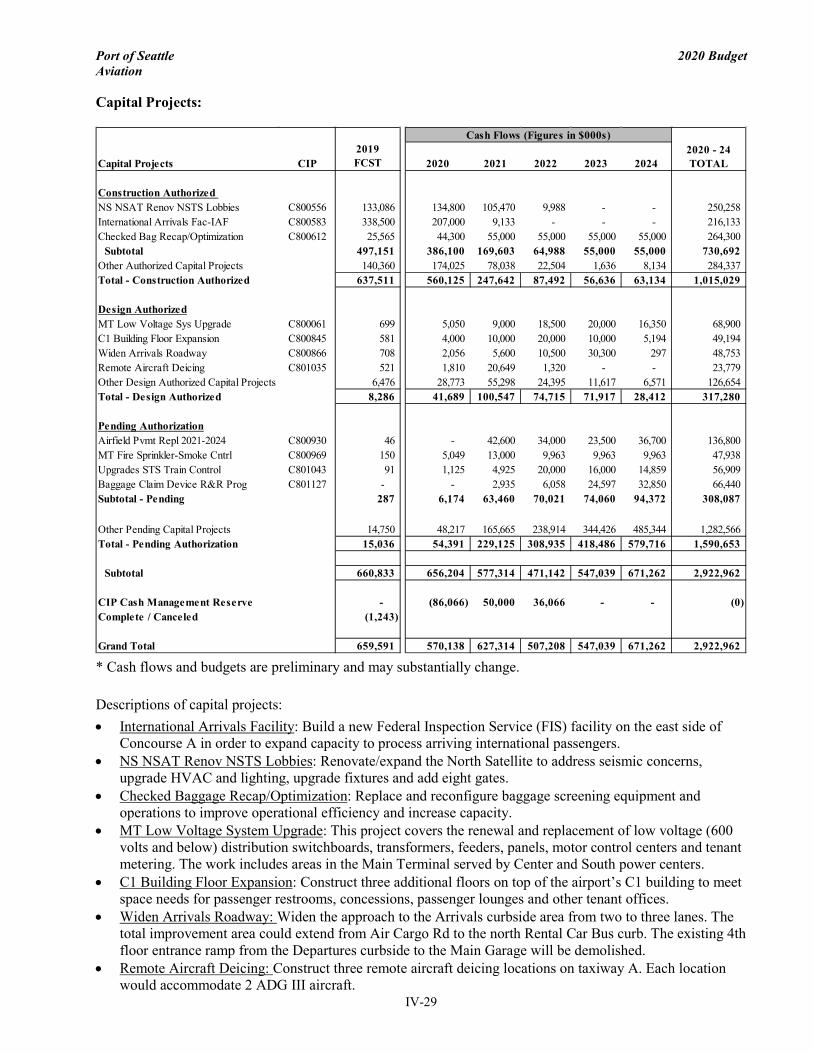
Port of Seattle 2020 Budget Aviation
IV-29
Capital Projects:
* Cash flows and budgets are preliminary and may substantially change. Descriptions of capital projects: • International Arrivals Facility: Build a new Federal Inspection Service (FIS) facility on the east side of
Concourse A in order to expand capacity to process arriving international passengers. • NS NSAT Renov NSTS Lobbies: Renovate/expand the North Satellite to address seismic concerns,
upgrade HVAC and lighting, upgrade fixtures and add eight gates. • Checked Baggage Recap/Optimization: Replace and reconfigure baggage screening equipment and
operations to improve operational efficiency and increase capacity. • MT Low Voltage System Upgrade: This project covers the renewal and replacement of low voltage (600
volts and below) distribution switchboards, transformers, feeders, panels, motor control centers and tenant metering. The work includes areas in the Main Terminal served by Center and South power centers.
• C1 Building Floor Expansion: Construct three additional floors on top of the airport’s C1 building to meet space needs for passenger restrooms, concessions, passenger lounges and other tenant offices.
• Widen Arrivals Roadway: Widen the approach to the Arrivals curbside area from two to three lanes. The total improvement area could extend from Air Cargo Rd to the north Rental Car Bus curb. The existing 4th floor entrance ramp from the Departures curbside to the Main Garage will be demolished.
• Remote Aircraft Deicing: Construct three remote aircraft deicing locations on taxiway A. Each location would accommodate 2 ADG III aircraft.
Capital Projects CIP2019FCST 2020 2021 2022 2023 2024
Construction Authorized NS NSAT Renov NSTS Lobbies C800556 133,086 134,800 105,470 9,988 - - 250,258 International Arrivals Fac-IAF C800583 338,500 207,000 9,133 - - - 216,133 Checked Bag Recap/Optimization C800612 25,565 44,300 55,000 55,000 55,000 55,000 264,300
Subtotal 497,151 386,100 169,603 64,988 55,000 55,000 730,692 Other Authorized Capital Projects 140,360 174,025 78,038 22,504 1,636 8,134 284,337 Total - Construction Authorized 637,511 560,125 247,642 87,492 56,636 63,134 1,015,029
Design AuthorizedMT Low Voltage Sys Upgrade C800061 699 5,050 9,000 18,500 20,000 16,350 68,900 C1 Building Floor Expansion C800845 581 4,000 10,000 20,000 10,000 5,194 49,194 Widen Arrivals Roadway C800866 708 2,056 5,600 10,500 30,300 297 48,753 Remote Aircraft Deicing C801035 521 1,810 20,649 1,320 - - 23,779 Other Design Authorized Capital Projects 6,476 28,773 55,298 24,395 11,617 6,571 126,654 Total - Design Authorized 8,286 41,689 100,547 74,715 71,917 28,412 317,280
Pending AuthorizationAirfield Pvmt Repl 2021-2024 C800930 46 - 42,600 34,000 23,500 36,700 136,800 MT Fire Sprinkler-Smoke Cntrl C800969 150 5,049 13,000 9,963 9,963 9,963 47,938 Upgrades STS Train Control C801043 91 1,125 4,925 20,000 16,000 14,859 56,909 Baggage Claim Device R&R Prog C801127 - - 2,935 6,058 24,597 32,850 66,440 Subtotal - Pending 287 6,174 63,460 70,021 74,060 94,372 308,087
Other Pending Capital Projects 14,750 48,217 165,665 238,914 344,426 485,344 1,282,566 Total - Pending Authorization 15,036 54,391 229,125 308,935 418,486 579,716 1,590,653
Subtotal 660,833 656,204 577,314 471,142 547,039 671,262 2,922,962
CIP Cash Management Reserve - (86,066) 50,000 36,066 - - (0) Complete / Canceled (1,243)
Grand Total 659,591 570,138 627,314 507,208 547,039 671,262 2,922,962
Cash Flows (Figures in $000s)2020 - 24 TOTAL
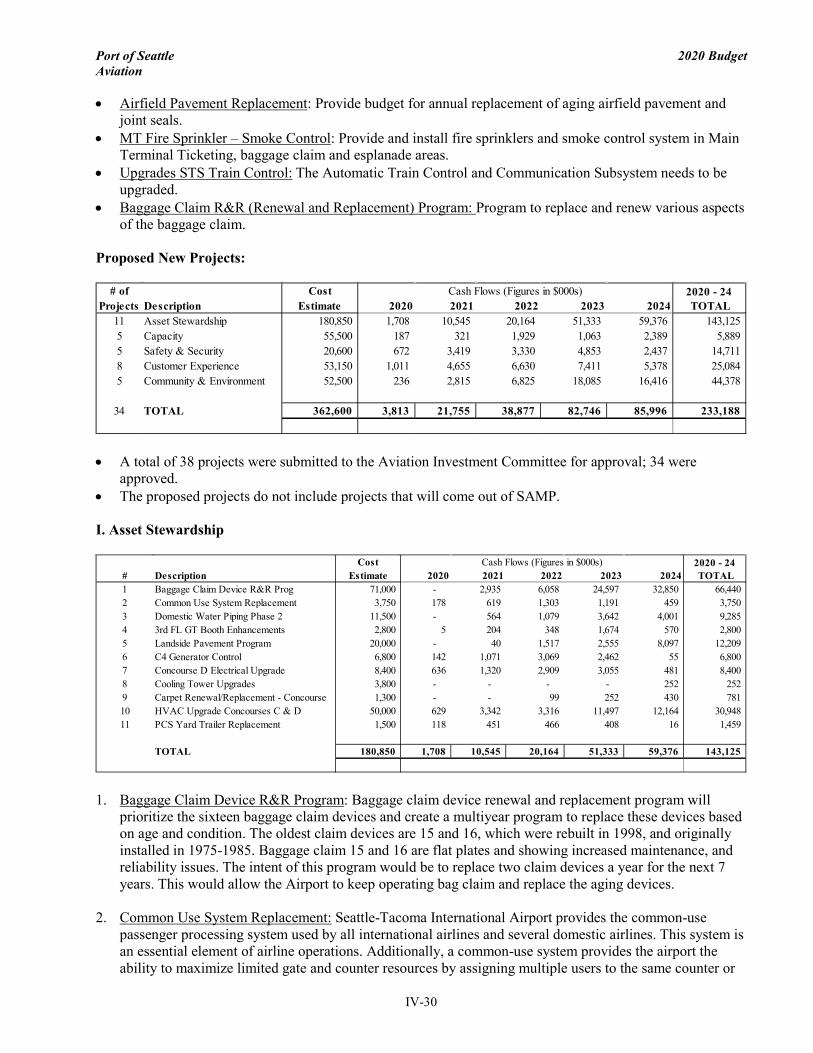
Port of Seattle 2020 Budget Aviation
IV-30
• Airfield Pavement Replacement: Provide budget for annual replacement of aging airfield pavement and joint seals.
• MT Fire Sprinkler – Smoke Control: Provide and install fire sprinklers and smoke control system in Main Terminal Ticketing, baggage claim and esplanade areas.
• Upgrades STS Train Control: The Automatic Train Control and Communication Subsystem needs to be upgraded.
• Baggage Claim R&R (Renewal and Replacement) Program: Program to replace and renew various aspects of the baggage claim.
Proposed New Projects:
• A total of 38 projects were submitted to the Aviation Investment Committee for approval; 34 were approved.
• The proposed projects do not include projects that will come out of SAMP. I. Asset Stewardship
1. Baggage Claim Device R&R Program: Baggage claim device renewal and replacement program will
prioritize the sixteen baggage claim devices and create a multiyear program to replace these devices based on age and condition. The oldest claim devices are 15 and 16, which were rebuilt in 1998, and originally installed in 1975-1985. Baggage claim 15 and 16 are flat plates and showing increased maintenance, and reliability issues. The intent of this program would be to replace two claim devices a year for the next 7 years. This would allow the Airport to keep operating bag claim and replace the aging devices.
2. Common Use System Replacement: Seattle-Tacoma International Airport provides the common-use passenger processing system used by all international airlines and several domestic airlines. This system is an essential element of airline operations. Additionally, a common-use system provides the airport the ability to maximize limited gate and counter resources by assigning multiple users to the same counter or
# of CostProjects Description Estimate 2020 2021 2022 2023 2024
11 Asset Stewardship 180,850 1,708 10,545 20,164 51,333 59,376 143,125 5 Capacity 55,500 187 321 1,929 1,063 2,389 5,889 5 Safety & Security 20,600 672 3,419 3,330 4,853 2,437 14,711 8 Customer Experience 53,150 1,011 4,655 6,630 7,411 5,378 25,084 5 Community & Environment 52,500 236 2,815 6,825 18,085 16,416 44,378
34 TOTAL 362,600 3,813 21,755 38,877 82,746 85,996 233,188
Cash Flows (Figures in $000s) 2020 - 24 TOTAL
Cost# Description Estimate 2020 2021 2022 2023 20241 Baggage Claim Device R&R Prog 71,000 - 2,935 6,058 24,597 32,850 66,440 2 Common Use System Replacement 3,750 178 619 1,303 1,191 459 3,750 3 Domestic Water Piping Phase 2 11,500 - 564 1,079 3,642 4,001 9,285 4 3rd FL GT Booth Enhancements 2,800 5 204 348 1,674 570 2,800 5 Landside Pavement Program 20,000 - 40 1,517 2,555 8,097 12,209 6 C4 Generator Control 6,800 142 1,071 3,069 2,462 55 6,800 7 Concourse D Electrical Upgrade 8,400 636 1,320 2,909 3,055 481 8,400 8 Cooling Tower Upgrades 3,800 - - - - 252 252 9 Carpet Renewal/Replacement - Concourse 1,300 - - 99 252 430 781 10 HVAC Upgrade Concourses C & D 50,000 629 3,342 3,316 11,497 12,164 30,948 11 PCS Yard Trailer Replacement 1,500 118 451 466 408 16 1,459
TOTAL 180,850 1,708 10,545 20,164 51,333 59,376 143,125
Cash Flows (Figures in $000s) 2020 - 24 TOTAL
Port of Seattle 2020 Budget Aviation
IV-31
gate resource. The airport is currently on the second iteration of a common-use platform which was put into service approximately ten years ago.
3. Domestic Water Piping Phase 2: In phase 1, 50-year-old domestic water piping mains were replaced in the underground service tunnel and mechanical rooms. Maintenance activities disassembled some domestic water piping in the Main Terminal and a large amount of mineral build up was found. Phase 2 will replace the 50-year-old domestic water piping that connect the water mains from phase 1 to all of the restrooms and Airport Dining and Retail (ADR) facilities in the Main Terminal. This project does not include any piping in the concourses.
4. 3rd FL GT Booth Enhancements: This project will expand and renovate the Ground Transportation Offices on the 3rd floor of the parking garage. This project will also explore the addition of internal employee restrooms, increase cell coverage and WIFI, update an upstairs breakroom and relocate a data center in the adjacent booth.
5. Landside Pavement Program: This Landside Pavement Replacement 2020-2024 project will fund the
initial five years of the continuous landside pavement renewal and replacement program described above. This project supports the Century Agenda Strategy to position the Puget Sound region as a premier international logistics hub by maintaining the most basic of infrastructure: pavement.
6. C4 Generator Control: The C4 generator provides back-up power to the C4 area, which includes the ACC, ECC, and 911 dispatch. The generator was initially installed during the STEP project (2004) with controls provided by GE Fanuc Programmable Logic Controller (PLC). GE no longer produces or supports the Fanuc PLC therefore software upgrades and hardware are difficult to obtain. The Port has recently standardized using Allen Bradley PLCs. This project would replace the obsolete PLC with the new standard. In addition, the HVAC controls for the generator room will be transferred to the building controls system that is used airport wide.
7. Concourse D Electrical Upgrade: Areas of Concourse D do not have electrical capacity. At the end of Concourse D, there are no available circuits and few viable locations for new panels. This leads to small tenant and Port projects having to install new infrastructure, adding cost and complexity to projects. This project will add an electrical room on Concourse D and populate it with electrical panels to serve ongoing project needs. In addition, the tenant distribution panels on Concourse D are obsolete and need to be replaced in order to support current and future ADR projects.
8. Cooling Tower Upgrades: There are 5 cooling towers currently serving the airport. In the winter, the cooling tower system is split in half, one side serving the Chillers, and the other serving the heat exchangers. The current supply for makeup water is subject to frequent shutdowns for construction and repair projects. Test coupon and pH measurement stations are used to test corrosion levels and water quality. A test coupon is a piece of metal that is left in the flow of water being tested. After a period of time, the coupon can be inspected to determine the amount of corrosion and build up. Currently, the water is manually tested using a procedure that is less accurate than using a test coupon and pH measurement station. In addition, the filtration system will need to be upgraded. This will allow for the most efficient use of the cooling towers.
9. Carpet Renewal/Replacement - Concourse D: This project will replace currently carpeted areas in publicly accessible spaces on D Concourse including hold rooms and common areas with new carpet tiles.
10. HVAC Upgrade Concourses C & D: The HVAC air handlers on Concourses C & D are at capacity and are unable to adequately heat and cool the concourse public spaces, mezzanine, and ramp level spaces. The system is unable to accommodate any additional load, which impacts projects adding additional space on the concourses. This project will upsize the existing air handlers and add additional air handlers as needed to be able to heat and cool the concourses, ramp, and mezzanine spaces on Concourse C and D.
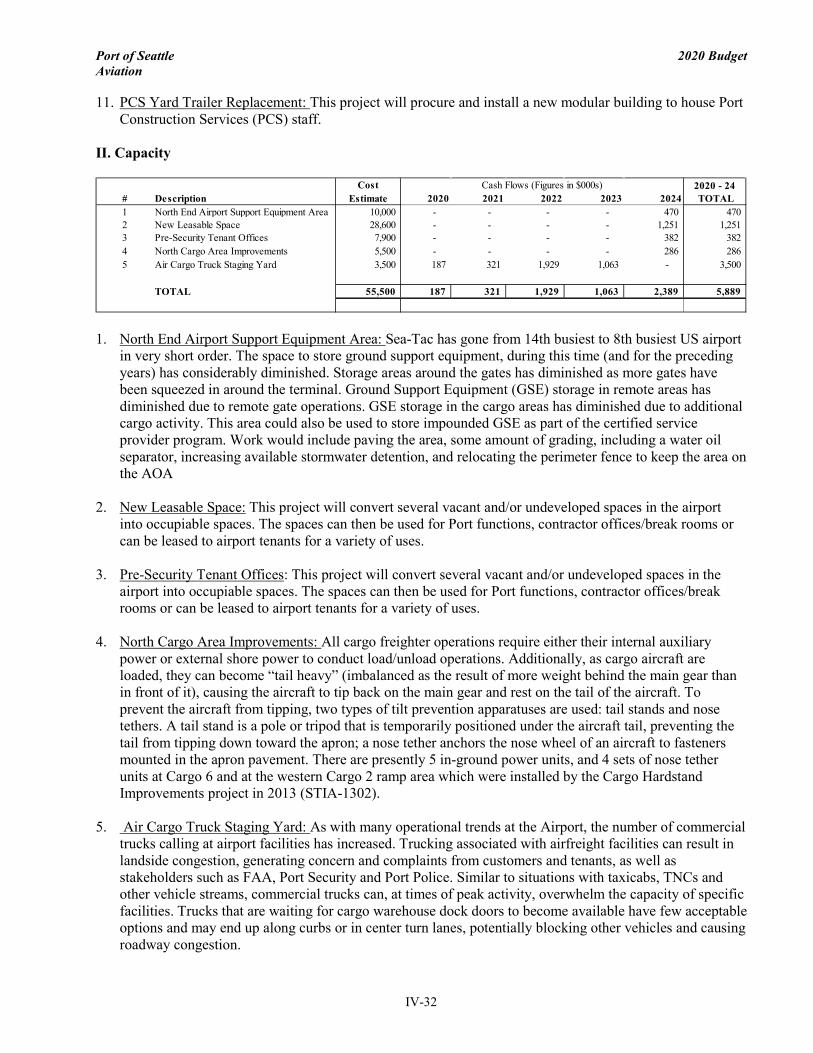
Port of Seattle 2020 Budget Aviation
IV-32
11. PCS Yard Trailer Replacement: This project will procure and install a new modular building to house Port Construction Services (PCS) staff.
II. Capacity
1. North End Airport Support Equipment Area: Sea-Tac has gone from 14th busiest to 8th busiest US airport in very short order. The space to store ground support equipment, during this time (and for the preceding years) has considerably diminished. Storage areas around the gates has diminished as more gates have been squeezed in around the terminal. Ground Support Equipment (GSE) storage in remote areas has diminished due to remote gate operations. GSE storage in the cargo areas has diminished due to additional cargo activity. This area could also be used to store impounded GSE as part of the certified service provider program. Work would include paving the area, some amount of grading, including a water oil separator, increasing available stormwater detention, and relocating the perimeter fence to keep the area on the AOA
2. New Leasable Space: This project will convert several vacant and/or undeveloped spaces in the airport into occupiable spaces. The spaces can then be used for Port functions, contractor offices/break rooms or can be leased to airport tenants for a variety of uses.
3. Pre-Security Tenant Offices: This project will convert several vacant and/or undeveloped spaces in the airport into occupiable spaces. The spaces can then be used for Port functions, contractor offices/break rooms or can be leased to airport tenants for a variety of uses.
4. North Cargo Area Improvements: All cargo freighter operations require either their internal auxiliary power or external shore power to conduct load/unload operations. Additionally, as cargo aircraft are loaded, they can become “tail heavy” (imbalanced as the result of more weight behind the main gear than in front of it), causing the aircraft to tip back on the main gear and rest on the tail of the aircraft. To prevent the aircraft from tipping, two types of tilt prevention apparatuses are used: tail stands and nose tethers. A tail stand is a pole or tripod that is temporarily positioned under the aircraft tail, preventing the tail from tipping down toward the apron; a nose tether anchors the nose wheel of an aircraft to fasteners mounted in the apron pavement. There are presently 5 in-ground power units, and 4 sets of nose tether units at Cargo 6 and at the western Cargo 2 ramp area which were installed by the Cargo Hardstand Improvements project in 2013 (STIA-1302).
5. Air Cargo Truck Staging Yard: As with many operational trends at the Airport, the number of commercial trucks calling at airport facilities has increased. Trucking associated with airfreight facilities can result in landside congestion, generating concern and complaints from customers and tenants, as well as stakeholders such as FAA, Port Security and Port Police. Similar to situations with taxicabs, TNCs and other vehicle streams, commercial trucks can, at times of peak activity, overwhelm the capacity of specific facilities. Trucks that are waiting for cargo warehouse dock doors to become available have few acceptable options and may end up along curbs or in center turn lanes, potentially blocking other vehicles and causing roadway congestion.
Cost# Description Estimate 2020 2021 2022 2023 20241 North End Airport Support Equipment Area 10,000 - - - - 470 470 2 New Leasable Space 28,600 - - - - 1,251 1,251 3 Pre-Security Tenant Offices 7,900 - - - - 382 382 4 North Cargo Area Improvements 5,500 - - - - 286 286 5 Air Cargo Truck Staging Yard 3,500 187 321 1,929 1,063 - 3,500
TOTAL 55,500 187 321 1,929 1,063 2,389 5,889
Cash Flows (Figures in $000s) 2020 - 24 TOTAL
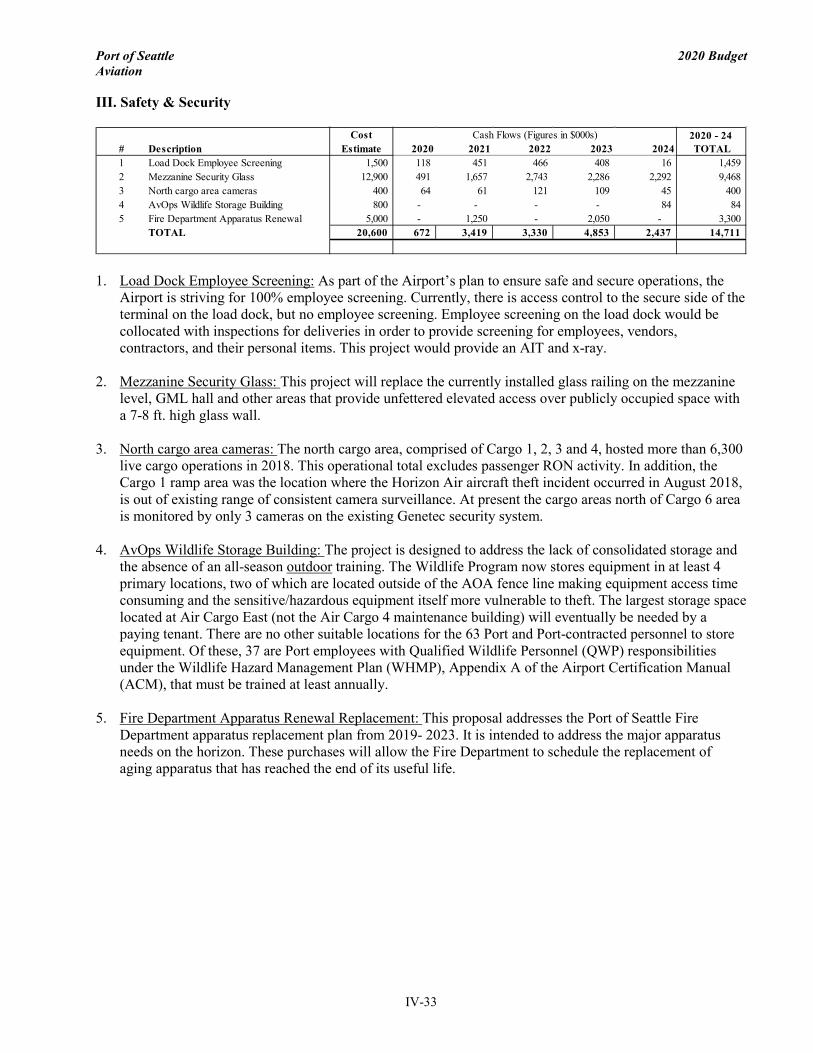
Port of Seattle 2020 Budget Aviation
IV-33
III. Safety & Security
1. Load Dock Employee Screening: As part of the Airport’s plan to ensure safe and secure operations, the
Airport is striving for 100% employee screening. Currently, there is access control to the secure side of the terminal on the load dock, but no employee screening. Employee screening on the load dock would be collocated with inspections for deliveries in order to provide screening for employees, vendors, contractors, and their personal items. This project would provide an AIT and x-ray.
2. Mezzanine Security Glass: This project will replace the currently installed glass railing on the mezzanine level, GML hall and other areas that provide unfettered elevated access over publicly occupied space with a 7-8 ft. high glass wall.
3. North cargo area cameras: The north cargo area, comprised of Cargo 1, 2, 3 and 4, hosted more than 6,300 live cargo operations in 2018. This operational total excludes passenger RON activity. In addition, the Cargo 1 ramp area was the location where the Horizon Air aircraft theft incident occurred in August 2018, is out of existing range of consistent camera surveillance. At present the cargo areas north of Cargo 6 area is monitored by only 3 cameras on the existing Genetec security system.
4. AvOps Wildlife Storage Building: The project is designed to address the lack of consolidated storage and the absence of an all-season outdoor training. The Wildlife Program now stores equipment in at least 4 primary locations, two of which are located outside of the AOA fence line making equipment access time consuming and the sensitive/hazardous equipment itself more vulnerable to theft. The largest storage space located at Air Cargo East (not the Air Cargo 4 maintenance building) will eventually be needed by a paying tenant. There are no other suitable locations for the 63 Port and Port-contracted personnel to store equipment. Of these, 37 are Port employees with Qualified Wildlife Personnel (QWP) responsibilities under the Wildlife Hazard Management Plan (WHMP), Appendix A of the Airport Certification Manual (ACM), that must be trained at least annually.
5. Fire Department Apparatus Renewal Replacement: This proposal addresses the Port of Seattle Fire Department apparatus replacement plan from 2019- 2023. It is intended to address the major apparatus needs on the horizon. These purchases will allow the Fire Department to schedule the replacement of aging apparatus that has reached the end of its useful life.
Cost# Description Estimate 2020 2021 2022 2023 20241 Load Dock Employee Screening 1,500 118 451 466 408 16 1,459 2 Mezzanine Security Glass 12,900 491 1,657 2,743 2,286 2,292 9,468 3 North cargo area cameras 400 64 61 121 109 45 400 4 AvOps Wildlife Storage Building 800 - - - - 84 84 5 Fire Department Apparatus Renewal 5,000 - 1,250 - 2,050 - 3,300
TOTAL 20,600 672 3,419 3,330 4,853 2,437 14,711
Cash Flows (Figures in $000s) 2020 - 24 TOTAL
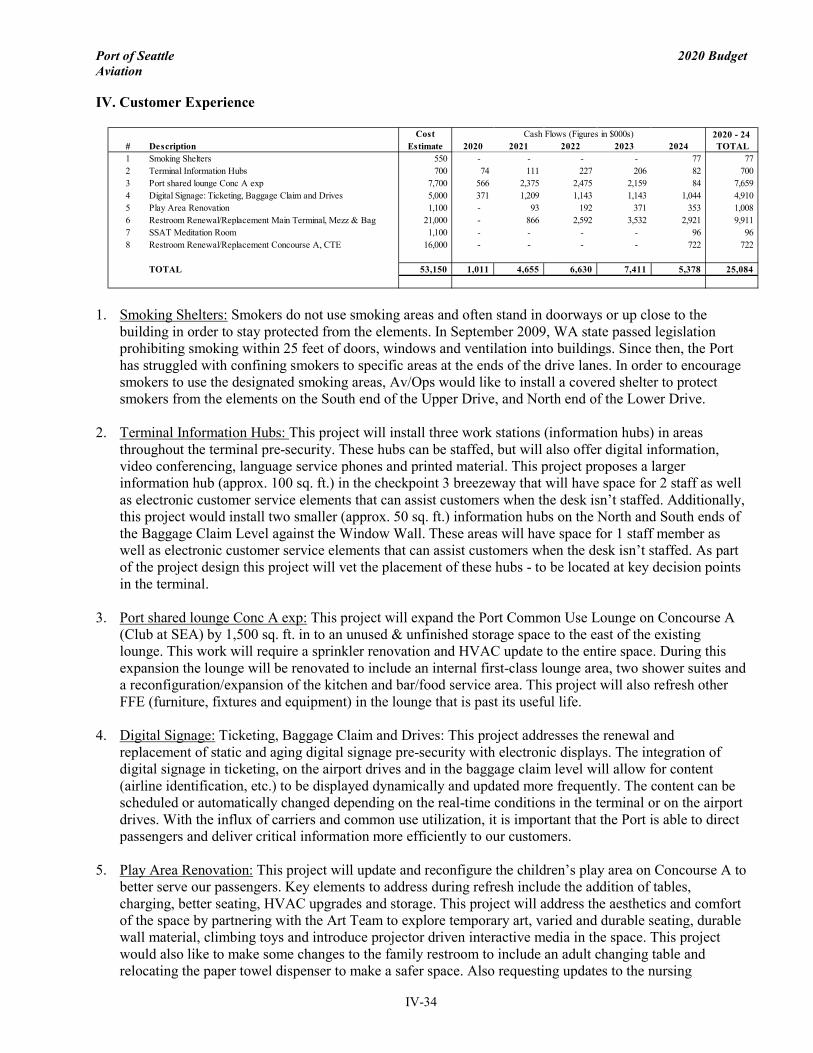
Port of Seattle 2020 Budget Aviation
IV-34
IV. Customer Experience
1. Smoking Shelters: Smokers do not use smoking areas and often stand in doorways or up close to the building in order to stay protected from the elements. In September 2009, WA state passed legislation prohibiting smoking within 25 feet of doors, windows and ventilation into buildings. Since then, the Port has struggled with confining smokers to specific areas at the ends of the drive lanes. In order to encourage smokers to use the designated smoking areas, Av/Ops would like to install a covered shelter to protect smokers from the elements on the South end of the Upper Drive, and North end of the Lower Drive.
2. Terminal Information Hubs: This project will install three work stations (information hubs) in areas throughout the terminal pre-security. These hubs can be staffed, but will also offer digital information, video conferencing, language service phones and printed material. This project proposes a larger information hub (approx. 100 sq. ft.) in the checkpoint 3 breezeway that will have space for 2 staff as well as electronic customer service elements that can assist customers when the desk isn’t staffed. Additionally, this project would install two smaller (approx. 50 sq. ft.) information hubs on the North and South ends of the Baggage Claim Level against the Window Wall. These areas will have space for 1 staff member as well as electronic customer service elements that can assist customers when the desk isn’t staffed. As part of the project design this project will vet the placement of these hubs - to be located at key decision points in the terminal.
3. Port shared lounge Conc A exp: This project will expand the Port Common Use Lounge on Concourse A (Club at SEA) by 1,500 sq. ft. in to an unused & unfinished storage space to the east of the existing lounge. This work will require a sprinkler renovation and HVAC update to the entire space. During this expansion the lounge will be renovated to include an internal first-class lounge area, two shower suites and a reconfiguration/expansion of the kitchen and bar/food service area. This project will also refresh other FFE (furniture, fixtures and equipment) in the lounge that is past its useful life.
4. Digital Signage: Ticketing, Baggage Claim and Drives: This project addresses the renewal and replacement of static and aging digital signage pre-security with electronic displays. The integration of digital signage in ticketing, on the airport drives and in the baggage claim level will allow for content (airline identification, etc.) to be displayed dynamically and updated more frequently. The content can be scheduled or automatically changed depending on the real-time conditions in the terminal or on the airport drives. With the influx of carriers and common use utilization, it is important that the Port is able to direct passengers and deliver critical information more efficiently to our customers.
5. Play Area Renovation: This project will update and reconfigure the children’s play area on Concourse A to better serve our passengers. Key elements to address during refresh include the addition of tables, charging, better seating, HVAC upgrades and storage. This project will address the aesthetics and comfort of the space by partnering with the Art Team to explore temporary art, varied and durable seating, durable wall material, climbing toys and introduce projector driven interactive media in the space. This project would also like to make some changes to the family restroom to include an adult changing table and relocating the paper towel dispenser to make a safer space. Also requesting updates to the nursing
Cost# Description Estimate 2020 2021 2022 2023 20241 Smoking Shelters 550 - - - - 77 77 2 Terminal Information Hubs 700 74 111 227 206 82 700 3 Port shared lounge Conc A exp 7,700 566 2,375 2,475 2,159 84 7,659 4 Digital Signage: Ticketing, Baggage Claim and Drives 5,000 371 1,209 1,143 1,143 1,044 4,910 5 Play Area Renovation 1,100 - 93 192 371 353 1,008 6 Restroom Renewal/Replacement Main Terminal, Mezz & Bag 21,000 - 866 2,592 3,532 2,921 9,911 7 SSAT Meditation Room 1,100 - - - - 96 96 8 Restroom Renewal/Replacement Concourse A, CTE 16,000 - - - - 722 722
TOTAL 53,150 1,011 4,655 6,630 7,411 5,378 25,084
Cash Flows (Figures in $000s) 2020 - 24 TOTAL
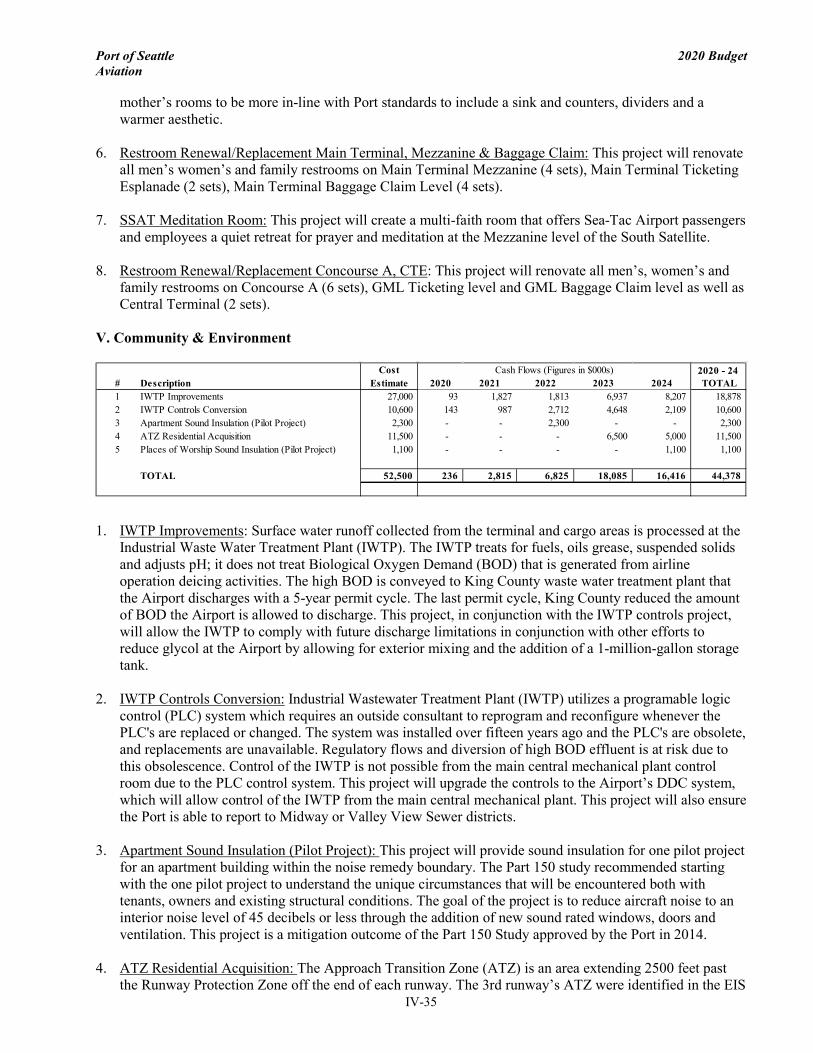
Port of Seattle 2020 Budget Aviation
IV-35
mother’s rooms to be more in-line with Port standards to include a sink and counters, dividers and a warmer aesthetic.
6. Restroom Renewal/Replacement Main Terminal, Mezzanine & Baggage Claim: This project will renovate all men’s women’s and family restrooms on Main Terminal Mezzanine (4 sets), Main Terminal Ticketing Esplanade (2 sets), Main Terminal Baggage Claim Level (4 sets).
7. SSAT Meditation Room: This project will create a multi-faith room that offers Sea-Tac Airport passengers and employees a quiet retreat for prayer and meditation at the Mezzanine level of the South Satellite.
8. Restroom Renewal/Replacement Concourse A, CTE: This project will renovate all men’s, women’s and family restrooms on Concourse A (6 sets), GML Ticketing level and GML Baggage Claim level as well as Central Terminal (2 sets).
V. Community & Environment
1. IWTP Improvements: Surface water runoff collected from the terminal and cargo areas is processed at the
Industrial Waste Water Treatment Plant (IWTP). The IWTP treats for fuels, oils grease, suspended solids and adjusts pH; it does not treat Biological Oxygen Demand (BOD) that is generated from airline operation deicing activities. The high BOD is conveyed to King County waste water treatment plant that the Airport discharges with a 5-year permit cycle. The last permit cycle, King County reduced the amount of BOD the Airport is allowed to discharge. This project, in conjunction with the IWTP controls project, will allow the IWTP to comply with future discharge limitations in conjunction with other efforts to reduce glycol at the Airport by allowing for exterior mixing and the addition of a 1-million-gallon storage tank.
2. IWTP Controls Conversion: Industrial Wastewater Treatment Plant (IWTP) utilizes a programable logic control (PLC) system which requires an outside consultant to reprogram and reconfigure whenever the PLC's are replaced or changed. The system was installed over fifteen years ago and the PLC's are obsolete, and replacements are unavailable. Regulatory flows and diversion of high BOD effluent is at risk due to this obsolescence. Control of the IWTP is not possible from the main central mechanical plant control room due to the PLC control system. This project will upgrade the controls to the Airport’s DDC system, which will allow control of the IWTP from the main central mechanical plant. This project will also ensure the Port is able to report to Midway or Valley View Sewer districts.
3. Apartment Sound Insulation (Pilot Project): This project will provide sound insulation for one pilot project for an apartment building within the noise remedy boundary. The Part 150 study recommended starting with the one pilot project to understand the unique circumstances that will be encountered both with tenants, owners and existing structural conditions. The goal of the project is to reduce aircraft noise to an interior noise level of 45 decibels or less through the addition of new sound rated windows, doors and ventilation. This project is a mitigation outcome of the Part 150 Study approved by the Port in 2014.
4. ATZ Residential Acquisition: The Approach Transition Zone (ATZ) is an area extending 2500 feet past
the Runway Protection Zone off the end of each runway. The 3rd runway’s ATZ were identified in the EIS
Cost# Description Estimate 2020 2021 2022 2023 20241 IWTP Improvements 27,000 93 1,827 1,813 6,937 8,207 18,878 2 IWTP Controls Conversion 10,600 143 987 2,712 4,648 2,109 10,600 3 Apartment Sound Insulation (Pilot Project) 2,300 - - 2,300 - - 2,300 4 ATZ Residential Acquisition 11,500 - - - 6,500 5,000 11,500 5 Places of Worship Sound Insulation (Pilot Project) 1,100 - - - - 1,100 1,100
TOTAL 52,500 236 2,815 6,825 18,085 16,416 44,378
Cash Flows (Figures in $000s) 2020 - 24 TOTAL
Port of Seattle 2020 Budget Aviation
IV-36
for the 3rd runway master plan update and was also approved in the subsequent Part 150 Studies. The residential housing in the north ATZ was acquired in 2009. The 2014 Part 150 Study further identified the South ATZ as an area for voluntary acquisition of residential parcels due to low flying aircraft and noise. There are approximately 16 single family homes and 6 apartment buildings that may be eligible for voluntary buyout in this area. Once acquired the land will be re-zoned to airport compatible (industrial/commercial).
5. Places of Worship Sound Insulation (Pilot Project): This project will provide sound insulation for one pilot program for a place of worship within the noise remedy boundary. The Part 150 Study recommended starting with the one pilot project to understand the unique circumstances that will be encountered with structural conditions. The goal of the project is to reduce aircraft noise to an interior noise level of 45dB or less through the addition of new sound rated windows, doors and ventilation. An avigation easement is required in exchange for sound insulation. The associated avigation easement provides air right protections for the Port. This project is a mitigation outcome of the Part 150 Study approved by the Port in 2014.
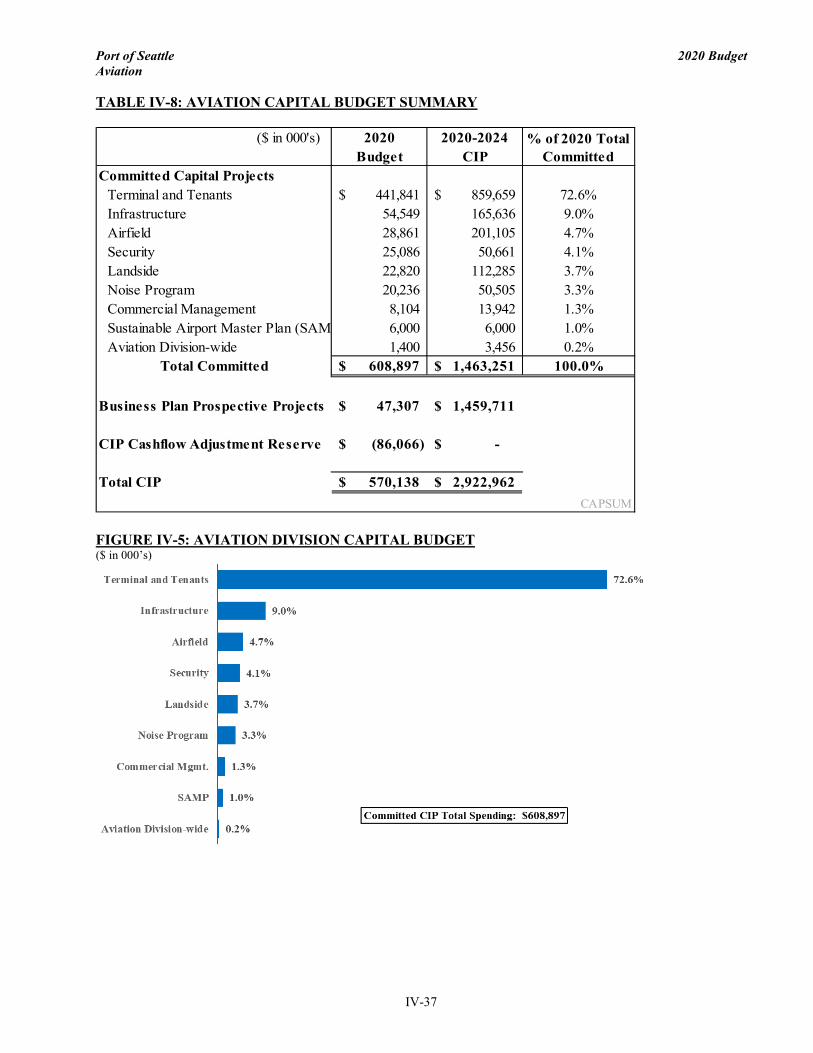
Port of Seattle 2020 Budget Aviation
IV-37
TABLE IV-8: AVIATION CAPITAL BUDGET SUMMARY
FIGURE IV-5: AVIATION DIVISION CAPITAL BUDGET ($ in 000’s)
($ in 000's) 2020 2020-2024Budget CIP
Committed Capital ProjectsTerminal and Tenants 441,841$ 859,659$ 72.6%Infrastructure 54,549 165,636 9.0%Airfield 28,861 201,105 4.7%Security 25,086 50,661 4.1%Landside 22,820 112,285 3.7%Noise Program 20,236 50,505 3.3%Commercial Management 8,104 13,942 1.3%Sustainable Airport Master Plan (SAM 6,000 6,000 1.0%Aviation Division-wide 1,400 3,456 0.2%
Total Committed 608,897$ 1,463,251$ 100.0%
Business Plan Prospective Projects 47,307$ 1,459,711$
CIP Cashflow Adjustment Reserve (86,066)$ -$
Total CIP 570,138$ 2,922,962$ CAPSUM
% of 2020 Total Committed

Port of Seattle 2020 Budget Aviation
IV-38
G. AVIATION DIVISION OPERATING STATISTICS TABLE IV-9: AVIATION DIVISION OPERATING STATISTICS
(1) (2) (3) Enplaned Total
Passengers Landed Weight Air CargoYear Number Growth Pounds Growth Metric tons Growth
2000 14,174 2.7% 23,051 -0.1% 456,920 2.9%2001 13,506 -4.7% 22,178 -3.8% 401,535 -12.1%2002 13,362 -1.1% 21,658 -2.3% 374,753 -6.7%2003 13,356 0.0% 20,790 -4.0% 351,418 -6.2%2004 14,364 7.6% 20,944 0.7% 347,517 -1.1%2005 14,632 1.9% 20,186 -3.6% 338,591 -2.6%2006 14,991 2.5% 20,362 0.9% 341,981 1.0%2007 15,661 4.5% 21,014 3.2% 319,013 -6.7%2008 16,085 2.7% 21,519 2.4% 290,205 -9.0%2009 15,610 -3.0% 20,388 -5.3% 270,142 -6.9%2010 15,773 1.0% 19,786 -3.0% 283,425 4.9%2011 16,397 4.0% 20,123 1.7% 279,893 -1.2%2012 16,597 1.2% 19,897 -1.1% 283,609 1.3%2013 17,376 4.7% 20,949 5.3% 292,709 3.2%2014 18,717 7.7% 22,505 7.4% 327,240 11.8%2015 21,109 12.8% 24,757 10.0% 332,636 1.6%2016 22,796 8.0% 27,118 9.5% 366,431 10.2%2017 23,416 2.7% 28,267 4.2% 425,856 16.2%2018 24,894 6.3% 30,109 6.5% 438,391 2.9%2019 Budget 25,394 2.0% 29,603 -1.7% 447,500 2.1%2019 Forecast 25,890 4.0% 30,326 0.7% 447,500 2.1%2020 Budget 26,667 3.0% 31,413 3.6% 456,450 2.0%
Compound Growth4.1% 3.0% 2.9%7.1% 7.3% 8.5%
Notes:(1) Passengers in thousands(2) Weight in thousands(3) In Metric Tons
2007 - 20182012 - 2018
V. MA
RIT
IME
V. MARITIME

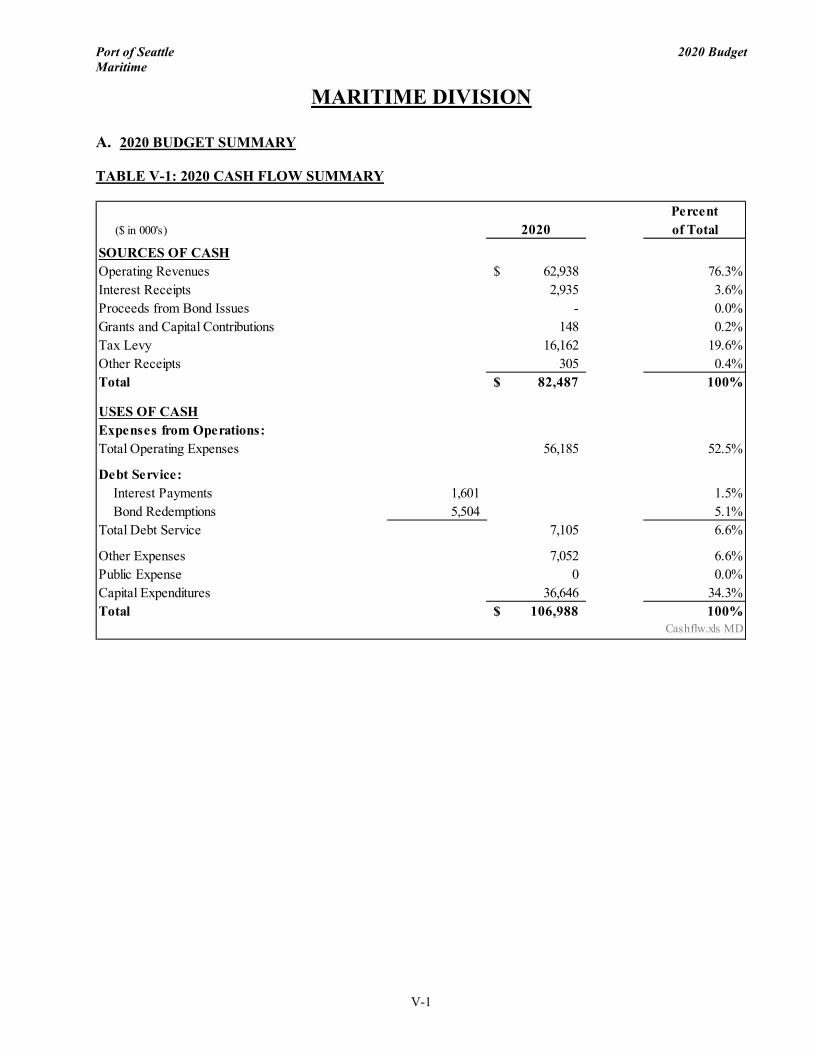
Port of Seattle 2020 Budget Maritime
V-1
MARITIME DIVISION
A. 2020 BUDGET SUMMARY TABLE V-1: 2020 CASH FLOW SUMMARY
Percent ($ in 000's) 2020 of Total
SOURCES OF CASHOperating Revenues 62,938$ 76.3%Interest Receipts 2,935 3.6%Proceeds from Bond Issues - 0.0%Grants and Capital Contributions 148 0.2%Tax Levy 16,162 19.6%Other Receipts 305 0.4%Total 82,487$ 100%
USES OF CASHExpenses from Operations:Total Operating Expenses 56,185 52.5%
Debt Service: Interest Payments 1,601 1.5% Bond Redemptions 5,504 5.1%Total Debt Service 7,105 6.6%
Other Expenses 7,052 6.6%Public Expense 0 0.0%Capital Expenditures 36,646 34.3%Total 106,988$ 100%
Cashflw.xls MD
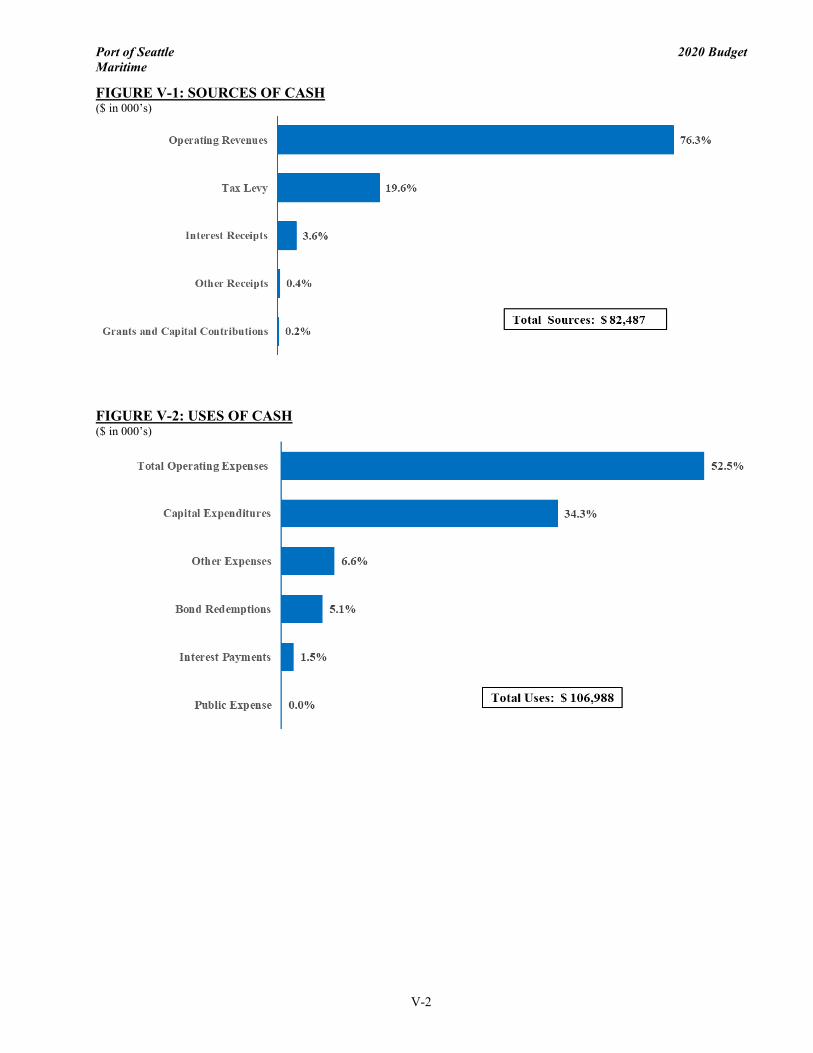
Port of Seattle 2020 Budget Maritime
V-2
FIGURE V-1: SOURCES OF CASH ($ in 000’s)
FIGURE V-2: USES OF CASH ($ in 000’s)
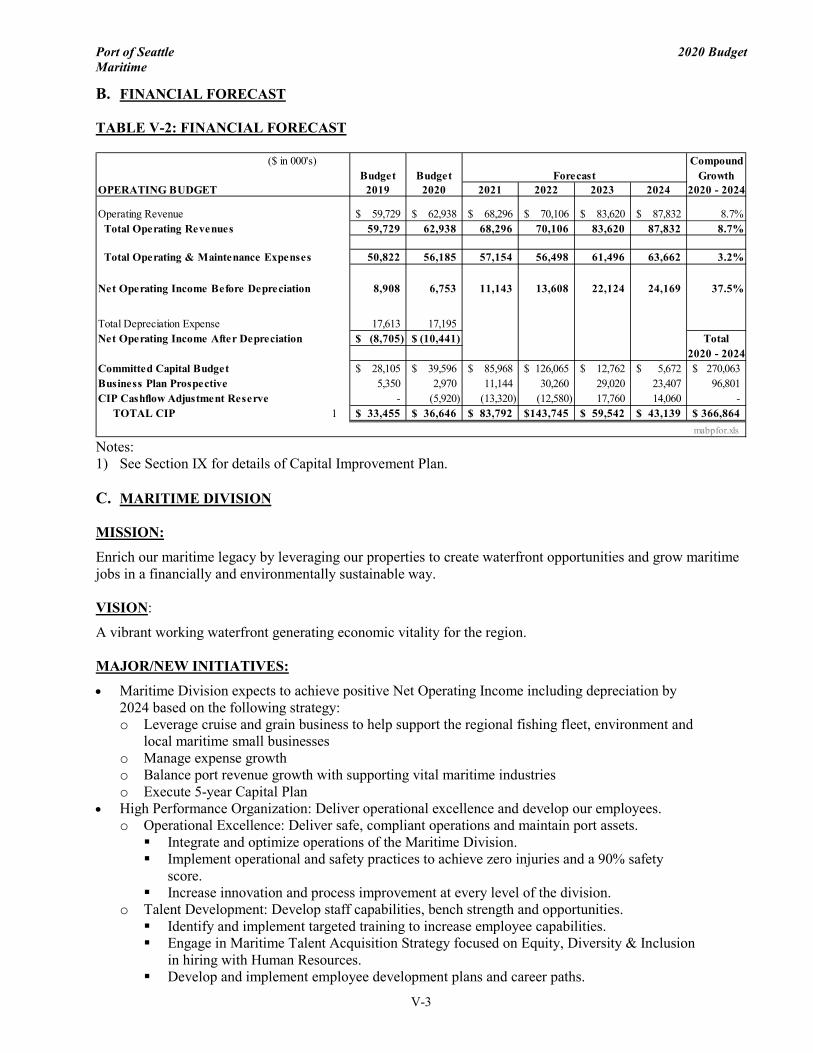
Port of Seattle 2020 Budget Maritime
V-3
B. FINANCIAL FORECAST TABLE V-2: FINANCIAL FORECAST
Notes: 1) See Section IX for details of Capital Improvement Plan. C. MARITIME DIVISION MISSION:
Enrich our maritime legacy by leveraging our properties to create waterfront opportunities and grow maritime jobs in a financially and environmentally sustainable way. VISION:
A vibrant working waterfront generating economic vitality for the region. MAJOR/NEW INITIATIVES:
• Maritime Division expects to achieve positive Net Operating Income including depreciation by 2024 based on the following strategy: o Leverage cruise and grain business to help support the regional fishing fleet, environment and
local maritime small businesses o Manage expense growth o Balance port revenue growth with supporting vital maritime industries o Execute 5-year Capital Plan
• High Performance Organization: Deliver operational excellence and develop our employees. o Operational Excellence: Deliver safe, compliant operations and maintain port assets. Integrate and optimize operations of the Maritime Division. Implement operational and safety practices to achieve zero injuries and a 90% safety
score. Increase innovation and process improvement at every level of the division.
o Talent Development: Develop staff capabilities, bench strength and opportunities. Identify and implement targeted training to increase employee capabilities. Engage in Maritime Talent Acquisition Strategy focused on Equity, Diversity & Inclusion
in hiring with Human Resources. Develop and implement employee development plans and career paths.
($ in 000's) CompoundBudget Budget Forecast Growth
OPERATING BUDGET 2019 2020 2021 2022 2023 2024 2020 - 2024
Operating Revenue 59,729$ 62,938$ 68,296$ 70,106$ 83,620$ 87,832$ 8.7% Total Operating Revenues 59,729 62,938 68,296 70,106 83,620 87,832 8.7%
Total Operating & Maintenance Expenses 50,822 56,185 57,154 56,498 61,496 63,662 3.2%
Net Operating Income Before Depreciation 8,908 6,753 11,143 13,608 22,124 24,169 37.5%
Total Depreciation Expense 17,613 17,195 Net Operating Income After Depreciation (8,705)$ (10,441)$ Total
2020 - 2024Committed Capital Budget 28,105$ 39,596$ 85,968$ 126,065$ 12,762$ 5,672$ 270,063$ Business Plan Prospective 5,350 2,970 11,144 30,260 29,020 23,407 96,801 CIP Cashflow Adjustment Reserve - (5,920) (13,320) (12,580) 17,760 14,060 - TOTAL CIP 1 33,455$ 36,646$ 83,792$ 143,745$ 59,542$ 43,139$ 366,864$
mabpfor.xls

Port of Seattle 2020 Budget Maritime
V-4
o Valued Communication: Provide information that is clear, concise and relevant. Leverage technology to improve quality and efficiency of communications. Develop and implement measures to improve Commission and public communications.
DIVISION DESCRIPTION: Maritime Division is comprised of several major business groups: Cruise Operations, Recreational Boating, Fishing and Operations, a Grain Terminal, and about half of the Seaport Real Estate portfolio. Additionally, the division includes service groups such as Maritime Marketing, Security, Marine Maintenance, Maritime Environmental, and Seaport Project Management. The Maritime Division and its facilities serve a diverse mix of year-round and seasonal activities. From April through October, Smith Cove Cruise Terminal and Bell Harbor Cruise Terminal serve as homeports for cruise ships headed to Alaska. From October through May, Fishermen’s Terminal and Terminal 91, serve as homeports for the North Pacific fishing fleet and factory trawlers. Throughout the year, recreational boats are served at Bell Harbor Marina, Harbor Island Marina, Salmon Bay Marina, and Shilshole Bay Marina – the latter two being home to vibrant liveaboard communities. The Maritime Division also operates the Maritime Industrial Center and leases Terminal 86, a fully automated grain terminal, along with other industrial properties connected with these maritime activities and businesses. INDUSTRY ASSESSMENT: Cruise
The global cruise market continues to grow with many lines increasing their focus in Asia and Australia. This market growth is supported by global fleet expansion with larger ships and new product innovations to meet the more sophisticated demands of consumers. There is significant growth in the demand for expedition cruising. The Alaskan cruise market remains strong with cruise lines deploying some of their best ships here in the Northwest. Seattle welcomed the Norwegian Joy and Royal Caribbean Ovation of the Seas in 2019. Fishing and Commercial Operations
The Alaska commercial fishing industry remains strong with the Alaska fisheries recognized as the most successfully managed in the world. With sustainable fisheries in the Bering Sea, Bristol Bay, and Gulf of Alaska fisheries, the commercial fishing industry that homeports in Seattle remains stable. Commercial fishing companies are revitalizing their fleets by building new boats to replace aging fishing vessels. Although Alaska ports are working to build better infrastructure to support the small boat fleets, Puget Sound continues to be very attractive for off season moorage for all sizes of commercial boats due to better weather conditions conducive to working on boats. It also provides an established parts supply and maintenance service network.
The industry continues to adapt to an evolving regulatory environment, fishing industry consolidation and more limited marine terminal options. The North American Emissions Control Area (ECA) requires more stringent emission reductions for ocean going vessels operating within coastal waters. This puts a higher burden of compliance on vessels transiting between Seattle and Alaska, when compared to vessels on transpacific voyages, because the entire voyage is within the ECA. In addition, ongoing consolidation of the commercial fishing fleet is driving changes in facilities and services to meet the needs of larger homeport operations. The availability of suitable and affordable marine terminals is growing increasingly scarce in the Northwest. Grain
Terminal operator/tenant, Louis Dreyfus Company, is projecting grain volumes to be about 16% lower in 2020 from 2019 budget due to the current political climate and tariffs that have been put in place.
Port of Seattle 2020 Budget Maritime
V-5
Maritime Habitat Initiatives
Demand for compensatory mitigation credits in the watershed, as well as Natural Resource Damage (NRD) credits in the Lower Duwamish River, is increasing due to tighter environmental regulations and pending claims. Large-scale projects in the Duwamish River and Elliott Bay may also create new demand. The Port has submitted a proposal to federal agencies to develop a habitat mitigation bank. There is competition in the mitigation market; however, the Port is in a good position given our property ownership and our track record in developing successful restoration projects. Industrial Properties
The Puget Sound Industrial Market is expected to continue to grow but at slightly slower pace in 2019 after a strong recovery in the past couple of years. As of the third quarter of 2019, total regional vacancy rate has fallen below 5%. Recreational Boating
The Recreational Boating industry continues to face such challenges as: the high cost of boats and boating, attracting younger generations, emerging environmental regulatory restrictions, and reduced access to water. Boating is primarily a middle-class lifestyle as 71.5% of American boat owners have a household income less than $100,000. Boaters are demanding upscale moorage facilities including high-end amenities, finishes, and architectural details with more customization, automation and personalization. Industry wide, the largest increases in revenues continue to be from in-water rentals (kayaks, paddle boards, etc.), boat rentals, restaurants, leased slips, fuel, and boat sales. BUSINESS ASSESSMENT: Cruise
Revenue passenger counts are expected to increase again in 2020 due to larger vessels. The number of vessels is expected to rise about 5% as well. Based on continued surveys, the level of satisfaction for Seattle cruise passengers exceeds industry standards. Passengers surveyed express a strong desire to return to Seattle again in the future. The number of pre and post cruise passenger visits is steadily increasing in the region and the number of guests visiting Seattle for the day before heading to the airport increased with the success of the Port Valet Program. Fishing and Commercial Operations
Commercial fishing vessel moorage demand remains steady with annual occupancy over 80%, even with the majority of customers leaving to work in Alaska for various parts of the year. The small commercial fishing boats (less than 40 feet) market is most at risk due to the expense of operating a boat, owners retiring, and boats relocating. This loss of commercial fishing moorage business is somewhat offset by monthly moorage for smaller recreational vessels which do not require year round moorage. The commercial property occupancy at both Fishermen’s Terminal and the Maritime Industrial Center is 97%, slightly better than the industry wide average long-term occupancy rate of 96%. The main focus throughout 2020 will be to retain existing tenants and cultivate new revenue streams. Continuous efforts will be made in offering excellent customer service, increasing rental rate levels on renewals and accommodating space reductions, and expansions while improving space for quality tenants. Dock and moorage assets at Fishermen’s Terminal are all fairly new with the exception of the Northwest Dock, which is the oldest dock and now approaching thirty years old. Available shore power systems for the various sizes of boats set us apart from our competition.
Port of Seattle 2020 Budget Maritime
V-6
The financial outlook is projected to be stable as staff continues to look at Fishermen’s Terminal in an entrepreneurial fashion for revenue generating opportunities. Revenue gains are expected from an increased number of recreational vessels, while the recapitalization of the large vessel fishing fleet replaced old vessels with new ones, not necessarily adding vessels to their respective fleets. Moorage rates at the terminal for fishing and commercial vessels lead the market when compared to other Puget Sound public ports. Recreational vessel rates at the terminal are at market as compared to local marinas. Fishing fleet homeport demand is expected to remain stable in 2020. Fishing, tug, and barge companies are making significant investments in vessel improvements and system upgrades. Other marine industrial moorage is expected to remain stable with moderate growth over time. Grain
The Pier 86 Grain Terminal handles corn and soy beans from the upper Midwest states. Despite its age, the terminal is still competitive for handling these grain commodities. Volumes will likely decrease given the ongoing tariff impact on export volumes. Maritime Habitat Initiatives
Interest in Port-provided compensatory mitigation and natural resource damage (NRD) credits is expected to continue to grow as both public and private maritime properties are redeveloped and NRD claims are pursued. Industrial Properties
Consistent with the regional figures discussed under the Industry Assessment, the forecast for the Seattle Close-In industrial market is for lease rates to remain steady, with slight upticks in rents possible. Demand for seaport industrial properties is expected to remain consistent. The Maritime Industrial Portfolio Management staff will continue to manage the industrial portfolio for the purpose of maximizing revenue by balancing rental rates (demand) with fluctuating supply to match the performance of the local Seattle Close-In market. Shilshole Bay Marina The monthly moorage occupancy at Shilshole Bay Marina remains strong and is budgeted to meet or exceed 95% for 2020. Due to a large waitlist, the opportunity to increase occupancy rates is centered on quicker slip turnaround times. Moorage rates remain competitive within the Seattle market, and will lead the market with a 5% across the board rate increase. Continued success is attributed to the marina’s location, docks with good maneuverability and wide navigation channels, a strong and active liveaboard community, and strong customer focus. The marina waitlist has lengthened, and we currently have approximately 500 individuals waiting for slips. Most of those on the waitlist are waiting for a liveaboard slip. We are currently at our maximum live-aboard slip capacity of 350. Liveaboard demand continues to escalate due to extremely high housing costs in the Seattle area. Over the next five years, several marina improvements are planned or underway, including replacement of 1960’s era restroom/shower/laundry buildings, repairs to utilities, and parking lot pavement replacement. The commercial property occupancy rate at Shilshole Bay Marina is currently at 100%. The focus throughout 2020 will be to retain existing tenants, continue to grow guest moorage and complete the restroom construction project.
Port of Seattle 2020 Budget Maritime
V-7
CHALLENGES AND OPPORTUNITIES: Cruise Challenges • Controlling the cost of building, maintaining and operating terminals. • Port cruise facilities not meeting future demand for berth space and larger ships. • Increase in environmental regulations for cruise operations in Washington and Alaska. • Managing traffic congestion at Terminal 91. Cruise Opportunities • Increased demand for Expedition Cruising and U.S. homeports. • Customer interest in bringing larger cruise ships to homeport in Seattle. • New larger ships with upgrades to current infrastructure and new cruise berth. Fishing and Commercial Challenges • Commercial Fishing is a highly regulated industry. Environmental regulations threaten commercial
fisheries which is a response to manage and preserve commercially harvested aquatic species. • Capturing the new business from the revitalized large commercial boat fleet is essential to remain the
homeport of the North Pacific Fishing Fleet. • Controlling the cost of building, maintaining and operating terminals. • Future planning and capital investment in properties with aging infrastructure. • Adapting facilities and operations to meet dynamic regulatory environment. • Attracting new maritime customers and vessel homeport bases within changing land use environment.
Fishing and Commercial Opportunities • Retaining business from commercial fishing customers who are recapitalizing their fleets. • Continuing to grow recreational vessel fleet during off-season, as space allows. • Promoting legislation to incentivise continued growth within the fishing and maritime industry. • Develop a “Blue Economy” framework accomplished by embracing new Washington State Maritime
Cluster organizations; digitalizing and decarbonizing maritime machinery, systems and platforms; embracing Workforce Development and Innovation; and the continued growth and promotion of our Working Waterfront.
• Upgrades to current infrastructure to accommodate larger fishing vessels, Berths 6 & 8 at Terminal 91. • Attracting vessel homeport bases for seafood, tug and barge fleets.
Port of Seattle 2020 Budget Maritime
V-8
Grain Challenges and Opportunities • Grain volume can fluctuate significantly from year to year due to weather and market conditions. • Revenues from the grain terminal include a minimum annual guarantee and otherwise are subject to upside
and downside depending on volumes. • Grain terminal impacted severely by tariff increases, specifically on soybeans. Maritime Habitat Initiatives Challenges and Opportunities • Construction costs associated with habitat projects in the urban maritime environment are escalating.
However, these costs affect both the Port and our competition. • NRD credit demand is directly correlated to the rate at which the Trustee Council generates settlements.
While the size of the NRD market is potentially substantial, to date the Trustees have proceeded with settlements very slowly.
• The Port has significant land assets in the Duwamish which are suitable for restoration purposes but more limited in the middle and upper watershed.
• The capacity for restoration projects to generate carbon sequestration benefits is beginning to be realized, though the accounting methodology is complex.
Recreational Marina Challenges • Maintaining assets responsibly within the Port system while still controlling costs. • Building the Shilshole multi-use service buildings (restrooms/showers/laundry) in a way that will meet the
long term needs of our customers. • Finding new revenue streams. • Balancing Port initiatives with operational work. • Adapting facilities and operations to meet dynamic regulatory environment. • Providing developmental opportunities to staff without reducing operational functionality.
Recreational Marina Opportunities • Exploring new lines of business that were previously not within the Port’s strategy, such as dry stack boat
storage. • Leveraging new technologies to create efficiencies, such as marina software update and handheld
technology. • Increasing moorage revenue due to current high demand. • Leveraging partnerships to create opportunities with organizations such as the Ballard High School
Maritime Academy, Seattle Maritime Academy, The Adventuress, and the Northwest Marine Trade Association.

Port of Seattle 2020 Budget Maritime
V-9
D. OPERATING BUDGET SUMMARY Background
From a financial standpoint, the Maritime Division’s activities are:
• Implementation of programs that directly support the Port’s initiatives to double the regional economic impacts of our Cruise and Fishing businesses. These activities can generate revenue for the Port.
• Managing other businesses in the portfolio to provide stewardship of public assets for taxpayers. These activities generate revenue through operations and expense through maintenance, repair and renovation.
Assumptions
The 2020 Maritime Division Budget is based on the following assumptions:
• Cruise forecasts 1.3 million passengers, an increase of 8.8% from the 2019 budget, due to larger ship sizes and more sailings.
• Grain volume is budgeted at 3.0 million metric tons based on forecast from tenant, a 16.1% decrease from 2019 budget.
• Recreational Marina occupancy rate of 95%, consistent with 2019 Budget and year end forecast. • Fishing and Commercial average occupancy rate of 86%, consistent with 2019 budget. • Commercial Building Properties target an occupancy of 95% or greater at year-end 2020, consistent with
current results. • Salaries and benefits are forecasted using the 2020 budget guidelines of a 3.9% increase to salaries and
specified benefit fixed amount/percentage. • Utility rates are based on applicable rate changes posted by Seattle Public Utility, Seattle City Light, Puget
Sound Energy and other utility vendors, as applicable. Operating Revenue
• Overall Maritime Division Revenues are budgeted to increase by $3.2 million or 5.4%. • Cruise revenues will increase by 17.2% due to increase in passenger volumes as well as year over year rate
increases in passenger fees and dockage. • Bulk Terminals decrease is based on feedback from Louis Dreyfus at Terminal 86. • Maritime Portfolio Management revenue increase of 1% is driven by CPI. • Fishing and Operations revenues decrease in 2020 due to the final year of service for the 700 ft Ocean
Phoenix. • Recreational Boating revenue is budgeted to increase by 4.4% due to stable occupancy and increased rates.
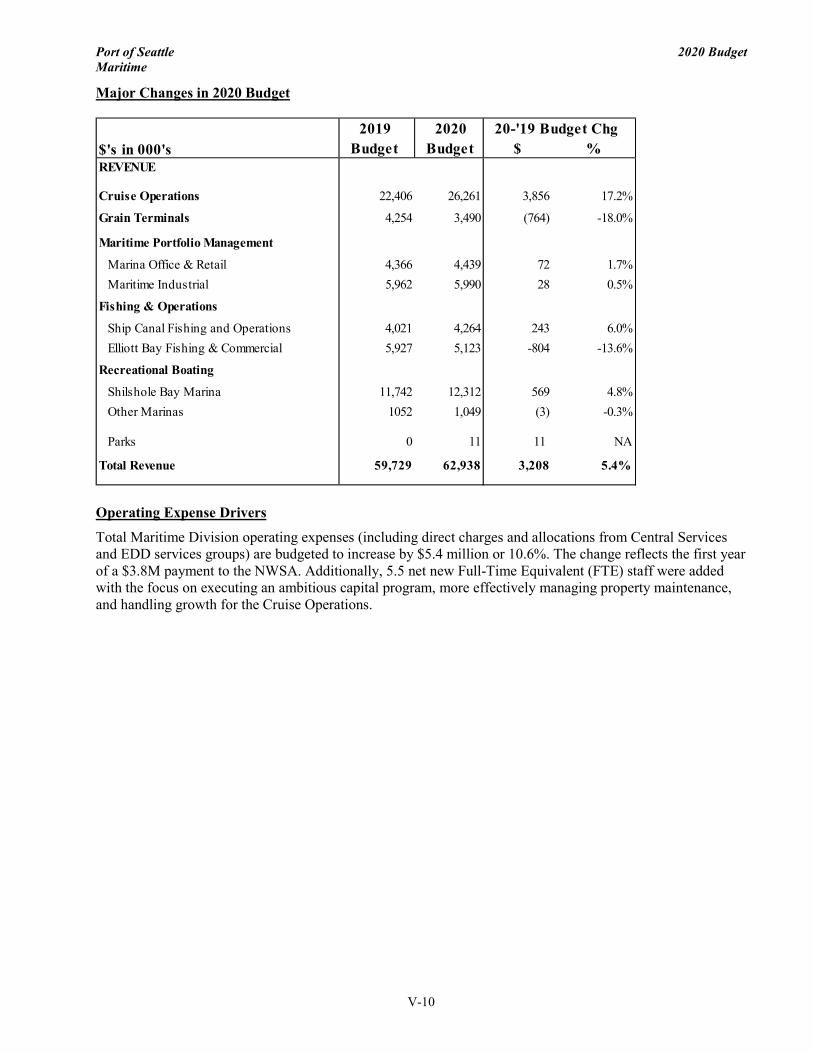
Port of Seattle 2020 Budget Maritime
V-10
Major Changes in 2020 Budget
Operating Expense Drivers
Total Maritime Division operating expenses (including direct charges and allocations from Central Services and EDD services groups) are budgeted to increase by $5.4 million or 10.6%. The change reflects the first year of a $3.8M payment to the NWSA. Additionally, 5.5 net new Full-Time Equivalent (FTE) staff were added with the focus on executing an ambitious capital program, more effectively managing property maintenance, and handling growth for the Cruise Operations.
2019 2020Budget Budget $ %
REVENUE
Cruise Operations 22,406 26,261 3,856 17.2%
Grain Terminals 4,254 3,490 (764) -18.0%
Maritime Portfolio Management
Marina Office & Retail 4,366 4,439 72 1.7%Maritime Industrial 5,962 5,990 28 0.5%
Fishing & Operations
Ship Canal Fishing and Operations 4,021 4,264 243 6.0%Elliott Bay Fishing & Commercial 5,927 5,123 -804 -13.6%
Recreational Boating
Shilshole Bay Marina 11,742 12,312 569 4.8%Other Marinas 1052 1,049 (3) -0.3%
Parks 0 11 11 NA
Total Revenue 59,729 62,938 3,208 5.4%
$'s in 000's20-'19 Budget Chg

Port of Seattle 2020 Budget Maritime
V-11
TABLE V-3: REVENUE BY ACCOUNT
Notes: 1) Revenue does not include allocations from other divisions. FIGURE V-3: MARITIME DIVISION REVENUE BY ACCOUNT ($ in 000’s)
(in 000's) % Change2018 2019 2020 2020 Bud -
REVENUE BY ACCOUNT Notes Actual Budget Budget 2019 BudOperating RevenueDckg, Whrfg, Serv/Facility, Passenger Fee 7,541$ 9,458$ 7,601$ -19.6%Equipment Rental 306 271 317 17.3%Berthage & Moorage 11,075 15,421 15,476 0.4%Parking Revenue 16 24 24 0.0%Revenue From Sale of Utilities 1,428 1,573 1,414 -10.1%Property Rental Revenue 24,635 21,981 26,881 22.3%Other Revenues 2,300 1,421 1,368 -3.8%Total Operating Revenue 1 47,300$ 50,148$ 53,082$ 5.9%
marbud.xls mardata
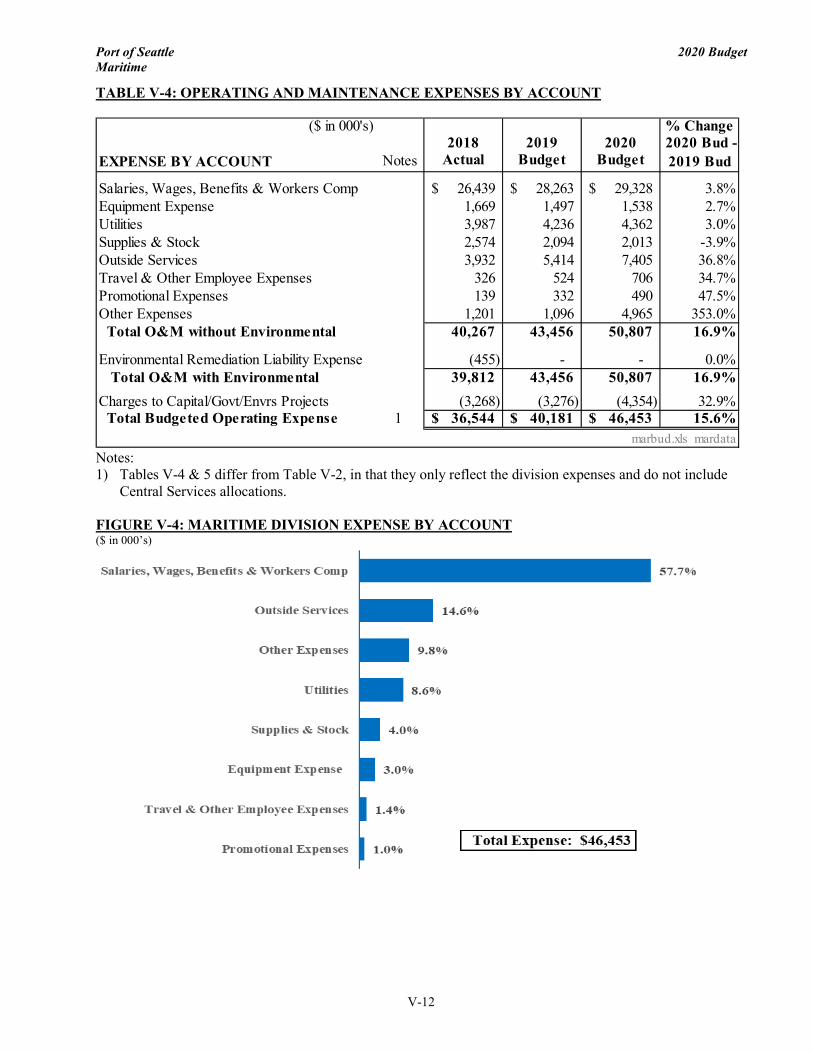
Port of Seattle 2020 Budget Maritime
V-12
TABLE V-4: OPERATING AND MAINTENANCE EXPENSES BY ACCOUNT
Notes: 1) Tables V-4 & 5 differ from Table V-2, in that they only reflect the division expenses and do not include
Central Services allocations. FIGURE V-4: MARITIME DIVISION EXPENSE BY ACCOUNT ($ in 000’s)
($ in 000's) % Change2018 2019 2020 2020 Bud -
EXPENSE BY ACCOUNT Notes Actual Budget Budget 2019 Bud
Salaries, Wages, Benefits & Workers Comp 26,439$ 28,263$ 29,328$ 3.8%Equipment Expense 1,669 1,497 1,538 2.7%Utilities 3,987 4,236 4,362 3.0%Supplies & Stock 2,574 2,094 2,013 -3.9%Outside Services 3,932 5,414 7,405 36.8%Travel & Other Employee Expenses 326 524 706 34.7%Promotional Expenses 139 332 490 47.5%Other Expenses 1,201 1,096 4,965 353.0% Total O&M without Environmental 40,267 43,456 50,807 16.9%
Environmental Remediation Liability Expense (455) - - 0.0% Total O&M with Environmental 39,812 43,456 50,807 16.9%Charges to Capital/Govt/Envrs Projects (3,268) (3,276) (4,354) 32.9% Total Budgeted Operating Expense 1 36,544$ 40,181$ 46,453$ 15.6%
marbud.xls mardata

Port of Seattle 2020 Budget Maritime
V-13
TABLE V-5: MARITIME REVENUE AND EXPENSE BY BUSINESS GROUP/DEPARTMENT
Notes: 1) Expenses do not include Central Services allocations.
($ in 000's) % Change2018 2019 2020 2020 Bud -
BY BUSINESS GROUP/DEPARTMENT Notes Actual Budget Budget 2019 BudREVENUEFishing & Operations 9,853$ 9,858$ 9,274$ -5.9%Recreational Boating 11,947 12,791 13,333 4.2%Cruise Operations 18,695 22,313 26,161 17.2%Bulk Terminals 5,167 4,252 3,484 -18.1%Marine Maintenance 1,638 935 829 -11.3%Maritime Security - - - Total Operating Revenue 47,300 50,148 53,082 5.9%
EXPENSES BEFORE CHARGES TO CAP/GOVT/ENVRS PROJECTSBusiness Groups:Fishing & Operations 4,960 5,240 5,239 0.0%Recreational Boating 3,341 3,836 3,788 -1.3%Cruise Operations 3,145 3,499 6,920 97.8%Maritime Security 65 1,295 2,811 117.1%Bulk Terminals 124 61 43 -28.9% Total Business Group Expense 11,634 13,931 18,802 35.0%Service Depts.:Maritime Marketing 278 1,031 1,193 15.7%Seaport PMG 2,584 2,909 3,922 34.8%Marine Maintenance 24,968 24,850 26,282 5.8%Other Maritime Administration 441 560 931 66.2%Maritime Contingency - (521) Parks 161 175 199 13.6%Maritime Habitat Initiatives 199 - - Maritime Environmental Remediation Liability Expense (455) - - Maritime Capital to Expense - - - Total Services Expense 28,177 29,525 32,005 8.4%
Total Expenses Before Charges to Cap/Govt /Envrs Projects 39,811 43,456 50,807 16.9%
CHARGES TO CAPITAL/ GOVT /ENVRS PROJECTS (3,268) (3,276) (4,354) 32.9%
OPERATING & MAINTENANCE EXPENSEBusiness Groups:Fishing & Operations 4,960 5,240 5,239 0.0%Recreational Boating 3,341 3,836 3,788 -1.3%Cruise Operations 2,903 3,499 6,920 97.8%Maritime Security 65 1,295 2,811 117.1%Bulk Terminals 124 61 43 -28.9% Total Business Group Expense 11,393 13,931 18,802 35.0%Service Depts.:Maritime Marketing 278 1,031 1,193 15.7%Seaport PMG 1,052 1,096 1,041 -5.0%Marine Maintenance 23,518 23,387 24,809 6.1%Other Maritime Administration 441 560 931 66.2%Maritime Contingency - (521) Parks 161 175 199 13.6%Maritime Habitat Initiatives 156 - - Maritime Environmental Remediation Liability Expense (455) - - Maritime Capital to Expense - - - Total Services Expense 25,151 26,249 27,651 5.3%
Total Operating Expense 1 36,544$ 40,181$ 46,453$ 15.6%marbud.xls.marreorg
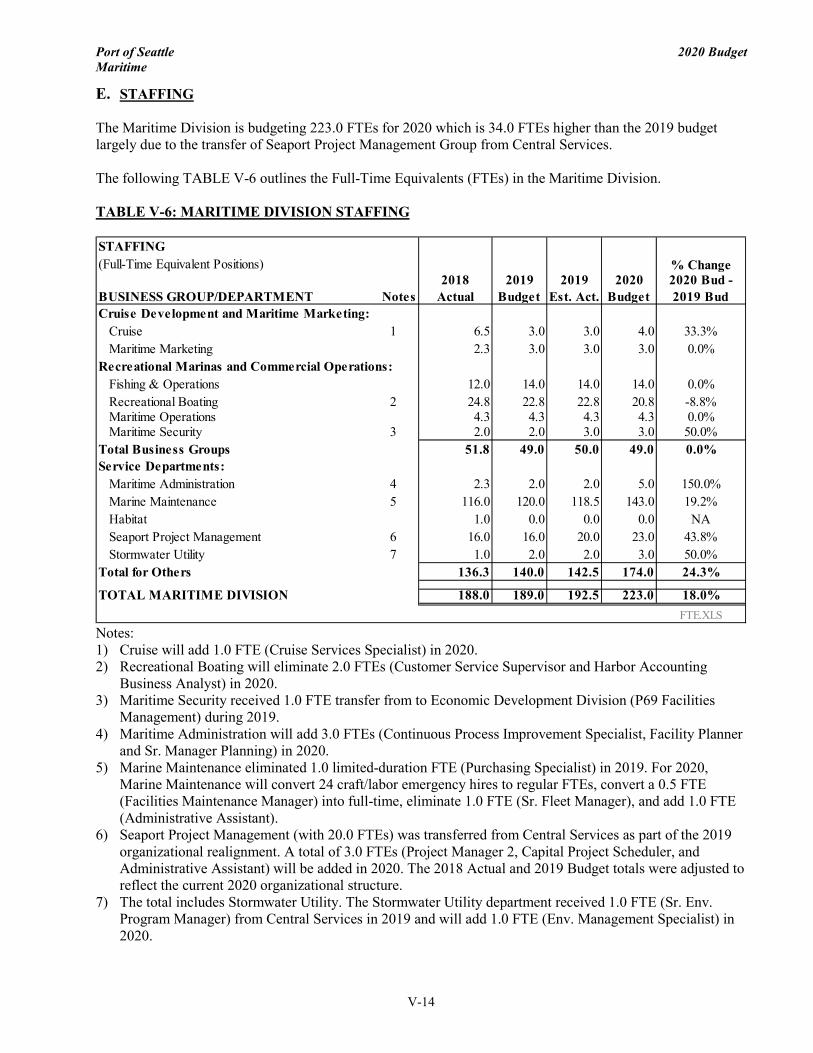
Port of Seattle 2020 Budget Maritime
V-14
E. STAFFING The Maritime Division is budgeting 223.0 FTEs for 2020 which is 34.0 FTEs higher than the 2019 budget largely due to the transfer of Seaport Project Management Group from Central Services. The following TABLE V-6 outlines the Full-Time Equivalents (FTEs) in the Maritime Division. TABLE V-6: MARITIME DIVISION STAFFING
Notes: 1) Cruise will add 1.0 FTE (Cruise Services Specialist) in 2020. 2) Recreational Boating will eliminate 2.0 FTEs (Customer Service Supervisor and Harbor Accounting
Business Analyst) in 2020. 3) Maritime Security received 1.0 FTE transfer from to Economic Development Division (P69 Facilities
Management) during 2019. 4) Maritime Administration will add 3.0 FTEs (Continuous Process Improvement Specialist, Facility Planner
and Sr. Manager Planning) in 2020. 5) Marine Maintenance eliminated 1.0 limited-duration FTE (Purchasing Specialist) in 2019. For 2020,
Marine Maintenance will convert 24 craft/labor emergency hires to regular FTEs, convert a 0.5 FTE (Facilities Maintenance Manager) into full-time, eliminate 1.0 FTE (Sr. Fleet Manager), and add 1.0 FTE (Administrative Assistant).
6) Seaport Project Management (with 20.0 FTEs) was transferred from Central Services as part of the 2019 organizational realignment. A total of 3.0 FTEs (Project Manager 2, Capital Project Scheduler, and Administrative Assistant) will be added in 2020. The 2018 Actual and 2019 Budget totals were adjusted to reflect the current 2020 organizational structure.
7) The total includes Stormwater Utility. The Stormwater Utility department received 1.0 FTE (Sr. Env. Program Manager) from Central Services in 2019 and will add 1.0 FTE (Env. Management Specialist) in 2020.
STAFFING(Full-Time Equivalent Positions) % Change
2018 2019 2019 2020 2020 Bud -BUSINESS GROUP/DEPARTMENT Notes Actual Budget Est. Act. Budget 2019 BudCruise Development and Maritime Marketing: Cruise 1 6.5 3.0 3.0 4.0 33.3% Maritime Marketing 2.3 3.0 3.0 3.0 0.0%Recreational Marinas and Commercial Operations: Fishing & Operations 12.0 14.0 14.0 14.0 0.0% Recreational Boating 2 24.8 22.8 22.8 20.8 -8.8% Maritime Operations 4.3 4.3 4.3 4.3 0.0% Maritime Security 3 2.0 2.0 3.0 3.0 50.0%Total Business Groups 51.8 49.0 50.0 49.0 0.0%Service Departments: Maritime Administration 4 2.3 2.0 2.0 5.0 150.0% Marine Maintenance 5 116.0 120.0 118.5 143.0 19.2% Habitat 1.0 0.0 0.0 0.0 NA Seaport Project Management 6 16.0 16.0 20.0 23.0 43.8% Stormwater Utility 7 1.0 2.0 2.0 3.0 50.0%Total for Others 136.3 140.0 142.5 174.0 24.3%
TOTAL MARITIME DIVISION 188.0 189.0 192.5 223.0 18.0%FTE.XLS
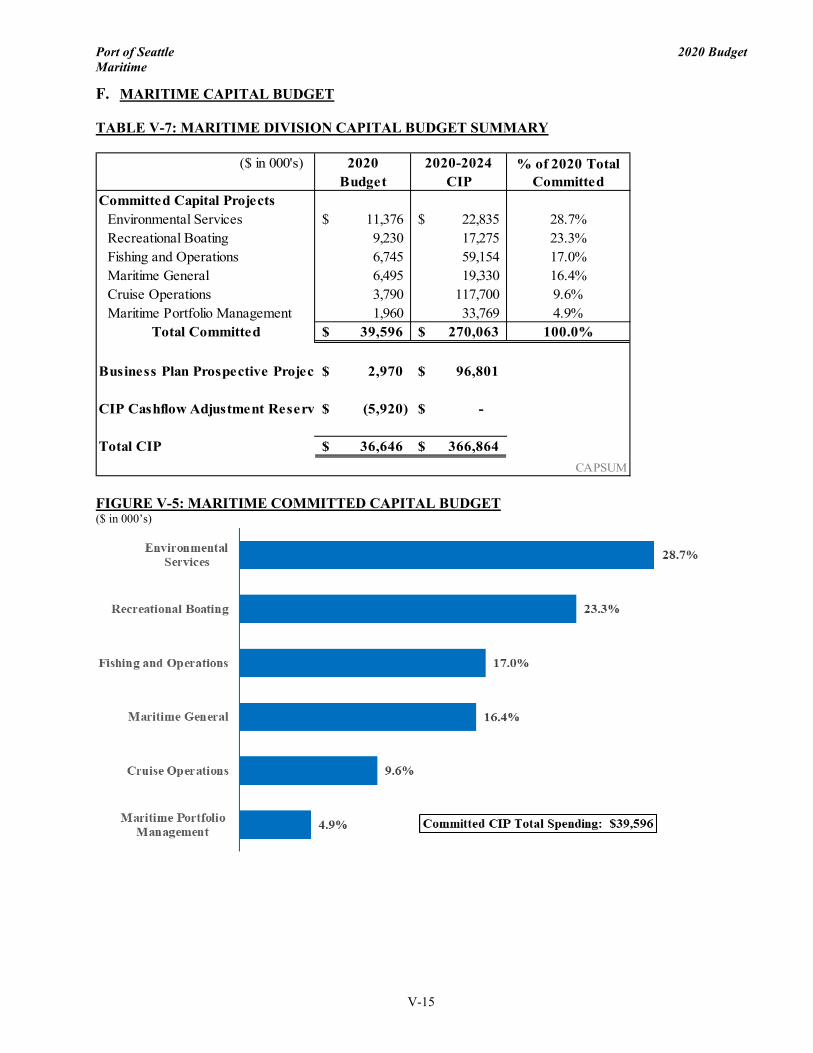
Port of Seattle 2020 Budget Maritime
V-15
F. MARITIME CAPITAL BUDGET
TABLE V-7: MARITIME DIVISION CAPITAL BUDGET SUMMARY
FIGURE V-5: MARITIME COMMITTED CAPITAL BUDGET ($ in 000’s)
($ in 000's) 2020 2020-2024Budget CIP
Committed Capital ProjectsEnvironmental Services 11,376$ 22,835$ 28.7%Recreational Boating 9,230 17,275 23.3%Fishing and Operations 6,745 59,154 17.0%Maritime General 6,495 19,330 16.4%Cruise Operations 3,790 117,700 9.6%Maritime Portfolio Management 1,960 33,769 4.9%
Total Committed 39,596$ 270,063$ 100.0%
Business Plan Prospective Project 2,970$ 96,801$
CIP Cashflow Adjustment Reserv (5,920)$ -$
Total CIP 36,646$ 366,864$ CAPSUM
% of 2020 Total Committed

Port of Seattle 2020 Budget Maritime
V-16
G. MARITIME DIVISION OPERATING STATISTICS TABLE V-8: MARITIME DIVISION OPERATING STATISTICS
Cruise CruiseShip Sailings Passengers Grain
Year Number Growth Number Growth Metric tons Growth
2003 99 344,922 3,107,732 2004 148 49.5% 562,308 63.0% 3,898,491 25.4%2005 169 14.2% 686,978 22.2% 5,049,107 29.5%2006 196 16.0% 751,074 9.3% 5,901,821 16.9%2007 190 -3.1% 780,593 3.9% 5,333,018 -9.6%2008 210 10.5% 886,039 13.5% 6,400,778 20.0%2009 218 3.8% 875,433 -1.2% 5,512,164 -13.9%2010 223 2.3% 931,698 6.4% 5,491,360 -0.4%2011 195 -12.6% 885,949 -4.9% 5,026,868 -8.5%2012 202 3.6% 935,000 5.5% 3,161,013 -37.1%2013 187 -7.4% 870,994 -6.8% 1,351,417 -57.2%2014 179 -4.3% 823,780 -5.4% 3,618,489 167.8%2015 192 7.3% 895,055 8.7% 3,778,476 4.4%2016 203 5.7% 983,539 9.9% 4,389,089 16.2%2017 218 7.4% 1,071,594 9.0% 4,362,603 -0.6%2018 216 -0.9% 1,114,888 4.0% 4,378,796 0.4%2019 Budget 211 -2.3% 1,203,317 7.9% 3,580,000 -18.2%2019 Forecast 212 -2.8% 1,204,064 12.4% 3,488,267 -20.3%2020 Budget 223 5.2% 1,309,013 8.7% 3,004,000 -13.9%
VI. E
CO
NO
MIC
DE
VE
LOP
ME
NT
VI. ECONOMIC DEVELOPMENT


Port of Seattle 2020 Budget Economic Development
VI-1
ECONOMIC DEVELOPMENT DIVISION
A. 2020 BUDGET SUMMARY TABLE VI-1: 2020 CASHFLOW SUMMARY
Percent ($ in 000's) 2020 of Total
SOURCES OF CASHOperating Revenues 19,110$ 58.4%Interest Receipts 174 0.5%Proceeds from Bond Issues - 0.0%Grants and Capital Contributions - 0.0%Tax Levy 13,375 40.9%Other Receipts 64 0.2%Total 32,723$ 100%
USES OF CASHExpenses from Operations:Total Operating Expenses 29,025 66.7%
Debt Service: Interest Payments 560 1.3% Bond Redemptions 0 0.0%Total Debt Service 560 1.3%
Other Expenses 180 0.4%Public Expense - 0.0%Capital Expenditures 13,721 31.6%Total 43,487$ 100%
Cashflow.xls ED
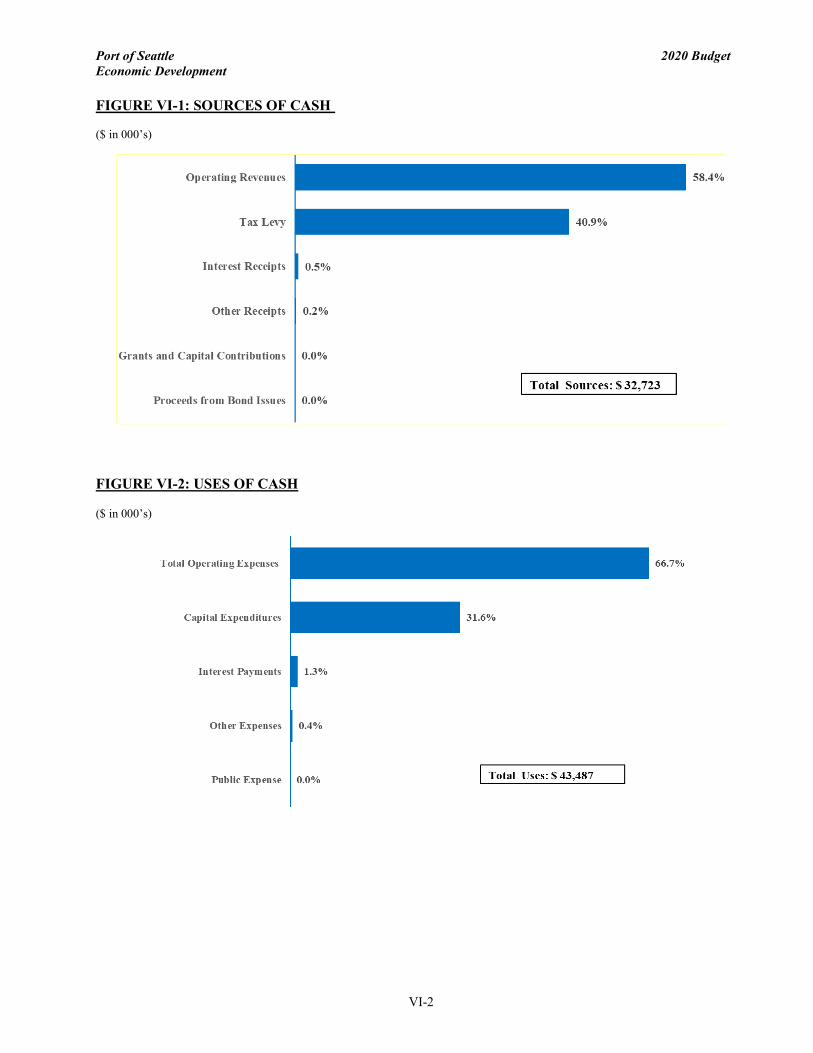
Port of Seattle 2020 Budget Economic Development
VI-2
FIGURE VI-1: SOURCES OF CASH ($ in 000’s)
FIGURE VI-2: USES OF CASH
($ in 000’s)

Port of Seattle 2020 Budget Economic Development
VI-3
B. FINANCIAL FORECAST TABLE VI-2: FINANCIAL FORECAST
Notes: 1) See Section IX for details of Capital Improvement Plan. C. ECONOMIC DEVELOPMENT DIVISION MISSION:
Create quality jobs in King County and across the state by advancing trade and commerce, promoting manufacturing and maritime growth, and stimulating equitable economic development. VISION:
The Port’s Economic Development Division will help meet the regional need for aviation and maritime services, while increasing economic opportunities in all communities we serve. The Economic Development Division will implement initiatives that drive regional economic vitality while advancing equity, diversity and inclusion: • Develop and promote Port business opportunities for Women and Minority Business Enterprises
(WMBE), Veteran, LGBTQ, and other disadvantaged businesses; • Increase international and domestic visitor traffic to the region through targeted tourism promotion; • Develop real estate projects that support the Port’s key industries and create quality jobs; • Manage port properties effectively (including the Port’s Pier 69 Headquarters); and • Build partnerships that advance innovation and economic development.
($ in 000's) CompoundBudget Budget Forecast Growth
OPERATING BUDGET Notes 2019 2020 2021 2022 2023 2024 2020 - 2024
Operating Revenue 19,725$ 19,110$ 21,498$ 22,301$ 24,074$ 25,778$ 7.8% Total Operating Revenues 19,725 19,110 21,498 22,301 24,074 25,778 7.8%
Total Operating Expense 30,445 29,025 29,739 30,831 31,941 32,758 3.1%
Net Operating Income Before Depreciation (10,720) (9,915) (8,241) (8,530) (7,867) (6,981) 8.4%
Total Depreciation Expense 3,784 3,351 Net Operating Income After Depreciation (14,504)$ (13,267)$
Total2020 - 2024
Committed Capital Budget 6,046$ 14,586$ 10,811$ 15,120$ 15,050$ 6,350$ 61,917$ Business Plan Prospective 2,175 1,215 1,686 4,051 1,685 2,905 11,542CIP Cashflow Adjustment Reserve 0 (2,080) (4,680) (4,420) 6,240 4,940 0 TOTAL CIP 1 8,221$ 13,721$ 7,817$ 14,751$ 22,975$ 14,195$ 73,459$
edbpfor.xlsx
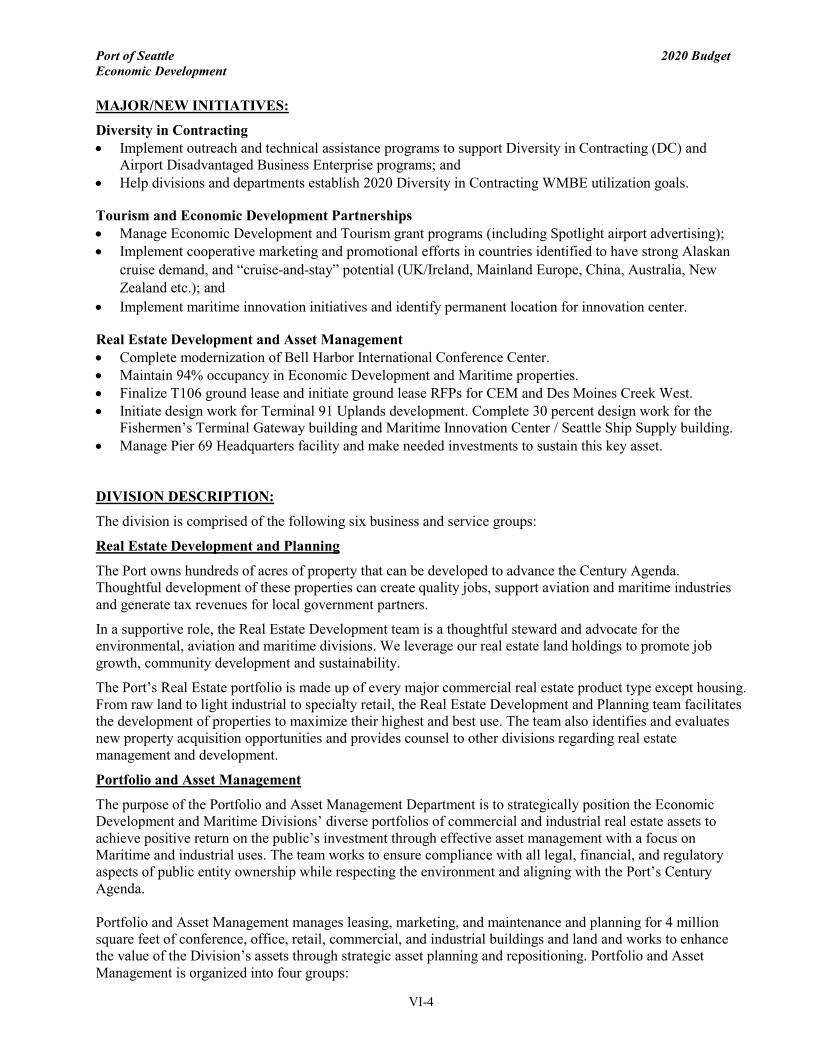
Port of Seattle 2020 Budget Economic Development
VI-4
MAJOR/NEW INITIATIVES:
Diversity in Contracting • Implement outreach and technical assistance programs to support Diversity in Contracting (DC) and
Airport Disadvantaged Business Enterprise programs; and • Help divisions and departments establish 2020 Diversity in Contracting WMBE utilization goals.
Tourism and Economic Development Partnerships • Manage Economic Development and Tourism grant programs (including Spotlight airport advertising); • Implement cooperative marketing and promotional efforts in countries identified to have strong Alaskan
cruise demand, and “cruise-and-stay” potential (UK/Ireland, Mainland Europe, China, Australia, New Zealand etc.); and
• Implement maritime innovation initiatives and identify permanent location for innovation center.
Real Estate Development and Asset Management • Complete modernization of Bell Harbor International Conference Center. • Maintain 94% occupancy in Economic Development and Maritime properties. • Finalize T106 ground lease and initiate ground lease RFPs for CEM and Des Moines Creek West. • Initiate design work for Terminal 91 Uplands development. Complete 30 percent design work for the
Fishermen’s Terminal Gateway building and Maritime Innovation Center / Seattle Ship Supply building. • Manage Pier 69 Headquarters facility and make needed investments to sustain this key asset.
DIVISION DESCRIPTION:
The division is comprised of the following six business and service groups:
Real Estate Development and Planning
The Port owns hundreds of acres of property that can be developed to advance the Century Agenda. Thoughtful development of these properties can create quality jobs, support aviation and maritime industries and generate tax revenues for local government partners.
In a supportive role, the Real Estate Development team is a thoughtful steward and advocate for the environmental, aviation and maritime divisions. We leverage our real estate land holdings to promote job growth, community development and sustainability.
The Port’s Real Estate portfolio is made up of every major commercial real estate product type except housing. From raw land to light industrial to specialty retail, the Real Estate Development and Planning team facilitates the development of properties to maximize their highest and best use. The team also identifies and evaluates new property acquisition opportunities and provides counsel to other divisions regarding real estate management and development.
Portfolio and Asset Management
The purpose of the Portfolio and Asset Management Department is to strategically position the Economic Development and Maritime Divisions’ diverse portfolios of commercial and industrial real estate assets to achieve positive return on the public’s investment through effective asset management with a focus on Maritime and industrial uses. The team works to ensure compliance with all legal, financial, and regulatory aspects of public entity ownership while respecting the environment and aligning with the Port’s Century Agenda. Portfolio and Asset Management manages leasing, marketing, and maintenance and planning for 4 million square feet of conference, office, retail, commercial, and industrial buildings and land and works to enhance the value of the Division’s assets through strategic asset planning and repositioning. Portfolio and Asset Management is organized into four groups:
Port of Seattle 2020 Budget Economic Development
VI-5
Central Harbor Management Group Central Harbor Management Group is responsible for Division assets located from Terminal 91 to Pier 2/CEM in West Seattle. This responsibility includes various retail, office and industrial properties, and the conference and event centers.
Lease Administration and Utilities Group Lease Administration and Utilities Group processes and administers all agreements for both the Economic Development and Maritime divisions. This responsibility includes monitoring for compliance with all agreement terms including insurance, surety, lease provisions, and amendments. The team also reads meters, processes payments, and bills customers for over 255 utility meters.
Foreign Trade Zone Foreign Trade Zone manages and markets the use of the Port’s Foreign Trade Zone for the benefit of businesses that import/export goods from/to other countries.
Maritime Real Estate Portfolio Asset Management
Our team also manages the leasing, marketing, maintenance, and planning for Maritime Division landside real estate assets located from Terminal 91 to Shilshole Bay Marina and also includes Terminal 106. This management includes retail, office, industrial, warehouse, and land assets.
Diversity in Contracting
The Diversity in Contracting (DC) department drives equitable economic development by supporting Women and Minority Business Enterprises (WMBE) and Disadvantaged Business Enterprises (DBE). The DC staff conducts outreach and training to ensure that WMBE and DBE firms are aware and capable of responding to Port contracting opportunities. DC staff also helps Port divisions/departments set annual WMBE utilization goals and helps identify WMBE utilization opportunities and requirements for Port consulting, architectural and engineering and construction projects. Tourism Development
The Tourism department focuses on increasing the economic value of travel for King County and Washington State by leveraging the Port of Seattle’s visitor assets (cruise terminals and Sea-Tac International Airport) as integral travel gateways. Tourism Development operates two unique programs that enable statewide organizations to share their tourism destination marketing messages. Awards (grants) from the Tourism Marketing Support Program and the Sea-Tac Airport Spotlight Program afford Destination Marketing Organizations (DMOs), cities, and Chambers of Commerce (non-profits), the opportunity to reach domestic and international non-resident travelers to promote their unique destinations and events. The department also partners with Visit Seattle, the Washington Tourism Alliance (WTA), and fellow destination marketing organizations (DMOs) to promote domestic and international leisure travel. With the increase in Sea-Tac Airport nonstop international flights and the strong growth of the Alaska cruise trade from Seattle, the Port’s tourism team supports cruise tourism development in key identified overseas markets (UK, Ireland, Mainland Europe, Australia, New Zealand, and China) to increase cruise related travel expenditures in the Pacific Northwest. Pier 69 Facilities Management
The purchase and redevelopment of the Pier 69 site in the late 1980s has proven to be a visionary move that served as a catalyst for the major redevelopment which has since occurred along the central waterfront. Pier 69 is a unique facility and a great example of adaptive reuse; it was constructed in 1931 by American Can Company and was originally used as a salmon cannery warehouse. The vision of the project team transformed
Port of Seattle 2020 Budget Economic Development
VI-6
the neglected, massive concrete structure into the Class A office building that has now served the Port and our working waterfront tenants for more than a quarter-century.
Pier 69 Facilities Management ensures the functionality of the Pier 69 site by integrating people, place, process, and technology. Our mission is to provide, operate, and maintain a safe, secure, comfortable, effective, and efficient workplace.
Facility management services include asset management, space management and planning, energy management, reception services, event coordination, mailroom/shipping/receiving, and administration of the site Commute Trip Reduction (CTR) program. Economic Development Administration The managing director, the economic development manager, and the assistant to the managing director provide general support to the division. This team also implements the Economic Development Partnership program and the Port’s maritime innovation initiatives.
Economic Development Partnership Program In 2016, the Port of Seattle established an economic development fund for King County cities to advance regional economic growth and the Port’s Century Agenda. The Port’s goals with the grant program are to facilitate growth in business, jobs and economic activity in participating municipalities. At the same time, the partnerships this program establishes will help advance the Port’s strategic “Century Agenda” objectives by advancing business development, job creation, and community revitalization region-wide. Maritime Innovation Initiative The division helps lead the Port’s efforts to advance maritime innovation and establish a Maritime Innovation Center at Fishermen’s Terminal. The economic development team coordinates innovation center advisory committee meetings, fact-finding trips, and works closely with other government, education, and private partners to support and stimulate innovation that helps sustain the region’s maritime industry.
Port of Seattle 2020 Budget Economic Development
VI-7
BUSINESS ASSESSMENT: REAL ESTATE DEVELOPMENT AND PLANNING
Market Analysis and Assessment:
The vacancy rate in the industrial submarket in Seattle and surrounding areas is relatively low at 2.5% and the real estate market maintained the momentum seen in 2018, so vacancy continues to be near all-time historic lows. Despite a slight softening in vacancy and absorption, tenant activity is stable, and the majority of the industrial markets demonstrated rent growth. (JLL, Trends and Insights, Research industrial market statistics Q1 2019)This stability is a key driver for further industrial development. Research also shows E-commerce contributes 40% of industrial absorption in 2018 (Shaw Lupton, [email protected], Juan Arias, [email protected], March 29, 2018). The Puget Sound regional industrial market sector continues to see a high level of leasing activity, and rents are seeing new peaks. Vacancy rates will continue to remain low. Construction activity is still robust, with a very active pipeline of new projects with multi-story warehouse design being the latest trend to capitalize on the last mile distribution market in SODO, Interbay and other close in areas. Economic forecasts point to a healthy regional economy and a strong regional industrial real estate market. For Port properties that fall within the various local clusters, rents are stable and industrial vacancy rates within those clusters are closer to 5%. PORTFOLIO AND ASSET MANAGEMENT
Leasing
Local Market Analysis and Assessment:
The occupancy level of our Commercial and Industrial Properties is currently at 94% compared to our specific submarket benchmarks which have occupancy of 93-96%. We expect leasing activity to remain stable with current economic conditions. There will be 64,000+ SF of space turning over in 2020 and we expect to retain 90% of those tenants and backfill the rest to reach our occupancy goal. At the same time, individual properties on the Central Waterfront and Duwamish will continue to wrestle with local challenges (e.g. transportation infrastructure projects) while increasing occupancy and maintaining market rates. Conference and Event Centers
Market Analysis and Assessment:
Bell Harbor International Conference Center (BHICC) has been a major success over the past twenty-three years. It has helped anchor Seattle’s waterfront revitalization, generated significant international interest in the region, contributed significant economic impacts to the region and become an asset that contributes to the Port’s bottom line.
The regional conference marketplace is rapidly evolving and multiple new and compelling event spaces are being introduced in Seattle, Bellevue and other nearby communities. Though our facility is iconic and enjoys the distinct advantage of a showcase position on the central waterfront, it is showing its age and the proposed refresh will help us maintain our high performance in the hospitality market. The proposed modernization project should resolve this issue.
Bell Harbor occupies a niche position in the local market as a mid-sized flexible event space. It is smaller and more intimate than the Washington State Convention Center (WSSC) and Century Link Field Event Center but larger than most large hotel conference venues. BHICC does not directly compete with the WSCC and, in fact, fulfills an otherwise missing component for mid-sized flexible event space in the market.

Port of Seattle 2020 Budget Economic Development
VI-8
In the long run, the upcoming WSCC will create new opportunities for increased, large conventions that benefit Bell Harbor. In the short-term, the new hotel rooms created recently in anticipation of the WSCC expansion have arrived a little early and often are attached to meeting space that can easily be offered as a loss leader for selling hotel rooms.
Our niche is still strong and the ongoing transformation of the waterfront will only increase the distinction and desirability of our waterfront location and amenities. PIER 69 FACILITIES MANAGEMENT
Market Analysis and Assessment:
Our Pier 69 headquarters has now been in operation for more than a quarter-century. The beautiful location and facility have served the Port well, but the building is showing its age and will require significant investment over its second 25 years of service life.
A plan was developed in 2019 to guide the renewal, replacement, and modernization of major building systems through 2042. The plan outlines $20-25 million of activity through 2027. An additional $20-25 million of activity is programmed from 2028 through 2042. This ongoing investment will be required to maintain the effectiveness, efficiency, and sustainability of our Class A office. DIVERSITY IN CONTRACTING
Market Analysis and Assessment:
The Economic Development Division helped create the new Diversity in Contracting (DC) program last year in an effort to expand equity, diversity, and inclusion within the Port and across the region. More specifically, address contracting disparities which includes low WMBE utilization results (e.g. .3% African American, .5% Hispanic, 1.1% Asian). While the Port is making progress on WMBE utilization, it still falls below performance at other public agencies. The Port will need to continue with robust outreach efforts combined with effective training for current and potential WMBE contracting partners. Diversity in Contracting is a core program for advancing the 2020 Port-wide Goal of expanding equity, diversity and inclusion across the region. DC also drives regional and statewide economic vitality and inclusion by growing businesses owned by people from diverse backgrounds, increasing economic activity to historically under-utilized firms, and providing opportunities to WMBE firms that in-turn support communities through new hires and other benefitable economic activity. The Port is becoming a leader in advancing inclusive procurement policies that support all firms within the Puget Sound Region. TOURISM DEVELOPMENT
Market Analysis and Assessment:
With the Port of Seattle’s visitor assets (cruise terminals and Sea-Tac International Airport) providing integral gateways for continued expansion of travel in the Pacific Northwest, Tourism’s efforts will focus to increase the economic value of travel for King County and Washington state. Cruise Line International Association (CLIA) projects 30 million cruise travelers globally for 2019. Over the next eight years, an additional 124 new ship builds are on order. By 2027, CLIA estimates the global cruise visitor number will increase by 25% reaching 40 million cruisers. For 2020, Norwegian Cruise Line group has announced plans to implement a fourth ship (NCL Sun) to the Seattle Alaska market. In addition to the Port of Seattle’s planned build-out of a fourth terminal at Pier 46, communities in Alaska (Ketchikan, Sitka, Skagway,
Port of Seattle 2020 Budget Economic Development
VI-9
and Icy Strait Point) are in the process of planning or building additional docking infrastructure – all of which has the potential to support the growth of the Alaska cruise market. International air travel to Seattle and Washington will continue to increase and the international cruise market is an important component of that growth. Seattle and King County visitor research indicates the international traveler represents 16% of the total visitors spend; although, they are only 7.1% of the actual total visitor volume to the area. • International air traffic thru Seattle increased 5.8% in 2018. Additional international destinations and
carriers are scheduled for startup in 2019 and the International Arrivals Facility will open in 2020. • Cruise traffic from Europe had the largest percentage of increase (17.1%) over any other international
markets. • CLIA states that Australia leads the established cruise markets in penetration rates. 5.8% of the population
took an ocean cruise in 2018 (one in every 17 Australians). • According to Bloomberg News, the estimated number of Chinese cruise travelers will reach 4.5 million by
2020. With the continued growth of the Alaska cruise trade and Sea-Tac Airport international gateways, Tourism will focus our efforts to impact and educate the travel trade and travel media on the merits of selling Alaska cruises and recommending extension of stays to explore the Pacific Northwest, to increase leisure air travel to Washington. We will continue to work with fellow destination marketing organizations and attractions to market all of Washington as well as impact and address our strengths, weaknesses, opportunities and threats. ECONOMIC DEVELOPMENT
Economic Development Partnership Program
Market Analysis and Assessment:
The Port of Seattle Economic Development Partnership Program funding is distinctive in the region in both its approach and mission, compared to other federal, state, and local grant programs. The program provides seed funding to spur economic development projects that integrate each city’s economic development strategy and support the Port’s Century Agenda goals and 2020 Port-wide Goals. In recent years, cities have undertaken multi-city, collaborative projects that address regional goals and needs. For example, the cities of Kirkland, Bellevue, and Redmond formed a partnership called the Innovation Triangle dedicated to promoting East King County as an international destination for technology companies. The Economic Development Partnership Program remains a popular program with cities in King County, allowing Port Commissioners to show Port of Seattle economic support in all corners of King County. A program evaluation report published at the end of 2018 found that cities often use the funds provided by the Port of Seattle as seed money for projects that would not have been possible otherwise. Some cities found that the projects undertaken with Port of Seattle funds generated follow-up ideas, or the projects received enough traction to continue regardless of future Port grant funding. Many smaller cities said that the increased economic development capacity was a huge benefit of the program.
Port of Seattle 2020 Budget Economic Development
VI-10
Connection to 2020 Port-Wide Goals
The Port of Seattle Economic Development Partnership Program advances regional economic vitality and builds positive partnerships with King County Cities. The program’s funding often supports innovative efforts that are outside the general economic development activities for cities and encourage cities to invest resources into economic development through the program matching requirement. In 2018 alone, cities expended $657,000 in matching funds and resources to support regional economic development – a roughly $100,000 increase over the minimum threshold that cities said they would allocate to program projects.
The program also positions the Port of Seattle as a key partner for King County cities by providing a flexible funding source for cities to implement economic development activities. Typically, external grant funding for local economic development projects is scarce and city economic development departments have trouble securing local funding.
CHALLENGES AND OPPORTUNITIES: REAL ESTATE DEVELOPMENT AND PLANNING Strengths: • Market timing coupled with a continuum of stable industrial development demand. • Strategically located properties along major waterways, near airport and industrial cargo transportation
channels. • Pro-development Port commission determined to add jobs, with a focused mission to improve our region
by strategically leveraging our diverse real estate holdings. Weaknesses: • Port properties are usually encumbered with wetlands, brownfields, and other development limitations that
require creative approaches towards redevelopment. • Long development review timelines and related permitting complexities. Opportunities: • Acquiring property to protect industrial lands and to potentially support Duwamish economic/equitable
development initiatives. • Developing aviation properties to create economic and workforce development opportunities for residents
in South King County. • Redeveloping Terminal 106 into a significant new property that supports the region’s manufacturing and
logistics industries. • Fishermen's Terminal redevelopment and the Terminal 91 Uplands development light industrial
development projects can support maritime manufacturers and suppliers within the Interbay Manufacturing Industrial Center.
• Longer term development of a Maritime innovation center development at Fishermen’s Terminal can help support and drive industry innovation.
Threats: • Market factors, environmental regulations, and an unprecedented wave of commercial real estate
technology innovations that change the way traditional assets are operated. • Political polarization and global uncertainty. • The real estate cycle in Seattle has been particularly long and as a result it is harder to predict when and if
a slow down will impact the Port’s industrial development projects.
Port of Seattle 2020 Budget Economic Development
VI-11
PORTFOLIO AND ASSET MANAGEMENT
Commercial Properties
Strengths: • Properties located in desireable areas for maritime and industrial users. • Experienced Management team familiar with assets, market and tenants. • Real Estate Managers have created a Leasing Task Team to work collaboratively across all portfolios to
address existing and anticipated vacancies.
Weaknesses: • Compliance with legal, financial, and regulatory aspects of public entity ownership of real property can
result in having a less competitive edge vis-a-vis the private sector in the commercial real estate market. Contracting procedures, security deposit requirements, and limited flexibility in negotiations are constraints. These constraints might be reflected in lease rates toward the lower end of the market range and/or lengthier vacancies through missed opportunities at some properties.
• Locations of several properties within the portfolio provide only limited amenities such as public transportation, shopping, dining, etc.
• Improving operating efficiencies in properties with aging infrastructure and implementing energy conservation improvements will require forward planning and capital investment.
Opportunities: • The current real estate market remains relatively stable and is expected to continue to provide new
opportunities for additional revenue.
Threats: • Potential economic downturn may affect growth of local businesses’ need for space. • There continues to be concern with local businesses that will be affected by the ongoing Viaduct Removal
and Alaskan Way Street Improvement Projects. The perception in the market is that the disruption from the ongoing work construction currently underway on the waterfront will continue to negatively affect businesses along the entire waterfront for the next several years.
Conference and Event Centers
Strengths: • Iconic, niche facility in desirable locations. • Assertive yet prudent management team with deep experience in the market. • Cruise Terminal Expansion: The recent expansion of the Cruise related spaces at 66 creates a renewed
opportunity to (continue to) market the larger spaces to an ever-expanding audience. • Continued Investment: The rebuilding of the Seattle Waterfront over the next few years presents a distinct
opportunity to leverage our historical financial success and iconic heritage. Updating and refreshing Bell Harbor International Conference and Event Center and the World Trade Center Seattle will prepare us for the renewed regional and international interest.
Weaknesses: • Aging facilities: Updating and refurbishing aging infrastructure will require forward planning and
continued capital investment. • Schedule conflicts: Cruise related activity, which should receive priority from an economic impact
perspective, often conflicts with selling and scheduling events. As cruise activity increases there is a corresponding negative impact on event sales.
• Parking capacity at Pier 91, Smith Cove Conference and Event Center is very limited and inconveniently located. Also, public transportation options to the site are limited.
Port of Seattle 2020 Budget Economic Development
VI-12
Opportunities: • Hotel room supply: With the significant increase in guest room supply, average room rates have dropped
by approximately $7 year to date. This provides an opportunity to bring conference and event business to the area which has been rate sensitive in the past. Leveraging partnerships with close by hotel properties has proven successful in some market segments which have previously skipped Seattle due to higher prices.
• Strong economy and growing appreciation of Seattle as a destination, hospitality businesses will thrive. • Planned expansion of WS Convention Center will bring increased, larger conventions that feed smaller
venues like Bell Harbor. Threats: • Hotel room supply: Seattle is an increasingly popular destination and limited hotel room supply decreases
the ability to leverage good rates for out of town conference business. This challenge has been off-set in the near-term (2019-2022) with the significant increase in guest room supply which has recently come on line in anticipation of the need for more inventory to support the Washington State Convention Center expansion now under construction and slated to open Summer of 2022 with the first signed contract in November of 2022.
• Competitive market: The expanding array of new supply now presents a different challenge; there are approximately 23 number of new “event venues” in the city/region offering event related space. To make matters worse, they will offer that event space at extreme discounts to fill their guest room inventory until the supply/demand balance is back on track.
• Refurbished event spaces: Additionally, there are several regional event facilities offering more space, flexibility, and modern amenities. A number of event space venues have recently opened or been remodeled (the Motif, the (Marriott) Renaissance Hotel, the Westin Hotel, the Chihuly Garden and Glass, the Conference Center at the Washington State Convention Center, and Museum of History and Industry).
• Increasingly short lead times in the market: There is a continuing trend toward “just-in-time” event planning and the shortening of lead time for events creates challenges in forecasting and logistics.
PIER 69 FACILITIES MANAGEMENT Strengths: • The scenic waterfront location and elegant office space facilitate employee recruitment, retention,
wellness, and engagement. • The site has been well maintained and does not have a significant backlog of deferred maintenance. • The site is energy efficient when benchmarked with similar building types. Weaknesses: • The operation, maintenance, renewal and replacement of aging building systems will require significant
investment over the next two decades. • Uncertainty regarding the service life of the concrete pier which is now 89 years old. Opportunities: • A recent appraisal indicated a $100M value for the site. • Creative thinking and partnerships to improve last-mile transit options. Threats: • There are limited last-mile transit options for commuters. • The site is located in a liquefaction zone and would likely suffer severe damage during a major earthquake. • Traffic congestion related to population growth may increase the difficulty of commuting and make the
site less attractive.

Port of Seattle 2020 Budget Economic Development
VI-13
DIVERSITY IN CONTRACTING
Strengths: • New program with new community WMBE excitement for future Port opportunities. • Changes within current Port contracting language which includes setting direct WMBE aspirational goals
and inclusion plans as part of the solicitation. • Deliberate and strategic outreach and marketing of opportunities in partnerships with WMBE community
organizations. • U.S.DOT’s Federal Disadvantage Business Enterprise program (DBE) provisions are very specific
towards WMBE’s utilization. Weaknesses: • Specific set-aside contracting for WMBE businesses only are still constrained by current state contracting
laws (I-200) which may impact maximizing Port WMBE results. Opportunities: • Collecting, tracking, and reporting of ethnicity information as part of the DC reports. • Expanding training programs for WMBE and DBE businesses interested in contracting with the Port. • Leveraging limited Small Works provisions (RCW) to improve upon WMBE participation. • Expanded media, social networks, and promotion of DC program. • Support the expansion of WMBE businesses in fields lacking diversity. Challenges: • Accurate collection, tracking, and reporting of participation by ethnicity in Port business opportunities. • How to determine transparent, fair, and most effective changes to procurement policy and processes to
create more opportunities for Minority, Woman, Disadvantage Business Enterprise, and Small Business Enterprise firms.
• Reduce internal perceived barriers towards WMBE businesses (i.e. “they can’t perform”, “they are not big enough”, “this is specialized work”, “too risky”, “cost more”).
• Setting advanced WMBE goals for construction is difficult without historical utilization data.
TOURISM DEVELOPMENT
Strengths:
• The Port’s capital improvements (International Arrivals Facility, North Satellite, a fourth cruise terminal) create opportunities for increased tourism visitation.
• The Tourism department’s effort on trade and media familiarization tours with Visit Seattle, the Washington Tourism Alliance and statewide destination marketing organizations reinforces the Port of Seattle’s role as major air and sea gateway for Washington.
• Our Tourism Marketing Support and Advertising Spotlight programs have reinforced the Ports perception as a positive team player and leader promoting all of Washington.
• Like most of the USA, Washington State is generally perceived as a safe destination for international travelers.
Port of Seattle 2020 Budget Economic Development
VI-14
Weaknesses:
• The ability to process agreements for the Tourism Marketing Support Program in a timely fashion has hampered implementation of projects.
• Communications between POS departments can continue improve, thereby enabling Tourism to develop comprehensive marketing strategies.
Opportunities: • CLIA’s 2018 Consumer Survey revealed nearly 80% of all cruisers prefer to book a cruise via a travel
consultant. Because of the complexity in consumer cruise travel decision making, Tourism will target efforts to impact and educate the cruise related sales specialists, cruise tour operators and travel media by building on the “cruise and stay program” and investing in joint marketing promotions. These efforts are targeted to reach important travel influencers. Targeted markets include UK, Ireland, Mainland Europe, Australia and New Zealand.
• The Tourism Marketing Support Program and Airport Spotlight Program will continue to offer smaller destination marketing organizations and attractions throughout Washington the opportunity to impact travelers utilizing the Port’s visitor gateways (cruise terminals and Sea-Tac International Airport).
• Like most of the USA, Washington State and the Pacific Northwest are generally perceived as a safe destination for international travelers.
Threats: • Destinations along the west coast are intently keen upon obtaining home porting and port of calls for their
destinations. Specifically, Anchorage, Vancouver, Astoria, San Francisco, Los Angeles and San Diego are going to be diligent in attempting to obtain a portion of the growing Alaska trade.
• Hotel availability and pricing in Seattle is challenging despite the addition of new properties. • Fluctuating international exchange rates and the health of United States and global economies can
negatively impact tourism and travel numbers. • International travel restrictions such as lengthy visa application processes and countries identifying the
USA as an inappropriate or unsafe destination can severely impact visitation. • The transient, homeless and addiction situation can pose a perceived safety issue by visitors experiencing
Seattle and select locations in King County. • Washington State’s national and international tourism marketing efforts are woefully underfunded and
well below neighboring states’ funding levels. • Washington’s perceived brand and the brand marketing approach is lacking.
ECONOMIC DEVELOPMENT
Economic Development Partnership Program
Strengths:
• Grants help advance regional economic vitality. “The Port of Seattle grant program has been invaluable to cities to invest in local and regional partnerships,” according to a program evaluation report completed in late 2018.
• Spurs productive regional partnerships. The program has allowed cities to connect with other cities in the region and create partnerships that can be leveraged for future initiatives and pooling of resources allowing cities to offer services they wouldn’t be able to be funded alone.
• Provides niche funding for business assistance, retention, and recruitment projects that are expected to: o Promote regional economic diversification; o Promote entrepreneurship and small business growth; o Attract foreign investment; o Diversify local rural and urban economies;
Port of Seattle 2020 Budget Economic Development
VI-15
o Recapture spending within the city; o Support development of local supply chains; and o Ultimately create jobs and increase economic activity.
Weaknesses:
• The program funding formula does not allow the Port to provide additional funding support to high-impact economic development projects or projects that could significantly support key Port of Seattle priorities like the 2020 Port-wide Goals.
Opportunities:
• Continue to streamline contracting and grant administration processes. • Work to better assess and highlight impacts from the Economic Development Partnership Program. Challenges/ Threats:
• It is challenging for cities to measure outcomes on a short-term basis. Many projects undertaken with Port of Seattle grant funds have long-term objectives, which are hard to measure in terms of immediate return on investment.
• Cities often challenged to implement projects in less than a year. Maritime Innovation Initiatives and Center Development
Strengths
• Established Port lines of business provide partnership and expertise needed to support maritime innovation.
• Port real estate assets can support short and long term needs for maritime innovation. • Port staff are knowledgeable about the maritime industry and staff understands the problems and
opportunities. Weaknesses • Port support for Maritime Blue plan is informal – an MOU would help clarify roles/responsibilities as well
as annual partner commitments. • Innovation initiatives are new, so patience is needed to define/achieve outcomes.
Opportunities • To bring world class technologies (Cloud, Cybersecurity, IoT) beneficially to the region’s maritime
cluster. • To spur innovations that sustain the region’s fishing industry and protect our maritime environment. • Advancing partnerships with the University of Washington, NOAA, City of Seattle, Maritime Blue,
private industry and many other stakeholders. • To realize maritime innovations that can support regional economic vitality, cluster competitiveness, and
Port NOI.
Port of Seattle 2020 Budget Economic Development
VI-16
Threats • The region’s maritime industry is not particularly collaborative. • Other ports and regions are hungry for talented maritime startups. Two local companies have participated
in the Port of Rotterdam’s accelerator to advance their startups.
D. ECONOMIC DEVELOPMENT OPERATING BUDGET SUMMARY Background
From a financial standpoint, the Economic Development Division’s activities are:
• Implementation of programs that directly support the Port’s initiatives to promote women and minority businesses, tourism, and Maritime Innovation. In general, these activities do not directly generate revenue for the Port.
• Managing and developing real estate assets to support Century Agenda goals and to maximize financial returns for taxpayers. These activities additionally generate revenue for both the Maritime and Aviation Divisions. The Division is also responsible for the management of the Port’s Pier 69 headquarters building.
Assumptions
The 2020 Economic Development Division Budget is based on the following assumptions:
• Commercial properties are expected to remain at 95% or greater occupancy at year-end 2020, consistent with a forecasted occupancy of more than 95% at year-end 2019.
• Conference and Event Center revenues are below 2019 Budget due to estimated 6 months of construction down time.
• Economic Development Partnership and Tourism Grants are expected to continue. • Salaries and benefits are forecasted using the 2020 Budget guidelines of a 3.9% increase to salaries and
specified benefit fixed amount/percentage. • Utility rate increases are based on applicable rate changes posted by Seattle Public Utility, Seattle City
Light, Puget Sound Energy and other utility vendors as applicable. Major Changes in 2020 Budget
The 2020 budget reflects continued expenditures for the Economic Development Partnership Grant Program with King County cities and funding for the Cooperative Tourism Promotion Program with local communities and non-profits.
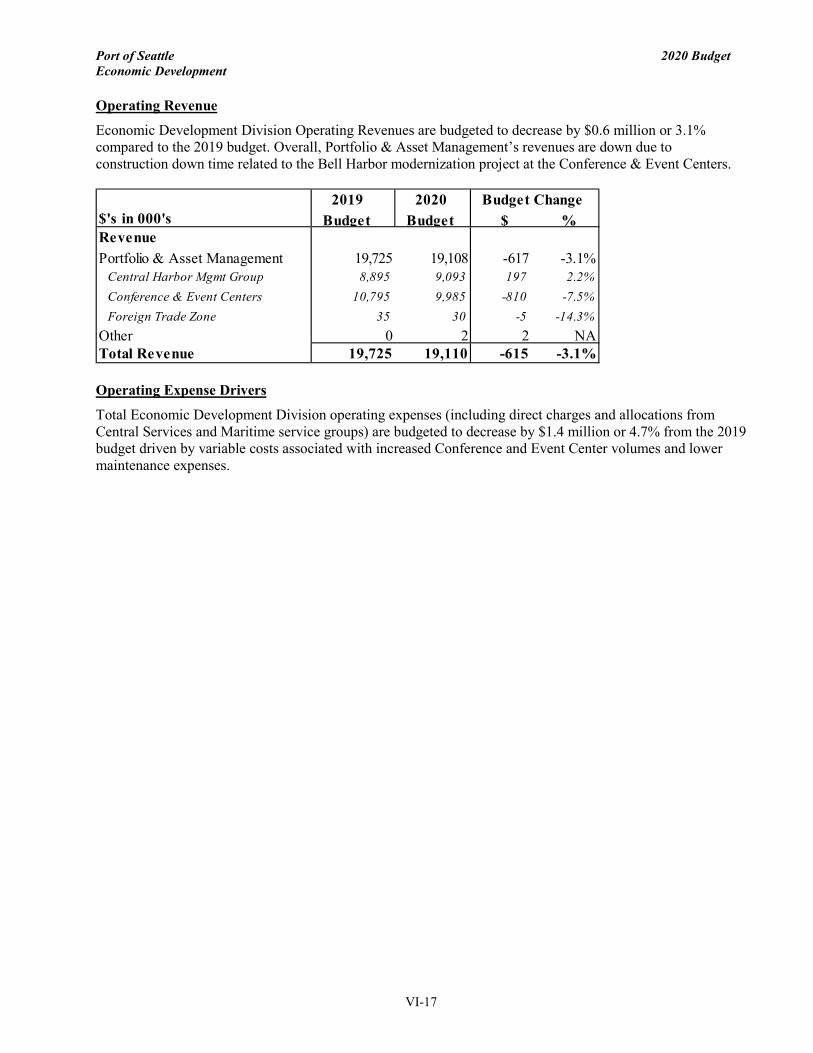
Port of Seattle 2020 Budget Economic Development
VI-17
Operating Revenue
Economic Development Division Operating Revenues are budgeted to decrease by $0.6 million or 3.1% compared to the 2019 budget. Overall, Portfolio & Asset Management’s revenues are down due to construction down time related to the Bell Harbor modernization project at the Conference & Event Centers.
Operating Expense Drivers
Total Economic Development Division operating expenses (including direct charges and allocations from Central Services and Maritime service groups) are budgeted to decrease by $1.4 million or 4.7% from the 2019 budget driven by variable costs associated with increased Conference and Event Center volumes and lower maintenance expenses.
2019 2020Budget Budget $ %
RevenuePortfolio & Asset Management 19,725 19,108 -617 -3.1%
Central Harbor Mgmt Group 8,895 9,093 197 2.2%Conference & Event Centers 10,795 9,985 -810 -7.5%Foreign Trade Zone 35 30 -5 -14.3%
Other 0 2 2 NATotal Revenue 19,725 19,110 -615 -3.1%
$'s in 000'sBudget Change
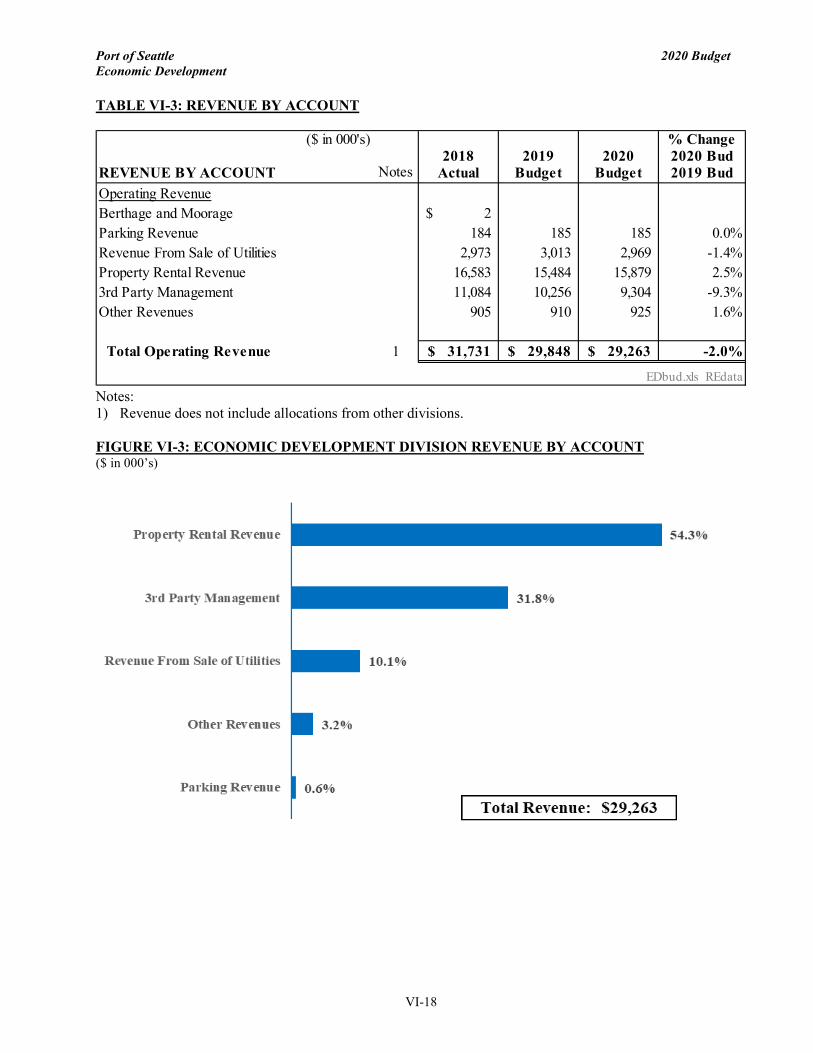
Port of Seattle 2020 Budget Economic Development
VI-18
TABLE VI-3: REVENUE BY ACCOUNT
Notes: 1) Revenue does not include allocations from other divisions. FIGURE VI-3: ECONOMIC DEVELOPMENT DIVISION REVENUE BY ACCOUNT ($ in 000’s)
($ in 000's) % Change2018 2019 2020 2020 Bud
REVENUE BY ACCOUNT Notes Actual Budget Budget 2019 BudOperating RevenueBerthage and Moorage 2$ Parking Revenue 184 185 185 0.0%Revenue From Sale of Utilities 2,973 3,013 2,969 -1.4%Property Rental Revenue 16,583 15,484 15,879 2.5%3rd Party Management 11,084 10,256 9,304 -9.3%Other Revenues 905 910 925 1.6%
Total Operating Revenue 1 31,731$ 29,848$ 29,263$ -2.0%
EDbud.xls REdata

Port of Seattle 2020 Budget Economic Development
VI-19
TABLE VI-4: OPERATING & MAINTENANCE EXPENSES BY ACCOUNT
Notes: 1) Table VI-4 differs from Table VI-2, in that it only reflects the division expenses and does not include Central Services allocations. FIGURE VI-4: ECONOMIC DEVELOPMENT DIVISION EXPENSE BY ACCOUNT ($ in 000’s)
($ in 000's) % Change2018 2019 2020 2020 Bud
EXPENSE BY ACCOUNT Notes Actual Budget Budget 2019 Bud
Salaries, Wages, Benefits & Workers Comp 3,994$ 4,636$ 4,875$ 5.2%Equipment Expense 253 387 349 -9.9%Utilities 4,351 4,848 4,996 3.0%Supplies & Stock 130 150 139 -7.6%Outside Services 3,110 4,160 3,996 -3.9%Travel & Other Employee Expenses 208 455 409 -10.2%Promotional Expenses 244 254 293 15.3%3rd Party Management 9,516 9,007 8,783 -2.5%Other Expenses 1,550 1,964 1,739 -11.4%
Charges to Capital/Govt/Envrs Projects (5) - - 0.0% Total Operating Expense 1 23,351$ 25,862$ 25,579$ -1.1%
EDbud.xls REdata
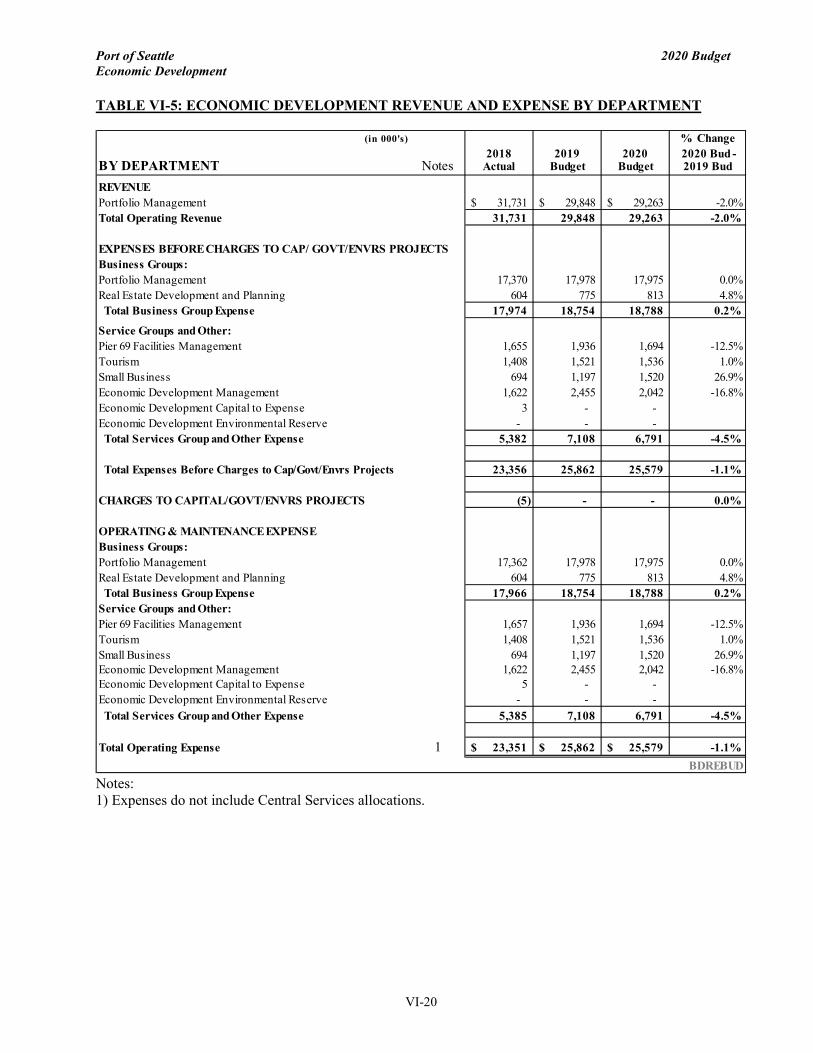
Port of Seattle 2020 Budget Economic Development
VI-20
TABLE VI-5: ECONOMIC DEVELOPMENT REVENUE AND EXPENSE BY DEPARTMENT
Notes: 1) Expenses do not include Central Services allocations.
(in 000's) % Change2018 2019 2020 2020 Bud -
BY DEPARTMENT Notes Actual Budget Budget 2019 Bud
REVENUEPortfolio Management 31,731$ 29,848$ 29,263$ -2.0%Total Operating Revenue 31,731 29,848 29,263 -2.0%
EXPENSES BEFORE CHARGES TO CAP/ GOVT/ENVRS PROJECTSBusiness Groups:Portfolio Management 17,370 17,978 17,975 0.0%Real Estate Development and Planning 604 775 813 4.8% Total Business Group Expense 17,974 18,754 18,788 0.2%
Service Groups and Other:Pier 69 Facilities Management 1,655 1,936 1,694 -12.5%Tourism 1,408 1,521 1,536 1.0%Small Business 694 1,197 1,520 26.9%Economic Development Management 1,622 2,455 2,042 -16.8%Economic Development Capital to Expense 3 - - Economic Development Environmental Reserve - - - Total Services Group and Other Expense 5,382 7,108 6,791 -4.5%
Total Expenses Before Charges to Cap/Govt/Envrs Projects 23,356 25,862 25,579 -1.1%
CHARGES TO CAPITAL/GOVT/ENVRS PROJECTS (5) - - 0.0%
OPERATING & MAINTENANCE EXPENSEBusiness Groups:Portfolio Management 17,362 17,978 17,975 0.0%Real Estate Development and Planning 604 775 813 4.8% Total Business Group Expense 17,966 18,754 18,788 0.2%Service Groups and Other:Pier 69 Facilities Management 1,657 1,936 1,694 -12.5%Tourism 1,408 1,521 1,536 1.0%Small Business 694 1,197 1,520 26.9%Economic Development Management 1,622 2,455 2,042 -16.8%Economic Development Capital to Expense 5 - - Economic Development Environmental Reserve - - - Total Services Group and Other Expense 5,385 7,108 6,791 -4.5%
Total Operating Expense 1 23,351$ 25,862$ 25,579$ -1.1%BDREBUD
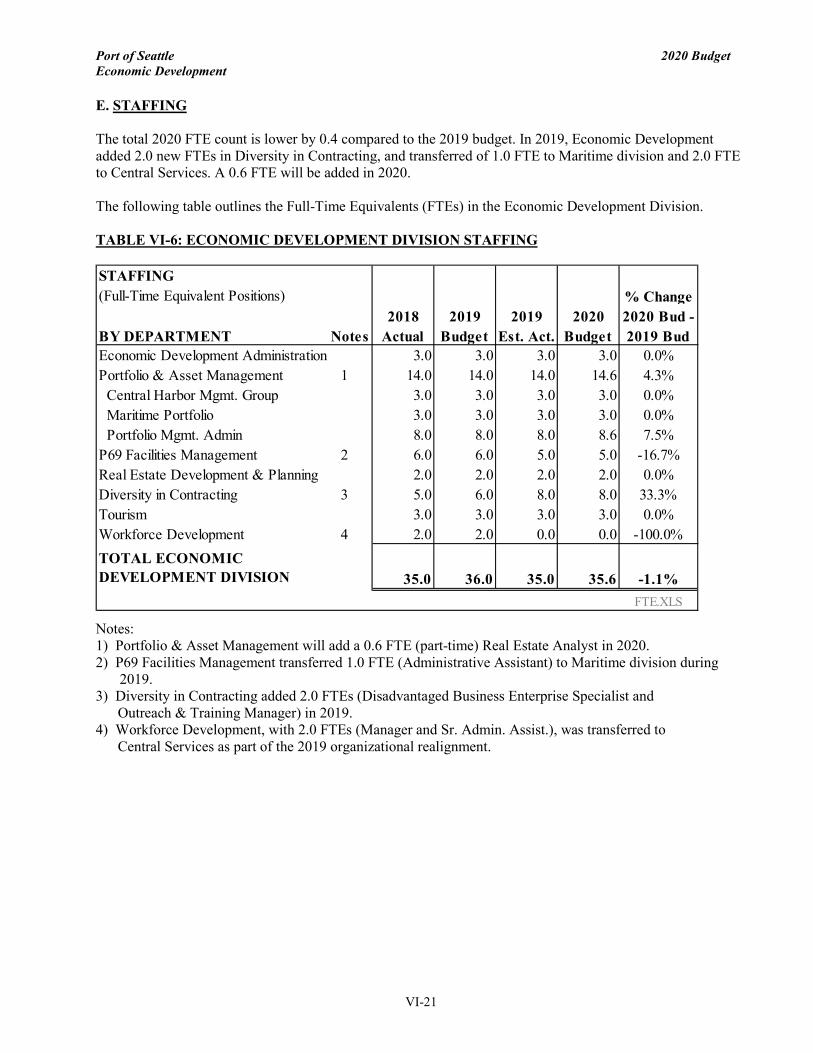
Port of Seattle 2020 Budget Economic Development
VI-21
E. STAFFING The total 2020 FTE count is lower by 0.4 compared to the 2019 budget. In 2019, Economic Development added 2.0 new FTEs in Diversity in Contracting, and transferred of 1.0 FTE to Maritime division and 2.0 FTE to Central Services. A 0.6 FTE will be added in 2020. The following table outlines the Full-Time Equivalents (FTEs) in the Economic Development Division. TABLE VI-6: ECONOMIC DEVELOPMENT DIVISION STAFFING
Notes: 1) Portfolio & Asset Management will add a 0.6 FTE (part-time) Real Estate Analyst in 2020. 2) P69 Facilities Management transferred 1.0 FTE (Administrative Assistant) to Maritime division during
2019. 3) Diversity in Contracting added 2.0 FTEs (Disadvantaged Business Enterprise Specialist and Outreach & Training Manager) in 2019. 4) Workforce Development, with 2.0 FTEs (Manager and Sr. Admin. Assist.), was transferred to Central Services as part of the 2019 organizational realignment.
STAFFING(Full-Time Equivalent Positions) % Change
2018 2019 2019 2020 2020 Bud -BY DEPARTMENT Notes Actual Budget Est. Act. Budget 2019 BudEconomic Development Administration 3.0 3.0 3.0 3.0 0.0%Portfolio & Asset Management 1 14.0 14.0 14.0 14.6 4.3% Central Harbor Mgmt. Group 3.0 3.0 3.0 3.0 0.0% Maritime Portfolio 3.0 3.0 3.0 3.0 0.0% Portfolio Mgmt. Admin 8.0 8.0 8.0 8.6 7.5%P69 Facilities Management 2 6.0 6.0 5.0 5.0 -16.7%Real Estate Development & Planning 2.0 2.0 2.0 2.0 0.0%Diversity in Contracting 3 5.0 6.0 8.0 8.0 33.3%Tourism 3.0 3.0 3.0 3.0 0.0%Workforce Development 4 2.0 2.0 0.0 0.0 -100.0%TOTAL ECONOMIC DEVELOPMENT DIVISION 35.0 36.0 35.0 35.6 -1.1%
FTE.XLS
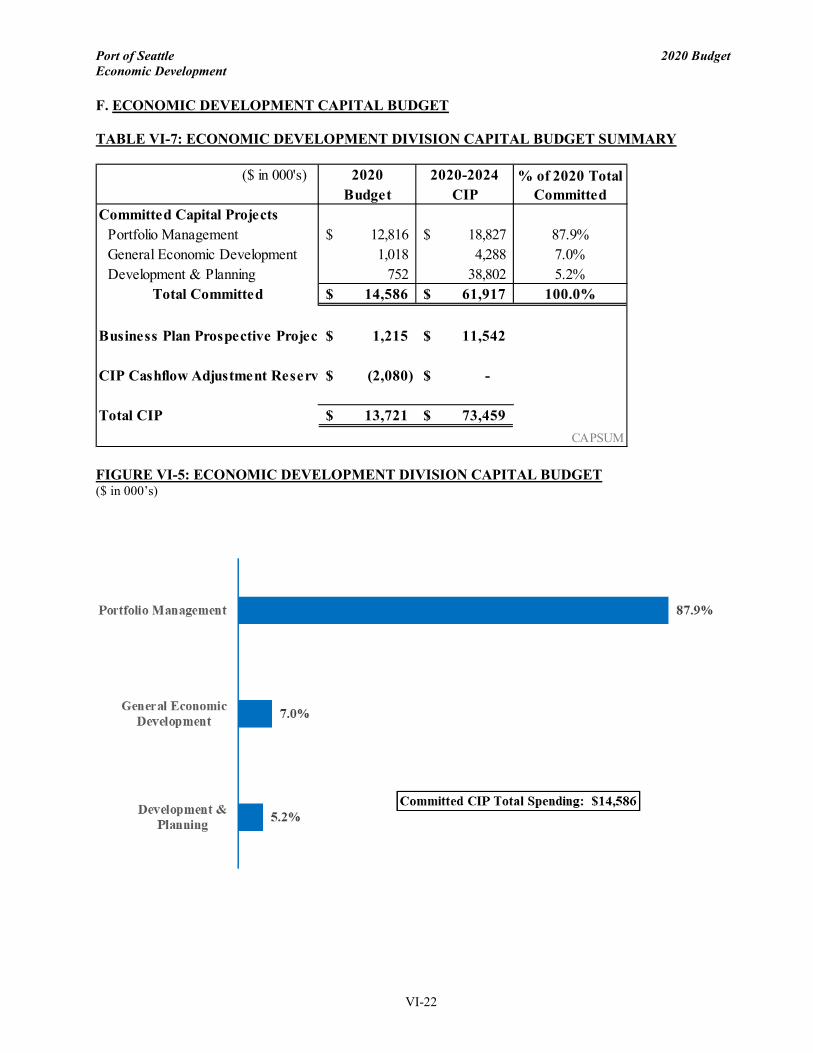
Port of Seattle 2020 Budget Economic Development
VI-22
F. ECONOMIC DEVELOPMENT CAPITAL BUDGET TABLE VI-7: ECONOMIC DEVELOPMENT DIVISION CAPITAL BUDGET SUMMARY
FIGURE VI-5: ECONOMIC DEVELOPMENT DIVISION CAPITAL BUDGET ($ in 000’s)
($ in 000's) 2020 2020-2024Budget CIP
Committed Capital ProjectsPortfolio Management 12,816$ 18,827$ 87.9%General Economic Development 1,018 4,288 7.0%Development & Planning 752 38,802 5.2%
Total Committed 14,586$ 61,917$ 100.0%
Business Plan Prospective Projec 1,215$ 11,542$
CIP Cashflow Adjustment Reserv (2,080)$ -$
Total CIP 13,721$ 73,459$ CAPSUM
% of 2020 Total Committed
VII. C
EN
TR
AL SE
RV
ICE
S
VII.

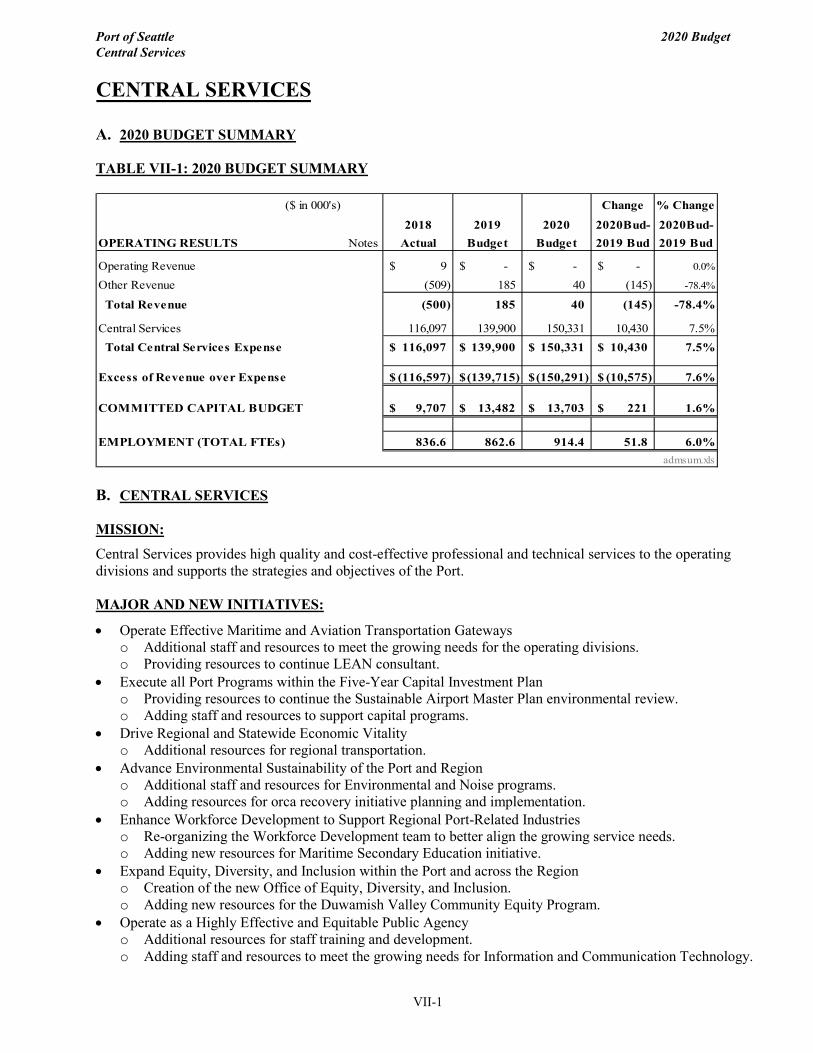
2020 Budget
VII-1
Port of Seattle Central Services
CENTRAL SERVICES
A. 2020 BUDGET SUMMARY
TABLE VII-1: 2020 BUDGET SUMMARY
B. CENTRAL SERVICES
MISSION:
Central Services provides high quality and cost-effective professional and technical services to the operating divisions and supports the strategies and objectives of the Port.
MAJOR AND NEW INITIATIVES:
• Operate Effective Maritime and Aviation Transportation Gatewayso Additional staff and resources to meet the growing needs for the operating divisions.o Providing resources to continue LEAN consultant.
• Execute all Port Programs within the Five-Year Capital Investment Plano Providing resources to continue the Sustainable Airport Master Plan environmental review.o Adding staff and resources to support capital programs.
• Drive Regional and Statewide Economic Vitalityo Additional resources for regional transportation.
• Advance Environmental Sustainability of the Port and Regiono Additional staff and resources for Environmental and Noise programs.o Adding resources for orca recovery initiative planning and implementation.
• Enhance Workforce Development to Support Regional Port-Related Industrieso Re-organizing the Workforce Development team to better align the growing service needs.o Adding new resources for Maritime Secondary Education initiative.
• Expand Equity, Diversity, and Inclusion within the Port and across the Regiono Creation of the new Office of Equity, Diversity, and Inclusion.o Adding new resources for the Duwamish Valley Community Equity Program.
• Operate as a Highly Effective and Equitable Public Agencyo Additional resources for staff training and development.o Adding staff and resources to meet the growing needs for Information and Communication Technology.
($ in 000's) Change % Change
2018 2019 2020 2020Bud- 2020Bud-OPERATING RESULTS Notes Actual Budget Budget 2019 Bud 2019 Bud
Operating Revenue 9$ -$ -$ -$ 0.0%
Other Revenue (509) 185 40 (145) -78.4%
Total Revenue (500) 185 40 (145) -78.4%
Central Services 116,097 139,900 150,331 10,430 7.5% Total Central Services Expense 116,097$ 139,900$ 150,331$ 10,430$ 7.5%
Excess of Revenue over Expense (116,597)$ (139,715)$ (150,291)$ (10,575)$ 7.6%
COMMITTED CAPITAL BUDGET 9,707$ 13,482$ 13,703$ 221$ 1.6%
EMPLOYMENT (TOTAL FTEs) 836.6 862.6 914.4 51.8 6.0%admsum.xls
Port of Seattle 2020 Budget Central Services
VII-2
C. KEY FUNCTIONS AND RESPONSIBILITIES OVERVIEW:
Central Services provides a number of essential services to the three operating divisions of the Port and to the Northwest Seaport Alliance (the NWSA) per service agreements. Central Services departments are vital to the success of the operating divisions and the NWSA and benefit the public in general. Central Services’ functions have evolved and now include 20 departments with organizational restructuring over the past few years. Apart from the traditional support functions, such as Accounting, Human Resources, External Relations, etc., Central Services also includes Police, Engineering, Port Construction Services, and three Centers of Expertise (COEs) – Business Intelligence, Finance and Budget, and Environment and Sustainability. As part of the re-org in 2019, Aviation Project Management Group and Seaport Project Management Group were transferred from Central Services to the Aviation Division and Maritime Division, respectively. Additionally, the new Office of Equity, Diversity and Inclusion was created in 2019 to support the Port’s commitment to social justice and promote equity, diversity and inclusion in the workplace and throughout the region. The Workforce Development organization was also transferred to the Office of Equity, Diversity and Inclusion from the Economic Development Division. The key functions for the Central Services departments in 2020 are as follows: COMMISSION:
The Port Commission is the legally constituted governing body of the Port of Seattle. Its primary duties are to establish policies on behalf of the community that guide the Port's future and maintain its global competitiveness, and to execute its fiduciary responsibilities in overseeing the expenditure of public funds. As a governing body of a special purpose municipal corporation, the Commission is charged with fulfilling the law as the basis for appropriate policy, and establishing policy as the basis for appropriate practices, activities, and procedures.
The Commission expresses its policy direction through the following mechanisms:
• Reviews the strategies that serve as the framework for the business divisions’ and Central Services departments’ goals and objectives. These strategies provide the groundwork for prioritizing and allocating resources to programs and projects at the division level.
• Reviews and approves the annual budget. The budget is made available to the general public as required by RCW 53.35.010 and RCW 53.35.045. A Public Hearing for the Introduction of the Preliminary Budget is held before the final passage of the Budget, at which time the Port Commission will make final recommendations and Adopt the budget.
• Sets additional long-term policy goals during public Commission meetings through the passage by majority vote of Commission Resolutions in accordance with RCW 53.08 and the Master Delegation of Authority. These policy goals help advance the Commission’s long-term mission of economic development and job creation through promotion of industrial growth and advancement of trade and commerce.
• Reviews and approves public session programs, projects, and select contracts through Commission motions that are introduced and seconded by Commission members, in accordance with the Master Delegation of Authority.
• Oversees the Executive Director to execute the long-range plans, major programs and goals, objectives, and policy guidelines established by the Port Commission through majority vote at Commission meetings and by Commission approval of the Executive Director’s performance goals and objectives. These include policy goals and objectives related to achieving the Port’s financial and budgetary annual performance goals, and aligning budget priorities to the Port’s core mission, division goals and objectives that demonstrate that the Executive Director is holding his direct report managers accountable for division-level performance.
• Oversees the Internal Audit function of the Port of Seattle through the Audit Committee made up of two Port Commissioners and a third public member.
Port of Seattle 2020 Budget Central Services
VII-3
EXECUTIVE:
• Achieve the operating and performance goals and objectives set by the Commission. • Select and manage all staff and outside resources needed to carry out long-range plans, major programs and
projects, and to maintain facilities. • Oversee the achievement of the Portwide goals, as well as all divisions’ major goals and initiatives. LEGAL:
Legal is comprised of Attorney Services, which includes Workplace Responsibility and Records. ATTORNEY SERVICES:
• Provide legal analysis, advice, expertise, opinions, and similar services, including: drafting, reviewing and interpreting contracts, agreements, statutes, regulations, judicial opinions, and other legal materials and documents.
• Provide prosecution and defense of claims and litigation. • Provide assistance with settlements and negotiations. • Provide representation in arbitration, mediations, and other forms of dispute resolution; representation before
hearings boards, and other administrative or legislative bodies. • Receive and manage reported violations and monitor workplace investigations and outcomes.
WORKPLACE RESPONSIBILITY:
• Provide overall leadership and coordination of the Port’s ethics and compliance program. • Publish and interpret the Code of Conduct, promote ethics awareness, provide ethics training, foster
organization and individual commitment to the port’s ethical values. • Provide guidance on ethics and whistleblower issues; and oversee the Workplace Responsibility program,
the process for responding to reported Code of Conduct and whistleblower violations.
RECORDS MANAGEMENT:
• Manage and provide public record administration, including public disclosure. • Provide Portwide assistance with regard to records management issues including retention scheduling,
archiving, and public disclosure. • Manage Port records in accordance with State retention requirements. • Manage the Portwide Records Center in SharePoint. EXTERNAL RELATIONS:
The Port’s External Relations department serves several key functions including federal, state, and local government relations; capital project delivery, which includes regional transportation technical and policy expertise; strategic communications; and community engagement. GOVERNMENT RELATIONS:
• Collaborate with Commission and Port business divisions (Aviation, Maritime and Economic Development) and Commission to develop legislative funding and policy priorities.
• Work with Port Commission to communicate the Port’s Century Agenda, business, transportation, and trade priorities to representatives from federal, state, and local elected officials, agencies, and stakeholders.
• Foster effective relationships between Port-elected officials and senior Port staff with local, state, and federal elected officials to advance the Port’s objectives and to represent regional, statewide, and national interests to officials in the Legislative and Executive branches of government.
• Develop partnerships with stakeholders in business, labor, and community organizations in support of trade development, economic growth, transportation infrastructure investment, and responsible environmental regulation.
Port of Seattle 2020 Budget Central Services
VII-4
• Utilize memberships and activities in associations engaged in legislative work to build coalitions and broaden awareness of Port issues and support for Port objectives.
• Provide opportunities for policy makers and staff to learn about the Port of Seattle’s business and operations through meaningful tours, briefings, and timely responses to requests for information.
• Continue to advocate for policies and regulations that enhance and expand the ability of the Port and related businesses to move people and commerce efficiently in a competitive global marketplace and educate leaders on the impacts of adverse policy proposals.
• Coordinate legislative advocacy and policy development with the NWSA. REGIONAL TRANSPORTATION:
• Advocate for Port interests in regional transportation programs and projects, including those sponsored by the state, county, city or other agencies or partners, including the City of Seattle, Sound Transit, WSDOT, King County, Puget Sound Regional Council.
• Work with external agencies on regional transportation policies and issues to leverage Port interests and minimize impacts to the Port, including federal freight planning, Seattle Freight Advisory Board, industrial stakeholders including MIC, SoDo BIA, NSIA.
• Manage internal interests regarding regional transportation across all areas of the Port, including leading the regional transportation strategy team, developing and finalizing Port comment letters throughout formal planning processes; liaison to NW Seaport Alliance; Airport Ground Transportation Regional Mobility group.
CAPITAL PROJECT DELIVERY:
• Manage strategy, communications and advocacy for growth and capital programs at Sea-Tac Airport, including the Sustainable Airport Master plan, the Flight Corridor Safety program, communicating airport-related demand, opportunities and benefit and building understanding and support for airport redevelopment.
• Advance regional and state economic vitality, including implementation of the South King County fund, supporting government relations and community engagement to increase visibility of port-related contributions to airport-area communities and the state.
• Advance environmental sustainability, including improved recognition of the Port’s environmental programs, and support of the StART federal policy working group.
• Support equity, diversity and inclusion through collaborative efforts on the South King County fund, promote improved understanding of the Port’s commitment and programs in these areas, and emphasize improved accessibility at the airport for all communities and populations.
• Strengthen and expand community engagement with focused efforts on community communications and engagement; support of StART roundtable and agenda; community and stakeholder plans for the Flight Corridor Safety program and ongoing ILA engagement with the City of SeaTac.
COMMUNICATIONS:
• Support economic and community development objectives by promoting Port of Seattle opportunities. • Improve customer service and provide a high-quality experience for passengers, tenants, community
members, and employees through direct engagement and stories that explain Port projects. • Increase employee engagement and demonstrate the Port is a great place to work. • Communicate how a well-run Port benefits local communities. • Ensure transparency for the public by promoting community engagement opportunities and sharing policy
decisions by leadership. • Communicate the Port’s progress towards key objectives. • Maintain engaging communications platforms to continually expand the audience interested in Port news. • Develop new communications platforms to reach underserved audiences.
Port of Seattle 2020 Budget Central Services
VII-5
COMMUNITY ENGAGEMENT:
• Develop and strengthen business, community, industry, government, and environmental partnerships that support the Port’s mission and key strategies.
• Regularly liaise with strategic business and community groups to anticipate emerging issues and broaden the Port’s awareness and understanding of community objectives and priorities.
• Create and execute events, communications, and outreach to facilitate, strengthen and commemorate our operating divisions’ business objectives.
• Initiate and manage “Trade, Business & Community Development” opportunities to support community and strategic partner priorities.
• Conduct ongoing outreach and communications to consult with stakeholders, gain public input to influence port decisions; broaden awareness and understanding for program, policy and regulatory decisions.
• Develop and manage effective public engagement programs that help tell the Port’s story in ways that are relevant to communities.
• Coordinate Commission and CEO events and help facilitate and support their community engagement activities.
EXTERNAL RELATIONS:
• Provide strategic guidance and direct the delivery of External Relations services to the Port Commissioners, the Executive Director, and business division leaders.
• Lead development and execution of work by the External Relations team to support the accomplishment of the Port’s goals and LRP objectives.
ACCOUNTING AND FINANCIAL REPORTING:
The Accounting and Financial Reporting (AFR) department’s key operational responsibilities and services include:
• Portwide core accounting and financial reporting services. • Port accounting policies and procedures development and enforcement. • Industry prescribed accounting and financial reporting standards compliance assurance. • Annual Port financial statements preparation and issuance. • Recurring fiscal management reporting. • Accounts payable administration. • Payroll administration. • P-card and Travel card administration. • Leases and customer billing administration. • Accounts receivable and revenues administration. • Credit and collection enforcement. • General ledger administration. • Capital projects costing and capital assets accounting (including physical inventory). • Cash/investment and debt accounting. • Grants billing and reporting. • Airport Passenger Facility Charge (PFC) accounting and reporting. • Airport Customer Facility Charge (CFC) accounting. • Corporate credit cards and procurement cards administration. • Employee expense claims and reimbursements. • Business tax administration. • External audits facilitation. • NW Seaport Alliance, North Harbor, accounting/financial reporting.
Port of Seattle 2020 Budget Central Services
VII-6
INFORMATION AND COMMUNICATIONS TECHNOLOGY (ICT):
ICT provides state of the art technology and related services in a cost effective, secure, and highly reliable manner that can rapidly respond to the Division and individual department's requirements which will enable them to achieve their business objectives and to support Port strategies. Key functions include: • Infrastructure (Data Management, Telephony, Network). • Personal Computing (PC Support, Smartphone/iPad). • Systems Delivery. • 24/7 Service desk. FINANCE AND BUDGET:
The overall goal of the Finance and Budget (F&B) department is to continuously improve the institution’s management of its debts, assets, budget, and resources. Key functions include:
BUDGET:
• Plan, coordinate and manage the Port’s budget planning process. • Maintain, enhance, and manage the Port’s budget system and its interfaces. • Provide budget training, workshops, and Management Information System (MIS) training to Portwide
budget support staff. • Review monthly variance reports and provide monthly Executive Summary Report to the Executive team. • Plan, coordinate and manage the Port’s quarterly financial performance reporting process. • Develop and refine budget policies and procedures for the Port. • Provide budget consultation and support to the operating divisions and Central Services departments. • Passenger Facility Charge (PFC) and grant program administration. • Rate model reporting, development and settlement. • Internal control monitoring. • File statutory budget. FINANCE AND TREASURY:
• Existing debt management: bond proceeds usage reconciliation; regulatory compliance and financial reporting; bad money analysis; arbitrage rebate calculations; provide financial updates to ratings agencies; investor relations; letter-of-credit renewals and replacements.
• Manage new debt issuance. • Manage engagements with outside financial advisor, bond and disclosure counsel and underwriters. • Coordination of short and long-term funding plans for future capital needs; development and monitoring
of the Port’s annual Capital Improvement Plan and Plan of Finance; tax levy funds management. • Industrial Development Corporation Administration. • Treasury functions include Cash and Investment portfolio management and management of the Port’s
banking contract. BUSINESS INTELLEGENCE:
The Business Intelligence Department’s core purpose is to transform the ways the Port accesses, analyzes, and shares data. Business Intelligence Center of Expertise provides advanced analytical and research support, creates efficiencies that eliminate information management waste, and fosters an analytical culture with data fluency. Key functions include:
• Facilitating development of KPIs and other operational and performance measures, driven by Port focus on metrics and measurement.
• Reducing the level of effort, complexity and process in preparing or manipulating data for analysis; supports LEAN/CPI initiatives.

Port of Seattle 2020 Budget Central Services
VII-7
• Providing advanced analytical capabilities (e.g. forecasting, etc) not widely present in organization; required to answer complex business problems.
• Internal capacity for survey research services; driven by need to measure effectiveness, performance, and service quality.
• Facilitating growth of a data-literate, evidence-based decision-making culture at the port; supports Port’s high-performance workforce goal.
RISK MANAGEMENT:
• Oversee Property/Casualty Insurance Program. • Manage claims process, intake, and settlement. • Recover and collect on claims/damages to the Port. • Manage Driver/Commercial Driver’s License (CDL) program (per Federal Motor Safety Carrier Act) and
work with Fleet Management Oversight Team to ensure the Port purchases, maintains, and looks for green fleet opportunities.
• Contractual reviews of leases and goods/services agreements. • Perform enterprise risk management analysis and training. • Update annual statements in relation to risk, uncertainty, insurance and claims; Report lost and stolen
assets to State Auditor. • Collaborate with Health and Safety and Construction Safety to ensure a safe workplace for both
employees and contractors and the public. • Collaborate with Police, Fire and Security to update emergency preparedness procedures and training are
kept current. • Provide risk assessment and review of special events. • Assist with the review and selection of Self-Funded Medical and Dental plans.
INTERNAL AUDIT:
Internal Audit conducts risk-based operational/performance audits throughout the Port in accordance with applicable auditing standards and the best practices of the internal auditing profession. Audit results are designed to add value and improve and strengthen accountability, increase fiscal integrity, provide greater transparency in governance and decision making, and improve investment of public resources to advance trade and commerce, promote industrial growth, stimulate economic development, and create jobs. In addition, audit results are intended to enhance efficiency and effectiveness of management practices in governance, risk assessment, controls and compliance. Internal Audit work is guided by two professional standards:
• Government Auditing Standards - issued by the Comptroller General of the United States. • International Professional Practices Framework (IPPF) - issued by The Institute of Internal Auditors. OFFICE OF STRATEGIC INITIATIVES:
Office of Strategic Initiatives (OSI) comprise of Strategic Planning unit and Continuous Process Improvement unit.
STRATEGIC PLANNING:
• Update the Century Agenda. • Re-evaluate the fundamentals of the long-term strategic planning. • Host Disruption Summit to prepare the Port for potential disruption and disruptive innovation. CONTINUOUS PROCESS IMPROVEMENT:
• Provide LEAN Training to foster understanding of LEAN principles. • Implement LEAN initiatives throughout the Port.
Port of Seattle 2020 Budget Central Services
VII-8
CENTRAL PROCUREMENT OFFICE:
• Manage the procurement process for all construction contracts, professional and personal service contracts, and goods and service contracts to ensure compliance with legal mandates.
• Lead team negotiations (price, contract terms and conditions) for base contract; draft and/or review, negotiate change orders and amendments.
• Provide advice and assistance in contract management, addressing performance problems. • Close out contracts, ensuring that all closing submittals have been received. • Provide notification to Commission, with respect to public works contracting, as required, for compliance
with state law and Resolution 3605. • Provide training and outreach on procurement and contract issues, including developing appropriate small
business programs and opportunities. • Develop program and training to include Diversity in Contracting in the Port’s consulting procurements
and major construction contracts. Active management of contract requirements. Provide updates to Commission on the program.
HUMAN RESOURCES:
Apart from providing core services listed below, Human Resources is also focused on broader issues such as attracting and retaining a diverse work force; succession preparation; process improvement; performance management aligned with values, strategies and business plans; and developing metrics that drive decisions. The list that follows reflects services Human Resources provides daily, many of which also respond to the bigger picture, longer-term concerns described above. EMPLOYEE RELATIONS (ER):
• Provide guidance and direction to Port employees, including senior leadership, managers, and individual contributors, regarding employee performance management issues, as well as consultation to identify the appropriate ER intervention such as coaching, fact-finding, investigation, progressive discipline, facilitation/mediation, training, and conflict resolution.
• Manage the interactive process associated with employees’ requests for reasonable accommodation • Ensure Port compliance with our affirmative action responsibilities, which informs, educates, and
promotes the Port being an equitable, inclusive and high performing organization.
HEALTH & SAFETY:
• Continuous improvement of workplace health and safety, as well as ensuring compliance to all regulated safety programs, including oversight of the Port’s self-insured, self-administered workers compensation program.
• Promote an active safety culture by teaming with employees and management to recognize, evaluate, communicate and control workplace hazards to ensure every employee, contractor and tenant goes home safely.
ORGANIZATIONAL EFFECTIVENESS:
• Support the organization in achieving improved business results through organizational and people effectiveness.
• Address organization-wide business needs such as developing and aligning clear business goals, missions, visions and strategies, defining organization-wide structures and clarifying roles and responsibilities.
• Provide leadership and support for the goals and methodology for improving employee engagement, innovation, building high performance teams, developing and improving cross port collaborations.
• Strategic advisors to the organization as a whole and Port of Seattle divisions ensuring the business has the skills, capabilities, structure, culture and change processes to execute their strategies and deliver on the near- and long-term goals.

Port of Seattle 2020 Budget Central Services
VII-9
• Lead Port-wide strategic initiatives such as engagement, culture and innovation and serve as a liaison between the HR Center of Expertise and assigned business units helping leaders to set direction and translate business goals into HR strategies.
• Provide HR related data to the Port to help HR and other groups make decisions using relevant data. • Use internal communications as an engine to drive progress toward organizational goals and connect
employees to information and resources about key programs, policies, initiatives, events and opportunities that drive employee engagement and knits employees together as a single organization.
TALENT MANAGEMENT:
• Promotes an equitable, inclusive and high performing organization by attracting, engaging and developing diverse talent so that the Port is able to realize its strategic goals.
• Partner with business lines to anticipate and support workforce planning needs, generating awareness through outreach of the Port as an employer of choice, identifying and evaluating top talent and building talent pipelines, and continuously enhancing the experience of employees so they are and continue to be highly engaged.
• Promote an equitable, inclusive and high performing organization by recruiting, engaging and developing diverse talent so the Port realizes its business and community goals.
• Build employee effectiveness through development of common approaches to work, leader and manager preparation and development, employee development, and support of diversity programs and initiatives, the Port is able to build a high performing organization and culture that values employee development, equity, diversity and inclusion.
• Generate increased awareness of the Port as an “employer of choice” and of the numerous opportunities available in Port-related industries. Through award winning internship and Veterans Fellowship programs, the HR Outreach function provides opportunities for youth and transitioning veterans to gain professional civilian experience while developing skills necessary to succeed in their career.
TOTAL REWARDS:
• Ensures the Port offers, directly or indirectly, a competitive total rewards package that supports retention and attraction of employees with the talents, skills and abilities necessary for the Port to fulfill its mission and vision. The Total Rewards package includes all things employees receive as result of their employment relationship with the Port.
• Ensure that pay programs for non-represented employees are internally equitable and externally competitive. To do this, employees supporting this function gather and analyze market pay data to maintain the Port’s non-represented pay ranges at competitive levels, evaluate non-represented jobs to ensure they are administered in competitive pay ranges, and analyze employee pay levels to ensure pay equity.
• Ensure the Port’s benefits programs are competitive so they can support attraction and retention of the employees necessary for the Port to be a high performing organization. This includes managing the self-insured medical and dental plans, the fully insured HMO, vision, life and disability insurance plans, time off plans, commuter benefits, and other benefits including and EAP, retirement, and wellness benefits.
• Responsible for the various recognition programs that support employee engagement by acknowledging actions and contributions that exceed what is normally expected.
• Responsible for enabling technology and business processes that make it easier to do HR business, and for other Port groups to do business with HR. This includes support and maintenance of existing technology systems and business processes, deployment of new functionality, and related improvements to business processes.
Port of Seattle 2020 Budget Central Services
VII-10
LABOR RELATIONS:
Labor Relations (LR) offers the best possible representation of the Port’s interests by engaging in collaborative relationships with employee organizations through open communication and dialogue. LR also provides strategic expertise and assistance to positively affect operations, reduce exposure and support a talented workforce to help propel the Port and region into the future. Key functions include: • Prepare, negotiate, implement and administer the Port’s 23 bargaining agreements. • Implement LR bargaining strategy and directives from the Commission and Executive Leadership Team. • Process grievance and disciplinary procedures according to the agreements. • Represent the Port in Public Employment Relations Commission (PERC) and Arbitration proceedings. • Participate in Port oversight committees; provide consultation to all Port committees and all divisions on
labor matters, including proposed changes in policies, practices and procedures in a manner designed to avoid labor disputes.
• Supervise and manage labor community outreach as well as Seaport Alliance LR work. Act as the Commission Liaison with Labor and support the Executive Director in their Labor Outreach strategy to facilitate positive labor relations across the region.
• Organize, manage, and attend labor business partnership meetings to resolve issues before they become grievances.
• Negotiate Project Labor Agreements (PLA) and assist with PLA policy and language. INFORMATION SECURITY:
Information Security is a relatively new department established during the third quarter of 2018. Information Security provides Governance, Protection, Response and Recovery to reduce data risks and enhance the Port’s continuity of business operations. The key functions include:
• Maintain enterprise systems and control systems across the Port. • Audit and compliance efforts with emphasis to Risk Assessments, and data governance of Payment Card
Industry (PCI), Health Insurance Portability and Accountability Act (HIPAA), Criminal Justice Information Services (CJIS) and Privacy data.
OFFICE OF EQUITY, DIVERSITY AND INCLUSION (EDI):
Office of Equity, Diversity and Inclusion is a new department that was added in 2019 with the main goal of supporting the objective in the Port’s strategic plan to become a model of equity, diversity and inclusion. Key functions include: • Designs, shapes and implements an overarching equity, diversity and inclusion vision and strategy for the
Port to be an organization that works to eliminate systemic organizational marginalization and promotes equity, diversity and inclusion practices that are evidenced through culture and leadership.
• Ensure that equity goals and objectives are incorporated throughout Port operations and providing strategic and policy direction on equity issues.
• Lead Portwide EDI training classes. New employees required to take EDI class as part of orientation. • Evaluate and clarify Port values and practices with the goal of increasing equity, diversity and inclusion
internally and externally in the region the Port serves. • Lead Port staff to develop and implement organizational strategies and work plans to support an equity
policy. • Provide strategic direction and lead long term vision and planning. Develop and implement technical
assistance program for Port departments and employees. • Develop communication and feedback mechanisms to ensure the Port is able to identify, discuss and address
equity issues impacting the Port’s communities, partners and staff. • Serve as a liaison with other local, state and federal government agencies on equity related topics and issues
and build strong partnerships within the Port as well as with our community partners and stakeholders.
Port of Seattle 2020 Budget Central Services
VII-11
• Implement equity focused workforce development initiatives that support the Port’s key sectors (e.g. Aviation, Maritime and Construction).
POLICE:
• Provide professional law enforcement services to internal and external Port of Seattle Stakeholders which includes essential emergency and routine response capability allowing airport operations to continue.
• Traffic mitigation as well as traditional law enforcement functions throughout the Port of Seattle’s jurisdiction.
• Provide essential emergency response to mitigate terrorist attacks and other acts of extraordinary violence. Respond with other first response partners to mitigate and stabilize unusual occurrences, disasters and mechanical calamities in order to stabilize the scene and enhance continuity of operations.
• Support the professional development of the police department to improve the ability to meet future needs of the Port of Seattle.
ENVIRONMENT AND SUSTAINABILITY:
The Environment and Sustainability includes the Aviation Environmental, Noise Program, and Maritime Environmental and Planning. Its key functions and responsibilities include: AVIATION ENVIRONMENTAL:
• Stormwater Program: provide environmental support to maintain compliance with the Airport’s National Pollutant Discharge Elimination System (NPDES) permit and waste discharge permit consistent with the associated Century Agenda to meet or exceed these regulations. These permits authorize the discharge of industrial and construction stormwater to adjacent creeks and lakes, industrial wastewater to Puget Sound and the King County wastewater treatment plant and industrial sanitary wastewater to the Midway sewage treatment plant. Compliance with these permits is mandatory with violations not to exceed $10,000 per day. Permits require regular monitoring of discharges from 11 outfalls, and Industrial Wastewater Treatment Plant, specialized testing for effluent toxicity, other specialized studies, administration development treatment and flow control requirements. The Program also develops guidelines and initiatives and works with airport staff and tenants to meet the requirements for Salmon Safe certification.
• Natural Resources Program: provide services necessary to comply with the Airport’s 1997 MPU Section 401 certification and Section 404 permit from the Department of Ecology (Ecology) and US Army Corps of Engineers, respectively. Program requirements extend through 2022 and include management of over 160 acres of wetlands around the Airport and in Auburn, habitat restoration and maintenance for the Flight Corridor Safety Program.
• Contaminated Sites, Solid Waste and Hazardous Materials program: monitor and provide oversight of construction contaminated soil, management of Port-generated hazardous waste, and oversight of underground and above ground storage tanks; remediation of Lora Lake site.
• Air Quality program: develop regulatory and voluntary air-related initiatives which include ensuring that the Port comply with all the requirements in the Airport’s Air Permit. Provide additional support for the development and implementation of initiatives to meet the Port’s Century Agenda goal to reduce air emissions by 50%.
• SEPA/NEPA function: ensure compliance with the State Environmental Policy Act (SEPA) and the National Environmental Policy Act (NEPA). Conduct comprehensive environmental reviews for all airport projects that could impact the environment, as well as actively engaging key stakeholders such as the Federal Aviation Administration (FAA) and neighboring communities.
• Waste Reduction and Recycling function: implement initiatives designed to divert airport wastes away from landfills through strategies that reduce, reuse or recycle our solid waste and enable the airport to meet the aggressive goal of diverting 60% of waste generated at the Terminal. Conduct waste audits and develop strategic plans to ensure that the airport can meet diversion goals year over year, even with significant passenger growth.
• Climate function: develop new sources of biofuels such as renewable natural gas that can be used at the airport to heat the terminal, develop emission inventories for certification under the Airports Carbon
Port of Seattle 2020 Budget Central Services
VII-12
Accreditation (ACA) program, and report the Airport’s emissions to the Washington State Department of Ecology. Collaborate with aviation stakeholders such as Boeing and Alaska Airlines to conduct studies necessary to create a market for aviation biofuels at Sea-Tac Airport.
• Energy function: provide assistance to other departments such as Operations and Facilities and Infrastructure to estimate the carbon benefits of reducing energy throughout the Terminal and on the airfield. Develop initiatives that allow the Airport to use different forms of energy such as providing electric vehicle charging stations throughout the Airport property and nearby locations as appropriate.
• Transportation function: develop initiatives aimed at reducing the environmental impacts associated with transportation from both commuting employees and passengers which include Commute Trip Reduction Program, Transportation Network Companies (TNCs), and taxi contracts.
NOISE PROGRAM:
• Sound Insulation Program Management is intended to reduce the impact of aircraft noise in eligible homes and schools located near the Airport. This program is an outcome of the recent Part 150 that was approved by the FAA in 2014 to provide modifications to homes to reduce interior noise levels.
• FAA Noise Compliance/Regulatory Program ensures that the Airport is in compliance with the FAA in monitoring noise contours which is conducted every three years and must meet the obligation of evaluating noise conditions.
• Noise Abate and Outreach Programs provide information to communities regarding airport noise, collect noise complaints, conduct research to determine root cause, compile all written correspondence, and provide presentations to different communities.
• Part 150 Project Implementation involves management oversight and implementation of the Part 150 Noise Compatibility Plan, which is necessary to receive grant funding for noise projects. The plan includes developing and implementing sound insulation programs, noise impacted acquisitions, flight procedures, and noise modeling and monitoring.
MARITIME ENVIRONMENTAL AND PLANNING:
• Energy Efficiency: Reduce energy use and Greenhouse gas (GHG) emissions from Port Maritime facilities. Participate in regional maritime strategic partnerships and develop clean air policies.
• Monitor Stormwater for regulatory compliance and report findings to Department of Ecology (DOE) for both the Stormwater Utility and in support of operating business units.
• Ensure compliance with local, state and federal regulations including but not limited to Green Marine certification, Derelict Vessels, Spill Prevention, Dangerous Waste (DW) designation and disposal, Underground Storage Tank (UST) monitoring, Spill Response.
• Capacity planning; perform due diligence related to potential environmental remediation when buying new properties; support maximizing cost recovery including grants, insurance, allocation and settlements.
• Develop habitat along Duwamish and Elliott Bay to meet Century Agenda goal. • Participate in regional maritime strategic partnerships and drive clean air policy. • Direct appropriate and successful implementation of environmental National and State Environmental
Policy Acts (NEPA/SEPA) environmental impact statements and permitting. • Ensure that methods to manage permits for federal, state and local agencies are cost effective and
regulatory compliant. • Compile technical data and mapping information for internal and external customers. • Manage and implement the Port’s Environmental Remediation Liability Program and public benefit
projects including clean truck program. • Preserve industrial lands and complete facility strategic plans. ENGINEERING:
DESIGN AND TECHNICAL SUPPORT:
• Civil/Structural and Mechanical/Electrical design, analysis and CAD drafting.
Port of Seattle 2020 Budget Central Services
VII-13
• Seismic risk analysis and condition assessment of facilities. • Central repository for all project drawings, as-built, and soils information. • Maintain technical master specifications. • CAD compliance reviews. • Establish and operate remote office facilities to support project requirements.
CONSTRUCTION MANAGEMENT:
• Pre-construction services. • Field observation/inspection and quality compliance checks. • Change order management, disputes and claims resolution. • Construction coordination with Port operations/tenants. • Construction document management. • Management of Project Labor Agreements (PLA).
SURVEYING AND MAPPING:
• Topographic and hydrographic surveys. • Legal descriptions and lease line layouts. • Utility locates/mapping and aerial mapping. • Geographic Information System (GIS) data gathering. • Project staking and validation.
CONSTRUCTION SAFETY:
• Provide Port Safety Training and Orientations for contractors, consultants and Full-Time Employees. • Review Contractors site safety plans for acceptance. • Weekly documented audits of construction projects. • Coordination with Operations, Fire Dept., PLA, Security, Port Construction Services (PCS), Risk
management, Building Department and Maintenance. • Response to and documentation of incidents, hazardous conditions and complaints. • Management of safety equipment and personal protective equipment (PPE) supplies for the Engineering
Department. • Management Emergency and Disaster preparedness supplies for the Engineering Department. • Data management of contactors safety plans, incidents corrective actions, and department training
records. • Data Management of Engineering Department training records.
ENGINEERING GENERAL AND ADMINISTRATION:
• Management of Port remote facilities, asset and fleet in support of Project delivery. • Emergency Response and Declaration of Emergency Support. • Engineering administrative services. PORT CONSTRUCTION SERVICES:
CONSTRUCTION MANAGEMENT OF SMALL WORKS CONSTRUCTION:
• Provide craft labor resources (carpenters, laborers, operators, etc.). • Provide construction equipment (pick-up trucks, dump trucks, heavy equipment, small tools, etc.). • Provide scope clarification and estimates against existing budgets. • Provide reporting on budget and schedule. • Recycle construction debris on projects.
Port of Seattle 2020 Budget Central Services
VII-14
PROJECT MANAGEMENT OF SMALL WORKS CONSTRUCTION PROJECTS:
• Communicate with Finance and Budget departments for approval of scope and budget. • Prepare estimates, work authorizations and service directives for small works contractors. • Provide required templates and checklists to Capital Services for review of plan and asset management. • Coordinate with partner departments for design review and approvals. • Reporting on project schedule and budgets.
o Perform construction quality inspections and document control for close out requirements. MANAGEMENT OF ASBESTOS ABATEMENT IN SUPPORT OF CONSTRUCTION PROJECTS:
• Review Regulated Materials Management (RMM) design. • Provide project monitoring and quality control. • Monitor project abatement. MANAGEMENT OF THE ASBESTOS OPERATIONS AND MAINTENANCE PROGRAM: • Provide RMM tenant support, RMM maintenance support, and RMM routine housekeeping. • Make periodic inspections. • Provide asbestos, lead, and silica awareness training. • Provide indoor air quality and mold inspections. PROVIDE SMALL BUSINESS OPPORTUNITIES IN OPEN ORDER AND PROJECT SPECIFIC SMALL WORKS CONTRACTS: • Coordinate contract requests with Central Procurement Office to identify opportunities for small businesses.
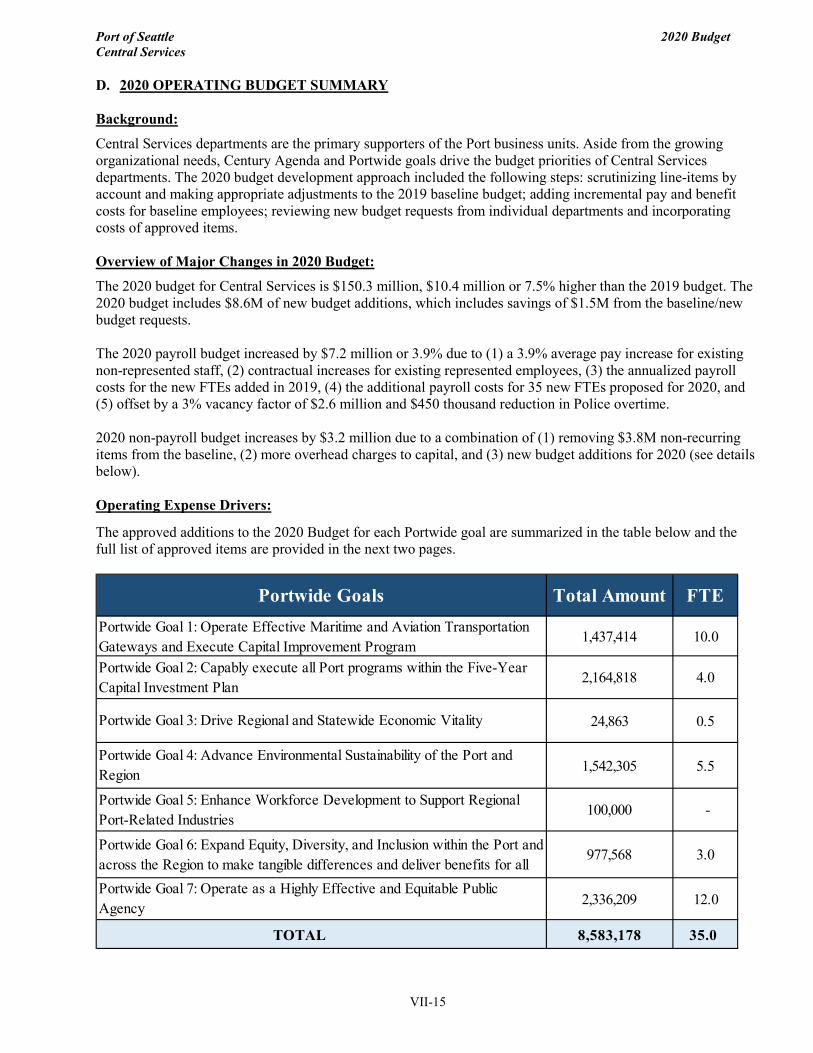
Port of Seattle 2020 Budget Central Services
VII-15
D. 2020 OPERATING BUDGET SUMMARY Background:
Central Services departments are the primary supporters of the Port business units. Aside from the growing organizational needs, Century Agenda and Portwide goals drive the budget priorities of Central Services departments. The 2020 budget development approach included the following steps: scrutinizing line-items by account and making appropriate adjustments to the 2019 baseline budget; adding incremental pay and benefit costs for baseline employees; reviewing new budget requests from individual departments and incorporating costs of approved items. Overview of Major Changes in 2020 Budget:
The 2020 budget for Central Services is $150.3 million, $10.4 million or 7.5% higher than the 2019 budget. The 2020 budget includes $8.6M of new budget additions, which includes savings of $1.5M from the baseline/new budget requests. The 2020 payroll budget increased by $7.2 million or 3.9% due to (1) a 3.9% average pay increase for existing non-represented staff, (2) contractual increases for existing represented employees, (3) the annualized payroll costs for the new FTEs added in 2019, (4) the additional payroll costs for 35 new FTEs proposed for 2020, and (5) offset by a 3% vacancy factor of $2.6 million and $450 thousand reduction in Police overtime. 2020 non-payroll budget increases by $3.2 million due to a combination of (1) removing $3.8M non-recurring items from the baseline, (2) more overhead charges to capital, and (3) new budget additions for 2020 (see details below). Operating Expense Drivers:
The approved additions to the 2020 Budget for each Portwide goal are summarized in the table below and the full list of approved items are provided in the next two pages.
1,437,414 10.0
2,164,818 4.0
24,863 0.5
1,542,305 5.5
100,000 -
977,568 3.0
2,336,209 12.0
TOTAL 8,583,178 35.0
Portwide Goal 7: Operate as a Highly Effective and Equitable Public Agency
Portwide Goal 4: Advance Environmental Sustainability of the Port and Region
Portwide Goal 5: Enhance Workforce Development to Support Regional Port-Related Industries
Portwide Goal 6: Expand Equity, Diversity, and Inclusion within the Port and across the Region to make tangible differences and deliver benefits for all
Portwide GoalsPortwide Goal 1: Operate Effective Maritime and Aviation Transportation Gateways and Execute Capital Improvement ProgramPortwide Goal 2: Capably execute all Port programs within the Five-Year Capital Investment Plan
Portwide Goal 3: Drive Regional and Statewide Economic Vitality
Total Amount FTE
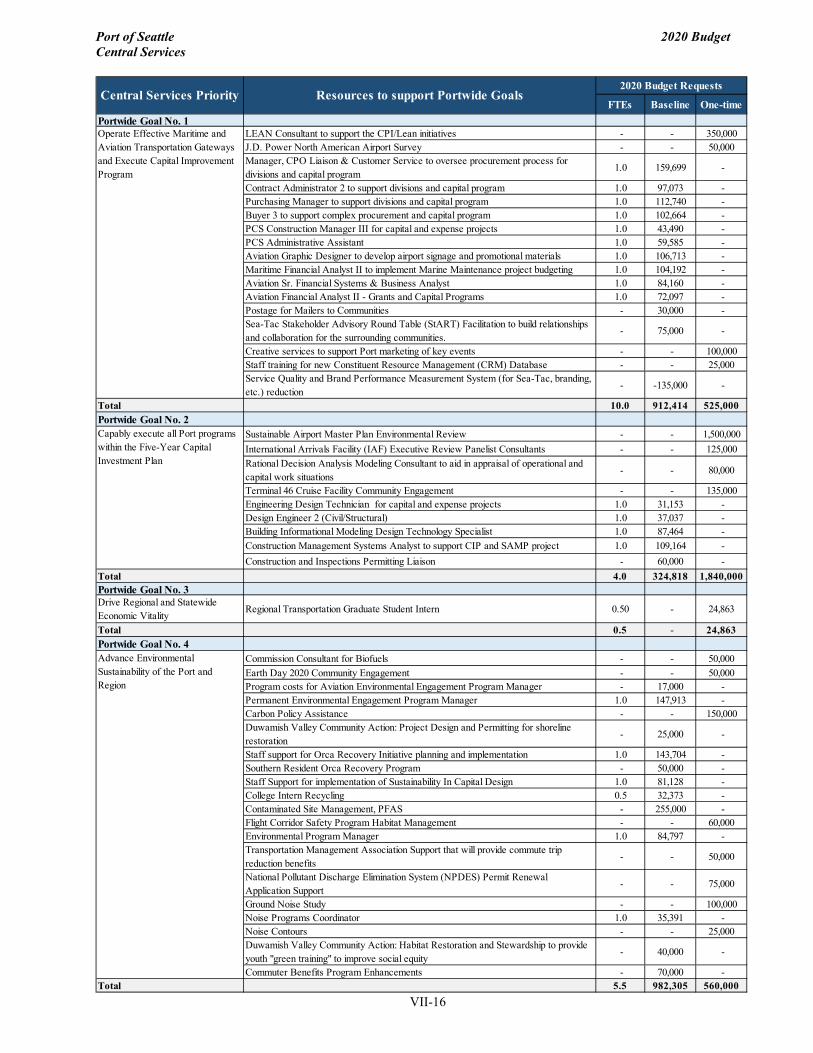
Port of Seattle 2020 Budget Central Services
VII-16
FTEs Baseline One-timePortwide Goal No. 1
LEAN Consultant to support the CPI/Lean initiatives - - 350,000J.D. Power North American Airport Survey - - 50,000Manager, CPO Liaison & Customer Service to oversee procurement process for divisions and capital program
1.0 159,699 -
Contract Administrator 2 to support divisions and capital program 1.0 97,073 -Purchasing Manager to support divisions and capital program 1.0 112,740 -Buyer 3 to support complex procurement and capital program 1.0 102,664 -PCS Construction Manager III for capital and expense projects 1.0 43,490 -PCS Administrative Assistant 1.0 59,585 -Aviation Graphic Designer to develop airport signage and promotional materials 1.0 106,713 -Maritime Financial Analyst II to implement Marine Maintenance project budgeting 1.0 104,192 -Aviation Sr. Financial Systems & Business Analyst 1.0 84,160 -Aviation Financial Analyst II - Grants and Capital Programs 1.0 72,097 -Postage for Mailers to Communities - 30,000 -Sea-Tac Stakeholder Advisory Round Table (StART) Facilitation to build relationships and collaboration for the surrounding communities.
- 75,000 -
Creative services to support Port marketing of key events - - 100,000Staff training for new Constituent Resource Management (CRM) Database - - 25,000Service Quality and Brand Performance Measurement System (for Sea-Tac, branding, etc.) reduction
- -135,000 -
Total 10.0 912,414 525,000Portwide Goal No. 2
Sustainable Airport Master Plan Environmental Review - - 1,500,000International Arrivals Facility (IAF) Executive Review Panelist Consultants - - 125,000Rational Decision Analysis Modeling Consultant to aid in appraisal of operational and capital work situations
- - 80,000
Terminal 46 Cruise Facility Community Engagement - - 135,000Engineering Design Technician for capital and expense projects 1.0 31,153 -Design Engineer 2 (Civil/Structural) 1.0 37,037 -Building Informational Modeling Design Technology Specialist 1.0 87,464 -Construction Management Systems Analyst to support CIP and SAMP project 1.0 109,164 -Construction and Inspections Permitting Liaison - 60,000 -
Total 4.0 324,818 1,840,000Portwide Goal No. 3Drive Regional and Statewide Economic Vitality
Regional Transportation Graduate Student Intern 0.50 - 24,863
Total 0.5 - 24,863Portwide Goal No. 4
Commission Consultant for Biofuels - - 50,000Earth Day 2020 Community Engagement - - 50,000Program costs for Aviation Environmental Engagement Program Manager - 17,000 -Permanent Environmental Engagement Program Manager 1.0 147,913 -Carbon Policy Assistance - - 150,000Duwamish Valley Community Action: Project Design and Permitting for shoreline restoration
- 25,000 -
Staff support for Orca Recovery Initiative planning and implementation 1.0 143,704 -Southern Resident Orca Recovery Program - 50,000 -Staff Support for implementation of Sustainability In Capital Design 1.0 81,128 -College Intern Recycling 0.5 32,373 -Contaminated Site Management, PFAS - 255,000 -Flight Corridor Safety Program Habitat Management - - 60,000Environmental Program Manager 1.0 84,797 -Transportation Management Association Support that will provide commute trip reduction benefits
- - 50,000
National Pollutant Discharge Elimination System (NPDES) Permit Renewal Application Support
- - 75,000
Ground Noise Study - - 100,000Noise Programs Coordinator 1.0 35,391 -Noise Contours - - 25,000Duwamish Valley Community Action: Habitat Restoration and Stewardship to provide youth "green training" to improve social equity
- 40,000 -
Commuter Benefits Program Enhancements - 70,000 -Total 5.5 982,305 560,000
2020 Budget Requests Central Services Priority Resources to support Portwide Goals
Capably execute all Port programs within the Five-Year Capital Investment Plan
Advance Environmental Sustainability of the Port and Region
Operate Effective Maritime and Aviation Transportation Gateways and Execute Capital Improvement Program

Port of Seattle 2020 Budget Central Services
VII-17
FTEs Baseline One-timePortwide Goal No. 5Enhance Workforce Development to Support Regional Port-Related Industries
Maritime Secondary Education - 100,000 -
Total - 100,000 -Portwide Goal No. 6
Non-English Language Proficient Communications - - 40,000Equity Diversity and Inclusion (EDI) Aviation Manager 1.0 162,183 -EDI Analyst, Data/Research and Policy Analysis 1.0 146,202 -Manager EDI Communications 1.0 162,183 -Implementation of the new EDI strategy - 175,000 -Duwamish Valley Community Equity Program - 292,000 -
Total 3.0 937,568 40,000Portwide Goal No. 7
Port Management Training Program - 34,125 -Port Management Training Program/Talent Development Specialist 1.0 116,686 -Applicant Tracking System and Implementation Consulting Services - 43,000 -Compensation Program Consulting Support - 75,000 -Temporary Agency Services - 35,000 -Workers Comp Claims and Safety Administrative Assistant 1.0 100,770 -Sr. Talent Acquisition Representative 1.0 140,923 -Employee Relations Consultant 1.0 105,465 -Increase in Outside Legal Services - 250,000 -Insurance tracking platform/cloud based - 40,000 -Increase in software costs - 676,000 -Network hardware maintenance - 133,000 -Rightsize PC Refresh cost - 322,000 -Software Developers to Sales Force Systems to provide new features and support 1.0 39,836 -Desktop Support Specialist 1.0 109,467 -Software Test Engineer 1.0 37,173 -Web Coordinator 1.0 89,588 -Storytelling with Data Workshops - - 17,500Storytelling Consultant - - 25,000Conferences / Travel - - 20,000OSI Administrative Assistant 1.0 87,998 -Disruptions Summit - - 10,000Jail Cost Increase - 50,000 -Police/Fire Communication Specialist 1.0 80,141 -Police Specialist 1.0 67,018 -Credit Analyst 1.0 125,018 -SharePoint Migration Oversight - - 15,000East King County Community & Government Relations Program Budget - 70,500 -Port-Hosted Travel Education Program - 100,000 -Savings/Offset (OT Reduction) for Police - -450,000 -Savings offset for External Relations - -180,000 -Commission Contingency Reduction - -50,000 -
Total 12.0 2,248,709 87,500
35.0 5,505,815 3,077,363
2020 Budget Requests Central Services Priority Resources to support Portwide Goals
Central Services Total - 2020 Budget Requests
Expand Equity, Diversity, and Inclusion within the Port and across the Region to make tangible differences and deliver benefits for all
Operate as a Highly Effective and Equitable Public Agency

Port of Seattle 2020 Budget Central Services
VII-18
The following Tables VII-2 and VII-3 and Figure VII-1 illustrate the administrative expense for Central Services by department and by account: TABLE VII-2: CENTRAL SERVICES EXPENSE BY DEPARTMENT
Notes: 1) Does not include adjustment for charges into Corporate Sub-Classes from Divisions.
($ in 000's) % Change2018 2019 2020 2020 Bud-
BY DEPARTMENT Notes Actual Budget Budget 2019 BudEXPENSES BEFORE CHARGES TO CAP/GOVT/ENVRS PROJECTS
Commission 1,848$ 2,153$ 2,165$ 0.5%Executive 2,136 1,995 2,355 18.1%Legal 3,995 3,624 4,059 12.0%External Relations 7,362 8,367 11,174 33.5%Human Resources 8,430 10,250 11,690 14.0%Labor Relations 1,079 1,330 1,386 4.2%Internal Audit 1,521 1,916 1,749 -8.7%Accounting & Financial Reporting 7,199 8,500 9,024 6.2%Information & Communications Technology 25,413 27,774 30,301 9.1%Finance & Budget 5,645 6,635 7,215 8.7%Business Intelligence 1,323 2,139 2,209 3.2%Risk Services 3,095 3,328 3,438 3.3%Office of Strategic Initiatives 1,596 1,776 1,619 -8.8%Central Procurement Office 6,072 6,847 8,230 20.2%Security and Preparedness 376 - - 0.0%Information Security 954 1,774 1,968 11.0%Equity, Diversity and Inclusion 1,561 3,271 4,465 36.5%Contingency 185 250 (2,702) -1180.6%Environment & Sustainability 10,306 14,916 14,565 -2.4%Police 23,911 30,778 31,444 2.2%Engineering 23,707 32,088 33,559 4.6%Port Construction Services 8,081 7,911 9,627 21.7% Total Expenses Before Charges to Cap/Govt/Envrs Projects 1 145,795 177,620 189,541 6.7%
CHARGES TO CAPITAL/GOVT/ENVRS PROJECTS (29,699) (37,720) (39,210) 4.0%
OPERATING & MAINTENANCE EXPENSECommission 1,848 2,153 2,165 0.5%Executive 2,136 1,995 2,355 18.1%Legal 3,948 3,568 4,001 12.1%Public Affairs 7,362 8,367 11,070 32.3%Human Resources 8,430 10,250 11,690 14.0%Labor Relations 1,079 1,330 1,386 4.2%Internal Audit 1,521 1,916 1,749 -8.7%Accounting & Financial Reporting 6,842 8,500 9,024 6.2%Information & Communications Technology 21,961 23,966 26,013 8.5%Finance & Budget 5,593 6,371 7,039 10.5%Business Intelligence 1,323 2,139 2,209 3.2%Risk Services 3,095 3,328 3,438 3.3%Office of Strategic Initiatives 1,596 1,776 1,619 -8.8%Central Procurement Office 4,630 4,678 5,988 28.0%Security and Preparedness 376 - - 0.0%Information Security 934 1,774 1,968 11.0%Equity, Diversity and Inclusion 1,561 3,271 4,465 36.5%Contingency 185 250 (2,702) -1180.6%Environment & Sustainability 8,770 13,224 12,866 -2.7%Police 23,908 30,778 31,444 2.2%Engineering 5,478 7,530 8,796 16.8%Port Construction Services 3,522 2,739 3,748 36.8% Total Operating Expenses 1 116,097$ 139,900$ 150,331$ 7.5%
adminbud.xls
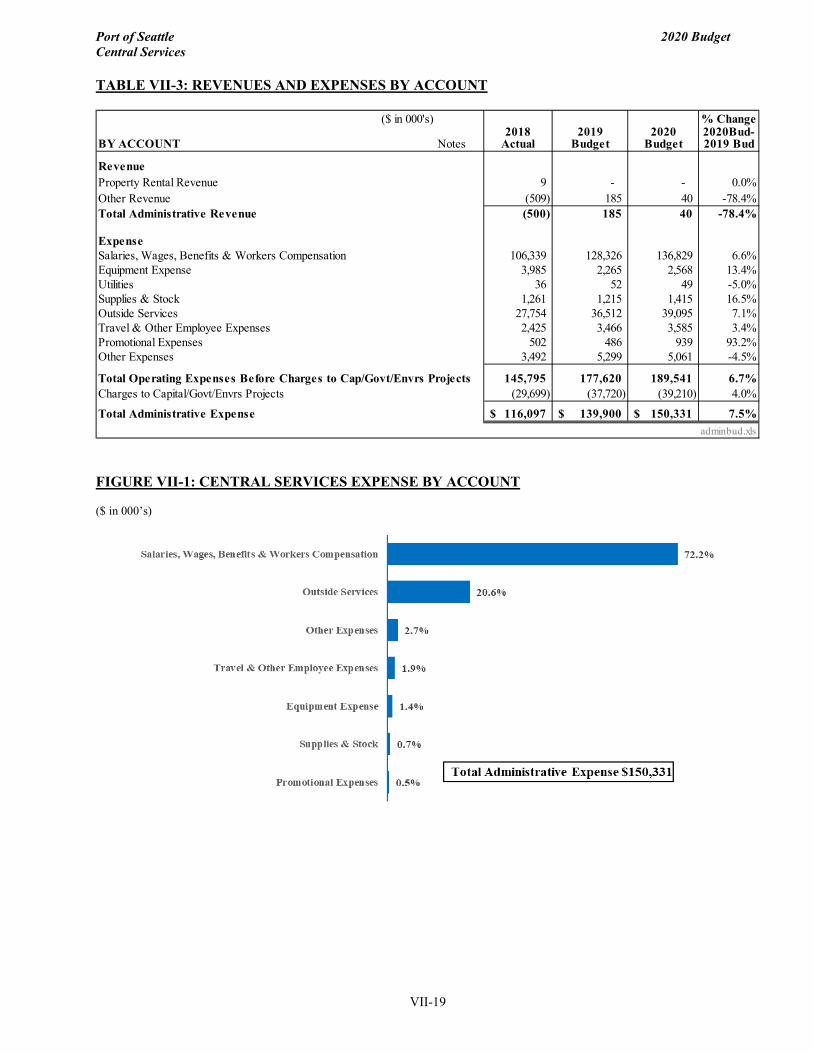
Port of Seattle 2020 Budget Central Services
VII-19
TABLE VII-3: REVENUES AND EXPENSES BY ACCOUNT
FIGURE VII-1: CENTRAL SERVICES EXPENSE BY ACCOUNT ($ in 000’s)
($ in 000's) % Change2018 2019 2020 2020Bud-
BY ACCOUNT Notes Actual Budget Budget 2019 Bud
RevenueProperty Rental Revenue 9 - - 0.0%Other Revenue (509) 185 40 -78.4%Total Administrative Revenue (500) 185 40 -78.4%
ExpenseSalaries, Wages, Benefits & Workers Compensation 106,339 128,326 136,829 6.6%Equipment Expense 3,985 2,265 2,568 13.4%Utilities 36 52 49 -5.0%Supplies & Stock 1,261 1,215 1,415 16.5%Outside Services 27,754 36,512 39,095 7.1%Travel & Other Employee Expenses 2,425 3,466 3,585 3.4%Promotional Expenses 502 486 939 93.2%Other Expenses 3,492 5,299 5,061 -4.5% Total Operating Expenses Before Charges to Cap/Govt/Envrs Projects 145,795 177,620 189,541 6.7%Charges to Capital/Govt/Envrs Projects (29,699) (37,720) (39,210) 4.0%
Total Administrative Expense 116,097$ 139,900$ 150,331$ 7.5%adminbud.xls
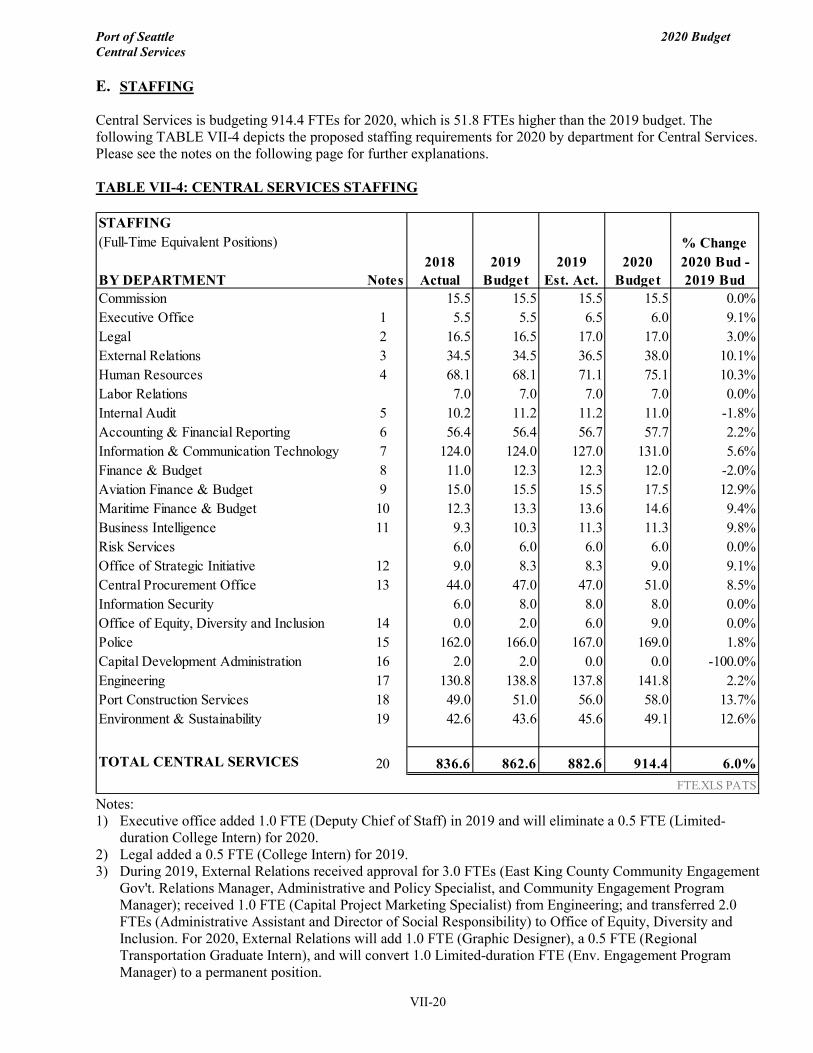
Port of Seattle 2020 Budget Central Services
VII-20
E. STAFFING Central Services is budgeting 914.4 FTEs for 2020, which is 51.8 FTEs higher than the 2019 budget. The following TABLE VII-4 depicts the proposed staffing requirements for 2020 by department for Central Services. Please see the notes on the following page for further explanations. TABLE VII-4: CENTRAL SERVICES STAFFING
Notes: 1) Executive office added 1.0 FTE (Deputy Chief of Staff) in 2019 and will eliminate a 0.5 FTE (Limited-
duration College Intern) for 2020. 2) Legal added a 0.5 FTE (College Intern) for 2019. 3) During 2019, External Relations received approval for 3.0 FTEs (East King County Community Engagement
Gov't. Relations Manager, Administrative and Policy Specialist, and Community Engagement Program Manager); received 1.0 FTE (Capital Project Marketing Specialist) from Engineering; and transferred 2.0 FTEs (Administrative Assistant and Director of Social Responsibility) to Office of Equity, Diversity and Inclusion. For 2020, External Relations will add 1.0 FTE (Graphic Designer), a 0.5 FTE (Regional Transportation Graduate Intern), and will convert 1.0 Limited-duration FTE (Env. Engagement Program Manager) to a permanent position.
STAFFING(Full-Time Equivalent Positions) % Change
2018 2019 2019 2020 2020 Bud -BY DEPARTMENT Notes Actual Budget Est. Act. Budget 2019 BudCommission 15.5 15.5 15.5 15.5 0.0%Executive Office 1 5.5 5.5 6.5 6.0 9.1%Legal 2 16.5 16.5 17.0 17.0 3.0%External Relations 3 34.5 34.5 36.5 38.0 10.1%Human Resources 4 68.1 68.1 71.1 75.1 10.3%Labor Relations 7.0 7.0 7.0 7.0 0.0%Internal Audit 5 10.2 11.2 11.2 11.0 -1.8%Accounting & Financial Reporting 6 56.4 56.4 56.7 57.7 2.2%Information & Communication Technology 7 124.0 124.0 127.0 131.0 5.6%Finance & Budget 8 11.0 12.3 12.3 12.0 -2.0%Aviation Finance & Budget 9 15.0 15.5 15.5 17.5 12.9%Maritime Finance & Budget 10 12.3 13.3 13.6 14.6 9.4%Business Intelligence 11 9.3 10.3 11.3 11.3 9.8%Risk Services 6.0 6.0 6.0 6.0 0.0%Office of Strategic Initiative 12 9.0 8.3 8.3 9.0 9.1%Central Procurement Office 13 44.0 47.0 47.0 51.0 8.5%Information Security 6.0 8.0 8.0 8.0 0.0%Office of Equity, Diversity and Inclusion 14 0.0 2.0 6.0 9.0 0.0%Police 15 162.0 166.0 167.0 169.0 1.8%Capital Development Administration 16 2.0 2.0 0.0 0.0 -100.0%Engineering 17 130.8 138.8 137.8 141.8 2.2%Port Construction Services 18 49.0 51.0 56.0 58.0 13.7%Environment & Sustainability 19 42.6 43.6 45.6 49.1 12.6%
TOTAL CENTRAL SERVICES 20 836.6 862.6 882.6 914.4 6.0%FTE.XLS PATS
Port of Seattle 2020 Budget Central Services
VII-21
4) Human Resources added 3.0 FTEs (HR Data Analyst, Workers Compensation Claims Manager, and Commuter Benefits Program Administrator) in 2019. For 2020, Human Resources will add 4.0 FTEs (Port Management Training Program/Talent Development Specialist, Workers Comp Claims and Safety Administrative Assistant, Sr. Talent Acquisition Representative, and Employee Relations Consultant).
5) Internal Audit will eliminate a 0.2 FTE (College Intern) in 2020. 6) Accounting & Financial Reporting added a 0.25 FTE (College Intern) in 2019 and will add 1.0 FTE (Credit
Analyst) in 2020. 7) During 2019, Information & Communication Technology (ICT) added 1.0 FTE (Desktop Support Specialist
for Police support) and received 2.0 FTEs (Telecomm Infrastructure Engineer and Project Manager) from Engineering. ICT will add 4.0 FTEs (Software Developer to Sales Force Systems, Desktop Support Specialist, Software Test Engineer, and Web Coordinator) in 2020.
8) Finance and Budget will eliminate a 0.25 FTE (Limited-duration Sr. Port Budget Analyst) in 2020. 9) Aviation Finance & Budget will add 2.0 FTEs (Sr. Financial Systems & Business Analyst and Financial
Analyst II - Grants and Capital Programs) in 2020. 10) Maritime Finance & Budget added a 0.25 FTE (College Intern) in 2019 and will add 1.0 FTE (Financial
Analyst II) in 2020. 11) Business Intelligence (BI) will add 1.0 FTE (BI Assistant) in 2020. 12) Office of Strategic Initiative will eliminate a 0.25 FTE (Limited-duration Program Manager) and add 1.0
FTE (Administrative Assistant) in 2020. 13) Central Procurement Office will add 4.0 FTEs (CPO Liaison and Customer Service Manager, Contract
Administrator II, Buyer 5/Purchasing Manager, and Buyer 3) in 2020. 14) During 2019, Office of Equity, Diversity and Inclusion (EDI) received 2.0 FTEs (Administrative Assistant
and Director of Social Responsibility) from External Relations. Additionally, Workforce Development department (with 2.0 FTEs: Manager and Sr. Administrative Assistant) was transferred from Economic Development Division. In 2020, EDI will add 3.0 FTEs (EDI Aviation Manager, Data/Research and Policy Analyst, and Manager/EDI Communications).
15) Police added 1.0 FTE (Auto Theft Task Force Detective) in 2019 and will add 2.0 FTEs (Police Specialist and Police/Fire Communications Specialist) in 2020.
16) Capital Development Administration was eliminated as part of the 2019 organizational realignment. 17) In 2019, Engineering transferred 2.0 FTEs (Electronic Tech Systems Foreman) to Aviation Maintenance, 2.0
FTEs (Project Manager and Telecommunications Infrastructure Engineer) to ICT, and 1.0 FTE (Capital Project Marketing Specialist) to External Relations. Engineering also received mid-year approval for 4.0 FTEs (Construction Labor Specialist, 2 Construction Inspector II and Resident Engineer II). A total of 4.0 FTEs (Engineering Design Technician, Design Engineer 2 (Civil/Structural), BIM Design Technology Specialist, and Construction Management Systems Analyst) will be added in 2020.
18) Port Construction Services added 5.0 FTEs (laborers) in 2019 and will add 2.0 FTEs (Administrative Assistant and PCS Construction Manager III) in 2020.
19) Environmental & Sustainability added 2.0 FTEs (Limited-duration Sr. Env. Management Specialist and Transportation Management Program Manager) in 2019. For 2020, Environmental & Sustainability will add 4.0 FTEs (Orca Recovery Initiative Planning and Implementation staff, Support staff for the Implementation of Sustainability in Capital Design, Env. Program Manager, Noise Programs Coordinator, and 0.5 Intern for the Recycling Program); and transfer 1.0 FTE (Sr Environmental Program Manager) to the Stormwater Utility.
20) Total FTE count for 2019 Budget was adjusted to reflect 940.30 instead of 940.35 due to discrepancy in Intern count.

Port of Seattle 2020 Budget Central Services
VII-22
F. CAPITAL BUDGET
Central Services has a total capital budget of $15.0 million for 2020. For more detail refer to the Capital Improvement Plan, Section IX. TABLE VII-5 provides a summary of the Central Services 2020-2024 capital budget. TABLE VII-5: CENTRAL SERVICES CAPITAL BUDGET
G. FINANCIAL AND FTE SUMMARY TABLE VII-6: FINANCIAL AND FTE SUMMARY
($ in 000's) 2020 2020-2024Budget CIP
Committed Capital ProjectsICT Business Services 10,057$ 21,061$ 73.4%General and Capital Development 3,646 10,976 26.6%
Total Committed 13,703$ 32,037$ 100.0%
Business Plan Prospective Projects 6,345$ 11,170$
CIP Cashflow Adjustment Reserve (5,000)$ -$
Total CIP 15,048$ 43,207$ CAPSUM
% of 2020 Total Committed
GrowthActual Budget 2020Bud-
OPERATING BUDGET Notes 2018 2020 2019 Bud
Operating Revenue (500)$ 185$ 498$ 40$ -78.4%
Central Services Expense 92,188 109,122 105,357 118,887 8.9%Law Enforcement Costs 23,908 30,778 29,578 31,444 2.2% Total 116,097 139,900 134,934 150,331 7.5%
Income from Operations (116,597)$ (139,715)$ (134,436)$ (150,291)$ 7.6%
CAPITAL SPENDING 9,707$ 13,482$ 11,414$ 13,703$ 1.6%
TOTAL FTEs 836.6 862.6 882.6 914.4 6.0%admhist.xls
Forecast
2019
Budget
($ in 000's)

VIII. TA
X LE
VY
VIII. TAX LEVY

Port of Seattle 2020 Budget Tax Levy
VIII-1
TAX LEVY
A. TAX AT A GLANCE • The maximum allowable levy for 2020 is $106.3 million. • For 2020 the preliminary levy is $76.38 million, a three percent increase over the 2019 levy of $74.16
million. • The estimated 2020 millage rate is $0.120. • The 2020 levy will be used for:
o General Obligation (G.O.) Bonds Debt Service o Capital projects specifically endorsed by the Commission o Regional Transportation projects o Environmental Remediation o Airport Community Ecology funding and energy and sustainability policy directives o Workforce development, tourism and economic development partnership grants o City of SeaTac safety enhancements o Local community advertising at Sea-Tac Airport o Highline Schools Noise Projects o South King County Fund o Sustainable Aviation Fuels and Air Emissions Program o Duwamish Valley Community Equity Program
B. TAX LEVY SOURCES
TYPES AND LIMITS OF LEVIES:
Regular Tax Levy
The County Treasurer acts as an agent to collect property taxes levied in the County for all taxing authorities. Taxes are levied annually on January 1 on property value listed as of the prior year. Assessed values are established by the County Assessor at 100% of fair market value. A re-evaluation of all properties is required annually. Taxes are due in two equal installments on April 30 and October 31. Collections are distributed to the Port by the County Treasurer. The Port is permitted to levy up to $0.45 per $1,000 of Assessed Valuation for general Port purposes under Washington State law in Revised Code of Washington (“RCW”) Chapter 53.36. The levy may go beyond the $0.45 limit to provide for G.O. Bonds debt service. However, the rate may be reduced below the $0.45 limit for the following reason: RCW Chapter 84.55 limits the annual growth of regular property taxes to the lesser of 1% or the inflation rate, where inflation is measured by the percentage change in the implicit price deflator for personal consumption expenditures for the United States, after adjustments for new construction. This 1% limit factor was instituted by Initiative 747 that Washington State voters approved in November 2001. Prior to the passage of the Initiative, the growth limit was the lesser of 6% or the inflation rate (for levy limit calculation see Section XI Statutory Budget).
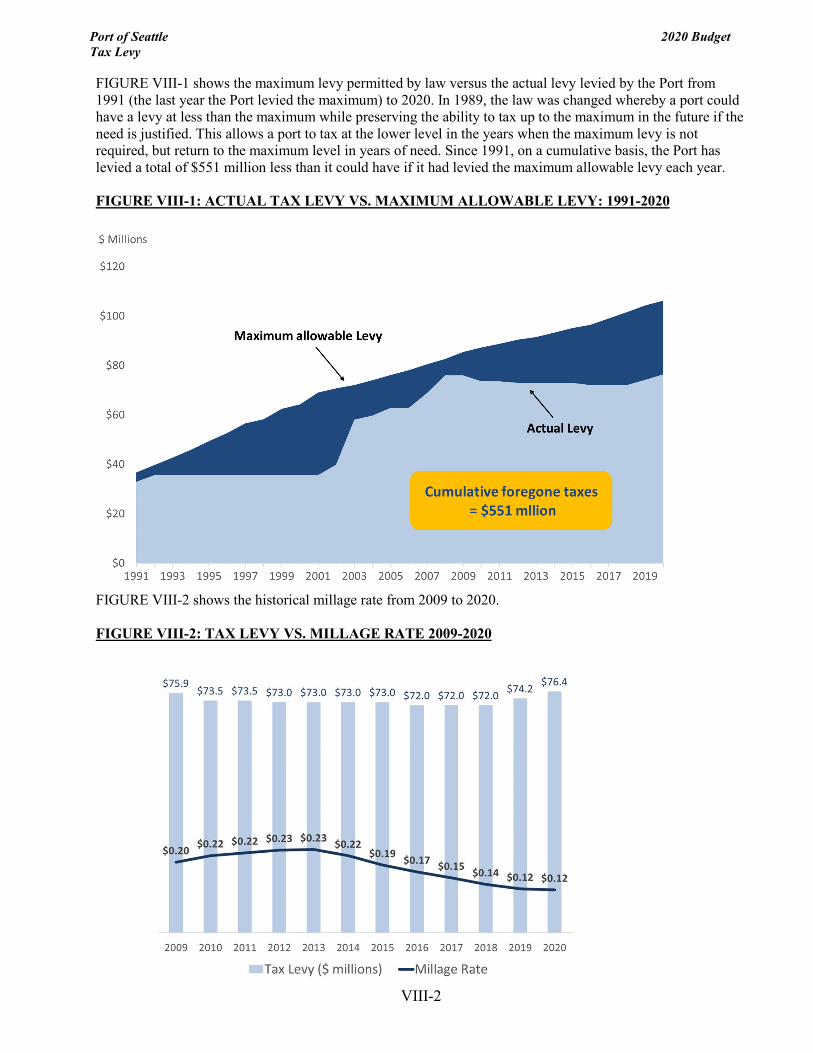
Port of Seattle 2020 Budget Tax Levy
VIII-2
FIGURE VIII-1 shows the maximum levy permitted by law versus the actual levy levied by the Port from 1991 (the last year the Port levied the maximum) to 2020. In 1989, the law was changed whereby a port could have a levy at less than the maximum while preserving the ability to tax up to the maximum in the future if the need is justified. This allows a port to tax at the lower level in the years when the maximum levy is not required, but return to the maximum level in years of need. Since 1991, on a cumulative basis, the Port has levied a total of $551 million less than it could have if it had levied the maximum allowable levy each year. FIGURE VIII-1: ACTUAL TAX LEVY VS. MAXIMUM ALLOWABLE LEVY: 1991-2020
FIGURE VIII-2 shows the historical millage rate from 2009 to 2020. FIGURE VIII-2: TAX LEVY VS. MILLAGE RATE 2009-2020

Port of Seattle 2020 Budget Tax Levy
VIII-3
Special Tax Levies
Special levies approved by the voters are not subject to the same limitations as the regular levy. The Port can levy property taxes for dredging, canal construction, leveling or filling upon approval of the majority of voters within the Port District, not to exceed $0.45 per $1,000 of Assessed Value of taxable property within the Port District. Industrial Development District Tax Levies
The Port may also levy property taxes for Industrial Development Districts (under a comprehensive scheme of harbor improvements), for two multi-year periods. The Port of Seattle levied the tax for a six-year period between 1963 and 1968 for property acquisition and development of the lower Duwamish River. In 2015, the rules governing the IDD tax levy were modified by the Washington State Legislature. Under the new rules, if the Port intends to levy this tax for a second multi-year period (not to exceed twenty years), the Port must adopt a resolution approving the use of the second levy period and publish notice of intent to impose such a levy no later than April 1 of the year prior to the first collection year. If a petition is filed with signatures of at least eight percent (8%) of the voters, the question of whether or not the levy can be imposed will be decided by voters. The amount of the Industrial Development Levy that could be imposed is now calculated on the Assessed Valuation of taxable property within the Port District in the year prior to the first collection year. This aggregate amount is calculated at $2.70/$1,000 of assessed value and represents the total amount that can be levied over the second levy period. The Port has not levied the second multi-year period, but if the Port were to Levy under this law, Port may levy up to an estimated $1.8 billion over the twenty-year period, with the collection period beginning no sooner than 2021. C. TAX LEVY USES During the annual budget process, the Commission reviews and approves the amount of and use of the tax levy. For 2020 the preliminary tax levy is $76.38 million, a 3% increase from the $74.16 million levy in 2019. This increase will help fund a significant 2020-2024 capital improvement plan that invests in key maritime and economic development projects aimed at maintaining Port assets, advancing maritime industries, supporting Seattle’s working waterfront, and investing in local communities and the environment. Such projects include Northwest Seaport Alliance (NWSA) container improvements in the North Harbor (Seattle), specifically the Terminal 5 modernization effort, as well as redevelopment efforts at Fisherman’s Terminal and Terminal 91, and habitat restoration at Terminal 117. The 2020 levy is expected to fund $39.8 million in G.O. bond debt service. See Table VIII-2 for the complete allocation of 2020 G.O. bond debt service by project. In 2020, the Port estimates funding $24.8 million of capital expenditures with the tax levy. In addition to the projects already noted, other projects include NWSA container infrastructure improvements at facilities located in the North Harbor, other maritime projects in support of the fishing industry, uplands industrial development and berth improvement projects at Terminal 91, as well as the modernization of Bell Harbor International Conference Center at Pier 66. The levy is also expected to fund an additional $8.2 million in environmental remediation expenses in 2020. The levy has not traditionally been used for projects at the Airport; however, the Commission has approved the use of the levy for specific community benefit programs not otherwise eligible for Airport funding due to FAA regulations. These include safety enhancements in the City of SeaTac and noise mitigation improvements at certain Highline School District schools near the Airport. The timing of Highline School District funding is dependent on the Highline School District, with certain spending expected in 2020. In 2019, the Commission approved an additional $15 million for two key airport programs; spending on these programs that is not eligible for airport funding is expected to come from the tax levy. The programs are $5 million for the development of sustainable airport fuels and reduction of air emissions at the Airport, and $10
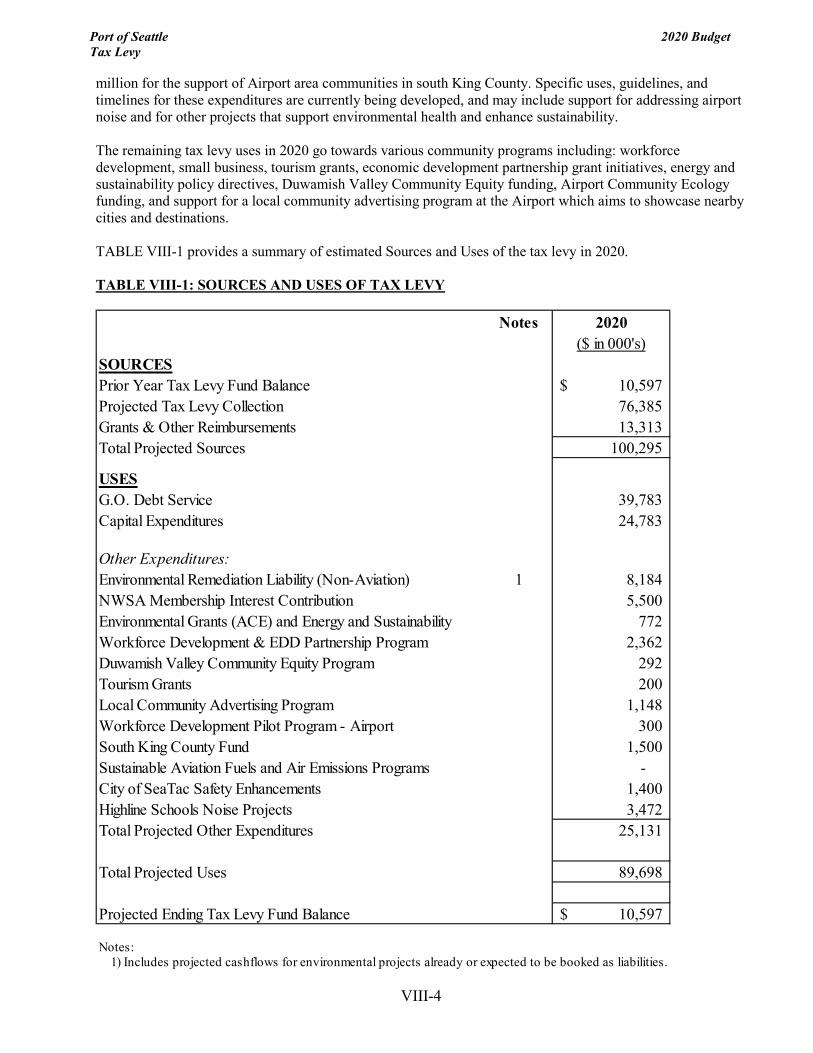
Port of Seattle 2020 Budget Tax Levy
VIII-4
million for the support of Airport area communities in south King County. Specific uses, guidelines, and timelines for these expenditures are currently being developed, and may include support for addressing airport noise and for other projects that support environmental health and enhance sustainability. The remaining tax levy uses in 2020 go towards various community programs including: workforce development, small business, tourism grants, economic development partnership grant initiatives, energy and sustainability policy directives, Duwamish Valley Community Equity funding, Airport Community Ecology funding, and support for a local community advertising program at the Airport which aims to showcase nearby cities and destinations. TABLE VIII-1 provides a summary of estimated Sources and Uses of the tax levy in 2020. TABLE VIII-1: SOURCES AND USES OF TAX LEVY
Notes 2020($ in 000's)
SOURCESPrior Year Tax Levy Fund Balance 10,597$ Projected Tax Levy Collection 76,385 Grants & Other Reimbursements 13,313 Total Projected Sources 100,295
USESG.O. Debt Service 39,783 Capital Expenditures 24,783
Other Expenditures:Environmental Remediation Liability (Non-Aviation) 1 8,184 NWSA Membership Interest Contribution 5,500 Environmental Grants (ACE) and Energy and Sustainability 772 Workforce Development & EDD Partnership Program 2,362 Duwamish Valley Community Equity Program 292 Tourism Grants 200 Local Community Advertising Program 1,148 Workforce Development Pilot Program - Airport 300 South King County Fund 1,500 Sustainable Aviation Fuels and Air Emissions Programs - City of SeaTac Safety Enhancements 1,400 Highline Schools Noise Projects 3,472 Total Projected Other Expenditures 25,131
Total Projected Uses 89,698
Projected Ending Tax Levy Fund Balance 10,597$
Notes: 1) Includes projected cashflows for environmental projects already or expected to be booked as liabilities.
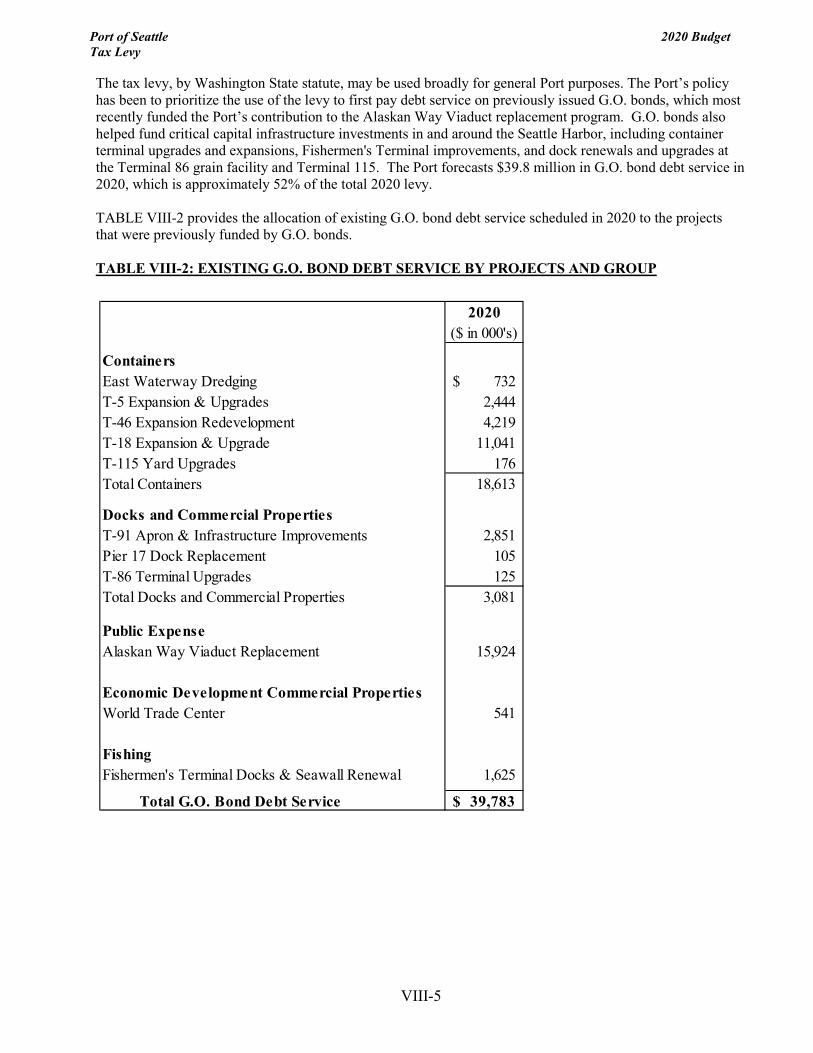
Port of Seattle 2020 Budget Tax Levy
VIII-5
The tax levy, by Washington State statute, may be used broadly for general Port purposes. The Port’s policy has been to prioritize the use of the levy to first pay debt service on previously issued G.O. bonds, which most recently funded the Port’s contribution to the Alaskan Way Viaduct replacement program. G.O. bonds also helped fund critical capital infrastructure investments in and around the Seattle Harbor, including container terminal upgrades and expansions, Fishermen's Terminal improvements, and dock renewals and upgrades at the Terminal 86 grain facility and Terminal 115. The Port forecasts $39.8 million in G.O. bond debt service in 2020, which is approximately 52% of the total 2020 levy. TABLE VIII-2 provides the allocation of existing G.O. bond debt service scheduled in 2020 to the projects that were previously funded by G.O. bonds. TABLE VIII-2: EXISTING G.O. BOND DEBT SERVICE BY PROJECTS AND GROUP
2020 ($ in 000's)
ContainersEast Waterway Dredging 732$ T-5 Expansion & Upgrades 2,444T-46 Expansion Redevelopment 4,219T-18 Expansion & Upgrade 11,041T-115 Yard Upgrades 176Total Containers 18,613
Docks and Commercial PropertiesT-91 Apron & Infrastructure Improvements 2,851Pier 17 Dock Replacement 105T-86 Terminal Upgrades 125Total Docks and Commercial Properties 3,081
Public ExpenseAlaskan Way Viaduct Replacement 15,924
Economic Development Commercial PropertiesWorld Trade Center 541
FishingFishermen's Terminal Docks & Seawall Renewal 1,625
Total G.O. Bond Debt Service 39,783$

Port of Seattle 2020 Budget Tax Levy
VIII-6
The Port has also used existing tax levy funds to support the following:
• Transportation & Infrastructure Reserve Fund (TIF) From time to time, the Port partners with the State and other local governments to invest in mutually beneficial transportation initiatives. The Port currently has an estimated $66.7 million of tax levy funds set aside in the Commission-designated Transportation & Infrastructure Reserve Fund (TIF), which has been and will be used to fund the Port’s contribution and obligations towards multiple regional mobility and transportation efforts. See Table VIII-3 for summary of project spending. TABLE VIII-3: USES OF TRANSPORTATION AND INFRASTRUCTURE FUND
In 2015, the Port entered into a Memorandum of Understanding (MOU) with the City of Seattle to establish a heavy haul network, which will allow heavier cargo containers to be transported between the Port of Seattle, industrial businesses and rail yards. The MOU provides the framework to repair and build roadways within the network, calls for semi-annual safety inspections of heavy haul trucks, and aligns weight regulations with the state and other municipalities across the country. The heavy haul network will also eliminate citations from the State Patrol to truck drivers for carrying overweight loads. As part of this MOU, the Port agreed to fund between $10.0 million and $20.0 million over a 20-year period for existing and future roadway repairs and reconstruction within the network. The Port forecasts $2.0 million of this funding will occur in 2019. As the Puget Sound region continues to experience unprecedented growth, the increased traffic has created mobility and safety challenges within local transportation corridors. In 2017, the Port entered into an MOU for $20 million with the City of Seattle to launch the Safe and Swift Corridor Program to support projects and other efforts to improve transportation flow and safety along key freight transportation corridors, including South Spokane Street, 15th Avenue West/Elliott Avenue West/Mercer Street and Lander Street Bridge (currently underway and expected to be complete in mid-2020). The Port forecasts $4.0 million of this funding will occur in 2019. In 2018, the Port, along with multiple local cities, entered into an MOU with the State of Washington for the Gateway Program. The Port agreed to provide $30 million of funding for Washington State Route 509 improvements near the Airport. The TIF will also help continue funding other public expense items related to regional mobility and transportation such as East Marginal Way grade separation, North Argo Yard Express Access, and the Freight Action Strategy for Seattle-Tacoma (FAST) Corridor Partnership.
($ in 000's)2020
Future Obligations
Beginning TIF Balance 66,706$ 55,186$ Project Spending:
Safe and Swift Corridor 8,500 7,500 Seattle Heavy Haul Network 2,000 16,000 State Route 509 - 30,000 Other 1,020 730
Total Project Spending 11,520$ 54,230$
Ending TIF Balance 55,186$ 956$
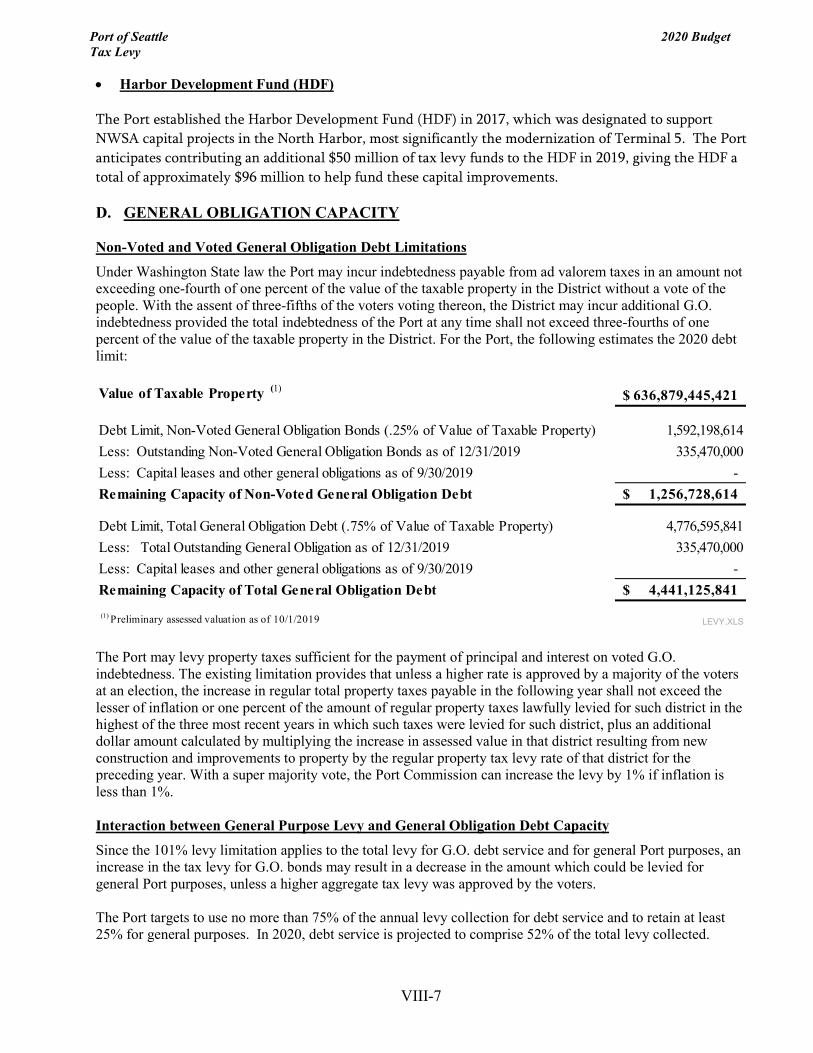
Port of Seattle 2020 Budget Tax Levy
VIII-7
• Harbor Development Fund (HDF) The Port established the Harbor Development Fund (HDF) in 2017, which was designated to support NWSA capital projects in the North Harbor, most significantly the modernization of Terminal 5. The Port anticipates contributing an additional $50 million of tax levy funds to the HDF in 2019, giving the HDF a total of approximately $96 million to help fund these capital improvements. D. GENERAL OBLIGATION CAPACITY Non-Voted and Voted General Obligation Debt Limitations
Under Washington State law the Port may incur indebtedness payable from ad valorem taxes in an amount not exceeding one-fourth of one percent of the value of the taxable property in the District without a vote of the people. With the assent of three-fifths of the voters voting thereon, the District may incur additional G.O. indebtedness provided the total indebtedness of the Port at any time shall not exceed three-fourths of one percent of the value of the taxable property in the District. For the Port, the following estimates the 2020 debt limit:
The Port may levy property taxes sufficient for the payment of principal and interest on voted G.O. indebtedness. The existing limitation provides that unless a higher rate is approved by a majority of the voters at an election, the increase in regular total property taxes payable in the following year shall not exceed the lesser of inflation or one percent of the amount of regular property taxes lawfully levied for such district in the highest of the three most recent years in which such taxes were levied for such district, plus an additional dollar amount calculated by multiplying the increase in assessed value in that district resulting from new construction and improvements to property by the regular property tax levy rate of that district for the preceding year. With a super majority vote, the Port Commission can increase the levy by 1% if inflation is less than 1%. Interaction between General Purpose Levy and General Obligation Debt Capacity
Since the 101% levy limitation applies to the total levy for G.O. debt service and for general Port purposes, an increase in the tax levy for G.O. bonds may result in a decrease in the amount which could be levied for general Port purposes, unless a higher aggregate tax levy was approved by the voters. The Port targets to use no more than 75% of the annual levy collection for debt service and to retain at least 25% for general purposes. In 2020, debt service is projected to comprise 52% of the total levy collected.
Value of Taxable Property (1) 636,879,445,421$
Debt Limit, Non-Voted General Obligation Bonds (.25% of Value of Taxable Property) 1,592,198,614Less: Outstanding Non-Voted General Obligation Bonds as of 12/31/2019 335,470,000Less: Capital leases and other general obligations as of 9/30/2019 - Remaining Capacity of Non-Voted General Obligation Debt 1,256,728,614$
Debt Limit, Total General Obligation Debt (.75% of Value of Taxable Property) 4,776,595,841Less: Total Outstanding General Obligation as of 12/31/2019 335,470,000Less: Capital leases and other general obligations as of 9/30/2019 - Remaining Capacity of Total General Obligation Debt 4,441,125,841$ (1) Preliminary assessed valuation as of 10/1/2019 LEVY.XLS
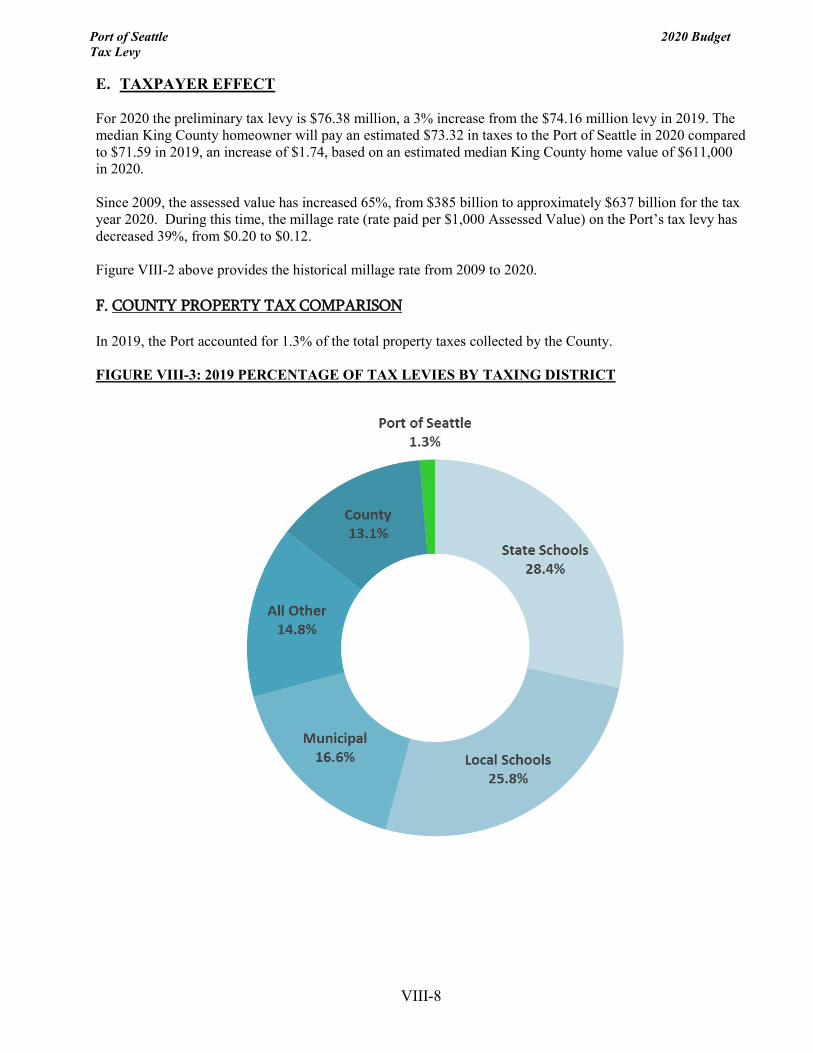
Port of Seattle 2020 Budget Tax Levy
VIII-8
E. TAXPAYER EFFECT For 2020 the preliminary tax levy is $76.38 million, a 3% increase from the $74.16 million levy in 2019. The median King County homeowner will pay an estimated $73.32 in taxes to the Port of Seattle in 2020 compared to $71.59 in 2019, an increase of $1.74, based on an estimated median King County home value of $611,000 in 2020. Since 2009, the assessed value has increased 65%, from $385 billion to approximately $637 billion for the tax year 2020. During this time, the millage rate (rate paid per $1,000 Assessed Value) on the Port’s tax levy has decreased 39%, from $0.20 to $0.12. Figure VIII-2 above provides the historical millage rate from 2009 to 2020. F. COUNTY PROPERTY TAX COMPARISON In 2019, the Port accounted for 1.3% of the total property taxes collected by the County. FIGURE VIII-3: 2019 PERCENTAGE OF TAX LEVIES BY TAXING DISTRICT

IX. CA
PITA
LIM
PR
OV
ME
NT
PLA
N
IX. CAPITAL

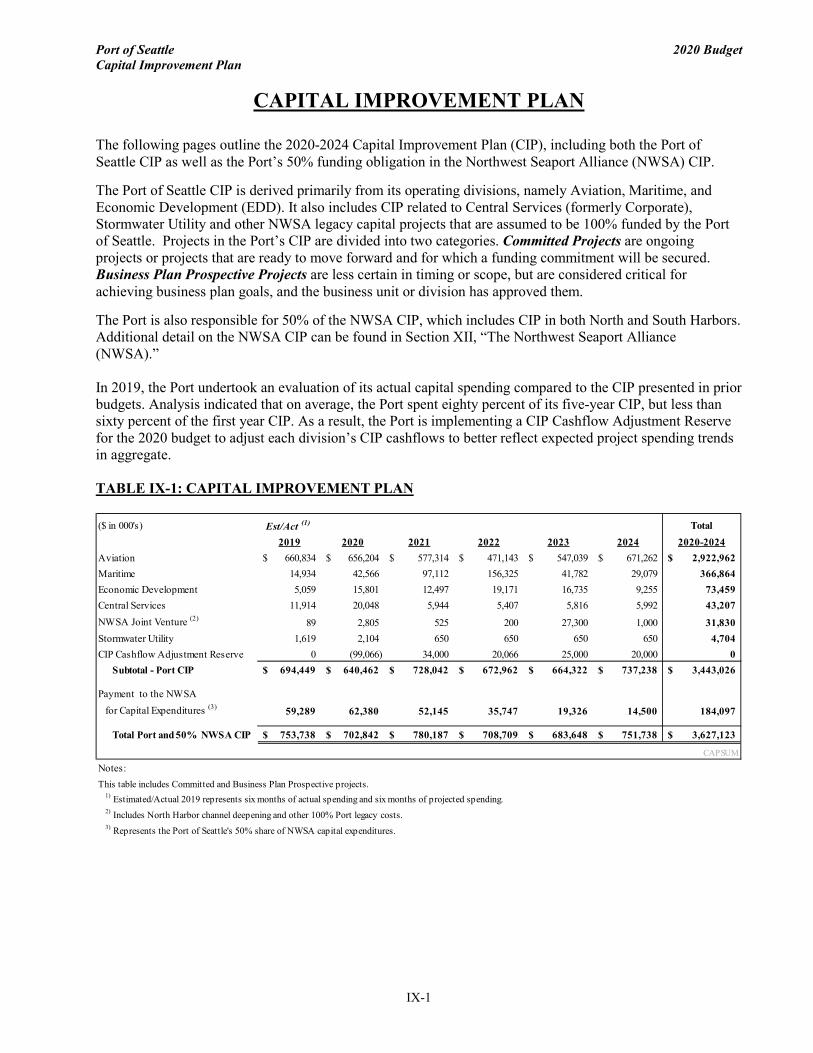
Port of Seattle 2020 Budget Capital Improvement Plan
IX-1
CAPITAL IMPROVEMENT PLAN
The following pages outline the 2020-2024 Capital Improvement Plan (CIP), including both the Port of Seattle CIP as well as the Port’s 50% funding obligation in the Northwest Seaport Alliance (NWSA) CIP.
The Port of Seattle CIP is derived primarily from its operating divisions, namely Aviation, Maritime, and Economic Development (EDD). It also includes CIP related to Central Services (formerly Corporate), Stormwater Utility and other NWSA legacy capital projects that are assumed to be 100% funded by the Port of Seattle. Projects in the Port’s CIP are divided into two categories. Committed Projects are ongoing projects or projects that are ready to move forward and for which a funding commitment will be secured. Business Plan Prospective Projects are less certain in timing or scope, but are considered critical for achieving business plan goals, and the business unit or division has approved them.
The Port is also responsible for 50% of the NWSA CIP, which includes CIP in both North and South Harbors. Additional detail on the NWSA CIP can be found in Section XII, “The Northwest Seaport Alliance (NWSA).” In 2019, the Port undertook an evaluation of its actual capital spending compared to the CIP presented in prior budgets. Analysis indicated that on average, the Port spent eighty percent of its five-year CIP, but less than sixty percent of the first year CIP. As a result, the Port is implementing a CIP Cashflow Adjustment Reserve for the 2020 budget to adjust each division’s CIP cashflows to better reflect expected project spending trends in aggregate. TABLE IX-1: CAPITAL IMPROVEMENT PLAN
($ in 000's) Est/Act (1) Total 2019 2020 2021 2022 2023 2024 2020-2024
Aviation 660,834$ 656,204$ 577,314$ 471,143$ 547,039$ 671,262$ 2,922,962$ Maritime 14,934 42,566 97,112 156,325 41,782 29,079 366,864Economic Development 5,059 15,801 12,497 19,171 16,735 9,255 73,459Central Services 11,914 20,048 5,944 5,407 5,816 5,992 43,207NWSA Joint Venture (2) 89 2,805 525 200 27,300 1,000 31,830Stormwater Utility 1,619 2,104 650 650 650 650 4,704CIP Cashflow Adjustment Reserve 0 (99,066) 34,000 20,066 25,000 20,000 0
Subtotal - Port CIP 694,449$ 640,462$ 728,042$ 672,962$ 664,322$ 737,238$ 3,443,026$
Payment to the NWSAfor Capital Expenditures (3) 59,289 62,380 52,145 35,747 19,326 14,500 184,097
Total Port and 50% NWSA CIP 753,738$ 702,842$ 780,187$ 708,709$ 683,648$ 751,738$ 3,627,123$
CAPSUM
Notes:This table includes Committed and Business Plan Prospective projects.
1) Estimated/Actual 2019 represents six months of actual spending and six months of projected spending.2) Includes North Harbor channel deepening and other 100% Port legacy costs.3) Represents the Port of Seattle's 50% share of NWSA capital expenditures.
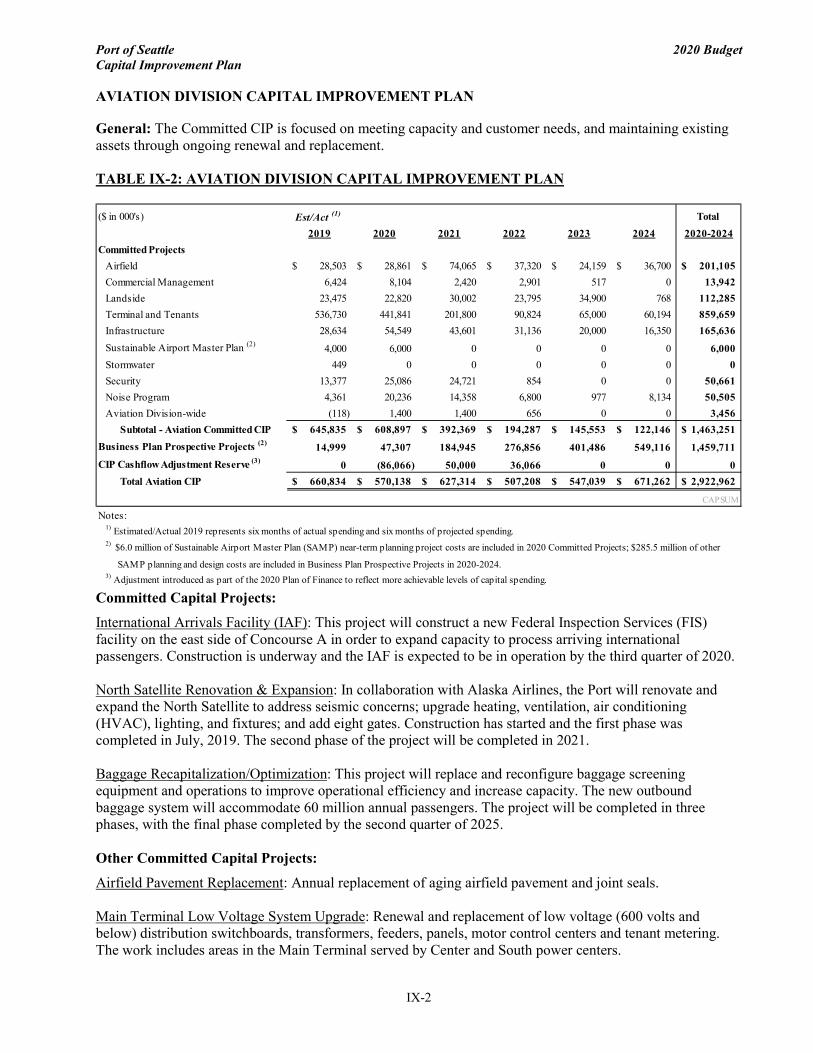
Port of Seattle 2020 Budget Capital Improvement Plan
IX-2
AVIATION DIVISION CAPITAL IMPROVEMENT PLAN General: The Committed CIP is focused on meeting capacity and customer needs, and maintaining existing assets through ongoing renewal and replacement. TABLE IX-2: AVIATION DIVISION CAPITAL IMPROVEMENT PLAN
Committed Capital Projects:
International Arrivals Facility (IAF): This project will construct a new Federal Inspection Services (FIS) facility on the east side of Concourse A in order to expand capacity to process arriving international passengers. Construction is underway and the IAF is expected to be in operation by the third quarter of 2020. North Satellite Renovation & Expansion: In collaboration with Alaska Airlines, the Port will renovate and expand the North Satellite to address seismic concerns; upgrade heating, ventilation, air conditioning (HVAC), lighting, and fixtures; and add eight gates. Construction has started and the first phase was completed in July, 2019. The second phase of the project will be completed in 2021. Baggage Recapitalization/Optimization: This project will replace and reconfigure baggage screening equipment and operations to improve operational efficiency and increase capacity. The new outbound baggage system will accommodate 60 million annual passengers. The project will be completed in three phases, with the final phase completed by the second quarter of 2025. Other Committed Capital Projects:
Airfield Pavement Replacement: Annual replacement of aging airfield pavement and joint seals. Main Terminal Low Voltage System Upgrade: Renewal and replacement of low voltage (600 volts and below) distribution switchboards, transformers, feeders, panels, motor control centers and tenant metering. The work includes areas in the Main Terminal served by Center and South power centers.
($ in 000's) Est/Act (1) Total 2019 2020 2021 2022 2023 2024 2020-2024
Committed ProjectsAirfield 28,503$ 28,861$ 74,065$ 37,320$ 24,159$ 36,700$ 201,105$ Commercial Management 6,424 8,104 2,420 2,901 517 0 13,942Landside 23,475 22,820 30,002 23,795 34,900 768 112,285Terminal and Tenants 536,730 441,841 201,800 90,824 65,000 60,194 859,659Infrastructure 28,634 54,549 43,601 31,136 20,000 16,350 165,636Sustainable Airport Master Plan (2) 4,000 6,000 0 0 0 0 6,000Stormwater 449 0 0 0 0 0 0Security 13,377 25,086 24,721 854 0 0 50,661Noise Program 4,361 20,236 14,358 6,800 977 8,134 50,505Aviation Division-wide (118) 1,400 1,400 656 0 0 3,456
Subtotal - Aviation Committed CIP 645,835$ 608,897$ 392,369$ 194,287$ 145,553$ 122,146$ 1,463,251$ Business Plan Prospective Projects (2) 14,999 47,307 184,945 276,856 401,486 549,116 1,459,711CIP Cashflow Adjustment Reserve (3) 0 (86,066) 50,000 36,066 0 0 0
Total Aviation CIP 660,834$ 570,138$ 627,314$ 507,208$ 547,039$ 671,262$ 2,922,962$
CAPSUM
Notes:1) Estimated/Actual 2019 represents six months of actual spending and six months of projected spending.2) $6.0 million of Sustainable Airport Master Plan (SAMP) near-term planning project costs are included in 2020 Committed Projects; $285.5 million of other
SAMP planning and design costs are included in Business Plan Prospective Projects in 2020-2024. 3) Adjustment introduced as part of the 2020 Plan of Finance to reflect more achievable levels of capital spending.
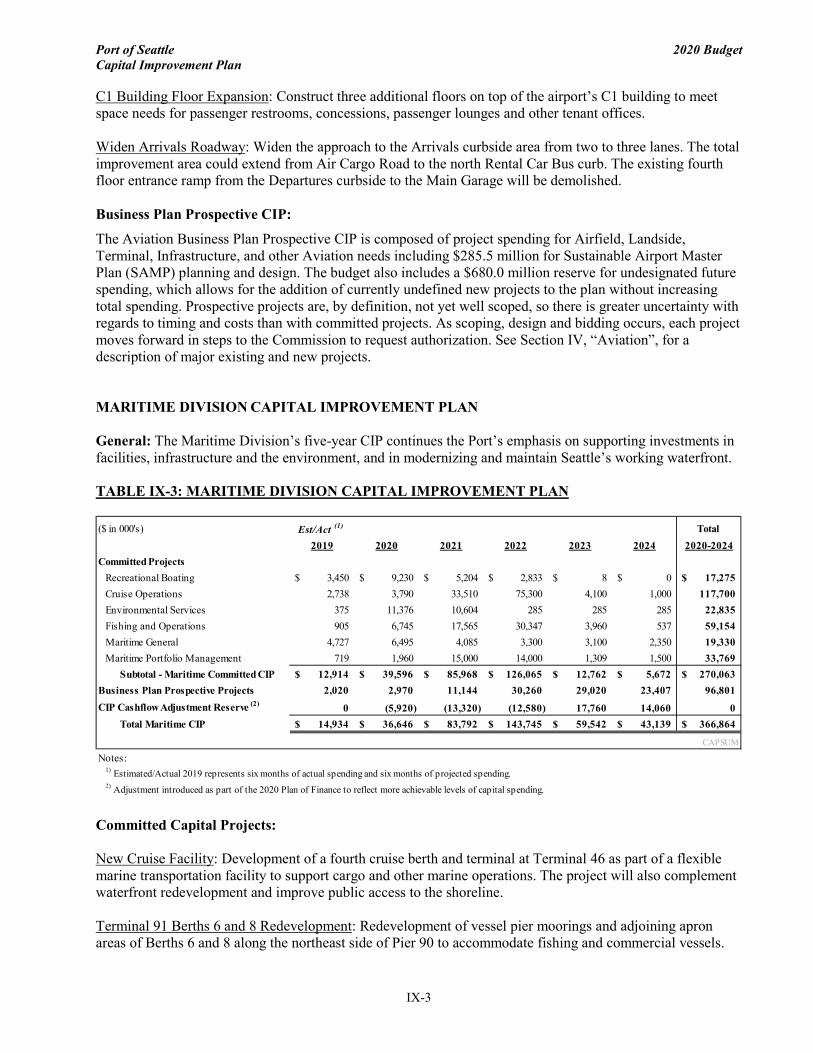
Port of Seattle 2020 Budget Capital Improvement Plan
IX-3
C1 Building Floor Expansion: Construct three additional floors on top of the airport’s C1 building to meet space needs for passenger restrooms, concessions, passenger lounges and other tenant offices. Widen Arrivals Roadway: Widen the approach to the Arrivals curbside area from two to three lanes. The total improvement area could extend from Air Cargo Road to the north Rental Car Bus curb. The existing fourth floor entrance ramp from the Departures curbside to the Main Garage will be demolished. Business Plan Prospective CIP:
The Aviation Business Plan Prospective CIP is composed of project spending for Airfield, Landside, Terminal, Infrastructure, and other Aviation needs including $285.5 million for Sustainable Airport Master Plan (SAMP) planning and design. The budget also includes a $680.0 million reserve for undesignated future spending, which allows for the addition of currently undefined new projects to the plan without increasing total spending. Prospective projects are, by definition, not yet well scoped, so there is greater uncertainty with regards to timing and costs than with committed projects. As scoping, design and bidding occurs, each project moves forward in steps to the Commission to request authorization. See Section IV, “Aviation”, for a description of major existing and new projects. MARITIME DIVISION CAPITAL IMPROVEMENT PLAN General: The Maritime Division’s five-year CIP continues the Port’s emphasis on supporting investments in facilities, infrastructure and the environment, and in modernizing and maintain Seattle’s working waterfront. TABLE IX-3: MARITIME DIVISION CAPITAL IMPROVEMENT PLAN
Committed Capital Projects: New Cruise Facility: Development of a fourth cruise berth and terminal at Terminal 46 as part of a flexible marine transportation facility to support cargo and other marine operations. The project will also complement waterfront redevelopment and improve public access to the shoreline. Terminal 91 Berths 6 and 8 Redevelopment: Redevelopment of vessel pier moorings and adjoining apron areas of Berths 6 and 8 along the northeast side of Pier 90 to accommodate fishing and commercial vessels.
($ in 000's) Est/Act (1) Total 2019 2020 2021 2022 2023 2024 2020-2024
Committed ProjectsRecreational Boating 3,450$ 9,230$ 5,204$ 2,833$ 8$ 0$ 17,275$ Cruise Operations 2,738 3,790 33,510 75,300 4,100 1,000 117,700Environmental Services 375 11,376 10,604 285 285 285 22,835Fishing and Operations 905 6,745 17,565 30,347 3,960 537 59,154Maritime General 4,727 6,495 4,085 3,300 3,100 2,350 19,330Maritime Portfolio Management 719 1,960 15,000 14,000 1,309 1,500 33,769
Subtotal - Maritime Committed CIP 12,914$ 39,596$ 85,968$ 126,065$ 12,762$ 5,672$ 270,063$ Business Plan Prospective Projects 2,020 2,970 11,144 30,260 29,020 23,407 96,801CIP Cashflow Adjustment Reserve (2) 0 (5,920) (13,320) (12,580) 17,760 14,060 0
Total Maritime CIP 14,934$ 36,646$ 83,792$ 143,745$ 59,542$ 43,139$ 366,864$
CAPSUM
Notes:1) Estimated/Actual 2019 represents six months of actual spending and six months of projected spending.2) Adjustment introduced as part of the 2020 Plan of Finance to reflect more achievable levels of capital spending.

Port of Seattle 2020 Budget Capital Improvement Plan
IX-4
Terminal 117 Restoration: This 13-acre habitat restoration project at Terminal 117 will support chinook salmon recovery goals and improve public access to the shoreline. Fishermen’s Terminal (FT) Gateway Building: This project will construct a new building in the area of the existing vacant bank building and two net sheds. The new building is expected to provide approximately 60,000 square feet of light industrial space for maritime businesses. The project also includes site improvements such as lighting and signage at the terminal. Pier 66 Shorepower/Waterfront Electrification: This project will create a dual voltage 20-megawatt shore power system for the single cruise ship berth at Pier 66. Other Committed Capital Projects:
Fishermen’s Terminal Maritime Innovation Center: This project will update and convert the existing Seattle Ship Supply building into a new Maritime Innovation Center in support of the Port’s small business incubator program. Salmon Bay Marina Docks D and E Replacement: Replacement of floating Docks D and E with new permitted dock configuration to improve safety and dock utilization. Terminal 91 Northwest Fender: This project will replace the timber fender system for berths K, L and M on the northwest corner of Terminal 91. The new fender will be a stronger steel system with greater durability. Fishermen’s Terminal Docks 3, 4, and 5 Pier Improvements: Installation of protective systems on Docks 3, 4, and 5 to prevent corrosion and enhance pile capacity. Committed capital projects also includes replacement/preservation of docks and moorage, tenant improvements, fleet replacement, and small capital (under $300,000) projects. Business Plan Prospective CIP:
Significant projects include: Terminal 46 North Pier Structure Replacement: Replacement timber and concrete pier structures along the north portion of Terminal 46 to support moorage for larger vessels. Terminal 91 New Cruise Gangway: This project will fabricate and install a new gangway to support larger cruise vessels at the Smith Cove Cruise Terminal. Jack Block Park Pier Replacement: This project will replace the existing damaged timber pier with a similar concrete pier supported by steel piles. Also included is a CIP reserve for unknown or undefined future projects.

Port of Seattle 2020 Budget Capital Improvement Plan
IX-5
ECONOMIC DEVELOPMENT DIVISION CAPITAL IMPROVEMENT PLAN General: Projects in the Economic Development Division’s five-year CIP are primarily associated with new development of industrial property and preservation of existing assets. Also included is an investment in tenant improvements related to the releasing of space expected to become vacant as existing leases expire. TABLE IX-4: EDD CAPITAL IMPROVEMENT PLAN
Committed Capital Projects:
Terminal 91 Uplands Development: This initial development will construct two 50,000 square foot buildings and associated site infrastructure improvements. The new facilities will support fishing and maritime related businesses. Bell Harbor International Conference Center Interior Modernization: This project will modernize the conference center by reconfiguring space for greater flexibility and expanded leasable area. The project will also upgrade the audio/visual/data/lighting systems and replace carpeting and window coverings. Pier 66 HVAC Systems Upgrade: This project replaces the cruise terminal and conference center building’s cooling tower, chiller, variable frequency drives and other HVAC system components that are at the end of their service life. WTC HVAC Replacement: This project replaces the current HVAC system at the end of its service life with a more energy efficient system. Other Committed projects include elevator upgrades at Pier 66, capitalized tenant improvements, fleet replacement, technology and other small projects. Business Plan Prospective CIP: The Economic Development Division Prospective CIP is a combination of revenue/capacity growth, renewal/enhancement, environmental, and safety projects. Renewal/enhancement projects include space reconfiguration/improvements at Pier 69, roof work at Pier 66, and elevator modernization work at the Bell Street Pier Garage. Also included is a general CIP reserve to allow for projects that cannot be determined with certainty as to location, timing, and cost.
($ in 000's) Est/Act (1) Total 2019 2020 2021 2022 2023 2024 2020-2024
Committed ProjectsDevelopment & Planning 203$ 752$ 4,750$ 14,000$ 14,000$ 5,300$ 38,802$ General Economic Development 1,192 1,018 950 820 750 750 4,288Portfolio Management 2,604 12,816 5,111 300 300 300 18,827
Subtotal - EDD Committed CIP 3,999$ 14,586$ 10,811$ 15,120$ 15,050$ 6,350$ 61,917$ Business Plan Prospective Projects 1,060 1,215 1,686 4,051 1,685 2,905 11,542CIP Cashflow Adjustment Reserve (2) 0 (2,080) (4,680) (4,420) 6,240 4,940 0
Total EDD CIP 5,059$ 13,721$ 7,817$ 14,751$ 22,975$ 14,195$ 73,459$ CAPSUM
Notes:1) Estimated/Actual 2019 represents six months of actual spending and six months of projected spending.2) Adjustment introduced as part of the 2020 Plan of Finance to reflect more achievable levels of capital spending.
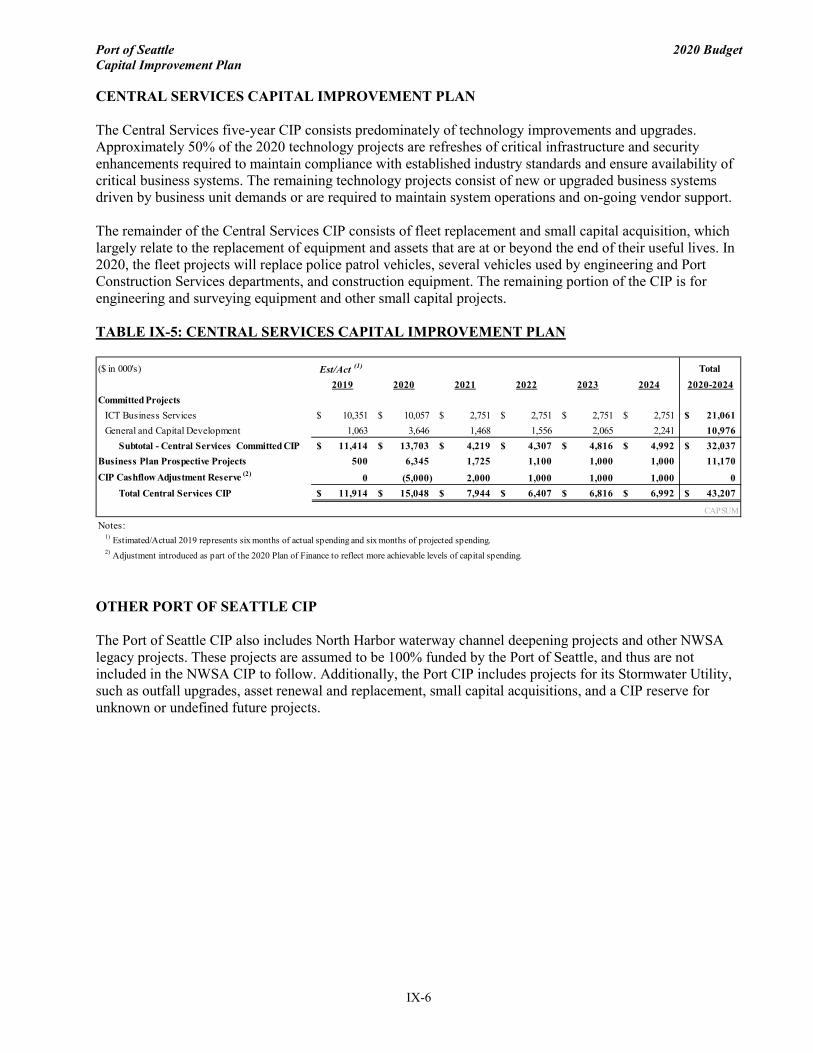
Port of Seattle 2020 Budget Capital Improvement Plan
IX-6
CENTRAL SERVICES CAPITAL IMPROVEMENT PLAN
The Central Services five-year CIP consists predominately of technology improvements and upgrades. Approximately 50% of the 2020 technology projects are refreshes of critical infrastructure and security enhancements required to maintain compliance with established industry standards and ensure availability of critical business systems. The remaining technology projects consist of new or upgraded business systems driven by business unit demands or are required to maintain system operations and on-going vendor support.
The remainder of the Central Services CIP consists of fleet replacement and small capital acquisition, which largely relate to the replacement of equipment and assets that are at or beyond the end of their useful lives. In 2020, the fleet projects will replace police patrol vehicles, several vehicles used by engineering and Port Construction Services departments, and construction equipment. The remaining portion of the CIP is for engineering and surveying equipment and other small capital projects.
TABLE IX-5: CENTRAL SERVICES CAPITAL IMPROVEMENT PLAN
OTHER PORT OF SEATTLE CIP
The Port of Seattle CIP also includes North Harbor waterway channel deepening projects and other NWSA legacy projects. These projects are assumed to be 100% funded by the Port of Seattle, and thus are not included in the NWSA CIP to follow. Additionally, the Port CIP includes projects for its Stormwater Utility, such as outfall upgrades, asset renewal and replacement, small capital acquisitions, and a CIP reserve for unknown or undefined future projects.
($ in 000's) Est/Act (1) Total 2019 2020 2021 2022 2023 2024 2020-2024
Committed ProjectsICT Business Services 10,351$ 10,057$ 2,751$ 2,751$ 2,751$ 2,751$ 21,061$ General and Capital Development 1,063 3,646 1,468 1,556 2,065 2,241 10,976
Subtotal - Central Services Committed CIP 11,414$ 13,703$ 4,219$ 4,307$ 4,816$ 4,992$ 32,037$ Business Plan Prospective Projects 500 6,345 1,725 1,100 1,000 1,000 11,170CIP Cashflow Adjustment Reserve (2) 0 (5,000) 2,000 1,000 1,000 1,000 0
Total Central Services CIP 11,914$ 15,048$ 7,944$ 6,407$ 6,816$ 6,992$ 43,207$
CAPSUM
Notes:1) Estimated/Actual 2019 represents six months of actual spending and six months of projected spending.2) Adjustment introduced as part of the 2020 Plan of Finance to reflect more achievable levels of capital spending.
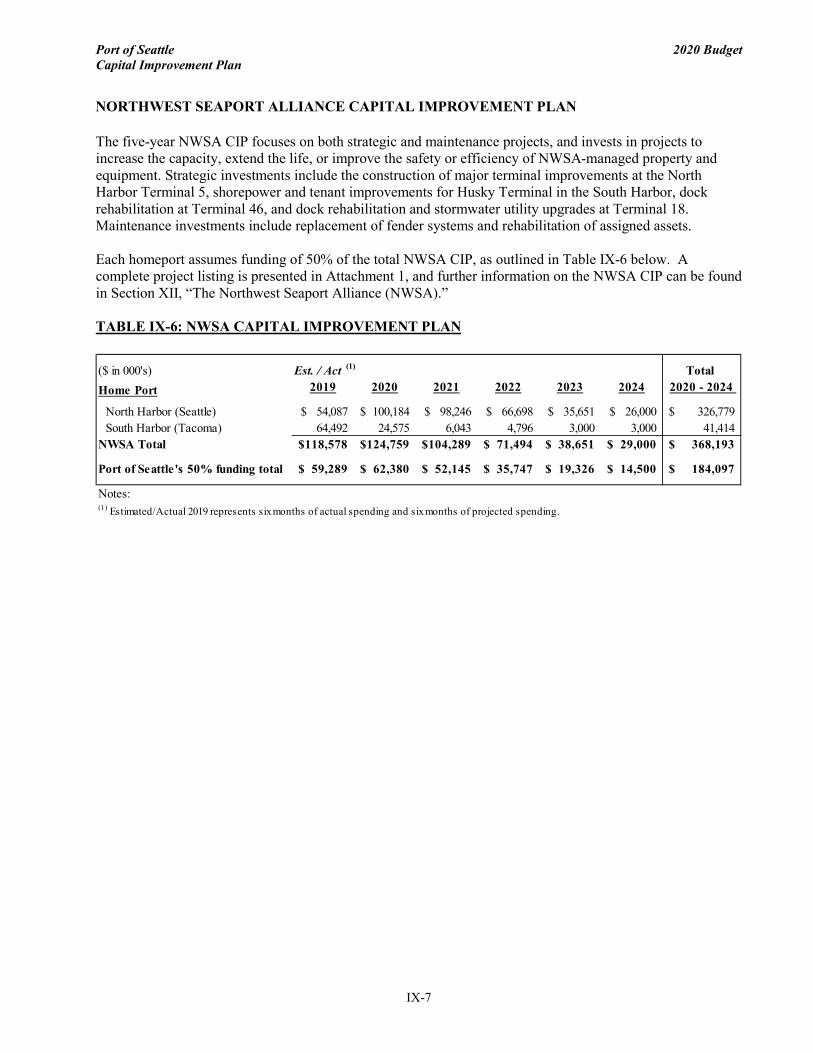
Port of Seattle 2020 Budget Capital Improvement Plan
IX-7
The five-year NWSA CIP focuses on both strategic and maintenance projects, and invests in projects to increase the capacity, extend the life, or improve the safety or efficiency of NWSA-managed property and equipment. Strategic investments include the construction of major terminal improvements at the North Harbor Terminal 5, shorepower and tenant improvements for Husky Terminal in the South Harbor, dock rehabilitation at Terminal 46, and dock rehabilitation and stormwater utility upgrades at Terminal 18. Maintenance investments include replacement of fender systems and rehabilitation of assigned assets.
Each homeport assumes funding of 50% of the total NWSA CIP, as outlined in Table IX-6 below. A complete project listing is presented in Attachment 1, and further information on the NWSA CIP can be found in Section XII, “The Northwest Seaport Alliance (NWSA).”
TABLE IX-6: NWSA CAPITAL IMPROVEMENT PLAN
($ in 000's) Est. / Act (1) Total Home Port 2019 2020 2021 2022 2023 2024 2020 - 2024
North Harbor (Seattle) 54,087$ 100,184$ 98,246$ 66,698$ 35,651$ 26,000$ 326,779$ South Harbor (Tacoma) 64,492 24,575 6,043 4,796 3,000 3,000 41,414
NWSA Total 118,578$ 124,759$ 104,289$ 71,494$ 38,651$ 29,000$ 368,193$
Port of Seattle's 50% funding total 59,289$ 62,380$ 52,145$ 35,747$ 19,326$ 14,500$ 184,097$
Notes:(1) Estimated/Actual 2019 represents six months of actual spending and six months of projected spending.
NORTHWEST SEAPORT ALLIANCE CAPITAL IMPROVEMENT PLAN
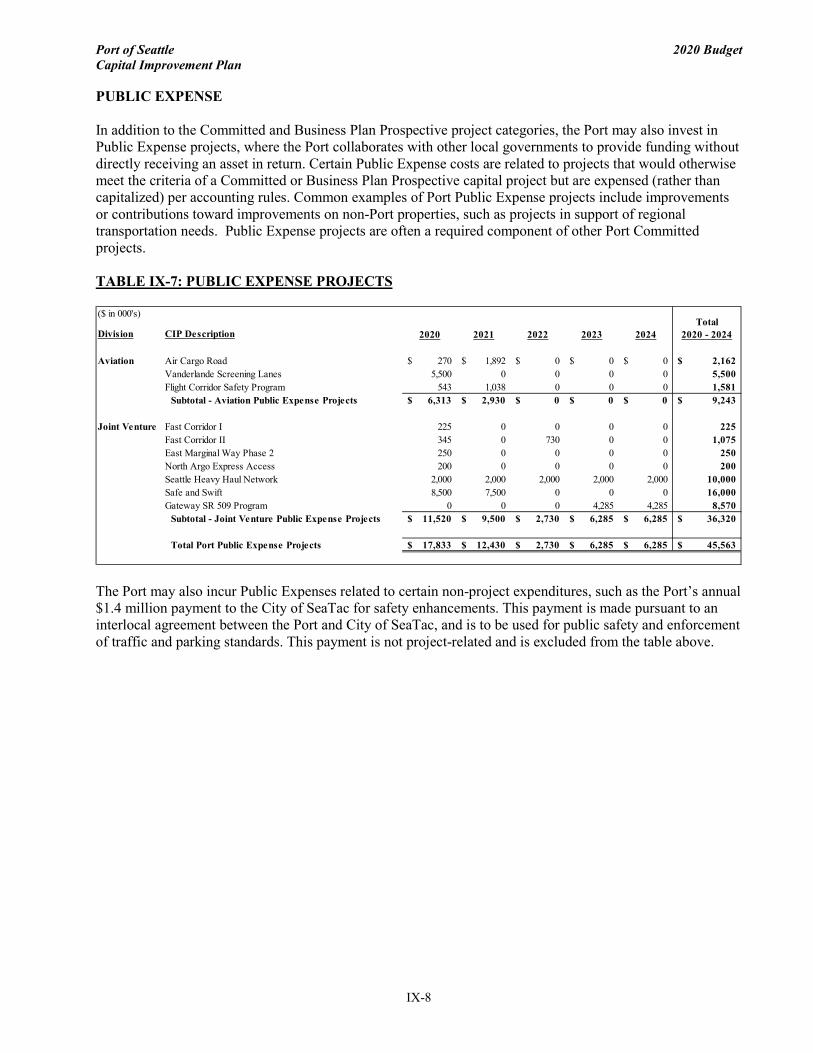
Port of Seattle 2020 Budget Capital Improvement Plan
IX-8
PUBLIC EXPENSE In addition to the Committed and Business Plan Prospective project categories, the Port may also invest in Public Expense projects, where the Port collaborates with other local governments to provide funding without directly receiving an asset in return. Certain Public Expense costs are related to projects that would otherwise meet the criteria of a Committed or Business Plan Prospective capital project but are expensed (rather than capitalized) per accounting rules. Common examples of Port Public Expense projects include improvements or contributions toward improvements on non-Port properties, such as projects in support of regional transportation needs. Public Expense projects are often a required component of other Port Committed projects. TABLE IX-7: PUBLIC EXPENSE PROJECTS
The Port may also incur Public Expenses related to certain non-project expenditures, such as the Port’s annual $1.4 million payment to the City of SeaTac for safety enhancements. This payment is made pursuant to an interlocal agreement between the Port and City of SeaTac, and is to be used for public safety and enforcement of traffic and parking standards. This payment is not project-related and is excluded from the table above.
($ in 000's)
Division CIP Description 2020 2021 2022 2023 2024
Aviation Air Cargo Road 270$ 1,892$ 0$ 0$ 0$ 2,162$ Vanderlande Screening Lanes 5,500 0 0 0 0 5,500 Flight Corridor Safety Program 543 1,038 0 0 0 1,581
Subtotal - Aviation Public Expense Projects 6,313$ 2,930$ 0$ 0$ 0$ 9,243$
Joint Venture Fast Corridor I 225 0 0 0 0 225 Fast Corridor II 345 0 730 0 0 1,075 East Marginal Way Phase 2 250 0 0 0 0 250 North Argo Express Access 200 0 0 0 0 200 Seattle Heavy Haul Network 2,000 2,000 2,000 2,000 2,000 10,000 Safe and Swift 8,500 7,500 0 0 0 16,000 Gateway SR 509 Program 0 0 0 4,285 4,285 8,570
Subtotal - Joint Venture Public Expense Projects 11,520$ 9,500$ 2,730$ 6,285$ 6,285$ 36,320$
Total Port Public Expense Projects 17,833$ 12,430$ 2,730$ 6,285$ 6,285$ 45,563$
Total 2020 - 2024

Port of Seattle 2020 Budget Capital Improvement Plan
IX-9
The following reports provide detail of the projects included in the Port’s 2020-2024 Capital Improvement Plan (CIP). • The projects are organized by the two categories: Committed and Business Plan Prospective. • Each project is assigned a number 1-6 based on its capital development progress status:
o Committed
6 = Completed (may have final payment cashflows) 5 = Construction authorized 4 = Design funding authorized 3 = Division level authorized
o Business Plan Prospective
2 = Business sponsor approved
o In addition, the Port may have “Other Prospective” projects (Status 1). These projects have been identified as potential future investments but are not included in the CIP.
• Attachment 1 includes the detail of the NWSA Capital Improvement Plan organized by home port.

Division / CIP Sponsor Status CIP DescriptionEst./ Act.
2019 2020 2021 2022 2023 2024Total
2020-2024Est./ Act. CIP Total
Aviation Airfield 5 C800335 GSE Electrical Chrg Stations 816 2,500 5,425 2,000 659 - 10,584 30,197
5 C800483 AFLD Pvmnt Program 2016-2020 10,248 12,375 2,206 - - - 14,581 25,831 5 C800585 Wi-Fi Enhancement Project 633 2,532 150 - - - 2,682 11,534 5 C800781 SSAT Narrow Body Configuration 2,766 1,017 - - - - 1,017 5,501 5 C800834 GBAS Upgrade 4 2,843 593 - - - 3,436 3,530 5 C800838 Hardstand Equipment Purchase 2,112 3,093 - - - - 3,093 11,812 5 C800842 AOA Perimeter Fence Line 5,876 519 - - - - 519 6,934 5 C800914 2018 Taxiway Improvement Proj 1,878 80 - - - - 80 34,238 5 C800986 Conc C Ramp Space Renovation 1,348 92 - - - - 92 1,782 5 C801089 Air Cargo 5 Ground Brd Facilit 550 - - - - - - 550 4 C800650 Surface Area Management System 1,706 2,000 2,442 - - - 4,442 6,200 4 C801035 Remote Aircraft Deicing 521 1,810 20,649 1,320 - - 23,779 24,300 3 C800930 2021-25 AFLD Pvmnt&Spprt Infr 45 - 42,600 34,000 23,500 36,700 136,800 156,299
Airfield Total 28,503 28,861 74,065 37,320 24,159 36,700 201,105 318,708
Aviation Division Wide 5 C101117 FIMS Phase II 25 - - - - - - 8,210 5 C800017 Aviation Small Jobs 226 - - - - - - 9,999 5 C800066 AV/IT Small Capital Projects 1,230 1,400 1,400 656 - - 3,456 12,494 5 C800688 Construction Logistics Expansn 4 - - - - - - 7,710 5 C800760 Auburn Mitigation Road Removal (1) - - - - - - 547 5 C800982 CDD & CPO Office Relocation (1,602) - - - - - - 1,621
Aviation Division Wide Total (118) 1,400 1,400 656 - - 3,456 40,581
Commercial Management 5 C800655 IWS Segregation Meters (CA) 161 1,500 315 - - - 1,815 2,242 5 C800846 Kiosk Program Expansion 424 672 - - - - 672 1,241 5 C800883 DL Inflight Svcs Relocate TRA 1,038 - - - - - - 1,272 5 C800886 Central Terminal Enhancements 2,316 844 - - - - 844 3,801 5 C800950 Cargo Buildings Improvements 754 3,801 - 1,997 - - 5,798 6,609 5 C801055 Main Terminal Space Conversion 933 762 1,580 379 - - 2,721 3,660 4 C800154 Tenant Reimbursement 798 525 525 525 517 - 2,092 6,709
Commercial Management Total 6,424 8,104 2,420 2,901 517 - 13,942 25,534
Infrastructure 6 C800107 C4 UPS System Improvements 4 - - - - - - 3,031 5 C800493 Emergency Backup Water Supply 208 977 1,477 - - - 2,454 2,739 5 C800497 Airportwide Mech Controls Sys 13 - - - - - - 3,348 5 C800538 Alternate Utility Facility 85 - - - - - - 33,033 5 C800699 Electric Utility SCADA 406 3,500 3,475 2,951 - - 9,926 11,899 5 C800717 N. Terminals Utilities Upgrade 763 7,200 8,800 796 - - 16,796 20,298 5 C800722 CT Infrastructure Upgrade Proj 8,779 554 - - - - 554 19,312 5 C800762 Telecommunication Meet Me Room 241 3,125 190 - - - 3,315 3,927 5 C800788 OPS Lan Core Switch Upgrade 387 - - - - - - 2,982 5 C800798 SSAT Infrastructure HVAC 6,185 21,000 11,000 8,267 - - 40,267 47,908 5 C800801 Replace Variable Freq. Drive 172 2,000 1,435 - - - 3,435 3,996 5 C800805 Duress System Replacement 314 21 - - - - 21 750 5 C800811 Chiller Panel Upgrade 232 68 - - - - 68 900
Port of Seattle 5 Year Capital Budget Committed Projects
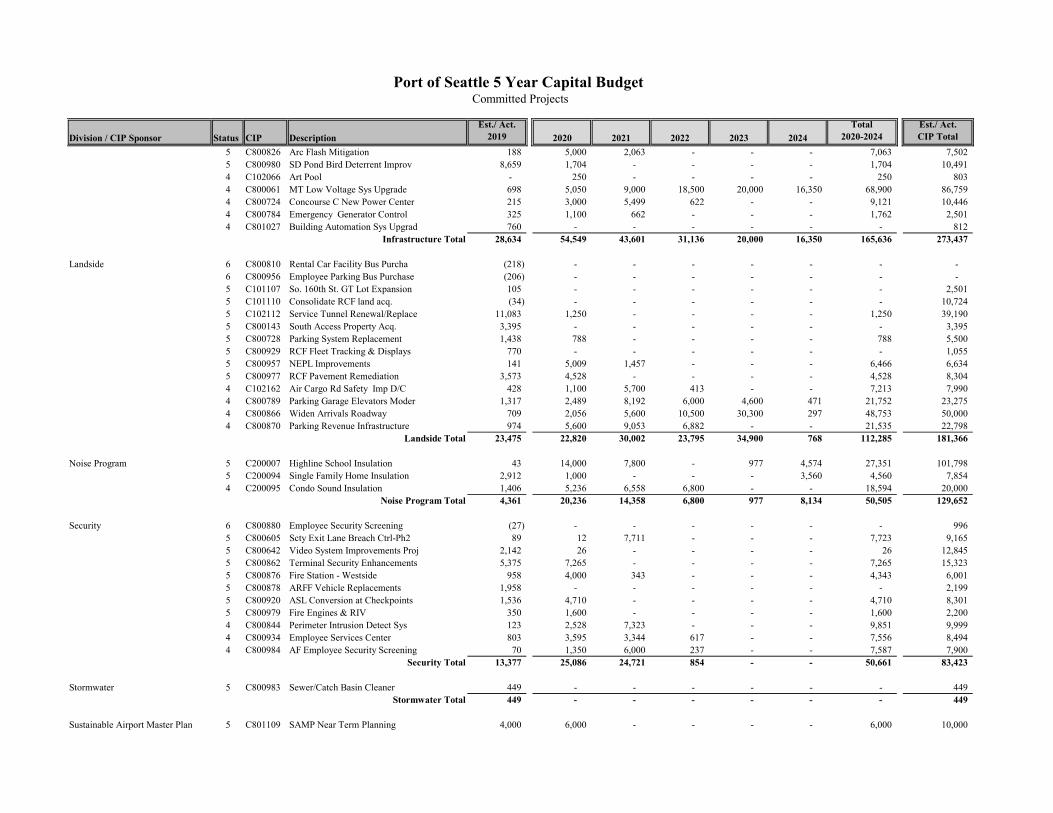
Division / CIP Sponsor Status CIP DescriptionEst./ Act.
2019 2020 2021 2022 2023 2024Total
2020-2024Est./ Act. CIP Total
Port of Seattle 5 Year Capital Budget Committed Projects
5 C800826 Arc Flash Mitigation 188 5,000 2,063 - - - 7,063 7,502 5 C800980 SD Pond Bird Deterrent Improv 8,659 1,704 - - - - 1,704 10,491 4 C102066 Art Pool - 250 - - - - 250 803 4 C800061 MT Low Voltage Sys Upgrade 698 5,050 9,000 18,500 20,000 16,350 68,900 86,759 4 C800724 Concourse C New Power Center 215 3,000 5,499 622 - - 9,121 10,446 4 C800784 Emergency Generator Control 325 1,100 662 - - - 1,762 2,501 4 C801027 Building Automation Sys Upgrad 760 - - - - - - 812
Infrastructure Total 28,634 54,549 43,601 31,136 20,000 16,350 165,636 273,437
Landside 6 C800810 Rental Car Facility Bus Purcha (218) - - - - - - - 6 C800956 Employee Parking Bus Purchase (206) - - - - - - - 5 C101107 So. 160th St. GT Lot Expansion 105 - - - - - - 2,501 5 C101110 Consolidate RCF land acq. (34) - - - - - - 10,724 5 C102112 Service Tunnel Renewal/Replace 11,083 1,250 - - - - 1,250 39,190 5 C800143 South Access Property Acq. 3,395 - - - - - - 3,395 5 C800728 Parking System Replacement 1,438 788 - - - - 788 5,500 5 C800929 RCF Fleet Tracking & Displays 770 - - - - - - 1,055 5 C800957 NEPL Improvements 141 5,009 1,457 - - - 6,466 6,634 5 C800977 RCF Pavement Remediation 3,573 4,528 - - - - 4,528 8,304 4 C102162 Air Cargo Rd Safety Imp D/C 428 1,100 5,700 413 - - 7,213 7,990 4 C800789 Parking Garage Elevators Moder 1,317 2,489 8,192 6,000 4,600 471 21,752 23,275 4 C800866 Widen Arrivals Roadway 709 2,056 5,600 10,500 30,300 297 48,753 50,000 4 C800870 Parking Revenue Infrastructure 974 5,600 9,053 6,882 - - 21,535 22,798
Landside Total 23,475 22,820 30,002 23,795 34,900 768 112,285 181,366
Noise Program 5 C200007 Highline School Insulation 43 14,000 7,800 - 977 4,574 27,351 101,798 5 C200094 Single Family Home Insulation 2,912 1,000 - - - 3,560 4,560 7,854 4 C200095 Condo Sound Insulation 1,406 5,236 6,558 6,800 - - 18,594 20,000
Noise Program Total 4,361 20,236 14,358 6,800 977 8,134 50,505 129,652
Security 6 C800880 Employee Security Screening (27) - - - - - - 996 5 C800605 Scty Exit Lane Breach Ctrl-Ph2 89 12 7,711 - - - 7,723 9,165 5 C800642 Video System Improvements Proj 2,142 26 - - - - 26 12,845 5 C800862 Terminal Security Enhancements 5,375 7,265 - - - - 7,265 15,323 5 C800876 Fire Station - Westside 958 4,000 343 - - - 4,343 6,001 5 C800878 ARFF Vehicle Replacements 1,958 - - - - - - 2,199 5 C800920 ASL Conversion at Checkpoints 1,536 4,710 - - - - 4,710 8,301 5 C800979 Fire Engines & RIV 350 1,600 - - - - 1,600 2,200 4 C800844 Perimeter Intrusion Detect Sys 123 2,528 7,323 - - - 9,851 9,999 4 C800934 Employee Services Center 803 3,595 3,344 617 - - 7,556 8,494 4 C800984 AF Employee Security Screening 70 1,350 6,000 237 - - 7,587 7,900
Security Total 13,377 25,086 24,721 854 - - 50,661 83,423
Stormwater 5 C800983 Sewer/Catch Basin Cleaner 449 - - - - - - 449 Stormwater Total 449 - - - - - - 449
Sustainable Airport Master Plan 5 C801109 SAMP Near Term Planning 4,000 6,000 - - - - 6,000 10,000

Division / CIP Sponsor Status CIP DescriptionEst./ Act.
2019 2020 2021 2022 2023 2024Total
2020-2024Est./ Act. CIP Total
Port of Seattle 5 Year Capital Budget Committed Projects
Sustainable Airport Master Plan Total 4,000 6,000 - - - - 6,000 10,000
Terminal and Tenants 6 C800019 Gate Utilities Improvements 4 - - - - - - 13,351 6 C800858 Checkpoint 5 Wall Relocation 1 - - - - - - 775 5 C800556 NS NSAT Renov NSTS Lobbies 133,086 134,800 105,470 9,988 - - 250,258 659,825 5 C800583 International Arrivals Fac-IAF 338,500 207,000 9,133 - - - 216,133 931,445 5 C800612 Checked Bag Recap/Optimization 25,564 44,300 55,000 55,000 55,000 55,000 264,300 444,584 5 C800638 Concessions Infrastructure 1,006 552 7,981 - - - 8,533 14,889 5 C800658 Mech Energy Conservation (CA) 4,369 1,670 - - - - 1,670 6,803 5 C800697 Restroom Upgrades Conc B, C, D 5,141 14,000 10,000 5,221 - - 29,221 38,338 5 C800761 B Concourse Ramp Lvl Holdroom 152 - - - - - - 5,983 5 C800769 Concourse D Hardstand Holdroom 2,369 233 - - - - 233 35,711 5 C800770 Concourse B Roof Replacement 219 - - - - - - 5,262 5 C800779 Safedock Upgrade & Expansion 1,022 24,039 2,440 - - - 26,479 27,971 5 C800782 STS Display Upgrade 408 - - - - - - 3,206 5 C800790 Passenger Flow Image Analytics 634 - - - - - - 1,217 5 C800793 PLB Renew & Replace Phase 2 4,168 3,965 76 - - - 4,041 12,999 5 C800818 SSAT Structural Improvements 231 - - - - - - 2,999 5 C800833 Holdroom Seatings for Conc B&C 4,865 250 - - - - 250 6,909 5 C800836 Add'l Baggage Makeup Space IAF 15,271 - - - - - - 18,498 5 C800841 Tenant Network DMARC Upgrade 746 1,150 500 217 - - 1,867 2,816 5 C800873 Concourse B Gate Reconfigure 104 - - - - - - 8,002 5 C800898 Airport Signage Phase 1 169 5,500 1,200 398 - - 7,098 7,999 5 C800925 Zone 3 Common Use Counters 9 62 - - - - 62 718 5 C801094 Gate S12 PLB Replacement 1,429 321 - - - - 321 1,750 4 C800702 2015-2016 C Conc Roof Replace 108 - - - - - - 4,721 4 C800743 SSAT Renovation Project (3,426) - - - - - - - 4 C800845 C1 Building Floor Expansion 581 4,000 10,000 20,000 10,000 5,194 49,194 50,000
Terminal and Tenants Total 536,730 441,842 201,800 90,824 65,000 60,194 859,660 2,306,771
Aviation Total 645,835 608,898 392,367 194,286 145,553 122,146 1,463,250 3,369,921
Central ServicesCorporate P&TS Capital Project 5 C800009 Infrastructure - Small Cap 1,250 1,382 1,500 1,500 1,500 1,500 7,382 34,727
5 C800012 Services Technology Small Cap 600 1,000 1,000 1,000 1,000 1,000 5,000 17,744 5 C800051 Small Capital Acquisition-Corp 200 200 200 200 200 200 1,000 3,847 5 C800747 Project Cost Management System 317 - - - - - - 967 5 C800907 Supplier Database System 410 - - - - - - 800 5 C800909 PeopleSoft Financials Upgrade 1,575 - - - - - - 3,600 5 C801012 Radio System Upgrade 5,311 5,623 - - - - 5,623 14,800 5 C801015 New Budget System 272 328 - - - - 328 600 5 C801078 Maximo Upgrade 30 470 - - - - 470 500 5 C801108 Customer Relationship Mgmt Sys 400 1,000 - - - - 1,000 1,400 3 C800016 Enterprise GIS - Small Cap 189 250 250 250 250 250 1,250 4,143 3 C800450 CDD Fleet Replacement 300 1,644 635 527 680 805 4,291 10,465 3 C800453 CDD Small Cap 351 314 110 122 190 125 861 3,182 3 C800458 Corporate Fleet Replacement 212 1,488 523 707 995 1,111 4,824 10,622

Division / CIP Sponsor Status CIP DescriptionEst./ Act.
2019 2020 2021 2022 2023 2024Total
2020-2024Est./ Act. CIP Total
Port of Seattle 5 Year Capital Budget Committed Projects
Corporate P&TS Capital Project Total 11,417 13,699 4,218 4,306 4,815 4,991 32,029 107,397
Central Services Total 11,417 13,699 4,218 4,306 4,815 4,991 32,029 107,397
Economic Development Development & Planning 4 C800158 T91 Uplands Development 203 752 4,750 14,000 14,000 5,300 38,802 39,278
Development & Planning Total 203 752 4,750 14,000 14,000 5,300 38,802 39,278
General Economic Development 5 C800887 P69 Commission Chambers Refres 258 - - - - - - 351 5 C800888 P69 Solar Panel System 266 - - - - - - 481 3 C800244 EDD Technology Projects 170 250 250 250 250 250 1,250 2,821 3 C800562 EDD: 2019 Small Projects 298 230 - - - - 230 528 3 C800831 EDD Fleet 2019 - 30 - - - - 30 30 3 C800990 EDD Fleet 2021 Beyond - - 200 70 - - 270 440 3 C801004 EDD: 2018 Small Projects 201 18 - - - - 18 249 3 C801085 EDD Fleet 2020 - 200 - - - - 200 200 3 C801087 EDD: 2020+ Small Projects - 290 500 500 500 500 2,290 4,790
General Economic Development Total 1,193 1,018 950 820 750 750 4,288 9,890
Portfolio Management 5 C800889 P66 BHICC Interior Modernize 750 10,353 10 - - - 10,363 11,560 5 C801006 P66 HVAC Systems Upgrade 666 763 1,000 - - - 1,763 2,442 4 C800813 P66 Elevator 2,3,4 Upgrades 2 - - - - - - 1,612 3 C800126 Tenant Improvements -Capital 1,023 300 300 300 300 300 1,500 6,886 3 C800199 WTC HVAC Replacement 113 700 3,052 - - - 3,752 3,899 3 C801016 CW Bridge Elev Modernizations 50 700 750 - - - 1,450 1,500
Portfolio Management Total 2,604 12,816 5,112 300 300 300 18,828 27,899
Economic Development Total 4,000 14,586 10,812 15,120 15,050 6,350 61,918 77,067
Maritime Cruise Operations 5 C800592 P66 Cruise Terminal Tenant Imp 1,370 - - - - - - 15,250
4 C800582 New Cruise Terminal 1,060 2,840 20,000 72,000 4,100 - 98,940 100,000 4 C800613 Cruise Cap Allow - CTA Lease 200 200 225 250 - - 675 1,226 4 C800614 Cruise per Passenger Allowance 43 50 50 50 - - 150 193 3 C800120 P66 Shore Power 65 700 13,235 3,000 - - 16,935 17,000 3 C800819 BSCT Imp Staff Oversight 1 - - - - - - 280 3 C800821 T91 P91W Slope Stabilization - - - - - 1,000 1,000 1,264
Cruise Operations Total 2,739 3,790 33,510 75,300 4,100 1,000 117,700 135,213
Environmental Services 5 C800995 T117 Restoration 375 11,376 10,604 285 285 285 22,835 25,311 Environmental Services Total 375 11,376 10,604 285 285 285 22,835 25,311
Fishing and Operations 5 C800526 FT Net Shed 3,4,5,6 Roof Rpl 2 - - - - - - 2,546 4 C800531 FT Docks 3,4,5 Fixed Pier Imp 637 2,475 - - - - 2,475 3,332 4 C800675 P91 South End Fender 13 - - - - - - 2,276 4 C801070 SaBM Docks D,E Replacement 145 125 1,000 4,000 3,810 - 8,935 9,080 3 C102475 T91 Berth 6 & 8 Redev 29 400 10,000 24,571 - - 34,971 35,000

Division / CIP Sponsor Status CIP DescriptionEst./ Act.
2019 2020 2021 2022 2023 2024Total
2020-2024Est./ Act. CIP Total
Port of Seattle 5 Year Capital Budget Committed Projects
3 C800999 T5 Harbor Mooring Dolphins 30 145 2,550 1,776 - - 4,471 4,501 3 C801028 T91 Pier Stormwater Imp Ph 1 - - 1,050 - - - 1,050 1,050 3 C801069 Salmon Bay Marina Facility Upg 1 - - - - - - 1 3 C801071 Salmon Bay Fire Suppression 13 - - - 150 537 687 700 3 C801097 T91 Northwest Fender 35 3,600 2,965 - - - 6,565 6,600
Fishing and Operations Total 905 6,745 17,565 30,347 3,960 537 59,154 65,086
Maritime General 4 C800729 Marina Mgt Sys Replacement 163 - - - - - - 286 4 C800993 Salmon Bay Marina ACQ 3 - - - - - - 15,942 3 C102395 Maritime Technology Projects 176 250 250 250 250 250 1,250 5,336 3 C800442 MD Fleet 2018 and Prior 239 - - - - - - 3,078 3 C800561 MD: 2019 Small Projects 990 540 320 - - - 860 1,850 3 C800797 CRM MM 2015 Small Projects 43 - - - - - - 1,058 3 C800816 MD: 2016 Small Projects 429 - - - - - - 1,577 3 C800892 MD: 2017 Small Projects 524 - - - - - - 2,111 3 C801003 MD: 2018 Small Projects 731 - - - - - - 1,221 3 C801073 EDD Tenant Improvements - Cap - - 250 250 250 250 1,000 2,250 3 C801086 MD Fleet 2020 Beyond - 2,750 - - - - 2,750 2,750 3 C801088 MD: 2020+ Small Projects - 2,955 865 500 500 750 5,570 8,320 3 C801090 MD Fleet 2019 1,429 - - - - - - 1,429 3 C801091 MD Fleet 2021 Beyond - - 2,400 2,300 2,100 1,100 7,900 12,175
Maritime General Total 4,727 6,495 4,085 3,300 3,100 2,350 19,330 59,383
Maritime Portfolio Management 5 C800829 T91 Building C-173 Roof Overl 2 - - - - - - 1,378 4 C800445 SBM Pad Site Developement 110 310 - - - - 310 476 4 C800525 FT Gateway Building 381 1,000 10,000 10,000 847 - 21,847 23,744 4 C801024 SaBM Uplands 1 - - - - 1,500 1,500 20,547 4 C801084 FT Maritime Innovation Center 225 650 5,000 4,000 462 - 10,112 10,337
Maritime Portfolio Management Total 719 1,960 15,000 14,000 1,309 1,500 33,769 56,482
Recreational Boating 5 C800356 SBM Restrms/Service Bldgs Rep 2,721 7,976 - - - - 7,976 12,108 4 C800355 SBM Paving 725 1,007 - - - - 1,007 2,042 3 C800539 P66 BHM Pile Wraps - 160 700 2,583 8 - 3,451 3,500 3 C800678 T102 HIM E Dock - 100 3,550 250 - - 3,900 3,965 3 C801002 SBM Boat Wash 4 - 954 - - - 954 958
Recreational Boating Total 3,450 9,243 5,204 2,833 8 - 17,288 22,573
Maritime Total 12,915 39,609 85,968 126,065 12,762 5,672 270,076 364,048
NWSA Joint VentureLease & Asset Management 5 C102858 T5 Street Vacation Completion - 30 - - - - 30 1,445
5 C800994 T46 JV Stormwater Improvements 19 - - - - - - 5,858 4 C800620 T46 Pub Acc Mitigation at T117 50 1,500 - - - - 1,500 1,794 4 C801107 T5 Pile Remove Net Tie-Off Pls - 275 25 - - - 300 300
Lease & Asset Management Total 69 1,805 25 - - - 1,830 9,397
NWSA Joint Venture Total 69 1,805 25 - - - 1,830 9,397
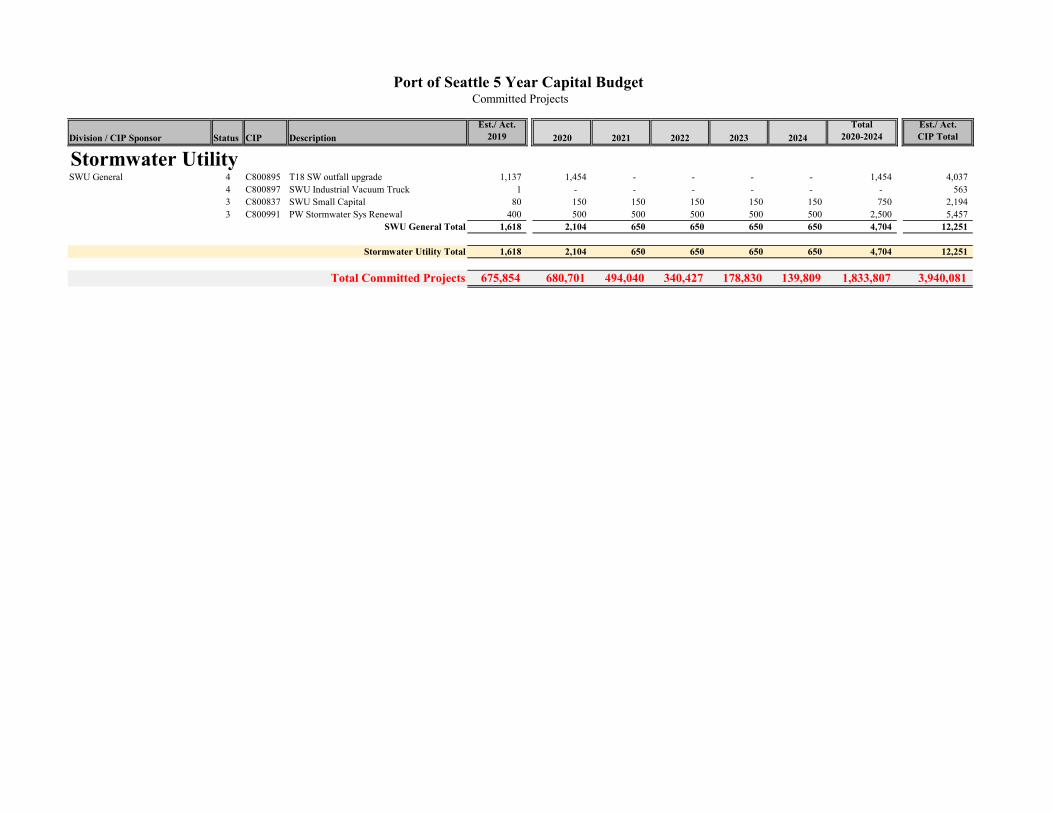
Division / CIP Sponsor Status CIP DescriptionEst./ Act.
2019 2020 2021 2022 2023 2024Total
2020-2024Est./ Act. CIP Total
Port of Seattle 5 Year Capital Budget Committed Projects
Stormwater UtilitySWU General 4 C800895 T18 SW outfall upgrade 1,137 1,454 - - - - 1,454 4,037
4 C800897 SWU Industrial Vacuum Truck 1 - - - - - - 563 3 C800837 SWU Small Capital 80 150 150 150 150 150 750 2,194 3 C800991 PW Stormwater Sys Renewal 400 500 500 500 500 500 2,500 5,457
SWU General Total 1,618 2,104 650 650 650 650 4,704 12,251
Stormwater Utility Total 1,618 2,104 650 650 650 650 4,704 12,251
Total Committed Projects 675,854 680,701 494,040 340,427 178,830 139,809 1,833,807 3,940,081
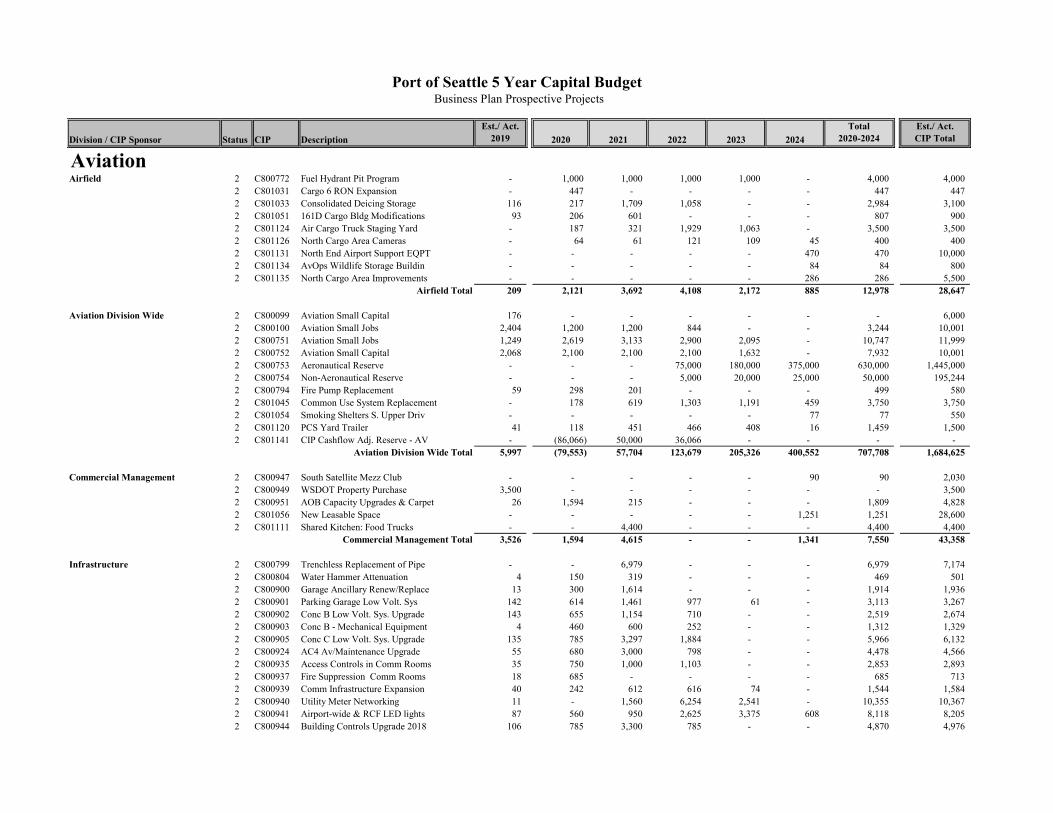
Division / CIP Sponsor Status CIP DescriptionEst./ Act.
2019 2020 2021 2022 2023 2024Total
2020-2024Est./ Act. CIP Total
Aviation Airfield 2 C800772 Fuel Hydrant Pit Program - 1,000 1,000 1,000 1,000 - 4,000 4,000
2 C801031 Cargo 6 RON Expansion - 447 - - - - 447 447 2 C801033 Consolidated Deicing Storage 116 217 1,709 1,058 - - 2,984 3,100 2 C801051 161D Cargo Bldg Modifications 93 206 601 - - - 807 900 2 C801124 Air Cargo Truck Staging Yard - 187 321 1,929 1,063 - 3,500 3,500 2 C801126 North Cargo Area Cameras - 64 61 121 109 45 400 400 2 C801131 North End Airport Support EQPT - - - - - 470 470 10,000 2 C801134 AvOps Wildlife Storage Buildin - - - - - 84 84 800 2 C801135 North Cargo Area Improvements - - - - - 286 286 5,500
Airfield Total 209 2,121 3,692 4,108 2,172 885 12,978 28,647
Aviation Division Wide 2 C800099 Aviation Small Capital 176 - - - - - - 6,000 2 C800100 Aviation Small Jobs 2,404 1,200 1,200 844 - - 3,244 10,001 2 C800751 Aviation Small Jobs 1,249 2,619 3,133 2,900 2,095 - 10,747 11,999 2 C800752 Aviation Small Capital 2,068 2,100 2,100 2,100 1,632 - 7,932 10,001 2 C800753 Aeronautical Reserve - - - 75,000 180,000 375,000 630,000 1,445,000 2 C800754 Non-Aeronautical Reserve - - - 5,000 20,000 25,000 50,000 195,244 2 C800794 Fire Pump Replacement 59 298 201 - - - 499 580 2 C801045 Common Use System Replacement - 178 619 1,303 1,191 459 3,750 3,750 2 C801054 Smoking Shelters S. Upper Driv - - - - - 77 77 550 2 C801120 PCS Yard Trailer 41 118 451 466 408 16 1,459 1,500 2 C801141 CIP Cashflow Adj. Reserve - AV - (86,066) 50,000 36,066 - - - -
Aviation Division Wide Total 5,997 (79,553) 57,704 123,679 205,326 400,552 707,708 1,684,625
Commercial Management 2 C800947 South Satellite Mezz Club - - - - - 90 90 2,030 2 C800949 WSDOT Property Purchase 3,500 - - - - - - 3,500 2 C800951 AOB Capacity Upgrades & Carpet 26 1,594 215 - - - 1,809 4,828 2 C801056 New Leasable Space - - - - - 1,251 1,251 28,600 2 C801111 Shared Kitchen: Food Trucks - - 4,400 - - - 4,400 4,400
Commercial Management Total 3,526 1,594 4,615 - - 1,341 7,550 43,358
Infrastructure 2 C800799 Trenchless Replacement of Pipe - - 6,979 - - - 6,979 7,174 2 C800804 Water Hammer Attenuation 4 150 319 - - - 469 501 2 C800900 Garage Ancillary Renew/Replace 13 300 1,614 - - - 1,914 1,936 2 C800901 Parking Garage Low Volt. Sys 142 614 1,461 977 61 - 3,113 3,267 2 C800902 Conc B Low Volt. Sys. Upgrade 143 655 1,154 710 - - 2,519 2,674 2 C800903 Conc B - Mechanical Equipment 4 460 600 252 - - 1,312 1,329 2 C800905 Conc C Low Volt. Sys. Upgrade 135 785 3,297 1,884 - - 5,966 6,132 2 C800924 AC4 Av/Maintenance Upgrade 55 680 3,000 798 - - 4,478 4,566 2 C800935 Access Controls in Comm Rooms 35 750 1,000 1,103 - - 2,853 2,893 2 C800937 Fire Suppression Comm Rooms 18 685 - - - - 685 713 2 C800939 Comm Infrastructure Expansion 40 242 612 616 74 - 1,544 1,584 2 C800940 Utility Meter Networking 11 - 1,560 6,254 2,541 - 10,355 10,367 2 C800941 Airport-wide & RCF LED lights 87 560 950 2,625 3,375 608 8,118 8,205 2 C800944 Building Controls Upgrade 2018 106 785 3,300 785 - - 4,870 4,976
Port of Seattle 5 Year Capital Budget Business Plan Prospective Projects

Division / CIP Sponsor Status CIP DescriptionEst./ Act.
2019 2020 2021 2022 2023 2024Total
2020-2024Est./ Act. CIP Total
Port of Seattle 5 Year Capital Budget Business Plan Prospective Projects
2 C800945 Terminal Solid Waste Imprvmnts 139 425 1,223 57 - - 1,705 6,200 2 C800978 VFD Replacement II 50 675 2,500 1,075 - - 4,250 4,300 2 C801030 Compactor Capacity 80 375 1,000 245 - - 1,620 1,700 2 C801036 Departure Drive Drainage 21 240 230 109 - - 579 600 2 C801037 C4 Generator Control - 142 1,071 3,069 2,462 55 6,799 6,799 2 C801038 Domestic Water Piping Phase 2 - - 564 1,079 3,642 4,001 9,286 11,501 2 C801039 Elevator/Escalator Comm. Cards - - - - - 1,400 1,400 6,000 2 C801041 HVAC Capacity Upgrade - 629 3,342 3,316 11,497 12,164 30,948 49,999 2 C801046 Concourse D Electrical Upgrade - 636 1,320 2,909 3,055 481 8,401 8,401 2 C801047 Cooling Tower Upgrades - - - - - 252 252 3,799
Infrastructure Total 1,083 9,788 37,096 27,863 26,707 18,961 120,415 155,616
Landside 2 C800975 RCF Camera Replacement 100 600 480 - - - 1,080 1,180 2 C801042 Landside Pavement Program - - 40 1,517 2,555 8,097 12,209 20,000 2 C801110 RCF Security Improvements 50 710 1,000 - - - 1,710 1,760 2 C801128 3rd FL GT Booth Enhancements - 5 204 348 1,674 570 2,801 2,801
Landside Total 150 1,315 1,724 1,865 4,229 8,667 17,800 25,741
Noise Program 2 C200096 Apartment Sound Insulation - - - 2,300 - - 2,300 2,300 2 C200097 ATZ Residential Acquisition - - - - 6,500 5,000 11,500 11,500 2 C200098 Places of Worship Sound Insula - - - - - 1,100 1,100 1,100
Noise Program Total - - - 2,300 6,500 6,100 14,900 14,900
Security 2 C801040 Fire Dept Apparatus Replace 1,700 - 1,250 - 2,050 - 3,300 5,000 2 C801093 Checkpoint 1 Relocation 100 1,900 - - - - 1,900 2,000 2 C801119 Lock Dock Employee Screening 41 118 451 466 408 16 1,459 1,500
Security Total 1,841 2,018 1,701 466 2,458 16 6,659 8,500
Stormwater 2 C801122 IWTP Controls Conversion - 143 987 2,712 4,648 2,109 10,599 10,599 2 C801123 IWTP Improvements - 93 1,827 1,813 6,937 8,207 18,877 26,999
Stormwater Total - 236 2,814 4,525 11,585 10,316 29,476 37,598
Sustainable Airport Master Plan 2 C801057 SAMP - Landside 500 3,750 20,000 20,000 10,000 1,250 55,000 56,250 2 C801059 SAMP - Airside 500 1,500 9,000 8,000 8,000 1,050 27,550 28,500 2 C801060 SAMP - Cargo - 500 1,500 - - - 2,000 2,000 2 C801061 SAMP - 2nd Terminal - 1,500 34,000 45,000 35,000 30,000 145,500 146,750 2 C801062 SAMP - Airline/Airport Support 600 2,750 12,000 21,750 15,000 3,900 55,400 56,500
Sustainable Airport Master Plan Total 1,600 10,000 76,500 94,750 68,000 36,200 285,450 290,000
Terminal and Tenants 2 C800875 Additional STS Cars 56 175 4,175 500 14,000 - 18,850 18,909 2 C800922 Baggage Claim Refresh - 2,750 8,287 - - - 11,037 11,037 2 C800959 Seating Replacement 22 2,000 7,000 4,864 - - 13,864 14,347 2 C800969 MT Fire Sprinkler-Smoke Cntrl 150 5,049 13,000 9,963 9,963 9,963 47,938 68,014 2 C800971 Checkpoint Smart LED Lighting 73 700 867 60 - - 1,627 2,472 2 C801034 Digital Signage 41 371 1,209 1,143 1,143 1,044 4,910 5,000 2 C801043 Upgrades STS Train Control 91 1,125 4,925 20,000 16,000 14,859 56,909 57,000 2 C801044 Carpet Replacement - Conc D - - - 99 252 430 781 1,300

Division / CIP Sponsor Status CIP DescriptionEst./ Act.
2019 2020 2021 2022 2023 2024Total
2020-2024Est./ Act. CIP Total
Port of Seattle 5 Year Capital Budget Business Plan Prospective Projects
2 C801049 Restroom Upgrade Conc A & CTE - - - - - 722 722 16,000 2 C801050 Restrooms - Mezz, Bag, Ticket - - 866 2,592 3,532 2,921 9,911 21,001 2 C801053 Digital Directories - 74 111 227 206 82 700 700 2 C801076 CTE Curtain Wall Setback 119 423 1,600 2,450 - - 4,473 4,600 2 C801121 Port Shared Lounge Conc A Exp 41 566 2,375 2,475 2,159 84 7,659 7,700 2 C801125 Mezzanine Security Glass - 491 1,657 2,743 2,286 2,292 9,469 12,900 2 C801127 Baggage Claim Device R&R Prog - - 2,935 6,058 24,597 32,850 66,440 71,000 2 C801129 Play Area Renovation - - 93 192 371 353 1,009 1,101 2 C801132 Pre-Security Tenant Offices 2 - - - - - 382 382 7,901 2 C801133 SSAT Meditation Room - - - - - 96 96 1,100
Terminal and Tenants Total 593 13,724 49,100 53,366 74,509 66,078 256,777 322,082
Aviation Total 14,999 (38,757) 234,946 312,922 401,486 549,116 1,459,713 2,611,067
Central Services Corporate P&TS Capital Project 2 C801143 CIP Cashflow Adj. Reserve - Corporate - (5,000) 2,000 1,000 1,000 1,000 - -
2 C800097 IT Renewal/Replacement - - - 1,000 1,000 1,000 3,000 18,000 2 C801063 Office Wi-Fi Refresh - 1,500 1,000 - - - 2,500 2,500 2 C801079 Exchange Online 50 300 - - - - 300 350 2 C801080 STIA Network Redundancy 100 1,350 - - - - 1,350 1,450 2 C801083 Phone System Upgrade 300 1,600 - - - - 1,600 1,900 2 C801136 Environmental Management Info - 200 150 - - - 350 350 2 C801137 Environmental Remediation MGMT - 145 255 100 - - 500 500 2 C801138 Learning Management System Rep - 400 - - - - 400 400 2 C801139 Applicant Tracking System - 350 - - - - 350 350 2 C801140 Community Communication Displ. - 180 320 - - - 500 500 2 C801142 Server Virtualization Upgrade 50 318 - - - - 318 368
Corporate P&TS Capital Project Total 500 1,343 3,725 2,100 2,000 2,000 11,168 26,668
Central Services Total 500 1,343 3,725 2,100 2,000 2,000 11,168 26,668
Economic DevelopmentGeneral Economic Development 2 C800216 EDD Reserve 1,000 1,000 1,000 1,500 1,500 1,500 6,500 22,500
2 C801065 Repurpose P69 datacenter space - - - - - 70 70 720 2 C801101 P69 Clerestory and Skylight Re - - 50 750 - - 800 800 2 C801112 P69 Lobby Improv V Wall Ph2 60 165 - - - - 165 225 2 C801145 CIP Cashflow Adj. Reserve - EDD - (2,080) (4,680) (4,420) 6,240 4,940 - -
General Economic Development Total 1,060 (915) (3,630) (2,170) 7,740 6,510 7,535 24,245
Portfolio Management 2 C801007 P66 Anthony's Mech Roof - - - - 25 675 700 750 2 C801064 WTC Garage Elevator Mods - - 50 1,750 130 - 1,930 1,930 2 C801103 P66 Roof Upgrades - 50 586 51 - - 687 687 2 C801104 WTCW Roof Replacement - - - - 30 660 690 741
Portfolio Management Total - 50 636 1,801 185 1,335 4,007 4,108
Economic Development Total 1,060 (865) (2,994) (369) 7,925 7,845 11,542 28,353
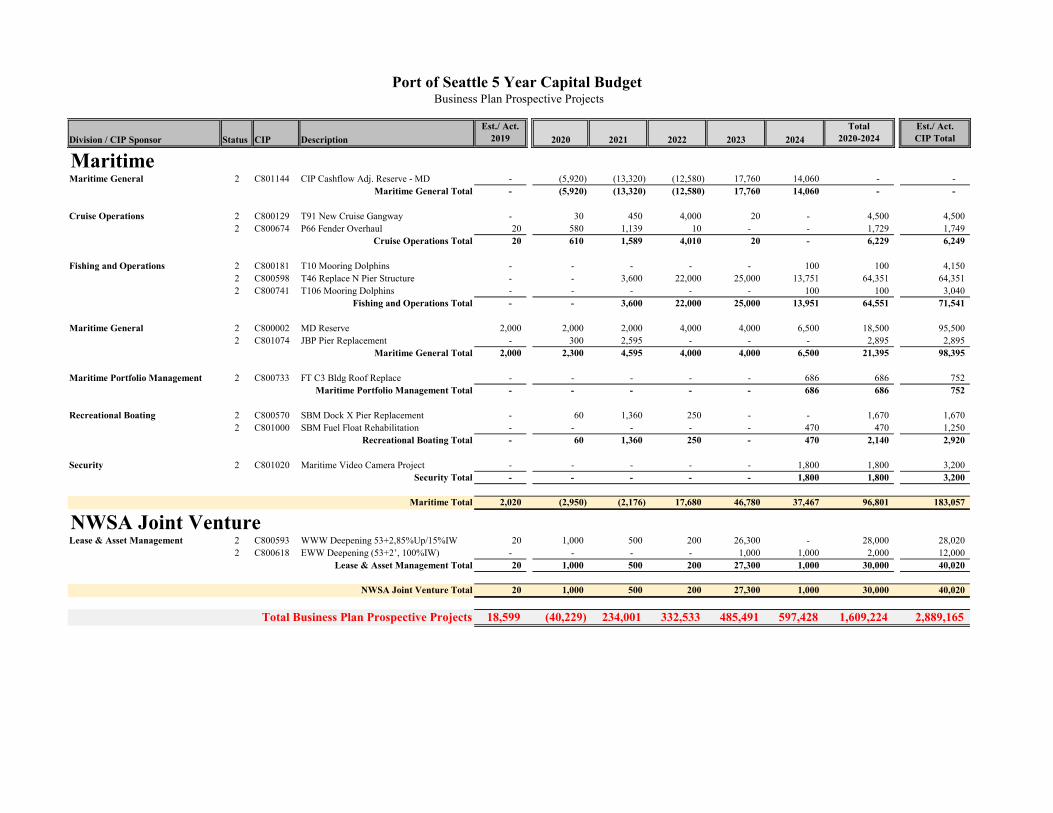
Division / CIP Sponsor Status CIP DescriptionEst./ Act.
2019 2020 2021 2022 2023 2024Total
2020-2024Est./ Act. CIP Total
Port of Seattle 5 Year Capital Budget Business Plan Prospective Projects
MaritimeMaritime General 2 C801144 CIP Cashflow Adj. Reserve - MD - (5,920) (13,320) (12,580) 17,760 14,060 - -
Maritime General Total - (5,920) (13,320) (12,580) 17,760 14,060 - -
Cruise Operations 2 C800129 T91 New Cruise Gangway - 30 450 4,000 20 - 4,500 4,500 2 C800674 P66 Fender Overhaul 20 580 1,139 10 - - 1,729 1,749
Cruise Operations Total 20 610 1,589 4,010 20 - 6,229 6,249
Fishing and Operations 2 C800181 T10 Mooring Dolphins - - - - - 100 100 4,150 2 C800598 T46 Replace N Pier Structure - - 3,600 22,000 25,000 13,751 64,351 64,351 2 C800741 T106 Mooring Dolphins - - - - - 100 100 3,040
Fishing and Operations Total - - 3,600 22,000 25,000 13,951 64,551 71,541
Maritime General 2 C800002 MD Reserve 2,000 2,000 2,000 4,000 4,000 6,500 18,500 95,500 2 C801074 JBP Pier Replacement - 300 2,595 - - - 2,895 2,895
Maritime General Total 2,000 2,300 4,595 4,000 4,000 6,500 21,395 98,395
Maritime Portfolio Management 2 C800733 FT C3 Bldg Roof Replace - - - - - 686 686 752 Maritime Portfolio Management Total - - - - - 686 686 752
Recreational Boating 2 C800570 SBM Dock X Pier Replacement - 60 1,360 250 - - 1,670 1,670 2 C801000 SBM Fuel Float Rehabilitation - - - - - 470 470 1,250
Recreational Boating Total - 60 1,360 250 - 470 2,140 2,920
Security 2 C801020 Maritime Video Camera Project - - - - - 1,800 1,800 3,200 Security Total - - - - - 1,800 1,800 3,200
Maritime Total 2,020 (2,950) (2,176) 17,680 46,780 37,467 96,801 183,057
NWSA Joint VentureLease & Asset Management 2 C800593 WWW Deepening 53+2,85%Up/15%IW 20 1,000 500 200 26,300 - 28,000 28,020
2 C800618 EWW Deepening (53+2’, 100%IW) - - - - 1,000 1,000 2,000 12,000 Lease & Asset Management Total 20 1,000 500 200 27,300 1,000 30,000 40,020
NWSA Joint Venture Total 20 1,000 500 200 27,300 1,000 30,000 40,020
Total Business Plan Prospective Projects 18,599 (40,229) 234,001 332,533 485,491 597,428 1,609,224 2,889,165
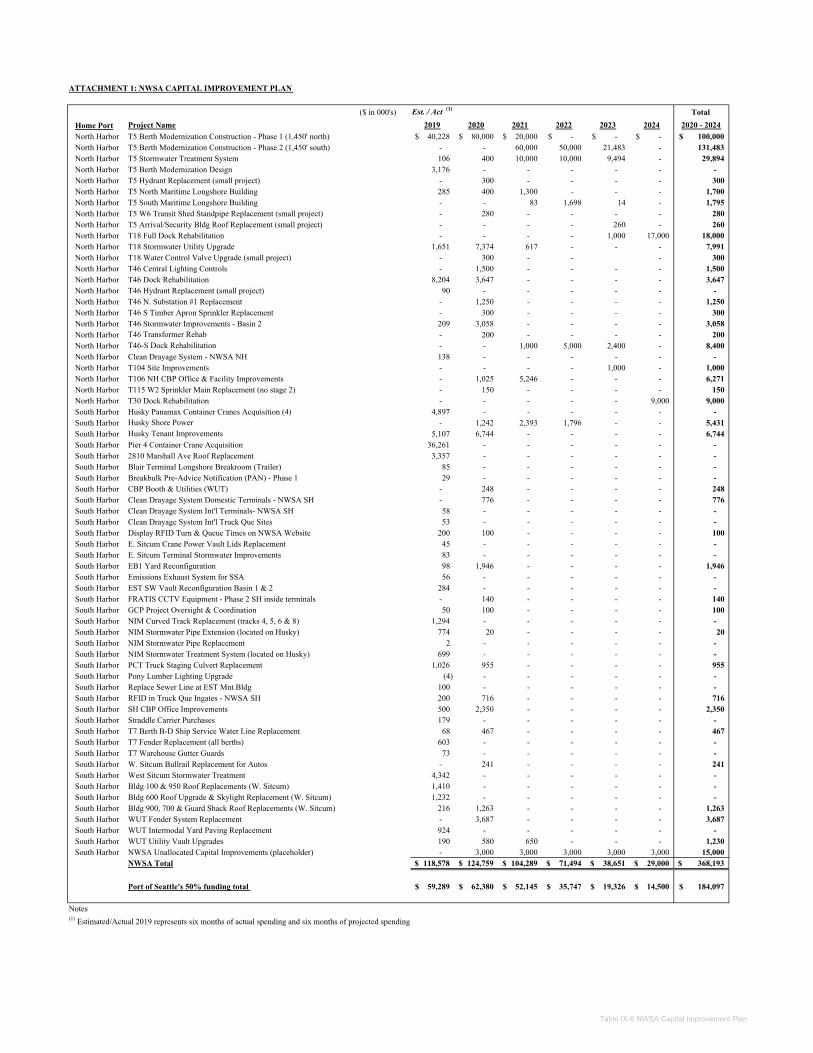
ATTACHMENT 1: NWSA CAPITAL IMPROVEMENT PLAN
($ in 000's) Est. / Act (1) Total Home Port Project Name 2019 2020 2021 2022 2023 2024 2020 - 2024North Harbor T5 Berth Modernization Construction - Phase 1 (1,450' north) 40,228$ 80,000$ 20,000$ -$ -$ -$ 100,000$ North Harbor T5 Berth Modernization Construction - Phase 2 (1,450' south) - - 60,000 50,000 21,483 - 131,483 North Harbor T5 Stormwater Treatment System 106 400 10,000 10,000 9,494 - 29,894 North Harbor T5 Berth Modernization Design 3,176 - - - - - - North Harbor T5 Hydrant Replacement (small project) - 300 - - - - 300 North Harbor T5 North Maritime Longshore Building 285 400 1,300 - - - 1,700 North Harbor T5 South Maritime Longshore Building - - 83 1,698 14 - 1,795 North Harbor T5 W6 Transit Shed Standpipe Replacement (small project) - 280 - - - - 280 North Harbor T5 Arrival/Security Bldg Roof Replacement (small project) - - - - 260 - 260 North Harbor T18 Full Dock Rehabilitation - - - - 1,000 17,000 18,000 North Harbor T18 Stormwater Utility Upgrade 1,651 7,374 617 - - - 7,991 North Harbor T18 Water Control Valve Upgrade (small project) - 300 - - - 300 North Harbor T46 Central Lighting Controls - 1,500 - - - - 1,500 North Harbor T46 Dock Rehabilitation 8,204 3,647 - - - - 3,647 North Harbor T46 Hydrant Replacement (small project) 90 - - - - - - North Harbor T46 N. Substation #1 Replacement - 1,250 - - - - 1,250 North Harbor T46 S Timber Apron Sprinkler Replacement - 300 - - - - 300 North Harbor T46 Stormwater Improvements - Basin 2 209 3,058 - - - - 3,058 North Harbor T46 Transformer Rehab - 200 - - - - 200 North Harbor T46-S Dock Rehabilitation - - 1,000 5,000 2,400 - 8,400 North Harbor Clean Drayage System - NWSA NH 138 - - - - - - North Harbor T104 Site Improvements - - - - 1,000 - 1,000 North Harbor T106 NH CBP Office & Facility Improvements - 1,025 5,246 - - - 6,271 North Harbor T115 W2 Sprinkler Main Replacement (no stage 2) - 150 - - - - 150 North Harbor T30 Dock Rehabilitation - - - - - 9,000 9,000 South Harbor Husky Panamax Container Cranes Acquisition (4) 4,897 - - - - - - South Harbor Husky Shore Power - 1,242 2,393 1,796 - - 5,431 South Harbor Husky Tenant Improvements 5,107 6,744 - - - - 6,744 South Harbor Pier 4 Container Crane Acquisition 36,261 - - - - - - South Harbor 2810 Marshall Ave Roof Replacement 3,357 - - - - - - South Harbor Blair Terminal Longshore Breakroom (Trailer) 85 - - - - - - South Harbor Breakbulk Pre-Advice Notification (PAN) - Phase 1 29 - - - - - - South Harbor CBP Booth & Utilities (WUT) - 248 - - - - 248 South Harbor Clean Drayage System Domestic Terminals - NWSA SH - 776 - - - - 776 South Harbor Clean Drayage System Int'l Terminals- NWSA SH 58 - - - - - - South Harbor Clean Drayage System Int'l Truck Que Sites 53 - - - - - - South Harbor Display RFID Turn & Queue Times on NWSA Website 200 100 - - - - 100 South Harbor E. Sitcum Crane Power Vault Lids Replacement 45 - - - - - - South Harbor E. Sitcum Terminal Stormwater Improvements 83 - - - - - - South Harbor EB1 Yard Reconfiguration 98 1,946 - - - - 1,946 South Harbor Emissions Exhaust System for SSA 56 - - - - - - South Harbor EST SW Vault Reconfiguration Basin 1 & 2 284 - - - - - - South Harbor FRATIS CCTV Equipment - Phase 2 SH inside terminals - 140 - - - - 140 South Harbor GCP Project Oversight & Coordination 50 100 - - - - 100 South Harbor NIM Curved Track Replacement (tracks 4, 5, 6 & 8) 1,294 - - - - - - South Harbor NIM Stormwater Pipe Extension (located on Husky) 774 20 - - - - 20 South Harbor NIM Stormwater Pipe Replacement 2 - - - - - - South Harbor NIM Stormwater Treatment System (located on Husky) 699 - - - - - - South Harbor PCT Truck Staging Culvert Replacement 1,026 955 - - - - 955 South Harbor Pony Lumber Lighting Upgrade (4) - - - - - - South Harbor Replace Sewer Line at EST Mnt Bldg 100 - - - - - - South Harbor RFID in Truck Que Ingates - NWSA SH 200 716 - - - - 716 South Harbor SH CBP Office Improvements 500 2,350 - - - - 2,350 South Harbor Straddle Carrier Purchases 179 - - - - - - South Harbor T7 Berth B-D Ship Service Water Line Replacement 68 467 - - - - 467 South Harbor T7 Fender Replacement (all berths) 603 - - - - - - South Harbor T7 Warehouse Gutter Guards 73 - - - - - - South Harbor W. Sitcum Bullrail Replacement for Autos - 241 - - - - 241 South Harbor West Sitcum Stormwater Treatment 4,342 - - - - - - South Harbor Bldg 100 & 950 Roof Replacements (W. Sitcum) 1,410 - - - - - - South Harbor Bldg 600 Roof Upgrade & Skylight Replacement (W. Sitcum) 1,232 - - - - - - South Harbor Bldg 900, 700 & Guard Shack Roof Replacements (W. Sitcum) 216 1,263 - - - - 1,263 South Harbor WUT Fender System Replacement - 3,687 - - - - 3,687 South Harbor WUT Intermodal Yard Paving Replacement 924 - - - - - - South Harbor WUT Utility Vault Upgrades 190 580 650 - - - 1,230 South Harbor NWSA Unallocated Capital Improvements (placeholder) - 3,000 3,000 3,000 3,000 3,000 15,000
NWSA Total 118,578$ 124,759$ 104,289$ 71,494$ 38,651$ 29,000$ 368,193$
Port of Seattle's 50% funding total 59,289$ 62,380$ 52,145$ 35,747$ 19,326$ 14,500$ 184,097$
Notes (1) Estimated/Actual 2019 represents six months of actual spending and six months of projected spending
Table IX-6 NWSA Capital Improvement Plan

X. P
LAN
OF FIN
AN
CE
X. PLAN OF FINANCE


Port of Seattle 2020 Budget Draft Plan of Finance
X-1
2020-2024 DRAFT PLAN OF FINANCE
The Draft Plan of Finance will be included as part of the 2020 Final Budget.
Thank You

Port of Seattle 2020 Budget Draft Plan of Finance
X-2
This page was intentionally left blank.
XI. STA
TU
TO
RY
BU
DG
ET
XI. STATUTORY BUDGET

Port of Seattle 2020 Budget Statutory Budget
XI-1
2020 STATUTORY BUDGET
A. INTRODUCTION The "statutory" budget as defined in RCW 53.35.010 is to portray "the estimated expenditures and the anticipated available funds from which all expenditures are to be paid." As a cash budget, the Statutory Budget establishes the need for the tax levy, sets upper limits on expenditures, and is not used as an operating budget. The function of controlling and managing the operations of the Port is accomplished with the Operating Budget, which is provided in Sections IV through VII. The preliminary 2020 Statutory Budget is provided to the Port Commissioners and made available to the general public as required by law (RCW 53.35.010 and RCW 53.35.045). Two Notices of the Public Hearing will be published on October 30, 2019 and on November 6, 2019 in the DAILY JOURNAL OF COMMERCE, as required by law (RCW 53.35.020 and RCW 53.35.045). The two notices will include announcements that copies of the preliminary budget would be available for distribution to any interested persons on October 24, 2019, that the introduction of the preliminary 2020 Budget and public hearing will be held on November 12, 2019, and that the adoption of the 2020 Budget will be held on November 19, 2019. The final statutory budget was filed with the King County Council by December 2, 2019, as allowed by RCW 53.35.045. In addition, RCW 84.55.120 requires that the Port adopt a separate resolution for an increase in the tax levy. B. STATUTORY BUDGET HIGHLIGHTS 1. Tax Levy
For 2020 the tax levy is assumed at $76.4 million. The following is a comparison of the tax levy detail between 2019 and 2020:
2. Tax Levy Rate
The tax levy rate is a product of dividing the tax levy dollars by the assessed valuation of personal and real properties within the Port District. Therefore, if assessed valuation increases at a greater rate than the increase in the tax levy amount the Port assesses, the tax millage rate would go down even though the Port's levy dollars may have increased. The exact levy rate is determined by the County Assessor after all taxing agencies have requested their levy dollars, and the assessed valuation dollars are certified. The 2019 preliminary assessed valuation as of October 1, 2019 is $636,879,445,421 after omitted assessments, which are not included in the Port’s levy calculation (The 2019 assessed valuation is used for 2020 tax collection). This is an increase from the final assessed valuation per the King County Annual Report for 2019 tax collection, which was $604,858,079,431 after omitted assessment. See section VII, Tax Levy, for additional discussion on the Port’s use of the tax levy.
Budget 2019 Budget 2020Levy Levy Levy LevyRate Amount Rate Amount
For General Obligation Bonds $ 0.0718 43,447,118$ $ 0.0625 39,783,253$
For General Purposes 0.0508 30,712,882 0.0575 36,601,548
Total $ 0.1226 $ 74,160,000 $ 0.1199 $ 76,384,800 (1)
(1) 2020 Port levy is pending commission approval
Port of Seattle 2020 Budget Statutory Budget
XI-2
C. RESOLUTIONS
RESOLUTION NO. 3763
A RESOLUTION of the Port Commission of the Port of Seattle adopting the final budget of the Port of Seattle for the year 2020; making, determining, and deciding the amount of taxes to be levied upon the current assessment roll; providing payment of bond redemptions and interest, cost of future capital improvements and acquisitions, and for such general purposes allowed by law which the Port deems necessary; and directing the King County Council as to the specific sums to be levied on all of the assessed properties of the Port of Seattle District in the Year 2020.
WHEREAS, the Port of Seattle in the Century Agenda commits to create economic
opportunity for all, steward our environmental responsibly, partner with surrounding communities, promote social responsibility, conduct ourselves transparently, and hold ourselves accountable; and
WHEREAS, the Port of Seattle's Century Agenda outlined goals of meeting current
demand as a business gateway and tourism hub for the region, and further expressed the need to anticipate future growth of the region and to prepare for the ensuing demand for cruise, maritime, and aviation all for the economic benefit of the region; and
WHEREAS, the Port of Seattle Commission is committed to the responsible stewardship
of public tax revenue, financial transparency, and an open budget process; and
WHEREAS, the Port of Seattle and its Commission are committed to making strategic investments necessary to promote a thriving maritime and industrial economy and recognize that increasing pressure on industrial lands and freight corridors in the region threatens the viability of this sector; and
WHEREAS, the long-term viability of the maritime and industrial sector is dependent on a
robust and well-trained workforce and the sector is facing both an aging workforce and a limited influx of trained younger workers to replace those approaching retirement and the need to strengthen training and pathways into the sector; and

Port of Seattle 2020 Budget Statutory Budget
XI-3
WHEREAS, the Port of Seattle Commission is committed to reducing our carbon footprint by investing in solutions to become the "greenest" and most efficient port in the nation and we are further committed to assisting and incentivizing those we do business with in order to reach these goals; and
WHEREAS, the Port of Seattle Commission has determined that the mission of the Port is
to create good jobs in the region by advancing trade and commerce, promoting manufacturing and maritime growth, and stimulating economic development; and
WHEREAS, the Port of Seattle Commission, on the 22nd day of October, 2019, provided the preliminary 2020 Budget of the Port of Seattle to the public and provided for the publication of Notice of Budget Hearing to consider adoption of a final budget, to be heard on the 12th day of November, 2019, when taxpayers might appear and present objections to the preliminary 2020 Budget; and
WHEREAS, a public hearing on the preliminary 2020 Budget was held in the Port
Commission Chambers, pursuant to notice duly given, in the City of Seattle, County of King, State of Washington, on the 12th of November, 2019, at 12 p.m.; and
WHEREAS, all parties present at said hearing were afforded a full opportunity to present
objections to the preliminary 2020Budget, and the Port Commission being duly advised in the premises; and
WHEREAS, the King County Assessor notified the Commissioners of the Port of Seattle on
the 1st day of October, 2019, that the regular levy assessed value of the property lying within the boundaries of the Port of Seattle district ("Port District") for the year 2019 is $636,879,445,421 (after omitted assessments); and
WHEREAS, the King County Assessor notified the Commissioners of the Port of Seattle on the
1st day of October, 2019, that the maximum allowable levy is $106,250,147 including $0 levy for prior year refunds, and the Port intends to retain this levy capacity;
NOW, THEREFORE, BE IT RESOLVED by the Port Commission of the Port of Seattle that
the preliminary 2020 Budget, as updated and amended at the November 12, 2019, Port Commission hearing, and as may have been further amended by the Port Commission on this 19th of November, 2019, is hereby adopted as the final budget of the Port of Seattle for the Year 2020. Said final budget includes the statutory budget required under RCW 53.35.040. A copy of the final budget shall be made available to the public on the Port of Seattle website.
BE IT FURTHER RESOLVED that the amount of taxes to be levied by the Port of Seattle
on the current assessment rolls to provide for payment of band redemption and interest on the Port of Seattle General Obligation Bonds, for future expenditures for acquisitions and
Port of Seattle 2020 Budget Statutory Budget
XI-4
capital improvements and for such general purposes allowed by law which the Port deems necessary be set and deposited is still pending commission approval.
BE IT FURTHER RESOLVED that the King County Council, State of Washington, be
notified that the specific sum herein mentioned being a total of $76,384,800 is necessary to be raised by taxation to meet the payment of bond redemption and interest on Port of Seattle General Obligation Bonds, of future expenditures for acquisitions and capital improvements, and of costs for such general purposes allowed by law which the Port deems necessary, as set forth for the period January 1, 2020, and thereafter; that said King County Council be respectfully requested to make a levy in said amount for the aforesaid purposes.
BE IT FURTHER RESOLVED that the above is a true and complete listing of levies for the
Port District for collection in the year 2020 and they are within the maximums established by law.
ADOPTED by the Port Commission of the Port of Seattle at a duly noticed meeting held this 19th
day of November, 2019, and duly authenticated in open session by the signatures of the Commissioners voting in favor thereof and the seal of the Commission.
Port of Seattle Commissioners

Port of Seattle 2020 Budget Statutory Budget
XI-5
RESOLUTION NO. 3764
A RESOLUTION of the Port Commission of the Port of Seattle specifying the dollar and percentage change in the regular property levy from the previous year per RCW 84.55.120; providing for an increase of the levy from $74,160,000 to $76,384,800.
WHEREAS, the Port of Seattle in the Commission has met and considered its budget
for the calendar year 2020; and
WHEREAS, the Port of Seattle's Commission, after hearing and duly considering all relevant evidence and testimony presented in a public hearing held pursuant to RCW 84.55.120, has determined the Port of Seattle requires a regular levy in the amount of $76,384,800, which represents the levy rate of approximately $0.120 per thousand of assessed value; and
WHEREAS, the levy amount includes an increase in property tax revenue from the previous
year to discharge the expenses and obligations of the district in its best interest;
NOW, THEREFORE, BE IT RESOLVED by the Port Commission of the Port of Seattle that a property tax levy is hereby authorized in the amount of $76,384,800, an increase of $2,224,800, a 3.0 percent increase from 2019. Excluding the new construction and refund amount, the increase is $1,035,306 or 1.4 percent from 2019 for tax filing purposes.
ADOPTED by the Port Commission of the Port of Seattle at a duly noticed meeting held this 19th day of November, 2019, and duly authenticated in open session by the signatures of the Commissioners voting in favor thereof and the seal of the Commission.
Port of Seattle Commissioners
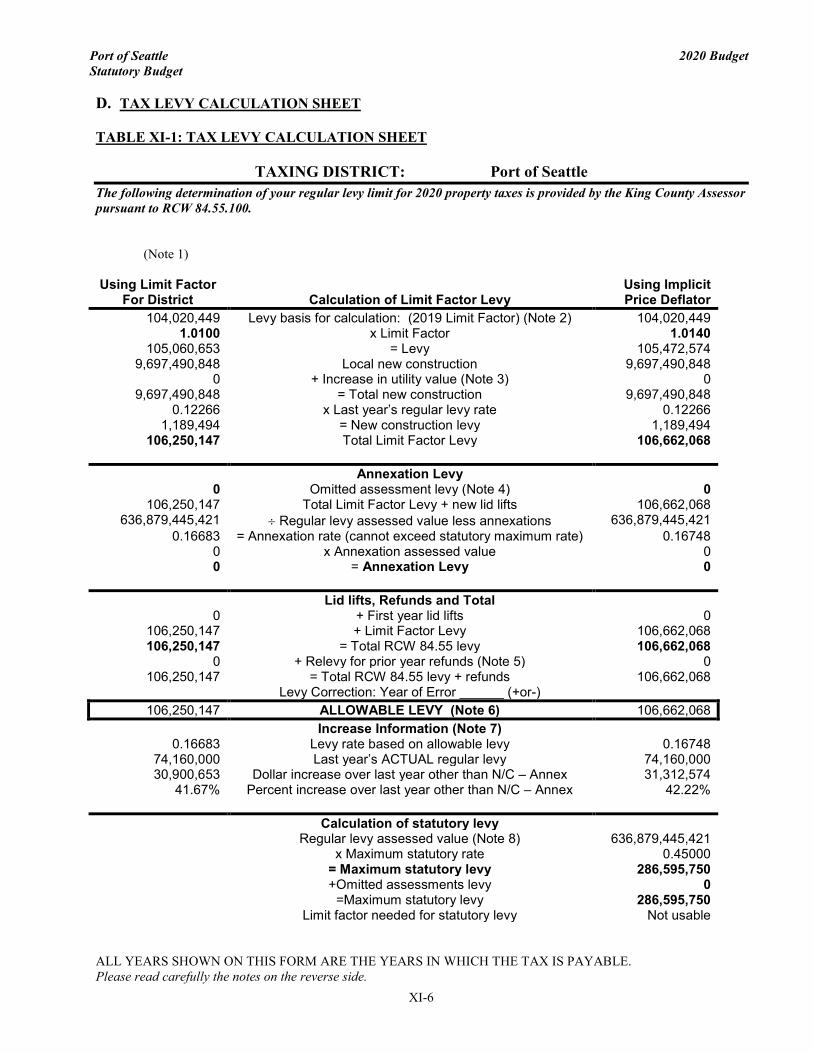
Port of Seattle 2020 Budget Statutory Budget
XI-6
D. TAX LEVY CALCULATION SHEET TABLE XI-1: TAX LEVY CALCULATION SHEET
TAXING DISTRICT: Port of Seattle
The following determination of your regular levy limit for 2020 property taxes is provided by the King County Assessor pursuant to RCW 84.55.100. (Note 1) Using Limit Factor
For District
Calculation of Limit Factor Levy Using Implicit Price Deflator
104,020,449 Levy basis for calculation: (2019 Limit Factor) (Note 2) 104,020,449 1.0100 x Limit Factor 1.0140
105,060,653 = Levy 105,472,574 9,697,490,848 Local new construction 9,697,490,848
0 + Increase in utility value (Note 3) 0 9,697,490,848 = Total new construction 9,697,490,848
0.12266 x Last year’s regular levy rate 0.12266 1,189,494 = New construction levy 1,189,494
106,250,147 Total Limit Factor Levy 106,662,068 Annexation Levy
0 Omitted assessment levy (Note 4) 0 106,250,147 Total Limit Factor Levy + new lid lifts 106,662,068
636,879,445,421 ÷ Regular levy assessed value less annexations 636,879,445,421 0.16683 = Annexation rate (cannot exceed statutory maximum rate) 0.16748
0 x Annexation assessed value 0 0 = Annexation Levy 0 Lid lifts, Refunds and Total
0 + First year lid lifts 0 106,250,147 + Limit Factor Levy 106,662,068 106,250,147 = Total RCW 84.55 levy 106,662,068
0 + Relevy for prior year refunds (Note 5) 0 106,250,147 = Total RCW 84.55 levy + refunds 106,662,068
Levy Correction: Year of Error ______ (+or-) 106,250,147 ALLOWABLE LEVY (Note 6) 106,662,068
Increase Information (Note 7) 0.16683 Levy rate based on allowable levy 0.16748
74,160,000 Last year’s ACTUAL regular levy 74,160,000 30,900,653 Dollar increase over last year other than N/C – Annex 31,312,574
41.67% Percent increase over last year other than N/C – Annex 42.22% Calculation of statutory levy Regular levy assessed value (Note 8) 636,879,445,421 x Maximum statutory rate 0.45000 = Maximum statutory levy 286,595,750 +Omitted assessments levy 0 =Maximum statutory levy 286,595,750 Limit factor needed for statutory levy Not usable
ALL YEARS SHOWN ON THIS FORM ARE THE YEARS IN WHICH THE TAX IS PAYABLE. Please read carefully the notes on the reverse side.

Port of Seattle 2020 Budget Statutory Budget
XI-7
Notes: 1) Rates for fire districts and the library district are estimated at the time this worksheet is produced.
Fire district and library district rates affect the maximum allowable rate for cities annexed to them. These rates will change, mainly in response to the actual levy requests from the fire and library districts. Hence, affected cities may have a higher or lower allowable levy rate than is shown here when final levy rates are calculated.
2) This figure shows the maximum allowable levy, which may differ from any actual prior levy if a district has levied less than its maximum in prior years. The maximum allowable levy excludes any allowable refund levy if the maximum was based on a limit factor. The maximum allowable levy excludes omitted assessments if the maximum was determined by your district’s statutory rate limit. If your district passed a limit factor ordinance in the year indicated, that limit factor would help determine the highest allowable levy. However, if the statutory rate limit was more restrictive than your stated limit factor, the statutory rate limit is controlling.
3) Any increase in value in state-assessed property is considered to be new construction value for purposes of calculating the respective limits. State-assessed property is property belonging to inter-county utility and transportation companies (telephone, railroad, airline companies and the like).
4) An omitted assessment is property value that should have been included on a prior year’s roll but will be included on the tax roll for which this worksheet has been prepared. Omits are assessed and taxed at the rate in effect for the year omitted (RCW 84.40.080-085). Omitted assessments tax is deducted from the levy maximum before calculating the levy rate for current assessments and added back in as a current year’s receivable.
5) Administrative refunds under RCW 84.69.020 were removed from the levy lid by the 1981 legislature.
6) A district is entitled to the lesser of the maximum levies determined by application of the limit under RCW 84.55 and the statutory rate limit. Levies may be subject to further proration if aggregate rate limits set in Article VII of the state constitution and in RCW 84.52.043 are exceeded.
7) This section is provided for your information, and to assist in preparing any Increase Ordinance that may be required by RCW 84.55.120. The increase information compares the allowable levy for the next tax year with your ACTUAL levy being collected this year. The actual levy excludes any refund levy and expired temporary lid lifts, if applicable. New construction, annexation and refund levies, as well as temporary lid lifts in their initial year, are subtracted from this year’s allowable levy before the comparison is made.
8) Assessed valuations shown are subject to change from error corrections and appeal board decisions recorded between the date of this worksheet and final levy rate determination.
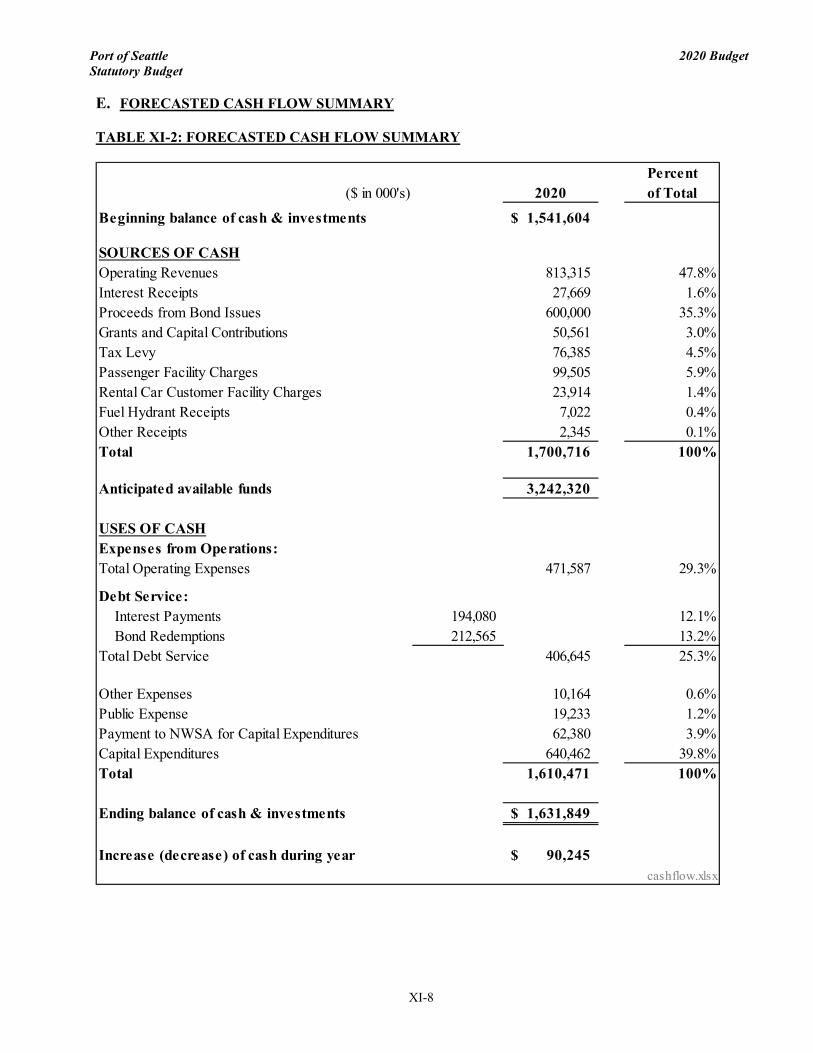
Port of Seattle 2020 Budget Statutory Budget
XI-8
E. FORECASTED CASH FLOW SUMMARY TABLE XI-2: FORECASTED CASH FLOW SUMMARY
Percent ($ in 000's) 2020 of Total
Beginning balance of cash & investments 1,541,604$
SOURCES OF CASHOperating Revenues 813,315 47.8%Interest Receipts 27,669 1.6%Proceeds from Bond Issues 600,000 35.3%Grants and Capital Contributions 50,561 3.0%Tax Levy 76,385 4.5%Passenger Facility Charges 99,505 5.9%Rental Car Customer Facility Charges 23,914 1.4%Fuel Hydrant Receipts 7,022 0.4%Other Receipts 2,345 0.1%Total 1,700,716 100%
Anticipated available funds 3,242,320
USES OF CASHExpenses from Operations:Total Operating Expenses 471,587 29.3%
Debt Service: Interest Payments 194,080 12.1% Bond Redemptions 212,565 13.2%Total Debt Service 406,645 25.3%
Other Expenses 10,164 0.6%Public Expense 19,233 1.2%Payment to NWSA for Capital Expenditures 62,380 3.9%Capital Expenditures 640,462 39.8%Total 1,610,471 100%
Ending balance of cash & investments 1,631,849$
Increase (decrease) of cash during year 90,245$ cashflow.xlsx
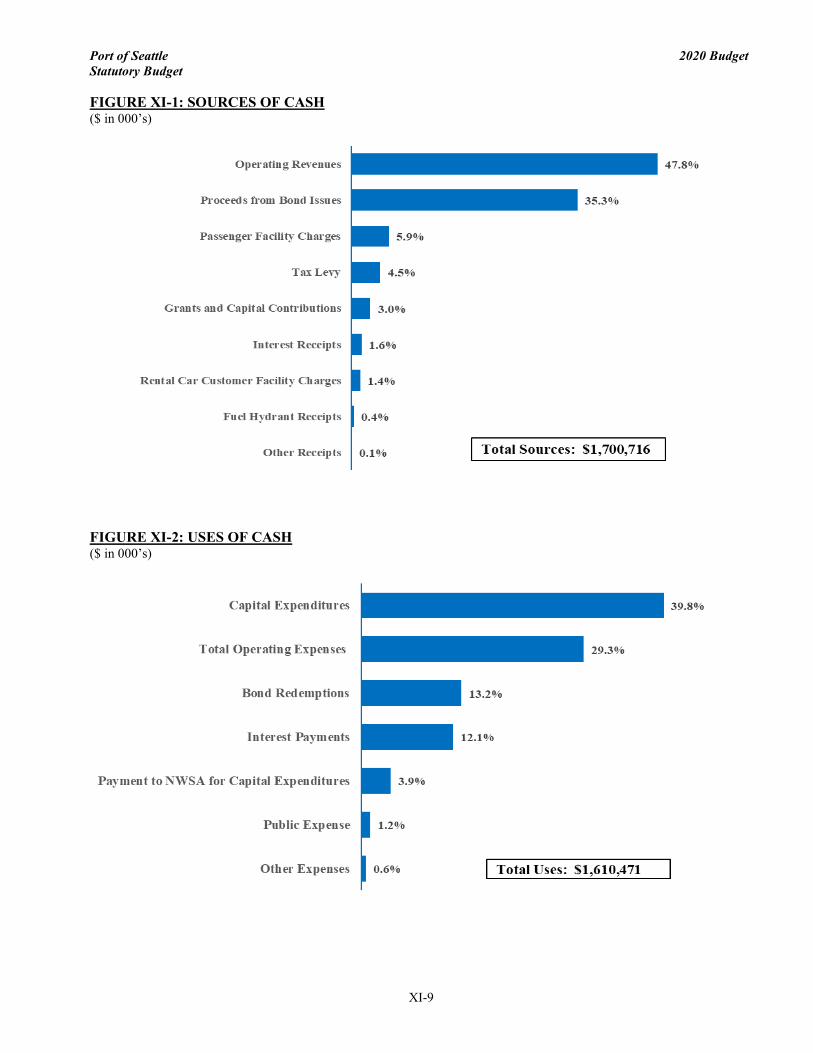
Port of Seattle 2020 Budget Statutory Budget
XI-9
FIGURE XI-1: SOURCES OF CASH ($ in 000’s)
FIGURE XI-2: USES OF CASH ($ in 000’s)

Port of Seattle 2020 Budget Statutory Budget
XI-10
This page was intentionally left blank.
XII. N
WSAXII. THE NORTHWEST SEAPORT
ALLIANCE (NWSA)


The Northwest Seaport Alliance 2020 Budget
Operating Budget and Capital Investment Plan adopted: November 14, 2019
A Crane operator at work
Port of Seattle The NWSA
2020 Budget
Draft
In July 2019, Inbound Logistics magazine named The Northwest Seaport Alliance in its annual list of “Green 75” supply chain partners. This is the third consecutive year that the NWSA has been recognized for its environmental programs and commitment to sustainability. Although this recognition is the first for the alliance, both the Port of Seattle and the Port of Tacoma have been recognized individually for several years.
In August 2019, Logistics Management Magazine awarded The Northwest Seaport Alliance with a 2017 Quest for Quality award in the West Coast Port category. This is the second year that the NWSA has earned this award. The NWSA ranked second highest among U.S. West Coast ports in the magazine’s annual readership survey of transportation providers. Ports were evaluated on ease of doing business, value, ocean carrier network, intermodal network and operations. The NWSA was one of only four West Coast ports to earn the honor this year.
Port of Seattle The NWSA
2020 Budget
Draft

Table of Contents
Memo from John Wolfe, CEO ....................................................................................................................................... i
Budget Document Overview ....................................................................................................................................... ii
I. Northwest Seaport Alliance Overview ............................................................................................................ I-1
II. Budget Message .............................................................................................................................................. II-1
III. Business Outlook ........................................................................................................................................... III-1
IV. Operating Budget ........................................................................................................................................... IV-1
V. Capital Investment Plan .................................................................................................................................. V-1
VI. Environmental Stewardship & Planning ...................................................................................................... VI-1
Appendix A Bond Income Calculation………………………………………………………………………………...…….A-1
Appendix B Capital Construction…………………………………………………………………………………………….A-2
Appendix C NWSA Full Time Personnel……………………………………………………………………………………A-3
Appendix D NWSA Memberships……………………………………………………………………………………………A-4
Port of Seattle The NWSA
2020 Budget
Draft
Figures
Figure Page Number I-1 Northwest Seaport Alliance Facilities – North Harbor…………………………………………………… I-6 I-2 Northwest Seaport Alliance Facilities – South Harbor…………………………………………………. I-7 I-3 The Northwest Seaport Alliance Organizational Chart........................................................................ I-8 V-1 Five-Year Capital Investment Plan by Line of Business .................................................................... V-4
Tables
Table Page Number III-1 Cargo Activity Five-Year Forecast .................................................................................................... III-4 IV-1 Statement of Revenue, Expenses and Change in Net Position by Business ................................... IV-4 IV-2 Operating Revenue and Expense Detail ........................................................................................... IV-5 IV-3 Statements of Revenues, Expenses and Changes in Net Position .................................................. IV-6 IV-4 Allocation and Direct Charge Summary…………………………………………………………………...IV-6 IV-5 NWSA Five-Year Financial Forecast ................................................................................................ IV-7 IV-6 NWSA Five-Year Bond Income………………………………………………………………...…………..IV-7 V-1 Planned Capitalized Project Spending............................................................................................... V-2 V-2 Five-Year Planned Capital Investment Plan by Purpose ................................................................... V-3 V-3 Five-Year Planned Capital Investment Plan by Accounting Treatment ............................................. V-3 V-4 Planned Major Projects by Line of Business ...................................................................................... V-3 V-5 Depreciation Impact due to Capitalized Projects ............................................................................... V-3
Port of Seattle The NWSA
2020 Budget
Draft

To: Managing Members Date: November 14, 2019
Subject: The Northwest Seaport Alliance Operating Budget and Five-Year Capital Investment Plan __________________________________________________________________________________ Staff is pleased to present the 2020 Northwest Seaport Alliance (NWSA) Budget. This document informs citizens and other interested parties about the NWSA’s overall goals and strategies, as well as the business environment in which we operate. It highlights our focus on strategic investments that will deliver competitive financial results, build for the future, and continue to create jobs and economic wealth for the Puget Sound region. The competition within the international container business among ports remains intense as capacity grows with larger ships and volumes are threatened by the ongoing trade war and softening of the Global marketplace. Shipping alliances and terminal operators continue to explore ways in which to improve their financial performance while investing in the infrastructure and or equipment required to handle the freight surge from larger ships. Over the last four years, the NWSA has made and continues to make the investments necessary to service the larger ships. We completed construction of a new wharf and the purchase of eight new cranes at Husky Terminal in the Tacoma Harbor and have started the redevelopment of the wharfs at Terminal 5 in Seattle. These two significant investments alone total over 500 million dollars and provide the NWSA with terminals in both harbors capable of handling the largest vessels in the transpacific trade. The NWSA creates significant economic activity and family wage jobs in the Puget Sound region and across the state. We provide manufacturers and agricultural producers throughout the nation valuable access to foreign markets. NWSA and our customers business activities generate more than 58,400 direct and indirect jobs and $12.4 billion of business output based on the most recent study released in 2019 for 2017 data. The NWSA is also an environmental leader in reducing cargo-related air emissions and stormwater pollution. The current NWSA’s Strategic Business Plan includes:
• Enhance NWSA, local and regional transportation infrastructure• Improve the efficiency and cost competitiveness of the supply chain• Advance the NWSA’s market position in the international and domestic shipping industry• Increase revenue through growth and diversification• Advance environmental stewardship
There is significant uncertainty in the global economy going into 2020. Additionally, our industry continues to experience rapid change and unforeseen circumstances that affect global trade. In 2020, the NWSA will initiate an update to our Gateway Master Plan to help us be ready to respond to market changes and to position us to continue to be a leading port in N. America. Despite the market uncertainty, our Team is focused on increasing the business activities and job growth within the region, while achieving that success in a financially and environmentally sustainable way.
John Wolfe Chief Executive Officer
Port of Seattle The NWSA
2020 Budget
Draft
Budget Document Overview
The Budget Document consists of these major sections: I. Overview: This section provides information aboutthe NWSA’s facilities and customers. It examines theeconomic context of the NWSA’s operatingenvironment, and it outlines the NWSA’sorganizational structure.
II. Budget Message: This includes an overview ofthe budget challenges and opportunities, revenuetypes and expenditures. The Budget Messageoutlines the priorities and issues for the budget yearand describes changes from the previous year.
III. Business Outlook: This section describes theNWSA’s overall goals and strategies. It includesassumptions, potential obstacles and trends that staffused to develop the forecast. These serve as thefoundation for the Operating Budget.
IV. Operating Budget: This section provides asummary of the assumptions that form the basis forthe NWSA’s operating budget. This section includesthe operating budget with revenue and expenses byline of business, and details of expected operatingcosts. This section also provides a five-year financialforecast for the alliance.
V. Five-Year Capital Investment Plan (CIP): TheCIP consists of all capitalized and expensed projectsthat the NWSA plans to complete in the next fiveyears. Capitalized projects affect the NWSA’s Profitand Loss statement through depreciation whileexpensed projects flow directly to the NWSA’s netincome in the year the expenses are incurred. Thissection provides details on the CIP including theimpact of the capital spending on profitability.
VI. Environmental Stewardship and Planning:This section provides a historical context for theenvironmental challenges facing the two ports andtheir surrounding communities. This section alsodiscusses the role of the NWSA Planning departmentand its work to integrate all aspects of the alliance.
Port of Seattle The NWSA
2020 Budget
Draft

I The Northwest Seaport Alliance Overview
Marine Cargo Operating Partnership
The Northwest Seaport Alliance (NWSA) is the first of its kind in North America.
The ports of Seattle and Tacoma joined forces in August 2015 to unify management of marine cargo facilities and business to strengthen the Puget Sound gateway and attract more marine cargo and jobs for the region.
Located in the Pacific Northwest in Washington state, the NWSA offers short U.S.-to-Asia transit times, and the infrastructure necessary to quickly move cargo to the U.S. Midwest.
International & Domestic Trade
The NWSA is the fourth-largest gateway for containerized cargo in North America, focused specifically on shipping between Asia and major distribution points in the Pacific Northwest, Midwest, Ohio Valley and the East Coast.
The NWSA is also a major center for bulk, breakbulk, project/heavy-lift cargoes, automobiles and trucks. The NWSA’s terminals are located near the second-largest concentration of distribution centers on the West Coast.
Top international trading partners include: • China/Hong Kong• Japan• Republic of Korea• Taiwan• Vietnam• Indonesia• Thailand• Malaysia• Australia
The value of this two-way international trade totaled more than $77.5 billion in 2018. Imports were $60.9 billion and exports were $16.6 billion of that total.
The Puget Sound is the major cargo gateway to Alaska. More than 80 percent of the total trade volume between Alaska and the lower 48 states moves through the Tacoma and Seattle harbors. Trade with Alaska was estimated at $5.4 billion in 2018. If it were ranked with the NWSA’s international trading partners, Alaska would be fourth. The NWSA also provides connections to Hawaii.
Port of Seattle & Port of Tacoma
The Port of Seattle was created September 5, 1911, in an effort by citizens to ensure public ownership of the Seattle harbor. The Port of Seattle was the first autonomous municipal corporation in the United States specifically tasked to develop harbor and port facilities to encourage commerce. The Port opened Fishermen’s Terminal in 1914, its first warehouse in 1915 and began working on the creation of Harbor Island.
The Port of Tacoma was created on November 5th, 1918 by the citizens of Pierce County to create job opportunities through trade, as well as in the economic development of Pierce County and the state of Washington.
The Port of Seattle and the Port of Tacoma’s geographic boundaries lie within King and Pierce counties, respectively. They are situated on Commencement and Elliott bays in Puget Sound. Because of this strategic location, they offer efficient connections to sea, rail, highway and air transportation networks.
The NWSA ranks among the world’s top 45 container gateways with some of the industry’s largest container shipping lines calling the Puget Sound. Nineteen international and four domestic shipping lines make regular service calls to the NWSA. The alliance also handles breakbulk, bulk, and auto shipping lines.
Shipping lines have been attracted to the Pacific Northwest because of its proximity to markets for trade, an experienced labor force, natural deep water, available land for expansion, excellent on-dock rail facilities and inland rail service. Rail service is
Port of Seattle The NWSA
2020 Budget
Draft

provided by the BNSF Railway and the Union Pacific Railroad. Currently, approximately 50% to 60% of the NWSA import cargo moves out via rail. Excellent highway access is provided via Interstate 5 and Interstate 90.
Through August 2019, the two ports handled about $50.8 billion of trade. Based on dollar volume, China (including Hong Kong) is the NWSA’s largest trading partner. Other leading trading partners include Japan, South Korea, Taiwan and Vietnam.
As the “Gateway to Alaska,” the NWSA handles about 3.4 million tons of domestic cargo shipped between the two states annually. Matson, TOTE Maritime Alaska, and Alaska Marine Lines are major shipping lines serving Alaska from the NWSA. Matson also provides service to Hawaii.
The NWSA is both a landlord and an operating organization. The NWSA’s maritime marketing efforts focus on attracting cargo and additional shipping lines to its facilities. The NWSA also works with charter shippers and others to move their cargoes through both NWSA and customer-operated facilities in Puget Sound.
The NWSA is a major auto import and processing center, handling vehicles for Kia, Mazda, and Mitsubishi.
Additionally, many of the two ports’ efforts are focused on industrial development and real estate. They each work to attract major manufacturing and warehouse/distribution centers to King and Pierce counties.
King and Pierce Counties
King and Pierce counties are the first and second most populous metropolitan areas in the state of Washington. The two counties represent a combined population of approximately 3.1 million or 41% of the population of the state of Washington.
Located about halfway between the Oregon and Canadian borders, King and Pierce counties cover 3,916 square miles.
Ports Economic Impact
In 2019, the ports of Tacoma and Seattle announced the results of a joint economic impact study for the
NWSA and the two seaports. The ports serve as a major economic engine for Pierce County, King County, and the state of Washington, creating thousands of family-wage jobs and serving as a catalyst for economic development.
According to the study, in 2017 the two ports’ marine cargo activities are related to 58,400 jobs in Washington state that contribute $12.4 billion in total business output. The two ports’ cargo-handling, and leasing activities generate more than $136 million annually in local and state taxes in Washington.
NWSA Facilities and Services
The ports have licensed to the NWSA facilities related to maritime commerce, including facilities for containerized cargo, automobiles, logs, breakbulk cargo, heavy-lift cargo and project cargoes, as well as intermodal rail terminal operations.
The NWSA’s four major waterways – two in Seattle and two in Tacoma – provide 33 ship berths on waterways that are about 51 feet deep. The NWSA facilities are located near I-5 and I-90, allowing access to the Puget Sound market and beyond.
BNSF Railway and the Union Pacific Railroad serve the NWSA’s nine on-dock and near-dock intermodal rail yards. The NWSA’s intermodal rail facilities help save shippers and shipping lines both time and money.
In Tacoma, Tacoma Rail, a division of Tacoma Public Utilities, provides switching and terminal rail service. Arrival and departure tracks help ensure efficient and reliable access to the mainline railroads.
See Figures 1-1 and 1-2 for an overview of The Northwest Seaport Alliance facilities located in Seattle (North Harbor) and Tacoma (South Harbor), respectively.
The Northwest Seaport Alliance governance The NWSA is a separate governmental entity established as a Port Development Authority (PDA), similar to Public Development Authorities formed by cities and counties. In 2015, the ports successfully sought and received an amendment to Washington law RCW 53 that allows the ports of Tacoma and
Port of Seattle The NWSA
2020 Budget
Draft
Seattle to form a PDA for management of maritime activities.
The NWSA is governed by the two ports as equal members, with each port acting through its elected commissioners. Each Port Commission is a Managing Member of the NWSA, with each Managing Member being represented by its Port Commission. Votes by the Managing Members require a simple majority from each commission.
Each port remains a separate legal entity, independently governed by its own elected commissioners. Each port has granted to the PDA a license for the PDA’s exclusive use, operation and management of certain facilities, including the collection of revenues. Ownership of the licensed facilities remains with the ports, not the PDA.
The ports remain responsible for their own debt and debt service; the PDA will not borrow funds.
The ports set up an initial 50/50 investment in the PDA; operating income is reported monthly and cash is distributed back to the ports at least quarterly. The PDA has its own annual operating budget and five-year capital investment plan.
The ports contribute to capital construction subject to Managing Members approval; capital funding does not come from working capital.
NWSA Managing Members
The Managing Members are the commissions for each of the two ports. The citizens of Pierce and King counties each elect a five-member Port Commission to govern the ports of Tacoma and Seattle. Each Commission seat is elected every four years, on a staggered basis.
The Managing Members are the final authority for approval of the NWSA’s annual budget, long-term leases, policies, long-range development plans, and all construction projects and spending in amounts exceeding the authority of the Chief Executive Officer.
The members of the commissions at the time of this publication are:
Port of Seattle • Stephanie Bowman• Ryan Calkins
• Fred Felleman• Courtney Gregoire• Peter Steinbrueck
Port of Tacoma • Don Johnson• Dick Marzano• John McCarthy• Don Meyer• Clare Petrich
NWSA Managing Members Meetings
Managing Member meetings are open to the public and are held at various locations in both King and Pierce counties.
For the location and agenda for upcoming Managing Member meeting, as well as minutes for previous Managing Member meetings, you can visit the website at www.nwseaportalliance.com.
The NWSA streams all Managing Member meetings live on the website and are archived for future viewing.
Citizens may contact the Managing Members by calling 800-657-9808. Correspondence may be mailed to:
The Northwest Seaport Alliance P.O. Box 2985 Tacoma, WA 98401-2985
Organizational Structure
The NWSA’s daily operations are led by the Chief Executive Officer and the NWSA Executive Team. See the Organizational Chart (Figure I-3 on page I-8).
Executive Team
The Executive Team is comprised of the CEO, two deputy CEO’s, seven chief officer positions, and executive administrative support. The Executive Team oversees all business activities and departments, and with the Managing Members, provides long-term strategic direction. The Executive Team ensures compliance with all regulations relevant to NWSA and port activities, including public meetings and information, environmental protection,
Port of Seattle The NWSA
2020 Budget
Draft
labor relations, procurement, security, financial management and other issues. The NWSA executive team provide day to day management of Port staff working on both Port and NWSA related items.
Commercial Group
Led by the Chief Commercial Officer and the Chief Strategy Officer, the Commercial Group is comprised of the Business Development team, the Marketing & Business Services Team, and two Real Estate teams, one for the NWSA, and one for the Port of Tacoma.
Business Development: International and domestic container, breakbulk, and bulk cargo are core business segments for the NWSA. The Business Development team is responsible for cargo and terminal business development and management, and customer service for all of these cargos. The Business Development team plays an important role coordinating efforts with the entire supply chain, including customers, terminal facilities, rail roads, and trucking companies. This team pursues and implements operational improvements to enhance overall efficiency at the NWSA’s terminals.
As one of the northernmost gateways on the U.S. West Coast, the Pacific Northwest has long been the primary hub for waterborne trade with Alaska, as well as a major gateway for trans-Pacific trade.
The gateway’s on-dock and near-dock intermodal rail yards, along with international and domestic rail services to the U.S. Midwest, are key assets and are an integral part of the NWSA business. Relationship management with Tacoma Rail, BNSF and Union Pacific (UP) and other rail stakeholders are key functions of this team.
While a significant portion of the Business Development team is focused on the container and associated intermodal business, the NWSA has a robust non-container business. Comprised of breakbulk (Roll On and Roll Off also known as RoRo), bulk and auto cargoes, these non-container businesses make a significant contribution to revenue and further diversify the gateway’s business portfolio. Additionally, the NWSA’s South Harbor is designated as a strategic military port for transport of military cargoes.
Auto customers include Kia, Mazda, and Mitsubishi. Auto Warehousing Company (AWC), a tenant, is the largest auto processor on the U.S. West Coast.
Exports of logs, petroleum products and molasses add to the diversified cargo mix.
The NWSA offers competitive rates and full service to all customers. To help facilitate and grow business, the NWSA has trade and business development representation in Alaska, New Jersey, Japan, Hong Kong, China and Korea.
Marketing and Business Services Team: This team supports the Business Development team and is responsible for research, data analysis, advertising and marketing activities. This team also manages and administrates the NWSA tariff. It also supports the goals of the Commercial Group by providing strategic market research and business intelligence, cargo volume tracking and forecasting.
NWSA Real Estate Team: Non-terminal industrial and commercial properties and facilities in the North and South harbor are included in the assets assigned to the NWSA. These properties are a significant source of revenue for the NWSA. Real estate personnel are responsible for leasing, divesting and managing the Port's real estate portfolio.
Located in an industrial zone with room for growth, tenants offer a broad range of services for the NWSA’s international and domestic customers including warehousing and distribution, manufacturing and marine services.
Operations Group
The Operations Group is responsible for the daily operations of NWSA facilities at both ports.
The Operations Group provides coordination with vessel arrivals and departures, and with the associated stevedores. The Operations group orders and manages labor at the North Intermodal Yard and other locations in Tacoma, and is also responsible for customer service. The major focus of this department is to ensure the proper processing of all vessels and freight shipments moving through the Puget Sound gateway.
The Operations Department, in conjunction with Tacoma Rail, is responsible for rail service delivery at
Port of Seattle The NWSA
2020 Budget
Draft
the South Harbor intermodal yards. This department also operates the North Intermodal Yard, and is the only port on the U.S. West Coast with dedicated rail services personnel. Both harbors offer competitive rail service via BNSF Railway and the UP Railroad, and are a major gateway for handling discretionary cargo destined for the Midwest.
Support Services
Support services such as maintenance, security, public affairs, facilities development and financial services are provided by service agreements between the alliance and the two ports. Costs for these services are charged by the ports to the alliance based on agreed upon methodologies including direct charge and purchased services.
Commitment to Fiscal Stewardship
The NWSA is intended to support the credit profiles of both ports, and its financial framework is intended to preserve both ports’ commitment to financial strength and fiscal stewardship.
Both ports have a solid track record of prudent financial management and strong financial results, including solid debt service coverage and ample liquidity balances.
The ports are committed to ensuring that existing bond pledges and covenants will not be negatively affected. Outstanding bonds will remain obligations of each individual port.
To maintain the rights of each port’s existing bondholders, the charter prohibits the NWSA from issuing debt.
Port of Seattle The NWSA
2020 Budget
Draft

Figure I-1….Northwest Seaport Alliance Facilities – North Harbor
Port of Seattle The NWSA
2020 Budget
Draft
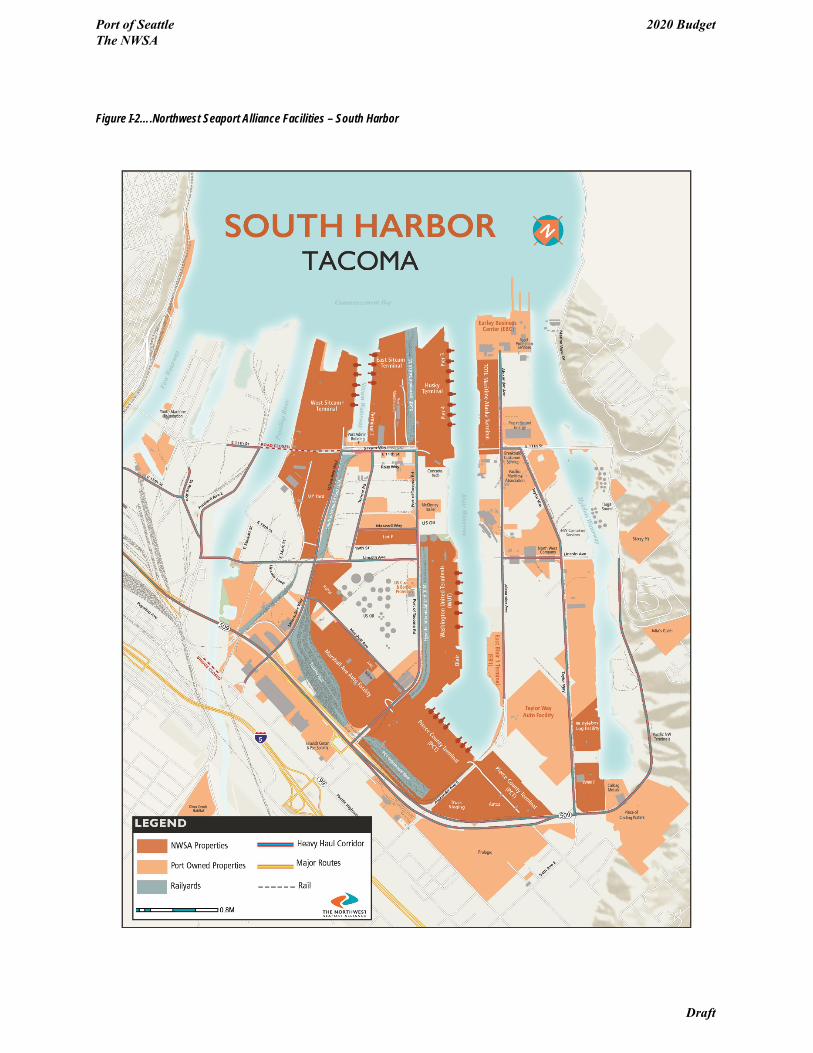
Figure I-2….Northwest Seaport Alliance Facilities – South Harbor
Port of Seattle The NWSA
2020 Budget
Draft

Figure I-3….The Northwest Seaport Alliance Organizational Chart
Port of Seattle The NWSA
2020 Budget
Draft
II 2020 The Northwest Seaport Alliance Budget Message
NWSA Goals
The NWSA has identified six commercial goals to maintain and grow the maritime business in the Puget Sound.
Port of Seattle The NWSA
2020 Budget
Draft

Budget Environment
The NWSA operates principally in two industries: terminal services and property rentals. Terminal services involve marine-oriented services including dockage, cargo-handling, storage and related activities. Property rentals include facilities and land used for container terminals, industrial activities, and storage.
As described in further detail in Section III, increased competition from Canadian ports as well as ports located on the U.S. West, Gulf and East coasts, have resulted in reduced cargo through the Puget Sound gateway. The expansion of the Panama Canal has made the all water route to the Gulf and East coasts more attractive for cargo owners. Due to decreased demand for terminal space, competition among ports for container business has increased.
The ports of Seattle and Tacoma responded to these conditions by reducing costs and focusing on the needs of our current customers. NWSA staff continue to review both harbor’s physical assets to rationalize the facilities and reduce costs where possible.
Revenues
GASB 87: The NWSA has adopted the new accounting standard for leases known as GASB 87 for 2020. Accordingly, a significant amount of revenue has moved from Lease income in Operating Revenue to Lease Interest Income which is included in non-operating revenue. Prior years have not been restated. Year over year comparisons are impacted by the adoption of GASB 87.
The NWSA has both fixed and variable revenue streams. The majority of NWSA’s revenue comes from fixed revenue streams, primarily from leased properties. The leased properties are mainly container terminals, buildings, and industrial and commercial land. The NWSA’s container terminal leases with shipping carriers can last 20 years or longer depending on carrier requirements. Building and land leases with more than one-year remaining are considered fixed. Minimum crane hours and minimum intermodal lift requirements specified in certain terminal leases are considered fixed.
The balance of NWSA revenue comes from variable services provided to customers. These services include intermodal lifts for rail car loading above minimums and per unit charges for automobile unloading and breakbulk cargo. Variable revenues also include equipment rental on an hourly basis for crane hours above minimums and straddle carriers used by terminal leaseholders and month to month building or land leases.
2020 Budget
The NWSA has developed an overall operating budget with projected revenue of $149.9 million. Operating income is budgeted to be $36.0 million, resulting in an operating margin of twenty-four percent (reduced from prior years due to GASB 87). The NWSA net distributable revenue of $83.0 million, which includes grant and interest income, and cash of $103.8 million will be distributed evenly between the two home ports. Each port’s portion of net income will be included as revenue in their financial reports.
NWSA financial performance reflects the investments it is making to successfully complete our customer commitments while meeting the NWSA financial goals. The operating and capital budgets are based on the cargo forecast in Section III.
Capital Investment Plan Highlights
NWSA projects for the next five years reflect a focus on strategic container terminal development in both harbors. With this focus the NWSA has reviewed potential assets for revenue generation to ensure that financial and economic growth goals are met.
Major 2020 – 2024 capital projects include the following:
North Harbor • T-5 wharf redevelopment, including a rail quiet
zone and electrical upgrades in the City ofSeattle’s substation.
• T-46 wharf repair and paving;• T5 and T-18 stormwater improvements;• T18 and T30 full dock rehabilitations
South Harbor • Husky tenant improvements including shore
power
Port of Seattle The NWSA
2020 Budget
Draft
• WUT fender system replacement• Development of facilities for Customs and Border
Patrol staff• Ongoing maintenance of our facilities.
Both Harbors • Clean air and stormwater investments;• Investments in numerous environmental
remediation and mitigation projects.
The NWSA’s 2020 Capital Investment Plan of $146 million represents the first year of the NWSA’s 2020-2024 CIP – a package totaling $441.2 million in new projects and investments. See Section V for additional details on the Capital Investment Plan.
Financial Measures
Financial measures for the NWSA have been developed to monitor financial performance. The two measures are (1) Net Distributable Revenue and (2) Return on Assets. These measures help ensure that the NWSA is providing the necessary financial performance required by each home port.
Legislative Impact
Transportation Funding
The NWSA relies on an efficient and well-maintained road and rail network to ensure the smooth movement of cargo to and from its facilities. The Washington Legislature made a significant commitment to infrastructure in 2015, passing a 16-year, $16 billion statewide transportation package. An estimated $3.3 billion of those funds will be invested in projects benefiting NWSA terminals.
In 2015 Congress passed the FAST Act, a surface transportation authorization bill that established a new freight funding program. In its Fiscal Year 2019 spending bill, Congress appropriated $292 million for a port-dedicated infrastructure funding program. Prior to these bills, few federal investment tools have been available to ports and other local government when it comes to freight infrastructure. The new program could assist the NWSA in making strategic investments in mission-critical freight infrastructure, such as marine terminals, roads and rail.
Shorepower Infrastructure Funding
During the 2019 legislative session, state lawmakers authorized a $4.4 million investment in shorepower infrastructure at the NWSA’s Terminal 5. This would allow vessels at berth to shut their engines off and plug into the local electrical grid for their energy needs.
Shore power infrastructure, however, is not essential to the operation of the terminal. It is expensive and often does not “pencil out” for the terminal operators without outside capital.
The NWSA projects shore power at T-5 would reduce carbon emissions by 1,666 tons per year and NOx emissions by 66 tons per year. The state would also see reduced diesel particulate matter emissions.
Additionally secured $1 million in federal Diesel Emissions Reduction Act grant funding for additional shorepower investments at Husky Container Terminal. To fully fund this project, the NWSA will seek additional state dollars in 2020 to match this federal investment.
Navigation Improvement Projects
The largest container vessels calling West Coast ports today have over two times the capacity of those that called just five years ago. To remain a competitive trade gateway, the NWSA is taking steps to upgrade our infrastructure to handle these ships. One such step involves the deepening of the navigation channels that serve its facilities. In 2018, the U.S. Army Corps of Engineers completed a Chief’s Report recommendation deepening in specific areas adjacent to the NWSA’s container terminals in the North Harbor. Congress subsequently authorized construction of the project in the 2018 Water Resources Development Act. While channels are mostly -51 feet or deeper, some shallower spots present navigational and safety challenges. The recommendation is to deepen the east and west waterway in the North Harbor to -57 feet MLLW. This will allow the NWSA to handle fully laden ships larger than 18,000 TEUs. Deepening channels to this depth will require a local financial match of federal dollars, which could come from several sources, including the potential for a contribution from the NWSA.
Port of Seattle The NWSA
2020 Budget
Draft

Additionally, the NWSA in 2018 signed a feasibility cost-sharing agreement with the Corp to initiate a feasibility study of navigation improvements to the Blair Waterway at the Port of Tacoma. The study will evaluate navigation improvement alternatives, including deepening. This is a first step to what could potentially result in a Chief’s Report comparable to the one referenced above in Seattle. The alliance is committed to contribute up to $1.5 million over the next three years for half of the costs of the feasibility study.
Harbor Maintenance Tax (HMT)
The HMT is assessed on ocean-going international imports that land at U.S. ports to pay for maintenance dredging of waterways through the HMT Trust Fund. It is not, however, assessed on importers who route cargo through non-US ports and afterwards move the cargo into U.S. markets by land. Moreover, the NWSA has received little, if any, benefit from the fund because its facilities are located on natural deep water harbors that do not require significant maintenance dredging. Since 1986 the ports of Seattle and Tacoma have sought reform of the HMT to provide a greater return to donor ports, such as the NWSA, and to ensure U.S. tax code does not disadvantage U.S. ports and maritime cargo.
The Water Resources Reform and Development Act (WRRDA) passed by Congress in 2014 included language that, for the first time in 30 years, partially reformed the federal Harbor Maintenance Tax to the betterment of Puget Sound ports. The bill authorizes up to $50 million to be distributed to a select group of donor ports and energy transfer ports. The funds can be used for berth maintenance, the navigation-related maintenance dredging and disposal of contaminated sediments, environmental remediation, or rebates to
importers. Congress appropriated $50 million in donor and energy port funding in FY19. Seattle and Tacoma do not plan to spend our ports’ share of the funding until the U.S. Army Corps of Engineers issues implementation guidelines for how to administer the customer rebate program authorized under Section 2106 of WRRDA 2014. The NWSA is actively working to encourage the Corps to issue these guidelines, in addition to securing additional appropriations for—and improvements to—this program.
Conclusion
The realities of the drastic changes in the global economy have led all ports to examine business and operational strategies.
The NWSA is focused on maximizing the use of existing facilities, working with existing customers to keep them competitive and successful, and making strategic infrastructure investments such as the construction of world class terminals in both harbors that position the gateway for long-term growth. Through coordinated investments in maritime assets, the NWSA will help ensure growth in the cargo flow through the Puget Sound.
The NWSA is placing increased emphasis on the importance of developing and strengthening relationships with labor partners, industry stakeholders, customers, and local, state and tribal governments in a collaborative effort to achieve the future vision of the NWSA. This vision must include the road and rail infrastructure that ties the whole system together.
Despite the challenging realities of today’s global economy, NWSA management is confident that the plans outlined in this budget will help the gateway remain financially strong, competitive and successful.
Port of Seattle The NWSA
2020 Budget
Draft

III Business Outlook
U.S. Economy
Real gross domestic product (GDP), defined as the value of the production of goods, was 2.1 percent in the second quarter of 2019 and 3.1 percent in the first quarter of 2019. The Department of Commerce Bureau of Economic Analysis (BEA) said the second-quarter real GDP had “positive contributions from personal consumption expenditures (PCE), federal government spending, and state and local government spending that were partly offset by negative contributions from private inventory investment, exports, nonresidential fixed investment and residential fixed investment.”
TTX expects a full-year GDP of 2 percent for 2019. Wages and salaries are expected to continue trending upward. Retail sales are forecast to grow 3.4 percent for the full year. TTX also predicts the likelihood of a recession in 2019 as low. Several factors that could raise the risk of recession include the trade war and rising fiscal deficits. Business inventory levels are expected to decline during the second half of the year.
The U.S. unemployment rate was at 3.7 percent in August 2019 with 130,000 jobs added for the month. Most job gains in August occurred in health care and financial activities. According to TTX, “As for many economic sectors, the trade war could turn things around in employment and income in the near term. Wage growth, which had been trending up over the last two years, has been down slightly over the past few months. Still, it is unlikely to fall significantly until whenever there is a next recession.”
According to the National Association of Realtors, existing home sales are up 0.6 percent from a year ago. Falling mortgage rates are improving housing affordability, but lower-priced homes are in short supply. According to Lawrence Yun, NAR’s chief economist, “Mortgage rates are important to consumers, but so is confidence about the nation’s overall economic outlook. Home buying is a serious long-term decision and current low or even lower future mortgage rates may not in themselves meaningfully boost sales unless accompanied by improved consumer confidence.”
The Conference Board reported August Consumer Confidence Index at 135.1, down from 135.8 in July. According to the Conference Board’s Senior Director of Economic Indicators Lynn Franco, “While other parts of the economy may show some weakening, consumers have remained confident and willing to spend. However, if the recent escalation in trade and tariff tensions persists, it could potentially dampen consumers’ optimism regarding the short-term economic outlook.”
Shipping Industry
The global container shipping industry continues to struggle with imbalance in the supply and demand of vessel capacity. The overcapacity problem dates to the last decade, when the high price of bunker fuel drove global carriers to build and operate the largest, most fuel-efficient vessels to drive down per unit container carrying costs. Competition for market share and the resulting downward pressure on freight rates has resulted in multi-billion-dollar losses for international container lines over time.
The orderbook for mega vessels (more than 13,000-TEU capacity) which predominantly serve the major East-West trade lanes is shrinking, but vessels continue to get larger. It is projected that this segment of the global fleet will eventually account for more than 10 percent of global TEU capacity.
The new generation of ultra-large container ships (ULCS) is also having a ripple effect across the U.S. port industry. As the mega-ships come into service in Asia-Europe, vessels they have replaced are slowly being redeployed, primarily to the trans-Pacific trade. These larger ships, with carrying capacity of between 10,000 and 14,000 TEUs, require deeper water, more berth space and additional cranes with a longer reach to work the breadth of the ship. The larger container volume on each ship also puts a strain on landside infrastructure as terminals need more yard space for the loading and unloading of containers, and additional backlands for container storage and operational support. Seaports across the U.S. are engaged in major dredging and infrastructure improvement projects to accommodate the larger vessels, but port congestion could be an issue until infrastructure catches up. The downturn in the
Port of Seattle The NWSA
2020 Budget
Draft

industry, coupled with the drive to scale operations forced carriers to re-evaluate their partnerships and fueled an intense period of M&A activity amongst carriers over the last few years. In 2016, there were 20 global carriers. As of 2019, there are 12 global carriers, and they control 84.7 percent of the fleet. Industry analysts suggest that there is still room for more consolidation going forward.
In 2019, the composition of carriers that make up the various shipping alliances shifted slightly. ZIM joined the 2M Alliance. It was also announced that Hyundai Merchant Marine (HMM) will join THE Alliance in 2020.
• 2M+Z – Maersk, MSC, ZIM
• Ocean Alliance – CMA CGM, APL, COSCO,Evergreen, OOCL
• THE Alliance – Hapag Lloyd, Yang Ming,Ocean Network Express (ONE)
Major Independent Carriers – Hamburg Sud, HMM, PIL, Wan Hai and SM Line.
Formation of these new alliances has concentrated capacity in fewer hands and allowed ocean carriers to exercise more control over available capacity on major trade lanes through coordinated changes to vessel sailings, schedules, and transit times, thereby influencing freight rates. Longer service strings with more port calls help carriers deploy excess capacity that would otherwise be running empty or delayed at great expense. Next year, THE Alliance expects fewer services with larger vessels in the PNW.
Carrier financials will again face pressure in 2020 when a new International Maritime Organization (IMO) mandate requiring ocean carriers to use fuels with a sulfur content no higher than 0.5 percent goes into effect on January 1. Ocean carriers can meet the new requirement by retrofitting vessels with special fuel scrubbers, a costly and time-consuming process or burning the new, more costly 0.5 percent low-sulfur fuel. The estimated cost to international shipping lines is estimated at $10-$15 billion.
The global container shipping industry will continue to face challenges; recent carrier financials are down, and global trade is slowing. Success or failure will in large part depend on carriers and their ability to
manage global capacity and resist the urge to seek market share through lower rates.
Northwest Seaport Alliance Activity
Containers:
Through August 2019, the NWSA has handled over 2.5 million TEUs (twenty-foot equivalent units), a 5.8 percent increase year-to-date. Volumes have been strong as importers have moved orders forward to stay ahead of tariffs. On the domestic side, the Alaska container market shows signs of recovery, although this could be derailed by in-state political tension and state budget constraints. The Hawaii market has improved, and larger vessels have been introduced to the service.
Container volume is projected to increase annually over the next several years due to larger vessels. Furthermore, 2019 volumes will be positively impacted by the PN4 service introduced in 2018. Factors that could impact NWSA international volumes include competition from ports in British Columbia, Canada, and other North American gateways or a possible decline in global trade and the global economy resulting from U.S. and international tariffs and trade policy.
Domestic container volume, which accounts for almost 20 percent of total NWSA volume, is also expected to increase annually over the next five years.
Breakbulk:
Breakbulk cargo is comprised of commodities that are either too large or heavy for containerized shipment. In the case of The Northwest Seaport Alliance, this consists largely of building materials, heavy machinery, boats, and agricultural and construction equipment. For 2019, breakbulk tonnage is estimated to reach approximately 280 metric tons. Volume is forecasted to reach 310K metric tons in 2020, resulting from new business and increased volume on current services.
Autos:
NWSA/POT auto units for 2020 are forecasted to reach 191K units, up 31% from the previous year. This is due to the new Port of Tacoma auto managed by the NWSA.
Port of Seattle The NWSA
2020 Budget
Draft
Logs:
On the NWSA’s bulk side of the business, log exports (metric tons) are forecasted to decline 34 percent in 2019 as demand from China, the primary customer, has dropped off significantly due to tariffs. The Log business has been suspended due to the tariffs and has not been included in the 2020 through 2024 forecast or budget.
Molasses & Petroleum:
Petroleum volumes in 2019 are projected to be 575K metric tons, essentially flat compared with the previous.
Molasses volumes are forecasted to be 49K metric tons in 2019. Molasses volumes are expected to grow 8 percent in 2019 and 2020.
Port of Seattle The NWSA
2020 Budget
Draft
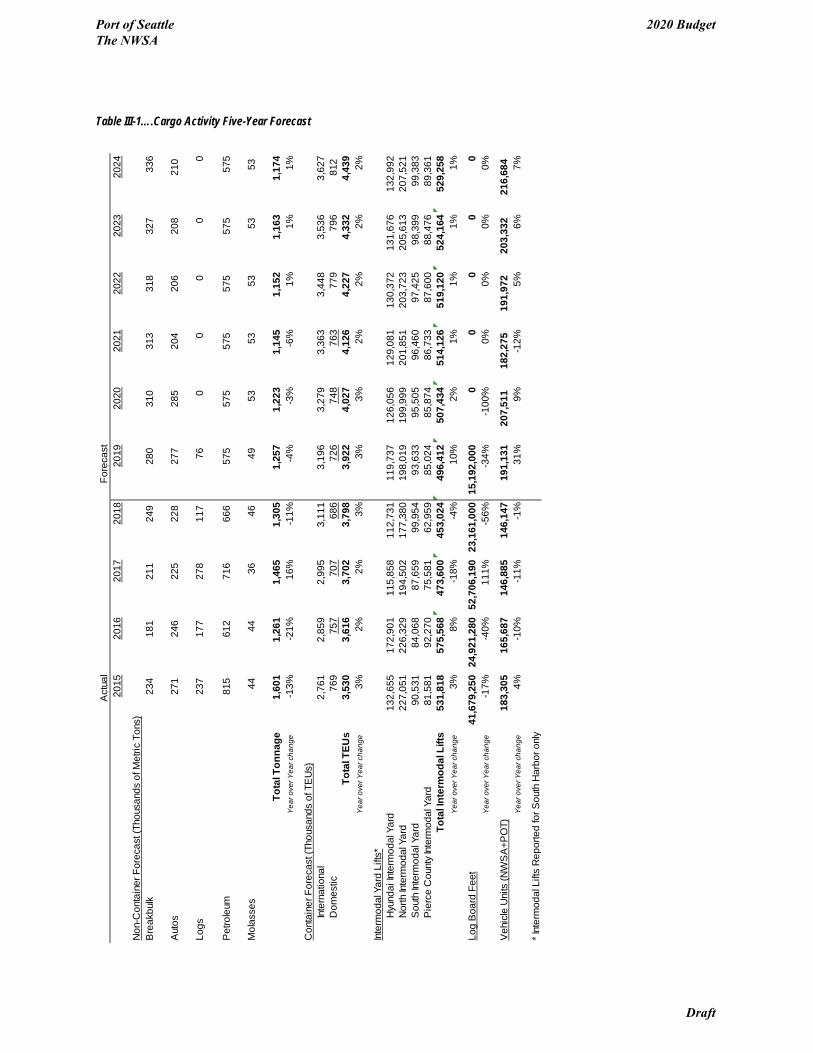
Table III-1….Cargo Activity Five-Year Forecast A
ctua
lFo
reca
st20
1520
1620
1720
1820
1920
2020
2120
2220
2320
24
Non
-Con
tain
er F
orec
ast (
Thou
sand
s of
Met
ric T
ons)
234
18
1
211
249
280
310
313
318
327
336
271
246
225
228
277
285
204
206
208
210
Logs
237
177
278
117
760
00
00
Pet
role
um
815
612
716
666
575
575
575
575
575
575
Mol
asse
s44
4436
4649
5353
5353
53
1,60
11,
261
1,46
51,
305
1,25
71,
223
1,14
51,
152
1,16
31,
174
-13%
-21%
16%
-11%
-4%
-3%
-6%
1%1%
1%
2,76
12,
859
2,99
53,
111
3,19
63,
279
3,36
33,
448
3,53
63,
627
769
757
707
686
726
748
763
779
796
812
3,53
03,
616
3,70
23,
798
3,92
24,
027
4,12
64,
227
4,33
24,
439
3%2%
2%3%
3%3%
2%2%
2%2%
Hyu
ndai
Inte
rmod
al Y
ard
132,
655
172,
901
115,
858
112,
731
119,
737
126,
056
129,
081
130,
372
131,
676
132,
992
227,
051
226,
329
194,
502
177,
380
198,
019
199,
999
201,
851
203,
723
205,
613
207,
521
90,5
3184
,068
87,6
5999
,954
93,6
3395
,505
96,4
6097
,425
98,3
9999
,383
81,5
8192
,270
75,5
8162
,959
85,0
2485
,874
86,7
3387
,600
88,4
7689
,361
531,
818
575,
568
473,
600
453,
024
496,
412
507,
434
514,
126
519,
120
524,
164
529,
258
Yea
r ove
r Yea
r cha
nge
3%8%
-18%
-4%
10%
2%1%
1%1%
1%
Log
Boa
rd F
eet
41,6
79,2
5024
,921
,280
52,7
06,1
9023
,161
,000
15,1
92,0
000
00
00
-17%
-40%
111%
-56%
-34%
-100
%0%
0%0%
0%
183,
305
165,
687
146,
885
146,
147
191,
131
207,
511
182,
275
191,
972
203,
332
216,
684
4%-1
0%-1
1%-1
%31
%9%
-12%
5%6%
7%
Pie
rce
Cou
nty
Inte
rmod
al Y
ard
Yea
r ove
r Yea
r cha
nge
Yea
r ove
r Yea
r cha
nge
Yea
r ove
r Yea
r cha
nge
Inte
rnat
iona
lC
onta
iner
For
ecas
t (Th
ousa
nds
of T
EU
s)
Dom
estic
Bre
akbu
lk
Tota
l Ton
nage
Aut
os
Veh
icle
Uni
ts (N
WS
A+P
OT)
* Int
erm
odal
Lift
s R
epor
ted
for S
outh
Har
bor o
nly
Tota
l TEU
s
Tota
l Int
erm
odal
Lift
s
Inte
rmod
al Y
ard
Lifts
*
Nor
th In
term
odal
Yar
dS
outh
Inte
rmod
al Y
ard
Yea
r ove
r Yea
r cha
nge
Port of Seattle The NWSA
2020 Budget
Draft
IV Operating Budget
Overview
The NWSA operating budget revenue is based on cargo volume forecasts (see Table III-1, page III-4), existing terminal and property leases and contractual and tariff-generated revenue. Operating budget expenses were projected based on historical information, as well as levels of expenditures required to support the increases in revenue.
From this information, NWSA staff prepared a realistic budget that supports both the strategic priorities and financial goals of the NWSA.
Departmental budgets estimate the expenses that will be generated in support of the NWSA and its businesses. Expenses fall into one of five categories: Administration, Operations, Security, Environmental or Maintenance. Administration expenses are incurred in the day-to-day management of the NWSA. Operations and Maintenance expenses support the day-to-day management of business activities. Security support is provided by each home port. Environmental expenses are a subset of overall environmental spending, and include clean air and clean water activities, and close coordination with each home port on compliance and monitoring activities.
Business budgets are projections of revenues earned and expenses incurred in the operation of a particular business line. In addition, the NWSA expects to receive funds from other sources including user fees, and investment earnings.
Although capital project spending is planned within the capital budget, capital projects will impact operating budgets for future years through new sources of revenues and increased operating expenses and depreciation costs.
Nature of Business
Washington law authorizes ports to provide and charge rents, tariffs and other fees for docks, wharves and similar harbor facilities, including associated storage and traffic-handling facilities for waterborne
commerce. Ports also may provide freight and passenger terminals and transfer and storage facilities for other modes of transportation, including air, rail and motor vehicles. Finally, ports may acquire and improve lands for sale or lease for industrial or commercial purposes and may create industrial development districts.
The NWSA is a joint venture that operates with the two ports as enterprise funds, allowing the NWSA and the ports to operate in much the same manner as a private business. Operating revenues are comprised of charges to its customers to cover costs associated with the service provided and to support investment in future projects.
Balanced Budget
Based on the Government Finance Officers Association (GFOA) Recommended Budget Practices, a balanced budget “is a basic budgetary constraint intended to ensure that a government does not spend beyond its means.”
The NWSA defines “balanced budget” in the following way: Total revenues are sufficient to cover operating expenses for the budget year and to offset the cost of capital investments (depreciation) and anticipated debt costs for any planned future capital investments.
Budget Process
The NWSA budget is a guideline used by management to direct strategic and tactical operations. Typically, more projects and spending are budgeted than may actually occur. This conservative approach ensures that the NWSA’s financial goals are still met if business conditions support the full budgeted spending.
The NWSA operates on a calendar year budget cycle that must integrate the budget schedule needs of both home ports. The operating budget and the capital budget are the NWSA’s plan for meeting the current needs of its customers, and for implementation of the strategic goals.
Port of Seattle The NWSA
2020 Budget
Draft
The annual budget development begins in August and continues through November. The process begins with the development of strategic objectives and initiatives, which are reviewed by the Managing Members and the Chief Executive Officer. The Managing Members and Chief Executive Officer communicate any strategy changes or policy concerns and gather additional input.
Cargo forecasts, available at the beginning of September, are used to develop the variable portion of the operating budget. During a study session, the Managing Members are presented with a draft budget.
In November, a public hearing is held by each home port to allow for public comment, and to adopt the statutory budget and approve the property tax levy for the budget year. The NWSA’s operating income is split evenly between the ports and is shown as revenue to the home ports. After the home port Commission approves and adopts its statutory budget, it is submitted, with the related home port resolutions, to the respective County Councils and Assessor Treasurer offices.
Major Assumptions
Major drivers of the 2020 operating budget are a result of economic and industry trends represented in the cargo forecast.
Revenue
• Existing leases continue per existing lease termsand contracts
• Cargo volumes drive equipment and intermodalrevenues and expenses
• Auto and breakbulk imports continue to providerevenue diversity
• Tariff rates are projected to increase between2.5% and 3.0%
• Property lease rental rates will increase asspecified in contracts
Direct Expenses
• The NWSA has direct headcount of 58 positions.Salaries are expected to increase by 3%.
• Major operating expenses include construction ofnon-NWSA owned infrastructure needed for the
development of T5, and ongoing maintenance of terminal paving, bulkheads and fender systems.
• Depreciation for licensed assets at the time of theformation of the NWSA will remain on the booksof the home ports. Depreciation of any newinvestments that are jointly funded will becharged against the NWSA.
Home port services provided
Each home port is providing services to the alliance, and some NWSA personnel are providing services back to the home ports. These services are provided either by direct charge or purchased services through Inter-local Agreements.
Table IV-4 shows the approximate value of Operating, environmental, and Administrative services purchased by the NWSA from each of the home ports and the services purchased by the Port of Tacoma from the NWSA. This table does not include the value of services provided for capitalized and expensed projects.
Estimating Revenues and Expenses
The NWSA uses several different methods of projecting revenues, depending upon the nature and materiality of the revenue item and the projection period. Specific revenue projection techniques include:
• Historical Data: Future revenues are based onhistorical trends with the assumption that they willcontinue in the future. When using historical dataas a means for projecting revenues, the NWSAanalyzes as many as 10 years of data toestimate a rate of growth
• Business Operations: Terminal lease/rentalagreements, grant agreements, and servicecontracts provide information for this projectionmethod. These projections may be adjusted toreflect the probable impacts of anticipatedchanges in the economy, legislation and inflation
• Judgment Estimates: This method relies on aperson knowledgeable in the field, often adepartment director, who prepares a revenueprojection based on awareness of past andpresent conditions including fee changes,development plans, marketing campaigns, usage
Port of Seattle The NWSA
2020 Budget
Draft
activity, frequency, volume, weight and similar determinations
• Current Data: This method predicts futurerevenue based on actual or annualized currentyear revenues and often is used when historicaldata and trends are not available, or if used,would result in an inaccurate revenue projection
• Volume: The NWSA uses the five-year cargoforecast to project budgeted revenues
Financial Practices
The NWSA manages its operations to maximize its financial capacity - to provide the necessary provide adequate home port debt service coverage ratios.
Financial Tools
• Cargo Forecasts: The NWSA maintains a cargoestimate for each of the next five years. (SeeTable III-1, page III-4)
• Five-Year Financial Forecast: A portion of theoperating budget is driven by volumes from thecargo forecast while the majority of the revenuecomes from major lease contracts. Plannedrevenue-generating capital projects are alignedwith new revenues and expenses in the five-yearoperating forecast. The operating budget ismonitored throughout the year, noting any
variances that may require corrective action. The Managing Members, Chief Executive Officer and Executive Team review these semi-annually
• Five-Year Capital Investment Plan: This planties directly to the strategy developed during thebudget process. Updated semi-annually, itidentifies all proposed projects. Some projectsare capitalized and impact future year forecaststhrough depreciation, while others are expensedin the current year
• Home Port Plan of Finance: The financialoutput of the NWSA will be shared evenlybetween the home ports and is an input into eachhome port’s five-year plan that identifies eachport's ability to fund their business objectives
• Financial Analysis of Investments: The NWSAreviews significant capital investments and theirrelated assumptions prior to acceptance into theplanned capital budget. Revenue-generatingprojects are expected to earn a return oninvestment that meets or exceeds the standards
• Financial Reporting: The NWSA creates avariety of reports available electronically or inhard copy
For additional information on accounting policies, see each home port’s budget and annual financial reports.
Port of Seattle The NWSA
2020 Budget
Draft
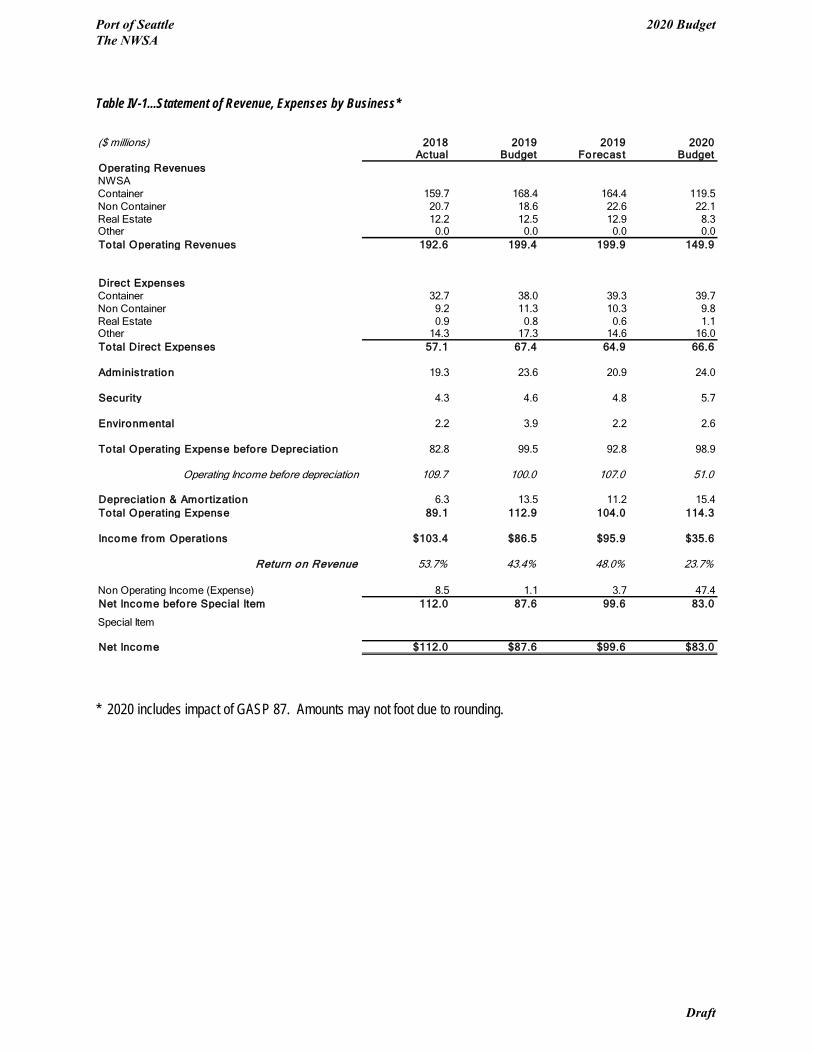
Table IV-1...Statement of Revenue, Expenses by Business*
* 2020 includes impact of GASP 87. Amounts may not foot due to rounding.
($ millions) 2018 2019 2019 2020Actual Budget Forecast Budget
Operating RevenuesNWSAContainer 159.7 168.4 164.4 119.5Non Container 20.7 18.6 22.6 22.1Real Estate 12.2 12.5 12.9 8.3Other 0.0 0.0 0.0 0.0Total Operating Revenues 192.6 199.4 199.9 149.9
Direct ExpensesContainer 32.7 38.0 39.3 39.7Non Container 9.2 11.3 10.3 9.8Real Estate 0.9 0.8 0.6 1.1Other 14.3 17.3 14.6 16.0Total Direct Expenses 57.1 67.4 64.9 66.6
Administration 19.3 23.6 20.9 24.0
Security 4.3 4.6 4.8 5.7
Environmental 2.2 3.9 2.2 2.6
Total Operating Expense before Depreciation 82.8 99.5 92.8 98.9
Operating Income before depreciation 109.7 100.0 107.0 51.0
Depreciation & Amortization 6.3 13.5 11.2 15.4Total Operating Expense 89.1 112.9 104.0 114.3
Income from Operations $103.4 $86.5 $95.9 $35.6
Return on Revenue 53.7% 43.4% 48.0% 23.7%
Non Operating Income (Expense) 8.5 1.1 3.7 47.4Net Income before Special Item 112.0 87.6 99.6 83.0
Special Item
Net Income $112.0 $87.6 $99.6 $83.0
Port of Seattle The NWSA
2020 Budget
Draft

Table IV-2....Operating Revenue and Expense Detail*
* 2020 includes impact of GASP 87. Amounts may not foot due to rounding.
Port of Seattle The NWSA
2020 Budget
Draft
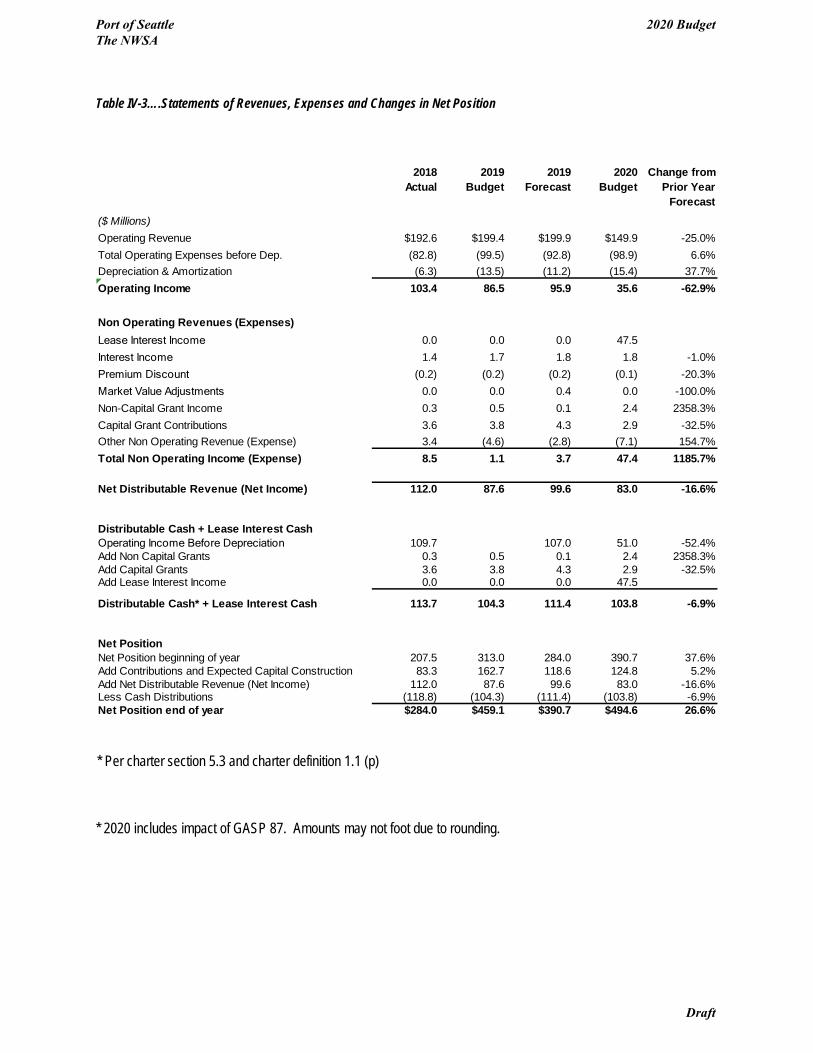
Table IV-3….Statements of Revenues, Expenses and Changes in Net Position
* Per charter section 5.3 and charter definition 1.1 (p)
* 2020 includes impact of GASP 87. Amounts may not foot due to rounding.
2018 2019 2019 2020 Change fromActual Budget Forecast Budget Prior Year
Forecast($ Millions)Operating Revenue $192.6 $199.4 $199.9 $149.9 -25.0%Total Operating Expenses before Dep. (82.8) (99.5) (92.8) (98.9) 6.6%Depreciation & Amortization (6.3) (13.5) (11.2) (15.4) 37.7%Operating Income 103.4 86.5 95.9 35.6 -62.9%
Non Operating Revenues (Expenses)Lease Interest Income 0.0 0.0 0.0 47.5Interest Income 1.4 1.7 1.8 1.8 -1.0%Premium Discount (0.2) (0.2) (0.2) (0.1) -20.3%Market Value Adjustments 0.0 0.0 0.4 0.0 -100.0%Non-Capital Grant Income 0.3 0.5 0.1 2.4 2358.3%Capital Grant Contributions 3.6 3.8 4.3 2.9 -32.5%Other Non Operating Revenue (Expense) 3.4 (4.6) (2.8) (7.1) 154.7%Total Non Operating Income (Expense) 8.5 1.1 3.7 47.4 1185.7%
Net Distributable Revenue (Net Income) 112.0 87.6 99.6 83.0 -16.6%
Distributable Cash + Lease Interest CashOperating Income Before Depreciation 109.7 107.0 51.0 -52.4%Add Non Capital Grants 0.3 0.5 0.1 2.4 2358.3%Add Capital Grants 3.6 3.8 4.3 2.9 -32.5%Add Lease Interest Income 0.0 0.0 0.0 47.5
Distributable Cash* + Lease Interest Cash 113.7 104.3 111.4 103.8 -6.9%
Net PositionNet Position beginning of year 207.5 313.0 284.0 390.7 37.6%Add Contributions and Expected Capital Construction 83.3 162.7 118.6 124.8 5.2%Add Net Distributable Revenue (Net Income) 112.0 87.6 99.6 83.0 -16.6%Less Cash Distributions (118.8) (104.3) (111.4) (103.8) -6.9%Net Position end of year $284.0 $459.1 $390.7 $494.6 26.6%
Port of Seattle The NWSA
2020 Budget
Draft

Table IV-4….Summary of Allocations and Direct Charges
Table IV-5…. Six-year Statement of Revenue, Expenses and Change in Assets*
*2020 to 2024 includes impact of GASP 87. Amounts may not foot due to rounding
The NWSA is required by the charter to provide at least $90 million in Bond Income every year to provide adequate cash to the homeports to pay bondholders of bond issues outstanding at the time of the NWSA formation. Table IV-6 provides a forecast of the Bond Income.
Table IV-6…. Six-year Bond Income*
2020 to 2024 includes impact of GASP 87. Amounts may not foot due to rounding
($ in millions) 2019 2020 2021 2022 2023 2024Operating Revenue $199.9 $149.9 $159.2 $168.0 $176.4 $192.7Total Operating Expenses before Dep. 92.8 98.9 109.2 97.3 99.8 101.9Depreciation & Amortization 11.2 15.4 21.1 22.8 22.3 27.8Operating Income 95.9 35.6 28.9 47.8 54.3 63.1Grant Income 4.4 5.3 1.6 0.5 0.0 0.0Lease Interest Income 0.0 47.5 45.4 43.1 40.7 38.2Other Non Operating Income -0.7 -5.4 -5.1 0.2 1.5 1.5Net Distributable Revenue 99.6 83.0 70.8 91.7 96.5 102.8
Distributable Cash + Lease Interest Cash $111.4 $103.8 $97.0 $114.2 $117.3 $129.1
($ Millions) 2019 2020 2021 2022 2023 2024
Operating Revenue $199.9 $149.9 $159.2 $168.0 $176.4 $192.7
Add Non Operating Revenue 6.5 54.4 48.7 45.3 42.4 39.8
Less Capital Grants (4.3) (2.9) (1.6) (0.5) 0.0 0.0
Less Operating Expenses before Depreciation (92.8) (98.9) (109.2) (97.3) (99.8) (101.9)
Bond Income $109.3 $102.5 $97.0 $115.4 $119.0 $130.7
Port of Seattle The NWSA
2020 Budget
Draft
Heavy equipment offloading at EB1 Breakbulk Terminal
Port of Seattle The NWSA
2020 Budget
Draft
V NWSA Capital Investment Plan
Overview
The Northwest Seaport Alliance invests in projects to increase the capacity, extend the life or improve the safety or efficiency of alliance-managed property and equipment.
The five-year Capital Investment Plan (CIP) identifies all projects planned or underway. The CIP provides a mechanism for tracking and managing project budgets and cash flows for five years into the future. Table V-1 shows planned spending on capitalized projects for the five-year time frame. Projects are associated with a program that fall under one of the businesses or under a category called “Infrastructure.”
Although funds for a project are included in the CIP, the project is not automatically authorized to proceed. The alliance Managing Members review and approve each project individually. Projects must have the necessary permitting before proceeding.
To achieve its goals, the alliance continues to invest in revenue-generating capital projects that support its businesses. Although the home ports are responsible for the general infrastructure in each respective county, the alliance may also invest in infrastructure projects that support the NWSA’s maritime business, as well as increasing rail and road transit of cargo within boundaries between the ports of Seattle and Tacoma. Often, these infrastructure projects are expensed versus capitalized due to accounting requirements.
In addition, environmental projects are planned for meeting or maintaining regulatory requirements, including the development of mitigation and remediation projects. Projects may be expensed or capitalized according to accounting rules.
Summary of Major Projects
The five-year Capital Investment Plan focuses on the following strategic and maintenance projects:
By the close of 2019, the NWSA will have completed or neared completion of the following capital projects:
• Placed in-service the second set of four super-post Panamax container cranes at HuskyTerminal
• Constructed stormwater treatment system atWest Sitcum Terminal
• Replaced roof at AWC• Removed cranes at T18 and T46• Implemented RFID at both harbors• Repaired T-46 wharf• Completed design for T5 and started construction
phase
Strategic investments: • Construction of major terminal improvements at
the North Harbor Terminal 5• Rehabilitation of T18, T30 and T-46 dock• Rehab bulkhead T-46 NW• Pave T46• T-18 stormwater utility upgrade• Husky shore power
Maintenance investments: • Replace fender system• Maintenance and rehabilitation of assigned
assets
The alliance has a strong commitment to the protection and improvement of the environment. Examples of this commitment include the Clean Truck Program, the Northwest Ports Clean Air Strategy, and significant investment in stormwater improvements.
Strategic development efforts focus on serving existing customers, attracting new customers and building a diverse, dynamic and resilient business base.
Port of Seattle The NWSA
2020 Budget
Draft
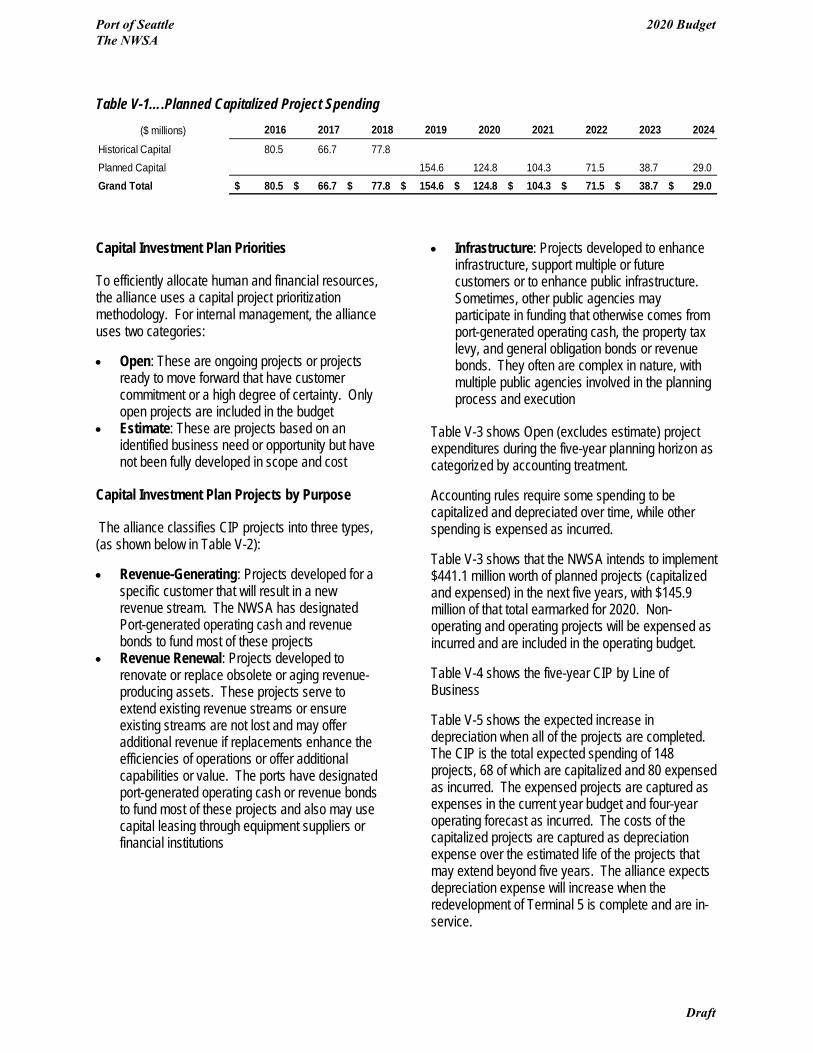
Table V-1….Planned Capitalized Project Spending
Capital Investment Plan Priorities
To efficiently allocate human and financial resources, the alliance uses a capital project prioritization methodology. For internal management, the alliance uses two categories:
• Open: These are ongoing projects or projectsready to move forward that have customercommitment or a high degree of certainty. Onlyopen projects are included in the budget
• Estimate: These are projects based on anidentified business need or opportunity but havenot been fully developed in scope and cost
Capital Investment Plan Projects by Purpose
The alliance classifies CIP projects into three types, (as shown below in Table V-2):
• Revenue-Generating: Projects developed for aspecific customer that will result in a newrevenue stream. The NWSA has designatedPort-generated operating cash and revenuebonds to fund most of these projects
• Revenue Renewal: Projects developed torenovate or replace obsolete or aging revenue-producing assets. These projects serve toextend existing revenue streams or ensureexisting streams are not lost and may offeradditional revenue if replacements enhance theefficiencies of operations or offer additionalcapabilities or value. The ports have designatedport-generated operating cash or revenue bondsto fund most of these projects and also may usecapital leasing through equipment suppliers orfinancial institutions
• Infrastructure: Projects developed to enhanceinfrastructure, support multiple or futurecustomers or to enhance public infrastructure.Sometimes, other public agencies mayparticipate in funding that otherwise comes fromport-generated operating cash, the property taxlevy, and general obligation bonds or revenuebonds. They often are complex in nature, withmultiple public agencies involved in the planningprocess and execution
Table V-3 shows Open (excludes estimate) project expenditures during the five-year planning horizon as categorized by accounting treatment.
Accounting rules require some spending to be capitalized and depreciated over time, while other spending is expensed as incurred.
Table V-3 shows that the NWSA intends to implement $441.1 million worth of planned projects (capitalized and expensed) in the next five years, with $145.9 million of that total earmarked for 2020. Non-operating and operating projects will be expensed as incurred and are included in the operating budget.
Table V-4 shows the five-year CIP by Line of Business
Table V-5 shows the expected increase in depreciation when all of the projects are completed. The CIP is the total expected spending of 148 projects, 68 of which are capitalized and 80 expensed as incurred. The expensed projects are captured as expenses in the current year budget and four-year operating forecast as incurred. The costs of the capitalized projects are captured as depreciation expense over the estimated life of the projects that may extend beyond five years. The alliance expects depreciation expense will increase when the redevelopment of Terminal 5 is complete and are in-service.
($ millions) 2016 2017 2018 2019 2020 2021 2022 2023 2024Historical Capital 80.5 66.7 77.8 Planned Capital 154.6 124.8 104.3 71.5 38.7 29.0 Grand Total 80.5$ 66.7$ 77.8$ 154.6$ 124.8$ 104.3$ 71.5$ 38.7$ 29.0$
Port of Seattle The NWSA
2020 Budget
Draft
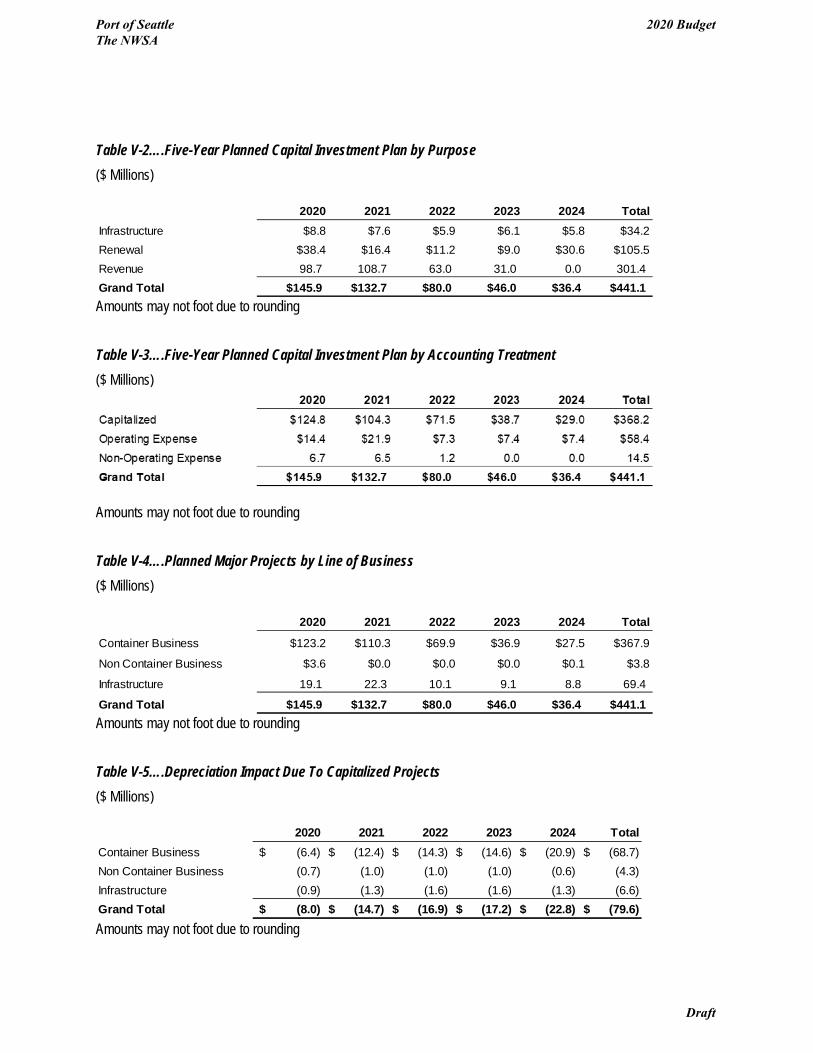
Table V-2….Five-Year Planned Capital Investment Plan by Purpose ($ Millions)
Amounts may not foot due to rounding
Table V-3….Five-Year Planned Capital Investment Plan by Accounting Treatment ($ Millions)
Amounts may not foot due to rounding
Table V-4….Planned Major Projects by Line of Business ($ Millions)
Amounts may not foot due to rounding
Table V-5….Depreciation Impact Due To Capitalized Projects ($ Millions)
Amounts may not foot due to rounding
2020 2021 2022 2023 2024 TotalInfrastructure $8.8 $7.6 $5.9 $6.1 $5.8 $34.2Renewal $38.4 $16.4 $11.2 $9.0 $30.6 $105.5Revenue 98.7 108.7 63.0 31.0 0.0 301.4Grand Total $145.9 $132.7 $80.0 $46.0 $36.4 $441.1
2020 2021 2022 2023 2024 Total
Container Business $123.2 $110.3 $69.9 $36.9 $27.5 $367.9
Non Container Business $3.6 $0.0 $0.0 $0.0 $0.1 $3.8
Infrastructure 19.1 22.3 10.1 9.1 8.8 69.4
Grand Total $145.9 $132.7 $80.0 $46.0 $36.4 $441.1
2020 2021 2022 2023 2024 TotalContainer Business (6.4)$ (12.4)$ (14.3)$ (14.6)$ (20.9)$ (68.7)$ Non Container Business (0.7) (1.0) (1.0) (1.0) (0.6) (4.3) Infrastructure (0.9) (1.3) (1.6) (1.6) (1.3) (6.6) Grand Total (8.0)$ (14.7)$ (16.9)$ (17.2)$ (22.8)$ (79.6)$
Port of Seattle The NWSA
2020 Budget
Draft
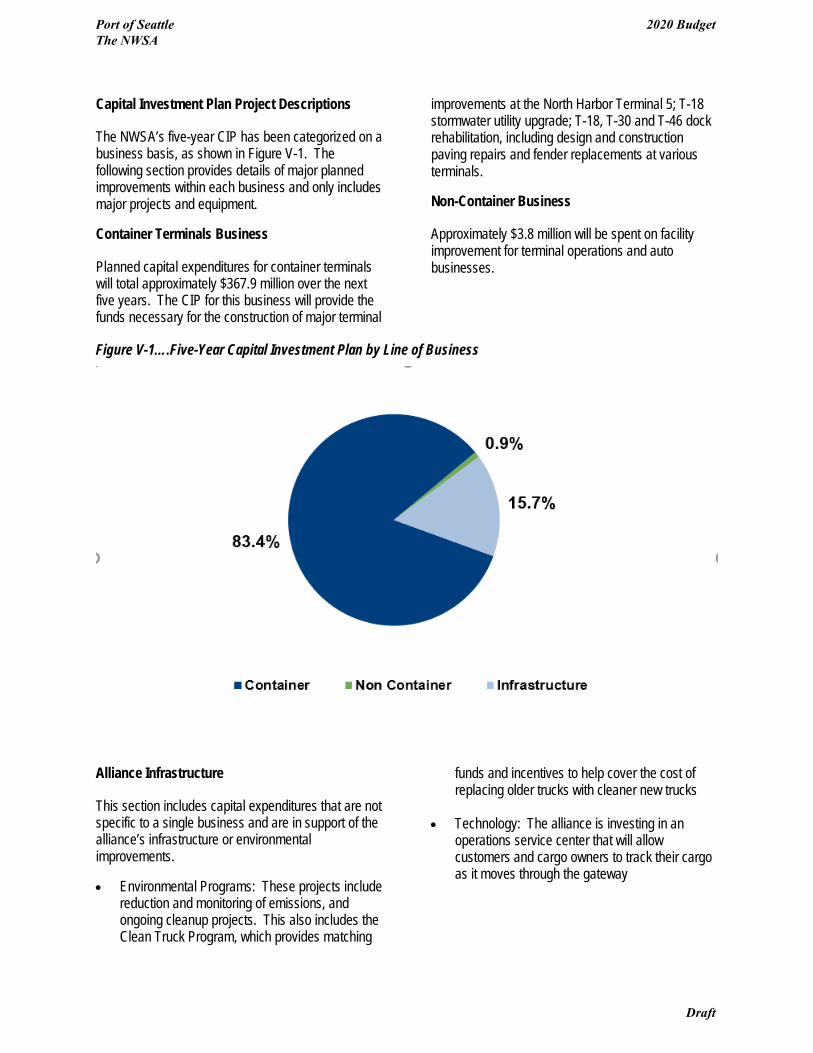
Capital Investment Plan Project Descriptions
The NWSA’s five-year CIP has been categorized on a business basis, as shown in Figure V-1. The following section provides details of major planned improvements within each business and only includes major projects and equipment.
Container Terminals Business
Planned capital expenditures for container terminals will total approximately $367.9 million over the next five years. The CIP for this business will provide the funds necessary for the construction of major terminal
improvements at the North Harbor Terminal 5; T-18 stormwater utility upgrade; T-18, T-30 and T-46 dock rehabilitation, including design and construction paving repairs and fender replacements at various terminals.
Non-Container Business
Approximately $3.8 million will be spent on facility improvement for terminal operations and auto businesses.
Figure V-1….Five-Year Capital Investment Plan by Line of Business
Alliance Infrastructure
This section includes capital expenditures that are not specific to a single business and are in support of the alliance’s infrastructure or environmental improvements.
• Environmental Programs: These projects includereduction and monitoring of emissions, andongoing cleanup projects. This also includes theClean Truck Program, which provides matching
funds and incentives to help cover the cost of replacing older trucks with cleaner new trucks
• Technology: The alliance is investing in anoperations service center that will allowcustomers and cargo owners to track their cargoas it moves through the gateway
Port of Seattle The NWSA
2020 Budget
Draft
Capital Investment Plan Revisions
The CIP is an integral part of the budget planning process and is reviewed and revised semi-annually. Adjustments in amount and timing are made as required to meet changes in customer or infrastructure requirements.
The alliance maintains sufficient cash reserves to meet the CIP requirements, as well as any unexpected capital requirements, without adversely affecting the ongoing operations of either ports.
Port of Seattle The NWSA
2020 Budget
Draft
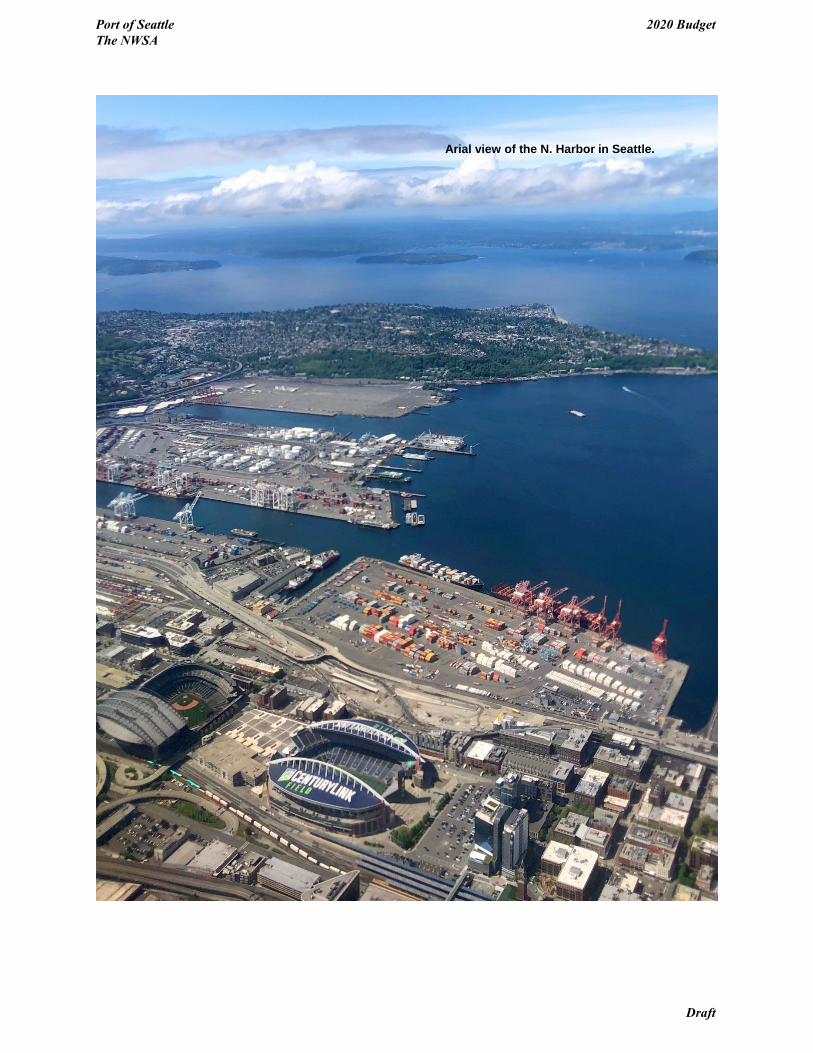
Arial view of the N. Harbor in Seattle.
Port of Seattle The NWSA
2020 Budget
Draft
VI Environmental Stewardship and NWSA Planning
Environmental stewardship is a high priority for the NWSA. The NWSA Environmental Stewardship Framework has been put into action. Specifically, working with our stakeholders, the NWSA developed a Best-In-Class approach built on a foundation of the following: • Fully integrated environmental, economic and
financial business decision planning/making;• Responsive to market and community; and,• Driver of innovative cost/effective and
sustainable solutions.
Program areas of emphasis include: • Water Quality (source control)• Air Quality and Sustainable Practices• Remediation• Habitat Restoration• Planning
o Transportationo Land Useo Facilities
In 2020, the NWSA plans to focus its environmental efforts on water and air quality and greenhouse gas reductions, with the bulk of that work on NWSA licensed properties. The NWSA plans to develop additional sustainability strategies to help shape future leasing strategies.
Water Quality Program
NWSA’s water quality team is comprised of professionals with experience in site inspection, monitoring, project development and delivery, and policy analysis. The goal of this program is to work with internal and external stakeholders to design highly effective, low cost solutions that meet or exceed Washington State’s high water quality standards.
Industrial Stormwater Management Program
The NWSA partnership is the framework for an industrial stormwater management program that is a collaborative effort engaging customers, agencies and environmental organizations in both the North and South harbors. The goal of the program is to discuss emerging stormwater issues, common problems and solutions and provide stormwater technical assistance to our customers at their request. Staff engage in extensive stakeholder outreach that includes customers, regulators, environmental organizations and the neighboring communities.
Research and Develop Cost-Effective Means to Manage Stormwater
The NWSA continues previous work initiated separately by the two ports. The NWSA implements innovative cost-effective treatment methods in the field in an effort to focus in on practical, effective stormwater Best Management Practices (BMPs). This includes conducting pilot studies of new and existing treatment infrastructure that are shared with tenants and customers.
Source Control
Controlling pollutants at or near the source is the most cost-effective way of reducing impacted stormwater runoff, managing the risk of costly corrective actions for treatment, and reducing the cost of operations and maintenance of installed stormwater treatment systems. NWSA WQ staff work with customers (as requested) to identify pollutants close to their source and eliminate the source where possible. Using a stepped approach like this, the WQ team assists customers with effective, cost-effective solutions.
North Harbor Focus
Most North Harbor tenants have installed or are installing stormwater treatment at their facilities. The challenge going forward is to reduce the cost of operating and maintaining these systems and, if possible, prevent or eliminate the need for stormwater treatment in selected areas. The Water Quality team continues to focus on maintaining relationships with tenants/customers and working with them to
Port of Seattle The NWSA
2020 Budget
Draft
implement at-source and near-source BMPs with these goals in mind.
South Harbor Focus
Many South Harbor tenants have reached consistent attainment or are currently meeting benchmarks for water quality parameters under the Industrial Stormwater General Permit. The Water Quality team continues to work with tenants/customers to implement at-source and near-source BMPs to facilitate cost-effective and successful solutions, and to focus on tenants/customers that may face site challenges to meet water quality criteria or regulatory policy issues.
Stormwater Development/Redevelopment
Coordination with each home ports’ stormwater permit programs ensures site-specific stormwater requirements are met. This includes the design of appropriate treatment systems and/or system selection based on proposed land use and typical discharges associated with site-specific activities. Projects include redevelopment of terminals in both harbors. Both home ports have developed Stormwater Management Guidance Manuals which give specific guidance for development and redevelopment projects to ensure compliance with MS4 requirements.
Projects
Tenant assistance projects in both harbors include installing downspout treatment boxes, infrastructure assessments to identify potential deficiencies, and source control site visits to assist tenants/customers.
North Harbor Projects
Design for the redevelopment of Terminal 5 is underway. As part of those efforts the NWSA is focused on cost-effective stormwater treatment solutions as the facility is updated in partnership with its customer, SSA Marine. The project goal is an effective, lowest cost treatment system that protects the water quality of the west waterway.
South Harbor Projects
At the East Sitcum Terminal, the NWSA is installing an end-of pipe retrofit of an existing treatment vault to support the Husky backlands reconfiguration and pipe
replacement project currently planned for 2020. The NWSA has successfully completed the treatment installation at the West Sitcum Terminal and anticipates turning over the operating permit to the customer in 2020.
2020 Goals
In 2020 the NWSA water quality team will assist SSA in completing the engineering design for stormwater at T-5. The team continues to assist other tenants as requested. The new 2020 ISGP will be released in December 2019 with an effective date of January 1, 2020. NWSA is evaluating its response to this permit and its impacts to NWSA and tenant operations. The Water Quality team also has two pilot projects planned for 2020.
Air Quality Program
Northwest Ports Clean Air Strategy
The Northwest Ports Clean Air Strategy (NWPCAS) was adopted in 2008 and updated in 2013 as a collaborative effort among Port of Vancouver (Canada), the Port of Seattle, and the Port of Tacoma to reduce air emissions from shipping and port-related activities. The NWPCAS includes goals to reduce emissions of diesel particulate matter and greenhouse gases, and establishes performance targets for various maritime sectors. The NWPCAS will be updated in 2020 to create goals for 2025 and beyond.
The NWPCAS identifies specific measures to achieve beyond compliance air quality and greenhouse gas objectives. NWSA staff will continue ongoing collaboration with NWPCAS partners to share information, conduct joint projects and publish annual progress reports to the community. The NWSA will seek opportunities to partner with customers and other stakeholders on grant-funded emission reduction projects and pilot studies.
Puget Sound Maritime Air Emissions Inventory
In 2005, 2011 and 2016 the partners in the Puget Sound Maritime Air Forum, consisting of the ports of Tacoma, Seattle, Anacortes, Everett and Olympia; along with Washington State Ferries, Puget Sound Clean Air Agency, Western States Petroleum Association, Pacific Merchant Shipping Association,
Port of Seattle The NWSA
2020 Budget
Draft
and others, collaborated on the development of a Puget Sound Maritime Air Emissions Inventory. The 2005 inventory formed the basis of the Northwest Ports Clean Air Strategy. The latest inventory was based on emissions in calendar year 2016 and was completed in early 2018. As the largest port authority in the Puget Sound Maritime Air Forum, the NWSA managed the 2016 inventory. The results of the 2016 inventory demonstrated that we met both our overarching diesel particulate reductions goals and our greenhouse gas reductions goals four years earlier than anticipated. A scenario tool was also deployed based on the data collected in the inventories. This tool helps Ports evaluate the effectiveness of proposed technology upgrades and new emission reduction programs. NWSA plans to initiate the next emissions inventory in 2021.
Clean Truck Program
The NWPCAS Clean Truck Program targets 100% of trucks serving the gateway to have a 2007 model year or equivalent engine.
In 2019, the NWSA and its terminal operators took the bold step of prohibiting truckers that call at our international marine terminal facilities from entering those terminals if they operated model year trucks of 2006 or older. Radio Frequency Identification Tags (RFID) readers have been installed at all international container terminals and are used to validate that trucks entering the terminals are model year 2007 or newer. In addition, the NWSA partnered with the Washington State Department of Ecology, the Puget Sound Clean Air Agency, the City of Seattle and received a Glean Diesel Grant to pool our resources and created a loan loss reserve fund to assist truckers with purchasing a compliant truck. The loan loss reserve program was discontinued as planned in spring 2019 after the clean truck deadline was successfully implemented.
In order to continue making progress towards phasing out pre 2007 trucks from domestic terminals and providing support for drivers serving the international terminals, NWSA has negotiated for continued use of Clean Diesel Grant funds from the Department of Ecology to provide incentives for drivers who wish to scrap their trucks and replace them with newer models. In close consultation with the trucking community, the NWSA will determine the future
direction of the Clean Truck Program through the 2020 Northwest Ports Clean Air Strategy Update.
Greenhouse Gas Reduction Resolution
In 2017, the NWSA Managing Members revised the greenhouse gas reduction goal outline in the NWPCAS and adopted greenhouse gas reduction targets in keeping with the Paris Agreement and in alignment with the global reductions necessary for keeping warming to within 2-degrees Celsius by 2050. The alliance will reduce greenhouse gas emissions within the Puget Sound airshed as follows:
By 2030: • 50% below 2005 levels (scope 1, 2 & 3
emissions)
By 2050: • Carbon Neutral (scope 1 & 2 emissions)• 80% below 2005 levels (scope 3 emissions)
To accomplish these goals, the alliance will advance initiatives specific to the operations it controls and work to influence other stakeholders whose emissions fall beyond the Port’s authority. The alliance is committed to partnering with tenants, cargo owners, shipping lines, manufacturers, warehousing and other key stakeholders to drive demand for cost-effective and innovative greenhouse gas reduction technologies and solutions to meet our collective goals.
Green Marine
Green Marine is a maritime environmental organization that offers a certification program for the North American marine industry. To receive certification, members benchmark their environmental performance each year and have bi-annual verification of results. The NWSA joined this organization in 2016 and began the self-assessment process. This work will continue in 2020, with results scored and published by Green Marine. NWSA staff participate in technical advisory groups to guide updates to the program.
Ship to Shore Power Expansion
Both the ports of Tacoma and Seattle have provided shorepower at some berths. The NWSA continues to pursue additional opportunities to leverage public and
Port of Seattle The NWSA
2020 Budget
Draft
private funding for additional shorepower installations, and ensure terminal designs include shorepower capability. Some of these opportunities include Diesel Emission Reduction Act (DERA), Federal Volkswagen Settlement (VW) funding, and TransAlta Centralia Coal Transition Grant funds, along with other emerging sources of state funding. As part of this effort the NWSA has developed a draft plan for shore power installations throughout the gateway. Pending Managing Member approval, NWSA plans to accept a DERA grant from the EPA that would contribute $1 million to the installation for shore power at Husky Terminal, with design planned in 2020 and construction in 2021. The expansion of shore power capabilities is consistent with the NWSA Strategic Plan and Northwest Ports Clean Air Strategy to reduce particulate emissions and greenhouse gases.
Energy Planning
Zero emission equipment and vehicles are quickly being developed and demonstrated and would provide opportunities to reduce emissions once fully commercially available. In addition, since electrical energy is cheaper than fuel, there is significant potential for the total cost of ownership for electric vehicles and equipment to be lower than diesel if the purchase price is appropriately reduced.
While zero emission equipment and vehicles could provide these advantages substantial infrastructure investments would be necessary to support them. In 2020 and 2021, the NWSA plans to develop an “Electrification Roadmap” for the South Harbor, quantifying the energy needs to power operations at the port, determining the infrastructure required to meet those energy needs, working with the utility to evaluate the grid’s capability to supply the required energy, and create a plan for making these infrastructure investments over time. The Port of Seattle is leading a similar effort in Seattle, which will cover NWSA’s North Harbor facilities.
Planning The Planning Team provides a range of services from strategic to site planning. Some of our primary services include planning for marine terminals and supporting infrastructure, port master planning, optimizing port operations and determining the operational and financial feasibility of new port and marine investments. Port Planning also coordinates
baseline studies to facilitate decision making about investments and operations.
Planning Overview: • Facility Planning: Port Planning has
experience with developing port industriallands, equipment costing, industrialwarehouse location and layout analysis.
• Operations, Planning, and Research:Planning supports Port Operations inoptimizing gates and terminals, analyzingtraffic flow and circulation, and evaluatingnew communications and data collectiontechnologies.
• Project Feasibility Development: ThePlanning Team supports FacilitiesDevelopment by maintaining a generalunderstanding of all focus areas within thegroup, especially the environmentalspecialties. With this overall perspective theteam is able to assist with opportunityassessment review and strategic portplanning.
• Economic and Financial Analysis:Services include: cost benefit studies,economic risk analysis, financial analysis,market studies, multi-modal and systemoptimization of transportation networks, anddefining development concepts andeconomic strategies.
• Strategic Planning: Services includedeveloping business plans, master plans,and strategic planning. The Planning Teamreviews and provides comment on new andupdated local, state, and federal policy andregulatory documents to protect the interestsof the Port. These plans can range fromState Freight Master Plans to CityComprehensive Plans.
• Grant Coordination: Planning helpscoordinate grant application efforts to ensure a unified and sensible approach. We look forgrants to help offset the cost of facility,technology, and planning work wheneverfeasible. Our coordination efforts encompass
Port of Seattle The NWSA
2020 Budget
Draft

tracking priority projects and possible grants, and keeping up to date on the progress of projects that benefit from grant dollars. We provide staff support to the Grant Steering Committee.
2020 Planning Goals
The major goals for 2020 include completion of the NWSA Gateway Master Plan, coordination of shoreline permit condition requirements for Terminal 5, coordination with Sound Transit on ST3 link extensions north and south and Sounder expansion, advocacy at Puget Sound Regional Council, and continued coordination with the NWSA Operations and Commercial teams, and coordination of grant applications
Port of Seattle The NWSA
2020 Budget
Draft
A Sea Lion in Commencement Bay
Port of Seattle The NWSA
2020 Budget
Draft
Appendix A Bond Income Calculation
The Northwest Seaport Alliance Charter requires the establishment of a Bond Income Calculation. Section 4.2 (b) states:
Bond Income Calculation. Managing Members shall establish and maintain a requirement for the PDA to calculate and establish a minimum level of net income from the PDA equal to the amount currently required for the Homeports to meet their current bond rate covenants (“Bond Income Calculation”). The Managing Members shall require the Bond Income Calculation to be reviewed annually as part of the PDA budget process and the Managing Members may adjust the Bond Income Calculation so long as it does not cause any Managing Member to fail to comply with its rate covenant. The PDA may not take any action that reasonably would reduce PDA income below the minimum level established by the Bond Income Calculation unless each Homeport separately votes to approve that action. Such a vote by each Homeport must occur even if the action is within the CEO’s authority under the Delegation of Authority Master Policy. If net income before depreciation of the PDA is not sufficient for either Homeport to be in compliance with a rate covenant (as currently described in each Homeport’s Master Bond Resolutions in effect as of the Effective Date), then:
(i) Upon that Homeport’s request, the PDA shall hire an independent third-party consultant to performanalysis and make recommendations for actions needed to achieve bond covenant compliance.
(ii) If the consultant recommends an action that the PDA is unwilling, unable or refuses to undertake, eitherManaging Member can require dissolution of the PDA following the dispute resolution process even if withinthe Initial Period.
(iii) The PDA shall have at least four months to respond, act and or dissolve following its receipt of theconsultant’s recommended action, unless a shorter time is required by the applicable bond covenants.
The Managing Members established the Bond Income Calculation as $90 million based on the currently outstanding debt of each Port, the applicable rate covenants and certain other net revenues available for debt service, as appropriate.
Port of Seattle The NWSA
2020 Budget
Draft
Appendix B Capital Construction
The Northwest Seaport Alliance Charter requires the funding of Capital Construction. Section 3.12 states:
Separate from Working Capital, the PDA shall provide for the funding of capital expenditures ("Capital Construction") to be funded by a pro rata initial contribution from each Managing Member based on their respective Membership Interests. Managing Members may approve by vote contributions to Capital Construction in amounts other than based on each Managing Members' pro rata respective Membership Interests on a project-specific basis. Requests for funding Capital Construction shall be based on the CEO's periodic projection of PDA capital project cash flow needs. Managing Members may consider requests for additional contributions to the PDA, the affirmative approval of which will require a vote by each Managing Member. Capital Construction shall be funded by each Managing Member separately and not from Working Capital. Distributions of Capital Construction funds will be made expressly subject to either (1) Managing Member approval of capital projects or (2) CEO approval of capital expenditure, where such expenditure is within the levels set in the Delegation of Authority Master Policy.
The Managing Members established the initial Capital Construction as $27 million based on the proposed 2016 NWSA Capital Improvement Plan. Additions to NWSA Capital Construction have been made as necessary to fund Managing Member approved projects.
Port of Seattle The NWSA
2020 Budget
Draft
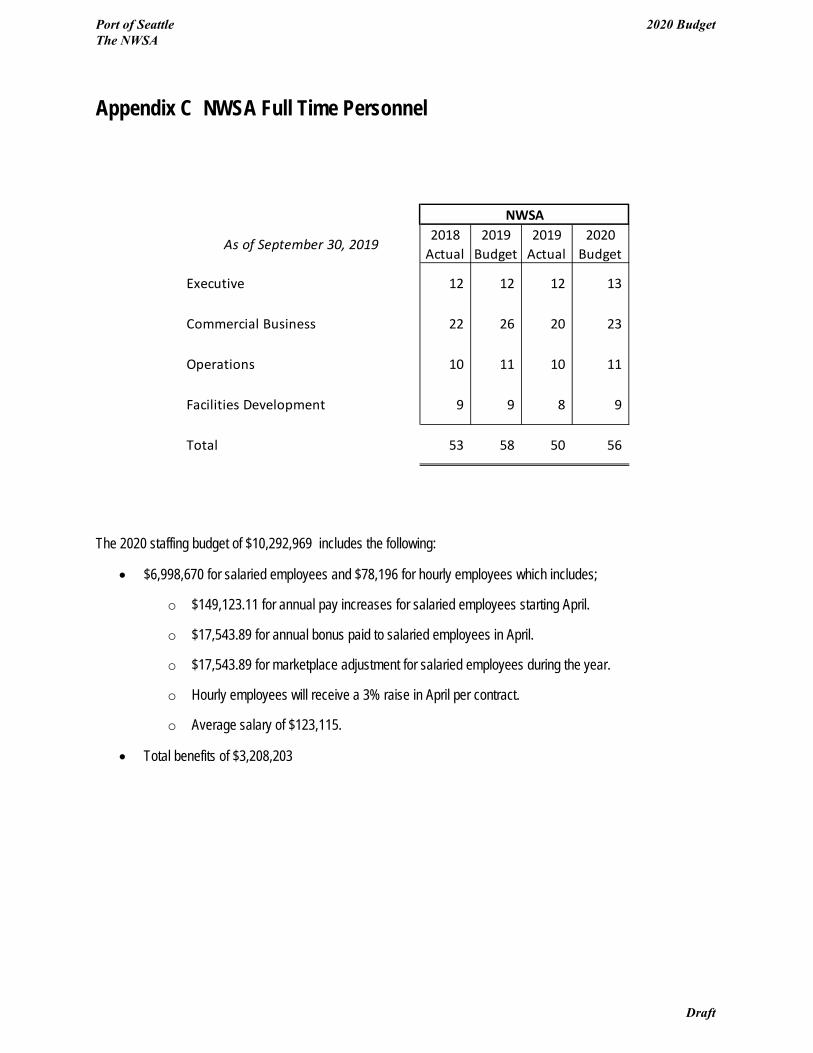
Appendix C NWSA Full Time Personnel
The 2020 staffing budget of $10,292,969 includes the following:
• $6,998,670 for salaried employees and $78,196 for hourly employees which includes;
o $149,123.11 for annual pay increases for salaried employees starting April.
o $17,543.89 for annual bonus paid to salaried employees in April.
o $17,543.89 for marketplace adjustment for salaried employees during the year.
o Hourly employees will receive a 3% raise in April per contract.
o Average salary of $123,115.
• Total benefits of $3,208,203
As of September 30, 20192018
Actual2019
Budget2019
Actual2020
Budget
Executive 12 12 12 13
Commercial Business 22 26 20 23
Operations 10 11 10 11
Facilities Development 9 9 8 9
Total 53 58 50 56
NWSA
Port of Seattle The NWSA
2020 Budget
Draft

Appendix D NWSA Memberships
Overview
The NWSA and alliance staff are members of several organizations. The NWSA believes that participating in these partnership organizations plays a key role in advancing the NWSA’s business objectives and ensures NWSA staff is knowledgeable and productive. These memberships are in addition to, or supplement the home port memberships.
Port Authority Organizations
These memberships assist the NWSA’s lobbying efforts on both the state and national levels and keep staff informed about major issues and developments that affect NWSA operations. Membership with the Washington State Public Ports Association remains with the home ports.
Economic Development Organizations
Economic development is a major part of the NWSA”s mission. For that reason, the NWSA maintains memberships and works closely with a variety of economic development groups. These memberships help strengthen the NWSA’s visibility throughout the world through trade missions and trade shows.
Regional Organizations
Memberships in regional organizations demonstrate the NWSA’s commitment to trade on a statewide and regional basis.
Industry Associations and Professional Organizations
These associations and organizations ensure that staff obtains the latest in technical development by taking advantage of meetings, networks and special programs offered by them.
Trade Promotion Organizations
These memberships give the marketing and sales staff important contacts and current industry trade information that enhances the NWSA’s overall marketing efforts.
Community Service Groups
The NWSA maintains memberships in these groups as part of its effort to build better community relations, to work more effectively with the business people and to ensure that the NWSA’s interests and concerns are addressed in the community.
Annual NWSA Memberships & Personnel Memberships (estimated)
Organization Annual Dues American Association of Port Authorities $55,000
Pacific Northwest Waterways Association 30,000
Washington Council on International Trade 20,000
Green Marine 11,000 All Other Memberships 61,796 Total NWSA Memberships $177,796
American Association of Port Authorities
AAPA is an alliance of leading ports in the Western Hemisphere that protects and advances the common interests of its diverse members through advocacy, professional development, relationship-building, and public awareness.
Pacific Northwest Waterways Association
The Association advocates for funding for navigation projects around the region, including those on the Columbia Snake River System, in the Puget Sound and along the Oregon and Washington coasts.
Washington Council on International Trade
The Council is dedicated to advocating for public policies that increase Washington State’s international competitiveness.
Green Marine
Green Marine is an environmental certification program for the North American marine industry.
Port of Seattle The NWSA
2020 Budget
Draft
The Northwest Seaport Alliance Mailing Address
P.O. Box 2985 Tacoma, WA 98401-2985
Phone: 800-657-9808
Website: www.nwseaportalliance.com
Port of Seattle The NWSA
2020 Budget
Draft

Port of Seattle The NWSA
2020 Budget
Draft
This page intentionally left blank.

XIII. A
PP
EN
DIC
ES
XIII. APPENDICES

Port of Seattle 2020 Budget Appendices
Filename: Section XIII Appendices Final Updated: 12/28/2009 XIII-1
APPENDIX A: BUDGET POLICY, PROCESS AND CALENDAR
1. OPERATING BUDGET a. Budget Policy:
The Port established a budget policy to provide systematic planning as part of the management performance and control. The purpose of this policy is to allow the capability to forecast realizable financial results over definite periods of time. This is accomplished through planning and coordination of the various complex operations and functions of the Port, through systematic communication and the use of the Port’s financial control and management information system. The Operating Budget is an essential tool for business planning, resource allocation, and control. It quantifies business groups and departmental plans for future periods in strategic, operational and monetary terms. This facilitates coordination of plans between divisions/departments and provides a basis for control once the plan is in effect. Various inputs to the budget planning process are required for it to be meaningful, including forecast of economic trends and business activity levels. Above all, goals, objectives, programs, action plans and performance measures are defined and reviewed annually for consistency and support of the Port’s overall mission. The budget plan is based on assumptions about the success of marketing efforts, demand for services, and the cost, availability and need for people and materials. The budget process provides continual feedback which compares not only actual performance to the plan but also the validity of the assumptions on which the plan was based. The Operating Budget is a management tool for controlling and analyzing each area of responsibility. Budgeting, as well as the recording of actual costs, is done on an Org basis. An Org is a distinct functional and physical unit. Its performance responsibility can be assigned to one person. There are over 200 Orgs at the Port and each Org has a budget. Allocated and/or indirect expenses are not budgeted for by the recipient Org. These are costs that are allocated to the business groups/units from service providers. Allocated costs are general support costs that cannot be directly attributed to a business unit, but instead support the entire Port. Costs can come from within the division (intra-division allocation) or from outside the division (inter-department allocation). Department Directors are responsible for preparing the operating budget for their areas of responsibility, subject to review and approval by several levels within the organization. Orgs can be combined to analyze and report on budgets by functional or business units. Port management needs current, timely, and accurate information to make informed decisions. The objective of the budget process is to provide resource allocation, accountabilities, performance, and control to enhance effective management. In addition to planning for the business needs of the organization, this process results in a method of comparing actual financial results with the approved budget plan. The appropriateness of the pricing structure or the effects of changes in costs or activity can be observed. This approach gives management the flexibility to evaluate the performance of a particular activity. The Budget Report (a comparison of the proposed budget to the current year’s budget and last year’s actual) and the Responsibility Report (a comparison of actual results to budget) can advise a manager if things are not going as expected, whether strategies are being accomplished, and also give them clues as to what might be wrong. The function of controlling and managing the operations of the Port is accomplished with the Operating Budget.
Port of Seattle 2020 Budget Appendices
Filename: Section XIII Appendices Final Updated: 12/28/2009 XIII-2
The 2020 budget process includes several Commission briefings by the operating divisions and Central Services departments during the year to update the Commission on key issues facing the business groups and to solicit input into overall strategies and objectives. The divisions update the Commission on each business unit with background information, discuss capital and operating plans, and dialogue on major policy issues. Divisions fine-tune their business and operating goals based on Commission input and put together their budgets. Key budget events include the following: • Conduct budget planning meetings with the Executive Management team. • Publish the budget guidelines/instructions and budget calendar. • Provide budget system training to budget staff. • Division and department budget staff prepare their respective budgets. • Conduct internal budget reviews which include in-depth discussion of revenue and expense assumptions;
new programs, initiatives, or other proposed increases in revenue and expenses. • Review and approval of budget by the Executive Management and Commissioners. • Release of the budget to the Port Commission and public stakeholders. The budget staff responds to inquiries of commission and interested stakeholders during commission budget workshops, first and second reading, and adoption of the budget after the public hearings. In addition to the Operating Budget as stated above, the budget staff prepares the Statutory Budget as defined in RCW 53.35.010 to show “estimated expenditures and the anticipated available funds from which all expenditures are paid.” Being a cash budget, the Statutory Budget establishes the level of the Port’s property tax levy and sets upper limits of expenditures and is not used as an Operating Budget.
b. Budget Adoption:
The budget is provided to the Port Commission and must be made available to the general public as required by law - RCW 53.35.010 and RCW 53.35.045. A Public Hearing for the Introduction of the Preliminary Budget is held before the final passage of the Budget, at which time the Port Commission will make final recommendations and Adopt the budget. An announcement of the public hearing is made in the DAILY JOURNAL OF COMMERCE newspaper and copies of the preliminary budget are made available for distribution to any interested persons by a specified date as required by laws - RCW 53.35.020 and RCW 53.35.045. Subsequent to the public hearing and Commission adoption of a final plan, the Statutory Budget and resolution is then filed with the King County Council and King County Assessor as required by law, by a specified date as allowed by RCW 53.35.045.
c. Monitoring of Budget:
Once an annual budget is in place, the Responsibility Report (comparing actual results to budget) is generated monthly and variances from the budget are analyzed and reported on a monthly basis, and more extensively each quarter, to determine if corrective action is needed. Divisions and departments prepare a quarterly year-end forecast, which is incorporated into the quarterly Performance/Variance Report. The Performance/Variance Report is a report in narrative format explaining the reason or causes of variances between actual revenues and expenses versus budgeted amounts on a quarterly basis. A good and accurate monthly and quarterly performance/variance report is a very important tool for management. This report provides explanation of variances from the approved plan and is presented quarterly to Executive Management and the Commission in public meetings. This allows Executive Management and the Commission to make timely and well-informed decisions.
Port of Seattle 2020 Budget Appendices
Filename: Section XIII Appendices Final Updated: 12/28/2009 XIII-3
d. Amending the Operating and Capital Budgets:
The Executive Director of the Port of Seattle is authorized “Within Budget Limits” to transfer budgeted amounts between departments; however, any revisions that alter the total expenses Portwide that are not within the Executive Director Authorized Budget Limits require authorization from the Port Commission. As per Resolution 3605, as amended, the Port Commission has adopted policy directives delegating administrative authority to the Executive Director for the purpose of day-to-day management and administration of the Port and as stated in sections 20.2.1 and 20.2.2 of said resolution: 20.2.1. "Annually Approved Capital Budget" means the list of capital projects (including small works projects) and the projected total dollar amount of upcoming budget-year spending associated with those projects which is presented to, and reviewed by, the Commission as part of the budget review process (i.e., the first year of the Capital Improvement Plan), or as subsequently amended by the Commission during the budget year. 20.2.2. "Annual Operating Budget" means the budgeted operating and non-operating revenues and expenses reviewed and approved by the Commission as part of the budget process, or as subsequently amended by the Commission during the budget year. e. Operating Budget Process:
The steps in the 2020 operating budget process are as follows:
• Budget planning meetings with the Executive Team to discuss key strategic initiatives and budget process for 2020.
• Commission strategic and business planning briefing. • Budget system training for budget users from the various divisions. • Commission briefing on budget process and providing key budget assumptions to the Commission. • Issuance of budget guidelines/instructions and budget calendar on the Port’s intranet. • For the operating divisions, targets are developed based on the divisions’ business forecast. • For Central Services, initial targets are based on a bottom-up assessment of needed resources to
accomplish Portwide strategy/actions plans. • Several Commission briefings by the operating divisions and Central Services are held during the year to
update the Commission on key issues facing the business groups/departments and to solicit input for any changes in strategy.
• Budget system is prepared and made available for input. • Actual preparation of the budget by divisions/departments. • Costs of service departments are charged/allocated to the operating divisions and the NWSA according
to the policy and the Service Agreements. • Finance and Budget generates a budget comparison report that compares the proposed budget to the
current year’s budget and last year’s actual. Finance and Budget also produces the current year’s Forecast Report.
• Divisions/departments complete their detailed budgets and are reviewed internally by their senior managers and Finance and Budget staff. These reviews include in-depth discussion of revenue and expense assumptions, new programs, initiatives, or other proposed increases in revenue, expenses as well as operational needs.
• Divisions/departments budgets are submitted to Finance and Budget and then reviewed against targets by the Executive Team.
• Executive Team makes recommendations and changes, which are incorporated into divisions and departments budgets.
• Several Commission budget briefings are held on divisions/departments capital budget, operating budget, and Draft Plan of Finance.
• All budget issues are resolved, and changes are entered into the budget system.

Port of Seattle 2020 Budget Appendices
Filename: Section XIII Appendices Final Updated: 12/28/2009 XIII-4
• Finance and Budget staff generates various reports, ascertains that all approved changes are incorporated into the budget and reports are accurate.
• Finance and Budget prepares the preliminary budget document and releases the proposed budget to the Port Commission and to the public approximately three weeks before the Introduction and Public Hearing of the 2020 Budget.
• The Introduction and Public Hearing of the budget are held on the second Tuesday of November. • The Adoption of the budget are held on the third Tuesday of November. • Statutory Budget is filed with King County Council and the King County Assessor as required by law on
the first Monday in December. • Finance and Budget staff prepares and releases the final budget document to reflect Commission
recommendations. • Finance and Budget staff sets commitment control for Central Services departments and operating
divisions.
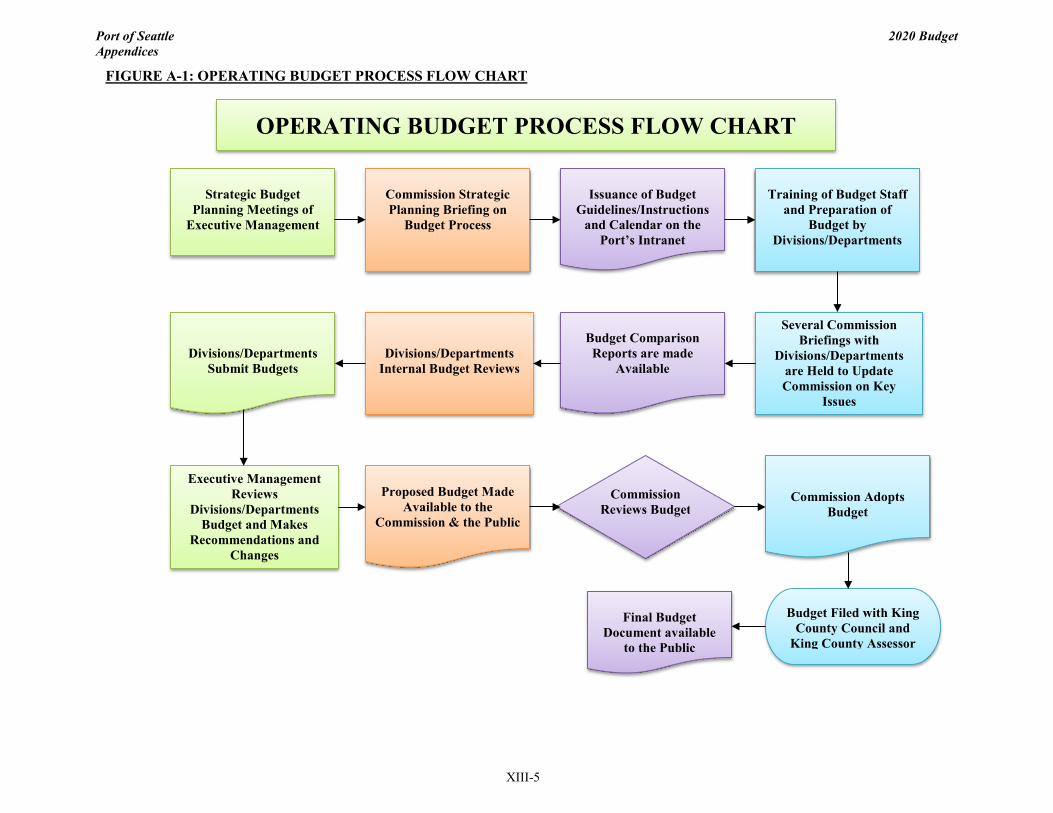
Port of Seattle 2020 Budget Appendices
Filename: Section XIII Appendices Final Updated: 9/21/2010 XIII-5
Strategic Budget
Planning Meetings of Executive Management
Issuance of Budget
Guidelines/Instructions and Calendar on the
Port’s Intranet
Training of Budget Staff
and Preparation of Budget by
Divisions/Departments
Several Commission Briefings with
Divisions/Departments are Held to Update Commission on Key
Issues
Budget Comparison Reports are made
Available
Commission Strategic Planning Briefing on
Budget Process
Divisions/Departments Internal Budget Reviews
Divisions/Departments Submit Budgets
Executive Management Reviews
Divisions/Departments Budget and Makes
Recommendations and Changes
Commission Reviews Budget
Proposed Budget Made
Available to the Commission & the Public
Commission Adopts Budget
Budget Filed with King County Council and
King County Assessor
Final Budget
Document available to the Public
OPERATING BUDGET PROCESS FLOW CHART
FIGURE A-1: OPERATING BUDGET PROCESS FLOW CHART
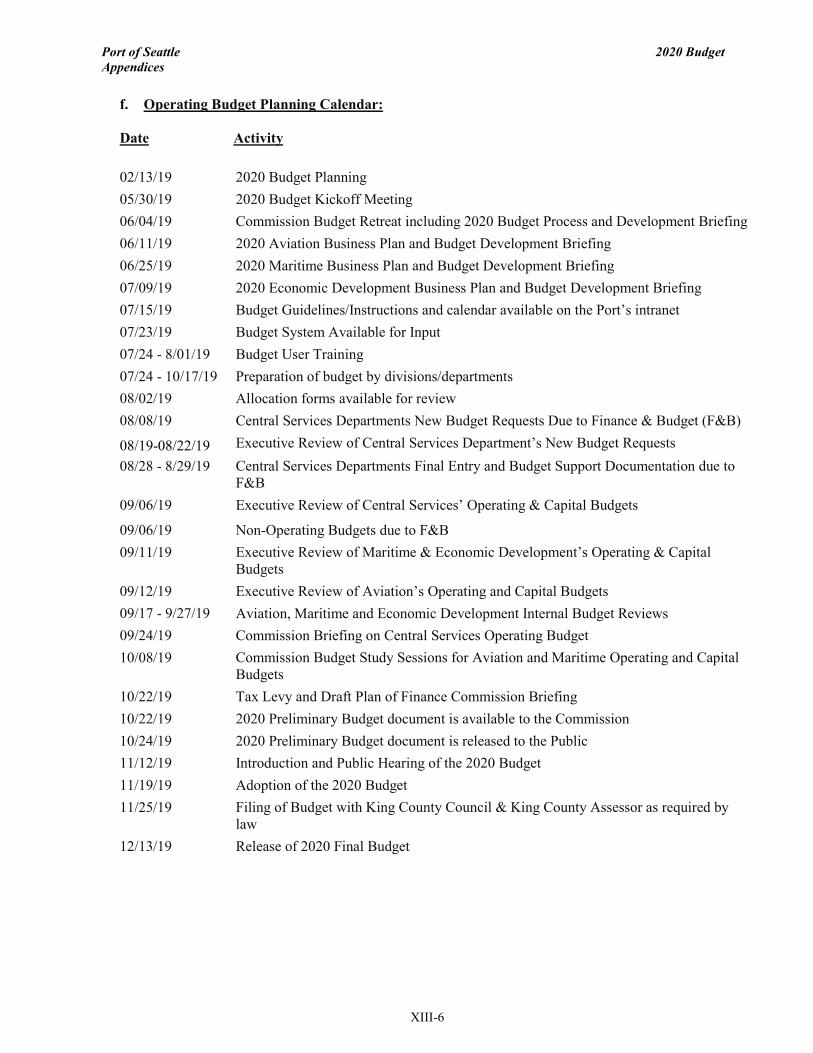
Port of Seattle 2020 Budget Appendices
Filename: Section XIII Appendices Final Updated: 9/21/2010 XIII-6
f. Operating Budget Planning Calendar: Date Activity 02/13/19 2020 Budget Planning 05/30/19 2020 Budget Kickoff Meeting 06/04/19 Commission Budget Retreat including 2020 Budget Process and Development Briefing 06/11/19 2020 Aviation Business Plan and Budget Development Briefing 06/25/19 2020 Maritime Business Plan and Budget Development Briefing 07/09/19 2020 Economic Development Business Plan and Budget Development Briefing 07/15/19 Budget Guidelines/Instructions and calendar available on the Port’s intranet 07/23/19 Budget System Available for Input 07/24 - 8/01/19 Budget User Training 07/24 - 10/17/19 Preparation of budget by divisions/departments 08/02/19 Allocation forms available for review 08/08/19 Central Services Departments New Budget Requests Due to Finance & Budget (F&B)
08/19-08/22/19 Executive Review of Central Services Department’s New Budget Requests 08/28 - 8/29/19 Central Services Departments Final Entry and Budget Support Documentation due to
F&B 09/06/19 Executive Review of Central Services’ Operating & Capital Budgets
09/06/19 Non-Operating Budgets due to F&B 09/11/19 Executive Review of Maritime & Economic Development’s Operating & Capital
Budgets 09/12/19 Executive Review of Aviation’s Operating and Capital Budgets 09/17 - 9/27/19 Aviation, Maritime and Economic Development Internal Budget Reviews 09/24/19 Commission Briefing on Central Services Operating Budget 10/08/19 Commission Budget Study Sessions for Aviation and Maritime Operating and Capital
Budgets 10/22/19 Tax Levy and Draft Plan of Finance Commission Briefing 10/22/19 2020 Preliminary Budget document is available to the Commission 10/24/19 2020 Preliminary Budget document is released to the Public 11/12/19 Introduction and Public Hearing of the 2020 Budget 11/19/19 Adoption of the 2020 Budget 11/25/19 Filing of Budget with King County Council & King County Assessor as required by
law 12/13/19 Release of 2020 Final Budget
Port of Seattle 2020 Budget Appendices
Filename: Section XIII Appendices Final Updated: 9/21/2010 XIII-7
2. CAPITAL BUDGET
a. Capital Budget Policy: As part of the Strategic Budgeting process, Finance and Budget produces the Capital Budget and the Draft Plan of Finance. The Capital Budget consists of capital plans or the Capital Improvement Plan (CIP), over a five-year period, for all divisions: Aviation, Maritime, Economic Development and Central Services. The Draft Plan of Finance is a funding plan of the CIP that the Port publishes on an annual basis. The divisions review and revise their CIP in conjunction with the review of their existing business goals and strategies. The CIP is comprised of Committed projects from the 2019 CIP, less any that have been deleted, plus any Prospective projects that may meet the criteria to move forward to Committed status. The CIP may include Business Plan Prospective projects if coverage targets are met. Divisions are encouraged to review CIP cash flows with respect to timing and reasonableness to ensure effective use of capital capacity. b. Capital Budget Process:
• A preliminary capacity/funding analysis is performed once the 2nd quarter update is completed, but no later than by the end of August.
• At the end of September, divisions submit to Finance and Budget the CIP and 2019 forecasted actual (which includes actual through second quarter). The funding implications of these capital plans are then reviewed with the divisions and business units.
• Following Finance and Budget funding analysis and Executive review of preliminary plans, business units and divisions finalize their operating and financial goals, including their CIP for 2020-2024.
• This information is then reviewed by Executive, presented to the Commission, and included in the 2020 Final Budget document.
After the close of the 2019 fourth quarter in January 2020 and based on the 2019 fourth quarter CIP update, the divisions should have more refined capital spending estimates for 2020. Each division may choose to adjust the spending from the original list of projects in the Capital Budget, to establish the 2020 approved funding amount for each project and for the division as a whole. The adjusted Capital Budget will become the “Approved 2020 Capital Budget” and will be used for quarterly variance reporting during the year. Note: Even though the Commission reviews the Capital Budget in November, each individual CIP project, with a total cost in excess of $300,000, is presented and approved by the Commission in public meeting for spending authority.
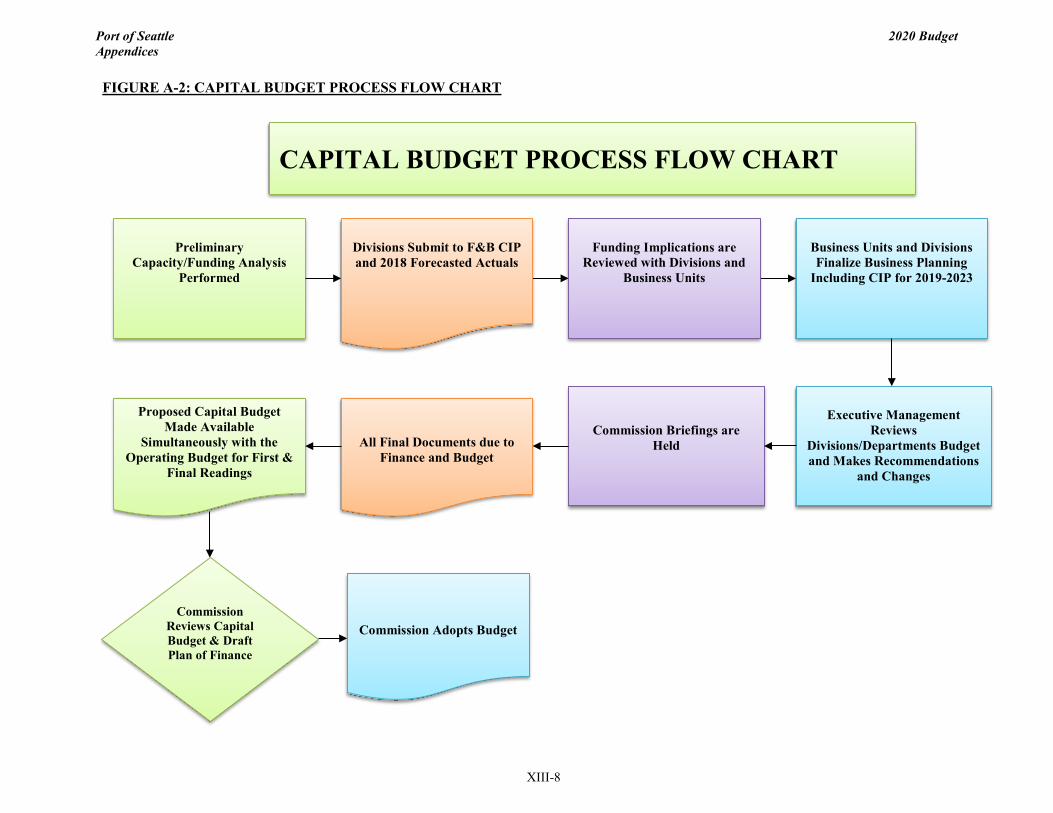
Port of Seattle 2020 Budget Appendices
Filename:Section XIII Appendices Final Updated: 12/28/2009 XIII-8
Preliminary
Capacity/Funding Analysis Performed
Business Units and Divisions Finalize Business Planning
Including CIP for 2019-2023
Executive Management
Reviews Divisions/Departments Budget and Makes Recommendations
and Changes
Commission Briefings are Held
All Final Documents due to Finance and Budget
Proposed Capital Budget Made Available
Simultaneously with the Operating Budget for First &
Final Readings
Divisions Submit to F&B CIP and 2018 Forecasted Actuals
Funding Implications are
Reviewed with Divisions and Business Units
Commission Reviews Capital Budget & Draft Plan of Finance
Commission Adopts Budget
CAPITAL BUDGET PROCESS FLOW CHART
FIGURE A-2: CAPITAL BUDGET PROCESS FLOW CHART

Port of Seattle 2020 Budget Appendices
Filename: _appendix.doc Updated: 10/18/2019 XIII-9
c. Capital Budget Planning Calendar: Following is the 2020 Capital Budget planning calendar: Date Activity 06/04/19 Commission Budget Retreat including 2020 Budget Process and Development Briefing 09/06/19 Preliminary Non-Aviation capital capacity analysis by F&B 09/06-09/12/19 Executive Review of Operating and Capital Budgets for all divisions 09/13/19 Preliminary Aviation Forecast Model due to F&B 09/17/19 F&B creates “CAPBUD” database from Projects 09/24/19 Commission Briefing on Central Services’ Operating and Capital Budgets 10/01-10/11/19 F&B finalizes Capacity/Funding Analysis 10/08/19 Commission Budget Study Sessions for Aviation and Maritime Operating and Capital Budgets 10/22/19 Tax Levy and Draft Plan of Finance Commission Briefing 11/12/19 Introduction and Public Hearing of the 2020 Budget 11/19/19 Adoption of the 2020 Budget 11/25/19 Filing of Budget with King County Council & King County Assessor as required by law 12/13/19 Release of 2020 Final Budget
Port of Seattle 2020 Budget Appendices
Filename: _appendix.doc Updated: 10/18/2019 XIII-10
APPENDIX B: FINANCIAL MANAGEMENT POLICIES The primary purpose of the Port is to broaden and strengthen the economic base of the port district. The Port uses key criteria in various combinations as it pursues its capital and operating programs and projects. Clearly, national and international economic strengths or weaknesses have a direct bearing upon the Port’s financial viability and role as an economic engine for the region.
1. KEY FINANCIAL TOOLS The Port uses several tools to monitor its financial performance and these are described below
a. Long-term Targets: The Port’s long-term targets provide high-level policy guidance. These targets provide guidance to business planning for each division.
b. Operating Budget: The Operating Budget is an essential tool for the Port’s management planning, resource allocations, and control. It quantifies line of business and departmental plans for the next year in both operational and monetary terms. Throughout the year, the Responsibility Reports (which compare actual results to budget) are generated monthly and variances from budget are analyzed on a monthly basis, and more extensively each quarter, to determine if corrective action is needed. Divisions and departments prepare a quarterly forecast, which is incorporated into the quarterly Performance Report, which provides explanation of variances from the approved plan and is presented quarterly to Executive Management and Commission in public meetings, as necessary.
c. Balanced Budget: The Port prepares an annual budget and supports, encourages and commits to a balanced budget in which revenues exceed expenses. In so doing, the practice is to pay for all current operating expenses with current revenues and not postpone current year operating expenses to future years or accrue future year’s revenues to the current year. The Port’s policy further requires that budgeted operating expenses do not exceed budgeted revenues, and on-going expenses do not exceed on-going revenues.
d. Operating Forecasts: Included in the budget document are five-year forecasts or projections of the division’s operating revenues and expenses. The first year of this forecast is the Operating Performance Budget.
e. Capital Budget and Capital Improvement Plan: A detailed plan of proposed outlays or capital expenditures arising from the acquisition or improvement of the Port’s fixed assets and the proposed means of financing them through bond proceeds, grants and operating revenues. This document serves as an operational and planning tool and it is directly tied to the business goals. The document identifies proposed capital projects at the airport and on the waterfront and prioritizes those projects.
f. Capital Improvement Plan (CIP) Reserve: The Capital Improvement Plan may include one or more CIP reserves to ensure funding capacity for unspecified projects (e.g. renewal and replacement), new initiatives and unforeseen needs. However, CIP reserves are not intended to anticipate all potential future spending and amounts will be determined by considering the data on historical capital trends, existing asset conditions, the status (level of certainty) of CIP forecasts, and any contingent risks that may require funding. The use of CIP reserves will be reviewed with the Commission annually during the budget process.
g. Capital Expenditures: Expenditures that arise from the acquisition or improvement of the Port’s fixed assets such as construction of new facility or renovation of existing facility; renewal, replacement or upgrading of mechanical, electrical, communications, HVAC and plumbing systems; computer and office equipment; furniture and fixtures; vehicles, etc.
h. Capital Budget Impact on the Operating Budget: Its impact on the Operating Budget is through Capitalized Labor or Charges to Capital Projects, which include the salaries and benefits costs associated with capital projects. These costs are subtracted out of the operating budget and then budgeted in the capital budget as part of the cost of the project(s). The Operating Budget is also impacted in the form of increased operating, maintenance and depreciation expenses because of the new assets. Depreciation is a non-cash item that represents the use of long-term assets. Port assets are given a useful life of more than
Port of Seattle 2020 Budget Appendices
Filename: _appendix.doc Updated: 10/18/2019 XIII-11
three years when they become active and each year some of that useful life is used up, worn or depreciated. The capitalized labor or charges to capital projects is displayed in table III-3 and the depreciation is displayed in table III-2. The capitalized labor is also displayed in similar tables in sections IV thru VII.
i. Plan of Finance: The Five-year Capital Budget is the basis of the Plan of Finance. This document provides a funding plan of the capital program developed within the financial targets and forecasts described within the Draft Plan of Finance section. The Draft Plan of Finance is prepared and presented to the Port Commission concurrently with the Operating Budget. See further discussion in the Draft Plan of Finance, section X of this book.
j. Capital Investment Matrix: The matrix provides an analytical framework for capital projects. The results of the analysis provide financial and non-financial information for the Port Commission as a guide for capital investment decisions.
k. Financial and Operational Indicators Report: The Port uses financial and operating indicators to monitor its financial performance and budget. This report is produced and distributed monthly to the Port Commission and Executive Management.
l. Treasury Management: Using its internal Treasury since July 2002, the Port has experienced increased investment earnings, faster mobilization of funds, on-line banking capabilities, easier accounts and full control of its cash and investments.
m. General Coverage Ratios and Cash Flow Margins: As part of its financial modeling, the Port targets that Airport cash flow equals 1.25x of all Airport related revenue debt and that Non-Airport cash flow equals 1.8x of all Non-Airport related revenue debt. In addition, the Port targets general obligation bond debt service not to exceed any more than seventy-five percent of the annual tax levy.
n. Bond Coverage Ratios: The Port, through financial modeling, runs projections for its revenue bond debt service coverage ratio. Although the Port has an obligation under First Lien Revenue Bond covenants to maintain a ratio of 1.35x, as a matter of practice a ratio of at least 1.8x is maintained. Debt service coverage may fall below this target level during periods of construction borrowing prior to the time that revenue producing assets come on-line.
o. Fund Balances: Working capital fund balances are maintained in the General Fund and the Airport Development Fund at a targeted level of approximately nine months of operating and maintenance expenses. The Port maintains $5 million in the Renewal and Replacement Fund as required by bond documents.
p. Performance/Variance Report: This report is in narrative format explaining the reasons for or causes of variances between actual revenues and expenses versus budgeted amounts on a quarterly basis. A good and accurate monthly and quarterly performance/variance report is a very important tool for management. Divisions and departments prepare a quarterly year-end forecast, which is incorporated into this report and it is presented quarterly to Executive Management and the Commission in public meetings.
q. Commitment Control: The Port has in place a commitment control ledger that monitors department budgets, and which prevents departments from exceeding their total budget without appropriate approval.
2. FINANCIAL POLICIES AND DESCRIPTION OF MAJOR FUNDS
This section, pages XIII-11 through 18, presents a summary of the Port’s major financial policies and description of its major funds. a. Organization: Founded in 1911 by a vote of the people as a special purpose government, the Port of
Seattle’s mission is to promote economic opportunities and quality of life in the region by advancing trade, travel, and commerce in an equitable, accountable, and environmentally responsible manner. The Port is considered a special purpose government with a separately elected commission of five members and is legally separate and fiscally independent of other State or local governments.
Port of Seattle 2020 Budget Appendices
Filename: _appendix.doc Updated: 10/18/2019 XIII-12
b. Reporting Entity: The Port reports the following fund: the Enterprise Fund accounts for all activities and operations of the Port.
There are dozens of funds that are summarized into the Enterprise Fund. The Enterprise fund is used to account for operations and activities that are financed at least in part by fees or charges to external users of Airport Facilities, Maritime and Economic Development properties. Therefore, the Port of Seattle summarizes all of its fund activities in the Enterprise Fund. This includes the Port's major business activities, which are comprised of three operating divisions - Aviation, Maritime, and Economic Development. Within the Enterprise Fund, the Port segregates non-operating expenses made to public entities which are funded by the ad valorem tax levy. This includes expenses for district schools and infrastructure improvements to the state and region in conjunction with other agencies. These projects are controlled by other governmental entities and are not reflected in the Port's financial statements.
In 2015, the Port underwent a series of reorganizations to strategically position the Port to achieve future growth, operational excellence and talent development.
Operation of the Port’s main cargo business was transferred to the Northwest Seaport Alliance, a joint venture with the Port of Tacoma, which unified the two ports’ marine cargo terminal investments, operations, planning and marketing to strengthen the Puget Sound gateway and attract more marine cargo to the region. The remaining Seaport businesses became a part of the new Maritime Division.
The Northwest Seaport Alliance is the fourth-largest trade gateway in North America, behind the ports of Los Angeles and Long Beach, the Port of New York/New Jersey, and the Port of Savannah. The Pacific Northwest is a key region for inbound and outbound United States cargo, moving cargo not only for the regional trade, but also cargo headed to destinations throughout the entire U.S. Midwest, and this Alliance will help the region remain competitive into the future. This is truly historic and signals a new era of cooperation between the ports. Combining the strong cargo terminal operations will make the region more competitive in the global economy and create new jobs in Washington.
The two ports have moved from fierce competitors to bold collaborators to form a new business model for the greater good of the region. The ports recognized how critical the maritime industry is to the state’s economy, and are proud and excited to strengthen it even more.
Together, the ports can more efficiently deploy the significant investments each port has devoted to infrastructure and speak with a stronger voice on pressing regional and industry-related issues. While the ports remain separate organizations that retain ownership of their respective assets, they formed a port development authority (PDA) to manage the container, break-bulk, auto and some bulk terminals in Seattle and Tacoma. The PDA is governed jointly by the two ports through their elected commissions. Effective January 1, 2016, the Port is comprised of three operating divisions, namely Aviation, Maritime and Economic Development.
The Aviation Division ("Aviation") operates Seattle-International (Sea-Tac) Airport which serves the predominant air travel needs of a five-county area. The Airport is ranked as 8th busiest airport in the U.S. serving 49.8 million passengers and more than 432,315 metric tons of air cargo in 2018. Thirty-two airlines serve 91 non-stop domestic and 29 international destinations including Canada, Mexico, and seasonal operations.
The Maritime Division manages industrial property connected with maritime businesses, recreational marinas, Fishermen’s Terminal, cruise, grain and maritime operations.
Port of Seattle 2020 Budget Appendices
Filename: _appendix.doc Updated: 10/18/2019 XIII-13
The Economic Development Division focuses on managing the Port’s industrial and commercial properties including conference and event centers, encouraging tourism, developing small business opportunities, and providing for workforce development in the aviation, maritime and construction industries. Central Services provides high quality and cost-effective professional and technical services to the divisions and supports the overall goals of the Port; it also delivers projects and provides technical and contracting services in support of the operating and infrastructure needs of the Port through Capital Development. Central Services expenses are allocated and charged to the operating divisions.
c. Basis of Accounting and Budgeting: The Port does not distinguish between the Basis of Accounting and the Basis of Budgeting since the principles set forth as the Basis of Accounting are observed in the budgeting process. The Port is accounted for on a flow of economic resources measurement focus. The financial statements and the budget are prepared in accordance with accounting principles generally accepted in the United States of America as applied to governmental units using the accrual basis of accounting under which revenue transactions are recognized when earned and expenses are recognized when incurred, regardless of the time the cash is received or disbursed. The Government Accounting Standard Board ("GASB") is the accepted standard-setting body for establishing governmental accounting and financial reporting principles. The Port adopted the provisions of GASB Statement No. 62, Codification of Accounting and Financial Reporting Guidance Contained in Pre-November 30, 1989 FASB and AICPA Pronouncements. This statement incorporates into GASB’s authoritative literature certain accounting and financial reporting guidance issued by Financial Accounting Standard Board (“FASB”) pronouncements which does not conflict with or contradict GASB pronouncements, and eliminates the option to apply post-November 30, 1989 FASB pronouncements that do not conflict with or contradict GASB pronouncements.
d. Use of Estimates: The preparation of the Port’s budget in conformity with accounting principles generally accepted in the United States of America requires management to make estimates and assumptions in reporting of revenues and expenses in certain instances. Thus, actual amounts could differ from those estimates.
e. Operating Revenues: Fees for services, rents and charges for the use of Port Facilities such as: Dockage, Wharfage, Berthage and Moorage, Airport Transportation Fees, Airport Landing Fees, Equipment, Property Rentals and other revenues generated from the Port’s operations are reported as operating revenue.
f. Non-Operating Revenues: Revenues that do not result from the normal operation of the Port’s business such as: Ad Valorem Tax Levy, Interest Income, Non-operating Grants, Passenger Facilities Charges, Customer Facilities Charges and other revenues generated from non-operating sources are classified as non-operating.
g. Operating & Maintenance Expenses: Cost or charges that arise from the normal operation of the Port’s business. These are costs or services required for a department/division to function. These include Salaries and Benefits, Equipment expense, Supplies and Stock, Travel and Other Employee expenses and all Direct Charges, even those from Central Services and from other Divisions.
h. Non-Operating Expenses: Cost or charges that do not arise from the normal operation of the Port’s business. An example is interest expense.
i. Capital Policy: The Port’s policy is to capitalize all asset additions or Tangible Assets [Property, Plant and Equipment] and Intangible Assets, if they exceed $20,000, whether it is a single payment or an accumulation of related costs and with an estimated useful life of more than three years. Any asset costing less than $20,000 is expensed. Land, facilities and equipment are stated at cost, less accumulated depreciation. Depreciation is computed on a straight-line basis. Buildings and improvements are assigned lives of 30 to 50 years, equipment 3 to 20 years, and furniture and fixtures 5 to 10 years.
Port of Seattle 2020 Budget Appendices
Filename: _appendix.doc Updated: 10/18/2019 XIII-14
j. Debt Policy: The Port’s debt policy is designed to ensure appropriate use and management of debt including compliance with various laws, regulations and agreements and effective management of risk. The policy requires use of an independent financial advisor and describes the roles of Commission and staff. The policy describes the type and structure of debt and sets forth limitations on new debt. Key limitations include minimum debt service coverage requirements for revenue bond debt of 1.25x for the Airport and 1.8x for the non-aeronautical businesses and that General Obligation bond debt service cannot exceed 75% of the annual tax levy. The policy establishes savings targets for refunding ranging from 3% for a current refunding with a short-term maturity/call date to 9% for a LIBOR based swap refunding with a long-term maturity/call date. The policy also provides guidelines for the sale of bonds.
k. Ad Valorem Tax Levy: Ad valorem taxes received by the Port are utilized for the acquisition and construction of facilities, for the payment of principal and interest on GO bonds issued for the acquisition or construction of facilities, for contributions to regional freight mobility improvements, for environmental expenses, for certain operating expenses, and for public expenses. The Port includes ad valorem tax levy revenues and interest expense on GO bonds as non-operating income in the Statement of Revenues and Expenses. The King County Treasurer acts as an agent to collect property taxes levied in the County for all taxing authorities. Taxes are levied annually on January 1 on property values listed as of the prior year. The lien date is January 1. Assessed values are established by the County Assessor at 100% of fair market value. A re-evaluation of all property is required annually. Taxes are due in two equal installments on April 30 and October 31. Collections are distributed to the Port by the County Treasurer.
l. Special Item: The Port recorded as a special item, a $120,000,000 payment made to the Washington State Department of Transportation (“WSDOT”) for the State Route 99 (“SR99”) Alaskan Way Viaduct Replacement Program in 2015. This is the first payment based on the funding agreement entered into with WSDOT for the State’s eligible construction cost incurred on the Tunnel Design Build Project. The Port made the remaining $147,700,000 payment to WSDOT in 2016 and recorded it as a special item. The SR99 Alaskan Way Viaduct Replacement Program will improve movement of freight and other traffic on the west corridors of the Seattle transportation system between the Duwamish and Ballard-Interbay neighborhoods, including easy access to the Port’s cargo, recreational boating, commercial fishing, cruise facilities and the Airport.
m. Description of Major Funds: There are dozens of funds that are summarized into the Enterprise Fund. The Enterprise Fund accounts for all activities and operations of the Port. The Enterprise fund is connected to the functional units in that it is used to account for operations and activities that are financed at least in part by fees or charges to external users of Airport Facilities, Maritime and Economic Development properties.
Therefore, the Port of Seattle summarizes all of its fund activities in the Enterprise Fund. This includes the Port's major business activities, which are comprised of three operating divisions (Aviation, Maritime, Economic Development), and Central Services. Descriptions of some of the major funds are:
Types of Funds Fund Name Fund # Fund Description 1. Operating Airport
Development Fund (ADF)
03040 This is the operating fund for the Seattle-Tacoma International Airport (Aviation division). The fund receives operating revenues derived from all airport sources, and it funds operating and maintenance expenses related to the Airport. The fund also receives Airport Improvement Program grants reimbursement receipts. Transfers made from this fund include funding for Aviation related revenue bond fund debt service. Capital acquisition expenditures which are not otherwise funded are also made from this fund. Other expenditures include: operating and administrative expenses and non-operating expenditures associated with Central Services that are
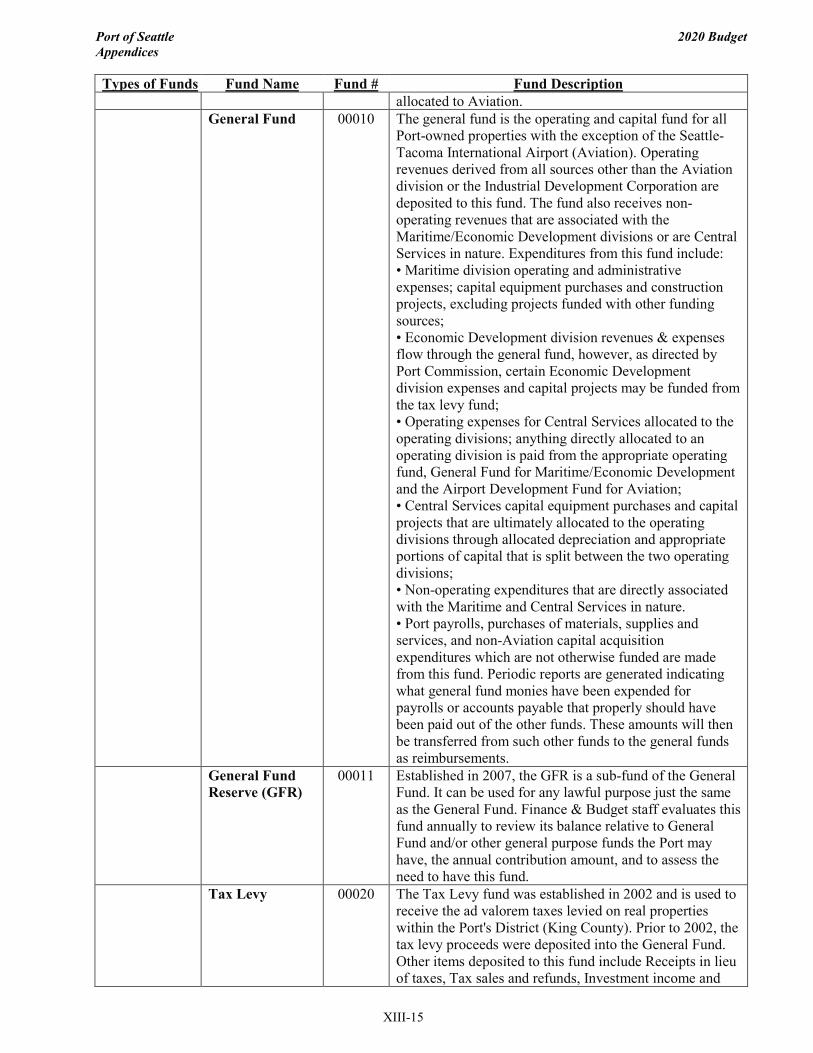
Port of Seattle 2020 Budget Appendices
Filename: _appendix.doc Updated: 10/18/2019 XIII-15
Types of Funds Fund Name Fund # Fund Description allocated to Aviation.
General Fund
00010 The general fund is the operating and capital fund for all Port-owned properties with the exception of the Seattle-Tacoma International Airport (Aviation). Operating revenues derived from all sources other than the Aviation division or the Industrial Development Corporation are deposited to this fund. The fund also receives non-operating revenues that are associated with the Maritime/Economic Development divisions or are Central Services in nature. Expenditures from this fund include: • Maritime division operating and administrative expenses; capital equipment purchases and construction projects, excluding projects funded with other funding sources; • Economic Development division revenues & expenses flow through the general fund, however, as directed by Port Commission, certain Economic Development division expenses and capital projects may be funded from the tax levy fund; • Operating expenses for Central Services allocated to the operating divisions; anything directly allocated to an operating division is paid from the appropriate operating fund, General Fund for Maritime/Economic Development and the Airport Development Fund for Aviation; • Central Services capital equipment purchases and capital projects that are ultimately allocated to the operating divisions through allocated depreciation and appropriate portions of capital that is split between the two operating divisions; • Non-operating expenditures that are directly associated with the Maritime and Central Services in nature. • Port payrolls, purchases of materials, supplies and services, and non-Aviation capital acquisition expenditures which are not otherwise funded are made from this fund. Periodic reports are generated indicating what general fund monies have been expended for payrolls or accounts payable that properly should have been paid out of the other funds. These amounts will then be transferred from such other funds to the general funds as reimbursements.
General Fund Reserve (GFR)
00011 Established in 2007, the GFR is a sub-fund of the General Fund. It can be used for any lawful purpose just the same as the General Fund. Finance & Budget staff evaluates this fund annually to review its balance relative to General Fund and/or other general purpose funds the Port may have, the annual contribution amount, and to assess the need to have this fund.
Tax Levy 00020 The Tax Levy fund was established in 2002 and is used to receive the ad valorem taxes levied on real properties within the Port's District (King County). Prior to 2002, the tax levy proceeds were deposited into the General Fund. Other items deposited to this fund include Receipts in lieu of taxes, Tax sales and refunds, Investment income and

Port of Seattle 2020 Budget Appendices
Filename: _appendix.doc Updated: 10/18/2019 XIII-16
Types of Funds Fund Name Fund # Fund Description expense, Tax adjustments, Tax supplements and cancellations. Proceeds are used for General Obligation (G.O.) bonds debt service, and to fund capital, expense and special item projects that meet criteria established by the Port, or as directed by Port Commission.
Transportation & Infrastructure Reserve (TIF)
00021 Established in 2010, as per the 2010 Commission approved budget, the TIF can be used for any lawful purpose just the same as Tax Levy Fund. The TIF initial funding source is from the Tax Levy fund, and the fund balance is reviewed at least annually with Port staff and Commission.
Harbor Development Fund (HDF)
00022 In 2017 as part of 2018 Budget/Plan of Finance, the Port set aside funds in the HDF to help fund future development in the North Harbor (NWSA). The HDF was initially funded with a portion of the 2017 G.O. bond proceeds, which were issued to reimburse the Port for prior year cash payments made to the State of Washington on the Alaska Way Viaduct project. The HDF is legally separate from any tax levy collections and is available to pay revenue bond debt service, if the Port chooses.
Lease Security SSAT/T-18 Fund
03090 Established December 2011, this fund represents the Lessee’s (SSAT and SSA) Security for Rent Payment in the form of a “Cash Security”, to satisfy the lease’s Security Requirement.
Customer Deposits
06010 This fund has been established as a depository of lease deposits and other monies held by the Port as surety, but belonging to Port of Seattle customers.
2. Special Facility
Passenger Facilities Charges (PFC) : • Revenue • Capital
06054
03060
PFC Revenues are derived from passenger facility charges levied on embarking passengers at Seattle-Tacoma International Airport. The collected revenues are used to pay debt service on PFC Revenue Bonds, debt service on other revenue bonds related to FAA PFC approved projects, and for specifically-designated airport facility improvements projects. All PFC’s revenues are deposited to the Revenue fund (06054). From the Revenue fund, there is a required monthly transfer of monies to the Debt Service fund equal to 1/6th of semi-annual debt service payment by the 25th of each month. The remaining balance of the Revenue fund, which includes interest earnings, is then transferred to Capital fund (03060).
Customer Facility Charge (CFC)
CFC01 Established in 2006, the CFC Fund holds revenue derived from charges imposed upon customers of rental car companies accessing the Airport, and taxable revenue bond proceeds issued to fund the Consolidated Rental Car Facility (CRCF). Funds are to be used to pay debt service on those bonds, construction costs for the CRCF project, any future capital maintenance projects, and specified CRCF operating expenses.
Fuel Hydrant Fund • Revenue • Debt Service
Held in Trust
The funds accruing to the Fuel Hydrant Revenue Fund are derived from Pledged Lease Revenue and Other Revenue as defined in Resolution No. 3504, as amended. Funds are to be used to pay Fuel Hydrant bonds debt service.
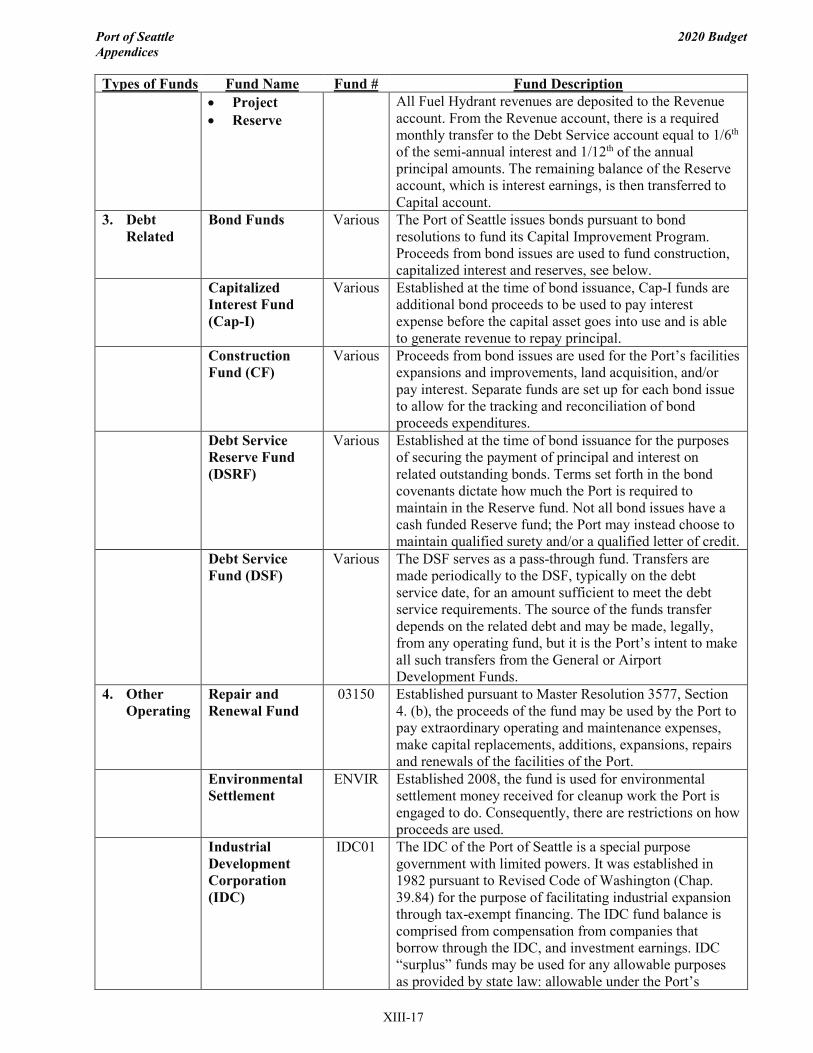
Port of Seattle 2020 Budget Appendices
Filename: _appendix.doc Updated: 10/18/2019 XIII-17
Types of Funds Fund Name Fund # Fund Description • Project • Reserve
All Fuel Hydrant revenues are deposited to the Revenue account. From the Revenue account, there is a required monthly transfer to the Debt Service account equal to 1/6th of the semi-annual interest and 1/12th of the annual principal amounts. The remaining balance of the Reserve account, which is interest earnings, is then transferred to Capital account.
3. Debt Related
Bond Funds
Various The Port of Seattle issues bonds pursuant to bond resolutions to fund its Capital Improvement Program. Proceeds from bond issues are used to fund construction, capitalized interest and reserves, see below.
Capitalized Interest Fund (Cap-I)
Various Established at the time of bond issuance, Cap-I funds are additional bond proceeds to be used to pay interest expense before the capital asset goes into use and is able to generate revenue to repay principal.
Construction Fund (CF)
Various Proceeds from bond issues are used for the Port’s facilities expansions and improvements, land acquisition, and/or pay interest. Separate funds are set up for each bond issue to allow for the tracking and reconciliation of bond proceeds expenditures.
Debt Service Reserve Fund (DSRF)
Various Established at the time of bond issuance for the purposes of securing the payment of principal and interest on related outstanding bonds. Terms set forth in the bond covenants dictate how much the Port is required to maintain in the Reserve fund. Not all bond issues have a cash funded Reserve fund; the Port may instead choose to maintain qualified surety and/or a qualified letter of credit.
Debt Service Fund (DSF)
Various The DSF serves as a pass-through fund. Transfers are made periodically to the DSF, typically on the debt service date, for an amount sufficient to meet the debt service requirements. The source of the funds transfer depends on the related debt and may be made, legally, from any operating fund, but it is the Port’s intent to make all such transfers from the General or Airport Development Funds.
4. Other Operating
Repair and Renewal Fund
03150 Established pursuant to Master Resolution 3577, Section 4. (b), the proceeds of the fund may be used by the Port to pay extraordinary operating and maintenance expenses, make capital replacements, additions, expansions, repairs and renewals of the facilities of the Port.
Environmental Settlement
ENVIR Established 2008, the fund is used for environmental settlement money received for cleanup work the Port is engaged to do. Consequently, there are restrictions on how proceeds are used.
Industrial Development Corporation (IDC)
IDC01 The IDC of the Port of Seattle is a special purpose government with limited powers. It was established in 1982 pursuant to Revised Code of Washington (Chap. 39.84) for the purpose of facilitating industrial expansion through tax-exempt financing. The IDC fund balance is comprised from compensation from companies that borrow through the IDC, and investment earnings. IDC “surplus” funds may be used for any allowable purposes as provided by state law: allowable under the Port’s

Port of Seattle 2020 Budget Appendices
Filename: _appendix.doc Updated: 10/18/2019 XIII-18
Types of Funds Fund Name Fund # Fund Description authorized powers to engage in economic development programs, and for growth management, planning or other economic development purposes.
3. REVENUE AND EXPENSE ASSUMPTIONS
Operating revenues are developed based on the terms of various lease agreements and on forecasted activity levels. Operating expenses are developed based on historical experience, forecasted activity levels and inflation. The 2020 Aviation aeronautical revenues, which are based on cost-recovery, are budgeted at $401.6 million, an increase of 9.8% compared to the 2019 budget. Non-aeronautical revenues are budgeted at $283.2 million which is 9.1% higher than the 2019 budget. The Airport expects steady enplanement growth of 3.0% in 2020. Strong performances are expected in several lines of business such as public parking, airport dining & retail, ground transportation, clubs & lounges, and commercial properties whereas modest growth is expected in Rental car. The 2020 Aviation expenses are expected at $377.7 million, an increase of 3.2% over the 2019 budget mainly driven by increases in payroll, contracted services, costs associated with rising non-aeronautical revenues as well as non-recurring baseline expenses to address operation needs and support strategic initiatives.
The 2020 Maritime revenues are budgeted at 62.9 million, an increase 5.4% over the 2019 budget due to the expected revenue increases in Cruise and in Recreational Boating. Recreational boating revenue is expected to increase 4.4% in 2020 due to stable occupancy and increased rates while Cruise revenue growth is projected to grow 11% in 2020 because of larger cruise vessels and more sailings. Maritime expenses are budgeted at $56.2 million, an increase of 10.6% compared to the 2019 budget mainly due to the first scheduled payment to NWSA for T46 as well as the addition of resources to support the capital program and meet operational needs.
Economic Development revenues are anticipated at $19.1 million, a reduction of 3.1% compared to the 2019 budget due to the estimated 6 months of construction down time at the Bell Harbor Conference and Event Center. The 2020 Economic Development expenses are budgeted at $29.0 million, a decrease of 4.4% from the 2019 budget driven by variable costs associated the Conference and Event Center activities and lower maintenance expenses. The key business activities forecast for the Airport, Maritime, and Economic Development divisions are as follows: • Enplaned passengers are expected to grow by 3.0% for 2020. • Cruise passengers are forecasting at a record 1.3 million for 2020, an 8.8% increase from 2019 budget. • Grain volume is forecast to be 3.0 million metric tons for 2020, a16% decrease from the 2019 budget. • The average Shilshole Bay Marina occupancy rate is forecast to be 95 percent, same as 2019. • Fishing and Commercial Operations occupancy rates are forecast to average 86 percent, same as 2019. • Commercial Properties are expected to remain strong at 95% occupancy at the end of 2020, same as 2019. Portwide salaries for exempt and non-exempt employees are budgeted to increase by an average of 3.9% for 2020. Benefit costs for employees in non-union jobs are budgeted in two parts:
• The first part is a flat dollar amount per employee per month and covers costs that are not related to employees’ pay. This includes medical and dental coverage, Wellness Rewards Program costs, 401(a) contributions, and Flexible Spending Account fees. This amount is $1,222.71 per employee per month.
• The second part covers costs that are related to employees’ pay. This includes FICA, PERS, life and
disability insurance as well as PTO and Sick Leave amounts together with the new Washington Paid Family and Medical Leave. These items are estimated to total 24.216% of pay in 2020.
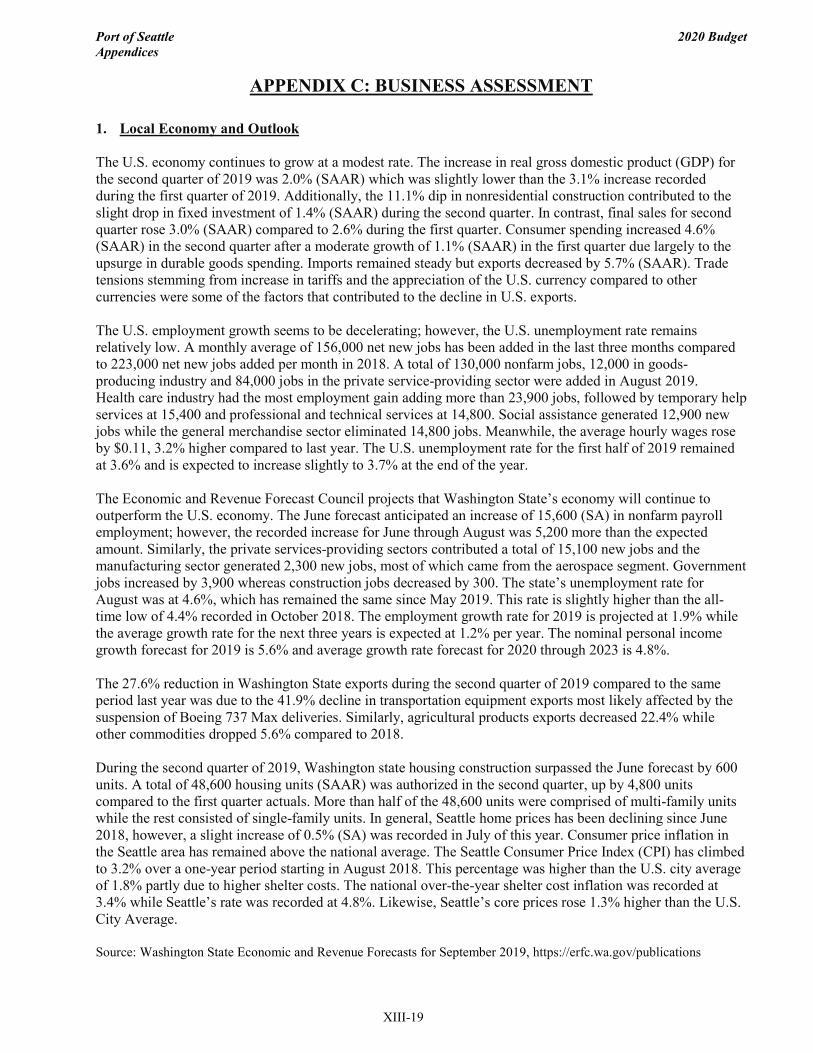
Port of Seattle 2020 Budget Appendices
Filename: _appendix.doc Updated: 10/18/2019 XIII-19
APPENDIX C: BUSINESS ASSESSMENT
1. Local Economy and Outlook The U.S. economy continues to grow at a modest rate. The increase in real gross domestic product (GDP) for the second quarter of 2019 was 2.0% (SAAR) which was slightly lower than the 3.1% increase recorded during the first quarter of 2019. Additionally, the 11.1% dip in nonresidential construction contributed to the slight drop in fixed investment of 1.4% (SAAR) during the second quarter. In contrast, final sales for second quarter rose 3.0% (SAAR) compared to 2.6% during the first quarter. Consumer spending increased 4.6% (SAAR) in the second quarter after a moderate growth of 1.1% (SAAR) in the first quarter due largely to the upsurge in durable goods spending. Imports remained steady but exports decreased by 5.7% (SAAR). Trade tensions stemming from increase in tariffs and the appreciation of the U.S. currency compared to other currencies were some of the factors that contributed to the decline in U.S. exports. The U.S. employment growth seems to be decelerating; however, the U.S. unemployment rate remains relatively low. A monthly average of 156,000 net new jobs has been added in the last three months compared to 223,000 net new jobs added per month in 2018. A total of 130,000 nonfarm jobs, 12,000 in goods-producing industry and 84,000 jobs in the private service-providing sector were added in August 2019. Health care industry had the most employment gain adding more than 23,900 jobs, followed by temporary help services at 15,400 and professional and technical services at 14,800. Social assistance generated 12,900 new jobs while the general merchandise sector eliminated 14,800 jobs. Meanwhile, the average hourly wages rose by $0.11, 3.2% higher compared to last year. The U.S. unemployment rate for the first half of 2019 remained at 3.6% and is expected to increase slightly to 3.7% at the end of the year. The Economic and Revenue Forecast Council projects that Washington State’s economy will continue to outperform the U.S. economy. The June forecast anticipated an increase of 15,600 (SA) in nonfarm payroll employment; however, the recorded increase for June through August was 5,200 more than the expected amount. Similarly, the private services-providing sectors contributed a total of 15,100 new jobs and the manufacturing sector generated 2,300 new jobs, most of which came from the aerospace segment. Government jobs increased by 3,900 whereas construction jobs decreased by 300. The state’s unemployment rate for August was at 4.6%, which has remained the same since May 2019. This rate is slightly higher than the all-time low of 4.4% recorded in October 2018. The employment growth rate for 2019 is projected at 1.9% while the average growth rate for the next three years is expected at 1.2% per year. The nominal personal income growth forecast for 2019 is 5.6% and average growth rate forecast for 2020 through 2023 is 4.8%. The 27.6% reduction in Washington State exports during the second quarter of 2019 compared to the same period last year was due to the 41.9% decline in transportation equipment exports most likely affected by the suspension of Boeing 737 Max deliveries. Similarly, agricultural products exports decreased 22.4% while other commodities dropped 5.6% compared to 2018. During the second quarter of 2019, Washington state housing construction surpassed the June forecast by 600 units. A total of 48,600 housing units (SAAR) was authorized in the second quarter, up by 4,800 units compared to the first quarter actuals. More than half of the 48,600 units were comprised of multi-family units while the rest consisted of single-family units. In general, Seattle home prices has been declining since June 2018, however, a slight increase of 0.5% (SA) was recorded in July of this year. Consumer price inflation in the Seattle area has remained above the national average. The Seattle Consumer Price Index (CPI) has climbed to 3.2% over a one-year period starting in August 2018. This percentage was higher than the U.S. city average of 1.8% partly due to higher shelter costs. The national over-the-year shelter cost inflation was recorded at 3.4% while Seattle’s rate was recorded at 4.8%. Likewise, Seattle’s core prices rose 1.3% higher than the U.S. City Average. Source: Washington State Economic and Revenue Forecasts for September 2019, https://erfc.wa.gov/publications

Port of Seattle 2020 Budget Appendices
Filename: _appendix.doc Updated: 10/18/2019 XIII-20
TABLE C-1: SUMMARY FORECAST
Source: Washington State Economic and Revenue Forecasts for September 2019, https://erfc.wa.gov/publications TABLE C-2: STATE EMPLOYMENT BY INDUSTRY
SUMMARY FORECAST(Annual Percent Change) 2017 2018 2019 2020 2021
Washington State Economic Forecast
Non-farm Payroll Employment (% Ch) 2.8 2.4 2.1 2.0 1.3 Unemployment Rate (%) 4.9 4.6 4.5 4.6 4.7 Real Personal Income (% Ch) 4.1 4.6 4.5 3.3 2.6 Seattle Consumer Price Index (% Ch) 1.5 1.9 1.7 1.8 2.1 Housing Permits (% Ch) 10.9 9.6 -5.6 -4.8 -2.2Total Population (in 000's) 7,310.3 7,427.6 7,539.8 7,649.8 7,753.2 % Change 1.8 1.6 1.5 1.5 1.4
Washington State 2018 Average Employment Classified by IndustryAverage Average Average
Industry description Firms Annual Employment Annual Wage
Agriculture, forestry, fishing, and hunting 7,028 106,794 $32,397Mining 142 2,569 71,045Utilities 225 5,034 99,748Construction 25,753 199,975 64,422Manufacturing 7,488 284,094 79,352Wholesale trade 12,769 133,560 80,237Retail trade 14,302 379,637 58,842Transportation & warehousing 4,589 103,459 60,334Information 4,038 133,091 194,774Finance and insurance 5,822 94,497 95,010Real estate, rental and leasing 6,944 53,451 55,109Professional, scientific, and technical services 25,776 201,638 101,189Management of companies and enterprises 631 44,601 118,075Administrative and waste management services 12,210 168,627 50,321Educational services 3,327 44,058 38,982Health care and social assistance 54,966 421,679 52,672Arts, entertainment, and recreation 2,830 52,803 32,545Accommodation and food services 14,547 282,931 24,006Other services (except public administration) 18,793 99,103 40,340Government 2,111 561,343 63,835 Total * 224,289 3,372,944 66,156
* Total and average of statewide rollup data. Employment and wages are not shown for some subsectors to avoid disclosure of data for ind. employer. Source: Washington State Employment Security Department, 2018 annual averages, Statewide 3 digit NAICShttps://esd.wa.gov/labormarketinfo/covered-employment
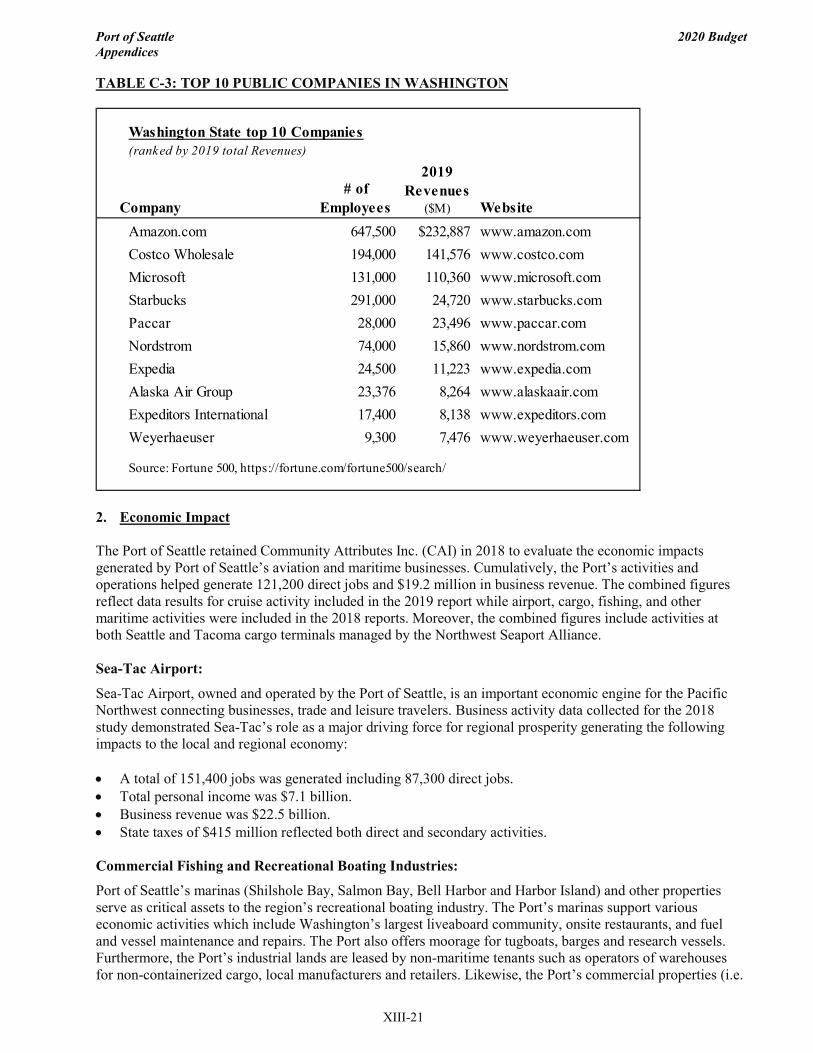
Port of Seattle 2020 Budget Appendices
Filename: _appendix.doc Updated: 10/18/2019 XIII-21
TABLE C-3: TOP 10 PUBLIC COMPANIES IN WASHINGTON
2. Economic Impact The Port of Seattle retained Community Attributes Inc. (CAI) in 2018 to evaluate the economic impacts generated by Port of Seattle’s aviation and maritime businesses. Cumulatively, the Port’s activities and operations helped generate 121,200 direct jobs and $19.2 million in business revenue. The combined figures reflect data results for cruise activity included in the 2019 report while airport, cargo, fishing, and other maritime activities were included in the 2018 reports. Moreover, the combined figures include activities at both Seattle and Tacoma cargo terminals managed by the Northwest Seaport Alliance. Sea-Tac Airport:
Sea-Tac Airport, owned and operated by the Port of Seattle, is an important economic engine for the Pacific Northwest connecting businesses, trade and leisure travelers. Business activity data collected for the 2018 study demonstrated Sea-Tac’s role as a major driving force for regional prosperity generating the following impacts to the local and regional economy: • A total of 151,400 jobs was generated including 87,300 direct jobs. • Total personal income was $7.1 billion. • Business revenue was $22.5 billion. • State taxes of $415 million reflected both direct and secondary activities. Commercial Fishing and Recreational Boating Industries:
Port of Seattle’s marinas (Shilshole Bay, Salmon Bay, Bell Harbor and Harbor Island) and other properties serve as critical assets to the region’s recreational boating industry. The Port’s marinas support various economic activities which include Washington’s largest liveaboard community, onsite restaurants, and fuel and vessel maintenance and repairs. The Port also offers moorage for tugboats, barges and research vessels. Furthermore, the Port’s industrial lands are leased by non-maritime tenants such as operators of warehouses for non-containerized cargo, local manufacturers and retailers. Likewise, the Port’s commercial properties (i.e.
Washington State top 10 Companies(ranked by 2019 total Revenues)
Company# of
Employees
2019 Revenues
($M) WebsiteAmazon.com 647,500 $232,887 www.amazon.comCostco Wholesale 194,000 141,576 www.costco.comMicrosoft 131,000 110,360 www.microsoft.comStarbucks 291,000 24,720 www.starbucks.comPaccar 28,000 23,496 www.paccar.comNordstrom 74,000 15,860 www.nordstrom.comExpedia 24,500 11,223 www.expedia.comAlaska Air Group 23,376 8,264 www.alaskaair.comExpeditors International 17,400 8,138 www.expeditors.comWeyerhaeuser 9,300 7,476 www.weyerhaeuser.com
Source: Fortune 500, https://fortune.com/fortune500/search/
Port of Seattle 2020 Budget Appendices
Filename: _appendix.doc Updated: 10/18/2019 XIII-22
Fishermen’s Terminal, Maritime Industrial Center, Terminal 91, etc.) play a major role in supporting the regional fishing industry. These facilities are used by a large majority of the North Pacific Fisheries Fleet as well as other fishing vessels that operate in the Puget Sound and the West Coast of the Olympic Peninsula. The results of the 2019 study underscore the importance of Port facilities in the region; highlights include: • $671.3 million of Direct Business Output from Commercial Fishing including 7,000 direct jobs. • Fishing vessels moored at Port facilities generated gross earnings of more than $455.0 million in 2017. • $729 million of Direct Business Output from Recreational boating including 3,620 jobs. • Recreational boating generated more than $357 million in labor compensation. Maritime Cargo:
In 2015, the ports of Seattle and Tacoma formed the Northwest Seaport Alliance (NWSA) to unify management of marine cargo facilities and business to strengthen the Puget Sound gateway and attract more marine cargo and jobs for the region. The Northwest Seaport Alliance represents one of the largest cargo-loading centers in the United States. In 2018, the NWSA commissioned a report on the economic impact of marine cargo. Key points of the 2018 study are as follows:
• NWSA directly supported 20,100 jobs with $1.9 billion in labor income in 2017. • Average annual wage including benefits for direct jobs was close to $95,000. • NWSA marine cargo directly supported $5.9 billion in business output in 2017. • Direct and secondary economic activities generated nearly $136 million in taxes. Cruise Industry:
The cruise ship industry continues to grow in Seattle. This year the Port celebrated 20 years as a cruise homeport welcoming approximately 213 vessels and 1.2 million passengers. Cruise ships utilizing the Port of Seattle facilities support economic activities by procuring supplies from local suppliers and vendors, offering shore services to cruise passengers, and commissioning service companies to repair or service equipment. Furthermore, cruise passengers and crew support the economy through their spending on local goods and services. The 2019 economic impacts of the Port of Seattle’s cruise business include: • Cruise activities create nearly $900 million a year in total local business revenue. • Each homeport ship call contributes an average $4.2 million to the state’s economy and supports over
5,500 jobs. • The 2019 estimated total economic impact (including direct, indirect and induced impact) is $260.1
million in labor income. • Business output for 2019 is estimated at $893.6 million. The Full Economic Reports for the Airport, Commercial Fishing and Recreational Boating, Marine Cargo and Cruise are available on the Port’s website: https://www.portseattle.org/page/economic-impact-and-tax-levy.
Port of Seattle 2020 Budget Appendices
Filename: _appendix.doc Updated: 10/18/2019 XIII-23
3. Fast/Fun Facts about the Port Five Fast/Fun Facts about Canine Police Officers
When you’re traveling through Sea-Tac Airport, you may have noticed dogs patrolling the ticketing area or working in the terminal. These four-legged police officers are well-loved by travelers and airport employees alike, but did you ever wonder what they actually do all day? These cute canines are working professionals and aren’t here to play. They are on the hunt for explosives at the airport and seaport and play a key role in keeping facilities, employees, and travelers safe. Their speed and flexibility in uncovering explosives and their ability to follow suspicious odors often give them an edge over mechanical detection devices. The Port of Seattle Police Department (POSPD) canine team is currently made up of 12 canines of a variety of breeds that specialize in detecting explosives and narcotics. Read on for five fast/fun facts about the Port of Seattle Police Department’s canine program. 1. Canines and their handlers are like family It takes anywhere from 18 months to two years for a handler and the dog to bond to the point where the handler can read the subtleties of their dog’s behavior. When an officer is paired with a canine, they are taking on more than a new coworker or partner at work. They patrol together, take lunch breaks together, and at the end of the shift, they head home together. Canines spend time away from work living the life of a typical dog, napping, playing, chasing sticks, and relaxing with the family. The partnership doesn’t end when a canine retires from life as a working dog. After retirement, the canine lives at home with the handler full time. 2. Canines train every day to keep their skills fresh As with anything, practice makes perfect. Canines have a big job in keeping us safe and the Port of Seattle Police Department takes that very seriously. The current group of canines bring a wide range of experience to the Port, from just a few months to over seven years of experience. Regardless of experience level, all canines train to maintain and improve their skills. What does canine training look like? Handlers and canines train throughout the airport and seaport to ensure that sniffing out a threat is second nature. They practice on and around aircraft, in warehouses, waterfront cargo, vehicles, and through open fields to keep them efficient and effective. Eight of the Port’s canine teams were trained at the Transportation Security Administration canine training center at Lackland Air Force Base. There, dogs are trained to sniff stationary objects for explosives. The Port’s other three canine teams are Air-Scent-trained, which means they detect odors on a moving target, they search whatever moves. POSPD is the first law enforcement agency in the state to have certified working Air-scent teams. Three more Air-scent teams are slotted to join the force. Also, just like many of us work for a paycheck, canines work for a reward. Canine handlers figure out what makes their pup happy, like playing with a toy or receiving attention, and every time the dog is successful in tracking a scent, they are rewarded. The POSPD decoy program allows Air-scent-trained dogs to practice on volunteers who walk through the airport carrying luggage. 3. Dogs’ sense of smell is so sensitive that handlers must design training activities that continue to challenge the canines Dogs are smart enough to remember the unique scent of a volunteer long after their work as a decoy is over. To avoid this and to maintain the integrity of the training, volunteers must wait a month after volunteering before signing up again.
Port of Seattle 2020 Budget Appendices
Filename: _appendix.doc Updated: 10/18/2019 XIII-24
Once a bag or piece of luggage is used as part of a decoy training, POSPD must destroy the bag because the dog will always be able to track the scent of explosives long after it is used as a decoy. Because a piece of luggage can only be used once in the training, the department goes through around 100 bags a year. Having a supply of bags to train with is important. A local luggage manufacturer in Kent donates luggage with minor defects to train the police dogs. 4. Despite being a relatively small police agency, Port of Seattle canines travel far and wide to ensure public safety Canines work in and around the Port of Seattle facilities and assist both regional police agencies and federal partners. They have traveled to California and Georgia to assist with national football championships and have gone to Washington D.C. for the Presidential inauguration. They also attend children’s events such as Make-A-Wish®, the American Airlines Snowball Express, the Delta Airlines North Pole Fantasy Flight, and Chief for a Day. Like the other officers in the department, canines work hard to keep us safe and serve as community ambassadors. 5. Becoming a canine handler is a competitive process POSPD officers interested in being a canine handler go through a competitive process to be paired with a canine. They are selected from a pool of many qualified applicants, but notable qualities include a love of dogs, being a team player, and accepting criticism well. Because canines and handlers spend so much time together, handlers are matched with canines with similar personalities, and a compatible home life and energy level.
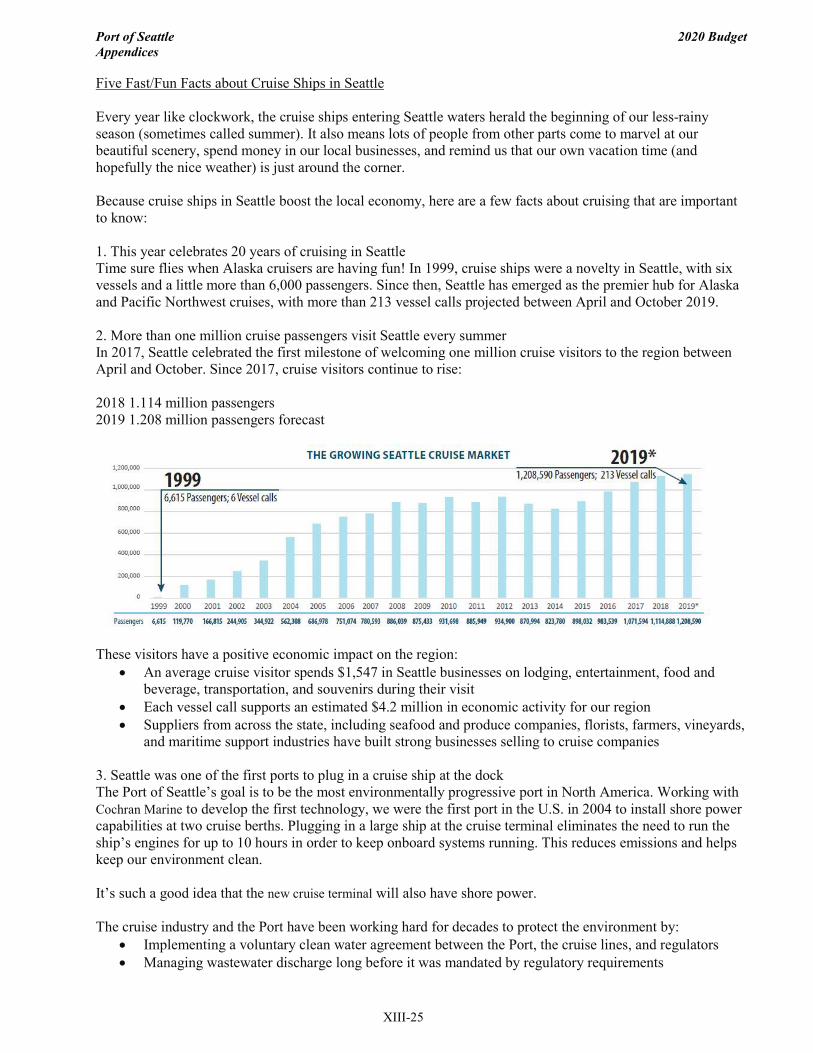
Port of Seattle 2020 Budget Appendices
Filename: _appendix.doc Updated: 10/18/2019 XIII-25
Five Fast/Fun Facts about Cruise Ships in Seattle Every year like clockwork, the cruise ships entering Seattle waters herald the beginning of our less-rainy season (sometimes called summer). It also means lots of people from other parts come to marvel at our beautiful scenery, spend money in our local businesses, and remind us that our own vacation time (and hopefully the nice weather) is just around the corner. Because cruise ships in Seattle boost the local economy, here are a few facts about cruising that are important to know: 1. This year celebrates 20 years of cruising in Seattle Time sure flies when Alaska cruisers are having fun! In 1999, cruise ships were a novelty in Seattle, with six vessels and a little more than 6,000 passengers. Since then, Seattle has emerged as the premier hub for Alaska and Pacific Northwest cruises, with more than 213 vessel calls projected between April and October 2019. 2. More than one million cruise passengers visit Seattle every summer In 2017, Seattle celebrated the first milestone of welcoming one million cruise visitors to the region between April and October. Since 2017, cruise visitors continue to rise: 2018 1.114 million passengers 2019 1.208 million passengers forecast
These visitors have a positive economic impact on the region:
• An average cruise visitor spends $1,547 in Seattle businesses on lodging, entertainment, food and beverage, transportation, and souvenirs during their visit
• Each vessel call supports an estimated $4.2 million in economic activity for our region • Suppliers from across the state, including seafood and produce companies, florists, farmers, vineyards,
and maritime support industries have built strong businesses selling to cruise companies 3. Seattle was one of the first ports to plug in a cruise ship at the dock The Port of Seattle’s goal is to be the most environmentally progressive port in North America. Working with Cochran Marine to develop the first technology, we were the first port in the U.S. in 2004 to install shore power capabilities at two cruise berths. Plugging in a large ship at the cruise terminal eliminates the need to run the ship’s engines for up to 10 hours in order to keep onboard systems running. This reduces emissions and helps keep our environment clean. It’s such a good idea that the new cruise terminal will also have shore power. The cruise industry and the Port have been working hard for decades to protect the environment by:
• Implementing a voluntary clean water agreement between the Port, the cruise lines, and regulators • Managing wastewater discharge long before it was mandated by regulatory requirements

Port of Seattle 2020 Budget Appendices
Filename: _appendix.doc Updated: 10/18/2019 XIII-26
• Decreasing emissions from ocean going vessels, including cruise ships entering Puget Sound, by more than 67 percent over the last 10 years
• Executing rigorous solid waste handling and recycling programs that support our environmental values here in Washington
• Creating storm water best management practices for cruise vessel maintenance and operations while at-berth
4. The largest passenger ship to travel through the Panama Canal calls Seattle home Just last May 14, 2018, the newly-commissioned Norwegian Bliss, (20 decks; 2,200 cabins; 4,000 passengers) made its maiden voyage from Germany to arrive in Seattle, its new home port. It’s the ninth-largest cruise ship ever built and made the Panama Canal transit just two years after it was expanded to accommodate larger ships. Seattle’s natural deep water harbor can accommodate these ships. 5. Provisioning a cruise ship is no small potatoes In fact, it’s a lot of potatoes (and many other fresh foods) that are purchased from local suppliers. For example, one ship carrying 3,080 passengers would need the following fresh provisions (and more) to feed passengers on a one week cruise:
• 11,460 pounds of seafood • 91,000 pounds of fresh fruits and vegetables • 69,000 local eggs
Local suppliers keep cruise ships provisioned when they are in Seattle and support other businesses that supply products to the cruise lines. In fact, one local bakery uses 40,000 pounds of butter every three weeks to make enough croissants to supply the cruise ships.
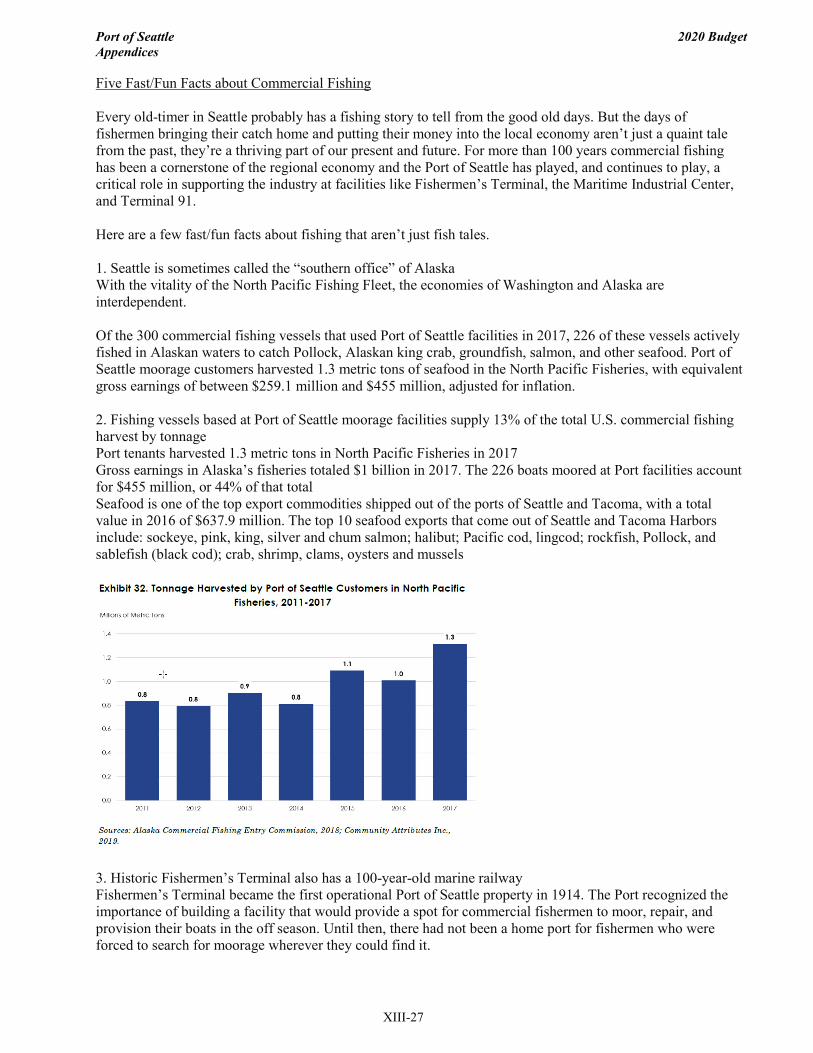
Port of Seattle 2020 Budget Appendices
Filename: _appendix.doc Updated: 10/18/2019 XIII-27
Five Fast/Fun Facts about Commercial Fishing Every old-timer in Seattle probably has a fishing story to tell from the good old days. But the days of fishermen bringing their catch home and putting their money into the local economy aren’t just a quaint tale from the past, they’re a thriving part of our present and future. For more than 100 years commercial fishing has been a cornerstone of the regional economy and the Port of Seattle has played, and continues to play, a critical role in supporting the industry at facilities like Fishermen’s Terminal, the Maritime Industrial Center, and Terminal 91. Here are a few fast/fun facts about fishing that aren’t just fish tales. 1. Seattle is sometimes called the “southern office” of Alaska With the vitality of the North Pacific Fishing Fleet, the economies of Washington and Alaska are interdependent. Of the 300 commercial fishing vessels that used Port of Seattle facilities in 2017, 226 of these vessels actively fished in Alaskan waters to catch Pollock, Alaskan king crab, groundfish, salmon, and other seafood. Port of Seattle moorage customers harvested 1.3 metric tons of seafood in the North Pacific Fisheries, with equivalent gross earnings of between $259.1 million and $455 million, adjusted for inflation. 2. Fishing vessels based at Port of Seattle moorage facilities supply 13% of the total U.S. commercial fishing harvest by tonnage Port tenants harvested 1.3 metric tons in North Pacific Fisheries in 2017 Gross earnings in Alaska’s fisheries totaled $1 billion in 2017. The 226 boats moored at Port facilities account for $455 million, or 44% of that total Seafood is one of the top export commodities shipped out of the ports of Seattle and Tacoma, with a total value in 2016 of $637.9 million. The top 10 seafood exports that come out of Seattle and Tacoma Harbors include: sockeye, pink, king, silver and chum salmon; halibut; Pacific cod, lingcod; rockfish, Pollock, and sablefish (black cod); crab, shrimp, clams, oysters and mussels
3. Historic Fishermen’s Terminal also has a 100-year-old marine railway Fishermen’s Terminal became the first operational Port of Seattle property in 1914. The Port recognized the importance of building a facility that would provide a spot for commercial fishermen to moor, repair, and provision their boats in the off season. Until then, there had not been a home port for fishermen who were forced to search for moorage wherever they could find it.
Port of Seattle 2020 Budget Appendices
Filename: _appendix.doc Updated: 10/18/2019 XIII-28
In 1919, a marine way was installed at Fishermen’s Terminal. A marine way is like a train track that runs from below the waterline onto land. A boat can be floated into a cradle on the rail tracks and pulled onshore with a winch for hull repairs and maintenance. Fast forward to 2019 and commercial fishing is a thriving, technology-driven, modern business that literally feeds the regional economy. And as a historic building and still the epicenter of the region’s fishing industry, it’s time for several facility updates that will improve long-term financial stability by developing new light industrial space and creating new jobs. 4. Commercial fishing is big business Fishing vessels that moored at Port of Seattle facilities operating in the Alaskan fisheries generated gross earnings of more $455 million in 2017. Maritime support services like vessel maintenance and repair, processing, and cold storage located on Port properties also generate additional revenues. Factoring in all segments of commercial fishing at the Port of Seattle, these activities generated more than $671.2 million in business output in 2017. 5. The average age of a maritime worker in Washington State is 54 years old That means that trained and skilled workforce in commercial fishing and related industries are needed now as the “silver tsunami” of workers begins to retire. In 2017, commercial fishing activities on Port of Seattle properties generated 7,200 jobs with a payroll of $313.4 million. One of the Port of Seattle’s top priorities is training maritime workers of the future. In April 2019, the Port established the Workforce Development Special Committee, chaired by Commissioners Stephanie Bowman and Ryan Calkins. The committee will review the Port’s Century Agenda strategy around workforce development and update the Port’s workforce development policy and the five-year strategic plan. The committee will also provide recommendations for the development of a feasibility study around a maritime high school and related business plan.
Port of Seattle 2020 Budget Appendices
Filename: _appendix.doc Updated: 10/18/2019 XIII-29
Five Fast/Fun Facts about Wildlife at Sea-Tac Airport Like most airports, Sea-Tac has large tracts of open, improved land that provide an added buffer for both safety and noise mitigation … and an appealing home for animals. Wildlife and airplanes are a less than optimal combination, so Sea-Tac has a few strategies for keeping them separate and safe. A coyote deterrent fence around the perimeter of the airfield keeps most larger animals out, but birds are a bigger challenge as they can fly over the fence and get access to the airfield. It may come as a surprise that the airport has a robust wildlife management program that plays a vital role in keeping passengers, facilities, employees, and wildlife safe. Here are five things you may not have known about Sea-Tac’s wildlife program. 1. Sea-Tac has a full-time wildlife biologist on staff In 1976, Sea-Tac was the first U.S. airport to employ a full-time biologist and to develop an ecological approach to maintaining aviation safety and protecting wildlife. It’s now become common for larger airports to have biologists on staff. Sea-Tac has the oldest wildlife program in the country — celebrating our 40-year anniversary in 2016 — that keeps both animals and people safe by reducing the chance that the two never meet on the runway or in the air. 2. Sea-Tac is a world leader when it comes to using technology to avoid bird strikes Another first for Sea-Tac Airport in August 2007, when we became the first airport in the world to use avian radar in a long-term monitoring effort to detect potentially hazardous bird activity on and near an airport. The radar acts like a powerful pair of eyes that see much farther and higher than human observers, who are limited to viewing only during daylight hours. 3. Sea-Tac Airport traps and relocates birds of prey to keep them off the airfield Through the Raptor Strike Avoidance Program, biologists trap birds of prey on the Sea-Tac airfield and safely relocate them to Skagit County. The program moves 100 birds a year and helps avoid bird strikes, which can be dangerous for aircraft, passengers, and birds. Red-tailed hawks are one of the largest species near the airport and we spend more time monitoring their hunting and breeding behavior than any other species at Sea-Tac. In addition to relocation, staff also use a variety of (sanctioned) methods to ensure that birds don’t get too comfortable near the airfield: starter’s pistols, shooting firecrackers, and sounding an air horn. 4. Sea-Tac’s wildlife program also includes tracking down our furry friends Occasionally, pets may wander onto airport property or become separated from owners in the terminal, and biologists work hard to return these pets to their worried owners. Dogs have escaped from faulty kennels on nearby Air Cargo Road and made their way through the coyote deterrent fence. Cats have slipped away from their owners and had to be retrieved from the terminal ceiling. A snare pole is an essential part of any airport wildlife biologist’s toolkit to help reunite these animals safely with their families. 5. There are bee hives at Sea-Tac Airport Airports are abuzz with airplane takeoffs and landings and people rushing to make their way to their destination. Amidst that activity, Sea-Tac Airport is also home to a large colony of honey bees, an efficient and sustainable ecosystem that benefits the environment. As many as 36 bee hives filled with thriving honeybees are located in three different apiaries around the airfield. The hives have been in place at Sea-Tac since 2013, when the Port of Seattle joined forces with local nonprofit The Common Acre to establish Flight Path, a project that has turned the unused green spaces on the south end of Sea-Tac into a native pollinator habitat — and in the process, produced a breed of bees better suited for survival in the coming years.
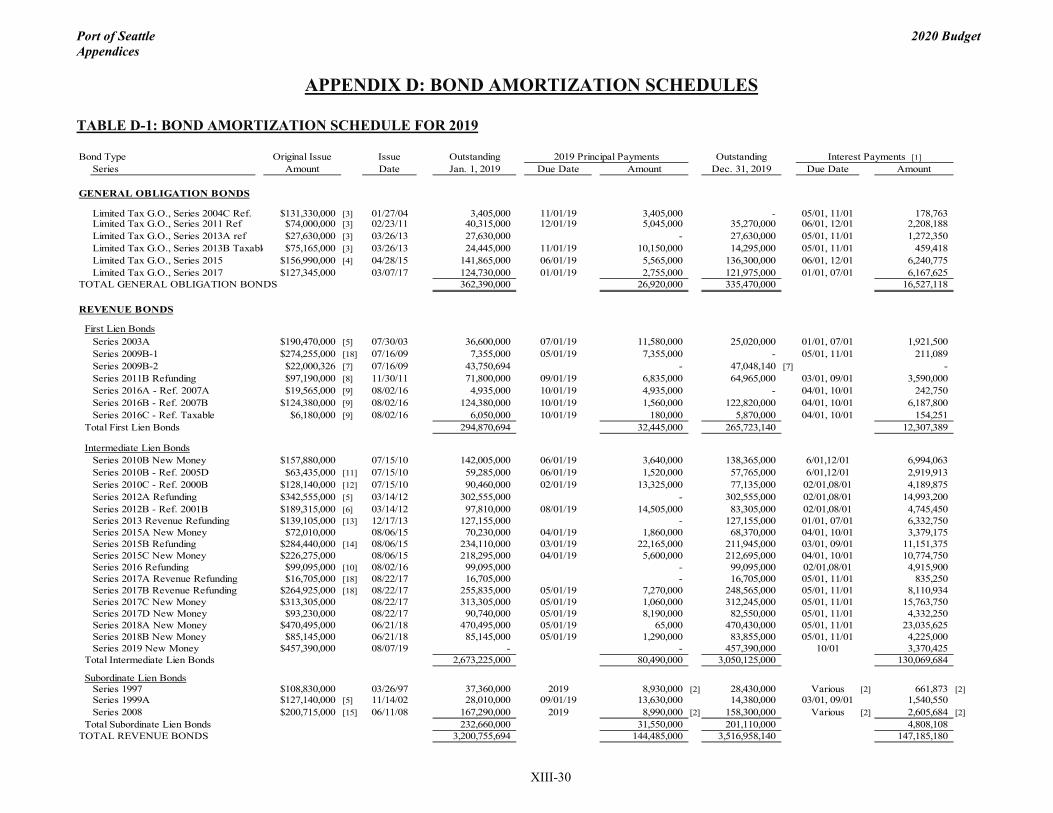
Port of Seattle 2020 Budget Appendices
Filename: _appendix.doc Updated:XIII-30
APPENDIX D: BOND AMORTIZATION SCHEDULES
TABLE D-1: BOND AMORTIZATION SCHEDULE FOR 2019
Bond Type Original Issue Issue Outstanding OutstandingSeries Amount Date Jan. 1, 2019 Due Date Amount Dec. 31, 2019 Due Date Amount
GENERAL OBLIGATION BONDS
Limited Tax G.O., Series 2004C Ref. $131,330,000 [3] 01/27/04 3,405,000 11/01/19 3,405,000 - 05/01, 11/01 178,763 Limited Tax G.O., Series 2011 Ref $74,000,000 [3] 02/23/11 40,315,000 12/01/19 5,045,000 35,270,000 06/01, 12/01 2,208,188 Limited Tax G.O., Series 2013A ref $27,630,000 [3] 03/26/13 27,630,000 - 27,630,000 05/01, 11/01 1,272,350 Limited Tax G.O., Series 2013B Taxable $75,165,000 [3] 03/26/13 24,445,000 11/01/19 10,150,000 14,295,000 05/01, 11/01 459,418 Limited Tax G.O., Series 2015 $156,990,000 [4] 04/28/15 141,865,000 06/01/19 5,565,000 136,300,000 06/01, 12/01 6,240,775 Limited Tax G.O., Series 2017 $127,345,000 03/07/17 124,730,000 01/01/19 2,755,000 121,975,000 01/01, 07/01 6,167,625
TOTAL GENERAL OBLIGATION BONDS 362,390,000 26,920,000 335,470,000 16,527,118
REVENUE BONDS
First Lien BondsSeries 2003A $190,470,000 [5] 07/30/03 36,600,000 07/01/19 11,580,000 25,020,000 01/01, 07/01 1,921,500 Series 2009B-1 $274,255,000 [18] 07/16/09 7,355,000 05/01/19 7,355,000 - 05/01, 11/01 211,089 Series 2009B-2 $22,000,326 [7] 07/16/09 43,750,694 - 47,048,140 [7] - Series 2011B Refunding $97,190,000 [8] 11/30/11 71,800,000 09/01/19 6,835,000 64,965,000 03/01, 09/01 3,590,000 Series 2016A - Ref. 2007A $19,565,000 [9] 08/02/16 4,935,000 10/01/19 4,935,000 - 04/01, 10/01 242,750 Series 2016B - Ref. 2007B $124,380,000 [9] 08/02/16 124,380,000 10/01/19 1,560,000 122,820,000 04/01, 10/01 6,187,800 Series 2016C - Ref. Taxable $6,180,000 [9] 08/02/16 6,050,000 10/01/19 180,000 5,870,000 04/01, 10/01 154,251
Total First Lien Bonds 294,870,694 32,445,000 265,723,140 12,307,389
Intermediate Lien BondsSeries 2010B New Money $157,880,000 07/15/10 142,005,000 06/01/19 3,640,000 138,365,000 6/01,12/01 6,994,063 Series 2010B - Ref. 2005D $63,435,000 [11] 07/15/10 59,285,000 06/01/19 1,520,000 57,765,000 6/01,12/01 2,919,913 Series 2010C - Ref. 2000B $128,140,000 [12] 07/15/10 90,460,000 02/01/19 13,325,000 77,135,000 02/01,08/01 4,189,875 Series 2012A Refunding $342,555,000 [5] 03/14/12 302,555,000 - 302,555,000 02/01,08/01 14,993,200 Series 2012B - Ref. 2001B $189,315,000 [6] 03/14/12 97,810,000 08/01/19 14,505,000 83,305,000 02/01,08/01 4,745,450 Series 2013 Revenue Refunding $139,105,000 [13] 12/17/13 127,155,000 - 127,155,000 01/01, 07/01 6,332,750 Series 2015A New Money $72,010,000 08/06/15 70,230,000 04/01/19 1,860,000 68,370,000 04/01, 10/01 3,379,175 Series 2015B Refunding $284,440,000 [14] 08/06/15 234,110,000 03/01/19 22,165,000 211,945,000 03/01, 09/01 11,151,375 Series 2015C New Money $226,275,000 08/06/15 218,295,000 04/01/19 5,600,000 212,695,000 04/01, 10/01 10,774,750 Series 2016 Refunding $99,095,000 [10] 08/02/16 99,095,000 - 99,095,000 02/01,08/01 4,915,900 Series 2017A Revenue Refunding $16,705,000 [18] 08/22/17 16,705,000 - 16,705,000 05/01, 11/01 835,250 Series 2017B Revenue Refunding $264,925,000 [18] 08/22/17 255,835,000 05/01/19 7,270,000 248,565,000 05/01, 11/01 8,110,934 Series 2017C New Money $313,305,000 08/22/17 313,305,000 05/01/19 1,060,000 312,245,000 05/01, 11/01 15,763,750 Series 2017D New Money $93,230,000 08/22/17 90,740,000 05/01/19 8,190,000 82,550,000 05/01, 11/01 4,332,250 Series 2018A New Money $470,495,000 06/21/18 470,495,000 05/01/19 65,000 470,430,000 05/01, 11/01 23,035,625 Series 2018B New Money $85,145,000 06/21/18 85,145,000 05/01/19 1,290,000 83,855,000 05/01, 11/01 4,225,000 Series 2019 New Money $457,390,000 08/07/19 - - 457,390,000 10/01 3,370,425
Total Intermediate Lien Bonds 2,673,225,000 80,490,000 3,050,125,000 130,069,684
Subordinate Lien BondsSeries 1997 $108,830,000 03/26/97 37,360,000 2019 8,930,000 [2] 28,430,000 Various [2] 661,873 [2]Series 1999A $127,140,000 [5] 11/14/02 28,010,000 09/01/19 13,630,000 14,380,000 03/01, 09/01 1,540,550 Series 2008 $200,715,000 [15] 06/11/08 167,290,000 2019 8,990,000 [2] 158,300,000 Various [2] 2,605,684 [2]
Total Subordinate Lien Bonds 232,660,000 31,550,000 201,110,000 4,808,108 TOTAL REVENUE BONDS 3,200,755,694 144,485,000 3,516,958,140 147,185,180
2019 Principal Payments Interest Payments [1]

Port of Seattle 2020 Budget Appendices
Filename: _appendix.doc Updated:XIII-31
SPECIAL REVENUE BONDS
PFC Rev. Bonds Series 1998A $118,490,000 [16] 07/16/98 15,925,000 12/01/19 15,925,000 - 06/01, 12/01 875,875 PFC Ref. Bonds Series 2010A $79,770,000 [16] 12/01/10 66,550,000 12/01/19 - 66,550,000 06/01, 12/01 3,327,500
TOTAL SPECIAL REVENUE BONDS 82,475,000 15,925,000 66,550,000 4,203,375
SPECIAL FACILITY REVENUE BONDS
Fuel Facilities Series 2013 ref $88,660,000 [17] 06/13/13 72,645,000 06/01/19 3,665,000 68,980,000 06/01, 12/01 3,267,008 TOTAL SPECIAL FACILITY REVENUE BONDS 72,645,000 3,665,000 68,980,000 3,267,008
Notes:[1] - Interest Payments shown in this schedule are gross amounts before use of any Capitalized Interest.[2] - Estimated annual total. Interest paid monthly. Principal paid annually or at maturity.[3] - Series 2013AB G.O. bonds fully refunded the Series 2004A G.O. bonds and partially refunded the Series 2004B G.O. bonds, the Series 2004C G.O. bonds and the Series 2011 G.O bonds on 3/26/2013. The
Series 2004C G.O. Ref. bonds refunded a portion of the Port's 1994B Revenue bonds and a portion of the 1994 G.O. bonds. The Series 2011 G.O. bonds refunded the outstanding 2000B G.O. Bonds.[4] - Series 2015 G.O. fully refunded the outstanding Series 2006 G.O. Ref. Bonds. The Series 2006 G.O bonds refunded a portion of the Port's 1999A Special Facility bonds and a portion of the 2000A G.O. bond [5] - Series 2012A Intermediate lien bonds fully refunded the Series 2001A First Lien Revenue bonds and partially refunded the Series 1999A Sub Lien bonds and 2003A First Lien bonds.[6] - Series 2012B Intermediate Lien bonds refunded a portion of the Series 2001B First Lien bonds and fully refunded the Series 2001C First Lien bonds. [7] - Series 2009B-2 First Lien Capital Appreciation Bonds were issued at $22,000,326 par. The outstanding principal balance at 12/31/2019 includes $25,047,814 of accumulated accreted interest.[8] - Series 2011AB First Lien bonds fully refunded the 1999B and 1999C Special Facility bonds and the 1998 Subordinate Lien series bonds.[9] - Series 2016 ABC First Lien bonds refunded a portion of the outstanding Series 2007A First Lien bonds and all of the Series 2007B First Lien bonds.[10] - Series 2016 Int Lien Refunding bonds refunded the outstanding Series 2006A bonds. The Series 2006A Intermediate Lien bonds refunded the outstanding 2000A First Lien series bonds. [11] - Series 2010B-Ref. 2005D Intermediate Lien bonds fully refunded the 2005D Subordinate Lien series bonds. [12] - Series 2010C Intermediate lien bonds refunded a portion of the Port's 2000B First Lien Bonds.[13] - Series 2013 Revenue Refunding Intermediate Lien bonds refunded the outstanding 2003B First Lien series bonds.[14] - Series 2015B Intermediate Lien bonds refunded the outstanding Series 2005A Intermediate Lien bonds. The Series 2005A Intermediate Lien bonds refunded a portion of the Port's 1996A First Lien bonds and
a portion of the Port's 1997A First Lien bonds.[15] - Series 2008 Subordinate Lien bonds refunded the 2003C Subordinate Lien bonds. [16] - Series 2010A PFC Ref. bonds refunded a portion of the 1998A PFC series bonds. Debt service for PFC Ref. bonds will be paid directly out of receipts from PFCs, not out of operating cash flows.[17] - Series 2013 Special Facility Fuel Hydrant bonds fully refunded the 2003 Special Facility Fuel Hydrant bonds. Debt service for Fuel Facilities is paid directly from Fuel Hydrant Facility income, not out of
operating cash flows.[18] - Series 2017A Int. Lien Revenue Refunding bonds fully refunded the Series 2009A First Lien Revenue Bonds. The 2017B bonds refunded a portion of the 2009B-1 First Lien Revenue bonds.The Port has authority to issue up to $250 million in Commercial Paper, as of 10/31/2019 the Port had $67.655 million outstanding. bondam.xls
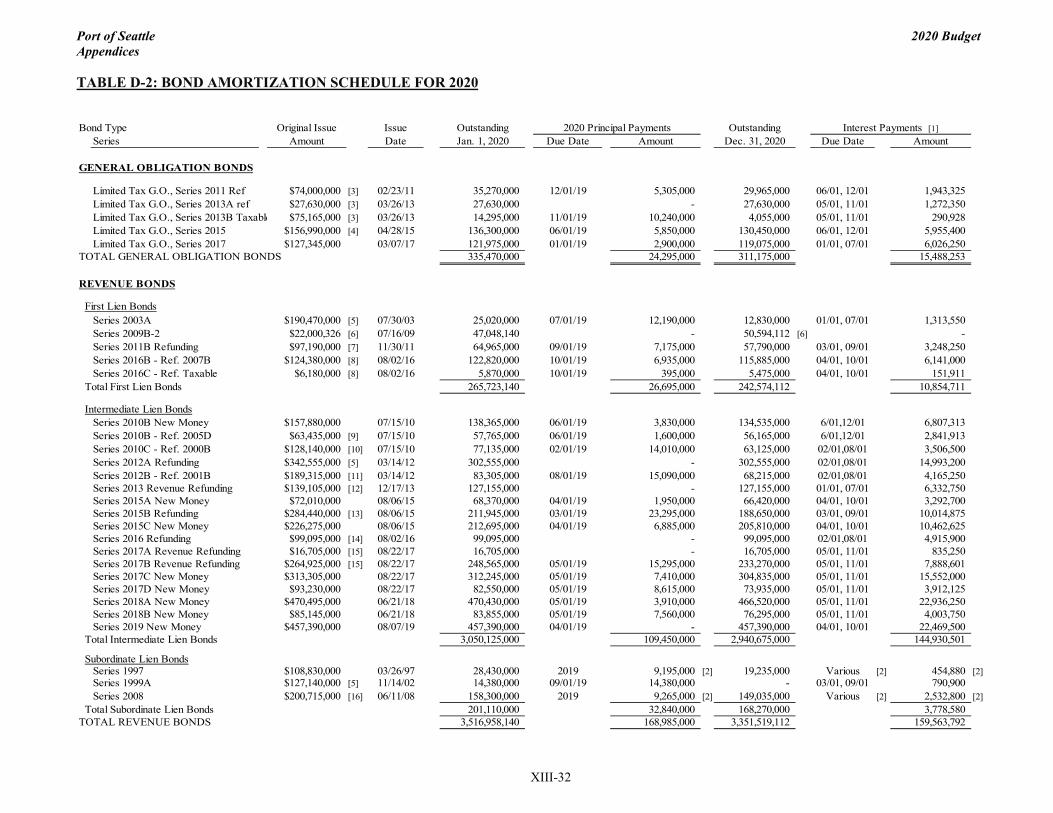
Port of Seattle 2020 Budget Appendices
Filename: _appendix.doc Updated:XIII-32
TABLE D-2: BOND AMORTIZATION SCHEDULE FOR 2020
Bond Type Original Issue Issue Outstanding OutstandingSeries Amount Date Jan. 1, 2020 Due Date Amount Dec. 31, 2020 Due Date Amount
GENERAL OBLIGATION BONDS
Limited Tax G.O., Series 2011 Ref $74,000,000 [3] 02/23/11 35,270,000 12/01/19 5,305,000 29,965,000 06/01, 12/01 1,943,325 Limited Tax G.O., Series 2013A ref $27,630,000 [3] 03/26/13 27,630,000 - 27,630,000 05/01, 11/01 1,272,350 Limited Tax G.O., Series 2013B Taxable $75,165,000 [3] 03/26/13 14,295,000 11/01/19 10,240,000 4,055,000 05/01, 11/01 290,928 Limited Tax G.O., Series 2015 $156,990,000 [4] 04/28/15 136,300,000 06/01/19 5,850,000 130,450,000 06/01, 12/01 5,955,400 Limited Tax G.O., Series 2017 $127,345,000 03/07/17 121,975,000 01/01/19 2,900,000 119,075,000 01/01, 07/01 6,026,250
TOTAL GENERAL OBLIGATION BONDS 335,470,000 24,295,000 311,175,000 15,488,253
REVENUE BONDS
First Lien BondsSeries 2003A $190,470,000 [5] 07/30/03 25,020,000 07/01/19 12,190,000 12,830,000 01/01, 07/01 1,313,550 Series 2009B-2 $22,000,326 [6] 07/16/09 47,048,140 - 50,594,112 [6] - Series 2011B Refunding $97,190,000 [7] 11/30/11 64,965,000 09/01/19 7,175,000 57,790,000 03/01, 09/01 3,248,250 Series 2016B - Ref. 2007B $124,380,000 [8] 08/02/16 122,820,000 10/01/19 6,935,000 115,885,000 04/01, 10/01 6,141,000 Series 2016C - Ref. Taxable $6,180,000 [8] 08/02/16 5,870,000 10/01/19 395,000 5,475,000 04/01, 10/01 151,911
Total First Lien Bonds 265,723,140 26,695,000 242,574,112 10,854,711
Intermediate Lien BondsSeries 2010B New Money $157,880,000 07/15/10 138,365,000 06/01/19 3,830,000 134,535,000 6/01,12/01 6,807,313 Series 2010B - Ref. 2005D $63,435,000 [9] 07/15/10 57,765,000 06/01/19 1,600,000 56,165,000 6/01,12/01 2,841,913 Series 2010C - Ref. 2000B $128,140,000 [10] 07/15/10 77,135,000 02/01/19 14,010,000 63,125,000 02/01,08/01 3,506,500 Series 2012A Refunding $342,555,000 [5] 03/14/12 302,555,000 - 302,555,000 02/01,08/01 14,993,200 Series 2012B - Ref. 2001B $189,315,000 [11] 03/14/12 83,305,000 08/01/19 15,090,000 68,215,000 02/01,08/01 4,165,250 Series 2013 Revenue Refunding $139,105,000 [12] 12/17/13 127,155,000 - 127,155,000 01/01, 07/01 6,332,750 Series 2015A New Money $72,010,000 08/06/15 68,370,000 04/01/19 1,950,000 66,420,000 04/01, 10/01 3,292,700 Series 2015B Refunding $284,440,000 [13] 08/06/15 211,945,000 03/01/19 23,295,000 188,650,000 03/01, 09/01 10,014,875 Series 2015C New Money $226,275,000 08/06/15 212,695,000 04/01/19 6,885,000 205,810,000 04/01, 10/01 10,462,625 Series 2016 Refunding $99,095,000 [14] 08/02/16 99,095,000 - 99,095,000 02/01,08/01 4,915,900 Series 2017A Revenue Refunding $16,705,000 [15] 08/22/17 16,705,000 - 16,705,000 05/01, 11/01 835,250 Series 2017B Revenue Refunding $264,925,000 [15] 08/22/17 248,565,000 05/01/19 15,295,000 233,270,000 05/01, 11/01 7,888,601 Series 2017C New Money $313,305,000 08/22/17 312,245,000 05/01/19 7,410,000 304,835,000 05/01, 11/01 15,552,000 Series 2017D New Money $93,230,000 08/22/17 82,550,000 05/01/19 8,615,000 73,935,000 05/01, 11/01 3,912,125 Series 2018A New Money $470,495,000 06/21/18 470,430,000 05/01/19 3,910,000 466,520,000 05/01, 11/01 22,936,250 Series 2018B New Money $85,145,000 06/21/18 83,855,000 05/01/19 7,560,000 76,295,000 05/01, 11/01 4,003,750 Series 2019 New Money $457,390,000 08/07/19 457,390,000 04/01/19 - 457,390,000 04/01, 10/01 22,469,500
Total Intermediate Lien Bonds 3,050,125,000 109,450,000 2,940,675,000 144,930,501
Subordinate Lien BondsSeries 1997 $108,830,000 03/26/97 28,430,000 2019 9,195,000 [2] 19,235,000 Various [2] 454,880 [2]Series 1999A $127,140,000 [5] 11/14/02 14,380,000 09/01/19 14,380,000 - 03/01, 09/01 790,900 Series 2008 $200,715,000 [16] 06/11/08 158,300,000 2019 9,265,000 [2] 149,035,000 Various [2] 2,532,800 [2]
Total Subordinate Lien Bonds 201,110,000 32,840,000 168,270,000 3,778,580 TOTAL REVENUE BONDS 3,516,958,140 168,985,000 3,351,519,112 159,563,792
2020 Principal Payments Interest Payments [1]
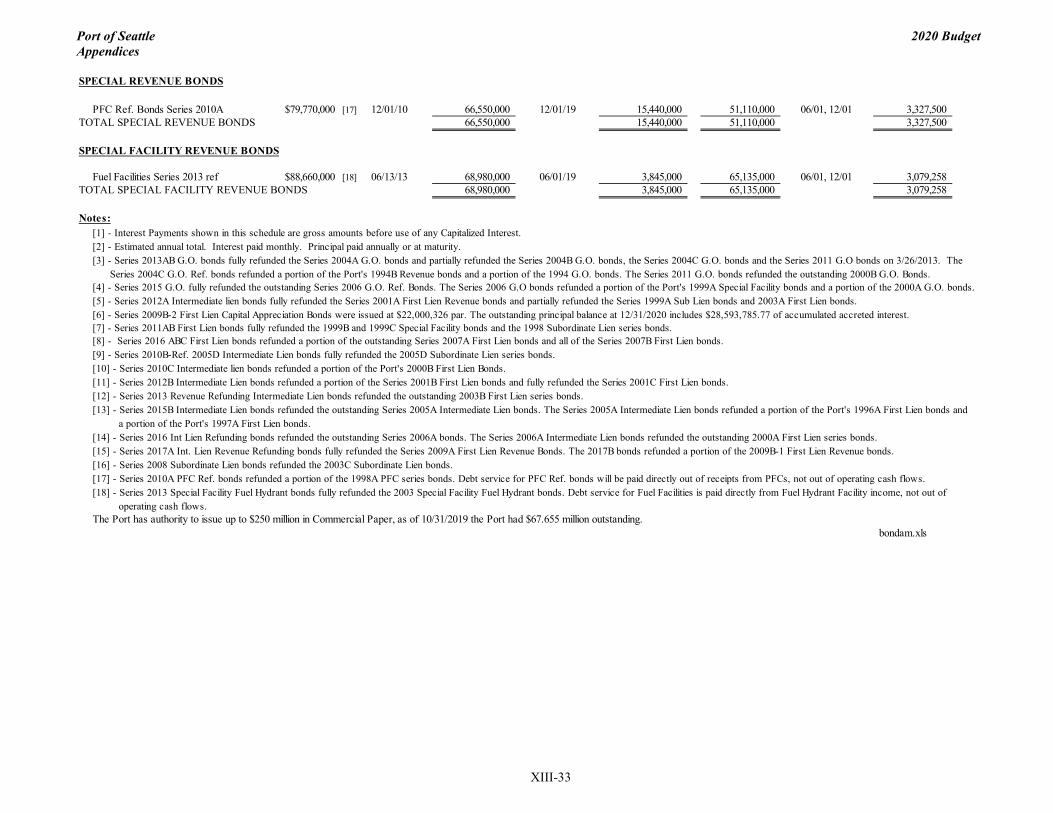
Port of Seattle 2020 Budget Appendices
Filename: _appendix.doc Updated:XIII-33
SPECIAL REVENUE BONDS
PFC Ref. Bonds Series 2010A $79,770,000 [17] 12/01/10 66,550,000 12/01/19 15,440,000 51,110,000 06/01, 12/01 3,327,500 TOTAL SPECIAL REVENUE BONDS 66,550,000 15,440,000 51,110,000 3,327,500
SPECIAL FACILITY REVENUE BONDS
Fuel Facilities Series 2013 ref $88,660,000 [18] 06/13/13 68,980,000 06/01/19 3,845,000 65,135,000 06/01, 12/01 3,079,258 TOTAL SPECIAL FACILITY REVENUE BONDS 68,980,000 3,845,000 65,135,000 3,079,258
Notes:[1] - Interest Payments shown in this schedule are gross amounts before use of any Capitalized Interest.[2] - Estimated annual total. Interest paid monthly. Principal paid annually or at maturity.[3] - Series 2013AB G.O. bonds fully refunded the Series 2004A G.O. bonds and partially refunded the Series 2004B G.O. bonds, the Series 2004C G.O. bonds and the Series 2011 G.O bonds on 3/26/2013. The
Series 2004C G.O. Ref. bonds refunded a portion of the Port's 1994B Revenue bonds and a portion of the 1994 G.O. bonds. The Series 2011 G.O. bonds refunded the outstanding 2000B G.O. Bonds.[4] - Series 2015 G.O. fully refunded the outstanding Series 2006 G.O. Ref. Bonds. The Series 2006 G.O bonds refunded a portion of the Port's 1999A Special Facility bonds and a portion of the 2000A G.O. bonds. [5] - Series 2012A Intermediate lien bonds fully refunded the Series 2001A First Lien Revenue bonds and partially refunded the Series 1999A Sub Lien bonds and 2003A First Lien bonds.[6] - Series 2009B-2 First Lien Capital Appreciation Bonds were issued at $22,000,326 par. The outstanding principal balance at 12/31/2020 includes $28,593,785.77 of accumulated accreted interest.[7] - Series 2011AB First Lien bonds fully refunded the 1999B and 1999C Special Facility bonds and the 1998 Subordinate Lien series bonds.[8] - Series 2016 ABC First Lien bonds refunded a portion of the outstanding Series 2007A First Lien bonds and all of the Series 2007B First Lien bonds.[9] - Series 2010B-Ref. 2005D Intermediate Lien bonds fully refunded the 2005D Subordinate Lien series bonds. [10] - Series 2010C Intermediate lien bonds refunded a portion of the Port's 2000B First Lien Bonds.[11] - Series 2012B Intermediate Lien bonds refunded a portion of the Series 2001B First Lien bonds and fully refunded the Series 2001C First Lien bonds. [12] - Series 2013 Revenue Refunding Intermediate Lien bonds refunded the outstanding 2003B First Lien series bonds.[13] - Series 2015B Intermediate Lien bonds refunded the outstanding Series 2005A Intermediate Lien bonds. The Series 2005A Intermediate Lien bonds refunded a portion of the Port's 1996A First Lien bonds and
a portion of the Port's 1997A First Lien bonds.[14] - Series 2016 Int Lien Refunding bonds refunded the outstanding Series 2006A bonds. The Series 2006A Intermediate Lien bonds refunded the outstanding 2000A First Lien series bonds. [15] - Series 2017A Int. Lien Revenue Refunding bonds fully refunded the Series 2009A First Lien Revenue Bonds. The 2017B bonds refunded a portion of the 2009B-1 First Lien Revenue bonds.[16] - Series 2008 Subordinate Lien bonds refunded the 2003C Subordinate Lien bonds. [17] - Series 2010A PFC Ref. bonds refunded a portion of the 1998A PFC series bonds. Debt service for PFC Ref. bonds will be paid directly out of receipts from PFCs, not out of operating cash flows.[18] - Series 2013 Special Facility Fuel Hydrant bonds fully refunded the 2003 Special Facility Fuel Hydrant bonds. Debt service for Fuel Facilities is paid directly from Fuel Hydrant Facility income, not out of
operating cash flows.The Port has authority to issue up to $250 million in Commercial Paper, as of 10/31/2019 the Port had $67.655 million outstanding.
bondam.xls
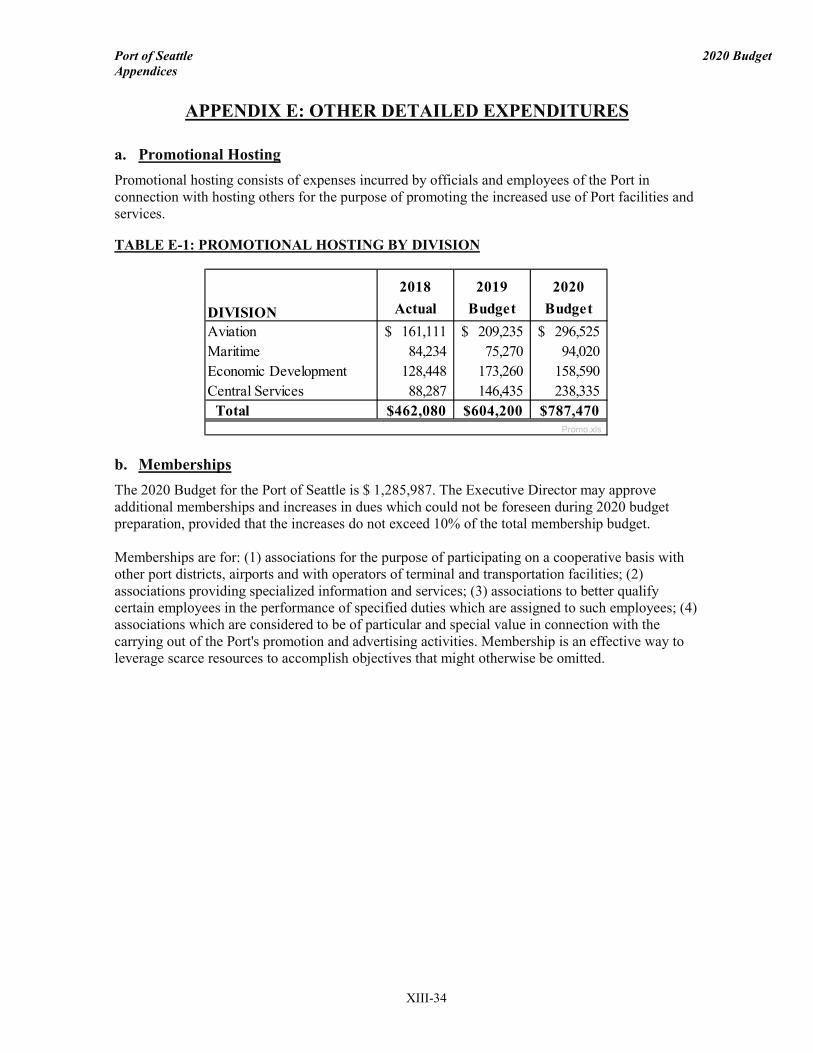
Port of Seattle 2020 Budget Appendices
Filename: _appendix.doc Updated:XIII-34
APPENDIX E: OTHER DETAILED EXPENDITURES
a. Promotional Hosting Promotional hosting consists of expenses incurred by officials and employees of the Port in connection with hosting others for the purpose of promoting the increased use of Port facilities and services. TABLE E-1: PROMOTIONAL HOSTING BY DIVISION
b. Memberships The 2020 Budget for the Port of Seattle is $ 1,285,987. The Executive Director may approve additional memberships and increases in dues which could not be foreseen during 2020 budget preparation, provided that the increases do not exceed 10% of the total membership budget. Memberships are for: (1) associations for the purpose of participating on a cooperative basis with other port districts, airports and with operators of terminal and transportation facilities; (2) associations providing specialized information and services; (3) associations to better qualify certain employees in the performance of specified duties which are assigned to such employees; (4) associations which are considered to be of particular and special value in connection with the carrying out of the Port's promotion and advertising activities. Membership is an effective way to leverage scarce resources to accomplish objectives that might otherwise be omitted.
2018 2019 2020
DIVISION Actual Budget BudgetAviation 161,111$ 209,235$ 296,525$ Maritime 84,234 75,270 94,020Economic Development 128,448 173,260 158,590Central Services 88,287 146,435 238,335 Total 462,080$ 604,200$ 787,470$
Promo.xls

Port of Seattle 2020 Budget Appendices
Filename: _appendix.doc Updated:XIII-35
APPENDIX F: GLOSSARY OF TERMS USED
Account: A record of an activity as revenue or expense, such as fees for services, rents, or as salaries, equipment, supplies, travel, etc.
Accrual: Represents an outstanding obligation for goods and services received or performed but for which payment has not been made.
Accrual Basis of Accounting: It is the basis of accounting under which revenue transactions are recognized when earned and expenses are recognized when incurred, regardless of the time the cash is received or disbursed, or the recording of revenue or expense in the absence of a cash transaction.
Actual: Earned revenue or incurred expense during the stated fiscal year.
Actions: The specific tactics, actions and projects an organization will undertake in an effort to meet the objectives. These statements should reflect how objectives will be achieved.
Ad Valorem Tax Levy: Ad valorem taxes received by the Port are utilized for the acquisition and construction of facilities, for the payment of principal and interest on GO bonds issued for the acquisition or construction of facilities, for contributions to regional freight mobility improvements, for environmental expenses, for certain operating expenses, and for public expenses. The Port includes ad valorem tax levy revenues and interest expense on GO bonds as non-operating income in the Statement of Revenues and Expenses.
Allocated Expense: These are costs allocated to business groups from service providers. Allocated costs are general support costs that cannot be directly attributed to a business unit, but instead support the entire Port and all its Business Groups. Costs can come from within the division (intra-division) or from outside the division (inter-division.)
Amortization: The gradual reduction in the book value of Fixed or Intangible Assets having a limited life by allocating the original cost over the life of the asset. (See Depreciation)
Appropriation: Authorization granted by a legislative body to make expenditures and to incur obligations for a specific use and contains specific limitations as to the amount, purpose, and time when it may be expended. Assessed Valuation: Is an official government valuation set upon real estate and personal property by the King County Assessor, as a basis for levying property taxes.
Audit: A formal examination of an organization accounts or financial situation. Balanced Budget: The Port prepares an annual budget and supports, encourages and commits to a balanced budget in which revenues exceed expenses. In so doing, the practice is to pay for all current operating expenses with current revenues and not postpone current year operating expenses to future years or accrue future year’s revenues to the current year. The Port policy further requires that budgeted operating expenses do not exceed budgeted revenues, and on-going expenses do not exceed on-going revenues.
Bonds: Is an interest bearing written instrument promising to pay a specified sum of money (the face value or principal amount) on a specified date (the maturity date) at a specified interest rate.
Port of Seattle 2020 Budget Appendices
Filename: _appendix.doc Updated:XIII-36
The interest payments and the repayment of the principal are detailed in a bond resolution or ordinance. Budget: A financial plan, forecast or projection of the Port’s revenues and expenses expected during the stated budget year.
Budget Calendar: A schedule of key dates that the Port follows in the preparation, review and adoption of its annual budget.
Budget Document: The Port’s official written approved budget in document format, prepared by the Port’s Finance and Budget teams.
Budget Message: A general discussion of the proposed budget presented in written format by the Executive Director of the Port to the Port Commission and Public.
Business & Occupation (B&O) Tax: It is a gross receipt tax levied on businesses. Washington State does not have a corporate or personal income tax. Washington’s B&O Tax is calculated on the gross income from activities.
Capital Improvement Plan and Draft Plan of Finance: A detailed five-year plan of proposed capital expenditures arising from the acquisition or improvement of the Port’s fixed assets and the means of financing them through bond proceeds, grants and operating revenues. This document serves as an operational and planning tool. The document identifies proposed capital projects at the airport and on the waterfront and prioritizes those projects.
Capital Capacity: An estimated calculation of the maximum amount available to spend on capital projects, given assumptions about future revenues and expenses and the ability to cover future interest payments per bond covenants and Port policies. See further discussion in the Draft Plan of Finance, section X.
Capital Expenditures: Expenditures that arise from the acquisition or improvement of the Port’s fixed assets such as construction of new facility or renovation of existing facility; renewal, replacement or upgrading of mechanical, electrical, communications, HVAC and plumbing systems; computer and office equipment; furniture and fixtures; vehicles, etc.
Capitalized Labor or Charges to Capital Projects: Includes the salaries and benefits costs associated with capital projects. These costs are subtracted out of the operating expense and then input into the capital budget as part of the cost of the project(s).
Cash Disbursements: Is the disbursement or payment of cash for cost incurred in the operation of the Port’s business.
Cash Flow: Illustrates the flow of funds over a period of time incorporating both the operating budget and the capital budget and determines the financial needs.
Cash Receipts: The collection of cash from services and from Port facilities and equipment leased or operated.
Chartfield: A field that contains information that defines a transaction in terms of account number, department code, subclass, fund or program.
Chart of Accounts: It is a long list (“index”) of account numbers and their descriptions.
Port of Seattle 2020 Budget Appendices
Filename: _appendix.doc Updated:XIII-37
Comprehensive Annual Financial Report (CAFR): This document, known as the CAFR, is produced by the Port of Seattle annually detailing financial, statistical, budgetary and demographic data and it is distributed to the public.
Contingency: A budgetary reserve set aside for emergencies or unforeseen expenditures not otherwise budgeted.
Continuous Process Improvement Program (CPI): CPI is the port’s official program to establish a continuous and enduring culture of improvement by utilizing a disciplined and time-tested improvement methodology called “LEAN.” A culture of CPI will expand and improve the Port’s capabilities, making the Port a stronger, more competitive organization. The CPI program focuses on four key elements:
• Organizational strategies, objectives, and metrics • Employee empowerment and engagement • Efficiency • Innovation
Cost Per Enplanement (CPE): Airline cost per enplanement reflects the overall cost to the airlines for each passenger enplaned. The CPE measures the total costs borne by the passenger airlines operating at the airport divided by the number of enplaned passengers (roughly half of the total passengers). CPE is a key indicator used by the airlines to measure the relative costs of airports.
Customer Facility Charges (CFC): As determined by applicable State legislation, customer facility charges generate revenue to be expended by the Port for eligible capital projects and the payment of principal and interest on specific revenue bonds.
Department/Org: An organizational unit within the Port which is part of a division.
Depreciation: This is a non-cash item that represents the use of long-term assets. Port assets are given a useful life of more than three years when they become active and each year some of that useful life is used up, worn or depreciated (See Amortization.)
Direct Charge: The ability to direct charged for services instead of allocating them, which is charging against another division’s/department’s subclass to represent where resources were used and dollars spent for the work that was actually done.
Draft Plan of Finance: The Five-year Capital Budget is the basis of the Plan of Finance. A funding plan for the Capital Budget that identifies the types and amounts of funding sources that are expected to be available in the five-year planning period, developed within the financial targets and forecasts described within the Draft Plan of Finance section. The Draft Plan of Finance is prepared and presented to the Port Commission concurrently with the Operating Budget. See further discussion in the Draft Plan of Finance section. Enterprise Fund: There are dozens of funds that are summarized into the Enterprise Fund. The Enterprise Fund accounts for all activities and operations of the Port. The Enterprise fund is connected to the functional units in that it is used to account for operations and activities that are financed at least in part by fees or charges to external users of Airport Facilities, Maritime and Economic Development properties. Therefore, the Port of Seattle summarizes all of its fund activities in the Enterprise Fund. This includes the Port's major business activities, which are comprised of three operating divisions (Aviation, Maritime, Economic Development), and Central Services.

Port of Seattle 2020 Budget Appendices
Filename: _appendix.doc Updated:XIII-38
Environmental Remediation Liability: The Port’s policy requires accrual of pollution remediation obligation amounts when (a) one of the following specific obligating events is met and (b) the amount can be reasonably estimated. Obligating events include: imminent endangerment to the public; permit violation; named as party responsible for sharing costs; named in a lawsuit to compel participation in pollution remediation; or commenced or legally obligated to commence pollution remediation. Potential cost recoveries such as insurance proceeds, if any, are evaluated separately from the Port’s pollution remediation obligation. Costs incurred for pollution remediation obligation are recorded as environmental expenses unless the expenditures meet specific criteria that allow them to be capitalized. Capitalization criteria include: preparation of property in anticipation of a sale; preparation of property for use if the property was acquired with known or suspected pollution that was expected to be remediated; performance of pollution remediation that restores a pollution-caused decline in service utility that was recognized as an asset impairment; or acquisition of property, plant, and equipment that have a future alternative use not associated with pollution remediation efforts.
Equity: The excess of assets over liabilities.
Estimates: Prediction of revenues and expenditures.
Fiscal Year: The Port’s annual accounting period for recording financial transactions begins January 1 and ends December 31, which is the same as the calendar year. It is also called the budget year.
Forecast: An estimate, projection or prediction of revenues and expenses.
Full Time Equivalent: Full Time Equivalent (FTE) employee, where “full-time” equals 100% of a full-time schedule. A full-time employee is represented as a “1.0 FTE” where 1.0 = 100% of a full-time schedule. FTEs represented by less than 1.0, such as 0.8, represent less than a full-time schedule. For example, “0.8 FTE” represents 80% of a full-time schedule.
Fund: The establishment of a fund is to account for money set aside for some specific purpose.
Generally Accepted Accounting Principles (GAAP): Standards and guidelines by which Accounting and Financial Reporting are governed.
General Obligation (G.O.) Bonds and Interest: The Port can borrow money which is intended to be paid back through its taxing authority. The tax levy (See Section VIII) funds the repayment of the principal and interest of these bonds. Port financial policies dictate that G.O. bonds be used for projects that have a long lag between project costs and revenues or are insufficient to support revenue bond financing, the project generates significant economic benefits for taxpayers, and the project is critical to the Port’s core business.
Goals: Written statements that declare what the port/division/department plan to achieve to fulfill its mission.
Governmental Accounting Standards Board (GASB): It is the accepted standard-setting body for establishing governmental accounting and financial reporting principles.
Government Finance Officers Association (of USA and Canada) (GFOA): The purpose of the Government Finance Officers Association is to enhance and promote the professional management of governments for the public benefit by identifying and developing financial policies and practices and promoting them through education, training and leadership.
Port of Seattle 2020 Budget Appendices
Filename: _appendix.doc Updated:XIII-39
Investment in Joint Venture: The Port adopted Joint Venture Accounting beginning January 1, 2016 to account for its 50% share in the Northwest Seaport Alliance (NWSA).
Inter-Division Allocation (Charges): Allocation or Charges from one division to another.
Intra-Division Allocation (Charges): Allocation or Charges from within the division.
Landing Fee: The landing fee rate and resulting landing fee revenues are based on the contractual agreement between the Port's Aviation Division and the airlines. This contractual agreement permits the airlines to land and operate at Sea-Tac Airport. See the discussion of landing fees in Appendix E.
LEAN: Is a management philosophy, a process improvement approach, and a set of methods that seek to identify, eliminate, and reduce non-value added activities or waste within a process. Lean is time tested and is used by several companies, industries, and agencies around the world. Key principles of LEAN are:
• Guiding team members through the steps in process improvement with a trained facilitator • Measuring the current state of a process • Analyzing problem areas within a process • Brainstorming improvement ideas, implementing improvements, and putting in place controls
to sustain improvements
Major Funds: There are dozens of funds that are summarized into the Enterprise Fund, which is used to account for operations and activities that are financed at least in part by fees or charges to external users of Airport Facilities, Maritime and Economic Development properties. Therefore, the Port of Seattle summarizes all of its activities in the Enterprise Fund. This includes the Port’s major business activities, which are comprised of three operating divisions – Aviation, Maritime and Economic Development, and Central Services. Majority in Interest (MII): Under the terms of the current agreement between the airlines and the airport, the airlines are entitled to vote their approval for particular capital projects that affect the airline rate base.
Millage: A tax rate on property, expressed in mills per dollar of value of the property.
Mission: A brief statement that describes the purpose of an organization’s existence. It defines the core purpose of the organization: What your organization does and for whom.
Net Assets: As required by GASB Statement No. 34, Basic Financial Statements – and Management’s Discussion and Analysis for State and Local Governments, net assets (equity) have been classified on the statement of net assets into the following categories:
• Invested in capital assets – net of related debt: Capital assets, net of accumulated depreciation and outstanding principal balances of debt attributable to the acquisition, construction, or improvement of those assets.
• Restricted: Net Assets subject to externally imposed stipulations on their use. • Unrestricted: All remaining net assets that do not meet the definition of “invested in capital
assets – net of related debt” or “restricted.” When both restricted and unrestricted resources are available for the same purpose, restricted assets are considered to be used first over unrestricted assets.
Port of Seattle 2020 Budget Appendices
Filename: _appendix.doc Updated:XIII-40
Net Operating Income before Depreciation (NOI): Income from operations after all direct and allocated expenses, but before depreciation, non-operating revenues and expenses has been included.
Non-Airline Revenues: Include concession, parking and other fees not charged directly to the airlines. These revenues help offset the residual landing fee requirement.
Non-Operating Expenses: Cost or charges that do not arise from the normal operation of the Port’s business. An example is interest expense.
Non-Operating Revenues: Revenues that do not result from the normal operation of the Port’s business such as: Ad Valorem Tax Levy, Interest Income, Non-operating Grants, Passenger Facilities Charges, Customer Facilities Charges and other revenues generated from non-operating sources.
Northwest Seaport Alliance (NWSA): A Joint Venture between the Port of Seattle and the Port of Tacoma formed the Northwest Seaport Alliance, which unifies the two ports’ marine cargo terminal investments, operations, planning and marketing to strengthen the Puget Sound gateway and attract more marine cargo to the region. It is the fourth-largest trade gateway in North America, behind the ports of Los Angeles and Long Beach, the Port of New York/New Jersey, and the Port of Savannah. It is a separate governmental entity established as a Port Development Authority, similar to Public Development Authorities formed by cities and counties. It is governed equally by the Managing Members who are acting through its home port’s elected commissioners. The citizens of Pierce and King Counties each elect a five-member Port Commission to govern the ports of Tacoma and Seattle every four years, on a staggered basis. Each home port will remain a separate legal entity, independently governed by its own elected commissioners.
Objectives: Are statements of specific outcomes that are related to achieving the desired goals/strategies.
Operating Income before Allocations & Depreciation: Direct operating revenues minus direct operating expenses. This does not include any allocated expenses.
Operating & Maintenance Expenses: Cost or charges that arise from the normal operation of Port’s business. These are cost or services required for a department/division to function. These include Salaries and Benefits, Equipment expense, Supplies and Stock, Travel and Other Employee expenses and all Direct and allocated charges, from Central Services and from other Divisions.
Operating Revenues: Fees for services, rents, and charges for the use of Port facilities such as: Dockage, Wharfage, Berthage and Moorage, Airport Transportation Fees, Airport Landing Fees, Equipment Rentals, Property Rentals and other revenues generated from port’s operations are reported as operating revenue.
ORG: Is an abbreviated term for “Organization” and is the number that identifies departments. It shows where cost originates.
Other Post-Employment Benefits (OPEB): According to the Governmental Accounting Standard Board (GASB) statement 45, government agencies are required to record post-employment benefit costs other than pensions as a liability based on actuarial costs.
Passenger Facilities Charges (PFCs): As determined by applicable federal legislation, passenger facility charges generate revenue to be expended by the Port for eligible capital projects and the payment of principal and interest on specific revenue bonds. PFC revenues received from the
Port of Seattle 2020 Budget Appendices
Filename: _appendix.doc Updated:XIII-41
airlines are recorded as non-operating income in the statements of revenues, expenses, and changes in net assets upon passenger enplanement.
Passenger Facilities Charges (PFCs) Bonds: Bonds backed by Passenger Facility Charges.
Passenger Traffic: Enplanements, deplanements and connecting passenger activity.
Performance Indicators or Measures: Metrics used by Port management to determine whether a program is achieving or accomplishing its mission efficiently and effectively.
Performance or Operating Budget: A financial plan that incorporates an estimate of proposed revenues and expenses for a given period. A department's budget includes only those revenues and expenditures for which it has control.
Performance or Variance Report: A report in narrative format explaining the reason or causes of variances between actual revenues and expenses versus budgeted amounts for a given period. A good and accurate monthly and quarterly performance/variance report is a very important tool for management. Divisions and departments prepare a quarterly year-end forecast, which is incorporated into this report and it is presented quarterly to Executive Management and the Commission in public meetings.
Port Commission: It is the governing body of the Port of Seattle, which is comprised of five commissioners elected by the voters of King County to serve four-year term and to establish Port policy.
Program: Represents costs that are tracked and tend to enhance account information.
Repairs and Maintenance: Expenditures for routine maintenance and repairs to structure and minor improvements to property, which do not increase the value of the capital assets.
Resolution: A formal expression of opinion or determination adopted by the Port Commission.
Revenue Bonds: A type of borrowing that is repaid through the dedication of revenues intended to be generated by the investment being funded by the bonds.
Revenue over Expense: The excess or deficit of revenues (operating and non-operating) over expenses (operating and non-operating). The excess of revenues over expenses increases equity, whereas the deficit, expenses over revenues, decrease equity.
Seasonally Adjusted: Monthly figures are seasonally adjusted to account for typical seasonal variations which allows for month-to-month comparison.
Seasonally Adjusted Annual Rate: An calculated rate to reflect the full year, and adjusted to account for the seasonal variations.
Strategies: The broad, overall priorities adopted by the organization in recognition of its operating environment and in pursuit of its mission and vision. Strategies set the stage for decisions on budget, resources, and timeframes.
Statutory Budget: A plan that depicts the cash flows of the Port. It shows the beginning balance, cash receipts and cash disbursements and the balance at the end of the year. This budget must be filed with the King County Council and the King County Assessor as required by law by a specific date. See Section XI.
Port of Seattle 2020 Budget Appendices
Filename: _appendix.doc Updated:XIII-42
Subclass: Shows where resources were used and spending occurred. It shows who benefited from the work.
Tax Levy: The amount of money to be raised by the imposition of property taxes. See Section VIII.
Transfers: The movement of money from one fund to another.
Transportation Worker Identification Credential (TWIC): The Transportation Worker Identification Credential, also known as TWIC®, is required by the Maritime Transportation Security Act for workers who need access to secure areas of the nation’s maritime facilities and vessels. It is a tamper-resistant biometric identification card system established through the U.S. Congress Maritime Transportation Security Act (MTSA) and administered by the Transportation Security Administration (TSA) and U.S. Coast Guard. TSA conducts a security threat assessment (background check) to determine a person’s eligibility and issues the credential. U.S. citizens and immigrants in certain immigration categories may apply for the credential. Most mariners licensed by the U.S. Coast Guard also require a credential.
Twenty-foot Equivalent Unit (TEU): The international standard of measurement for the container volume that moves through the Port. One forty-foot container is equivalent to two TEUs.
Values: Principles, standards, characteristics or qualities held in high positive regard by an individual or group. They are often used to guide day-to-day actions.
Variances: The difference between “actual” and “budget” amounts for revenues and for expenses, which could be either favorable or unfavorable.
Favorable Variance: This is a positive variance and it exists when, in a given period:
• Revenues: Actual revenues are higher than budgeted revenues • Expenses: Actual expenses are lower than budgeted expenses
Unfavorable Variance: This is a negative variance and it exists when, in a given period:
• Revenues: Actual revenues are lower than budgeted revenues • Expenses: Actual expenses are higher than budgeted expenses
Vision: A word picture or brief statement of what the organization intends to become or how it sees itself at some point in the future.
Port of Seattle 2020 Budget Appendices
Filename: _appendix.doc Updated:XIII-43
APPENDIX G: ACRONYMS AND ABBREVIATIONS
AAPA American Association of Port Authorities AAAE American Association of Airport Executives ACI Airports Council International AEC Airport Employment Center AIR 21 Aviation Investment & Reform Act for the 21st Century APM Automated People Mover ARFF Aviation Regional Fire Fighting ATC Air Traffic Control B&OT Business and Occupation Tax BHICC Bell Harbor International Conference Center BHM Bell Harbor Marina BHS Baggage Handling System BLS Bureau of Labor Statistics BMP Best Management Practices CAFR Comprehensive Annual Financial Report CDD Capital Development Division CERT Community Emergency Response Team CFC Customer Facility Charges CFO Chief Financial Officer CIP Capital Improvement Plan CMMS Computerized Maintenance Management System COO Chief Operating Officer CPE Cost Per Enplanement CPI Consumer Price Index/ Continuous Process Improvement CPO Central Procurement Office, a Port department CTE Central Terminal Expansion CY Calendar Year / Container Yard DHS Department of Homeland Security DNR Department of Natural Resources DOT Department of Transportation ED Executive Director EDD Economic Development Division EDI Equity, Diversity, and Inclusion, a Port Department EIS Environmental Impact Statement EPA Environmental Protection Agency ESGR Employer Support of the Guard Reserve FAA Federal Aviation Administration FAR Federal Aviation Regulations FASB Financial Accounting Standard Board FAST Freight Action Strategy Corridor F&B Finance and Budget, a Port Department FEMA Federal Emergency Management Agency FIMS Flight Information Management System FIS Federal Inspection Area FMC Federal Maritime Commission FOD Foreign Object Debris FTE Full-time Equivalent Employee FY Fiscal Year GAAP Generally Accepted Accounting Principles

Port of Seattle 2020 Budget Appendices
Filename: _appendix.doc Updated:XIII-44
GASB Governmental Accounting Standards Board GFOA Government Finance Officers Association (of USA and Canada) GIS Geographical Information System G.O. General Obligation (Bond) GT Ground Transportation HCM Human Capital Management HDS Harbor Development Strategy HR Human Resources, a Port department HVAC Heating, Ventilation and Air Conditioning IAF International Arrivals Facility IDC Industrial Development Corporation ILA Interlocal Agreement IMC Intermodal Center ICT Information and Communications Technology, a Port Department KPI Key Performance Indicators LEOFF Law Enforcement Officers’ and Fire Fighters’ Retirement System LOI Letter of Intent LOC Letter of Credit LR Labor Relations, a Port Department LRP Long Range Plan MAP Million Annual Passengers WMBE Women & Minority Owned Business Enterprise MD Managing Director MIC Marine Industrial Center MIS Management Information System MOBI Marina Operation Boating Inventory System MOU Memorandum of Understanding NAMF North Area Maintenance Facility NAC Neighborhood Advisory Committee NEPA National Environmental Policy Act NMA National Management Association NOI Net Operating Income NSAT North Satellite NTSB National Transportation Safety Board NWMTA Northwest Marine Terminal Association NWSA Northwest Seaport Alliance O&D Origin and Destination O&M Operating and Maintenance Expense OPEB Other Post-Employment Benefits ORG Organization PCS Port Construction Services, a Port department PDA Port Development Authority PERS Public Employees’ Retirement System PFC Passenger Facility Charges PLA Project Labor Agreement PM Project Manager PMA Pacific Maritime Association PMG Project Management Group, a Port department PNWA Pacific North West Waterways Association POS Port of Seattle PPE Personal Protective Equipment PPM Post Panamax
Port of Seattle 2020 Budget Appendices
Filename: _appendix.doc Updated:XIII-45
PREP Performance Review, Evaluation & Planning PSA Professional Service Agreement PSCAA Puget Sound Clean Air Agency PSRC Puget Sound Regional Council RCF Rental Car Facility RCW Revised Code of Washington RFP Request For Proposal RMM Regulated Materials Management SBM Shilshole Bay Marina SDS Storm water Drainage System SEPA State Environmental Policy Act SLOA Signatory Airline Lease and Operating Agreements SSA Stevedoring Services of America STEP South Terminal Expansion Project STIA Seattle-Tacoma International Airport STS Satellite Transit System SWU Storm Water Utility USCG United States Coast Guard USDA United States Department of Agriculture TEU Twenty-foot Equivalent Unit TSA Transportation Security Administration TWIC Transportation Worker Identification Credential UBC Uniform Building Code WASPC Washington Association of Sheriffs and Police Chiefs WSDOE Washington State Department of Ecology WSDOT Washington State Department of Transportation WTC World Trade Center WPPA Washington Public Ports Association

Port of Seattle 2020 Budget Appendices
Filename: _appendix.doc Updated:XIII-46
This page intentionally left blank.