Embed Size (px)
Citation preview
w w w . g e o s o f t . c o m
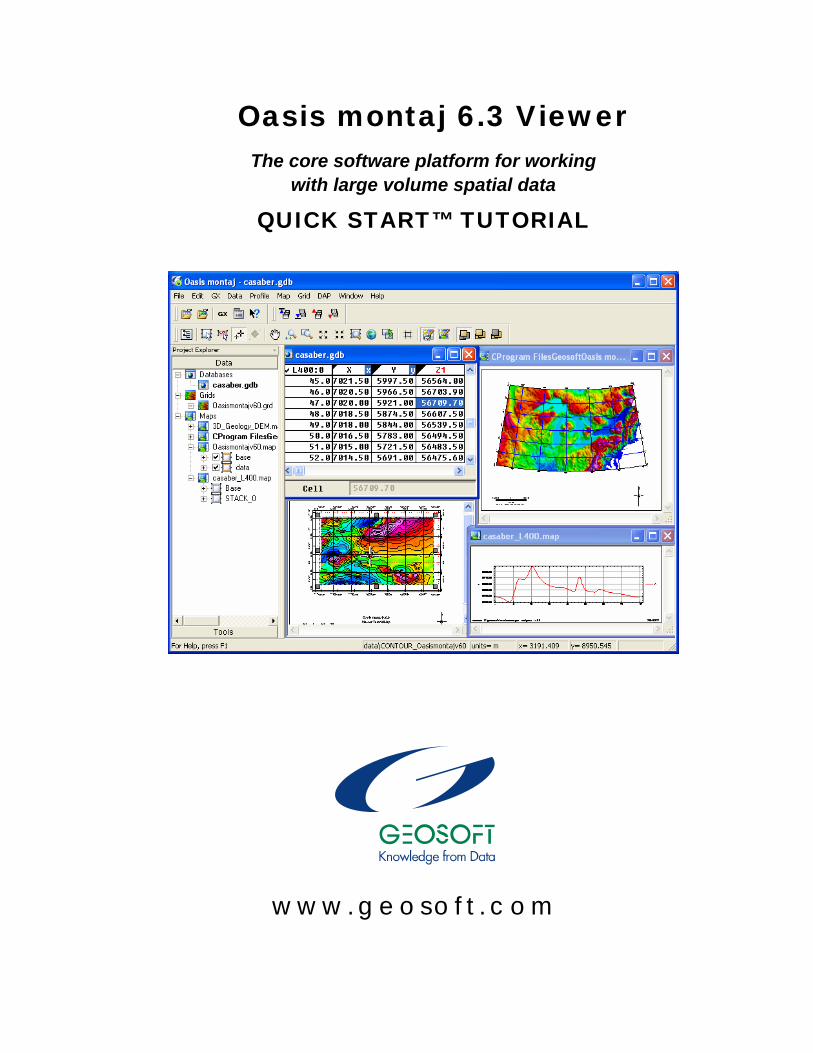
Oasis montaj 6.3 Viewer The core software platform for working
with large volume spatial data
QUICK START™ TUTORIAL

The software described in this manual is a completely free software environment that you can distribute freely to any recipient with whom you need to share your earth science results and ideas. Manual release date: 26/04/2006. Written by, Nancy Whitehead. Please send comments or questions to [email protected]
Copyright © Geosoft Inc. 2006. All rights reserved. No part of this publication may be reproduced, stored in a retrieval system or transmitted, in any form, or by any means, electronic, mechanical, photo-copying, reading, or otherwise, without prior consent from Geosoft Inc.
Program Copyright© Geosoft Inc. 2006. All rights reserved. Geosoft and Oasis montaj are registered trademarks of Geosoft Inc. GEOSOFT, Oasis are trademarks of Geosoft Inc.
Windows®, and Windows NT™ are either registered trademarks or trademarks of Microsoft Corporation. Geosoft Incorporated 8th Floor 85 Richmond St. W. Toronto, Ontario M5H 2C9 Canada Tel: (416) 369-0111 Fax: (416) 369-9599 Web Site: www.geosoft.com E-mail: [email protected]
Contents
Oasis montaj 6.3 1
Software and Hardware Requirements 1
Installing Oasis montaj Viewer 2
Install from the Oasis montaj Viewer CD ROM 2
Install from the Web 2
Authorizing Your Internet Communication Settings 3
Authorize Internet Communication Dialog 3
Internet Trust Relationship Dialog 3
Setting High-Resolution Graphics 4
Configuring Oasis montaj Settings 4
Finding More Help Information 5
Contacting Geosoft 5
Tutorial 1: Getting Ready to Work 7
Welcome to the Oasis montaj Environment 7
System Files 7
Creating a Working Directory 8
Before you Begin 8
Creating a Project 8
Changing Default Settings 10
Finding Help 13
Tutorial 2: Working with Data 15
Oasis montaj Databases 15
Opening a Database 15
Adding Compression to your Database 16
Displaying Data Files in an Oasis montaj Database 16
Displaying Channels (Columns) in the Spreadsheet 18
Displaying Basic Channel Statistics 20
Displaying Profiles in the Spreadsheet 21 DataBase Tool Bar 23
Profile Panel Options 23
Plotting Profile Windows 24
Metadata Tool 25
Data Types 25
Drag-n-Drop 27
Oasis montaj Maps 28
Displaying a Map 28
Adding Map Comments 28
Using the Map View/Group Manager Tool 28 Render ing Opt ions 29 Other Tool Opt ions 30
Using the Viewer Tool Bars 31 Standard Bar 31 Map Tools Bar 31 Navigat ion Tool Bar 32
Displaying Grids and Images on a Map 35
Data Access Protocol (DAP) 37
Using the Metadata Tool 42
3D Surface Tool 43
3D Rendering Memory Requirements 51
Copying and/or Converting Grid Files 52
Grid Report and Statistics 52
Sending E-maps 53
Unpacking an E-map 54
Exporting Data 54
Exporting Databases 55
Export Geosoft XYZ Data Format 55
Export CSV Format 56
Exporting Maps 56
Printing Maps in Oasis montaj 57
Printer Setup 58
Print a Map 58
Appendix 1: Geosoft Concepts 60
Oasis montaj Viewer 60
What is Oasis montaj? 61
Viewer Capabilities 61 Projects 61 Data and Prof i les 62 Maps, Gr ids and Images 62 Onl ine Help and Technica l Suppor t 62
Keeping you in touch with your data 63
Projects and the Project Explorer 64
What you need to know about Project files 65
Databases and high-volume data processing 66
Spreadsheets are the windows to your database 68
How the Spreadsheet Displays Project Data 69
Profiles and viewing your data graphically 70
Maps are more than printed sheets of information 71
Dynamically link data and information to knowledge 73
Geosoft Algorithms and Techniques 74
Process Maker technology links data processing 75
Appendix 2: Displaying Data Formats 76
Geosoft XYZ File Format 76
ASEG-GDF File Format 77
Geosoft GBN (Binary Data File) Format 78

Oasis montaj 1
Oasis montaj 6.3 Oasis montaj 6.3 is the latest release from Geosoft. Oasis montaj is available in two versions – a free Viewer and a licensed Mapping and Processing System.
The Oasis montaj Viewer is a free software product that enables you to view Geosoft databases, Geosoft grids and a variety of common image and data exchange formats. Specifically, this version provides you with the following capabilities:
• Access project data (Geosoft databases, grids and maps), tools (3D Tool and Project Explorer), and Geosoft toolbars (Database Tools, Map Tools, Standard Toolbar)
• Evaluate data, information and interpretations by viewing and performing specific tasks using Geosoft databases, profiles, maps, and grids as well as Geosoft and third-party images (including Geosoft PLT, AutoCAD DXF, MapInfo TAB, ArcView SHP and Microstation DGN files).
• Verify data quality, analyses and interpretations by tracking processes applied to databases and maps
• Perform selected processes made available through Geosoft menus or third-party GXs
• Share results and knowledge by viewing and/or sending E-maps to team members and other professional contacts
• Prepare reports using clipboard image copying capabilities
Software and Hardware Requirements To run Oasis montaj, you require the following software and hardware: Operating System Windows XP recommended, Windows 2000 SP3 minimum. We
do not support Windows 95, 98, Me or Windows NT
CPU No requirement on a specific CPU type. An Intel Celeron processor is not recommended
RAM 512 MB or more of RAM recommended. 256 MB or more minimum (get as much RAM as you can afford)
Graphics 24-bit graphics card with 3D acceleration is recommended and required for full colour imaging. Recommend 64MB RAM on card
Printer/Plotter Any Windows® supported colour printer. Hewlett Packard® large-format ink-jet plotters are recommended
Installation Oasis montaj MUST be installed while logged on as Administrator
Installation Disk Space 1 GB or more of free space on the Program Files drive is required for the installation process
Data Disk Space Data disk space depends on the volume of project data to be processed and the printer driver you are using, however 100 GB is recommended. This is largely based on your business and data
2 Oasis montaj
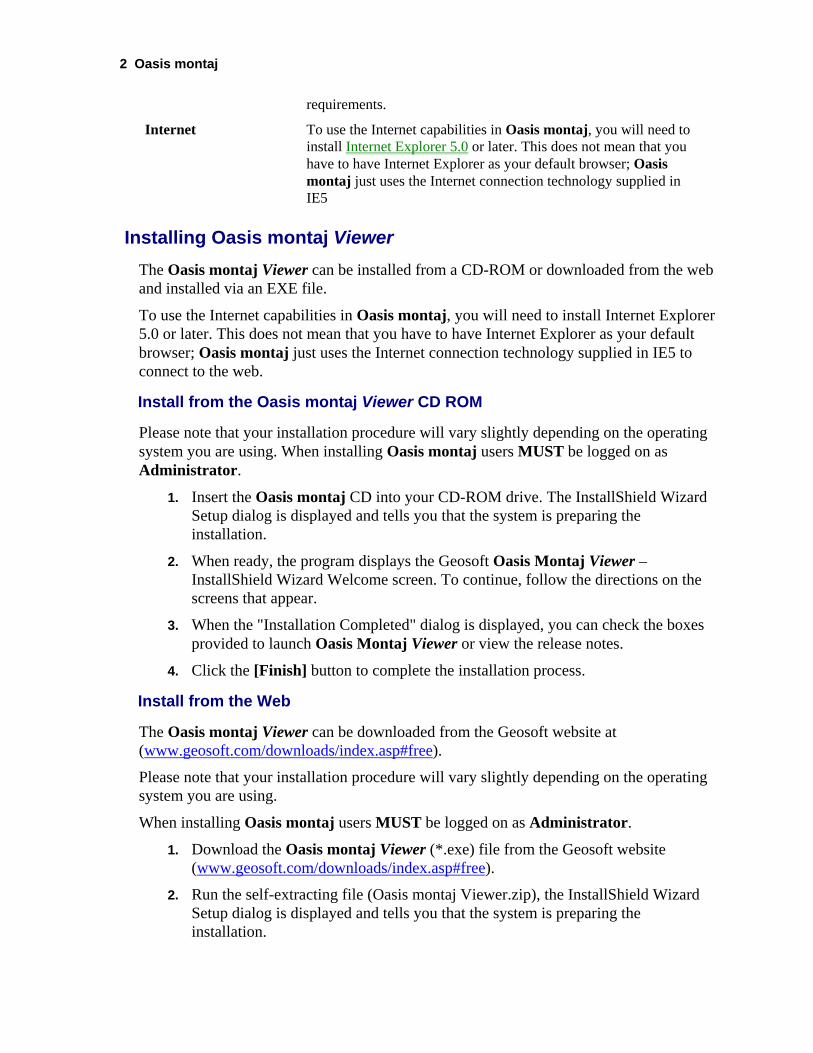
requirements.
Internet To use the Internet capabilities in Oasis montaj, you will need to install Internet Explorer 5.0 or later. This does not mean that you have to have Internet Explorer as your default browser; Oasis montaj just uses the Internet connection technology supplied in IE5
Installing Oasis montaj Viewer The Oasis montaj Viewer can be installed from a CD-ROM or downloaded from the web and installed via an EXE file.
To use the Internet capabilities in Oasis montaj, you will need to install Internet Explorer 5.0 or later. This does not mean that you have to have Internet Explorer as your default browser; Oasis montaj just uses the Internet connection technology supplied in IE5 to connect to the web.
Install from the Oasis montaj Viewer CD ROM
Please note that your installation procedure will vary slightly depending on the operating system you are using. When installing Oasis montaj users MUST be logged on as Administrator.
1. Insert the Oasis montaj CD into your CD-ROM drive. The InstallShield Wizard Setup dialog is displayed and tells you that the system is preparing the installation.
2. When ready, the program displays the Geosoft Oasis Montaj Viewer – InstallShield Wizard Welcome screen. To continue, follow the directions on the screens that appear.
3. When the "Installation Completed" dialog is displayed, you can check the boxes provided to launch Oasis Montaj Viewer or view the release notes.
4. Click the [Finish] button to complete the installation process.
Install from the Web
The Oasis montaj Viewer can be downloaded from the Geosoft website at (www.geosoft.com/downloads/index.asp#free).
Please note that your installation procedure will vary slightly depending on the operating system you are using.
When installing Oasis montaj users MUST be logged on as Administrator.
1. Download the Oasis montaj Viewer (*.exe) file from the Geosoft website (www.geosoft.com/downloads/index.asp#free).
2. Run the self-extracting file (Oasis montaj Viewer.zip), the InstallShield Wizard Setup dialog is displayed and tells you that the system is preparing the installation.
Oasis montaj 3
3. When ready, the program displays the Geosoft Oasis Montaj Viewer – InstallShield Wizard Welcome screen. To continue, follow the directions on the screens that appear.
4. When the "Installation Completed" dialog is displayed, you can check the boxes provided to launch Oasis Montaj Viewer or view the release notes.
5. Click the [Finish] button to complete the installation process.
Authorizing Your Internet Communication Settings The Authorize Internet Communication dialog box enables you to authorize what communication takes place between your Oasis montaj system and the Geosoft Internet Server. The Internet Trust Relationship dialog box enables you to select the default setting for authorizing all future communication with the server.
All communication with the Geosoft Server is encrypted for your privacy and security.
Authorize Internet Communication Dialog
This dialog box is displayed when Oasis montaj tries to communicate with an internet server. For example, when you try to download data from the Geosoft DAP server and your authorization is set to Verify (the default setting).
• Click the [Authorize] button to authorize the communication and connect to the server.
• Click [Deny] to cancel the communication. The server will not be accessed. • Click [Security] to view the Internet Trust Relationship dialog box and change
your default authorization setting (see below).
Internet Trust Relationship Dialog
This dialog box enables you to set the type of access you want when communicating with an internet or external server to download data.
You can select from three levels of access that will define how the Geosoft Server will communicate with your computer:
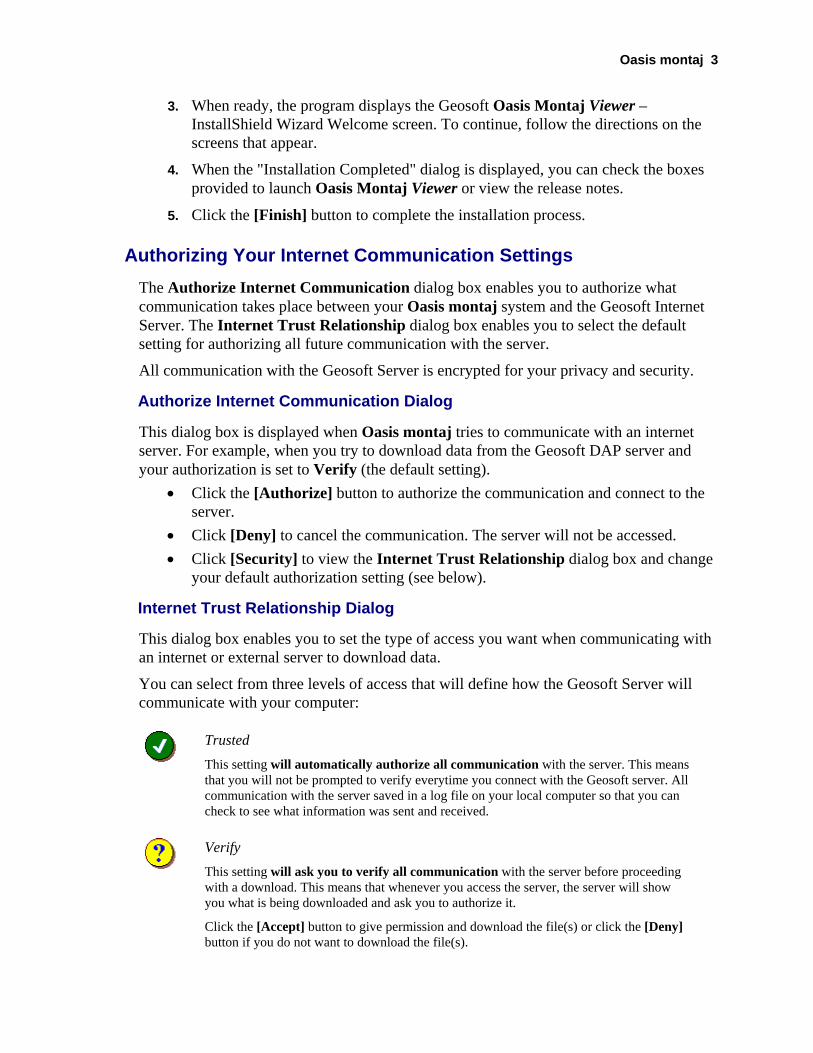
Trusted This setting will automatically authorize all communication with the server. This means that you will not be prompted to verify everytime you connect with the Geosoft server. All communication with the server saved in a log file on your local computer so that you can check to see what information was sent and received.
Verify This setting will ask you to verify all communication with the server before proceeding with a download. This means that whenever you access the server, the server will show you what is being downloaded and ask you to authorize it.
Click the [Accept] button to give permission and download the file(s) or click the [Deny] button if you do not want to download the file(s).
4 Oasis montaj
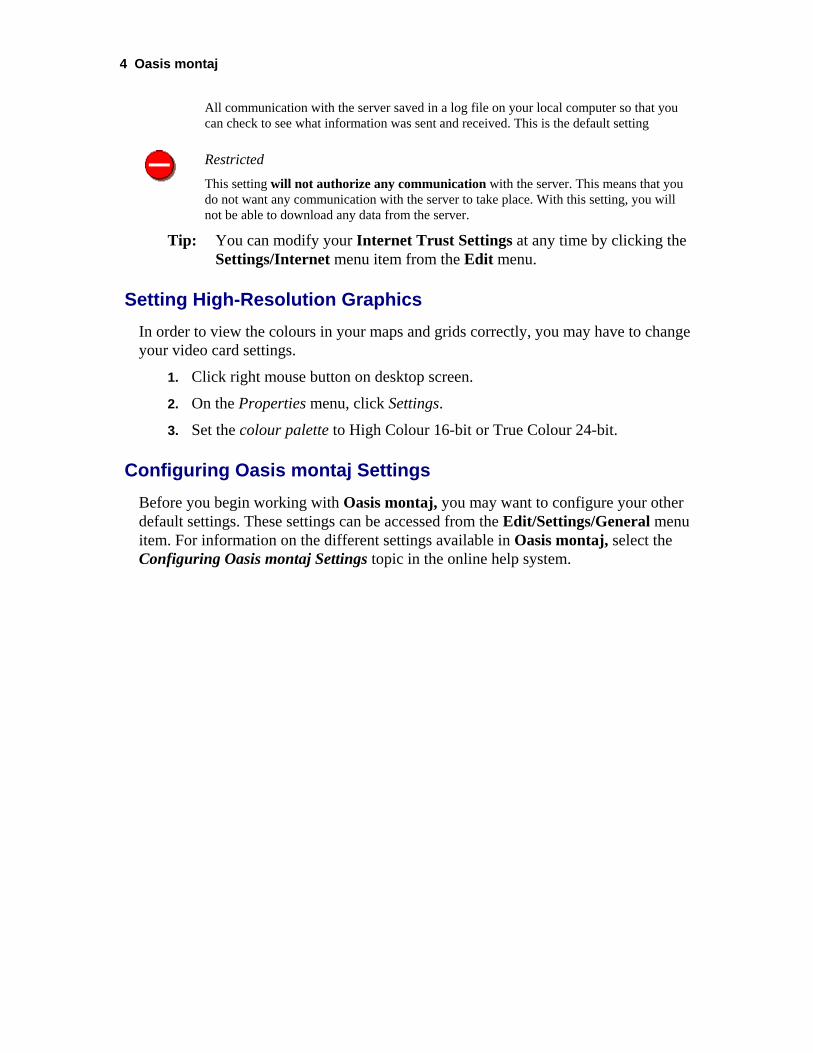
All communication with the server saved in a log file on your local computer so that you can check to see what information was sent and received. This is the default setting
Restricted This setting will not authorize any communication with the server. This means that you do not want any communication with the server to take place. With this setting, you will not be able to download any data from the server.
Tip: You can modify your Internet Trust Settings at any time by clicking the Settings/Internet menu item from the Edit menu.
Setting High-Resolution Graphics In order to view the colours in your maps and grids correctly, you may have to change your video card settings.
1. Click right mouse button on desktop screen.
2. On the Properties menu, click Settings.
3. Set the colour palette to High Colour 16-bit or True Colour 24-bit.
Configuring Oasis montaj Settings Before you begin working with Oasis montaj, you may want to configure your other default settings. These settings can be accessed from the Edit/Settings/General menu item. For information on the different settings available in Oasis montaj, select the Configuring Oasis montaj Settings topic in the online help system.

Oasis montaj 5
Finding More Help Information There are several other functions included in the basic Oasis montaj help system that may be useful to your work. The entire documentation for the system is available through the online help system. This electronic library of information enables us to constantly update the information and provide you with the most up-to-date information available.
The best way to find information in this system is to use the Search tab to perform a full-text search of all help topics. If you still can’t find the information you’re looking for, all of the Geosoft Manuals and Tutorials are available online, www.geosoft.com/resources/tutorials/
Contacting Geosoft
The list below provides contact information for Geosoft offices around the world. Note that, technical support is for Licensed Users Only.
North America
Geosoft Inc., 85 Richmond St. W., 8th Floor Toronto, Ont., Canada M5H 2C9
Tel. (416) 369-0111 Fax (416) 369-9599
Email:[email protected]
Europe and North Africa
Geosoft Europe Ltd. 20/21 Market Place, First Floor Wallingford, Oxfordshire OX10 OAD United Kingdom
Tel: +44 1491 835 231 Fax: +44 1491 835 281
Email: [email protected]
South America
Geosoft Latinoamerica Ltda. Praça Floriano 51 / 19º Andar CEP: 20031-050, Centro Rio de Janeiro, RJ, Brasil
Tel: (55-21) 2532-0140 Fax: (55-21) 2532-7197
Email: [email protected]
Australia and Southeast Asia
Geosoft Australia Pty. Ltd 350 Hay Street Subiaco WA 6008 Australia
Tel 61 (8) 9382 1900 Fax 61 (8) 9382-1911
Email: [email protected]
South and Central Africa
Geosoft Africa Ltd. Buren Building, Second Floor Kasteelpark Office Park c/o Nossob & Jochemus Streets Erasmuskloof X3, Pretoria
Tel: 27 12 347 4519 Fax: 27 12 347 6936
Email: [email protected]


Tutorial 1: Getting Ready to Work 7
Tutorial 1: Getting Ready to Work In this tutorial, we will guide you through the steps you need to know to start working with your new software. At this point you should have already installed Oasis montaj. You should begin by starting Oasis montaj.
TO START USING OASIS MONTAJ
1. On the Start menu bar click Programs and then click Geosoft and then click Oasis montaj Viewer|Oasis montaj Viewer.
or
2. Double click on the Oasis montaj Viewer icon in Windows Explorer or File manager or the icon located on you desktop screen.
Welcome to the Oasis montaj Environment When you run Oasis montaj, the system opens the Oasis montaj interface window.
System Files
As you work with the system, you will become familiar with a variety of standard files used for specific functions. The following list provides a short summary of the more important files.
Oasis montaj System Files System File Extensions
Geosoft database file *.GDB
8 Tutorial 1: Getting Ready to Work
Map file, including plots and grids *.MAP
Geosoft grid file *.GRD
Colour information for grids/images *.AGG
Geosoft eXecutable *.GX
Geosoft Script file *.GS
Oasis Menu, Oasis sub-menu *.OMN, * .SMN
Geosoft Project file *.GPF
Geosoft projection information file *.GI
Geosoft Map file (used in the MapInfo software to distinguish a Geosoft map file from a MapInfo (*.map) file
*.GM
Creating a Working Directory The system enables you to access files anywhere but it is a good strategy to carefully organize your data (project information and files) before carrying out any processing.
To start this tutorial, please create a working directory called D:\Tutorial. A general rule to follow in working with Geosoft applications is to avoid working in the directory where Oasis montaj was installed. In this tutorial, we will follow this rule by keeping all the working data files in D:\Tutorial.
Before you Begin
This tutorial uses sample data (casaber.gdb, casaber.grd, xyz_format.xyz, and Oasis montaj v61.map) which is available on the Geosoft website http://www.geosoft.com/free/downloadfree.html. Before you begin the tutorial, download and copy the data files to your working directory D:\Tutorial.
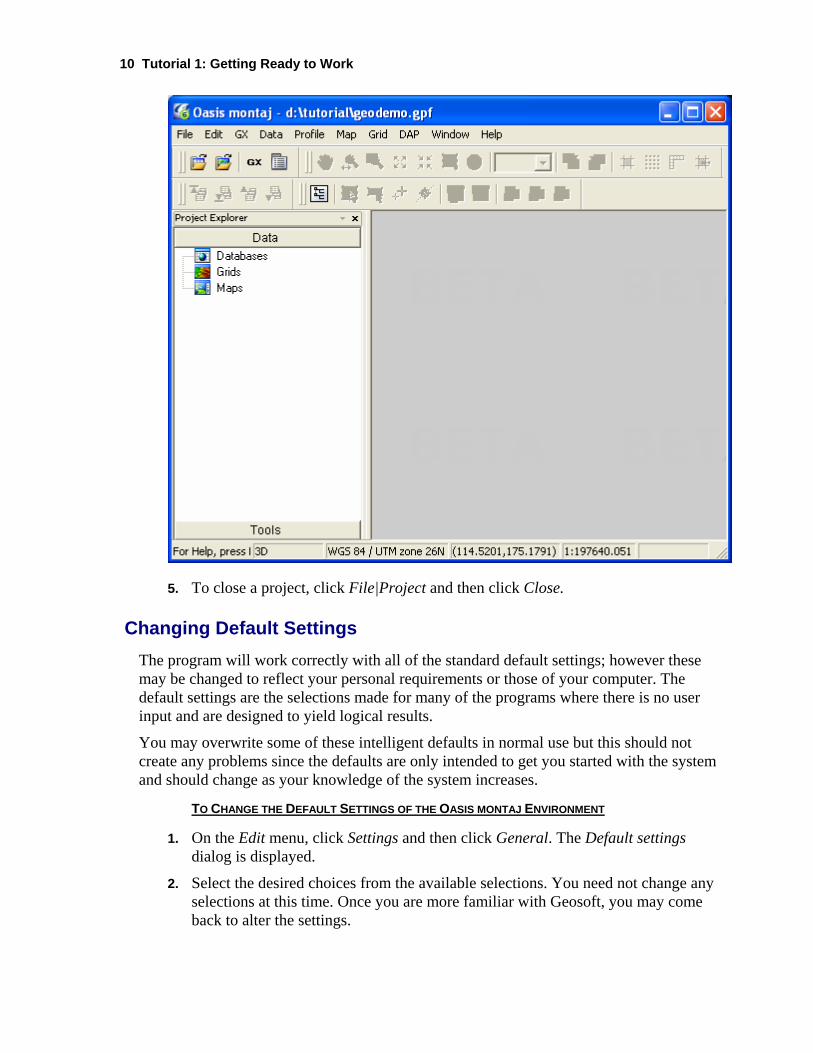
Creating a Project To work in Oasis montaj requires an open Project. An Oasis montaj "Project" encompasses every item in your working project; from the data files in your project (databases, maps, and grids), to the tools used (including 3D tool and the Project Explorer), to the project setup including the menus you have displayed and whether you are working on a map or profile and the state in which you left it the last time you used it.
The project also controls your working directory. Projects are saved as (*.gpf) files. If you open an existing project from a directory, the system assumes that all your project files are located in the same directory. To streamline your work, as well as keep it organized, you may wish to make sure that your project file is in the same directory as the other files you want to use. We recommend that each project you work on have its own project (*.gpf) file.
The Project Explorer tool enables you to browse as well as open any project item. The Project Explorer has two windows, the Data window that includes all data files included in the project and the Tools window that organizes and maintains the project tools. To
Tutorial 1: Getting Ready to Work 9
access the Tools window click the Tools bar on the bottom of the Project Explorer. To return to the Data window, click the Data bar on the top the Project Explorer.
TO CREATE A PROJECT:
1. Start Oasis montaj.
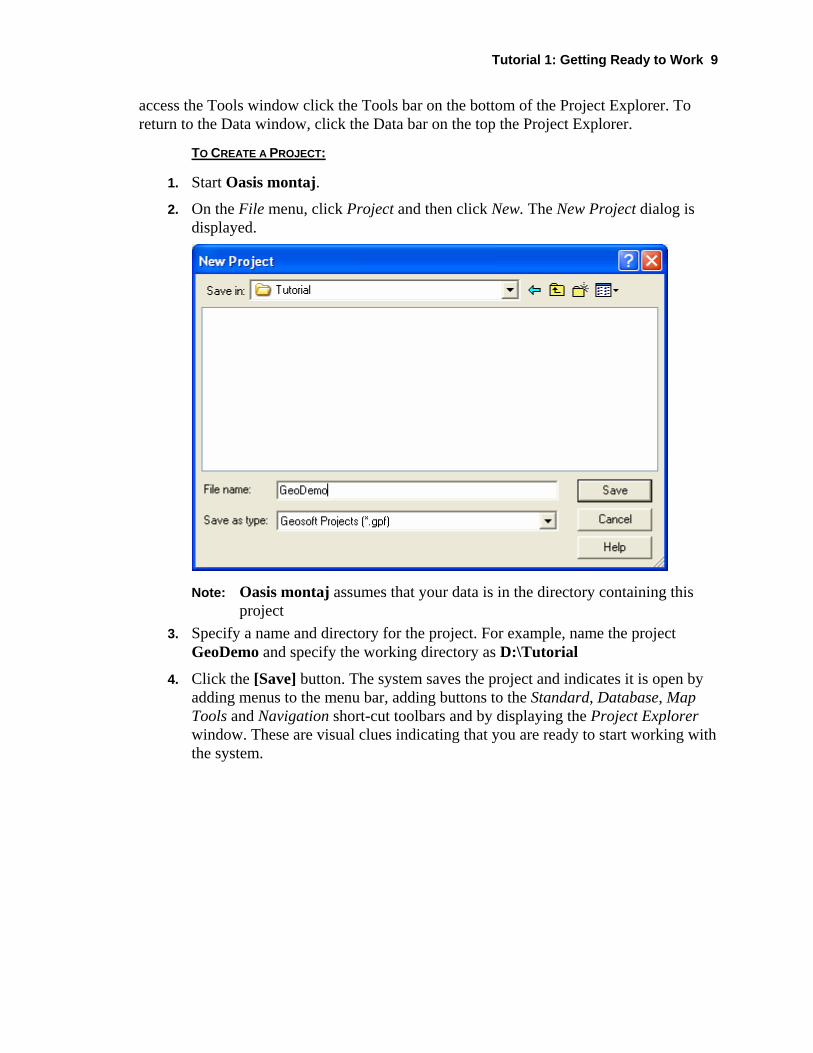
2. On the File menu, click Project and then click New. The New Project dialog is displayed.
Note: Oasis montaj assumes that your data is in the directory containing this project
3. Specify a name and directory for the project. For example, name the project GeoDemo and specify the working directory as D:\Tutorial
4. Click the [Save] button. The system saves the project and indicates it is open by adding menus to the menu bar, adding buttons to the Standard, Database, Map Tools and Navigation short-cut toolbars and by displaying the Project Explorer window. These are visual clues indicating that you are ready to start working with the system.
10 Tutorial 1: Getting Ready to Work
5. To close a project, click File|Project and then click Close.
Changing Default Settings The program will work correctly with all of the standard default settings; however these may be changed to reflect your personal requirements or those of your computer. The default settings are the selections made for many of the programs where there is no user input and are designed to yield logical results.
You may overwrite some of these intelligent defaults in normal use but this should not create any problems since the defaults are only intended to get you started with the system and should change as your knowledge of the system increases.
TO CHANGE THE DEFAULT SETTINGS OF THE OASIS MONTAJ ENVIRONMENT
1. On the Edit menu, click Settings and then click General. The Default settings dialog is displayed.
2. Select the desired choices from the available selections. You need not change any selections at this time. Once you are more familiar with Geosoft, you may come back to alter the settings.
Tutorial 1: Getting Ready to Work 11
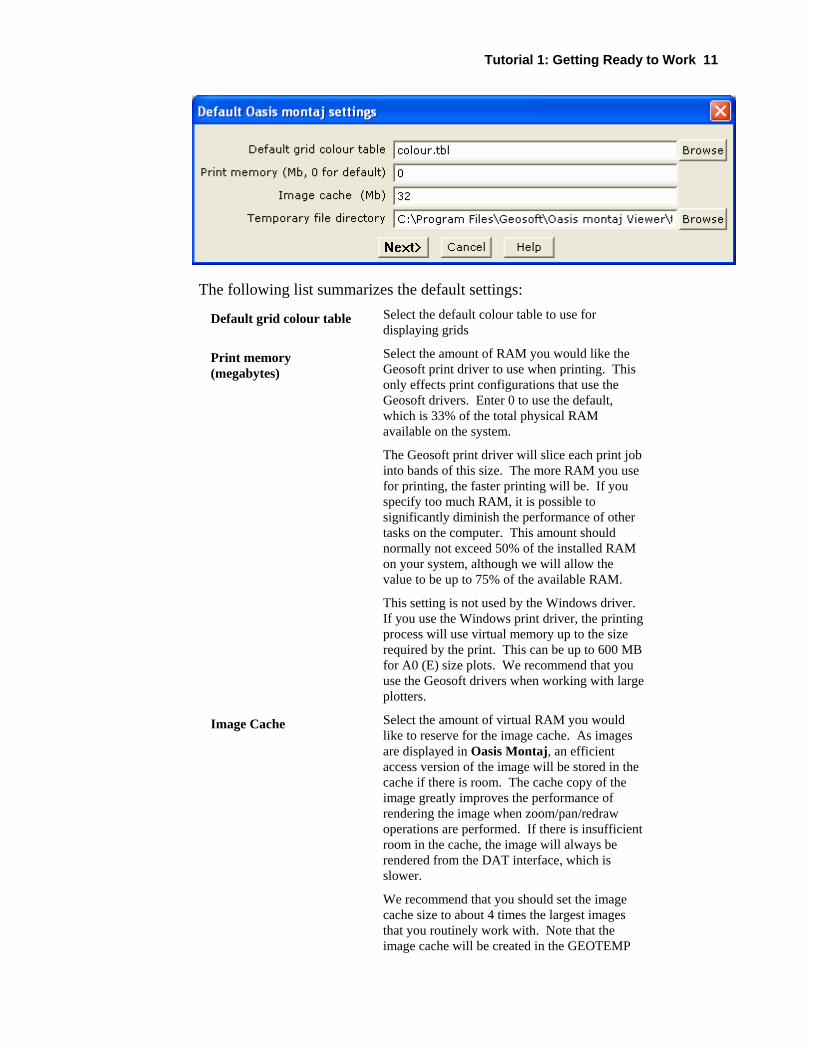
The following list summarizes the default settings:
Default grid colour table Select the default colour table to use for displaying grids
Print memory (megabytes)
Select the amount of RAM you would like the Geosoft print driver to use when printing. This only effects print configurations that use the Geosoft drivers. Enter 0 to use the default, which is 33% of the total physical RAM available on the system.
The Geosoft print driver will slice each print job into bands of this size. The more RAM you use for printing, the faster printing will be. If you specify too much RAM, it is possible to significantly diminish the performance of other tasks on the computer. This amount should normally not exceed 50% of the installed RAM on your system, although we will allow the value to be up to 75% of the available RAM.
This setting is not used by the Windows driver. If you use the Windows print driver, the printing process will use virtual memory up to the size required by the print. This can be up to 600 MB for A0 (E) size plots. We recommend that you use the Geosoft drivers when working with large plotters.
Image Cache Select the amount of virtual RAM you would like to reserve for the image cache. As images are displayed in Oasis Montaj, an efficient access version of the image will be stored in the cache if there is room. The cache copy of the image greatly improves the performance of rendering the image when zoom/pan/redraw operations are performed. If there is insufficient room in the cache, the image will always be rendered from the DAT interface, which is slower.
We recommend that you should set the image cache size to about 4 times the largest images that you routinely work with. Note that the image cache will be created in the GEOTEMP
12 Tutorial 1: Getting Ready to Work
directory, and there must be sufficient room to hold the cache plus other Geosoft temporary files. The image cache should not be more than 50% of the available room in GEOTEMP.
Temporary file directory This directory is used by Oasis montaj to store temporary files. Depending on the application, the requirements for storage in this directory can be VERY large (from 10 megabytes to gigabytes). We recommend setting this parameter to a very FAST drive. This will improve performance of all large data operations (magmap, gridding, etc).
Oasis montaj cannot start if this drive is invalid or if it is set to a drive in which it cannot create files (CD ROM). Please ensure that the directory is always valid.
Note that in previous versions of Oasis montaj the GEOTEMP environment variable determined where this directory was stored. This variable is no longer used and the setting is controlled through the Windows registry.
Tutorial 1: Getting Ready to Work 13
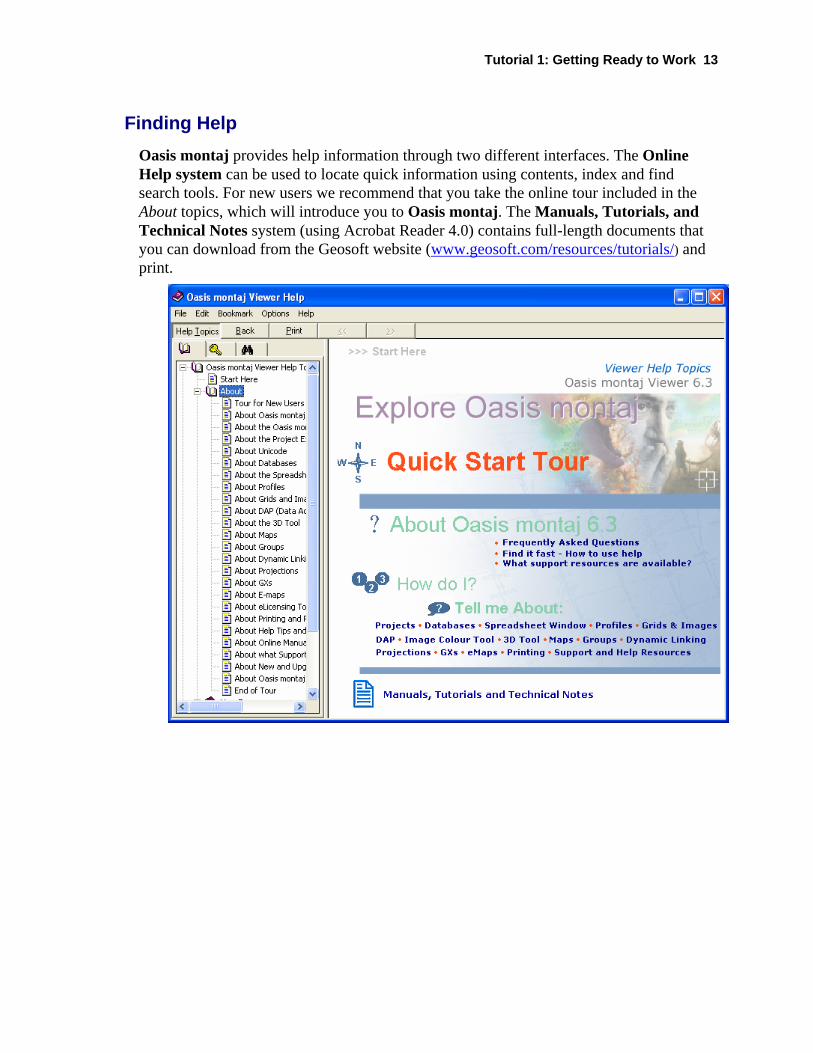
Finding Help Oasis montaj provides help information through two different interfaces. The Online Help system can be used to locate quick information using contents, index and find search tools. For new users we recommend that you take the online tour included in the About topics, which will introduce you to Oasis montaj. The Manuals, Tutorials, and Technical Notes system (using Acrobat Reader 4.0) contains full-length documents that you can download from the Geosoft website (www.geosoft.com/resources/tutorials/) and print.

Tutorial 2: Working with Data 15
Tutorial 2: Working with Data To a use Oasis montaj effectively, you will need to understand a bit about databases, spreadsheets, profiles and maps. The “window” to the database in Oasis montaj is a specialized earth science spreadsheet that appears automatically when you open a database. This spreadsheet provides access to a wide range of data management and profile viewing capabilities. Maps have special properties that you will learn about in later tutorials.
The purpose of this tutorial is to provide you with an overview of how you can use this data management system effectively.
Oasis montaj Databases One of the fundamental technologies in Oasis montaj is its unique database architecture. This architecture is designed to let you display many kinds of data formats (ASCII and binary) in high-performance Oasis montaj databases.
Oasis montaj provides the ability to add compression to a database. You can choose to compress for speed, size or use no compression at all. The type of compression you use depends on which type better suites your needs. We recommend that you use speed, as it provides the fastest access to your data with a good compression rate.
Opening a Database
Geosoft databases store and organize your survey data. Databases are displayed and organized in Oasis montaj in the Spreadsheet Window.
TO OPEN A DATABASE
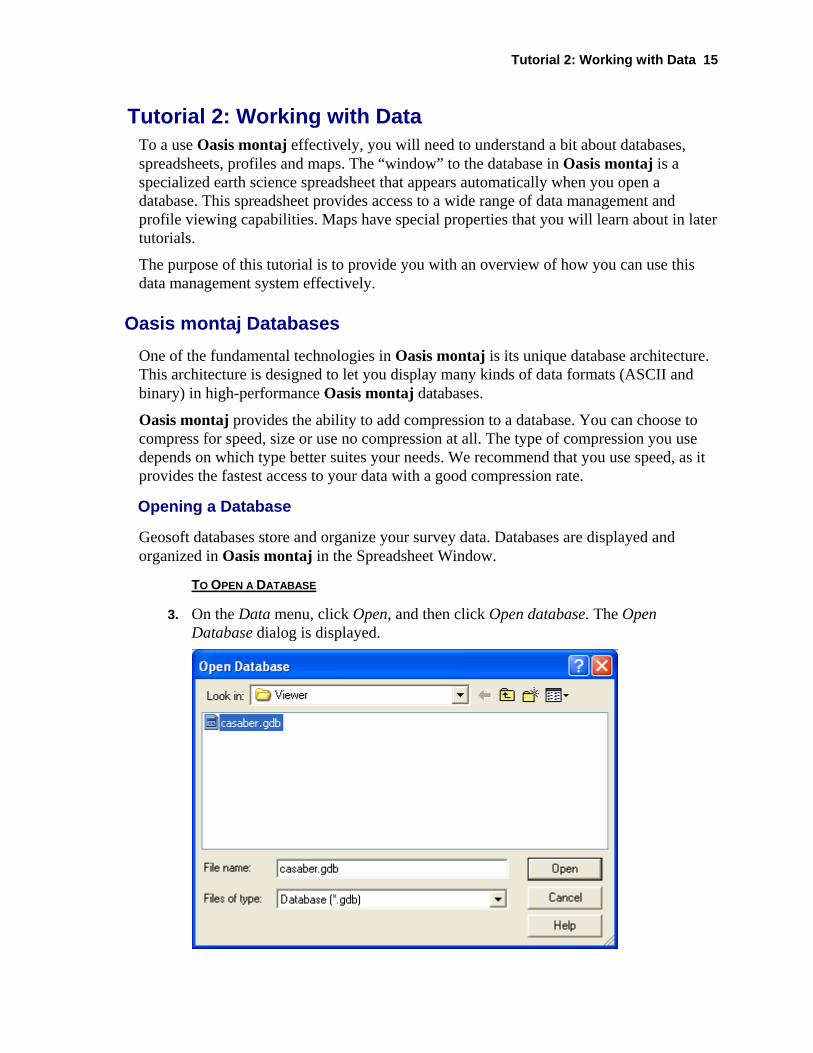
3. On the Data menu, click Open, and then click Open database. The Open Database dialog is displayed.
16 Tutorial 2: Working with Data
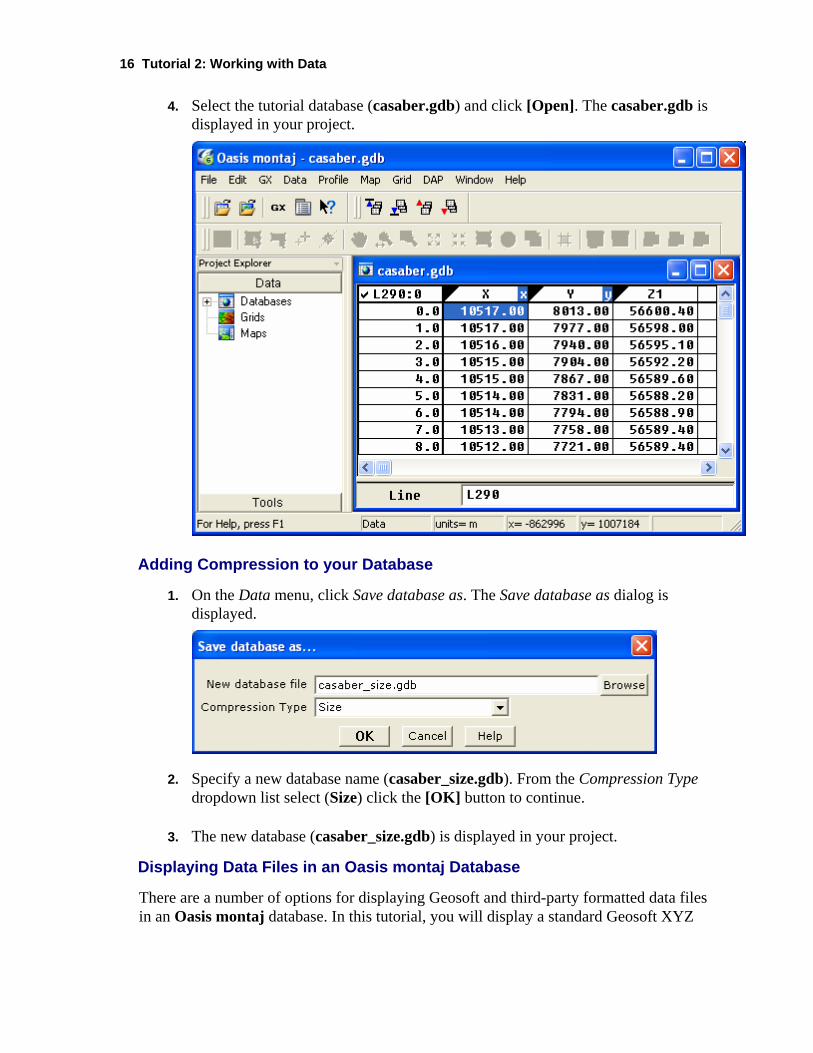
4. Select the tutorial database (casaber.gdb) and click [Open]. The casaber.gdb is displayed in your project.
Adding Compression to your Database
1. On the Data menu, click Save database as. The Save database as dialog is displayed.
2. Specify a new database name (casaber_size.gdb). From the Compression Type dropdown list select (Size) click the [OK] button to continue.
3. The new database (casaber_size.gdb) is displayed in your project.
Displaying Data Files in an Oasis montaj Database
There are a number of options for displaying Geosoft and third-party formatted data files in an Oasis montaj database. In this tutorial, you will display a standard Geosoft XYZ
Tutorial 2: Working with Data 17
file. For more information about the Geosoft XYZ format and other file formats that can be displayed in an Oasis montaj database see Appendix 2: Displaying Data Formats.
DISPLAYING AN XYZ FORMAT FILE IN A DATABASE
1. On the Data menu, click Open, and then click Geosoft XYZ.
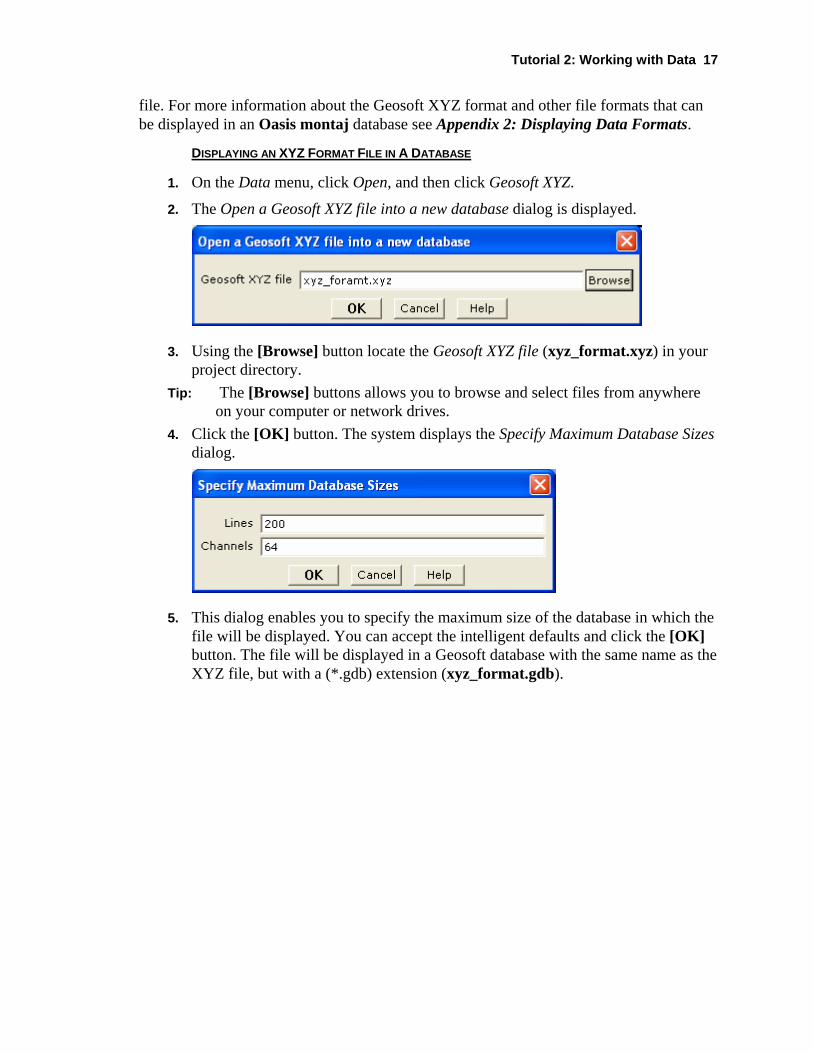
2. The Open a Geosoft XYZ file into a new database dialog is displayed.
3. Using the [Browse] button locate the Geosoft XYZ file (xyz_format.xyz) in your project directory.
Tip: The [Browse] buttons allows you to browse and select files from anywhere on your computer or network drives.
4. Click the [OK] button. The system displays the Specify Maximum Database Sizes dialog.
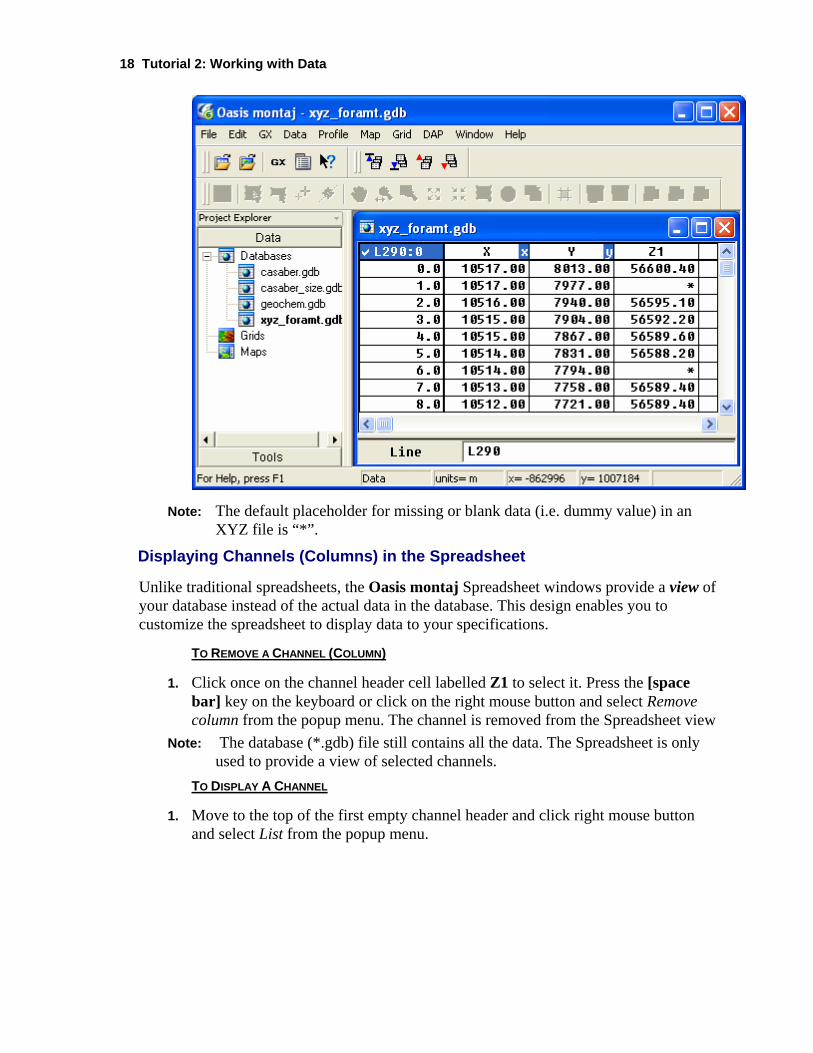
5. This dialog enables you to specify the maximum size of the database in which the file will be displayed. You can accept the intelligent defaults and click the [OK] button. The file will be displayed in a Geosoft database with the same name as the XYZ file, but with a (*.gdb) extension (xyz_format.gdb).
18 Tutorial 2: Working with Data
Note: The default placeholder for missing or blank data (i.e. dummy value) in an XYZ file is “*”.
Displaying Channels (Columns) in the Spreadsheet
Unlike traditional spreadsheets, the Oasis montaj Spreadsheet windows provide a view of your database instead of the actual data in the database. This design enables you to customize the spreadsheet to display data to your specifications.
TO REMOVE A CHANNEL (COLUMN)
1. Click once on the channel header cell labelled Z1 to select it. Press the [space bar] key on the keyboard or click on the right mouse button and select Remove column from the popup menu. The channel is removed from the Spreadsheet view
Note: The database (*.gdb) file still contains all the data. The Spreadsheet is only used to provide a view of selected channels.
TO DISPLAY A CHANNEL
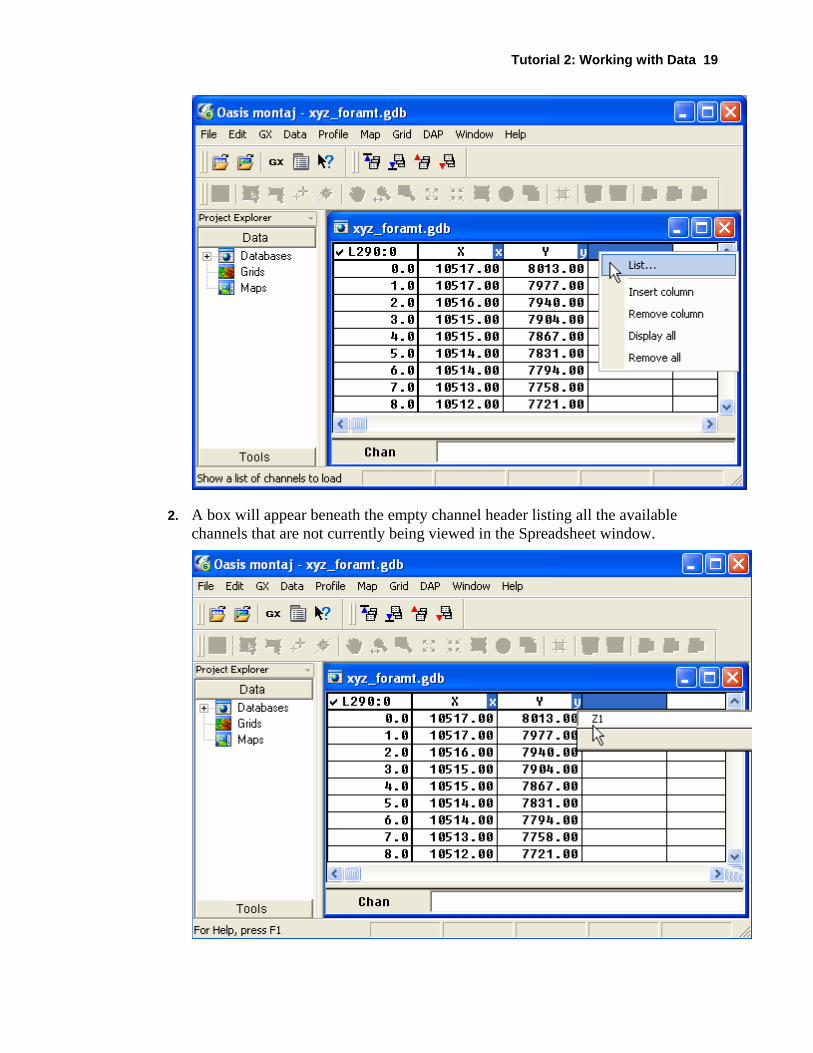
1. Move to the top of the first empty channel header and click right mouse button and select List from the popup menu.
Tutorial 2: Working with Data 19
2. A box will appear beneath the empty channel header listing all the available channels that are not currently being viewed in the Spreadsheet window.
20 Tutorial 2: Working with Data
3. Select Z1 and click the [OK] button, to display the channel in the Spreadsheet. Tip: If you know the name of the data channel already, you can simply position the
cursor on a specific Channel Header Cell, type the name and press the [Enter] key.
Note: The symbol ‘**’ in a channel cell indicates that the data are too wide for the spreadsheet column. To change the width of a column, place the cursor on the dividing line between the column headers. The cursor changes to a double arrow. Holding the left mouse button, drag the line to the right to increase the column width. Release the mouse button when done.
Displaying Basic Channel Statistics
After you open a Spreadsheet and display one or more channels, you can display and save the channel statistics.
TO CALCULATE BASIC STATISTICS ON A CHANNEL:
4. Click three times on the channel header cell labelled Z1 to select (highlight) the channel header and all of the lines in the database. The selected data is the data the system will calculate the statistics on.
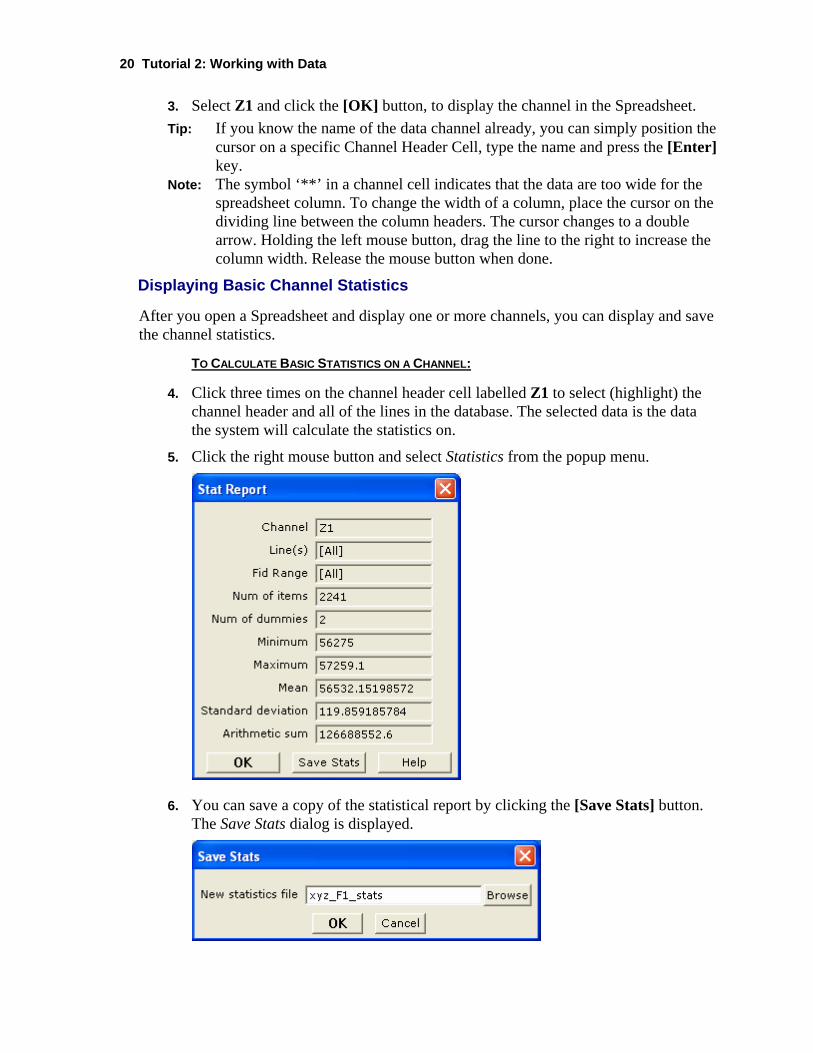
5. Click the right mouse button and select Statistics from the popup menu.
6. You can save a copy of the statistical report by clicking the [Save Stats] button. The Save Stats dialog is displayed.
Tutorial 2: Working with Data 21
7. In the New statistics file box, specify a file name (xyz_F1_stats.txt). Click the [OK] button to save the file to your project directory. Then, click the [OK] button to close the Stat Report dialog box.
The following list summarizes how to obtain results on specific parts of your database:
Click once on the channel header cell to highlight the header cell.
No statistics can be calculated.
Click twice (double click) on the channel header cell to highlight the data in the current line (group).
Statistics are calculated for that specific line of the database.
Click three times on the channel header cell to highlight the data in all of the selected lines (groups) in the database.
Channel statistics are calculated for all of the selected lines in the database.
Displaying Profiles in the Spreadsheet
After you open a Spreadsheet and display one or more channels, you have the option of displaying them as a graphical profile line. You can display profiles for one or more channels in your database. The profile appears in the profile windows directly below the corresponding database. You can have up to five windows displayed, with a maximum of 32 channels displayed in each window. Profile windows are linked dynamically to their corresponding database. When you select a value or range of values in either the database or profile window respectively, they are also highlighted in the other window.
For more information about the Profile window, please refer to the Help system.
TO DISPLAY A PROFILE:
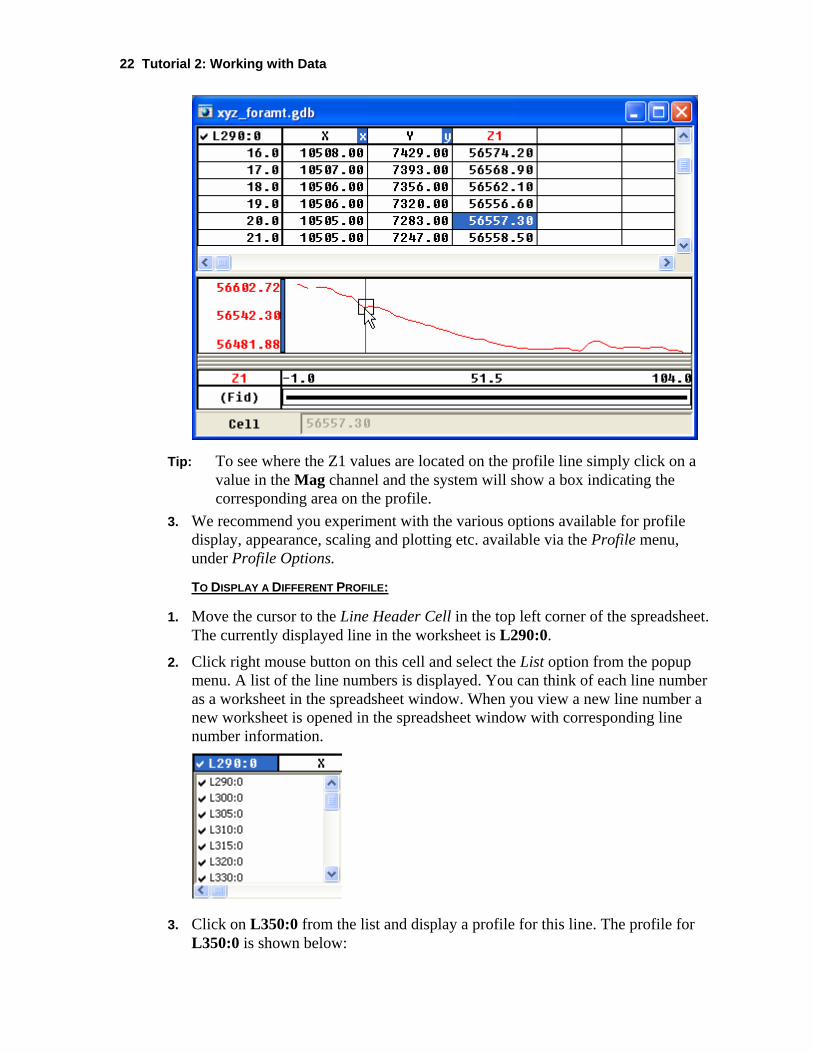
1. Click the left mouse button on the channel header cell labelled Z1 to highlight it. On the Profile menu, click Show Profile.
2. The system displays a profile of the data in the Profile Window below the spreadsheet.
22 Tutorial 2: Working with Data
Tip: To see where the Z1 values are located on the profile line simply click on a value in the Mag channel and the system will show a box indicating the corresponding area on the profile.
3. We recommend you experiment with the various options available for profile display, appearance, scaling and plotting etc. available via the Profile menu, under Profile Options.
TO DISPLAY A DIFFERENT PROFILE:
1. Move the cursor to the Line Header Cell in the top left corner of the spreadsheet. The currently displayed line in the worksheet is L290:0.
2. Click right mouse button on this cell and select the List option from the popup menu. A list of the line numbers is displayed. You can think of each line number as a worksheet in the spreadsheet window. When you view a new line number a new worksheet is opened in the spreadsheet window with corresponding line number information.
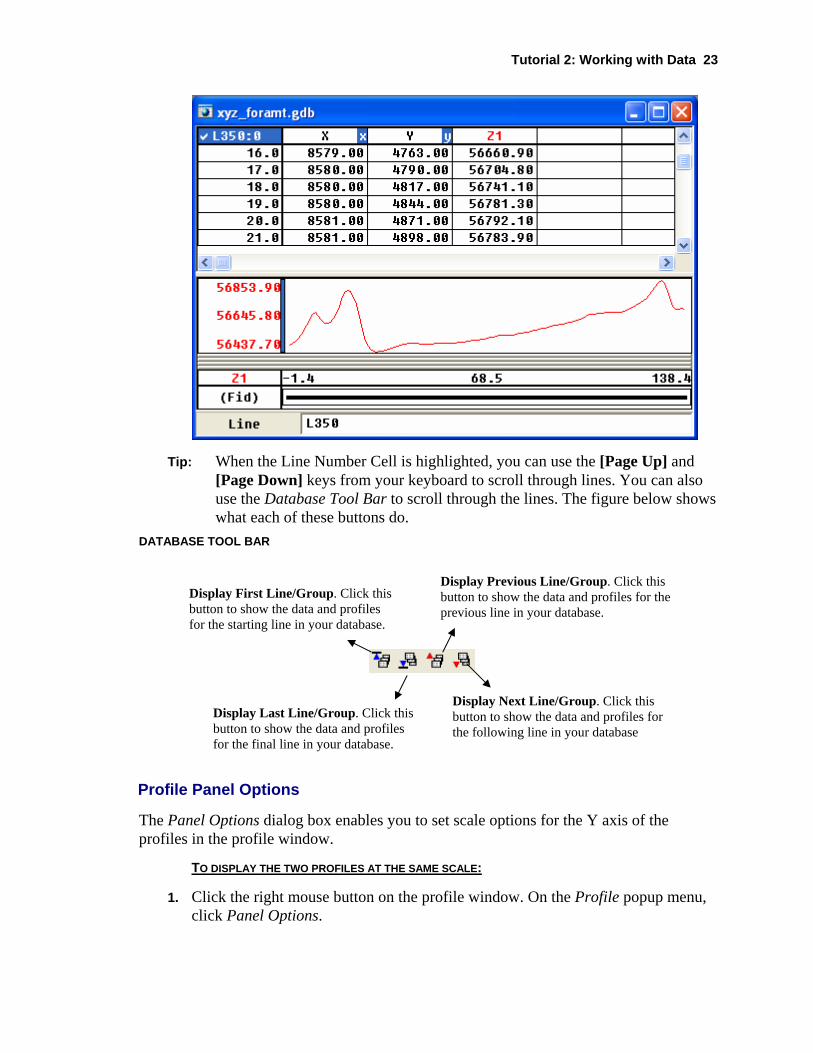
3. Click on L350:0 from the list and display a profile for this line. The profile for L350:0 is shown below:
Tutorial 2: Working with Data 23
Tip: When the Line Number Cell is highlighted, you can use the [Page Up] and [Page Down] keys from your keyboard to scroll through lines. You can also use the Database Tool Bar to scroll through the lines. The figure below shows what each of these buttons do.
DATABASE TOOL BAR
Profile Panel Options
The Panel Options dialog box enables you to set scale options for the Y axis of the profiles in the profile window.
TO DISPLAY THE TWO PROFILES AT THE SAME SCALE:
1. Click the right mouse button on the profile window. On the Profile popup menu, click Panel Options.
Display First Line/Group. Click this button to show the data and profiles for the starting line in your database.
Display Last Line/Group. Click this button to show the data and profiles for the final line in your database.
Display Previous Line/Group. Click this button to show the data and profiles for the previous line in your database.
Display Next Line/Group. Click this button to show the data and profiles for the following line in your database
24 Tutorial 2: Working with Data
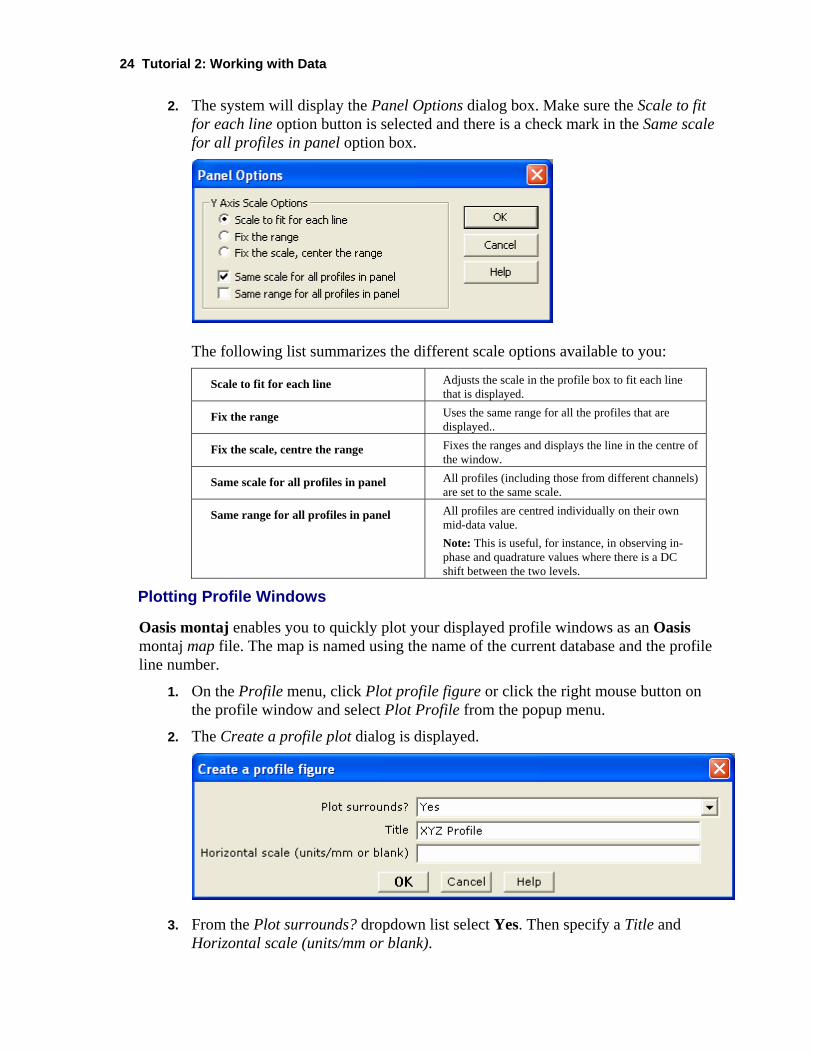
2. The system will display the Panel Options dialog box. Make sure the Scale to fit for each line option button is selected and there is a check mark in the Same scale for all profiles in panel option box.
The following list summarizes the different scale options available to you:
Scale to fit for each line Adjusts the scale in the profile box to fit each line that is displayed.
Fix the range Uses the same range for all the profiles that are displayed..
Fix the scale, centre the range Fixes the ranges and displays the line in the centre of the window.
Same scale for all profiles in panel All profiles (including those from different channels) are set to the same scale.
Same range for all profiles in panel
All profiles are centred individually on their own mid-data value. Note: This is useful, for instance, in observing in-phase and quadrature values where there is a DC shift between the two levels.
Plotting Profile Windows
Oasis montaj enables you to quickly plot your displayed profile windows as an Oasis montaj map file. The map is named using the name of the current database and the profile line number.
1. On the Profile menu, click Plot profile figure or click the right mouse button on the profile window and select Plot Profile from the popup menu.
2. The Create a profile plot dialog is displayed.
3. From the Plot surrounds? dropdown list select Yes. Then specify a Title and Horizontal scale (units/mm or blank).
Tutorial 2: Working with Data 25
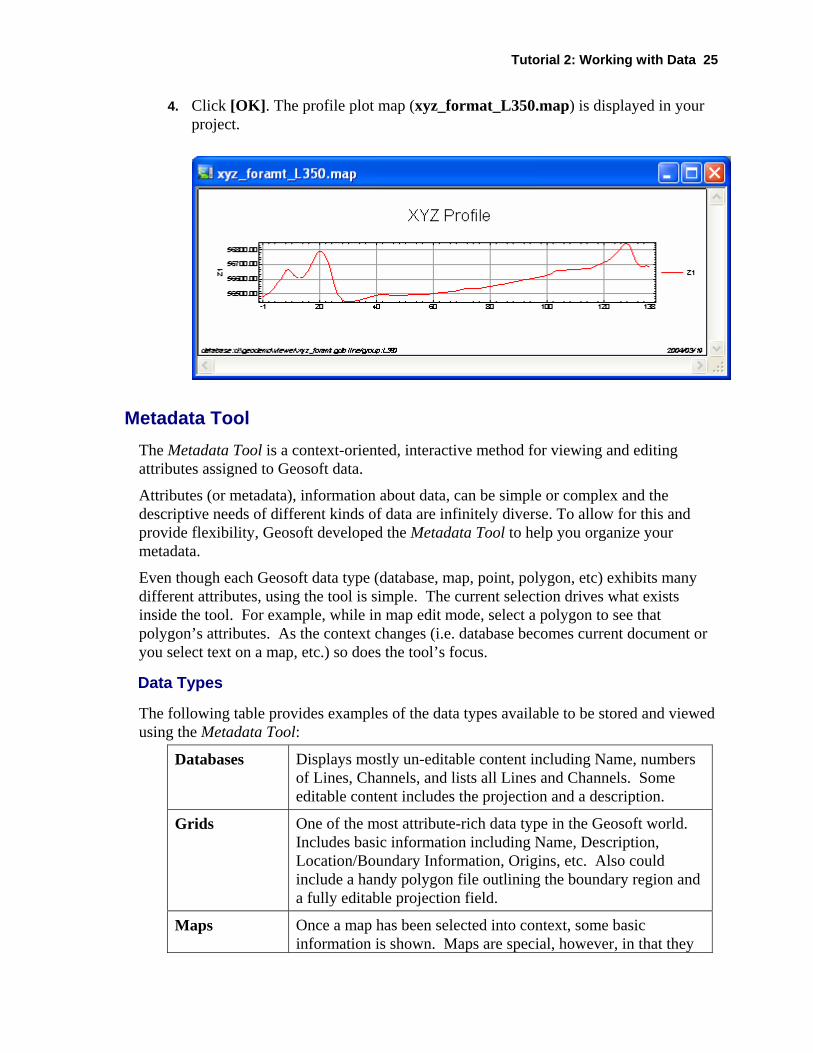
4. Click [OK]. The profile plot map (xyz_format_L350.map) is displayed in your project.
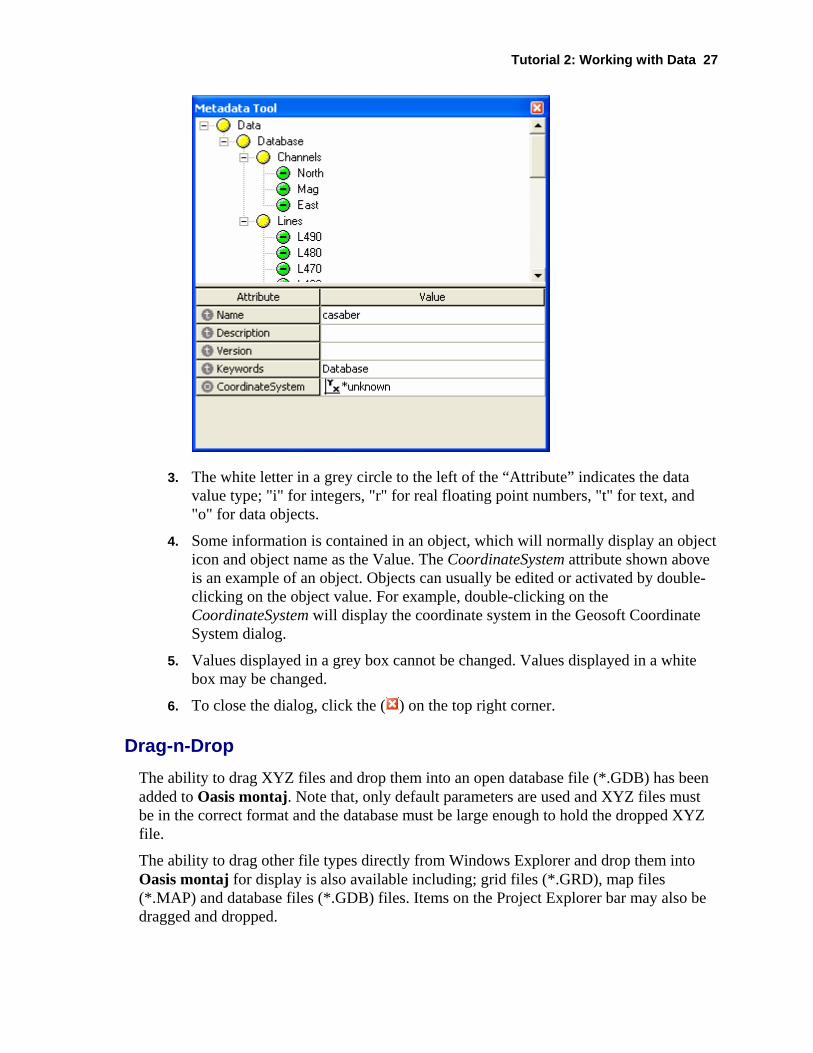
Metadata Tool The Metadata Tool is a context-oriented, interactive method for viewing and editing attributes assigned to Geosoft data.
Attributes (or metadata), information about data, can be simple or complex and the descriptive needs of different kinds of data are infinitely diverse. To allow for this and provide flexibility, Geosoft developed the Metadata Tool to help you organize your metadata.
Even though each Geosoft data type (database, map, point, polygon, etc) exhibits many different attributes, using the tool is simple. The current selection drives what exists inside the tool. For example, while in map edit mode, select a polygon to see that polygon’s attributes. As the context changes (i.e. database becomes current document or you select text on a map, etc.) so does the tool’s focus.
Data Types
The following table provides examples of the data types available to be stored and viewed using the Metadata Tool:
Databases Displays mostly un-editable content including Name, numbers of Lines, Channels, and lists all Lines and Channels. Some editable content includes the projection and a description.
Grids One of the most attribute-rich data type in the Geosoft world. Includes basic information including Name, Description, Location/Boundary Information, Origins, etc. Also could include a handy polygon file outlining the boundary region and a fully editable projection field.
Maps Once a map has been selected into context, some basic information is shown. Maps are special, however, in that they
26 Tutorial 2: Working with Data
can exhibit attribute information for specific map elements. For example, a polygon contains specific attributes which are displayed if a polygon is the current selection (only permitted in map edit mode).Map views and groups exhibit different characteristics and the tool is adjusted with each context change.Map elements (polygons, lines, points, etc.) exhibit their own attributes depending on the context chosen.
Global Settings Contains all the information need to customize and drive Oasis montaj sessions.
Note: Values displayed in a grey box cannot be edited. Values displayed in a white box may be edited.
TO VIEW METADATA:
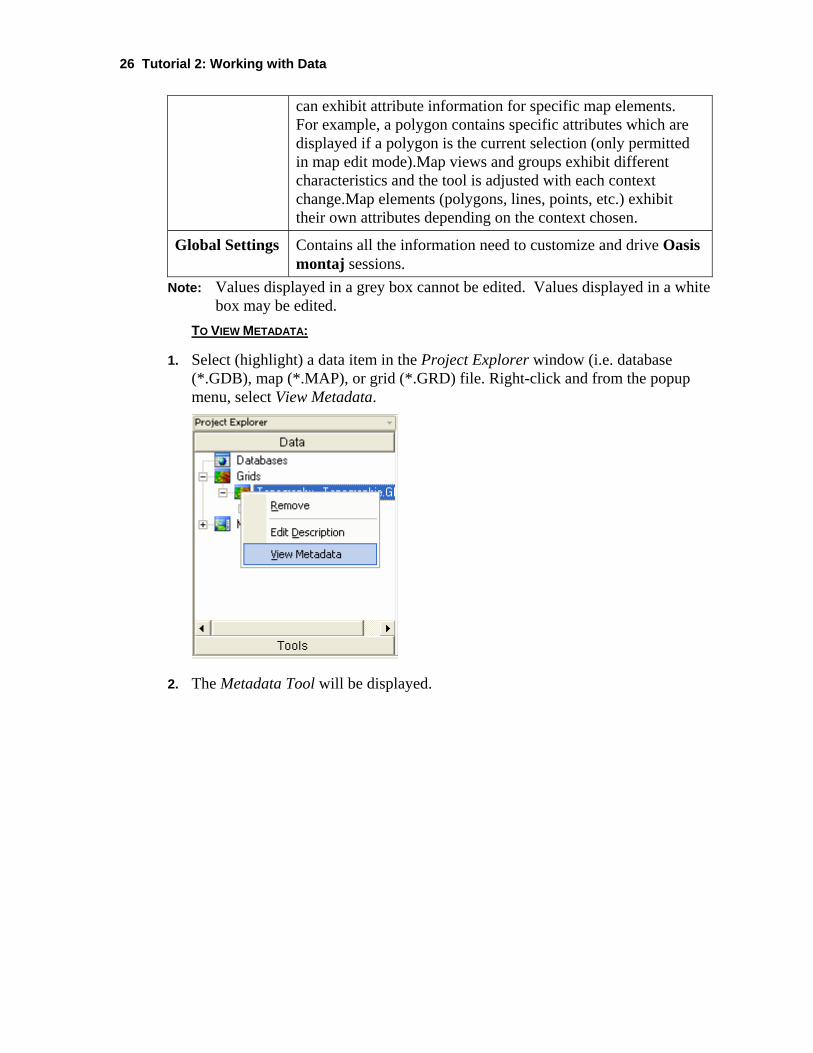
1. Select (highlight) a data item in the Project Explorer window (i.e. database (*.GDB), map (*.MAP), or grid (*.GRD) file. Right-click and from the popup menu, select View Metadata.
2. The Metadata Tool will be displayed.
Tutorial 2: Working with Data 27
3. The white letter in a grey circle to the left of the “Attribute” indicates the data value type; "i" for integers, "r" for real floating point numbers, "t" for text, and "o" for data objects.
4. Some information is contained in an object, which will normally display an object icon and object name as the Value. The CoordinateSystem attribute shown above is an example of an object. Objects can usually be edited or activated by double-clicking on the object value. For example, double-clicking on the CoordinateSystem will display the coordinate system in the Geosoft Coordinate System dialog.
5. Values displayed in a grey box cannot be changed. Values displayed in a white box may be changed.
6. To close the dialog, click the ( ) on the top right corner.
Drag-n-Drop The ability to drag XYZ files and drop them into an open database file (*.GDB) has been added to Oasis montaj. Note that, only default parameters are used and XYZ files must be in the correct format and the database must be large enough to hold the dropped XYZ file.
The ability to drag other file types directly from Windows Explorer and drop them into Oasis montaj for display is also available including; grid files (*.GRD), map files (*.MAP) and database files (*.GDB) files. Items on the Project Explorer bar may also be dragged and dropped.
28 Tutorial 2: Working with Data
Oasis montaj Maps In Oasis montaj, a Map is more than a printed sheet of information. Maps are special items that serve a number of purposes in the system. The map window provides the basic mechanism for creating maps, displaying images, and linking to other maps and data. To work effectively with maps, you need to be familiar with the purposes of maps in the system as well as the role of Views and Groups.
Maps use Views to organize and display information. A View divides the information on a map into a Base view, (e.g. map surrounds, north arrows, and scale bars) which uses paper coordinates, and a Data view, (e.g. map coordinates, contours, and grids) which uses ground coordinates.
Maps use Groups to determine the order in which objects are displayed (rendered) on a map. Groups are layered on top of each other in a specific order determined by the Map View/Group Manager Tool.
Displaying a Map
1. On the Map menu, click Open map. The Open Map dialog box is displayed.
2. Select the map file (Oasismontaj.map) and click [Open]. The map is opened in your project.
Adding Map Comments
1. On the Map menu, click Map comments.
2. The Default Text Editor (i.e. notepad) is displayed. Note: If you have not specified your Default Text Editor, the Select a default text
editor dialog is displayed. Using the [Browse] button, locate a text editor on your computer (notepad is recommended), and then click [OK].
3. Type your comments in the window, then save the file and exit the text editor. The comments are saved in the map file (*.map file).
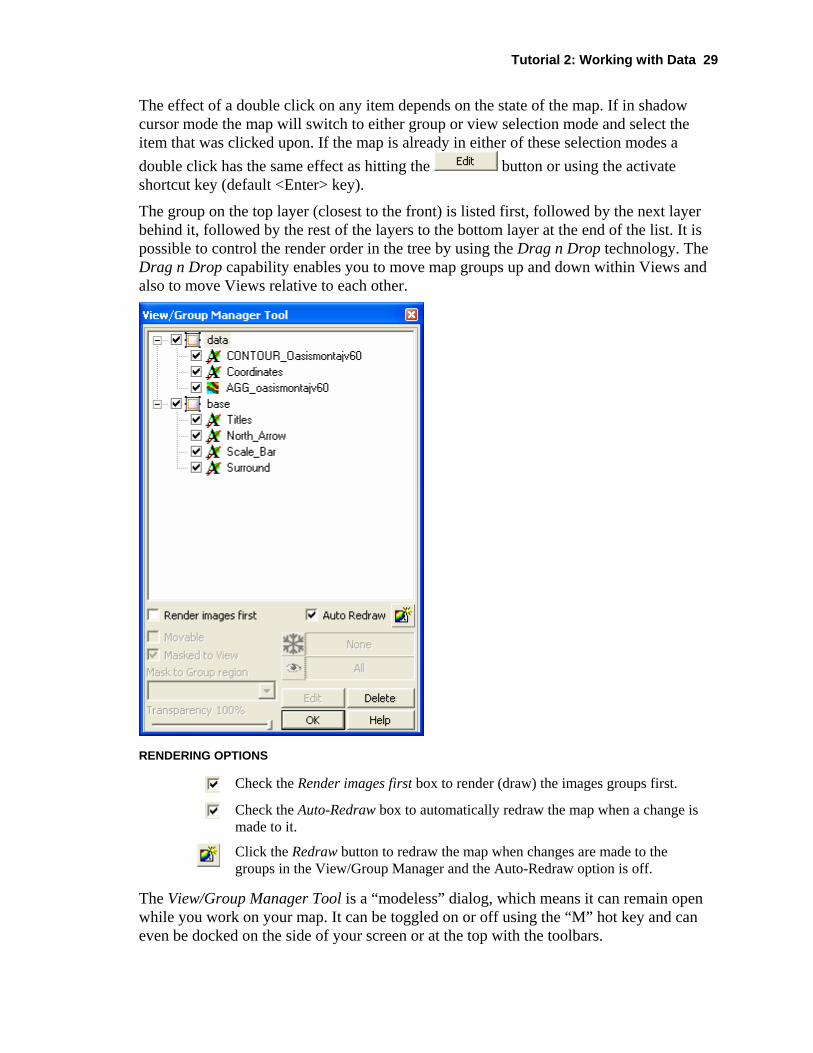
Using the Map View/Group Manager Tool
You can use the Map View/Group Manager tool ( ) to display and edit the Views and Groups in a map. This tool consists of a ‘tree’ structure that contains two main branches representing the Base view and the Data view. Under each view, a number of groups are listed according to their layer on the map
Each group in a view shows an icon beside its name that identifies the group as either a map vector object ( ) or an aggregate ( ). Views can either be normal 2D views ( ) or 3D views ( ). The check boxes in the tree controls and indicates visibility of an item.
To select single items in the tree click on the item desired. Multiple selections of groups within a view can be achieved by holding the <Ctrl> key and clicking on the desired items. Changing the selection during group editing will end group editing without cancelling any current changes.
Tutorial 2: Working with Data 29
The effect of a double click on any item depends on the state of the map. If in shadow cursor mode the map will switch to either group or view selection mode and select the item that was clicked upon. If the map is already in either of these selection modes a double click has the same effect as hitting the button or using the activate shortcut key (default <Enter> key).
The group on the top layer (closest to the front) is listed first, followed by the next layer behind it, followed by the rest of the layers to the bottom layer at the end of the list. It is possible to control the render order in the tree by using the Drag n Drop technology. The Drag n Drop capability enables you to move map groups up and down within Views and also to move Views relative to each other.
RENDERING OPTIONS
Check the Render images first box to render (draw) the images groups first.
Check the Auto-Redraw box to automatically redraw the map when a change is made to it.
Click the Redraw button to redraw the map when changes are made to the groups in the View/Group Manager and the Auto-Redraw option is off.
The View/Group Manager Tool is a “modeless” dialog, which means it can remain open while you work on your map. It can be toggled on or off using the “M” hot key and can even be docked on the side of your screen or at the top with the toolbars.
30 Tutorial 2: Working with Data
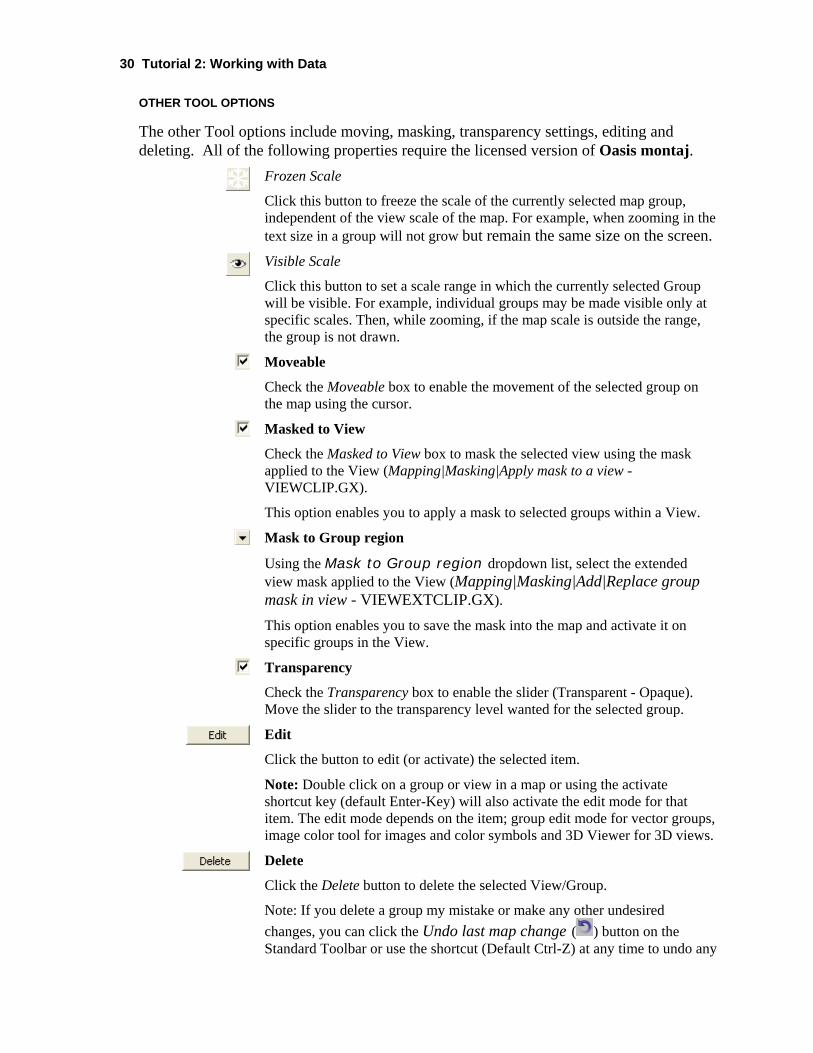
OTHER TOOL OPTIONS
The other Tool options include moving, masking, transparency settings, editing and deleting. All of the following properties require the licensed version of Oasis montaj.
Frozen Scale
Click this button to freeze the scale of the currently selected map group, independent of the view scale of the map. For example, when zooming in the text size in a group will not grow but remain the same size on the screen.
Visible Scale
Click this button to set a scale range in which the currently selected Group will be visible. For example, individual groups may be made visible only at specific scales. Then, while zooming, if the map scale is outside the range, the group is not drawn.
Moveable
Check the Moveable box to enable the movement of the selected group on the map using the cursor.
Masked to View
Check the Masked to View box to mask the selected view using the mask applied to the View (Mapping|Masking|Apply mask to a view - VIEWCLIP.GX).
This option enables you to apply a mask to selected groups within a View.
Mask to Group region
Using the Mask to Group region dropdown list, select the extended view mask applied to the View (Mapping|Masking|Add|Replace group mask in view - VIEWEXTCLIP.GX).
This option enables you to save the mask into the map and activate it on specific groups in the View.
Transparency
Check the Transparency box to enable the slider (Transparent - Opaque). Move the slider to the transparency level wanted for the selected group.
Edit
Click the button to edit (or activate) the selected item.
Note: Double click on a group or view in a map or using the activate shortcut key (default Enter-Key) will also activate the edit mode for that item. The edit mode depends on the item; group edit mode for vector groups, image color tool for images and color symbols and 3D Viewer for 3D views.
Delete
Click the Delete button to delete the selected View/Group.
Note: If you delete a group my mistake or make any other undesired changes, you can click the Undo last map change ( ) button on the Standard Toolbar or use the shortcut (Default Ctrl-Z) at any time to undo any
Tutorial 2: Working with Data 31
changes and revert to the original map.
Using the Viewer Tool Bars
The following Tool Bars can be displayed in the Oasis montaj Viewer. Note that the Database Tool Bar can be found on page 23.
To Show|Hide tool bars, on the Tools tab of the Project Explorer select the tool bar of interest, right-click and select Show|Hide from the popup menu.
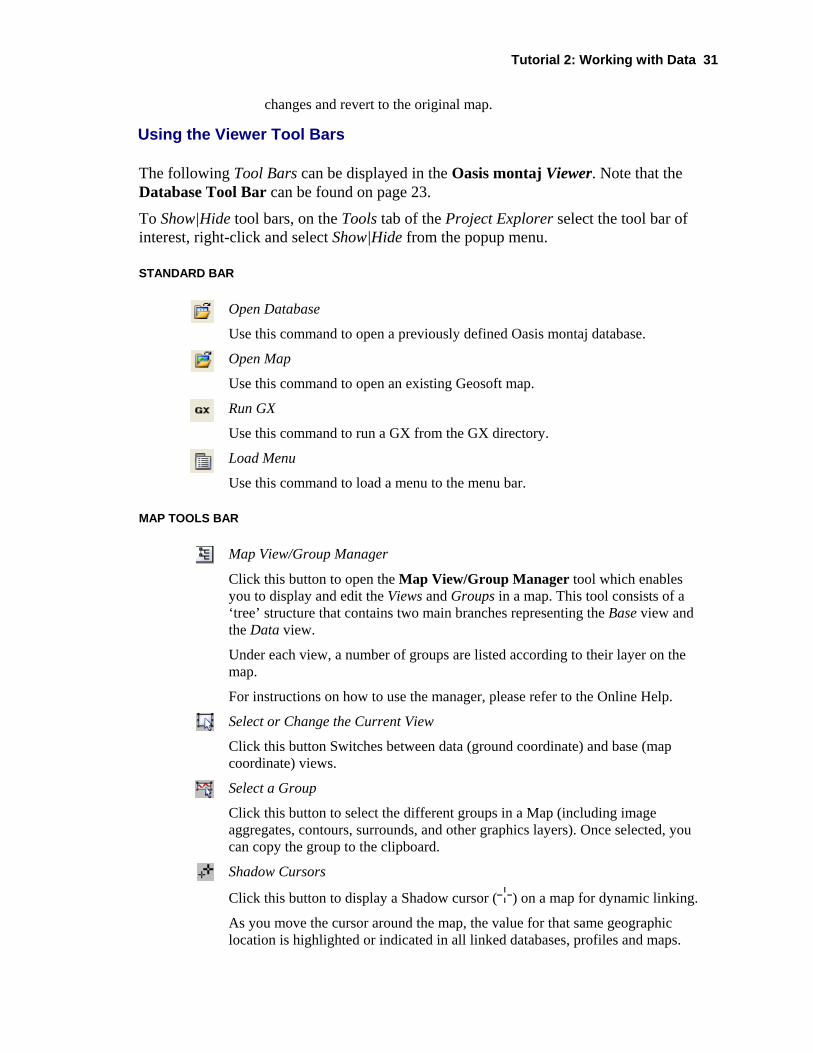
STANDARD BAR
Open Database
Use this command to open a previously defined Oasis montaj database.
Open Map
Use this command to open an existing Geosoft map.
Run GX
Use this command to run a GX from the GX directory.
Load Menu
Use this command to load a menu to the menu bar.
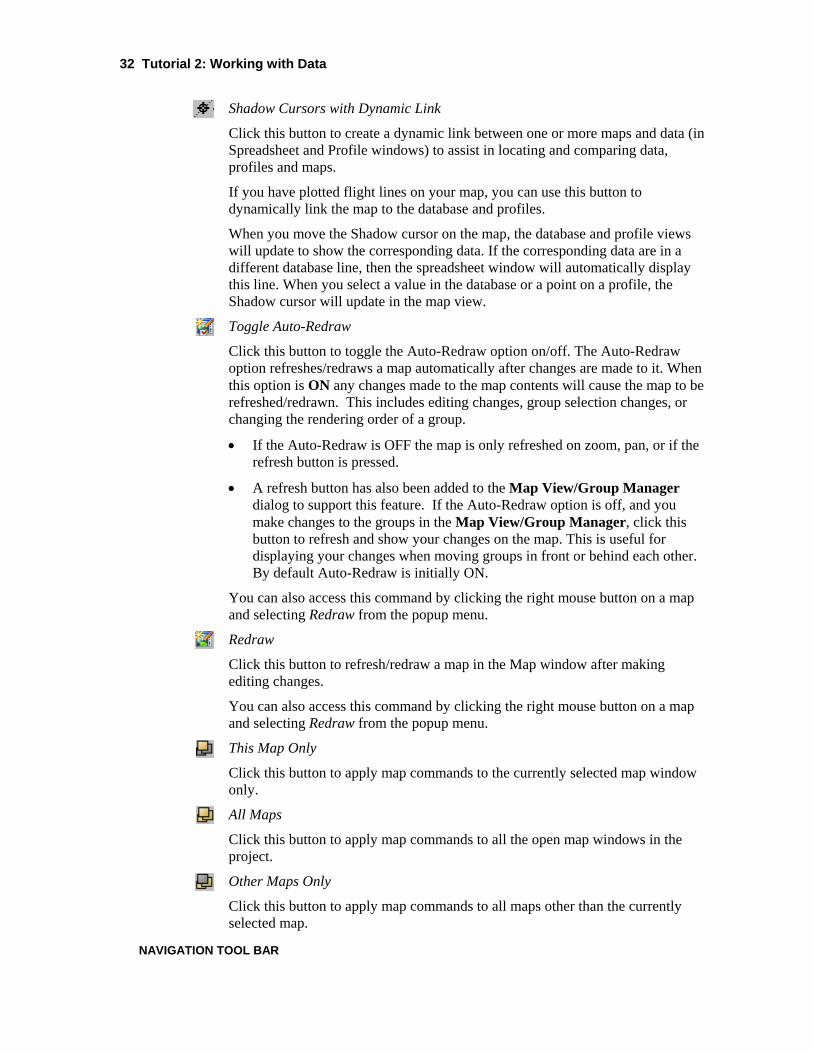
MAP TOOLS BAR
Map View/Group Manager
Click this button to open the Map View/Group Manager tool which enables you to display and edit the Views and Groups in a map. This tool consists of a ‘tree’ structure that contains two main branches representing the Base view and the Data view.
Under each view, a number of groups are listed according to their layer on the map.
For instructions on how to use the manager, please refer to the Online Help.
Select or Change the Current View
Click this button Switches between data (ground coordinate) and base (map coordinate) views.
Select a Group
Click this button to select the different groups in a Map (including image aggregates, contours, surrounds, and other graphics layers). Once selected, you can copy the group to the clipboard.
Shadow Cursors
Click this button to display a Shadow cursor ( ) on a map for dynamic linking.
As you move the cursor around the map, the value for that same geographic location is highlighted or indicated in all linked databases, profiles and maps.
32 Tutorial 2: Working with Data
Shadow Cursors with Dynamic Link
Click this button to create a dynamic link between one or more maps and data (in Spreadsheet and Profile windows) to assist in locating and comparing data, profiles and maps.
If you have plotted flight lines on your map, you can use this button to dynamically link the map to the database and profiles.
When you move the Shadow cursor on the map, the database and profile views will update to show the corresponding data. If the corresponding data are in a different database line, then the spreadsheet window will automatically display this line. When you select a value in the database or a point on a profile, the Shadow cursor will update in the map view.
Toggle Auto-Redraw
Click this button to toggle the Auto-Redraw option on/off. The Auto-Redraw option refreshes/redraws a map automatically after changes are made to it. When this option is ON any changes made to the map contents will cause the map to be refreshed/redrawn. This includes editing changes, group selection changes, or changing the rendering order of a group.
• If the Auto-Redraw is OFF the map is only refreshed on zoom, pan, or if the refresh button is pressed.
• A refresh button has also been added to the Map View/Group Manager dialog to support this feature. If the Auto-Redraw option is off, and you make changes to the groups in the Map View/Group Manager, click this button to refresh and show your changes on the map. This is useful for displaying your changes when moving groups in front or behind each other. By default Auto-Redraw is initially ON.
You can also access this command by clicking the right mouse button on a map and selecting Redraw from the popup menu.
Redraw
Click this button to refresh/redraw a map in the Map window after making editing changes.
You can also access this command by clicking the right mouse button on a map and selecting Redraw from the popup menu.
This Map Only
Click this button to apply map commands to the currently selected map window only.
All Maps
Click this button to apply map commands to all the open map windows in the project.
Other Maps Only
Click this button to apply map commands to all maps other than the currently selected map.
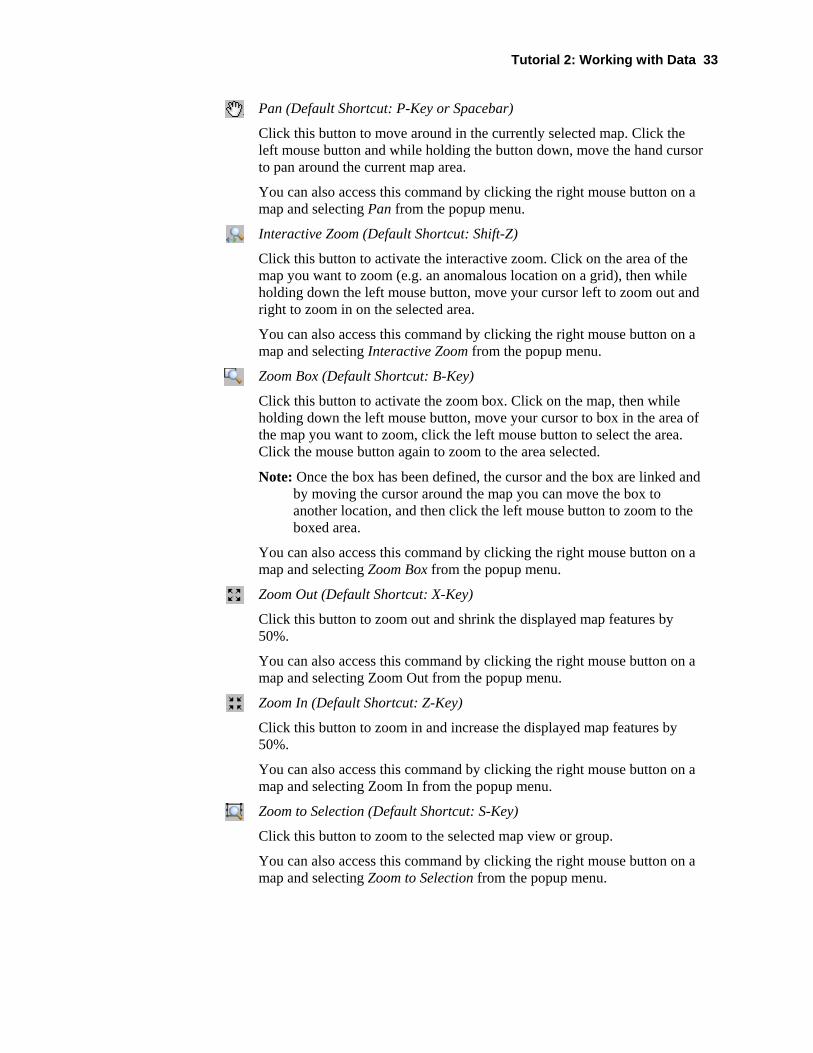
NAVIGATION TOOL BAR
Tutorial 2: Working with Data 33
Pan (Default Shortcut: P-Key or Spacebar)
Click this button to move around in the currently selected map. Click the left mouse button and while holding the button down, move the hand cursor to pan around the current map area.
You can also access this command by clicking the right mouse button on a map and selecting Pan from the popup menu. Interactive Zoom (Default Shortcut: Shift-Z)
Click this button to activate the interactive zoom. Click on the area of the map you want to zoom (e.g. an anomalous location on a grid), then while holding down the left mouse button, move your cursor left to zoom out and right to zoom in on the selected area.
You can also access this command by clicking the right mouse button on a map and selecting Interactive Zoom from the popup menu. Zoom Box (Default Shortcut: B-Key)
Click this button to activate the zoom box. Click on the map, then while holding down the left mouse button, move your cursor to box in the area of the map you want to zoom, click the left mouse button to select the area. Click the mouse button again to zoom to the area selected.
Note: Once the box has been defined, the cursor and the box are linked and by moving the cursor around the map you can move the box to another location, and then click the left mouse button to zoom to the boxed area.
You can also access this command by clicking the right mouse button on a map and selecting Zoom Box from the popup menu. Zoom Out (Default Shortcut: X-Key)
Click this button to zoom out and shrink the displayed map features by 50%.
You can also access this command by clicking the right mouse button on a map and selecting Zoom Out from the popup menu. Zoom In (Default Shortcut: Z-Key)
Click this button to zoom in and increase the displayed map features by 50%.
You can also access this command by clicking the right mouse button on a map and selecting Zoom In from the popup menu.
Zoom to Selection (Default Shortcut: S-Key)
Click this button to zoom to the selected map view or group.
You can also access this command by clicking the right mouse button on a map and selecting Zoom to Selection from the popup menu.
34 Tutorial 2: Working with Data
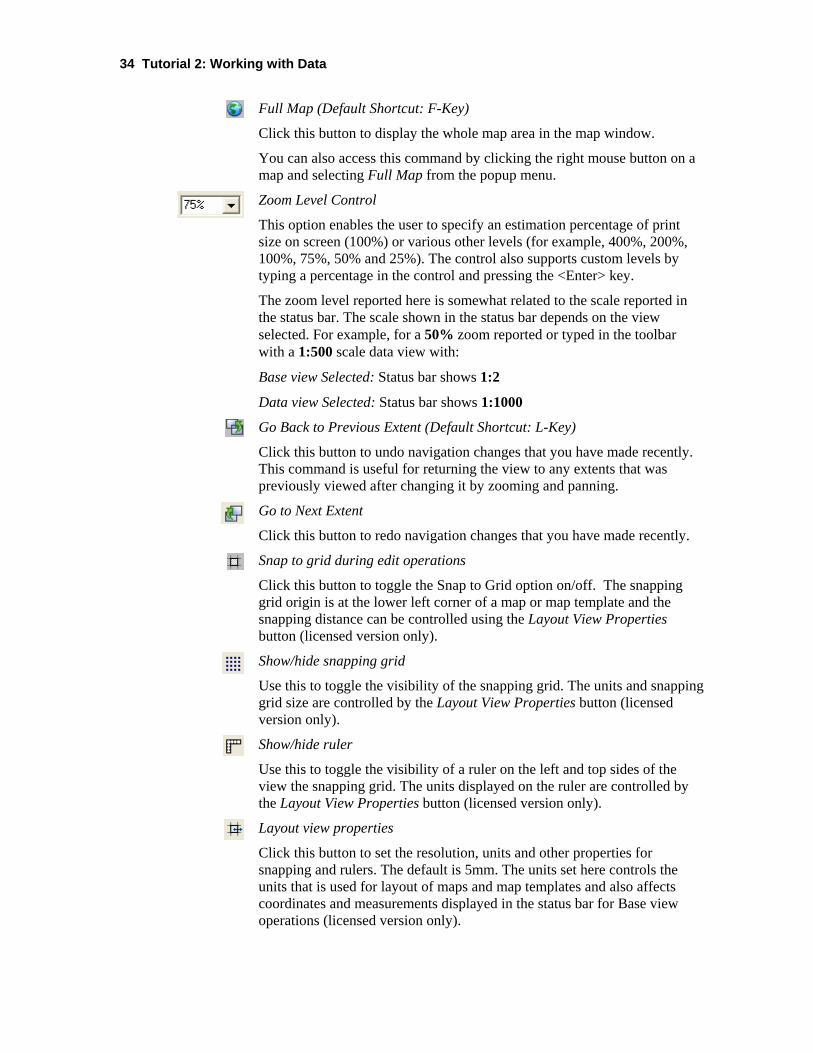
Full Map (Default Shortcut: F-Key)
Click this button to display the whole map area in the map window.
You can also access this command by clicking the right mouse button on a map and selecting Full Map from the popup menu. Zoom Level Control
This option enables the user to specify an estimation percentage of print size on screen (100%) or various other levels (for example, 400%, 200%, 100%, 75%, 50% and 25%). The control also supports custom levels by typing a percentage in the control and pressing the <Enter> key.
The zoom level reported here is somewhat related to the scale reported in the status bar. The scale shown in the status bar depends on the view selected. For example, for a 50% zoom reported or typed in the toolbar with a 1:500 scale data view with:
Base view Selected: Status bar shows 1:2
Data view Selected: Status bar shows 1:1000
Go Back to Previous Extent (Default Shortcut: L-Key)
Click this button to undo navigation changes that you have made recently. This command is useful for returning the view to any extents that was previously viewed after changing it by zooming and panning.
Go to Next Extent
Click this button to redo navigation changes that you have made recently.
Snap to grid during edit operations
Click this button to toggle the Snap to Grid option on/off. The snapping grid origin is at the lower left corner of a map or map template and the snapping distance can be controlled using the Layout View Properties button (licensed version only).
Show/hide snapping grid
Use this to toggle the visibility of the snapping grid. The units and snapping grid size are controlled by the Layout View Properties button (licensed version only).
Show/hide ruler
Use this to toggle the visibility of a ruler on the left and top sides of the view the snapping grid. The units displayed on the ruler are controlled by the Layout View Properties button (licensed version only).
Layout view properties
Click this button to set the resolution, units and other properties for snapping and rulers. The default is 5mm. The units set here controls the units that is used for layout of maps and map templates and also affects coordinates and measurements displayed in the status bar for Base view operations (licensed version only).
Tutorial 2: Working with Data 35
Displaying Grids and Images on a Map
In Oasis montaj, grids and images are always displayed on a map in the Map window. There are several types of grids and images you can display. For a complete list of the grid and image formats that are supported in Oasis montaj see the online help topic Data Exchange formats.
In Oasis montaj, a Grid is a visual representation of a survey area interpolated from a series of survey points. For example, magnetic survey data are collected as a series of point values organized using a number of lines and arranged in a grid pattern.
When you create a grid, Oasis montaj takes these point values from the database and interpolates between them, creating a visual representation similar to a contour map. However, instead of simple contour lines, colours and shading are used to represent the magnetic differences across the grid.
There are two types of images in Oasis montaj, Raster and Vector images.
Raster Images
Raster images or bitmap graphics (.bmp, .tif, and .jpg) are created from a series of pixels to represent graphics. Each pixel in a bitmap image has a specific location and colour value assigned to it.
Bitmap images are resolution dependent—that is, they represent a fixed number of pixels. As a result, they can appear jagged and lose detail if they are scaled on-screen or if they are printed at a higher resolution than they were created for.
Vector Images
Drawing programs such as AutoCAD create vector graphics (.dxf, .eps, .wmf), made of lines and curves defined by mathematical objects called vectors. Vectors describe graphics according to their geometric characteristics. The Oasis montaj CAD drawing tools (licensed version) enable you to draw vector lines and shapes.
A vector graphic is resolution-independent—that is, it can be scaled to any size and printed on any output device at any resolution without losing its detail or clarity. As a result, vector graphics are the best choice for type (especially small type) and bold graphics that must retain crisp lines when scaled to various sizes—for example, logos.
Because computer monitors represent images by displaying them on a grid, both vector and bitmap images are displayed as pixels on-screen.
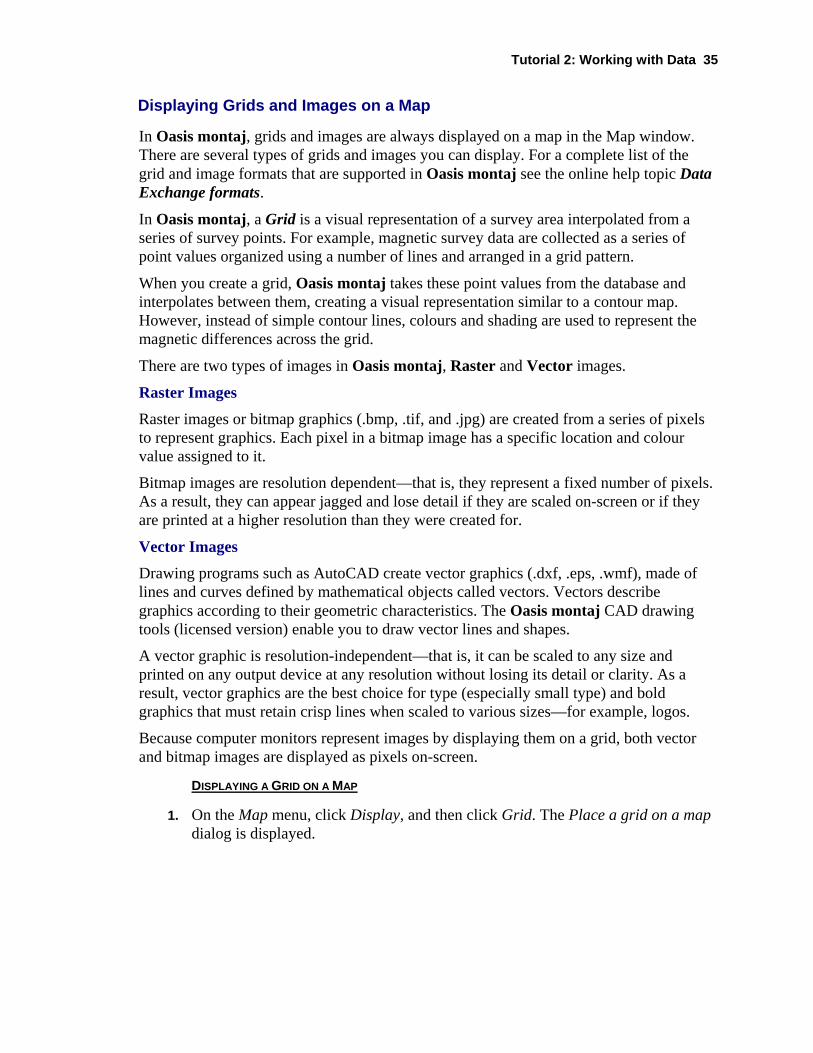
DISPLAYING A GRID ON A MAP
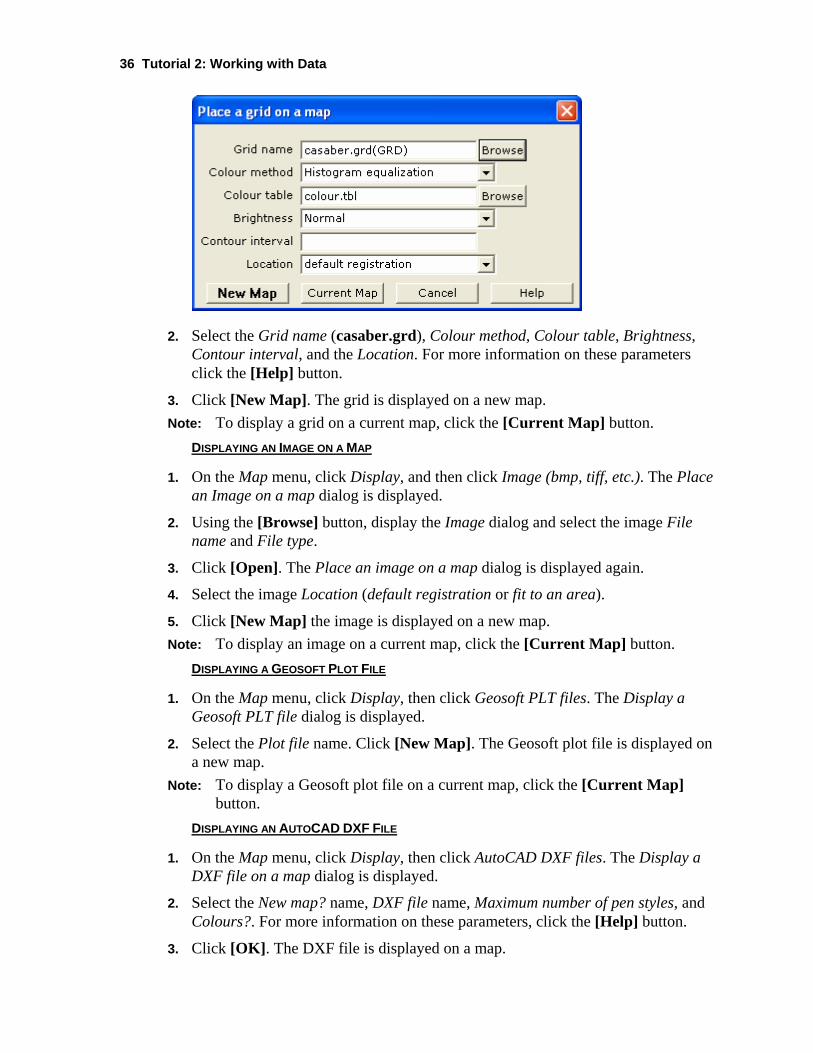
1. On the Map menu, click Display, and then click Grid. The Place a grid on a map dialog is displayed.
36 Tutorial 2: Working with Data
2. Select the Grid name (casaber.grd), Colour method, Colour table, Brightness, Contour interval, and the Location. For more information on these parameters click the [Help] button.
3. Click [New Map]. The grid is displayed on a new map. Note: To display a grid on a current map, click the [Current Map] button.
DISPLAYING AN IMAGE ON A MAP
1. On the Map menu, click Display, and then click Image (bmp, tiff, etc.). The Place an Image on a map dialog is displayed.
2. Using the [Browse] button, display the Image dialog and select the image File name and File type.
3. Click [Open]. The Place an image on a map dialog is displayed again.
4. Select the image Location (default registration or fit to an area).
5. Click [New Map] the image is displayed on a new map. Note: To display an image on a current map, click the [Current Map] button.
DISPLAYING A GEOSOFT PLOT FILE
1. On the Map menu, click Display, then click Geosoft PLT files. The Display a Geosoft PLT file dialog is displayed.
2. Select the Plot file name. Click [New Map]. The Geosoft plot file is displayed on a new map.
Note: To display a Geosoft plot file on a current map, click the [Current Map] button.
DISPLAYING AN AUTOCAD DXF FILE
1. On the Map menu, click Display, then click AutoCAD DXF files. The Display a DXF file on a map dialog is displayed.
2. Select the New map? name, DXF file name, Maximum number of pen styles, and Colours?. For more information on these parameters, click the [Help] button.
3. Click [OK]. The DXF file is displayed on a map.
Tutorial 2: Working with Data 37
Data Access Protocol (DAP)
DAP is a technology that enables efficient transfer of high volume spatial data from a designated DAP data server to a DAP client via the Internet or an Intranet. There are two types of DAP clients, a thick client (a desktop software application) and a thin client (web browser).
Oasis montaj, MapInfo and ArcGIS are thick DAP client software applications. Thick client applications enable you to download and save the actual data to your hard drive, so you can use the data in Oasis montaj or any other GIS or spatial data processing program.
Thin clients, like Geosoft’s DAP Data Explorer use a web browser to browse, view and extract data from a DAP server. Visit www.geodap.com/map/ and see how it works!
Geosoft’s DAP capability enables users of both the free Viewer and licensed applications to access Geosoft’s public DAP server. This server contains global topographic, coastline and river data as well as magnetic and gravity data for North America and Australia. These data sets (grid and point data) can be used to create sample maps in Oasis montaj and to learn about the newest technology for accessing high volume data via the Internet.
Additional public access DAP servers are expected to go online soon, for more information visit: www.geodap.com/map/
DAP’s main features include:
• Large Volume Data Transfer: DAP technology handles the efficient transfer of very high-volume data, and its associated metadata, through a streaming technology.
• Spatially Aware: DAP is spatially aware, enabling user-specified spatial querying and retrieval.
• Ready-to-use Data: DAP provides localized data that matches your current Oasis montaj map window and projection information.
• Safe and Efficient Data Transfer: DAP data transfer technology provides direct DAP client/server communication enabling the transfer of compressed data that maintains original data integrity.
TO ACCESS THE DAP SERVER:
Data on Geosoft’s DAP server can be accessed through the Oasis montaj DAP menu. Once connection to a DAP server has been established the server will determine what grid data matches the data view of your map. You will then be presented with a list of data that is available to be downloaded and displayed on your map.
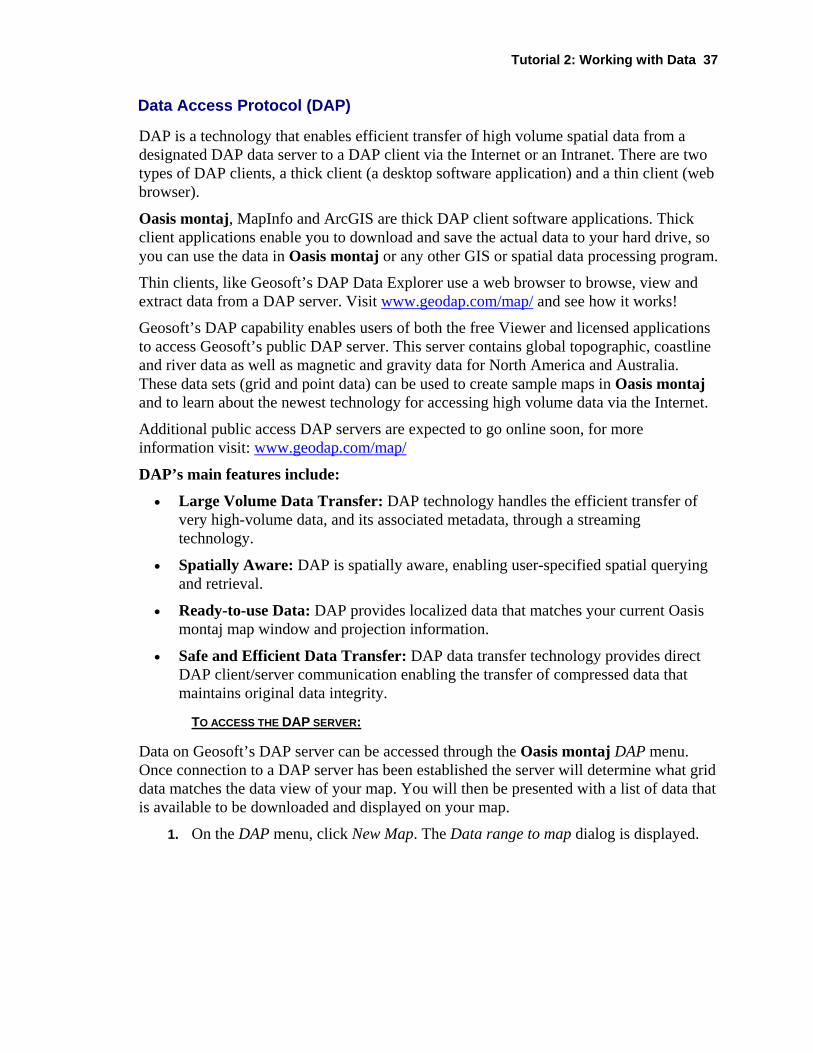
1. On the DAP menu, click New Map. The Data range to map dialog is displayed.
38 Tutorial 2: Working with Data
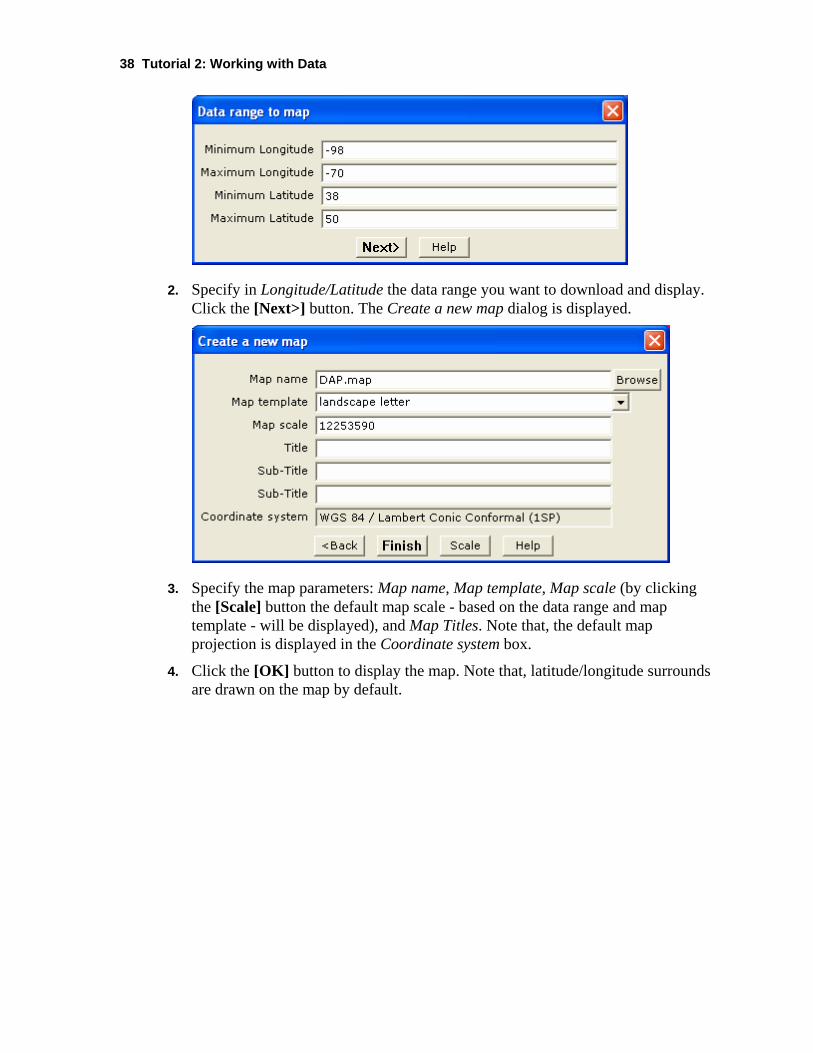
2. Specify in Longitude/Latitude the data range you want to download and display. Click the [Next>] button. The Create a new map dialog is displayed.
3. Specify the map parameters: Map name, Map template, Map scale (by clicking the [Scale] button the default map scale - based on the data range and map template - will be displayed), and Map Titles. Note that, the default map projection is displayed in the Coordinate system box.
4. Click the [OK] button to display the map. Note that, latitude/longitude surrounds are drawn on the map by default.
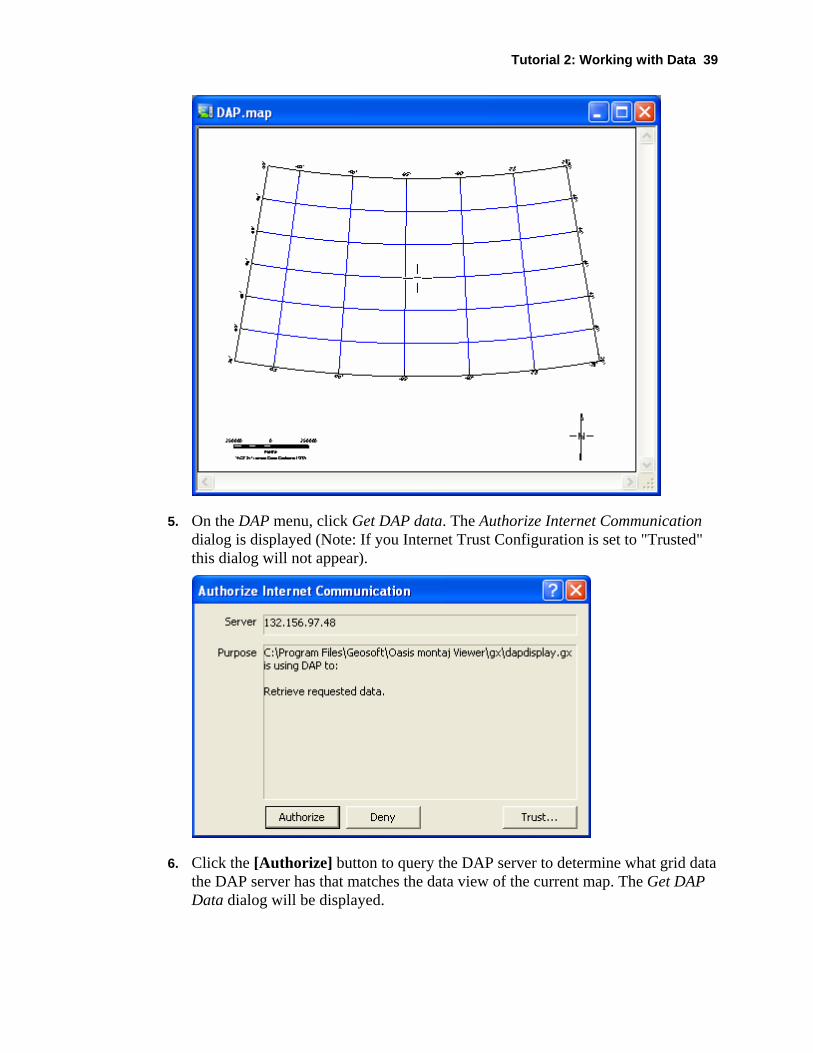
Tutorial 2: Working with Data 39
5. On the DAP menu, click Get DAP data. The Authorize Internet Communication dialog is displayed (Note: If you Internet Trust Configuration is set to "Trusted" this dialog will not appear).
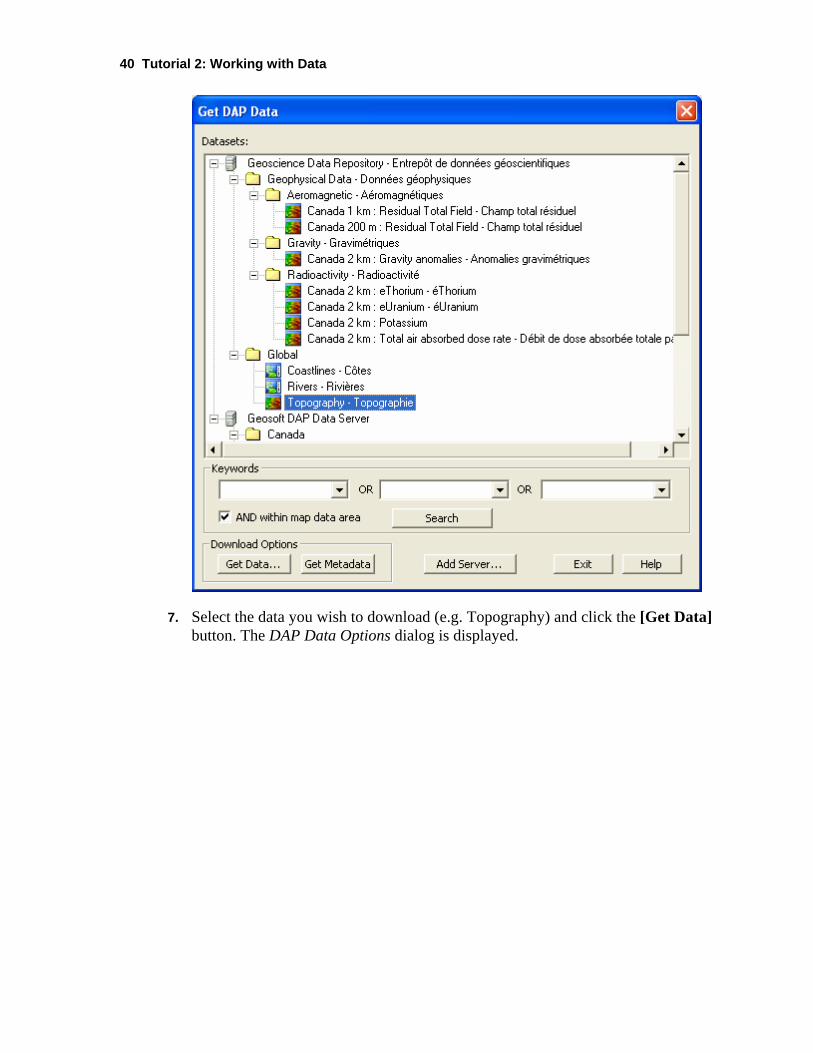
6. Click the [Authorize] button to query the DAP server to determine what grid data the DAP server has that matches the data view of the current map. The Get DAP Data dialog will be displayed.
40 Tutorial 2: Working with Data
7. Select the data you wish to download (e.g. Topography) and click the [Get Data] button. The DAP Data Options dialog is displayed.
Tutorial 2: Working with Data 41
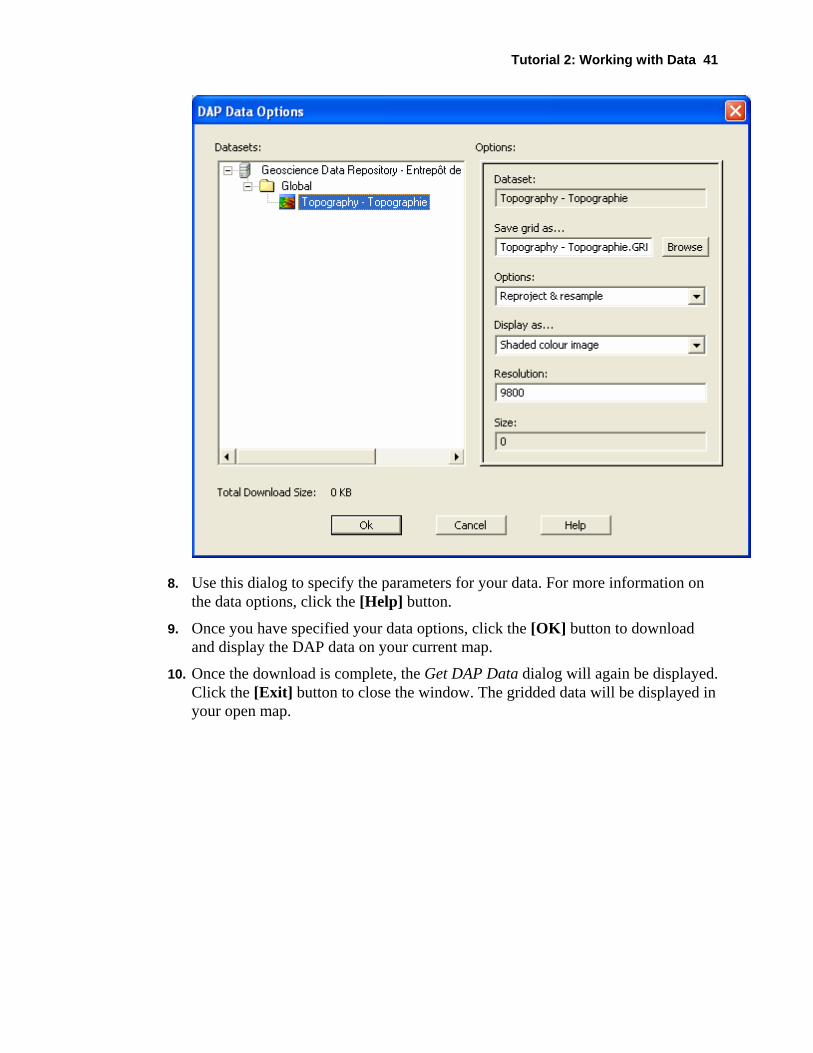
8. Use this dialog to specify the parameters for your data. For more information on the data options, click the [Help] button.
9. Once you have specified your data options, click the [OK] button to download and display the DAP data on your current map.
10. Once the download is complete, the Get DAP Data dialog will again be displayed. Click the [Exit] button to close the window. The gridded data will be displayed in your open map.
42 Tutorial 2: Working with Data
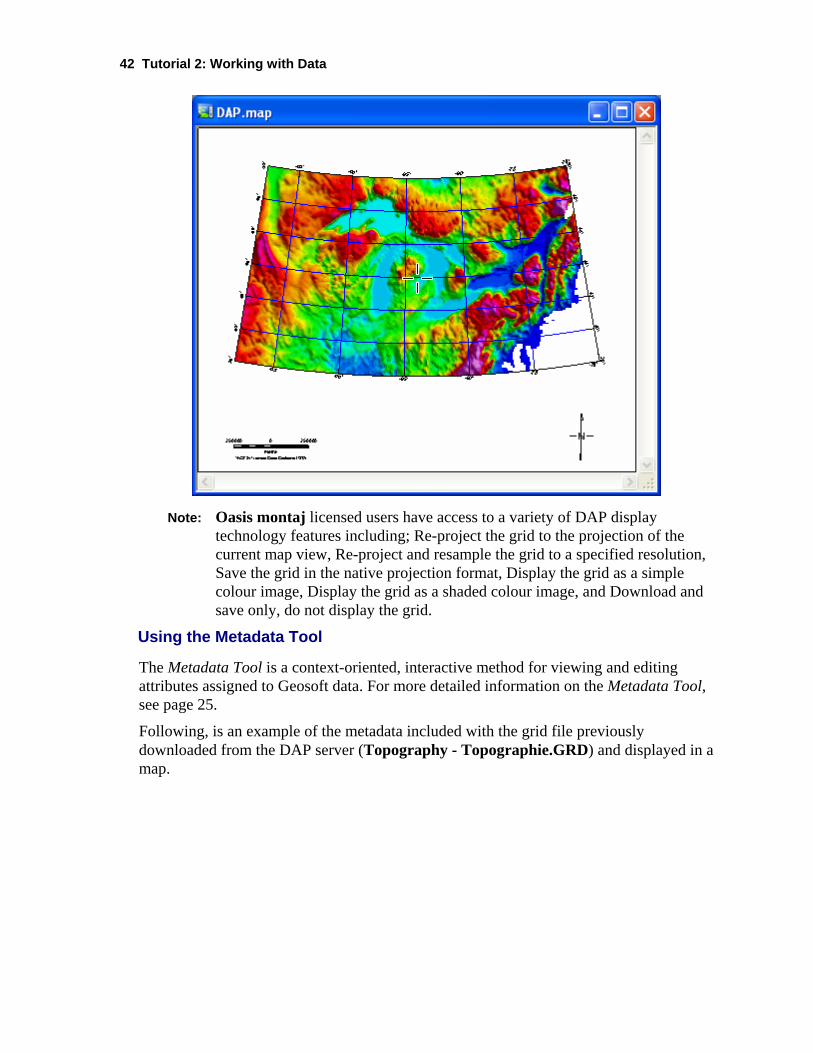
Note: Oasis montaj licensed users have access to a variety of DAP display technology features including; Re-project the grid to the projection of the current map view, Re-project and resample the grid to a specified resolution, Save the grid in the native projection format, Display the grid as a simple colour image, Display the grid as a shaded colour image, and Download and save only, do not display the grid.
Using the Metadata Tool
The Metadata Tool is a context-oriented, interactive method for viewing and editing attributes assigned to Geosoft data. For more detailed information on the Metadata Tool, see page 25.
Following, is an example of the metadata included with the grid file previously downloaded from the DAP server (Topography - Topographie.GRD) and displayed in a map.
Tutorial 2: Working with Data 43
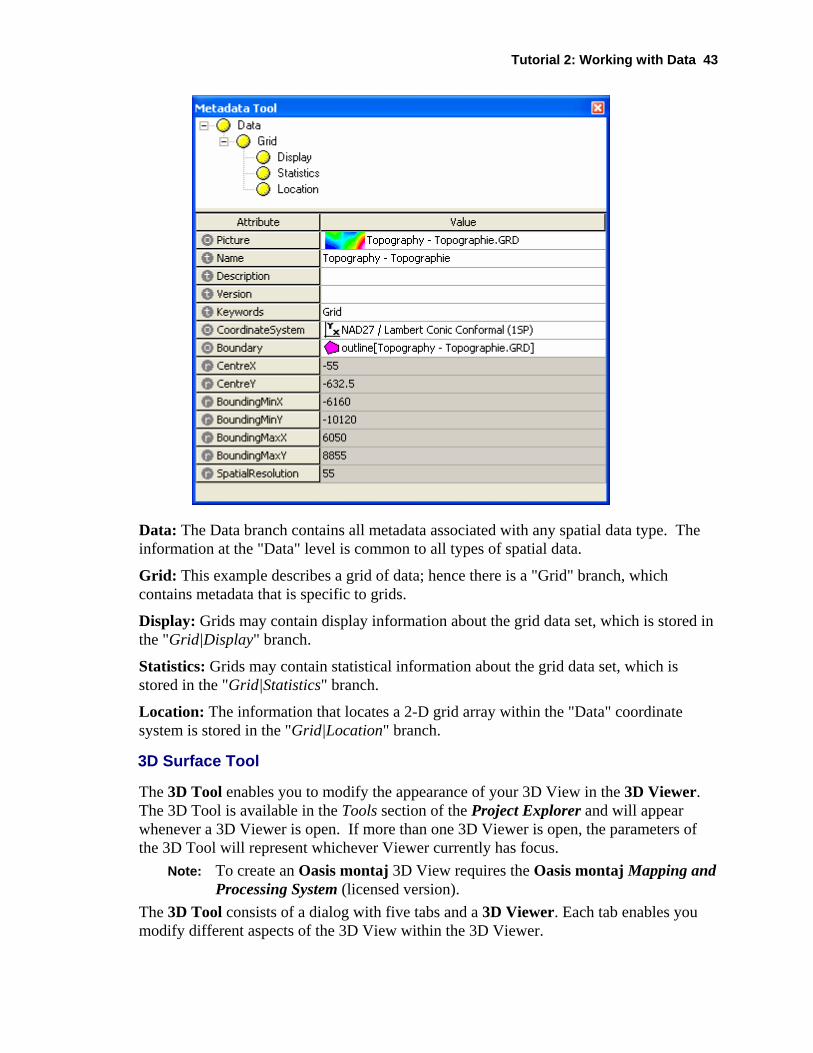
Data: The Data branch contains all metadata associated with any spatial data type. The information at the "Data" level is common to all types of spatial data.
Grid: This example describes a grid of data; hence there is a "Grid" branch, which contains metadata that is specific to grids.
Display: Grids may contain display information about the grid data set, which is stored in the "Grid|Display" branch.
Statistics: Grids may contain statistical information about the grid data set, which is stored in the "Grid|Statistics" branch.
Location: The information that locates a 2-D grid array within the "Data" coordinate system is stored in the "Grid|Location" branch.
3D Surface Tool
The 3D Tool enables you to modify the appearance of your 3D View in the 3D Viewer. The 3D Tool is available in the Tools section of the Project Explorer and will appear whenever a 3D Viewer is open. If more than one 3D Viewer is open, the parameters of the 3D Tool will represent whichever Viewer currently has focus.
Note: To create an Oasis montaj 3D View requires the Oasis montaj Mapping and Processing System (licensed version).
The 3D Tool consists of a dialog with five tabs and a 3D Viewer. Each tab enables you modify different aspects of the 3D View within the 3D Viewer.
44 Tutorial 2: Working with Data
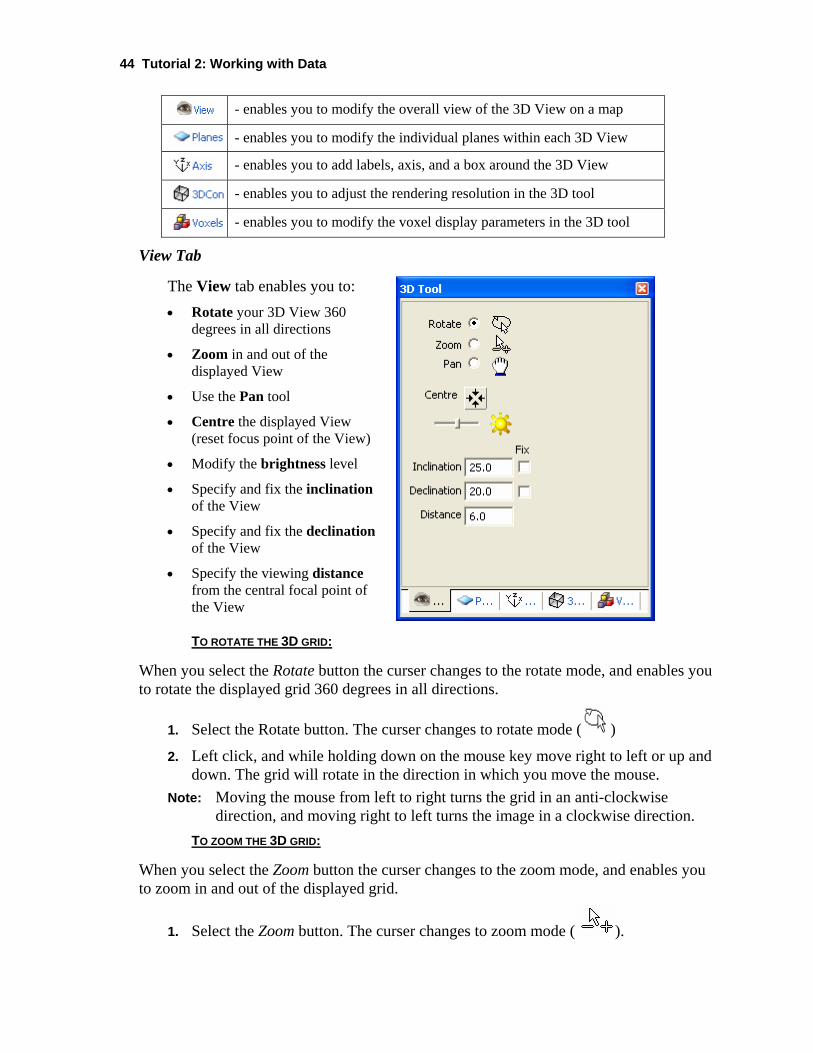
- enables you to modify the overall view of the 3D View on a map
- enables you to modify the individual planes within each 3D View
- enables you to add labels, axis, and a box around the 3D View
- enables you to adjust the rendering resolution in the 3D tool
- enables you to modify the voxel display parameters in the 3D tool
View Tab
The View tab enables you to: • Rotate your 3D View 360
degrees in all directions
• Zoom in and out of the displayed View
• Use the Pan tool
• Centre the displayed View (reset focus point of the View)
• Modify the brightness level
• Specify and fix the inclination of the View
• Specify and fix the declination of the View
• Specify the viewing distance from the central focal point of the View TO ROTATE THE 3D GRID:
When you select the Rotate button the curser changes to the rotate mode, and enables you to rotate the displayed grid 360 degrees in all directions.
1. Select the Rotate button. The curser changes to rotate mode ( )
2. Left click, and while holding down on the mouse key move right to left or up and down. The grid will rotate in the direction in which you move the mouse.
Note: Moving the mouse from left to right turns the grid in an anti-clockwise direction, and moving right to left turns the image in a clockwise direction.
TO ZOOM THE 3D GRID:
When you select the Zoom button the curser changes to the zoom mode, and enables you to zoom in and out of the displayed grid.
1. Select the Zoom button. The curser changes to zoom mode ( ).

Tutorial 2: Working with Data 45
2. Left click, and while holding down on the mouse key move to the right to zoom in and to the left to zoom out.
TO USE THE PAN TOOL:
When you select the Pan button the curser changes to the pan mode, and enables you to move the entire displayed grid.
1. Select the Pan button. The curser changes to pan mode ( ).
2. Left click, and while holding down on the mouse key move the grid right to left or up and down. The entire grid will move in the direction in which you move the mouse.
TO CENTRE THE GRID:
When you select the Centre button, the focus point of the grid is reset and the current displayed grid is centred in the 3D Surface Display Tool.
1. Select the Centre button. The displayed grid is centred.
TO MODIFY THE BRIGHTNESS LEVEL OF THE GRID:
When you select the Brightness bar, you can modify the brightness of the displayed grid.
1. Select the brightness bar.
2. Slide the bar to the left to increase the brightness level and to the right to decreases the brightness level of the displayed grid.
TO SPECIFY AND FIX THE INCLINATION OF THE GRID:
1. Click inside the inclination box and specify the inclination you want for the 3D grid.
2. Check the Fix box, and then click the OK button. The grid will be redrawn on your map with the new fixed inclination.
TO SPECIFY AND FIX THE DECLINATION OF THE GRID:
1. Click inside the declination box and specify the declination you want for the 3D grid.
2. Check the Fix box, and then click the OK button. The grid will be redrawn on your map with the new fixed inclination.
TO SPECIFY THE DISTANCE OF THE GRID:
The distance specifies the distance away from the centre focal point relative to the longest displayed dimension. For example, a value of 5 will place the viewpoint 5 times the size of the grid away from the centre of the grid.
1. Click inside the distance box and specify the distance you want for the 3D grid.
2. Click the OK button. The grid will be redrawn on your map with the new distance.
46 Tutorial 2: Working with Data
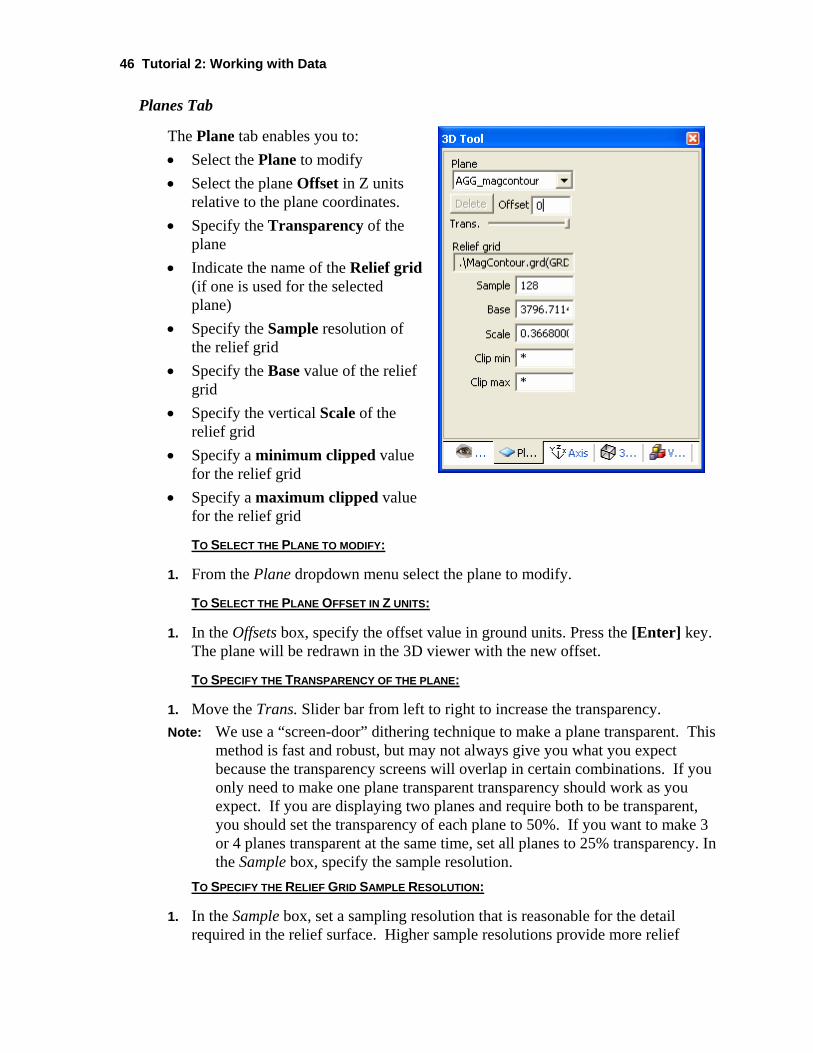
Planes Tab
The Plane tab enables you to: • Select the Plane to modify • Select the plane Offset in Z units
relative to the plane coordinates. • Specify the Transparency of the
plane • Indicate the name of the Relief grid
(if one is used for the selected plane)
• Specify the Sample resolution of the relief grid
• Specify the Base value of the relief grid
• Specify the vertical Scale of the relief grid
• Specify a minimum clipped value for the relief grid
• Specify a maximum clipped value for the relief grid
TO SELECT THE PLANE TO MODIFY:
1. From the Plane dropdown menu select the plane to modify.
TO SELECT THE PLANE OFFSET IN Z UNITS:
1. In the Offsets box, specify the offset value in ground units. Press the [Enter] key. The plane will be redrawn in the 3D viewer with the new offset.
TO SPECIFY THE TRANSPARENCY OF THE PLANE:
1. Move the Trans. Slider bar from left to right to increase the transparency. Note: We use a “screen-door” dithering technique to make a plane transparent. This
method is fast and robust, but may not always give you what you expect because the transparency screens will overlap in certain combinations. If you only need to make one plane transparent transparency should work as you expect. If you are displaying two planes and require both to be transparent, you should set the transparency of each plane to 50%. If you want to make 3 or 4 planes transparent at the same time, set all planes to 25% transparency. In the Sample box, specify the sample resolution.
TO SPECIFY THE RELIEF GRID SAMPLE RESOLUTION:
1. In the Sample box, set a sampling resolution that is reasonable for the detail required in the relief surface. Higher sample resolutions provide more relief
Tutorial 2: Working with Data 47
detail at the expense of performance. You can select a number up to 768 (you entry will be converted to an even multiple of 16). Press the [Enter] key. The relief grid will be redrawn in the 3D viewer with the new sample resolution.
TO SPECIFY THE BASE VALUE OF THE RELIEF GRID:
1. In the Base box, specify the base value of the relief grid. Press the [Enter] key. The relief grid will be redrawn in the 3D viewer with the new base value.
TO SPECIFY THE VERTICAL SCALE OF THE RELIEF GRID:
1. In the Scale box, specify the vertical scale of the relief grid. Press the [Enter] key. The relief grid will be redrawn in the 3D viewer with the new vertical scale.
TO SPECIFY A MINIMUM CLIPPED VALUE FOR THE RELIEF GRID:
The Clip minimum enables you to specify the minimum Z value of your relief grid. Grid values below this will be clipped.
1. Click inside the Clip min box and specify the minimum value you want for the Z data of the relief grid. Press the [Enter] key. The relief grid will be redrawn in the 3D viewer with the new minimum Z value.
TO SPECIFY A MAXIMUM CLIPPED VALUE FOR THE RELIEF GRID:
The Clip maximum enables you to specify the maximum Z value of your relief grid. Grid values above this will be clipped.
1. Click inside the Clip max box and specify the maximum value you want for the Z data of the relief grid. Press the [Enter] key. The relief grid will be redrawn in the 3D viewer with the new maximum Z value.

48 Tutorial 2: Working with Data
Axis Tab
The Axis tab enables you to:
• Add a box around the 3D View display
• Add an axis to the 3D View display
• Specify the X axis label
• Specify the Y axis label
• Specify the Z axis label
TO ADD OR REMOVE AN AXIS ON MY 3D VIEW:
The Axis check box enables you to draw an X, Y and Z axis on the View display.
1. Click the Axis check box to add or remove the X, Y, and Z axis on the View display.
TO ADD OR REMOVE A BOX AROUND MY 3D VIEW:
The Box check box enables you to draw rectangular box edges around the 3D volume being rendered
1. Click the Box check box to add or remove the rectangular box edges around the 3D volume being rendered.
TO SPECIFY LABELS FOR THE X, Y, AND Z AXIS OF MY 3D VIEW:
You can specify the labels for the X, Y, and Z axis, if the axis is selected.
1. Click inside the X, Y and Z axis label box, and specify the titles you want to display for your 3D grid image.
2. Press the [Enter] key. The axis labels will be redrawn on your map with the new axis titles.
3D Con Tab
Use the 3D Con tab to adjust the rendering resolution in the 3D tool.
Important information about the 3D Con tab:
• The controls on the 3D Con tab are system controls and changes made to this tab will affect all 3D maps in your Oasis Montaj system.
Tutorial 2: Working with Data 49
• Full rendering occurs every time you modify the 3D view and the view is redrawn.
• Fast rendering occurs when the image is in constantly motion for example while rotating, zooming or panning.
• The 3D Views rendering process makes heavy use of the available memory on your video card, and performance will be substantially reduced if your limits are exceeded.
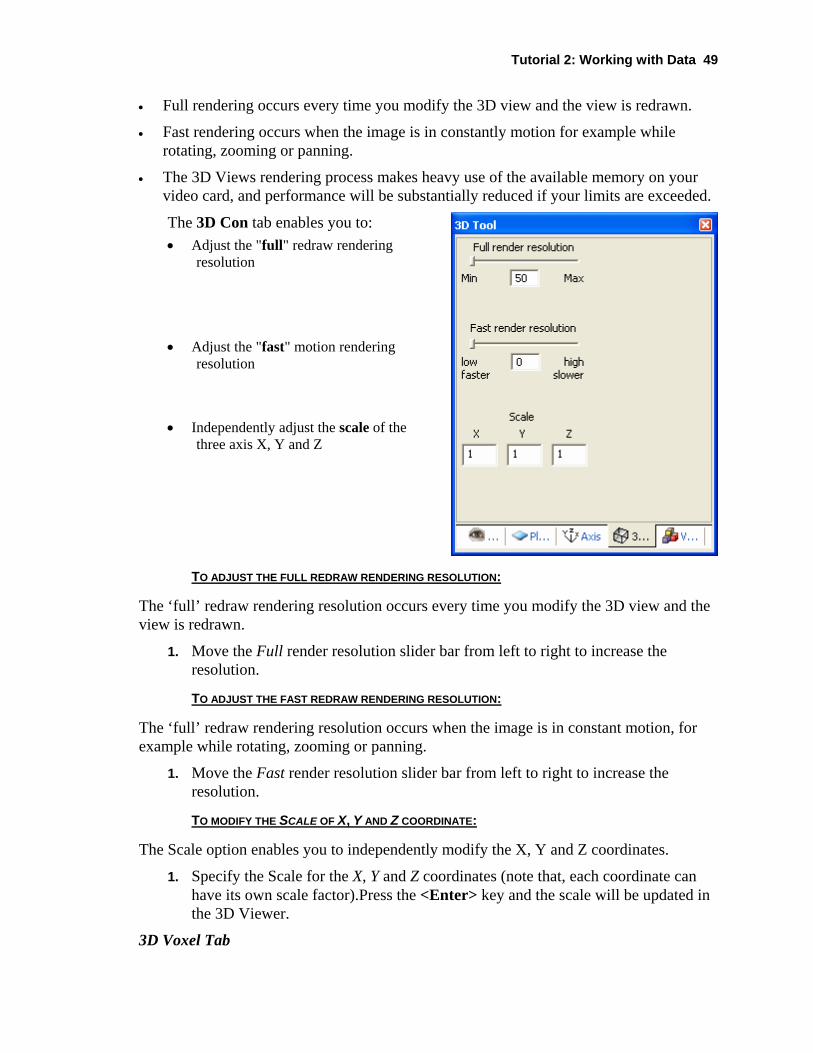
The 3D Con tab enables you to: • Adjust the "full" redraw rendering
resolution
• Adjust the "fast" motion rendering resolution
• Independently adjust the scale of the three axis X, Y and Z
TO ADJUST THE FULL REDRAW RENDERING RESOLUTION:
The ‘full’ redraw rendering resolution occurs every time you modify the 3D view and the view is redrawn.
1. Move the Full render resolution slider bar from left to right to increase the resolution.
TO ADJUST THE FAST REDRAW RENDERING RESOLUTION:
The ‘full’ redraw rendering resolution occurs when the image is in constant motion, for example while rotating, zooming or panning.
1. Move the Fast render resolution slider bar from left to right to increase the resolution.
TO MODIFY THE SCALE OF X, Y AND Z COORDINATE:
The Scale option enables you to independently modify the X, Y and Z coordinates.
1. Specify the Scale for the X, Y and Z coordinates (note that, each coordinate can have its own scale factor).Press the <Enter> key and the scale will be updated in the 3D Viewer.
3D Voxel Tab
50 Tutorial 2: Working with Data
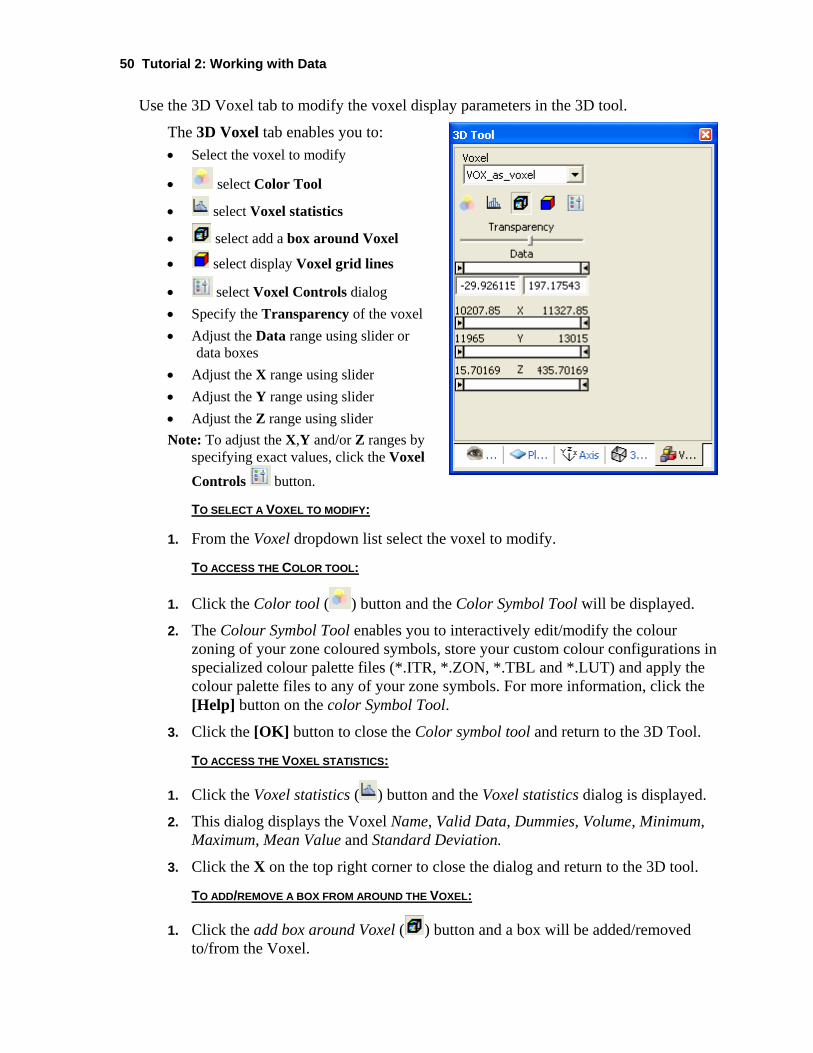
Use the 3D Voxel tab to modify the voxel display parameters in the 3D tool.
The 3D Voxel tab enables you to: • Select the voxel to modify
• select Color Tool
• select Voxel statistics
• select add a box around Voxel
• select display Voxel grid lines
• select Voxel Controls dialog • Specify the Transparency of the voxel • Adjust the Data range using slider or
data boxes • Adjust the X range using slider • Adjust the Y range using slider • Adjust the Z range using slider Note: To adjust the X,Y and/or Z ranges by
specifying exact values, click the Voxel
Controls button.
TO SELECT A VOXEL TO MODIFY:
1. From the Voxel dropdown list select the voxel to modify.
TO ACCESS THE COLOR TOOL:
1. Click the Color tool ( ) button and the Color Symbol Tool will be displayed.
2. The Colour Symbol Tool enables you to interactively edit/modify the colour zoning of your zone coloured symbols, store your custom colour configurations in specialized colour palette files (*.ITR, *.ZON, *.TBL and *.LUT) and apply the colour palette files to any of your zone symbols. For more information, click the [Help] button on the color Symbol Tool.
3. Click the [OK] button to close the Color symbol tool and return to the 3D Tool.
TO ACCESS THE VOXEL STATISTICS:
1. Click the Voxel statistics ( ) button and the Voxel statistics dialog is displayed.
2. This dialog displays the Voxel Name, Valid Data, Dummies, Volume, Minimum, Maximum, Mean Value and Standard Deviation.
3. Click the X on the top right corner to close the dialog and return to the 3D tool.
TO ADD/REMOVE A BOX FROM AROUND THE VOXEL:
1. Click the add box around Voxel ( ) button and a box will be added/removed to/from the Voxel.
Tutorial 2: Working with Data 51
2. This button works as a toggle you can toggle on or off the Voxel box.
TO DISPLAY VOXEL GRID LINES:
1. Click the display Voxel grid lines ( ) button and the Voxel colour shading will be removed/added and the Voxel grid/Voxel colour fill will be displayed.
2. This button works as a toggle you can toggle on or off the Voxel grid lines or colour shading.
TO DISPLAY VOXEL CONTROLS DIALOG:
1. Click the Voxel controls ( ) button and the Voxel Controls dialog will be displayed.
2. Using either the slider bars or the corresponding value boxes, specify the Data Range, X Range, Y Range and Z Range values for your Voxel display.
3. Click the [OK] button and the Voxel will be updated with the new data ranges.
TO SPECIFY THE TRANSPARENCY OF THE VOXEL:
1. Move the Transparency slider bar from right to left to increase the transparency.
TO INTERACTIVELY MODIFY DATA RANGE:
1. Using the slider bars specify the Data range and the Voxel will be updated simultaneously.
Note: If you specify new Data ranges by specifying values in the data boxes, you must press the <Enter> key to update the Voxel.
TO INTERACTIVELY MODIFY MY X, Y, Z RANGES:
1. Using the slider bars specify the X, Y, Z ranges and the Voxel displayed in the 3D Viewer will be updated simultaneously.
3D Rendering Memory Requirements
You can adjust the rendering resolution for 3D Views on the 3D Con tab. The controls on this tab are system controls and changes made to this tab will affect all 3D maps in your Oasis Montaj system.
The 3D Views rendering process makes heavy use of the available memory on your video card, and performance will be substantially reduced if your limits are exceeded.
Full render resolution:
When the full render resolution is set to maximum it can easily consume hundreds of megabytes of memory (200-600 Mb). If you do not have adequate memory available your computer will start to thrash, your hard drive light will turn on and stay on and the rendering will take a very long time. If you have less than 256 Mb of RAM, you should not increase this control.
52 Tutorial 2: Working with Data
Fast render resolution:
The fast render resolution moves 128k to the video card at the low range, 2 Mb at the middle range and 24 Mb at the high range. This means that every time you draw in FAST mode you move that much memory to the video card. Unfortunately, if your memory bandwidth is low or your video card is not very fast this slows down the rendering time.
Copying and/or Converting Grid Files
Oasis montaj enables you to copy and/or convert any supported grid format to any other supported grid format.
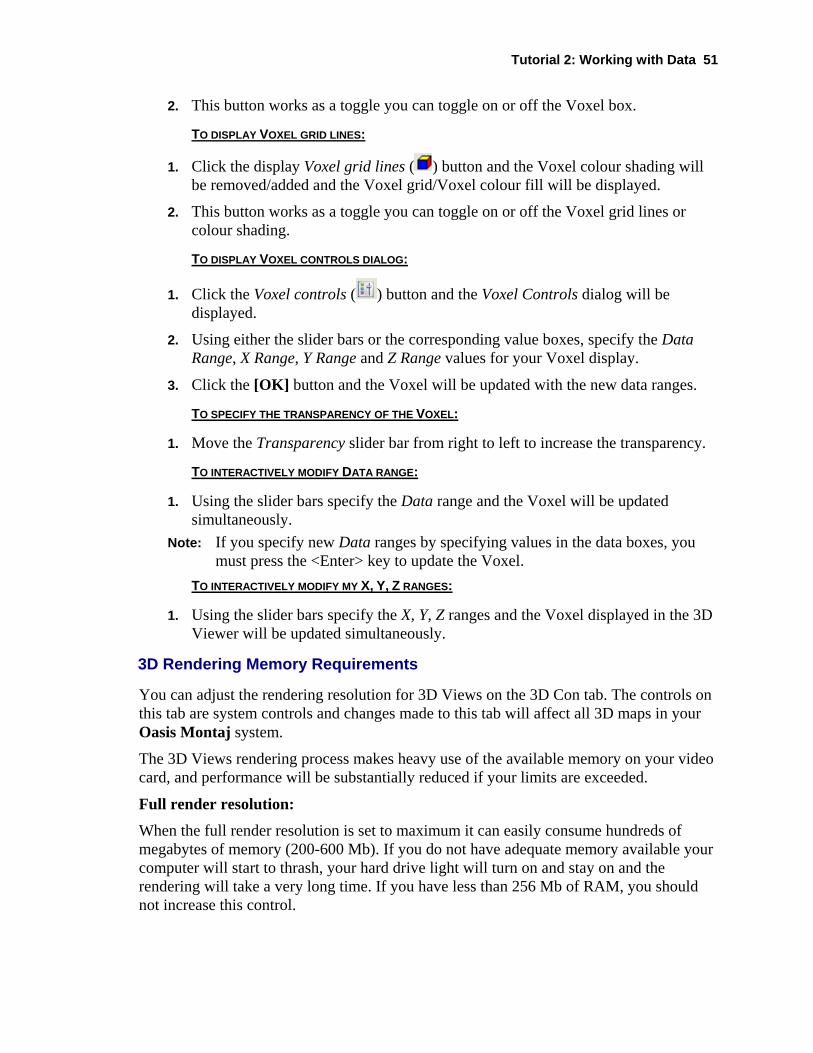
COPYING AND/OR CONVERTING GRID FILES
1. On the Grid menu, click Copy/convert grids. The Copy/convert grids dialog is displayed.
2. Using the [Browse] button, select the Input Grid File, and specify the Output Grid File.
3. Click the [OK] button. The grid is copied and/or converted as specified. Note: For more information on copying and /or converting grid files, click the
[Help] button. For information on the supported grid formats see the “Data Exchange Formats” help topic. (Hint: use the Search tab on the online Help system to locate topics of interest.)
Grid Report and Statistics
Basic grid information and statistics can be quickly displayed in Oasis montaj.
DISPLAYING GRID INFORMATION AND STATISTICS
1. On the Grid menu, click Grid Information. The Grid Statistics dialog is displayed.
2. Using the [Browse] button select the Grid File you want information about (casaber.grd). Click the [Open] button to return to the Grid Statistics dialog.
3. Click the [Report] button to view the Basic grid report dialog.
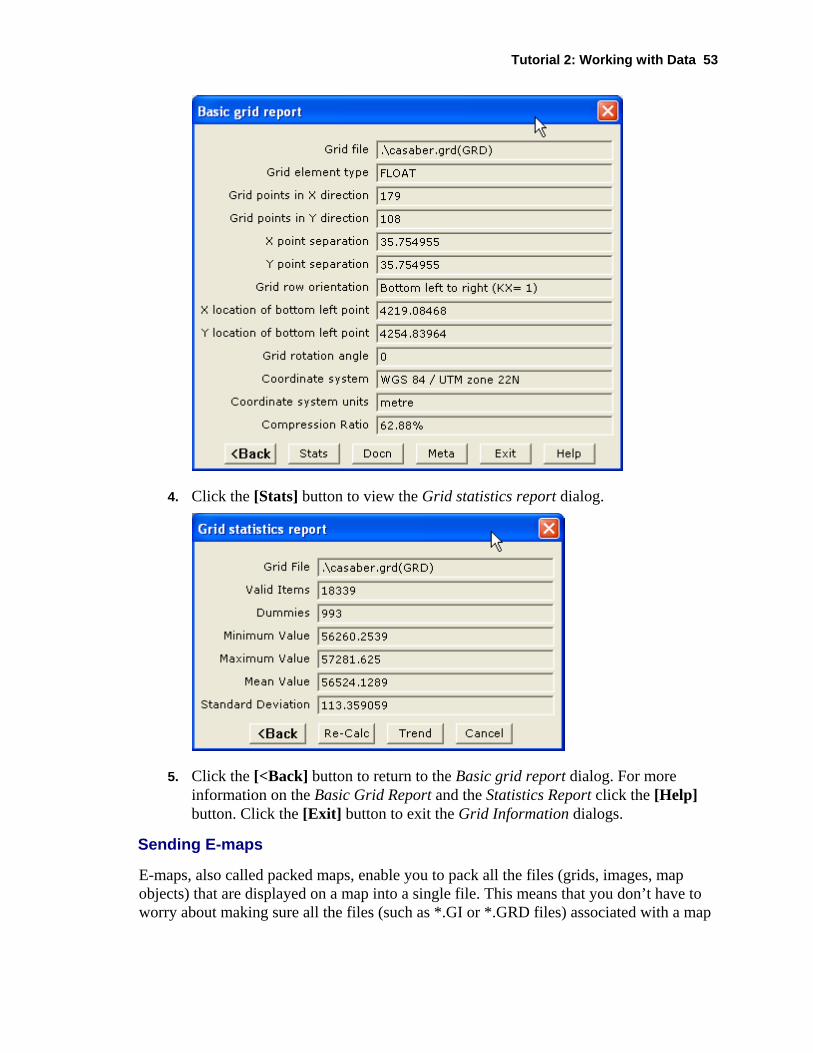
Tutorial 2: Working with Data 53
4. Click the [Stats] button to view the Grid statistics report dialog.
5. Click the [<Back] button to return to the Basic grid report dialog. For more information on the Basic Grid Report and the Statistics Report click the [Help] button. Click the [Exit] button to exit the Grid Information dialogs.
Sending E-maps
E-maps, also called packed maps, enable you to pack all the files (grids, images, map objects) that are displayed on a map into a single file. This means that you don’t have to worry about making sure all the files (such as *.GI or *.GRD files) associated with a map
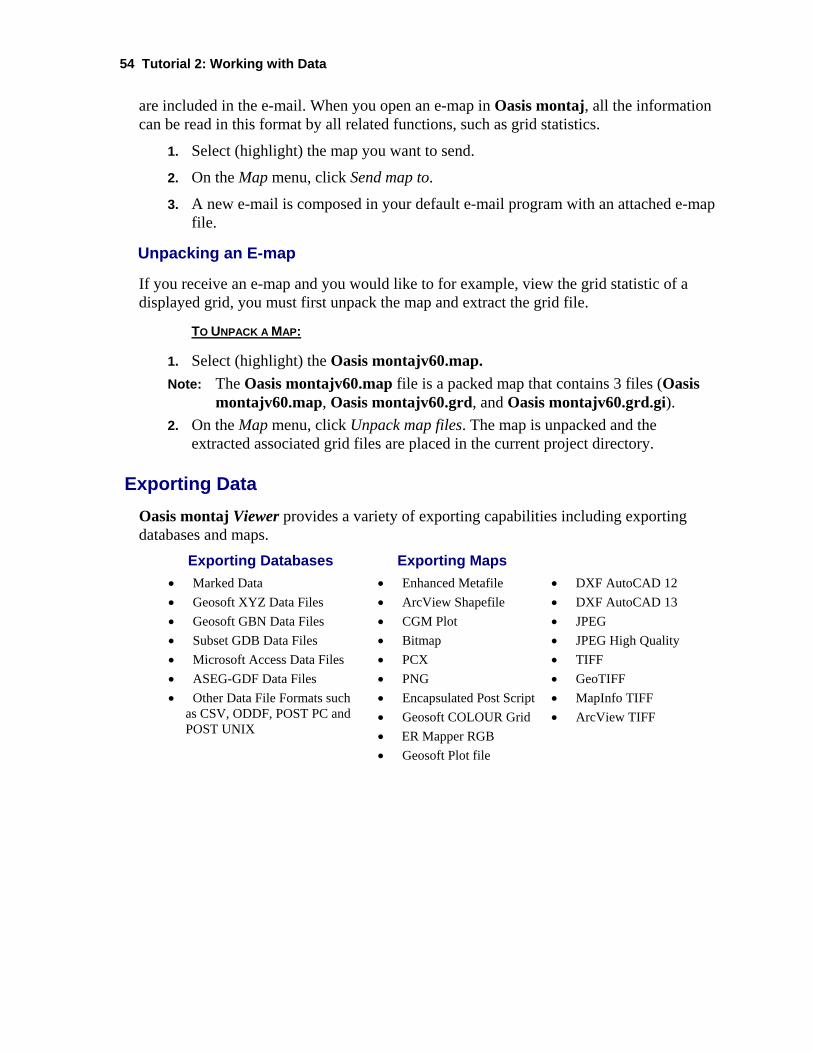
54 Tutorial 2: Working with Data
are included in the e-mail. When you open an e-map in Oasis montaj, all the information can be read in this format by all related functions, such as grid statistics.
1. Select (highlight) the map you want to send.
2. On the Map menu, click Send map to.
3. A new e-mail is composed in your default e-mail program with an attached e-map file.
Unpacking an E-map
If you receive an e-map and you would like to for example, view the grid statistic of a displayed grid, you must first unpack the map and extract the grid file.
TO UNPACK A MAP:
1. Select (highlight) the Oasis montajv60.map. Note: The Oasis montajv60.map file is a packed map that contains 3 files (Oasis
montajv60.map, Oasis montajv60.grd, and Oasis montajv60.grd.gi). 2. On the Map menu, click Unpack map files. The map is unpacked and the
extracted associated grid files are placed in the current project directory.
Exporting Data Oasis montaj Viewer provides a variety of exporting capabilities including exporting databases and maps.
Exporting Databases Exporting Maps • Marked Data • Geosoft XYZ Data Files • Geosoft GBN Data Files • Subset GDB Data Files • Microsoft Access Data Files • ASEG-GDF Data Files • Other Data File Formats such
as CSV, ODDF, POST PC and POST UNIX
• Enhanced Metafile • ArcView Shapefile • CGM Plot • Bitmap • PCX • PNG • Encapsulated Post Script • Geosoft COLOUR Grid • ER Mapper RGB • Geosoft Plot file
• DXF AutoCAD 12 • DXF AutoCAD 13 • JPEG • JPEG High Quality • TIFF • GeoTIFF • MapInfo TIFF • ArcView TIFF
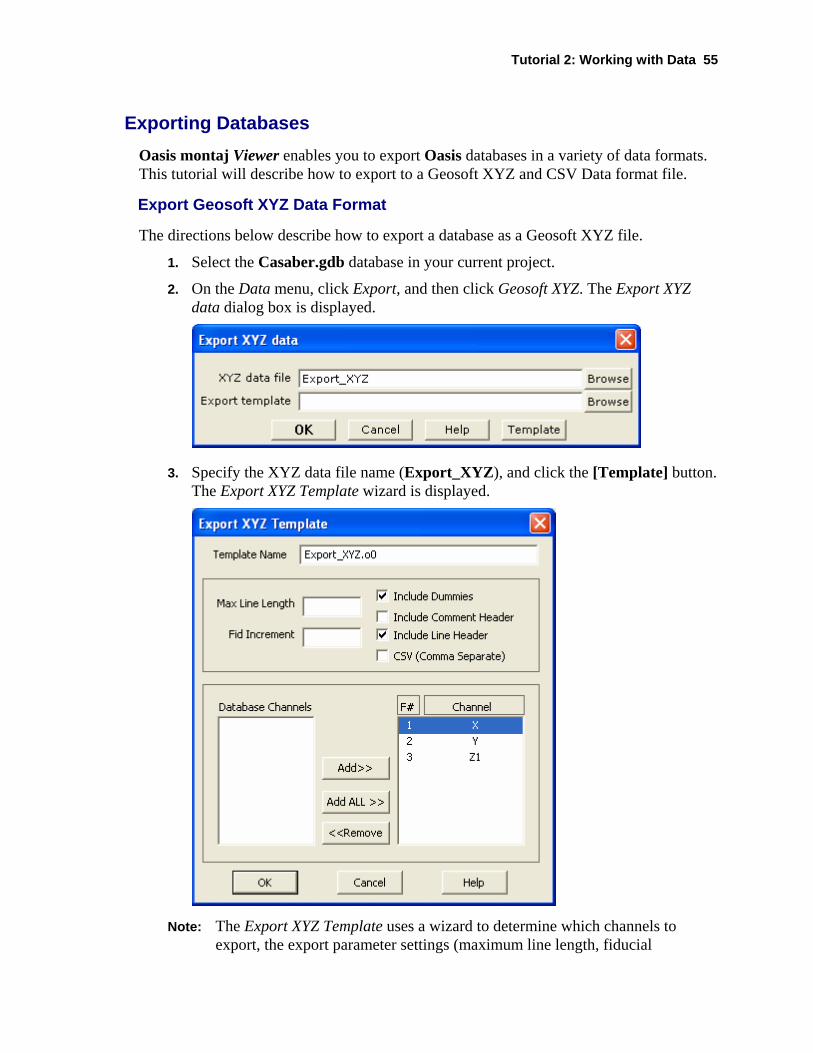
Tutorial 2: Working with Data 55
Exporting Databases Oasis montaj Viewer enables you to export Oasis databases in a variety of data formats. This tutorial will describe how to export to a Geosoft XYZ and CSV Data format file.
Export Geosoft XYZ Data Format
The directions below describe how to export a database as a Geosoft XYZ file.
1. Select the Casaber.gdb database in your current project.
2. On the Data menu, click Export, and then click Geosoft XYZ. The Export XYZ data dialog box is displayed.
3. Specify the XYZ data file name (Export_XYZ), and click the [Template] button. The Export XYZ Template wizard is displayed.
Note: The Export XYZ Template uses a wizard to determine which channels to export, the export parameter settings (maximum line length, fiducial
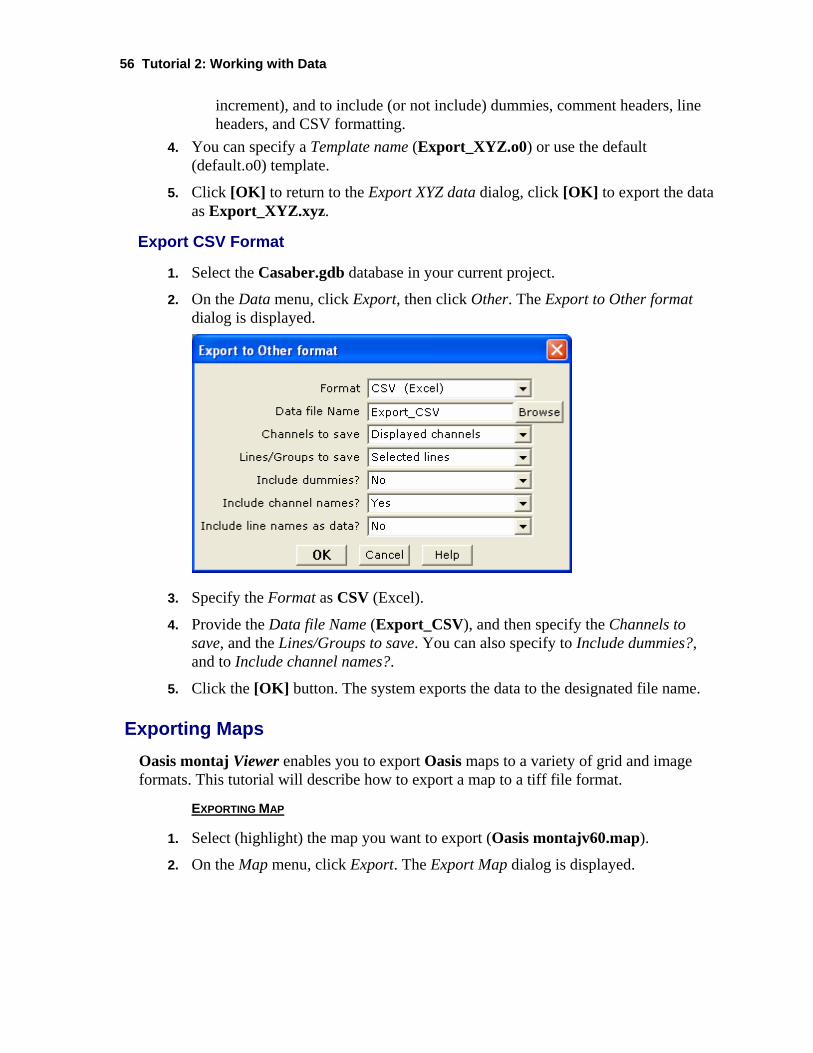
56 Tutorial 2: Working with Data
increment), and to include (or not include) dummies, comment headers, line headers, and CSV formatting.
4. You can specify a Template name (Export_XYZ.o0) or use the default (default.o0) template.
5. Click [OK] to return to the Export XYZ data dialog, click [OK] to export the data as Export_XYZ.xyz.
Export CSV Format
1. Select the Casaber.gdb database in your current project.
2. On the Data menu, click Export, then click Other. The Export to Other format dialog is displayed.
3. Specify the Format as CSV (Excel).
4. Provide the Data file Name (Export_CSV), and then specify the Channels to save, and the Lines/Groups to save. You can also specify to Include dummies?, and to Include channel names?.
5. Click the [OK] button. The system exports the data to the designated file name.
Exporting Maps Oasis montaj Viewer enables you to export Oasis maps to a variety of grid and image formats. This tutorial will describe how to export a map to a tiff file format.
EXPORTING MAP
1. Select (highlight) the map you want to export (Oasis montajv60.map).
2. On the Map menu, click Export. The Export Map dialog is displayed.
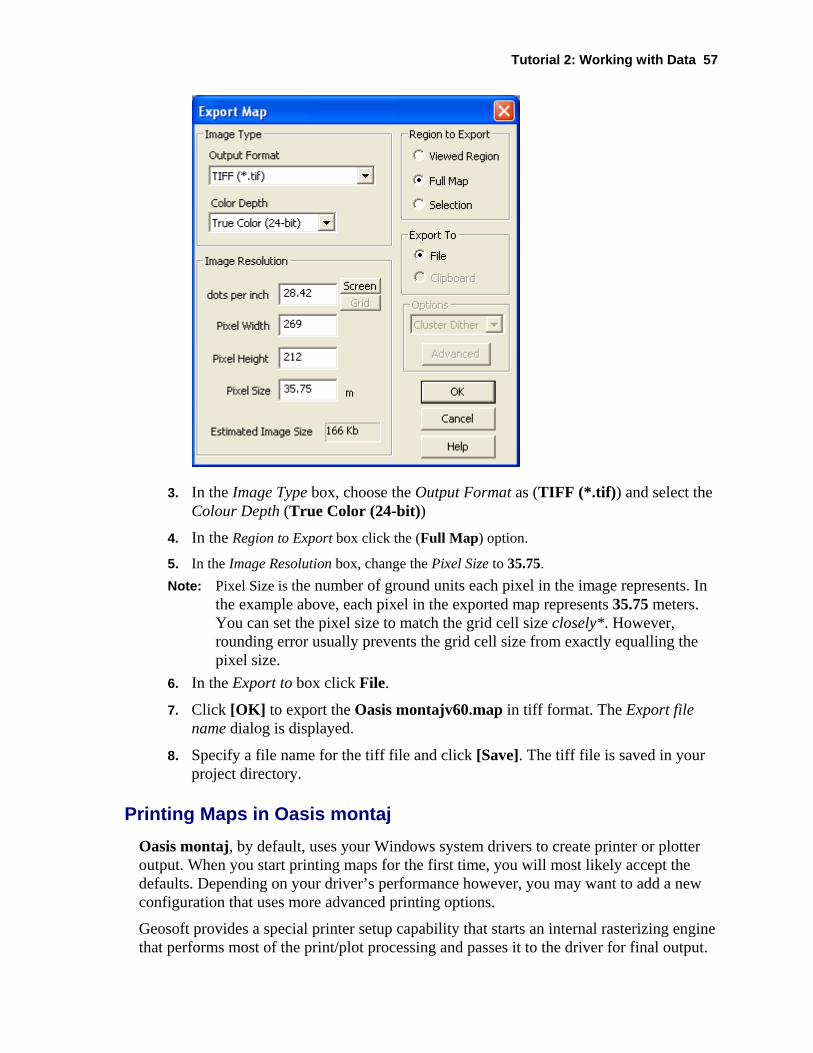
Tutorial 2: Working with Data 57
3. In the Image Type box, choose the Output Format as (TIFF (*.tif)) and select the Colour Depth (True Color (24-bit))
4. In the Region to Export box click the (Full Map) option. 5. In the Image Resolution box, change the Pixel Size to 35.75. Note: Pixel Size is the number of ground units each pixel in the image represents. In
the example above, each pixel in the exported map represents 35.75 meters. You can set the pixel size to match the grid cell size closely*. However, rounding error usually prevents the grid cell size from exactly equalling the pixel size.
6. In the Export to box click File.
7. Click [OK] to export the Oasis montajv60.map in tiff format. The Export file name dialog is displayed.
8. Specify a file name for the tiff file and click [Save]. The tiff file is saved in your project directory.
Printing Maps in Oasis montaj Oasis montaj, by default, uses your Windows system drivers to create printer or plotter output. When you start printing maps for the first time, you will most likely accept the defaults. Depending on your driver’s performance however, you may want to add a new configuration that uses more advanced printing options.
Geosoft provides a special printer setup capability that starts an internal rasterizing engine that performs most of the print/plot processing and passes it to the driver for final output.
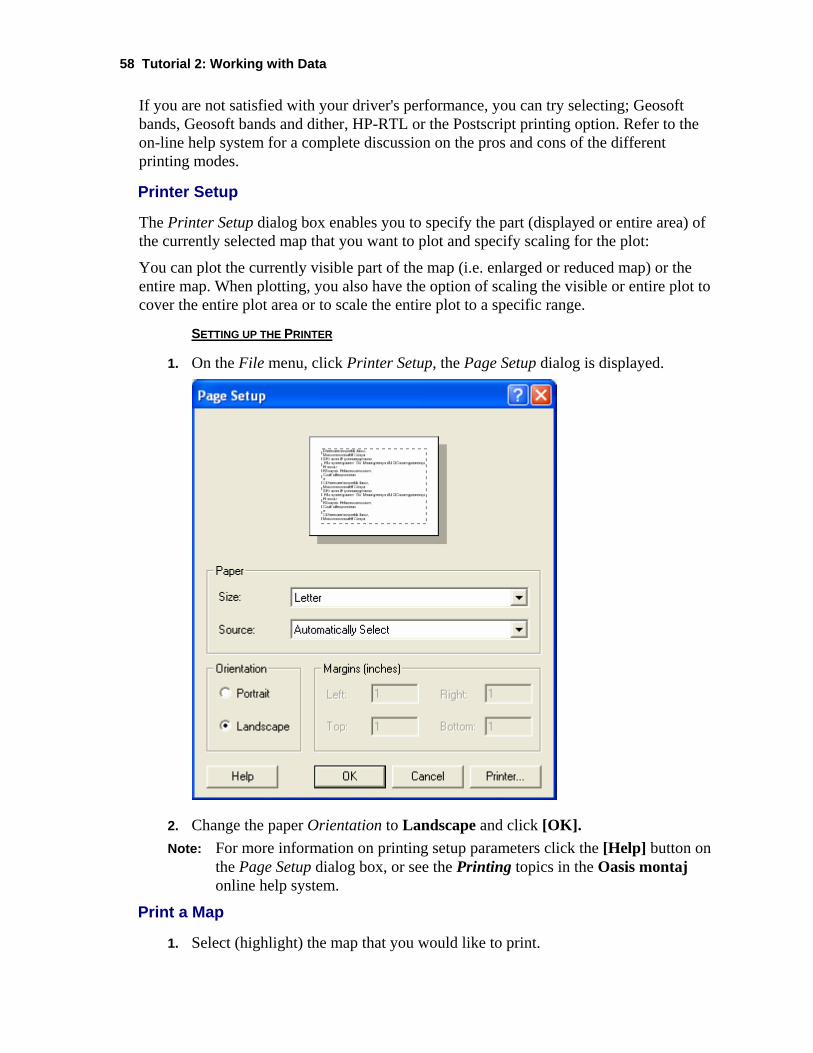
58 Tutorial 2: Working with Data
If you are not satisfied with your driver's performance, you can try selecting; Geosoft bands, Geosoft bands and dither, HP-RTL or the Postscript printing option. Refer to the on-line help system for a complete discussion on the pros and cons of the different printing modes.
Printer Setup
The Printer Setup dialog box enables you to specify the part (displayed or entire area) of the currently selected map that you want to plot and specify scaling for the plot:
You can plot the currently visible part of the map (i.e. enlarged or reduced map) or the entire map. When plotting, you also have the option of scaling the visible or entire plot to cover the entire plot area or to scale the entire plot to a specific range.
SETTING UP THE PRINTER
1. On the File menu, click Printer Setup, the Page Setup dialog is displayed.
2. Change the paper Orientation to Landscape and click [OK]. Note: For more information on printing setup parameters click the [Help] button on
the Page Setup dialog box, or see the Printing topics in the Oasis montaj online help system.
Print a Map
1. Select (highlight) the map that you would like to print.
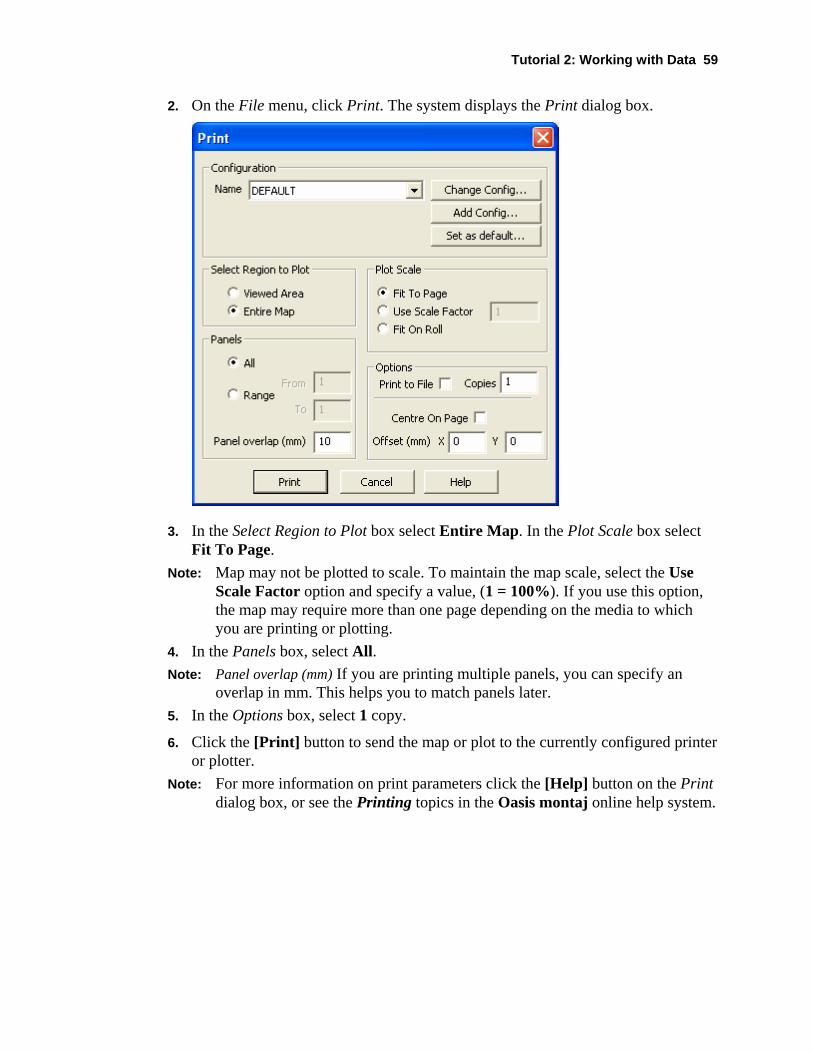
Tutorial 2: Working with Data 59
2. On the File menu, click Print. The system displays the Print dialog box.
3. In the Select Region to Plot box select Entire Map. In the Plot Scale box select Fit To Page.
Note: Map may not be plotted to scale. To maintain the map scale, select the Use Scale Factor option and specify a value, (1 = 100%). If you use this option, the map may require more than one page depending on the media to which you are printing or plotting.
4. In the Panels box, select All. Note: Panel overlap (mm) If you are printing multiple panels, you can specify an
overlap in mm. This helps you to match panels later. 5. In the Options box, select 1 copy.
6. Click the [Print] button to send the map or plot to the currently configured printer or plotter.
Note: For more information on print parameters click the [Help] button on the Print dialog box, or see the Printing topics in the Oasis montaj online help system.
60 Appendix 1: Geosoft Concepts
Appendix 1: Geosoft Concepts This chapter contains information about the components included in Oasis montaj™ and describes the concepts you will need to know to use the system. A quick overview of the concepts described in this chapter are available in the Oasis montaj Viewer help system in the About directory called Tour for New Users.
Oasis montaj is Geosoft’s core software platform for working with large volume spatial data. The core software platform consists of a free Viewer and a licensed Mapping and Processing System. For more information on the Oasis montaj Mapping and Processing System visit www.geosoft.com/pinfo/oasis_montaj.html
Oasis montaj Viewer
The Oasis montaj Viewer is a free software product that enables you to view Geosoft databases, Geosoft Grids and a variety of common image and data exchange formats. Specifically, this version provides you with the following capabilities:
• Access project data (Geosoft databases, grids and maps), tools (3D Tool, Project Explorer, Undo/Redo Tool), and Geosoft toolbars (Database Tools, Map Tools, Standard Toolbar)
• Evaluate data, information and interpretations by viewing and performing specific tasks using Geosoft databases, profiles, maps, and grids as well as Geosoft and third-party images (including PLT and DXF).
• Verify data quality, analyses and interpretations by tracking processes applied to databases and maps
• Perform selected processes made available through Geosoft menus or third-party GXs
• Share results and knowledge by viewing and/or sending E-maps to team members and other professional contacts
• Prepare reports using clipboard image copying capabilities
The Oasis montaj environment provides direct access to data contained in Oasis databases through a spreadsheet window and an integrated profile display window. The Oasis database is a high-performance database that provides efficient storage and access for very large spatial data sets.
The Viewer provides visual data links that enable you to dynamically connect data in the spreadsheet, profile and map views. DAT technology (for accessing grids and images) enables the Viewer to display a variety of grid and image formats in Oasis montaj.
The Oasis montaj core platform provides the basic resources for all Geosoft Applications and Tools. Geosoft provides a variety of systems that address specific applications in exploration geophysics, drillhole geology, exploration geochemistry and other areas. These systems consist of menus and corresponding Geosoft eXecutables (GXs) that run on the core platform.

Appendix 1: Geosoft Concepts 61
What is Oasis montaj? The concept of an integrated environment for earth science data emerged from over two decades of software development at Geosoft and is now implemented in the Oasis montaj software platform. Geosoft’s vision reflects the fast pace of today’s professional work environment and the significant changes in data processing over the past twenty years:
• An order of magnitude increase in data volumes • Increasing digital data availability and connectivity • Shift in processing from office to in situ (or field) environments • Replacement of proprietary software with commercial solutions
By design, Geosoft’s Oasis montaj Viewer meets specific needs including: • Project Explorer Tool enables users to browse as well as open any ‘project’ item • Enhanced metadata capabilities provide access to the “Properties” (or meta) of
the data displayed in the Project Explorer using the Metadata tool • File locations are displayed in a popup dialog when you mouse over an item in
the Project Explorer • Description tool enable users to add descriptive text to the items displayed in the
Project Explorer • Geosoft’s DAP (Data Access Protocol) technology enables users to access very
large spatial datasets residing on an Internet Server (or locally on a Personal Computer).
• Connecting you to your data and information via dynamic linking – a unique technology for graphically connecting data, profiles and maps in a single desktop environment
• Addressing high-volume data storage and access requirements for very large spatial data sets
• Delivering focused solutions to specific Earth Science problems • Free Oasis montaj Viewer for Data and Information Sharing
Viewer Capabilities
The Oasis montaj Viewer is a free software product for accessing and sharing data and images in native Geosoft and standard PC formats. The Viewer is available for download at www.geosoft.com. The Viewer can be freely distributed by anyone who wants to enable other geoscientists to share data and maps in a Geosoft environment. Some of the Viewer’s capabilities are listed below.
PROJECTS
• Open and display projects and display/edit project comments • Browse and open any project item in the Project Explorer • Add or modify “descriptions” of all data items displayed in the Project Explorer • View and edit proejct data “Properties” (or meta) using the Metadata Browser
62 Appendix 1: Geosoft Concepts
DATA AND PROFILES
• Open new databases imported from Geosoft GDB, Geosoft GBN, Geosoft XYZ and ASEG-GDF formats
• Export databases as Geosoft GDB, Geosoft GBN, Geosoft XYZ, ASEG-GDF, CSV (Excel), ODDF (USGS), POST PC (USGS) and POST UNIX (USGS)
• Show and plot data profiles in upto five database profile windows • View data projected coordinate system information • View data statistics and historical processing logs • Dynamically link data between spreadsheet, profile window and maps
MAPS, GRIDS AND IMAGES
• Display a wide variety of grid and image files (for a detailed list see the Data Exchange Format online help topic)
• Import and display Geosoft PLT, AutoCAD DXF, MapInfo TAB, ArcView SHP and Microstation DGN files
• Open and display maps, and display/edit map comments • Pan, zoom, and cursor-link map views • View map view projected coordinate system information • Copy and paste database data and maps to other Windows applications • Export maps to a variety of formats • Plot maps to Windows printers and large-format plotters • Send and receive E-Maps
ONLINE HELP AND TECHNICAL SUPPORT
• Full on-line help system with links to Geosoft Web Server. • Access to Geosoft [geonet] support list and Geosoft Web Site resources.
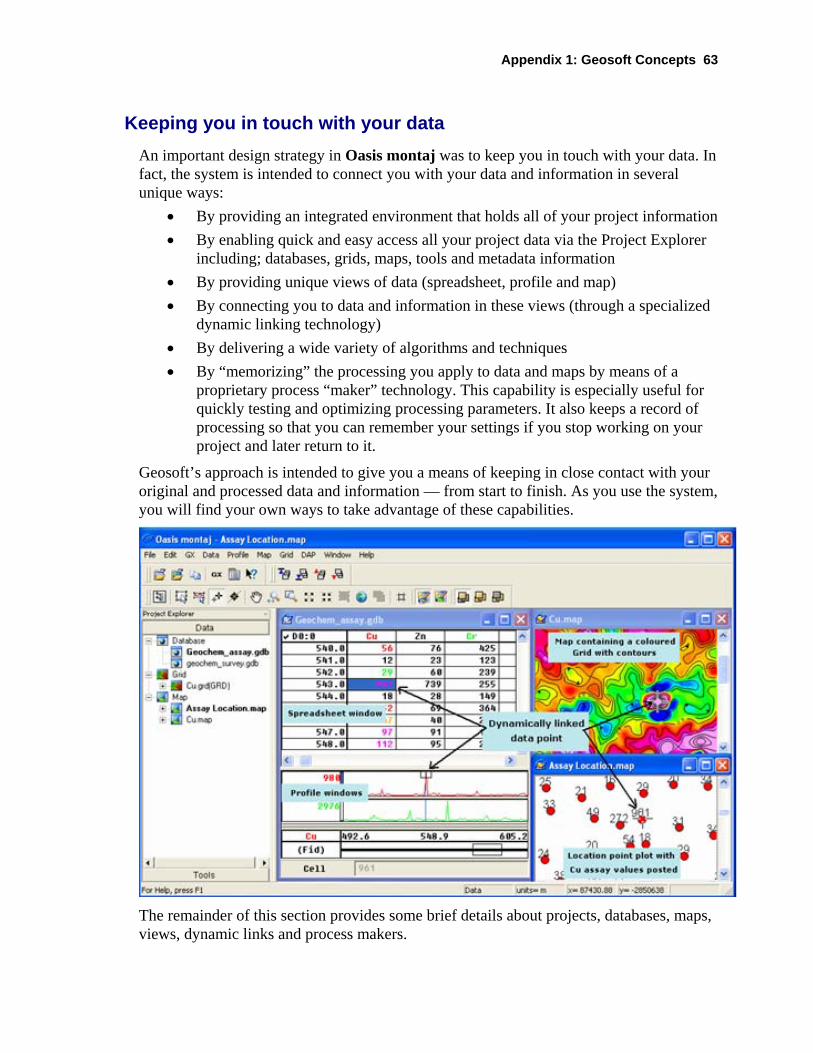
Appendix 1: Geosoft Concepts 63
Keeping you in touch with your data An important design strategy in Oasis montaj was to keep you in touch with your data. In fact, the system is intended to connect you with your data and information in several unique ways:
• By providing an integrated environment that holds all of your project information • By enabling quick and easy access all your project data via the Project Explorer
including; databases, grids, maps, tools and metadata information • By providing unique views of data (spreadsheet, profile and map) • By connecting you to data and information in these views (through a specialized
dynamic linking technology) • By delivering a wide variety of algorithms and techniques • By “memorizing” the processing you apply to data and maps by means of a
proprietary process “maker” technology. This capability is especially useful for quickly testing and optimizing processing parameters. It also keeps a record of processing so that you can remember your settings if you stop working on your project and later return to it.
Geosoft’s approach is intended to give you a means of keeping in close contact with your original and processed data and information — from start to finish. As you use the system, you will find your own ways to take advantage of these capabilities.
The remainder of this section provides some brief details about projects, databases, maps, views, dynamic links and process makers.
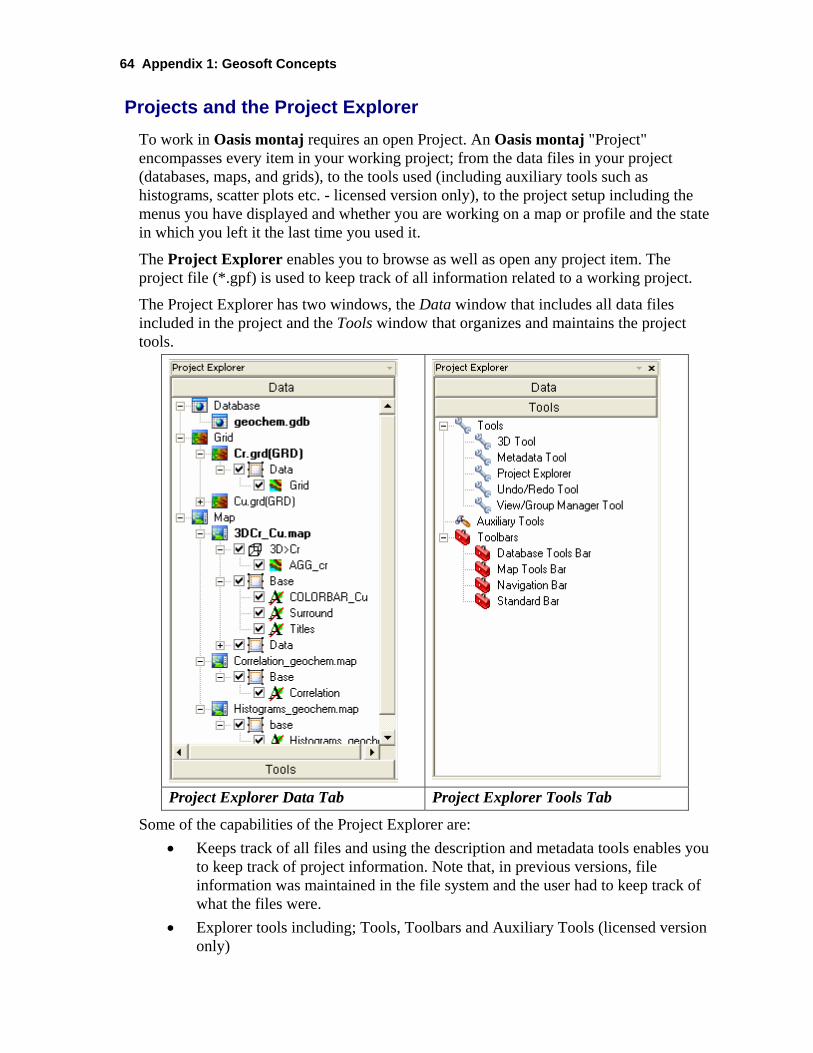
64 Appendix 1: Geosoft Concepts
Projects and the Project Explorer To work in Oasis montaj requires an open Project. An Oasis montaj "Project" encompasses every item in your working project; from the data files in your project (databases, maps, and grids), to the tools used (including auxiliary tools such as histograms, scatter plots etc. - licensed version only), to the project setup including the menus you have displayed and whether you are working on a map or profile and the state in which you left it the last time you used it.
The Project Explorer enables you to browse as well as open any project item. The project file (*.gpf) is used to keep track of all information related to a working project.
The Project Explorer has two windows, the Data window that includes all data files included in the project and the Tools window that organizes and maintains the project tools.
Project Explorer Data Tab Project Explorer Tools Tab
Some of the capabilities of the Project Explorer are: • Keeps track of all files and using the description and metadata tools enables you
to keep track of project information. Note that, in previous versions, file information was maintained in the file system and the user had to keep track of what the files were.
• Explorer tools including; Tools, Toolbars and Auxiliary Tools (licensed version only)
Appendix 1: Geosoft Concepts 65
• Tools; 3D Tool, Metadata Tool, Project Explorer and Undo/Redo Tool and the View/Group Manager Tool.
• Toolbars; Database Tools Bar, Map Tools Bar, Navigation Bar and Standard Toolbar. Also available with the licensed version, Map Edit Tools Bar, Polygon Tools Bar and Script Bar.
• Auxiliary Tools: Histograms, Scatter plots, Probability plots and Triplots (licensed version only).
• File locations displayed in popup dialog when you mouse over item in the Project Explorer
• Data Description Tool enable users to add description to project items • Enhanced metadata capabilities enable access to the "Properties" of all items
displayed in the Project Explorer • Recent Projects & recent Geosoft data files available under File menu Note: Grids appear in the Project Explorer under "Grids". Opening a grid opens a
view of the grid in its own internal "map". A grid map view is just like a real map and can accept any graphics that a map can. It can also be saved as a map, in which case the map will appear in the "Map" section of the project explorer.
What you need to know about Project files
You require an open project to do any work in Oasis montaj. The project also controls your working directory. Projects are saved as (*.gpf) files. If you open an existing project from a directory, the system assumes that your files are located in the specified directory. To streamline your work, as well as keep it organized, you may want to make sure that your project is in the same directory as the other files you want to use.
We recommend that each project you work on have its own project (*.gpf) file. If you use a number of applications or add-on tools in Oasis montaj that have different menus, you can use the project to display only the menus you require.
Important Note: Workspace files (*.gws) used in Oasis montaj prior to version 6.0 can be easily converted to Project files (*.gpf) simply by opening them in Oasis montaj. On the Open Project dialog (File|Project|Open) select File of Type as “Workspaces (*.gws)” and when asked if you want to convert the old workspace into a new Oasis montaj project file, select “Yes”. The workspace file will be converted to a project file and all associated workspace information will be transferred to the new project file. In addition, the workspace file will remain untouched so that it can be opened in previous versions.

66 Appendix 1: Geosoft Concepts
Databases and high-volume data processing Many commercial and governmental groups currently use Oasis montaj for routine processing of high volume datasets (tested up to 10 gigabytes) and also for relatively low volume processing in a variety of mapping and other applications. One key to the system’s capabilities is the proprietary 3-dimensional database architecture, which enables the rapid processing and analysis of high volume data. This object-oriented database structure stores data in a form that enables rapid access and efficient storage of your data.
Databases are displayed and organized in Oasis Montaj in the Spreadsheet Window.
The spreadsheet window organizes and displays data differently than conventional (relational) spreadsheet and database programs. Conventional databases organize data as tables, records and fields, as shown below:
Conventional databases organize data as tables, records and fields. This is effective for querying and searching type applications but limits it as a data processing engine because:
• Programs must read an entire record to access a single field • It is computationally intensive to change record structures • Data sampled at different intervals and starting points are difficult to store
Oasis montaj is based on a proprietary 3-dimensional-file format architecture that overcomes these limitations, as shown below:

Appendix 1: Geosoft Concepts 67
Organized in lines (or groups), columns and elements, the database stores all data values of a particular type in individual columns or channels. This enables stand-alone processing of columns and eliminates the need to write results to interim storage areas and then re-write them after processing. The result is a significant increase in processing efficiency. This Geosoft file structure provides additional advantages including:
• Ability to process any number of lines/groups • Ability to handle lines/groups with unlimited columns • Ability to handle very large datasets
In addition, since columns are stored separately, this file format is capable of storing and manipulating data with different end point and sample intervals.
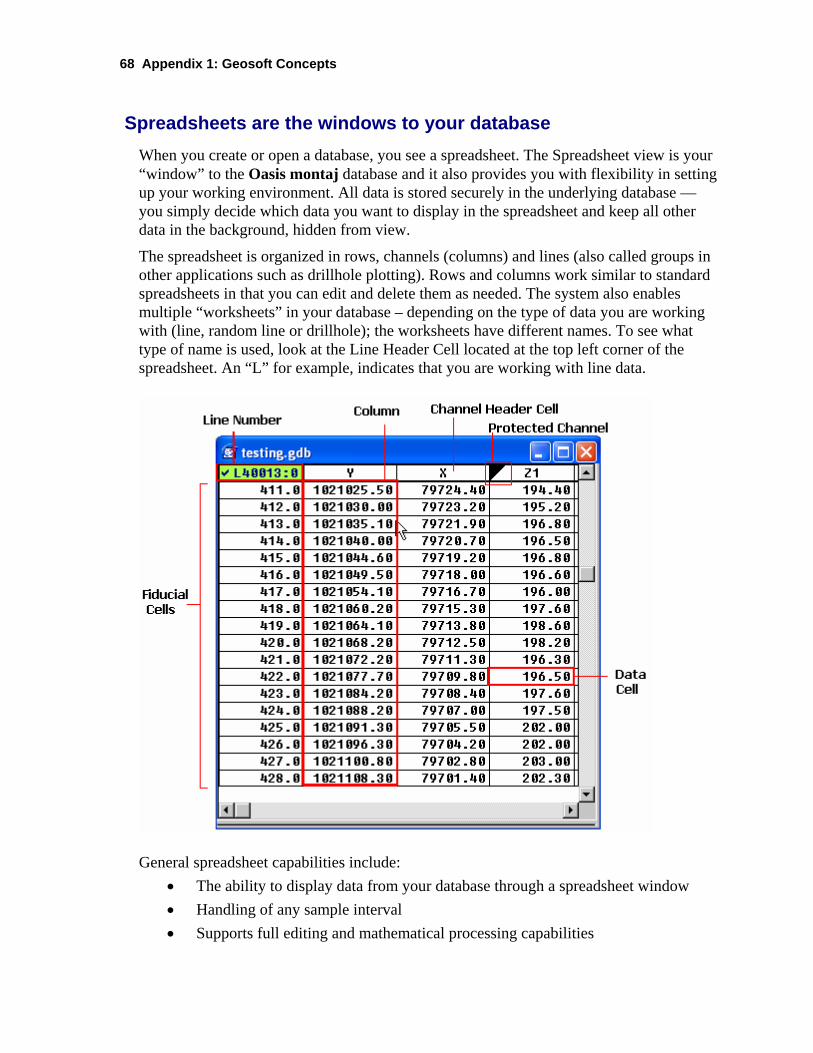
68 Appendix 1: Geosoft Concepts
Spreadsheets are the windows to your database When you create or open a database, you see a spreadsheet. The Spreadsheet view is your “window” to the Oasis montaj database and it also provides you with flexibility in setting up your working environment. All data is stored securely in the underlying database — you simply decide which data you want to display in the spreadsheet and keep all other data in the background, hidden from view.
The spreadsheet is organized in rows, channels (columns) and lines (also called groups in other applications such as drillhole plotting). Rows and columns work similar to standard spreadsheets in that you can edit and delete them as needed. The system also enables multiple “worksheets” in your database – depending on the type of data you are working with (line, random line or drillhole); the worksheets have different names. To see what type of name is used, look at the Line Header Cell located at the top left corner of the spreadsheet. An “L” for example, indicates that you are working with line data.
General spreadsheet capabilities include: • The ability to display data from your database through a spreadsheet window • Handling of any sample interval • Supports full editing and mathematical processing capabilities
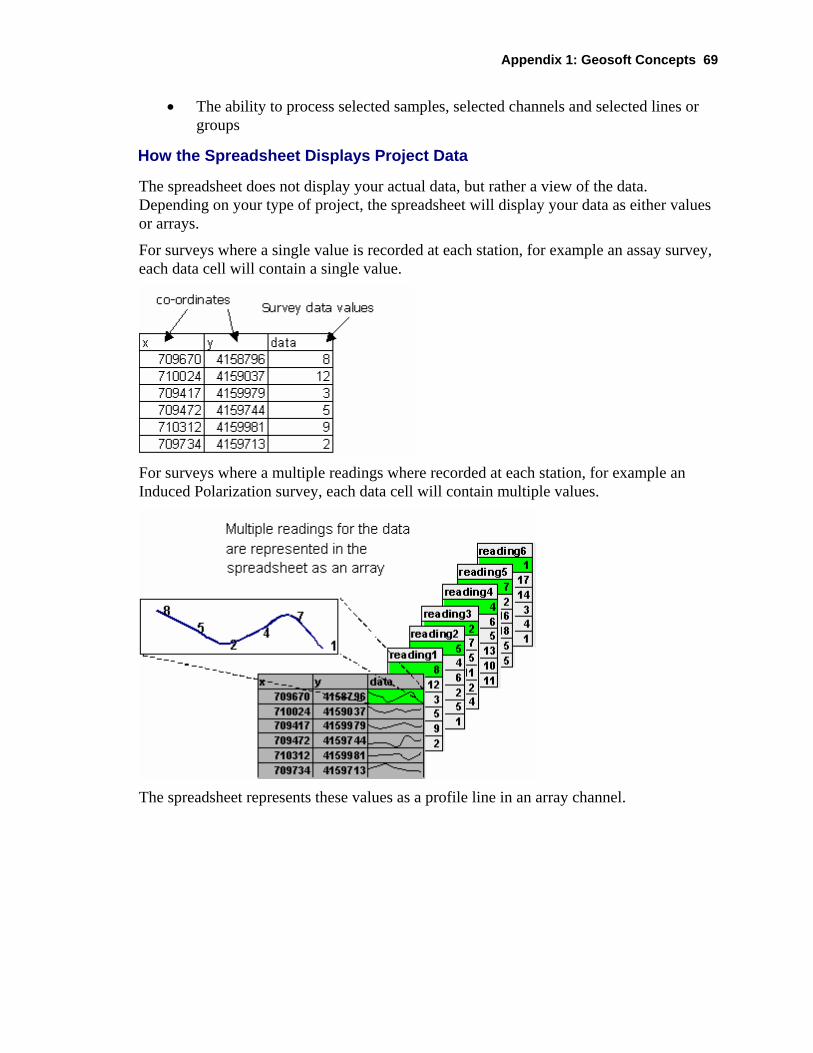
Appendix 1: Geosoft Concepts 69
• The ability to process selected samples, selected channels and selected lines or groups
How the Spreadsheet Displays Project Data
The spreadsheet does not display your actual data, but rather a view of the data. Depending on your type of project, the spreadsheet will display your data as either values or arrays.
For surveys where a single value is recorded at each station, for example an assay survey, each data cell will contain a single value.
For surveys where a multiple readings where recorded at each station, for example an Induced Polarization survey, each data cell will contain multiple values.
The spreadsheet represents these values as a profile line in an array channel.
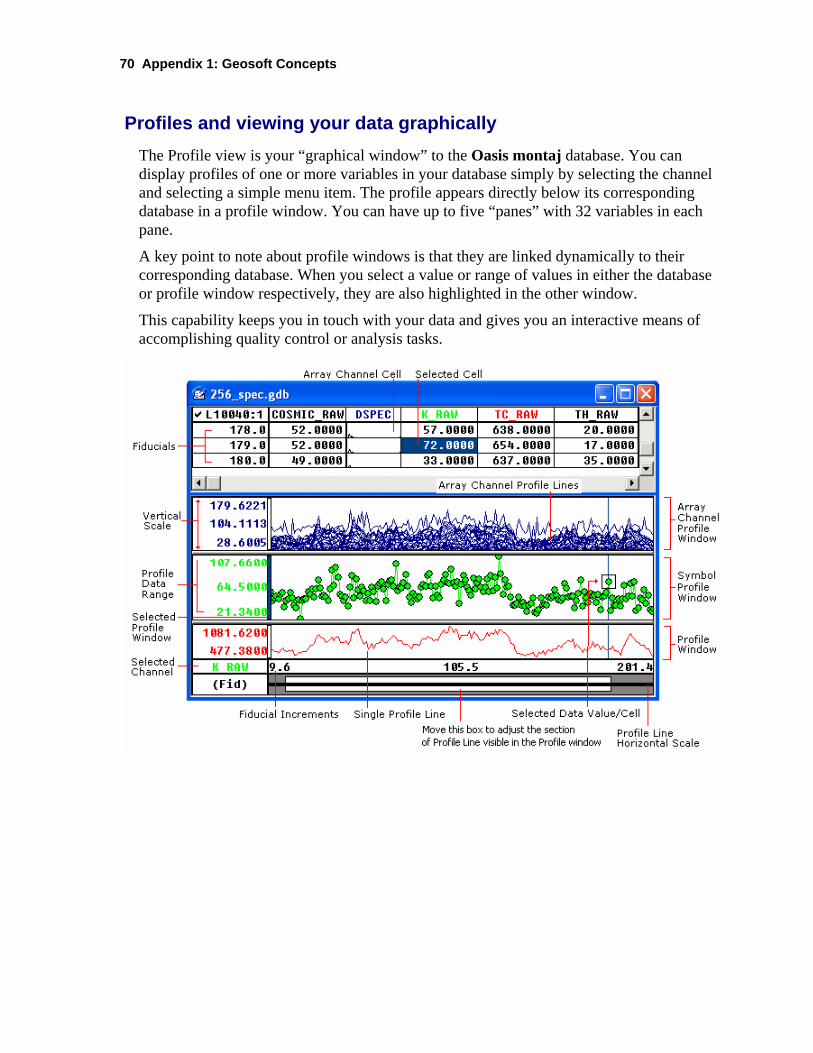
70 Appendix 1: Geosoft Concepts
Profiles and viewing your data graphically The Profile view is your “graphical window” to the Oasis montaj database. You can display profiles of one or more variables in your database simply by selecting the channel and selecting a simple menu item. The profile appears directly below its corresponding database in a profile window. You can have up to five “panes” with 32 variables in each pane.
A key point to note about profile windows is that they are linked dynamically to their corresponding database. When you select a value or range of values in either the database or profile window respectively, they are also highlighted in the other window.
This capability keeps you in touch with your data and gives you an interactive means of accomplishing quality control or analysis tasks.
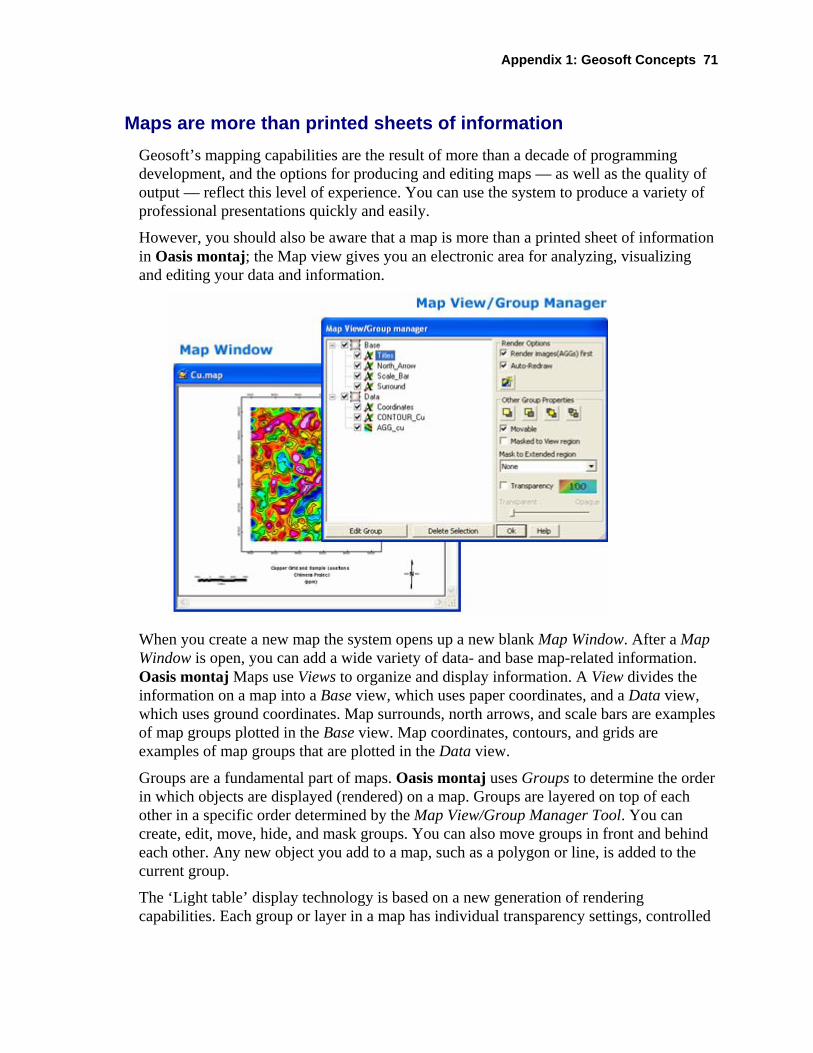
Appendix 1: Geosoft Concepts 71
Maps are more than printed sheets of information Geosoft’s mapping capabilities are the result of more than a decade of programming development, and the options for producing and editing maps — as well as the quality of output — reflect this level of experience. You can use the system to produce a variety of professional presentations quickly and easily.
However, you should also be aware that a map is more than a printed sheet of information in Oasis montaj; the Map view gives you an electronic area for analyzing, visualizing and editing your data and information.
When you create a new map the system opens up a new blank Map Window. After a Map Window is open, you can add a wide variety of data- and base map-related information. Oasis montaj Maps use Views to organize and display information. A View divides the information on a map into a Base view, which uses paper coordinates, and a Data view, which uses ground coordinates. Map surrounds, north arrows, and scale bars are examples of map groups plotted in the Base view. Map coordinates, contours, and grids are examples of map groups that are plotted in the Data view.
Groups are a fundamental part of maps. Oasis montaj uses Groups to determine the order in which objects are displayed (rendered) on a map. Groups are layered on top of each other in a specific order determined by the Map View/Group Manager Tool. You can create, edit, move, hide, and mask groups. You can also move groups in front and behind each other. Any new object you add to a map, such as a polygon or line, is added to the current group.
The ‘Light table’ display technology is based on a new generation of rendering capabilities. Each group or layer in a map has individual transparency settings, controlled
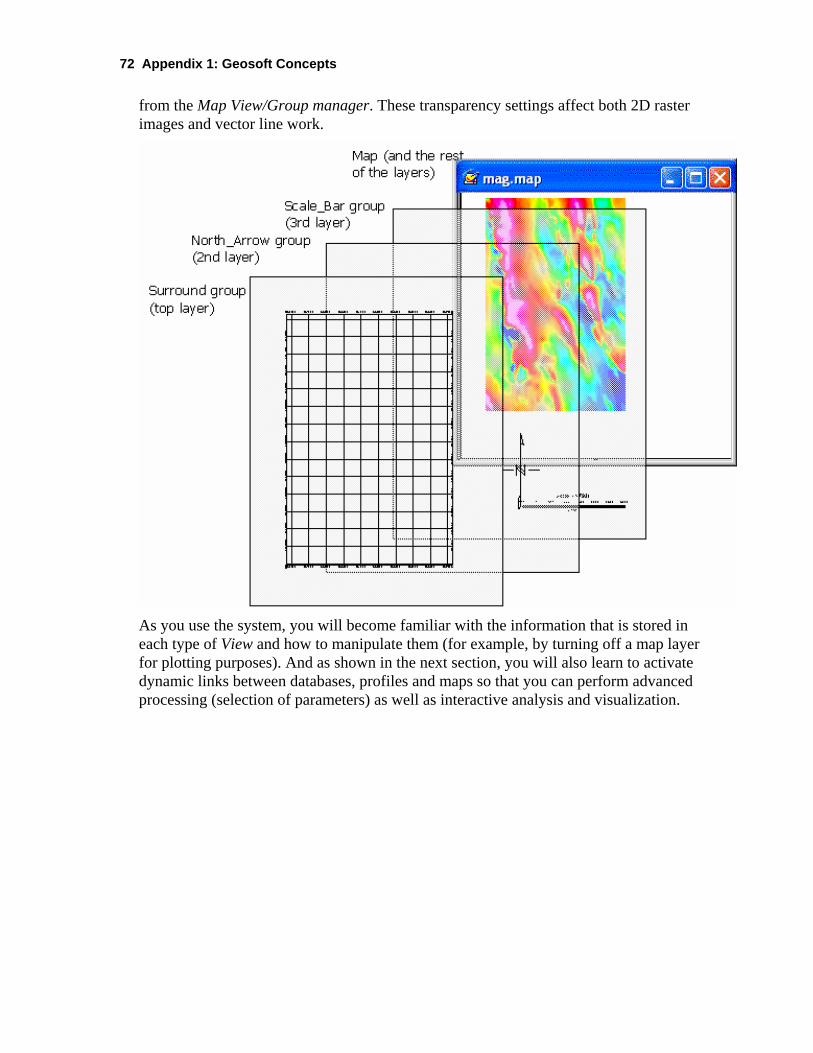
72 Appendix 1: Geosoft Concepts
from the Map View/Group manager. These transparency settings affect both 2D raster images and vector line work.
As you use the system, you will become familiar with the information that is stored in each type of View and how to manipulate them (for example, by turning off a map layer for plotting purposes). And as shown in the next section, you will also learn to activate dynamic links between databases, profiles and maps so that you can perform advanced processing (selection of parameters) as well as interactive analysis and visualization.
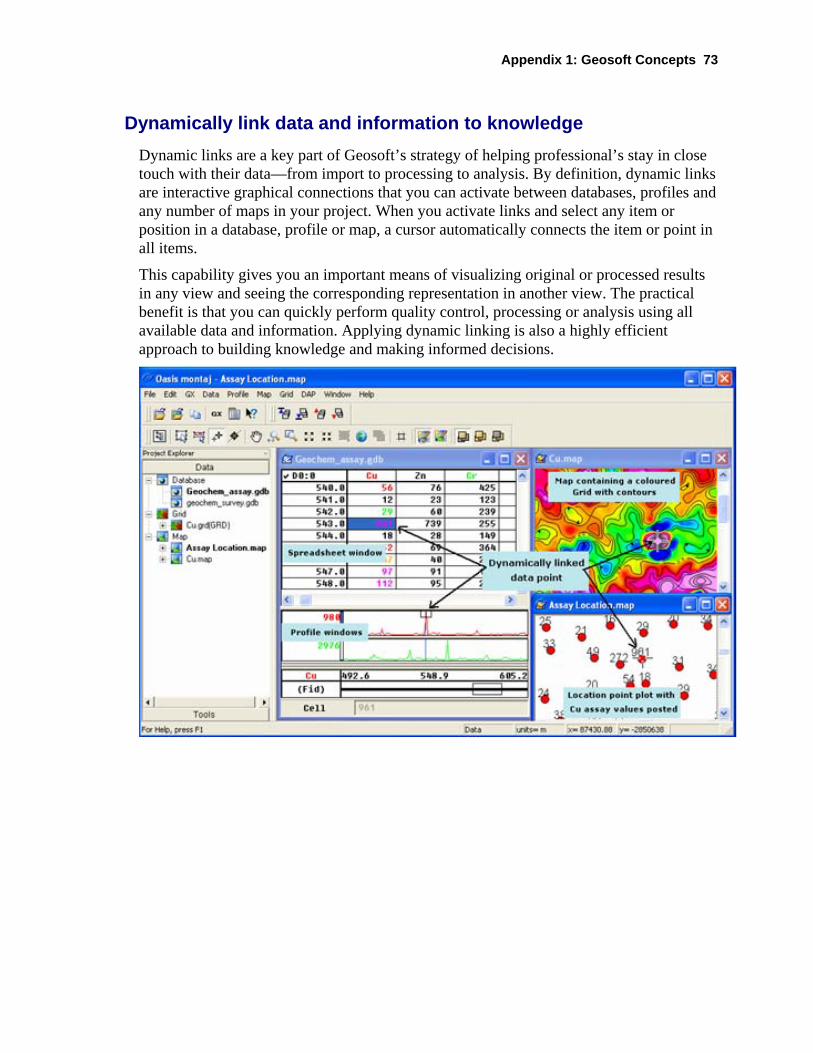
Appendix 1: Geosoft Concepts 73
Dynamically link data and information to knowledge Dynamic links are a key part of Geosoft’s strategy of helping professional’s stay in close touch with their data—from import to processing to analysis. By definition, dynamic links are interactive graphical connections that you can activate between databases, profiles and any number of maps in your project. When you activate links and select any item or position in a database, profile or map, a cursor automatically connects the item or point in all items.
This capability gives you an important means of visualizing original or processed results in any view and seeing the corresponding representation in another view. The practical benefit is that you can quickly perform quality control, processing or analysis using all available data and information. Applying dynamic linking is also a highly efficient approach to building knowledge and making informed decisions.
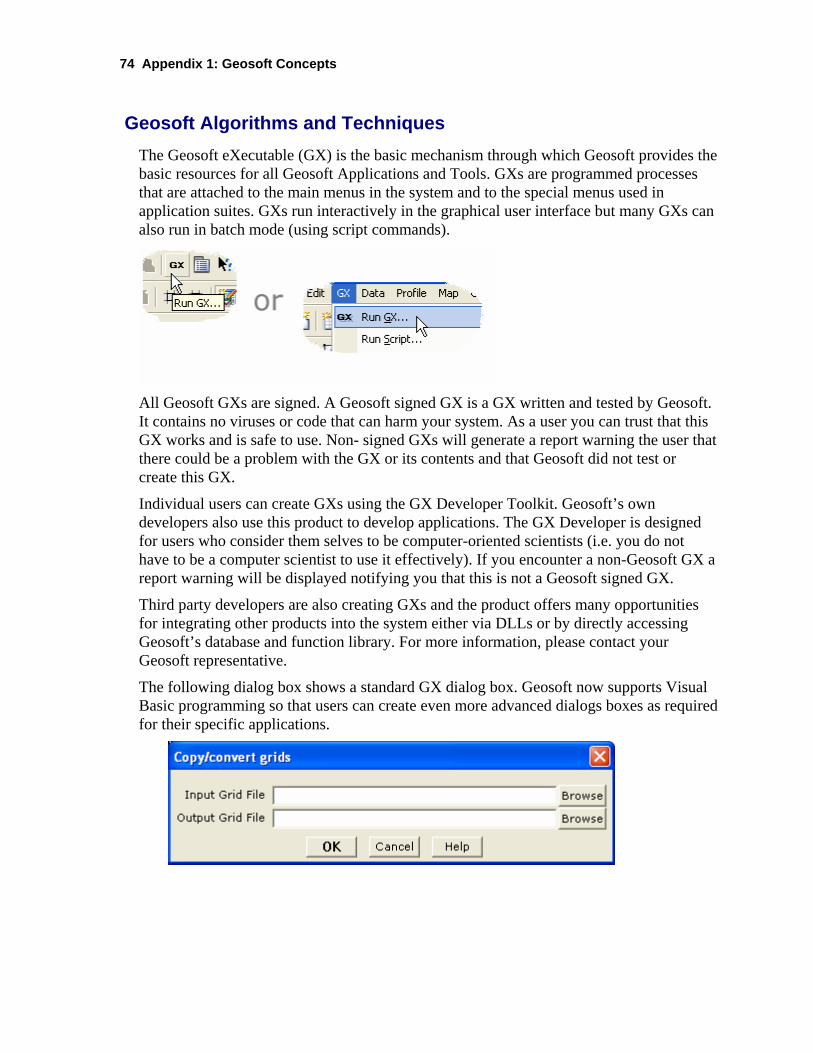
74 Appendix 1: Geosoft Concepts
Geosoft Algorithms and Techniques The Geosoft eXecutable (GX) is the basic mechanism through which Geosoft provides the basic resources for all Geosoft Applications and Tools. GXs are programmed processes that are attached to the main menus in the system and to the special menus used in application suites. GXs run interactively in the graphical user interface but many GXs can also run in batch mode (using script commands).
All Geosoft GXs are signed. A Geosoft signed GX is a GX written and tested by Geosoft. It contains no viruses or code that can harm your system. As a user you can trust that this GX works and is safe to use. Non- signed GXs will generate a report warning the user that there could be a problem with the GX or its contents and that Geosoft did not test or create this GX.
Individual users can create GXs using the GX Developer Toolkit. Geosoft’s own developers also use this product to develop applications. The GX Developer is designed for users who consider them selves to be computer-oriented scientists (i.e. you do not have to be a computer scientist to use it effectively). If you encounter a non-Geosoft GX a report warning will be displayed notifying you that this is not a Geosoft signed GX.
Third party developers are also creating GXs and the product offers many opportunities for integrating other products into the system either via DLLs or by directly accessing Geosoft’s database and function library. For more information, please contact your Geosoft representative.
The following dialog box shows a standard GX dialog box. Geosoft now supports Visual Basic programming so that users can create even more advanced dialogs boxes as required for their specific applications.
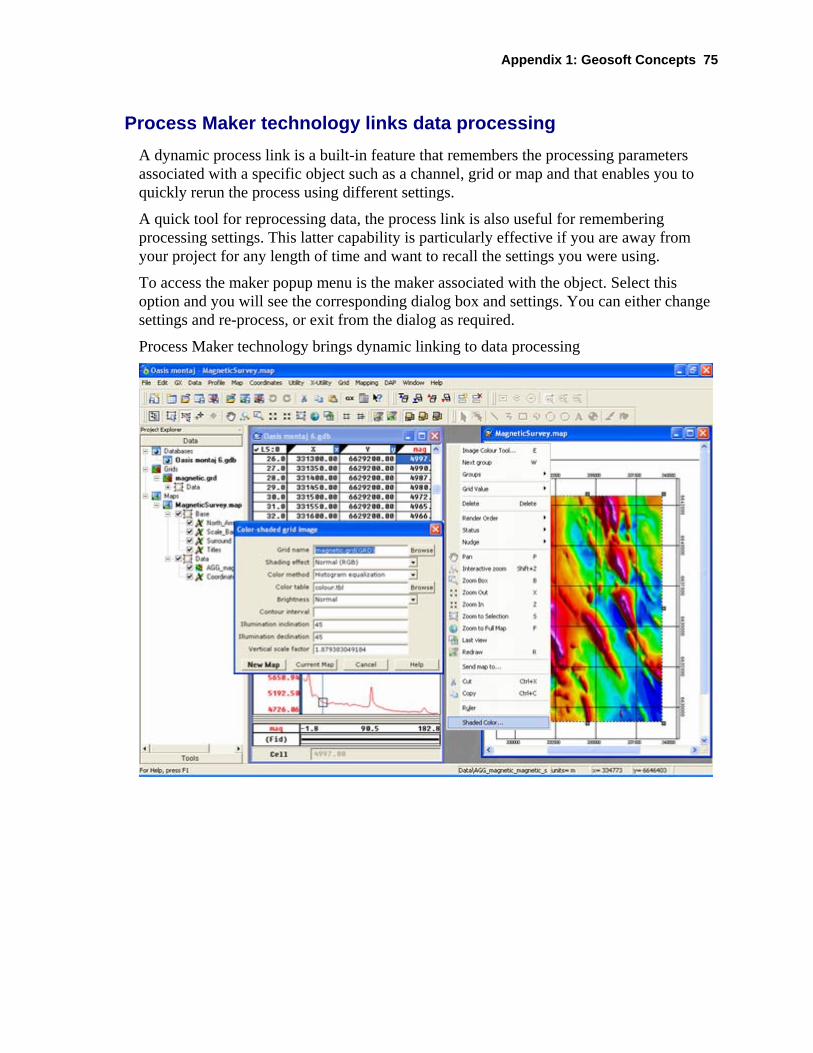
Appendix 1: Geosoft Concepts 75
Process Maker technology links data processing A dynamic process link is a built-in feature that remembers the processing parameters associated with a specific object such as a channel, grid or map and that enables you to quickly rerun the process using different settings.
A quick tool for reprocessing data, the process link is also useful for remembering processing settings. This latter capability is particularly effective if you are away from your project for any length of time and want to recall the settings you were using.
To access the maker popup menu is the maker associated with the object. Select this option and you will see the corresponding dialog box and settings. You can either change settings and re-process, or exit from the dialog as required.
Process Maker technology brings dynamic linking to data processing
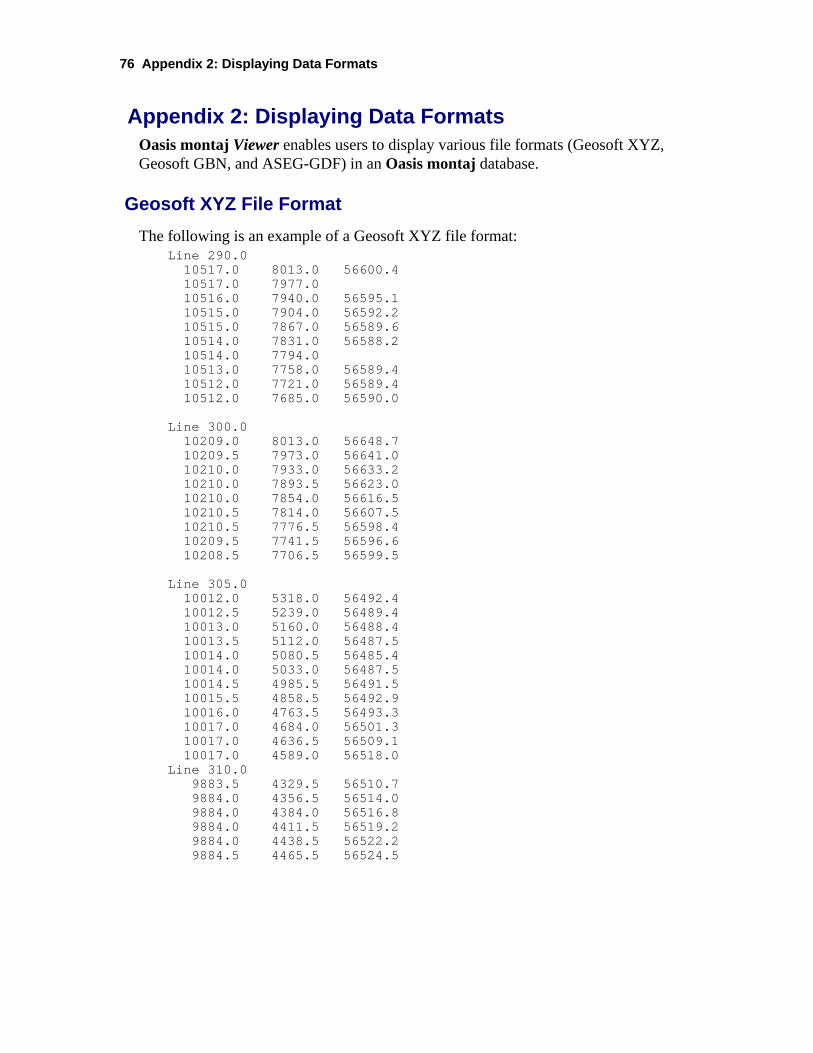
76 Appendix 2: Displaying Data Formats
Appendix 2: Displaying Data Formats Oasis montaj Viewer enables users to display various file formats (Geosoft XYZ, Geosoft GBN, and ASEG-GDF) in an Oasis montaj database.
Geosoft XYZ File Format The following is an example of a Geosoft XYZ file format:
Line 290.0 10517.0 8013.0 56600.4 10517.0 7977.0 10516.0 7940.0 56595.1 10515.0 7904.0 56592.2 10515.0 7867.0 56589.6 10514.0 7831.0 56588.2 10514.0 7794.0 10513.0 7758.0 56589.4 10512.0 7721.0 56589.4 10512.0 7685.0 56590.0 Line 300.0 10209.0 8013.0 56648.7 10209.5 7973.0 56641.0 10210.0 7933.0 56633.2 10210.0 7893.5 56623.0 10210.0 7854.0 56616.5 10210.5 7814.0 56607.5 10210.5 7776.5 56598.4 10209.5 7741.5 56596.6 10208.5 7706.5 56599.5 Line 305.0 10012.0 5318.0 56492.4 10012.5 5239.0 56489.4 10013.0 5160.0 56488.4 10013.5 5112.0 56487.5 10014.0 5080.5 56485.4 10014.0 5033.0 56487.5 10014.5 4985.5 56491.5 10015.5 4858.5 56492.9 10016.0 4763.5 56493.3 10017.0 4684.0 56501.3 10017.0 4636.5 56509.1 10017.0 4589.0 56518.0 Line 310.0 9883.5 4329.5 56510.7 9884.0 4356.5 56514.0 9884.0 4384.0 56516.8 9884.0 4411.5 56519.2 9884.0 4438.5 56522.2 9884.5 4465.5 56524.5
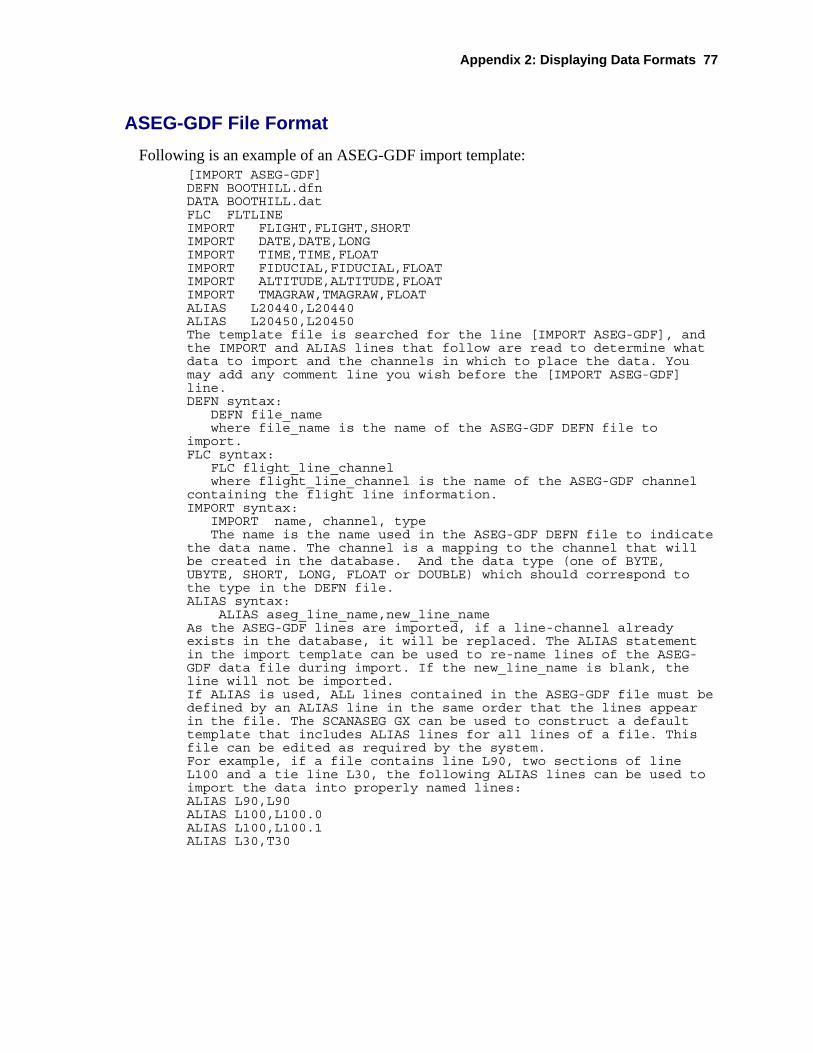
Appendix 2: Displaying Data Formats 77
ASEG-GDF File Format Following is an example of an ASEG-GDF import template:
[IMPORT ASEG-GDF] DEFN BOOTHILL.dfn DATA BOOTHILL.dat FLC FLTLINE IMPORT FLIGHT,FLIGHT,SHORT IMPORT DATE,DATE,LONG IMPORT TIME,TIME,FLOAT IMPORT FIDUCIAL,FIDUCIAL,FLOAT IMPORT ALTITUDE,ALTITUDE,FLOAT IMPORT TMAGRAW,TMAGRAW,FLOAT ALIAS L20440,L20440 ALIAS L20450,L20450 The template file is searched for the line [IMPORT ASEG-GDF], and the IMPORT and ALIAS lines that follow are read to determine what data to import and the channels in which to place the data. You may add any comment line you wish before the [IMPORT ASEG-GDF] line. DEFN syntax: DEFN file_name where file_name is the name of the ASEG-GDF DEFN file to import. FLC syntax: FLC flight_line_channel where flight_line_channel is the name of the ASEG-GDF channel containing the flight line information. IMPORT syntax: IMPORT name, channel, type The name is the name used in the ASEG-GDF DEFN file to indicate the data name. The channel is a mapping to the channel that will be created in the database. And the data type (one of BYTE, UBYTE, SHORT, LONG, FLOAT or DOUBLE) which should correspond to the type in the DEFN file. ALIAS syntax: ALIAS aseg_line_name,new_line_name As the ASEG-GDF lines are imported, if a line-channel already exists in the database, it will be replaced. The ALIAS statement in the import template can be used to re-name lines of the ASEG-GDF data file during import. If the new_line_name is blank, the line will not be imported. If ALIAS is used, ALL lines contained in the ASEG-GDF file must be defined by an ALIAS line in the same order that the lines appear in the file. The SCANASEG GX can be used to construct a default template that includes ALIAS lines for all lines of a file. This file can be edited as required by the system. For example, if a file contains line L90, two sections of line L100 and a tie line L30, the following ALIAS lines can be used to import the data into properly named lines: ALIAS L90,L90 ALIAS L100,L100.0 ALIAS L100,L100.1 ALIAS L30,T30
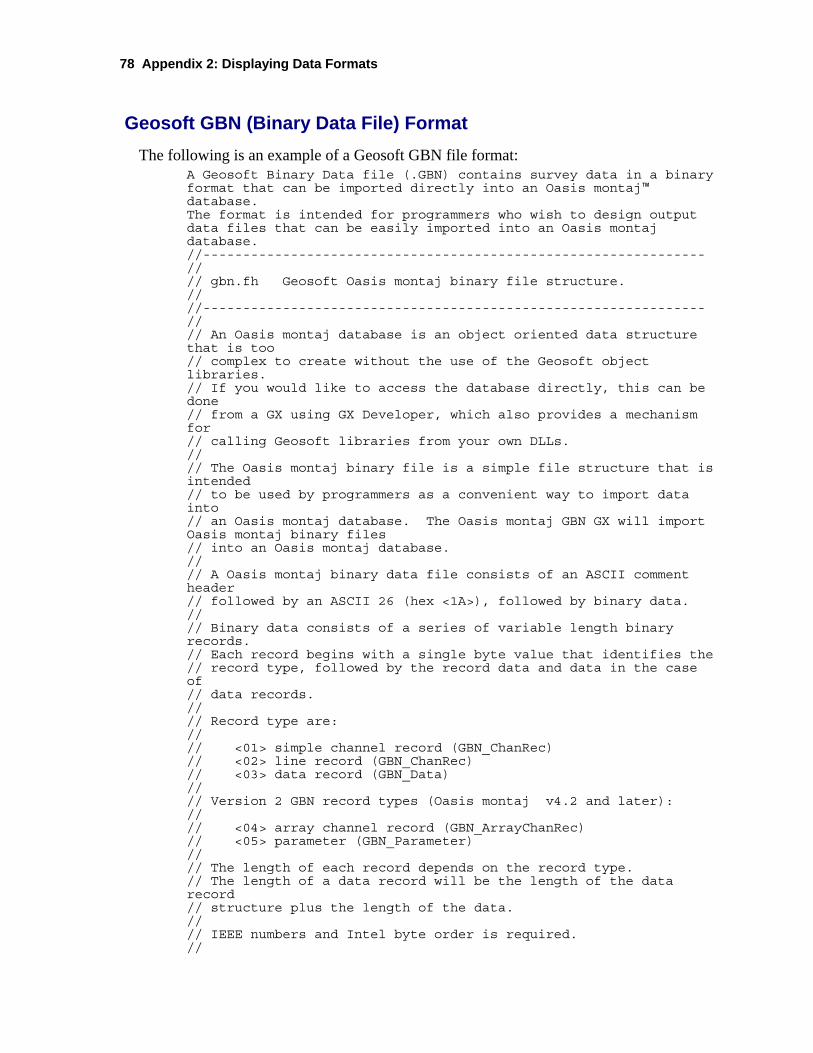
78 Appendix 2: Displaying Data Formats
Geosoft GBN (Binary Data File) Format The following is an example of a Geosoft GBN file format:
A Geosoft Binary Data file (.GBN) contains survey data in a binary format that can be imported directly into an Oasis montaj™ database. The format is intended for programmers who wish to design output data files that can be easily imported into an Oasis montaj database. //--------------------------------------------------------------- // // gbn.fh Geosoft Oasis montaj binary file structure. // //--------------------------------------------------------------- // // An Oasis montaj database is an object oriented data structure that is too // complex to create without the use of the Geosoft object libraries. // If you would like to access the database directly, this can be done // from a GX using GX Developer, which also provides a mechanism for // calling Geosoft libraries from your own DLLs. // // The Oasis montaj binary file is a simple file structure that is intended // to be used by programmers as a convenient way to import data into // an Oasis montaj database. The Oasis montaj GBN GX will import Oasis montaj binary files // into an Oasis montaj database. // // A Oasis montaj binary data file consists of an ASCII comment header // followed by an ASCII 26 (hex <1A>), followed by binary data. // // Binary data consists of a series of variable length binary records. // Each record begins with a single byte value that identifies the // record type, followed by the record data and data in the case of // data records. // // Record type are: // // <01> simple channel record (GBN_ChanRec) // <02> line record (GBN_ChanRec) // <03> data record (GBN_Data) // // Version 2 GBN record types (Oasis montaj v4.2 and later): // // <04> array channel record (GBN_ArrayChanRec) // <05> parameter (GBN_Parameter) // // The length of each record depends on the record type. // The length of a data record will be the length of the data record // structure plus the length of the data. // // IEEE numbers and Intel byte order is required. //
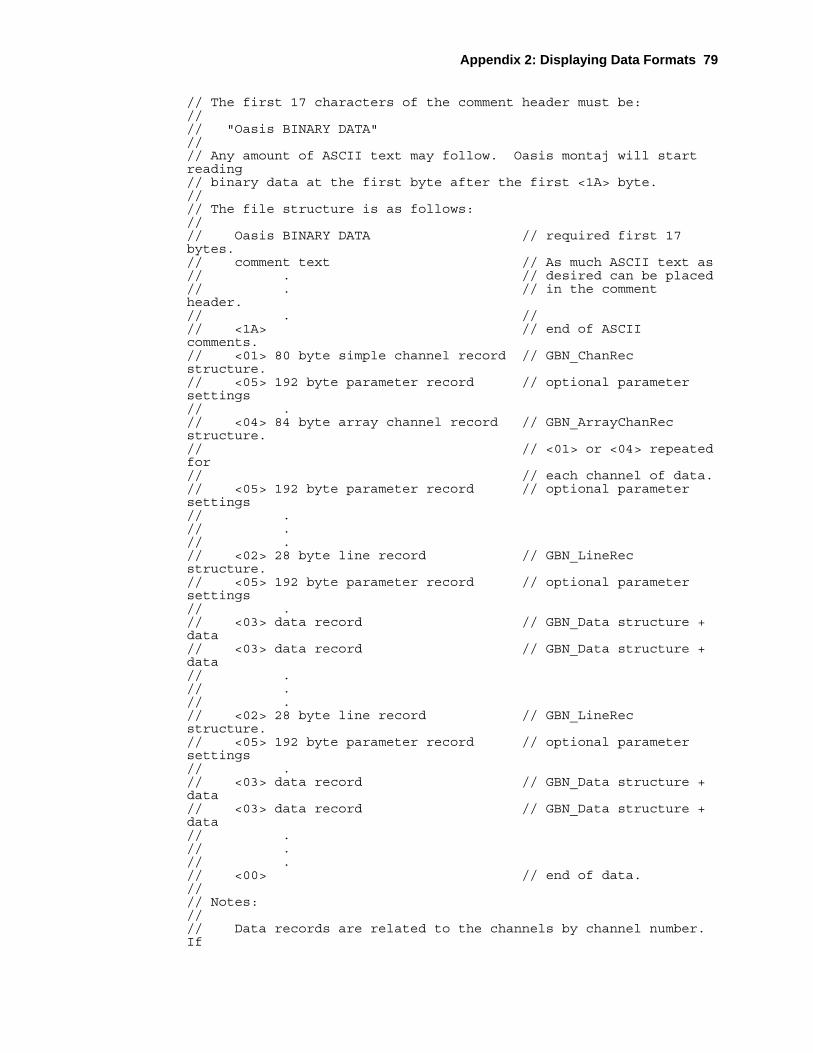
Appendix 2: Displaying Data Formats 79
// The first 17 characters of the comment header must be: // // "Oasis BINARY DATA" // // Any amount of ASCII text may follow. Oasis montaj will start reading // binary data at the first byte after the first <1A> byte. // // The file structure is as follows: // // Oasis BINARY DATA // required first 17 bytes. // comment text // As much ASCII text as // . // desired can be placed // . // in the comment header. // . // // <1A> // end of ASCII comments. // <01> 80 byte simple channel record // GBN_ChanRec structure. // <05> 192 byte parameter record // optional parameter settings // . // <04> 84 byte array channel record // GBN_ArrayChanRec structure. // // <01> or <04> repeated for // // each channel of data. // <05> 192 byte parameter record // optional parameter settings // . // . // . // <02> 28 byte line record // GBN_LineRec structure. // <05> 192 byte parameter record // optional parameter settings // . // <03> data record // GBN_Data structure + data // <03> data record // GBN_Data structure + data // . // . // . // <02> 28 byte line record // GBN_LineRec structure. // <05> 192 byte parameter record // optional parameter settings // . // <03> data record // GBN_Data structure + data // <03> data record // GBN_Data structure + data // . // . // . // <00> // end of data. // // Notes: // // Data records are related to the channels by channel number. If
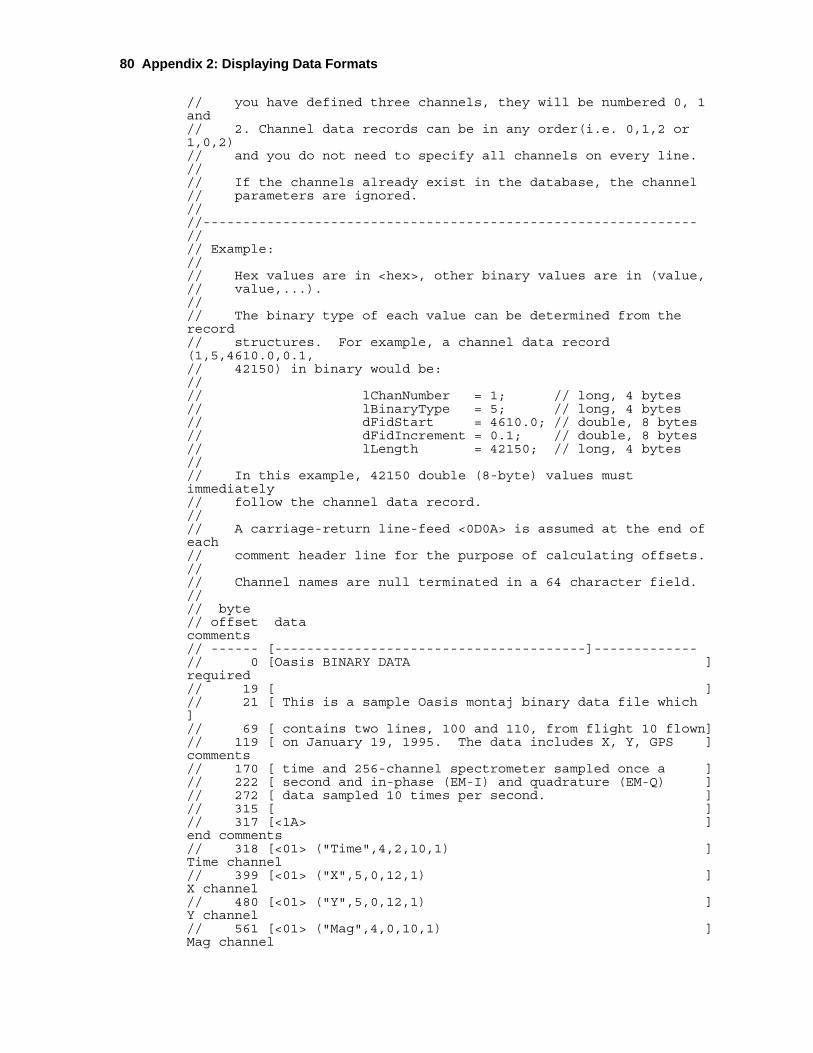
80 Appendix 2: Displaying Data Formats
// you have defined three channels, they will be numbered 0, 1 and // 2. Channel data records can be in any order(i.e. 0,1,2 or 1,0,2) // and you do not need to specify all channels on every line. // // If the channels already exist in the database, the channel // parameters are ignored. // //-------------------------------------------------------------- // // Example: // // Hex values are in <hex>, other binary values are in (value, // value,...). // // The binary type of each value can be determined from the record // structures. For example, a channel data record (1,5,4610.0,0.1, // 42150) in binary would be: // // lChanNumber = 1; // long, 4 bytes // lBinaryType = 5; // long, 4 bytes // dFidStart = 4610.0; // double, 8 bytes // dFidIncrement = 0.1; // double, 8 bytes // lLength = 42150; // long, 4 bytes // // In this example, 42150 double (8-byte) values must immediately // follow the channel data record. // // A carriage-return line-feed <0D0A> is assumed at the end of each // comment header line for the purpose of calculating offsets. // // Channel names are null terminated in a 64 character field. // // byte // offset data comments // ------ [---------------------------------------]------------- // 0 [Oasis BINARY DATA ] required // 19 [ ] // 21 [ This is a sample Oasis montaj binary data file which ] // 69 [ contains two lines, 100 and 110, from flight 10 flown] // 119 [ on January 19, 1995. The data includes X, Y, GPS ] comments // 170 [ time and 256-channel spectrometer sampled once a ] // 222 [ second and in-phase (EM-I) and quadrature (EM-Q) ] // 272 [ data sampled 10 times per second. ] // 315 [ ] // 317 [<1A> ] end comments // 318 [<01> ("Time",4,2,10,1) ] Time channel // 399 [<01> ("X",5,0,12,1) ] X channel // 480 [<01> ("Y",5,0,12,1) ] Y channel // 561 [<01> ("Mag",4,0,10,1) ] Mag channel
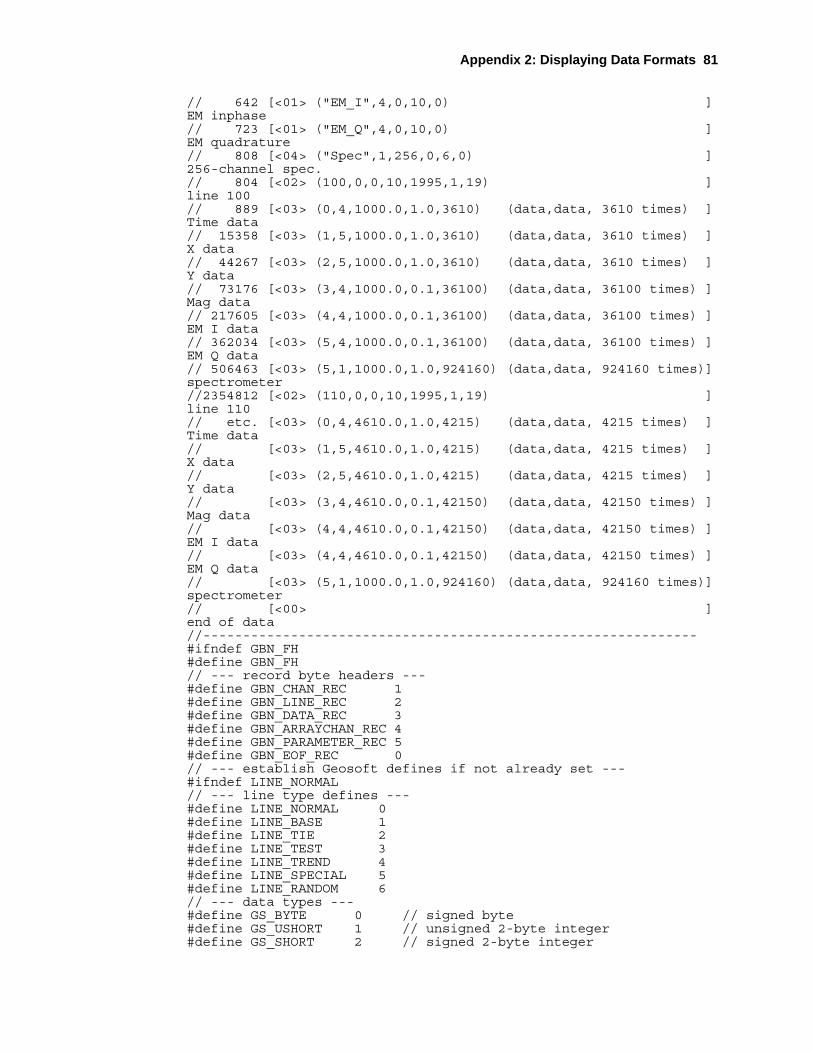
Appendix 2: Displaying Data Formats 81
// 642 [<01> ("EM_I",4,0,10,0) ] EM inphase // 723 [<01> ("EM_Q",4,0,10,0) ] EM quadrature // 808 [<04> ("Spec",1,256,0,6,0) ] 256-channel spec. // 804 [<02> (100,0,0,10,1995,1,19) ] line 100 // 889 [<03> (0,4,1000.0,1.0,3610) (data,data, 3610 times) ] Time data // 15358 [<03> (1,5,1000.0,1.0,3610) (data,data, 3610 times) ] X data // 44267 [<03> (2,5,1000.0,1.0,3610) (data,data, 3610 times) ] Y data // 73176 [<03> (3,4,1000.0,0.1,36100) (data,data, 36100 times) ] Mag data // 217605 [<03> (4,4,1000.0,0.1,36100) (data,data, 36100 times) ] EM I data // 362034 [<03> (5,4,1000.0,0.1,36100) (data,data, 36100 times) ] EM Q data // 506463 [<03> (5,1,1000.0,1.0,924160) (data,data, 924160 times)] spectrometer //2354812 [<02> (110,0,0,10,1995,1,19) ] line 110 // etc. [<03> (0,4,4610.0,1.0,4215) (data,data, 4215 times) ] Time data // [<03> (1,5,4610.0,1.0,4215) (data,data, 4215 times) ] X data // [<03> (2,5,4610.0,1.0,4215) (data,data, 4215 times) ] Y data // [<03> (3,4,4610.0,0.1,42150) (data,data, 42150 times) ] Mag data // [<03> (4,4,4610.0,0.1,42150) (data,data, 42150 times) ] EM I data // [<03> (4,4,4610.0,0.1,42150) (data,data, 42150 times) ] EM Q data // [<03> (5,1,1000.0,1.0,924160) (data,data, 924160 times)] spectrometer // [<00> ] end of data //-------------------------------------------------------------- #ifndef GBN_FH #define GBN_FH // --- record byte headers --- #define GBN_CHAN_REC 1 #define GBN_LINE_REC 2 #define GBN_DATA_REC 3 #define GBN_ARRAYCHAN_REC 4 #define GBN_PARAMETER_REC 5 #define GBN_EOF_REC 0 // --- establish Geosoft defines if not already set --- #ifndef LINE_NORMAL // --- line type defines --- #define LINE_NORMAL 0 #define LINE_BASE 1 #define LINE_TIE 2 #define LINE_TEST 3 #define LINE_TREND 4 #define LINE_SPECIAL 5 #define LINE_RANDOM 6 // --- data types --- #define GS_BYTE 0 // signed byte #define GS_USHORT 1 // unsigned 2-byte integer #define GS_SHORT 2 // signed 2-byte integer
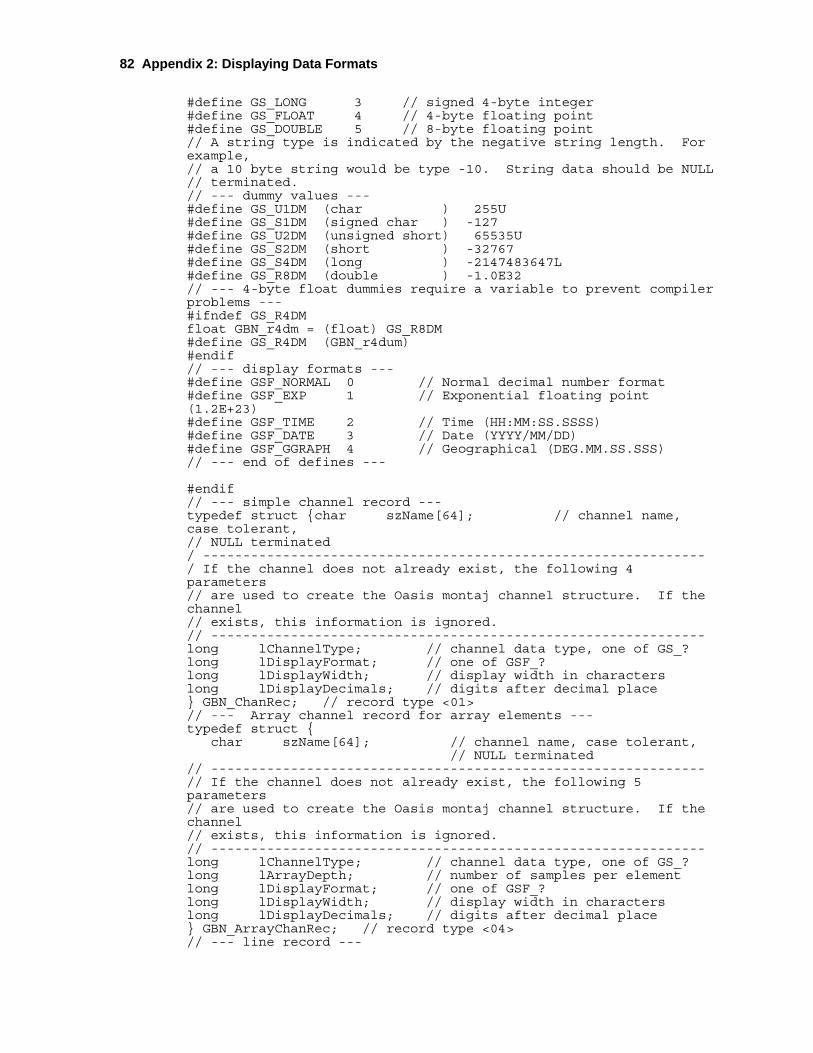
82 Appendix 2: Displaying Data Formats
#define GS_LONG 3 // signed 4-byte integer #define GS_FLOAT 4 // 4-byte floating point #define GS_DOUBLE 5 // 8-byte floating point // A string type is indicated by the negative string length. For example, // a 10 byte string would be type -10. String data should be NULL // terminated. // --- dummy values --- #define GS_U1DM (char ) 255U #define GS_S1DM (signed char ) -127 #define GS_U2DM (unsigned short) 65535U #define GS_S2DM (short ) -32767 #define GS_S4DM (long ) -2147483647L #define GS_R8DM (double ) -1.0E32 // --- 4-byte float dummies require a variable to prevent compiler problems --- #ifndef GS_R4DM float GBN_r4dm = (float) GS_R8DM #define GS_R4DM (GBN_r4dum) #endif // --- display formats --- #define GSF_NORMAL 0 // Normal decimal number format #define GSF_EXP 1 // Exponential floating point (1.2E+23) #define GSF_TIME 2 // Time (HH:MM:SS.SSSS) #define GSF_DATE 3 // Date (YYYY/MM/DD) #define GSF_GGRAPH 4 // Geographical (DEG.MM.SS.SSS) // --- end of defines --- #endif // --- simple channel record --- typedef struct {char szName[64]; // channel name, case tolerant, // NULL terminated / --------------------------------------------------------------- / If the channel does not already exist, the following 4 parameters // are used to create the Oasis montaj channel structure. If the channel // exists, this information is ignored. // -------------------------------------------------------------- long lChannelType; // channel data type, one of GS_? long lDisplayFormat; // one of GSF_? long lDisplayWidth; // display width in characters long lDisplayDecimals; // digits after decimal place } GBN_ChanRec; // record type <01> // --- Array channel record for array elements --- typedef struct { char szName[64]; // channel name, case tolerant, // NULL terminated // -------------------------------------------------------------- // If the channel does not already exist, the following 5 parameters // are used to create the Oasis montaj channel structure. If the channel // exists, this information is ignored. // -------------------------------------------------------------- long lChannelType; // channel data type, one of GS_? long lArrayDepth; // number of samples per element long lDisplayFormat; // one of GSF_? long lDisplayWidth; // display width in characters long lDisplayDecimals; // digits after decimal place } GBN_ArrayChanRec; // record type <04> // --- line record ---
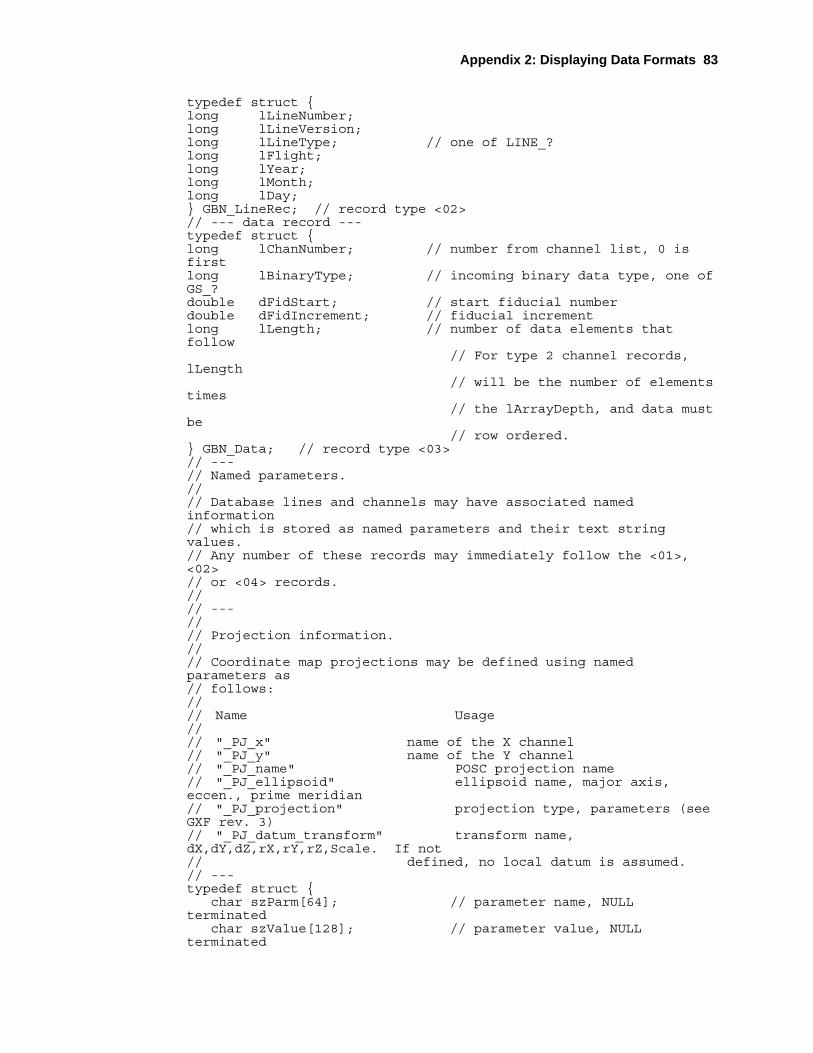
Appendix 2: Displaying Data Formats 83
typedef struct { long lLineNumber; long lLineVersion; long lLineType; // one of LINE_? long lFlight; long lYear; long lMonth; long lDay; } GBN_LineRec; // record type <02> // --- data record --- typedef struct { long lChanNumber; // number from channel list, 0 is first long lBinaryType; // incoming binary data type, one of GS_? double dFidStart; // start fiducial number double dFidIncrement; // fiducial increment long lLength; // number of data elements that follow // For type 2 channel records, lLength // will be the number of elements times // the lArrayDepth, and data must be // row ordered. } GBN_Data; // record type <03> // --- // Named parameters. // // Database lines and channels may have associated named information // which is stored as named parameters and their text string values. // Any number of these records may immediately follow the <01>, <02> // or <04> records. // // --- // // Projection information. // // Coordinate map projections may be defined using named parameters as // follows: // // Name Usage // // "_PJ_x" name of the X channel // "_PJ_y" name of the Y channel // "_PJ_name" POSC projection name // "_PJ_ellipsoid" ellipsoid name, major axis, eccen., prime meridian // "_PJ_projection" projection type, parameters (see GXF rev. 3) // "_PJ_datum_transform" transform name, dX,dY,dZ,rX,rY,rZ,Scale. If not // defined, no local datum is assumed. // --- typedef struct { char szParm[64]; // parameter name, NULL terminated char szValue[128]; // parameter value, NULL terminated
84 Appendix 2: Displaying Data Formats
} GBN_ParameterRec; // record type <05> //---------------------------------------------------------------- // BINARY TYPES // // Some of the data types in a GBN file have special usage in Oasis // montaj. These are: // // GSF_TIME 2 // Time (HH:MM:SS.SSSS) // GSF_DATE 3 // Date (YYYY/MM/DD) // GSF_GGRAPH 4 // Geographical (DEG.MM.SS.SSS) // // They are stored as either GS_FLOAT or GS_DOUBLE in a channel and can // be display in Oasis montaj as a number of as their special format (Time,Date). // // The following C functions can be used to create GEOSOFT dates and times. // Note that the GGRAPH format is just a TIME format with hours between -360 and 360. // // //--------------------------------------------------------------- // // long RoundLong(double a) // { // if (a > 0.0) // return((long) (a + 0.5)); // else // return((long) (a - 0.5)); // } // // // void // BreakTime(double dVal, // Value to break // long *plHour, // Hours // short *psMin, // Minutes // short *psSec, // Seconds // double *pdFrac) // Fraction // { // double dI,dF; // short sNeg = 0; // // // --- Take out the negative --- // // if (dVal < 0.0) { sNeg = 1; dVal = -dVal; } // // // // --- Break into Fractional Components --- // // dF = modf(dVal,&dI); // // // // --- Determine the Hour --- // // *plHour = (long) dI; // // // // --- Determine the Minutes And Seconds/Frac --- // // *pdFrac = modf(dF * 3600.0,&dI); // *psSec = (short) RoundLong(dI);

Appendix 2: Displaying Data Formats 85
// *psMin = (short) (*psSec / 60); // *psSec = (short) (*psSec % 60); // // // --- Negative ? --- // // return(sNeg); // } // // -------------------------------------------------------------- // // static const short DateNGS[12] = {31,28,31,30,31,30,31,31,30,31,30,31}; // static const short DateLGS[12] = {31,29,31,30,31,30,31,31,30,31,30,31}; // // #define NORMAL_YEAR 365 // #define LEAP_YEAR 366 // // void // sBreakDate(double dVal, // Value to break // short *psYear, // Year // short *psMonth, // Month // short *psDay) // Day // { // double dF,dI; // short sDays; // const short *psMonths; // // short sDay; // short sMonth; // short sYear; // // // --- Break in the Integer and Fractional Components --- // // if (dVal < 0.0) dVal = 0.0; // dF = modf(dVal,&dI); // // // // --- Compute the Year --- // // sYear = (short) dI; // if ( (sYear % 4) == 0) // { // psMonths = DateLGS; // sDays = LEAP_YEAR; // } else { // psMonths = DateNGS; // sDays = NORMAL_YEAR; // } // // --- Compute the Day --- // // sDay = (short) RoundLong(dF * (double) sDays); // // // // --- Compute the Month --- // // sMonth = 0; // while (sDay >= psMonths[sMonth]) { sDay-= psMonths[sMonth]; sMonth++; } // // // // --- Ok --- // // *psYear = sYear;
86 Appendix 2: Displaying Data Formats
// *psMonth = sMonth+1; // *psDay = sDay+1; // } // // -------------------------------------------------------------- // // double // dMakeTime(long lHour, // Hour Value // long lMin, // Minute // double dSec) // Second // { // double dVal; // // // --- Limit the Information --- // // if (dSec > 30000000.0) dSec = 0.0; // else { // while (dSec >= 60.0) {lMin++; dSec -= 60.0;} // if (dSec < 0.0) dSec = 0.0; // } // if (lMin > 500000L) lMin = 0L; // else { // while (lMin >= 60L) { // if (lHour >= 0L) lHour++; // else lHour--; // lMin -= 60; // } // if (lMin < 0L) lMin = 0L; // } // // // --- Compute fractional hour --- // // dVal = (dSec + (double) (lMin * 60L)) / 3600.0; // if (lHour < 0) dVal = -dVal; // // // --- Compute final value --- // // return(dVal + (double) lHour); // } // // //------------------------------------------------------------ // // double // dMakeDate(short sYear, // Year // short sMonth, // Month // short sDay) // Day of the Month // { // short sDays; // const short *psMonths; // short i; // // // --- Validate the Date --- // // if (sYear < 0) sYear = 0; // if ((sYear%4) == 0) // { // psMonths = DateLGS; // sDays = LEAP_YEAR; // } else { // psMonths = DateNGS; // sDays = NORMAL_YEAR; // } // //
Appendix 2: Displaying Data Formats 87
// // --- Get the Month --- // // sMonth--; // if (sMonth < 0) sMonth = 0; // if (sMonth > 11) sMonth = 11; // // // // --- Get the Day --- // // sDay--; // if (sDay < 0) sDay = 0; // if (sDay >= psMonths[sMonth]) sDay = (short) (psMonths[sMonth]-1); // // // // --- Add days in the previous months --- // // i=0; // while (i < sMonth) sDay += psMonths[i++]; // // // // --- Compute the Value --- // // return((double) sYear + ((double) sDay / (double) sDays)); // } #endif