Embed Size (px)
Citation preview
Oasis montaj How-To Guide
Oasis montaj 3D ViewerThe 3D Viewer has been redesigned to streamline your workflow and provide enhanced usability. The 3D Viewer provides all of your 3D mapping tools, functions and settings in one integrated 3D environment.
This How-To Guide introduces you to the 3D Viewer environment and shows you how to work with the 3D tools, including creating 3D views, planes, symbols and voxels.
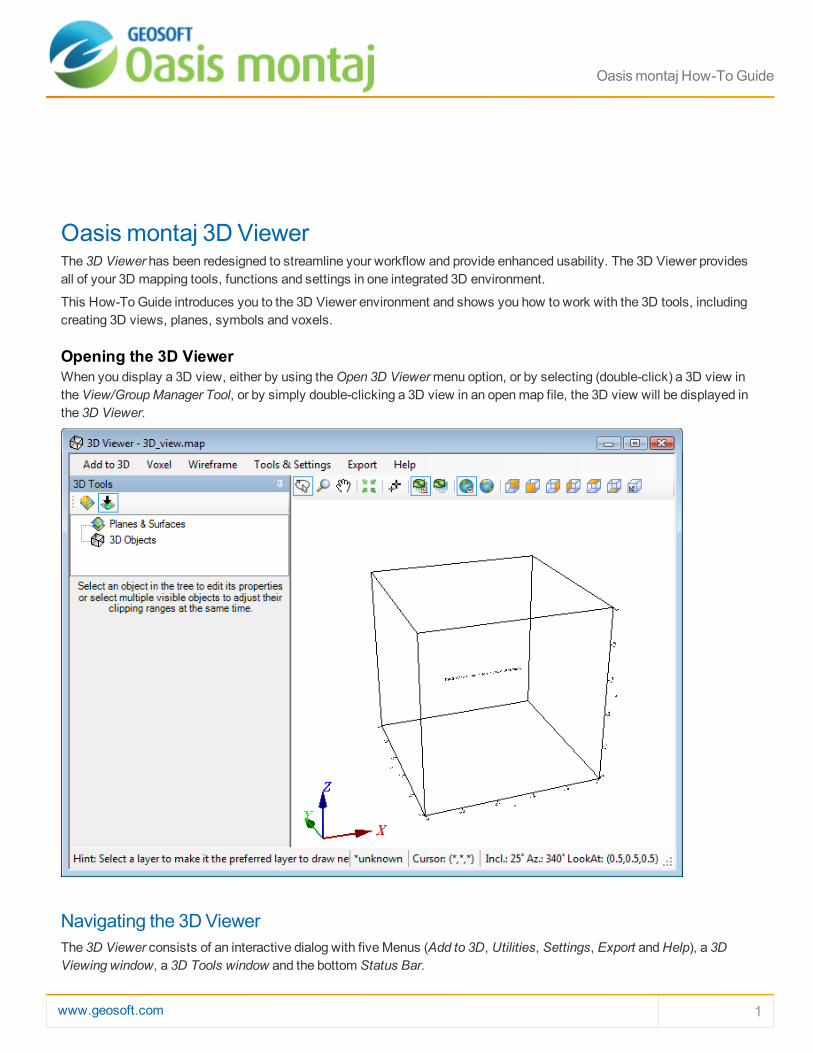
Opening the 3D ViewerWhen you display a 3D view, either by using the Open 3D Viewer menu option, or by selecting (double-click) a 3D view in the View/Group Manager Tool, or by simply double-clicking a 3D view in an open map file, the 3D view will be displayed in the 3D Viewer.
Navigating the 3D ViewerThe 3D Viewer consists of an interactive dialog with five Menus (Add to 3D, Utilities, Settings, Export and Help), a 3D Viewing window, a 3D Tools window and the bottom Status Bar.
www.geosoft.com 1
2 www.geosoft.com
For more detailed information on the 3D Viewer select Help on the 3D Viewing window.
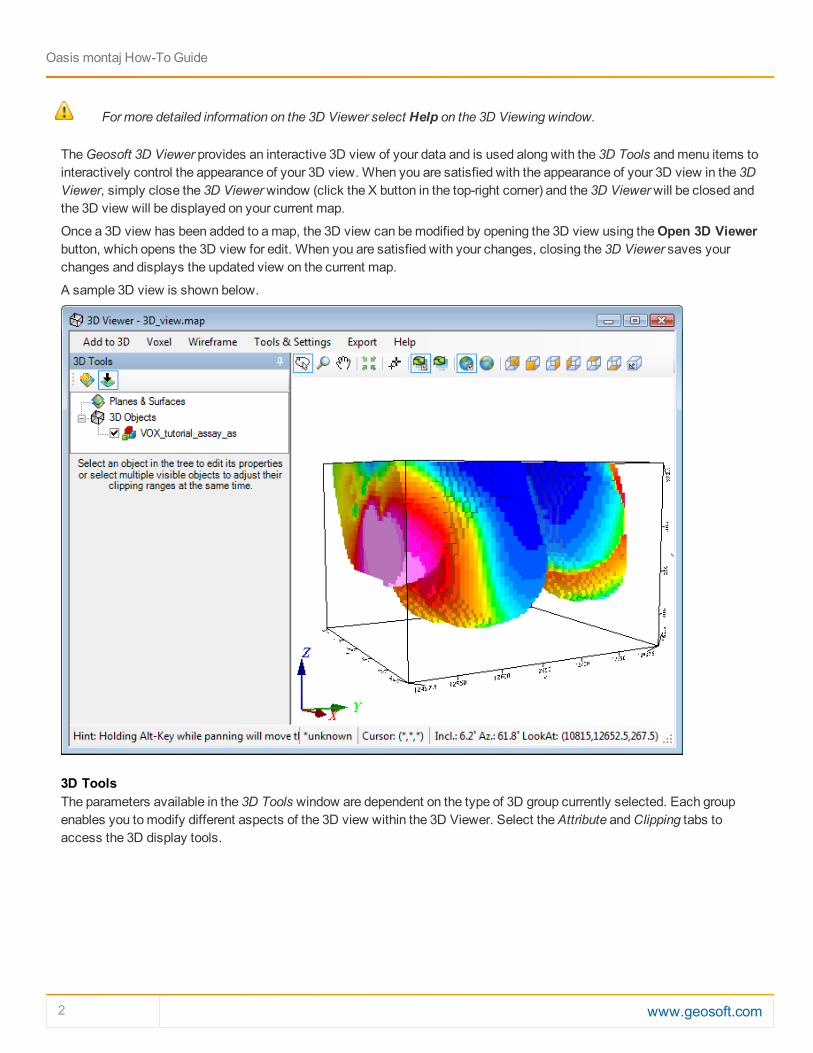
The Geosoft 3D Viewer provides an interactive 3D view of your data and is used along with the 3D Tools and menu items to interactively control the appearance of your 3D view. When you are satisfied with the appearance of your 3D view in the 3D Viewer, simply close the 3D Viewer window (click the X button in the top-right corner) and the 3D Viewer will be closed and the 3D view will be displayed on your current map.
Once a 3D view has been added to a map, the 3D view can be modified by opening the 3D view using the Open 3D Viewer button, which opens the 3D view for edit. When you are satisfied with your changes, closing the 3D Viewer saves your changes and displays the updated view on the current map.
A sample 3D view is shown below.
3D ToolsThe parameters available in the 3D Tools window are dependent on the type of 3D group currently selected. Each group enables you to modify different aspects of the 3D view within the 3D Viewer. Select the Attribute and Clipping tabs to access the 3D display tools.
Oasis montaj How-To Guide
Oasis montaj How-To Guide
3D Viewing WindowInteractive viewing buttons are provided on the toolbar directly above the 3D Viewing window.
Status BarThe Status Bar at the bottom of the 3D Viewer displays helpful navigation hints, along with the current 3D view's coordinate system, the shadow cursor location, the view's inclination, declination and look at point (centre of rotation).
Notes about 3D Views3D Views are rendered coarsely when interactively changing the orientation or point of view. When you release the mouse in any of these modes, the objects will be refined in a way that is optimum for the given point of view. The time it takes to refine the picture depends on processor speed, your 3D graphics capabilities, the complexity of the 3D object being drawn (number of planes, number of groups, relief resolution, etc.), and the amount of RAM on your system.
If a plane has a relief view, the groups drawn on the plane will only appear where the relief view is defined. Groups drawn on flat planes (those without relief Views) will be drawn to the extents of the group.
3D Views may have clipping areas just like 2D Views. In 3D views, the clip area is applied vertically relative to the X, Y coordinate of each plane.
3D Views in Oasis montajOasis montaj 3D views are a representation of a 3D drawing space on a standard Geosoft map. The 3D capabilities enable you to display multiple surfaces, each with its own relief and contents, and each with its own orientation in 3D space.
Creating 3D views requires the licensed processing engine, but 3D views on an existing map can be viewed and manipulated in the Oasis montaj free Viewer.
Understanding ViewsGeosoft Maps use views to organize and display information. Most Geosoft maps contain both a Base view and a Data view, but some maps may have more views for different purposes. Views contain Groups, and these groups in turn contain drawing elements. All Groups within a 2D View are drawn in the coordinate system of that view. The Base view uses coordinates in millimetres relative to the final printed paper, and the Data view uses a coordinate system that can represent a projected or geographic coordinate system on the earth, or simply an arbitrary X, Y Cartesian coordinate system. 2D Views contain one flat drawing surface, which is defined by the view’s coordinate system.
Like 2D Views, a 3D view also represents coordinates, but in this case in X, Y and Z. 3D views may contain Voxel (3D Grids) and any number of drawing planes. Any Group or drawing object that can be drawn on a 2D view can be drawn on a plane in a 3D view. Each plane in a 3D view can be oriented independently in the 3D coordinate system. A plane in a 3D view can be flat or it can have a relief surface defined by a grid file.
Planes will normally share the X, Y coordinates of the 3D view, and flat planes will have a constant Z value representing the vertical location of the plane. However, a plane coordinate system may be oriented in any direction in the 3D space for special applications. If a plane does have a Relief view, the axis of the relief is always in the Z direction of the plane.
www.geosoft.com 3
4 www.geosoft.com
3D views appear on a 2D map as a standard view, except that what you see is the 3D representation of the view from a fixed perspective. You can manipulate a 3D view using the 3D Viewer. To do this, select the 3D view, right click and select 3D Viewer from the pop-up menu, or simply click the Open 3D Viewer icon, and the 3D view will be displayed in the 3D Viewer.
You must be in Map View Mode to select a view
The 3D Viewer provides an integrated 3D environment that includes all of the tools, functions and settings to create a 3D map. Using the 3D Viewer you can add any number of 3D and 2D views and groups to your map, including; planes, relief surfaces, grids, voxels, vector voxels, isosurfaces, drillholes, geostrings, geosurfaces, 3D symbols, 2D map groups, and 3D import file formats.
When viewing the 3D view in the 3D Viewer, you can change the orientation of the view relative to your point of view by rotating the coordinate system horizontally and vertically, and you can zoom and pan into the view, and you can modify certain display parameters such as delete planes, and adjust plane transparency using the 3D Tools. The 3D Tools enable you to modify the 3D parameters, display characteristics and the appearance of your 3D view in the 3D Viewer. The 3D Tools are available in the window on the left side of the 3D Viewer.
Additional options are available using the 3D Viewer menus:
Add to 3D Voxel WireframeTools & Settings Export Help
When you close the 3D Viewer window, the 3D view will be drawn on the 2D Map as it last appeared in the 3D Viewer.
Creating a New 3D View in the 3D ViewerUsing the Create a New 3D View dialog you can add a new 3D view to a new 3D map or a current map.
To Create a New 3D ViewNewly created 3D views will open in the 3D Viewer.
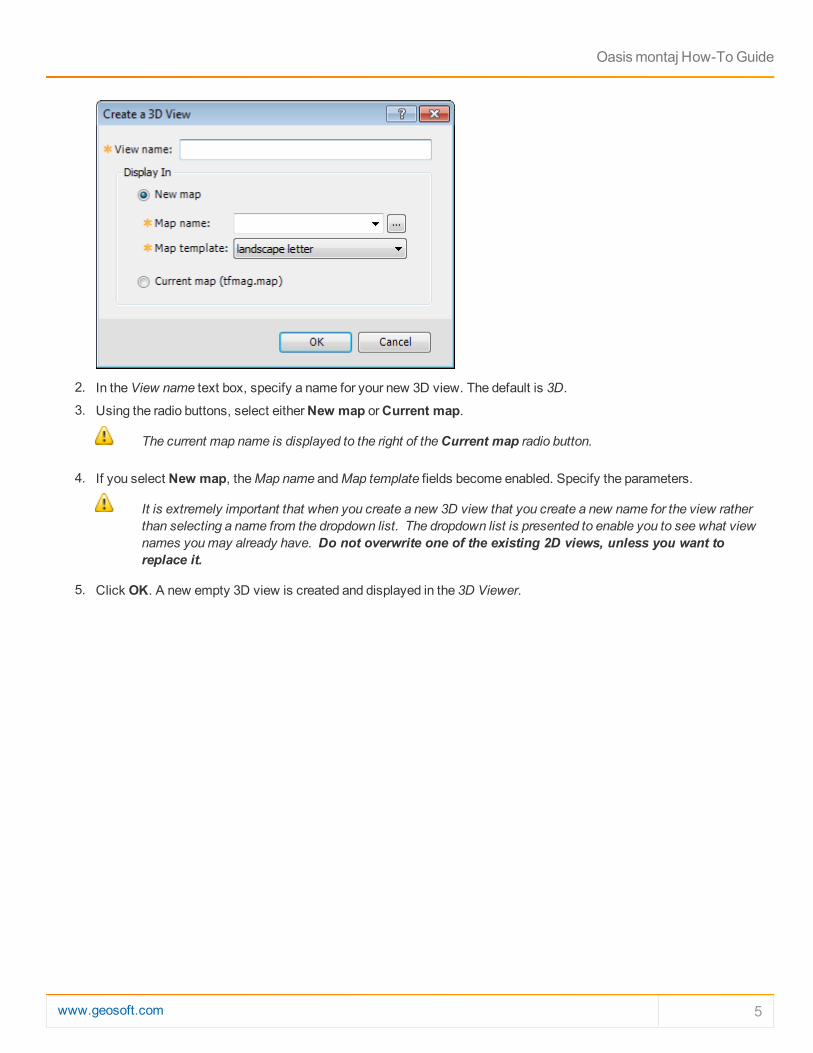
1. On the 3D menu, select Create a New 3D View. The Create a 3D View dialog appears.
Oasis montaj How-To Guide
Oasis montaj How-To Guide
2. In the View name text box, specify a name for your new 3D view. The default is 3D.
3. Using the radio buttons, select either New map or Current map.
The current map name is displayed to the right of the Current map radio button.
4. If you select New map, the Map name and Map template fields become enabled. Specify the parameters.
It is extremely important that when you create a new 3D view that you create a new name for the view rather than selecting a name from the dropdown list. The dropdown list is presented to enable you to see what view names you may already have. Do not overwrite one of the existing 2D views, unless you want to replace it.
5. Click OK. A new empty 3D view is created and displayed in the 3D Viewer.
www.geosoft.com 5
6 www.geosoft.com
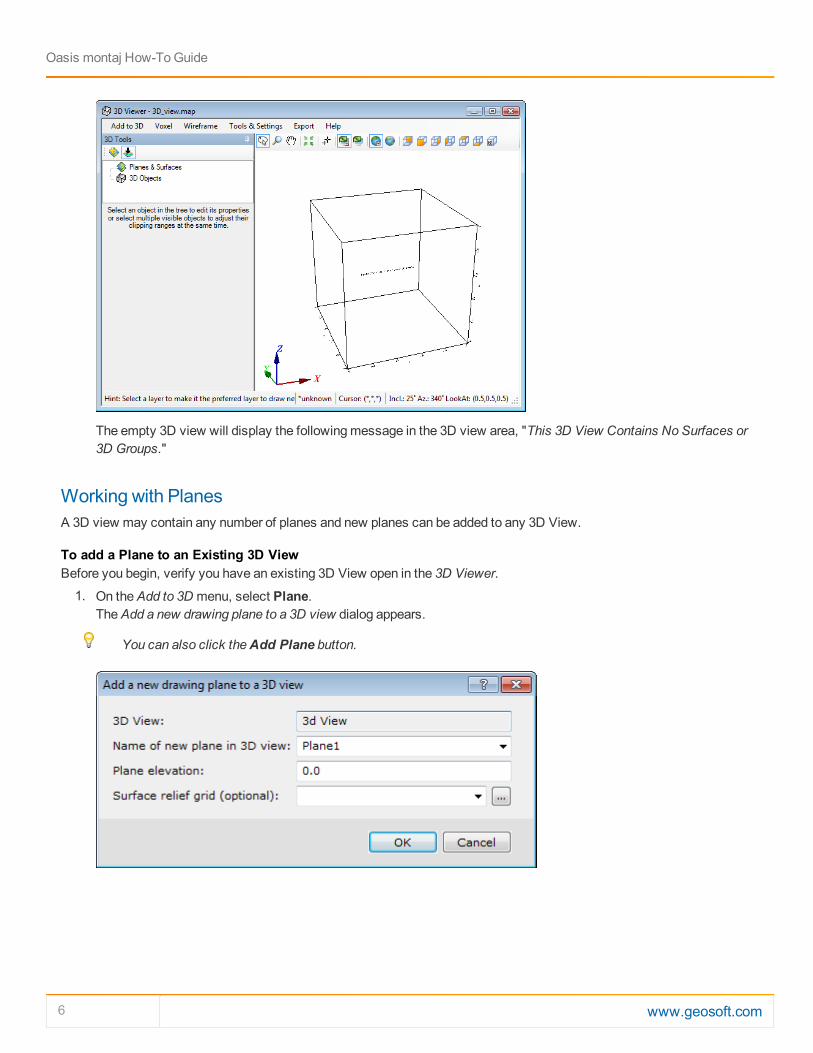
The empty 3D view will display the following message in the 3D view area, "This 3D View Contains No Surfaces or 3D Groups."
Working with PlanesA 3D view may contain any number of planes and new planes can be added to any 3D View.
To add a Plane to an Existing 3D ViewBefore you begin, verify you have an existing 3D View open in the 3D Viewer.
1. On the Add to 3D menu, select Plane. The Add a new drawing plane to a 3D view dialog appears.
You can also click the Add Plane button.
Oasis montaj How-To Guide
Oasis montaj How-To Guide
2. Specify the Name of new plane in 3D view . The default is Plane1.
If you enter the name of an existing plane, that plane will be replaced!
3. Specify the Plane elevation.
4. You can also select a Surface Relief grid if you would like the plane to have relief.
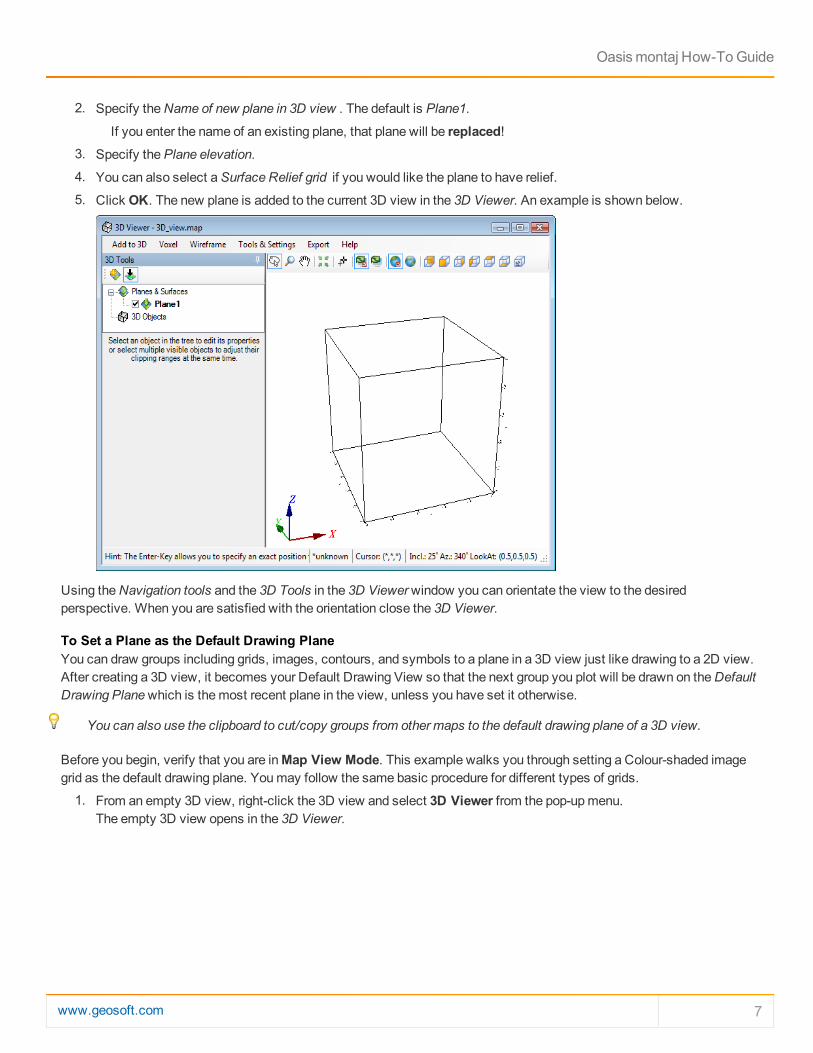
5. Click OK. The new plane is added to the current 3D view in the 3D Viewer. An example is shown below.
Using the Navigation tools and the 3D Tools in the 3D Viewer window you can orientate the view to the desired perspective. When you are satisfied with the orientation close the 3D Viewer.
To Set a Plane as the Default Drawing PlaneYou can draw groups including grids, images, contours, and symbols to a plane in a 3D view just like drawing to a 2D view. After creating a 3D view, it becomes your Default Drawing View so that the next group you plot will be drawn on the Default Drawing Plane which is the most recent plane in the view, unless you have set it otherwise.
You can also use the clipboard to cut/copy groups from other maps to the default drawing plane of a 3D view.
Before you begin, verify that you are in Map View Mode. This example walks you through setting a Colour-shaded image grid as the default drawing plane. You may follow the same basic procedure for different types of grids.
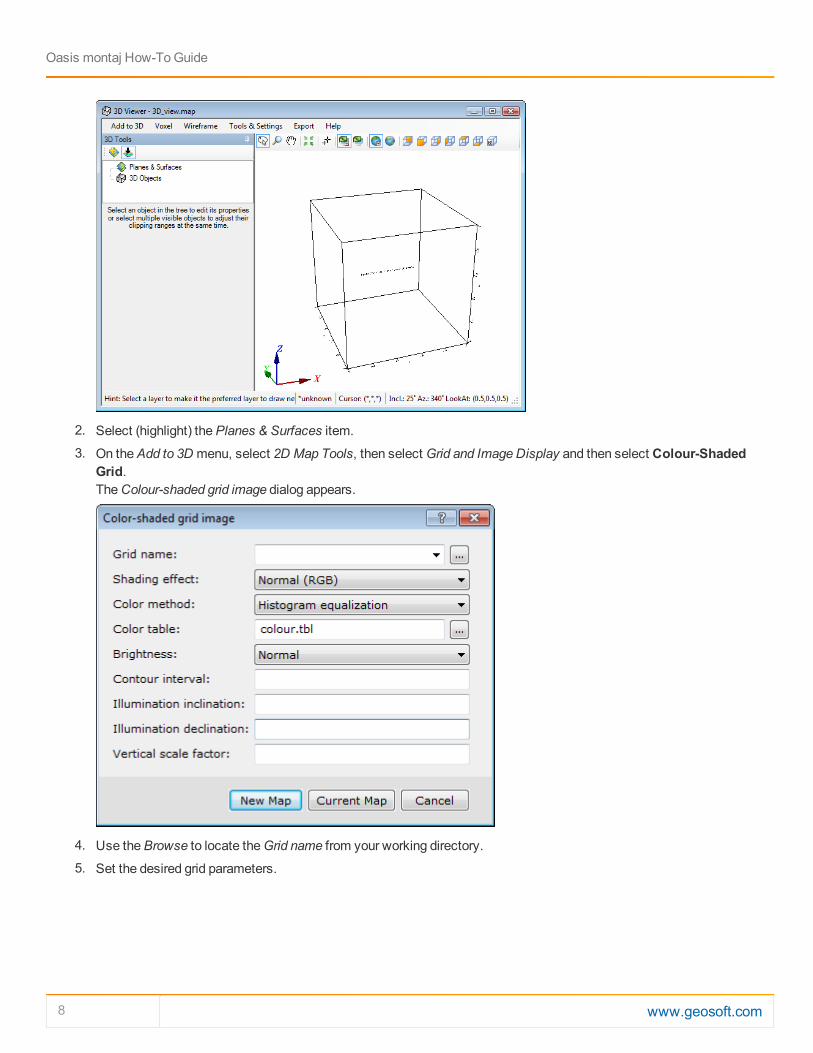
1. From an empty 3D view, right-click the 3D view and select 3D Viewer from the pop-up menu. The empty 3D view opens in the 3D Viewer.
www.geosoft.com 7
8 www.geosoft.com
2. Select (highlight) the Planes & Surfaces item.
3. On the Add to 3D menu, select 2D Map Tools, then select Grid and Image Display and then select Colour-Shaded Grid. The Colour-shaded grid image dialog appears.
4. Use the Browse to locate the Grid name from your working directory.
5. Set the desired grid parameters.
Oasis montaj How-To Guide
Oasis montaj How-To Guide
For more information on Color-shaded grid image settings, click the Help button.
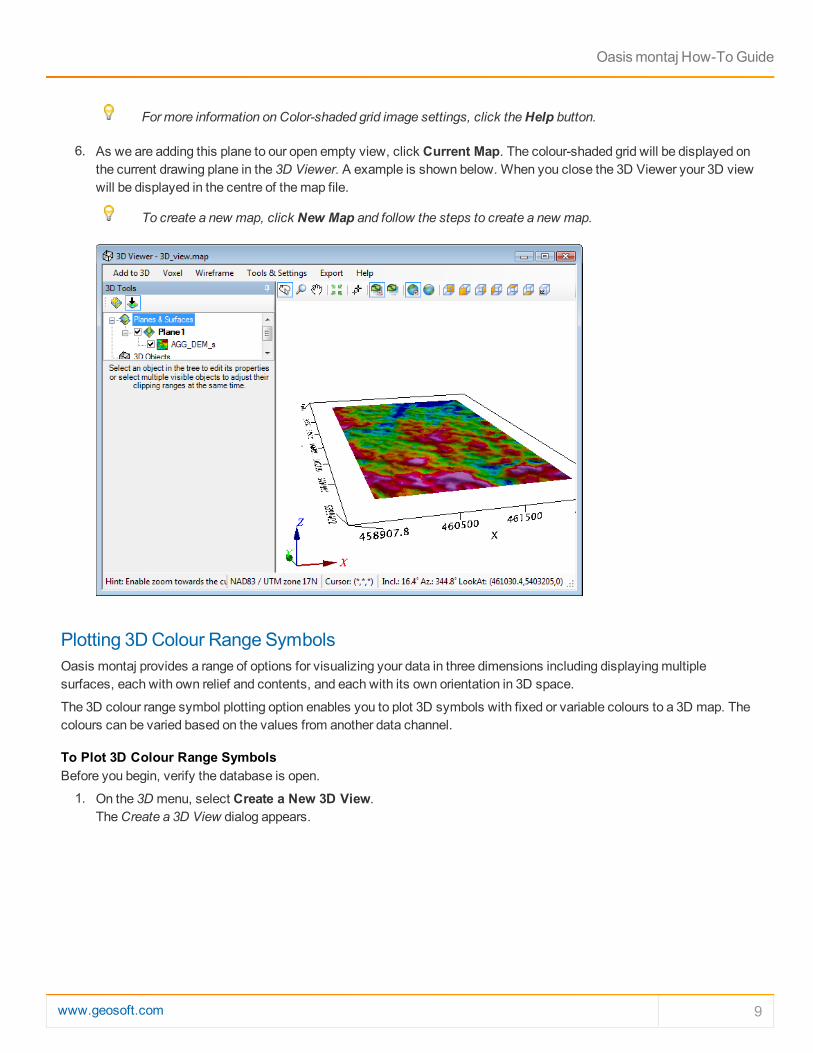
6. As we are adding this plane to our open empty view, click Current Map. The colour-shaded grid will be displayed on the current drawing plane in the 3D Viewer. A example is shown below. When you close the 3D Viewer your 3D view will be displayed in the centre of the map file.
To create a new map, click New Map and follow the steps to create a new map.
Plotting 3D Colour Range SymbolsOasis montaj provides a range of options for visualizing your data in three dimensions including displaying multiple surfaces, each with own relief and contents, and each with its own orientation in 3D space.
The 3D colour range symbol plotting option enables you to plot 3D symbols with fixed or variable colours to a 3D map. The colours can be varied based on the values from another data channel.
To Plot 3D Colour Range SymbolsBefore you begin, verify the database is open.
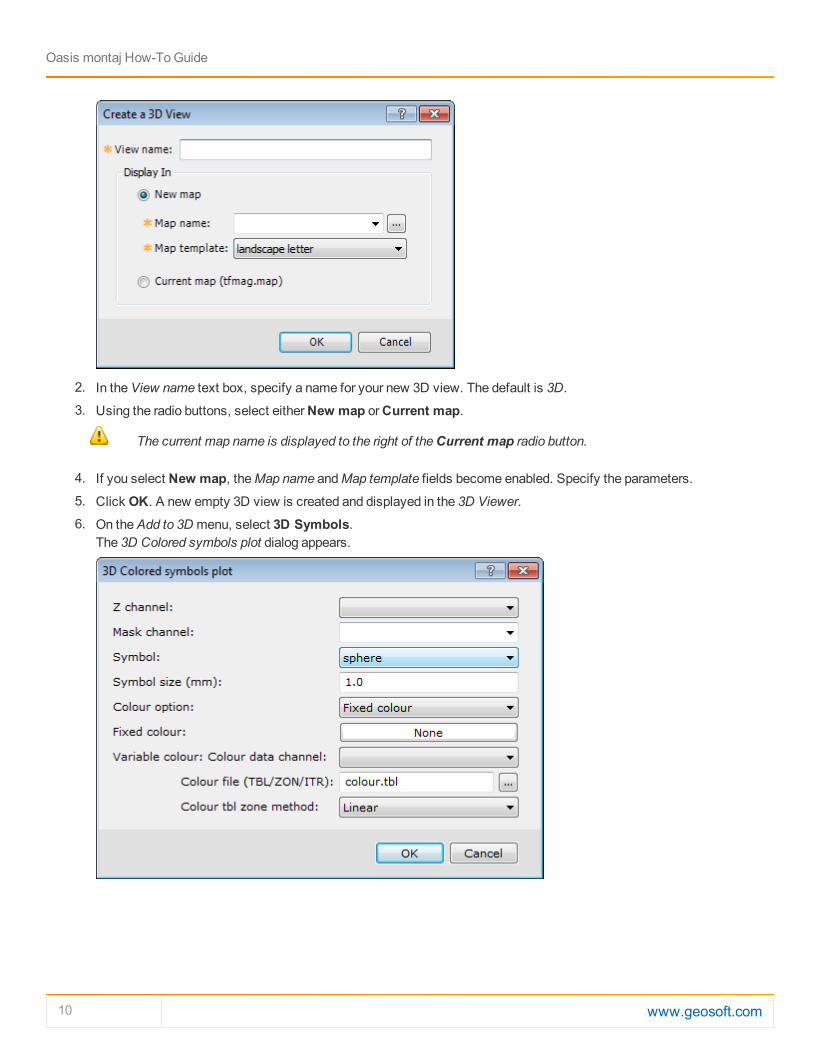
1. On the 3D menu, select Create a New 3D View. The Create a 3D View dialog appears.
www.geosoft.com 9
10 www.geosoft.com
2. In the View name text box, specify a name for your new 3D view. The default is 3D.
3. Using the radio buttons, select either New map or Current map.
The current map name is displayed to the right of the Current map radio button.
4. If you select New map, the Map name and Map template fields become enabled. Specify the parameters.
5. Click OK. A new empty 3D view is created and displayed in the 3D Viewer.
6. On the Add to 3D menu, select 3D Symbols. The 3D Colored symbols plot dialog appears.
Oasis montaj How-To Guide
Oasis montaj How-To Guide
7. Using the dropdown list, select the Z channel.
8. Select the Mask channel, if desired. If the use of the mask channel is enabled, and set to this channel, only those data values whose corresponding mask channel value is not a dummy will be plotted or exported.
9. Specify the Symbol and Symbol size (in mm).
10. The Colour option can be set to either Fixed or Variable
If you choose Fixed colour, set the colour to be the value specified under Fixed colour.
11. If you would like to colour your data using the values from a secondary channel, select the Variable colour option and then specify the Variable colour: Colour data channel.
12. To change the Colour table from the default colour.tbl file, specify the desired TBL, ZON or ITR file.
13. Select the Colour method : Histogram equalization, Normal distribution, Linear or Log-linear.
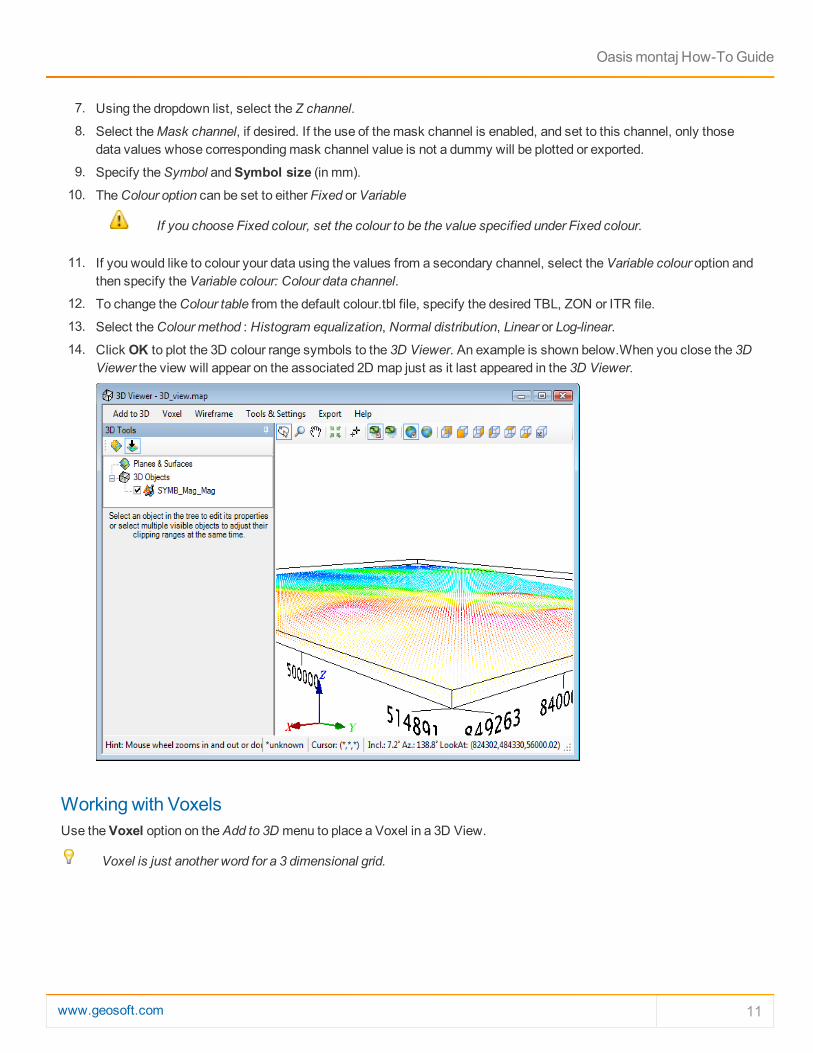
14. Click OK to plot the 3D colour range symbols to the 3D Viewer. An example is shown below.When you close the 3D Viewer the view will appear on the associated 2D map just as it last appeared in the 3D Viewer.
Working with VoxelsUse the Voxel option on the Add to 3D menu to place a Voxel in a 3D View.
Voxel is just another word for a 3 dimensional grid.
www.geosoft.com 11
12 www.geosoft.com
To Display a Voxel in a 3D ViewThis exercise assumes you have an available voxel to display. You can create a Voxel using the 3D Gridding option on the 3D menu.
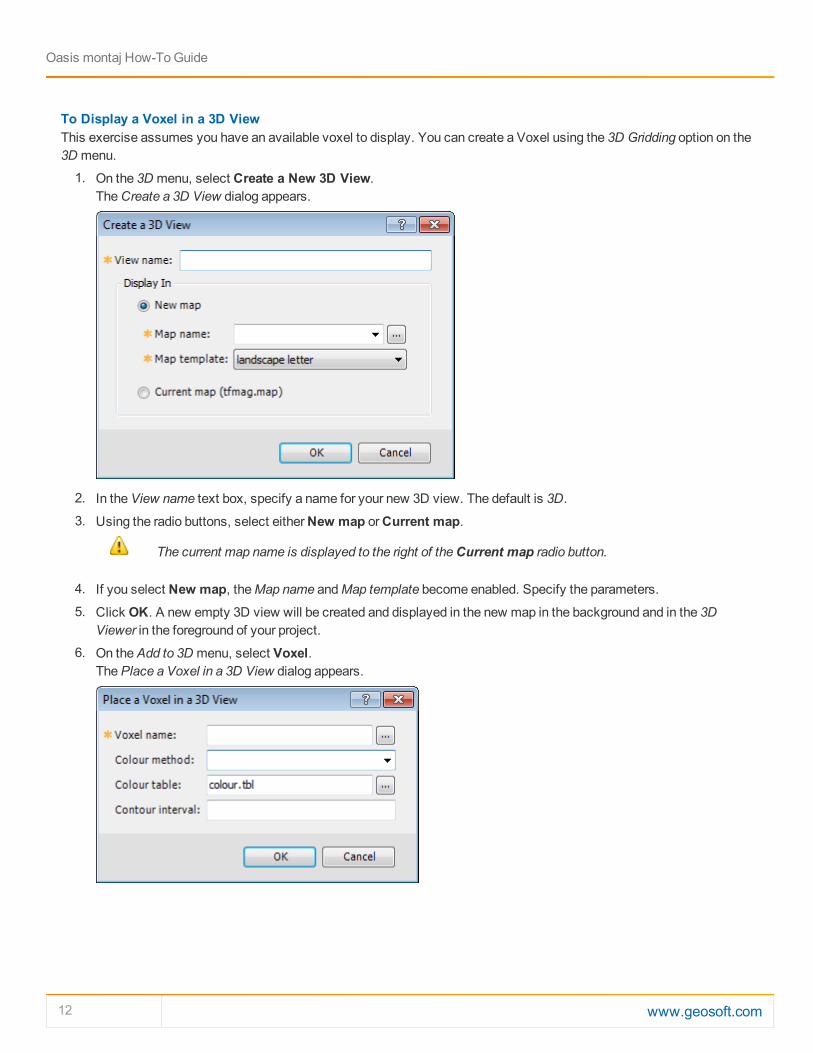
1. On the 3D menu, select Create a New 3D View. The Create a 3D View dialog appears.
2. In the View name text box, specify a name for your new 3D view. The default is 3D.
3. Using the radio buttons, select either New map or Current map.
The current map name is displayed to the right of the Current map radio button.
4. If you select New map, the Map name and Map template become enabled. Specify the parameters.
5. Click OK. A new empty 3D view will be created and displayed in the new map in the background and in the 3D Viewer in the foreground of your project.
6. On the Add to 3D menu, select Voxel. The Place a Voxel in a 3D View dialog appears.
Oasis montaj How-To Guide
Oasis montaj How-To Guide
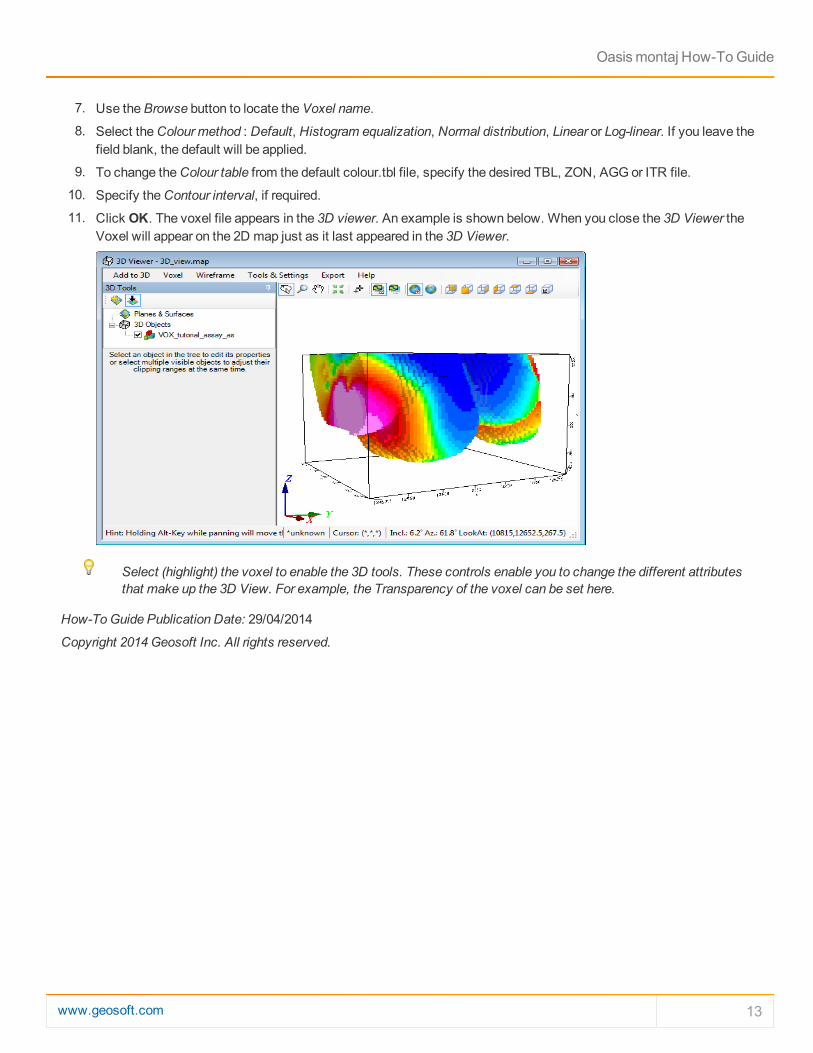
7. Use the Browse button to locate the Voxel name.
8. Select the Colour method : Default, Histogram equalization, Normal distribution, Linear or Log-linear. If you leave the field blank, the default will be applied.
9. To change the Colour table from the default colour.tbl file, specify the desired TBL, ZON, AGG or ITR file.
10. Specify the Contour interval, if required.
11. Click OK. The voxel file appears in the 3D viewer. An example is shown below. When you close the 3D Viewer the Voxel will appear on the 2D map just as it last appeared in the 3D Viewer.
Select (highlight) the voxel to enable the 3D tools. These controls enable you to change the different attributes that make up the 3D View. For example, the Transparency of the voxel can be set here.
How-To Guide Publication Date: 29/04/2014
Copyright 2014 Geosoft Inc. All rights reserved.
www.geosoft.com 13