Embed Size (px)
Citation preview
6/13/2013
1
Cancer DisparityCancer Disparity
Produced by the Alabama Department of Public Health
Video Communications and Distance Learning Division
Produced by the Alabama Department of Public Health
Video Communications and Distance Learning Division
Satellite Conference and Live Webcast
Monday, June 17, 20131:00 – 3:00 p.m. Central Time
Satellite Conference and Live Webcast
Monday, June 17, 20131:00 – 3:00 p.m. Central Time
FacultyFaculty
Windy Dean-Colomb, MD, PhD
Medical OncologistAssistant Professor
Interdisciplinary Clinical Oncology
University of South Alabama Mitchell Cancer Institute
Mobile, Alabama
Windy Dean-Colomb, MD, PhD
Medical OncologistAssistant Professor
Interdisciplinary Clinical Oncology
University of South Alabama Mitchell Cancer Institute
Mobile, Alabama
ObjectivesObjectives
• Discuss cancer disparity and some
of its root causes
• Discuss cancer disparities in breast,
cervical, prostate, and colorectal
cancer
• Discuss avenues to address
inequalities in cancer care across
the continuum
• Discuss cancer disparity and some
of its root causes
• Discuss cancer disparities in breast,
cervical, prostate, and colorectal
cancer
• Discuss avenues to address
inequalities in cancer care across
the continuum
IntroductionIntroduction
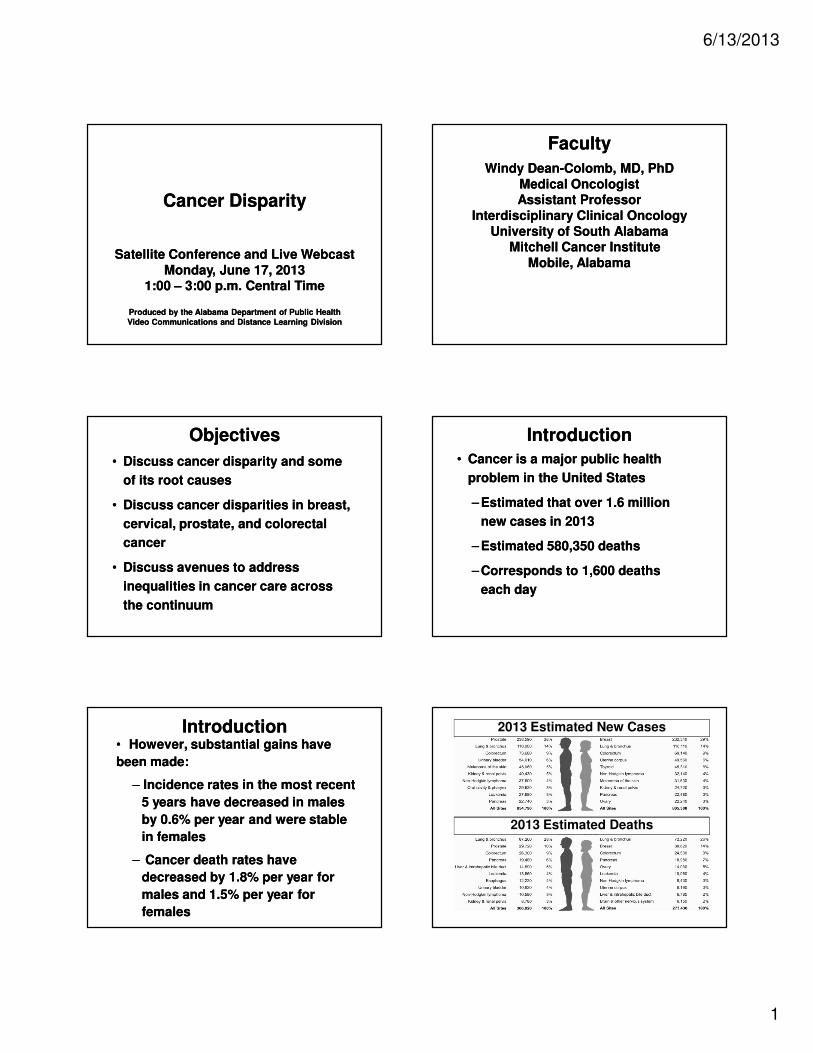
• Cancer is a major public health
problem in the United States
– Estimated that over 1.6 million
new cases in 2013
– Estimated 580,350 deaths
– Corresponds to 1,600 deaths
each day
• Cancer is a major public health
problem in the United States
– Estimated that over 1.6 million
new cases in 2013
– Estimated 580,350 deaths
– Corresponds to 1,600 deaths
each day
IntroductionIntroduction• However, substantial gains have
been made:
– Incidence rates in the most recent
5 years have decreased in males
by 0.6% per year and were stable
in females
– Cancer death rates have
decreased by 1.8% per year for
males and 1.5% per year for
females
• However, substantial gains have
been made:
– Incidence rates in the most recent
5 years have decreased in males
by 0.6% per year and were stable
in females
– Cancer death rates have
decreased by 1.8% per year for
males and 1.5% per year for
females
2013 Estimated New Cases
2013 Estimated Deaths
6/13/2013
2
Trends in Incidence Rates for Selected Cancers by Sex from 1975 to 2009
Trends in Incidence Rates for Selected Cancers by Sex from 1975 to 2009
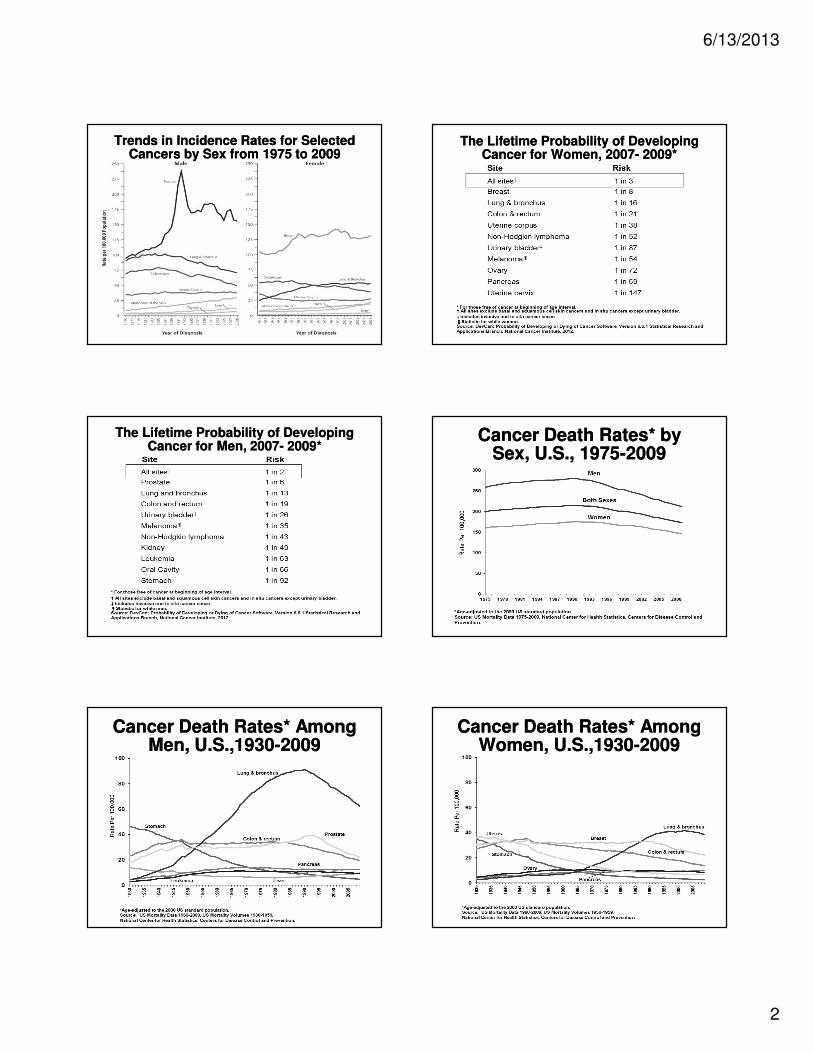
The Lifetime Probability of Developing Cancer for Women, 2007- 2009*
The Lifetime Probability of Developing Cancer for Women, 2007- 2009*
The Lifetime Probability of Developing Cancer for Men, 2007- 2009*
The Lifetime Probability of Developing Cancer for Men, 2007- 2009*
Cancer Death Rates* by Sex, U.S., 1975-2009
Cancer Death Rates* by Sex, U.S., 1975-2009
Cancer Death Rates* Among Men, U.S.,1930-2009
Cancer Death Rates* Among Men, U.S.,1930-2009
Cancer Death Rates* Among Women, U.S.,1930-2009
Cancer Death Rates* Among Women, U.S.,1930-2009
6/13/2013
3
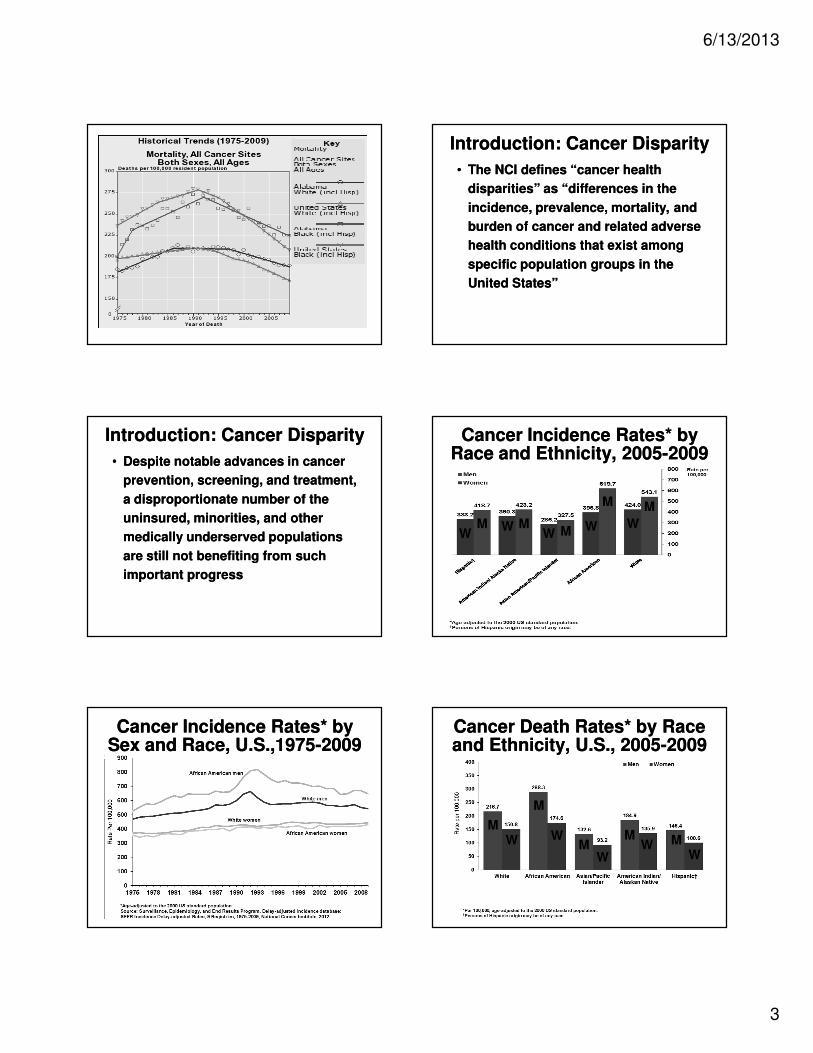
Introduction: Cancer DisparityIntroduction: Cancer Disparity
• The NCI defines “cancer health
disparities” as “differences in the
incidence, prevalence, mortality, and
burden of cancer and related adverse
health conditions that exist among
specific population groups in the
United States”
• The NCI defines “cancer health
disparities” as “differences in the
incidence, prevalence, mortality, and
burden of cancer and related adverse
health conditions that exist among
specific population groups in the
United States”
Introduction: Cancer DisparityIntroduction: Cancer Disparity
• Despite notable advances in cancer
prevention, screening, and treatment,
a disproportionate number of the
uninsured, minorities, and other
medically underserved populations
are still not benefiting from such
important progress
• Despite notable advances in cancer
prevention, screening, and treatment,
a disproportionate number of the
uninsured, minorities, and other
medically underserved populations
are still not benefiting from such
important progress
Cancer Incidence Rates* by Race and Ethnicity, 2005-2009
Cancer Incidence Rates* by Race and Ethnicity, 2005-2009
MW
MM
M M
WW
W W
Cancer Incidence Rates* by Sex and Race, U.S.,1975-2009Cancer Incidence Rates* by
Sex and Race, U.S.,1975-2009Cancer Death Rates* by Race and Ethnicity, U.S., 2005-2009Cancer Death Rates* by Race and Ethnicity, U.S., 2005-2009
M
M
MM M
WW
W
WW
6/13/2013
4
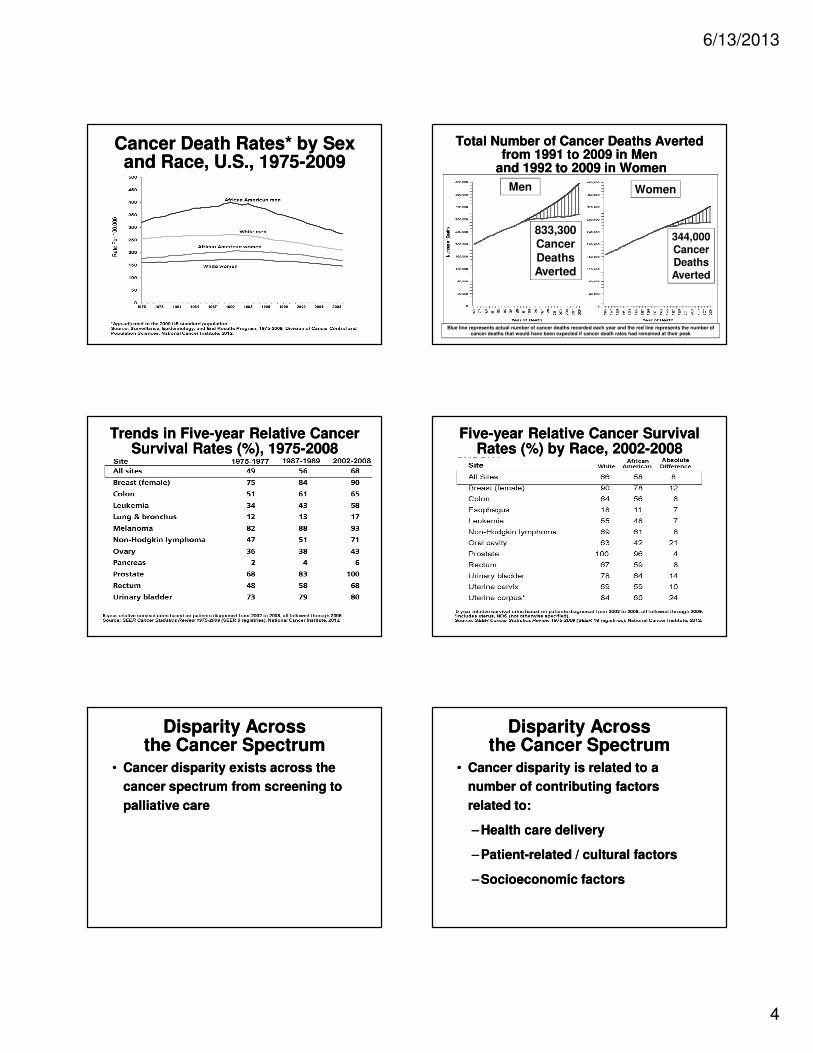
Cancer Death Rates* by Sex and Race, U.S., 1975-2009
Cancer Death Rates* by Sex and Race, U.S., 1975-2009
Total Number of Cancer Deaths Averted from 1991 to 2009 in Men
and 1992 to 2009 in Women
Total Number of Cancer Deaths Averted from 1991 to 2009 in Men
and 1992 to 2009 in Women
Blue line represents actual number of cancer deaths recorded each year and the red line represents the number of cancer deaths that would have been expected if cancer death rates had remained at their peak
Men Women
833,300 Cancer
Deaths Averted
344,000 Cancer Deaths Averted
Trends in Five-year Relative Cancer Survival Rates (%), 1975-2008
Trends in Five-year Relative Cancer Survival Rates (%), 1975-2008
Five-year Relative Cancer Survival Rates (%) by Race, 2002-2008
Five-year Relative Cancer Survival Rates (%) by Race, 2002-2008
Disparity Across the Cancer Spectrum
Disparity Across the Cancer Spectrum
• Cancer disparity exists across the
cancer spectrum from screening to
palliative care
• Cancer disparity exists across the
cancer spectrum from screening to
palliative care
Disparity Across the Cancer Spectrum
Disparity Across the Cancer Spectrum
• Cancer disparity is related to a
number of contributing factors
related to:
– Health care delivery
– Patient-related / cultural factors
– Socioeconomic factors
• Cancer disparity is related to a
number of contributing factors
related to:
– Health care delivery
– Patient-related / cultural factors
– Socioeconomic factors
6/13/2013
5
Disparity Across the Cancer Spectrum
Disparity Across the Cancer Spectrum
• To truly address cancer disparity it
will take a multi-faceted, community-
wide approach
• To truly address cancer disparity it
will take a multi-faceted, community-
wide approach
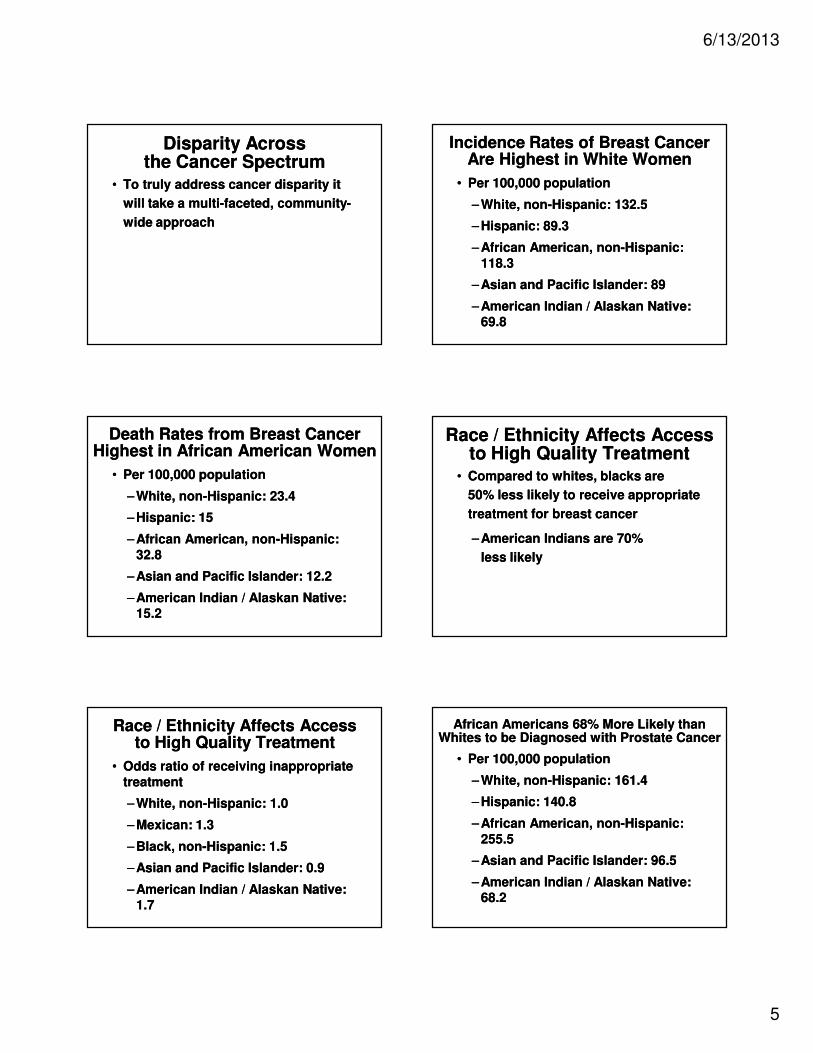
Incidence Rates of Breast Cancer Are Highest in White Women
Incidence Rates of Breast Cancer Are Highest in White Women
• Per 100,000 population
– White, non-Hispanic: 132.5
– Hispanic: 89.3
– African American, non-Hispanic:
118.3
– Asian and Pacific Islander: 89
– American Indian / Alaskan Native: 69.8
• Per 100,000 population
– White, non-Hispanic: 132.5
– Hispanic: 89.3
– African American, non-Hispanic:
118.3
– Asian and Pacific Islander: 89
– American Indian / Alaskan Native: 69.8
Death Rates from Breast Cancer Highest in African American Women
Death Rates from Breast Cancer Highest in African American Women
• Per 100,000 population
– White, non-Hispanic: 23.4
– Hispanic: 15
– African American, non-Hispanic:
32.8
– Asian and Pacific Islander: 12.2
– American Indian / Alaskan Native: 15.2
• Per 100,000 population
– White, non-Hispanic: 23.4
– Hispanic: 15
– African American, non-Hispanic:
32.8
– Asian and Pacific Islander: 12.2
– American Indian / Alaskan Native: 15.2
Race / Ethnicity Affects Access to High Quality Treatment
Race / Ethnicity Affects Access to High Quality Treatment
• Compared to whites, blacks are
50% less likely to receive appropriate
treatment for breast cancer
– American Indians are 70%
less likely
• Compared to whites, blacks are
50% less likely to receive appropriate
treatment for breast cancer
– American Indians are 70%
less likely
Race / Ethnicity Affects Access to High Quality Treatment
Race / Ethnicity Affects Access to High Quality Treatment
• Odds ratio of receiving inappropriate
treatment
– White, non-Hispanic: 1.0
– Mexican: 1.3
– Black, non-Hispanic: 1.5
– Asian and Pacific Islander: 0.9
– American Indian / Alaskan Native: 1.7
• Odds ratio of receiving inappropriate
treatment
– White, non-Hispanic: 1.0
– Mexican: 1.3
– Black, non-Hispanic: 1.5
– Asian and Pacific Islander: 0.9
– American Indian / Alaskan Native: 1.7
African Americans 68% More Likely than Whites to be Diagnosed with Prostate Cancer
African Americans 68% More Likely than Whites to be Diagnosed with Prostate Cancer
• Per 100,000 population
– White, non-Hispanic: 161.4
– Hispanic: 140.8
– African American, non-Hispanic:
255.5
– Asian and Pacific Islander: 96.5
– American Indian / Alaskan Native: 68.2
• Per 100,000 population
– White, non-Hispanic: 161.4
– Hispanic: 140.8
– African American, non-Hispanic:
255.5
– Asian and Pacific Islander: 96.5
– American Indian / Alaskan Native: 68.2

6/13/2013
6
African Americans 2.5 Times as Likely than Whites to Die of Prostate Cancer
African Americans 2.5 Times as Likely than Whites to Die of Prostate Cancer
• Per 100,000 population
– White, non-Hispanic: 22.6
– Hispanic: 18.5
– African American, non-Hispanic:
53.3
– Asian and Pacific Islander: 10.4
– American Indian / Alaskan Native: 17.6
• Per 100,000 population
– White, non-Hispanic: 22.6
– Hispanic: 18.5
– African American, non-Hispanic:
53.3
– Asian and Pacific Islander: 10.4
– American Indian / Alaskan Native: 17.6
Having Insurance Makes a DifferenceHaving Insurance
Makes a Difference• Uninsured persons are less likely
than privately insured persons to
receive timely cancer screenings
• Uninsured persons are less likely
than privately insured persons to
receive timely cancer screenings
68%
38%40%
83%
56%48%
88%
75%
19%
Uninsured Medicaid Private
Received recommended colorectal cancer screening in past 10 years, 2005
Pap Test in Past Three Years, 2005
Adults50-64
Mammogram in Past Two Years, 2005
Women40-64
Women 18-64
SOURCES: Ward, Elizabeth, et al. "Association of Insurance with Cancer Care Utilization and Outcomes." CA: A Cancer Journal for Clinicians 58.1 (2008): 9-31.
19%
68%
38%
U
U
U
M
M
MP
P
P
Having Health Insurance Matters
Having Health Insurance Matters
• Uninsured, publicly insured women
are three times more likely to be
diagnosed with a later stage of
breast cancer than privately insured
women
• Uninsured, publicly insured women
are three times more likely to be
diagnosed with a later stage of
breast cancer than privately insured
women
Having Health Insurance Matters
Having Health Insurance Matters
• Likelihood of being diagnosed with
Stage III / IV Breast Cancer vs. Stage
I Breast Cancer
– Private Insurance: 1.0
– Uninsured: 2.9
– Medicaid: 2.7
– Medicare, 65+: 1.2
• Likelihood of being diagnosed with
Stage III / IV Breast Cancer vs. Stage
I Breast Cancer
– Private Insurance: 1.0
– Uninsured: 2.9
– Medicaid: 2.7
– Medicare, 65+: 1.2
Adjusted Colorectal Cancer Survival by Stages and Insurance Status Among
Patients Diagnosed in 1999 - 2000
Adjusted Colorectal Cancer Survival by Stages and Insurance Status Among
Patients Diagnosed in 1999 - 2000
6/13/2013
7
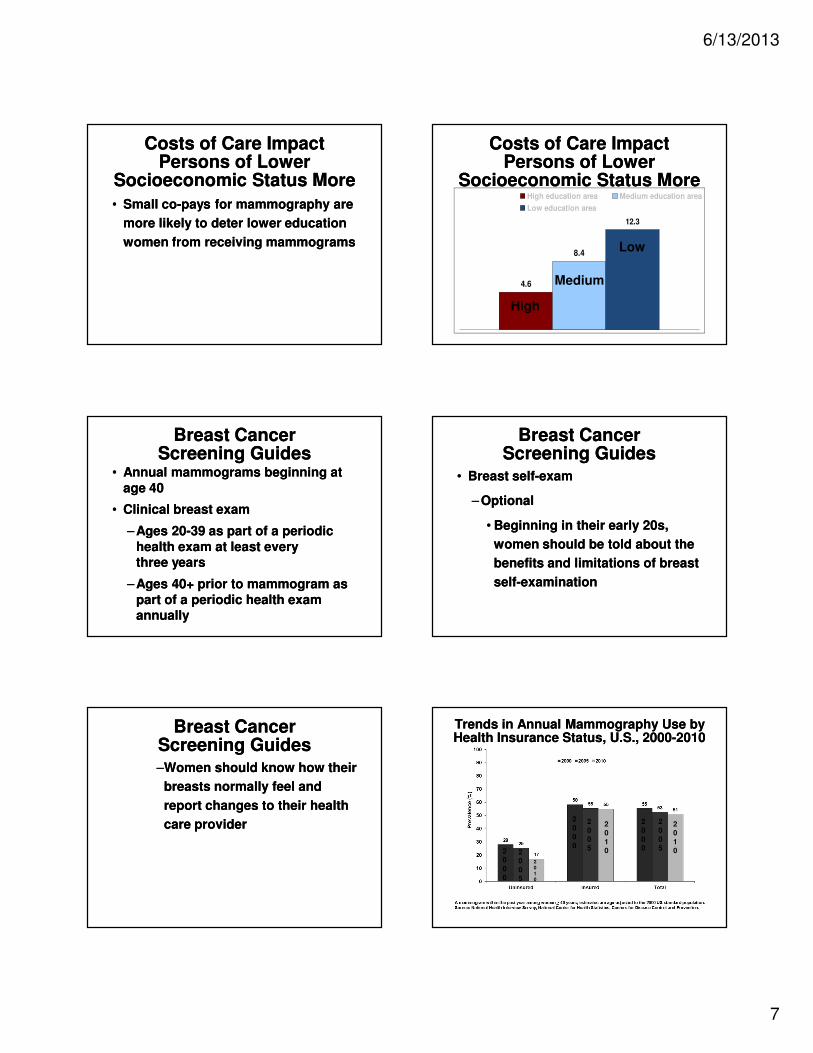
Costs of Care Impact Persons of Lower
Socioeconomic Status More
Costs of Care Impact Persons of Lower
Socioeconomic Status More
• Small co-pays for mammography are
more likely to deter lower education
women from receiving mammograms
• Small co-pays for mammography are
more likely to deter lower education
women from receiving mammograms
Costs of Care Impact Persons of Lower
Socioeconomic Status More
Costs of Care Impact Persons of Lower
Socioeconomic Status More
8.4
12.3
4.6
High education area Medium education area
Low education area
Medium
Low
High
Breast Cancer Screening Guides
Breast Cancer Screening Guides
• Annual mammograms beginning at
age 40
• Clinical breast exam
– Ages 20-39 as part of a periodic
health exam at least every three years
– Ages 40+ prior to mammogram as
part of a periodic health exam annually
• Annual mammograms beginning at
age 40
• Clinical breast exam
– Ages 20-39 as part of a periodic
health exam at least every three years
– Ages 40+ prior to mammogram as
part of a periodic health exam annually
Breast Cancer Screening Guides
Breast Cancer Screening Guides
• Breast self-exam
– Optional
• Beginning in their early 20s,
women should be told about the
benefits and limitations of breast
self-examination
• Breast self-exam
– Optional
• Beginning in their early 20s,
women should be told about the
benefits and limitations of breast
self-examination
Breast Cancer Screening Guides
Breast Cancer Screening Guides–Women should know how their
breasts normally feel and
report changes to their health
care provider
–Women should know how their
breasts normally feel and
report changes to their health
care provider
Trends in Annual Mammography Use by Health Insurance Status, U.S., 2000-2010Trends in Annual Mammography Use by Health Insurance Status, U.S., 2000-2010
20
00
20
00
20
00
20
05
20
05
20
05
2010
20
10
20
10
6/13/2013
8
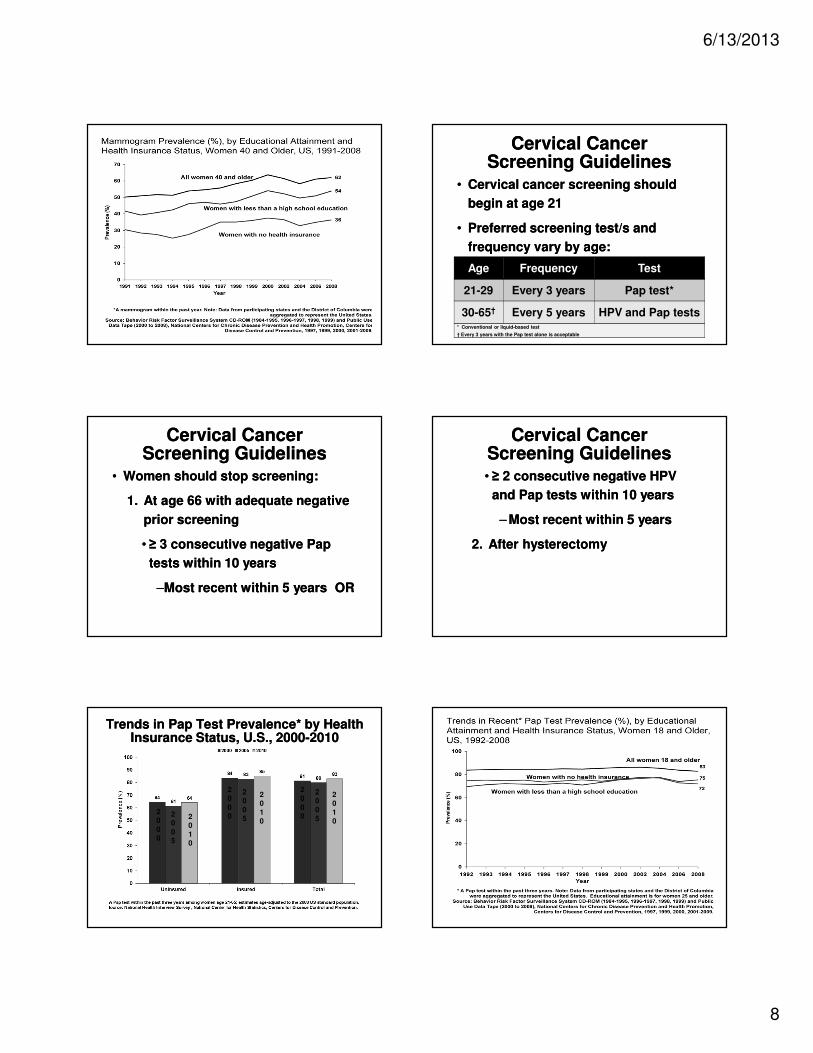
Cervical Cancer Screening Guidelines
Cervical Cancer Screening Guidelines
• Cervical cancer screening should
begin at age 21
• Preferred screening test/s and
frequency vary by age:
• Cervical cancer screening should
begin at age 21
• Preferred screening test/s and
frequency vary by age:
Age Frequency Test
21-29 Every 3 years Pap test*
30-65† Every 5 years HPV and Pap tests* Conventional or liquid-based test
† Every 3 years with the Pap test alone is acceptable
Cervical Cancer Screening Guidelines
Cervical Cancer Screening Guidelines
• Women should stop screening:
1. At age 66 with adequate negative
prior screening
• ≥ 3 consecutive negative Pap
tests within 10 years
–Most recent within 5 years OR
• Women should stop screening:
1. At age 66 with adequate negative
prior screening
• ≥ 3 consecutive negative Pap
tests within 10 years
–Most recent within 5 years OR
Cervical Cancer Screening Guidelines
Cervical Cancer Screening Guidelines• ≥ 2 consecutive negative HPV
and Pap tests within 10 years
– Most recent within 5 years
2. After hysterectomy
• ≥ 2 consecutive negative HPV
and Pap tests within 10 years
– Most recent within 5 years
2. After hysterectomy
Trends in Pap Test Prevalence* by Health Insurance Status, U.S., 2000-2010
Trends in Pap Test Prevalence* by Health Insurance Status, U.S., 2000-2010
20
00
20
05
20
10
20
00
20
05
20
10
20
00
20
05
20
10
6/13/2013
9
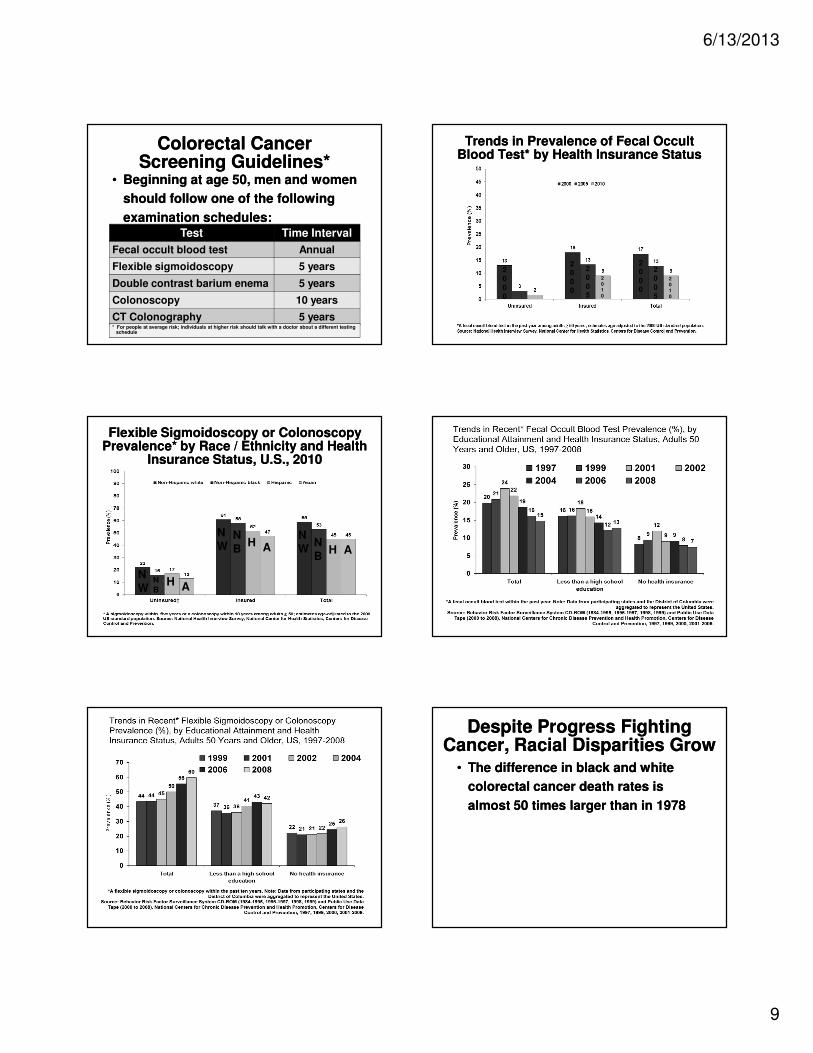
Colorectal Cancer Screening Guidelines*
Colorectal Cancer Screening Guidelines*
• Beginning at age 50, men and women
should follow one of the following
examination schedules:
• Beginning at age 50, men and women
should follow one of the following
examination schedules:Test Time Interval
Fecal occult blood test Annual
Flexible sigmoidoscopy 5 years
Double contrast barium enema 5 years
Colonoscopy 10 years
CT Colonography 5 years* For people at average risk; individuals at higher risk should talk with a doctor about a different testing
schedule
Trends in Prevalence of Fecal Occult Blood Test* by Health Insurance Status
Trends in Prevalence of Fecal Occult Blood Test* by Health Insurance Status
20
00
20
05
2010
20
00
20
00
20
05
2010
Flexible Sigmoidoscopy or Colonoscopy Prevalence* by Race / Ethnicity and Health
Insurance Status, U.S., 2010
Flexible Sigmoidoscopy or Colonoscopy Prevalence* by Race / Ethnicity and Health
Insurance Status, U.S., 2010
NW
NW
NW
NB
NB
N
BH
HH AA
A
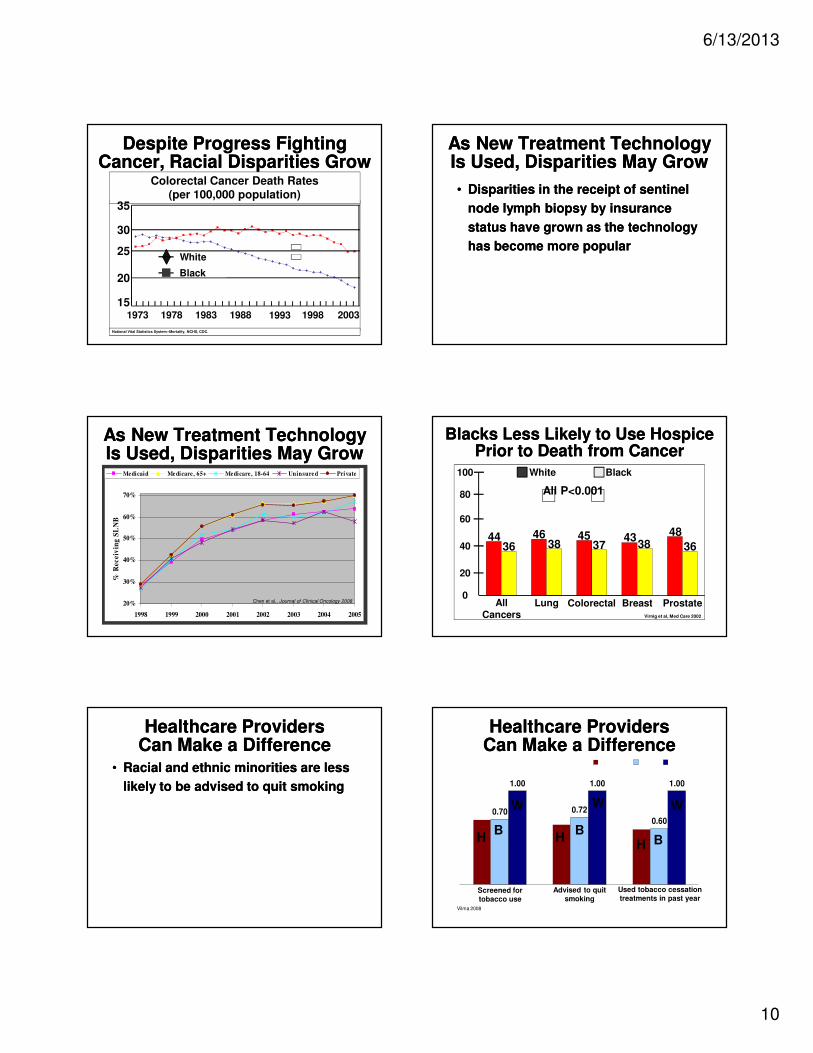
Despite Progress Fighting Cancer, Racial Disparities Grow
Despite Progress Fighting Cancer, Racial Disparities Grow
• The difference in black and white
colorectal cancer death rates is
almost 50 times larger than in 1978
• The difference in black and white
colorectal cancer death rates is
almost 50 times larger than in 1978
6/13/2013
10
Despite Progress Fighting Cancer, Racial Disparities Grow
Despite Progress Fighting Cancer, Racial Disparities Grow
15
20
25
30
35
1973 1978 1983 1988 1993 1998 2003
White
Black
Colorectal Cancer Death Rates(per 100,000 population)
National Vital Statistics System--Mortality, NCHS, CDC.
35
30
25
20
151973 1978 1983 2003199819931988
White
Black
As New Treatment Technology Is Used, Disparities May GrowAs New Treatment Technology Is Used, Disparities May Grow
• Disparities in the receipt of sentinel
node lymph biopsy by insurance
status have grown as the technology
has become more popular
• Disparities in the receipt of sentinel
node lymph biopsy by insurance
status have grown as the technology
has become more popular
As New Treatment Technology Is Used, Disparities May GrowAs New Treatment Technology Is Used, Disparities May Grow
20%
30%
40%
50%
60%
70%
1998 1999 2000 2001 2002 2003 2004 2005
% R
ec
eiv
ing
SL
NB
Medicaid Medicare, 65+ Medicare, 18-64 Uninsured Private
Chen et al., Journal of Clinical Oncology 2008
Blacks Less Likely to Use Hospice Prior to Death from Cancer
Blacks Less Likely to Use Hospice Prior to Death from Cancer
44 46 45 4348
36 38 37 38 36
0
20
40
60
80
100
All cancers Lung Colorectal Breast Prostate
White Black
Virnig et al, Med Care 2002
100
80
60
40
20
0
4436
46 45 4348
38 37 38 36
White Black
All P<0.001
All Cancers
Lung Colorectal Breast Prostate
Healthcare Providers Can Make a DifferenceHealthcare Providers
Can Make a Difference• Racial and ethnic minorities are less
likely to be advised to quit smoking
• Racial and ethnic minorities are less
likely to be advised to quit smoking
Healthcare Providers Can Make a DifferenceHealthcare Providers
Can Make a Difference
0.640.59
0.70 0.72
0.60
1.00 1.00 1.00
0.69
Hispanic Black White
Screened for tobacco use
Advised to quit smoking
Used tobacco cessation treatments in past year
Vilma 2008
H HH B
BB
W W W
6/13/2013
11
8090
100110120130140150160170180190200210220
75 78 81 84 87 90 93 96 99 '02 '05 '08 '11 '14
2015 Goal – 50% Reduction from Baseline2015 Goal – 50% Reduction from Baseline
1991 Baseline215.1
2015 Goal 107.6
Incidence and mortality rates per 100,000 and age-adjusted to 2000 US standard populationSEER Cancer Statistics Review 1975-2007.
2007
178.2
(���� 17.2% from
baseline)
(Current trend to 2015 - ���� 30.0% from baseline)(The latest joinpoint trend (2001-2007) shows a
-1.6 APC in age-adjusted rates)
2015 Projected
Rate –150.6
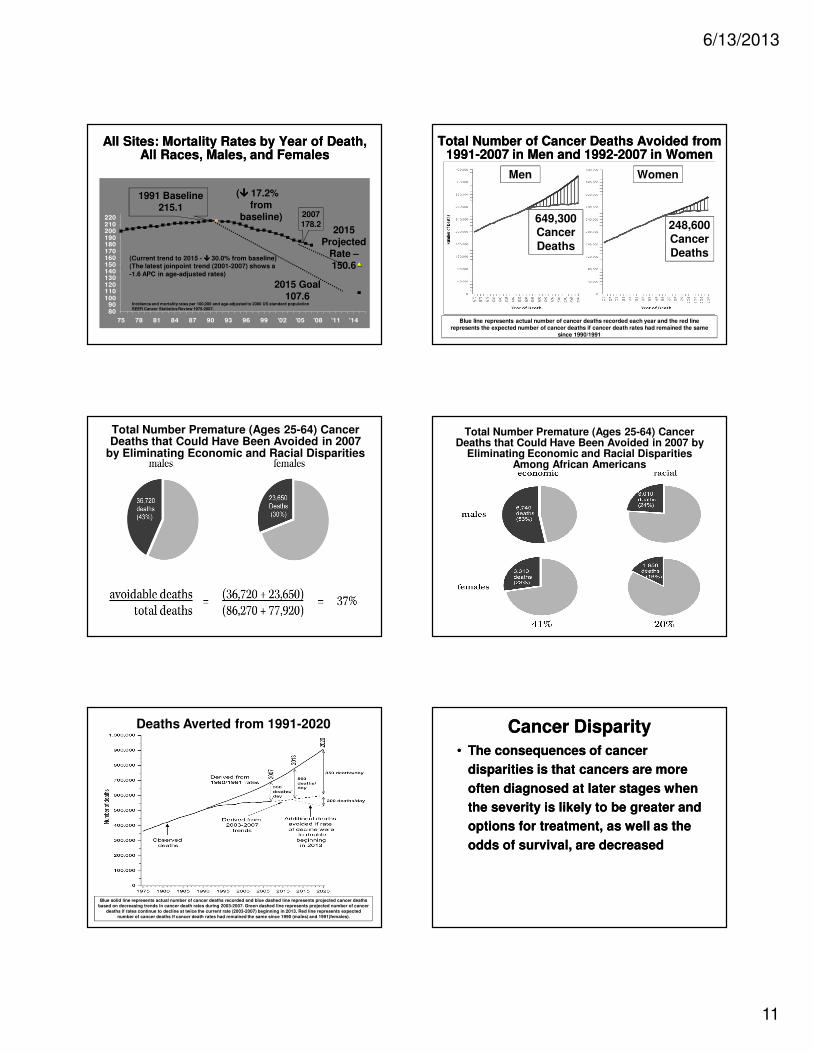
All Sites: Mortality Rates by Year of Death, All Races, Males, and Females
All Sites: Mortality Rates by Year of Death, All Races, Males, and Females
Total Number of Cancer Deaths Avoided from 1991-2007 in Men and 1992-2007 in Women
Total Number of Cancer Deaths Avoided from 1991-2007 in Men and 1992-2007 in Women
Blue line represents actual number of cancer deaths recorded each year and the red line represents the expected number of cancer deaths if cancer death rates had remained the same
since 1990/1991
Men Women
649,300 Cancer
Deaths
248,600 Cancer
Deaths
Total Number Premature (Ages 25-64) Cancer Deaths that Could Have Been Avoided in 2007
by Eliminating Economic and Racial Disparities
Total Number Premature (Ages 25-64) Cancer Deaths that Could Have Been Avoided in 2007 by
Eliminating Economic and Racial Disparities Among African Americans
Deaths Averted from 1991-2020
Blue solid line represents actual number of cancer deaths recorded and blue dashed line represents projected cancer deaths
based on decreasing trends in cancer death rates during 2003-2007. Green dashed line represents projected number of cancer
deaths if rates continue to decline at twice the current rate (2003-2007) beginning in 2013. Red line represents expected
number of cancer deaths if cancer death rates had remained the same since 1990 (males) and 1991(females).
Cancer DisparityCancer Disparity
• The consequences of cancer
disparities is that cancers are more
often diagnosed at later stages when
the severity is likely to be greater and
options for treatment, as well as the
odds of survival, are decreased
• The consequences of cancer
disparities is that cancers are more
often diagnosed at later stages when
the severity is likely to be greater and
options for treatment, as well as the
odds of survival, are decreased
6/13/2013
12
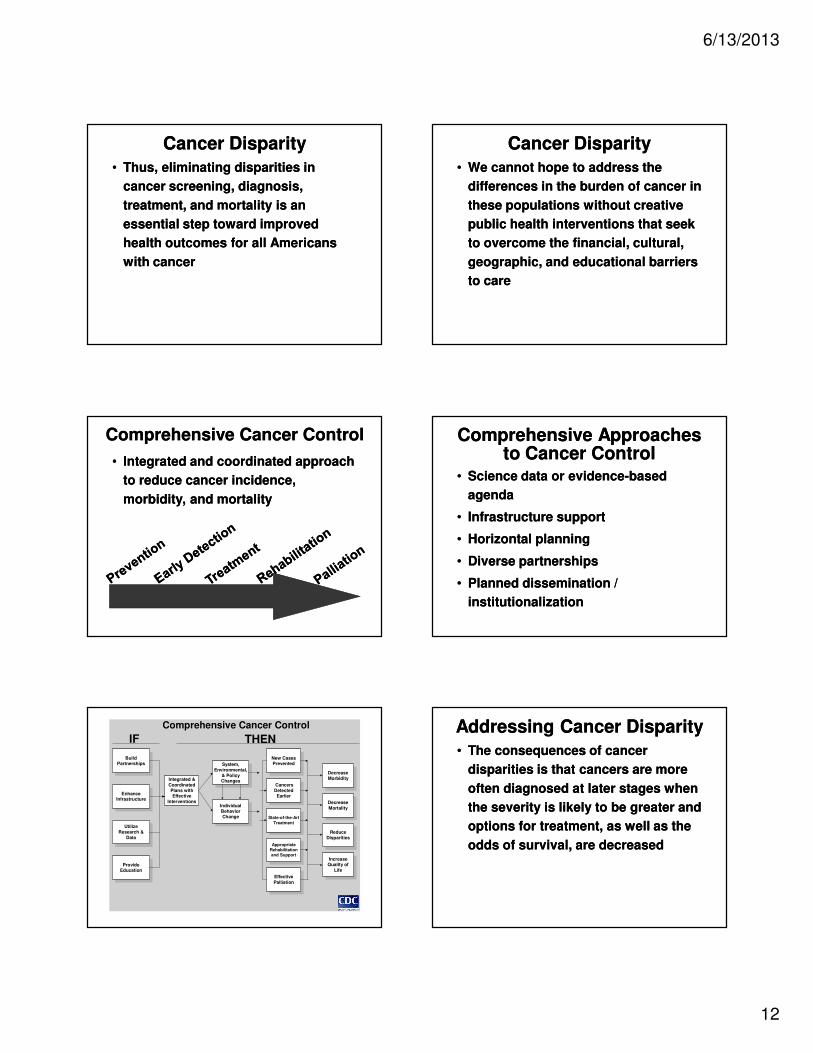
Cancer DisparityCancer Disparity
• Thus, eliminating disparities in
cancer screening, diagnosis,
treatment, and mortality is an
essential step toward improved
health outcomes for all Americans
with cancer
• Thus, eliminating disparities in
cancer screening, diagnosis,
treatment, and mortality is an
essential step toward improved
health outcomes for all Americans
with cancer
Cancer DisparityCancer Disparity
• We cannot hope to address the
differences in the burden of cancer in
these populations without creative
public health interventions that seek
to overcome the financial, cultural,
geographic, and educational barriers
to care
• We cannot hope to address the
differences in the burden of cancer in
these populations without creative
public health interventions that seek
to overcome the financial, cultural,
geographic, and educational barriers
to care
Comprehensive Cancer ControlComprehensive Cancer Control
• Integrated and coordinated approach
to reduce cancer incidence,
morbidity, and mortality
• Integrated and coordinated approach
to reduce cancer incidence,
morbidity, and mortality
Comprehensive Approaches to Cancer Control
Comprehensive Approaches to Cancer Control
• Science data or evidence-based
agenda
• Infrastructure support
• Horizontal planning
• Diverse partnerships
• Planned dissemination /
institutionalization
• Science data or evidence-based
agenda
• Infrastructure support
• Horizontal planning
• Diverse partnerships
• Planned dissemination /
institutionalization
Comprehensive Cancer Control
IF THEN
ProvideEducation
BuildPartnerships
EnhanceInfrastructure
Utilize
Research &
Data
Integrated &
Coordinated
Plans withEffective
InterventionsIndividual
BehaviorChange
System,
Environmental,
& PolicyChanges
AppropriateRehabilitationand Support
Effective
Palliation
New CasesPrevented
Cancers
DetectedEarlier
State-of-the-Art
Treatment
Decrease
Morbidity
Decrease
Mortality
Reduce
Disparities
IncreaseQuality of
Life
IF THENAddressing Cancer DisparityAddressing Cancer Disparity
• The consequences of cancer
disparities is that cancers are more
often diagnosed at later stages when
the severity is likely to be greater and
options for treatment, as well as the
odds of survival, are decreased
• The consequences of cancer
disparities is that cancers are more
often diagnosed at later stages when
the severity is likely to be greater and
options for treatment, as well as the
odds of survival, are decreased
6/13/2013
13
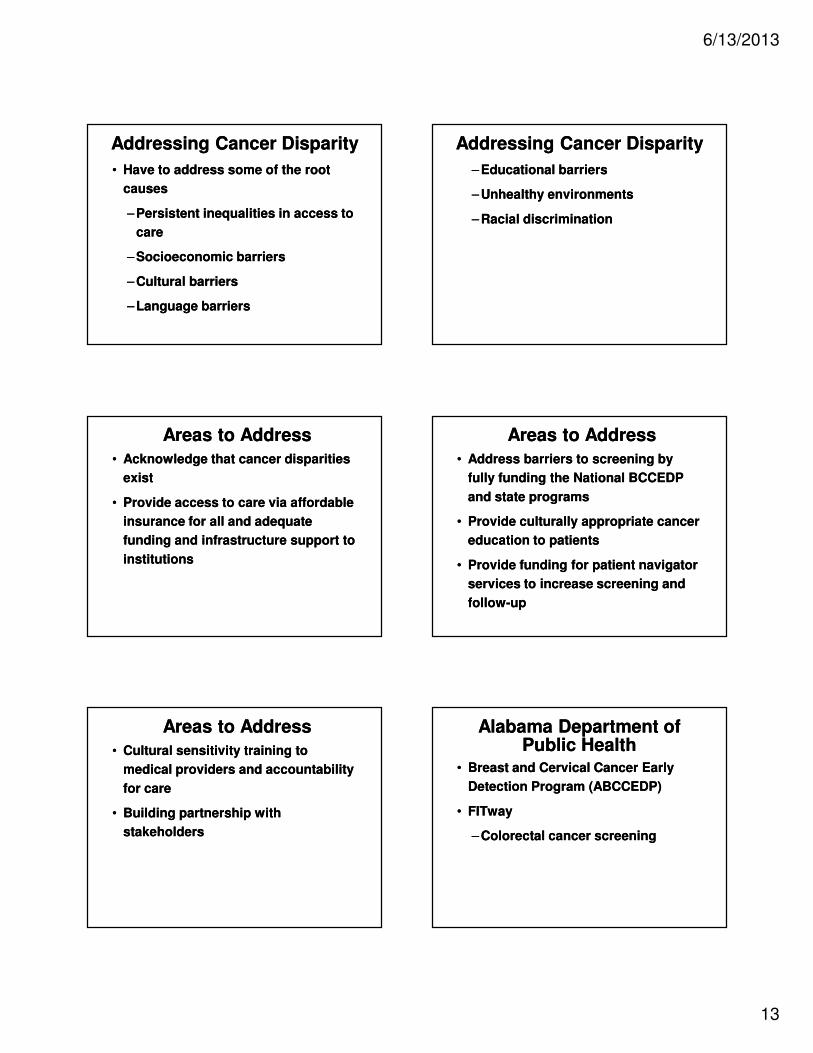
Addressing Cancer DisparityAddressing Cancer Disparity
• Have to address some of the root
causes
– Persistent inequalities in access to
care
– Socioeconomic barriers
– Cultural barriers
– Language barriers
• Have to address some of the root
causes
– Persistent inequalities in access to
care
– Socioeconomic barriers
– Cultural barriers
– Language barriers
Addressing Cancer DisparityAddressing Cancer Disparity
– Educational barriers
– Unhealthy environments
– Racial discrimination
– Educational barriers
– Unhealthy environments
– Racial discrimination
Areas to AddressAreas to Address
• Acknowledge that cancer disparities
exist
• Provide access to care via affordable
insurance for all and adequate
funding and infrastructure support to
institutions
• Acknowledge that cancer disparities
exist
• Provide access to care via affordable
insurance for all and adequate
funding and infrastructure support to
institutions
Areas to AddressAreas to Address
• Address barriers to screening by
fully funding the National BCCEDP
and state programs
• Provide culturally appropriate cancer
education to patients
• Provide funding for patient navigator
services to increase screening and
follow-up
• Address barriers to screening by
fully funding the National BCCEDP
and state programs
• Provide culturally appropriate cancer
education to patients
• Provide funding for patient navigator
services to increase screening and
follow-up
Areas to AddressAreas to Address
• Cultural sensitivity training to
medical providers and accountability
for care
• Building partnership with
stakeholders
• Cultural sensitivity training to
medical providers and accountability
for care
• Building partnership with
stakeholders
Alabama Department of Public Health
Alabama Department of Public Health
• Breast and Cervical Cancer Early
Detection Program (ABCCEDP)
• FITway
– Colorectal cancer screening
• Breast and Cervical Cancer Early
Detection Program (ABCCEDP)
• FITway
– Colorectal cancer screening
6/13/2013
14
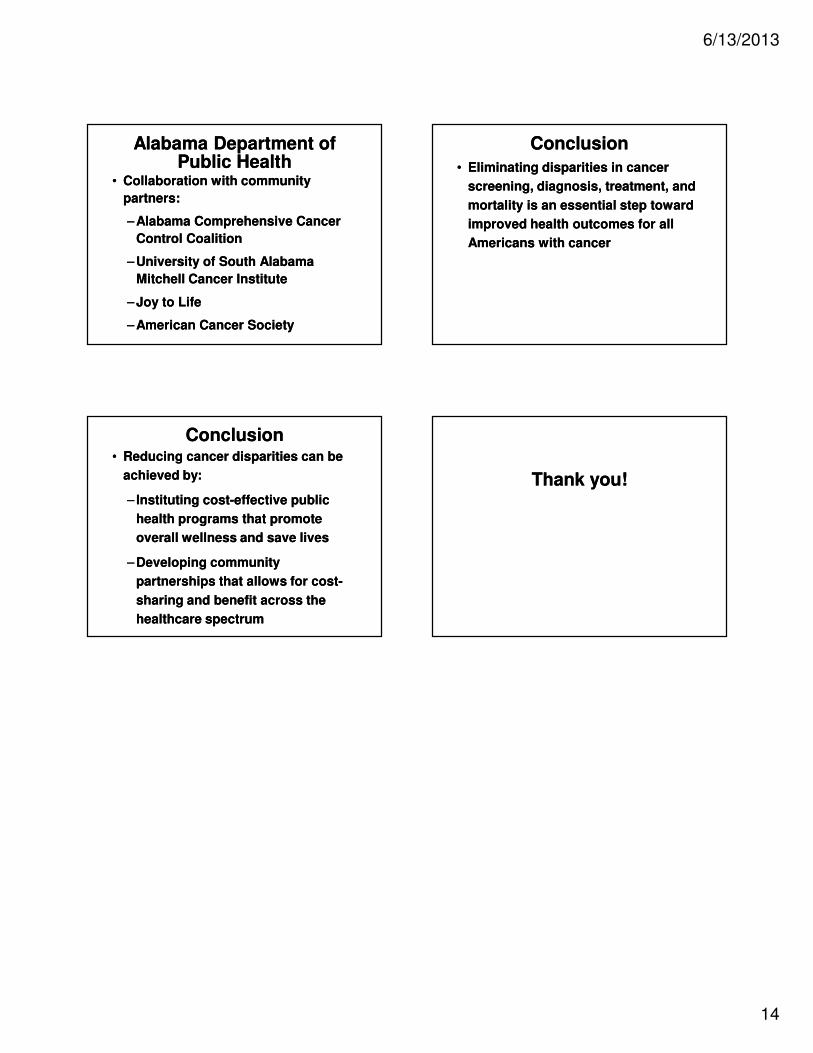
Alabama Department of Public Health
Alabama Department of Public Health
• Collaboration with community
partners:
– Alabama Comprehensive Cancer
Control Coalition
– University of South Alabama
Mitchell Cancer Institute
– Joy to Life
– American Cancer Society
• Collaboration with community
partners:
– Alabama Comprehensive Cancer
Control Coalition
– University of South Alabama
Mitchell Cancer Institute
– Joy to Life
– American Cancer Society
ConclusionConclusion
• Eliminating disparities in cancer
screening, diagnosis, treatment, and
mortality is an essential step toward
improved health outcomes for all
Americans with cancer
• Eliminating disparities in cancer
screening, diagnosis, treatment, and
mortality is an essential step toward
improved health outcomes for all
Americans with cancer
ConclusionConclusion• Reducing cancer disparities can be
achieved by:
– Instituting cost-effective public
health programs that promote
overall wellness and save lives
– Developing community
partnerships that allows for cost-
sharing and benefit across the
healthcare spectrum
• Reducing cancer disparities can be
achieved by:
– Instituting cost-effective public
health programs that promote
overall wellness and save lives
– Developing community
partnerships that allows for cost-
sharing and benefit across the
healthcare spectrum
Thank you!Thank you!