Embed Size (px)
Citation preview


Co
mm
en
ta
ry
financial rewards for the handful of players who reach its pinnacles of
achievement.
Nevertheless, at the grassroots level, the basics remain and the soccer
culture is strewn with rags-to-riches stories. Many top players have had
the most humble of origins, developing their dazzling skills on patches of
land that would sometimes be unrecognizable as soccer grounds. Some
don’t even have grassroots!
The World Cup finals provide the ideal international arena for such
rich talent to shine before a global audience, either collectively as a team
or individually as players. In this respect, it is a great equalizer.
But the competition’s service to mankind exceeds this.
It provides a distraction to the woes of the world during the course
of the tournament. It adds faces and emotions to people in far-off lands,
and this can be very important at times when international tensions are
high. People are people the world over, whatever destiny may bestow
upon them at birth. Lasting friendships can be formed, even among sup-
porters of opposing teams. After all, the true supporter delights in soccer
played with skill and dignity, whatever the team.
Why is all of this so important to OPEC?
OPEC’s Members are all developing countries. Even though they may
be at different stages of socioeconomic development, they can easily re-
late to the idea of a singular attribute propelling them onto the world
stage. In their case, it has been their abundant reserves of crude oil, the
dominant energy source for the world economy. They too have experi-
enced the disappointment of discovering that this is all that some con-
sumers from the richer part of the world want from them, and that there
is little interest in helping them develop their economies and integrating
them into a truly global community.
This is why OPEC remains committed to the ideals and aspirations of
other developing countries, as they seek to eradicate poverty and mod-
ernize their economies in a viable and sustainable manner.
This is why we welcome competitions like the World Cup and the
Olympic Games, because they enable the international spotlight to be
focused on the innate competence and capabilities of people in develop-
ing countries, even though this may be for only a fleeting moment. In a
world full of injustices and inequalities, this may be a tiny step forward,
but it is, indeed, a step forward, rather than standing still or even going
backwards, as is so often, regrettably, the case.
Destiny can be highly capricious. Sometimes the difference between
two teams can be just a lucky bounce.
“May the best team win!” is the most appropriate expression for a
global competition like the 2006 soccer World Cup.
And let us hope that it is an OPEC team!
Alles Gute, the Islamic Republic of Iran!
Alles Gute, Saudi Arabia!
Soccer —a greater service to mankind
than just kicking
a ballThe best wishes of the OPEC Secretariat go to the soccer
teams from the Islamic Republic of Iran and Saudi Arabia
at the 2006 FIFA World Cup finals that kick off in Germany
on June 9.
These two Founder Members of OPEC will be among
the 32 teams competing in the closing rounds of the tour-
nament, for the coveted cup which will be awarded to the
winner of the final in Berlin one month later, on July 9.
Across the globe, the World Cup captures the imagina-
tion probably more than any other organized international
event. It symbolises the opportunity for players from a rich
tapestry of nations, cultures and backgrounds to compete
with each other for 90 minutes or more on a level playing
field — using this term in a more literal sense than usual.
Soccer’s appeal is a basic one. Kicking a ball around is
almost as natural as walking, the rules are simple and the
game can be played on virtually any flat, firm surface across
the world, where weather conditions permit. These are the
fundamental elements.
Of course, in practice, soccer has become a highly so-
phisticated sport when it is played at an advanced level,
particularly to national or international standards, with vast
Co
nt
en
ts
Publishers
OPEC
Organization of the Petroleum Exporting Countries
Obere Donaustrasse 93
1020 Vienna, Austria
Telephone: +43 1 211 12/0
Telefax: +43 1 216 4320
Public Relations & Information
Department fax: +43 1 214 9827
E-mail: [email protected]
Web site: www.opec.org
Visit the OPEC Web site for the latest news and infor-
mation about the Organization and back issues of the
OPEC Bulletin which is also available free of charge
in PDF format.
Hard copy subscription: $70/year
Membership and aims
OPEC is a permanent, intergovernmental
Or gan i za tion, established in Baghdad, September
10–14, 1960, by IR Iran, Iraq, Kuwait, Saudi
Arabia and Venezuela. Its objective is to co-
ordinate and unify petroleum policies among
Member Countries, in order to secure fair
and stable prices for petroleum producers;
an efficient, economic and regular supply of
petroleum to consuming nations; and a fair return
on capital to those investing in the industry.
The Organization now comprises 11 Members:
Qatar joined in 1961; Indonesia and SP Libyan AJ
(1962); United Arab Emirates (Abu Dhabi, 1967);
Algeria (1969); and Nigeria (1971). Ecuador
joined the Organization in 1973 and left in 1992;
Gabon joined in 1975 and left in 1995.
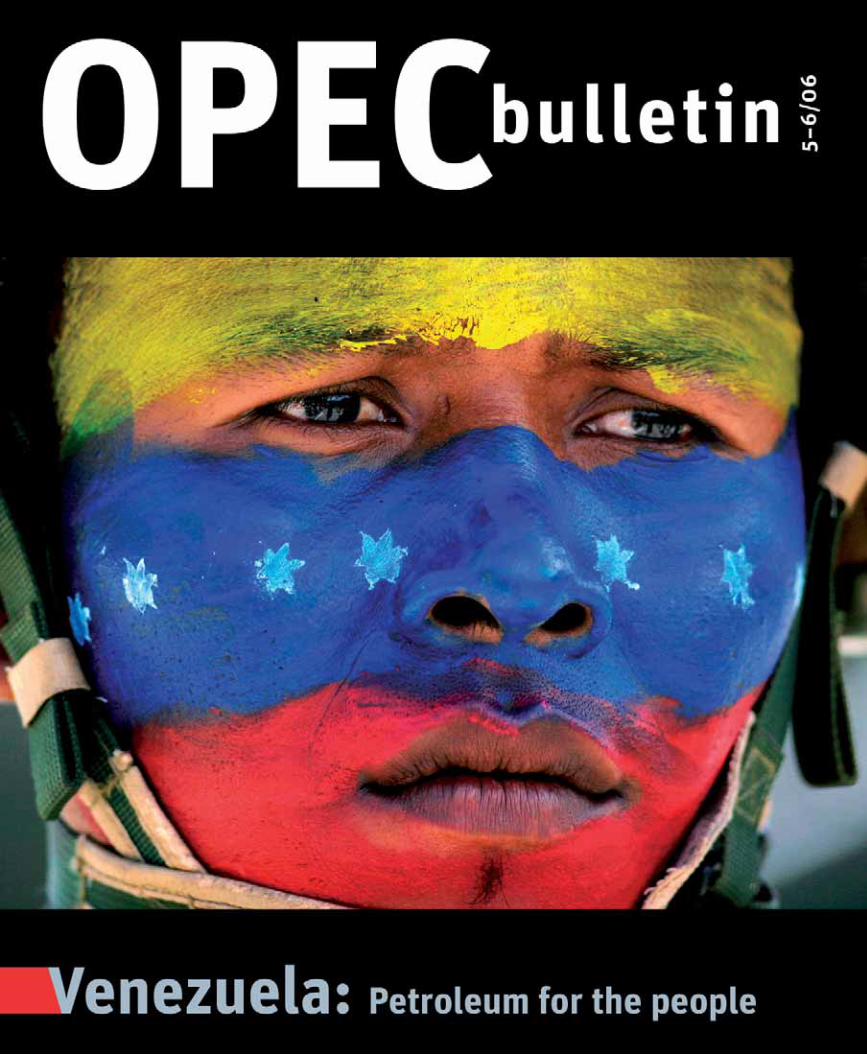
CoverVenezuela will be host of the 141st Meeting of the
OPEC Conference on June 1, 2006. A Venezuelan
market overview can be found on pp4–17.
Photo: Reuters.
OP
EC
bu
lle
tin
Vol XXXVII, No 3, May/June 2006, ISSN 0474–6279
Countr y Prof i le 4
Feature 1810th IEF in Doha — Fuelling the future:
energy security, a shared responsibility
Interviews with Odd Roger Enoksen,
Malcolm Wicks, Lord Browne of Madingley
Ethanol proves to be the perfect complement to Brazil’s crude oil
Sowing the oil:
a new direction for Venezuela
Venezuela: resources for all (p12)
Out and about in Caracas (p16)
PD
VSA
Feature 30
Feature 38
Qatar’s development in full swing
as the gas starts to flow
High-level OPEC-China roundtable
stresses the need for harmony
Feature 28
Reu
ters
Qat
arga
s
Printed in Austria by Ueberreuter Print and Digimedia
Indexed and abstracted in PAIS International
Contributions
The OPEC Bulletin welcomes original contri butions on
the technical, financial and en vi ronmental aspects
of all stages of the energy industry, including letters
for publication, research reports and project descrip-
tions with supporting illustrations and photographs.
Editorial policy
The OPEC Bulletin is published by the PR & Informa-
tion Department. The contents do not necessarily
reflect the official views of OPEC nor its Mem ber Coun-
tries. Names and boundaries on any maps should not
be regarded as authoritative. No responsibility is tak-
en for claims or contents of advertisements. Editorial
material may be freely reproduced (unless copyright-
ed), crediting the OPEC Bulletin as the source. A copy
to the Editor would be appreciated.
Secretariat officialsSecretary General
HE Dr Edmund Maduabebe Daukoru
Acting for the Secretary General
Mohammed S Barkindo
Director, Research Division
Dr Hasan Qabazard
Head, Administration & Human Resources Department
Senussi J Senussi/Alejandro Rodriguez
Head, Energy Studies Department
Mohamed Hamel
Head, PR & Information Department
Dr Omar Farouk Ibrahim
Head, Petroleum Market Analysis Department
Mohammad Alipour-Jeddi
Senior Legal Counsel
Dr Ibibia Lucky Worika
Head, Data Services Department
Fuad Al-Zayer
Head, Office of the Secretary General
Abdullah Al-Shameri
Editorial staffEditor-in-ChiefDr Omar Farouk Ibrahim
Senior Editorial Co-ordinatorUmar Gbobe Aminu
EditorEdward Pearcey
Associate EditorsKeith Aylward-Marchant
Jerry Haylins
James Griffin
ProductionDiana Lavnick
DesignElfi Plakolm
Photographs (unless otherwise credited)Diana Golpashin
Market Review 68
Noticeboard 79
OPEC Publications 80
Feature 46
Saudi Aramco to supply Sinopec with 1m b/d by 2010
Middle Eastern energy investment to total $220bn within five years (p61)
Global offshore expenditure set to reach $247.5bn by 2010 (p62)
Exploration opportunities grow offshore Vietnam (p63)
BP sees revenues up but profits down (p64)
Shell sees rising income and looks to open up more resources (p65)
OPEC Fund News 66
Forum 54
Newsline 60
Norway seeks a new approach to exploration
Prediction demand:
a job for consumers and producers
OPEC Fund hosts meeting of
Heads of Arab aid institutions
Edw
ard
Pear
cey
Reu
ters
Reu
ters
4
OP
EC
bu
lle
tin
5–
6/0
6
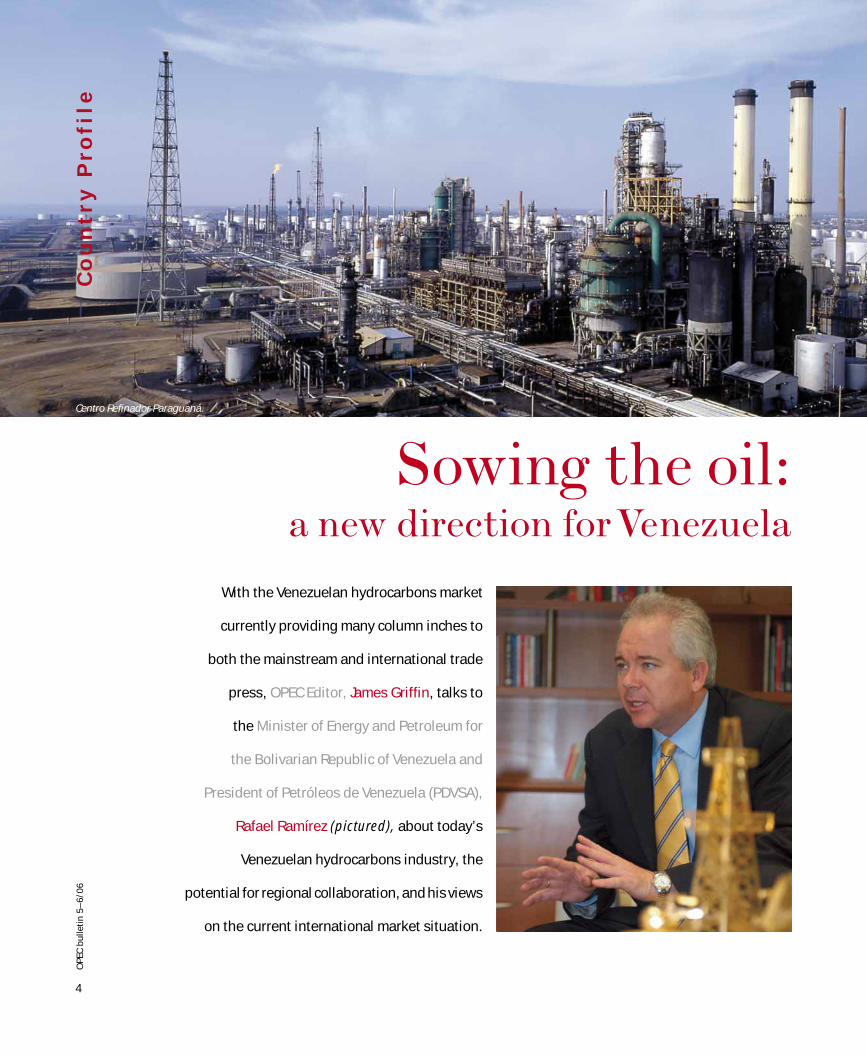
Sowing the oil:a new direction for Venezuela
With the Venezuelan hydrocarbons market
currently providing many column inches to
both the mainstream and international trade
press, OPEC Editor, James Griffin, talks to
the Minister of Energy and Petroleum for
the Bolivarian Republic of Venezuela and
President of Petróleos de Venezuela (PDVSA),
Rafael Ramírez (pictured), about today’s
Venezuelan hydrocarbons industry, the
potential for regional collaboration, and his views
on the current international market situation.
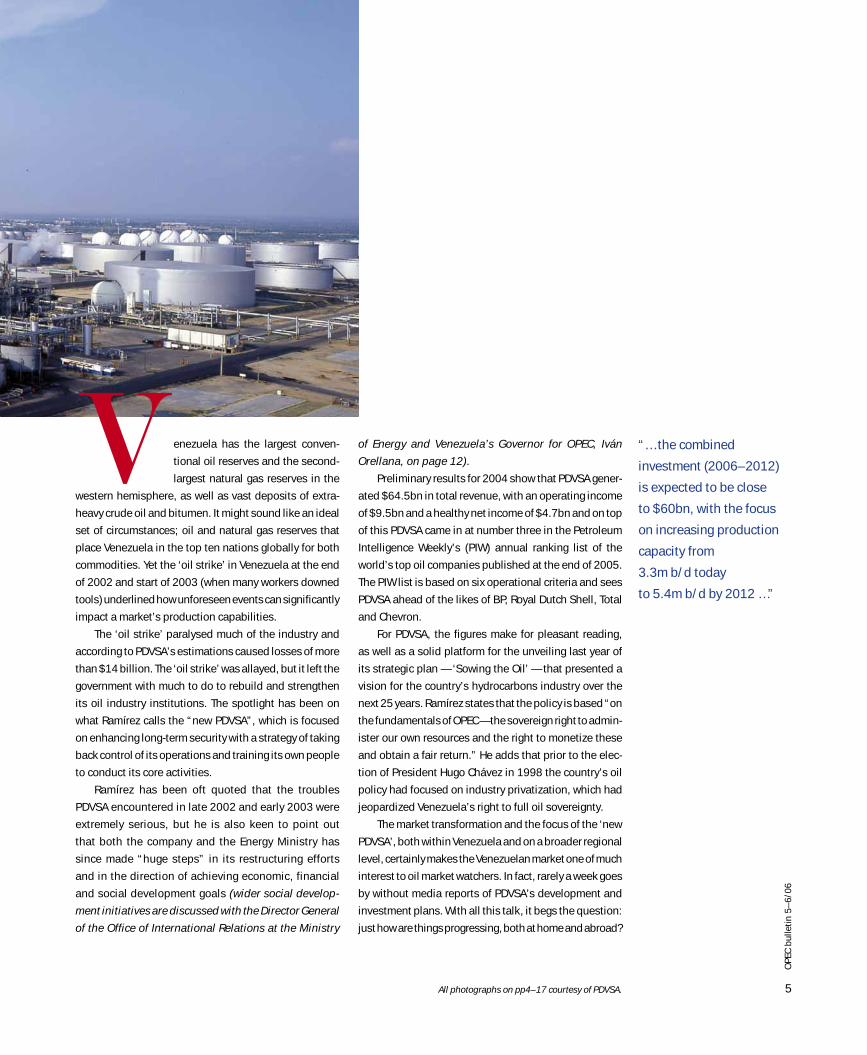
Centro Refinador Paraguaná.
Co
un
tr
y P
ro
fi
le
5
OP
EC
bu
lle
tin
5–
6/0
6
Venezuela has the largest conven-
tional oil reserves and the second-
largest natural gas reserves in the
western hemisphere, as well as vast deposits of extra-
heavy crude oil and bitumen. It might sound like an ideal
set of circumstances; oil and natural gas reserves that
place Venezuela in the top ten nations globally for both
commodities. Yet the ‘oil strike’ in Venezuela at the end
of 2002 and start of 2003 (when many workers downed
tools) underlined how unforeseen events can significantly
impact a market’s production capabilities.
The ‘oil strike’ paralysed much of the industry and
according to PDVSA’s estimations caused losses of more
than $14 billion. The ‘oil strike’ was allayed, but it left the
government with much to do to rebuild and strengthen
its oil industry institutions. The spotlight has been on
what Ramírez calls the “new PDVSA”, which is focused
on enhancing long-term security with a strategy of taking
back control of its operations and training its own people
to conduct its core activities.
Ramírez has been oft quoted that the troubles
PDVSA encountered in late 2002 and early 2003 were
extremely serious, but he is also keen to point out
that both the company and the Energy Ministry has
since made “huge steps” in its restructuring efforts
and in the direction of achieving economic, financial
and social development goals (wider social develop-
ment initiatives are discussed with the Director General
of the Office of International Relations at the Ministry
of Energy and Venezuela’s Governor for OPEC, Iván
Orellana, on page 12).
Preliminary results for 2004 show that PDVSA gener-
ated $64.5bn in total revenue, with an operating income
of $9.5bn and a healthy net income of $4.7bn and on top
of this PDVSA came in at number three in the Petroleum
Intelligence Weekly’s (PIW) annual ranking list of the
world’s top oil companies published at the end of 2005.
The PIW list is based on six operational criteria and sees
PDVSA ahead of the likes of BP, Royal Dutch Shell, Total
and Chevron.
For PDVSA, the figures make for pleasant reading,
as well as a solid platform for the unveiling last year of
its strategic plan — ‘Sowing the Oil’ — that presented a
vision for the country’s hydrocarbons industry over the
next 25 years. Ramírez states that the policy is based “on
the fundamentals of OPEC — the sovereign right to admin-
ister our own resources and the right to monetize these
and obtain a fair return.” He adds that prior to the elec-
tion of President Hugo Chávez in 1998 the country’s oil
policy had focused on industry privatization, which had
jeopardized Venezuela’s right to full oil sovereignty.
The market transformation and the focus of the ‘new
PDVSA’, both within Venezuela and on a broader regional
level, certainly makes the Venezuelan market one of much
interest to oil market watchers. In fact, rarely a week goes
by without media reports of PDVSA’s development and
investment plans. With all this talk, it begs the question:
just how are things progressing, both at home and abroad?
“… the combined
investment (2006–2012)
is expected to be close
to $60bn, with the focus
on increasing production
capacity from
3.3m b/d today
to 5.4m b/d by 2012 …”
All photographs on pp4–17 courtesy of PDVSA.
6
OP
EC
bu
lle
tin
5–
6/0
6C
ou
nt
ry
Pr
of
il
e
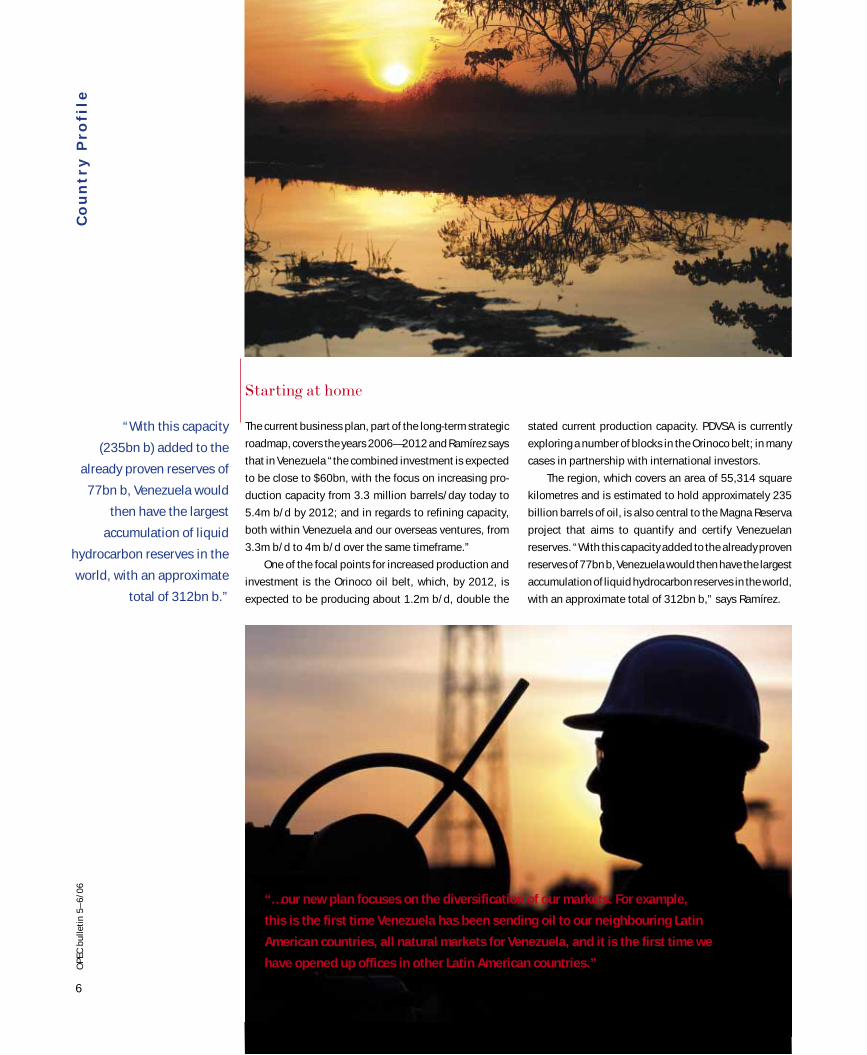
Starting at home
The current business plan, part of the long-term strategic
roadmap, covers the years 2006—2012 and Ramírez says
that in Venezuela “the combined investment is expected
to be close to $60bn, with the focus on increasing pro-
duction capacity from 3.3 million barrels/day today to
5.4m b/d by 2012; and in regards to refining capacity,
both within Venezuela and our overseas ventures, from
3.3m b/d to 4m b/d over the same timeframe.”
One of the focal points for increased production and
investment is the Orinoco oil belt, which, by 2012, is
expected to be producing about 1.2m b/d, double the
stated current production capacity. PDVSA is currently
exploring a number of blocks in the Orinoco belt; in many
cases in partnership with international investors.
The region, which covers an area of 55,314 square
kilometres and is estimated to hold approximately 235
billion barrels of oil, is also central to the Magna Reserva
project that aims to quantify and certify Venezuelan
reserves. “With this capacity added to the already proven
reserves of 77bn b, Venezuela would then have the largest
accumulation of liquid hydrocarbon reserves in the world,
with an approximate total of 312bn b,” says Ramírez.
“…our new plan focuses on the diversification of our markets. For example,
this is the first time Venezuela has been sending oil to our neighbouring Latin
American countries, all natural markets for Venezuela, and it is the first time we
have opened up offices in other Latin American countries.”
“With this capacity
(235bn b) added to the
already proven reserves of
77bn b, Venezuela would
then have the largest
accumulation of liquid
hydrocarbon reserves in the
world, with an approximate
total of 312bn b.”
7
OP
EC
bu
lle
tin
5–
6/0
6
Refining investment is expected to hit $16.5bn dur-
ing the 2006–2012 plan and includes the construction of
three new refineries. The new refineries are to be located
in Barinas, Cabruta in Guárico and Caripito in Monagas.
The plan also aims to upgrade and refurbish existing
facilities to process heavy crudes.
The ‘Hydrocarbons Law’
The investment figures outlined emphasize the desire
of PDVSA to expand both upstream and downstream to
meet domestic, regional and international requirements.
The opportunities and potential production increases are
certainly significant, but parts of the restructuring and
the new ‘Hydrocarbons Law’, which revises a number of
contractual commitments that the Venezuelan govern-
ment considers to be unfair and harmful to the national
interest, have not met with universal approval. Earlier
this year Exxon Mobil sold its Venezuelan investments
to Spanish multinational, Repsol YPF, after refusing to
sign new contracts and in April, Italian group Eni, failed
to agree terms on a new operating service contract for
the Daicon Area.
Ramírez iterates that the ‘Hydrocarbons Law’ clearly
sets out the role of private sector participation and this
must be adhered to. “According to the law, the private
sector can participate in upstream activities up to 49 per
cent and downstream this is 100 per cent,” he says. “Oil
reserves belong to the Venezuelan State and PDVSA must
have a majority stake in these activities, with the Ministry
of Energy and Petroleum having the power to regulate the
exploitation of resources in a rational manner.”
He adds that the law is aimed at striking a new balance
between the interests of investors, private companies and
the state as the owner of the hydrocarbon resources and
points out that most international oil companies remain
present in Venezuela. This was highlighted at a ceremony
on March 31 this year that brought together Venezuelan
representatives, including President Chávez and Ramírez,
with international companies that had signed agree-
ments to migrate to the new operating agreements. This
included representatives from Repsol YPF, Suelopetrol,
BP, Teikoku, Vincler, Inemaka, Open, Petrobras, China
National Petroleum Corporation, Chevron, Royal Dutch/
Shell, Tecpetrol, Perenco, Harvest and Hocol. Ramírez
believes the willingness shown by private enterprises
participating in the migration process is a demonstra-
tion of confidence in Venezuela and its new policies.
Gas development expands
In the Venezuelan gas market, new legislation has also
been enacted through the ‘Gaseous Hydrocarbons Law’.
PDVSA says the new law promotes private sector partici-
pation and permits a national and foreign investor par-
ticipation of up to 100 per cent of the capital. Given that
on the world scene Venezuela ranks eighth among the
countries with the largest natural gas reserves, much of
which is still to be exploited, there is plenty of scope for
development. Ramírez adds that “we are planning exten-
sive exploitation of our offshore gas resources … and pro-
posing to add an additional 100 trillion cubic feet to the
proven reserves.”
The aim is to increase production from 6.3bn to
11.5bn cu ft per day by 2012, with investment reaching
$16.8bn during this period. Within the framework of the
National Gas Plan, the three main projects in offshore
gas exploration and production are: Plataforma Deltana,
Mariscal Sycre and Rafael Urdaneta and the focus for
bringing gas onshore is the Gran Mariscal de Ayacucho
Industrial Complex (CIGMA). The complex will undertake
LNG production and crude processing, pump gas inland,
provide export facilities for LNG, as well as be the home
base for offshore services.
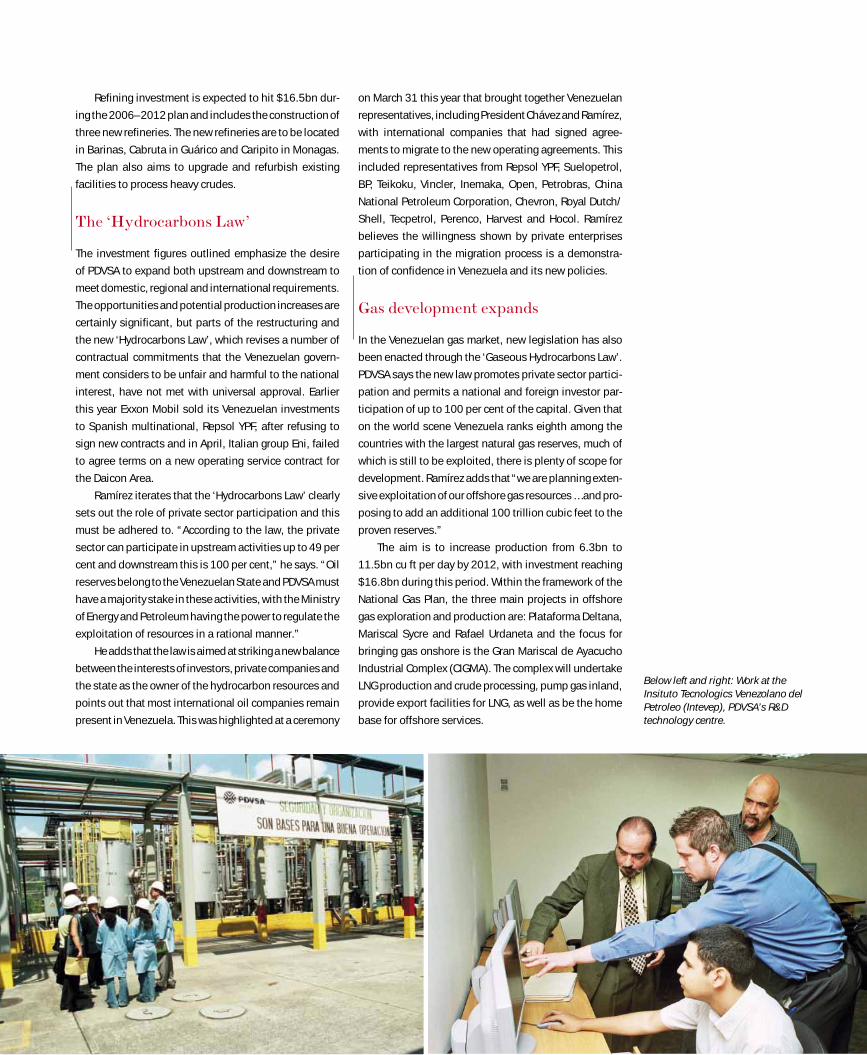
Below left and right: Work at the Insituto Tecnologics Venezolano del Petroleo (Intevep), PDVSA’s R&D technology centre.
8
OP
EC
bu
lle
tin
5–
6/0
6C
ou
nt
ry
Pr
of
il
e
Ramírez sees the prospects offshore as “very
encouraging” and the potential benefits for Venezuela’s
internal market are easy to see, but for many what has
caught the eye is the prospect and plans for regional
gas integration.
Everyone needs good neighbours
One of the cornerstones for regional integration is the
‘Great gas pipeline of the south’, which according to pre-
liminary proposals is expected to begin in Puerto Ordaz,
south-east of Caracas, stretch south the length of Brazil
and end in Argentina, with possible branches serving
Uruguay and Bolivia. In March, the Co-ordination and
Decision-Making Ministerial Committee met for the first
time and in late April the leaders of Venezuela, Argentina
and Brazil held a one-day summit in Sao Paulo, Brazil, to
discuss the project, where it was agreed to push ahead
with the plans.
The gains for Venezuela, as well as Bolivia, which has
the continent’s second largest gas reserves, are clear, just
as they are for consumers such as Brazil, whose supplies
come largely from Bolivia. These supplies are also pre-
dicted to triple by the end of the decade.
There is widespread recognition that the pipeline
makes economic sense and Ramírez states that “agree-
ments have already been signed” and that “the concept
engineering and the environmental studies are currently
being undertaken.” Some commentators, however, have
expressed doubts due to environmental concerns.
It will be interesting to see the outcome of these
studies, but if engineering hurdles and environmental
concerns can be met in the required manner, the project
will certainly play a major role in expanding the energy
integration of Latin America. For Ramírez, the belief is that
it will deliver far more than natural gas — it will be a fun-
damental step in the development of the Latin American
Petrosur agreement that covers Argentina, Brazil, Uruguay
and Venezuela.
The petro-agreements
The Petrosur agreement is just one of the projects aimed
at diversifying Venezuela’s hydrocarbons markets;
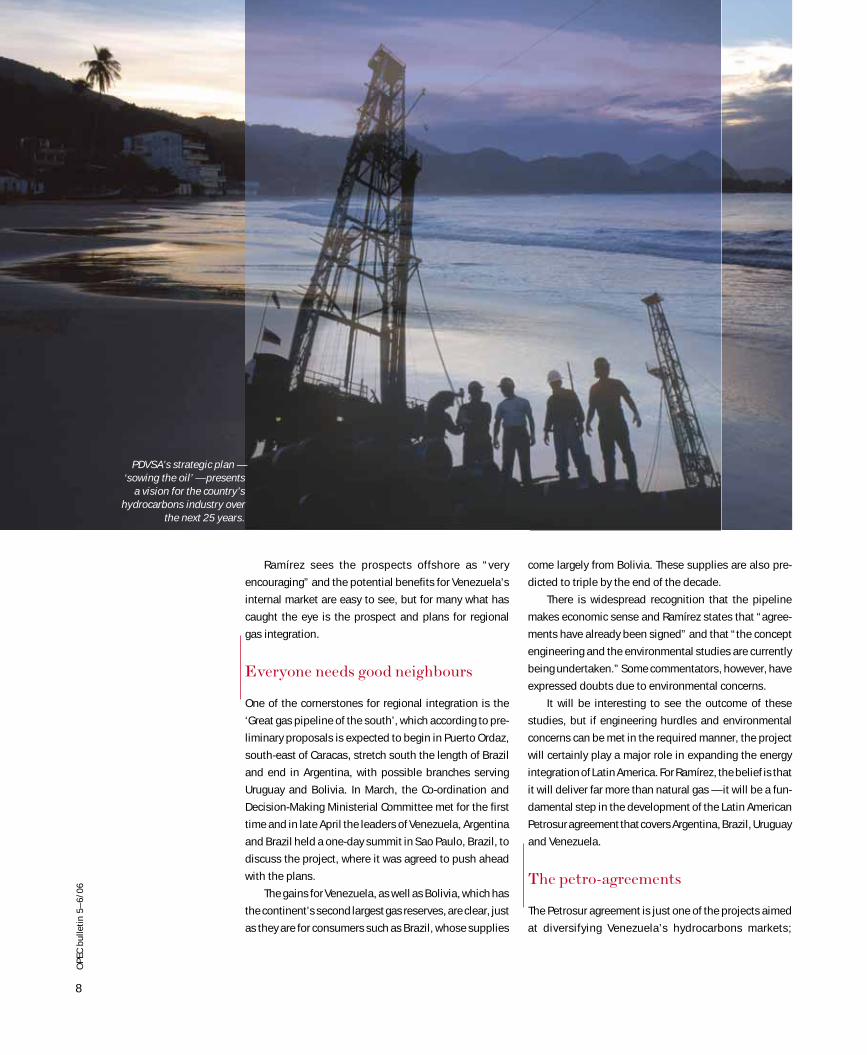
PDVSA’s strategic plan —
‘sowing the oil’ — presents
a vision for the country’s
hydrocarbons industry over
the next 25 years.
9
OP
EC
bu
lle
tin
5–
6/0
6
others include Petroandina, covering Venezuela, Bolivia,
Ecuador, Peru and Colombia and Petrocaribe, covering
Venezuela and 13 Caribbean nations. The three initia-
tives come under the umbrella of Petroamerica.
The appetite for stronger regional integration, in both
oil and gas, is underlined by Ramírez. “Venezuela has
been exporting oil for over 100 years and for this period
our sole task has been to export to the US. So our new
plan focuses on the diversification of our markets. For
example, this is the first time Venezuela has been send-
ing oil to our neighbouring Latin American countries, all
natural markets for Venezuela, and it is the first time we
have opened up offices in other Latin American coun-
tries.” Since 2002, PDVSA has increased its supply to
Latin America and the Caribbean by 31 per cent.
He does iterate, however, that “we will of course
maintain our important role in the North American mar-
ket and keep sending our oil there, as well as looking to
increase our presence there.” At present, approximately
57 per cent of Venezuela’s crude and associated petro-
leum product exports are sent to North America.
Within the strategy for Latin America, Ramírez empha-
sizes the aim is to co-ordinate and plan public policy in
energy matters that minimizes the negative effect the
cost of energy has on countries of the region as a result
of geopolitical and speculative factors. He adds: “We
have already signed an agreement with Brazil to sup-
ply fuel to the PDVSA-Petrobas Abreu e Lima refinery in
Pernambuco; add into this plans to refurbish a refinery
in Uruguay, energy co-operation agreements with Brazil,
Argentina, Uruguay and Paraguay, as well as plans to
integrate with Colombia and a number of agreements
with Bolivia to help them with the exploitation of their
gas reserves, and it is clear that enhanced regional co-
operation has taken some big steps forward.”
He is also keen to stress that “at the same time as we
are pushing forward energy integration, we are also pro-
posing economic and social integration.” At the end of
last year, Venezuela became a full member of Mercosur, a
regional integration block consisting of Argentina, Brazil,
Paraguay and Uruguay, which according to PDVSA “shares
values that find expression in their own democratic and
plural societies … the fight against poverty and economic
and social development under equal conditions.”
“It is clear to us that
developing world
economies will never
be able to compete
with large economies,
such as the US and
Europe, in a free trade
system.”
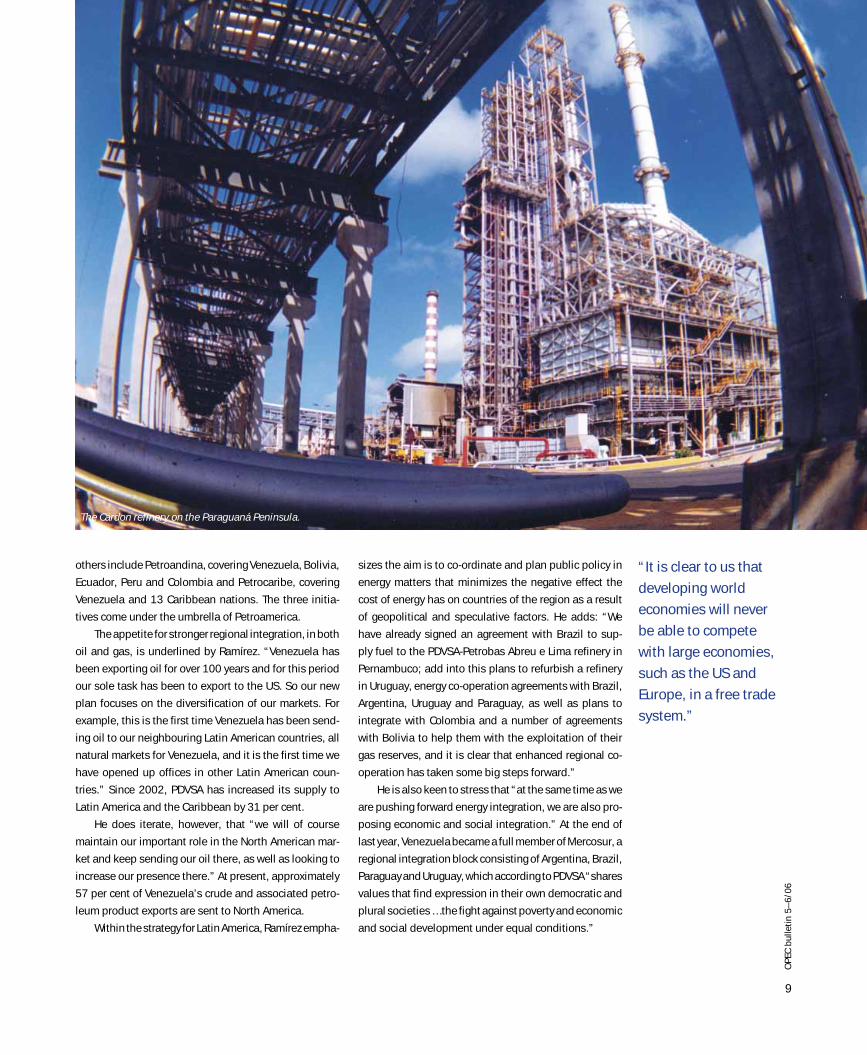
The Cardon refinery on the Paraguaná Peninsula.
10
OP
EC
bu
lle
tin
5–
6/0
6C
ou
nt
ry
Pr
of
il
e
Ramírez adds that Venezuela is looking to “an alter-
native way to integrate from the liberalized free market
way. It is clear to us that developing world economies will
never be able to compete with large economies, such as
the US and Europe, in a free trade system.”
For the Caribbean, Petrocaribe came into force last
July and is focused on solving the problems of access to
energy resources in the Caribbean region. Ramírez says:
“It is an alliance under which Venezuela will provide
approximately 200,000 b/d, supplied without third party
intermediaries, to 13 Caribbean nations, with financing
arrangements for up to 40 per cent of the bill at current
oil price levels. And in addition, Venezuela will accept
payment in the form of products and services.” A good
example of the exchange of products and services, he
says, is the agreement with Cuba. In return for oil, Cuba
is loaning its medics to provide free health care to the
poorest parts of Venezuela’s population.
Broader international expansion
PDVSA’s plans also cover the diversification of export
“It needs to be
remembered that
you cannot demand
stability in the markets
when you introduce
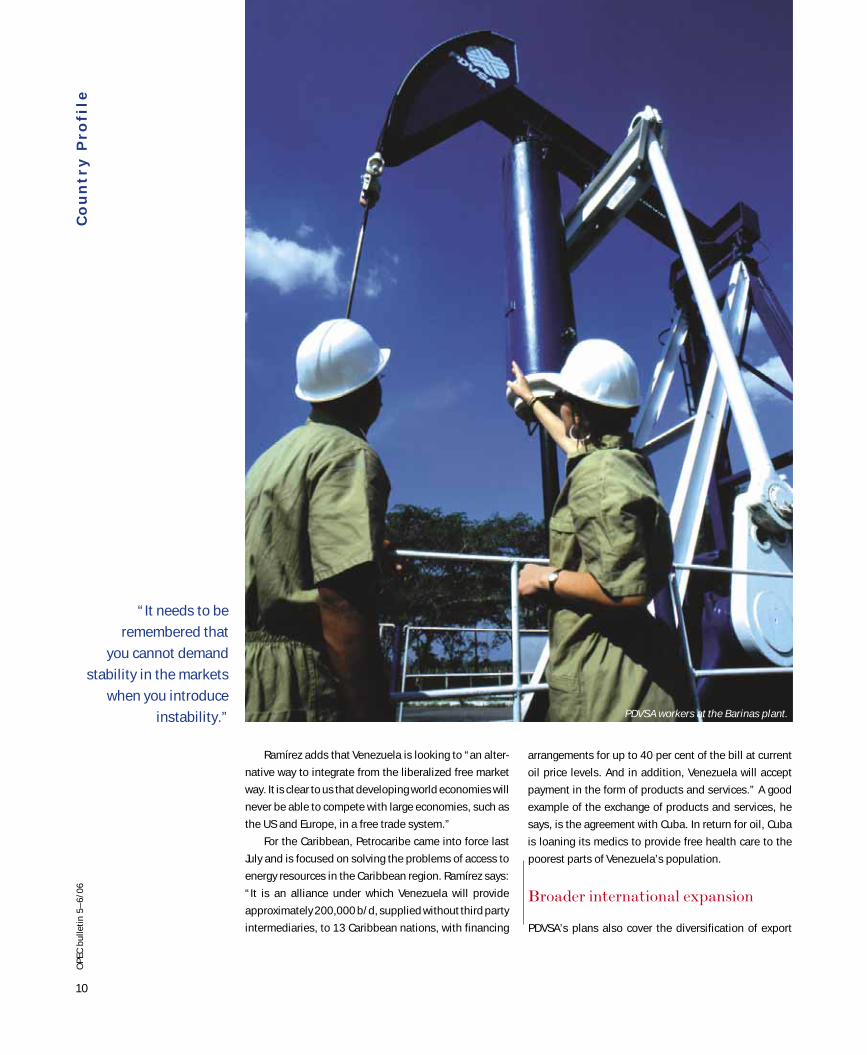
instability.” PDVSA workers at the Barinas plant.
11
OP
EC
bu
lle
tin
5–
6/0
6
markets much further afield. For example, Ramírez says
that “for the first time PDVSA is sending oil to China and
India.” Today, PDVSA is sending approximately 160,000
b/d to China and in 2005 it opened up PDVSA China
in Beijing to foster commercial opportunities in both
upstream and downstream activities. In February, it also
sent its first oil shipment to India.
In Europe too, PDVSA has put together Plan Europa,
which in its first phase, according to PDVSA, has identi-
fied five target countries where particular collaborative
initiatives have been carried out: Norway, the UK, Spain,
Italy and France. The objectives of the plan are to promote
direct investment and the formation of strategic alliances
with European suppliers and contractors; to promote the
transfer of best practices from Europe to PDVSA; and, to
help European operators in Venezuela identify and con-
solidate business opportunities.
The global oil market
Talk of the broader international arena turns attention to
the OPEC Conference in Caracas in June and Ramírez’s
thoughts on the current global oil market situation. In
March this year at the OPEC Conference in Vienna, it was
reported that Venezuela had been pushing for a cut in
OPEC production. Ramírez stresses that “what we have
been proposing to OPEC has been based on market funda-
mentals and what corresponds is a cut in production.”
He adds, however, geopolitical factors; particularly
the situations in Nigeria and Iran and a bottleneck in refin-
ing capabilities, need to be taken into consideration. “So
even though storage capacity is good, even though the
season coming is not one where oil consumption is at its
peak, it has been agreed by consensus, that in order not
to create too much tension in the market we are looking
to keep production where it is,” he says.
The current oil price is also a topic of much glo-
bal debate. Ramírez stresses that “firstly, it needs to
be pointed out that the price needs to stabilize”, and
emphasizes the importance of dialogue between pro-
ducers and consumers. From a producer’s perspective
he says: “It needs to be recognized that it is a time when
all countries are looking to increase their production and
refining capacities and the investment inputs are becom-
ing increasingly expensive. For example, the price of
rigs is escalating, the availability of materials is proving
troublesome and this all affects prices.”
On the consumer side, he adds, “demand keeps on
increasing, many consuming nations take no measures
“Even though storage capacity is good, even though the season
coming is not one where oil consumption is at its peak, it has been
agreed by consensus, that in order not to create too much tension in
the market we are looking to keep production where it is.”
whatsoever to conserve energy and in many instances
consuming nations are imposing high taxes on the end
consumers. For example, high taxes on petroleum are
widely prevalent in Europe. So these issues also need to be
taken into consideration when we talk about prices.”
When asked for a fair and sustainable price going
forward, Ramírez says, “somewhere around $50 plus for
a barrel, but who knows? What happens if Iran suffers
supply disruptions because of geopolitical events? Just
imagine we could be looking at $100 a barrel! It needs
to be remembered that you cannot demand stability in
the markets when you introduce instability.”
Venezuela: extending its reach
With the Venezuelan domestic market very much back
on even keel after the ‘oil strike’ at the end of 2002 and
start of 2003, the signs are that much change is afoot.
Ramírez’s references to the ‘new PDVSA’ underlines the
restructuring being undertaken at home as PDVSA and
the government focus on ‘full oil sovereignty’ and its long-
term strategy for ‘Sowing the oil’.
Yet its plans extend much further than Venezuela.
Abroad there are signs that development aplenty is in the
pipeline: enhanced regional integration with both Latin
America and the Caribbean, and the desire for much more
expansive international growth. With so much activity,
the Venezuelan market is very much ‘one to follow’.
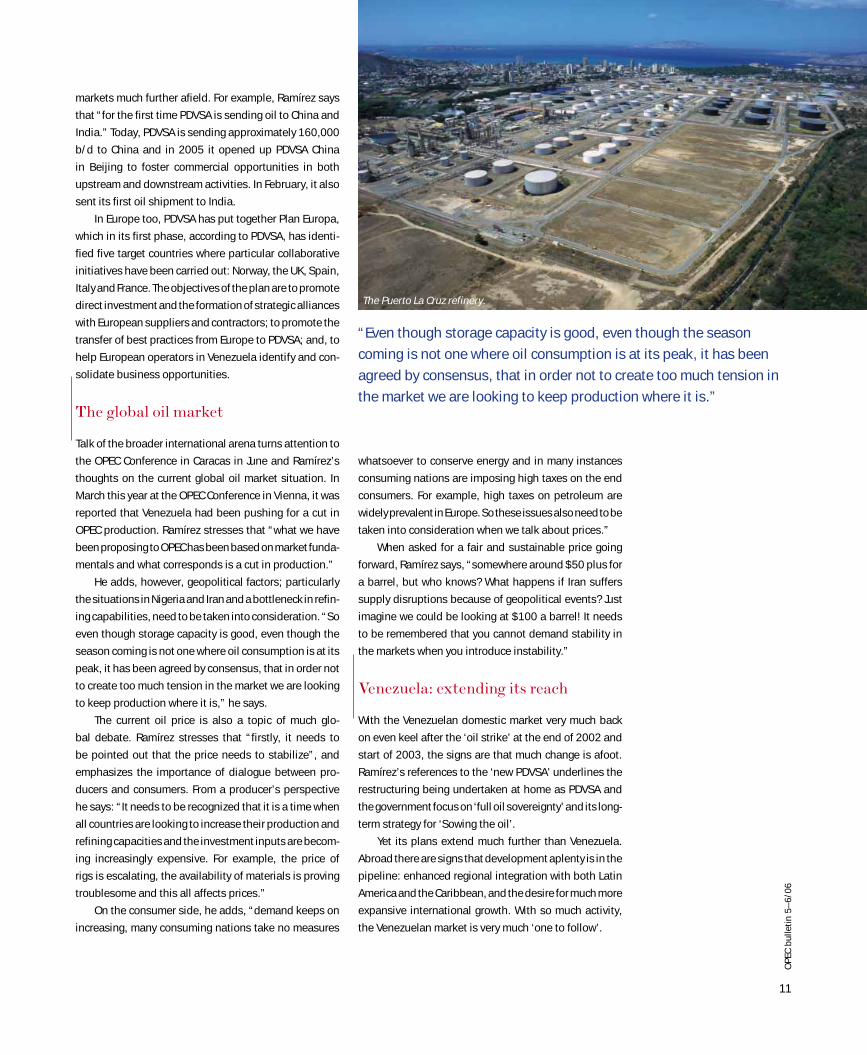
The Puerto La Cruz refinery.
12
OP
EC
bu
lle
tin
5–
6/0
6C
ou
nt
ry
Pr
of
il
e
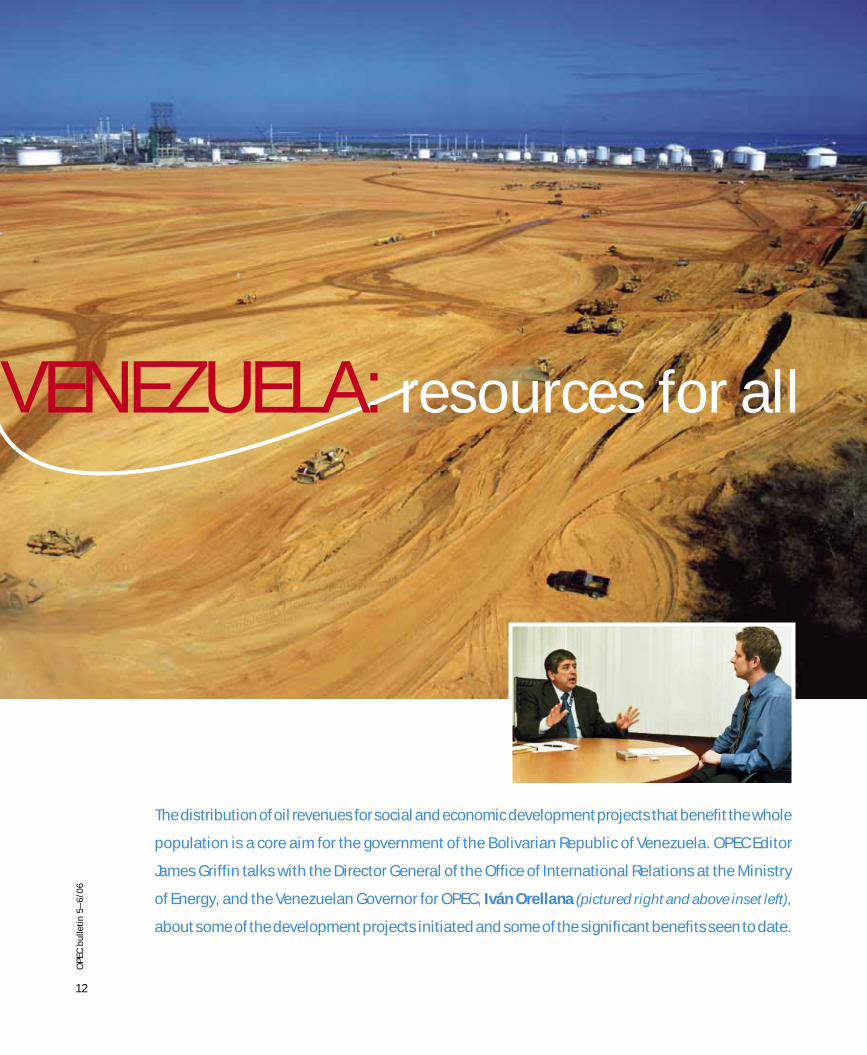
The distribution of oil revenues for social and economic development projects that benefit the whole
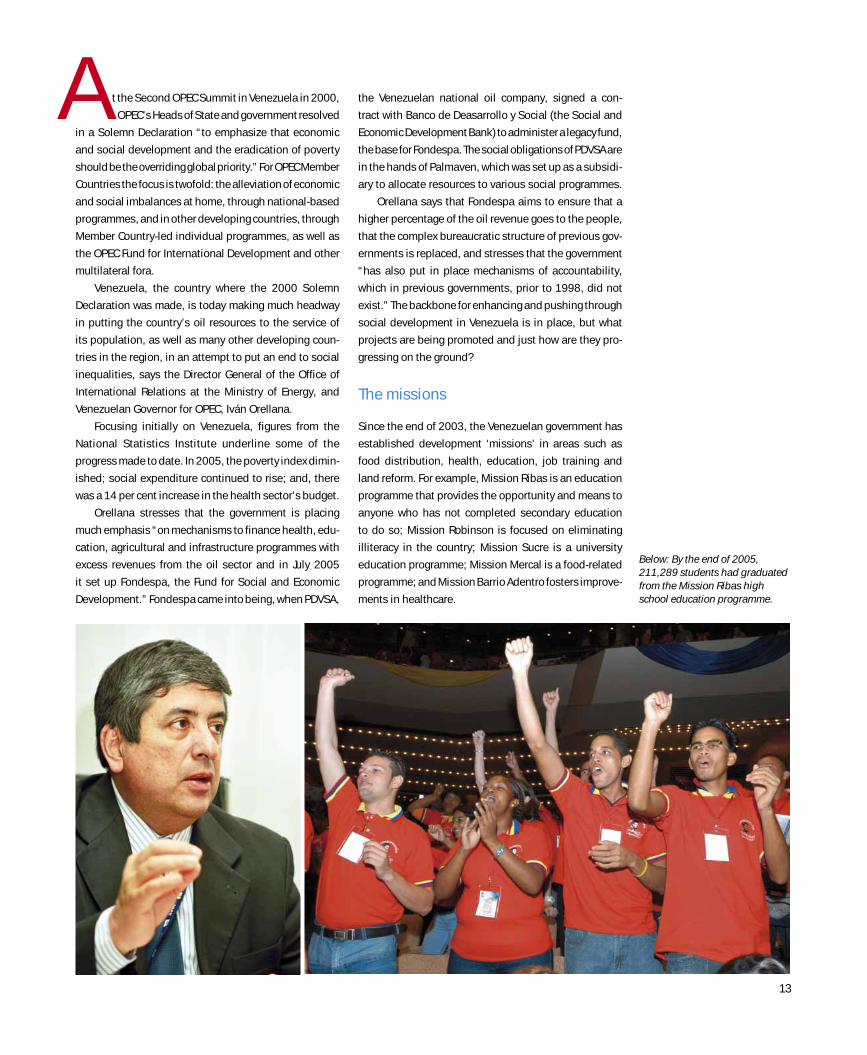
population is a core aim for the government of the Bolivarian Republic of Venezuela. OPEC Editor
James Griffin talks with the Director General of the Office of International Relations at the Ministry
of Energy, and the Venezuelan Governor for OPEC, Iván Orellana (pictured right and above inset left),
about some of the development projects initiated and some of the significant benefits seen to date.
VENEZUELA: resources for all
13
t the Second OPEC Summit in Venezuela in 2000,
OPEC’s Heads of State and government resolved
in a Solemn Declaration “to emphasize that economic
and social development and the eradication of poverty
should be the overriding global priority.” For OPEC Member
Countries the focus is twofold: the alleviation of economic
and social imbalances at home, through national-based
programmes, and in other developing countries, through
Member Country-led individual programmes, as well as
the OPEC Fund for International Development and other
multilateral fora.
Venezuela, the country where the 2000 Solemn
Declaration was made, is today making much headway
in putting the country’s oil resources to the service of
its population, as well as many other developing coun-
tries in the region, in an attempt to put an end to social
inequalities, says the Director General of the Office of
International Relations at the Ministry of Energy, and
Venezuelan Governor for OPEC, Iván Orellana.
Focusing initially on Venezuela, figures from the
National Statistics Institute underline some of the
progress made to date. In 2005, the poverty index dimin-
ished; social expenditure continued to rise; and, there
was a 14 per cent increase in the health sector’s budget.
Orellana stresses that the government is placing
much emphasis “on mechanisms to finance health, edu-
cation, agricultural and infrastructure programmes with
excess revenues from the oil sector and in July 2005
it set up Fondespa, the Fund for Social and Economic
Development.” Fondespa came into being, when PDVSA,
the Venezuelan national oil company, signed a con-
tract with Banco de Deasarrollo y Social (the Social and
Economic Development Bank) to administer a legacy fund,
the base for Fondespa. The social obligations of PDVSA are
in the hands of Palmaven, which was set up as a subsidi-
ary to allocate resources to various social programmes.
Orellana says that Fondespa aims to ensure that a
higher percentage of the oil revenue goes to the people,
that the complex bureaucratic structure of previous gov-
ernments is replaced, and stresses that the government
“has also put in place mechanisms of accountability,
which in previous governments, prior to 1998, did not
exist.” The backbone for enhancing and pushing through
social development in Venezuela is in place, but what
projects are being promoted and just how are they pro-
gressing on the ground?
The missions
Since the end of 2003, the Venezuelan government has
established development ‘missions’ in areas such as
food distribution, health, education, job training and
land reform. For example, Mission Ribas is an education
programme that provides the opportunity and means to
anyone who has not completed secondary education
to do so; Mission Robinson is focused on eliminating
illiteracy in the country; Mission Sucre is a university
education programme; Mission Mercal is a food-related
programme; and Mission Barrio Adentro fosters improve-
ments in healthcare.
A
Below: By the end of 2005, 211,289 students had graduated from the Mission Ribas high school education programme.
14
OP
EC
bu
lle
tin
5–
6/0
6C
ou
nt
ry
Pr
of
il
e
Orellana believes the most significant impact thus
far has been seen in education. “We supply Cuba with
100,000 b/d of crude oil in an agreement that gives
them the means to make part payments with products
and services. The first service they provided was trained
teachers and new methods to improve the literacy of the
Venezuelan people. When we began the programme,
the levels of literacy were very low, but in a very short
time period literacy levels have improved significantly,”
he says. To date, Orellana says, over one million people
have been taught to read and write. In October 2005,
Venezuela was declared by UNESCO to be a country free
of illiteracy.
The next step on the education ladder, Mission
Ribas, is also deemed by the government to be a major
success. According to PDVSA and the Ministry of Energy
and Petroleum, this mission has 8,174 localities, 29,929
classrooms and 31,041 facilitators and by the end of
2005, 211,289 students had finalized their studies and
graduated from this programme.
In health, the primary objective of the Barrio Adentro
Mission is to guarantee full access to integral health serv-
ices. The programme is aided by over 20,000 Cuban doc-
tors, again as part-payment for oil, and Orellana adds
that “the Cuban doctors have been extremely helpful in
designing the most effective and efficient system to pro-
vide health services.” For example, he says, “the Cuban
doctors have been particularly effective in alleviating
common illnesses related to the eyes, such as cataracts.
Previously some people in Venezuela had been left need-
lessly blind.”
According to the Ministry of Health and Social
Development, the Barrio Adentro Mission has reached
approximately 17 million people across the country and
embraces over 90 per cent of the prioritized municipali-
ties. Orellana offers up an anecdote to underline the
value local communities attach to the health missions.
“When the Mission began I was very curious to see how
it was being accepted by some of the poorest parts of
Venezuelan society. So, I decided to visit one of the most
remote villages high in the mountains and spend two days
there so I could talk to the people.
“I remember I spoke to a lady there and at the time
there was talk of the Supreme Court ordering the Cuban
doctors home. In reference to this she said to me directly
‘if you are going to take the Cubans out of here, you
will over my dead body!’ It highlights the importance
local communities attach to the health services being
provided.”
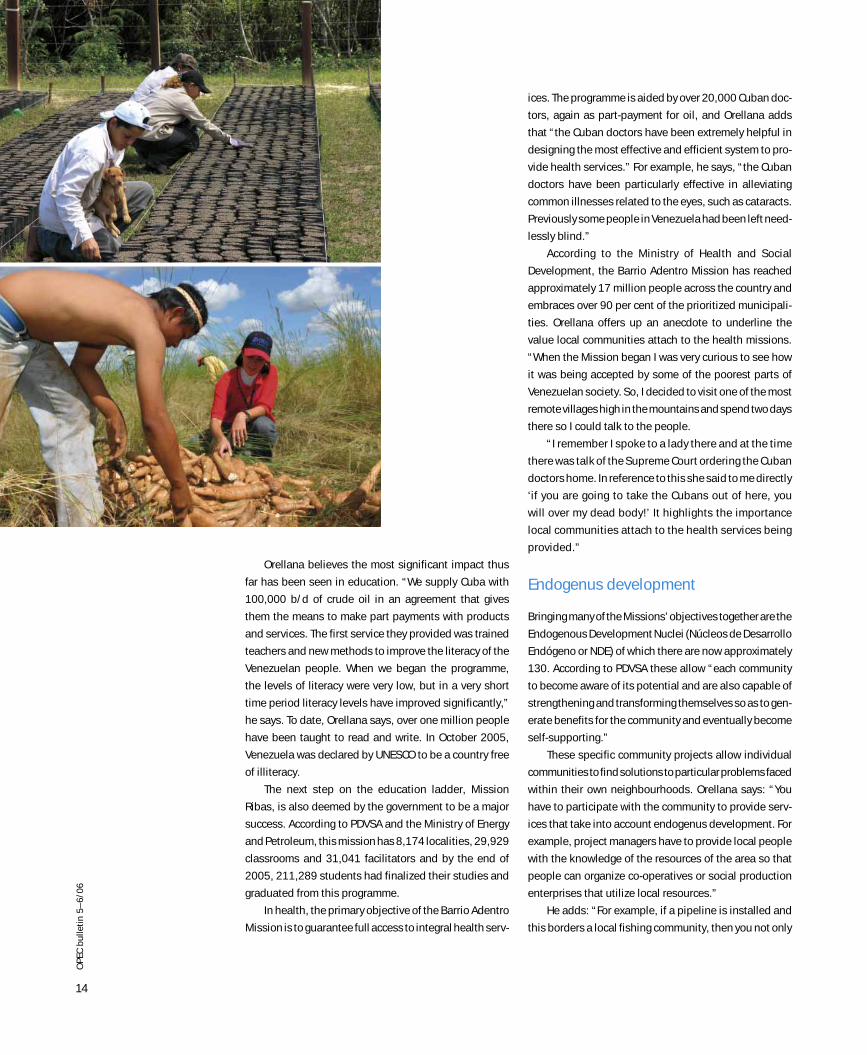
Endogenus development
Bringing many of the Missions’ objectives together are the
Endogenous Development Nuclei (Núcleos de Desarrollo
Endógeno or NDE) of which there are now approximately
130. According to PDVSA these allow “each community
to become aware of its potential and are also capable of
strengthening and transforming themselves so as to gen-
erate benefits for the community and eventually become
self-supporting.”
These specific community projects allow individual
communities to find solutions to particular problems faced
within their own neighbourhoods. Orellana says: “You
have to participate with the community to provide serv-
ices that take into account endogenus development. For
example, project managers have to provide local people
with the knowledge of the resources of the area so that
people can organize co-operatives or social production
enterprises that utilize local resources.”
He adds: “For example, if a pipeline is installed and
this borders a local fishing community, then you not only
15
OP
EC
bu
lle
tin
5–
6/0
6
provide gas from the pipeline to power generators, but
also sustainable projects that will directly aid the fishing
community. The project will create value for the commu-
nity and in turn for the people of Venezuela.”
The creation of an NDE can be viewed on a plot of
land in Gramoven, a poor suburb of Caracas. The land
was once home to the Nueva Caracas fuel distribution
plant, which belonged to PDVSA, but had been idle for
ten years. The Fabricio Ojeda Endogenus Development
Nucleus, as it is now called, opened in February 2004,
and is home to sports facilities, a clinic, a pharmacy,
a dentist, a community centre, agricultural plots and
workshops.
The pharmacy offers the community approximately
3,500 lines of pharmaceutical products, the workshops
offer skills training in the production of shoes, which are
then sold both locally and overseas, and the agricultural
plots are focused on allowing locals to replant the land
and grow organic produce. There is even talk of setting
up an organic restaurant. It is also interesting to note
that all monetary issues and decisions are debated and
taken by the local community, with everyone having an
opportunity to sit on the board of decision makers.
A helping hand
On the seventh anniversary of the Bolivarian Revolution
in February this year, Venezuelan President, Hugo
Chávez, said: “The country is growing internally
thanks to oil resources allotment made through endog-
enous development cores, development poles (local
community advancement programmes), and social
missions.”
With an additional $700m expected to be made avail-
able to existing social expenditures in 2006 — the aver-
age has been around $4m per year — further strides in
the social development of Venezuelan’s population can
be expected.
Orellana adds that the significance of these initia-
tives is both short- and long-term. He says: “Whatever
happens in the future, the political process and strate-
gies developed by President Chávez for social develop-
ment are now an integral part of Venezuela.
All sides of the political spectrum understand this and
recognize that the only future option is to take account of
the entire Venezuelan population. The oil resources are
for us all.”
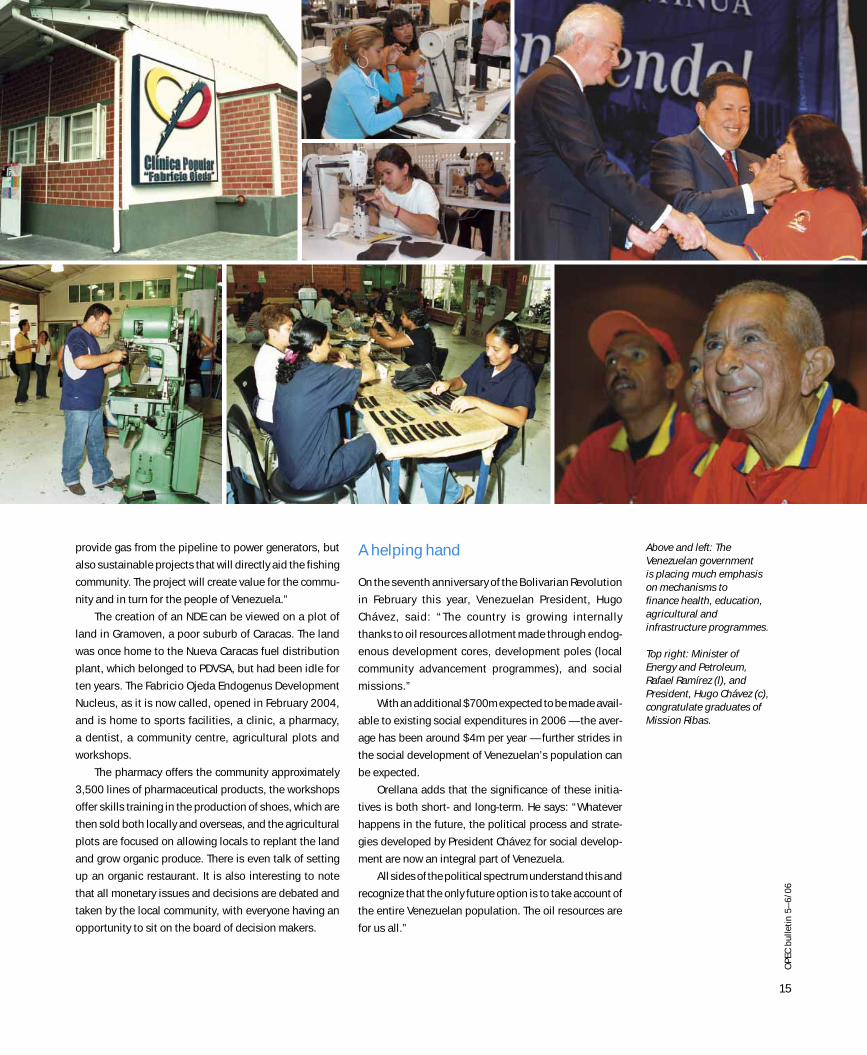
Above and left: The Venezuelan government is placing much emphasis on mechanisms to finance health, education, agricultural and infrastructure programmes.
Top right: Minister of Energy and Petroleum, Rafael Ramírez (l), and President, Hugo Chávez (c), congratulate graduates of Mission Ribas.
16
OP
EC
bu
lle
tin
5–
6/0
6C
ou
nt
ry
Pr
of
il
e
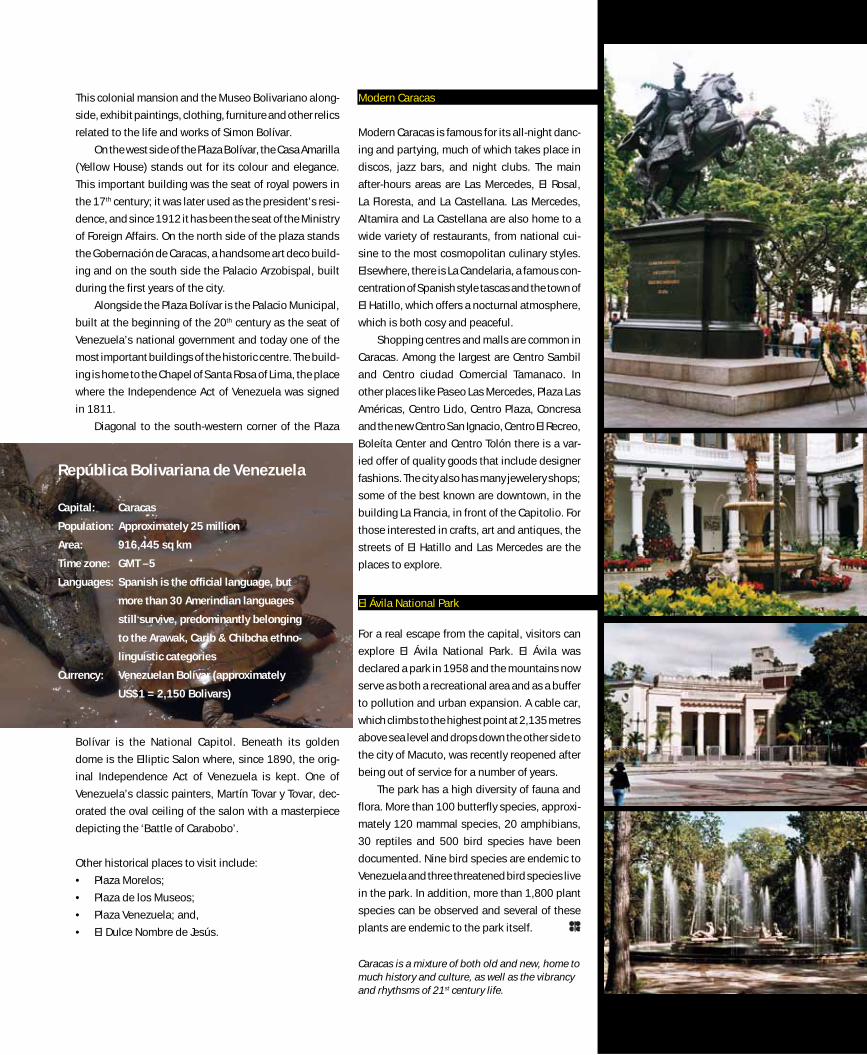
Historical Caracas
The original and historical part of the city is focused on the
Plaza Bolívar in which sits a monument of Simón Bolívar,
‘El Libertador’, which was unveiled in 1874. Bolívar was
born in Caracas in 1783 and is revered as the founding
father of Venezuelan independence. Around Plaza Bolívar
are historic sites such as Caracas Cathedral, which is home
to religious art dating back to the 17th and 18th centuries.
One of the side chapels, the Capilla de la Trinidad, is also
the resting-place of ‘El Libertador’s’ father, mother and
young wife. A block to the east of the Plaza Bolívar is the
Casa Natal de El Libertador (birthplace of El Libertador).
Out and about in CaracasOut and about in Caracas
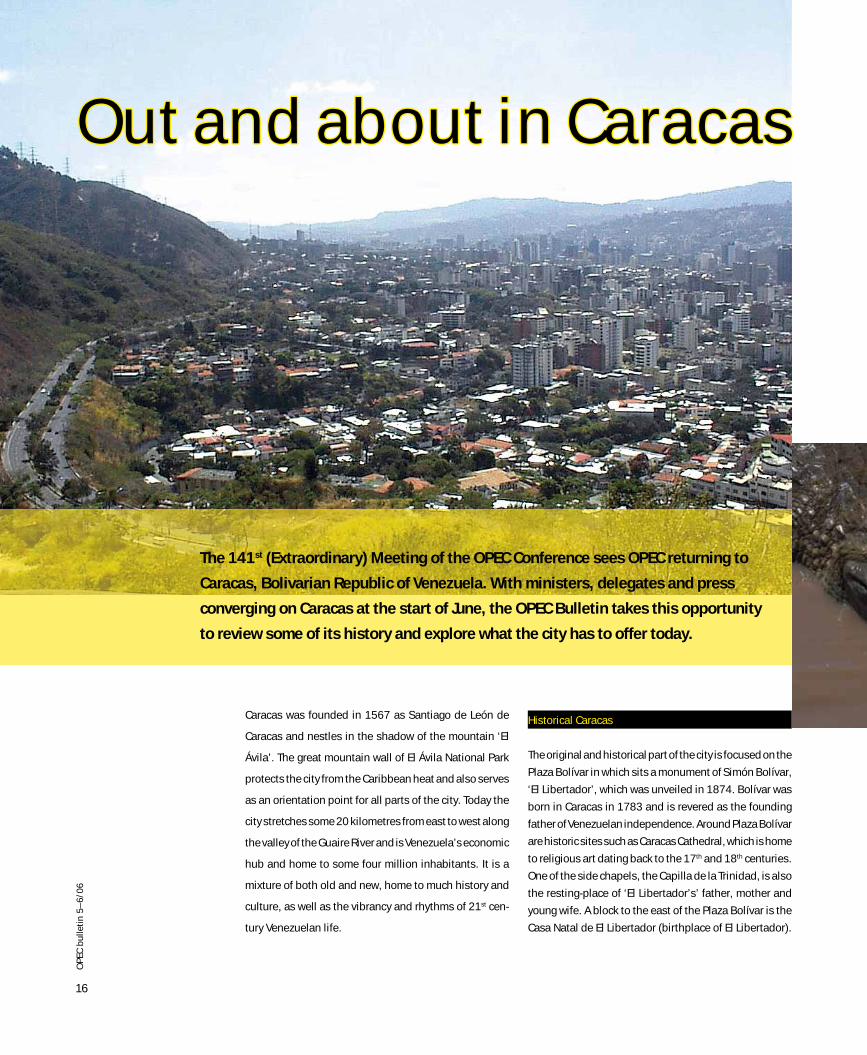
Caracas was founded in 1567 as Santiago de León de
Caracas and nestles in the shadow of the mountain ‘El
Ávila’. The great mountain wall of El Ávila National Park
protects the city from the Caribbean heat and also serves
as an orientation point for all parts of the city. Today the
city stretches some 20 kilometres from east to west along
the valley of the Guaire River and is Venezuela’s economic
hub and home to some four million inhabitants. It is a
mixture of both old and new, home to much history and
culture, as well as the vibrancy and rhythms of 21st cen-
tury Venezuelan life.
The 141st (Extraordinary) Meeting of the OPEC Conference sees OPEC returning to
Caracas, Bolivarian Republic of Venezuela. With ministers, delegates and press
converging on Caracas at the start of June, the OPEC Bulletin takes this opportunity
to review some of its history and explore what the city has to offer today.
17
OP
EC
bu
lle
tin
5–
6/0
6
This colonial mansion and the Museo Bolivariano along-
side, exhibit paintings, clothing, furniture and other relics
related to the life and works of Simon Bolívar.
On the west side of the Plaza Bolívar, the Casa Amarilla
(Yellow House) stands out for its colour and elegance.
This important building was the seat of royal powers in
the 17th century; it was later used as the president’s resi-
dence, and since 1912 it has been the seat of the Ministry
of Foreign Affairs. On the north side of the plaza stands
the Gobernación de Caracas, a handsome art deco build-
ing and on the south side the Palacio Arzobispal, built
during the first years of the city.
Alongside the Plaza Bolívar is the Palacio Municipal,
built at the beginning of the 20th century as the seat of
Venezuela’s national government and today one of the
most important buildings of the historic centre. The build-
ing is home to the Chapel of Santa Rosa of Lima, the place
where the Independence Act of Venezuela was signed
in 1811.
Diagonal to the south-western corner of the Plaza
Bolívar is the National Capitol. Beneath its golden
dome is the Elliptic Salon where, since 1890, the orig-
inal Independence Act of Venezuela is kept. One of
Venezuela’s classic painters, Martín Tovar y Tovar, dec-
orated the oval ceiling of the salon with a masterpiece
depicting the ‘Battle of Carabobo’.
Other historical places to visit include:
• Plaza Morelos;
• Plaza de los Museos;
• Plaza Venezuela; and,
• El Dulce Nombre de Jesús.
Modern Caracas
Modern Caracas is famous for its all-night danc-
ing and partying, much of which takes place in
discos, jazz bars, and night clubs. The main
after-hours areas are Las Mercedes, El Rosal,
La Floresta, and La Castellana. Las Mercedes,
Altamira and La Castellana are also home to a
wide variety of restaurants, from national cui-
sine to the most cosmopolitan culinary styles.
Elsewhere, there is La Candelaria, a famous con-
centration of Spanish style tascas and the town of
El Hatillo, which offers a nocturnal atmosphere,
which is both cosy and peaceful.
Shopping centres and malls are common in
Caracas. Among the largest are Centro Sambil
and Centro ciudad Comercial Tamanaco. In
other places like Paseo Las Mercedes, Plaza Las
Américas, Centro Lido, Centro Plaza, Concresa
and the new Centro San Ignacio, Centro El Recreo,
Boleíta Center and Centro Tolón there is a var-
ied offer of quality goods that include designer
fashions. The city also has many jewelery shops;
some of the best known are downtown, in the
building La Francia, in front of the Capitolio. For
those interested in crafts, art and antiques, the
streets of El Hatillo and Las Mercedes are the
places to explore.
El Ávila National Park
For a real escape from the capital, visitors can
explore El Ávila National Park. El Ávila was
declared a park in 1958 and the mountains now
serve as both a recreational area and as a buffer
to pollution and urban expansion. A cable car,
which climbs to the highest point at 2,135 metres
above sea level and drops down the other side to
the city of Macuto, was recently reopened after
being out of service for a number of years.
The park has a high diversity of fauna and
flora. More than 100 butterfly species, approxi-
mately 120 mammal species, 20 amphibians,
30 reptiles and 500 bird species have been
documented. Nine bird species are endemic to
Venezuela and three threatened bird species live
in the park. In addition, more than 1,800 plant
species can be observed and several of these
plants are endemic to the park itself.
Caracas is a mixture of both old and new, home to much history and culture, as well as the vibrancy and rhythsms of 21st century life.
República Bolivariana de Venezuela
Capital: Caracas
Population: Approximately 25 million
Area: 916,445 sq km
Time zone: GMT –5
Languages: Spanish is the official language, but
more than 30 Amerindian languages
still survive, predominantly belonging
to the Arawak, Carib & Chibcha ethno-
linguistic categories
Currency: Venezuelan Bolívar (approximately
US$1 = 2,150 Bolivars)
18
OP
EC
bu
lle
tin
5–
6/0
6F
ea
tu
re
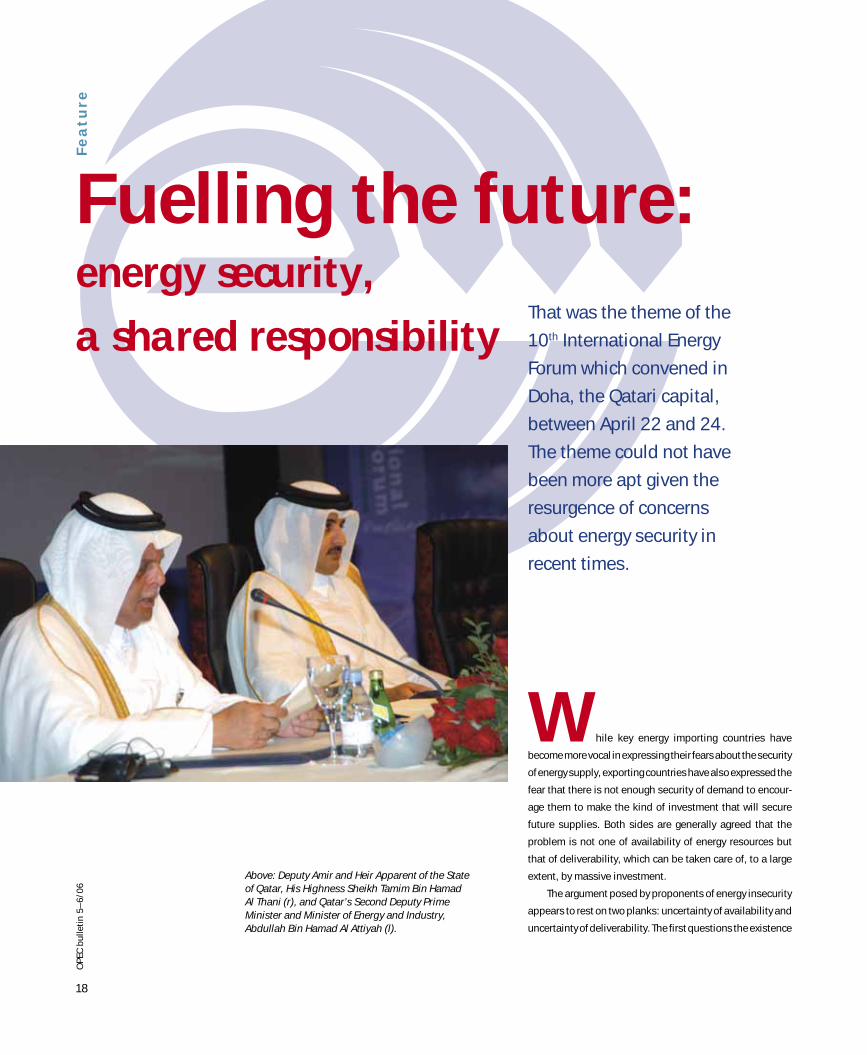
Fuelling the future:energy security,
a shared responsibility
While key energy importing countries have
become more vocal in expressing their fears about the security
of energy supply, exporting countries have also expressed the
fear that there is not enough security of demand to encour-
age them to make the kind of investment that will secure
future supplies. Both sides are generally agreed that the
problem is not one of availability of energy resources but
that of deliverability, which can be taken care of, to a large
extent, by massive investment.
The argument posed by proponents of energy insecurity
appears to rest on two planks: uncertainty of availability and
uncertainty of deliverability. The first questions the existence
Above: Deputy Amir and Heir Apparent of the State of Qatar, His Highness Sheikh Tamim Bin Hamad Al Thani (r), and Qatar’s Second Deputy Prime Minister and Minister of Energy and Industry, Abdullah Bin Hamad Al Attiyah (l).
That was the theme of the
10th International Energy
Forum which convened in
Doha, the Qatari capital,
between April 22 and 24.
The theme could not have
been more apt given the
resurgence of concerns
about energy security in
recent times.
19
OP
EC
bu
lle
tin
5–
6/0
6
of enough unconsumed resources to provide the global econ-
omy with the energy it needs in the coming decades and into
the future. The peak oil theory falls in this category.
The problem with this argument is that it is built on
an unsound premise. It assumes, in the first place, that all
locations of global reserves have been identified already
and the amount of resources in them is known. It does not,
therefore, make room for huge findings, onshore or off-
shore. Secondly it also assumes that mankind is not going
to further develop the technology of energy exploration and
exploitation. In other words, as we consume what we already
have, we are not replacing it with new findings. But neither
of these two premises is sound as more and more findings
are made by big and small companies, just as more efficient
technologies have continued to enhance resource recovery
rates in recent years.
The second plank of the argument is the uncertainty of
deliverability. This position does not question the availabil-
ity of the resources. It acknowledges that the resources are
there. What it sees as the problem is that these resources
are in places where they cannot easily be made available to
those who need it and can afford it. There are two sides to
this argument.
In the first place there is the paucity of needed invest-
ment and technology to turn the potential into real assets. This
problem was the focus of the 9th International Energy Forum
in Amsterdam in 2004. The second is the fear of political use
of resources by those who have and control it against those
who do not. This fear, partly informed by the experience of
the early 1970s, has continued to haunt many energy import-
ing countries. But that fear is simply unfounded in today’s
globalized economy. So much has changed in the last quar-
ter of a century plus. The world economy has become a lot
more interdependent and nations have come to realize that
no nation is an island. At a lower level, the uncertainty of
deliverability is informed by geopolitical tensions in impor-
tant producing and transit areas, thus making the logistics
of actual acquisition and delivery practically impossible.
These were some of the problems that the Forum sought
answers to. It was acknowledged that technology can make
a huge difference in bringing resources to the market more
cheaply, and that there is the need for investment to be
allowed to go where it is required, just as it was acknowl-
edged that for the foreseeable future there are oil and gas
resources to meet growing world demand.
Among the problems that have plagued the industry,
and which needs to be addressed in order to make energy
security a reality, is resources nationalism. And this prob-
lem is present in both producing as in consuming countries.
Whereas some energy producing countries prohibit direct
foreign investment in their energy sector, consumer coun-
tries are also known to have established impossible hurdles
for developing countries energy firms to participate in their
economies.
Part of the reason for the current concern about energy
security can be traced to the recent rise in oil prices. But the
problem did not just spring up. It was in the making since
the oil price collapse of the late 1980s. The industry did not
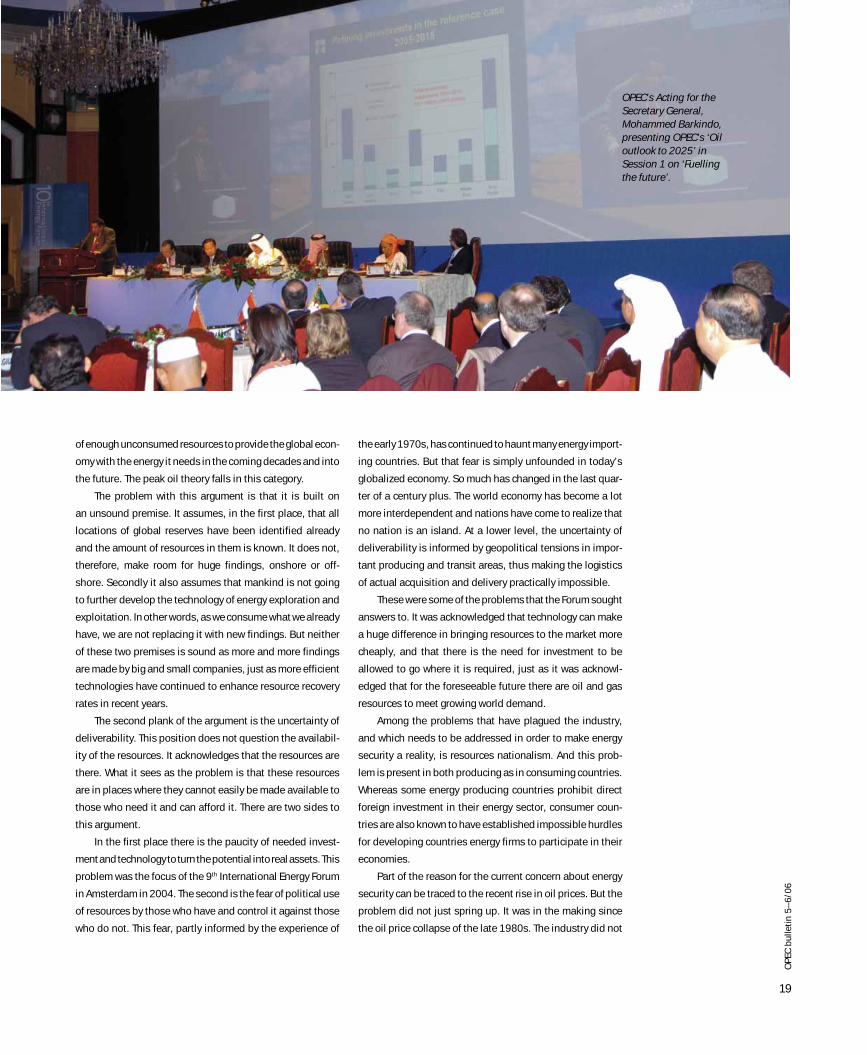
OPEC’s Acting for the Secretary General, Mohammed Barkindo, presenting OPEC’s ‘Oil outlook to 2025’ in Session 1 on ‘Fuelling the future’.
20
OP
EC
bu
lle
tin
5–
6/0
6F
ea
tu
re invest sufficiently in the upstream and downstream sectors
in the 1990s because of the experience of the late 1980s.
Indeed, up to 2000–2001, the industry was not expecting
oil prices to remain the way they were. Since it was thought
to be temporary, no investments were made. And we are
now paying the price of our failure to do the right thing at
the right time.
On the current price of oil, there was agreement that
there was ample supply in the market and that the high price
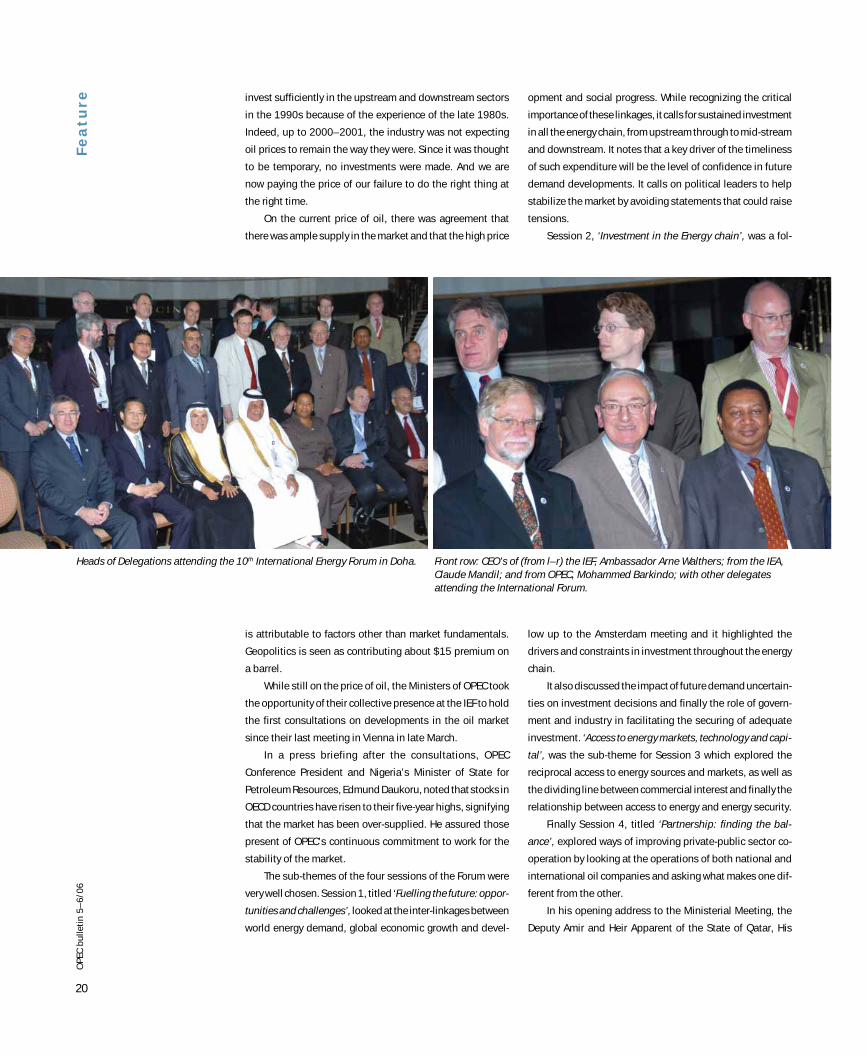
Heads of Delegations attending the 10th International Energy Forum in Doha. Front row: CEO’s of (from l–r) the IEF, Ambassador Arne Walthers; from the IEA, Claude Mandil; and from OPEC, Mohammed Barkindo; with other delegates attending the International Forum.
is attributable to factors other than market fundamentals.
Geopolitics is seen as contributing about $15 premium on
a barrel.
While still on the price of oil, the Ministers of OPEC took
the opportunity of their collective presence at the IEF to hold
the first consultations on developments in the oil market
since their last meeting in Vienna in late March.
In a press briefing after the consultations, OPEC
Conference President and Nigeria’s Minister of State for
Petroleum Resources, Edmund Daukoru, noted that stocks in
OECD countries have risen to their five-year highs, signifying
that the market has been over-supplied. He assured those
present of OPEC’s continuous commitment to work for the
stability of the market.
The sub-themes of the four sessions of the Forum were
very well chosen. Session 1, titled ‘Fuelling the future: oppor-
tunities and challenges’, looked at the inter-linkages between
world energy demand, global economic growth and devel-
opment and social progress. While recognizing the critical
importance of these linkages, it calls for sustained investment
in all the energy chain, from upstream through to mid-stream
and downstream. It notes that a key driver of the timeliness
of such expenditure will be the level of confidence in future
demand developments. It calls on political leaders to help
stabilize the market by avoiding statements that could raise
tensions.
Session 2, ‘Investment in the Energy chain’, was a fol-
low up to the Amsterdam meeting and it highlighted the
drivers and constraints in investment throughout the energy
chain.
It also discussed the impact of future demand uncertain-
ties on investment decisions and finally the role of govern-
ment and industry in facilitating the securing of adequate
investment. ‘Access to energy markets, technology and capi-
tal’, was the sub-theme for Session 3 which explored the
reciprocal access to energy sources and markets, as well as
the dividing line between commercial interest and finally the
relationship between access to energy and energy security.
Finally Session 4, titled ‘Partnership: finding the bal-
ance’, explored ways of improving private-public sector co-
operation by looking at the operations of both national and
international oil companies and asking what makes one dif-
ferent from the other.
In his opening address to the Ministerial Meeting, the
Deputy Amir and Heir Apparent of the State of Qatar, His
21
OP
EC
bu
lle
tin
5–
6/0
6
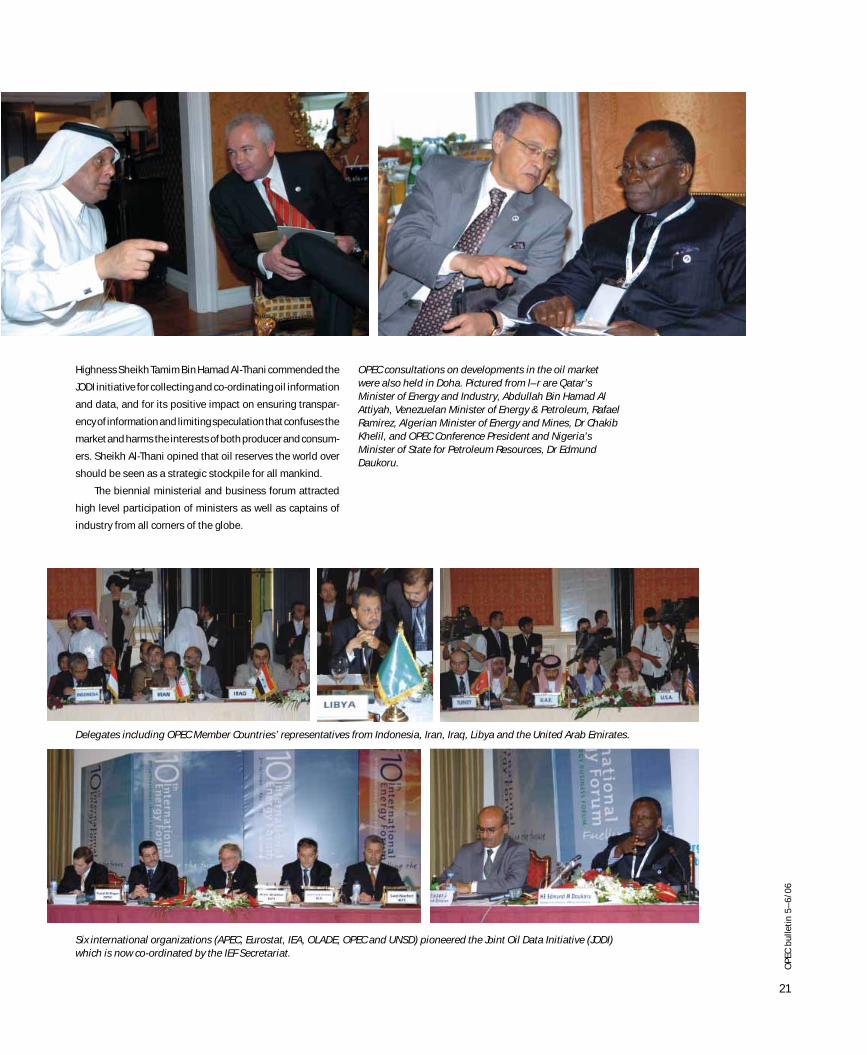
Delegates including OPEC Member Countries’ representatives from Indonesia, Iran, Iraq, Libya and the United Arab Emirates.
Highness Sheikh Tamim Bin Hamad Al-Thani commended the
JODI initiative for collecting and co-ordinating oil information
and data, and for its positive impact on ensuring transpar-
ency of information and limiting speculation that confuses the
market and harms the interests of both producer and consum-
ers. Sheikh Al-Thani opined that oil reserves the world over
should be seen as a strategic stockpile for all mankind.
The biennial ministerial and business forum attracted
high level participation of ministers as well as captains of
industry from all corners of the globe.
OPEC consultations on developments in the oil market were also held in Doha. Pictured from l–r are Qatar’s Minister of Energy and Industry, Abdullah Bin Hamad Al Attiyah, Venezuelan Minister of Energy & Petroleum, Rafael Ramirez, Algerian Minister of Energy and Mines, Dr Chakib Khelil, and OPEC Conference President and Nigeria’s Minister of State for Petroleum Resources, Dr Edmund Daukoru.
Six international organizations (APEC, Eurostat, IEA, OLADE, OPEC and UNSD) pioneered the Joint Oil Data Initiative (JODI) which is now co-ordinated by the IEF Secretariat.
22
OP
EC
bu
lle
tin
5–
6/0
6F
ea
tu
re
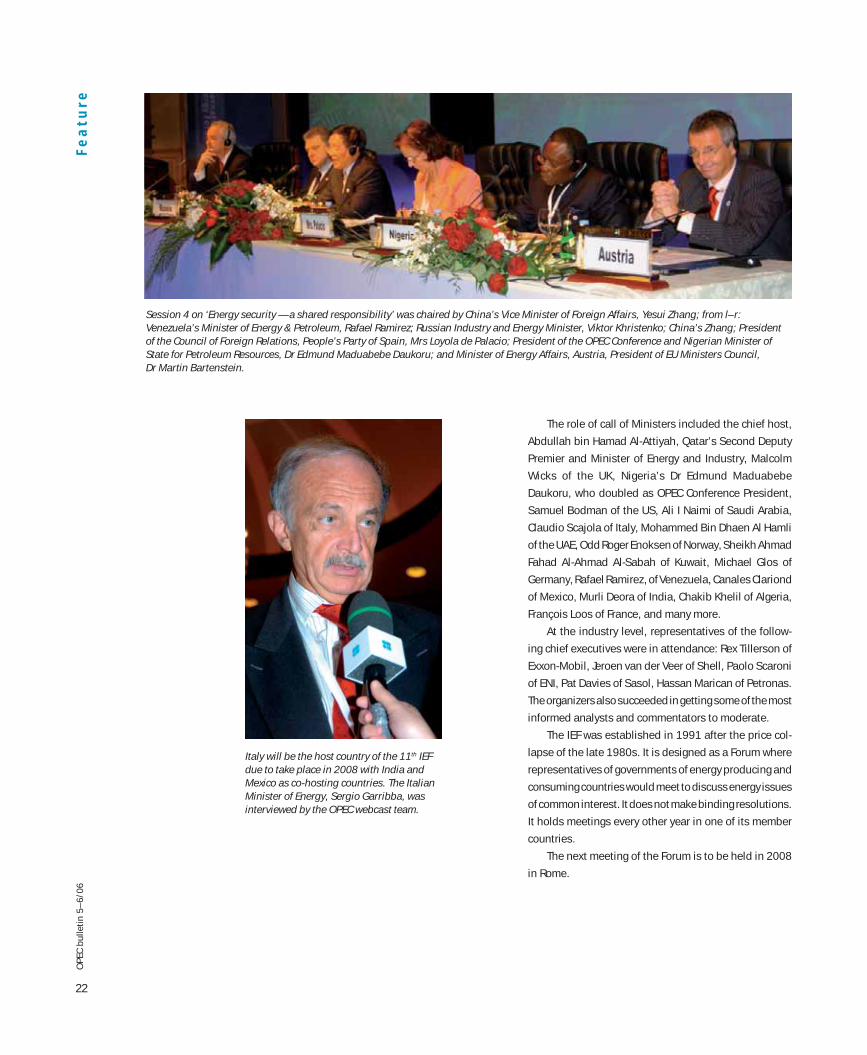
Italy will be the host country of the 11th IEF due to take place in 2008 with India and Mexico as co-hosting countries. The Italian Minister of Energy, Sergio Garribba, was interviewed by the OPEC webcast team.
Session 4 on ‘Energy security — a shared responsibility’ was chaired by China’s Vice Minister of Foreign Affairs, Yesui Zhang; from l–r: Venezuela’s Minister of Energy & Petroleum, Rafael Ramirez; Russian Industry and Energy Minister, Viktor Khristenko; China’s Zhang; President of the Council of Foreign Relations, People’s Party of Spain, Mrs Loyola de Palacio; President of the OPEC Conference and Nigerian Minister of State for Petroleum Resources, Dr Edmund Maduabebe Daukoru; and Minister of Energy Affairs, Austria, President of EU Ministers Council, Dr Martin Bartenstein.
The role of call of Ministers included the chief host,
Abdullah bin Hamad Al-Attiyah, Qatar’s Second Deputy
Premier and Minister of Energy and Industry, Malcolm
Wicks of the UK, Nigeria’s Dr Edmund Maduabebe
Daukoru, who doubled as OPEC Conference President,
Samuel Bodman of the US, Ali I Naimi of Saudi Arabia,
Claudio Scajola of Italy, Mohammed Bin Dhaen Al Hamli
of the UAE, Odd Roger Enoksen of Norway, Sheikh Ahmad
Fahad Al-Ahmad Al-Sabah of Kuwait, Michael Glos of
Germany, Rafael Ramirez, of Venezuela, Canales Clariond
of Mexico, Murli Deora of India, Chakib Khelil of Algeria,
François Loos of France, and many more.
At the industry level, representatives of the follow-
ing chief executives were in attendance: Rex Tillerson of
Exxon-Mobil, Jeroen van der Veer of Shell, Paolo Scaroni
of ENI, Pat Davies of Sasol, Hassan Marican of Petronas.
The organizers also succeeded in getting some of the most
informed analysts and commentators to moderate.
The IEF was established in 1991 after the price col-
lapse of the late 1980s. It is designed as a Forum where
representatives of governments of energy producing and
consuming countries would meet to discuss energy issues
of common interest. It does not make binding resolutions.
It holds meetings every other year in one of its member
countries.
The next meeting of the Forum is to be held in 2008
in Rome.
23
OP
EC
bu
lle
tin
5–
6/0
6
How important is the producer/consumer dialogue?
The dialogue between producers and consumers is get-
ting more and more important with increased consump-
tion of oil. It is important to have transparency and close
dialogue to be able to make a forecast on developments
in this sector. The relationship between OPEC and non-
OPEC nations is even more important because of the
increase in oil consumption.
I think the dialogue has improved and what has been done
in the last few years is in my opinion positive. To develop
this dialogue in the future it must be given priority. From
Norway’s side we are eager to push this dialogue.
How has the current oil price impacted on the development of the hydrocarbons industry in Norway?
Actually, the investment of Norwegian oil companies
is quite high and it will stay at the high level in coming
years, mainly because of high oil prices, but also because
we are developing the gas sector in Norway. Oil produc-
tion is decreasing slightly, but not as fast as we thought
it would, thanks mainly to high oil prices and bigger
investment in small fields, as well as developments in
the Barents Sea region.
On the need for partnerships:
That has been the situation in Norway since we started
our oil activity on the Continental Shelf in the late 60s.
I think the co-operation between national and interna-
tional companies is part of our success. I am sure close
dialogue between companies, dialogue between differ-
ent countries, and dialogue between producers and con-
sumers is needed
In terms of the environmental impact, what are you doing?
I think greenhouse gases are one of the main challenges
we have to deal with in the coming years. I think Norway is
doing a lot on carbon capture. Producing countries have
the possibility to use CO2 to increase oil production and
we are working on several different projects in Norway to
be able to take care of CO2 from gas-fired power plants.
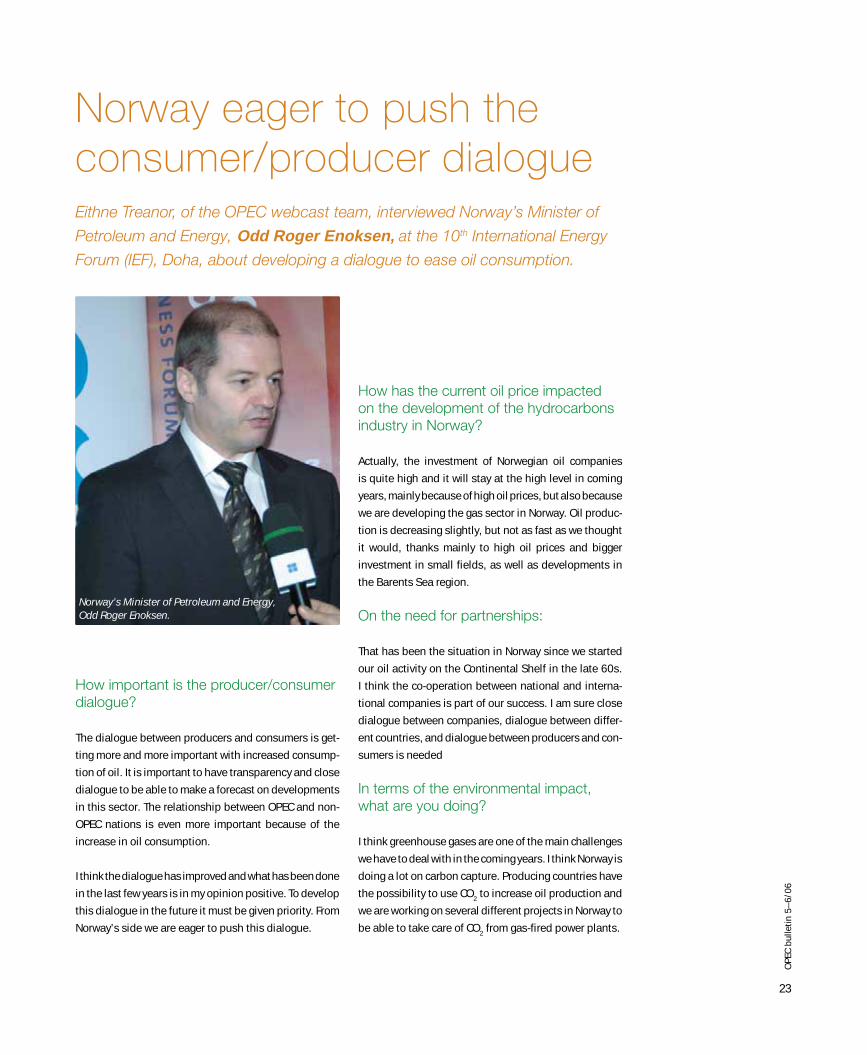
Norway eager to push the consumer/producer dialogueEithne Treanor, of the OPEC webcast team, interviewed Norway’s Minister of
Petroleum and Energy, Odd Roger Enoksen, at the 10th International Energy
Forum (IEF), Doha, about developing a dialogue to ease oil consumption.
Norway’s Minister of Petroleum and Energy, Odd Roger Enoksen.
24
OP
EC
bu
lle
tin
5–
6/0
6
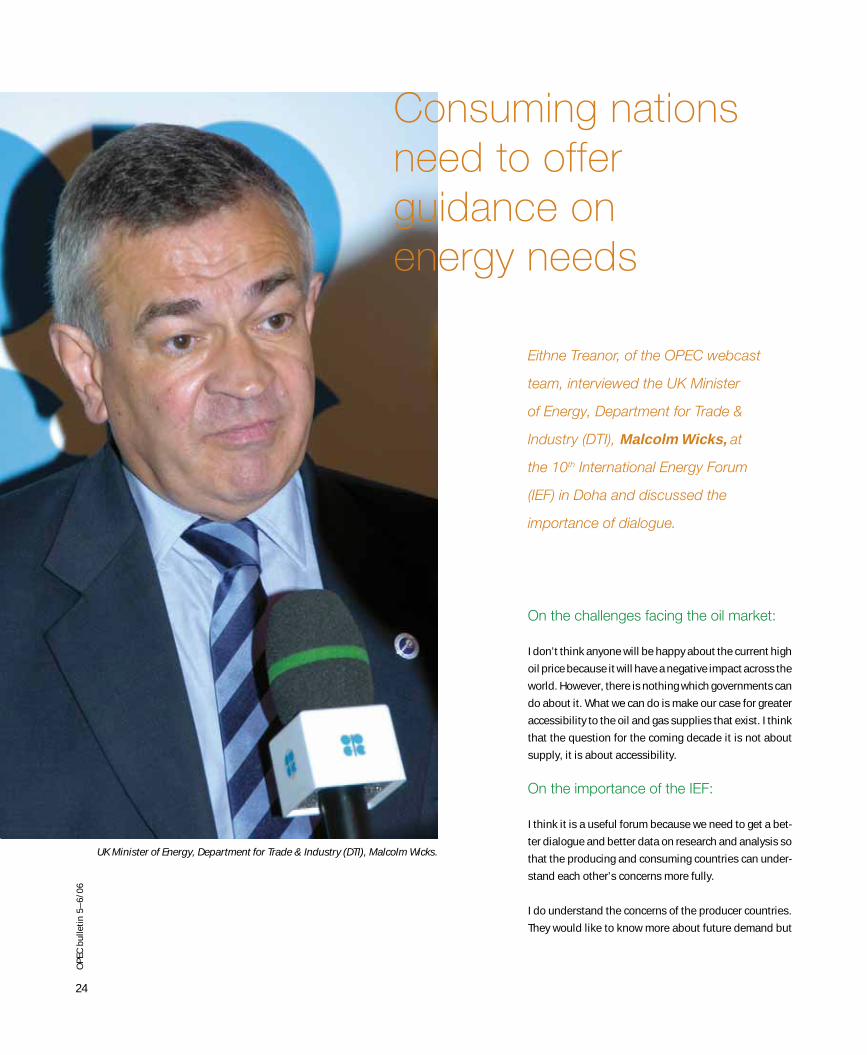
Consuming nations need to offer guidance on energy needs
Eithne Treanor, of the OPEC webcast
team, interviewed the UK Minister
of Energy, Department for Trade &
Industry (DTI), Malcolm Wicks, at
the 10th International Energy Forum
(IEF) in Doha and discussed the
importance of dialogue.
On the challenges facing the oil market:
I don’t think anyone will be happy about the current high
oil price because it will have a negative impact across the
world. However, there is nothing which governments can
do about it. What we can do is make our case for greater
accessibility to the oil and gas supplies that exist. I think
that the question for the coming decade it is not about
supply, it is about accessibility.
On the importance of the IEF:
I think it is a useful forum because we need to get a bet-
ter dialogue and better data on research and analysis so
that the producing and consuming countries can under-
stand each other’s concerns more fully.
I do understand the concerns of the producer countries.
They would like to know more about future demand but
UK Minister of Energy, Department for Trade & Industry (DTI), Malcolm Wicks.
25
OP
EC
bu
lle
tin
5–
6/0
6
we need to understand what that means, we need better
scenarios based on the best possible projections about
what demand might be in the future.
You will never get a situation where the EU or any of the
other countries that are the major consumers are going to
say exactly what demand would be. It would be foolish to
think that’s either desirable or possible. But I think there
is an onus on the consumers to produce better scenarios
of what demand might look like in the future.
The JODI initiative has been put in place. Are you encouraged by this?
Yes, I am encouraged and we need more countries to
participate. We need the greatest transparency from
both producing and consuming countries about data on
energy demand and supply.
Do you think there is sufficient investment in the oil indus-
try at the moment?
Probably not. I suppose my instinct is to say that we need
much greater investment in energy generally, not just in
oil and gas, but generally across the board. There is going
to be a huge extra investment demand in the decades to
come and I think that people need long term certainty.
We have a target around climate change and CO2 reduc-
tions for the middle of this century, 2050, and it’s that
kind of long-term goal that everyone needs — governments
need it, economies need it, and the producers need it.
Do you think there is a lot more aware-ness in terms of climate change?
Yes, I think in the UK and across EU climate change is rec-
ognized. Whereas a few years ago those people in the oil
and gas business would have been talking about energy
supply/security in maybe too narrow a way, now global
warming is the biggest threat facing our planet and is
now increasingly encroaching on discussions about oil,
gas and energy supply and demand.
The EU President has said that the environment is on top
of the agenda. Is that very encouraging for you?
Yes, I am very encouraged. Maybe 30 or so years ago oil
producers might have seen environmental issues as a
We will be burning a lot
of these fossil fuels in
the years to come, but
everyone now recognizes
that this has to be done in
an environmentally-friendly
way, using cleaner and
greener technologies such
as carbon capture and
storage.
threat to the oil industry, but there is now a recognition
that the oil, gas, coal industries worldwide have a great
future ahead of them. We will be burning a lot of these
fossil fuels in the years to come, but everyone now rec-
ognizes that this has to be done in an environmentally-
friendly way, using cleaner and greener technologies such
as carbon capture and storage.
These are things that the OPEC nations need to put on the
top of their agendas, and I think they are beginning to do
that. I am encouraged by many of the meetings I have had
with Ministers of OPEC Member Countries, and certainly
the world has to put this at the top of the agenda.
Looking at the EU footprint, how impor-tant is a concerted energy use policy?
I certainly think with the arrival of the 21st century energy
very much goes global in terms of demand and supply. We
are still as a world thinking through the implications of
that. Certainly within the EU member states we are talking
now about what kind of energy strategy we need, and that
is very much linked with a climate change challenge.
But we need to go further than that. There is no point for
the UK, which is responsible for only two per cent of CO2
emissions, tackling that problem on its own. You need to
do this internationally.
I’ve been very impressed by the dialogues the EU has had
with OPEC. There is a shared understanding about both
energy issues and climate change issues.
26
OP
EC
bu
lle
tin
5–
6/0
6F
ea
tu
re
Everyone needs to play a partto bring down prices
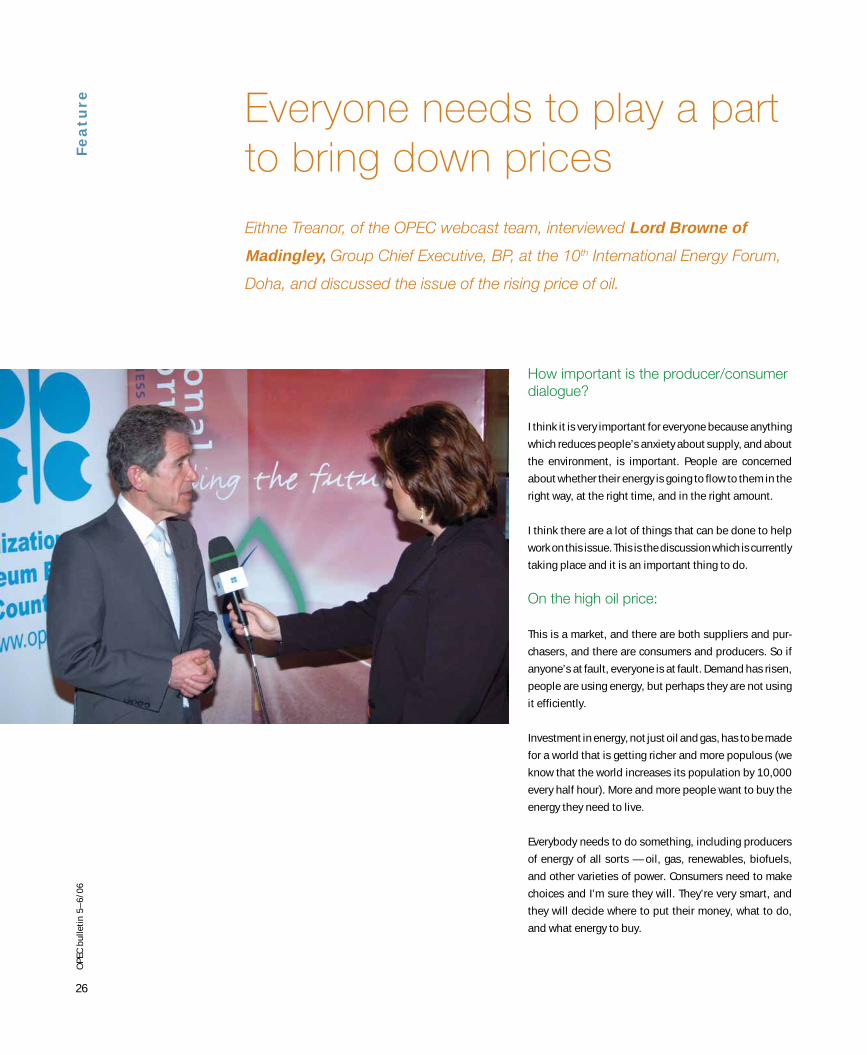
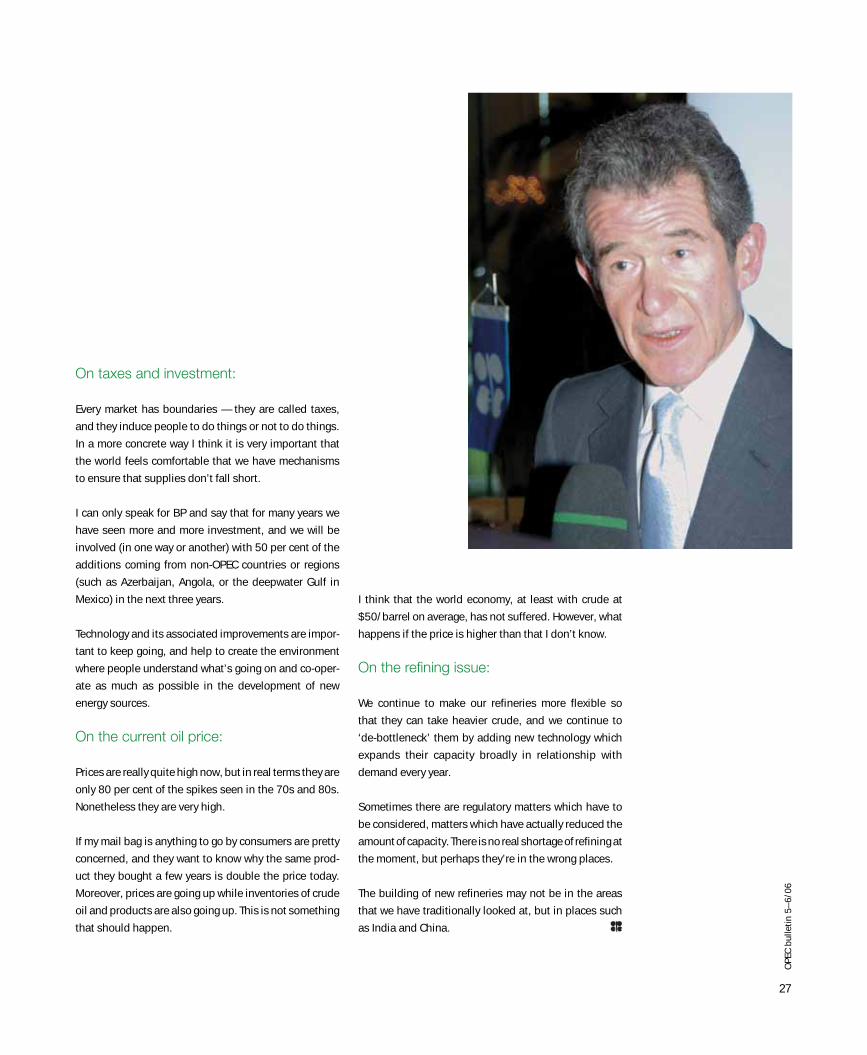
Eithne Treanor, of the OPEC webcast team, interviewed Lord Browne of
Madingley, Group Chief Executive, BP, at the 10th International Energy Forum,
Doha, and discussed the issue of the rising price of oil.
How important is the producer/consumer dialogue?
I think it is very important for everyone because anything
which reduces people’s anxiety about supply, and about
the environment, is important. People are concerned
about whether their energy is going to flow to them in the
right way, at the right time, and in the right amount.
I think there are a lot of things that can be done to help
work on this issue. This is the discussion which is currently
taking place and it is an important thing to do.
On the high oil price:
This is a market, and there are both suppliers and pur-
chasers, and there are consumers and producers. So if
anyone’s at fault, everyone is at fault. Demand has risen,
people are using energy, but perhaps they are not using
it efficiently.
Investment in energy, not just oil and gas, has to be made
for a world that is getting richer and more populous (we
know that the world increases its population by 10,000
every half hour). More and more people want to buy the
energy they need to live.
Everybody needs to do something, including producers
of energy of all sorts — oil, gas, renewables, biofuels,
and other varieties of power. Consumers need to make
choices and I’m sure they will. They’re very smart, and
they will decide where to put their money, what to do,
and what energy to buy.
27
OP
EC
bu
lle
tin
5–
6/0
6
On taxes and investment:
Every market has boundaries — they are called taxes,
and they induce people to do things or not to do things.
In a more concrete way I think it is very important that
the world feels comfortable that we have mechanisms
to ensure that supplies don’t fall short.
I can only speak for BP and say that for many years we
have seen more and more investment, and we will be
involved (in one way or another) with 50 per cent of the
additions coming from non-OPEC countries or regions
(such as Azerbaijan, Angola, or the deepwater Gulf in
Mexico) in the next three years.
Technology and its associated improvements are impor-
tant to keep going, and help to create the environment
where people understand what’s going on and co-oper-
ate as much as possible in the development of new
energy sources.
On the current oil price:
Prices are really quite high now, but in real terms they are
only 80 per cent of the spikes seen in the 70s and 80s.
Nonetheless they are very high.
If my mail bag is anything to go by consumers are pretty
concerned, and they want to know why the same prod-
uct they bought a few years is double the price today.
Moreover, prices are going up while inventories of crude
oil and products are also going up. This is not something
that should happen.
I think that the world economy, at least with crude at
$50/barrel on average, has not suffered. However, what
happens if the price is higher than that I don’t know.
On the refining issue:
We continue to make our refineries more flexible so
that they can take heavier crude, and we continue to
‘de-bottleneck’ them by adding new technology which
expands their capacity broadly in relationship with
demand every year.
Sometimes there are regulatory matters which have to
be considered, matters which have actually reduced the
amount of capacity. There is no real shortage of refining at
the moment, but perhaps they’re in the wrong places.
The building of new refineries may not be in the areas
that we have traditionally looked at, but in places such
as India and China.
28
OP
EC
bu
lle
tin
5–
6/0
6
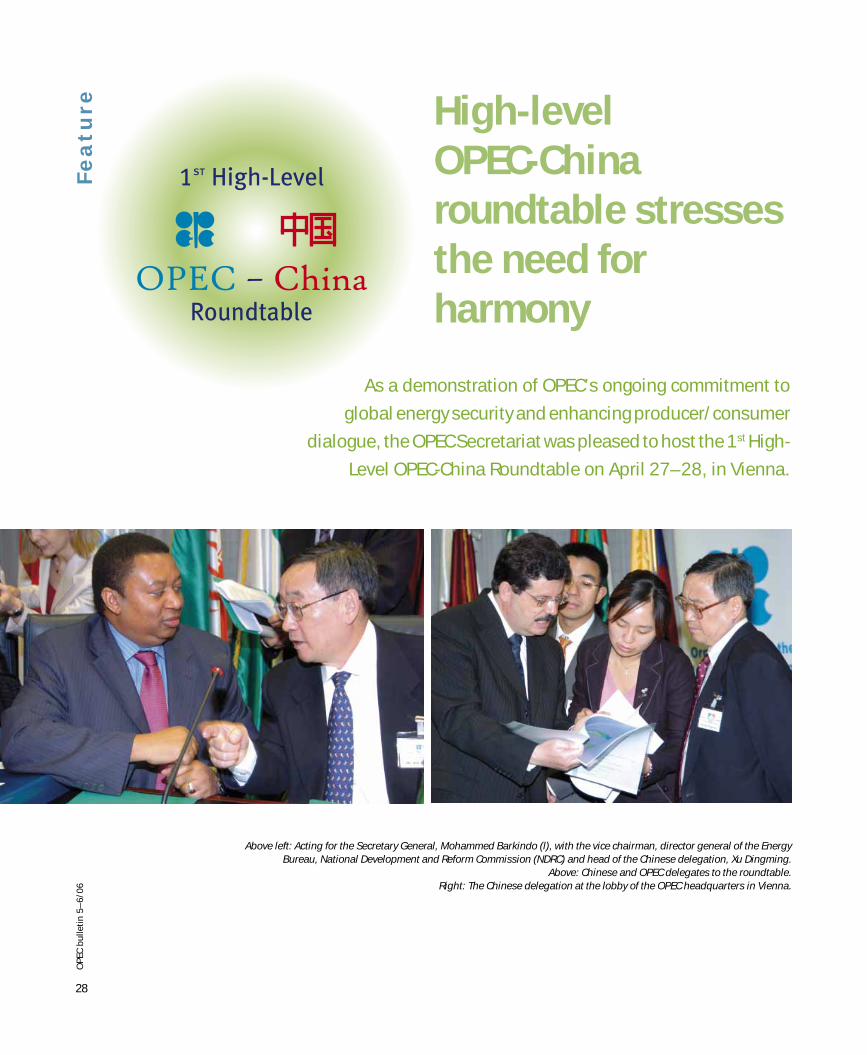
As a demonstration of OPEC’s ongoing commitment to
global energy security and enhancing producer/consumer
dialogue, the OPEC Secretariat was pleased to host the 1st High-
Level OPEC-China Roundtable on April 27–28, in Vienna.
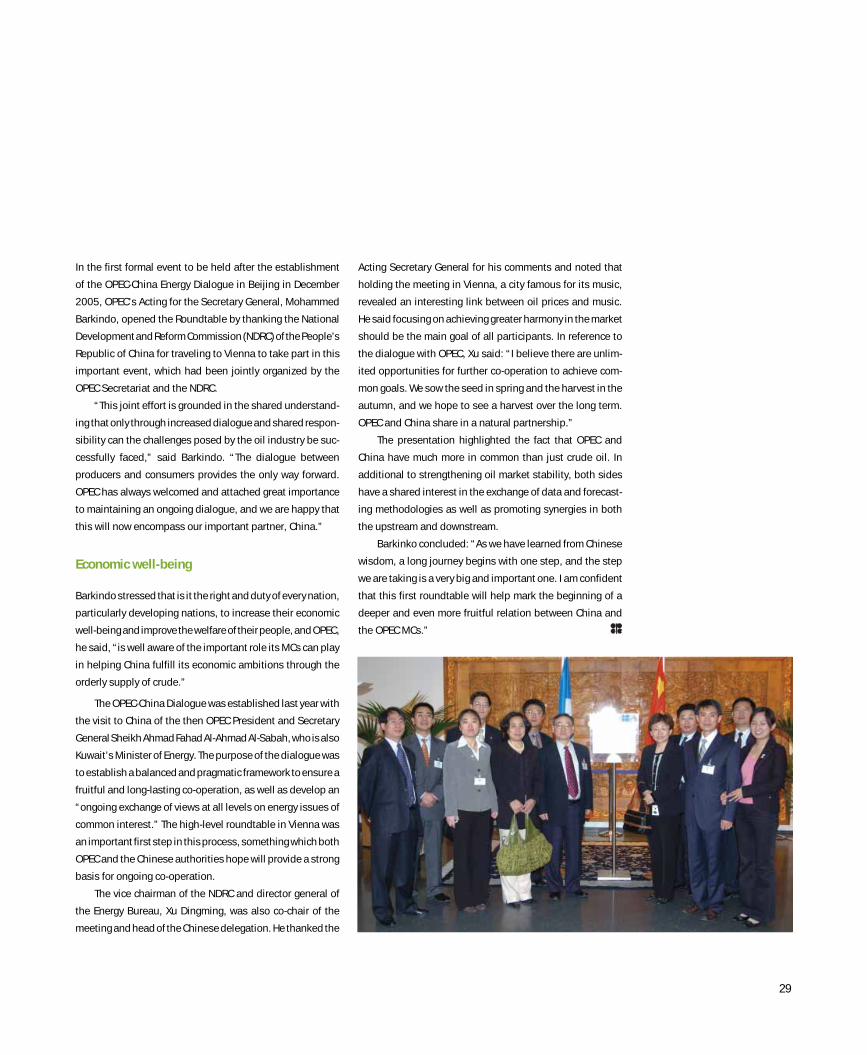
Above left: Acting for the Secretary General, Mohammed Barkindo (l), with the vice chairman, director general of the Energy Bureau, National Development and Reform Commission (NDRC) and head of the Chinese delegation, Xu Dingming.
Above: Chinese and OPEC delegates to the roundtable.Right: The Chinese delegation at the lobby of the OPEC headquarters in Vienna.
High-level
OPEC-China
roundtable stresses
the need for
harmony
Fe
at
ur
e
29
In the first formal event to be held after the establishment
of the OPEC-China Energy Dialogue in Beijing in December
2005, OPEC’s Acting for the Secretary General, Mohammed
Barkindo, opened the Roundtable by thanking the National
Development and Reform Commission (NDRC) of the People’s
Republic of China for traveling to Vienna to take part in this
important event, which had been jointly organized by the
OPEC Secretariat and the NDRC.
“This joint effort is grounded in the shared understand-
ing that only through increased dialogue and shared respon-
sibility can the challenges posed by the oil industry be suc-
cessfully faced,” said Barkindo. “The dialogue between
producers and consumers provides the only way forward.
OPEC has always welcomed and attached great importance
to maintaining an ongoing dialogue, and we are happy that
this will now encompass our important partner, China.”
Economic well-being
Barkindo stressed that is it the right and duty of every nation,
particularly developing nations, to increase their economic
well-being and improve the welfare of their people, and OPEC,
he said, “is well aware of the important role its MCs can play
in helping China fulfill its economic ambitions through the
orderly supply of crude.”
The OPEC-China Dialogue was established last year with
the visit to China of the then OPEC President and Secretary
General Sheikh Ahmad Fahad Al-Ahmad Al-Sabah, who is also
Kuwait’s Minister of Energy. The purpose of the dialogue was
to establish a balanced and pragmatic framework to ensure a
fruitful and long-lasting co-operation, as well as develop an
“ongoing exchange of views at all levels on energy issues of
common interest.” The high-level roundtable in Vienna was
an important first step in this process, something which both
OPEC and the Chinese authorities hope will provide a strong
basis for ongoing co-operation.
The vice chairman of the NDRC and director general of
the Energy Bureau, Xu Dingming, was also co-chair of the
meeting and head of the Chinese delegation. He thanked the
Acting Secretary General for his comments and noted that
holding the meeting in Vienna, a city famous for its music,
revealed an interesting link between oil prices and music.
He said focusing on achieving greater harmony in the market
should be the main goal of all participants. In reference to
the dialogue with OPEC, Xu said: “I believe there are unlim-
ited opportunities for further co-operation to achieve com-
mon goals. We sow the seed in spring and the harvest in the
autumn, and we hope to see a harvest over the long term.
OPEC and China share in a natural partnership.”
The presentation highlighted the fact that OPEC and
China have much more in common than just crude oil. In
additional to strengthening oil market stability, both sides
have a shared interest in the exchange of data and forecast-
ing methodologies as well as promoting synergies in both
the upstream and downstream.
Barkinko concluded: “As we have learned from Chinese
wisdom, a long journey begins with one step, and the step
we are taking is a very big and important one. I am confident
that this first roundtable will help mark the beginning of a
deeper and even more fruitful relation between China and
the OPEC MCs.”
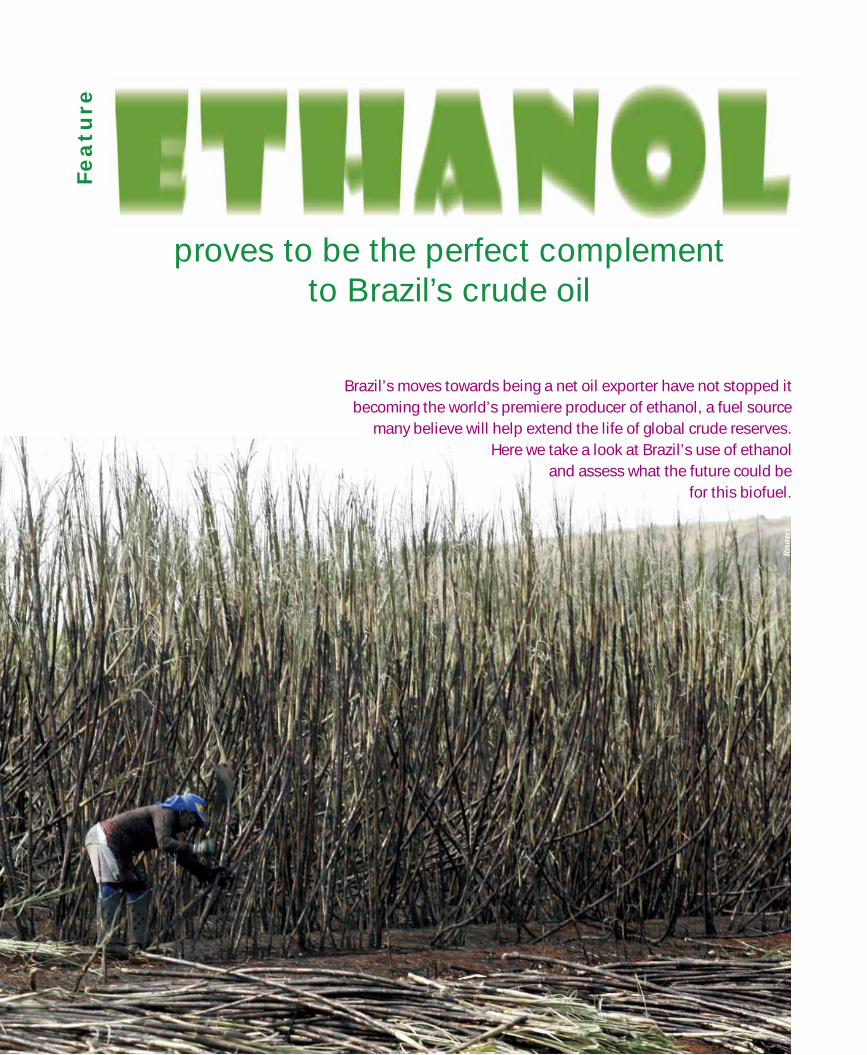
30
OP
EC
bu
lle
tin
5–
6/0
6
proves to be the perfect complementto Brazil’s crude oil
Brazil’s moves towards being a net oil exporter have not stopped it
becoming the world’s premiere producer of ethanol, a fuel source
many believe will help extend the life of global crude reserves.
Here we take a look at Brazil’s use of ethanol
and assess what the future could be
for this biofuel.
Fe
at
ur
e
Reu
ters
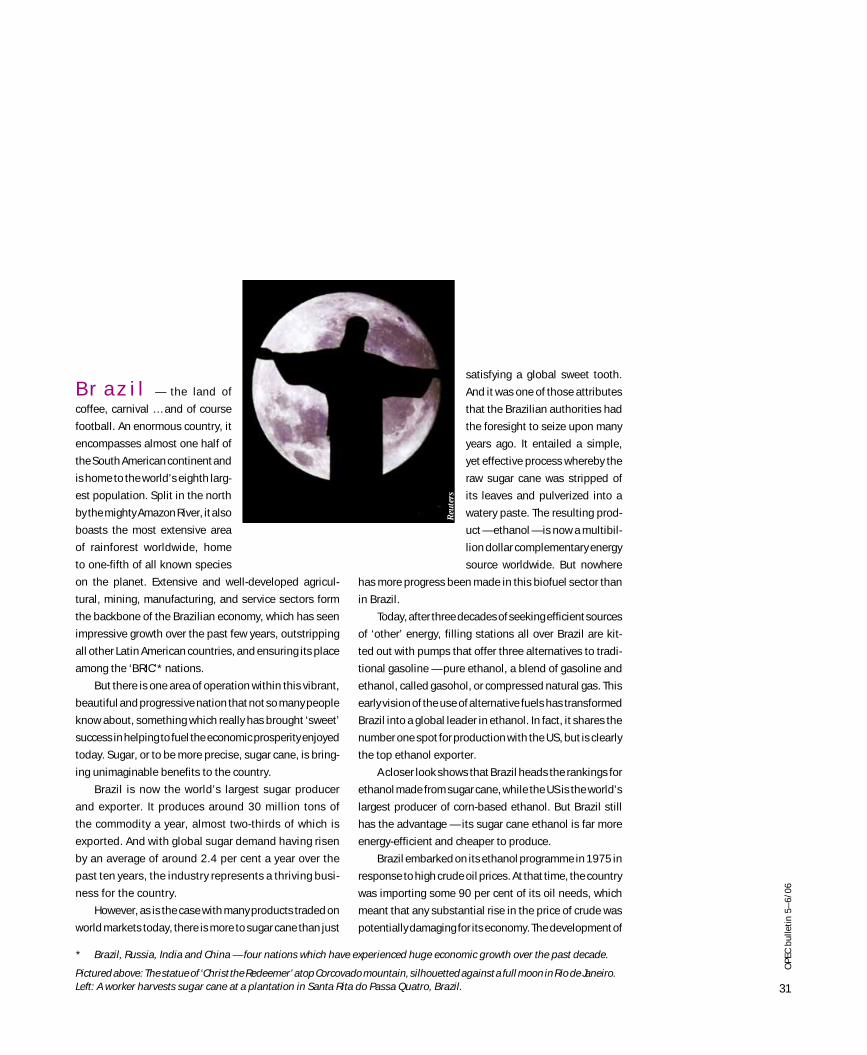
31
OP
EC
bu
lle
tin
5–
6/0
6
Brazil — the land of
coffee, carnival … and of course
football. An enormous country, it
encompasses almost one half of
the South American continent and
is home to the world’s eighth larg-
est population. Split in the north
by the mighty Amazon River, it also
boasts the most extensive area
of rainforest worldwide, home
to one-fifth of all known species
on the planet. Extensive and well-developed agricul-
tural, mining, manufacturing, and service sectors form
the backbone of the Brazilian economy, which has seen
impressive growth over the past few years, outstripping
all other Latin American countries, and ensuring its place
among the ‘BRIC’* nations.
But there is one area of operation within this vibrant,
beautiful and progressive nation that not so many people
know about, something which really has brought ‘sweet’
success in helping to fuel the economic prosperity enjoyed
today. Sugar, or to be more precise, sugar cane, is bring-
ing unimaginable benefits to the country.
Brazil is now the world’s largest sugar producer
and exporter. It produces around 30 million tons of
the commodity a year, almost two-thirds of which is
exported. And with global sugar demand having risen
by an average of around 2.4 per cent a year over the
past ten years, the industry represents a thriving busi-
ness for the country.
However, as is the case with many products traded on
world markets today, there is more to sugar cane than just
satisfying a global sweet tooth.
And it was one of those attributes
that the Brazilian authorities had
the foresight to seize upon many
years ago. It entailed a simple,
yet effective process whereby the
raw sugar cane was stripped of
its leaves and pulverized into a
watery paste. The resulting prod-
uct — ethanol — is now a multibil-
lion dollar complementary energy
source worldwide. But nowhere
has more progress been made in this biofuel sector than
in Brazil.
Today, after three decades of seeking efficient sources
of ‘other’ energy, filling stations all over Brazil are kit-
ted out with pumps that offer three alternatives to tradi-
tional gasoline — pure ethanol, a blend of gasoline and
ethanol, called gasohol, or compressed natural gas. This
early vision of the use of alternative fuels has transformed
Brazil into a global leader in ethanol. In fact, it shares the
number one spot for production with the US, but is clearly
the top ethanol exporter.
A closer look shows that Brazil heads the rankings for
ethanol made from sugar cane, while the US is the world’s
largest producer of corn-based ethanol. But Brazil still
has the advantage — its sugar cane ethanol is far more
energy-efficient and cheaper to produce.
Brazil embarked on its ethanol programme in 1975 in
response to high crude oil prices. At that time, the country
was importing some 90 per cent of its oil needs, which
meant that any substantial rise in the price of crude was
potentially damaging for its economy. The development of
* Brazil, Russia, India and China — four nations which have experienced huge economic growth over the past decade.
Pictured above: The statue of ‘Christ the Redeemer’ atop Corcovado mountain, silhouetted against a full moon in Rio de Janeiro.Left: A worker harvests sugar cane at a plantation in Santa Rita do Passa Quatro, Brazil.
Reu
ters
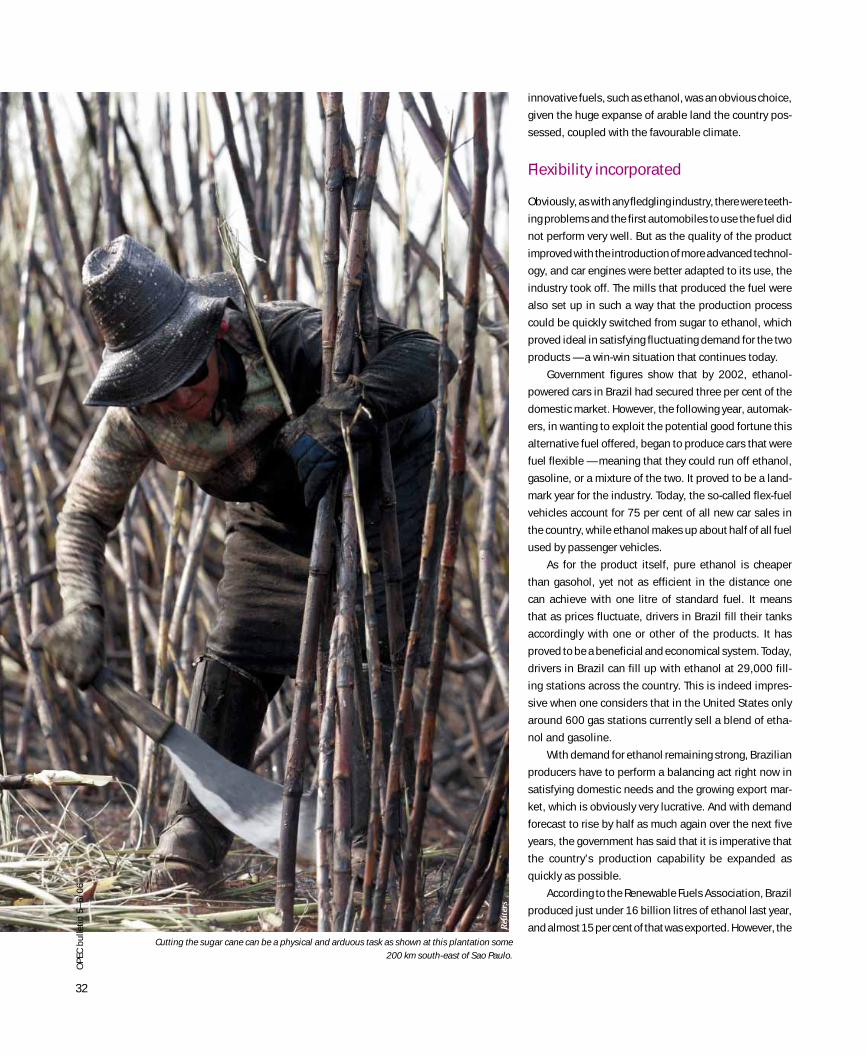
32
Fe
at
ur
e innovative fuels, such as ethanol, was an obvious choice,
given the huge expanse of arable land the country pos-
sessed, coupled with the favourable climate.
Flexibility incorporated
Obviously, as with any fledgling industry, there were teeth-
ing problems and the first automobiles to use the fuel did
not perform very well. But as the quality of the product
improved with the introduction of more advanced technol-
ogy, and car engines were better adapted to its use, the
industry took off. The mills that produced the fuel were
also set up in such a way that the production process
could be quickly switched from sugar to ethanol, which
proved ideal in satisfying fluctuating demand for the two
products — a win-win situation that continues today.
Government figures show that by 2002, ethanol-
powered cars in Brazil had secured three per cent of the
domestic market. However, the following year, automak-
ers, in wanting to exploit the potential good fortune this
alternative fuel offered, began to produce cars that were
fuel flexible — meaning that they could run off ethanol,
gasoline, or a mixture of the two. It proved to be a land-
mark year for the industry. Today, the so-called flex-fuel
vehicles account for 75 per cent of all new car sales in
the country, while ethanol makes up about half of all fuel
used by passenger vehicles.
As for the product itself, pure ethanol is cheaper
than gasohol, yet not as efficient in the distance one
can achieve with one litre of standard fuel. It means
that as prices fluctuate, drivers in Brazil fill their tanks
accordingly with one or other of the products. It has
proved to be a beneficial and economical system. Today,
drivers in Brazil can fill up with ethanol at 29,000 fill-
ing stations across the country. This is indeed impres-
sive when one considers that in the United States only
around 600 gas stations currently sell a blend of etha-
nol and gasoline.
With demand for ethanol remaining strong, Brazilian
producers have to perform a balancing act right now in
satisfying domestic needs and the growing export mar-
ket, which is obviously very lucrative. And with demand
forecast to rise by half as much again over the next five
years, the government has said that it is imperative that
the country’s production capability be expanded as
quickly as possible.
According to the Renewable Fuels Association, Brazil
produced just under 16 billion litres of ethanol last year,
and almost 15 per cent of that was exported. However, the
OP
EC
bu
lle
tin
5–
6/0
6
Reu
ters
Cutting the sugar cane can be a physical and arduous task as shown at this plantation some
200 km south-east of Sao Paulo.
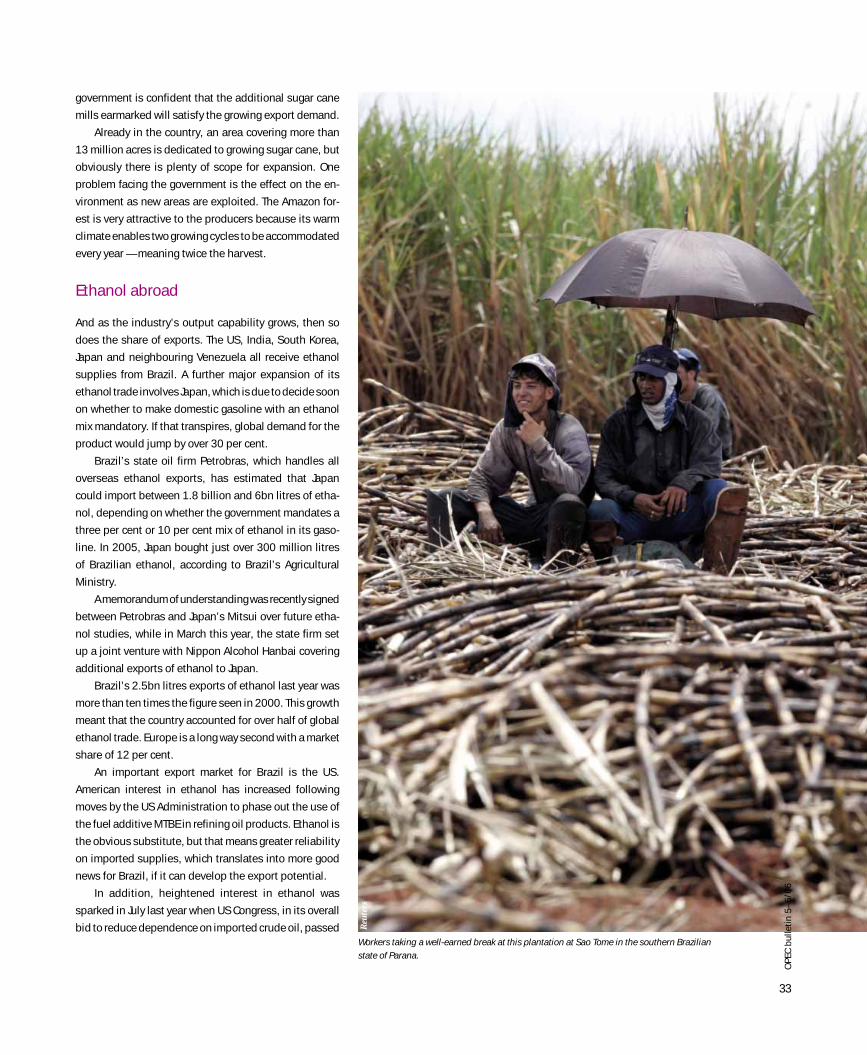
33
government is confident that the additional sugar cane
mills earmarked will satisfy the growing export demand.
Already in the country, an area covering more than
13 million acres is dedicated to growing sugar cane, but
obviously there is plenty of scope for expansion. One
problem facing the government is the effect on the en-
vironment as new areas are exploited. The Amazon for-
est is very attractive to the producers because its warm
climate enables two growing cycles to be accommodated
every year — meaning twice the harvest.
Ethanol abroad
And as the industry’s output capability grows, then so
does the share of exports. The US, India, South Korea,
Japan and neighbouring Venezuela all receive ethanol
supplies from Brazil. A further major expansion of its
ethanol trade involves Japan, which is due to decide soon
on whether to make domestic gasoline with an ethanol
mix mandatory. If that transpires, global demand for the
product would jump by over 30 per cent.
Brazil’s state oil firm Petrobras, which handles all
overseas ethanol exports, has estimated that Japan
could import between 1.8 billion and 6bn litres of etha-
nol, depending on whether the government mandates a
three per cent or 10 per cent mix of ethanol in its gaso-
line. In 2005, Japan bought just over 300 million litres
of Brazilian ethanol, according to Brazil’s Agricultural
Ministry.
A memorandum of understanding was recently signed
between Petrobras and Japan’s Mitsui over future etha-
nol studies, while in March this year, the state firm set
up a joint venture with Nippon Alcohol Hanbai covering
additional exports of ethanol to Japan.
Brazil’s 2.5bn litres exports of ethanol last year was
more than ten times the figure seen in 2000. This growth
meant that the country accounted for over half of global
ethanol trade. Europe is a long way second with a market
share of 12 per cent.
An important export market for Brazil is the US.
American interest in ethanol has increased following
moves by the US Administration to phase out the use of
the fuel additive MTBE in refining oil products. Ethanol is
the obvious substitute, but that means greater reliability
on imported supplies, which translates into more good
news for Brazil, if it can develop the export potential.
In addition, heightened interest in ethanol was
sparked in July last year when US Congress, in its overall
bid to reduce dependence on imported crude oil, passed
OP
EC
bu
lle
tin
5–
6/0
6
Reu
ters
Workers taking a well-earned break at this plantation at Sao Tome in the southern Brazilian
state of Parana.
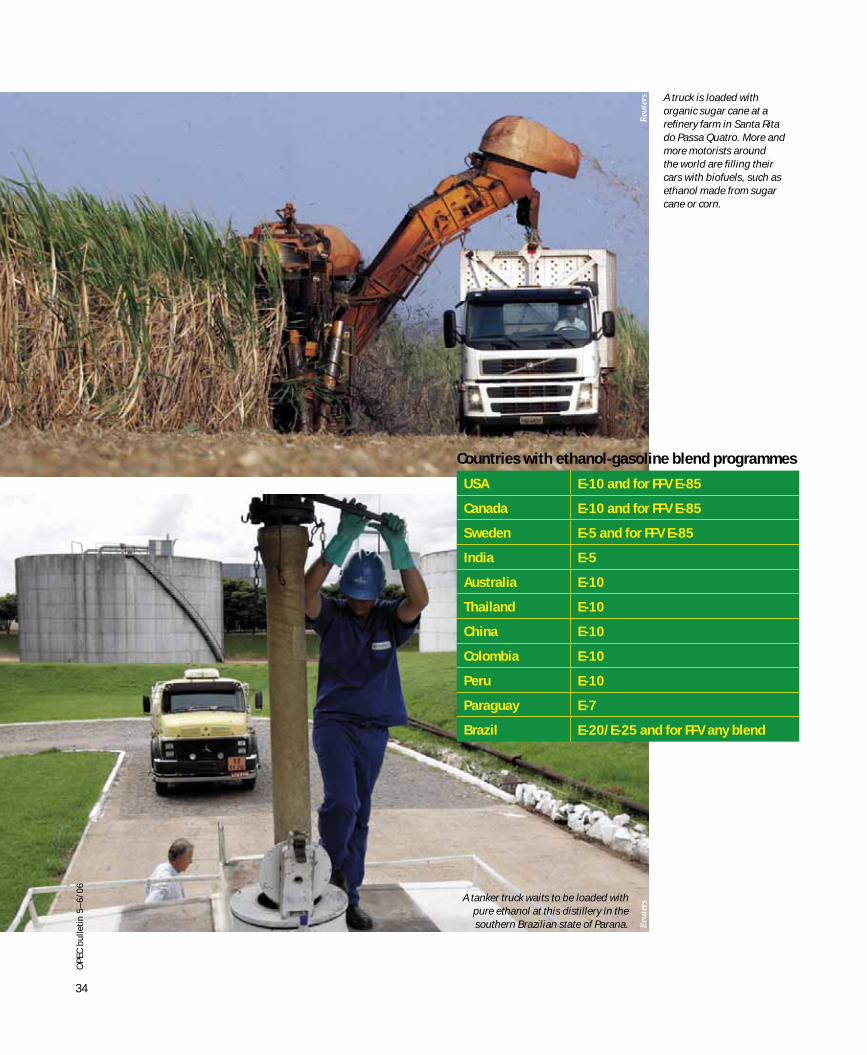
34
Fe
at
ur
e
Countries with ethanol-gasoline blend programmes
USA E-10 and for FFV E-85
Canada E-10 and for FFV E-85
Sweden E-5 and for FFV E-85
India E-5
Australia E-10
Thailand E-10
China E-10
Colombia E-10
Peru E-10
Paraguay E-7
Brazil E-20/E-25 and for FFV any blend
OP
EC
bu
lle
tin
5–
6/0
6
Reu
ters
Reu
ters
A truck is loaded with organic sugar cane at a refinery farm in Santa Rita do Passa Quatro. More and more motorists around the world are filling their cars with biofuels, such as ethanol made from sugar cane or corn.
A tanker truck waits to be loaded with pure ethanol at this distillery in the southern Brazilian state of Parana.
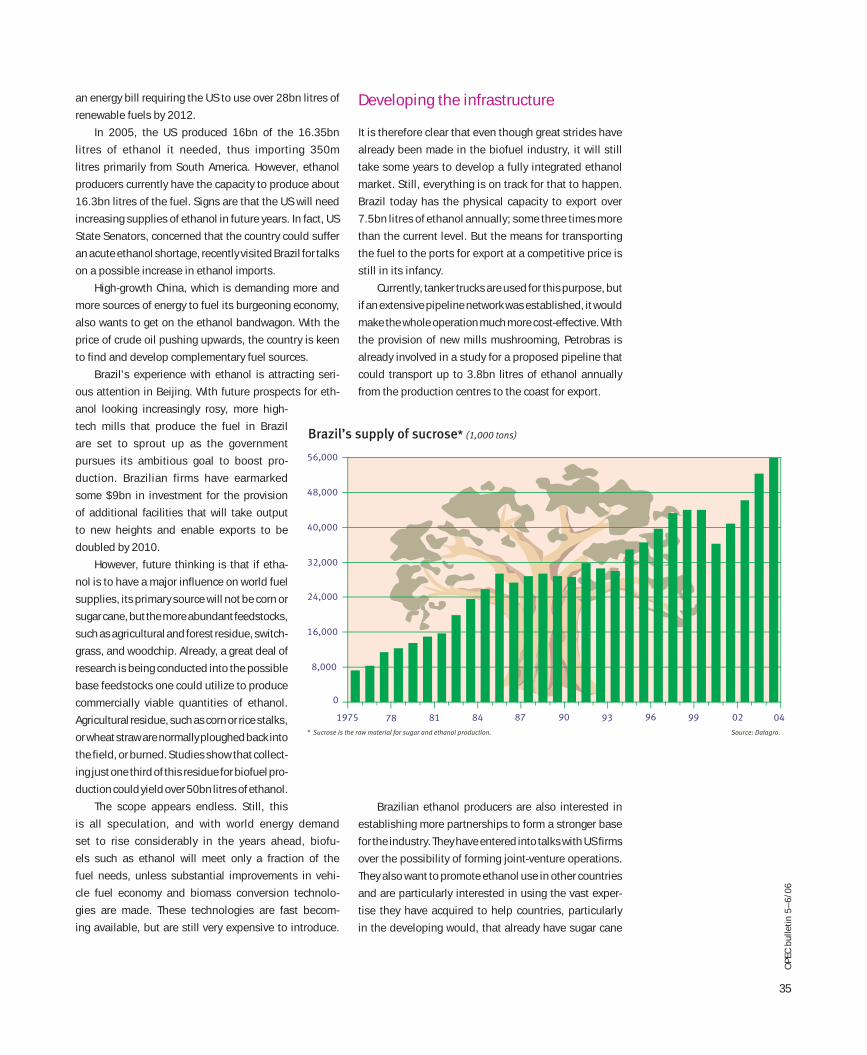
35
OP
EC
bu
lle
tin
5–
6/0
6
0
8,000
16,000
24,000
32,000
40,000
48,000
56,000
Brazil’s supply of sucrose* (1,000 tons)
* Sucrose is the raw material for sugar and ethanol production.
1975 78 81 84 87 90 93 96 99 02 04
Source: Datagro.
an energy bill requiring the US to use over 28bn litres of
renewable fuels by 2012.
In 2005, the US produced 16bn of the 16.35bn
litres of ethanol it needed, thus importing 350m
litres primarily from South America. However, ethanol
producers currently have the capacity to produce about
16.3bn litres of the fuel. Signs are that the US will need
increasing supplies of ethanol in future years. In fact, US
State Senators, concerned that the country could suffer
an acute ethanol shortage, recently visited Brazil for talks
on a possible increase in ethanol imports.
High-growth China, which is demanding more and
more sources of energy to fuel its burgeoning economy,
also wants to get on the ethanol bandwagon. With the
price of crude oil pushing upwards, the country is keen
to find and develop complementary fuel sources.
Brazil’s experience with ethanol is attracting seri-
ous attention in Beijing. With future prospects for eth-
anol looking increasingly rosy, more high-
tech mills that produce the fuel in Brazil
are set to sprout up as the government
pursues its ambitious goal to boost pro-
duction. Brazilian firms have earmarked
some $9bn in investment for the provision
of additional facilities that will take output
to new heights and enable exports to be
doubled by 2010.
However, future thinking is that if etha-
nol is to have a major influence on world fuel
supplies, its primary source will not be corn or
sugar cane, but the more abundant feedstocks,
such as agricultural and forest residue, switch-
grass, and woodchip. Already, a great deal of
research is being conducted into the possible
base feedstocks one could utilize to produce
commercially viable quantities of ethanol.
Agricultural residue, such as corn or rice stalks,
or wheat straw are normally ploughed back into
the field, or burned. Studies show that collect-
ing just one third of this residue for biofuel pro-
duction could yield over 50bn litres of ethanol.
The scope appears endless. Still, this
is all speculation, and with world energy demand
set to rise considerably in the years ahead, biofu-
els such as ethanol will meet only a fraction of the
fuel needs, unless substantial improvements in vehi-
cle fuel economy and biomass conversion technolo-
gies are made. These technologies are fast becom-
ing available, but are still very expensive to introduce.
Developing the infrastructure
It is therefore clear that even though great strides have
already been made in the biofuel industry, it will still
take some years to develop a fully integrated ethanol
market. Still, everything is on track for that to happen.
Brazil today has the physical capacity to export over
7.5bn litres of ethanol annually; some three times more
than the current level. But the means for transporting
the fuel to the ports for export at a competitive price is
still in its infancy.
Currently, tanker trucks are used for this purpose, but
if an extensive pipeline network was established, it would
make the whole operation much more cost-effective. With
the provision of new mills mushrooming, Petrobras is
already involved in a study for a proposed pipeline that
could transport up to 3.8bn litres of ethanol annually
from the production centres to the coast for export.
Brazilian ethanol producers are also interested in
establishing more partnerships to form a stronger base
for the industry. They have entered into talks with US firms
over the possibility of forming joint-venture operations.
They also want to promote ethanol use in other countries
and are particularly interested in using the vast exper-
tise they have acquired to help countries, particularly
in the developing would, that already have sugar cane
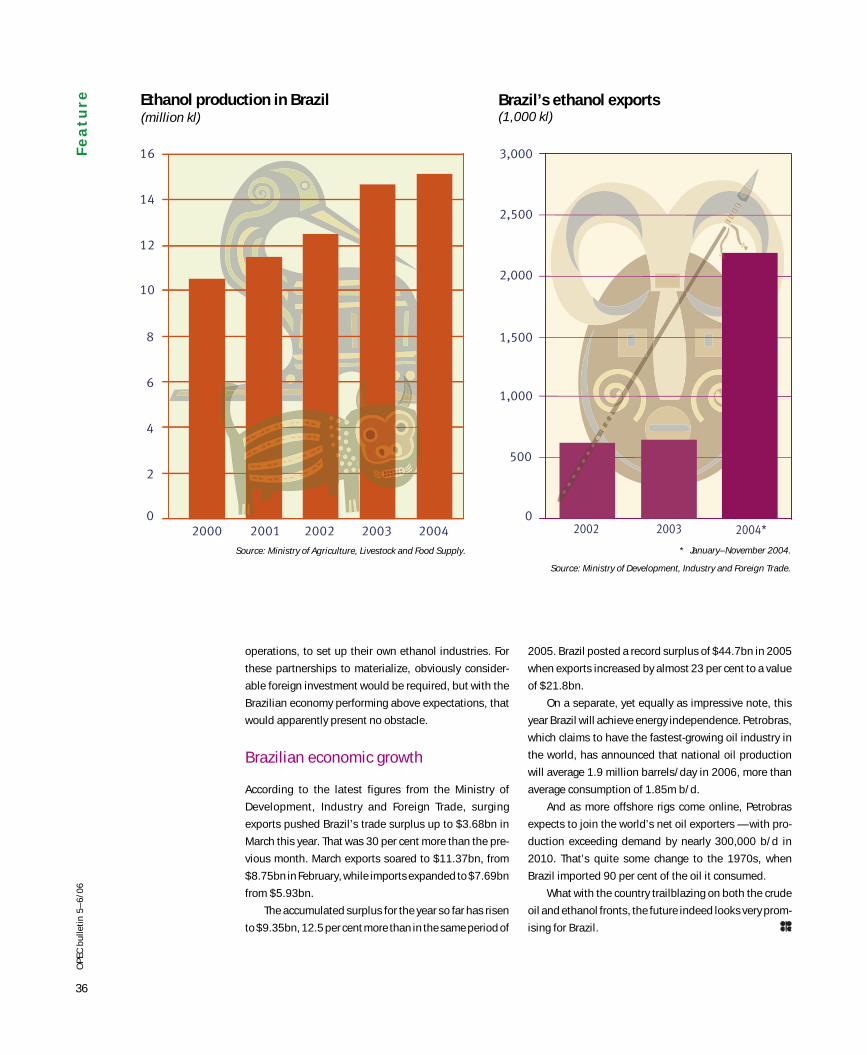
36
OP
EC
bu
lle
tin
5–
6/0
6
operations, to set up their own ethanol industries. For
these partnerships to materialize, obviously consider-
able foreign investment would be required, but with the
Brazilian economy performing above expectations, that
would apparently present no obstacle.
Brazilian economic growth
According to the latest figures from the Ministry of
Development, Industry and Foreign Trade, surging
exports pushed Brazil’s trade surplus up to $3.68bn in
March this year. That was 30 per cent more than the pre-
vious month. March exports soared to $11.37bn, from
$8.75bn in February, while imports expanded to $7.69bn
from $5.93bn.
The accumulated surplus for the year so far has risen
to $9.35bn, 12.5 per cent more than in the same period of
2005. Brazil posted a record surplus of $44.7bn in 2005
when exports increased by almost 23 per cent to a value
of $21.8bn.
On a separate, yet equally as impressive note, this
year Brazil will achieve energy independence. Petrobras,
which claims to have the fastest-growing oil industry in
the world, has announced that national oil production
will average 1.9 million barrels/day in 2006, more than
average consumption of 1.85m b/d.
And as more offshore rigs come online, Petrobras
expects to join the world’s net oil exporters — with pro-
duction exceeding demand by nearly 300,000 b/d in
2010. That’s quite some change to the 1970s, when
Brazil imported 90 per cent of the oil it consumed.
What with the country trailblazing on both the crude
oil and ethanol fronts, the future indeed looks very prom-
ising for Brazil.
0
2
4
6
8
10
12
14
16
2000 2001 2002 2003 2004
(million kl)
Source: Ministry of Agriculture, Livestock and Food Supply.
Ethanol production in Brazil
0
500
1,000
1,500
2,000
2,500
3,000
2002 2003 2004*
Source: Ministry of Development, Industry and Foreign Trade.
* January–November 2004.
Brazil’s ethanol exports(1,000 kl)
Fe
at
ur
e
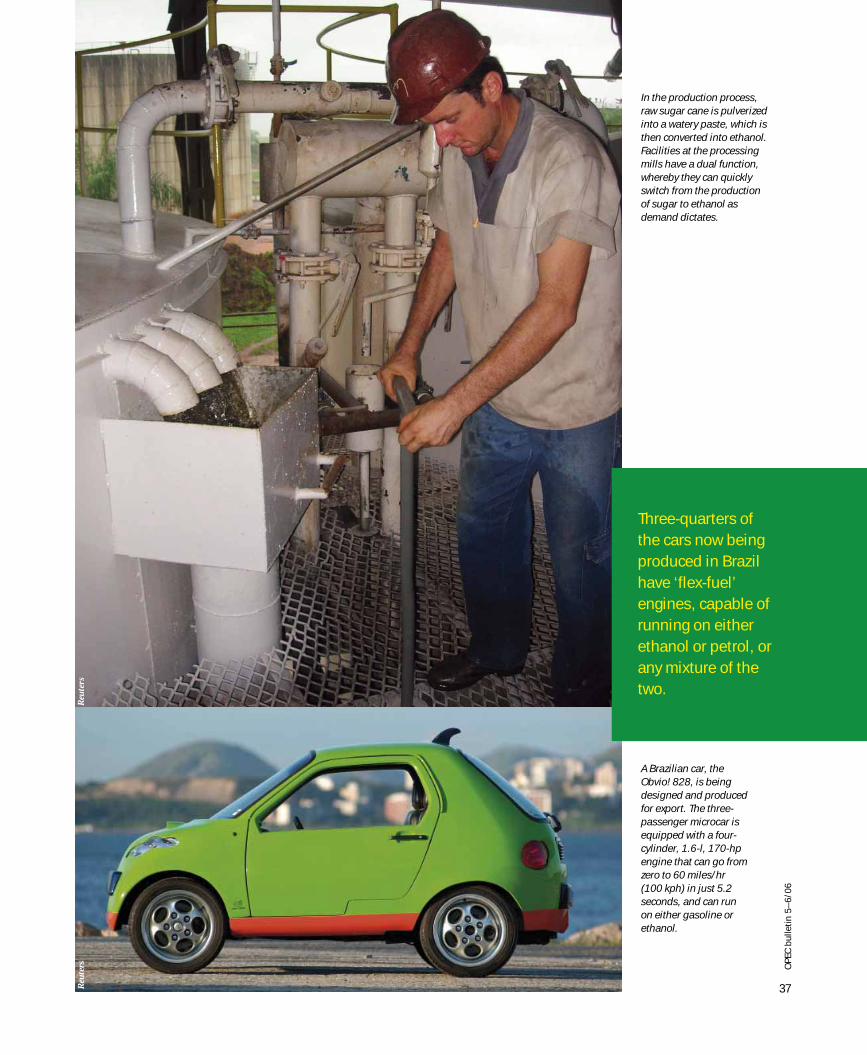
37
OP
EC
bu
lle
tin
5–
6/0
6
In the production process, raw sugar cane is pulverized into a watery paste, which is then converted into ethanol. Facilities at the processing mills have a dual function, whereby they can quickly switch from the production of sugar to ethanol as demand dictates.
A Brazilian car, the Obvio! 828, is being designed and produced for export. The three-passenger microcar is equipped with a four-cylinder, 1.6-l, 170-hp engine that can go from zero to 60 miles/hr (100 kph) in just 5.2 seconds, and can run on either gasoline or ethanol.
Reu
ters
Reu
ters
Three-quarters of
the cars now being
produced in Brazil
have ‘flex-fuel’
engines, capable of
running on either
ethanol or petrol, or
any mixture of the
two.
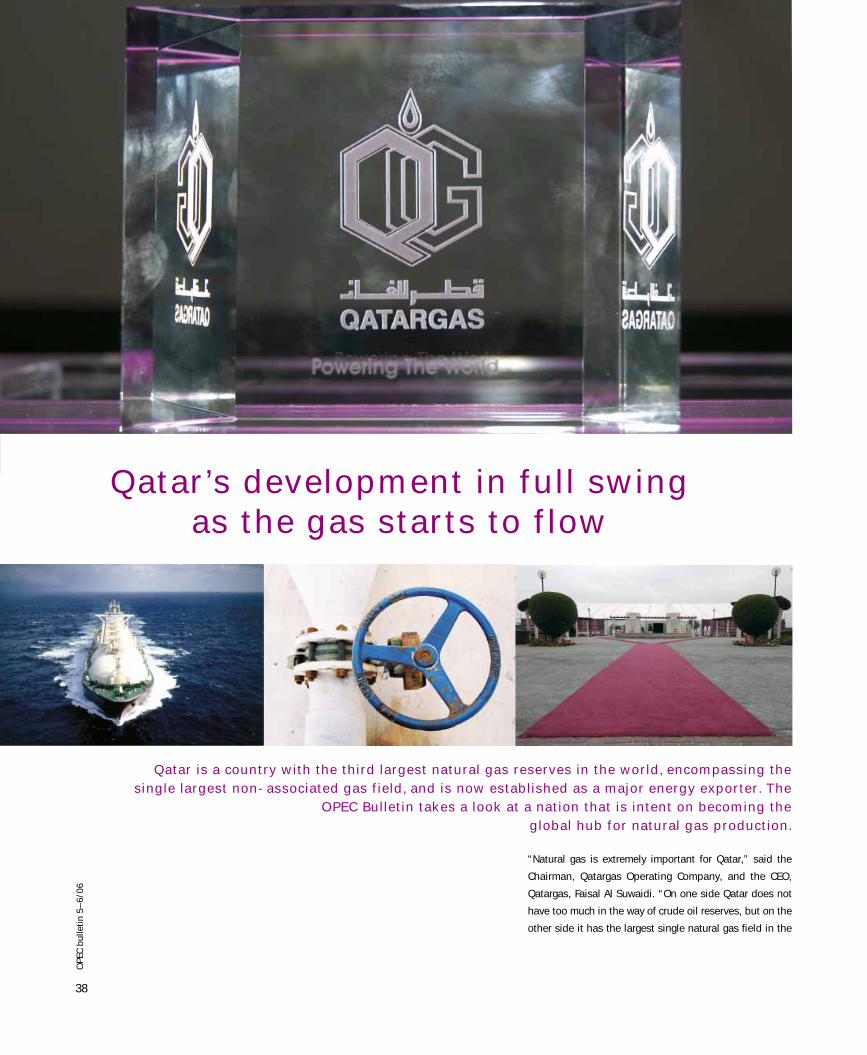
38
OP
EC
bu
lle
tin
5–
6/0
6F
ea
tu
re
“Natural gas is extremely important for Qatar,” said the
Chairman, Qatargas Operating Company, and the CEO,
Qatargas, Faisal Al Suwaidi. “On one side Qatar does not
have too much in the way of crude oil reserves, but on the
other side it has the largest single natural gas field in the
Qatar’s development in full swingas the gas starts to flow
Qatar is a country with the third largest natural gas reserves in the world, encompassing the single largest non-associated gas field, and is now established as a major energy exporter. The
OPEC Bulletin takes a look at a nation that is intent on becoming theglobal hub for natural gas production.
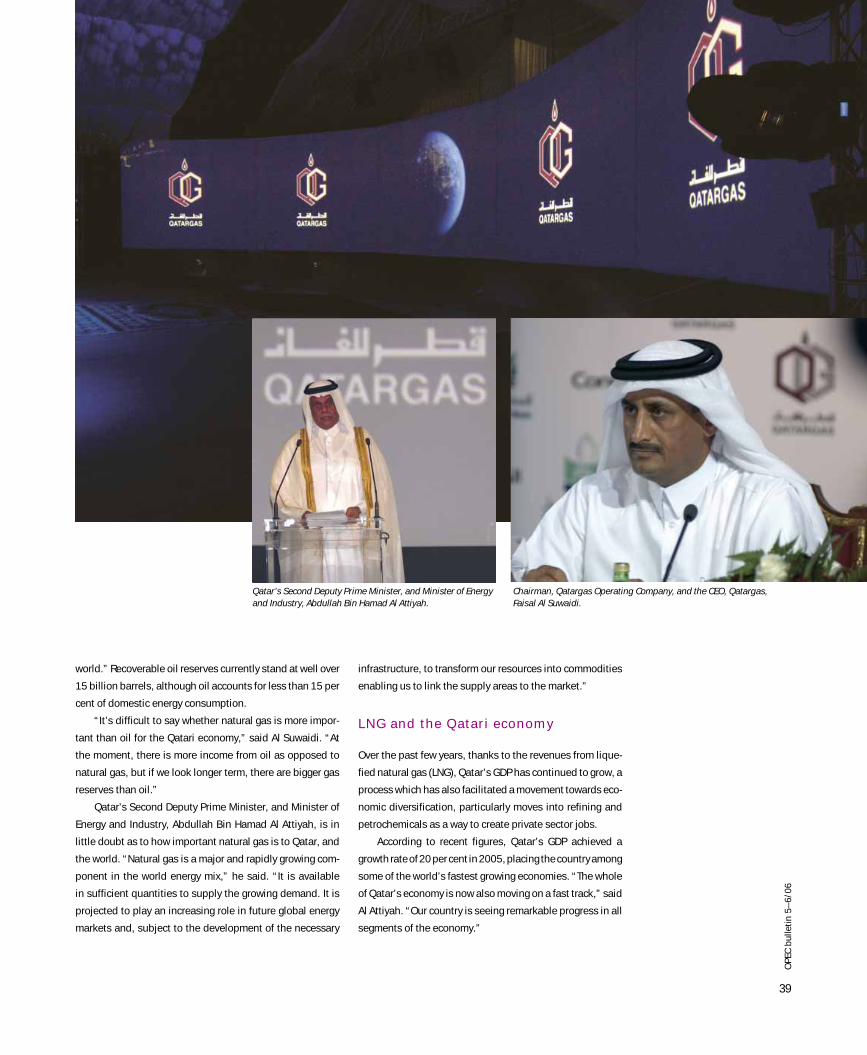
39
OP
EC
bu
lle
tin
5–
6/0
6
world.” Recoverable oil reserves currently stand at well over
15 billion barrels, although oil accounts for less than 15 per
cent of domestic energy consumption.
“It’s difficult to say whether natural gas is more impor-
tant than oil for the Qatari economy,” said Al Suwaidi. “At
the moment, there is more income from oil as opposed to
natural gas, but if we look longer term, there are bigger gas
reserves than oil.”
Qatar’s Second Deputy Prime Minister, and Minister of
Energy and Industry, Abdullah Bin Hamad Al Attiyah, is in
little doubt as to how important natural gas is to Qatar, and
the world. “Natural gas is a major and rapidly growing com-
ponent in the world energy mix,” he said. “It is available
in sufficient quantities to supply the growing demand. It is
projected to play an increasing role in future global energy
markets and, subject to the development of the necessary
infrastructure, to transform our resources into commodities
enabling us to link the supply areas to the market.”
LNG and the Qatari economy
Over the past few years, thanks to the revenues from lique-
fied natural gas (LNG), Qatar’s GDP has continued to grow, a
process which has also facilitated a movement towards eco-
nomic diversification, particularly moves into refining and
petrochemicals as a way to create private sector jobs.
According to recent figures, Qatar’s GDP achieved a
growth rate of 20 per cent in 2005, placing the country among
some of the world’s fastest growing economies. “The whole
of Qatar’s economy is now also moving on a fast track,” said
Al Attiyah. “Our country is seeing remarkable progress in all
segments of the economy.”
Chairman, Qatargas Operating Company, and the CEO, Qatargas, Faisal Al Suwaidi.
Qatar’s Second Deputy Prime Minister, and Minister of Energy and Industry, Abdullah Bin Hamad Al Attiyah.
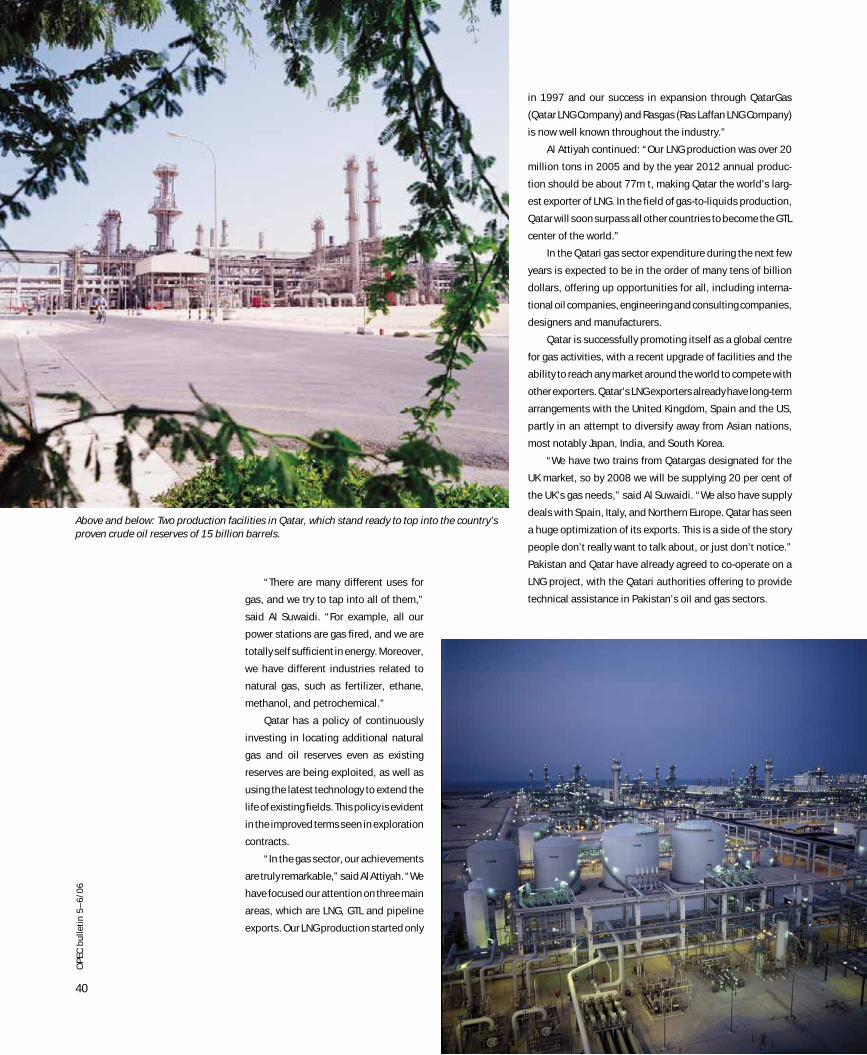
40
OP
EC
bu
lle
tin
5–
6/0
6F
ea
tu
re
“There are many different uses for
gas, and we try to tap into all of them,”
said Al Suwaidi. “For example, all our
power stations are gas fired, and we are
totally self sufficient in energy. Moreover,
we have different industries related to
natural gas, such as fertilizer, ethane,
methanol, and petrochemical.”
Qatar has a policy of continuously
investing in locating additional natural
gas and oil reserves even as existing
reserves are being exploited, as well as
using the latest technology to extend the
life of existing fields. This policy is evident
in the improved terms seen in exploration
contracts.
“In the gas sector, our achievements
are truly remarkable,” said Al Attiyah. “We
have focused our attention on three main
areas, which are LNG, GTL and pipeline
exports. Our LNG production started only
in 1997 and our success in expansion through QatarGas
(Qatar LNG Company) and Rasgas (Ras Laffan LNG Company)
is now well known throughout the industry.”
Al Attiyah continued: “Our LNG production was over 20
million tons in 2005 and by the year 2012 annual produc-
tion should be about 77m t, making Qatar the world’s larg-
est exporter of LNG. In the field of gas-to-liquids production,
Qatar will soon surpass all other countries to become the GTL
center of the world.”
In the Qatari gas sector expenditure during the next few
years is expected to be in the order of many tens of billion
dollars, offering up opportunities for all, including interna-
tional oil companies, engineering and consulting companies,
designers and manufacturers.
Qatar is successfully promoting itself as a global centre
for gas activities, with a recent upgrade of facilities and the
ability to reach any market around the world to compete with
other exporters. Qatar’s LNG exporters already have long-term
arrangements with the United Kingdom, Spain and the US,
partly in an attempt to diversify away from Asian nations,
most notably Japan, India, and South Korea.
“We have two trains from Qatargas designated for the
UK market, so by 2008 we will be supplying 20 per cent of
the UK’s gas needs,” said Al Suwaidi. “We also have supply
deals with Spain, Italy, and Northern Europe. Qatar has seen
a huge optimization of its exports. This is a side of the story
people don’t really want to talk about, or just don’t notice.”
Pakistan and Qatar have already agreed to co-operate on a
LNG project, with the Qatari authorities offering to provide
technical assistance in Pakistan’s oil and gas sectors.
Above and below: Two production facilities in Qatar, which stand ready to top into the country’s proven crude oil reserves of 15 billion barrels.
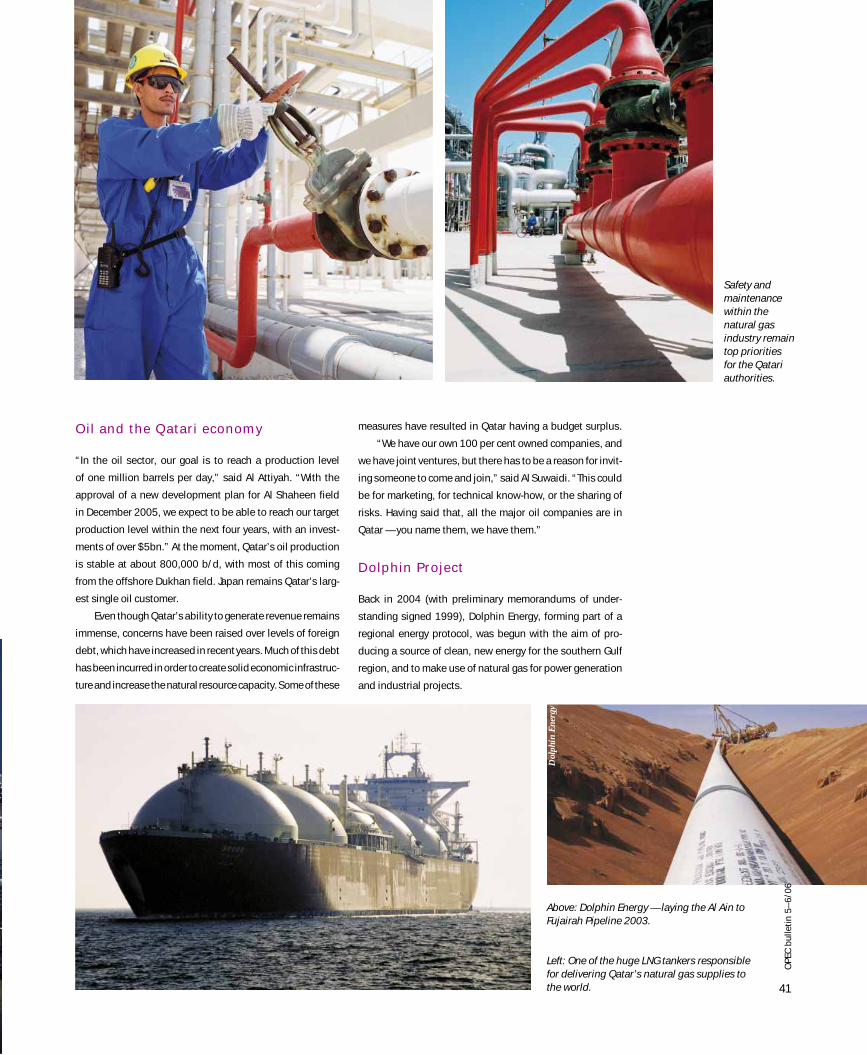
41
Oil and the Qatari economy
“In the oil sector, our goal is to reach a production level
of one million barrels per day,” said Al Attiyah. “With the
approval of a new development plan for Al Shaheen field
in December 2005, we expect to be able to reach our target
production level within the next four years, with an invest-
ments of over $5bn.” At the moment, Qatar’s oil production
is stable at about 800,000 b/d, with most of this coming
from the offshore Dukhan field. Japan remains Qatar’s larg-
est single oil customer.
Even though Qatar’s ability to generate revenue remains
immense, concerns have been raised over levels of foreign
debt, which have increased in recent years. Much of this debt
has been incurred in order to create solid economic infrastruc-
ture and increase the natural resource capacity. Some of these
measures have resulted in Qatar having a budget surplus.
“We have our own 100 per cent owned companies, and
we have joint ventures, but there has to be a reason for invit-
ing someone to come and join,” said Al Suwaidi. “This could
be for marketing, for technical know-how, or the sharing of
risks. Having said that, all the major oil companies are in
Qatar — you name them, we have them.”
Dolphin Project
Back in 2004 (with preliminary memorandums of under-
standing signed 1999), Dolphin Energy, forming part of a
regional energy protocol, was begun with the aim of pro-
ducing a source of clean, new energy for the southern Gulf
region, and to make use of natural gas for power generation
and industrial projects.
Safety and maintenance within the natural gas industry remain top priorities for the Qatari authorities.
Above: Dolphin Energy — laying the Al Ain to Fujairah Pipeline 2003.
Left: One of the huge LNG tankers responsible for delivering Qatar’s natural gas supplies to the world.
OP
EC
bu
lle
tin
5–
6/0
6
Dol
phin
Ene
rgy
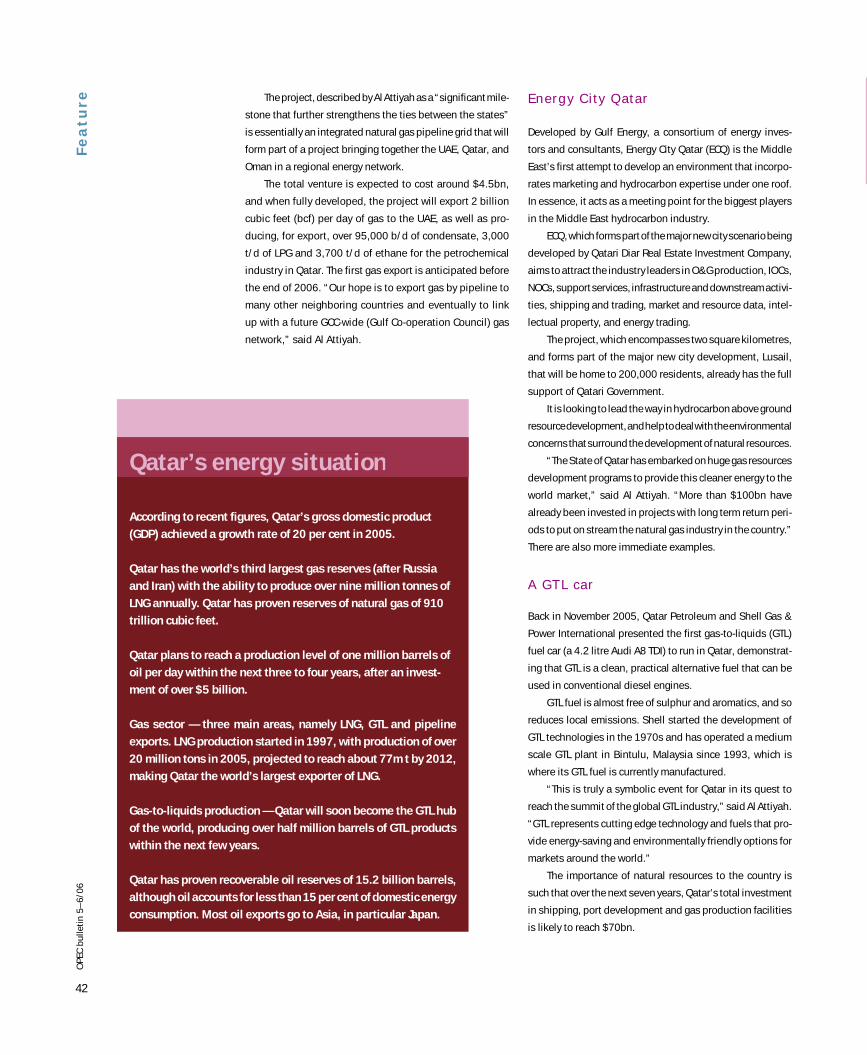
42
OP
EC
bu
lle
tin
5–
6/0
6
The project, described by Al Attiyah as a “significant mile-
stone that further strengthens the ties between the states”
is essentially an integrated natural gas pipeline grid that will
form part of a project bringing together the UAE, Qatar, and
Oman in a regional energy network.
The total venture is expected to cost around $4.5bn,
and when fully developed, the project will export 2 billion
cubic feet (bcf) per day of gas to the UAE, as well as pro-
ducing, for export, over 95,000 b/d of condensate, 3,000
t/d of LPG and 3,700 t/d of ethane for the petrochemical
industry in Qatar. The first gas export is anticipated before
the end of 2006. “Our hope is to export gas by pipeline to
many other neighboring countries and eventually to link
up with a future GCC-wide (Gulf Co-operation Council) gas
network,” said Al Attiyah.
Energy City Qatar
Developed by Gulf Energy, a consortium of energy inves-
tors and consultants, Energy City Qatar (ECQ) is the Middle
East’s first attempt to develop an environment that incorpo-
rates marketing and hydrocarbon expertise under one roof.
In essence, it acts as a meeting point for the biggest players
in the Middle East hydrocarbon industry.
ECQ, which forms part of the major new city scenario being
developed by Qatari Diar Real Estate Investment Company,
aims to attract the industry leaders in O&G production, IOCs,
NOCs, support services, infrastructure and downstream activi-
ties, shipping and trading, market and resource data, intel-
lectual property, and energy trading.
The project, which encompasses two square kilometres,
and forms part of the major new city development, Lusail,
that will be home to 200,000 residents, already has the full
support of Qatari Government.
It is looking to lead the way in hydrocarbon above ground
resource development, and help to deal with the environmental
concerns that surround the development of natural resources.
“The State of Qatar has embarked on huge gas resources
development programs to provide this cleaner energy to the
world market,” said Al Attiyah. “More than $100bn have
already been invested in projects with long term return peri-
ods to put on stream the natural gas industry in the country.”
There are also more immediate examples.
A GTL car
Back in November 2005, Qatar Petroleum and Shell Gas &
Power International presented the first gas-to-liquids (GTL)
fuel car (a 4.2 litre Audi A8 TDI) to run in Qatar, demonstrat-
ing that GTL is a clean, practical alternative fuel that can be
used in conventional diesel engines.
GTL fuel is almost free of sulphur and aromatics, and so
reduces local emissions. Shell started the development of
GTL technologies in the 1970s and has operated a medium
scale GTL plant in Bintulu, Malaysia since 1993, which is
where its GTL fuel is currently manufactured.
“This is truly a symbolic event for Qatar in its quest to
reach the summit of the global GTL industry,” said Al Attiyah.
“GTL represents cutting edge technology and fuels that pro-
vide energy-saving and environmentally friendly options for
markets around the world.”
The importance of natural resources to the country is
such that over the next seven years, Qatar’s total investment
in shipping, port development and gas production facilities
is likely to reach $70bn.
Fe
at
ur
e
Qatar’s energy situation
According to recent figures, Qatar’s gross domestic product
(GDP) achieved a growth rate of 20 per cent in 2005.
Qatar has the world’s third largest gas reserves (after Russia
and Iran) with the ability to produce over nine million tonnes of
LNG annually. Qatar has proven reserves of natural gas of 910
trillion cubic feet.
Qatar plans to reach a production level of one million barrels of
oil per day within the next three to four years, after an invest-
ment of over $5 billion.
Gas sector — three main areas, namely LNG, GTL and pipeline
exports. LNG production started in 1997, with production of over
20 million tons in 2005, projected to reach about 77m t by 2012,
making Qatar the world’s largest exporter of LNG.
Gas-to-liquids production — Qatar will soon become the GTL hub
of the world, producing over half million barrels of GTL products
within the next few years.
Qatar has proven recoverable oil reserves of 15.2 billion barrels,
although oil accounts for less than 15 per cent of domestic energy
consumption. Most oil exports go to Asia, in particular Japan.
Qatar’s energy situation
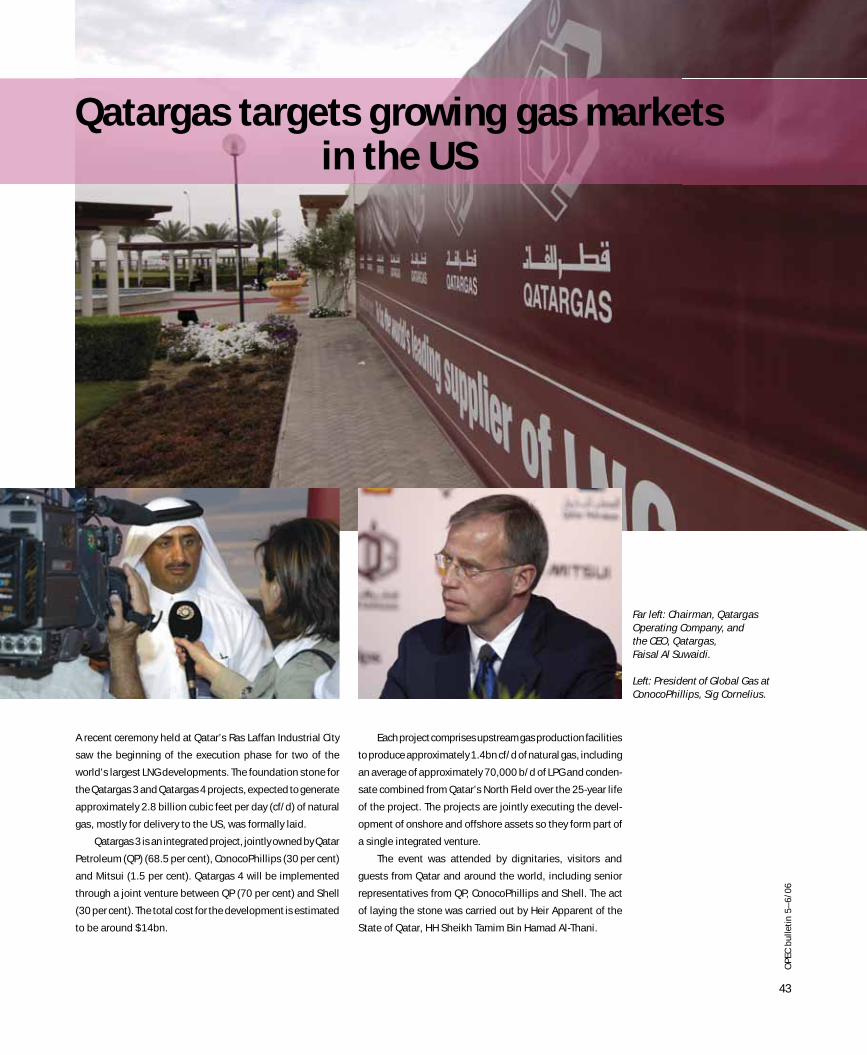
43
OP
EC
bu
lle
tin
5–
6/0
6
A recent ceremony held at Qatar’s Ras Laffan Industrial City
saw the beginning of the execution phase for two of the
world’s largest LNG developments. The foundation stone for
the Qatargas 3 and Qatargas 4 projects, expected to generate
approximately 2.8 billion cubic feet per day (cf/d) of natural
gas, mostly for delivery to the US, was formally laid.
Qatargas 3 is an integrated project, jointly owned by Qatar
Petroleum (QP) (68.5 per cent), ConocoPhillips (30 per cent)
and Mitsui (1.5 per cent). Qatargas 4 will be implemented
through a joint venture between QP (70 per cent) and Shell
(30 per cent). The total cost for the development is estimated
to be around $14bn.
Each project comprises upstream gas production facilities
to produce approximately 1.4bn cf/d of natural gas, including
an average of approximately 70,000 b/d of LPG and conden-
sate combined from Qatar’s North Field over the 25-year life
of the project. The projects are jointly executing the devel-
opment of onshore and offshore assets so they form part of
a single integrated venture.
The event was attended by dignitaries, visitors and
guests from Qatar and around the world, including senior
representatives from QP, ConocoPhillips and Shell. The act
of laying the stone was carried out by Heir Apparent of the
State of Qatar, HH Sheikh Tamim Bin Hamad Al-Thani.
Qatargas targets growing gas markets in the US
Far left: Chairman, Qatargas Operating Company, and the CEO, Qatargas, Faisal Al Suwaidi.
Left: President of Global Gas at ConocoPhillips, Sig Cornelius.
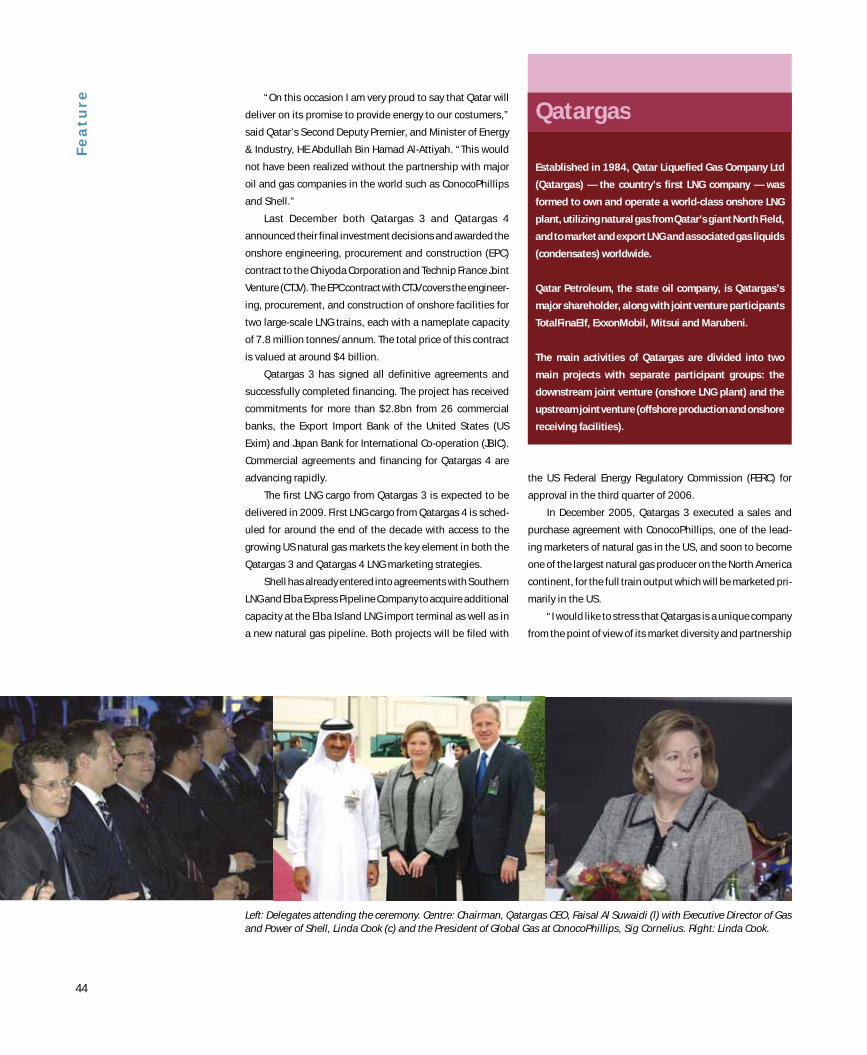
44
Fe
at
ur
e
the US Federal Energy Regulatory Commission (FERC) for
approval in the third quarter of 2006.
In December 2005, Qatargas 3 executed a sales and
purchase agreement with ConocoPhillips, one of the lead-
ing marketers of natural gas in the US, and soon to become
one of the largest natural gas producer on the North America
continent, for the full train output which will be marketed pri-
marily in the US.
“I would like to stress that Qatargas is a unique company
from the point of view of its market diversity and partnership
“On this occasion I am very proud to say that Qatar will
deliver on its promise to provide energy to our costumers,”
said Qatar’s Second Deputy Premier, and Minister of Energy
& Industry, HE Abdullah Bin Hamad Al-Attiyah. “This would
not have been realized without the partnership with major
oil and gas companies in the world such as ConocoPhillips
and Shell.”
Last December both Qatargas 3 and Qatargas 4
announced their final investment decisions and awarded the
onshore engineering, procurement and construction (EPC)
contract to the Chiyoda Corporation and Technip France Joint
Venture (CTJV). The EPC contract with CTJV covers the engineer-
ing, procurement, and construction of onshore facilities for
two large-scale LNG trains, each with a nameplate capacity
of 7.8 million tonnes/annum. The total price of this contract
is valued at around $4 billion.
Qatargas 3 has signed all definitive agreements and
successfully completed financing. The project has received
commitments for more than $2.8bn from 26 commercial
banks, the Export Import Bank of the United States (US
Exim) and Japan Bank for International Co-operation (JBIC).
Commercial agreements and financing for Qatargas 4 are
advancing rapidly.
The first LNG cargo from Qatargas 3 is expected to be
delivered in 2009. First LNG cargo from Qatargas 4 is sched-
uled for around the end of the decade with access to the
growing US natural gas markets the key element in both the
Qatargas 3 and Qatargas 4 LNG marketing strategies.
Shell has already entered into agreements with Southern
LNG and Elba Express Pipeline Company to acquire additional
capacity at the Elba Island LNG import terminal as well as in
a new natural gas pipeline. Both projects will be filed with
Qatargas
Established in 1984, Qatar Liquefied Gas Company Ltd
(Qatargas) — the country’s first LNG company — was
formed to own and operate a world-class onshore LNG
plant, utilizing natural gas from Qatar’s giant North Field,
and to market and export LNG and associated gas liquids
(condensates) worldwide.
Qatar Petroleum, the state oil company, is Qatargas’s
major shareholder, along with joint venture participants
TotalFinaElf, ExxonMobil, Mitsui and Marubeni.
The main activities of Qatargas are divided into two
main projects with separate participant groups: the
downstream joint venture (onshore LNG plant) and the
upstream joint venture (offshore production and onshore
receiving facilities).
Qatargas
Left: Delegates attending the ceremony. Centre: Chairman, Qatargas CEO, Faisal Al Suwaidi (l) with Executive Director of Gas and Power of Shell, Linda Cook (c) and the President of Global Gas at ConocoPhillips, Sig Cornelius. Right: Linda Cook.
45
OP
EC
bu
lle
tin
5–
6/0
6
with its shareholders,” said the Chairman, Qatargas Operating
Company, and the CEO, Qatargas, Faisal Al Suwaidi. “Qatargas
is supplying to Asia, will reach Europe by end of 2007, and
the North American market by end of 2008. Therefore our
marketing will reach every corner of the world and in turn
we will realize our vision to be the world’s leading supplier
of LNG by the end of the decade.”
President, Global Gas, ConocoPhillips, Sig Cornelius,
said: “This project is an important addition to Conoco-
Phillips’s growing LNG portfolio, and we are pleased to
have an important role in helping Qatar reach its objective
to become the largest LNG supplier in the world by the end
of the decade.”
Executive Director of Gas and Power, Shell, Linda
Cook, said: “This venture demonstrates Shell’s and Qatar
Petroleum’s joint efforts to strengthen security and diversity
of natural gas supply primarily to the US, the world’s largest
natural gas market.”
Plans for energy diversification and development in
Qatar also include a new gas condensate refinery (offering
up naphtha, kerosene, and LPG) at Ras Laffan, with opera-
tions starting in late 2008, and a global investment unit set
up by QP called Qatar Petroleum International (QPI). State-
owned QPI will seek out petroleum assets (both upstream
and downstream) abroad, with particular reference to China
and India.
Ras Laffan will thus soon become home for the world’s
largest liquefied natural gas plant, supplying almost 25 per
cent of global LNG needs. It should also be remembered
that not only is world demand for natural gas expected to
increase dramatically over the next 30 years, as a fuel it is
also far cleaner than crude oil.
Japan and Qatar move
closer on energy
co-operation
Bilateral economic relations between Japan and the
State of Qatar were given a boost by the signing in late
April of an energy supply agreement. The agreement
aims to satisfy Japan’s long term energy supply needs,
while at the same time create momentum for Qatar’s
gas production industry.
The agreement, which was signed by Qatar’s Second
Deputy Prime Minister and Minister of Energy and
Industry, Abdullah bin Hamad Al Attiyah, and Japan’s
Minister for Economy, Trade, and Industry, Toshihiro
Nikai, also touched upon non-energy matters, such
as increasing Japanese investments in Qatar’s rapidly
diversifying economy.
Qatar, with some of the largest gas fields in the world,
is already the largest supplier of natural gas to Japan.
Within five years it is expected that Qatar will become
one of the world’s biggest exporters of LNG.
Bilateral relations between Japan and Qatar have been
on the rise for some years, culminating in the in the
June 2005 Japan-Qatar Summit Meeting in Tokyo. It saw
Japan’s Prime Minister, Junichiro Koizumi, meet with the
Emir of the State of Qatar, His Highness Sheikh Hamad
Bin Khalifa Al Thani. The two leaders discussed a number
of important bilateral issues.
Japanese officials called the agreement “a commitment
for further strengthening between Japan and Qatar in
the economic and industrial sectors.” It has also been
reported that Japan is soon to start negotiations with
the Gulf Co-operation Council concerning arrangements
for free trade. Photographs on pp38–44, unless otherwise credited, courtesy Qatargas.
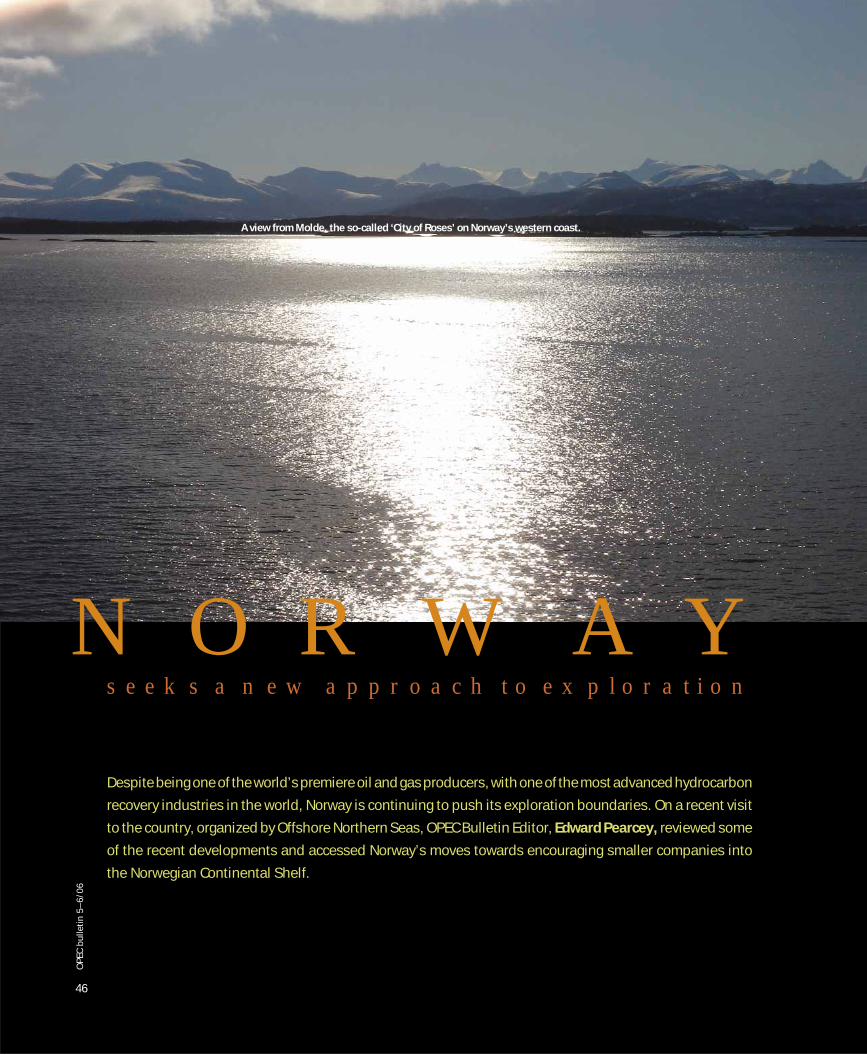
Co
un
tr
y P
ro
fi
le
A view from Molde, the so-called ‘City of Roses’ on Norway’s western coast.
NORWAY
Despite being one of the world’s premiere oil and gas producers, with one of the most advanced hydrocarbon
recovery industries in the world, Norway is continuing to push its exploration boundaries. On a recent visit
to the country, organized by Offshore Northern Seas, OPEC Bulletin Editor, Edward Pearcey, reviewed some
of the recent developments and accessed Norway’s moves towards encouraging smaller companies into
the Norwegian Continental Shelf.
seeks a new approach to exploration
OP
EC
bu
lle
tin
5–
6/0
6
46
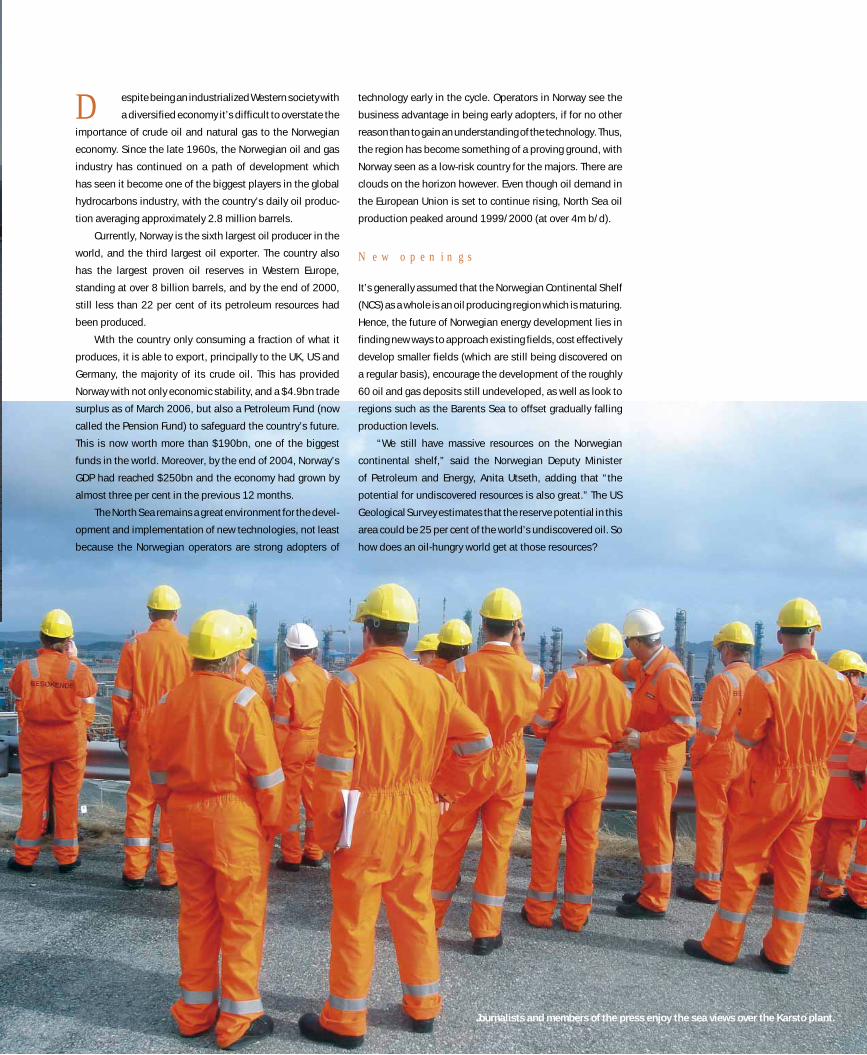
47
OP
EC
bu
lle
tin
5–
6/0
6
espite being an industrialized Western society with
a diversified economy it’s difficult to overstate the
importance of crude oil and natural gas to the Norwegian
economy. Since the late 1960s, the Norwegian oil and gas
industry has continued on a path of development which
has seen it become one of the biggest players in the global
hydrocarbons industry, with the country’s daily oil produc-
tion averaging approximately 2.8 million barrels.
Currently, Norway is the sixth largest oil producer in the
world, and the third largest oil exporter. The country also
has the largest proven oil reserves in Western Europe,
standing at over 8 billion barrels, and by the end of 2000,
still less than 22 per cent of its petroleum resources had
been produced.
With the country only consuming a fraction of what it
produces, it is able to export, principally to the UK, US and
Germany, the majority of its crude oil. This has provided
Norway with not only economic stability, and a $4.9bn trade
surplus as of March 2006, but also a Petroleum Fund (now
called the Pension Fund) to safeguard the country’s future.
This is now worth more than $190bn, one of the biggest
funds in the world. Moreover, by the end of 2004, Norway’s
GDP had reached $250bn and the economy had grown by
almost three per cent in the previous 12 months.
The North Sea remains a great environment for the devel-
opment and implementation of new technologies, not least
because the Norwegian operators are strong adopters of
technology early in the cycle. Operators in Norway see the
business advantage in being early adopters, if for no other
reason than to gain an understanding of the technology. Thus,
the region has become something of a proving ground, with
Norway seen as a low-risk country for the majors. There are
clouds on the horizon however. Even though oil demand in
the European Union is set to continue rising, North Sea oil
production peaked around 1999/2000 (at over 4m b/d).
New openings
It’s generally assumed that the Norwegian Continental Shelf
(NCS) as a whole is an oil producing region which is maturing.
Hence, the future of Norwegian energy development lies in
finding new ways to approach existing fields, cost effectively
develop smaller fields (which are still being discovered on
a regular basis), encourage the development of the roughly
60 oil and gas deposits still undeveloped, as well as look to
regions such as the Barents Sea to offset gradually falling
production levels.
“We still have massive resources on the Norwegian
continental shelf,” said the Norwegian Deputy Minister
of Petroleum and Energy, Anita Utseth, adding that “the
potential for undiscovered resources is also great.” The US
Geological Survey estimates that the reserve potential in this
area could be 25 per cent of the world’s undiscovered oil. So
how does an oil-hungry world get at those resources?
D
Journalists and members of the press enjoy the sea views over the Karsto plant.
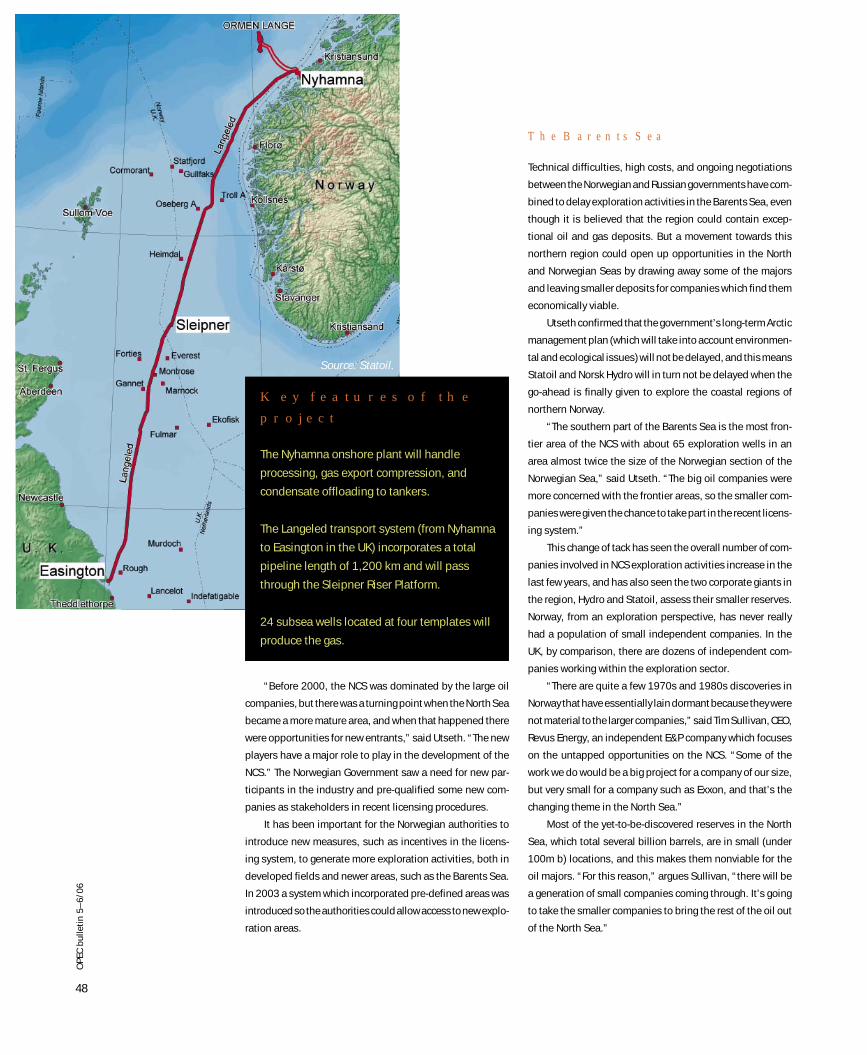
48
OP
EC
bu
lle
tin
5–
6/0
6C
ou
nt
ry
Pr
of
il
e
Key features of the
project
The Nyhamna onshore plant will handle
processing, gas export compression, and
condensate offloading to tankers.
The Langeled transport system (from Nyhamna
to Easington in the UK) incorporates a total
pipeline length of 1,200 km and will pass
through the Sleipner Riser Platform.
24 subsea wells located at four templates will
produce the gas.
The Barents Sea
Technical difficulties, high costs, and ongoing negotiations
between the Norwegian and Russian governments have com-
bined to delay exploration activities in the Barents Sea, even
though it is believed that the region could contain excep-
tional oil and gas deposits. But a movement towards this
northern region could open up opportunities in the North
and Norwegian Seas by drawing away some of the majors
and leaving smaller deposits for companies which find them
economically viable.
Utseth confirmed that the government’s long-term Arctic
management plan (which will take into account environmen-
tal and ecological issues) will not be delayed, and this means
Statoil and Norsk Hydro will in turn not be delayed when the
go-ahead is finally given to explore the coastal regions of
northern Norway.
“The southern part of the Barents Sea is the most fron-
tier area of the NCS with about 65 exploration wells in an
area almost twice the size of the Norwegian section of the
Norwegian Sea,” said Utseth. “The big oil companies were
more concerned with the frontier areas, so the smaller com-
panies were given the chance to take part in the recent licens-
ing system.”
This change of tack has seen the overall number of com-
panies involved in NCS exploration activities increase in the
last few years, and has also seen the two corporate giants in
the region, Hydro and Statoil, assess their smaller reserves.
Norway, from an exploration perspective, has never really
had a population of small independent companies. In the
UK, by comparison, there are dozens of independent com-
panies working within the exploration sector.
“There are quite a few 1970s and 1980s discoveries in
Norway that have essentially lain dormant because they were
not material to the larger companies,” said Tim Sullivan, CEO,
Revus Energy, an independent E&P company which focuses
on the untapped opportunities on the NCS. “Some of the
work we do would be a big project for a company of our size,
but very small for a company such as Exxon, and that’s the
changing theme in the North Sea.”
Most of the yet-to-be-discovered reserves in the North
Sea, which total several billion barrels, are in small (under
100m b) locations, and this makes them nonviable for the
oil majors. “For this reason,” argues Sullivan, “there will be
a generation of small companies coming through. It’s going
to take the smaller companies to bring the rest of the oil out
of the North Sea.”
“Before 2000, the NCS was dominated by the large oil
companies, but there was a turning point when the North Sea
became a more mature area, and when that happened there
were opportunities for new entrants,” said Utseth. “The new
players have a major role to play in the development of the
NCS.” The Norwegian Government saw a need for new par-
ticipants in the industry and pre-qualified some new com-
panies as stakeholders in recent licensing procedures.
It has been important for the Norwegian authorities to
introduce new measures, such as incentives in the licens-
ing system, to generate more exploration activities, both in
developed fields and newer areas, such as the Barents Sea.
In 2003 a system which incorporated pre-defined areas was
introduced so the authorities could allow access to new explo-
ration areas.
Source: Statoil.
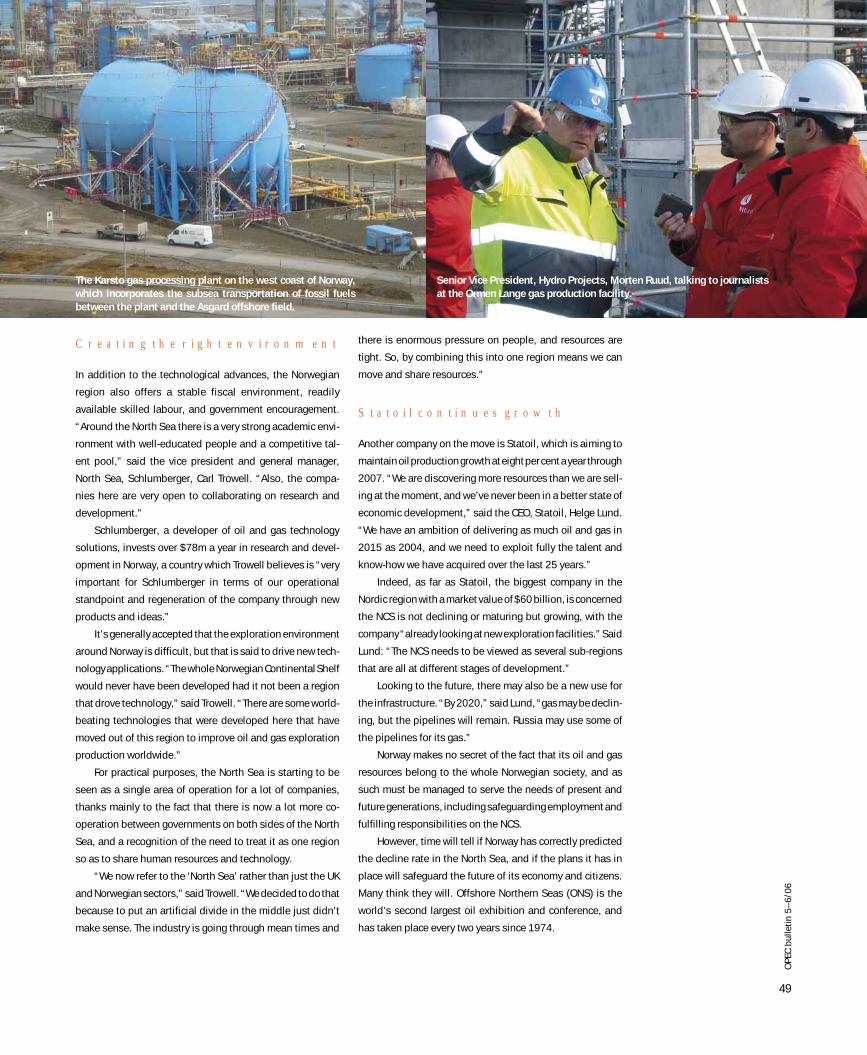
49
OP
EC
bu
lle
tin
5–
6/0
6
Creating the right environment
In addition to the technological advances, the Norwegian
region also offers a stable fiscal environment, readily
available skilled labour, and government encouragement.
“Around the North Sea there is a very strong academic envi-
ronment with well-educated people and a competitive tal-
ent pool,” said the vice president and general manager,
North Sea, Schlumberger, Carl Trowell. “Also, the compa-
nies here are very open to collaborating on research and
development.”
Schlumberger, a developer of oil and gas technology
solutions, invests over $78m a year in research and devel-
opment in Norway, a country which Trowell believes is “very
important for Schlumberger in terms of our operational
standpoint and regeneration of the company through new
products and ideas.”
It’s generally accepted that the exploration environment
around Norway is difficult, but that is said to drive new tech-
nology applications. “The whole Norwegian Continental Shelf
would never have been developed had it not been a region
that drove technology,” said Trowell. “There are some world-
beating technologies that were developed here that have
moved out of this region to improve oil and gas exploration
production worldwide.”
For practical purposes, the North Sea is starting to be
seen as a single area of operation for a lot of companies,
thanks mainly to the fact that there is now a lot more co-
operation between governments on both sides of the North
Sea, and a recognition of the need to treat it as one region
so as to share human resources and technology.
“We now refer to the ‘North Sea’ rather than just the UK
and Norwegian sectors,” said Trowell. “We decided to do that
because to put an artificial divide in the middle just didn’t
make sense. The industry is going through mean times and
there is enormous pressure on people, and resources are
tight. So, by combining this into one region means we can
move and share resources.”
Statoil continues growth
Another company on the move is Statoil, which is aiming to
maintain oil production growth at eight per cent a year through
2007. “We are discovering more resources than we are sell-
ing at the moment, and we’ve never been in a better state of
economic development,” said the CEO, Statoil, Helge Lund.
“We have an ambition of delivering as much oil and gas in
2015 as 2004, and we need to exploit fully the talent and
know-how we have acquired over the last 25 years.”
Indeed, as far as Statoil, the biggest company in the
Nordic region with a market value of $60 billion, is concerned
the NCS is not declining or maturing but growing, with the
company “already looking at new exploration facilities.” Said
Lund: “The NCS needs to be viewed as several sub-regions
that are all at different stages of development.”
Looking to the future, there may also be a new use for
the infrastructure. “By 2020,” said Lund, “gas may be declin-
ing, but the pipelines will remain. Russia may use some of
the pipelines for its gas.”
Norway makes no secret of the fact that its oil and gas
resources belong to the whole Norwegian society, and as
such must be managed to serve the needs of present and
future generations, including safeguarding employment and
fulfilling responsibilities on the NCS.
However, time will tell if Norway has correctly predicted
the decline rate in the North Sea, and if the plans it has in
place will safeguard the future of its economy and citizens.
Many think they will. Offshore Northern Seas (ONS) is the
world’s second largest oil exhibition and conference, and
has taken place every two years since 1974.
The Karsto gas processing plant on the west coast of Norway,
which incorporates the subsea transportation of fossil fuels
between the plant and the Asgard offshore field.
Senior Vice President, Hydro Projects, Morten Ruud, talking to journalists
at the Ormen Lange gas production facility.
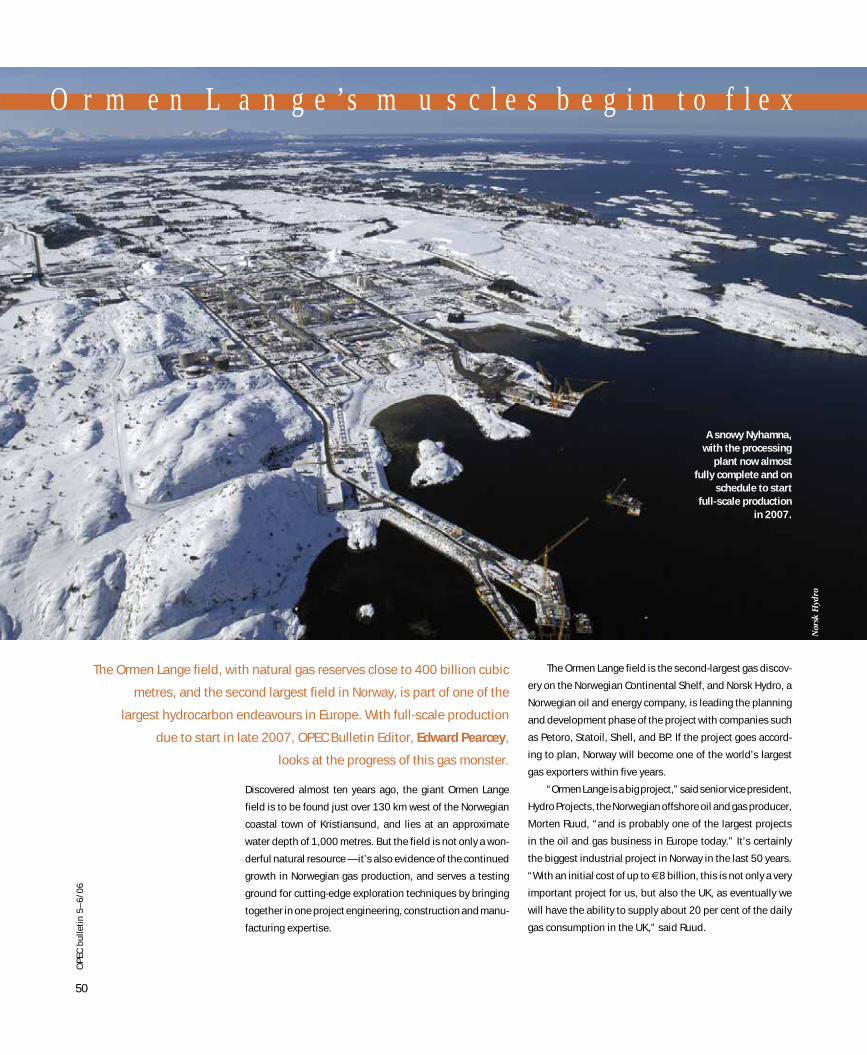
50
OP
EC
bu
lle
tin
5–
6/0
6C
ou
nt
ry
Pr
of
il
e
Discovered almost ten years ago, the giant Ormen Lange
field is to be found just over 130 km west of the Norwegian
coastal town of Kristiansund, and lies at an approximate
water depth of 1,000 metres. But the field is not only a won-
derful natural resource — it’s also evidence of the continued
growth in Norwegian gas production, and serves a testing
ground for cutting-edge exploration techniques by bringing
together in one project engineering, construction and manu-
facturing expertise.
The Ormen Lange field is the second-largest gas discov-
ery on the Norwegian Continental Shelf, and Norsk Hydro, a
Norwegian oil and energy company, is leading the planning
and development phase of the project with companies such
as Petoro, Statoil, Shell, and BP. If the project goes accord-
ing to plan, Norway will become one of the world’s largest
gas exporters within five years.
“Ormen Lange is a big project,” said senior vice president,
Hydro Projects, the Norwegian offshore oil and gas producer,
Morten Ruud, “and is probably one of the largest projects
in the oil and gas business in Europe today.” It’s certainly
the biggest industrial project in Norway in the last 50 years.
“With an initial cost of up to €8 billion, this is not only a very
important project for us, but also the UK, as eventually we
will have the ability to supply about 20 per cent of the daily
gas consumption in the UK,” said Ruud.
Ormen Lange’s muscles begin to flex
The Ormen Lange field, with natural gas reserves close to 400 billion cubic
metres, and the second largest field in Norway, is part of one of the
largest hydrocarbon endeavours in Europe. With full-scale production
due to start in late 2007, OPEC Bulletin Editor, Edward Pearcey,
looks at the progress of this gas monster.
Nor
sk H
ydro
A snowy Nyhamna,
with the processing
plant now almost
fully complete and on
schedule to start
full-scale production
in 2007.
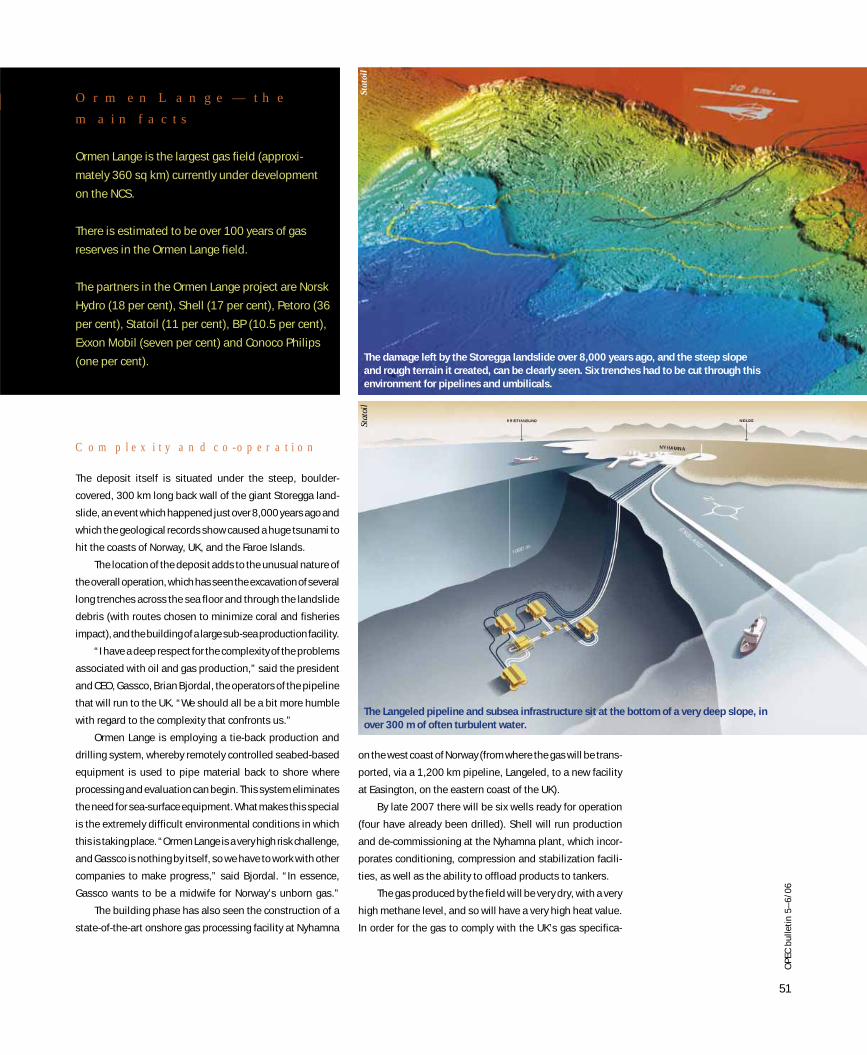
51
OP
EC
bu
lle
tin
5–
6/0
6
The Langeled pipeline and subsea infrastructure sit at the bottom of a very deep slope, in
over 300 m of often turbulent water.
Ormen Lange — the
main facts
Ormen Lange is the largest gas field (approxi-
mately 360 sq km) currently under development
on the NCS.
There is estimated to be over 100 years of gas
reserves in the Ormen Lange field.
The partners in the Ormen Lange project are Norsk
Hydro (18 per cent), Shell (17 per cent), Petoro (36
per cent), Statoil (11 per cent), BP (10.5 per cent),
Exxon Mobil (seven per cent) and Conoco Philips
(one per cent).
Complexity and co-operation
The deposit itself is situated under the steep, boulder-
covered, 300 km long back wall of the giant Storegga land-
slide, an event which happened just over 8,000 years ago and
which the geological records show caused a huge tsunami to
hit the coasts of Norway, UK, and the Faroe Islands.
The location of the deposit adds to the unusual nature of
the overall operation, which has seen the excavation of several
long trenches across the sea floor and through the landslide
debris (with routes chosen to minimize coral and fisheries
impact), and the building of a large sub-sea production facility.
“I have a deep respect for the complexity of the problems
associated with oil and gas production,” said the president
and CEO, Gassco, Brian Bjordal, the operators of the pipeline
that will run to the UK. “We should all be a bit more humble
with regard to the complexity that confronts us.”
Ormen Lange is employing a tie-back production and
drilling system, whereby remotely controlled seabed-based
equipment is used to pipe material back to shore where
processing and evaluation can begin. This system eliminates
the need for sea-surface equipment. What makes this special
is the extremely difficult environmental conditions in which
this is taking place. “Ormen Lange is a very high risk challenge,
and Gassco is nothing by itself, so we have to work with other
companies to make progress,” said Bjordal. “In essence,
Gassco wants to be a midwife for Norway’s unborn gas.”
The building phase has also seen the construction of a
state-of-the-art onshore gas processing facility at Nyhamna
The damage left by the Storegga landslide over 8,000 years ago, and the steep slope
and rough terrain it created, can be clearly seen. Six trenches had to be cut through this
environment for pipelines and umbilicals.
on the west coast of Norway (from where the gas will be trans-
ported, via a 1,200 km pipeline, Langeled, to a new facility
at Easington, on the eastern coast of the UK).
By late 2007 there will be six wells ready for operation
(four have already been drilled). Shell will run production
and de-commissioning at the Nyhamna plant, which incor-
porates conditioning, compression and stabilization facili-
ties, as well as the ability to offload products to tankers.
The gas produced by the field will be very dry, with a very
high methane level, and so will have a very high heat value.
In order for the gas to comply with the UK’s gas specifica-
Stat
oil
Stat
oil
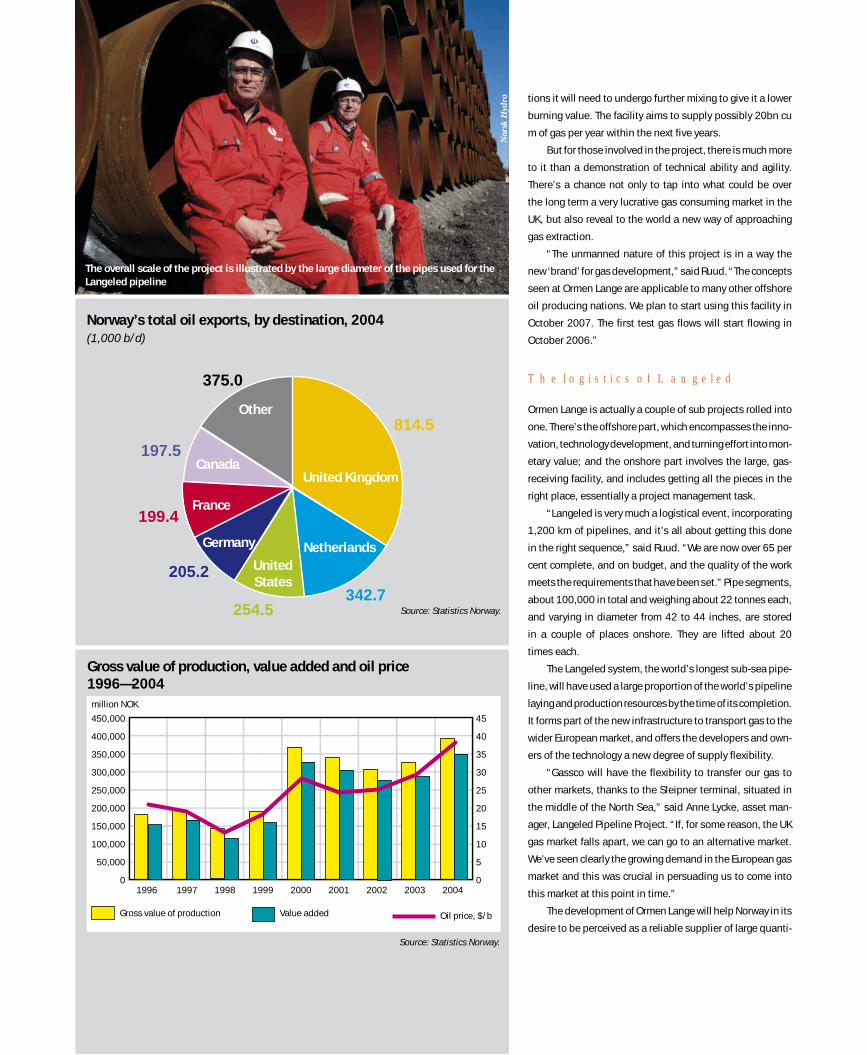
52
Co
un
tr
y P
ro
fi
le tions it will need to undergo further mixing to give it a lower
burning value. The facility aims to supply possibly 20bn cu
m of gas per year within the next five years.
But for those involved in the project, there is much more
to it than a demonstration of technical ability and agility.
There’s a chance not only to tap into what could be over
the long term a very lucrative gas consuming market in the
UK, but also reveal to the world a new way of approaching
gas extraction.
“The unmanned nature of this project is in a way the
new ‘brand’ for gas development,” said Ruud. “The concepts
seen at Ormen Lange are applicable to many other offshore
oil producing nations. We plan to start using this facility in
October 2007. The first test gas flows will start flowing in
October 2006.”
The logistics of Langeled
Ormen Lange is actually a couple of sub projects rolled into
one. There’s the offshore part, which encompasses the inno-
vation, technology development, and turning effort into mon-
etary value; and the onshore part involves the large, gas-
receiving facility, and includes getting all the pieces in the
right place, essentially a project management task.
“Langeled is very much a logistical event, incorporating
1,200 km of pipelines, and it’s all about getting this done
in the right sequence,” said Ruud. “We are now over 65 per
cent complete, and on budget, and the quality of the work
meets the requirements that have been set.” Pipe segments,
about 100,000 in total and weighing about 22 tonnes each,
and varying in diameter from 42 to 44 inches, are stored
in a couple of places onshore. They are lifted about 20
times each.
The Langeled system, the world’s longest sub-sea pipe-
line, will have used a large proportion of the world’s pipeline
laying and production resources by the time of its completion.
It forms part of the new infrastructure to transport gas to the
wider European market, and offers the developers and own-
ers of the technology a new degree of supply flexibility.
“Gassco will have the flexibility to transfer our gas to
other markets, thanks to the Sleipner terminal, situated in
the middle of the North Sea,” said Anne Lycke, asset man-
ager, Langeled Pipeline Project. “If, for some reason, the UK
gas market falls apart, we can go to an alternative market.
We’ve seen clearly the growing demand in the European gas
market and this was crucial in persuading us to come into
this market at this point in time.”
The development of Ormen Lange will help Norway in its
desire to be perceived as a reliable supplier of large quanti-
Norway’s total oil exports, by destination, 2004
(1,000 b/d)
Other
Canada
France
Germany
United
States
Netherlands
United Kingdom
814.5
342.7254.5
205.2
199.4
197.5
375.0
Source: Statistics Norway.
Gross value of production, value added and oil price
1996—2004
million NOK
450,000
400,000
350,000
300,000
250,000
200,000
150,000
100,000
50,000
0
Gross value of production Value added Oil price, $/b
45
40
35
30
25
20
15
10
5
01996 1997 1998 1999 2000 2001 2002 2003 2004
Nor
sk H
ydro
Source: Statistics Norway.
The overall scale of the project is illustrated by the large diameter of the pipes used for the
Langeled pipeline
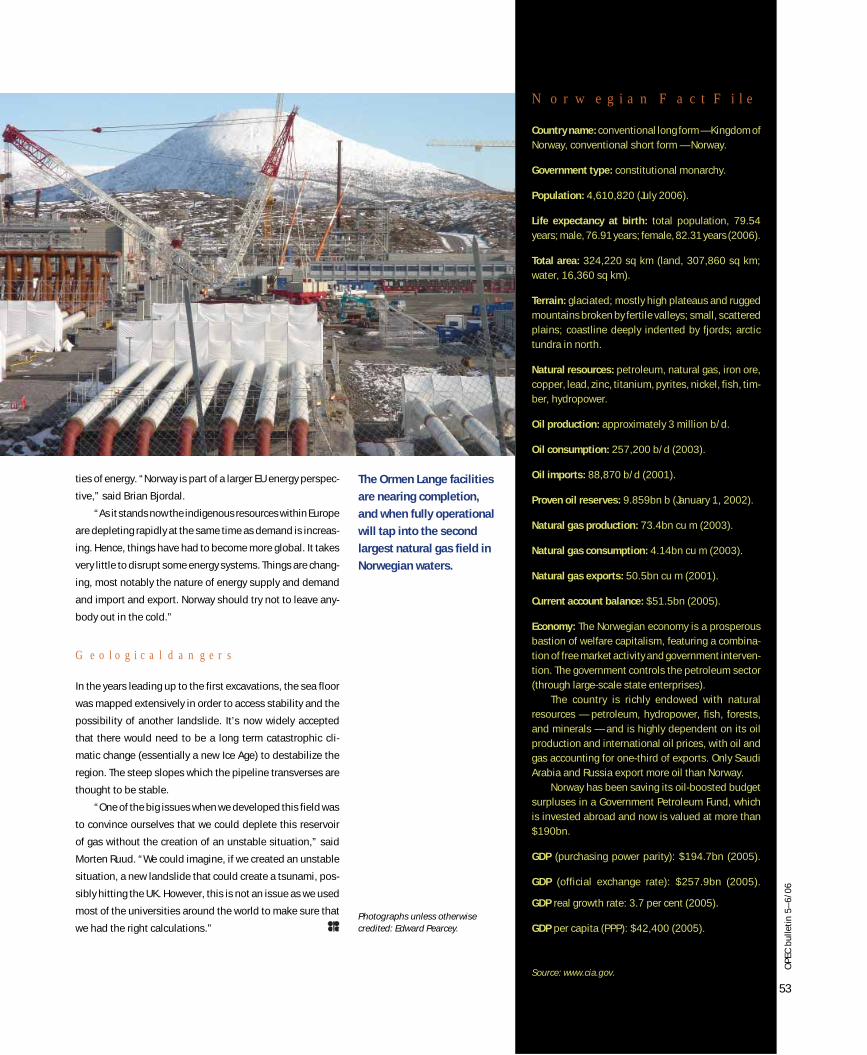
53
OP
EC
bu
lle
tin
5–
6/0
6
Norwegian Fact File
Country name: conventional long form — Kingdom of
Norway, conventional short form — Norway.
Government type: constitutional monarchy.
Population: 4,610,820 (July 2006).
Life expectancy at birth: total population, 79.54
years; male, 76.91 years; female, 82.31 years (2006).
Total area: 324,220 sq km (land, 307,860 sq km;
water, 16,360 sq km).
Terrain: glaciated; mostly high plateaus and rugged
mountains broken by fertile valleys; small, scattered
plains; coastline deeply indented by fjords; arctic
tundra in north.
Natural resources: petroleum, natural gas, iron ore,
copper, lead, zinc, titanium, pyrites, nickel, fish, tim-
ber, hydropower.
Oil production: approximately 3 million b/d.
Oil consumption: 257,200 b/d (2003).
Oil imports: 88,870 b/d (2001).
Proven oil reserves: 9.859bn b (January 1, 2002).
Natural gas production: 73.4bn cu m (2003).
Natural gas consumption: 4.14bn cu m (2003).
Natural gas exports: 50.5bn cu m (2001).
Current account balance: $51.5bn (2005).
Economy: The Norwegian economy is a prosperous
bastion of welfare capitalism, featuring a combina-
tion of free market activity and government interven-
tion. The government controls the petroleum sector
(through large-scale state enterprises).
The country is richly endowed with natural
resources — petroleum, hydropower, fish, forests,
and minerals — and is highly dependent on its oil
production and international oil prices, with oil and
gas accounting for one-third of exports. Only Saudi
Arabia and Russia export more oil than Norway.
Norway has been saving its oil-boosted budget
surpluses in a Government Petroleum Fund, which
is invested abroad and now is valued at more than
$190bn.
GDP (purchasing power parity): $194.7bn (2005).
GDP (official exchange rate): $257.9bn (2005).
GDP real growth rate: 3.7 per cent (2005).
GDP per capita (PPP): $42,400 (2005).
Source: www.cia.gov.
ties of energy. “Norway is part of a larger EU energy perspec-
tive,” said Brian Bjordal.
“As it stands now the indigenous resources within Europe
are depleting rapidly at the same time as demand is increas-
ing. Hence, things have had to become more global. It takes
very little to disrupt some energy systems. Things are chang-
ing, most notably the nature of energy supply and demand
and import and export. Norway should try not to leave any-
body out in the cold.”
Geological dangers
In the years leading up to the first excavations, the sea floor
was mapped extensively in order to access stability and the
possibility of another landslide. It’s now widely accepted
that there would need to be a long term catastrophic cli-
matic change (essentially a new Ice Age) to destabilize the
region. The steep slopes which the pipeline transverses are
thought to be stable.
“One of the big issues when we developed this field was
to convince ourselves that we could deplete this reservoir
of gas without the creation of an unstable situation,” said
Morten Ruud. “We could imagine, if we created an unstable
situation, a new landslide that could create a tsunami, pos-
sibly hitting the UK. However, this is not an issue as we used
most of the universities around the world to make sure that
we had the right calculations.”
The Ormen Lange facilities
are nearing completion,
and when fully operational
will tap into the second
largest natural gas field in
Norwegian waters.
Photographs unless otherwise credited: Edward Pearcey.
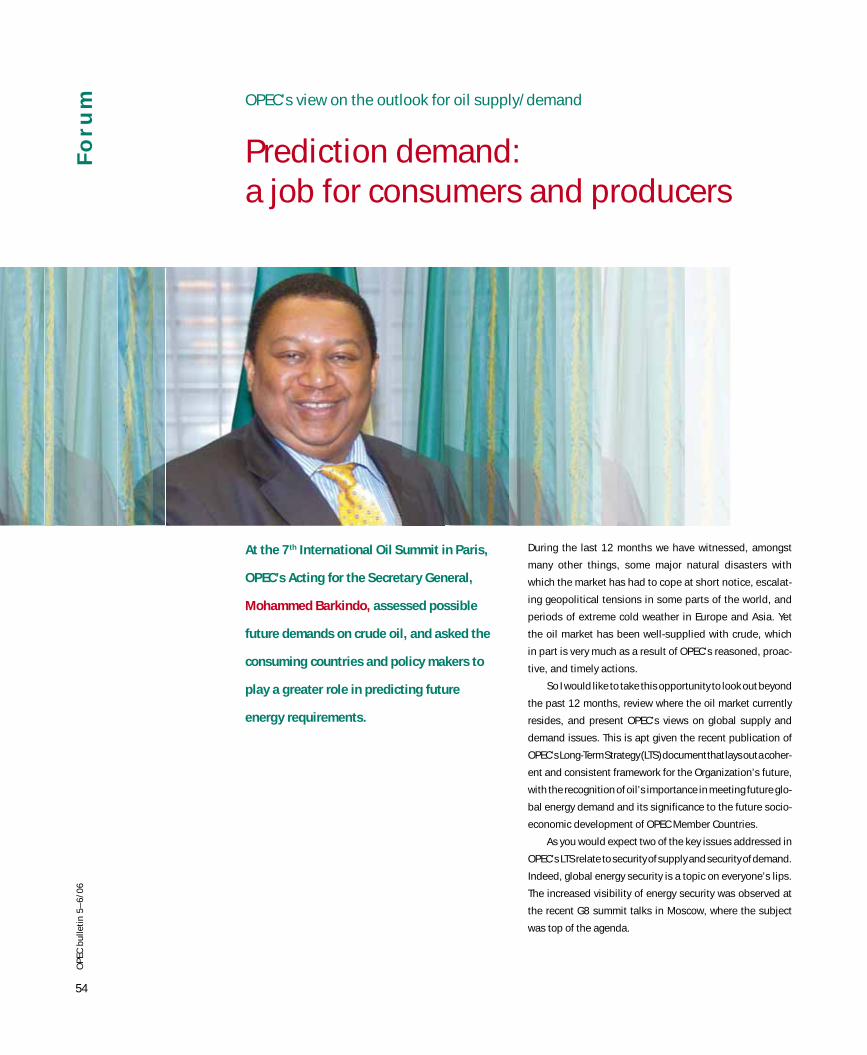
54
OP
EC
bu
lle
tin
5–
6/0
6
OPEC’s view on the outlook for oil supply/demand
Prediction demand:
a job for consumers and producers
During the last 12 months we have witnessed, amongst
many other things, some major natural disasters with
which the market has had to cope at short notice, escalat-
ing geopolitical tensions in some parts of the world, and
periods of extreme cold weather in Europe and Asia. Yet
the oil market has been well-supplied with crude, which
in part is very much as a result of OPEC’s reasoned, proac-
tive, and timely actions.
So I would like to take this opportunity to look out beyond
the past 12 months, review where the oil market currently
resides, and present OPEC’s views on global supply and
demand issues. This is apt given the recent publication of
OPEC’s Long-Term Strategy (LTS) document that lays out a coher-
ent and consistent framework for the Organization’s future,
with the recognition of oil’s importance in meeting future glo-
bal energy demand and its significance to the future socio-
economic development of OPEC Member Countries.
As you would expect two of the key issues addressed in
OPEC’s LTS relate to security of supply and security of demand.
Indeed, global energy security is a topic on everyone’s lips.
The increased visibility of energy security was observed at
the recent G8 summit talks in Moscow, where the subject
was top of the agenda.
At the 7th International Oil Summit in Paris,
OPEC’s Acting for the Secretary General,
Mohammed Barkindo, assessed possible
future demands on crude oil, and asked the
consuming countries and policy makers to
play a greater role in predicting future
energy requirements.
Fo
ru
m
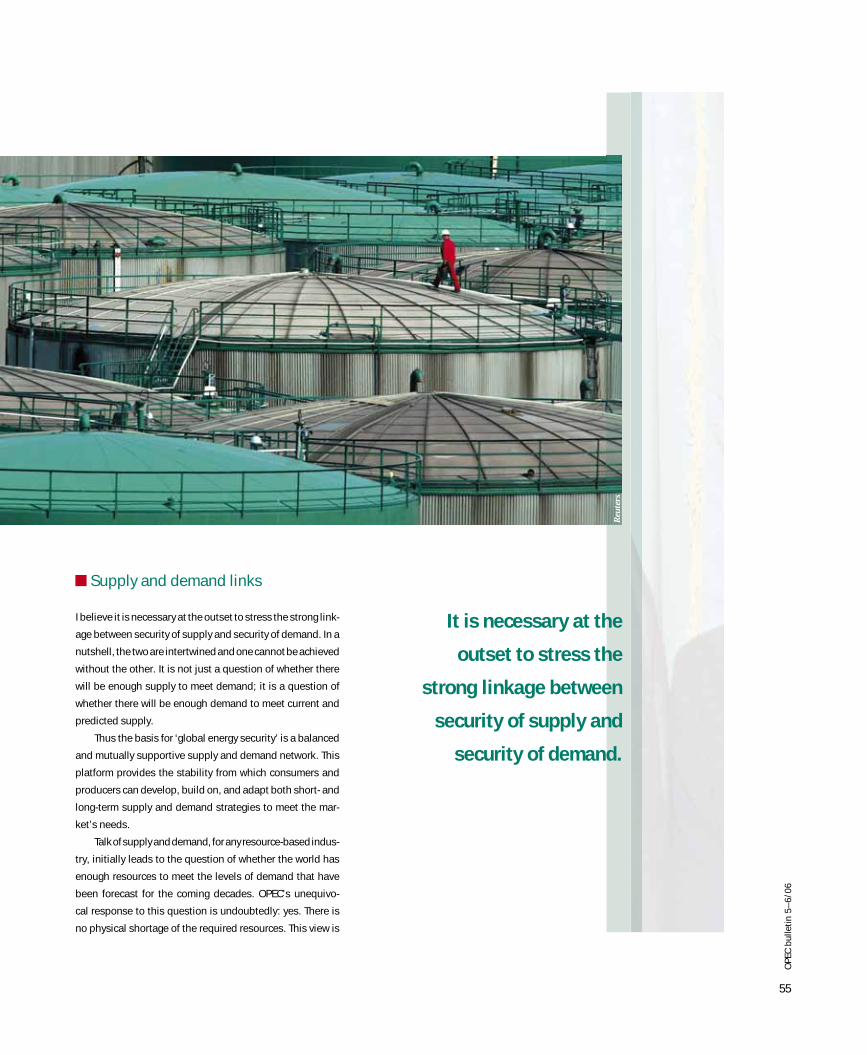
55
OP
EC
bu
lle
tin
5–
6/0
6
Supply and demand links
I believe it is necessary at the outset to stress the strong link-
age between security of supply and security of demand. In a
nutshell, the two are intertwined and one cannot be achieved
without the other. It is not just a question of whether there
will be enough supply to meet demand; it is a question of
whether there will be enough demand to meet current and
predicted supply.
Thus the basis for ‘global energy security’ is a balanced
and mutually supportive supply and demand network. This
platform provides the stability from which consumers and
producers can develop, build on, and adapt both short- and
long-term supply and demand strategies to meet the mar-
ket’s needs.
Talk of supply and demand, for any resource-based indus-
try, initially leads to the question of whether the world has
enough resources to meet the levels of demand that have
been forecast for the coming decades. OPEC’s unequivo-
cal response to this question is undoubtedly: yes. There is
no physical shortage of the required resources. This view is
It is necessary at the
outset to stress the
strong linkage between
security of supply and
security of demand.
Reu
ters
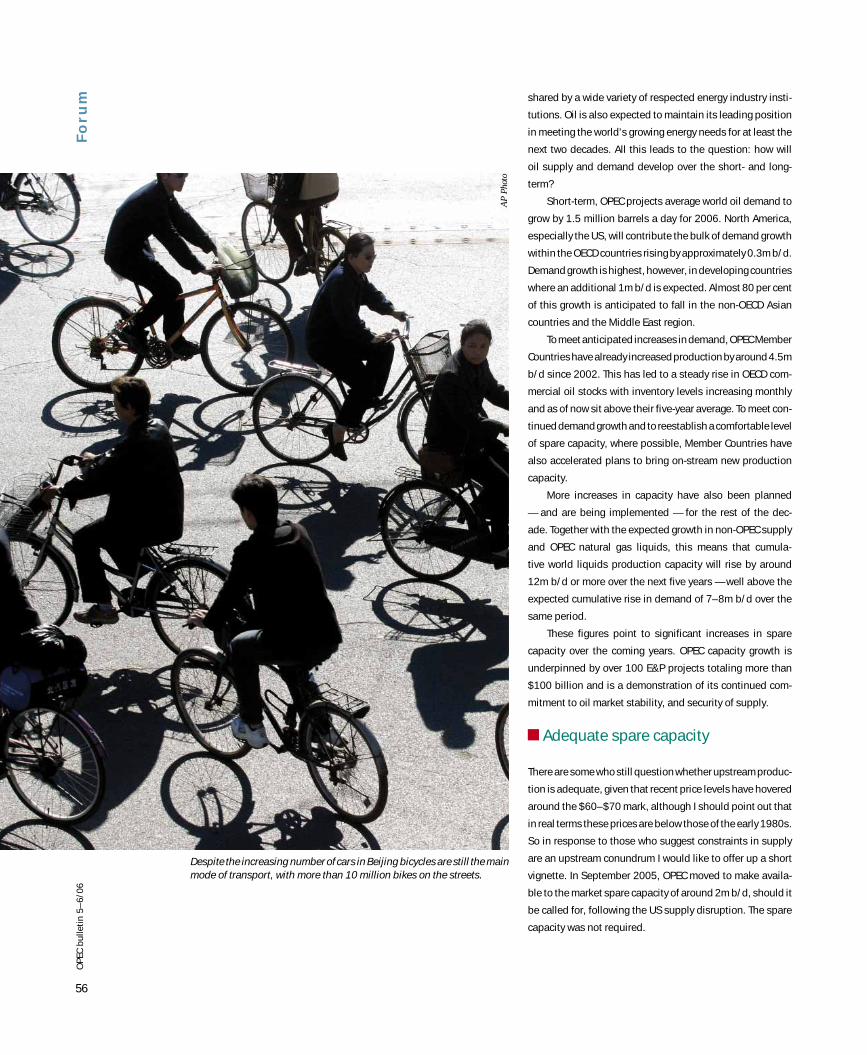
56
OP
EC
bu
lle
tin
5–
6/0
6F
or
um shared by a wide variety of respected energy industry insti-
tutions. Oil is also expected to maintain its leading position
in meeting the world’s growing energy needs for at least the
next two decades. All this leads to the question: how will
oil supply and demand develop over the short- and long-
term?
Short-term, OPEC projects average world oil demand to
grow by 1.5 million barrels a day for 2006. North America,
especially the US, will contribute the bulk of demand growth
within the OECD countries rising by approximately 0.3m b/d.
Demand growth is highest, however, in developing countries
where an additional 1m b/d is expected. Almost 80 per cent
of this growth is anticipated to fall in the non-OECD Asian
countries and the Middle East region.
To meet anticipated increases in demand, OPEC Member
Countries have already increased production by around 4.5m
b/d since 2002. This has led to a steady rise in OECD com-
mercial oil stocks with inventory levels increasing monthly
and as of now sit above their five-year average. To meet con-
tinued demand growth and to reestablish a comfortable level
of spare capacity, where possible, Member Countries have
also accelerated plans to bring on-stream new production
capacity.
More increases in capacity have also been planned
— and are being implemented — for the rest of the dec-
ade. Together with the expected growth in non-OPEC supply
and OPEC natural gas liquids, this means that cumula-
tive world liquids production capacity will rise by around
12m b/d or more over the next five years — well above the
expected cumulative rise in demand of 7–8m b/d over the
same period.
These figures point to significant increases in spare
capacity over the coming years. OPEC capacity growth is
underpinned by over 100 E&P projects totaling more than
$100 billion and is a demonstration of its continued com-
mitment to oil market stability, and security of supply.
Adequate spare capacity
There are some who still question whether upstream produc-
tion is adequate, given that recent price levels have hovered
around the $60–$70 mark, although I should point out that
in real terms these prices are below those of the early 1980s.
So in response to those who suggest constraints in supply
are an upstream conundrum I would like to offer up a short
vignette. In September 2005, OPEC moved to make availa-
ble to the market spare capacity of around 2m b/d, should it
be called for, following the US supply disruption. The spare
capacity was not required.
AP
Phot
o
Despite the increasing number of cars in Beijing bicycles are still the main mode of transport, with more than 10 million bikes on the streets.
57
OP
EC
bu
lle
tin
5–
6/0
6
Intimation that supply constraints are an upstream con-
cern is not borne out by this recent event. It is more a market
perception than based on any reality. Recent OPEC research
has sought to enhance the understanding of what is driving
current price levels. Since 2004, the traditional approach
to assessing the tightness of the oil market, based on oil
inventories as an explanation for oil price movements, has
not been applicable.
Downstream investments
Despite continual rising inventory levels on the back of
OPEC’s additional capacity, prices continued to increase in
2004 and 2005. Research points to downstream tightness,
as well as the perception of upstream constraints, which
has led to increased activity in the futures market and a sig-
nificant rise in open interests, namely the number of out-
standing contracts for which an entity has not yet made an
offsetting sale or purchase. Geopolitical concerns obviously
play a role too.
OPEC’s Member Countries, although traditionally asso-
ciated more with the upstream, have themselves taken the
initiative to invest in downstream projects; this has been on
their own and in partnership with others. Currently, 600,000
b/d of new refinery capacity is under construction, with an
additional 1.9m b/d planned. However, all of this does not
escape the fact that downstream investment is primarily the
responsibility of the international oil companies and consum-
ing countries.
Inadequate past investment and increasingly stringent
product specifications have been major factors behind this
lack of effective global refining capacity and today invest-
ments in the refining sector are also coming at a consider-
ably slower pace than is warranted by expected growth in
demand. Thus, the downstream sector could very well remain
a source of market instability over the coming years.
As well as these downstream concerns, OPEC’s LTS under-
lines a number of challenges that may impact future world
oil demand, such as world economic growth and expanding
vehicle usage, country demographics, consuming countries’
energy and environmental policies, and technology devel-
opment. Questions over how future non-OPEC production
might evolve further compounds the uncertainty regarding
how much oil will be needed from OPEC to achieve a supply
and demand balance.
These uncertainties are explored in the LTS by three con-
sistent scenarios, the first of which envisages a future follow-
ing previous oil demand patterns, with the other two explor-
ing futures leading to lower and higher rates of oil demand
growth respectively. The difference between the lower and
higher rates of oil demand growth out to 2020 is more than
12m b/d.
Global economic growth
Let me initially focus on global economic growth. This is very
much a major unknown and an obvious leading driver for
future demand. In recent years, extremes of economic activ-
ity have demonstrated the difficulty of assessing what might
reasonably be expected to occur over the next 20 years. The
average rate of world economic growth in 2004, over five per
cent per annum, had not been experienced since the early
1970s, while economic growth in 2005 was the third fastest
over the past two decades. On the other hand, as recently
as 2001, world economic growth was at its lowest for more
than a decade, while 1998 also saw weak global growth in
the wake of the Asian financial crisis.
By far the greatest increase in future demand is expected
from developing countries. The recent rapid economic growth
of countries such as China and India are cases in point. With
a combined population approaching 2.5 billion, the two coun-
tries have recently witnessed significant demand increases.
And in the future demand is expected to rise further.
For example, in China and India, there are now just
10–20 vehicles per 1,000 inhabitants, compared with more
than 500 vehicles per 1,000 inhabitants in the OECD region.
With the transportation sector expected to be the single
most important source of demand increase, there is clearly
enormous potential for the transport sector growth in these
two countries alone.
and
than
very
r for
ctiv-
ight
The
e per
early
stest
ently
more
th in
cted
owth
With
oun-
ses.
just
more
gion.
ngle
early
hese
In China and India,
there are now just
10–20 vehicles per 1,000
inhabitants, compared with
more than 500 vehicles per
1,000 inhabitants in the
OECD region.
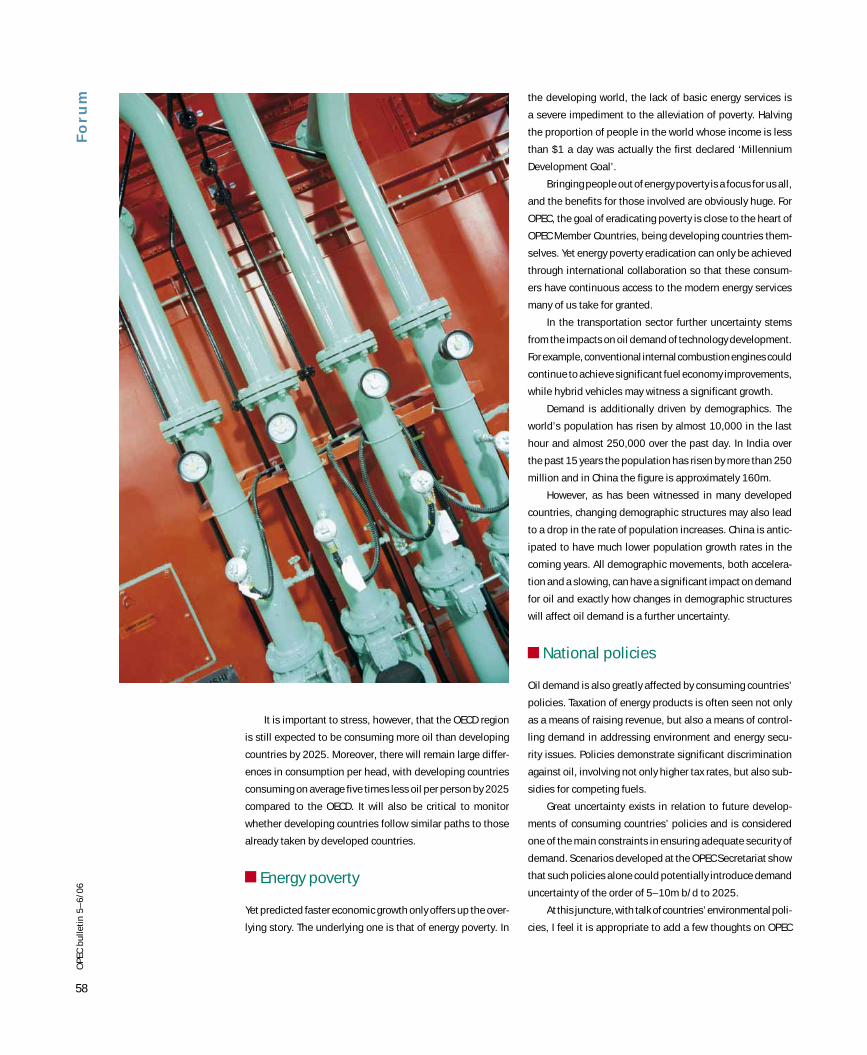
58
OP
EC
bu
lle
tin
5–
6/0
6F
or
um
It is important to stress, however, that the OECD region
is still expected to be consuming more oil than developing
countries by 2025. Moreover, there will remain large differ-
ences in consumption per head, with developing countries
consuming on average five times less oil per person by 2025
compared to the OECD. It will also be critical to monitor
whether developing countries follow similar paths to those
already taken by developed countries.
Energy poverty
Yet predicted faster economic growth only offers up the over-
lying story. The underlying one is that of energy poverty. In
the developing world, the lack of basic energy services is
a severe impediment to the alleviation of poverty. Halving
the proportion of people in the world whose income is less
than $1 a day was actually the first declared ‘Millennium
Development Goal’.
Bringing people out of energy poverty is a focus for us all,
and the benefits for those involved are obviously huge. For
OPEC, the goal of eradicating poverty is close to the heart of
OPEC Member Countries, being developing countries them-
selves. Yet energy poverty eradication can only be achieved
through international collaboration so that these consum-
ers have continuous access to the modern energy services
many of us take for granted.
In the transportation sector further uncertainty stems
from the impacts on oil demand of technology development.
For example, conventional internal combustion engines could
continue to achieve significant fuel economy improvements,
while hybrid vehicles may witness a significant growth.
Demand is additionally driven by demographics. The
world’s population has risen by almost 10,000 in the last
hour and almost 250,000 over the past day. In India over
the past 15 years the population has risen by more than 250
million and in China the figure is approximately 160m.
However, as has been witnessed in many developed
countries, changing demographic structures may also lead
to a drop in the rate of population increases. China is antic-
ipated to have much lower population growth rates in the
coming years. All demographic movements, both accelera-
tion and a slowing, can have a significant impact on demand
for oil and exactly how changes in demographic structures
will affect oil demand is a further uncertainty.
National policies
Oil demand is also greatly affected by consuming countries’
policies. Taxation of energy products is often seen not only
as a means of raising revenue, but also a means of control-
ling demand in addressing environment and energy secu-
rity issues. Policies demonstrate significant discrimination
against oil, involving not only higher tax rates, but also sub-
sidies for competing fuels.
Great uncertainty exists in relation to future develop-
ments of consuming countries’ policies and is considered
one of the main constraints in ensuring adequate security of
demand. Scenarios developed at the OPEC Secretariat show
that such policies alone could potentially introduce demand
uncertainty of the order of 5–10m b/d to 2025.
At this juncture, with talk of countries’ environmental poli-
cies, I feel it is appropriate to add a few thoughts on OPEC
59
OP
EC
bu
lle
tin
5–
6/0
6
and the environment. Although OPEC is concerned about
the impact of environmental policies from consuming coun-
tries, this does not alter the fact that it remains committed
to working with all parties to achieve sound and balanced
environmental policies that do not undermine the ability of
developing countries to pursue their legitimate goals of eco-
nomic and social advancement.
Climate concerns
OPEC also recognises that its Member Countries need to play
an active role in addressing climate change concerns and as
an Organization welcomes the Kyoto Protocol. Though renew-
ables can and will make a further contribution to the energy
mix, their likely limited role for the foreseeable future leads
to an expectation of expanded use of fossil fuels, at least
over the next few decades.
In this light, there is a need to emphasise the role of
cleaner fossil fuel technology. In particular, carbon capture
and storage is a promising technology that is cost effective
and can allow the continued use of fossil fuels in a carbon-
constrained world. In conjunction with enhanced oil recov-
ery, it also offers a win-win opportunity. Steps need to be
taken to move this and other advanced and cleaner fossil
fuel technologies forward.
Returning to uncertainties, both singularly and taken as
a whole these all represent significant challenges. If there is
no particular departure from past trends, oil demand might
be expected to grow by something of the order of 1.5m b/d
annually over the next two decades. Yet supply and demand
of OPEC oil is also impacted on by the development of non-
OPEC supply. This further complicates the making appropri-
ate and timely investments in OPEC Member Countries. It
is anticipated that although non-OPEC supply will continue
to expand during this decade and further, it will eventually
reach a plateau.
Given the uncertainties, the amount of oil that OPEC is
projected to supply over the next 10–15 years could range
by as much as 10m b/d or more and somewhere between
$230bn and $470bn in investment terms. This vast range in
oil demand and investment becomes even more acute when
taking into account the long lead and pay back times involved
and it must also be noted that uncertainties are overwhelm-
ingly skewed to the downside.
Dialogue and co-operation
The way forward is dialogue and co-operation. To this end
OPEC continues to devote much effort in this direction, with
dialogue now being widened and deepened in an open and
constructive spirit. As you may know, the most recent result
of this was the establishment, last year, of energy dialogues
between OPEC and, respectively, the European Union, China
and Russia. The close involvement with the International
Energy Forum and the establishment of its Secretariat in
Saudi Arabia demonstrates clearly OPEC’s commitment to
this ongoing process.
OPEC is committed to ‘global energy security’, both today
and in the future and its most recent actions, both upstream
and downstream, bear witness to this. This is no empty state-
ment. It needs to also be recognized that the revenues oil-
producing countries receive from petroleum sales are essen-
tial for financing their economic and social development.
Planning investment
Yet without the confidence that demand for OPEC’s oil will
emerge, the incentive to undertake investment can be
reduced, which, in turn, can exacerbate concerns over even-
tual sufficiency of capacity in the future, and hamper the drive
towards long-term oil market stability.
Thus, more transparency and predictability in the evolu-
tion and implementation of economic, energy and environ-
mental policies in consuming countries, and how they will
affect future demand growth is essential. High-quality, timely
information underpins well-functioning markets and today
there is a particular need for better data on the evolution of
demand and stocks.
As an industry we have to be inclusive: to think and plan
ahead and to look at the needs of the world market, not just
this year and next, but over the next decade and beyond.
That is the timescale on which the industry has to think, and
to invest. ‘Global energy security’ and its twin pillars of sup-
ply and demand may be checkered with uncertainties, but
future market stability resides in all our hands.
end
with
and
sult
gues
hina
onal
at in
nt to
oday
eam
ate-
oil-
sen-
nt.
will
be
ven-
rive
olu-
ron-
will
mely
oday
n of
plan
just
ond.
and
sup-
but
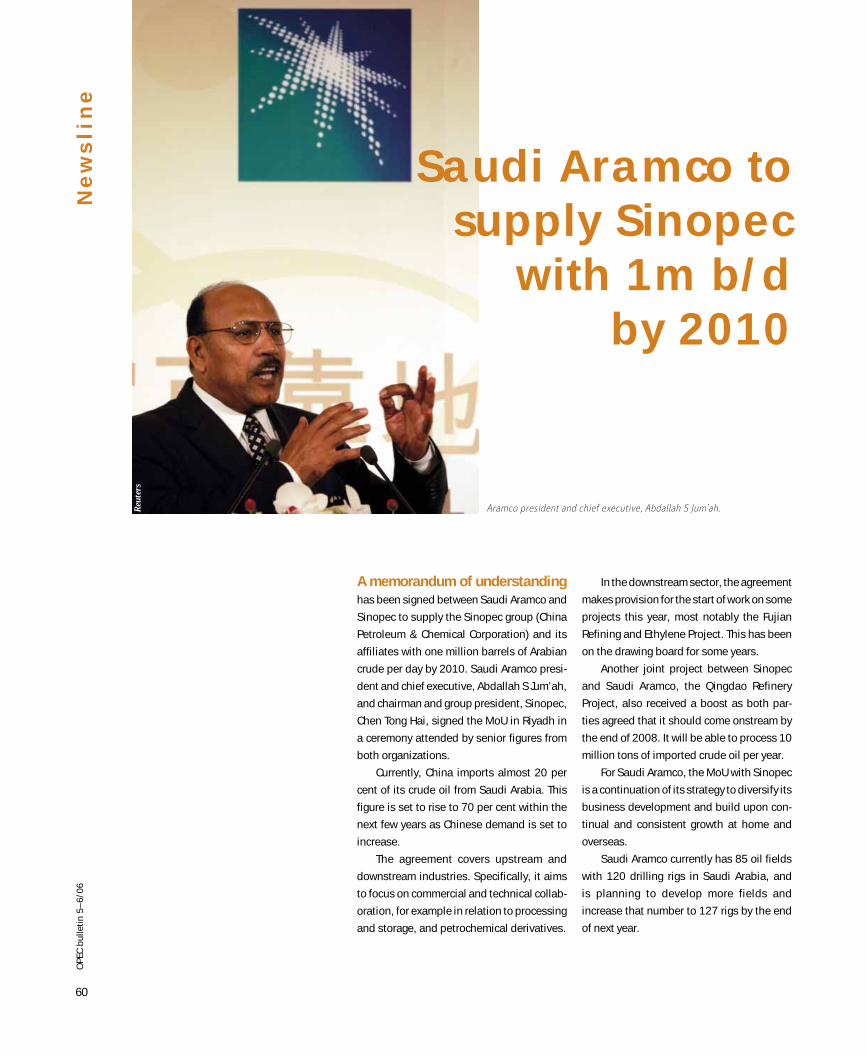
60
OP
EC
bu
lle
tin
5–
6/0
6
A memorandum of understanding
has been signed between Saudi Aramco and
Sinopec to supply the Sinopec group (China
Petroleum & Chemical Corporation) and its
affiliates with one million barrels of Arabian
crude per day by 2010. Saudi Aramco presi-
dent and chief executive, Abdallah S Jum’ah,
and chairman and group president, Sinopec,
Chen Tong Hai, signed the MoU in Riyadh in
a ceremony attended by senior figures from
both organizations.
Currently, China imports almost 20 per
cent of its crude oil from Saudi Arabia. This
figure is set to rise to 70 per cent within the
next few years as Chinese demand is set to
increase.
The agreement covers upstream and
downstream industries. Specifically, it aims
to focus on commercial and technical collab-
oration, for example in relation to processing
and storage, and petrochemical derivatives.
In the downstream sector, the agreement
makes provision for the start of work on some
projects this year, most notably the Fujian
Refining and Ethylene Project. This has been
on the drawing board for some years.
Another joint project between Sinopec
and Saudi Aramco, the Qingdao Refinery
Project, also received a boost as both par-
ties agreed that it should come onstream by
the end of 2008. It will be able to process 10
million tons of imported crude oil per year.
For Saudi Aramco, the MoU with Sinopec
is a continuation of its strategy to diversify its
business development and build upon con-
tinual and consistent growth at home and
overseas.
Saudi Aramco currently has 85 oil fields
with 120 drilling rigs in Saudi Arabia, and
is planning to develop more fields and
increase that number to 127 rigs by the end
of next year.
Ne
ws
li
ne
Saudi Aramco to supply Sinopec
with 1m b/dby 2010
Aramco president and chief executive, Abdallah S Jum’ah.Reu
ters
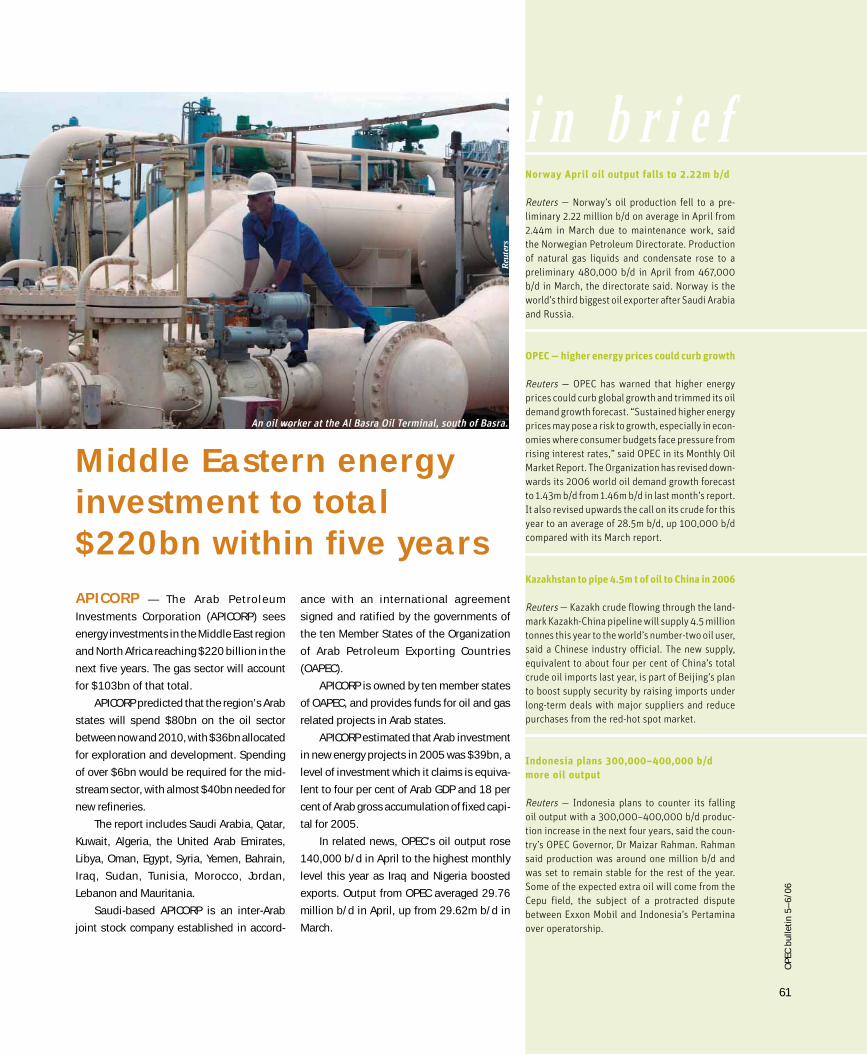
61
OP
EC
bu
lle
tin
5–
6/0
6
i n b r i e fNorway April oil output falls to 2.22m b/d
Reuters — Norway’s oil production fell to a pre-
liminary 2.22 million b/d on average in April from
2.44m in March due to maintenance work, said
the Norwegian Petroleum Directorate. Production
of natural gas liquids and condensate rose to a
preliminary 480,000 b/d in April from 467,000
b/d in March, the directorate said. Norway is the
world’s third biggest oil exporter after Saudi Arabia
and Russia.
OPEC — higher energy prices could curb growth
Reuters — OPEC has warned that higher energy
prices could curb global growth and trimmed its oil
demand growth forecast. “Sustained higher energy
prices may pose a risk to growth, especially in econ-
omies where consumer budgets face pressure from
rising interest rates,” said OPEC in its Monthly Oil
Market Report. The Organization has revised down-
wards its 2006 world oil demand growth forecast
to 1.43m b/d from 1.46m b/d in last month’s report.
It also revised upwards the call on its crude for this
year to an average of 28.5m b/d, up 100,000 b/d
compared with its March report.
Kazakhstan to pipe 4.5m t of oil to China in 2006
Reuters — Kazakh crude flowing through the land-
mark Kazakh-China pipeline will supply 4.5 million
tonnes this year to the world’s number-two oil user,
said a Chinese industry official. The new supply,
equivalent to about four per cent of China’s total
crude oil imports last year, is part of Beijing’s plan
to boost supply security by raising imports under
long-term deals with major suppliers and reduce
purchases from the red-hot spot market.
Indonesia plans 300,000–400,000 b/d
more oil output
Reuters — Indonesia plans to counter its falling
oil output with a 300,000–400,000 b/d produc-
tion increase in the next four years, said the coun-
try’s OPEC Governor, Dr Maizar Rahman. Rahman
said production was around one million b/d and
was set to remain stable for the rest of the year.
Some of the expected extra oil will come from the
Cepu field, the subject of a protracted dispute
between Exxon Mobil and Indonesia’s Pertamina
over operatorship.
APICORP — The Arab Petroleum
Investments Corporation (APICORP) sees
energy investments in the Middle East region
and North Africa reaching $220 billion in the
next five years. The gas sector will account
for $103bn of that total.
APICORP predicted that the region’s Arab
states will spend $80bn on the oil sector
between now and 2010, with $36bn allocated
for exploration and development. Spending
of over $6bn would be required for the mid-
stream sector, with almost $40bn needed for
new refineries.
The report includes Saudi Arabia, Qatar,
Kuwait, Algeria, the United Arab Emirates,
Libya, Oman, Egypt, Syria, Yemen, Bahrain,
Iraq, Sudan, Tunisia, Morocco, Jordan,
Lebanon and Mauritania.
Saudi-based APICORP is an inter-Arab
joint stock company established in accord-
Middle Eastern energy investment to total $220bn within five years
ance with an international agreement
signed and ratified by the governments of
the ten Member States of the Organization
of Arab Petroleum Exporting Countries
(OAPEC).
APICORP is owned by ten member states
of OAPEC, and provides funds for oil and gas
related projects in Arab states.
APICORP estimated that Arab investment
in new energy projects in 2005 was $39bn, a
level of investment which it claims is equiva-
lent to four per cent of Arab GDP and 18 per
cent of Arab gross accumulation of fixed capi-
tal for 2005.
In related news, OPEC’s oil output rose
140,000 b/d in April to the highest monthly
level this year as Iraq and Nigeria boosted
exports. Output from OPEC averaged 29.76
million b/d in April, up from 29.62m b/d in
March.
Reu
ters
An oil worker at the Al Basra Oil Terminal, south of Basra.
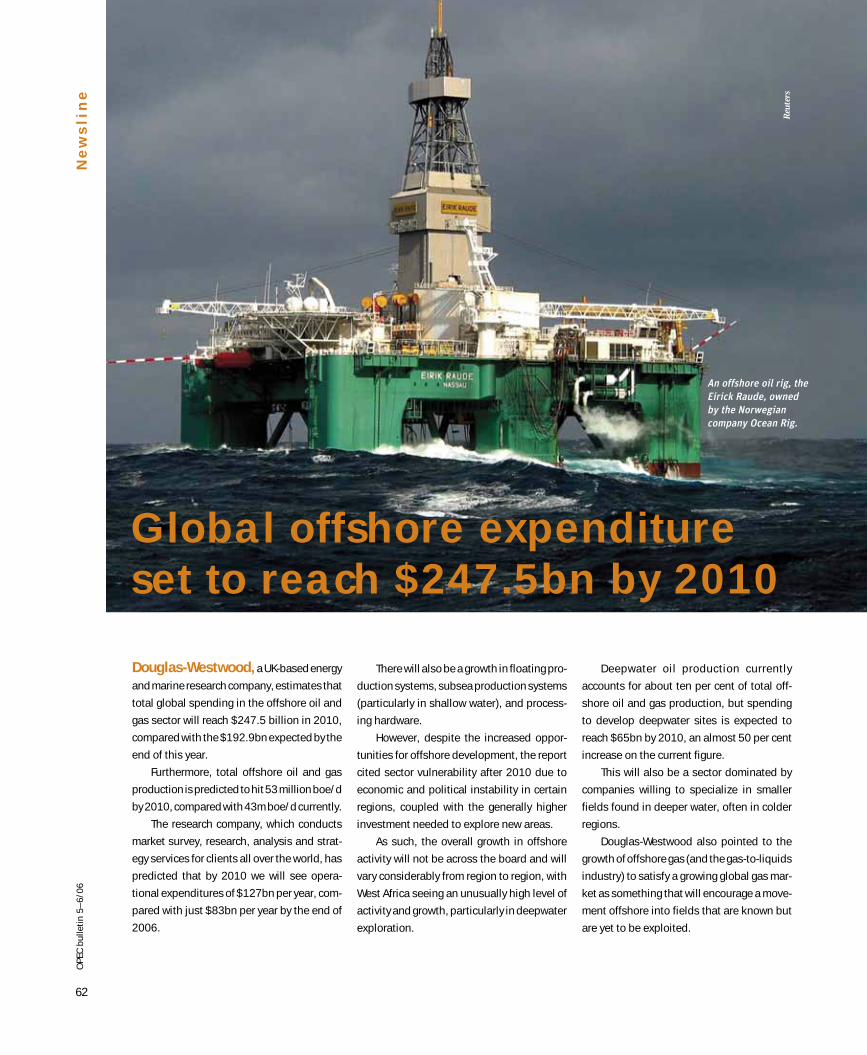
62
OP
EC
bu
lle
tin
5–
6/0
6N
ew
sl
in
e
Douglas-Westwood, a UK-based energy
and marine research company, estimates that
total global spending in the offshore oil and
gas sector will reach $247.5 billion in 2010,
compared with the $192.9bn expected by the
end of this year.
Furthermore, total offshore oil and gas
production is predicted to hit 53 million boe/d
by 2010, compared with 43m boe/d currently.
The research company, which conducts
market survey, research, analysis and strat-
egy services for clients all over the world, has
predicted that by 2010 we will see opera-
tional expenditures of $127bn per year, com-
pared with just $83bn per year by the end of
2006.
There will also be a growth in floating pro-
duction systems, subsea production systems
(particularly in shallow water), and process-
ing hardware.
However, despite the increased oppor-
tunities for offshore development, the report
cited sector vulnerability after 2010 due to
economic and political instability in certain
regions, coupled with the generally higher
investment needed to explore new areas.
As such, the overall growth in offshore
activity will not be across the board and will
vary considerably from region to region, with
West Africa seeing an unusually high level of
activity and growth, particularly in deepwater
exploration.
Deepwater oil production currently
accounts for about ten per cent of total off-
shore oil and gas production, but spending
to develop deepwater sites is expected to
reach $65bn by 2010, an almost 50 per cent
increase on the current figure.
This will also be a sector dominated by
companies willing to specialize in smaller
fields found in deeper water, often in colder
regions.
Douglas-Westwood also pointed to the
growth of offshore gas (and the gas-to-liquids
industry) to satisfy a growing global gas mar-
ket as something that will encourage a move-
ment offshore into fields that are known but
are yet to be exploited.
Global offshore expenditureset to reach $247.5bn by 2010
Reu
ters
An offshore oil rig, the
Eirick Raude, owned
by the Norwegian
company Ocean Rig.
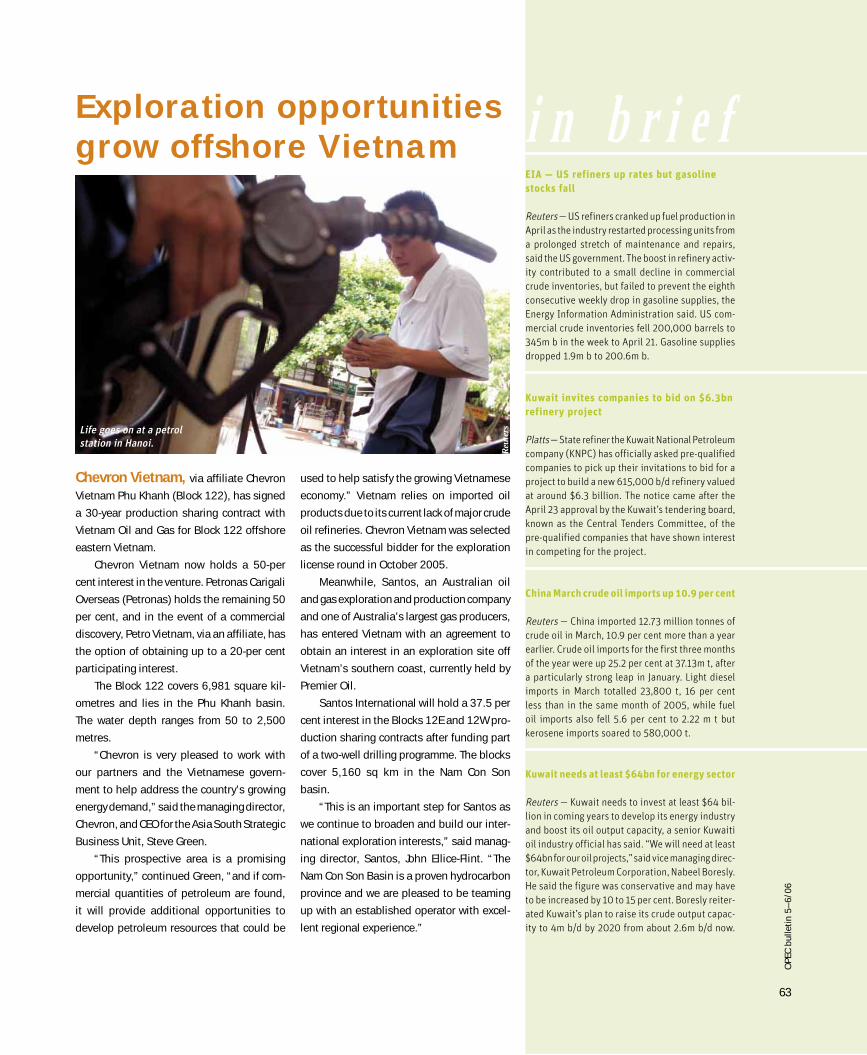
63
OP
EC
bu
lle
tin
5–
6/0
6
i n b r i e fEIA — US refiners up rates but gasoline
stocks fall
Reuters — US refiners cranked up fuel production in
April as the industry restarted processing units from
a prolonged stretch of maintenance and repairs,
said the US government. The boost in refinery activ-
ity contributed to a small decline in commercial
crude inventories, but failed to prevent the eighth
consecutive weekly drop in gasoline supplies, the
Energy Information Administration said. US com-
mercial crude inventories fell 200,000 barrels to
345m b in the week to April 21. Gasoline supplies
dropped 1.9m b to 200.6m b.
Kuwait invites companies to bid on $6.3bn
refinery project
Platts — State refiner the Kuwait National Petroleum
company (KNPC) has officially asked pre-qualified
companies to pick up their invitations to bid for a
project to build a new 615,000 b/d refinery valued
at around $6.3 billion. The notice came after the
April 23 approval by the Kuwait’s tendering board,
known as the Central Tenders Committee, of the
pre-qualified companies that have shown interest
in competing for the project.
China March crude oil imports up 10.9 per cent
Reuters — China imported 12.73 million tonnes of
crude oil in March, 10.9 per cent more than a year
earlier. Crude oil imports for the first three months
of the year were up 25.2 per cent at 37.13m t, after
a particularly strong leap in January. Light diesel
imports in March totalled 23,800 t, 16 per cent
less than in the same month of 2005, while fuel
oil imports also fell 5.6 per cent to 2.22 m t but
kerosene imports soared to 580,000 t.
Kuwait needs at least $64bn for energy sector
Reuters — Kuwait needs to invest at least $64 bil-
lion in coming years to develop its energy industry
and boost its oil output capacity, a senior Kuwaiti
oil industry official has said. “We will need at least
$64bn for our oil projects,” said vice managing direc-
tor, Kuwait Petroleum Corporation, Nabeel Boresly.
He said the figure was conservative and may have
to be increased by 10 to 15 per cent. Boresly reiter-
ated Kuwait’s plan to raise its crude output capac-
ity to 4m b/d by 2020 from about 2.6m b/d now.
Exploration opportunities grow offshore Vietnam
Chevron Vietnam, via affiliate Chevron
Vietnam Phu Khanh (Block 122), has signed
a 30-year production sharing contract with
Vietnam Oil and Gas for Block 122 offshore
eastern Vietnam.
Chevron Vietnam now holds a 50-per
cent interest in the venture. Petronas Carigali
Overseas (Petronas) holds the remaining 50
per cent, and in the event of a commercial
discovery, Petro Vietnam, via an affiliate, has
the option of obtaining up to a 20-per cent
participating interest.
The Block 122 covers 6,981 square kil-
ometres and lies in the Phu Khanh basin.
The water depth ranges from 50 to 2,500
metres.
“Chevron is very pleased to work with
our partners and the Vietnamese govern-
ment to help address the country’s growing
energy demand,” said the managing director,
Chevron, and CEO for the Asia South Strategic
Business Unit, Steve Green.
“This prospective area is a promising
opportunity,” continued Green, “and if com-
mercial quantities of petroleum are found,
it will provide additional opportunities to
develop petroleum resources that could be
Reu
tersLife goes on at a petrol
station in Hanoi.
used to help satisfy the growing Vietnamese
economy.” Vietnam relies on imported oil
products due to its current lack of major crude
oil refineries. Chevron Vietnam was selected
as the successful bidder for the exploration
license round in October 2005.
Meanwhile, Santos, an Australian oil
and gas exploration and production company
and one of Australia’s largest gas producers,
has entered Vietnam with an agreement to
obtain an interest in an exploration site off
Vietnam’s southern coast, currently held by
Premier Oil.
Santos International will hold a 37.5 per
cent interest in the Blocks 12E and 12W pro-
duction sharing contracts after funding part
of a two-well drilling programme. The blocks
cover 5,160 sq km in the Nam Con Son
basin.
“This is an important step for Santos as
we continue to broaden and build our inter-
national exploration interests,” said manag-
ing director, Santos, John Ellice-Flint. “The
Nam Con Son Basin is a proven hydrocarbon
province and we are pleased to be teaming
up with an established operator with excel-
lent regional experience.”
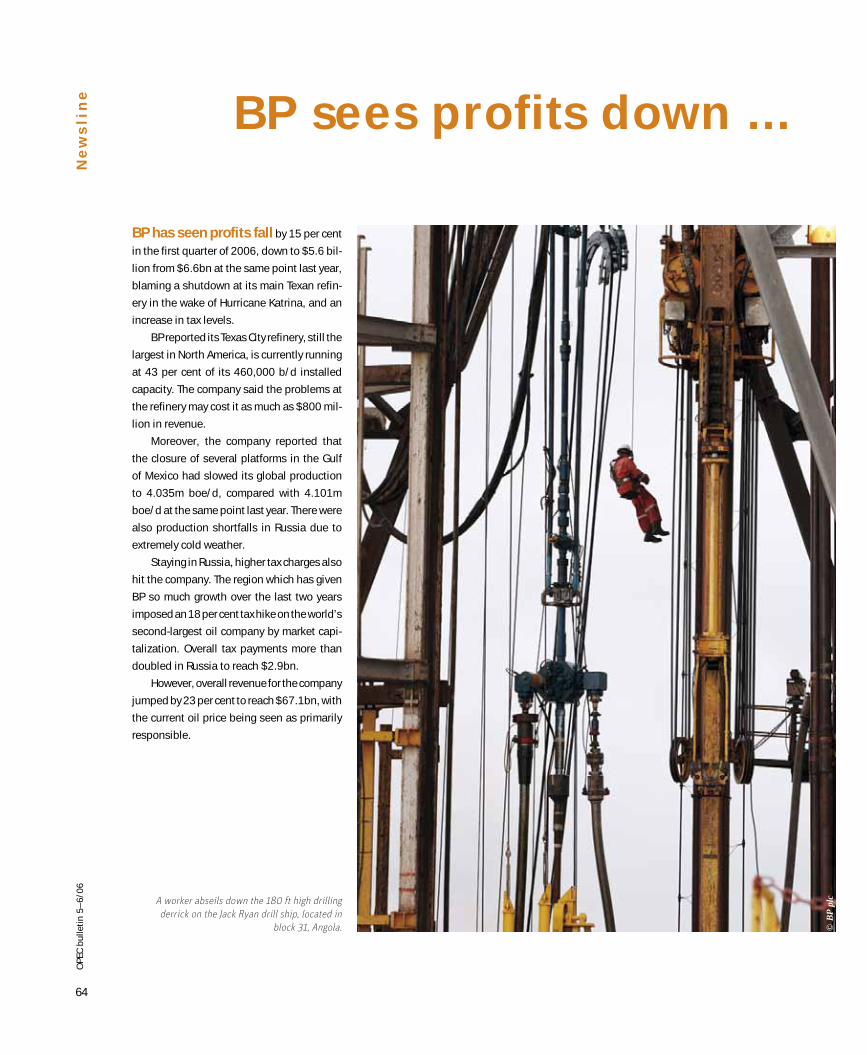
64
OP
EC
bu
lle
tin
5–
6/0
6N
ew
sl
in
e
BP has seen profits fall by 15 per cent
in the first quarter of 2006, down to $5.6 bil-
lion from $6.6bn at the same point last year,
blaming a shutdown at its main Texan refin-
ery in the wake of Hurricane Katrina, and an
increase in tax levels.
BP reported its Texas City refinery, still the
largest in North America, is currently running
at 43 per cent of its 460,000 b/d installed
capacity. The company said the problems at
the refinery may cost it as much as $800 mil-
lion in revenue.
Moreover, the company reported that
the closure of several platforms in the Gulf
of Mexico had slowed its global production
to 4.035m boe/d, compared with 4.101m
boe/d at the same point last year. There were
also production shortfalls in Russia due to
extremely cold weather.
Staying in Russia, higher tax charges also
hit the company. The region which has given
BP so much growth over the last two years
imposed an 18 per cent tax hike on the world’s
second-largest oil company by market capi-
talization. Overall tax payments more than
doubled in Russia to reach $2.9bn.
However, overall revenue for the company
jumped by 23 per cent to reach $67.1bn, with
the current oil price being seen as primarily
responsible.
BP sees profits down ...
© B
P p
lcA worker abseils down the 180 ft high drilling
derrick on the Jack Ryan drill ship, located in
block 31, Angola.
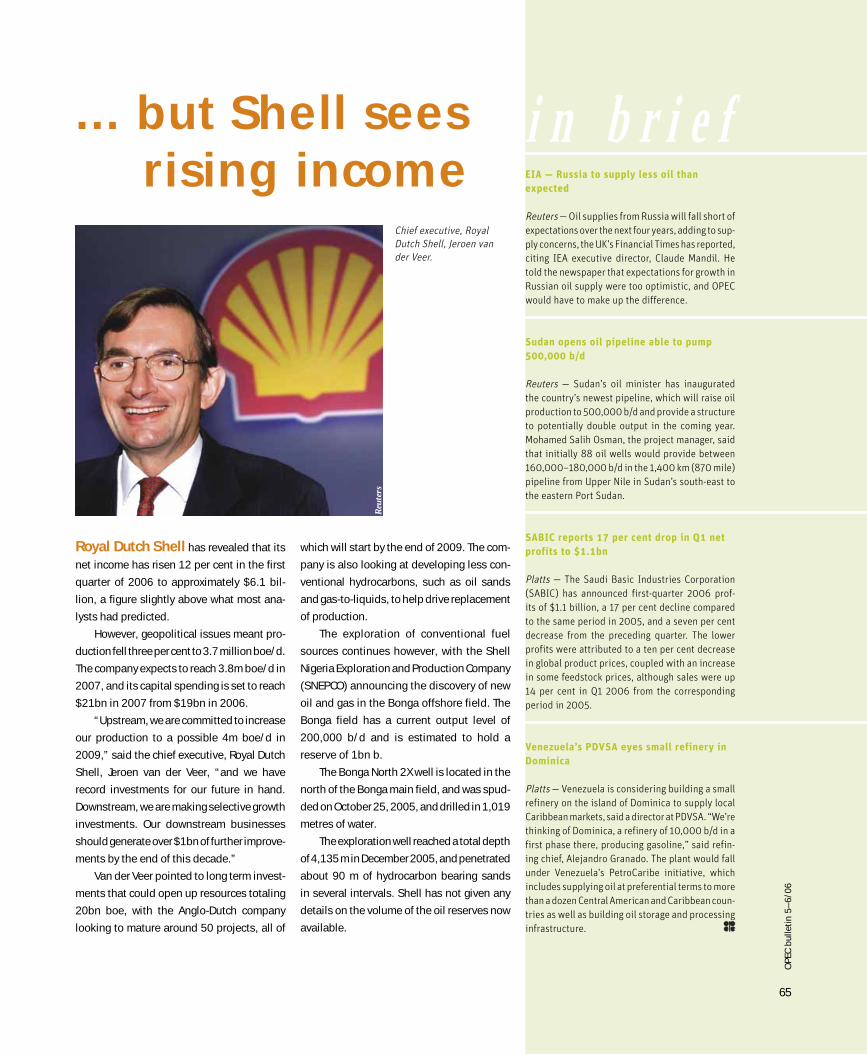
65
OP
EC
bu
lle
tin
5–
6/0
6
i n b r i e fEIA — Russia to supply less oil than
expected
Reuters — Oil supplies from Russia will fall short of
expectations over the next four years, adding to sup-
ply concerns, the UK’s Financial Times has reported,
citing IEA executive director, Claude Mandil. He
told the newspaper that expectations for growth in
Russian oil supply were too optimistic, and OPEC
would have to make up the difference.
Sudan opens oil pipeline able to pump
500,000 b/d
Reuters — Sudan’s oil minister has inaugurated
the country’s newest pipeline, which will raise oil
production to 500,000 b/d and provide a structure
to potentially double output in the coming year.
Mohamed Salih Osman, the project manager, said
that initially 88 oil wells would provide between
160,000–180,000 b/d in the 1,400 km (870 mile)
pipeline from Upper Nile in Sudan’s south-east to
the eastern Port Sudan.
SABIC reports 17 per cent drop in Q1 net
profits to $1.1bn
Platts — The Saudi Basic Industries Corporation
(SABIC) has announced first-quarter 2006 prof-
its of $1.1 billion, a 17 per cent decline compared
to the same period in 2005, and a seven per cent
decrease from the preceding quarter. The lower
profits were attributed to a ten per cent decrease
in global product prices, coupled with an increase
in some feedstock prices, although sales were up
14 per cent in Q1 2006 from the corresponding
period in 2005.
Venezuela’s PDVSA eyes small refinery in
Dominica
Platts — Venezuela is considering building a small
refinery on the island of Dominica to supply local
Caribbean markets, said a director at PDVSA. “We’re
thinking of Dominica, a refinery of 10,000 b/d in a
first phase there, producing gasoline,” said refin-
ing chief, Alejandro Granado. The plant would fall
under Venezuela’s PetroCaribe initiative, which
includes supplying oil at preferential terms to more
than a dozen Central American and Caribbean coun-
tries as well as building oil storage and processing
infrastructure.
Royal Dutch Shell has revealed that its
net income has risen 12 per cent in the first
quarter of 2006 to approximately $6.1 bil-
lion, a figure slightly above what most ana-
lysts had predicted.
However, geopolitical issues meant pro-
duction fell three per cent to 3.7 million boe/d.
The company expects to reach 3.8m boe/d in
2007, and its capital spending is set to reach
$21bn in 2007 from $19bn in 2006.
“Upstream, we are committed to increase
our production to a possible 4m boe/d in
2009,” said the chief executive, Royal Dutch
Shell, Jeroen van der Veer, “and we have
record investments for our future in hand.
Downstream, we are making selective growth
investments. Our downstream businesses
should generate over $1bn of further improve-
ments by the end of this decade.”
Van der Veer pointed to long term invest-
ments that could open up resources totaling
20bn boe, with the Anglo-Dutch company
looking to mature around 50 projects, all of
which will start by the end of 2009. The com-
pany is also looking at developing less con-
ventional hydrocarbons, such as oil sands
and gas-to-liquids, to help drive replacement
of production.
The exploration of conventional fuel
sources continues however, with the Shell
Nigeria Exploration and Production Company
(SNEPCO) announcing the discovery of new
oil and gas in the Bonga offshore field. The
Bonga field has a current output level of
200,000 b/d and is estimated to hold a
reserve of 1bn b.
The Bonga North 2X well is located in the
north of the Bonga main field, and was spud-
ded on October 25, 2005, and drilled in 1,019
metres of water.
The exploration well reached a total depth
of 4,135 m in December 2005, and penetrated
about 90 m of hydrocarbon bearing sands
in several intervals. Shell has not given any
details on the volume of the oil reserves now
available.
… but Shell sees rising income
Chief executive, Royal
Dutch Shell, Jeroen van
der Veer.
Reu
ters
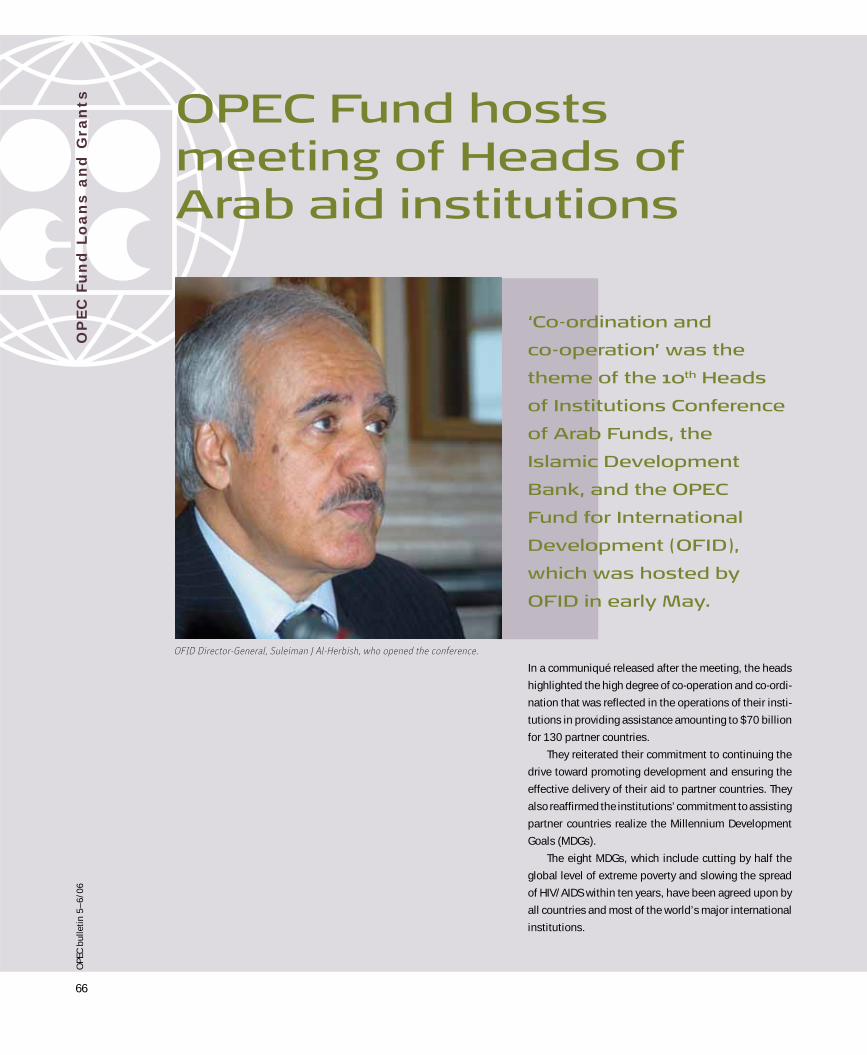
66
OP
EC
bu
lle
tin
5–
6/0
6O
PE
C F
un
d L
oa
ns
an
d G
ra
nt
s
OPEC Fund hosts
meeting of Heads of
Arab aid institutions
OFID Director-General, Suleiman J Al-Herbish, who opened the conference.
In a communiqué released after the meeting, the heads
highlighted the high degree of co-operation and co-ordi-
nation that was reflected in the operations of their insti-
tutions in providing assistance amounting to $70 billion
for 130 partner countries.
They reiterated their commitment to continuing the
drive toward promoting development and ensuring the
effective delivery of their aid to partner countries. They
also reaffirmed the institutions’ commitment to assisting
partner countries realize the Millennium Development
Goals (MDGs).
The eight MDGs, which include cutting by half the
global level of extreme poverty and slowing the spread
of HIV/AIDS within ten years, have been agreed upon by
all countries and most of the world’s major international
institutions.
‘Co-ordination and
co-operation’ was the
theme of the 10th Heads
of Institutions Conference
of Arab Funds, the
Islamic Development
Bank, and the OPEC
Fund for International
Development (OFID),
which was hosted by
OFID in early May.
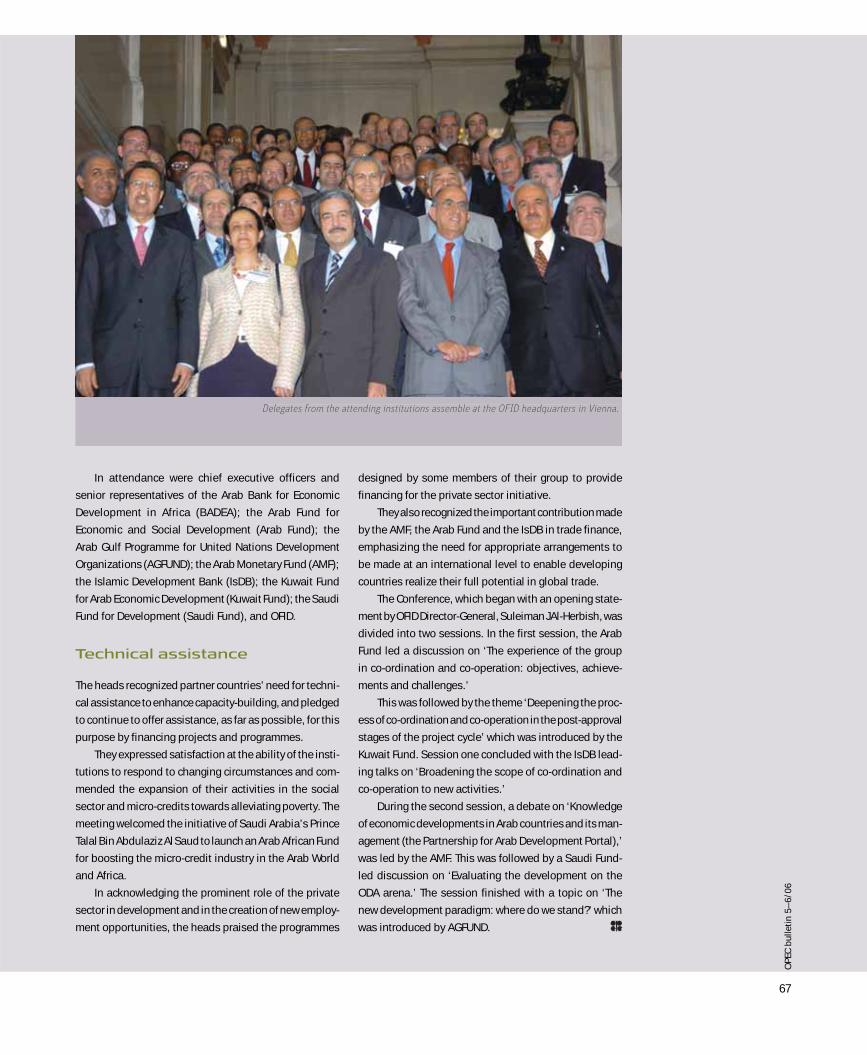
67
OP
EC
bu
lle
tin
5–
6/0
6
In attendance were chief executive officers and
senior representatives of the Arab Bank for Economic
Development in Africa (BADEA); the Arab Fund for
Economic and Social Development (Arab Fund); the
Arab Gulf Programme for United Nations Development
Organizations (AGFUND); the Arab Monetary Fund (AMF);
the Islamic Development Bank (IsDB); the Kuwait Fund
for Arab Economic Development (Kuwait Fund); the Saudi
Fund for Development (Saudi Fund), and OFID.
Technical assistance
The heads recognized partner countries’ need for techni-
cal assistance to enhance capacity-building, and pledged
to continue to offer assistance, as far as possible, for this
purpose by financing projects and programmes.
They expressed satisfaction at the ability of the insti-
tutions to respond to changing circumstances and com-
mended the expansion of their activities in the social
sector and micro-credits towards alleviating poverty. The
meeting welcomed the initiative of Saudi Arabia’s Prince
Talal Bin Abdulaziz Al Saud to launch an Arab African Fund
for boosting the micro-credit industry in the Arab World
and Africa.
In acknowledging the prominent role of the private
sector in development and in the creation of new employ-
ment opportunities, the heads praised the programmes
designed by some members of their group to provide
financing for the private sector initiative.
They also recognized the important contribution made
by the AMF, the Arab Fund and the IsDB in trade finance,
emphasizing the need for appropriate arrangements to
be made at an international level to enable developing
countries realize their full potential in global trade.
The Conference, which began with an opening state-
ment by OFID Director-General, Suleiman J Al-Herbish, was
divided into two sessions. In the first session, the Arab
Fund led a discussion on ‘The experience of the group
in co-ordination and co-operation: objectives, achieve-
ments and challenges.’
This was followed by the theme ‘Deepening the proc-
ess of co-ordination and co-operation in the post-approval
stages of the project cycle’ which was introduced by the
Kuwait Fund. Session one concluded with the IsDB lead-
ing talks on ‘Broadening the scope of co-ordination and
co-operation to new activities.’
During the second session, a debate on ‘Knowledge
of economic developments in Arab countries and its man-
agement (the Partnership for Arab Development Portal),’
was led by the AMF. This was followed by a Saudi Fund-
led discussion on ‘Evaluating the development on the
ODA arena.’ The session finished with a topic on ‘The
new development paradigm: where do we stand?’ which
was introduced by AGFUND.
Delegates from the attending institutions assemble at the OFID headquarters in Vienna.Delegates from the attending institutions assemble at the OFID headquarters in Vienna.
68
OP
EC
bu
lle
tin
5–
6/0
6
1. An average of Saharan Blend (Algeria), Minas (Indonesia), Iran Heavy (IR Iran), Basra Light (Iraq), Kuwait Export (Kuwait), Es Sider (SP Libyan AJ), Bonny Light
(Nigeria), Qatar Marine (Qatar), Arab Light (Saudi Arabia), Murban (United Arab Emirates) and BCF-17 (Bachaquero, Venezuela).
This section includes highlights from the OPEC Monthly Oil Market Report
(MOMR) for April published by the Research Division of the Secretariat,
con tain ing up-to-date anal y sis, ad di tion al in for ma tion, graphs and tables.
The publication may be downloaded in PDF format from our Web site
(www.opec.org), provided OPEC is cred it ed as the source for any usage.
Ma
rk
et
Re
vi
ew
Crude oil price movements
OPEC Reference Basket1
The petroleum market began the month on
an upward trend due to revived fear of a sup-
ply shortfall amid ongoing political tensions in
both the Middle East and West Africa. Concerns
over a depletion of refined products as refin-
eries underwent heavy seasonal maintenance
supported the bullish sentiment. The Basket
closed more than five per cent or $3 higher at
$59.08/barrel on March 3. Steady OPEC output
amid a call to keep quotas unchanged at the
March Meeting of the Conference helped the
market to turn bearish. The Basket slipped by
$2.90/b or nearly five per cent on average to set-
tle at $56.18/b on March 10. However, concern
over gasoline supply in the West as more refin-
eries moved into the maintenance season amid
prolonged light sweet grade supply disruptions
from Nigeria revived market jitteriness once
again. The lower April programme from Europe
amid a widened Brent/Dubai spread prevent-
ing crude flows into Asia inspired the renewed
upward trend. While ample supply in the USA
kept a cap on the rally, concern over stringent
gasoline specifications prevented any further
decline. The Basket closed up $2.29/b or four
per cent to stand at $58.47/b on March 17.
In the fourth week, the sentiment eased
on ample crude oil supply amid the expecta-
tion of lower global demand growth. Concern
over light sweet crude supply maintained the
market’s bullish sentiment as some US refin-
eries returned from turnaround. The Basket
eased a marginal 42¢ to close at $58.05/b on
March 24. In the final week of the month, the
bullish sentiment gained momentum on devel-
opments in the Middle East and West Africa,
as well as an expected rise in demand as US
refineries returned from turnaround. The month
ended with a hefty drop in the US gasoline
stocks. Hence, in the final week of the month,
the Basket rallied over $3 or five per cent to
close at $60.64/b. The monthly average was
$57.86/b, representing a gain of $1.24 or over
two per cent.
During the first week of April, the bullish
momentum was sustained by attention turning
to the geopolitical arena. The Basket reached
a new record-high of $65.02/b on April 17
with month-to-date average at $62.67/b (see
Table A).
US market
The US crude oil market was pressured by
outages in Nigeria, although rising crude oil
stocks amid sluggish refinery demand helped
to calm market sentiment. However, concern
over gasoline supply during the driving sea-
son narrowed differentials for the light crude.
The WTI/WTS (West Texas Intermediate/West
Texas Sour) spread weakened in the first week to
$7.60/b, compared to a peak of over $10/b and
an average of $8.62/b in the previous month.
The resumption of some refineries in the US
Gulf Coast stepped up demand for sour crude.
Hence, the sweet/sour spread for light crude
narrowed further in the second week to average
$6.28/b. Continued outage from Nigeria forced
refiners to take alternative grades as more CDUs
returned to production amid the shift towards
grades with higher gasoline yields. Thus, the
WTI/WTS spread narrowed to $5.81/b.
AAp
ril
Ap
ril
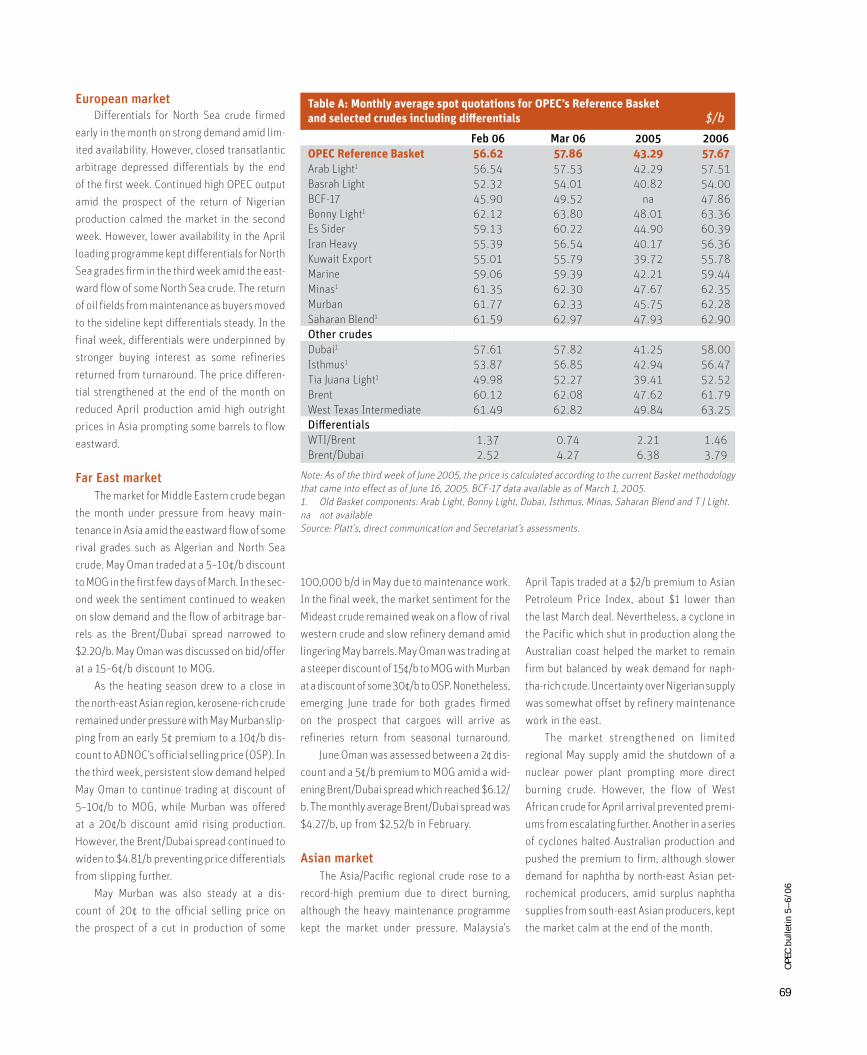
69
OP
EC
bu
lle
tin
5–
6/0
6
Table A: Monthly average spot quotations for OPEC’s Reference Basket
and selected crudes including diff erentials $/b
Feb 06 Mar 06 2005 2006
OPEC Reference Basket 56.62 57.86 43.29 57.67
Arab Light1 56.54 57.53 42.29 57.51
Basrah Light 52.32 54.01 40.82 54.00
BCF-17 45.90 49.52 na 47.86
Bonny Light1 62.12 63.80 48.01 63.36
Es Sider 59.13 60.22 44.90 60.39
Iran Heavy 55.39 56.54 40.17 56.36
Kuwait Export 55.01 55.79 39.72 55.78
Marine 59.06 59.39 42.21 59.44
Minas1 61.35 62.30 47.67 62.35
Murban 61.77 62.33 45.75 62.28
Saharan Blend1 61.59 62.97 47.93 62.90
Other crudes
Dubai1 57.61 57.82 41.25 58.00
Isthmus1 53.87 56.85 42.94 56.47
Tia Juana Light1 49.98 52.27 39.41 52.52
Brent 60.12 62.08 47.62 61.79
West Texas Intermediate 61.49 62.82 49.84 63.25
Diff erentials
WTI/Brent 1.37 0.74 2.21 1.46
Brent/Dubai 2.52 4.27 6.38 3.79
Note: As of the third week of June 2005, the price is calculated according to the current Basket methodology
that came into effect as of June 16, 2005. BCF-17 data available as of March 1, 2005.
1. Old Basket components: Arab Light, Bonny Light, Dubai, Isthmus, Minas, Saharan Blend and T J Light.
na not available
Source: Platt’s, direct communication and Secretariat’s assessments.
European market
Differentials for North Sea crude firmed
early in the month on strong demand amid lim-
ited availability. However, closed transatlantic
arbitrage depressed differentials by the end
of the first week. Continued high OPEC output
amid the prospect of the return of Nigerian
production calmed the market in the second
week. However, lower availability in the April
loading programme kept differentials for North
Sea grades firm in the third week amid the east-
ward flow of some North Sea crude. The return
of oil fields from maintenance as buyers moved
to the sideline kept differentials steady. In the
final week, differentials were underpinned by
stronger buying interest as some refineries
returned from turnaround. The price differen-
tial strengthened at the end of the month on
reduced April production amid high outright
prices in Asia prompting some barrels to flow
eastward.
Far East market
The market for Middle Eastern crude began
the month under pressure from heavy main-
tenance in Asia amid the eastward flow of some
rival grades such as Algerian and North Sea
crude. May Oman traded at a 5–10¢/b discount
to MOG in the first few days of March. In the sec-
ond week the sentiment continued to weaken
on slow demand and the flow of arbitrage bar-
rels as the Brent/Dubai spread narrowed to
$2.20/b. May Oman was discussed on bid/offer
at a 15–6¢/b discount to MOG.
As the heating season drew to a close in
the north-east Asian region, kerosene-rich crude
remained under pressure with May Murban slip-
ping from an early 5¢ premium to a 10¢/b dis-
count to ADNOC’s official selling price (OSP). In
the third week, persistent slow demand helped
May Oman to continue trading at discount of
5–10¢/b to MOG, while Murban was offered
at a 20¢/b discount amid rising production.
However, the Brent/Dubai spread continued to
widen to $4.81/b preventing price differentials
from slipping further.
May Murban was also steady at a dis-
count of 20¢ to the official selling price on
the prospect of a cut in production of some
100,000 b/d in May due to maintenance work.
In the final week, the market sentiment for the
Mideast crude remained weak on a flow of rival
western crude and slow refinery demand amid
lingering May barrels. May Oman was trading at
a steeper discount of 15¢/b to MOG with Murban
at a discount of some 30¢/b to OSP. Nonetheless,
emerging June trade for both grades firmed
on the prospect that cargoes will arrive as
refineries return from seasonal turnaround.
June Oman was assessed between a 2¢ dis-
count and a 5¢/b premium to MOG amid a wid-
ening Brent/Dubai spread which reached $6.12/
b. The monthly average Brent/Dubai spread was
$4.27/b, up from $2.52/b in February.
Asian market
The Asia/Pacific regional crude rose to a
record-high premium due to direct burning,
although the heavy maintenance programme
kept the market under pressure. Malaysia’s
April Tapis traded at a $2/b premium to Asian
Petroleum Price Index, about $1 lower than
the last March deal. Nevertheless, a cyclone in
the Pacific which shut in production along the
Australian coast helped the market to remain
firm but balanced by weak demand for naph-
tha-rich crude. Uncertainty over Nigerian supply
was somewhat offset by refinery maintenance
work in the east.
The market strengthened on limited
regional May supply amid the shutdown of a
nuclear power plant prompting more direct
burning crude. However, the flow of West
African crude for April arrival prevented premi-
ums from escalating further. Another in a series
of cyclones halted Australian production and
pushed the premium to firm, although slower
demand for naphtha by north-east Asian pet-
rochemical producers, amid surplus naphtha
supplies from south-east Asian producers, kept
the market calm at the end of the month.
70
Ma
rk
et
Re
vi
ew
OP
EC
bu
lle
tin
3–
4/0
6
The tanker market
After showing a decline of more than 2.4m b/d
in February, OPEC spot fixtures enjoyed some
recovery with an increase of 400,000 b/d or 2.8
per cent to reach 311m b/d in March, driven by
eastbound chartering. Nevertheless, OPEC spot
fixtures remained 1m b/d below the March 2005
level. Despite this recovery, the share of OPEC in
total spot fixtures declined from 66 per cent in
February to 63 per cent in March, meaning that
spot fixtures from countries outside OPEC saw
higher increases. Middle East/eastbound fix-
tures increased by 300,000 b/d or 4.6 per cent
to average 5.6m b/d, while westbound fixtures
dropped by 200,000 b/d or almost ten per cent
to stand at 1.7m b/d due to lower activity from
the USA, supported by high stocks and ongo-
ing refinery maintenance. Compared to a year
earlier, both Middle East/east- and westbound
fixtures were 100,000 b/d lower.
The share of Middle East spot fixtures in
total spot fixtures remained stable at 40 per
cent with eastbound at 27 per cent and west-
bound at 13 per cent. However, non-OPEC spot
fixtures surged by more than 1m b/d, the high-
est growth in almost one year to average 7.6m
b/d, which corresponds to a 600,000 b/d year-
on-year growth.
Following the growth in OPEC and non-
OPEC fixtures, total spot fixtures averaged
20.7m b/d, a gain of 1.4m b/d from the previous
month. Preliminary estimates put OPEC sailings
at 24.2m b/d, which corresponds to 1.3m b/d
below February level. This decline is explained
to some extent by the drop in OPEC fixtures
displayed in the previous month. Sailings from
the Middle East retreated by around 900,000
b/d to 17.7m b/d. Arrivals increased in most
of the main importing regions, except for the
Euro-Mediterranean countries where they fell
500,000 b/d to 4.5m b/d.
Arrivals at US Gulf/East Coasts and the
Caribbean, as well as in Japan continued to
increase for the second consecutive month to
average 12.3m b/d and 4.8m b/d, respectively,
which corresponds to 1m b/d and 200,000
b/d above February levels. Arrivals in North-
West Europe improved by 800,000 b/d or 11
per cent, the highest increase in more than one
year, to stand at around 8.5m b/d. Compared to
a year earlier, arrivals at US Gulf/East Coasts
and the Caribbean were 2m b/d higher while
arrivals in the other regions were around
500,000 b/d.
World oil demand
Estimate for 2005
With preliminary figures available for the
first time for the whole of 2005, global oil
demand appears to have grown by almost 1m
b/d or 1.2 per cent to average 83.1m b/d in 2005.
The estimated growth is almost identical to the
figure presented in the last report; however,
on a quarterly basis some minor adjustments
have been made based on historical data revi-
sions. Thus, 1Q06 absolute world demand was
raised a slight 40,000 b/d to 83.8m b/d, while
2Q06 figures were adjusted up by 100,000
b/d to 82.2m b/d. The 3Q06 and 4Q06 figures
also suffered minor revisions of 40,000 b/d
to 82.7m b/d and 50,000 b/d to 83.8m b/d,
respectively.
On a regional basis, OECD growth of
200,000 b/d made up less than one-fifth of total
global demand growth, while developing coun-
tries (DCs) accounted for more than three quar-
ters of total world oil demand growth. China’s
apparent demand appears to have risen by a
disappointing 0.3 per cent in sharp contrast to
a GDP growth rate of nearly ten per cent.
Forecast for 2006
World oil demand is forecast at 1.4m b/d
or 1.7 per cent to average 84.5m b/d, margin-
ally lower with respect to the growth estimate
in the last report. The slight downward revision
to this year’s growth can be traced back to dis-
appointing consumption in the USA during the
first three months of 2006 partially offset by
above trend growth in Western Europe, espe-
cially in January. Although complete information
for China’s apparent demand for the 1Q06 is not
yet available, preliminary trade and production
figures point to very volatile consumption, with
demand appearing to have surged by around
20 per cent in January but increasing by only
three per cent in February.
The latest EIA figure showed a substantial
contraction in 1Q06 demand in the USA. The
figures indicate that total petroleum supplies
dropped by more than 400,000 b/d or two per
cent in January only to register a minor y-o-y rise
of three per cent in February. The weekly data,
which is available for the period January–March,
points to a fall of 200,000 b/d or nearly one per
cent for the 1Q6. Warm weather, which affected
heating oil demand, along with lower fuel oil
consumption on inter-fuel switching with gas,
could in part explain the drop in consumption;
nonetheless, with the economy expected to
grow at a consensus rate of by four to five per
cent during the 1Q06, it is clear that there is
a dichotomy between economic and demand
growth possibly attributable to high domestic
petroleum product prices.
OECD
OECD demand is projected to grow by
400,000 b/d or 0.8 per cent to average 50m
b/d for the whole of 2006. Naturally, the lion’s
share of the growth is expected to originate in
the North American region, with US consumption
accounting for nearly 80 per cent of the growth.
As was the case in previous years, OECD coun-
tries combined demand growth is expected to
be around one-quarter of total global demand
despite the fact that the group accounts for more
than three-fifths of world demand. According to
the latest data available for the month of January
2006, inland deliveries of petroleum products
Global oil demand
appears to have
grown by almost
1m b/d or 1.2 per
cent to average
83.1m b/d in 2005.
71
OP
EC
bu
lle
tin
5–
6/0
6
Non-OPEC oil supply
for 2006 is expected
to average 51.5m
b/d, an increase of
1.4m b/d over 2005.
fell by 200,000 b/d or 0.5 per cent y-o-y. The
sizeable drop in demand occurred in the North
American region where oil requirements fell by
nearly 600,000 b/d or 2.4 per cent with respect
to January. On the other hand oil demand in
Western Europe and the OECD Pacific regions
rose by 400,000 b/d or 2.9 per cent and 60,000
b/d or 0.7 per cent y-o-y in January partially off-
setting the decline in the North American region.
As indicated earlier, total petroleum product sup-
plies in the USA fell by 170,000 b/d or nearly
one per cent during 1Q06.
Developing countries
On a regional basis, the Middle East and
non-OECD Asia are expected to account for
27 per cent and 39 per cent of the total growth
in oil demand with Latin America and Africa
contributing 19 per cent and 14 per cent,
respectively. The quarterly breakdown indi-
cates a y-o-y growth of nearly 600,000 b/d
during the 1Q06 followed by a 400,000 b/d
rise during the 2Q06. Growth in the 3Q06 and
4Q06 is estimated to reach 600,000 b/d and
700,000 b/d, respectively. The rapid decelera-
tion in oil demand growth rates in non-OECD
Asian countries observed in the second half of
2005 — when demand rose by only 1.7 per cent
and 0.1 per cent y-o-y in the 3Q06 and 4Q06
compared to more than four per cent during
the first half — seems to have extended to the
beginning of 2006.
World oil supply
Non-OPEC
Estimate for 2005
Non-OPEC supply in 2005 is expected to
average 50.1m b/d, representing an increase
of 200,000 b/d over 2004. Baseline revisions
to the 2004 and 2005 estimates have resulted
in a slight adjustment to the level of non-OPEC
supply, but not to growth.
Revisions to the 2004–05 estimate
The full year estimate for 2004 has been
revised up 7,000 b/d to account for a higher
baseline than previously assessed. For 2005,
the level of non-OPEC supply has also been
revised up 29,000 b/d due to the impact of his-
torical revisions in the UK, and the inclusion of
actual data for India, Vietnam, Malaysia, Syria,
Yemen and China.
Forecast for 2006
Non-OPEC oil supply for 2006 is expected
to average 51.5m b/d, an increase of 1.4m b/d
over 2005, broadly unchanged from the last
assessment, but the impact of historical revi-
sions and actual data, recently announced
maintenance plans, unscheduled shutdowns,
as well as adjustments to project schedules
have resulted in a material revision in the
quarterly breakdown. In particular, the out-
look of the USA, Canada, Norway, UK, Australia,
Philippines, Angola, Azerbaijan and China have
been adjusted. Major uncertainties remain in
the second half including the expected path of
recovery for the US Gulf of Mexico (GoM), and
a potential slide in the start up of some fields
from 4Q06 to 2007.
OECD
OECD oil supply is expected to average
20.5m b/d, representing an increase of 120,000
b/d versus the previous year and unchanged from
last month’s report. The outlook for the US and
Australia has been revised slightly down, whilst
that of Canada has been revised upward.
USA
US oil supply is expected to average 7.4m
b/d in 2006, an increase of 130,000 b/d ver-
sus 2005, but slightly lower versus the last
assessment. On a quarterly basis, US oil sup-
ply is expected to average 7.2m b/d, 7.4m b/d,
7.4m b/d, and 7. 7m b/d in 1Q06, 2Q06, 3Q06
and 4Q06, respectively. The revision reflects a
slightly worse expectation for the recovery of
the US GoM in 2Q06 and 3Q06. Assumed GoM
losses in 2Q06 have been adjusted to 280,000
from a previous estimate of 200,000 b/d while
for 3Q06 losses are now assumed at 100,000
b/d compared to a previous 50,000 b/d.
The second reason for the revisions is
related to the problems in Prudhoe Bay gather-
ing centre No 2, which averaged 100,000 b/d
in March. Some of these losses will extend into
April, but recovery is under way with over 70 per
cent of the lost output back on line. Preliminary
data puts average US oil supply at 7.2m b/d in
the 1Q06, reaching 7.2m b/d in March. The lat-
est weekly preliminary data also indicates that
in the first few days of April, US supply aver-
aged 7.2m b/d. It is important to highlight that
despite the lower than expected recovery in the
US GoM, oil supply continues to improve due to
the combined effect of new start ups and more
drilling in conventional matured fields. Looking
forward, the greatest uncertainty/risk remains
the path of recovery of GoM production, the
impact of new storms, and a potential slide in
the start up of the Atlantis field from 4Q06 to
2007, which remains unconfirmed.
Mexico and Canada
Mexican oil supply is expected to average
3.8m b/d in 2006, flat from last year and broadly
unchanged from the previous month. The last
data available indicates that total oil supply
averaged 3.8m b/d in February, a level which
is likely to be maintained in March.
Western Europe
Total oil supply in Western Europe is expected
to average 5.4m b/d in 2006, a drop of 300,000
b/d versus 2005 and broadly unchanged from
last month. Recent announcements indicate
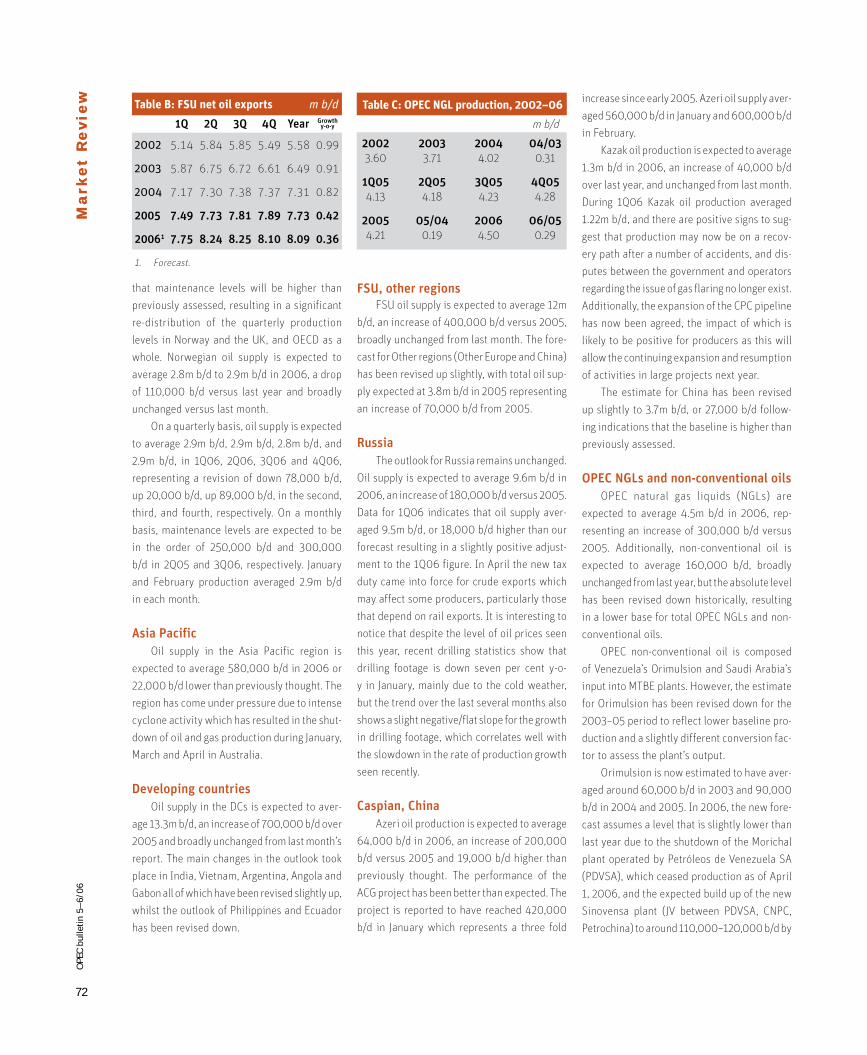
72
OP
EC
bu
lle
tin
5–
6/0
6M
ar
ke
t R
ev
ie
wM
ar
ke
t R
ev
ie
w Table B: FSU net oil exports m b/d
1Q 2Q 3Q 4Q Year Growthy-o-y
2002 5.14 5.84 5.85 5.49 5.58 0.99
2003 5.87 6.75 6.72 6.61 6.49 0.91
2004 7.17 7.30 7.38 7.37 7.31 0.82
2005 7.49 7.73 7.81 7.89 7.73 0.42
20061 7.75 8.24 8.25 8.10 8.09 0.36
1. Fore cast.
Table C: OPEC NGL production, 2002–06
2002 2003 2004 04/03
3.60 3.71 4.02 0.31
1Q05 2Q05 3Q05 4Q05
4.13 4.18 4.23 4.28
2005 05/04 2006 06/05
4.21 0.19 4.50 0.29
m b/d
that maintenance levels will be higher than
previously assessed, resulting in a significant
re-distribution of the quarterly production
levels in Norway and the UK, and OECD as a
whole. Norwegian oil supply is expected to
average 2.8m b/d to 2.9m b/d in 2006, a drop
of 110,000 b/d versus last year and broadly
unchanged versus last month.
On a quarterly basis, oil supply is expected
to average 2.9m b/d, 2.9m b/d, 2.8m b/d, and
2.9m b/d, in 1Q06, 2Q06, 3Q06 and 4Q06,
representing a revision of down 78,000 b/d,
up 20,000 b/d, up 89,000 b/d, in the second,
third, and fourth, respectively. On a monthly
basis, maintenance levels are expected to be
in the order of 250,000 b/d and 300,000
b/d in 2Q05 and 3Q06, respectively. January
and February production averaged 2.9m b/d
in each month.
Asia Pacific
Oil supply in the Asia Pacific region is
expected to average 580,000 b/d in 2006 or
22,000 b/d lower than previously thought. The
region has come under pressure due to intense
cyclone activity which has resulted in the shut-
down of oil and gas production during January,
March and April in Australia.
Developing countries
Oil supply in the DCs is expected to aver-
age 13.3m b/d, an increase of 700,000 b/d over
2005 and broadly unchanged from last month’s
report. The main changes in the outlook took
place in India, Vietnam, Argentina, Angola and
Gabon all of which have been revised slightly up,
whilst the outlook of Philippines and Ecuador
has been revised down.
FSU, other regions
FSU oil supply is expected to average 12m
b/d, an increase of 400,000 b/d versus 2005,
broadly unchanged from last month. The fore-
cast for Other regions (Other Europe and China)
has been revised up slightly, with total oil sup-
ply expected at 3.8m b/d in 2005 representing
an increase of 70,000 b/d from 2005.
Russia
The outlook for Russia remains unchanged.
Oil supply is expected to average 9.6m b/d in
2006, an increase of 180,000 b/d versus 2005.
Data for 1Q06 indicates that oil supply aver-
aged 9.5m b/d, or 18,000 b/d higher than our
forecast resulting in a slightly positive adjust-
ment to the 1Q06 figure. In April the new tax
duty came into force for crude exports which
may affect some producers, particularly those
that depend on rail exports. It is interesting to
notice that despite the level of oil prices seen
this year, recent drilling statistics show that
drilling footage is down seven per cent y-o-
y in January, mainly due to the cold weather,
but the trend over the last several months also
shows a slight negative/flat slope for the growth
in drilling footage, which correlates well with
the slowdown in the rate of production growth
seen recently.
Caspian, China
Azeri oil production is expected to average
64,000 b/d in 2006, an increase of 200,000
b/d versus 2005 and 19,000 b/d higher than
previously thought. The performance of the
ACG project has been better than expected. The
project is reported to have reached 420,000
b/d in January which represents a three fold
increase since early 2005. Azeri oil supply aver-
aged 560,000 b/d in January and 600,000 b/d
in February.
Kazak oil production is expected to average
1.3m b/d in 2006, an increase of 40,000 b/d
over last year, and unchanged from last month.
During 1Q06 Kazak oil production averaged
1.22m b/d, and there are positive signs to sug-
gest that production may now be on a recov-
ery path after a number of accidents, and dis-
putes between the government and operators
regarding the issue of gas flaring no longer exist.
Additionally, the expansion of the CPC pipeline
has now been agreed, the impact of which is
likely to be positive for producers as this will
allow the continuing expansion and resumption
of activities in large projects next year.
The estimate for China has been revised
up slightly to 3.7m b/d, or 27,000 b/d follow-
ing indications that the baseline is higher than
previously assessed.
OPEC NGLs and non-conventional oils
OPEC natural gas liquids (NGLs) are
expected to average 4.5m b/d in 2006, rep-
resenting an increase of 300,000 b/d versus
2005. Additionally, non-conventional oil is
expected to average 160,000 b/d, broadly
unchanged from last year, but the absolute level
has been revised down historically, resulting
in a lower base for total OPEC NGLs and non-
conventional oils.
OPEC non-conventional oil is composed
of Venezuela’s Orimulsion and Saudi Arabia’s
input into MTBE plants. However, the estimate
for Orimulsion has been revised down for the
2003–05 period to reflect lower baseline pro-
duction and a slightly different conversion fac-
tor to assess the plant’s output.
Orimulsion is now estimated to have aver-
aged around 60,000 b/d in 2003 and 90,000
b/d in 2004 and 2005. In 2006, the new fore-
cast assumes a level that is slightly lower than
last year due to the shutdown of the Morichal
plant operated by Petróleos de Venezuela SA
(PDVSA), which ceased production as of April
1, 2006, and the expected build up of the new
Sinovensa plant (JV between PDVSA, CNPC,
Petrochina) to around 110,000–120,000 b/d by
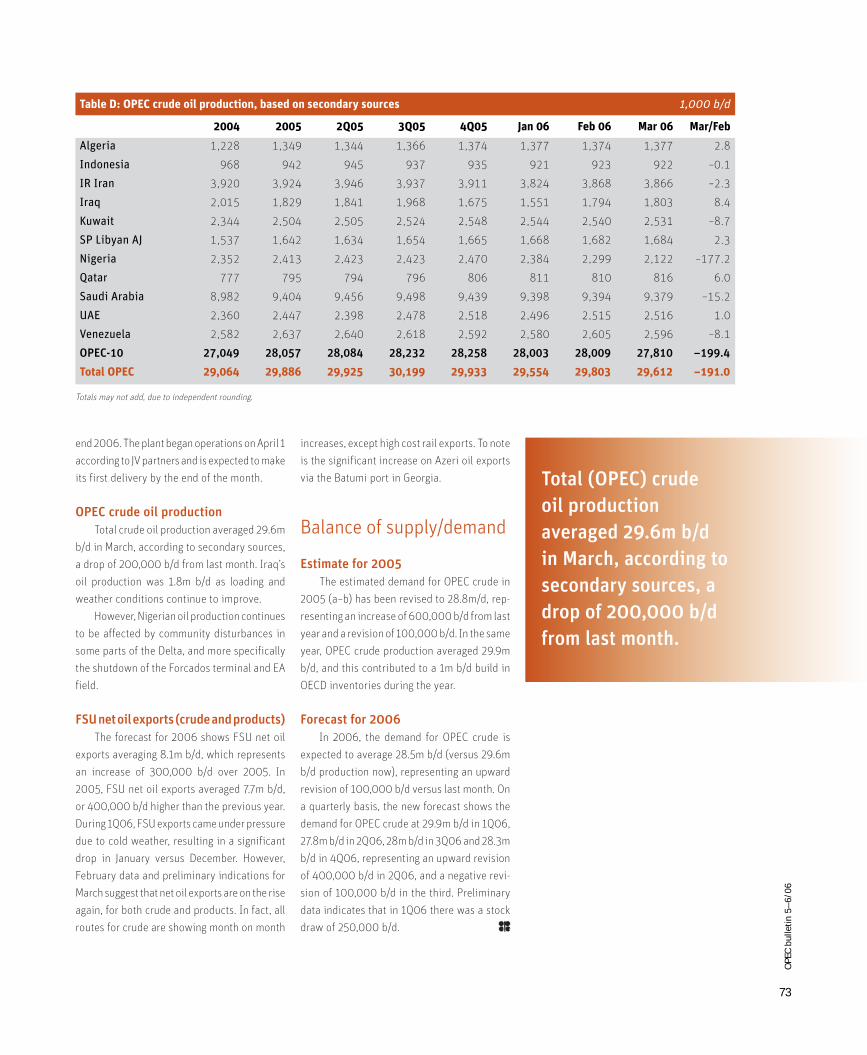
73
OP
EC
bu
lle
tin
5–
6/0
6
Table D: OPEC crude oil production, based on secondary sources 1,000 b/d
2004 2005 2Q05 3Q05 4Q05 Jan 06 Feb 06 Mar 06 Mar/Feb
Algeria 1,228 1,349 1,344 1,366 1,374 1,377 1,374 1,377 2.8
Indonesia 968 942 945 937 935 921 923 922 –0.1
IR Iran 3,920 3,924 3,946 3,937 3,911 3,824 3,868 3,866 –2.3
Iraq 2,015 1,829 1,841 1,968 1,675 1,551 1,794 1,803 8.4
Kuwait 2,344 2,504 2,505 2,524 2,548 2,544 2,540 2,531 –8.7
SP Libyan AJ 1,537 1,642 1,634 1,654 1,665 1,668 1,682 1,684 2.3
Nigeria 2,352 2,413 2,423 2,423 2,470 2,384 2,299 2,122 –177.2
Qatar 777 795 794 796 806 811 810 816 6.0
Saudi Arabia 8,982 9,404 9,456 9,498 9,439 9,398 9,394 9,379 –15.2
UAE 2,360 2,447 2,398 2,478 2,518 2,496 2,515 2,516 1.0
Venezuela 2,582 2,637 2,640 2,618 2,592 2,580 2,605 2,596 –8.1
OPEC-10 27,049 28,057 28,084 28,232 28,258 28,003 28,009 27,810 –199.4
Total OPEC 29,064 29,886 29,925 30,199 29,933 29,554 29,803 29,612 –191.0
Totals may not add, due to independent rounding.
end 2006. The plant began operations on April 1
according to JV partners and is expected to make
its first delivery by the end of the month.
OPEC crude oil production
Total crude oil production averaged 29.6m
b/d in March, according to secondary sources,
a drop of 200,000 b/d from last month. Iraq’s
oil production was 1.8m b/d as loading and
weather conditions continue to improve.
However, Nigerian oil production continues
to be affected by community disturbances in
some parts of the Delta, and more specifically
the shutdown of the Forcados terminal and EA
field.
FSU net oil exports (crude and products)
The forecast for 2006 shows FSU net oil
exports averaging 8.1m b/d, which represents
an increase of 300,000 b/d over 2005. In
2005, FSU net oil exports averaged 7.7m b/d,
or 400,000 b/d higher than the previous year.
During 1Q06, FSU exports came under pressure
due to cold weather, resulting in a significant
drop in January versus December. However,
February data and preliminary indications for
March suggest that net oil exports are on the rise
again, for both crude and products. In fact, all
routes for crude are showing month on month
increases, except high cost rail exports. To note
is the significant increase on Azeri oil exports
via the Batumi port in Georgia.
Balance of supply/demand
Estimate for 2005
The estimated demand for OPEC crude in
2005 (a–b) has been revised to 28.8m/d, rep-
resenting an increase of 600,000 b/d from last
year and a revision of 100,000 b/d. In the same
year, OPEC crude production averaged 29.9m
b/d, and this contributed to a 1m b/d build in
OECD inventories during the year.
Forecast for 2006
In 2006, the demand for OPEC crude is
expected to average 28.5m b/d (versus 29.6m
b/d production now), representing an upward
revision of 100,000 b/d versus last month. On
a quarterly basis, the new forecast shows the
demand for OPEC crude at 29.9m b/d in 1Q06,
27.8m b/d in 2Q06, 28m b/d in 3Q06 and 28.3m
b/d in 4Q06, representing an upward revision
of 400,000 b/d in 2Q06, and a negative revi-
sion of 100,000 b/d in the third. Preliminary
data indicates that in 1Q06 there was a stock
draw of 250,000 b/d.
Total (OPEC) crude
oil production
averaged 29.6m b/d
in March, according to
secondary sources, a
drop of 200,000 b/d
from last month.
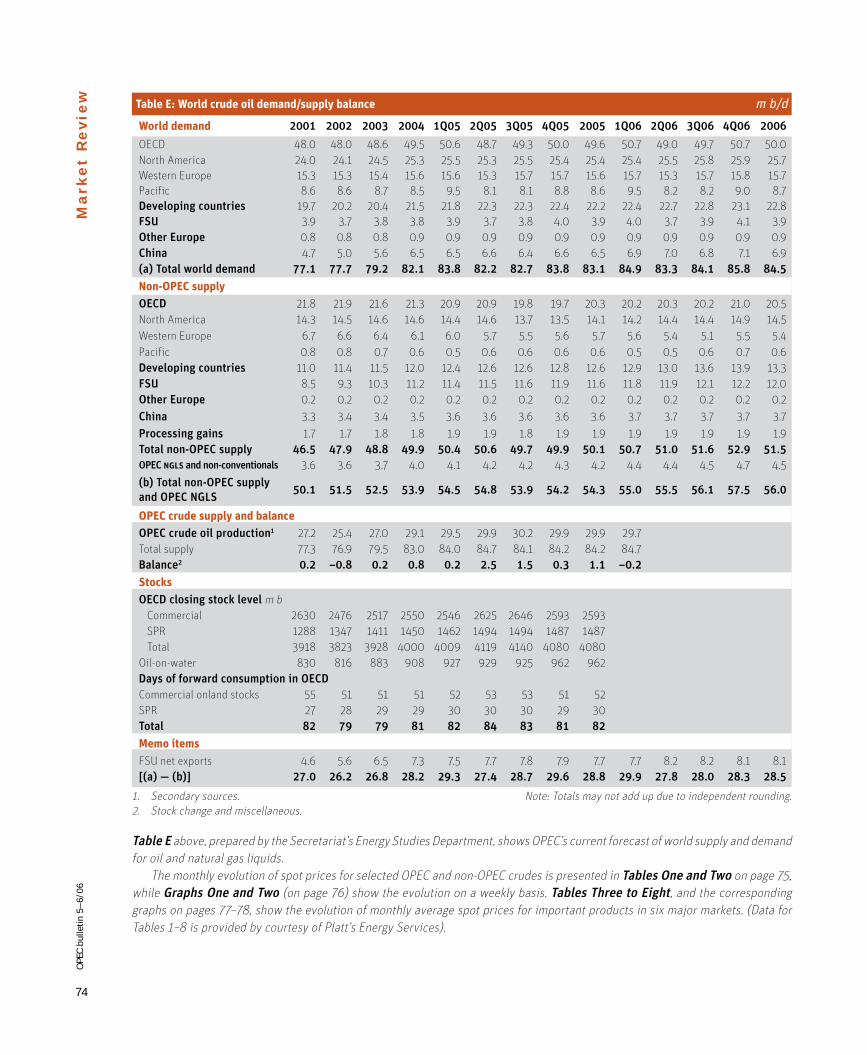
74
OP
EC
bu
lle
tin
5–
6/0
6M
ar
ke
t R
ev
ie
w Table E: World crude oil demand/supply balance m b/d
1. Secondary sources. Note: Totals may not add up due to independent rounding.2. Stock change and miscellaneous.
Table E above, prepared by the Secretariat’s En er gy Stud ies Department, shows OPEC’s cur rent fore cast of world sup ply and de mand
for oil and natural gas liquids.
The month ly ev o lu tion of spot prices for se lected OPEC and non-OPEC crudes is pre sented in Tables One and Two on page 75,
while Graphs One and Two (on page 76) show the ev o lu tion on a weekly basis. Tables Three to Eight, and the corresponding
graphs on pages 77–78, show the ev o lu tion of monthly average spot prices for important prod ucts in six major markets. (Data for
Tables 1–8 is provided by courtesy of Platt’s Energy Services).
World demand 2001 2002 2003 2004 1Q05 2Q05 3Q05 4Q05 2005 1Q06 2Q06 3Q06 4Q06 2006
OECD 48.0 48.0 48.6 49.5 50.6 48.7 49.3 50.0 49.6 50.7 49.0 49.7 50.7 50.0
North America 24.0 24.1 24.5 25.3 25.5 25.3 25.5 25.4 25.4 25.4 25.5 25.8 25.9 25.7
Western Europe 15.3 15.3 15.4 15.6 15.6 15.3 15.7 15.7 15.6 15.7 15.3 15.7 15.8 15.7
Pacific 8.6 8.6 8.7 8.5 9.5 8.1 8.1 8.8 8.6 9.5 8.2 8.2 9.0 8.7
Developing countries 19.7 20.2 20.4 21.5 21.8 22.3 22.3 22.4 22.2 22.4 22.7 22.8 23.1 22.8
FSU 3.9 3.7 3.8 3.8 3.9 3.7 3.8 4.0 3.9 4.0 3.7 3.9 4.1 3.9
Other Europe 0.8 0.8 0.8 0.9 0.9 0.9 0.9 0.9 0.9 0.9 0.9 0.9 0.9 0.9
China 4.7 5.0 5.6 6.5 6.5 6.6 6.4 6.6 6.5 6.9 7.0 6.8 7.1 6.9
(a) Total world demand 77.1 77.7 79.2 82.1 83.8 82.2 82.7 83.8 83.1 84.9 83.3 84.1 85.8 84.5
Non-OPEC supply
OECD 21.8 21.9 21.6 21.3 20.9 20.9 19.8 19.7 20.3 20.2 20.3 20.2 21.0 20.5
North America 14.3 14.5 14.6 14.6 14.4 14.6 13.7 13.5 14.1 14.2 14.4 14.4 14.9 14.5
Western Europe 6.7 6.6 6.4 6.1 6.0 5.7 5.5 5.6 5.7 5.6 5.4 5.1 5.5 5.4
Pacific 0.8 0.8 0.7 0.6 0.5 0.6 0.6 0.6 0.6 0.5 0.5 0.6 0.7 0.6
Developing countries 11.0 11.4 11.5 12.0 12.4 12.6 12.6 12.8 12.6 12.9 13.0 13.6 13.9 13.3
FSU 8.5 9.3 10.3 11.2 11.4 11.5 11.6 11.9 11.6 11.8 11.9 12.1 12.2 12.0
Other Europe 0.2 0.2 0.2 0.2 0.2 0.2 0.2 0.2 0.2 0.2 0.2 0.2 0.2 0.2
China 3.3 3.4 3.4 3.5 3.6 3.6 3.6 3.6 3.6 3.7 3.7 3.7 3.7 3.7
Processing gains 1.7 1.7 1.8 1.8 1.9 1.9 1.8 1.9 1.9 1.9 1.9 1.9 1.9 1.9
Total non-OPEC supply 46.5 47.9 48.8 49.9 50.4 50.6 49.7 49.9 50.1 50.7 51.0 51.6 52.9 51.5
OPEC ngls and non-conventionals 3.6 3.6 3.7 4.0 4.1 4.2 4.2 4.3 4.2 4.4 4.4 4.5 4.7 4.5
(b) Total non-OPEC supply
and OPEC NGLS50.1 51.5 52.5 53.9 54.5 54.8 53.9 54.2 54.3 55.0 55.5 56.1 57.5 56.0
OPEC crude supply and balance
OPEC crude oil production1 27.2 25.4 27.0 29.1 29.5 29.9 30.2 29.9 29.9 29.7
Total supply 77.3 76.9 79.5 83.0 84.0 84.7 84.1 84.2 84.2 84.7
Balance2 0.2 –0.8 0.2 0.8 0.2 2.5 1.5 0.3 1.1 –0.2
Stocks
OECD closing stock level m b
Commercial 2630 2476 2517 2550 2546 2625 2646 2593 2593
SPR 1288 1347 1411 1450 1462 1494 1494 1487 1487
Total 3918 3823 3928 4000 4009 4119 4140 4080 4080
Oil-on-water 830 816 883 908 927 929 925 962 962
Days of forward consumption in OECD
Commercial onland stocks 55 51 51 51 52 53 53 51 52
SPR 27 28 29 29 30 30 30 29 30
Total 82 79 79 81 82 84 83 81 82
Memo items
FSU net exports 4.6 5.6 6.5 7.3 7.5 7.7 7.8 7.9 7.7 7.7 8.2 8.2 8.1 8.1
[(a) — (b)] 27.0 26.2 26.8 28.2 29.3 27.4 28.7 29.6 28.8 29.9 27.8 28.0 28.3 28.5
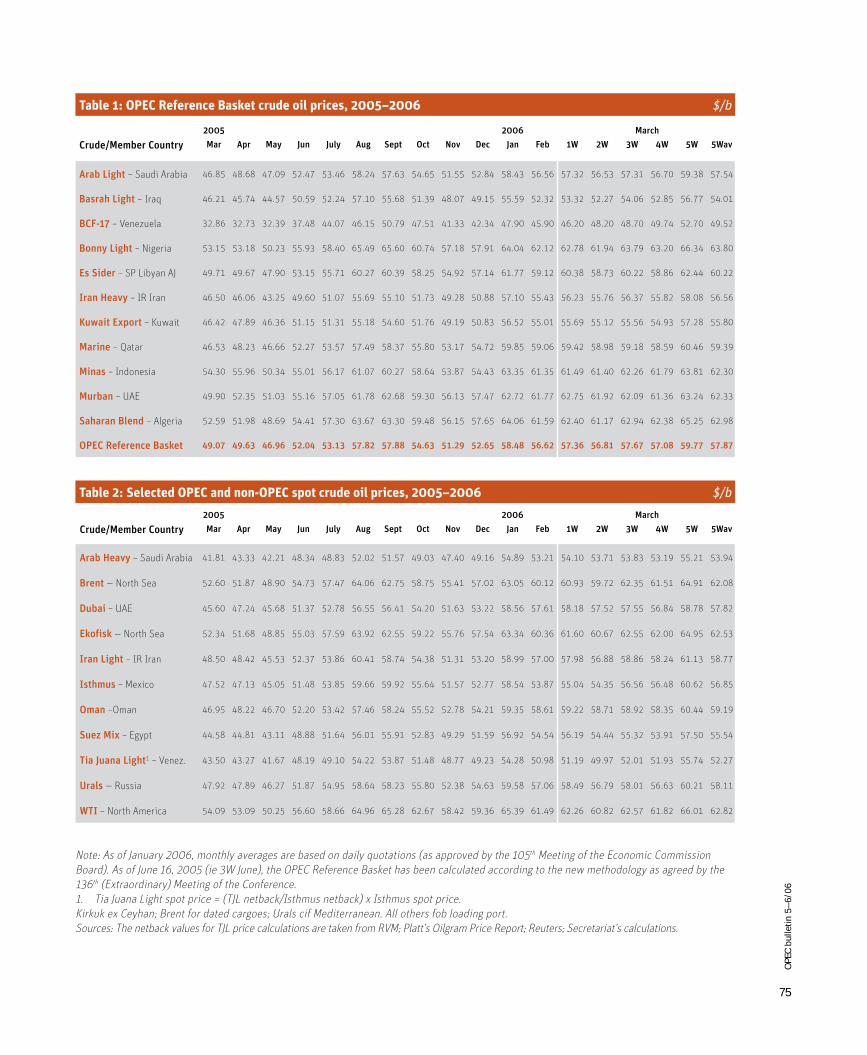
75
OP
EC
bu
lle
tin
5–
6/0
6
Note: As of January 2006, monthly averages are based on daily quotations (as approved by the 105th Meeting of the Economic Commission Board). As of June 16, 2005 (ie 3W June), the OPEC Reference Basket has been calculated according to the new methodology as agreed by the 136th (Extraordinary) Meeting of the Conference.1. Tia Juana Light spot price = (TJL netback/Isthmus netback) x Isthmus spot price.Kirkuk ex Ceyhan; Brent for dated cargoes; Urals cif Mediterranean. All others fob loading port.Sources: The netback values for TJL price calculations are taken from RVM; Platt’s Oilgram Price Report; Reuters; Secretariat’s calculations.
Table 2: Selected OPEC and non-OPEC spot crude oil prices, 2005–2006 $/b
2005 2006 March
Crude/Member Country Mar Apr May Jun July Aug Sept Oct Nov Dec Jan Feb 1W 2W 3W 4W 5W 5Wav
Arab Light – Saudi Arabia 46.85 48.68 47.09 52.47 53.46 58.24 57.63 54.65 51.55 52.84 58.43 56.56 57.32 56.53 57.31 56.70 59.38 57.54
Basrah Light – Iraq 46.21 45.74 44.57 50.59 52.24 57.10 55.68 51.39 48.07 49.15 55.59 52.32 53.32 52.27 54.06 52.85 56.77 54.01
BCF-17 – Venezuela 32.86 32.73 32.39 37.48 44.07 46.15 50.79 47.51 41.33 42.34 47.90 45.90 46.20 48.20 48.70 49.74 52.70 49.52
Bonny Light – Nigeria 53.15 53.18 50.23 55.93 58.40 65.49 65.60 60.74 57.18 57.91 64.04 62.12 62.78 61.94 63.79 63.20 66.34 63.80
Es Sider – SP Libyan AJ 49.71 49.67 47.90 53.15 55.71 60.27 60.39 58.25 54.92 57.14 61.77 59.12 60.38 58.73 60.22 58.86 62.44 60.22
Iran Heavy – IR Iran 46.50 46.06 43.25 49.60 51.07 55.69 55.10 51.73 49.28 50.88 57.10 55.43 56.23 55.76 56.37 55.82 58.08 56.56
Kuwait Export – Kuwait 46.42 47.89 46.36 51.15 51.31 55.18 54.60 51.76 49.19 50.83 56.52 55.01 55.69 55.12 55.56 54.93 57.28 55.80
Marine – Qatar 46.53 48.23 46.66 52.27 53.57 57.49 58.37 55.80 53.17 54.72 59.85 59.06 59.42 58.98 59.18 58.59 60.46 59.39
Minas – Indonesia 54.30 55.96 50.34 55.01 56.17 61.07 60.27 58.64 53.87 54.43 63.35 61.35 61.49 61.40 62.26 61.79 63.81 62.30
Murban – UAE 49.90 52.35 51.03 55.16 57.05 61.78 62.68 59.30 56.13 57.47 62.72 61.77 62.75 61.92 62.09 61.36 63.24 62.33
Saharan Blend – Algeria 52.59 51.98 48.69 54.41 57.30 63.67 63.30 59.48 56.15 57.65 64.06 61.59 62.40 61.17 62.94 62.38 65.25 62.98
OPEC Reference Basket 49.07 49.63 46.96 52.04 53.13 57.82 57.88 54.63 51.29 52.65 58.48 56.62 57.36 56.81 57.67 57.08 59.77 57.87
Table 1: OPEC Reference Basket crude oil prices, 2005–2006 $/b
2005 2006 March
Crude/Member Country Mar Apr May Jun July Aug Sept Oct Nov Dec Jan Feb 1W 2W 3W 4W 5W 5Wav
Arab Heavy – Saudi Arabia 41.81 43.33 42.21 48.34 48.83 52.02 51.57 49.03 47.40 49.16 54.89 53.21 54.10 53.71 53.83 53.19 55.21 53.94
Brent — North Sea 52.60 51.87 48.90 54.73 57.47 64.06 62.75 58.75 55.41 57.02 63.05 60.12 60.93 59.72 62.35 61.51 64.91 62.08
Dubai – UAE 45.60 47.24 45.68 51.37 52.78 56.55 56.41 54.20 51.63 53.22 58.56 57.61 58.18 57.52 57.55 56.84 58.78 57.82
Ekofisk — North Sea 52.34 51.68 48.85 55.03 57.59 63.92 62.55 59.22 55.76 57.54 63.34 60.36 61.60 60.67 62.55 62.00 64.95 62.53
Iran Light – IR Iran 48.50 48.42 45.53 52.37 53.86 60.41 58.74 54.38 51.31 53.20 58.99 57.00 57.98 56.88 58.86 58.24 61.13 58.77
Isthmus – Mexico 47.52 47.13 45.05 51.48 53.85 59.66 59.92 55.64 51.57 52.77 58.54 53.87 55.04 54.35 56.56 56.48 60.62 56.85
Oman –Oman 46.95 48.22 46.70 52.20 53.42 57.46 58.24 55.52 52.78 54.21 59.35 58.61 59.22 58.71 58.92 58.35 60.44 59.19
Suez Mix – Egypt 44.58 44.81 43.11 48.88 51.64 56.01 55.91 52.83 49.29 51.59 56.92 54.54 56.19 54.44 55.32 53.91 57.50 55.54
Tia Juana Light1 – Venez. 43.50 43.27 41.67 48.19 49.10 54.22 53.87 51.48 48.77 49.23 54.28 50.98 51.19 49.97 52.01 51.93 55.74 52.27
Urals — Russia 47.92 47.89 46.27 51.87 54.95 58.64 58.23 55.80 52.38 54.63 59.58 57.06 58.49 56.79 58.01 56.63 60.21 58.11
WTI – North America 54.09 53.09 50.25 56.60 58.66 64.96 65.28 62.67 58.42 59.36 65.39 61.49 62.26 60.82 62.57 61.82 66.01 62.82
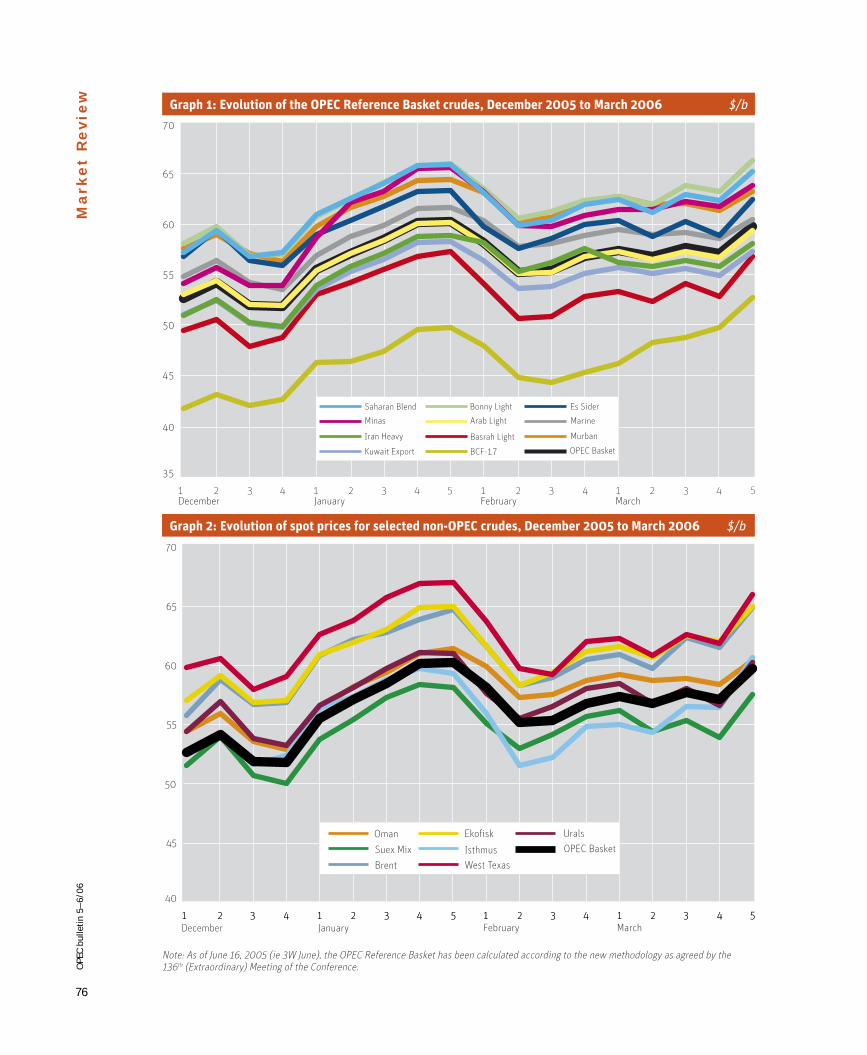
76
OP
EC
bu
lle
tin
5–
6/0
6M
ar
ke
t R
ev
ie
w
Note: As of June 16, 2005 (ie 3W June), the OPEC Reference Basket has been calculated according to the new methodology as agreed by the 136th (Extraordinary) Meeting of the Conference.
Graph 1: Evolution of the OPEC Reference Basket crudes, December 2005 to March 2006 $/b
Graph 2: Evolution of spot prices for se lect ed non-OPEC crudes, December 2005 to March 2006 $/b
35
40
45
50
55
60
65
70
OPEC Basket
Murban
Marine
Es Sider
BCF-17
Basrah Light
Arab Light
Bonny Light
Kuwait Export
Iran Heavy
Minas
Saharan Blend
MarchFebruaryJanuaryDecember1 2 3 4 1 2 3 4 1 2 3 42 3 4 15 5
40
45
50
55
60
65
70
MarchFebruaryJanuaryDecember
OPEC Basket
Urals
West Texas
Isthmus
Ekofisk
Brent
Suex Mix
Oman
11 22 33 44 11 22 33 44 11 22 33 44 11 22 33 44 5555
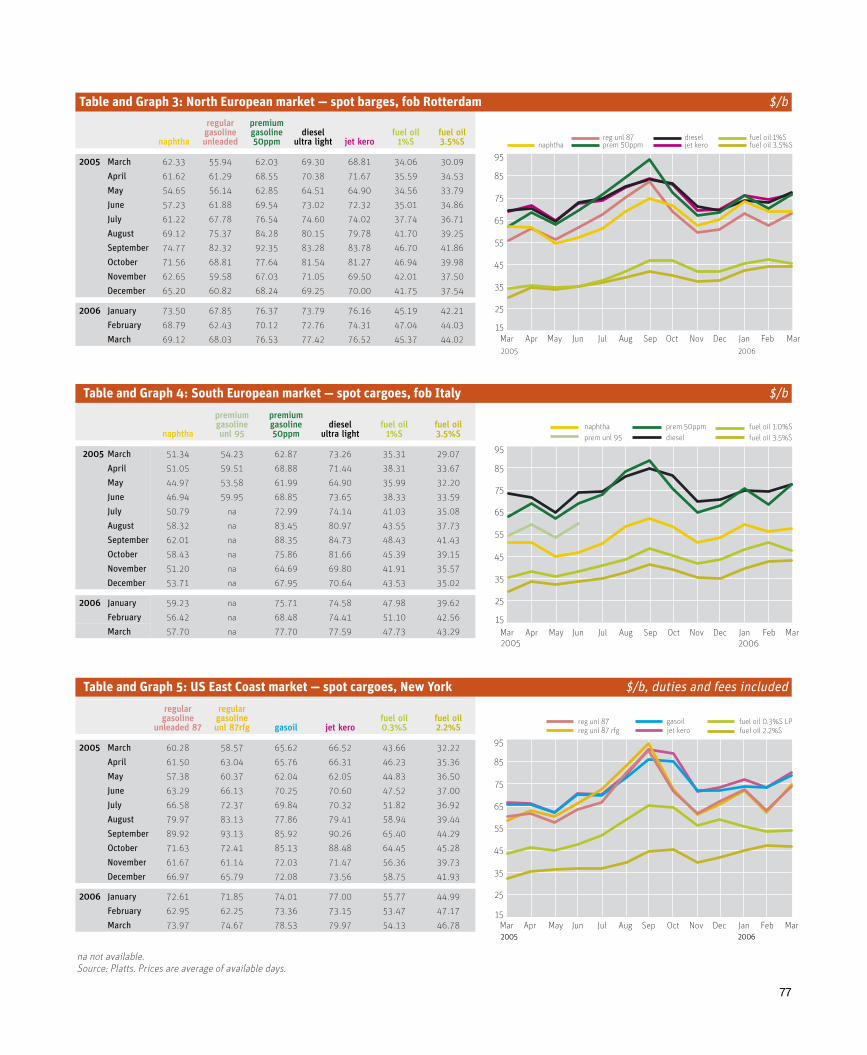
77
naphtha
regular gasoline unleaded
premium gasoline 50ppm
dieselultra light jet kero
fuel oil1%S
fuel oil3.5%S
2005 March 62.33 55.94 62.03 69.30 68.81 34.06 30.09
April 61.62 61.29 68.55 70.38 71.67 35.59 34.53
May 54.65 56.14 62.85 64.51 64.90 34.56 33.79
June 57.23 61.88 69.54 73.02 72.32 35.01 34.86
July 61.22 67.78 76.54 74.60 74.02 37.74 36.71
August 69.12 75.37 84.28 80.15 79.78 41.70 39.25
September 74.77 82.32 92.35 83.28 83.78 46.70 41.86
October 71.56 68.81 77.64 81.54 81.27 46.94 39.98
November 62.65 59.58 67.03 71.05 69.50 42.01 37.50
December 65.20 60.82 68.24 69.25 70.00 41.75 37.54
2006 January 73.50 67.85 76.37 73.79 76.16 45.19 42.21
February 68.79 62.43 70.12 72.76 74.31 47.04 44.03
March 69.12 68.03 76.53 77.42 76.52 45.37 44.02
naphtha
premiumgasolineunl 95
premium gasoline50ppm
diesel ultra light
fuel oil1%S
fuel oil3.5%S
2005 March 51.34 54.23 62.87 73.26 35.31 29.07
April 51.05 59.51 68.88 71.44 38.31 33.67
May 44.97 53.58 61.99 64.90 35.99 32.20
June 46.94 59.95 68.85 73.65 38.33 33.59
July 50.79 na 72.99 74.14 41.03 35.08
August 58.32 na 83.45 80.97 43.55 37.73
September 62.01 na 88.35 84.73 48.43 41.43
October 58.43 na 75.86 81.66 45.39 39.15
November 51.20 na 64.69 69.80 41.91 35.57
December 53.71 na 67.95 70.64 43.53 35.02
2006 January 59.23 na 75.71 74.58 47.98 39.62
February 56.42 na 68.48 74.41 51.10 42.56
March 57.70 na 77.70 77.59 47.73 43.29
regular gasoline
unleaded 87
regular gasoline unl 87rfg gasoil jet kero
fuel oil0.3%S
fuel oil2.2%S
2005 March 60.28 58.57 65.62 66.52 43.66 32.22
April 61.50 63.04 65.76 66.31 46.23 35.36
May 57.38 60.37 62.04 62.05 44.83 36.50
June 63.29 66.13 70.25 70.60 47.52 37.00
July 66.58 72.37 69.84 70.32 51.82 36.92
August 79.97 83.13 77.86 79.41 58.94 39.44
September 89.92 93.13 85.92 90.26 65.40 44.29
October 71.63 72.41 85.13 88.48 64.45 45.28
November 61.67 61.14 72.03 71.47 56.36 39.73
December 66.97 65.79 72.08 73.56 58.75 41.93
2006 January 72.61 71.85 74.01 77.00 55.77 44.99
February 62.95 62.25 73.36 73.15 53.47 47.17
March 73.97 74.67 78.53 79.97 54.13 46.78
na not available.Source: Platts. Prices are average of available days.
Table and Graph 5: US East Coast market — spot cargoes, New York $/b, duties and fees included
Table and Graph 3: North European market — spot barges, fob Rotterdam $/b
Table and Graph 4: South European mar ket — spot cargoes, fob Italy $/b
15
25
35
45
55
65
75
85
95
MarFebJanDecNovOctSepAugJulJunMayAprMar
fuel oil 3.5%Sfuel oil 1%S
jet kerodiesel
prem 50ppmreg unl 87
naphtha
2005 2006
2005 2006
15
25
35
45
55
65
75
85
95
MarFebJanDecNovOctSepAugJulJunMayAprMar
fuel oil 3.5%S
fuel oil 1.0%S
diesel
prem 50ppm
prem unl 95
naphtha
20052005 20062006
15
25
35
45
55
65
75
85
95
MarFebJanDecNovOctSepAugJulJunMayAprMar
fuel oil 2.2%Sfuel oil 0.3%S LP
jet kerogasoilreg unl 87
reg unl 87 rfg
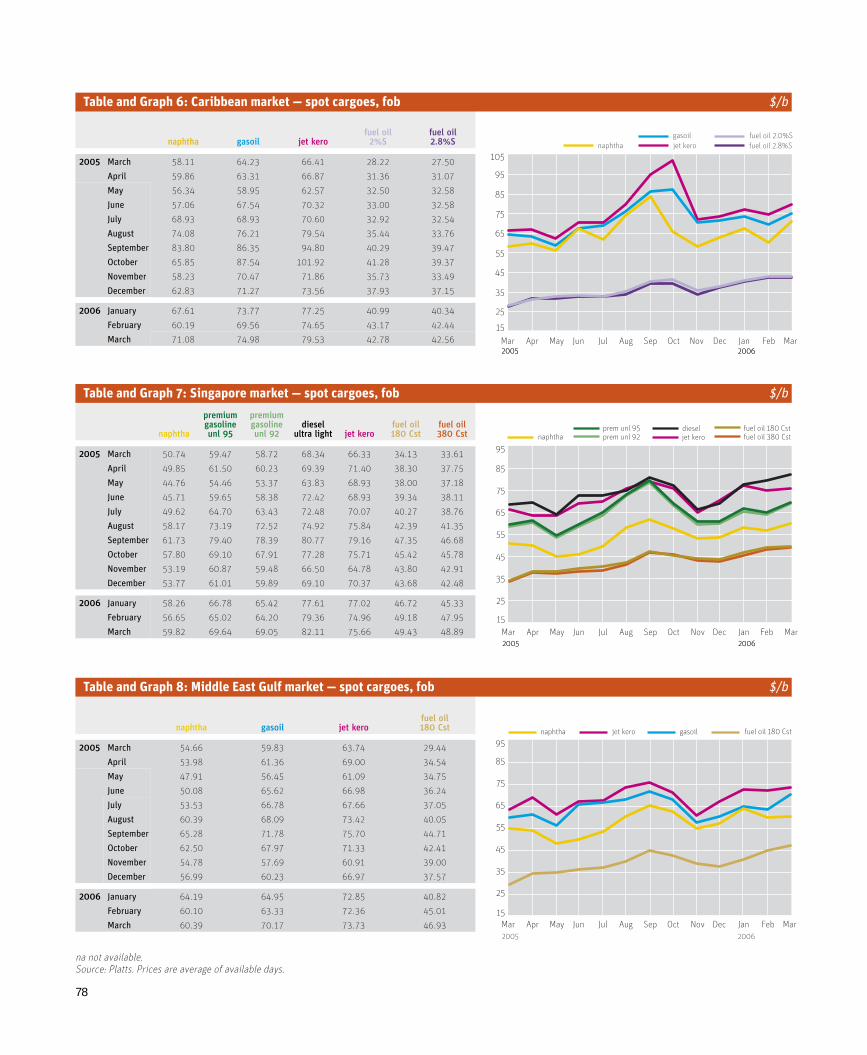
78
naphtha gasoil jet kerofuel oil
2%Sfuel oil2.8%S
2005 March 58.11 64.23 66.41 28.22 27.50
April 59.86 63.31 66.87 31.36 31.07
May 56.34 58.95 62.57 32.50 32.58
June 57.06 67.54 70.32 33.00 32.58
July 68.93 68.93 70.60 32.92 32.54
August 74.08 76.21 79.54 35.44 33.76
September 83.80 86.35 94.80 40.29 39.47
October 65.85 87.54 101.92 41.28 39.37
November 58.23 70.47 71.86 35.73 33.49
December 62.83 71.27 73.56 37.93 37.15
2006 January 67.61 73.77 77.25 40.99 40.34
February 60.19 69.56 74.65 43.17 42.44
March 71.08 74.98 79.53 42.78 42.56
naphtha
premium gasoline unl 95
premium gasoline unl 92
dieselultra light jet kero
fuel oil180 Cst
fuel oil380 Cst
2005 March 50.74 59.47 58.72 68.34 66.33 34.13 33.61
April 49.85 61.50 60.23 69.39 71.40 38.30 37.75
May 44.76 54.46 53.37 63.83 68.93 38.00 37.18
June 45.71 59.65 58.38 72.42 68.93 39.34 38.11
July 49.62 64.70 63.43 72.48 70.07 40.27 38.76
August 58.17 73.19 72.52 74.92 75.84 42.39 41.35
September 61.73 79.40 78.39 80.77 79.16 47.35 46.68
October 57.80 69.10 67.91 77.28 75.71 45.42 45.78
November 53.19 60.87 59.48 66.50 64.78 43.80 42.91
December 53.77 61.01 59.89 69.10 70.37 43.68 42.48
2006 January 58.26 66.78 65.42 77.61 77.02 46.72 45.33
February 56.65 65.02 64.20 79.36 74.96 49.18 47.95
March 59.82 69.64 69.05 82.11 75.66 49.43 48.89
naphtha gasoil jet kerofuel oil180 Cst
2005 March 54.66 59.83 63.74 29.44
April 53.98 61.36 69.00 34.54
May 47.91 56.45 61.09 34.75
June 50.08 65.62 66.98 36.24
July 53.53 66.78 67.66 37.05
August 60.39 68.09 73.42 40.05
September 65.28 71.78 75.70 44.71
October 62.50 67.97 71.33 42.41
November 54.78 57.69 60.91 39.00
December 56.99 60.23 66.97 37.57
2006 January 64.19 64.95 72.85 40.82
February 60.10 63.33 72.36 45.01
March 60.39 70.17 73.73 46.93
na not available.Source: Platts. Prices are average of available days.
Table and Graph 6: Caribbean market — spot cargoes, fob $/b
Table and Graph 7: Singapore market — spot cargoes, fob $/b
Table and Graph 8: Middle East Gulf market — spot cargoes, fob $/b
20052005 20062006
15
25
35
45
55
65
75
85
95
105
MarFebJanDecNovOctSepAugJulJunMayAprMar
fuel oil 2.0%S
fuel oil 2.8%S
gasoil
jet keronaphtha
20052005 20062006
15
25
35
45
55
65
75
85
95
MarFebJanDecNovOctSepAugJulJunMayAprMar
fuel oil 380 Cstfuel oil 180 Cst
jet kerodiesel
prem unl 92prem unl 95
naphtha
2005 2006
15
25
35
45
55
65
75
85
95
MarFebJanDecNovOctSepAugJulJunMayAprMar
fuel oil 180 Cstjet keronaphtha gasoil
79
OP
EC
bu
lle
tin
5–
6/0
6
Natural gas market fundamentals, May 29–30, 2006, Calgary, Canada. Details: Canadian Energy Research Institute, #150, 3512–33 Street, NW Calgary T2L 2A6, Canada. Tel: +1 403 282 1231; fax: +1 403 284 4181; e-mail:[email protected]; Web site: www.ceri.ca. NOC-IOC 2006, May 31–June 1, 2006, Surrey, UK. Details: CWC Associates Limited, 3 Tyers Gate; London SE1 3HX, UK. Tel: +44 207 089 4200; fax: +44 207 089 4201; e-mail: [email protected]; Web site: www.thecwcgroup.com. CIS oil and gas summit 2006, May 31–June 2, 2006, Paris, France. Details: The Energy Exchange Ltd, 5th Floor, 86 Hatton Garden, London EC1N 8QQ, UK. Tel: +44 207 067 1800; fax: +44 207 242 2673; e-mail: [email protected]; Web site: www.theenergyexchange.co.uk. Power generation in Russia, June 1–2, 2006, Rome, Italy. Details: Marcus Evans, 4 Cavendish Square, London W1G OBX, UK. Tel: +44 207 499 0900; fax: +44 207 637 0843; e-mail: [email protected]; Web site: www.meenergy.com. CERI 2006 petrochemical conference, June 4–6, 2006, Kananaskis Village, Canada. Details: Canadian Energy Research Institute, #150, 3512–33 Street, NW Calgary T2L 2A6, Canada. Tel: +1 403 282 1231; fax: +1 403 284 4181; e-mail:[email protected]; Web site: www.ceri.ca. Measuring and managing upstream oil and gas performance, June 5–7, 2006, London, UK. Details: Petroleum Economist, Nestor House, Playhouse Yard, London EC4V 5EX, UK. Tel: +44 207 779 8104; fax: +44 207 770 8896/8899; e-mail: [email protected]; Web site: www.petroleum-economist.com. 12th International Caspian oil & gas exhibition and conference, June 6–9, 2006, Baku, Azerbaijan. Details: ITE Group Plc, 105 Salusbury Road, London NW6 6RG, UK. Tel: +44 207 596 5000; fax: +44 207 596 5111; e-mail: [email protected]; Web site: www.ite-exhibitions.com. Introduction to Canada’s oil sands industry, June 8–9, 2006, Calgary, Canada. Details: Canadian Energy Research Institute, #150, 3512–33 Street, NW Calgary T2L 2A6, Canada. Tel: +1 403 282 1231; fax: +1 403 284 4181; e-mail: [email protected]; Web site: www.ceri.ca. Asia oil and gas conference, June 11–13, 2006, Kuala Lumpur, Malaysia. Details: Conference Connection Administrators Pte Ltd, 105 Cecil Street, #07–02, The Octagon, 069534 Singapore. Tel: +65 6222 0230; fax: +65 6222 0121; e-mail: [email protected]; Web site: www.cconnection.org. 28th Executive retreat meeting, June 12–13, 2006, Bagshot, UK. Details: Centre for Global Energy Studies, 17 Knightsbridge, London SW1X 7LY, UK. Tel: +44 207 235 4334; fax: +44 207 235 4338/5038; e-mail: [email protected]; Web site: www.cges.co.uk. Asia geosciences conference and exhibition, June 12–14, 2006, Kuala Lumpur, Malaysia. Details: Allworld Exhibitions, 12th Floor, Westminster Tower, 3 Albert Embankment, London SE1 7SP, UK. Tel: +44 207 840 2136; fax: +44 207 840 2119; e-mail: [email protected]; Web site: www.allworldex-hibitions.com. ERTC management conference 2006, June 12–14, 2006, Portugal. Details: Global Technology Forum, Highview House, Tattenham Crescent, Epsom Downs, Surrey KT18 5QJ, UK. Tel: +44 1737 365100; fax: +44 1737 365101; e-mail: [email protected]; Web site: www.gtforum.com. Project economics and decision analysis, June 12–16, 2006. London, UK. Details: CWC Associates Limited, 3 Tyers Gate; London SE1 3HX, UK. Tel: +44 207 089 4200; fax: +44 207 089 4201; e-mail: [email protected]; Web site: www.thecwcgroup.com.
Future fields 2006, June 13–14, 2006, Amsterdam, The Netherlands. Details: IQPC Ltd, Anchor House, 15–19 Britten Street, London SW3 3QL, UK. Tel: +44 207 368 9300; fax: +44 207 368 9301; e-mail: [email protected]; Web site: www.iqpc.co.uk. Energy risk management, June 14–15, 2006, London, UK. Details: SMi Group Ltd, Unit 009, Great Guildford Business Square, 30 Great Guildford Street, London SE1 0HS, UK. Tel: +44 207 827 6000; fax: +44 207 827 6001; e-mail: [email protected]; Web site: www.smi-online.co.uk. Introduction to the natural gas industry … from wellhead to burner-tip, June 15–16, 2006, Calgary, Canada; June 19–20, 2006, Toronto, Canada. Details: Canadian Energy Research Institute, #150, 3512–33 Street, NW Calgary T2L 2A6, Canada. Tel: +1 403 282 1231; fax: +1 403 284 4181; e-mail: [email protected]; Web site: www.ceri.ca. Introduction to the upstream petroleum industry, June 19–20, 2006, Calgary, Canada. Details: Canadian Energy Research Institute, #150, 3512–33 Street, NW Calgary T2L 2A6, Canada. Tel: +1 403 282 1231; fax: +1 403 284 4181; e-mail:[email protected]; Web site: www.ceri.ca. Increasing and developing European energy supply, June 19–20, 2006, Rome, Italy. Details: Marcus Evans, 4 Cavendish Square, London W1G OBX, UK. Tel: +44 207 499 0900; fax: +44 207 637 0843; e-mail: [email protected]; Web site: www.meenergy.com. World fiscal systems for oil, June 19–23, 2006, London, UK. Details: CWC Associates Limited, 3 Tyers Gate, London SE1 3HX, UK. Tel: +44 207 089 4200; fax: +44 207 089 4201; e-mail: [email protected]; Web site: www.thecwcgroup.com. Advanced international boundary disputes in oil and gas 2006, June 20–21, 2006, London, UK. Details: IQPC Ltd, Anchor House, 15–19 Britten Street, London SW3 3QL, UK. Tel: +44 207 368 9300; fax: +44 207 368 9301; e-mail: [email protected]; Web site: www.iqpc.co.uk. 4th Russian petroleum and gas congress, June 20–21, 2006, Moscow, Russia. Details: ITE Group Plc, 105 Salusbury Road, London NW6 6RG, UK. Tel: +44 207 596 5000; fax: +44 207 596 5111; e-mail: [email protected]; Web site: www.ite-exhibitions.com. Natural gas market fundamentals, June 22–23, 2006, Toronto, Canada. Details: Canadian Energy Research Institute, #150, 3512–33 Street, NW Calgary T2L 2A6, Canada. Tel: +1 403 282 1231; fax: +1 403 284 4181; e-mail: [email protected]; Web site: www.ceri.ca. Introduction to Canada’s oil sands industry, June 26–27, 2006, Edmonton, Canada. Details: Canadian Energy Research Institute, #150, 3512–33 Street, NW Calgary T2L 2A6, Canada. Tel: +1 403 282 1231; fax: +1 403 284 4181; e-mail: [email protected]; Web site: www.ceri.ca. World legal systems and contracts for oil and gas, June 26–30, 2006, London, UK. Details: CWC Associates Limited, 3 Tyers Gate, London SE1 3HX, UK. Tel: +44 207 089 4200; fax: +44 207 089 4201; e-mail: [email protected]; Web site: www.thecwcgroup.com. Gulf petrochemicals 2006 conference, June 5–6, 2006, Manama, Bahrain. Details: MEED Conference Registration, MEED Office, 20th Floor, Al Thuraya Tower, Dubai Media City, PO Box 25960, Dubai, UAE. Tel: +9714 390 0699; fax: +9714 368 8025; e-mail: [email protected]; Web site: www.emapconferencesites.co.uk/gulfpetrochemicals. Third OPEC international seminar: ‘OPEC in a new energy era: challenges and opportunities’, September 12–13, 2006, Vienna, Austria. Details: CWC Asso-ciates, 3 Tyers Gate, London SE1 3HX, UK. Tel: +44 20 7089 4203; fax: +44 20 7 89 4201; e-mail: [email protected]; www.thecwcgroup.com.
Forthcoming events
No
ti
ce
bo
ar
d
80
OP
EC
bu
lle
tin
5–
6/0
6
OPEC Bulletinis published ten times/year and a subscription costs $70. Sub scrip tion com menc es with the current issue (unless otherwise re quest ed) after receipt of
payment.
I wish to subscribe to the OPEC Bulletin for a one-year period
OPEC Monthly Oil Market ReportPublished monthly, this source of key information about OPEC Member Country output also con tains the Sec re tar i at’s analyses of oil and product price
movements, futures markets, the energy supply/demand bal ance, stock movements and global economic trends. $525 per year for an annual subscription
of 12 issues.
I wish to subscribe to the MOMR for a one-year period Please send me a sample copy
OPEC Annual Statistical Bulletin 2004This 144-page book, including colour graphs and tables, comes with a CD-ROM featuring all the data in the book and more (for Microsoft Windows only).
The book with CD-ROM package costs $85.
Please send me ................. copies of the OPEC Annual Statistical Bulletin 2004 (book plus CD-ROM)
OPEC Reviewcontains research papers by international experts on energy, the oil market, economic development and the en vi ron ment.
Available quarterly only from the commercial publisher.
For details contact: Blackwell Publishing Ltd, 9600 Garsington Road, Oxford OX4 2DQ, UK. Tel: +44 (0)1865 776868; fax: +44 (0)1865 714591;
e-mail: [email protected]; www.blackwellpublishing.com. Subscription rates for 2006: UK/Europe: individual €129, institutional £307;
The Americas: individual $144, institutional $516; Rest of world: individual £86, institutional £307.
Shipping address (please print in block letters): Invoicing address (if different from shipping address):
Name: Name:
Address: Address:
How to pay:
Invoice me Credit card (Visa, Eurocard/MasterCard and Diners Club)
Credit card company: Credit card no: Expiry date:
Holder: Signature:
Please mail this form to:
PR & Information Department or telefax to:
OPEC Secretariat PR & Information Department
Obere Donaustrasse 93, A-1020 Vienna, Austria +43 1 214 98 27
All prices include airmail delivery. Windows™ is a trademark of the Microsoft Corporation
Or
de
r F
or
m
To order, please fill in the form
OPEC Bul le tinAnnual sub scrip tion $70
Vol XXX, No 1 March 2006
The effect of OPECpolicy decisions on oil
and stock prices
Futures trading and the storage of North American natural gas
Petroleum product scarcity:a review of the supply and
distribution of petroleum products in Nigeria
Correlation betweenenergy usage and the rate of
economic development
Marco G.D. Guidi,Alexander Russell and Heather Tarbert
Apostolos Serletis and Asghar Shahmoradi
Osi S. Akpoghomeh and Dele Badejo
Salman Saif Ghouri
Annual Report 2004Free of charge
OPEC Review(published quarterly) annual subscription rates for 2006:UK/Europe: individual €129 institutional £307The Americas: individual $144 institutional $516Rest of world: individual £86 institutional £307Orders and enquiries: Blackwell Publishing Journals, 9600 Garsington Road, Oxford OX4 2DQ, UK.Tel: +44 (0)1865 776868Fax: +44 (0)1865 714591E-mail: jnlinfo@ blackwellpublishers.co.ukwww.blackwellpublishing.com
OPEC Annual Statistical Bulletin 2004144-page book with CDSingle issue $85The CD (for MicrosoftWindows only) contains all the data in the book and much more.• Easy to install and display• Easy to manipulate and
query• Easy to export to spread-
sheets such as Excel
OPEC Month ly Oil Market Report • Crude oil and product
prices analysis • Member Country output
figures • Stocks and supply/
demand anal y sisAnnual subscription $525 (12 issues)
OPEC offers a range of publications that reflect its ac tiv i ties. Single copies and subscriptions can be obtained by contacting this De part ment, which regular readers should also notify in the event of a change of address:
PR & Information Department, OPEC SecretariatObere Donaustrasse 93, A-1020 Vienna, Austria
Tel: +43 1 211 12-0; fax: +43 1 214 98 27; e-mail: [email protected]
PE
C
20
04
Annual Statistical Bulletin
Summary tables and basic indicatorsOil and gas dataTransportationPricesMajor oil companies
OPECOrganization of the Petroleum Exporting Countries
Monthly Oil Market Report
Obere Donaustrasse 93, A-1020 Vienna, AustriaTel +43 1 21112 Fax +43 1 2164320 E-mail: [email protected] Web site: www.opec.org
April 2006
Feature Article:
Economic uncertainties and the oil demand outlook
Oil Market Highlights
Feature Article
Highlights of the world economy
Crude oil price movements
Product markets and refinery operations
The oil futures market
The tanker market
World oil demand
World oil supply
Rig count
Oil trade
Stock movements
Balance of supply and demand
1
3
5
11
15
19
21
24
29
36
37
39
43
OPECOrganization of the Petroleum Exporting Countries
Monthly Oil Market Report
Obere Donaustrasse 93, A-1020 Vienna, AustriaTel +43 1 21112 Fax +43 1 2164320 E-mail: [email protected] Web site: www.opec.org
OP
EC
Pu
bl
ic
at
io
ns