Embed Size (px)
Citation preview
1
Oceanography 10Ocean Circulation
• PART 1: IntroductionGeneral types of Ocean CurrentsSolar Energy and the Seasons
• PART 2:Measuring Ocean Currents and Structure
• PART 3: General Surface Currents and their PatternsEffects of the Earth’ rotation; Coriolis EffectEarth’s changing rotational velocitiesEarth’s major wind patternsGryres and effects of currents
• PART 4:Ocean Structure & Water Masses
Figure 8.8
Gulf Stream flows at 55 million cubic meters/sec,
500 times the flow of the Amazon River
Figure 8.14

2
Sea Surface Temperatures in Celsius during the Northern Hemisphere Summer
(25 degrees C = 77 degrees F, 15 degrees C = 59 degrees F)
Top picture is July, bottom is January, green and blue indicate temperatures below 0 Celsuis and warmer temperatures are shown in red and black
Oceanography 10Ocean Circulatio
• PART 1: IntroductionGeneral types of Ocean CurrentsSolar Energy and the Seasonshttps://www.youtube.com/watch?v=CCmTY0PKGDs (NASA Perpetual Ocean)
• PART 2:Measuring Ocean Currents and Structure
• PART 3: General Surface Currents and their PatternsEffects of the Earth’ rotation; Coriolis EffectEarth’s changing rotational velocitiesEarth’s major wind patternsGryres and effects of currents
• PART 4:Ocean Structure & Water Masses
Part 2
Measuring Ocean Currents
and Structure:
• CTD Sensors
• Satellites
• Bouys
• ARGO: free floating profile
floats
• Current Meters
• Doppler Meters
• Spills, Accidents
Seasoar, a modified CTD metercan be used at the surface to ~350 meters

3
Fig. 9.17
Part 2
Measuring Ocean Currents
and Structure:
• CTD Sensors
• Satellites
• Bouys
• ARGO: free floating profile
floats
• Current Meters
• Doppler Meters
• Spills, Accidents
ARGO = Array for Real-Time Geostrophic Oceanography“Argo is a global array of 3,000 free-drifting profiling floats that measures the temperature and salinity of the upper 2000 m of the ocean. This allows for continuous monitoring of the temperature, salinity, and velocity of the upper ocean, with all data being relayed and made publicly available within hours after collection.”
Part 2
Measuring Ocean Currents
and Structure:
• CTD Sensors
• Satellites
• Bouys
• ARGO: free floating profile
floats
• Current Meters
• Doppler Meters
• Spills, Accidents

4
Doppler Current Meter
Doppler Effect
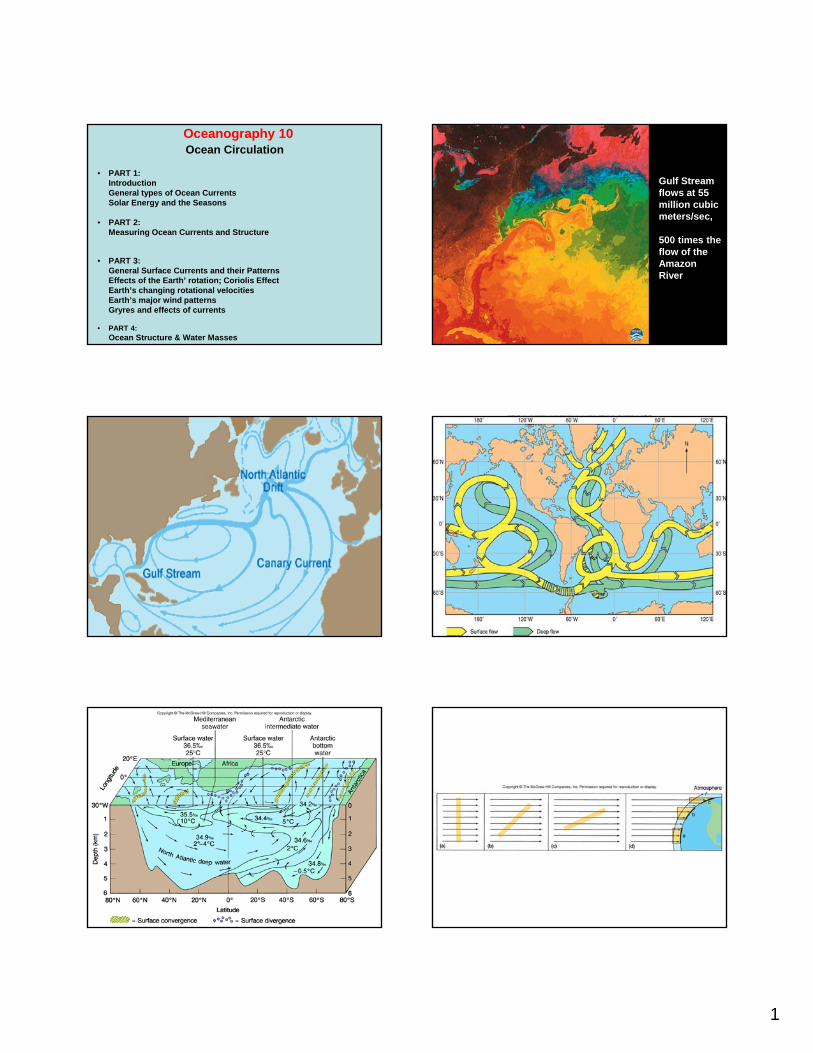
• Flotsam: floating wreckage of a ship or its cargo.
• Jetsam: part of a ship, its equipment, or its cargo that is purposely cast overboard or jettisoned to lighten the load in time of distress and that sinks or is washed ashore.
Drift Bottles1956 – 1959: 33,800 bottles released
The Hansa Carrier / May 1990
5
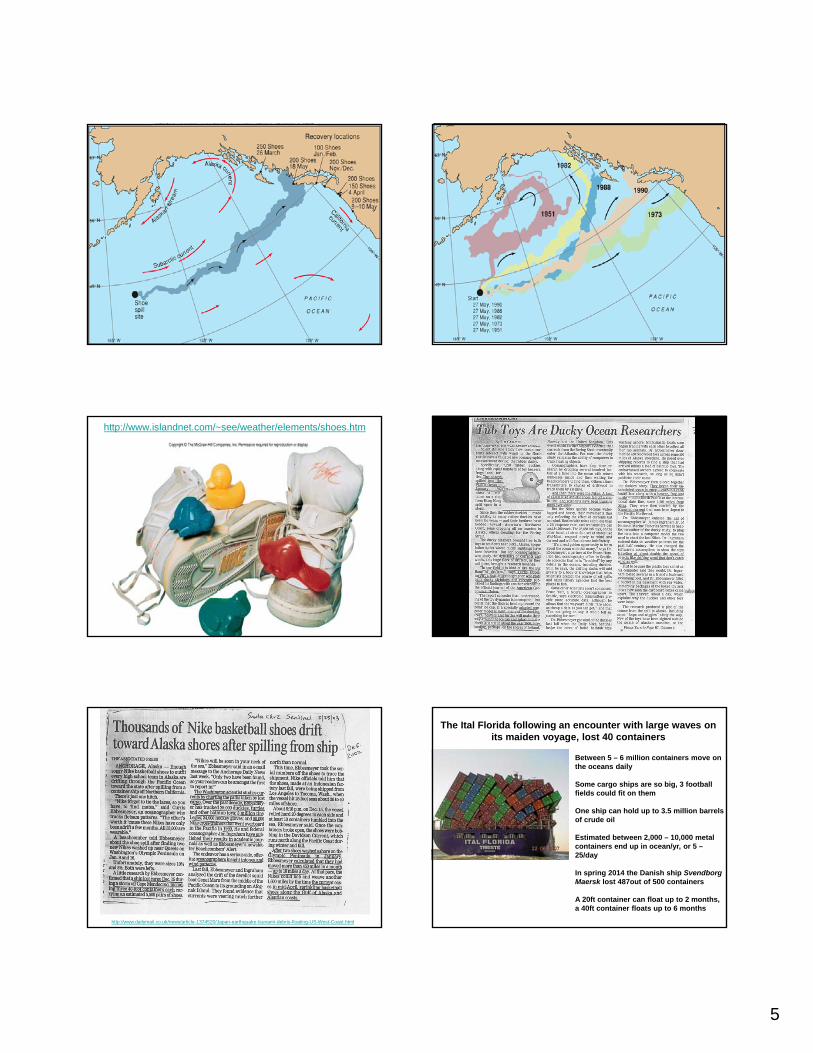
Figure 8 p.236 (figure 2) Figure 8 p.237 (figure 3)
http://www.islandnet.com/~see/weather/elements/shoes.htm
http://www.dailymail.co.uk/news/article-1374520/Japan-earthquake-tsunami-debris-floating-US-West-Coast.html
The Ital Florida following an encounter with large waves on its maiden voyage, lost 40 containers
Between 5 – 6 million containers move on the oceans daily
Some cargo ships are so big, 3 football fields could fit on them
One ship can hold up to 3.5 million barrels of crude oil
Estimated between 2,000 – 10,000 metal containers end up in ocean/yr, or 5 –25/day
In spring 2014 the Danish ship Svendborg Maersk lost 487out of 500 containers
A 20ft container can float up to 2 months, a 40ft container floats up to 6 months
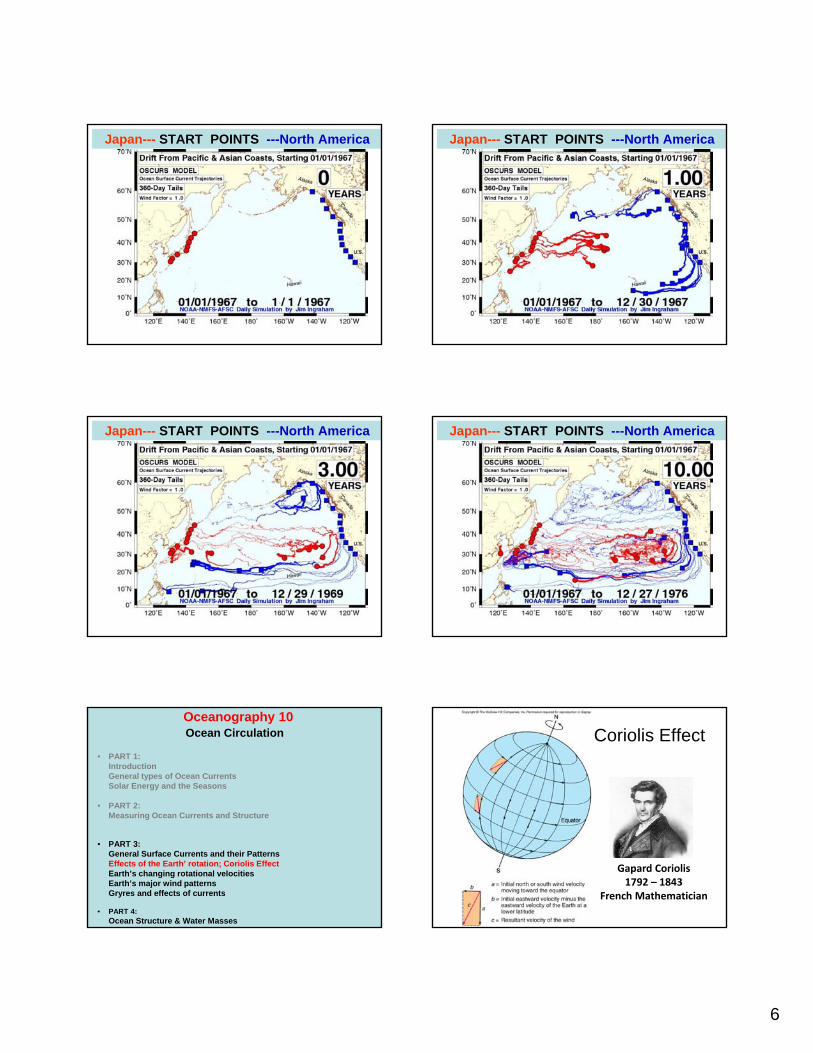
6
Japan--- START POINTS ---North America Japan--- START POINTS ---North America
Japan--- START POINTS ---North America Japan--- START POINTS ---North America
Oceanography 10Ocean Circulation
• PART 1: IntroductionGeneral types of Ocean CurrentsSolar Energy and the Seasons
• PART 2:Measuring Ocean Currents and Structure
• PART 3: General Surface Currents and their PatternsEffects of the Earth’ rotation; Coriolis EffectEarth’s changing rotational velocitiesEarth’s major wind patternsGryres and effects of currents
• PART 4:Ocean Structure & Water Masses
Coriolis Effect
Gapard Coriolis 1792 – 1843
French Mathematician

7
Coriolis Effect: the apparent deflection of moving unattached objects relative to the Earth’s surface.
Notice the change between 0-30 degrees = 140mph and between 30-60 degrees = 380mph!
Oceanography 10Ocean Circulation
• PART 1: IntroductionGeneral types of Ocean CurrentsSolar Energy and the Seasons
• PART 2:Measuring Ocean Currents and Structure
• PART 3: General Surface Currents and their PatternsEffects of the Earth’ rotation; Coriolis EffectEarth’s changing rotational velocitiesEarth’s major wind patternsGryres and effects of currents
• PART 4:Ocean Structure & Water Masses
Figure 6.19

8
Oceanography 10Ocean Circulation
• PART 1: IntroductionGeneral types of Ocean CurrentsSolar Energy and the Seasons
• PART 2:Measuring Ocean Currents and Structure
• PART 3: General Surface Currents and their PatternsEffects of the Earth’ rotation; Coriolis EffectEarth’s changing rotational velocitiesEarth’s major wind patternsGryres and effects of currents
• PART 4:Ocean Structure & Water Masses
Part 3: General Surface Current PatternsEkman Spiral & Transport, Gyres, Zones of Divergence and Convergence,
Upwelling and Downwelling, Geostrophic Flow, & Boundary Currents
Figure 8.1 Ekman Transport
Vagen Walfrid Ekman1874 – 1954
Swedish Oceanographer

9
Why Low Pressure spins in a counter-clockwise direction
Low Pressure
…
Practice Problems
If strong steady winds are blowing from the north to the south off the coast of California, which of the following will result?A. DownwellingB. UpwellingC. A zone of convergenceD. Both A and C
If strong steady winds are blowing from the south to the north off the eastcoast of Southern South America, which of the following will result? A. Upwelling and a zone of divergenceB. Downwelling and a zone of convergenceC. El NinoD. Both B and C
Geostrophic Flow
10
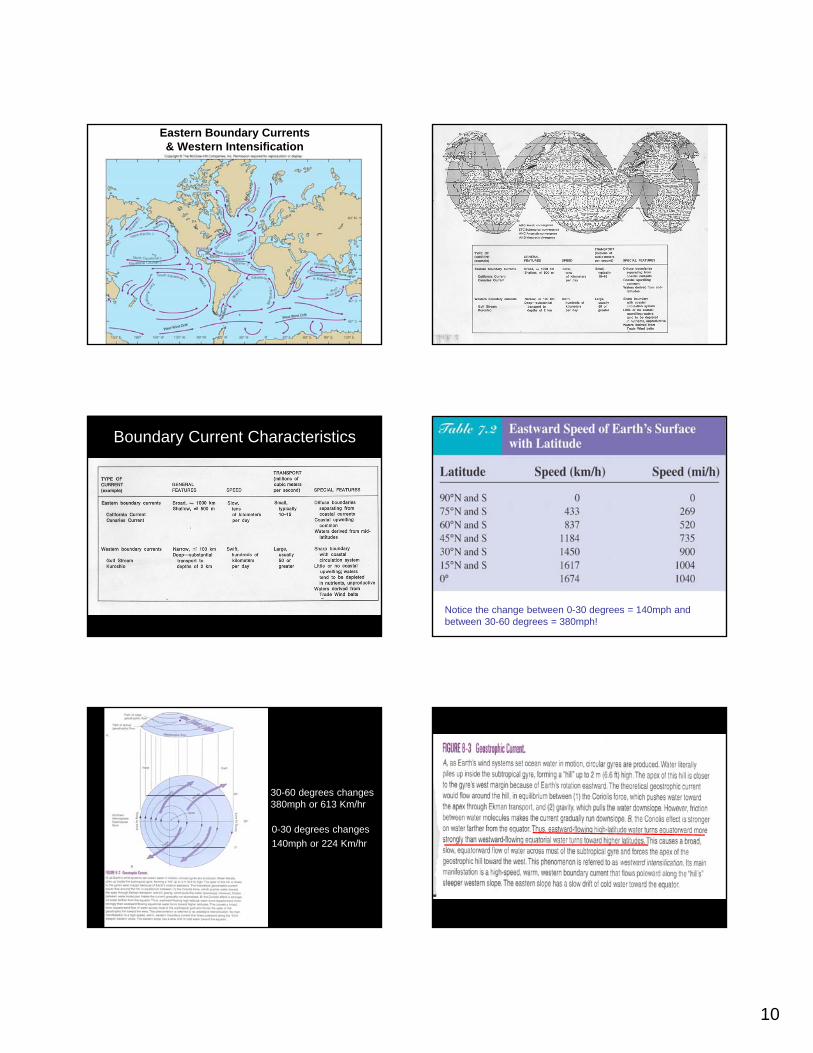
Eastern Boundary Currents & Western Intensification
Boundary Current Characteristics
Notice the change between 0-30 degrees = 140mph and between 30-60 degrees = 380mph!
30-60 degrees changes 380mph or 613 Km/hr
0-30 degrees changes
140mph or 224 Km/hr

11
The Cromwell Current: Flows eastward~ 100 meters deep, 400Km wide, 6,000Km long, flowing at ~ 3 knots, flow volume ~ 1,000 X Mississippi River, discovered in 1952
Oceanography 10Ocean Circulation
• PART 1: IntroductionGeneral types of Ocean CurrentsSolar Energy and the Seasons
• PART 2:Measuring Ocean Currents and Structure
• PART 3: General Surface Currents and their PatternsEffects of the Earth’ rotation; Coriolis EffectEarth’s changing rotational velocitiesEarth’s major wind patternsGryres and effects of currents
• PART 4:Ocean Structure & Water Masses

12
• Part 4
• Perpetual Oceanhttp://video.mit.edu/watch/perpetual-ocean-10824/
Ocean Structure and Water MassesSurface Zone, Pycnocline Zone & Deep Zone
El Niño
Figure 7.4

13
• Part 4
Ocean Structure and Water MassesSurface Zone, Pycnocline Zone & Deep Zone
El Niño
El Niño / ENSO
This slide shows “normal” atmospheric conditions called “La Niña” (not an El Niño event)
High air pressurein eastern Pacific, low air pressure inwestern Pacific.
Surface topography and
temperature is measured by
satellites and subsurface
temperatures are measured
by buoys.
Red is 30 degrees Celsius
(86F) and blue is 8 degrees
Celsius (46.4F).
http://www.cpc.ncep.noaa.gov/products/analysis_monitoring/enso_advisory/index.shtml
El Niño / warm phase = high pressure
in western Pacific, low in eastern
Pacific.
La Niña / cold phase = low pressure
in western Pacific, high in eastern
Pacific

14
Atlantic Multidecadal Oscillationvariability in the North Atlantic SST, defined in 1994
There is also a North Atlantic Oscillation (1920’s) involving changes of atmospheric Pressure and a Pacific Decadal Oscillation (1997), effects climate and SST. “Mechanisms causing oscillations remain under study”
Figure 8.8
https://www.youtube.com/watch?v=B-TSwthjPYE
https://www.youtube.com/watch?v=vP4QTyVQTUo