Embed Size (px)
Citation preview
OCTORARA AREA SCHOOL DISTRICT
ANNUAL REPORT
“CHALLENGES AND OPPORTUNITIES -
MORE THAN PSSA AND AYP”
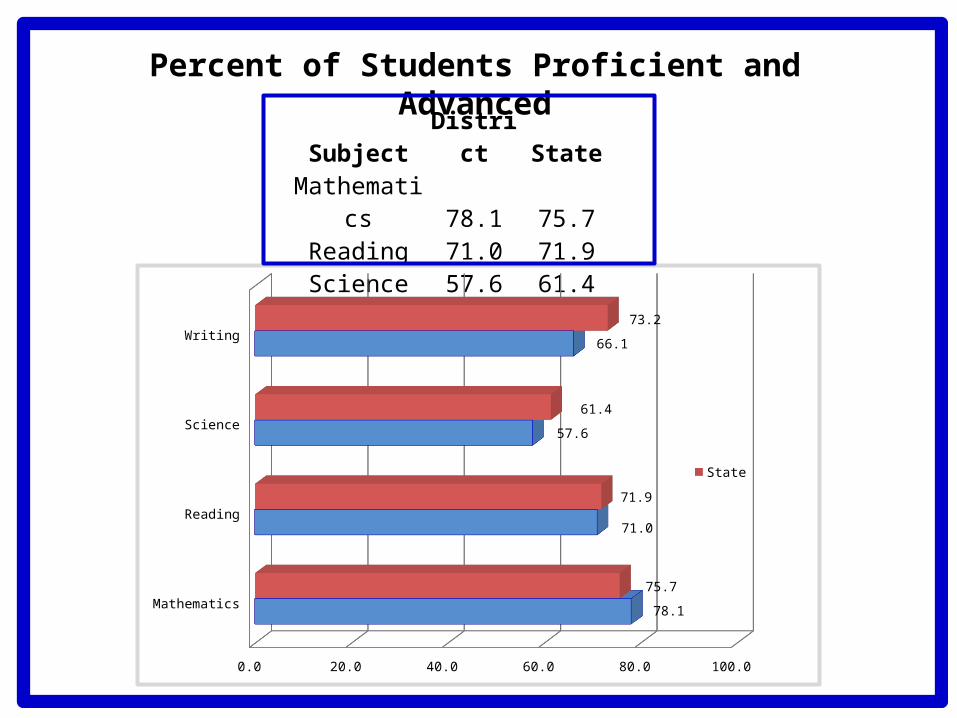
Subject District StateMathematics 78.1 75.7
Reading 71.0 71.9Science 57.6 61.4Writing 66.1 73.2
Mathematics
Reading
Science
Writing
0.0 20.0 40.0 60.0 80.0 100.0
78.1
71.0
57.6
66.1
75.7
71.9
61.4
73.2
State
District
Percent of Students Proficient and Advanced
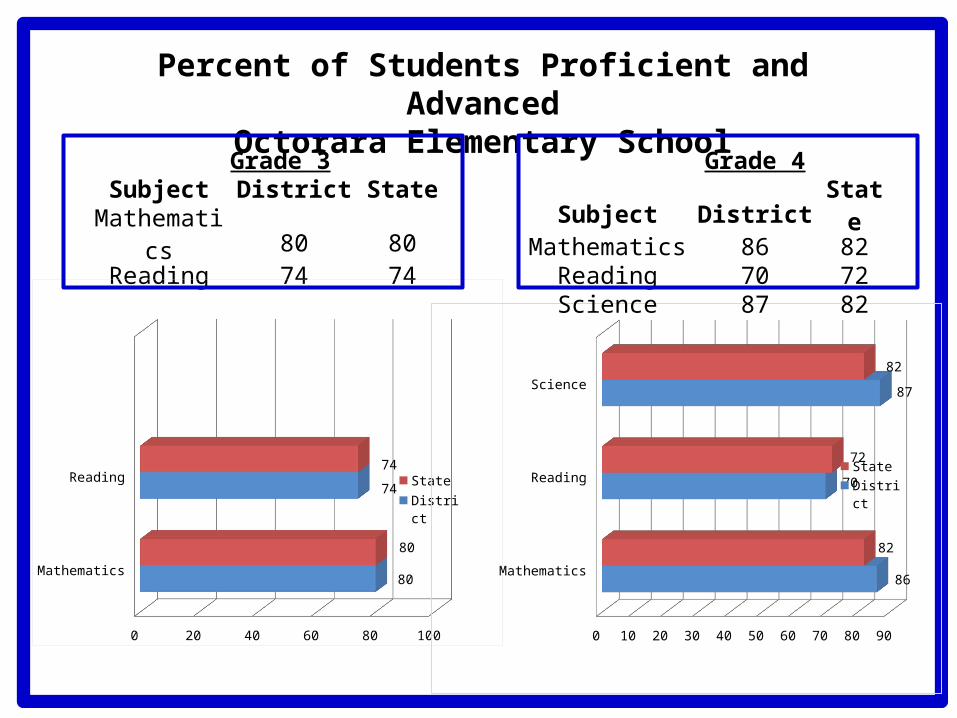
Percent of Students Proficient and AdvancedOctorara Elementary School
Grade 3Subject District State
Mathematics 80 80Reading 74 74
Mathematics
Reading
0 20 40 60 80 100
80
74
80
74
State
District
Mathematics
Reading
Science
0 10 20 30 40 50 60 70 80 90
86
70
87
82
72
82
State
District
Grade 4Subject District State
Mathematics 86 82Reading 70 72Science 87 82
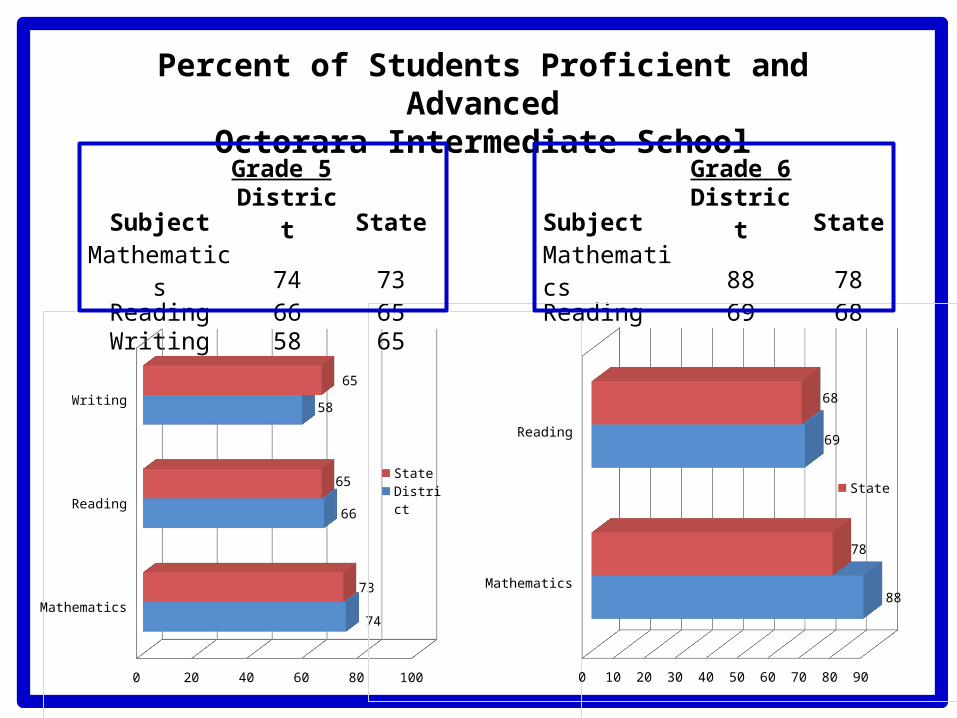
Percent of Students Proficient and AdvancedOctorara Intermediate School
Grade 5Subject District State
Mathematics 74 73Reading 66 65Writing 58 65
Mathematics
Reading
Writing
0 20 40 60 80 100
74
66
58
73
65
65
State
District
Grade 6Subject District StateMathematics 88 78Reading 69 68
Mathematics
Reading
0 10 20 30 40 50 60 70 80 90
88
69
78
68
State
District
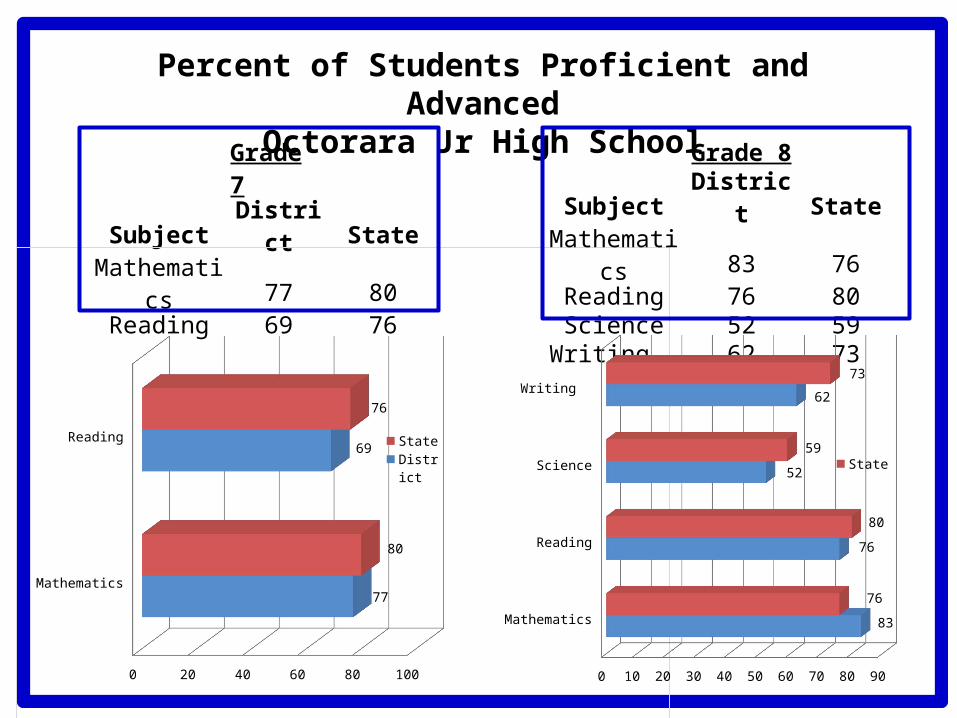
Percent of Students Proficient and AdvancedOctorara Jr High School
Grade 7Subject District State
Mathematics 77 80Reading 69 76
Mathematics
Reading
0 20 40 60 80 100
77
69
80
76
State
District
Grade 8Subject District State
Mathematics 83 76Reading 76 80Science 52 59Writing 62 73
Mathematics
Reading
Science
Writing
0 10 20 30 40 50 60 70 80 90
83
76
52
62
76
80
59
73
State
District
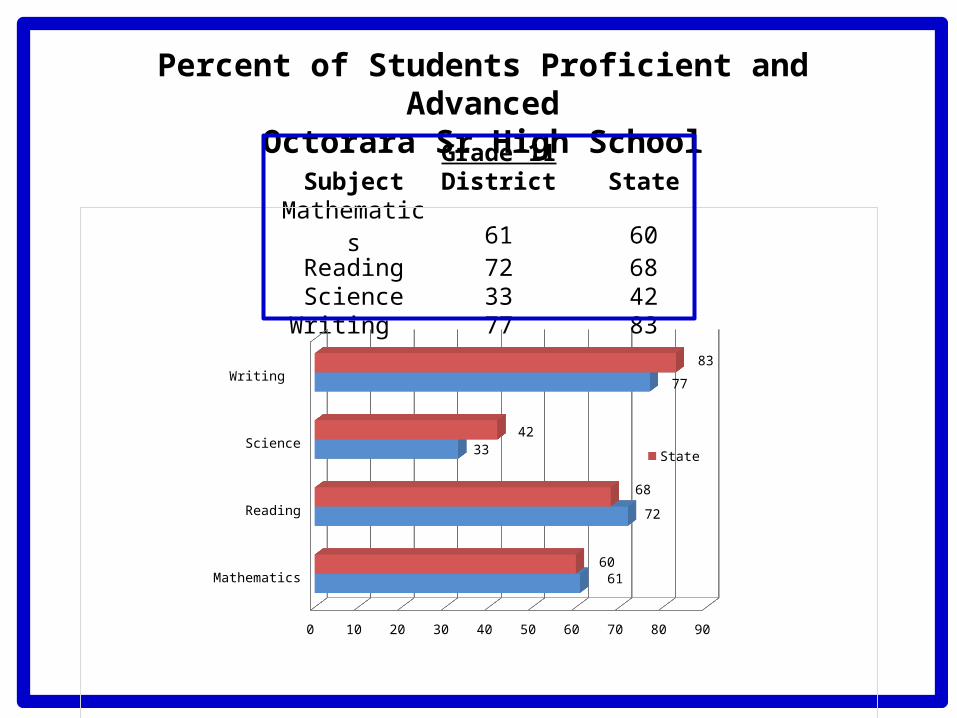
Percent of Students Proficient and AdvancedOctorara Sr High School
Grade 11Subject District State
Mathematics 61 60Reading 72 68Science 33 42Writing 77 83
Mathematics
Reading
Science
Writing
0 10 20 30 40 50 60 70 80 90
61
72
33
77
60
68
42
83
State
District
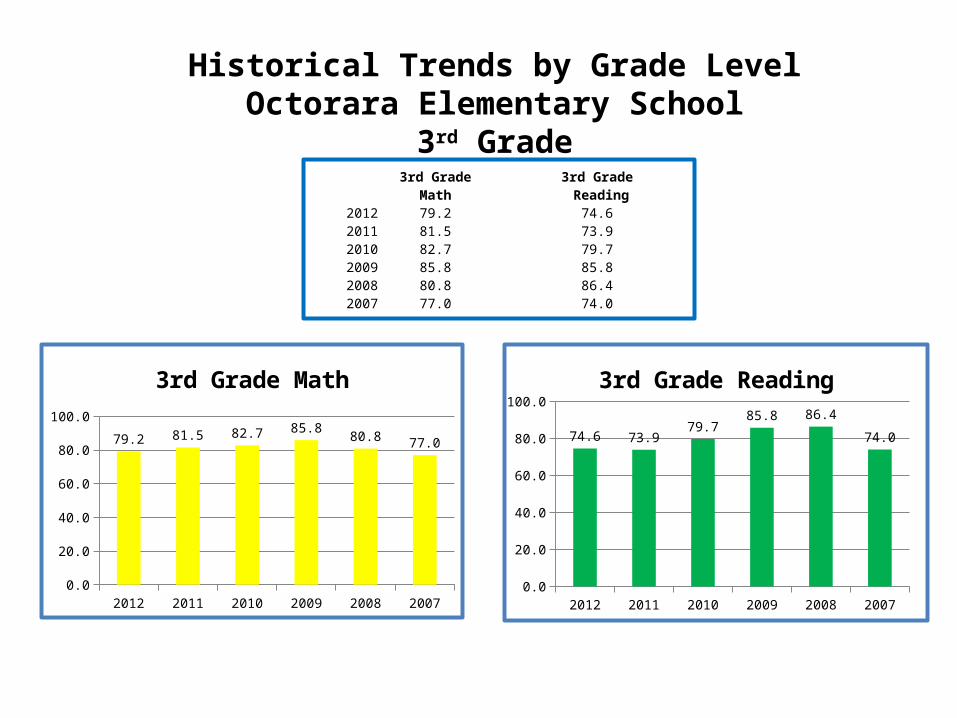
3rd Grade Math
3rd Grade Reading
2012 79.2 74.62011 81.5 73.92010 82.7 79.72009 85.8 85.82008 80.8 86.42007 77.0 74.0
Historical Trends by Grade LevelOctorara Elementary School
3rd Grade
2012 2011 2010 2009 2008 20070.0
20.0
40.0
60.0
80.0
100.0
79.2 81.5 82.7 85.880.8 77.0
3rd Grade Math
2012 2011 2010 2009 2008 20070.0
20.0
40.0
60.0
80.0
100.0
74.6 73.979.7
85.8 86.4
74.0
3rd Grade Reading
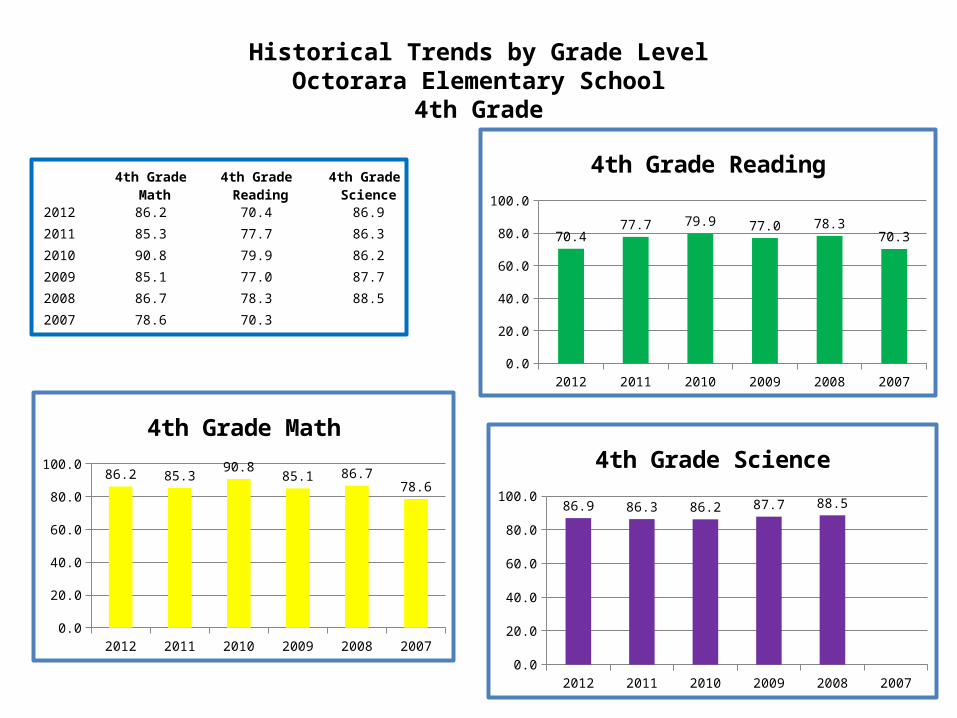
Historical Trends by Grade LevelOctorara Elementary School
4th Grade
2012 2011 2010 2009 2008 20070.0
20.0
40.0
60.0
80.0
100.086.2 85.3
90.885.1 86.7
78.6
4th Grade Math
2012 2011 2010 2009 2008 20070.0
20.0
40.0
60.0
80.0
100.0
70.477.7 79.9 77.0 78.3
70.3
4th Grade Reading
2012 2011 2010 2009 2008 20070.0
20.0
40.0
60.0
80.0
100.086.9 86.3 86.2 87.7 88.5
4th Grade Science
4th Grade Math
4th Grade Reading
4th Grade Science
2012 86.2 70.4 86.9
2011 85.3 77.7 86.3
2010 90.8 79.9 86.2
2009 85.1 77.0 87.7
2008 86.7 78.3 88.5
2007 78.6 70.3
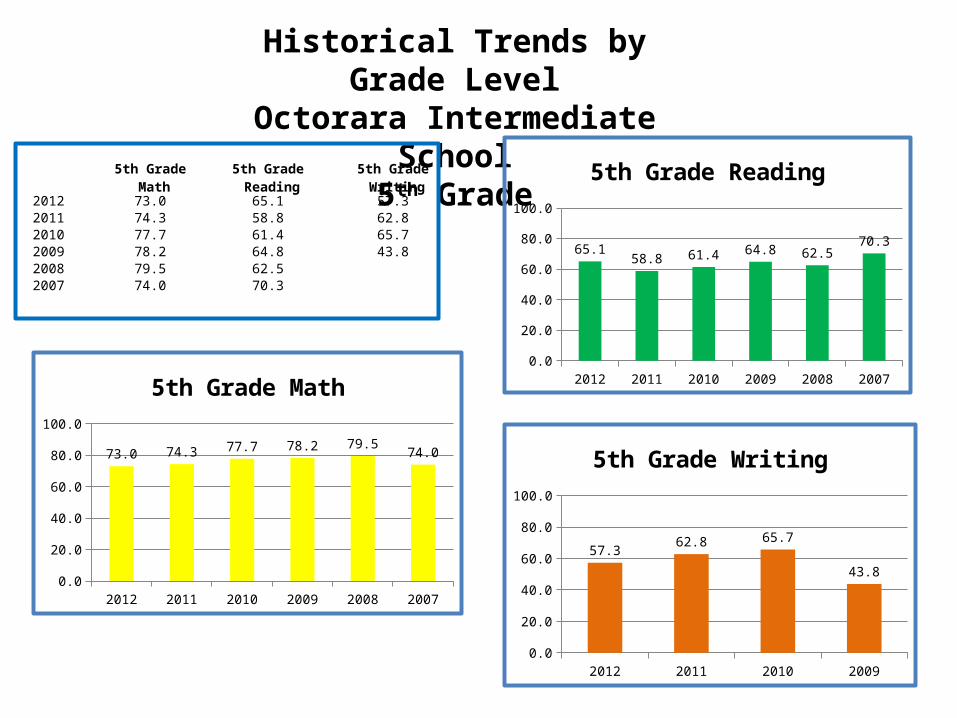
Historical Trends by Grade LevelOctorara Intermediate School
5th Grade5th Grade
Math5th Grade Reading
5th Grade Writing
2012 73.0 65.1 57.32011 74.3 58.8 62.82010 77.7 61.4 65.72009 78.2 64.8 43.82008 79.5 62.52007 74.0 70.3
2012 2011 2010 2009 2008 20070.0
20.0
40.0
60.0
80.0
100.0
73.0 74.3 77.7 78.2 79.574.0
5th Grade Math 2012 2011 2010 2009 2008 20070.0
20.0
40.0
60.0
80.0
100.0
65.158.8 61.4 64.8 62.5
70.3
5th Grade Reading
2012 2011 2010 20090.0
20.0
40.0
60.0
80.0
100.0
57.362.8 65.7
43.8
5th Grade Writing
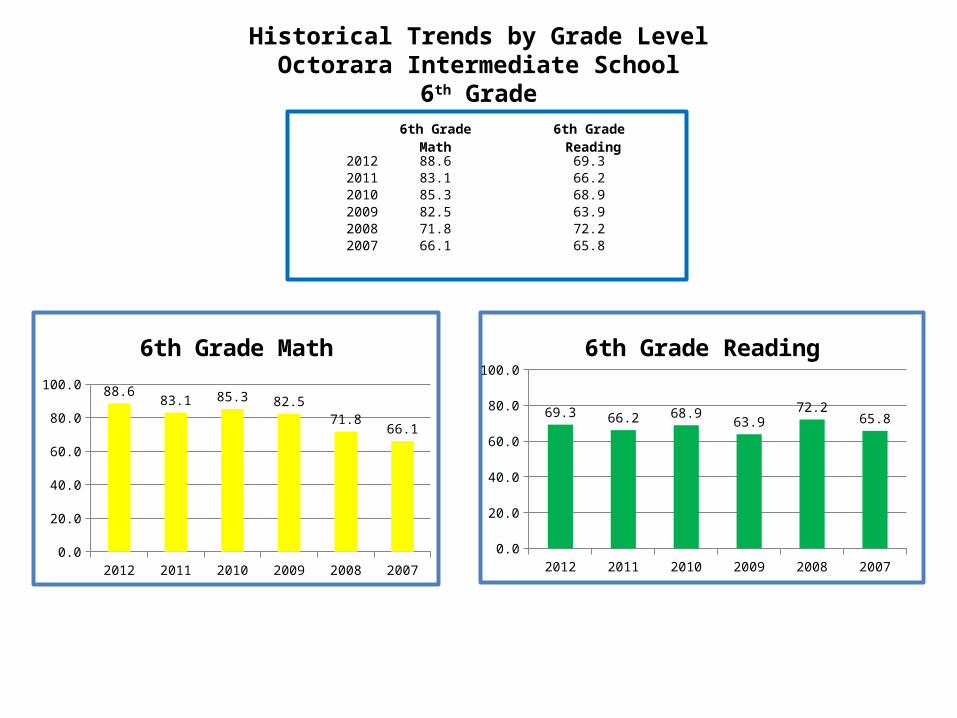
Historical Trends by Grade LevelOctorara Intermediate School
6th Grade6th Grade
Math6th Grade Reading
2012 88.6 69.32011 83.1 66.22010 85.3 68.92009 82.5 63.92008 71.8 72.22007 66.1 65.8
2012 2011 2010 2009 2008 20070.0
20.0
40.0
60.0
80.0
100.088.6
83.1 85.3 82.571.8
66.1
6th Grade Math
2012 2011 2010 2009 2008 20070.0
20.0
40.0
60.0
80.0
100.0
69.3 66.2 68.963.9
72.265.8
6th Grade Reading
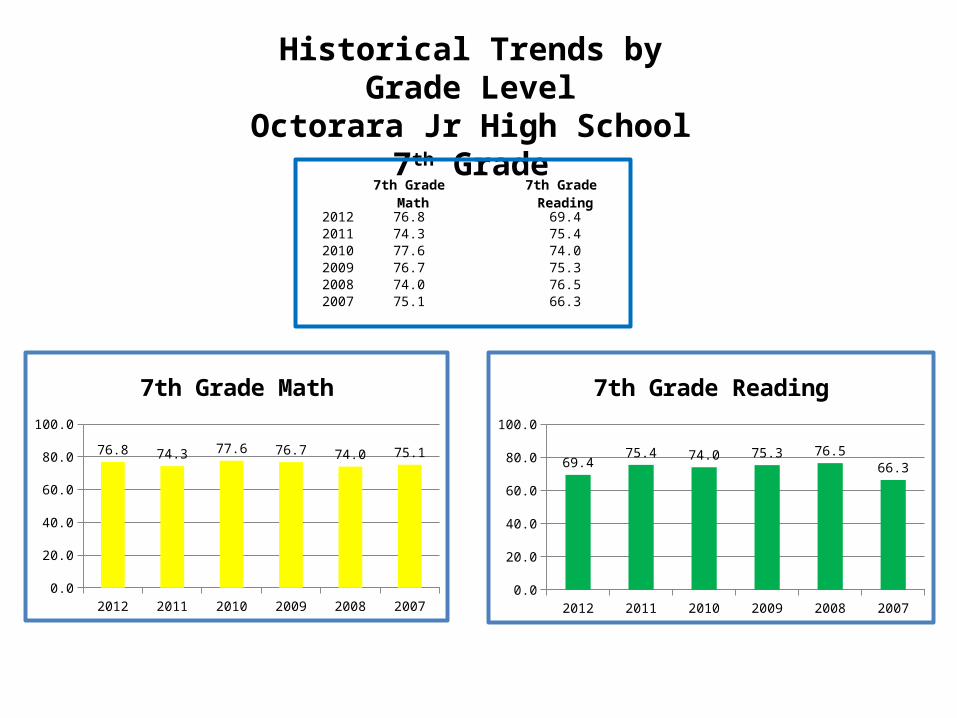
Historical Trends by Grade LevelOctorara Jr High School
7th Grade
7th Grade Math
7th Grade Reading
2012 76.8 69.42011 74.3 75.42010 77.6 74.02009 76.7 75.32008 74.0 76.52007 75.1 66.3
2012 2011 2010 2009 2008 20070.0
20.0
40.0
60.0
80.0
100.0
76.8 74.3 77.6 76.7 74.0 75.1
7th Grade Math
2012 2011 2010 2009 2008 20070.0
20.0
40.0
60.0
80.0
100.0
69.475.4 74.0 75.3 76.5
66.3
7th Grade Reading
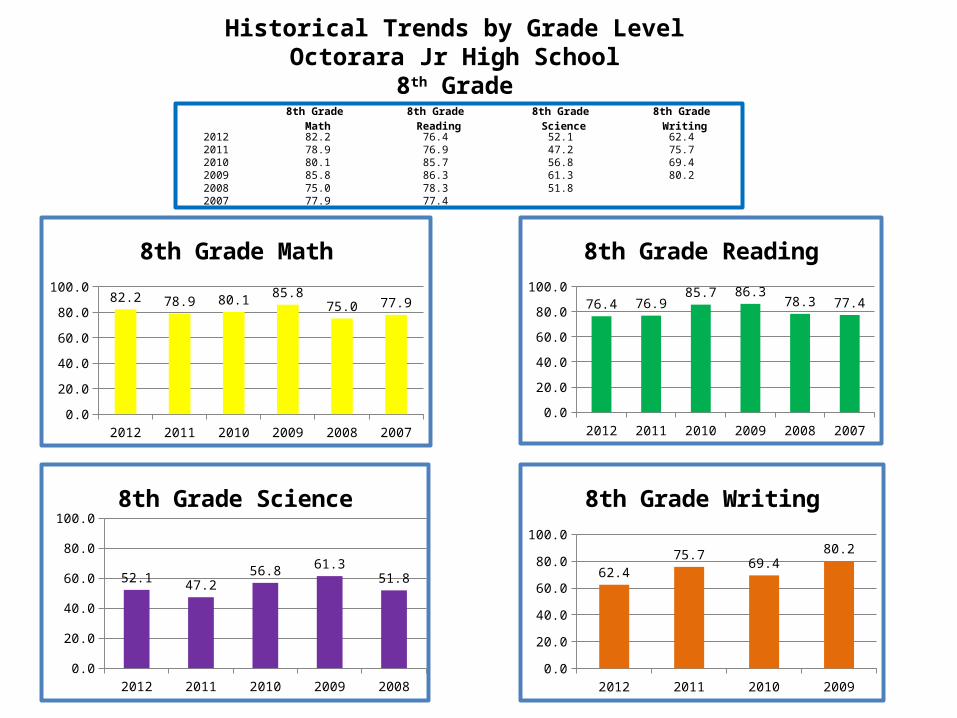
Historical Trends by Grade LevelOctorara Jr High School
8th Grade8th Grade
Math8th Grade Reading
8th Grade Science
8th Grade Writing
2012 82.2 76.4 52.1 62.42011 78.9 76.9 47.2 75.72010 80.1 85.7 56.8 69.42009 85.8 86.3 61.3 80.22008 75.0 78.3 51.82007 77.9 77.4
2012 2011 2010 2009 2008 20070.0
20.0
40.0
60.0
80.0
100.082.2 78.9 80.1
85.875.0 77.9
8th Grade Math
2012 2011 2010 2009 2008 20070.0
20.0
40.0
60.0
80.0
100.0
76.4 76.985.7 86.3
78.3 77.4
8th Grade Reading
2012 2011 2010 2009 20080.0
20.0
40.0
60.0
80.0
100.0
52.1 47.256.8 61.3
51.8
8th Grade Science
2012 2011 2010 20090.010.020.030.040.050.060.070.080.090.0
62.4
75.769.4
80.2
8th Grade Writing
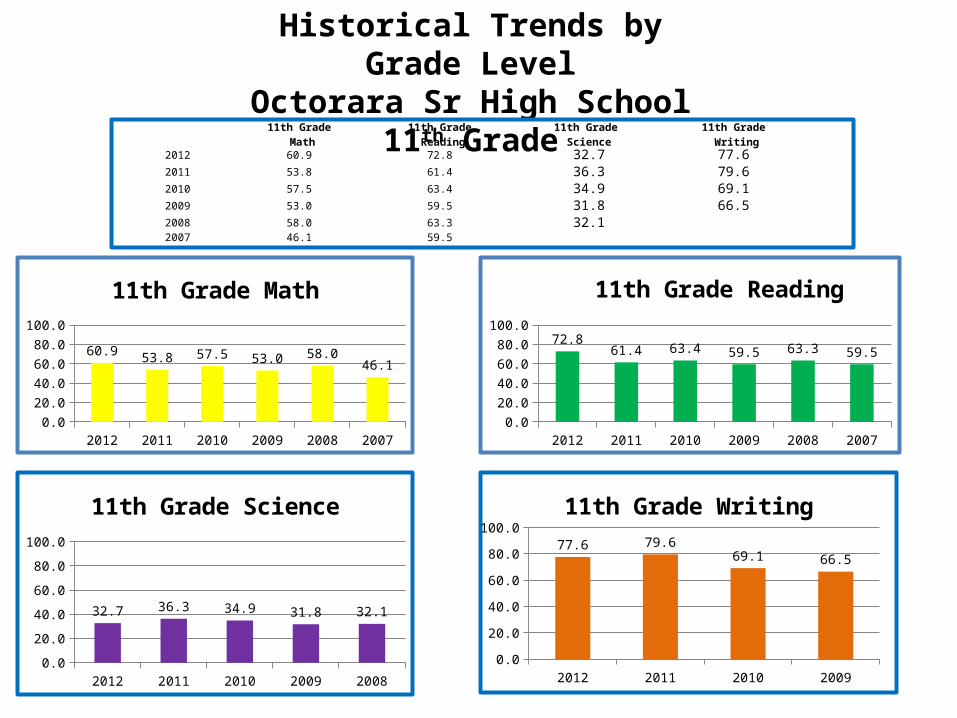
Historical Trends by Grade LevelOctorara Sr High School
11th Grade11th Grade
Math11th Grade Reading
11th Grade Science
11th Grade Writing
2012 60.9 72.8 32.7 77.62011 53.8 61.4 36.3 79.62010 57.5 63.4 34.9 69.12009 53.0 59.5 31.8 66.52008 58.0 63.3 32.12007 46.1 59.5
2012 2011 2010 2009 2008 20070.0
20.0
40.0
60.0
80.0
100.0
60.953.8 57.5 53.0 58.0
46.1
11th Grade Math
2012 2011 2010 2009 2008 20070.0
20.0
40.0
60.0
80.0
100.0
72.861.4 63.4 59.5 63.3 59.5
11th Grade Reading
2012 2011 2010 2009 20080.0
20.0
40.0
60.0
80.0
100.0
32.7 36.3 34.9 31.8 32.1
11th Grade Science
2012 2011 2010 20090.0
20.0
40.0
60.0
80.0
100.077.6 79.6
69.1 66.5
11th Grade Writing
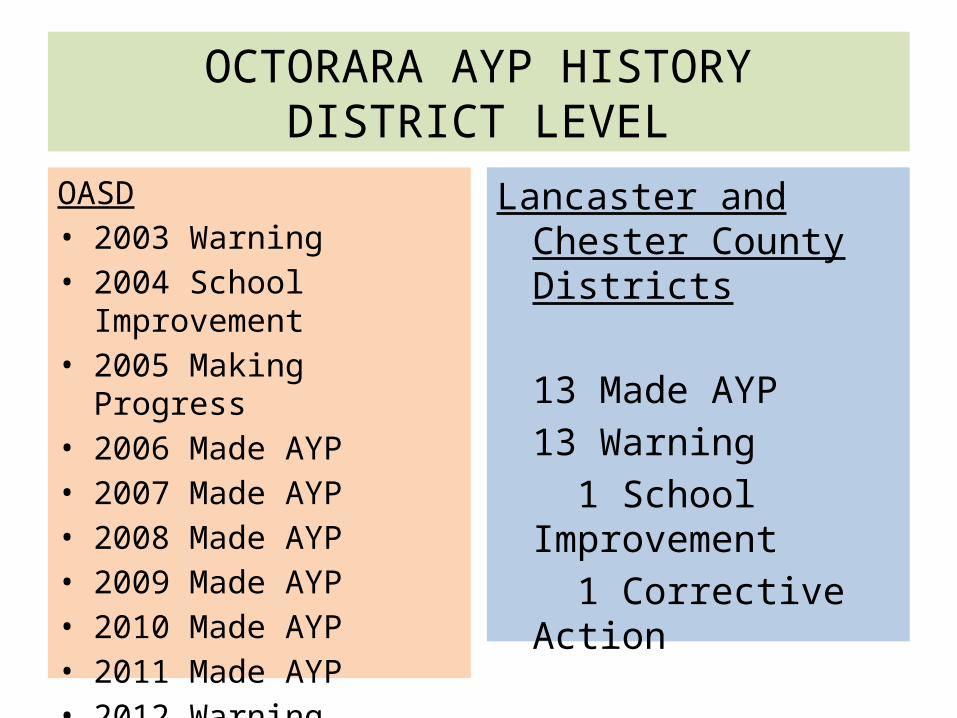
OCTORARA AYP HISTORYDISTRICT LEVEL
OASD• 2003 Warning• 2004 School Improvement• 2005 Making Progress• 2006 Made AYP• 2007 Made AYP• 2008 Made AYP• 2009 Made AYP• 2010 Made AYP• 2011 Made AYP• 2012 Warning
Lancaster and Chester County Districts
13 Made AYP13 Warning 1 School Improvement 1 Corrective Action
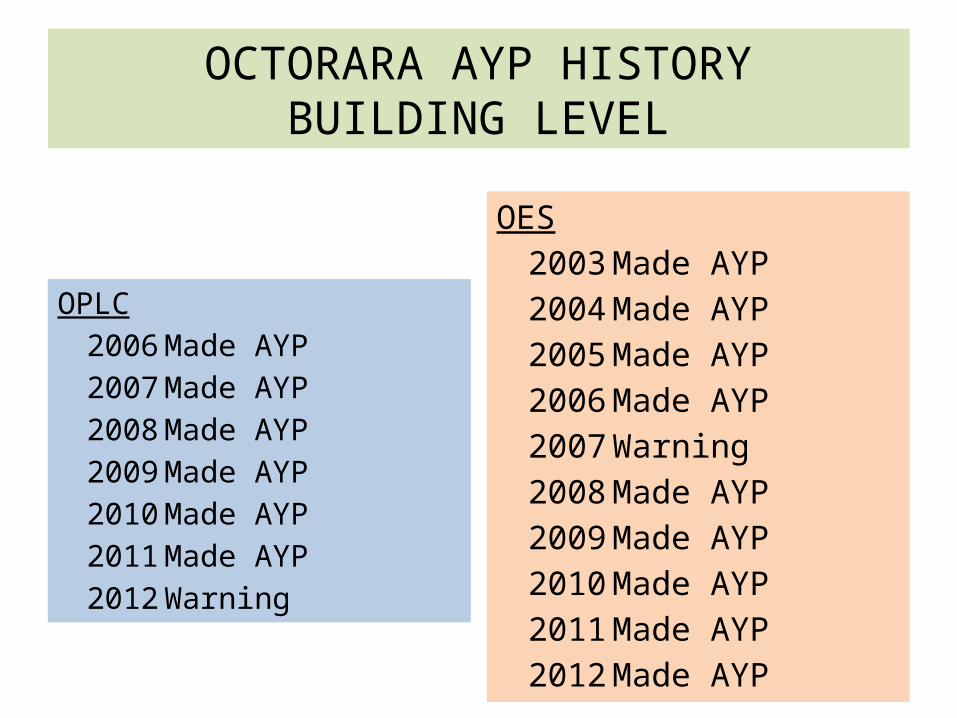
OCTORARA AYP HISTORYBUILDING LEVEL
OPLC2006 Made AYP2007 Made AYP2008 Made AYP2009 Made AYP2010 Made AYP2011 Made AYP2012 Warning
OES2003 Made AYP2004 Made AYP2005 Made AYP2006 Made AYP2007 Warning2008 Made AYP2009 Made AYP2010 Made AYP2011 Made AYP2012 Made AYP
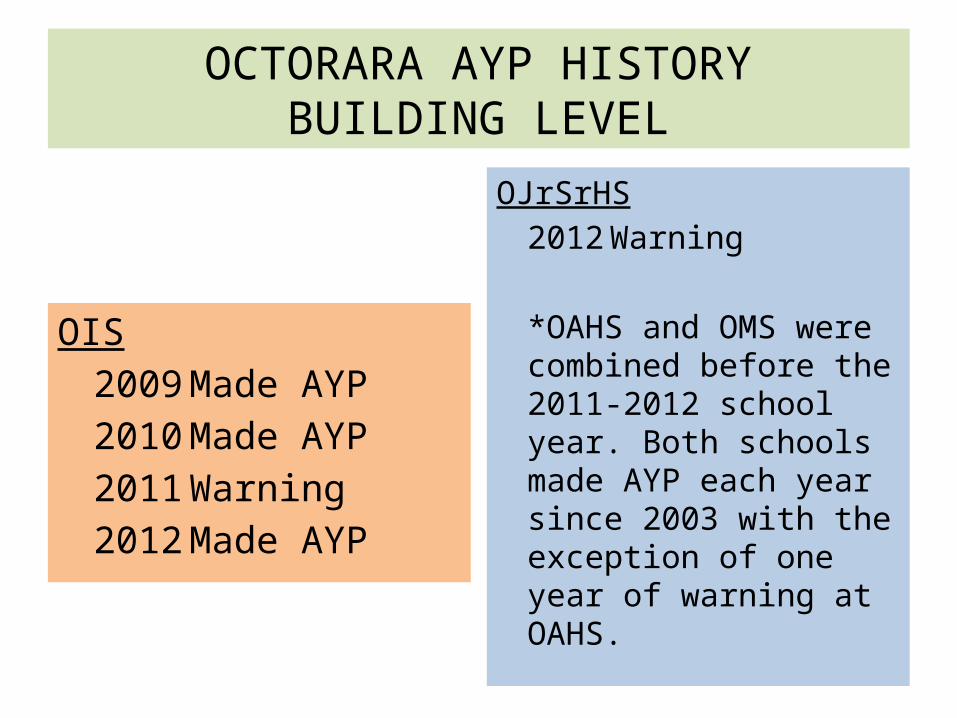
OCTORARA AYP HISTORYBUILDING LEVEL
OIS2009 Made AYP2010 Made AYP2011 Warning2012 Made AYP
OJrSrHS2012 Warning
*OAHS and OMS were combined before the 2011-2012 school year. Both schools made AYP each year since 2003 with the exception of one year of warning at OAHS.
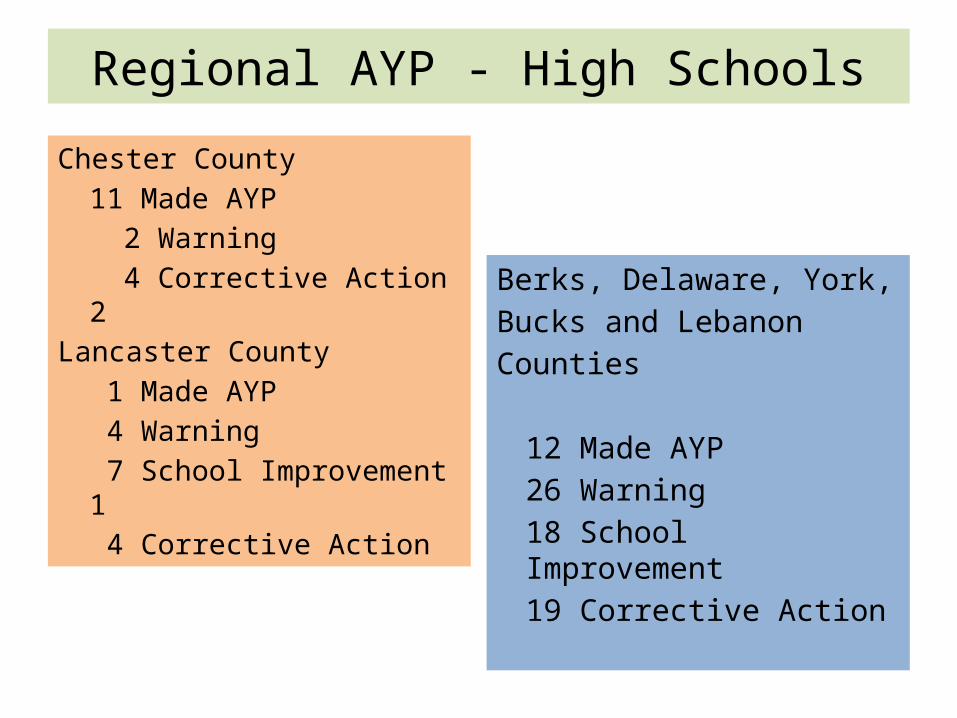
Regional AYP - High Schools
Chester County11 Made AYP 2 Warning 4 Corrective Action 2
Lancaster County 1 Made AYP 4 Warning 7 School Improvement 1 4 Corrective Action
Berks, Delaware, York, Bucks and Lebanon Counties
12 Made AYP26 Warning18 School Improvement19 Corrective Action
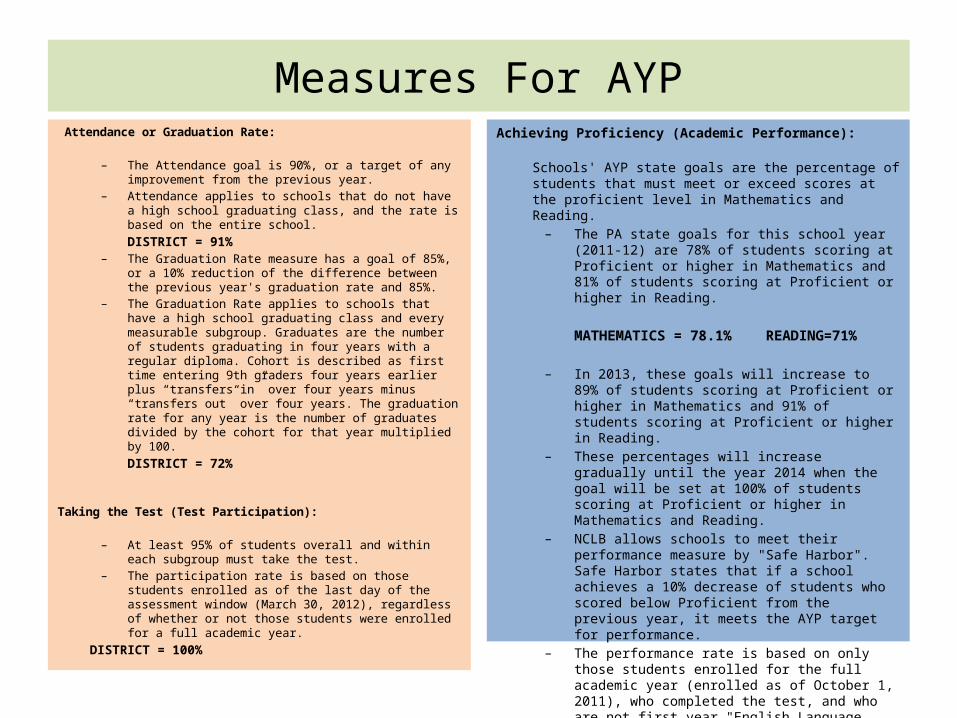
Measures For AYP Attendance or Graduation Rate:
– The Attendance goal is 90%, or a target of any improvement from the previous year.
– Attendance applies to schools that do not have a high school graduating class, and the rate is based on the entire school.
DISTRICT = 91%– The Graduation Rate measure has a goal of 85%, or a 10%
reduction of the difference between the previous year's graduation rate and 85%.
– The Graduation Rate applies to schools that have a high school graduating class and every measurable subgroup. Graduates are the number of students graduating in four years with a regular diploma. Cohort is described as first time entering 9th graders four years earlier plus “transfers in” over four years minus “transfers out” over four years. The graduation rate for any year is the number of graduates divided by the cohort for that year multiplied by 100.
DISTRICT = 72%
Taking the Test (Test Participation):
– At least 95% of students overall and within each subgroup must take the test.
– The participation rate is based on those students enrolled as of the last day of the assessment window (March 30, 2012), regardless of whether or not those students were enrolled for a full academic year.
DISTRICT = 100%
Achieving Proficiency (Academic Performance):
Schools' AYP state goals are the percentage of students that must meet or exceed scores at the proficient level in Mathematics and Reading.
– The PA state goals for this school year (2011-12) are 78% of students scoring at Proficient or higher in Mathematics and 81% of students scoring at Proficient or higher in Reading.
MATHEMATICS = 78.1% READING=71%
– In 2013, these goals will increase to 89% of students scoring at Proficient or higher in Mathematics and 91% of students scoring at Proficient or higher in Reading.
– These percentages will increase gradually until the year 2014 when the goal will be set at 100% of students scoring at Proficient or higher in Mathematics and Reading.
– NCLB allows schools to meet their performance measure by "Safe Harbor". Safe Harbor states that if a school achieves a 10% decrease of students who scored below Proficient from the previous year, it meets the AYP target for performance.
– The performance rate is based on only those students enrolled for the full academic year (enrolled as of October 1, 2011), who completed the test, and who are not first year "English Language Learners" students.
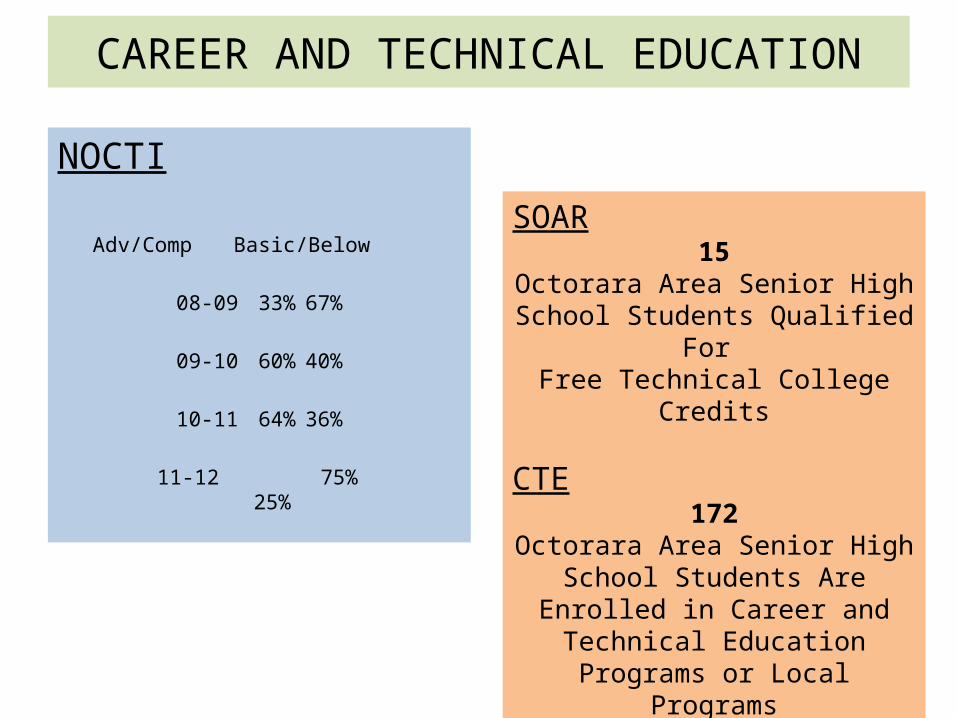
CAREER AND TECHNICAL EDUCATION
NOCTI
Adv/Comp Basic/Below
08-09 33% 67%
09-10 60% 40%
10-11 64% 36%
11-12 75% 25%
SOAR15
Octorara Area Senior High School Students Qualified For
Free Technical College Credits
CTE172
Octorara Area Senior High School Students Are Enrolled in Career and Technical Education Programs or
Local Programs75/70/27
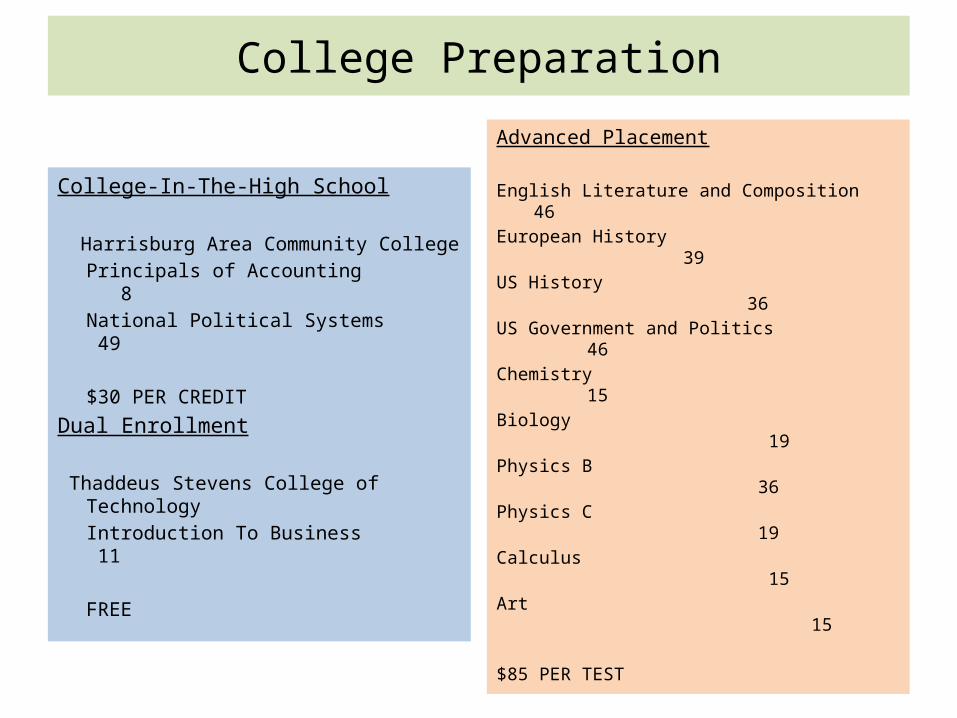
College Preparation
College-In-The-High School
Harrisburg Area Community CollegePrincipals of Accounting 8National Political Systems 49
$30 PER CREDIT
Dual Enrollment
Thaddeus Stevens College of TechnologyIntroduction To Business 11
FREE
Advanced Placement
English Literature and Composition 46European History 39
US History 36US Government and Politics 46Chemistry 15Biology 19Physics B 36Physics C 19Calculus 15Art 15
$85 PER TEST
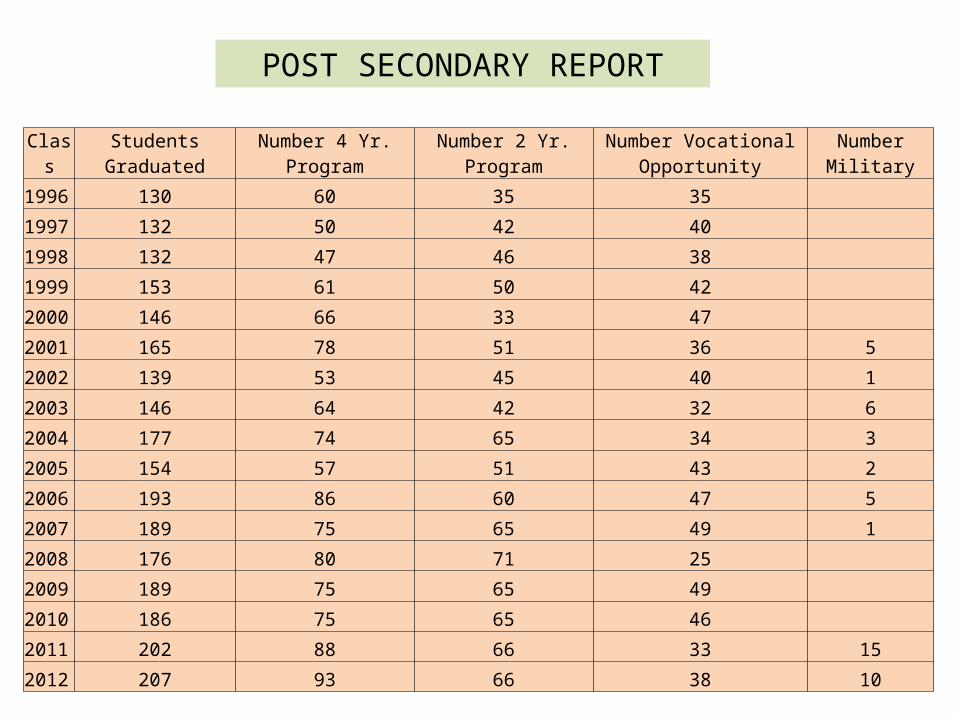
ClassStudents
GraduatedNumber 4 Yr.
ProgramNumber 2 Yr.
ProgramNumber Vocational
OpportunityNumber Military
1996 130 60 35 35
1997 132 50 42 40
1998 132 47 46 38
1999 153 61 50 42
2000 146 66 33 47
2001 165 78 51 36 5
2002 139 53 45 40 1
2003 146 64 42 32 6
2004 177 74 65 34 3
2005 154 57 51 43 2
2006 193 86 60 47 5
2007 189 75 65 49 1
2008 176 80 71 25
2009 189 75 65 49
2010 186 75 65 46
2011 202 88 66 33 15
2012 207 93 66 38 10
POST SECONDARY REPORT
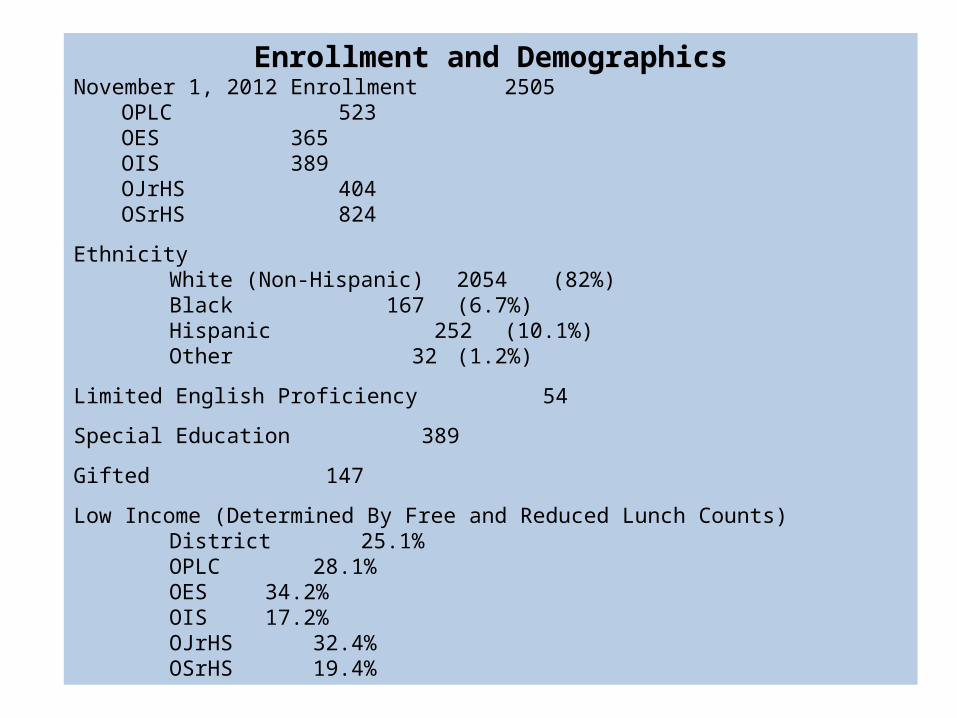
Enrollment and DemographicsNovember 1, 2012 Enrollment 2505
OPLC 523OES 365OIS 389OJrHS 404OSrHS 824
EthnicityWhite (Non-Hispanic) 2054 (82%)Black 167 (6.7%)Hispanic 252 (10.1%)Other 32 (1.2%)
Limited English Proficiency 54
Special Education 389
Gifted 147
Low Income (Determined By Free and Reduced Lunch Counts)District 25.1%OPLC 28.1%OES 34.2%OIS 17.2%OJrHS 32.4%OSrHS 19.4%
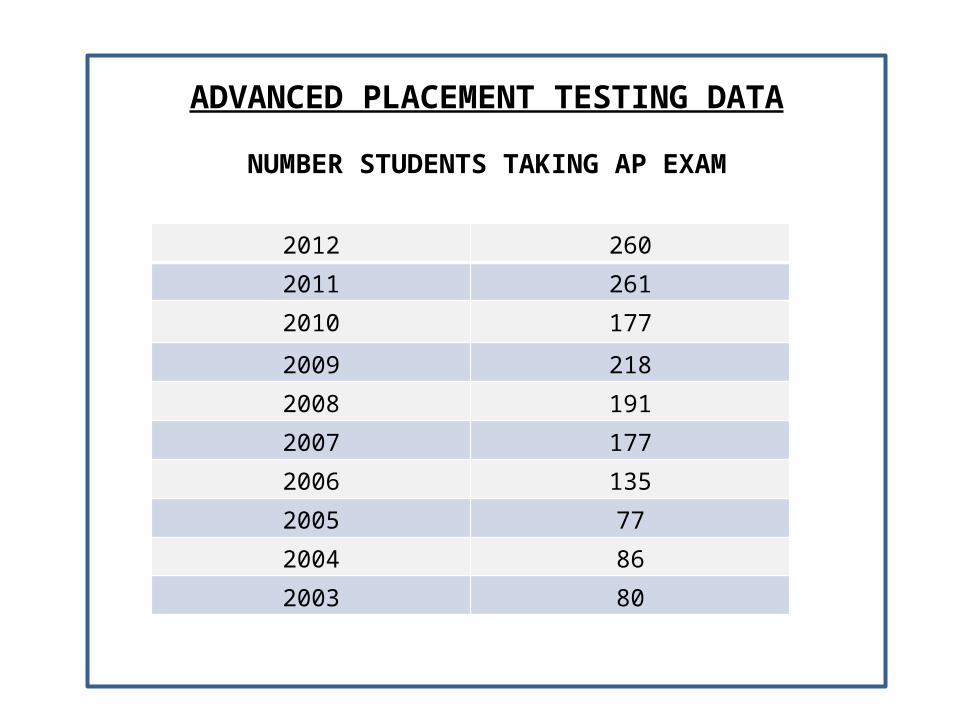
ADVANCED PLACEMENT TESTING DATA
NUMBER STUDENTS TAKING AP EXAM
2012 260
2011 261
2010 177
2009 218
2008 191
2007 177
2006 135
2005 77
2004 86
2003 80
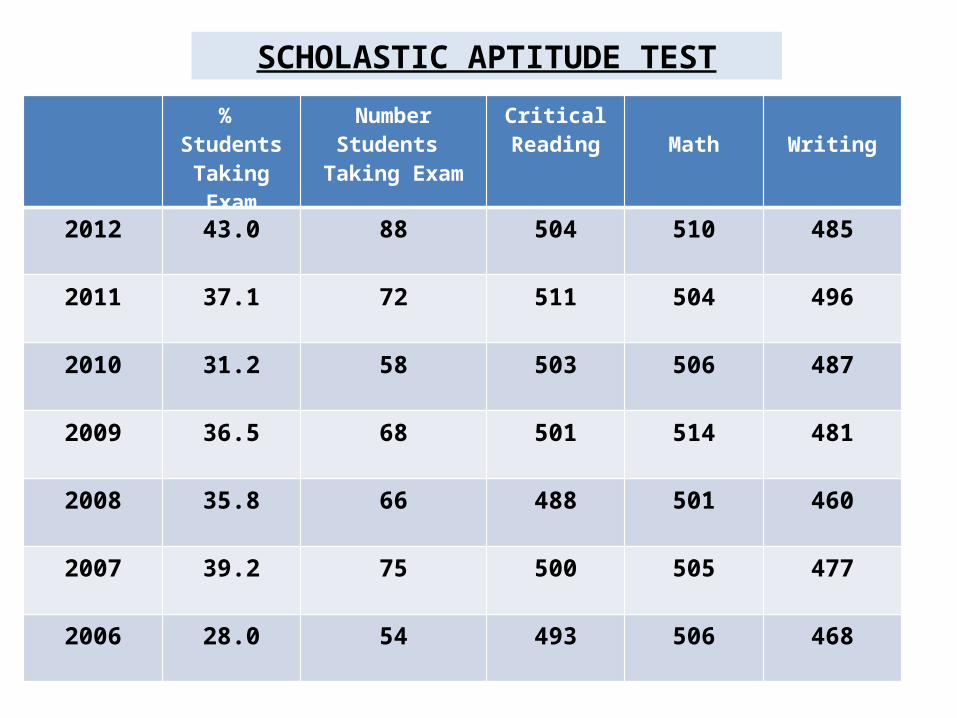
SCHOLASTIC APTITUDE TEST% Students Taking Exam
Number Students Taking Exam
CriticalReading Math Writing
2012 43.0 88 504 510 485
2011 37.1 72 511 504 496
2010 31.2 58 503 506 487
2009 36.5 68 501 514 481
2008 35.8 66 488 501 460
2007 39.2 75 500 505 477
2006 28.0 54 493 506 468
COMPREHENSIVE PLANNINGStrategic Planning
LEARNING FOCUSED SCHOOLS“SCHOOLS ARE NOT ABOUT TEACHING – THEY ARE
ABOUT LEARNING.”~Jim Riedl

QUESTIONS?