Embed Size (px)
Citation preview

Odour Impact Assessment for a Proposed Wastewater Treatment Plant Talbotville, Township of Southwold, Ontario
Prepared for: 1873828 Ontario Limited 94 Curtis Street St. Thomas, Ontario N5P 1J2
Site Name: Talbotville Wastewater Treatment Plant Township of Southwold Ontario
Prepared by:
Reviewed by:
Xiaoxi (Winnie) Song, M.S.c, P.Eng. Senior Environmental Engineer Bridget Mills, P.Eng. Senior Environmental Engineer
BCX File No. 1013-02.01
Date: November 2016
Executive Summary BCX Environmental Consulting (BCX) was subcontracted by Pottinger Gaherty Environmental Consultants (PGL) to prepare an Odour Impact Assessment (Study) for the proposed Talbotville Wastewater Treatment Plant (WWTP). The purpose of this Study is to provide technical input to the Environmental Assessment on odour as requested by Ontario Ministry of the Environment and Climate Change (MOECC) and to facilitate the Township of Southwold (Southwold)’s review of the draft Site Plan Approval for the WWTP. The odour modelling assessment can be used to support an ECA application to the MOECC. 1873828 Ontario Limited (Company) is proposing a WWTP to service the community of Talbotville and the proposed residential subdivision in Southwold. The proposed WWTP will use the State-of-the-art Newterra MicroclearTM membrane bioreactor (MBR) technology with an ultimate capacity of 1,250 cubic metres of influent per day (m3/day). Where applicable, this study followed the MOECC emission summary and air dispersion modelling guidelines as set out in s.26 of Ontario Regulation 419/05 and MOECC guidance documents Procedure for Preparing an Emission Summary and Dispersion Modelling Report (March 2009); Air Dispersion Modelling Guideline for Ontario (March 2009); and Technical Bulletin: Methodology for Modelling Assessments of Contaminants with 10-Minute Average Standards and Guidelines under O. Reg. 419/05 (April 2008). An emission inventory and air dispersion modelling assessment was completed to conservatively assess the WWTP’s potential odour impact at the property line, at the nearby existing sensitive receptors and the proposed residential subdivision when the WWTP is operating at its ultimate capacity. The odour emission inventory was developed based odour source testing data for a larger scale conventional WWTP under normal operations and the proposed plant design, provided by Ricor Engineering Ltd. (Ricor), the Company and their representatives. The modelling assessment was completed using the MOECC regulatory model, AERMOD (Version 14134). The results of the study predict that the maximum 10-minute average odour concentrations are below the MOECC odour guideline at all offsite locations including the surrounding existing sensitive receptors and the proposed residential subdivision to be located immediately northwest of the WWTP. No odour impacts are, therefore, expected from the normal operation of the proposed WWTP.
Table of Contents
1.0 INTRODUCTION ........................................................................................................... 5
1.1 Project Background .................................................................................................... 5
1.2 Site Description .......................................................................................................... 5
1.3 Process Description .................................................................................................... 6
1.3.1 Headworks ....................................................................................................... 6
1.3.2 Biological Treatment ........................................................................................ 6
1.3.3 Sludge Management ........................................................................................ 7
2.0 IDENTIFICATION OF SIGNIFICANT ODOUR SOURCES .................................................... 8
3.0 ODOUR EMISSION ESTIMATION AND MAXIMUM EMISSIONS SCENARIO ..................... 8
3.1 Emission Estimation Methodologies ........................................................................ 10
3.2 Maximum Emissions Scenario .................................................................................. 10
4.0 AIR DISPERSION MODELLING ..................................................................................... 11
4.1 Model Selection and Use .......................................................................................... 11
4.2 Meteorology ............................................................................................................. 11
4.3 Terrain ...................................................................................................................... 11
4.4 Modelling Domain and Receptor Grid ..................................................................... 11
4.5 Source Parameters ................................................................................................... 12
5.0 RESULTS .................................................................................................................... 14
6.0 CONCLUSIONS AND RECOMMENDATIONS ................................................................. 16
6.1 Conclusions ............................................................................................................... 16
6.2 Contingency .............................................................................................................. 16
7.0 LIMITATIONS ............................................................................................................. 16
8.0 REFERENCES .............................................................................................................. 17

LIST OF TABLES Table 3-1: Source and Contaminant Identification Summary ..........................................................9 Table 4-1: AERMOD Source Input Parameters .............................................................................. 13 Table 5-1: Modelling Results Summary ......................................................................................... 15 LIST OF FIGURES (APPENDIX A) Figure 1: Site and Receptor Locations Map Figure 2: Detailed Site Layout Figure 3: Simplified Process Flow Diagram Figure 4: Dispersion Modelling Configuration Figures 5A-E: Wind Roses APPENDICES Appendix A Figures Appendix B Emission Calculation Sheet Appendix C AERMOD Dispersion Modelling Results
Odour Impact Assessment November 2016 Talbotville WWTP Page 5 BCX File: 1013-02.01
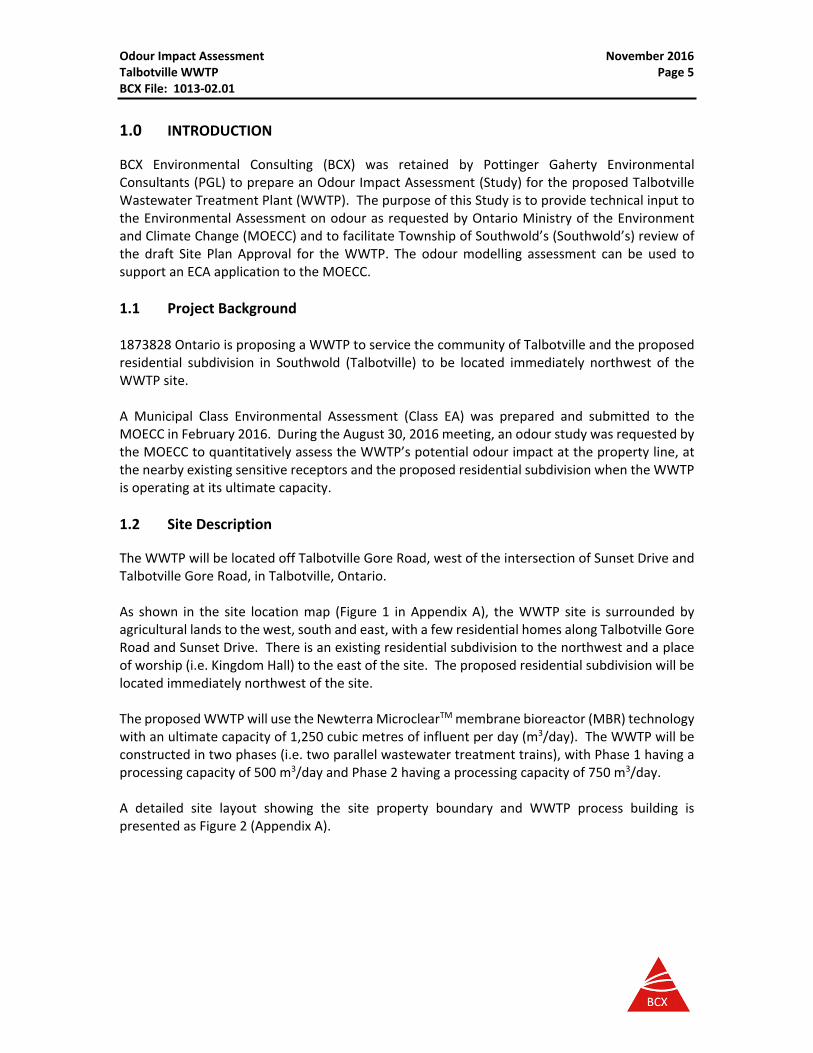
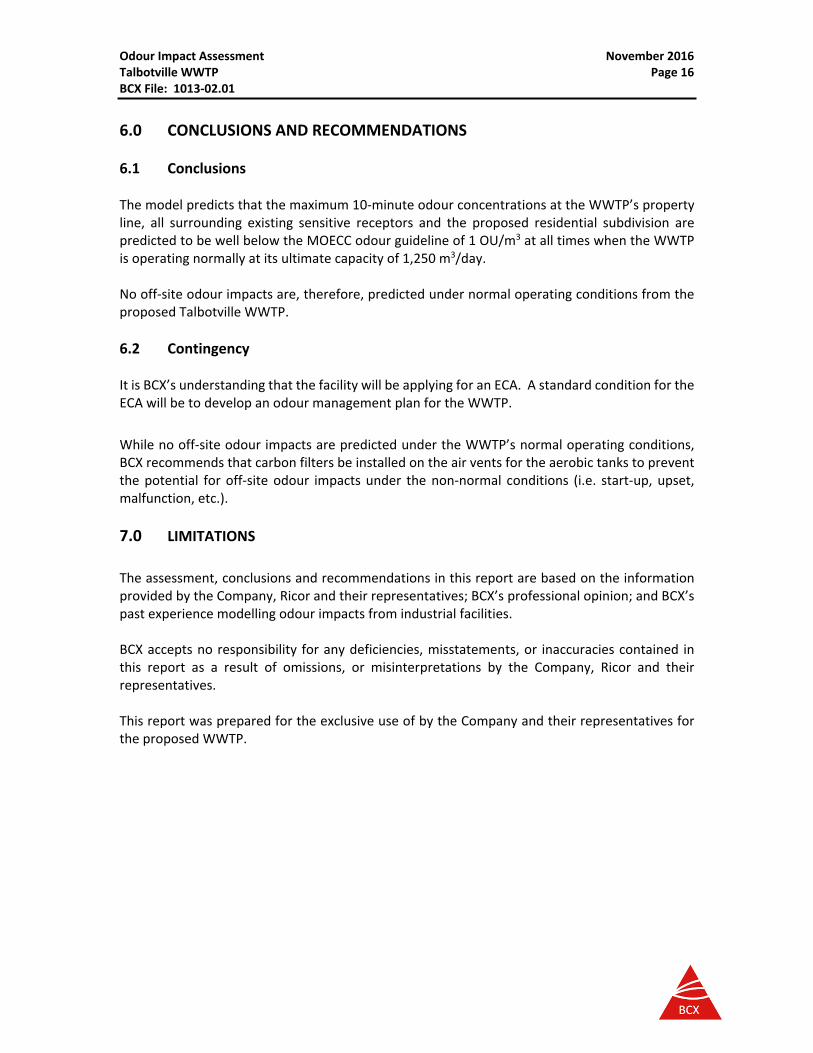
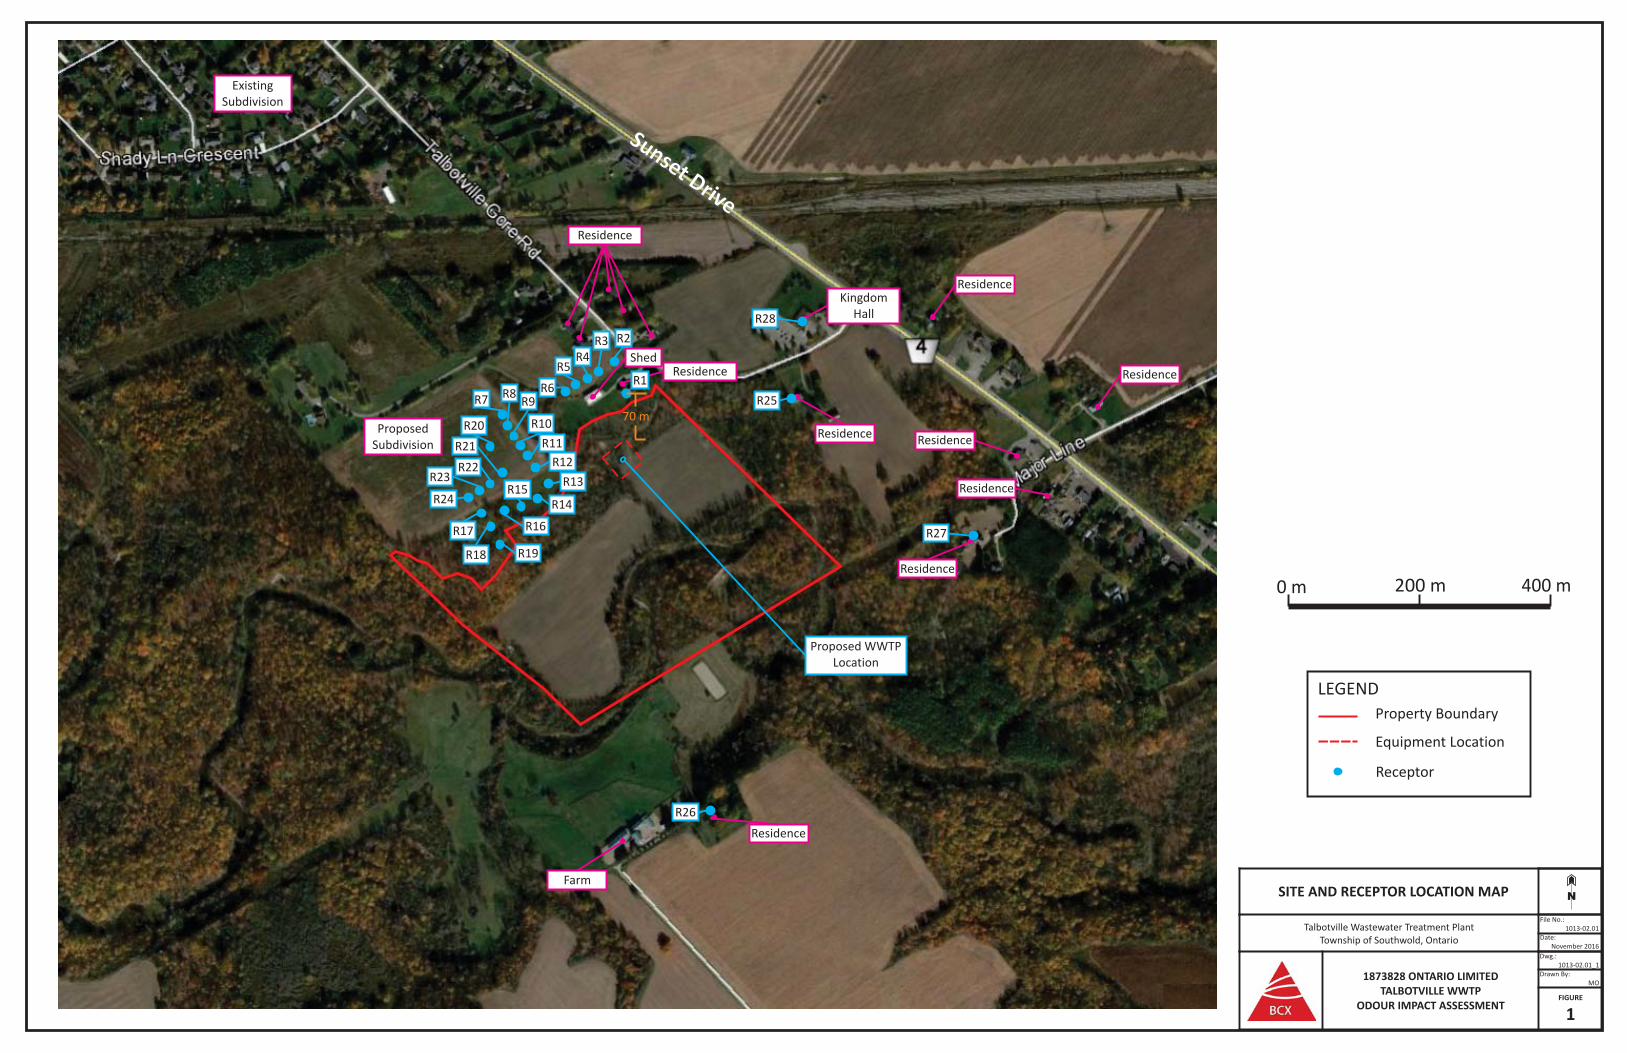
1.0 INTRODUCTION BCX Environmental Consulting (BCX) was retained by Pottinger Gaherty Environmental Consultants (PGL) to prepare an Odour Impact Assessment (Study) for the proposed Talbotville Wastewater Treatment Plant (WWTP). The purpose of this Study is to provide technical input to the Environmental Assessment on odour as requested by Ontario Ministry of the Environment and Climate Change (MOECC) and to facilitate Township of Southwold’s (Southwold’s) review of the draft Site Plan Approval for the WWTP. The odour modelling assessment can be used to support an ECA application to the MOECC. 1.1 Project Background 1873828 Ontario is proposing a WWTP to service the community of Talbotville and the proposed residential subdivision in Southwold (Talbotville) to be located immediately northwest of the WWTP site. A Municipal Class Environmental Assessment (Class EA) was prepared and submitted to the MOECC in February 2016. During the August 30, 2016 meeting, an odour study was requested by the MOECC to quantitatively assess the WWTP’s potential odour impact at the property line, at the nearby existing sensitive receptors and the proposed residential subdivision when the WWTP is operating at its ultimate capacity. 1.2 Site Description The WWTP will be located off Talbotville Gore Road, west of the intersection of Sunset Drive and Talbotville Gore Road, in Talbotville, Ontario. As shown in the site location map (Figure 1 in Appendix A), the WWTP site is surrounded by agricultural lands to the west, south and east, with a few residential homes along Talbotville Gore Road and Sunset Drive. There is an existing residential subdivision to the northwest and a place of worship (i.e. Kingdom Hall) to the east of the site. The proposed residential subdivision will be located immediately northwest of the site. The proposed WWTP will use the Newterra MicroclearTM membrane bioreactor (MBR) technology with an ultimate capacity of 1,250 cubic metres of influent per day (m3/day). The WWTP will be constructed in two phases (i.e. two parallel wastewater treatment trains), with Phase 1 having a processing capacity of 500 m3/day and Phase 2 having a processing capacity of 750 m3/day. A detailed site layout showing the site property boundary and WWTP process building is presented as Figure 2 (Appendix A).
Odour Impact Assessment November 2016 Talbotville WWTP Page 6 BCX File: 1013-02.01
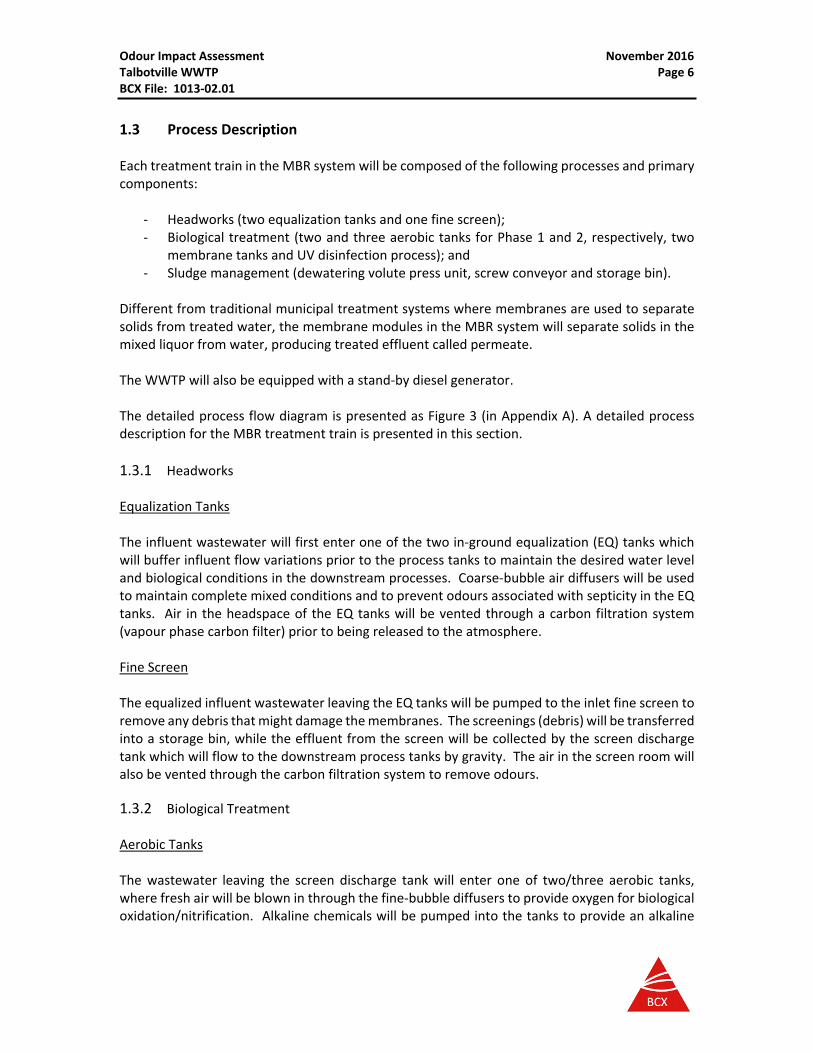
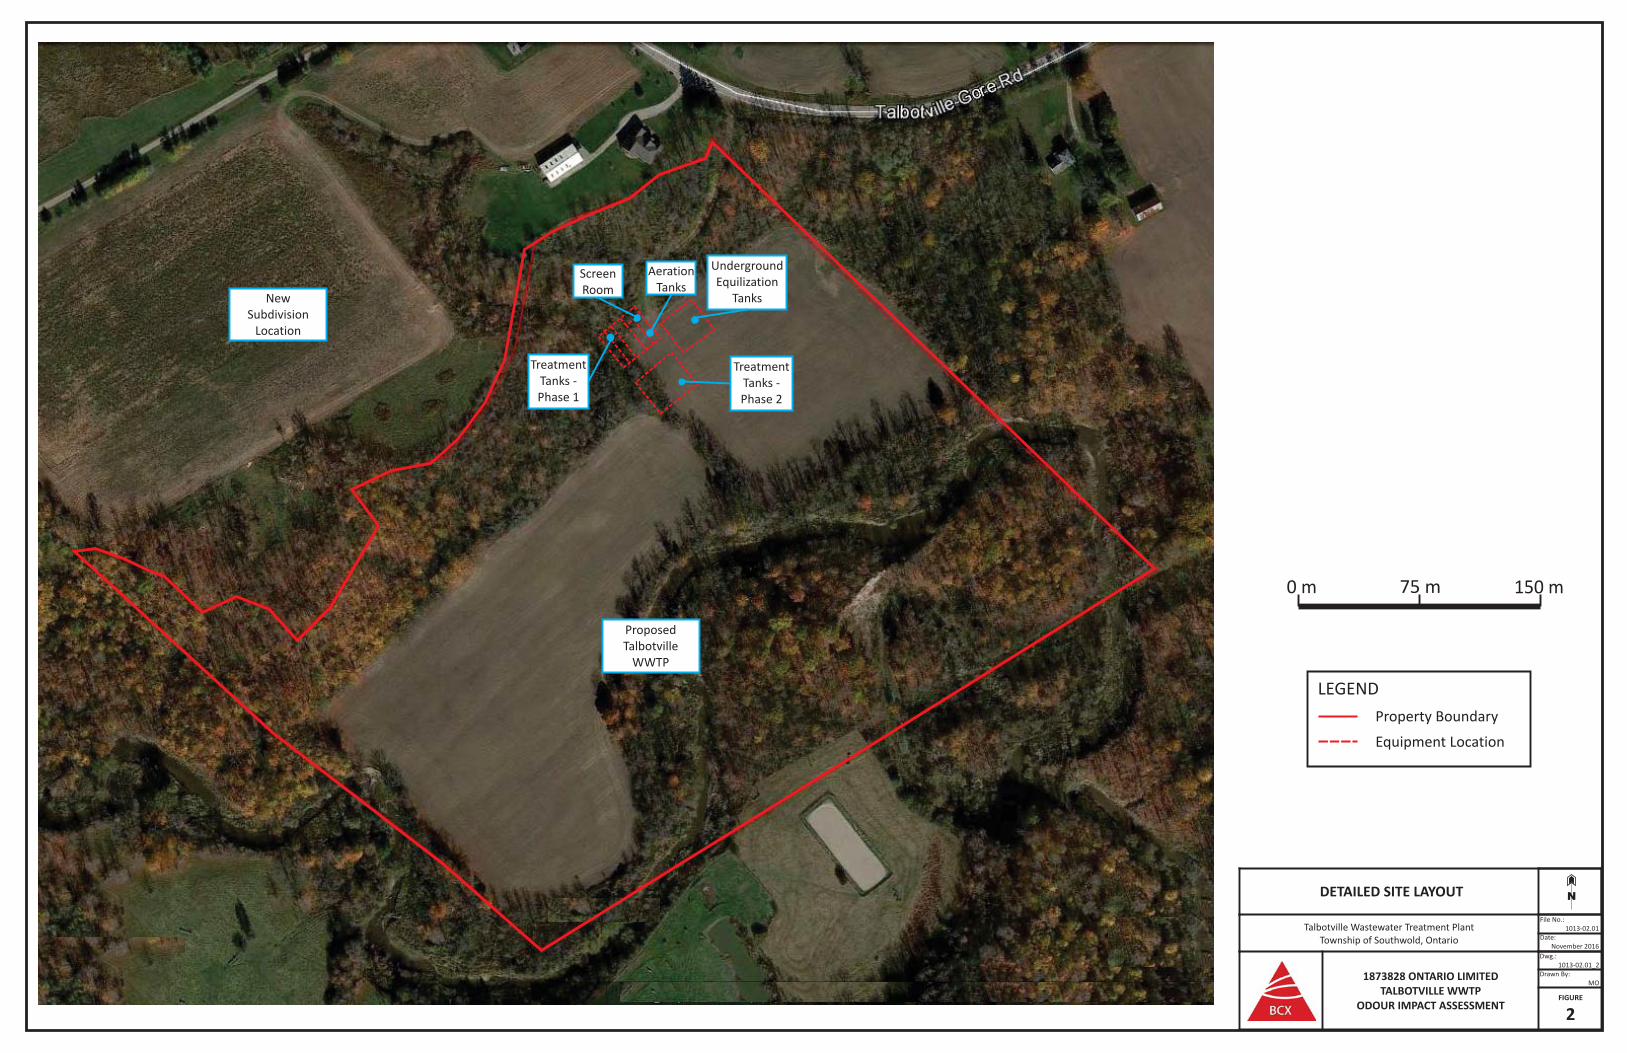
1.3 Process Description Each treatment train in the MBR system will be composed of the following processes and primary components:
- Headworks (two equalization tanks and one fine screen); - Biological treatment (two and three aerobic tanks for Phase 1 and 2, respectively, two
membrane tanks and UV disinfection process); and - Sludge management (dewatering volute press unit, screw conveyor and storage bin).
Different from traditional municipal treatment systems where membranes are used to separate solids from treated water, the membrane modules in the MBR system will separate solids in the mixed liquor from water, producing treated effluent called permeate. The WWTP will also be equipped with a stand-by diesel generator. The detailed process flow diagram is presented as Figure 3 (in Appendix A). A detailed process description for the MBR treatment train is presented in this section. 1.3.1 Headworks Equalization Tanks The influent wastewater will first enter one of the two in-ground equalization (EQ) tanks which will buffer influent flow variations prior to the process tanks to maintain the desired water level and biological conditions in the downstream processes. Coarse-bubble air diffusers will be used to maintain complete mixed conditions and to prevent odours associated with septicity in the EQ tanks. Air in the headspace of the EQ tanks will be vented through a carbon filtration system (vapour phase carbon filter) prior to being released to the atmosphere. Fine Screen The equalized influent wastewater leaving the EQ tanks will be pumped to the inlet fine screen to remove any debris that might damage the membranes. The screenings (debris) will be transferred into a storage bin, while the effluent from the screen will be collected by the screen discharge tank which will flow to the downstream process tanks by gravity. The air in the screen room will also be vented through the carbon filtration system to remove odours. 1.3.2 Biological Treatment Aerobic Tanks The wastewater leaving the screen discharge tank will enter one of two/three aerobic tanks, where fresh air will be blown in through the fine-bubble diffusers to provide oxygen for biological oxidation/nitrification. Alkaline chemicals will be pumped into the tanks to provide an alkaline
Odour Impact Assessment November 2016 Talbotville WWTP Page 7 BCX File: 1013-02.01
environment for the nitrification process, as well as to precipitate phosphorous prior to the membrane tanks. Dissolved oxygen, pH levels and temperature in the aerobic tanks will be controlled to maintain the optimum conditions in the tanks. The aerobic tanks will be equipped with passive vents exhausting to the atmosphere. Membrane Tanks/UV Disinfection The effluent wastewater from the aerobic tanks will undergo solid-liquid separation through the ultrafiltration membranes in the membrane tanks. The treated water (i.e. permeate) will be filtered through the membranes on a permeate relaxation cycle. Scour air will be introduced to the bottom of the membrane unit through medium-bubble diffusers (i.e. counter-flow) to remove cake build up on the membranes. Solids, including organics, bacteria and most viruses will be retained in the membrane tanks. The overflow from the membrane tanks will be collected in the return activated sludge (RAS) overflow tank and pumped back into the aerobic tanks. The RAS overflow tank will be passively vented to atmosphere. The treated water leaving the membrane tanks will enter the UV disinfection system prior to being discharged into the environment. The open membrane tanks will vent into membrane tank room which will be equipped with active fans to remove moisture build up inside the building. The membrane Clean-in-Place (CIP) system will supply dilute cleaning chemicals to remove any accumulation of organics in the membrane surface. The membrane tanks will also be equipped with a backwash system which recycle the cleaning solution back through the permeate lines. 1.3.3 Sludge Management The waste mixed liquor will be pumped from the aerobic tanks to the dewatering volute press unit. The volute press unit will contain a flocculation tank, where mixed liquor will be combined with polymer to improve the dewatering process. Once flocculated, the mixed liquor will overflow into the screw press for dewatering. The dewatered cake from the volute press will be conveyed using a screw conveyor to an outdoor storage bin. Filtrate from the dewatering process will be recycled back to the aerobic tanks for treatment.
Odour Impact Assessment November 2016 Talbotville WWTP Page 8 BCX File: 1013-02.01
2.0 IDENTIFICATION OF SIGNIFICANT ODOUR SOURCES The Company, Ricor and their representatives identified that the only potential significant odour sources are the incoming untreated wastewater and the headworks (i.e. EQ tanks and fine screen) all exhausting through the vapour phase carbon filter vents. Detailed odour emission calculations for these sources are presented in Section 3 of this report. A rationale for the negligible odour sources are presented below. Aerobic and Membrane Tanks Unlike the conventional anaerobic treatment processes, bacteria used in the biological treatment process will oxidize odorous compounds (i.e. hydrogen sulphide and other sulphur based compounds) in aerobic environments including the aerobic tanks and membrane tanks to prevent the formation of odours. These processes are, therefore, not considered a significant source of odour. RAS Overflow Tank Although not aerated, the RAS overflow tank will only receive aerated mixed liquor with very short retention times (i.e. a retention time of 3 minutes for normal operation and 7 minutes for peak flow conditions). As such, the concentrations of dissolved oxygen and nitrate will remain high to prevent the formation of odorous compounds. The RAS overflow tank is, therefore, not considered a significant source of odour. Sludge Storage/Dewatering The handling of untreated sludge at conventional wastewater treatment plants is a primary source of odour because the sludge storage and dewatering process at these plants contain untreated sludge. As described in Section 1.3.3 of the report, the sludge storage and dewatering process at the Talbotville WWTP is for activated sludge (aerated) only. Further, the higher solids retention times used in the MBR processes result in the activated sludge being partially digested. These processes are, therefore, not considered a significant source of odour. 3.0 ODOUR EMISSION ESTIMATION AND MAXIMUM EMISSIONS SCENARIO An odour emission inventory was developed using odour source testing data for a larger scale conventional WWTP (i.e. Odour Study and Air Quality Study for Duffin Creek Water Pollution Control Plant, September 2006) and the proposed plant design/information provided by the Company, Ricor and their representatives. As identified in Section 2.0, the significant odour emission sources at the WWTP are expected to be the headworks operations as summarized in Table 3-1.
Odour Impact Assessment November 2016 Talbotville WWTP Page 9 BCX File: 1013-02.01
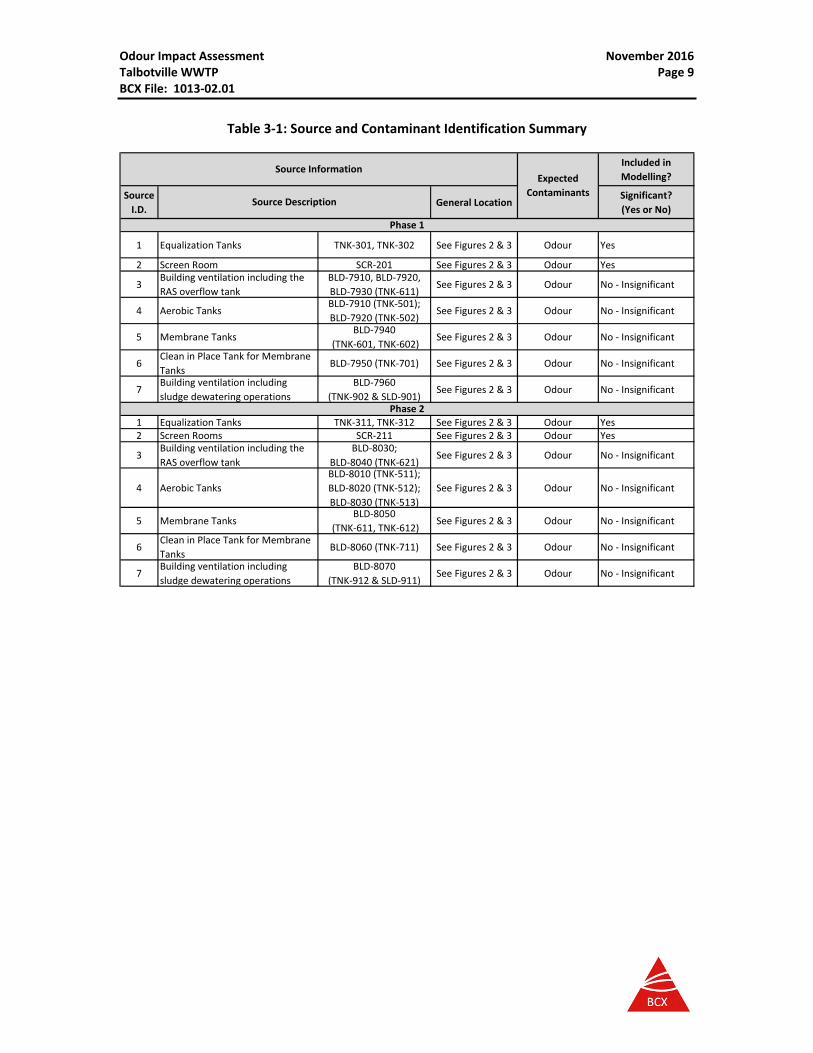
Table 3-1: Source and Contaminant Identification Summary
Included in Modelling?
Source I.D. General Location Significant?
(Yes or No)
1 Equalization Tanks TNK-301, TNK-302 See Figures 2 & 3 Odour Yes
2 Screen Room SCR-201 See Figures 2 & 3 Odour Yes
3 Building ventilation including the RAS overflow tank
BLD-7910, BLD-7920, BLD-7930 (TNK-611) See Figures 2 & 3 Odour No - Insignificant
4 Aerobic Tanks BLD-7910 (TNK-501); BLD-7920 (TNK-502) See Figures 2 & 3 Odour No - Insignificant
5 Membrane Tanks BLD-7940(TNK-601, TNK-602) See Figures 2 & 3 Odour No - Insignificant
6 Clean in Place Tank for Membrane Tanks BLD-7950 (TNK-701) See Figures 2 & 3 Odour No - Insignificant
7 Building ventilation including sludge dewatering operations
BLD-7960 (TNK-902 & SLD-901) See Figures 2 & 3 Odour No - Insignificant
1 Equalization Tanks TNK-311, TNK-312 See Figures 2 & 3 Odour Yes2 Screen Rooms SCR-211 See Figures 2 & 3 Odour Yes
3 Building ventilation including the RAS overflow tank
BLD-8030; BLD-8040 (TNK-621) See Figures 2 & 3 Odour No - Insignificant
4 Aerobic TanksBLD-8010 (TNK-511); BLD-8020 (TNK-512);BLD-8030 (TNK-513)
See Figures 2 & 3 Odour No - Insignificant
5 Membrane Tanks BLD-8050(TNK-611, TNK-612) See Figures 2 & 3 Odour No - Insignificant
6 Clean in Place Tank for Membrane Tanks BLD-8060 (TNK-711) See Figures 2 & 3 Odour No - Insignificant
7 Building ventilation including sludge dewatering operations
BLD-8070(TNK-912 & SLD-911) See Figures 2 & 3 Odour No - Insignificant
Phase 2
Source Description
Source InformationExpected
Contaminants
Phase 1
Odour Impact Assessment November 2016 Talbotville WWTP Page 10 BCX File: 1013-02.01
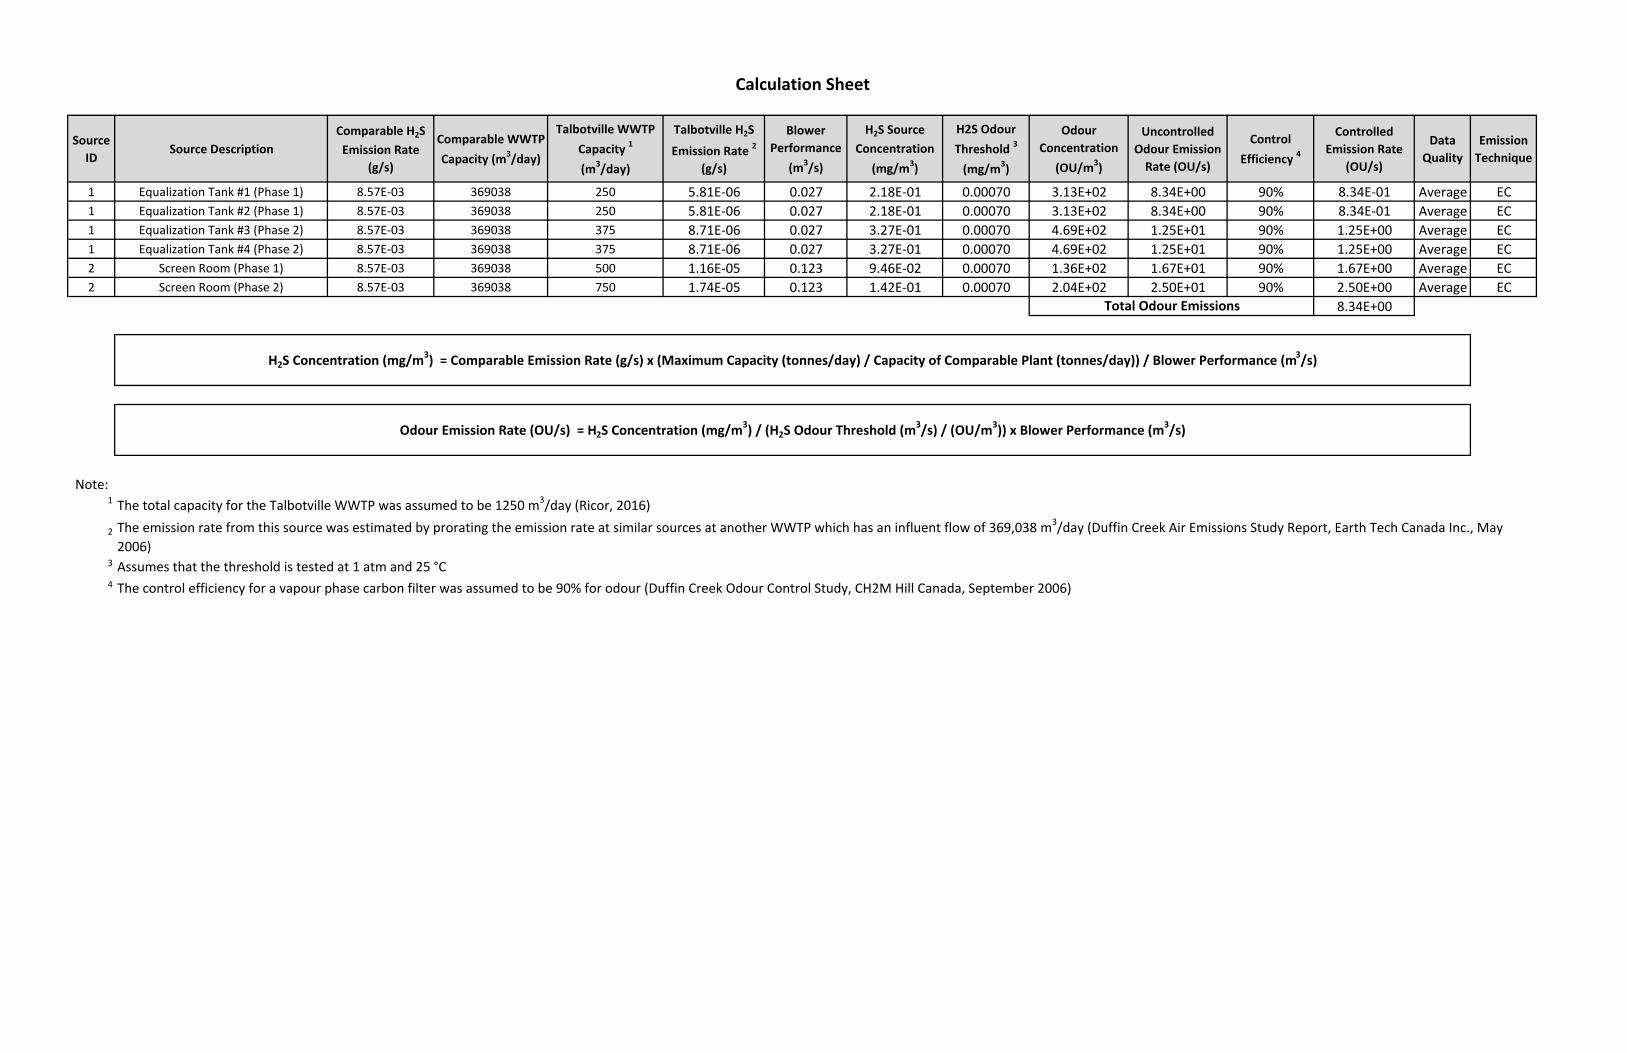
3.1 Emission Estimation Methodologies Site specific odour emission sampling data is not available for the proposed Talbotville WWTP. Emissions for potential odour sources (i.e. headworks) were derived from the source testing data for equivalent processes in the Duffin Creek Water Pollution Control Plant’s Odour Control Study, September 2016 (Duffin Creek Study) provided by the Company, Ricor and their representatives. The Duffin Creek study identified and assessed Hydrogen sulphide (H2S) as the surrogate for odour from the headworks and primary treatment processes. Emissions of H2S from these processes during normal operations in the Duffin Creek Study are, therefore, used to calculate odour emissions for the EQ tanks and fine screens at the Talbotville WWTP. The odour emission calculation was completed using the following steps:
1. The H2S emission rate from the grit and screening building in the Duffin Creek Study was selected as a conservative representation of the primary treatment emissions at Talbotville WWTP and prorated to an ultimate plant capacity of 1,250 m3/day;
2. The blower performance for each source was then used to calculate the H2S source concentrations;
3. The minimum human detection threshold for H2S—where threshold is the concentration that 50% of an odour panel is able to detect the odour—was used to convert the H2S concentration to an odour concentration in a unit of odour units per cubic metre (OU/m3);
4. The blower performance was then used to convert the odour concentration back to an odour emission rate (OU/s); and
5. Control efficiencies for the carbon filtration system were applied to yield a controlled odour emission rate.
The emission calculation sheet detailing the assumptions and methodologies are presented in Appendix B. 3.2 Maximum Emissions Scenario The study assessed one maximum emissions scenario based on the ultimate plant capacity (1,250 m3/day for the entire plant, 500 m3/day for Phase 1 and 750 m3/day for Phase 2). The maximum emissions scenario also assumed all equipment and processes operate simultaneously at their respective maximum capacity, 24 hours per day, all year round. As noted previously, the emission rates obtained from the Duffin Creek Study are those of the screened, untreated influent. Actual odour emissions from the headworks at the proposed Talbotville WWTP are expected to be much lower since the equalization tanks will provide some primary aerobic treatment prior to proceeding to the screening room.
Odour Impact Assessment November 2016 Talbotville WWTP Page 11 BCX File: 1013-02.01
4.0 AIR DISPERSION MODELLING 4.1 Model Selection and Use Air dispersion modelling for this odour study was undertaken using MOECC’s approved AERMOD model (version 14134).
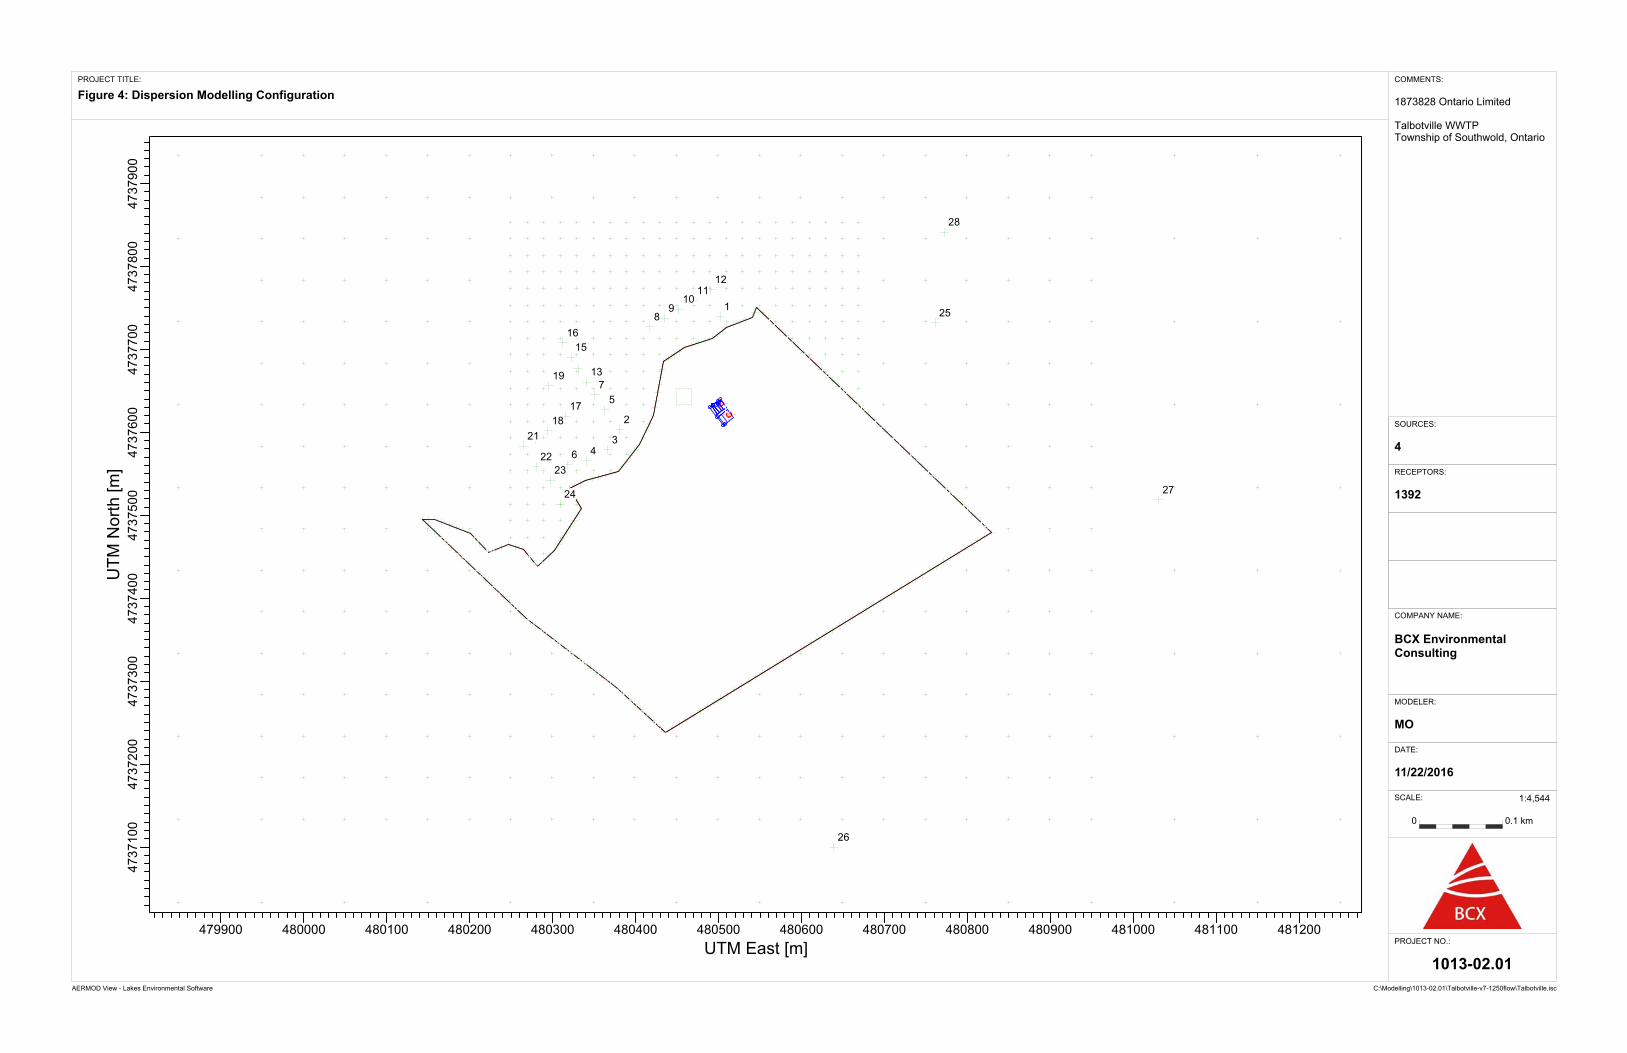
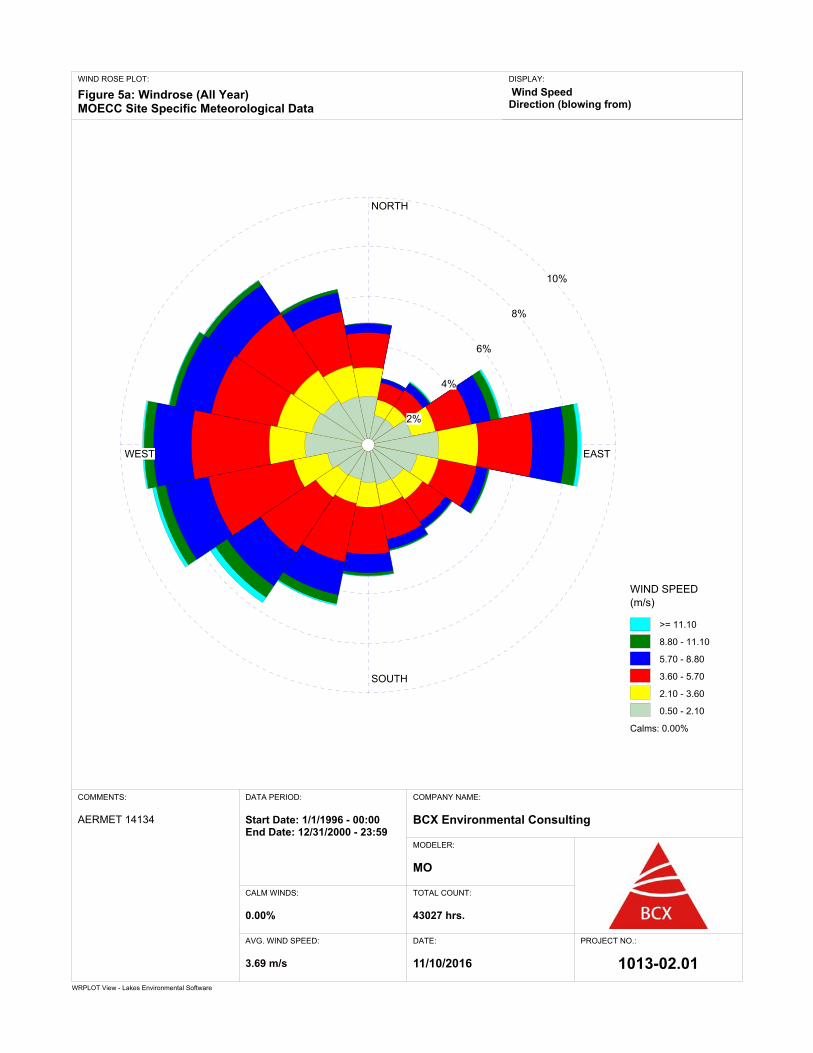
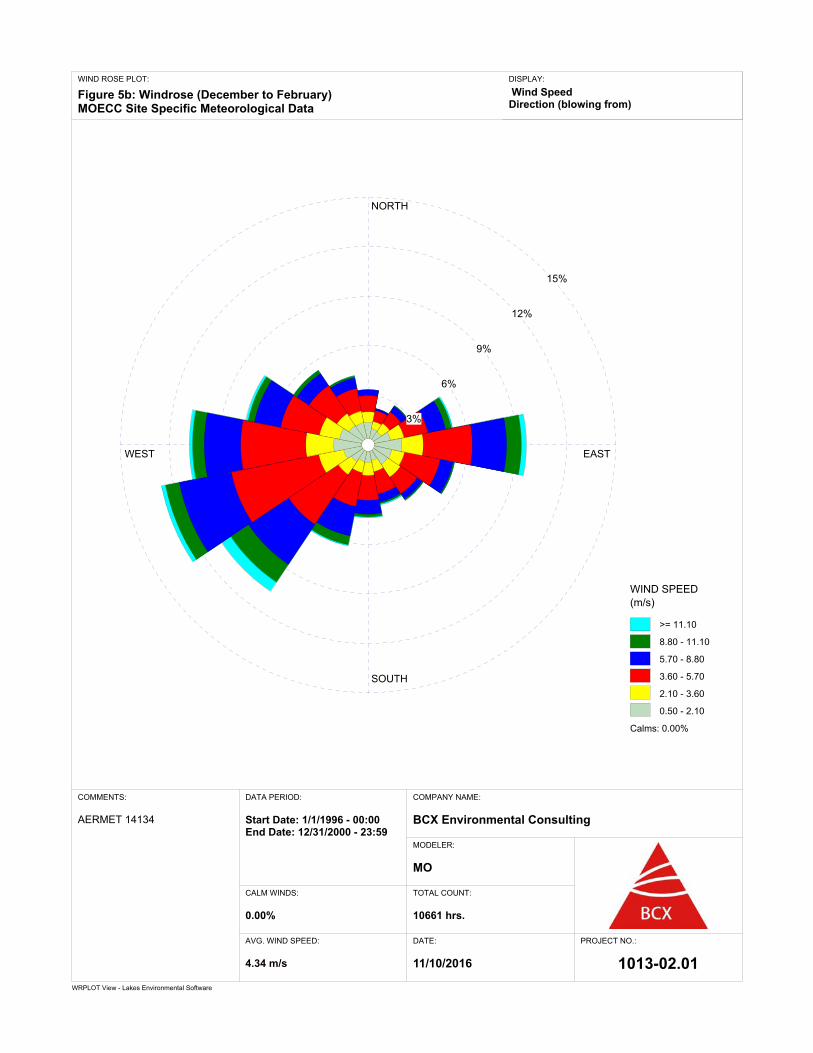
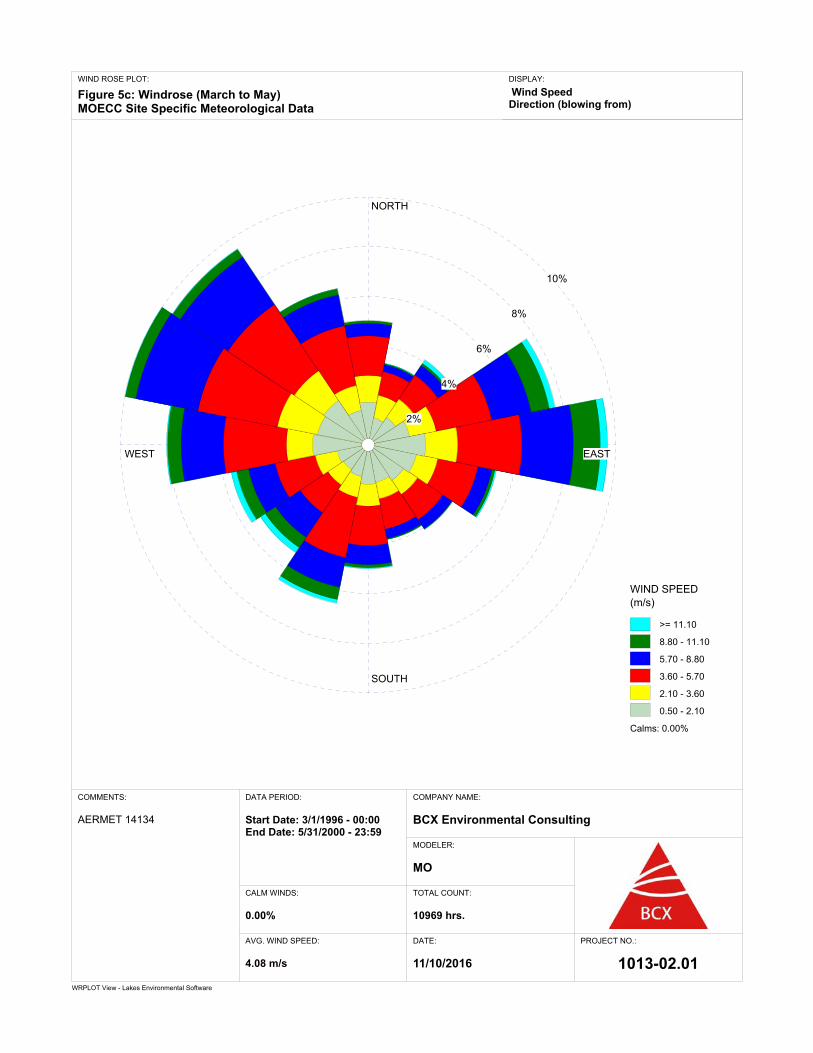
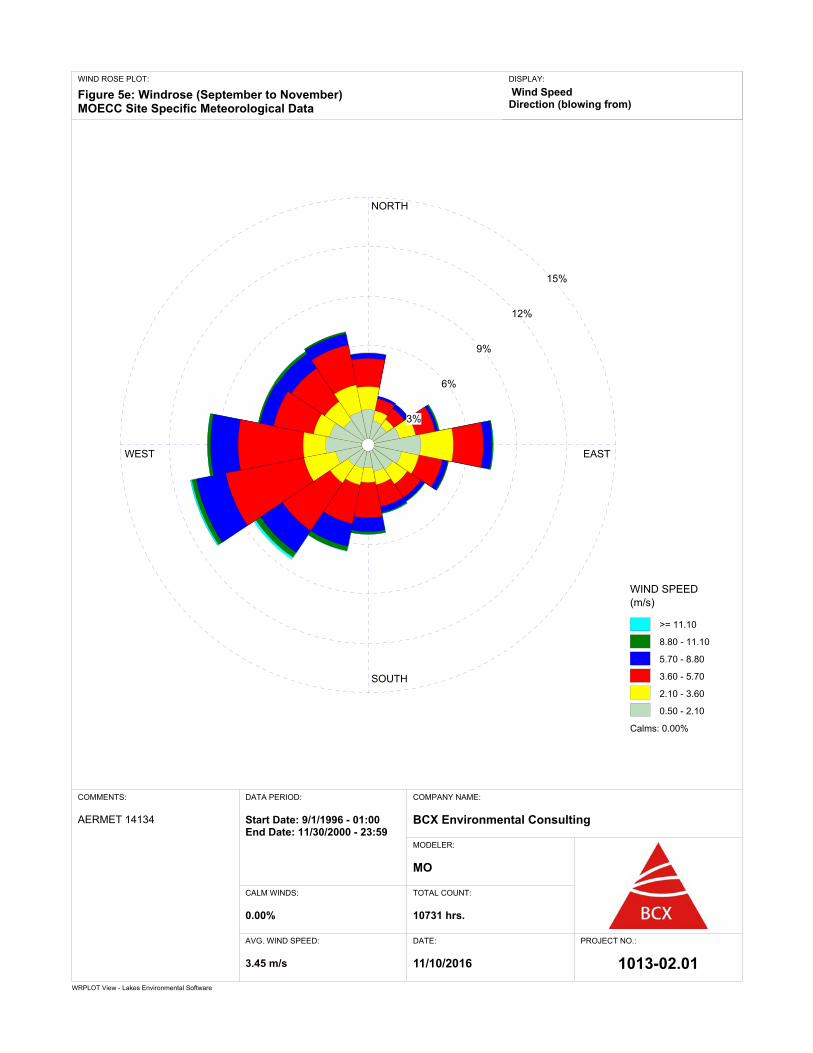
The model calculates maximum hourly concentrations, which were used to provide maximum 10-minute average concentrations using local meteorological data. AERMOD is an MOECC approved steady-state Gaussian plume dispersion modelling system that can be used to assess pollutant concentrations from a wide variety of complex industrial settings including multiple stacks, fugitive emissions, and building wake effects. The AERMOD modelling system was developed by the AMS/EPA Regulatory Model Improvement Committee (AERMIC), and consists of two pre-processors (AERMET and AERMAP) and the dispersion model, AERMOD. AERMET is a general purpose meteorological pre-processor which uses surface and upper air meteorological conditions together with surface characteristics to calculate the boundary layer parameters needed by AERMOD. AERMAP is the terrain pre-processor used to calculate a representative terrain-influenced height associated with each receptor within the modelling domain. 4.2 Meteorology The MOECC regional hourly surface and upper air meteorological data set (AERMET Version 14134) for the western region of Ontario (i.e. London_crops.SFC and London_crops.PFL) were used for the AERMOD dispersion model. A 5-year and seasonal wind roses are provided in Appendix A. The wind roses shows the distribution of wind directions and wind speeds from the surface data. Winds predominantly blow from the northwest and southwest quadrants, as well as the east direction with no significant seasonal variations. As shown in Figure 1, the majority of the nearby residential receptors (within 400m) are not often located downwind of the WWTP. 4.3 Terrain The terrain data used, 0754_1 and 0755_1, Datum NAD83, UTM Zone 17, was downloaded from Ontario Digital Elevation Model Data on the MOECC’s website. 4.4 Modelling Domain and Receptor Grid The modeling domain was defined by a tiered receptor grid centred on the site and extending out approximately 1000 m from the property line in all directions. The grid spacing was determined according to the MOECC Air Dispersion Modelling Guideline for Ontario [MOECC, 2005].
Odour Impact Assessment November 2016 Talbotville WWTP Page 12 BCX File: 1013-02.01
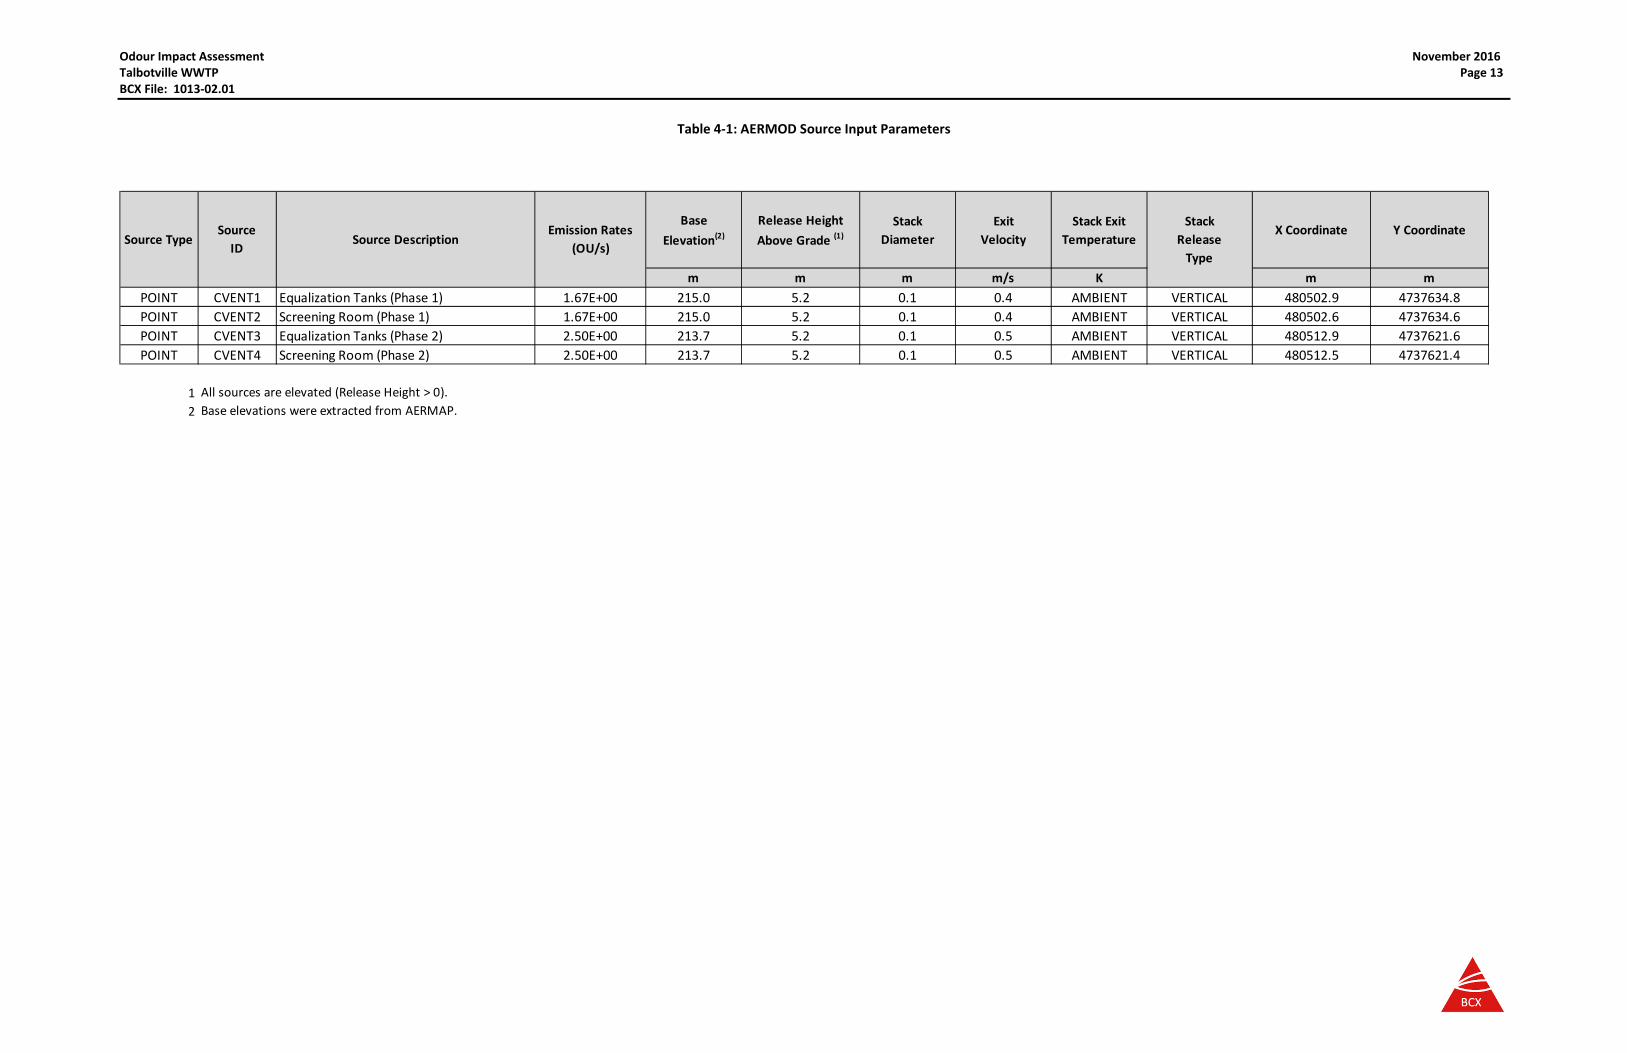
In addition, fenceline receptors and a set of twenty-eight discrete receptors (23 proposed residential homes, 4 existing residential homes and 1 for Kingdom Hall, shown in Figure 1) were included in the modelling exercise to assess the WWTP’s potential off-site impact on nearby existing and proposed sensitive receptors. As identified in Figure 1, the closest sensitive receptor is an existing house (R1) located approximately 70 m northwest of the proposed WWTP building. Figure 4 (Appendix A) shows the modelling domain, receptor grid and the discrete receptors. All modelling was undertaken in Universal Transverse Mercator (UTM) coordinates. 4.5 Source Parameters For this modelling assessment, the carbon filter vents were modelled as point sources. Building downwash was, therefore, considered for these point sources. The physical parameters of the modelling sources are summarized in Table 4-1. A multiplier of 1.65 was included in the model source input which converts the averaging period for the modelling results from 1 hour to 10 minute.
Odour Impact Assessment November 2016 Talbotville WWTP Page 13 BCX File: 1013-02.01
Table 4-1: AERMOD Source Input Parameters
BaseElevation(2)
Release Height Above Grade (1)
StackDiameter
ExitVelocity
Stack ExitTemperature
X Coordinate Y Coordinate
m m m m/s K m mPOINT CVENT1 Equalization Tanks (Phase 1) 1.67E+00 215.0 5.2 0.1 0.4 AMBIENT VERTICAL 480502.9 4737634.8POINT CVENT2 Screening Room (Phase 1) 1.67E+00 215.0 5.2 0.1 0.4 AMBIENT VERTICAL 480502.6 4737634.6POINT CVENT3 Equalization Tanks (Phase 2) 2.50E+00 213.7 5.2 0.1 0.5 AMBIENT VERTICAL 480512.9 4737621.6POINT CVENT4 Screening Room (Phase 2) 2.50E+00 213.7 5.2 0.1 0.5 AMBIENT VERTICAL 480512.5 4737621.4
12
All sources are elevated (Release Height > 0).Base elevations were extracted from AERMAP.
Source TypeSource
ID Source DescriptionEmission Rates
(OU/s)
Stack Release
Type

Odour Impact Assessment November 2016 Talbotville WWTP Page 14 BCX File: 1013-02.01
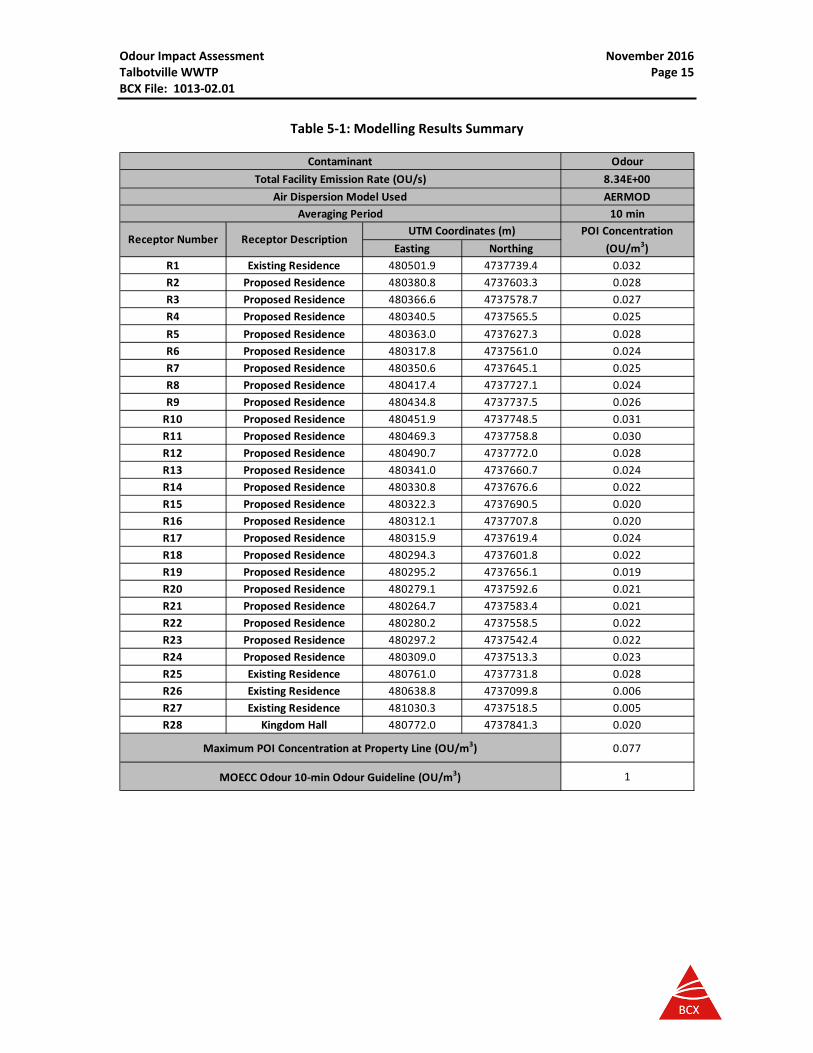
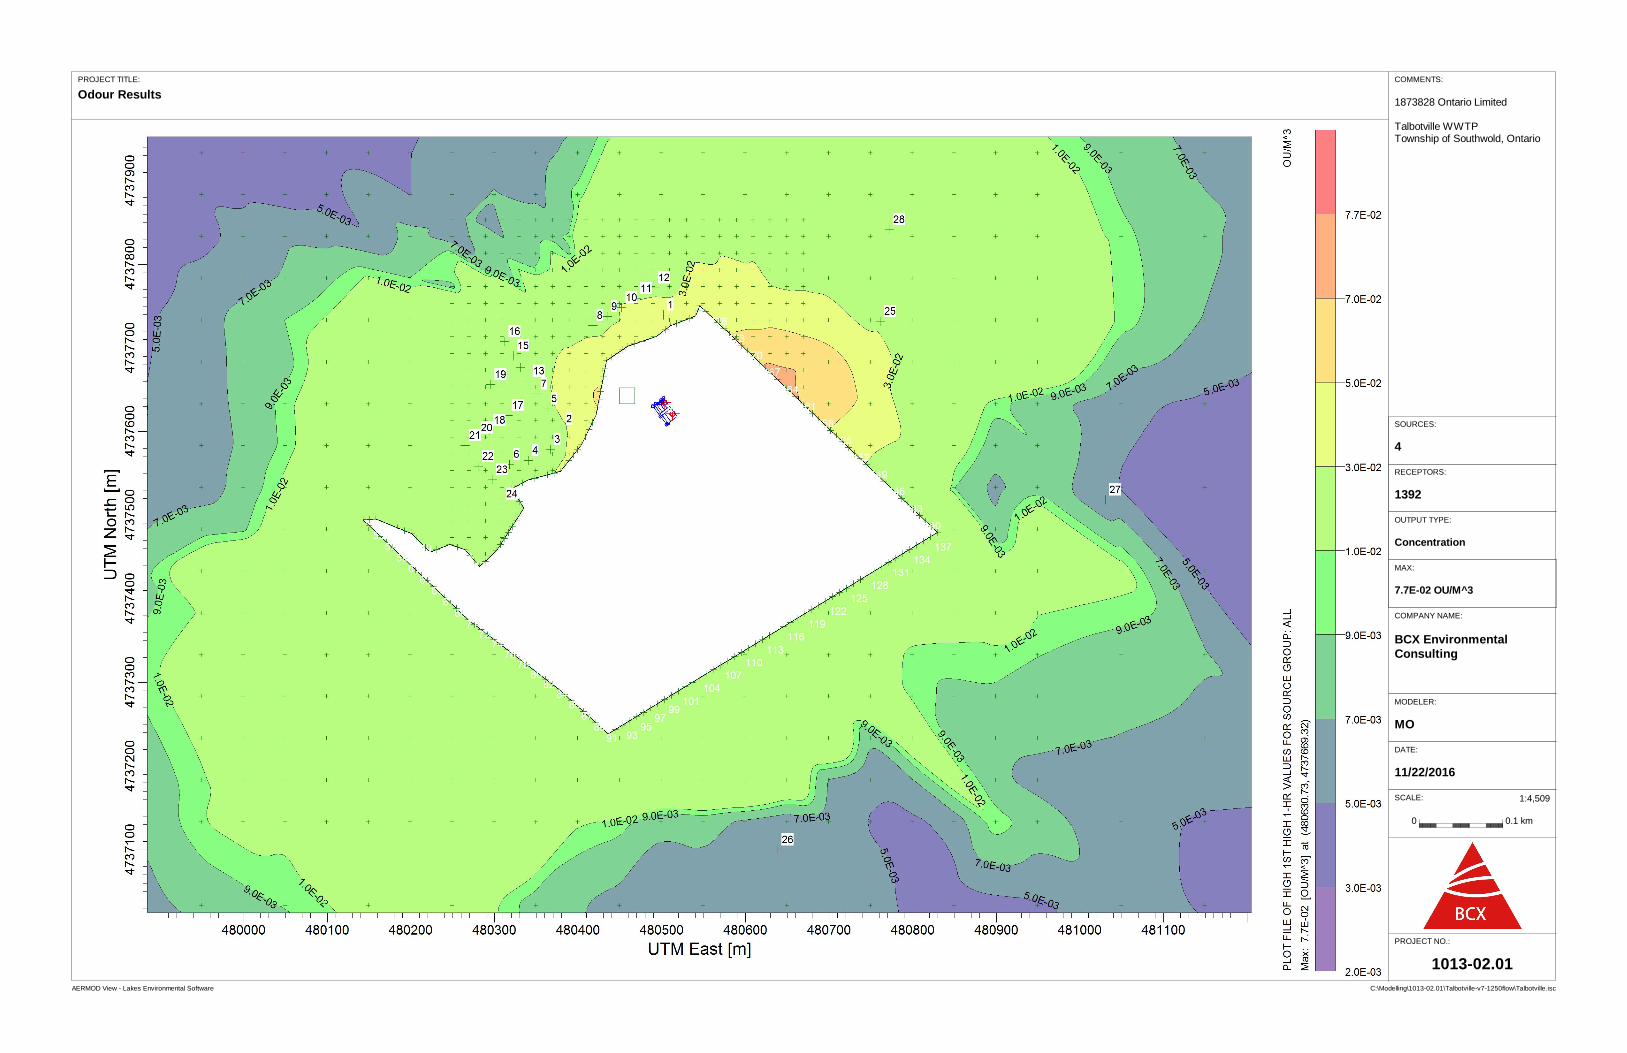
5.0 RESULTS The maximum 10-minute average concentrations at the discrete receptors are presented in tabular format for the closest off-site sensitive receptors (Table 5-1). The receptor locations are presented in Figure 1. In addition, a maximum 10-minute average concentration isopleths (lines of equal concentration) figure is also presented in Appendix C. As presented in Table 5-1 and Appendix C, the maximum off-site 10-minute average odour
concentrations are predicted to be well below the MOECC odour guideline of 1 OU/m3 at the WWTP’s property line, the surrounding existing sensitive receptors and the proposed nearby residential subdivision.
Odour Impact Assessment November 2016 Talbotville WWTP Page 15 BCX File: 1013-02.01
Table 5-1: Modelling Results Summary
Odour8.34E+00AERMOD
10 min
Easting NorthingR1 Existing Residence 480501.9 4737739.4 0.032R2 Proposed Residence 480380.8 4737603.3 0.028R3 Proposed Residence 480366.6 4737578.7 0.027R4 Proposed Residence 480340.5 4737565.5 0.025R5 Proposed Residence 480363.0 4737627.3 0.028R6 Proposed Residence 480317.8 4737561.0 0.024R7 Proposed Residence 480350.6 4737645.1 0.025R8 Proposed Residence 480417.4 4737727.1 0.024R9 Proposed Residence 480434.8 4737737.5 0.026
R10 Proposed Residence 480451.9 4737748.5 0.031R11 Proposed Residence 480469.3 4737758.8 0.030R12 Proposed Residence 480490.7 4737772.0 0.028R13 Proposed Residence 480341.0 4737660.7 0.024R14 Proposed Residence 480330.8 4737676.6 0.022R15 Proposed Residence 480322.3 4737690.5 0.020R16 Proposed Residence 480312.1 4737707.8 0.020R17 Proposed Residence 480315.9 4737619.4 0.024R18 Proposed Residence 480294.3 4737601.8 0.022R19 Proposed Residence 480295.2 4737656.1 0.019R20 Proposed Residence 480279.1 4737592.6 0.021R21 Proposed Residence 480264.7 4737583.4 0.021R22 Proposed Residence 480280.2 4737558.5 0.022R23 Proposed Residence 480297.2 4737542.4 0.022R24 Proposed Residence 480309.0 4737513.3 0.023R25 Existing Residence 480761.0 4737731.8 0.028R26 Existing Residence 480638.8 4737099.8 0.006R27 Existing Residence 481030.3 4737518.5 0.005R28 Kingdom Hall 480772.0 4737841.3 0.020
0.077
1
POI Concentration (OU/m3)
MOECC Odour 10-min Odour Guideline (OU/m3)
Maximum POI Concentration at Property Line (OU/m3)
ContaminantTotal Facility Emission Rate (OU/s)
Averaging PeriodAir Dispersion Model Used
UTM Coordinates (m)Receptor Number Receptor Description
Odour Impact Assessment November 2016 Talbotville WWTP Page 16 BCX File: 1013-02.01
6.0 CONCLUSIONS AND RECOMMENDATIONS 6.1 Conclusions The model predicts that the maximum 10-minute odour concentrations at the WWTP’s property line, all surrounding existing sensitive receptors and the proposed residential subdivision are predicted to be well below the MOECC odour guideline of 1 OU/m3 at all times when the WWTP is operating normally at its ultimate capacity of 1,250 m3/day. No off-site odour impacts are, therefore, predicted under normal operating conditions from the proposed Talbotville WWTP. 6.2 Contingency It is BCX’s understanding that the facility will be applying for an ECA. A standard condition for the ECA will be to develop an odour management plan for the WWTP.
While no off-site odour impacts are predicted under the WWTP’s normal operating conditions, BCX recommends that carbon filters be installed on the air vents for the aerobic tanks to prevent the potential for off-site odour impacts under the non-normal conditions (i.e. start-up, upset, malfunction, etc.). 7.0 LIMITATIONS The assessment, conclusions and recommendations in this report are based on the information provided by the Company, Ricor and their representatives; BCX’s professional opinion; and BCX’s past experience modelling odour impacts from industrial facilities. BCX accepts no responsibility for any deficiencies, misstatements, or inaccuracies contained in this report as a result of omissions, or misinterpretations by the Company, Ricor and their representatives. This report was prepared for the exclusive use of by the Company and their representatives for the proposed WWTP.

Odour Impact Assessment November 2016 Talbotville WWTP Page 17 BCX File: 1013-02.01
8.0 REFERENCES Ministry of the Environment and Climate Change (MOECC), Air Dispersion Modelling Guideline for
Ontario, Version 1.0, March 2009. Ministry of the Environment and Climate Change (MOECC), Procedure for Preparing and Emission
Summary and Dispersion Modelling Report, Version 2.0, March 2009. Ministry of the Environment and Climate Change (MOECC), Technical Bulletin: Methodology for
Modelling Assessments of Contaminants with 10-minute Average Standards and Guidelines under O. Reg. 419/05 (April 2008).
CH2M Hill Canada Limited (CH2M) and Earth Tech Canada Inc. (EarthTech), Duffin Creek Water
Pollution Control Plant, Schedule C Class EA, Odour Control Study, September 2006. Earth Tech Canada Inc. (EarthTech), Air Emissions Study Report, Duffin Creek Water Pollution
Control Plant, September 19, 2006.

Appendix A
Figures
NSITE AND RECEPTOR LOCATION MAP
1873828 ONTARIO LIMITED
TALBOTVILLE WWTP
ODOUR IMPACT ASSESSMENT
File No.:
Date:
November 2016
1013-02.01
FIGURE
1
Dwg.:
1013-02.01_1
Drawn By:
MO
Talbotville Wastewater Treatment Plant
Township of Southwold, Ontario
0 m 400 m200 m
LEGEND
Equipment Location
Receptor
ShedResidence
Kingdom
Hall
Residence
Residence
Residence
Residence
Residence
Existing
Subdivision
Proposed
Subdivision
Property Boundary
Residence
Residence
Residence
Farm
Sunset Drive
R1
R2R3
R4R5
R6R7
R8R9
R10
R11
R12
R13
R14
R18
Proposed WWTP
Location
R17 R16
R15
R19
R24
R23R22
R21
R20
R25
R26
R27
R28
70 m
NDETAILED SITE LAYOUT
1873828 ONTARIO LIMITED
TALBOTVILLE WWTP
ODOUR IMPACT ASSESSMENT
File No.:
Date:
November 2016
1013-02.01
FIGURE
2
Dwg.:
1013-02.01_2
Drawn By:
MO
Talbotville Wastewater Treatment Plant
Township of Southwold, Ontario
0 m 150 m75 m
LEGEND
Equipment Location
Property Boundary
Underground
Equilization
TanksNew
Subdivision
Location
Aeration
Tanks
Proposed
Talbotville
WWTP
Treatment
Tanks -
Phase 1
Treatment
Tanks -
Phase 2
Screen
Room
PROCESS FLOW DIAGRAM
1873828 ONTARIO LIMITED
TALBOTVILLE WWTP
ODOUR IMPACT ASSESSMENT
File No.:
1013-02.01
Date:
November 2016
Dwg.:
1013-02.01_3
Drawn By:
MO
Talbotville Wastewater Treatment Plant
Township of Southwold, Ontario
FIGURE
3
Inlet flow from
collection
system
Equalization
Tank
(TNK-301)
Odour
Equalization
Tank
(TNK-302)
Equalization
Tank
(TNK-311)
Equalization
Tank
(TNK-312)
Aerobic Tank
(TNK-501)
Aerobic Tank
(TNK-502)
Membrane
Tank
(TNK-611)
Membrane
Tank
(TNK-612)
Sludge
Dewatering
In-ground Tanks
Fine Screen
(SCR-201)
RAS Overflow
Tank
Clean In Place
Tank
(TNK-701)
BLD-8050
Membrane
Tank
(TNK-601)
Membrane
Tank
(TNK-602)
BLD-7940
UV
Disinfection
In-ground Tanks
BLD-7920
BLD-7930
BLD-7950
BLD-7960
BLD-7960
Aerobic Tank
(TNK-511)
Fine Screen
(SCR-211)
BLD-8010
Aerobic Tank
(TNK-512)
BLD-8020
Aerobic Tank
(TNK-513)
BLD-8030
Sludge
Dewatering
BLD-8070
UV
Disinfection
BLD-8070
RAS Overflow
Tank
BLD-8040
Clean In Place
Tank
(TNK-701)
BLD-8060
Waste Activated Sludge to Solids Bin
BLD-7910Permeate Disposal
Permeate Disposal
Waste Activated Sludge to Solids Bin
Phase 2
Phase 1 Vapour Phase
Carbon Filter
Odour
Vapour Phase
Carbon Filter
Odour
Vapour Phase
Carbon FilterOdour
Vapour Phase
Carbon Filter
LEGEND
Building is Passively Vented
Building is Actively Vented
BLD-8010
BLD-7910
C:\Modelling\1013-02.01\Talbotville-v7-1250flow\Talbotville.iscAERMOD View - Lakes Environmental Software
SCALE:
0 0.1 km
1:4,544
176173
170167
164161
158155
152149
146143
140
137134
131128
125122
119116
113110
107104
10199
9795
939189
8785
8482
8078
7674
7271
6865
6259
56 52 5048 46 44
43 4139
36
3331
292725
2221
19181614
12987 6
4321
28
27
26
25
24
2322
21
19
1817
1615
13
1211
109
8
7
6
5
43
2
1
CVENT4BLD_10, Tier 1
BLD-7910, Tier 1
479900 480000 480100 480200 480300 480400 480500 480600 480700 480800 480900 481000 481100 481200UTM East [m]
4737
100
4737
200
4737
300
4737
400
4737
500
4737
600
4737
700
4737
800
4737
900
UTM
Nor
th [m
]
PROJECT NO.:
1013-02.01
DATE:
11/22/2016
MODELER:
MO
COMPANY NAME:
BCX Environmental Consulting
COMMENTS:
1873828 Ontario Limited
Talbotville WWTPTownship of Southwold, Ontario
PROJECT TITLE:
Figure 4: Dispersion Modelling Configuration
SOURCES:
4
RECEPTORS:
1392
WRPLOT View - Lakes Environmental Software
WIND ROSE PLOT:
Figure 5a: Windrose (All Year)MOECC Site Specific Meteorological Data
COMMENTS:
AERMET 14134
COMPANY NAME:
BCX Environmental Consulting
MODELER:
MO
DATE:
11/10/2016
PROJECT NO.:
1013-02.01
NORTH
SOUTH
WEST EAST
2%
4%
6%
8%
10%
WIND SPEED (m/s)
>= 11.10
8.80 - 11.10
5.70 - 8.80
3.60 - 5.70
2.10 - 3.60
0.50 - 2.10
Calms: 0.00%
TOTAL COUNT:
43027 hrs.
CALM WINDS:
0.00%
DATA PERIOD:
Start Date: 1/1/1996 - 00:00End Date: 12/31/2000 - 23:59
AVG. WIND SPEED:
3.69 m/s
DISPLAY:
Wind SpeedDirection (blowing from)
WRPLOT View - Lakes Environmental Software
WIND ROSE PLOT:
Figure 5b: Windrose (December to February)MOECC Site Specific Meteorological Data
COMMENTS:
AERMET 14134
COMPANY NAME:
BCX Environmental Consulting
MODELER:
MO
DATE:
11/10/2016
PROJECT NO.:
1013-02.01
NORTH
SOUTH
WEST EAST
3%
6%
9%
12%
15%
WIND SPEED (m/s)
>= 11.10
8.80 - 11.10
5.70 - 8.80
3.60 - 5.70
2.10 - 3.60
0.50 - 2.10
Calms: 0.00%
TOTAL COUNT:
10661 hrs.
CALM WINDS:
0.00%
DATA PERIOD:
Start Date: 1/1/1996 - 00:00End Date: 12/31/2000 - 23:59
AVG. WIND SPEED:
4.34 m/s
DISPLAY:
Wind SpeedDirection (blowing from)
WRPLOT View - Lakes Environmental Software
WIND ROSE PLOT:
Figure 5c: Windrose (March to May)MOECC Site Specific Meteorological Data
COMMENTS:
AERMET 14134
COMPANY NAME:
BCX Environmental Consulting
MODELER:
MO
DATE:
11/10/2016
PROJECT NO.:
1013-02.01
NORTH
SOUTH
WEST EAST
2%
4%
6%
8%
10%
WIND SPEED (m/s)
>= 11.10
8.80 - 11.10
5.70 - 8.80
3.60 - 5.70
2.10 - 3.60
0.50 - 2.10
Calms: 0.00%
TOTAL COUNT:
10969 hrs.
CALM WINDS:
0.00%
DATA PERIOD:
Start Date: 3/1/1996 - 00:00End Date: 5/31/2000 - 23:59
AVG. WIND SPEED:
4.08 m/s
DISPLAY:
Wind SpeedDirection (blowing from)

WRPLOT View - Lakes Environmental Software
WIND ROSE PLOT:
Figure 5d: Windrose (June to August)MOECC Site Specific Meteorological Data
COMMENTS:
AERMET 14134
COMPANY NAME:
BCX Environmental Consulting
MODELER:
MO
DATE:
11/10/2016
PROJECT NO.:
1013-02.01
NORTH
SOUTH
WEST EAST
3%
6%
9%
12%
15%
WIND SPEED (m/s)
>= 11.10
8.80 - 11.10
5.70 - 8.80
3.60 - 5.70
2.10 - 3.60
0.50 - 2.10
Calms: 0.00%
TOTAL COUNT:
10666 hrs.
CALM WINDS:
0.00%
DATA PERIOD:
Start Date: 6/1/1996 - 00:00End Date: 8/31/2000 - 23:59
AVG. WIND SPEED:
2.91 m/s
DISPLAY:
Wind SpeedDirection (blowing from)
WRPLOT View - Lakes Environmental Software
WIND ROSE PLOT:
Figure 5e: Windrose (September to November)MOECC Site Specific Meteorological Data
COMMENTS:
AERMET 14134
COMPANY NAME:
BCX Environmental Consulting
MODELER:
MO
DATE:
11/10/2016
PROJECT NO.:
1013-02.01
NORTH
SOUTH
WEST EAST
3%
6%
9%
12%
15%
WIND SPEED (m/s)
>= 11.10
8.80 - 11.10
5.70 - 8.80
3.60 - 5.70
2.10 - 3.60
0.50 - 2.10
Calms: 0.00%
TOTAL COUNT:
10731 hrs.
CALM WINDS:
0.00%
DATA PERIOD:
Start Date: 9/1/1996 - 01:00End Date: 11/30/2000 - 23:59
AVG. WIND SPEED:
3.45 m/s
DISPLAY:
Wind SpeedDirection (blowing from)

Appendix B
Emission Calculation Sheet
SourceID Source Description
Comparable H2S Emission Rate
(g/s)
Comparable WWTP Capacity (m3/day)
Talbotville WWTP Capacity 1
(m3/day)
Talbotville H2S Emission Rate 2
(g/s)
Blower Performance
(m3/s)
H2S Source Concentration
(mg/m3)
H2S Odour Threshold 3
(mg/m3)
Odour Concentration
(OU/m3)
Uncontrolled Odour Emission
Rate (OU/s)
Control Efficiency 4
Controlled Emission Rate
(OU/s)
Data Quality
Emission Technique
1 Equalization Tank #1 (Phase 1) 8.57E-03 369038 250 5.81E-06 0.027 2.18E-01 0.00070 3.13E+02 8.34E+00 90% 8.34E-01 Average EC1 Equalization Tank #2 (Phase 1) 8.57E-03 369038 250 5.81E-06 0.027 2.18E-01 0.00070 3.13E+02 8.34E+00 90% 8.34E-01 Average EC1 Equalization Tank #3 (Phase 2) 8.57E-03 369038 375 8.71E-06 0.027 3.27E-01 0.00070 4.69E+02 1.25E+01 90% 1.25E+00 Average EC1 Equalization Tank #4 (Phase 2) 8.57E-03 369038 375 8.71E-06 0.027 3.27E-01 0.00070 4.69E+02 1.25E+01 90% 1.25E+00 Average EC2 Screen Room (Phase 1) 8.57E-03 369038 500 1.16E-05 0.123 9.46E-02 0.00070 1.36E+02 1.67E+01 90% 1.67E+00 Average EC2 Screen Room (Phase 2) 8.57E-03 369038 750 1.74E-05 0.123 1.42E-01 0.00070 2.04E+02 2.50E+01 90% 2.50E+00 Average EC
8.34E+00
Note:1
2
3
4Assumes that the threshold is tested at 1 atm and 25 °CThe control efficiency for a vapour phase carbon filter was assumed to be 90% for odour (Duffin Creek Odour Control Study, CH2M Hill Canada, September 2006)
Calculation Sheet
Total Odour Emissions
H2S Concentration (mg/m3) = Comparable Emission Rate (g/s) x (Maximum Capacity (tonnes/day) / Capacity of Comparable Plant (tonnes/day)) / Blower Performance (m3/s)
Odour Emission Rate (OU/s) = H2S Concentration (mg/m3) / (H2S Odour Threshold (m3/s) / (OU/m3)) x Blower Performance (m3/s)
The emission rate from this source was estimated by prorating the emission rate at similar sources at another WWTP which has an influent flow of 369,038 m3/day (Duffin Creek Air Emissions Study Report, Earth Tech Canada Inc., May 2006)
The total capacity for the Talbotville WWTP was assumed to be 1250 m3/day (Ricor, 2016)
Appendix C
AERMOD Dispersion Modelling Results
C:\Modelling\1013-02.01\Talbotville-v7-1250flow\Talbotville.iscAERMOD View - Lakes Environmental Software
SCALE:
0 0.1 km
1:4,509
PROJECT NO.:
1013-02.01
DATE:
11/22/2016
MODELER:
MO
COMPANY NAME:
BCX Environmental Consulting
COMMENTS:
1873828 Ontario Limited
Talbotville WWTPTownship of Southwold, Ontario
PROJECT TITLE:
Odour Results
SOURCES:
4
RECEPTORS:
1392
OUTPUT TYPE:
Concentration
MAX:
7.7E-02 OU/M^3