Embed Size (px)
Citation preview
ABSTRACT
SAS� Output Delivery System (ODS) provides several features that greatly enhance the statistical graphicspresentation. The ODS features discussed in this paper are: 1) creation of SAS data sets from ODS outputtables and passing the statistical information to the graph, 2) using ODS to read and write graphics files, 3) usingODS to hyperlink other files, and 4) using the ODS GRAPHICS ON statement to produce statistical graphs.Some sample code and illustrations are provided in this paper.
The SAS products used in this paper are SAS BASE�, SAS/STAT�, and SAS/GRAPH� on a UNIX platformand a PC WINDOWS� environment.
INTRODUCTION
An effective statistical graph presents accurate, unambiguous, and informative data. Helpful illustrations offerclearly defined statistical results and elegantly represented information. Displaying the output from SAS/STATprocedures onto a statistical graph is just one of the desirable features.
Clinical Data Interchange Standards Consortium (CDISC) "is an open, multidisciplinary, non-profit organizationcommitted to the development of industry standards to support the electronic acquisition, exchange, submissionand archiving of clinical trials data and metadata for medical and biopharmaceutical product development. Themission of CDISC is to lead the development of global, vendor-neutral, platform independent standards toimprove data quality and accelerate product development in our industry." [1]
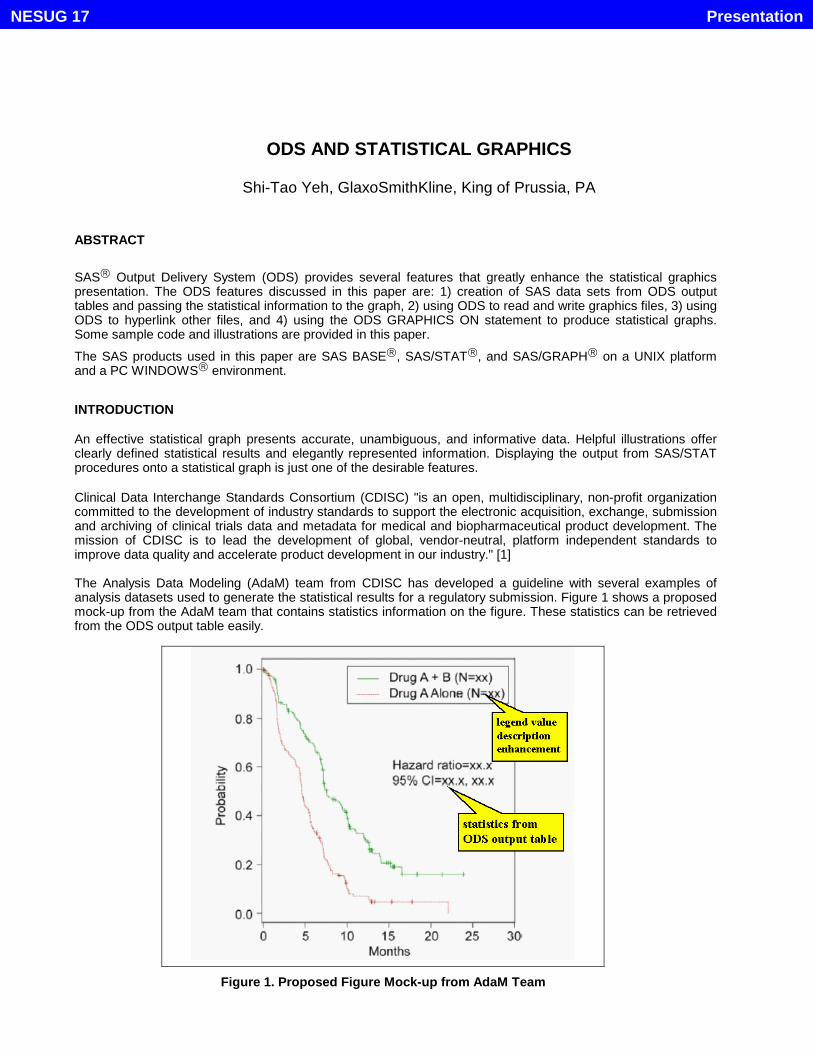
The Analysis Data Modeling (AdaM) team from CDISC has developed a guideline with several examples ofanalysis datasets used to generate the statistical results for a regulatory submission. Figure 1 shows a proposedmock-up from the AdaM team that contains statistics information on the figure. These statistics can be retrievedfrom the ODS output table easily.
Figure 1. Proposed Figure Mock-up from AdaM Team
ODS AND STATISTICAL GRAPHICS
Shi-Tao Yeh, GlaxoSmithKline, King of Prussia, PA
PresentationNESUG 17
2
Prior to Version 7, SAS output provided no means for you to parse its contents. Retrieving the output from astatistical procedure would have been a challenging task. Beginning with Version 7, all SAS/STAT proceduresuse the Output Delivery System (ODS) to manage their output. This includes managing the form the outputappears, as well as its organization and format. The default for SAS/STAT procedures is to produce the usualSAS listing file. However, by using the features of the ODS, you can make changes to the format andappearance of your SAS output. In particular, you can:
• display your output in different destinations, such as hypertext markup language (HTML) , Rich-Text-Format(RTF) or PDF format
• create SAS data sets directly from output tables• hyperlink to files or locations• select or exclude individual output tables• customize the layout, format, and headers of your output• produce ODS statistical graphics as part of ODS output in SAS 9.1.
You can use the feature of 'select or exclude individual output tables' to retrieve the outputs table data and createthe SAS data sets.
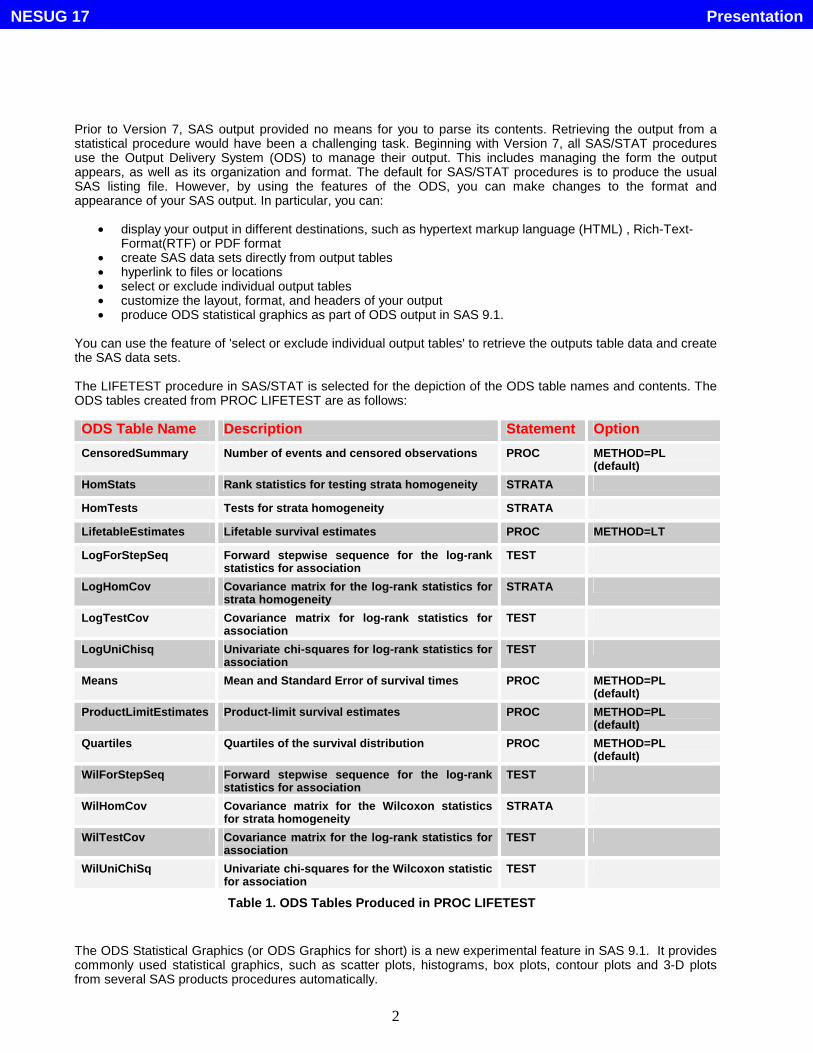
The LIFETEST procedure in SAS/STAT is selected for the depiction of the ODS table names and contents. TheODS tables created from PROC LIFETEST are as follows:
ODS Table Name Description Statement Option
CensoredSummary Number of events and censored observations PROC METHOD=PL(default)
HomStats Rank statistics for testing strata homogeneity STRATA
HomTests Tests for strata homogeneity STRATA
LifetableEstimates Lifetable survival estimates PROC METHOD=LT
LogForStepSeq Forward stepwise sequence for the log-rankstatistics for association
TEST
LogHomCov Covariance matrix for the log-rank statistics forstrata homogeneity
STRATA
LogTestCov Covariance matrix for log-rank statistics forassociation
TEST
LogUniChisq Univariate chi-squares for log-rank statistics forassociation
TEST
Means Mean and Standard Error of survival times PROC METHOD=PL(default)
ProductLimitEstimates Product-limit survival estimates PROC METHOD=PL(default)
Quartiles Quartiles of the survival distribution PROC METHOD=PL(default)
WilForStepSeq Forward stepwise sequence for the log-rankstatistics for association
TEST
WilHomCov Covariance matrix for the Wilcoxon statisticsfor strata homogeneity
STRATA
WilTestCov Covariance matrix for the log-rank statistics forassociation
TEST
WilUniChiSq Univariate chi-squares for the Wilcoxon statisticfor association
TEST
Table 1. ODS Tables Produced in PROC LIFETEST
The ODS Statistical Graphics (or ODS Graphics for short) is a new experimental feature in SAS 9.1. It providescommonly used statistical graphics, such as scatter plots, histograms, box plots, contour plots and 3-D plotsfrom several SAS products procedures automatically.
PresentationNESUG 17
3
ODS Graphics can not produce just graphs without other ODS output tables and listings. In other words, ODSGraphics are part of ODS output and use at least one ODS destination to obtain graphics. ODS Graphics usesJava technology and is independent of SAS/GRAPH. ODS Graphics do not support the following statements: 1)any SAS/GRAPH statements, such as GOPTIONS, SYMBOL, PATTERN; 2) the GTITLE or GFOOTNOTEoptions available with the ODS destinations HTML, RTF, and MACKUP, and 3) the ODS USEGOPT statement.
DATA FILE
The data, which is used throughout this paper, is from a hypothetical clinical trial survival analysis. This data filecontains eighty-seven subjects and four variables: Subject ID, Efsurvw, Survival, and Trtgrpt. It also contains twotreatments: Dose A and Dose B with 67 and 20 subjects respectively.
ODS OUTPUT TABLE DATA
The ODS allows you to convert the output of a procedure into a SAS data set. The following sample codecreates the Output Tables as SAS data sets.
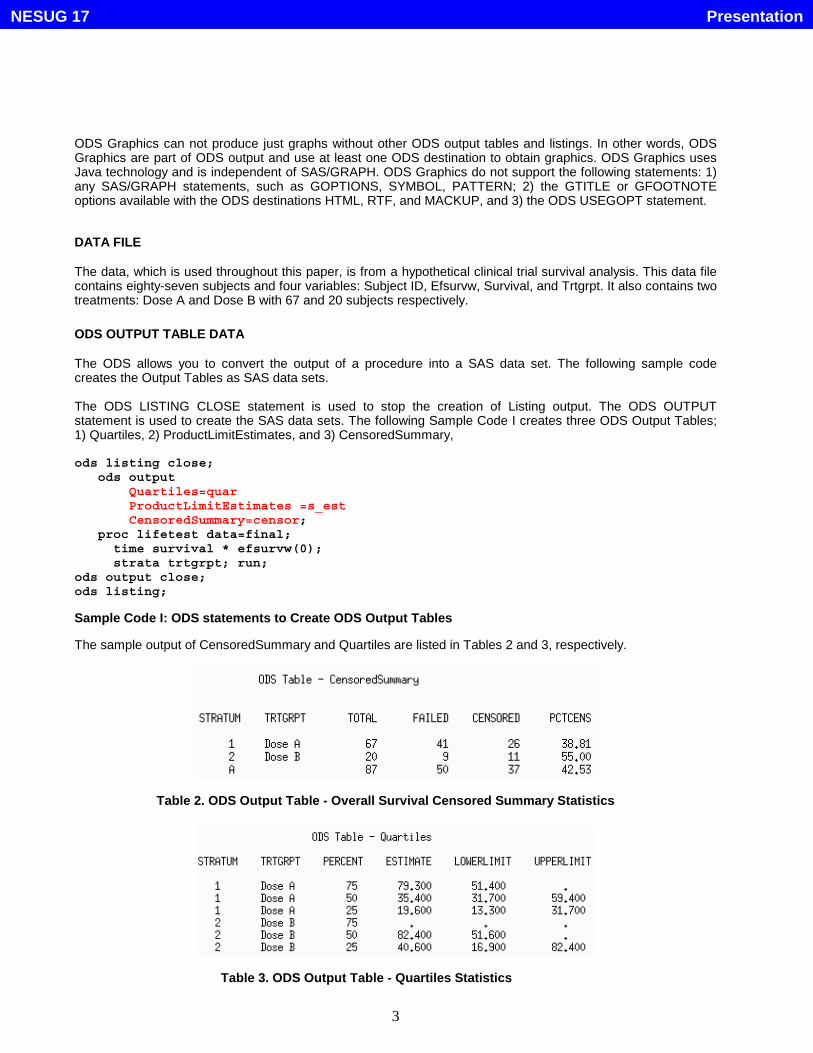
The ODS LISTING CLOSE statement is used to stop the creation of Listing output. The ODS OUTPUTstatement is used to create the SAS data sets. The following Sample Code I creates three ODS Output Tables;1) Quartiles, 2) ProductLimitEstimates, and 3) CensoredSummary,
ods listing close;ods output
Quartiles=quarProductLimitEstimates =s_estCensoredSummary=censor;
proc lifetest data=final;time survival * efsurvw(0);strata trtgrpt; run;
ods output close;ods listing;
Sample Code I: ODS statements to Create ODS Output Tables
The sample output of CensoredSummary and Quartiles are listed in Tables 2 and 3, respectively.
Table 2. ODS Output Table - Overall Survival Censored Summary Statistics
Table 3. ODS Output Table - Quartiles Statistics
PresentationNESUG 17
4
There are four methods to display ODS Output data; 1) using SAS macro variables to store the ODS Output dataand passing it to the graphics, 2) using SAS/GRAPH PROC GPRINT to create the ODS Output Tables as agraphic file, then call PROC GREPLAY to display it as multiple graphics on one page, 3) using SAS/GRAPHPROC GPRINT to create the ODS Output Tables as a graphic file in jpeg format, then call ODS to display it asmultiple graphics on one page, 4) using PROC PRINT to print ODS Output Tables on a graphic page, and 5)using PROC REPORT to print ODS Output Tables on a graphic page. The following sample layouts illustratedifferent method performed.
SAMPLE LAYOUT 1: USING ODS AND MACRO VARIABLES FOR PASSING ODS OUTPUT TABLE TOFOOTNOTE STATEMENTS
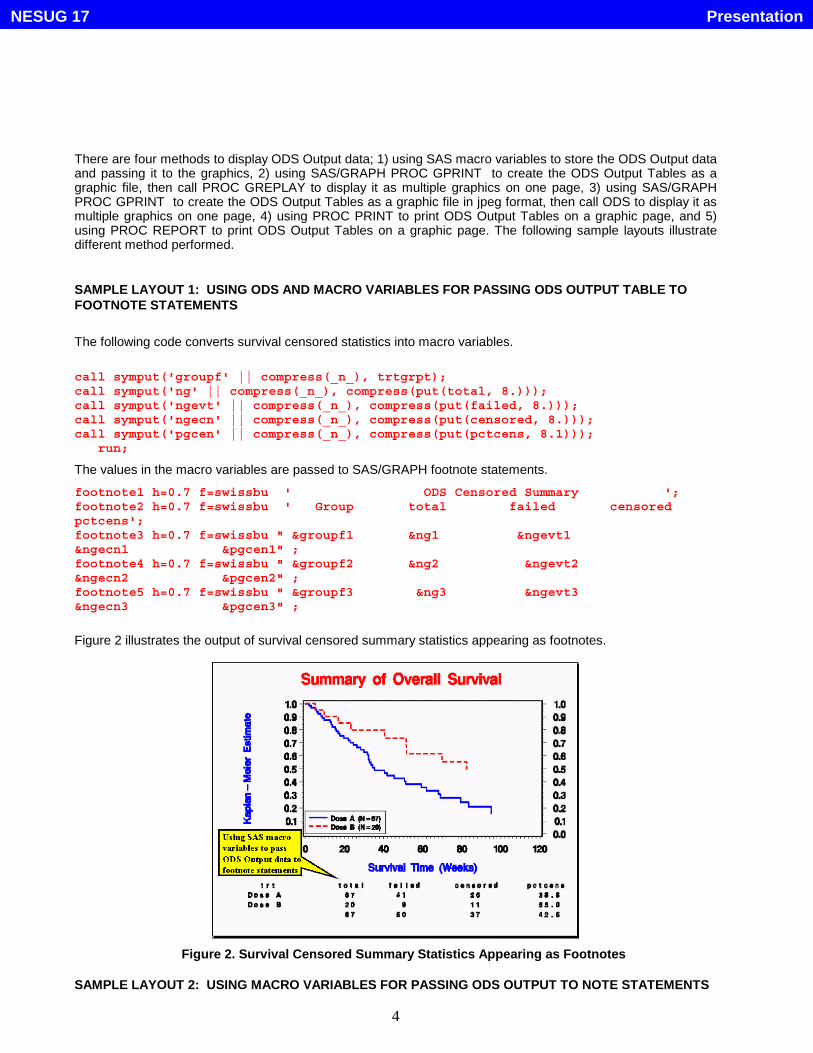
The following code converts survival censored statistics into macro variables.
call symput('groupf' || compress(_n_), trtgrpt);call symput('ng' || compress(_n_), compress(put(total, 8.)));call symput('ngevt' || compress(_n_), compress(put(failed, 8.)));call symput('ngecn' || compress(_n_), compress(put(censored, 8.)));call symput('pgcen' || compress(_n_), compress(put(pctcens, 8.1)));
run;
The values in the macro variables are passed to SAS/GRAPH footnote statements.
footnote1 h=0.7 f=swissbu ' ODS Censored Summary ';footnote2 h=0.7 f=swissbu ' Group total failed censoredpctcens';footnote3 h=0.7 f=swissbu " &groupf1 &ng1 &ngevt1&ngecn1 &pgcen1" ;footnote4 h=0.7 f=swissbu " &groupf2 &ng2 &ngevt2&ngecn2 &pgcen2" ;footnote5 h=0.7 f=swissbu " &groupf3 &ng3 &ngevt3&ngecn3 &pgcen3" ;
Figure 2 illustrates the output of survival censored summary statistics appearing as footnotes.
Figure 2. Survival Censored Summary Statistics Appearing as Footnotes
SAMPLE LAYOUT 2: USING MACRO VARIABLES FOR PASSING ODS OUTPUT TO NOTE STATEMENTS
PresentationNESUG 17
5
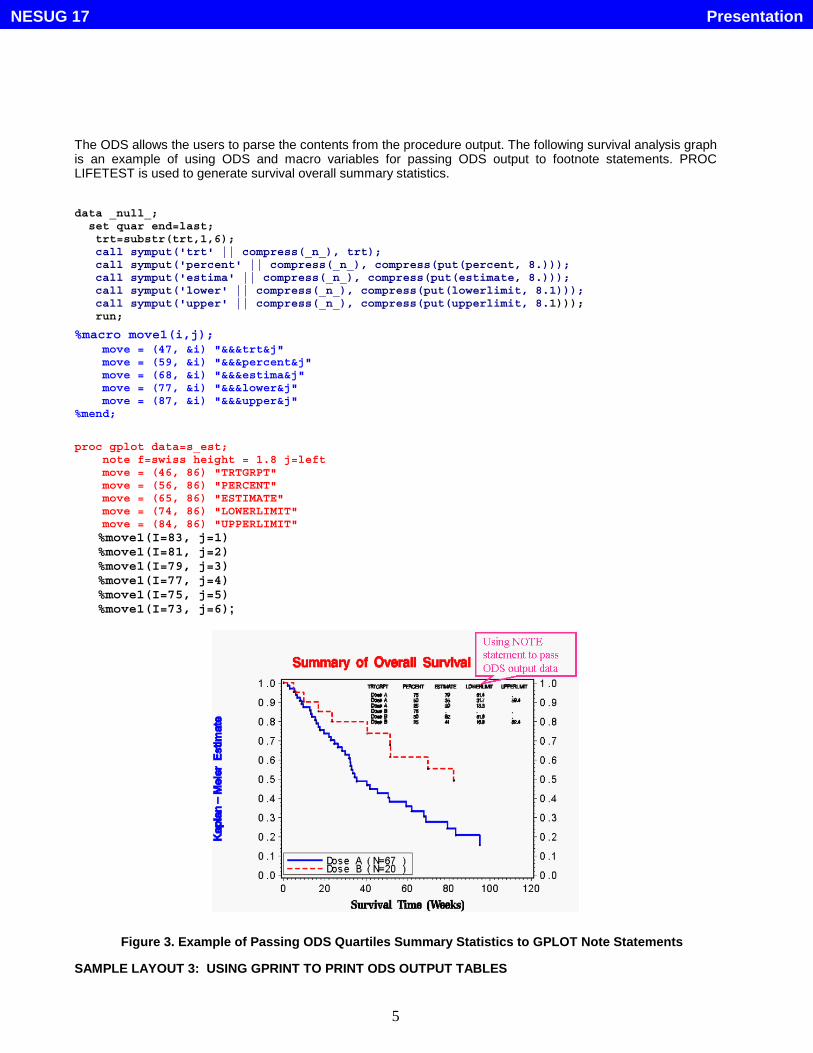
The ODS allows the users to parse the contents from the procedure output. The following survival analysis graphis an example of using ODS and macro variables for passing ODS output to footnote statements. PROCLIFETEST is used to generate survival overall summary statistics.
data _null_;set quar end=last;trt=substr(trt,1,6);call symput('trt' || compress(_n_), trt);call symput('percent' || compress(_n_), compress(put(percent, 8.)));call symput('estima' || compress(_n_), compress(put(estimate, 8.)));call symput('lower' || compress(_n_), compress(put(lowerlimit, 8.1)));call symput('upper' || compress(_n_), compress(put(upperlimit, 8.1)));run;
%macro move1(i,j);move = (47, &i) "&&&trt&j"move = (59, &i) "&&&percent&j"move = (68, &i) "&&&estima&j"move = (77, &i) "&&&lower&j"move = (87, &i) "&&&upper&j"
%mend;
proc gplot data=s_est;note f=swiss height = 1.8 j=leftmove = (46, 86) "TRTGRPT"move = (56, 86) "PERCENT"move = (65, 86) "ESTIMATE"move = (74, 86) "LOWERLIMIT"move = (84, 86) "UPPERLIMIT"%move1(I=83, j=1)%move1(I=81, j=2)%move1(I=79, j=3)%move1(I=77, j=4)%move1(I=75, j=5)%move1(I=73, j=6);
Figure 3. Example of Passing ODS Quartiles Summary Statistics to GPLOT Note Statements
SAMPLE LAYOUT 3: USING GPRINT TO PRINT ODS OUTPUT TABLES
PresentationNESUG 17
6
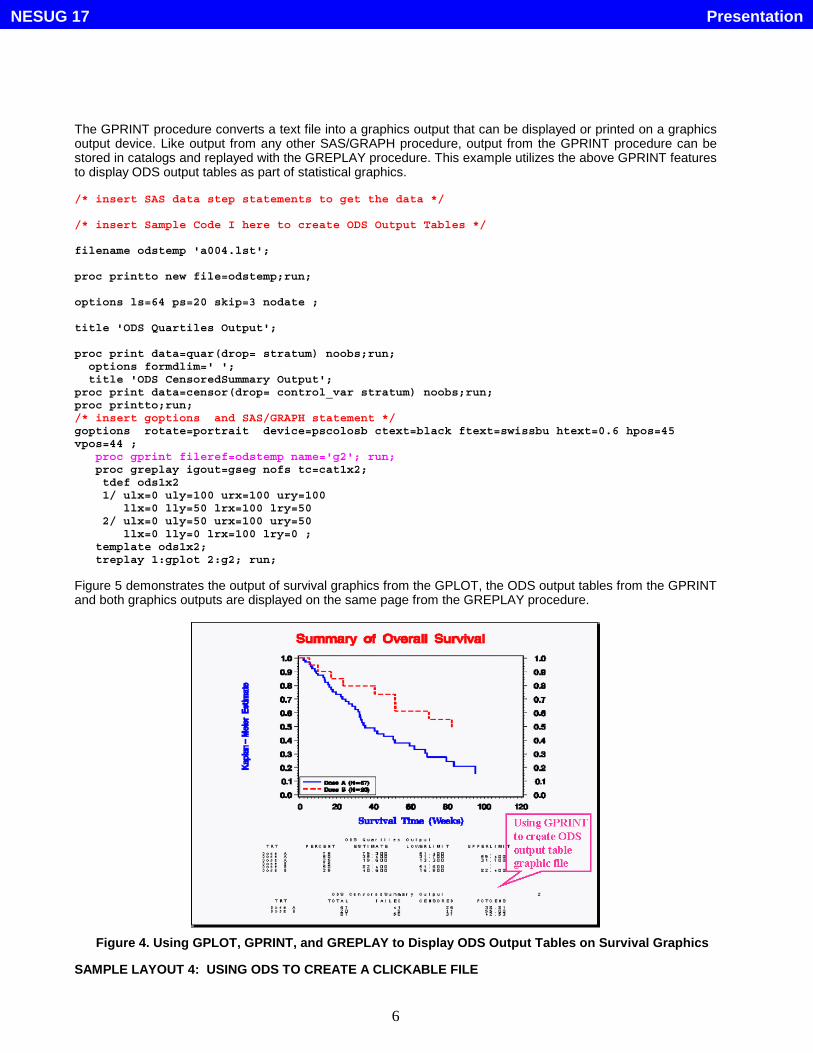
The GPRINT procedure converts a text file into a graphics output that can be displayed or printed on a graphicsoutput device. Like output from any other SAS/GRAPH procedure, output from the GPRINT procedure can bestored in catalogs and replayed with the GREPLAY procedure. This example utilizes the above GPRINT featuresto display ODS output tables as part of statistical graphics.
/* insert SAS data step statements to get the data */
/* insert Sample Code I here to create ODS Output Tables */
filename odstemp 'a004.lst';
proc printto new file=odstemp;run;
options ls=64 ps=20 skip=3 nodate ;
title 'ODS Quartiles Output';
proc print data=quar(drop= stratum) noobs;run;options formdlim=' ';title 'ODS CensoredSummary Output';
proc print data=censor(drop= control_var stratum) noobs;run;proc printto;run;/* insert goptions and SAS/GRAPH statement */goptions rotate=portrait device=pscolosb ctext=black ftext=swissbu htext=0.6 hpos=45vpos=44 ;
proc gprint fileref=odstemp name='g2'; run;proc greplay igout=gseg nofs tc=cat1x2;tdef ods1x21/ ulx=0 uly=100 urx=100 ury=100
llx=0 lly=50 lrx=100 lry=502/ ulx=0 uly=50 urx=100 ury=50
llx=0 lly=0 lrx=100 lry=0 ;template ods1x2;treplay 1:gplot 2:g2; run;
Figure 5 demonstrates the output of survival graphics from the GPLOT, the ODS output tables from the GPRINTand both graphics outputs are displayed on the same page from the GREPLAY procedure.
Figure 4. Using GPLOT, GPRINT, and GREPLAY to Display ODS Output Tables on Survival Graphics
SAMPLE LAYOUT 4: USING ODS TO CREATE A CLICKABLE FILE
PresentationNESUG 17
7
You can combine SAS/GRAPH with ODS to produce high-resolution graphics in production reports. You can usethe ODS to convert the file format into either a Portable Document Format (PDF) or Rich Text Format (RTF)graphic output. Both file formats are clickable files, but the RTF file is for use in Microsoft Word.
The selection of an appropriate graphic device driver is also an important consideration. Graphic device driversare the components of SAS/GRAPH software that translate the device-independent graphics output fromSAS/GRAPH procedures into the appropriate commands to produce graphics output on particular outputdevices. Each device driver contains settings that determine the default appearance of the output, such asdimensions and orientation, cell size, colors, and hardware fonts. Table 4 lists suggested graphics device driversfor different ODS destinations.
Destination DevicePDF PDF, PDFCRTF JPEG, PNG, CGMOF97L, CGMOF97PTable 4. Suggested Graphics Device Drivers for Different ODS Destination
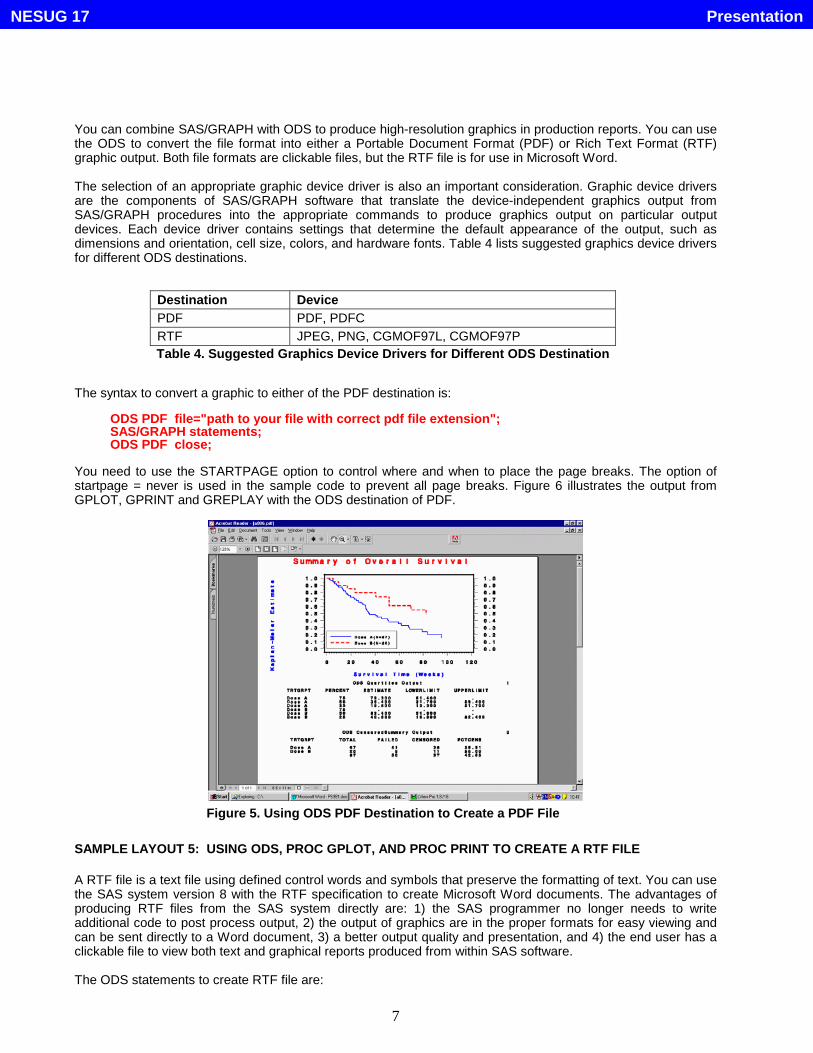
The syntax to convert a graphic to either of the PDF destination is:
ODS PDF file="path to your file with correct pdf file extension";SAS/GRAPH statements;ODS PDF close;
You need to use the STARTPAGE option to control where and when to place the page breaks. The option ofstartpage = never is used in the sample code to prevent all page breaks. Figure 6 illustrates the output fromGPLOT, GPRINT and GREPLAY with the ODS destination of PDF.
Figure 5. Using ODS PDF Destination to Create a PDF File
SAMPLE LAYOUT 5: USING ODS, PROC GPLOT, AND PROC PRINT TO CREATE A RTF FILE
A RTF file is a text file using defined control words and symbols that preserve the formatting of text. You can usethe SAS system version 8 with the RTF specification to create Microsoft Word documents. The advantages ofproducing RTF files from the SAS system directly are: 1) the SAS programmer no longer needs to writeadditional code to post process output, 2) the output of graphics are in the proper formats for easy viewing andcan be sent directly to a Word document, 3) a better output quality and presentation, and 4) the end user has aclickable file to view both text and graphical reports produced from within SAS software.
The ODS statements to create RTF file are:
PresentationNESUG 17
8
ODS RTF file="path to your file with correct rtf file extension";SAS/GRAPH statements;ODS RTF close;
An escape sequence is a series of characters starting with the specified escape character. Escape sequencesare used to send a command to a device or program. ODS allows you to define an escape character byESCAPECHAR= option. Furthermore, escape sequences are used for any sequence of characters thattemporarily suspends normal processing of a stream of characters to perform some special function.
A data set named image, which contains the ODS ESCAPECHAR= facility to define the escape character, iscreated in the following sample code. In this dataset, the PREIMAGE style option ^S= {preimage= } is used topoint to an external graphic file.
data image;list='^S={preimage="a007.jpg"}'; run;
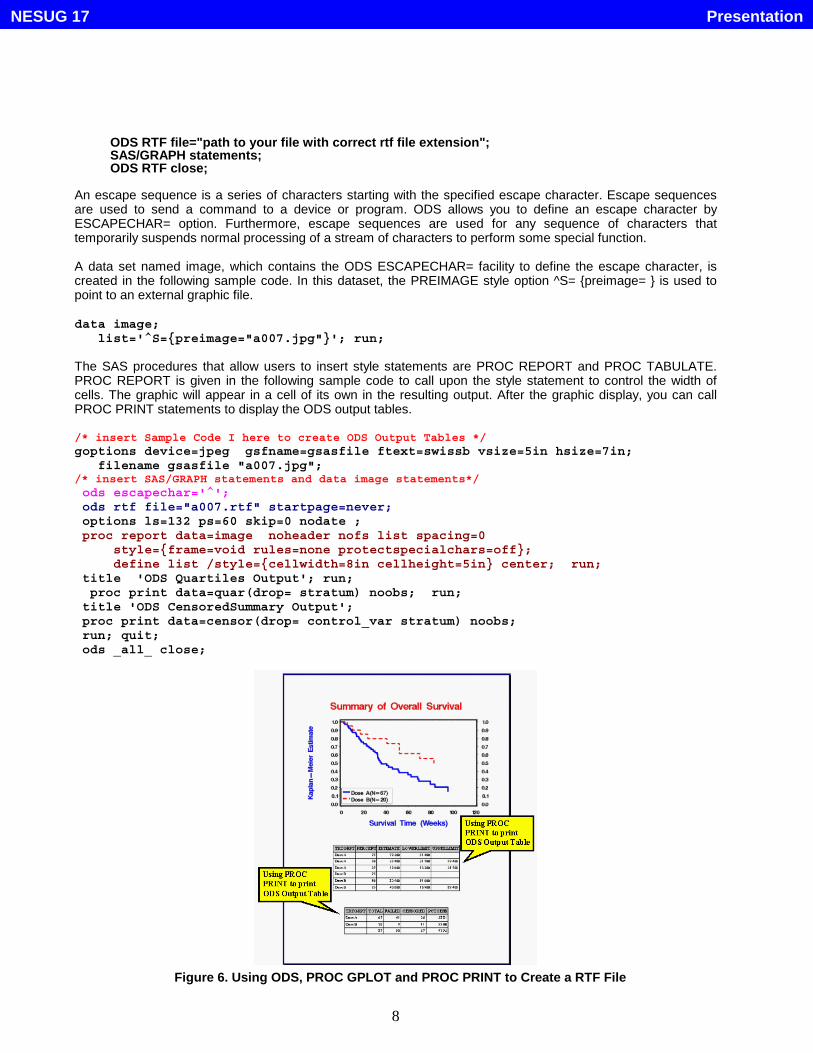
The SAS procedures that allow users to insert style statements are PROC REPORT and PROC TABULATE.PROC REPORT is given in the following sample code to call upon the style statement to control the width ofcells. The graphic will appear in a cell of its own in the resulting output. After the graphic display, you can callPROC PRINT statements to display the ODS output tables.
/* insert Sample Code I here to create ODS Output Tables */goptions device=jpeg gsfname=gsasfile ftext=swissb vsize=5in hsize=7in;
filename gsasfile "a007.jpg";/* insert SAS/GRAPH statements and data image statements*/ods escapechar='^';ods rtf file="a007.rtf" startpage=never;options ls=132 ps=60 skip=0 nodate ;proc report data=image noheader nofs list spacing=0
style={frame=void rules=none protectspecialchars=off};define list /style={cellwidth=8in cellheight=5in} center; run;
title 'ODS Quartiles Output'; run;proc print data=quar(drop= stratum) noobs; run;
title 'ODS CensoredSummary Output';proc print data=censor(drop= control_var stratum) noobs;run; quit;ods _all_ close;
Figure 6. Using ODS, PROC GPLOT and PROC PRINT to Create a RTF File
PresentationNESUG 17
9
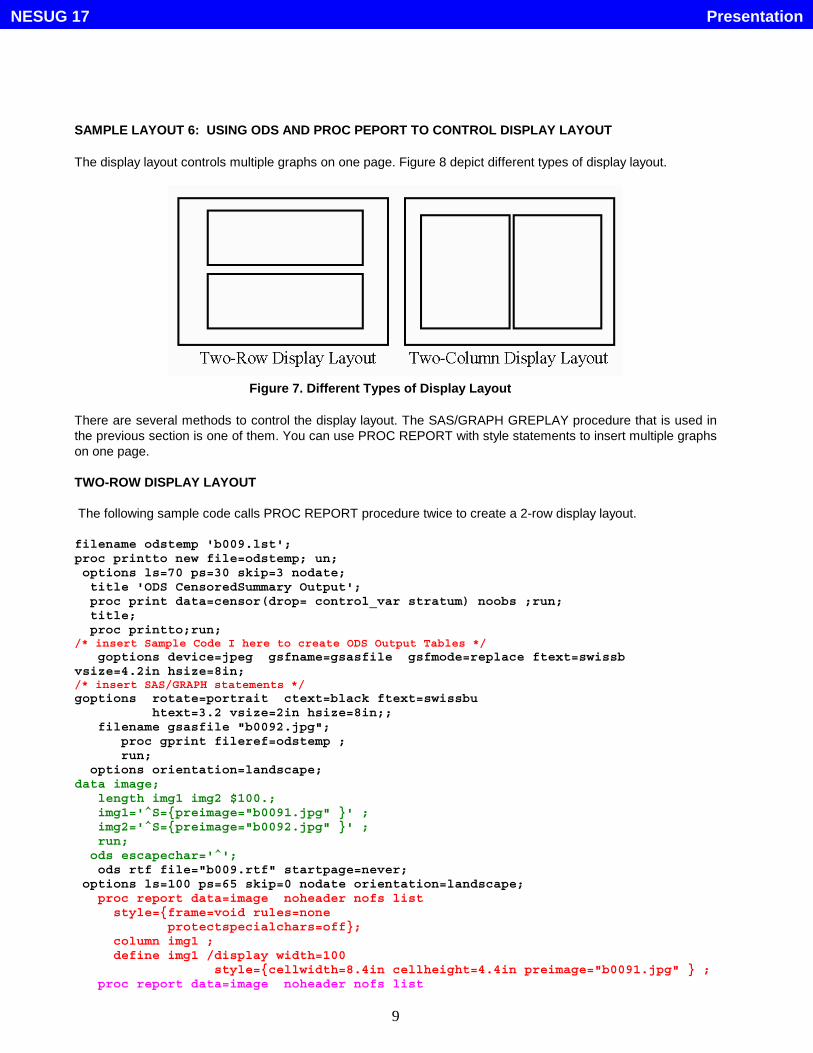
SAMPLE LAYOUT 6: USING ODS AND PROC PEPORT TO CONTROL DISPLAY LAYOUT
The display layout controls multiple graphs on one page. Figure 8 depict different types of display layout.
Figure 7. Different Types of Display Layout
There are several methods to control the display layout. The SAS/GRAPH GREPLAY procedure that is used inthe previous section is one of them. You can use PROC REPORT with style statements to insert multiple graphson one page.
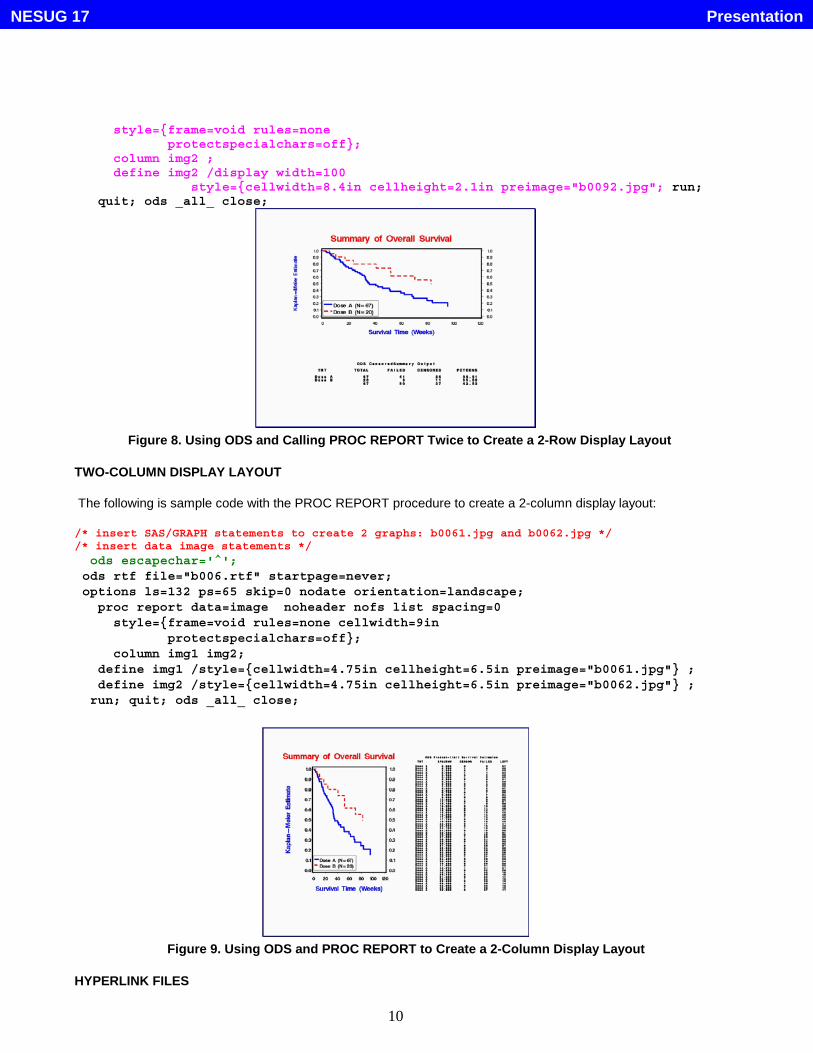
TWO-ROW DISPLAY LAYOUT
The following sample code calls PROC REPORT procedure twice to create a 2-row display layout.
filename odstemp 'b009.lst';proc printto new file=odstemp; un;options ls=70 ps=30 skip=3 nodate;title 'ODS CensoredSummary Output';proc print data=censor(drop= control_var stratum) noobs ;run;title;proc printto;run;
/* insert Sample Code I here to create ODS Output Tables */goptions device=jpeg gsfname=gsasfile gsfmode=replace ftext=swissb
vsize=4.2in hsize=8in;/* insert SAS/GRAPH statements */goptions rotate=portrait ctext=black ftext=swissbu
htext=3.2 vsize=2in hsize=8in;;filename gsasfile "b0092.jpg";
proc gprint fileref=odstemp ;run;
options orientation=landscape;data image;
length img1 img2 $100.;img1='^S={preimage="b0091.jpg" }' ;img2='^S={preimage="b0092.jpg" }' ;run;
ods escapechar='^';ods rtf file="b009.rtf" startpage=never;
options ls=100 ps=65 skip=0 nodate orientation=landscape;proc report data=image noheader nofs list
style={frame=void rules=noneprotectspecialchars=off};
column img1 ;define img1 /display width=100
style={cellwidth=8.4in cellheight=4.4in preimage="b0091.jpg" } ;proc report data=image noheader nofs list
PresentationNESUG 17
10
style={frame=void rules=noneprotectspecialchars=off};
column img2 ;define img2 /display width=100
style={cellwidth=8.4in cellheight=2.1in preimage="b0092.jpg"; run;quit; ods _all_ close;
Figure 8. Using ODS and Calling PROC REPORT Twice to Create a 2-Row Display Layout
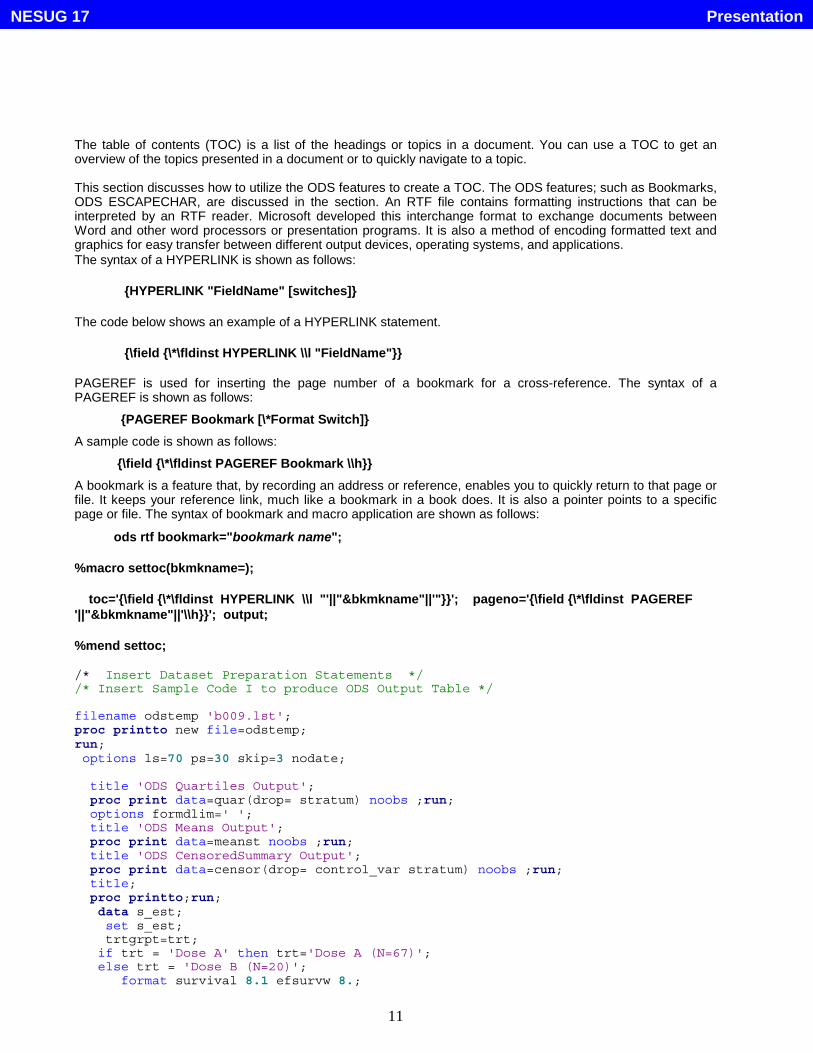
TWO-COLUMN DISPLAY LAYOUT
The following is sample code with the PROC REPORT procedure to create a 2-column display layout:
/* insert SAS/GRAPH statements to create 2 graphs: b0061.jpg and b0062.jpg *//* insert data image statements */
ods escapechar='^';ods rtf file="b006.rtf" startpage=never;options ls=132 ps=65 skip=0 nodate orientation=landscape;
proc report data=image noheader nofs list spacing=0style={frame=void rules=none cellwidth=9in
protectspecialchars=off};column img1 img2;
define img1 /style={cellwidth=4.75in cellheight=6.5in preimage="b0061.jpg"} ;define img2 /style={cellwidth=4.75in cellheight=6.5in preimage="b0062.jpg"} ;
run; quit; ods _all_ close;
Figure 9. Using ODS and PROC REPORT to Create a 2-Column Display Layout
HYPERLINK FILES
PresentationNESUG 17
11
The table of contents (TOC) is a list of the headings or topics in a document. You can use a TOC to get anoverview of the topics presented in a document or to quickly navigate to a topic.
This section discusses how to utilize the ODS features to create a TOC. The ODS features; such as Bookmarks,ODS ESCAPECHAR, are discussed in the section. An RTF file contains formatting instructions that can beinterpreted by an RTF reader. Microsoft developed this interchange format to exchange documents betweenWord and other word processors or presentation programs. It is also a method of encoding formatted text andgraphics for easy transfer between different output devices, operating systems, and applications.The syntax of a HYPERLINK is shown as follows:
{HYPERLINK "FieldName" [switches]}
The code below shows an example of a HYPERLINK statement.
{\field {\*\fldinst HYPERLINK \\l "FieldName"}}
PAGEREF is used for inserting the page number of a bookmark for a cross-reference. The syntax of aPAGEREF is shown as follows:
{PAGEREF Bookmark [\*Format Switch]}
A sample code is shown as follows:
{\field {\*\fldinst PAGEREF Bookmark \\h}}
A bookmark is a feature that, by recording an address or reference, enables you to quickly return to that page orfile. It keeps your reference link, much like a bookmark in a book does. It is also a pointer points to a specificpage or file. The syntax of bookmark and macro application are shown as follows:
ods rtf bookmark="bookmark name";
%macro settoc(bkmkname=);
toc='{\field {\*\fldinst HYPERLINK \\l "'||"&bkmkname"||'"}}'; pageno='{\field {\*\fldinst PAGEREF'||"&bkmkname"||'\\h}}'; output;
%mend settoc;
/* Insert Dataset Preparation Statements *//* Insert Sample Code I to produce ODS Output Table */
filename odstemp 'b009.lst';proc printto new file=odstemp;run;options ls=70 ps=30 skip=3 nodate;
title 'ODS Quartiles Output';proc print data=quar(drop= stratum) noobs ;run;options formdlim=' ';title 'ODS Means Output';proc print data=meanst noobs ;run;title 'ODS CensoredSummary Output';proc print data=censor(drop= control_var stratum) noobs ;run;title;proc printto;run;data s_est;set s_est;trtgrpt=trt;
if trt = 'Dose A' then trt='Dose A (N=67)';else trt = 'Dose B (N=20)';
format survival 8.1 efsurvw 8.;
PresentationNESUG 17
12
run;/* insert SAS/GRAPH statements to produce Survival Graph ab051.jpg *//* insert SAS/GRAPH statements to produce ODS Output image file ab093.jpg */
options orientation=landscape;%macro settoc(bkmkname=);
toc='{\field {\*\fldinst HYPERLINK \\l "'||"&bkmkname"||'"}}';pageno='{\field {\*\fldinst PAGEREF '||"&bkmkname"||'\\h}}';output;
%mend settoc;run;data toc;
length toc pageno $70;%settoc(bkmkname=Quartiles);%settoc(bkmkname=Means);%settoc(bkmkname=CensorSummary);%settoc(bkmkname=SurvivalEstimates);%settoc(bkmkname=Graphic_1);%settoc(bkmkname=Graphic_2);run;
ods rtf file="ac010.rtf";title 'Table of Contents';proc report data=toc nowd
style={protectspecialchars=offrules=groupsframe=hsides};
column toc pageno;define toc / display 'Table' left
style={cellwidth=3in just=left};define pageno / display 'Page' left
style={cellwidth=2.5in just=right};run;
options ls=100 ps=60 skip=5 nodate;ods rtf bookmark="Quartiles";title 'ODS Quartiles Output';proc print data=quar(drop= stratum) noobs ;run;
title 'ODS Means Output';ods rtf bookmark="Means";proc print data=meanst noobs ;run;title 'ODS CensoredSummary Output';ods rtf bookmark="CensorSummary";proc print data=censor(drop= control_var stratum) noobs ;run;ods rtf bookmark="SurvivalEstimates";title 'ODS Survival Estimates Output';proc print data=s_est(drop=trt stratum) noobs ;run;run;title ' ';ods escapechar='^'; run;data image1;length img1 img2 $100.;img1='^S={preimage="ab051.jpg" }' ;img2='^S={preimage="ab093.jpg" }' ; run;
title 'Summary of Overall Survival';ods rtf bookmark="Graphic_1";proc print data=image1 noobs
style={frame=void rules=noneprotectspecialchars=off};
var img1 / style={cellwidth=8.4in cellheight=6in preimage="ab051.jpg" }style(header)={background=white foreground=white font_size=1pt};
run; title 'ODS Output Tables';ods rtf bookmark="Graphic_2";proc print data=image1 noobs
PresentationNESUG 17
13
style={frame=void rules=noneprotectspecialchars=off};
var img2 / style={cellwidth=8.4in cellheight=6in preimage="ab093.jpg" }style(header)={background=white foreground=white font_size=1pt};
run; quit;ods _all_ close;
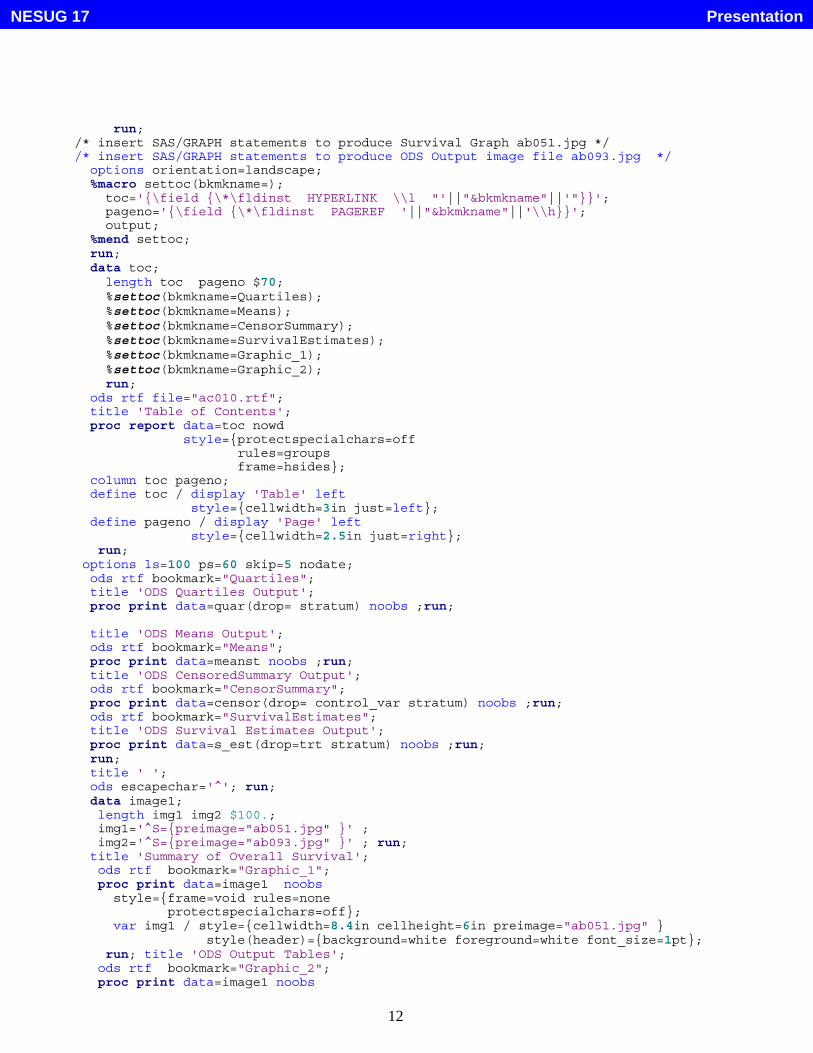
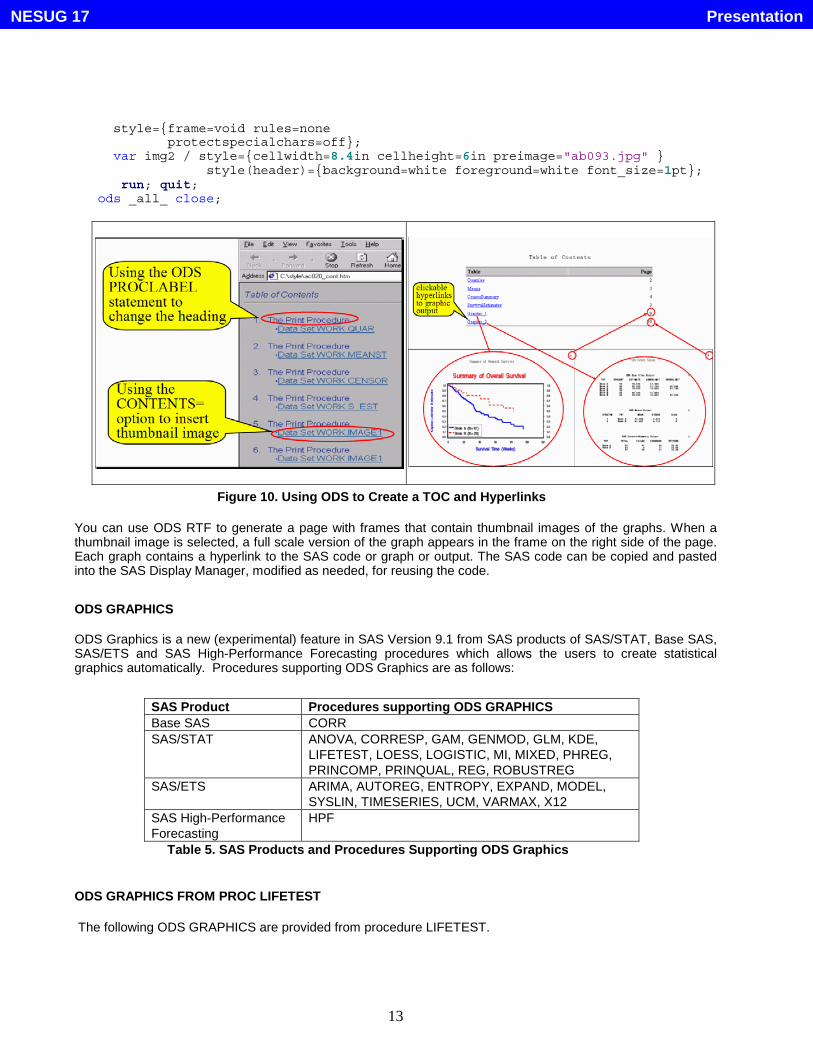
Figure 10. Using ODS to Create a TOC and Hyperlinks
You can use ODS RTF to generate a page with frames that contain thumbnail images of the graphs. When athumbnail image is selected, a full scale version of the graph appears in the frame on the right side of the page.Each graph contains a hyperlink to the SAS code or graph or output. The SAS code can be copied and pastedinto the SAS Display Manager, modified as needed, for reusing the code.
ODS GRAPHICS
ODS Graphics is a new (experimental) feature in SAS Version 9.1 from SAS products of SAS/STAT, Base SAS,SAS/ETS and SAS High-Performance Forecasting procedures which allows the users to create statisticalgraphics automatically. Procedures supporting ODS Graphics are as follows:
SAS Product Procedures supporting ODS GRAPHICSBase SAS CORRSAS/STAT ANOVA, CORRESP, GAM, GENMOD, GLM, KDE,
LIFETEST, LOESS, LOGISTIC, MI, MIXED, PHREG,PRINCOMP, PRINQUAL, REG, ROBUSTREG
SAS/ETS ARIMA, AUTOREG, ENTROPY, EXPAND, MODEL,SYSLIN, TIMESERIES, UCM, VARMAX, X12
SAS High-PerformanceForecasting
HPF
Table 5. SAS Products and Procedures Supporting ODS Graphics
ODS GRAPHICS FROM PROC LIFETEST
The following ODS GRAPHICS are provided from procedure LIFETEST.
PresentationNESUG 17
14
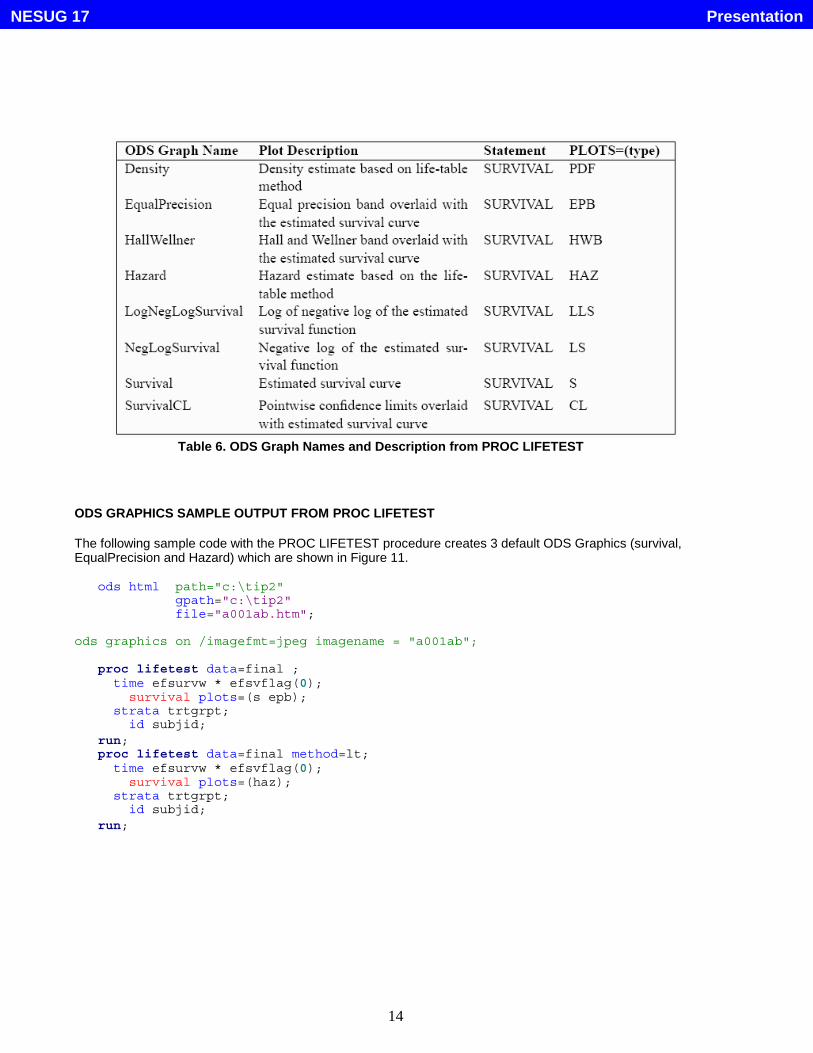
Table 6. ODS Graph Names and Description from PROC LIFETEST
ODS GRAPHICS SAMPLE OUTPUT FROM PROC LIFETEST
The following sample code with the PROC LIFETEST procedure creates 3 default ODS Graphics (survival,EqualPrecision and Hazard) which are shown in Figure 11.
ods html path="c:\tip2"gpath="c:\tip2"file="a001ab.htm";
ods graphics on /imagefmt=jpeg imagename = "a001ab";
proc lifetest data=final ;time efsurvw * efsvflag(0);
survival plots=(s epb);strata trtgrpt;
id subjid;run;proc lifetest data=final method=lt;
time efsurvw * efsvflag(0);survival plots=(haz);
strata trtgrpt;id subjid;
run;
PresentationNESUG 17
15
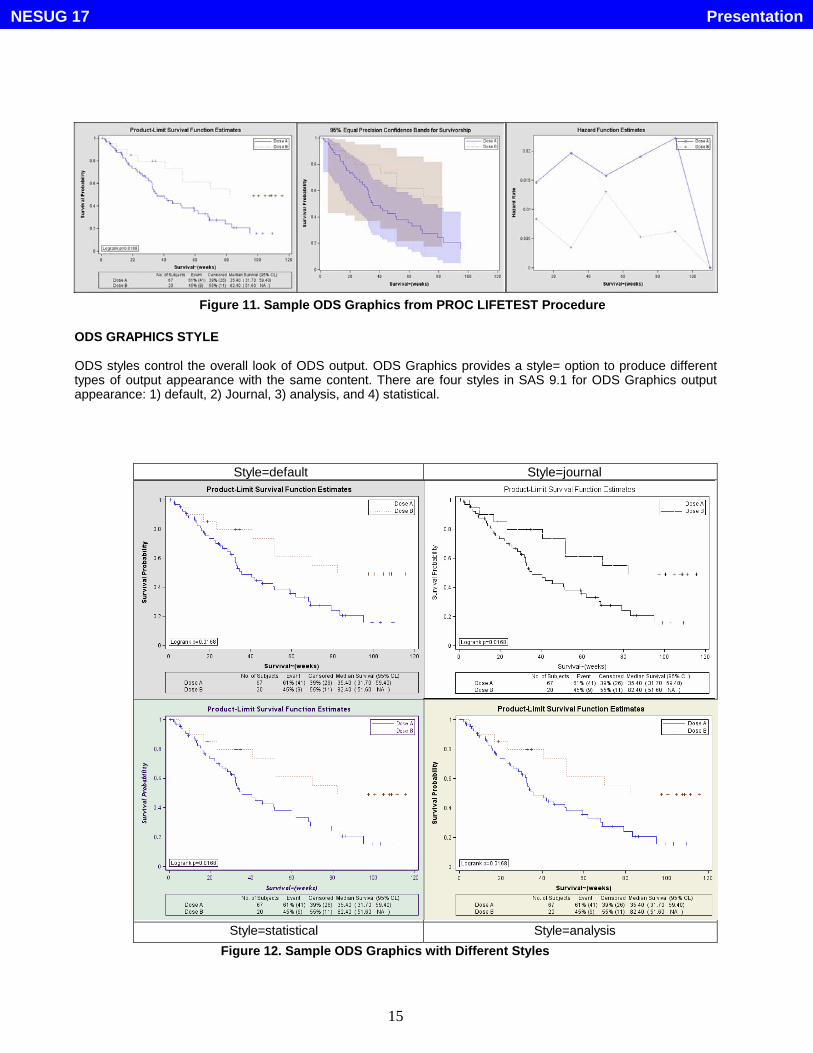
Figure 11. Sample ODS Graphics from PROC LIFETEST Procedure
ODS GRAPHICS STYLE
ODS styles control the overall look of ODS output. ODS Graphics provides a style= option to produce differenttypes of output appearance with the same content. There are four styles in SAS 9.1 for ODS Graphics outputappearance: 1) default, 2) Journal, 3) analysis, and 4) statistical.
Style=default Style=journal
Style=statistical Style=analysis
Figure 12. Sample ODS Graphics with Different Styles
PresentationNESUG 17
16
CUSTOMIZING ODS GRAPHICS
In SAS 9.1, the ODS Graphics are controlled by a new graph definition language called ODS Graphics TemplateLanguage (GTL). ODS Graphics are part of procedure ODS output and are governed by the standard ODSstatements. In addition, graph appearance, like ODS output tables, are controlled by the current ODS style.
The names of the templates a procedure uses are predefined, the users can not change a template’s name oradd new templates to a procedure’s output. The default SAS supplied templates are located inSASHELP.TEMPLMST. You can change the default template and keep the same template name, but store themodified template to SASUSER path that is searched before the default path. The default template for HazardFunction graph in procedure LIFETEST is as follows:
proc template;define statgraph Stat.Lifetest.Graphics.Hazard;
dynamic NStrata;layout Gridded;
if (NSTRATA=1)layout gridded / padbottom=5;EntryTitle "Hazard Function Estimate";
endlayout;layout OVERLAY;
seriesplot y=HAZARD x=MIDPOINT / linecolor=StatGraphFitLine:contrastcolor markercolor=StatGraphFitLine:contrastcolor index=STRATUMNUM markers=on name
="Hazard";EndLayout;else
layout gridded / padbottom=5;EntryTitle "Hazard Function Estimates";
endlayout;layout OVERLAY;
seriesplot y=HAZARD x=MIDPOINT / group=STRATUM index=STRATUMNUMmarkers=on name="Hazard";
DiscreteLegend "Hazard" / hAlign=right vAlign=top across=1 border=true;
EndLayout;endif;
EndLayout;end;
run;
The Hazard Function graph is modified in the following items: 1) three title lines instead of only one with user’sprovided titles, 2) change the position of legend from right top corner to left bottom corner, 3) a footnote isadded, 4) line colors are added, and 5) thicker lines are selected. Table 7 shows sources for controlling ODSGraphics appearance.
Source for Control ODS Graphics ComponentFeed-in data set x-axis label, legend value descriptionStyle template Colors, line styles, marker styles, font styles, graph sizes,ODS graph template Titles, footnotes, legend styles, line styles, colors styles,
marker styles, font styles, borders and graph dimentionsTable 7. Source for Controlling ODS Graphics Components
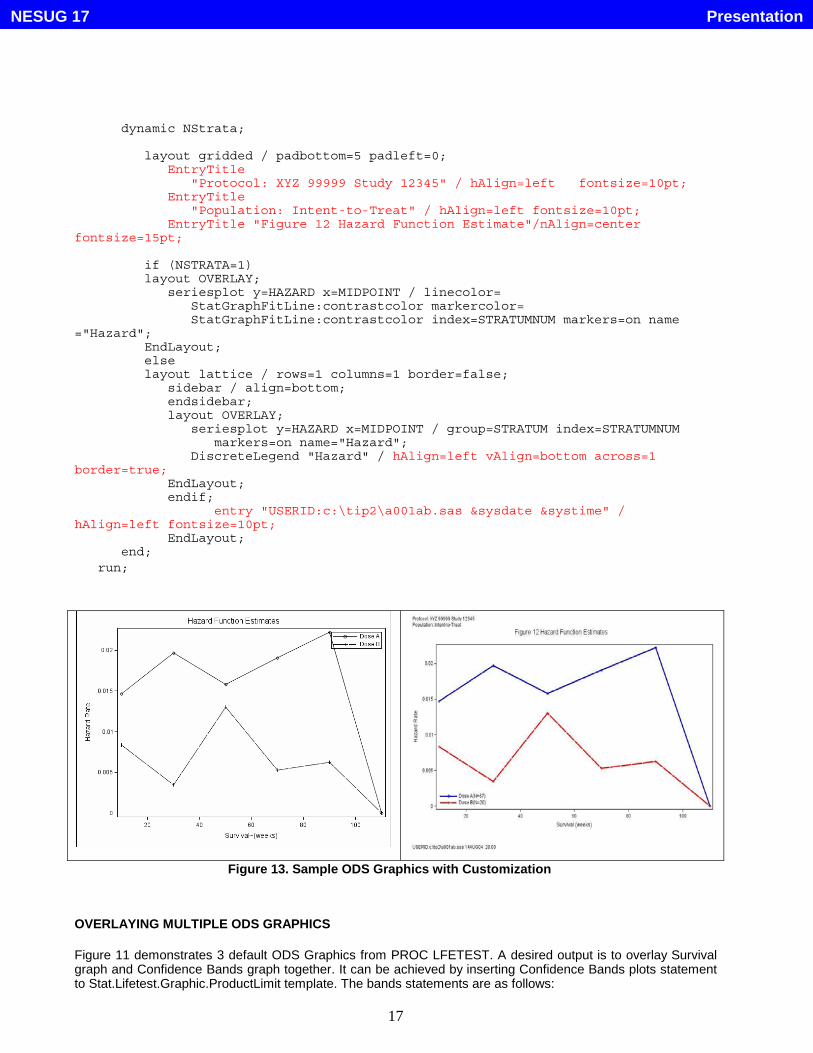
The following sample code is the modified template. The modified code is highlighted. The output is shown inFigure 13.
proc template;define statgraph Stat.Lifetest.Graphics.Hazard / store = SASUSER.TEMPLAT;
PresentationNESUG 17
17
dynamic NStrata;
layout gridded / padbottom=5 padleft=0;EntryTitle
"Protocol: XYZ 99999 Study 12345" / hAlign=left fontsize=10pt;EntryTitle
"Population: Intent-to-Treat" / hAlign=left fontsize=10pt;EntryTitle "Figure 12 Hazard Function Estimate"/nAlign=center
fontsize=15pt;
if (NSTRATA=1)layout OVERLAY;
seriesplot y=HAZARD x=MIDPOINT / linecolor=StatGraphFitLine:contrastcolor markercolor=StatGraphFitLine:contrastcolor index=STRATUMNUM markers=on name
="Hazard";EndLayout;elselayout lattice / rows=1 columns=1 border=false;
sidebar / align=bottom;endsidebar;layout OVERLAY;
seriesplot y=HAZARD x=MIDPOINT / group=STRATUM index=STRATUMNUMmarkers=on name="Hazard";
DiscreteLegend "Hazard" / hAlign=left vAlign=bottom across=1border=true;
EndLayout;endif;
entry "USERID:c:\tip2\a001ab.sas &sysdate &systime" /hAlign=left fontsize=10pt;
EndLayout;end;
run;
Figure 13. Sample ODS Graphics with Customization
OVERLAYING MULTIPLE ODS GRAPHICS
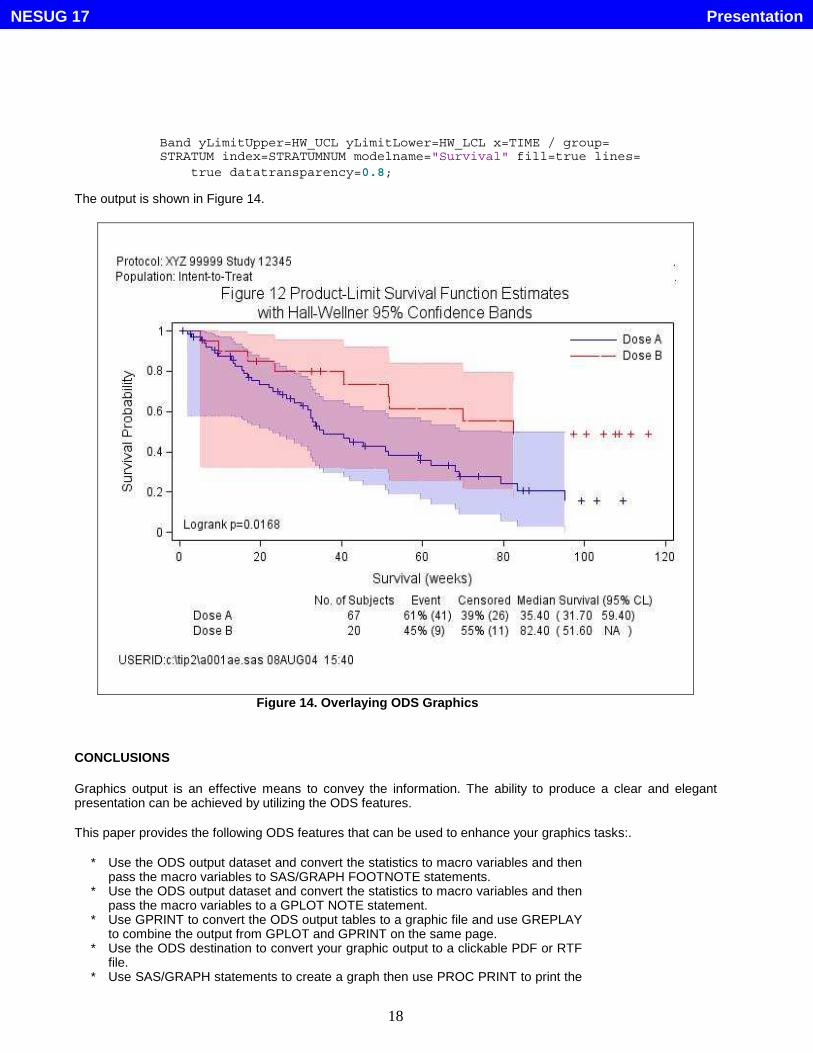
Figure 11 demonstrates 3 default ODS Graphics from PROC LFETEST. A desired output is to overlay Survivalgraph and Confidence Bands graph together. It can be achieved by inserting Confidence Bands plots statementto Stat.Lifetest.Graphic.ProductLimit template. The bands statements are as follows:
PresentationNESUG 17
18
Band yLimitUpper=HW_UCL yLimitLower=HW_LCL x=TIME / group=STRATUM index=STRATUMNUM modelname="Survival" fill=true lines=
true datatransparency=0.8;
The output is shown in Figure 14.
Figure 14. Overlaying ODS Graphics
CONCLUSIONS
Graphics output is an effective means to convey the information. The ability to produce a clear and elegantpresentation can be achieved by utilizing the ODS features.
This paper provides the following ODS features that can be used to enhance your graphics tasks:.
* Use the ODS output dataset and convert the statistics to macro variables and thenpass the macro variables to SAS/GRAPH FOOTNOTE statements.
* Use the ODS output dataset and convert the statistics to macro variables and thenpass the macro variables to a GPLOT NOTE statement.
* Use GPRINT to convert the ODS output tables to a graphic file and use GREPLAYto combine the output from GPLOT and GPRINT on the same page.
* Use the ODS destination to convert your graphic output to a clickable PDF or RTFfile.
* Use SAS/GRAPH statements to create a graph then use PROC PRINT to print the
PresentationNESUG 17
19
ODS output tables on the same page.* Use SAS/GRAPH statements with PROC REPORT statements to control display
layout and insert multiple graphs on one page.* Produce ODS Graphics as part of ODS output for modelling diagnosis or a first
step of data analysis.* ODS Graphics can be produced easily but the modification of the default graph
appearance involves Graphical Template Language.
ACKNOWLEDGMENT
The author would like to thank Wendy Ma for her suggestions and discussions on the topic of creating 2-rowdisplay layout.
REFERENCES
[1] CDISC website: http://www.cdisc.org/
[2] Delaney, Kevin,: Multiple Graphs on One Page, the easy way (PDF) and the hard way (RTF), Proceedings ofAnnual Conference of the SAS Users Group International, SUGI 28, Paper 94-28, April 2003
[3] Mitchell, R.M.: Thumbs Up For ODS Graphics, But Don’t Throw Out All Your SAS/GRAPH Program,Proceedings of Annual Conference of the SAS Users Group International, SUGI 29, Paper 083-29, May 2004
[4] Robert N. Rodriguez: An Introduction to ODS for Statistical Graphics in SAS 9.1, Proceedings of AnnualConference of the SAS Users Group International, SUGI 29 Paper 204-29, May 2004
[5] http://support.sas.com/rnd/base/topics/statgraph/v91StatGraphStyles.htm
[6] SAS Institute Inc.: SAS 9.1 Output Delivery System: User’s Guide, SAS Institute Inc., Cary NC, USA. Jan.2004
[7] SAS Institute Inc.: The Analyst Application, Second Edition, SAS Institute Inc., Cary NC, USA. 2003
[8] SAS Institute Inc.: SAS/STAT 9.1 User’s Guide, SAS Institute Inc., Cary NC, USA. Jan. 2004
[9] SAS Institute Inc.: The Complete Guide to the SAS Output Delivery System, Version 8, SAS Institute Inc.,Cary NC, USA. 1999
[10] Shannon, David,: To ODS RTF and Beyond, Proceedings of Annual Conference of the SAS Users GroupInternational, SUGI 27, Paper 1-27, April 2002
[11] Watt, P.; Multiple-Plot Displays: Simplified with Macros, SAS Publishing, Books by Users press. 2004
[12] Yeh, Shi-Tao: Tips to Enhance Your SAS Statistical Graphics Output, Proceedings of Annual Conferenceof the Pharmaceutical Industry SAS Users Group, PharmaSUG 2003, May 2003, pp 343-348
[13] Zhou, Joanne: An Enhancement of Survival Graph Proceedings of Annual Conference of thePharmaceutical Industry SAS Users Group, PharmaSUG 2003, May 2003, pp 403-408
[14] Watt, P.; Multiple-Plot Displays: Simplified with Macros, SAS Publishing, Books by Users press. 2004
TRADEMARKS
SAS® and all other SAS Institute Inc. product or service names are registered trademarks or trademarks of SASInstitute Inc. in the USA and other countries. ® indicates USA registration. Other brand and product names areregistered trademarks or trademarks of their respective companies.
AUTHOR CONTACT INFORMATION
Shi-Tao Yeh, Ph. D.(610)787-3856 (W)E-mail: [email protected]
PresentationNESUG 17