Embed Size (px)
Citation preview

OECD Services Trade Restrictiveness Index:Policy trends up to 2018January 2018

OECD TRADE AND AGRICULTURE DIRECTORATE
This booklet is published under the responsibility of the Secretary-General of the OECD. The opinions expressed and the arguments employed herein do not necessarily reflect the official views of OECD countries.
The publication of this booklet has been authorised by Ken Ash, Director of the Trade and Agriculture Directorate
Comments are welcome and should be sent to [email protected].
Photo credits: Cover Illustration © Jeffrey Fisher
© OECD (2018)
You can copy, download or print OECD content for your own use, and you can include excerpts from OECD publications, databases and multimedia products in your own documents, presentations, blogs, websites and teaching materials, provided that suitable acknowledgment of OECD as source and copyright owner is given. All requests for commercial use and translation rights should be submitted to [email protected].

© OECD 2018
STRI Policy Trends up to 2018
The OECD Services Trade Restrictiveness Index (STRI) is a unique tool that provides up-to-date information on regulatory changes that affect trade in services in 44 countries across 22 sectors, accounting for over 80% of global services trade.
Launched in 2014 and updated annually, the STRI offers a comprehensive and transparent overview of global trends in services trade regulations, while facilitating deeper analysis into the effects that such regulations have on trade in services. The STRI is updated each year to incorporate changes that have been introduced through new or amended laws and regulations. This evidence-based tool allows policymakers to assess reform options, benchmark them relative to global best practice, and assess their likely impact; helps trade negotiators identify restrictions that most impede trade; and is a source of regulatory transparency for businesses seeking to enter foreign markets.
Results from the most recent STRI update show that although there is evidence of some progressive liberalisation of services markets, the overall 2017 STRI indices are more restrictive than in 2016, highlighting an overall tightening of the global regulatory environment for services trade. These results are largely due to restrictive horizontal policy changes being implemented in a number of countries that affect all services sectors. This was particularly the case for measures affecting services supplied through the temporary movement of natural persons (Mode 4), due to more stringent entry conditions being applied to persons seeking to provide services on a temporary basis, such as intra-corporate transferees, contractual or independent services suppliers. In addition, some countries have introduced economy-wide limitations on cross-border data flows.
Top regulatory performers
The top ten countries with the most open markets for services trade in 2017 are Latvia,Ireland, Germany, Netherlands, Australia, Lithuania, Denmark, Japan, United Kingdom,and the Czech Republic.
Norway recorded the most significant liberalising reforms in 2017, followed by Indonesiaand Iceland.
Leading sectoral reformers from 2014 to 2017 include Mexico in telecommunications, thePeople’s Republic of China in rail freight transport services, and Japan in logistics services(customs brokerage).
Top services exporters
The United States exported services worth USD 752 billion in 2016, followed by theUnited Kingdom (USD 333 billion), Germany (USD 281 billion), France (USD 237 billion),and the People’s Republic of China (USD 207 billion).

4 │ STRI POLICY TRENDS UP TO 2018
© OECD 2018
Key analytical findings
Services trade barriers impede services exports. OECD estimates reveal that thetrade cost equivalent of services trade barriers largely exceeds the average tariff ontraded goods. Services trade barriers have a strong anti-export bias that impedesservices exports as much as services imports. Trade costs arise both from policies thatexplicitly target foreign suppliers and from domestic regulation that falls short of bestpractice in the area of competition policy and rule-making.
Consumers and firms pay the cost of trade restrictions. Entry barriers allowincumbent firms to gain market power, limit competition, and delay innovation. Thecosts of a policy environment that reduces competition from new entrants, whetherdomestic or foreign, is ultimately borne by consumers and downstream businesscustomers, who pay higher prices and enjoy less choice than they would in morecompetitive markets. The resulting price increases for domestic users of services canbe quantified as a sales tax equivalent on their purchases. On average, estimates of thetax equivalent of the restrictions recorded in the STRI range from about 3% in roadfreight transport to almost 40% in broadcasting. In some segments of transport andlogistics, as well as in construction, the average estimated sales tax equivalent is about20%, and in some countries almost 80%, imposing substantial additional costs onmanufacturing enterprises and eventually on final customers.
Regulatory co-operation can reduce trade costs. Differences among countries inregulating the same service create additional costs for exporters that need to adapt tonew sets of rules in each new market. Regulatory differences become more importantas trade barriers come down to a level where firms start to consider entering multiplemarkets. Thus, when markets are relatively open, trade costs imposed by the averagedegree of regulatory differences is estimated at about 40% in ad valorem terms. Whileregulatory harmonisation can reduce trade costs, removing the most onerousrestrictions first is a prerequisite to maximise the gains from regulatory co-operation.
Trade in services depends on the movement of professionals. The cross-bordermovement of people does not account for a large share of services trade, but it isessential for international business operations. Mobility of natural persons acrossinternational borders is particularly key for trade in business services, which in turnis an important channel for knowledge transfer.
Trade in services underpins the digital economy. Liberalisation and pro-competitive reforms in the telecommunications sector are associated with asubstantial reduction in the trade costs for business services. High capacity networksat competitive prices are a necessary condition for a digital transformation ofknowledge-intensive services. Access to the professions and the services they provideis also essential.
Services reforms help SMEs. The costs of dealing with regulatory hurdles andcomplying with diverging regulations in every new market fall more heavily on smalland medium-sized enterprises (SMEs). For micro firms engaging in cross-borderexports, an average level of services trade restrictiveness represents an additional 7%in trade costs relative to large firms. Establishing an affiliate abroad involves evenhigher costs; for a small firm an average level of services trade restrictiveness isestimated to be equivalent to an additional 12% tariff compared to large firms.

STRI POLICY TRENDS UP TO 2018 │ 5
© OECD 2018
Monitoring services policy changes 2014-2017
The 2017 STRI update identified 70 policy changes across all countries. A similar number of changes were recorded in 2016 (75) and 2015 (69) (Figure 1). These changes include policies that both restrict and liberalise services trade. The main policy changes identified over the years are described in Annex I for each country covered.
Since 2014, the number of liberalising reforms has been higher than the number of restrictive changes. In 2016, liberalising reforms accounted for almost 76% of the total recorded in the STRI database. Tightening measures were most visible in 2015, when 36% of changes were restrictive for services trade. However, most changes that tightened trade apply horizontally across the economy and contribute to the STRI results across all sectors, leading to a higher overall impact on the indices.
While about 24% of all changes were trade restrictive in 2016, this increased to 32% in 2017 due to the introduction in a few countries of more stringent conditions across the economy, particularly those limiting the temporary movement of natural persons providing services (Figure 2).
Figure 1. Extent of policy changes across years
Number of policy changes recorded in the STRI database across all sectors and countries
Source: STRI database (http://oe.cd/stri-db).
0 10 20 30 40 50 60 70 80
2015
2016
2017
Tightening Liberalising

6 │ STRI POLICY TRENDS UP TO 2018
© OECD 2018
Figure 2. Nature of changes in 2016 and 2017, number of measures
2016 2017
Source: STRI database (http://oe.cd/stri-db).
Policy changes across modes of supply
The STRI differentiates between the nature of policy changes by modes of services supply through commercial establishment (Mode 3), temporary movement of natural persons (Mode 4), and changes that affect services irrespective of the mode through which they are supplied (all modes). The latter category is comprised of barriers to competition and regulatory transparency, in particular.
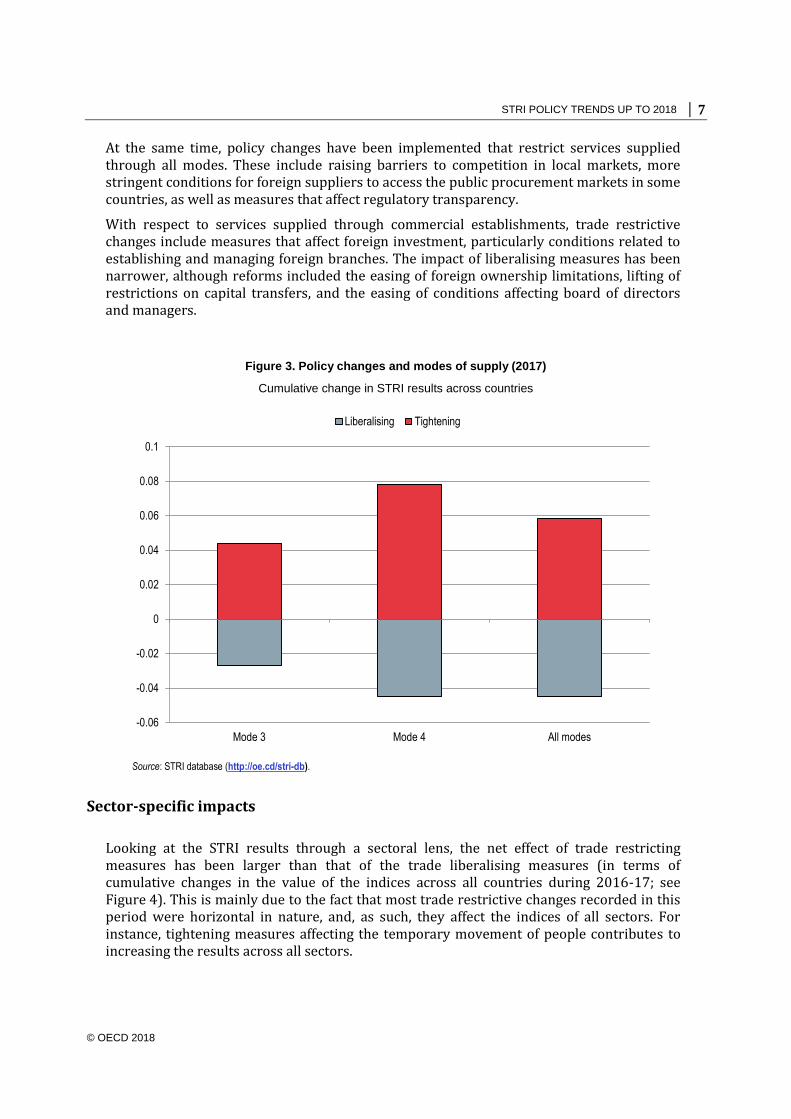
Figure 3 shows that services supplied via temporary movement of natural persons (Mode 4) are particularly affected, with the highest net increase in the STRI results in 2017. This is the result of a few countries applying stricter labour market tests for some or all three categories of persons covered in the STRI (intra-corporate transferees, contractual services suppliers, and independent services suppliers). Two countries have introduced quotas on intra-corporate transferees and contractual services suppliers. In one country, the duration of stay for corporate transferees was reduced, while two countries introduced new conditions for obtaining permits, including the condition that sponsors must support the person in question.
Liberalising reforms have also been introduced in several countries. These included the roll-back of burdensome ex ante regulations when these were no longer needed, as well as the simplifying of customs procedures for courier and logistics firms. A number of countries, particularly those within the European Union, also liberalised policies affecting the temporary movement of natural persons (Mode 4 access) by introducing new permits for intra-corporate transferees coming from non-EU Member States, providing more clarity on the conditions and duration of stay applicable to these persons.
Liberalising Tightening
76%
24%
68%
32%
STRI POLICY TRENDS UP TO 2018 │ 7
© OECD 2018
At the same time, policy changes have been implemented that restrict services supplied through all modes. These include raising barriers to competition in local markets, more stringent conditions for foreign suppliers to access the public procurement markets in some countries, as well as measures that affect regulatory transparency.
With respect to services supplied through commercial establishments, trade restrictive changes include measures that affect foreign investment, particularly conditions related to establishing and managing foreign branches. The impact of liberalising measures has been narrower, although reforms included the easing of foreign ownership limitations, lifting of restrictions on capital transfers, and the easing of conditions affecting board of directors and managers.
Figure 3. Policy changes and modes of supply (2017)
Cumulative change in STRI results across countries
Source: STRI database (http://oe.cd/stri-db).
Sector-specific impacts
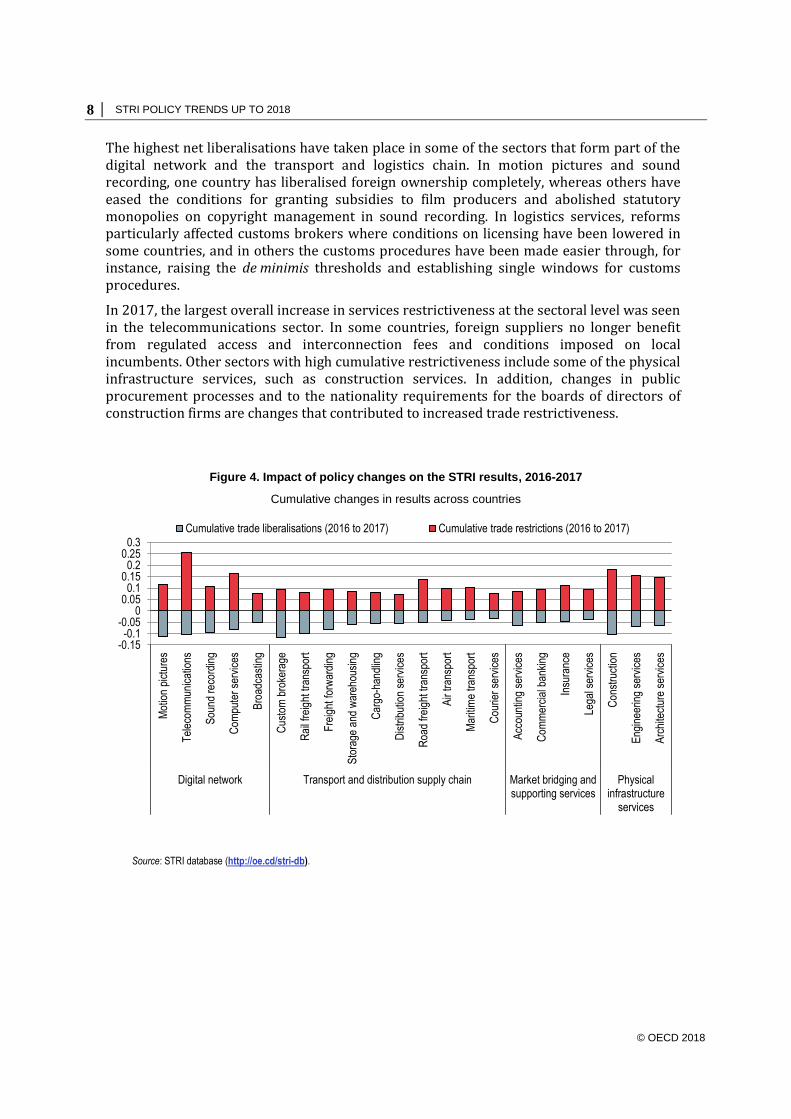
Looking at the STRI results through a sectoral lens, the net effect of trade restricting measures has been larger than that of the trade liberalising measures (in terms of cumulative changes in the value of the indices across all countries during 2016-17; see Figure 4). This is mainly due to the fact that most trade restrictive changes recorded in this period were horizontal in nature, and, as such, they affect the indices of all sectors. For instance, tightening measures affecting the temporary movement of people contributes to increasing the results across all sectors.
-0.06
-0.04
-0.02
0
0.02
0.04
0.06
0.08
0.1
Mode 3 Mode 4 All modes
Liberalising Tightening
8 │ STRI POLICY TRENDS UP TO 2018
© OECD 2018
The highest net liberalisations have taken place in some of the sectors that form part of the digital network and the transport and logistics chain. In motion pictures and sound recording, one country has liberalised foreign ownership completely, whereas others have eased the conditions for granting subsidies to film producers and abolished statutory monopolies on copyright management in sound recording. In logistics services, reforms particularly affected customs brokers where conditions on licensing have been lowered in some countries, and in others the customs procedures have been made easier through, for instance, raising the de minimis thresholds and establishing single windows for customs procedures.
In 2017, the largest overall increase in services restrictiveness at the sectoral level was seen in the telecommunications sector. In some countries, foreign suppliers no longer benefit from regulated access and interconnection fees and conditions imposed on local incumbents. Other sectors with high cumulative restrictiveness include some of the physical infrastructure services, such as construction services. In addition, changes in public procurement processes and to the nationality requirements for the boards of directors of construction firms are changes that contributed to increased trade restrictiveness.
Figure 4. Impact of policy changes on the STRI results, 2016-2017
Cumulative changes in results across countries
Source: STRI database (http://oe.cd/stri-db).
-0.15-0.1
-0.050
0.050.1
0.150.2
0.250.3
Mot
ion
pict
ures
Tel
ecom
mun
icat
ions
Sou
nd r
ecor
ding
Com
pute
r se
rvic
es
Bro
adca
stin
g
Cus
tom
bro
kera
ge
Rai
l fre
ight
tran
spor
t
Fre
ight
forw
ardi
ng
Sto
rage
and
war
ehou
sing
Car
go-h
andl
ing
Dis
trib
utio
n se
rvic
es
Roa
d fr
eigh
t tra
nspo
rt
Air
tran
spor
t
Mar
itim
e tr
ansp
ort
Cou
rier
serv
ices
Acc
ount
ing
serv
ices
Com
mer
cial
ban
king
Insu
ranc
e
Lega
l ser
vice
s
Con
stru
ctio
n
Eng
inee
ring
serv
ices
Arc
hite
ctur
e se
rvic
es
Digital network Transport and distribution supply chain Market bridging andsupporting services
Physicalinfrastructure
services
Cumulative trade liberalisations (2016 to 2017) Cumulative trade restrictions (2016 to 2017)

STRI POLICY TRENDS UP TO 2018 │ 9
© OECD 2018
Overall STRI performance in 2017
Figure 5 ranks the overall STRI performance for 44 countries in 2017, based on sectoral results and rankings.1 The trend line depicts the extent to which countries’ indices perform well compared to top sectoral performers, on the one hand, and the entire sample on the other. Closer proximity to the trend line indicates a more balanced performance, whereas a higher position in the line is associated with better overall results.
Figure 5. Overall STRI performance, 2017
Source: STRI database (http://oe.cd/stri-db).
1. Ranks vary from 1 (best performing) to 44 (least performing) for each sector. The variable works in the
following way: country A ranks, for instance, 5th out of 44 countries in sector X, 12th in sector Y, 1st in sector Z, and so on. The variable shows the simple average of these ranks for all 22 sectors.
AUS
AUT BEL BRA
CAN
CHE
CHL
CHN
COL CRI
CZE
DEU
DNK
ESP
EST
FIN
FRA
GBR
GRC
HUN
IDN IND
IRL
ISL ISR
ITA
JPN
KOR
LTU
LUX
LVA
MEX
NLD
NOR
NZL
POL
PRT
RUS
SVK
SVN
SWE
TUR
USA
ZAF
0
5
10
15
20
25
0 5 10 15 20 25 30 35 40 45
Nu
mb
er o
f to
p 1
0 ra
nki
ng
s ac
ross
all
sect
ors
Average ranking
10 │ STRI POLICY TRENDS UP TO 2018
© OECD 2018
Where countries have a high number of well-performing sectors and low average sector ranks, their overall STRI performance increases. In some cases, countries might rank lower on the sectoral average but still have a high number of sectors with low scores, which is the case when indices are low in most but a few sectors (e.g. outlier scores may exist due to a completely closed market in one sector but open across the others).
The top ten countries with the highest overall performance in the 2017 STRI were Latvia, Ireland, Germany, Netherlands, Australia, Lithuania, Denmark, Japan, United Kingdom, and the Czech Republic.
Leading sectoral reformers
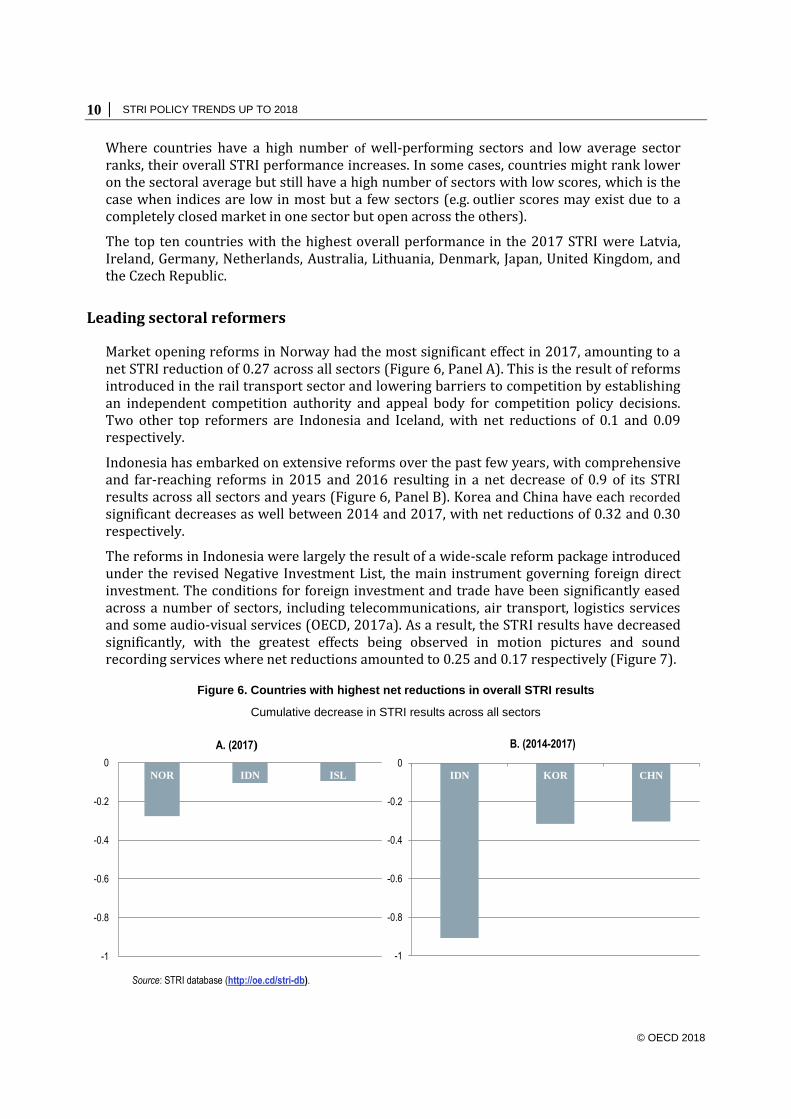
Market opening reforms in Norway had the most significant effect in 2017, amounting to a net STRI reduction of 0.27 across all sectors (Figure 6, Panel A). This is the result of reforms introduced in the rail transport sector and lowering barriers to competition by establishing an independent competition authority and appeal body for competition policy decisions. Two other top reformers are Indonesia and Iceland, with net reductions of 0.1 and 0.09 respectively.
Indonesia has embarked on extensive reforms over the past few years, with comprehensive and far-reaching reforms in 2015 and 2016 resulting in a net decrease of 0.9 of its STRI results across all sectors and years (Figure 6, Panel B). Korea and China have each recorded significant decreases as well between 2014 and 2017, with net reductions of 0.32 and 0.30 respectively.
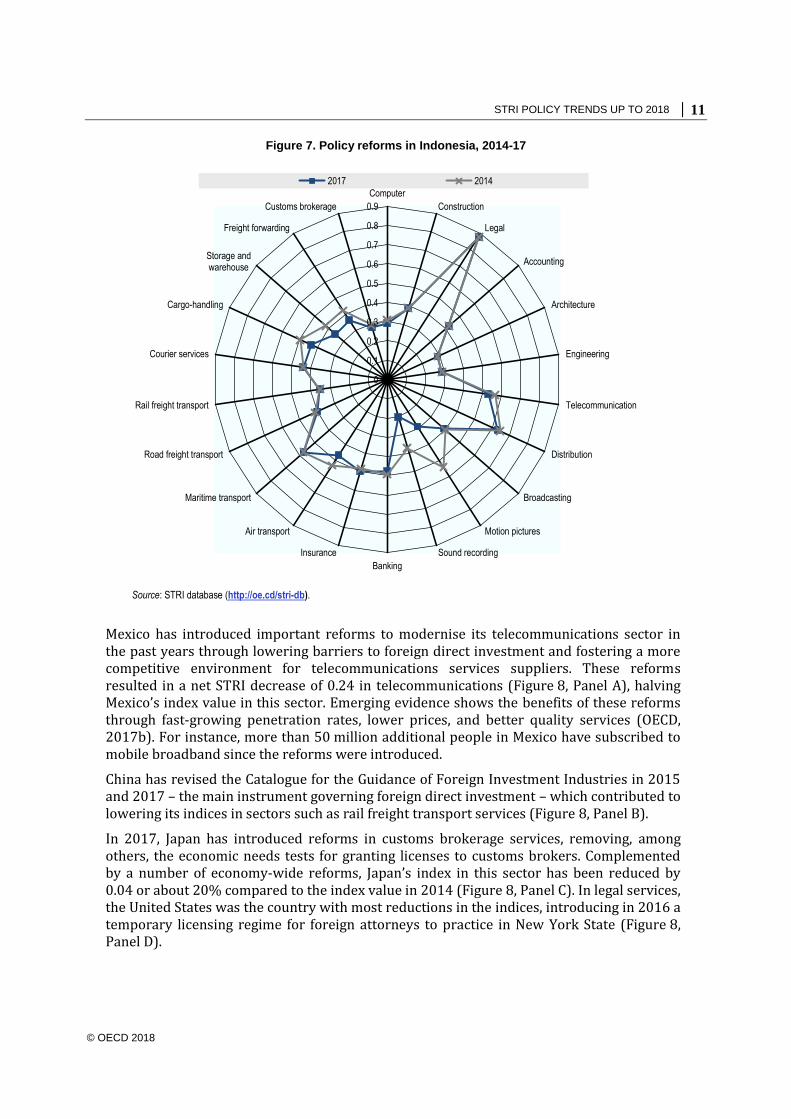
The reforms in Indonesia were largely the result of a wide-scale reform package introduced under the revised Negative Investment List, the main instrument governing foreign direct investment. The conditions for foreign investment and trade have been significantly eased across a number of sectors, including telecommunications, air transport, logistics services and some audio-visual services (OECD, 2017a). As a result, the STRI results have decreased significantly, with the greatest effects being observed in motion pictures and sound recording services where net reductions amounted to 0.25 and 0.17 respectively (Figure 7).
Figure 6. Countries with highest net reductions in overall STRI results
Cumulative decrease in STRI results across all sectors
Source: STRI database (http://oe.cd/stri-db).
-1
-0.8
-0.6
-0.4
-0.2
0NOR IDN ISL
A. (2017)
-1
-0.8
-0.6
-0.4
-0.2
0IDN KOR CHN
B. (2014-2017)
STRI POLICY TRENDS UP TO 2018 │ 11
© OECD 2018
Figure 7. Policy reforms in Indonesia, 2014-17
Source: STRI database (http://oe.cd/stri-db).
Mexico has introduced important reforms to modernise its telecommunications sector in the past years through lowering barriers to foreign direct investment and fostering a more competitive environment for telecommunications services suppliers. These reforms resulted in a net STRI decrease of 0.24 in telecommunications (Figure 8, Panel A), halving Mexico’s index value in this sector. Emerging evidence shows the benefits of these reforms through fast-growing penetration rates, lower prices, and better quality services (OECD, 2017b). For instance, more than 50 million additional people in Mexico have subscribed to mobile broadband since the reforms were introduced.
China has revised the Catalogue for the Guidance of Foreign Investment Industries in 2015 and 2017 – the main instrument governing foreign direct investment – which contributed to lowering its indices in sectors such as rail freight transport services (Figure 8, Panel B).
In 2017, Japan has introduced reforms in customs brokerage services, removing, among others, the economic needs tests for granting licenses to customs brokers. Complemented by a number of economy-wide reforms, Japan’s index in this sector has been reduced by 0.04 or about 20% compared to the index value in 2014 (Figure 8, Panel C). In legal services, the United States was the country with most reductions in the indices, introducing in 2016 a temporary licensing regime for foreign attorneys to practice in New York State (Figure 8, Panel D).
0
0.1
0.2
0.3
0.4
0.5
0.6
0.7
0.8
0.9
Computer
Construction
Legal
Accounting
Architecture
Engineering
Telecommunication
Distribution
Broadcasting
Motion pictures
Sound recording
Banking
Insurance
Air transport
Maritime transport
Road freight transport
Rail freight transport
Courier services
Cargo-handling
Storage andwarehouse
Freight forwarding
Customs brokerage
2017 2014

12 │ STRI POLICY TRENDS UP TO 2018
© OECD 2018
Figure 8. Leading sectoral reformers
Cumulative decrease in STRI results between 2014 and 2017, in selected sectors
Source: STRI database (http://oe.cd/stri-db).
References
OECD (2017a), Services Trade Policies and the Global Economy, OECD Publishing, Paris. http://dx.doi.org/10.1787/9789264275232-en
OECD (2017b), OECD Telecommunication and Broadcasting Review of Mexico 2017, OECD Publishing, Paris. http://dx.doi.org/10.1787/9789264278011-en
-0.25
-0.2
-0.15
-0.1
-0.05
0
MEX ISR IDN
A. Telecommunications services
-0.25
-0.2
-0.15
-0.1
-0.05
0
CHN NOR BEL
B. Rail freight transport services
-0.25
-0.2
-0.15
-0.1
-0.05
0
JPN CHL IDN
C. Logistics - customs brokerage
-0.25
-0.2
-0.15
-0.1
-0.05
0
USA KOR SWE
D. Legal services

STRI POLICY TRENDS UP TO 2018 │ 13
© OECD 2018
STRI online tools
The STRI Internet page is a single window to the STRI regulatory database, interactive tools such as Compare Your Country and Policy Simulator, methodological notes, and links to analytical OECD Trade Policy Papers on services trade.
Compare your country (http://oe.cd/stri-cyc)
Policy simulator (http://sim.oecd.org/)
The STRI analytical findings, presented in Services Trade Policies and the Global Economy, demonstrate the potential gains from strategic regulatory reforms such as:
Scaling back restrictions on foreign entry and barriers to the movement of professionals that discriminate against foreign services providers.
Adopting strategic reforms across a spectrum of trade, investment and competition policies to facilitate trade in services.
Targeting bottlenecks in transportation and logistics services to reduce trade costs.
This interactive website can be used to compare services trade restrictiveness across 22 sectors in 44 OECD countries and partner economies. Key economic indicators are projected onto a world map to give a comparative view of the importance of services in the countries covered by the STRI.
The policy simulator provides all STRI information by country and by sector. It can be used to understand how the STRI indices are calculated, to analyse the contribution of each policy measure to the index, to compare countries in detail, and to simulate the impact of a policy change on the index value. Simulations can be saved and shared with other users, and the relevant data can be downloaded.
More information

14 │ STRI POLICY TRENDS UP TO 2018
© OECD 2018
Online STRI regulatory database (http://oe.cd/stri-db)
STRI Composite Indices at OECD.Stat (http://oe.cd/stri-stat) STRI mobile application (available for iOS and Android devices)
John Drummond Hildegunn Kyvik Nordås Head, Trade in Services Division Senior Trade Policy Analyst ([email protected]) ([email protected])
OECD Services Trade Restrictiveness Index http://oe.cd/stri OECD STRI sector notes and papers http://oe.cd/stri-sectors
OECD Trade and Agriculture Directorate http://www.oecd.org/tad Sign-up for OECD e-mail alerts http://www.oecd.org/OECDdirect
For further information contact:
The online STRI regulatory database displays complete and up-to-date regulatory information collected for the sector composite indices. This qualitative database contains information on trade restrictions and behind-the-border regulations in the 22 STRI services sectors. The database entries are documented with reference to the sources (title and articles of the relevant law), with an internet link to each legal source.
The STRI indices are easily accessed and extracted from OECD.Stat (under the heading: Industry and Services, subheading: Services Trade Restrictions). In addition to the five policy areas, the indices are presented by four additional classifications: GATS market access/national treatment and domestic regulation/other, GATS modes of supply, Discriminatory versus non-discriminatory measures, Firm’s establishment versus on-going operations. The indices of regulatory heterogeneity based on the same information included in the STRI regulatory database are also available under this section.
This mobile application features an integrated policy simulator function with downloadable data for offline use. Built-in quick links guide users to other STRI tools and materials. The application is available on Apple’s App Store and Google Play Store.

STRI POLICY TRENDS UP TO 2018 │ 15
© OECD 2018
Annex I
Policy Changes Across Countries
This annex presents some of the main policy changes identified in the annual STRI updates for the countries covered. Detailed country information can be found on the STRI website and online database.2
Australia
In June 2016, New South Wales introduced a 4% surcharge for foreign persons (including foreign corporations) in addition to the duty payable on the purchase of residential property. Furthermore, foreigners are also subject to a land tax surcharge of 0.75% (in 2017) for residential property.
Austria
As of October 2017, a new permit for intra-corporate transferees is available for non-EU/EEA nationals. The period of validity has been extended from one to three years for managers and specialists. Moreover, the Federal Ministry for Labour, Social Affairs and Consumer Protection may, by regulation, fix quotas for the employment of non-EU/EEA intra-corporate transferees. In the telecommunications sector, parts of the fixed line telephony market have been deregulated in May 2017.
Belgium
B Logistics, one of the main rail freight operators in Belgium, was partly privatised in 2015. The state-owned Belgian national railway company, SNCB, now owns only 31% of its equity shares.
Brazil
The Federal Supreme Court ruled in 2015 to exempt the designated postal operator from VAT and other local taxes for both its postal and courier services.
Canada
As of June 2017, the investment review threshold under the Investment Canada Act was raised to CAD 1 billion in enterprise value for investors wishing to directly acquire control of a Canadian business. This applied to: (1) WTO investors that are not state-owned enterprises; and (2) by non-WTO investors that are not state-owned enterprises whereas the Canadian business that is the subject of the investment is, immediately prior to the implementation of the investment, "controlled by a WTO investor".
Chile
In 2017, Chile revised its customs regulation, introducing, inter alia, an Authorised Economic Operators Scheme open to foreign firms, and authorising the release of goods before the determination and payment of duties.
2. Available at http://oe.cd/stri.

16 │ STRI POLICY TRENDS UP TO 2018
© OECD 2018
China, People’s Republic of
The 2015 revision of the Catalogue for the Guidance of Foreign Investment Industries – the main instrument governing foreign direct investment in China – eased investment conditions in key service sectors such as distribution and rail freight transport services. In telecommunications services, China introduced regulations in 2015 on number portability and interconnection in fixed line. It also revised the Telecom Business Classification Catalogue, which since 2016 mandates the resale of mobile communication services. In September 2016, the general requirement for prior approval of foreign investments was replaced with an online notification requirement. The Catalogue for the Guidance of Foreign Investment Industries is updated every two to five years, the most recent entering into effect in June 2017. The new Catalogue introduced a negative list approach, lifting investment screening in sectors not covered in the Catalogue. A new Cybersecurity Law entered into effect in 2017, introducing new conditions affecting data transfers abroad.
Colombia
Since 2015, the Financial Superintendence has been financially autonomous. In 2016, the New Customs Statute (Nuevo Estatuto Aduanero) introduced a de minimis regime imposing minimum warehouse surface requirements for postal operators, and an obligation for courier services operators to be available 24/7.
Costa Rica
In 2017, Costa Rica ratified the United Nations Convention on Contracts for the International Sale of Goods, which aligned national contract rules for cross-border transaction to internationally standardised rules.
Czech Republic
As of April 2017, the Regulatory Body for Access to Transport Infrastructure (Úřad pro přístup k dopravní infrastruktuře) has been established as an independent regulator to oversee access to the rail infrastructure for rail transport operators.
Denmark
There are no significant policy changes that affect the score of the STRI during the period 2014-2017.
Estonia
In 2017, foreign workers were subject to wage parity requirements. In 2015, rules were introduced to improve the enforcement of copyright in the digital environment.
Finland
A major state-owned construction enterprise, Destia, was privatised in 2014. In the distribution sector, shop opening hours were deregulated in 2015, and labelling standards reformed in 2016.
France
In 2016, the labour market test for intra-corporate transferees was removed. However, a transport company established outside of France and seeking to provide cross-border transport services to France must submit a notification to the labour inspectorate where the service will be provided (Déclaration préalable de détachement transnational). Moreover, as of 2016, only licensed professionals can hold shares in auditing firms.

STRI POLICY TRENDS UP TO 2018 │ 17
© OECD 2018
Germany
There are no significant policy changes that affect the score of the STRI during the period 2014-2017.
Greece
There are no significant policy changes that affect the score of the STRI during the period 2014-2017.
Hungary
Since 2015, Hungary applies quotas on work permits for natural persons with non-EU nationalities working on a temporary basis in the country. Such work permits are required for services suppliers as well. As of 2016, intra-corporate transferees from third countries can stay in Hungary for up to 12 months on their initial permits.
Iceland
Temporary capital controls introduced following the financial crisis have been gradually lifted and the remaining controls relevant for services trade were lifted in 2016. Iceland has also reformed its copyright enforcement regime, abolishing a statutory monopoly in copyright management in sound recording, and aligning its regulation of copyright management and subsidies in the film industry with EU directives. Deregulation of mobile telecommunications services took effect in 2017. On the other hand, new restrictions on movement of people were introduced in 2017, limiting access for contractual services providers to education and R&D activities, and introducing an obligation to purchase local health insurance as a condition for obtaining work permits for intra-corporate transferees and independent services providers.
India
In 2015 India lifted foreign equity limits from 26% to 49% in the insurance sector and foreign branches were permitted in the reinsurance field. Further investment liberalisation took place in 2016 when foreign equity limits were removed for airport services, and cable and satellite broadcasting and foreign equity limits were eased in civil aviation. Minimum capital requirements for establishing a company were eliminated in most sectors in 2016. On the other hand, India introduced an equalization levy of 6% on purchases of advertising services from non-resident companies in 2017.
Indonesia
Indonesia has fully or partially opened several sectors to foreign investment under the 2016 Negative Investment List.3 These include air freight transport, logistics services, telecommunications, audio-visual services, architecture and engineering services. Minimum capital requirements were removed in 2016. In 2017, more favourable conditions for the release of imported goods before determination and payment of duties have benefitted distribution, courier and logistic services. In the same year, Indonesia revoked minimum capital requirements for maritime transport service. However, the Construction Act of 2017 imposed nationality requirements on the management of construction and architecture companies.
3. Daftar bidang usaha yang tertutup dan bidang usaha yang terbuka dengan persyaratan di bidang penanaman modal, Government Regulation No. 44/2016, available at: http://peraturan.bkpm.go.id/jdih/front/form/19133

18 │ STRI POLICY TRENDS UP TO 2018
© OECD 2018
Ireland
In 2016, Ireland introduced a time frame of six months within which the Central Bank of Ireland, the sector regulator, must decide on applications for authorisation to provide insurance services.
Israel
In 2016, the Capital Market, Insurance and Savings Authority, the sector regulator for insurance services, was made independent from the Ministry of Finance. In commercial banking, the residency requirement for two-thirds of the board members of banks was lifted in 2017.
Italy
In 2017, Italy implemented the EU Directive regarding intra-corporate transferees from outside the European Union. Accordingly, the maximum duration of stay for intra-corporate transfers was changed to 36 months for managers and specialists.
Japan
In 2017, Japan amended Customs Business Act by removing the economic needs test. Customs brokerage firms are no longer required to place at least one qualified customs specialist in each office.
Korea
The requirement that foreign investors transfer stocks to Korean national(s) within six months in cases where their registration is cancelled was lifted in 2015. Restrictions on internet banking were also lifted. Conversely, a requirement that only licensed architects may establish an architectural firm was introduced that same year.
Latvia
As of January 2017, the fixed telecommunication market segment has been deregulated.
Lithuania
Since September 2016, Lithuania no longer applies a labour market test for contractual service suppliers staying in the country for less than 12 months. As of June 2017, the market for fixed telephony has been deregulated. That same year, foreign professionals are no longer required to take a local exam to become a licensed auditor.
Luxembourg
Since December 2015, approval to establish a branch may be refused if reciprocity for Luxembourg companies is not guaranteed by the national law of the foreign investor.
Mexico
In recent years, Mexico has passed a series of reforms, including, inter alia, a new telecommunications and broadcasting law, and a new financial law. The telecommunications reforms eased foreign participation in the mobile and fixed-line services segments of the sector. It also introduced a new independent regulator, with exclusive authority over the sector and new sanctioning powers, as well as a series of pro-competitive measures challenging the dominant position of incumbent firms. The financial reform aimed to strengthen prudential regulation, increase credit penetration and promote competition. As a result, foreign financial institutions can now open branches in Mexico to provide insurance services. Although this possibility is still subject to

STRI POLICY TRENDS UP TO 2018 │ 19
© OECD 2018
government authorisation, and granted on the basis of reciprocity, it nevertheless increases certainty and clarity on the regulatory environment in the sector. In 2015, Mexico established an independent rail regulatory agency. In 2017, Mexico rolled back the foreign equity restrictions on domestic air transport services; foreign ownership of air companies is now permitted up to 49%.
Netherlands
There are no significant policy changes that affect the score of the STRI during the period 2014-2017.
New Zealand
In May 2015, the Companies Act 1993 was amended to require all companies to have at least one director domiciled in New Zealand or an “enforcement country” (currently only Australia). A temporary ban on the parallel importation of films for commercial sale for a period of five months from the film’s international release ended on 31 October 2016.
Norway
In 2016, Norway eliminated the postal monopoly for letters in courier services. Pro-competitive regulations overseen by an independent regulator was introduced in the rail freight sector in 2017. By the same token the competition authority can no longer be instructed by the government on individual cases or on the general interpretation of competition laws, and its decisions can be appealed to a newly established independent body.
Poland
There are no significant policy changes that affect the score of the STRI during the period 2014-2017.
Portugal
Portugal privatised CP Carga, the former public rail freight transporter and cargo-handler, in 2015. It has also taken steps to ensure the independence of the insurance regulator. The liberalisation in architecture services in 2015 repealed a reciprocity requirement for admission to the Portuguese Order of Architects, which is a prerequisite to practice in the country. However, a reciprocity requirement was introduced for the Order of Portuguese Engineers and the Order of Portuguese Technical Engineers.
Russian Federation
In 2015, a new legal requirement came into force requiring that certain personal data collected in the Russian Federation be stored on local servers. In 2016, the Russian Federation introduced limitations on foreign participation in the total authorised capital of credit institutions, and lowered the threshold for foreign equity allowed in broadcasting companies. As of 2017, certain subsidies granted for the acquisition of rail transport equipment cannot be granted to foreign entities.
Slovak Republic
In courier services, a pro-competitive dispute settlement mechanism, under the auspices of the regulatory authority, was introduced in 2016.

20 │ STRI POLICY TRENDS UP TO 2018
© OECD 2018
Slovenia
Slovenia adopted a new Collective Management of Copyright and Related Rights Act in 2016, in which conditions for membership in a collective copyright management body are based on objective, transparent and non-discriminatory rules.
South Africa
South Africa eliminated quotas for contractual services suppliers and independent services suppliers. It repealed labour market tests for intra-corporate transferees in 2014.
Spain
Since 2014, labour market tests have been lifted for contractual services suppliers. At the same time, their maximum duration of stay was extended from 12 to 24 months. In 2014, the duration of stay for intra-corporate transferees and independent services suppliers was shortened from 60 to 36 months and 24 months, respectively.
Sweden
Fixed line telephony was deregulated in 2017, following a market analysis by the regulator which found the sector to be competitive.
Switzerland
There are no significant policy changes that affect the score of the STRI during the period 2014-2017.
Turkey
In 2015, Turkey adopted a regulation implementing the 2013 Law on Liberalisation of the Turkish Rail Transport. The new regulation paved the way for operationalising the reforms prepared for the rail transport sector. In 2016, Turkey adopted a new law on the protection of personal data.
United Kingdom
A cap on contractual interest rates for short-term credit was implemented in January 2015. As of 2017, under the new Immigration Skills Charge Regulations, a sponsor must pay a fee of GBP 1 000 per year to the Secretary of State each time it assigns a certificate of sponsorship to a non-EEA skilled worker (Tier 2). Smaller employers pay GBP 364 per year and certain exemptions may be granted.
United States of America
Since 2016, foreign attorneys can obtain a temporary authorisation to practice law in New York. As of July 2016, foreign banks with USD 50 billion or more in US assets must form a US intermediate holding company (IHC) to act as the parent company of all of the foreign bank’s US subsidiaries. In 2016, the threshold for de minimis regime on custom duties for imported merchandise was raised to USD 800.

STRI POLICY TRENDS UP TO 2018 │ 21
© OECD 2018
Annex II
STRI Indices by sector
The digital network
Figure A.1. Telecommunications services, 2017
Figure A.2. Television and broadcasting services, 2017
0
0.1
0.2
0.3
0.4
0.5
0.6
Restrictions on foreign entry Restrictions to the movement of people Other discriminatory measures
Barriers to competition Regulatory transparency Average
STRI 2014
0
0.1
0.2
0.3
0.4
0.5
0.6
0.7
Limitations on foreign entry Limitations on the movement of people Other discriminatory measures
Barriers to competition Regulatory transparency Average
STRI 2014

22 │ STRI POLICY TRENDS UP TO 2018
© OECD 2018
Figure A.3. Motion pictures services, 2017
Figure A.4. Sound recording services, 2017
0
0.1
0.2
0.3
0.4
0.5
0.6
Limitations on foreign entry Limitations on the movement of people Other discriminatory measures
Barriers to competition Regulatory transparency Average
STRI 2014
0
0.1
0.2
0.3
0.4
0.5
Limitations on foreign entry Limitations on the movement of people Other discriminatory measures
Barriers to competition Regulatory transparency Average
STRI 2014

STRI POLICY TRENDS UP TO 2018 │ 23
© OECD 2018
Figure A.5. Computer services, 2017
The transport and distribution supply chain
Figure A.6. Air transport services, 2017
00.050.1
0.150.2
0.250.3
0.350.4
0.450.5
Restrictions on foreign entry Restrictions to the movement of people Other discriminatory measures
Barriers to competition Regulatory transparency Average
STRI 2014
0
0.1
0.2
0.3
0.4
0.5
0.6
0.7
Restrictions on foreign entry Restrictions to the movement of people Other discriminatory measures
Barriers to competition Regulatory transparency Average
STRI 2014

24 │ STRI POLICY TRENDS UP TO 2018
© OECD 2018
Figure A.7. Maritime transport services, 2017
Figure A.8. Rail freight transport services, 2017
0
0.1
0.2
0.3
0.4
0.5
0.6
Restrictions on foreign entry Restrictions to the movement of people Other discriminatory measures
Barriers to competition Regulatory transparency Average
STRI 2014
0
0.1
0.2
0.3
0.4
0.5
0.6
0.7
0.8
0.9
1
Restrictions on foreign entry Restrictions to the movement of people Other discriminatory measures
Barriers to competition Regulatory transparency Average
STRI 2014
STRI POLICY TRENDS UP TO 2018 │ 25
© OECD 2018
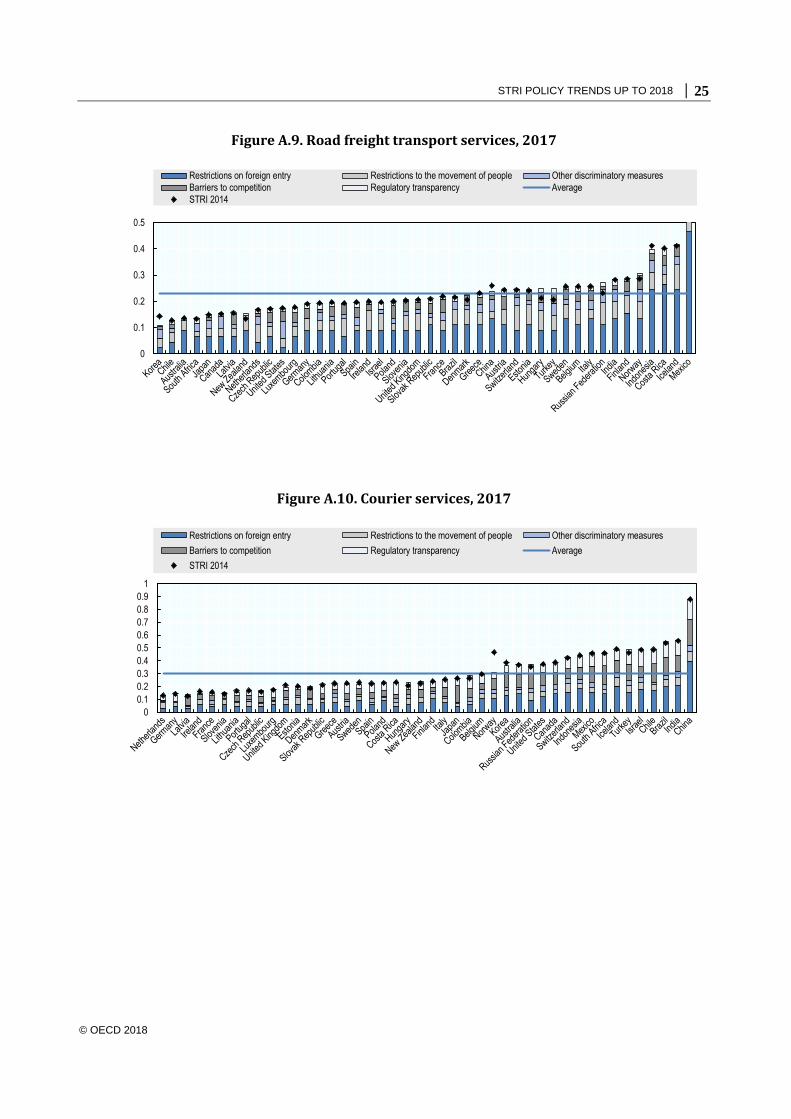
Figure A.9. Road freight transport services, 2017
Figure A.10. Courier services, 2017
0
0.1
0.2
0.3
0.4
0.5
Restrictions on foreign entry Restrictions to the movement of people Other discriminatory measures
Barriers to competition Regulatory transparency Average
STRI 2014
0
0.1
0.2
0.3
0.4
0.5
0.6
0.7
0.8
0.9
1
Restrictions on foreign entry Restrictions to the movement of people Other discriminatory measures
Barriers to competition Regulatory transparency Average
STRI 2014

26 │ STRI POLICY TRENDS UP TO 2018
© OECD 2018
Figure A.11. Distribution services, 2017
Figure A.12. Logistics cargo-handling services, 2017
0
0.1
0.2
0.3
0.4
0.5
0.6
0.7
Restrictions on foreign entry Restrictions to the movement of people Other discriminatory measures
Barriers to competition Regulatory transparency Average
STRI 2014
0
0.1
0.2
0.3
0.4
0.5
0.6
0.7
0.8
0.9
1
Restrictions on foreign entry Restrictions to the movement of people Other discriminatory measures
Barriers to competition Regulatory transparency Average
STRI 2014

STRI POLICY TRENDS UP TO 2018 │ 27
© OECD 2018
Figure A.13. Logistics storage and warehouse services, 2017
Figure A.14. Logistics freight forwarding services, 2017
0
0.1
0.2
0.3
0.4
0.5
0.6
0.7
0.8
0.9
1
Restrictions on foreign entry Restrictions to the movement of people Other discriminatory measures
Barriers to competition Regulatory transparency Average
STRI 2014
0
0.05
0.1
0.15
0.2
0.25
0.3
0.35
0.4
0.45
0.5
Restrictions on foreign entry Restrictions to the movement of people Other discriminatory measures
Barriers to competition Regulatory transparency Average
STRI 2014

28 │ STRI POLICY TRENDS UP TO 2018
© OECD 2018
Figure A.15. Logistics customs brokerage services, 2017
Market bridging and supporting services
Figure A.16. Commercial banking services, 2017
0
0.1
0.2
0.3
0.4
0.5
0.6
0.7
0.8
0.9
1
Restrictions on foreign entry Restrictions to the movement of people Other discriminatory measures
Barriers to competition Regulatory transparency Average
STRI 2014
0
0.1
0.2
0.3
0.4
0.5
0.6
Restrictions on foreign entry Restrictions to the movement of people Other discriminatory measures
Barriers to competition Regulatory transparency Average
STRI 2014

STRI POLICY TRENDS UP TO 2018 │ 29
© OECD 2018
Figure A.17. Insurance services, 2017
Figure A.18. Legal services, 2017
0
0.1
0.2
0.3
0.4
0.5
0.6
Restrictions on foreign entry Restrictions to the movement of people Other discriminatory measures
Barriers to competition Regulatory transparency Average
STRI 2014
0
0.1
0.2
0.3
0.4
0.5
0.6
0.7
0.8
0.9
1
Restrictions on foreign entry Restrictions to the movement of people Other discriminatory measures
Barriers to competition Regulatory transparency Average
STRI 2014
30 │ STRI POLICY TRENDS UP TO 2018
© OECD 2018
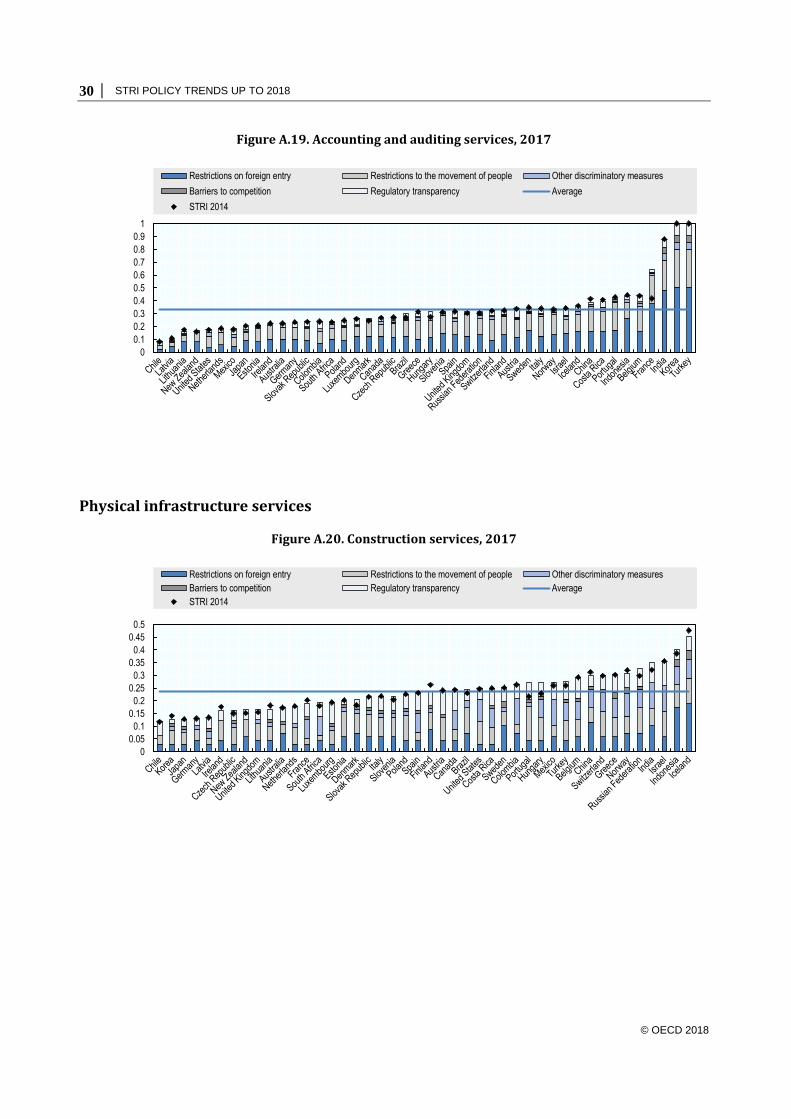
Figure A.19. Accounting and auditing services, 2017
Physical infrastructure services
Figure A.20. Construction services, 2017
0
0.1
0.2
0.3
0.4
0.5
0.6
0.7
0.8
0.9
1
Restrictions on foreign entry Restrictions to the movement of people Other discriminatory measures
Barriers to competition Regulatory transparency Average
STRI 2014
0
0.05
0.1
0.15
0.2
0.25
0.3
0.35
0.4
0.45
0.5
Restrictions on foreign entry Restrictions to the movement of people Other discriminatory measures
Barriers to competition Regulatory transparency Average
STRI 2014

STRI POLICY TRENDS UP TO 2018 │ 31
© OECD 2018
Figure A.21. Architecture services, 2017
Figure A.22. Engineering services, 2017
0
0.1
0.2
0.3
0.4
0.5
0.6
0.7
Restrictions on foreign entry Restrictions to the movement of people Other discriminatory measures
Barriers to competition Regulatory transparency Average
STRI 2014
0
0.05
0.1
0.15
0.2
0.25
0.3
0.35
0.4
0.45
0.5
Restrictions on foreign entry Restrictions to the movement of people Other discriminatory measures
Barriers to competition Regulatory transparency Average
STRI 2014

OECD Services Trade Restrictiveness Index: Policy trends up to 2018
January 2018 http://oe.cd/stri