Embed Size (px)
Citation preview

85
LOW
ER M
ISSI
SSIP
PI D
ELTA
LOWER MISSISSIPPI DELTA
86 TAKING STOCK
Figure 1
LOWER MISSISSIPPI DELTA REGION
*Unless otherwise noted, these data are derived from HAC tabulations of the 2010 U.S. Census of Population or the American Community Survey 2005-2009 Five Year Estimates.
LOWER MISSISSIPPI DELTA*
In early May 2011, a levee was blown up along the Mississippi River to save Cairo, Il-linois, from an impending flood caused by torrential storms that had been impacting the region for weeks. Water levels had been rising dangerously high and threatened to overwhelm small communities along the river. In destroying the levee and saving the town, thousands of acres of valuable farmland were flooded, crops were destroyed, and fields
were left unusable for the foreseeable future. Over the next few weeks, emergency person-nel opened several other levees along the Mississippi River, bringing high water levels to rural parts of the Mississippi Delta to protect the region’s population centers.1
The resolution to this emergency highlights the incred-ible connection and tension that exist between the land and the people of the Lower Mississippi Delta. The fertile Delta region has been both shaped and named by the mighty river that runs through it. For generations, the

87HIGH POVERTY RURAL AREAS AND POPULATIONS IN THE UNITED STATES
LOW
ER M
ISSI
SSIP
PI D
ELTA
RURAL DELTA DELTA UNITED STATES
Population 4,556,880 8,922,311 301,461,533
Black or African-American Population 24.4% 30.9% 12.4%
Poverty Rate 21.9% 19.7% 13.5%
Population Living in Small Town/Rural 100% 50.8% 21.2%
Homeownership 70.9% 68.0% 66.9%
Source: HAC Tabulations of the American Community Survey 2005-2009 Five-Year Estimates
Table 1. LOWER MISSISSIPPI DELTA QUICK FACTS
land has provided a way of life that has meant different things to different people. For some, these resources have brought economic prosperity and for others, economic exploitation. The result is a land of two distinct cultures: one refl ecting the interests and needs of the haves and one for the have-nots. It is a region that still bears the legacy of a deep racial divide and clearly illustrates the irony of extreme poverty in a land of abundant riches.
Many efforts have been made to address the economic and community development needs of the Mississippi Delta region. In 1988, Congress authorized the creation of the Lower Mississippi Delta Commission to inves-tigate the social, political, and economic conditions of this region and propose recommendations to bring about change and an improvement in conditions in the region. The commission ultimately recommended a series of actions around human capital, social, econom-ic, and community development.2 Authorized under the Delta Regional Authority Act of 2000, the Delta Regional Authority (DRA) was created to provide a unifi ed, regional approach to economic and community development in the region. The DRA has crafted a Re-gional Development Plan that proposes an investment strategy to help the region grow and prosper.3
Whether these proposed actions have improved or will improve conditions in the Delta is the subject of much debate by the many stakeholders across the region.4 Evidence shows simultaneous progress and inertia. Ma-jor manufacturing plants have opened in communities across the region and renewed interest in the region’s history and culture have led to increased tourism to plantations, battlefi elds, and museums.5 With almost
one-fi fth of the region’s population in poverty, however, the region’s residents continue to experience some of the most pressing social, economic, and community development needs in the country.
Added to the ongoing economic and social struggles that have plagued the region, the Delta has been hard hit by a number of natural and manmade disasters. From hur-ricanes Katrina, Rita, and Gustav in the mid-2000s to the numerous tornados and storms that touched down in the region, these natural disasters have devastated communities and tested the resolve of Delta residents. The 2010 Gulf oil spill, and the resulting moratorium on drilling, have had untold environmental and economic impacts. Despite these changes and the uncertainty wrought on the people and the land, the residents still demonstrate a sense of permanency; in the face of ad-versity, the people are still resilient.
DEFINING THE DELTA
The Mississippi Delta is a region both romanticized and reviled in great American literature. Writers including William Faulkner and Eudora Welty have shared the complexities of life in the Mississippi Delta. As defi ned by the federally sanctioned Lower Mississippi Delta Commission, the Lower Mississippi Delta (LMD) region is comprised of 219 counties and parishes in portions of Arkansas, Louisiana, Mississippi, Missouri, Illinois, Tennessee, and Kentucky. Technically, the region is not a delta but a 200-mile plain that covers more than 90,000 miles of rivers and streams and more than 3 million acres of some of the most fertile land in the na-
88 TAKING STOCK
tion. This fertile land gave birth to an economy, a music form, and a people that are all inextricably linked.
The Mississippi Delta region is both rural and urban. It includes major southern cities, such as New Orleans, Louisiana, with more than 400,000 residents, as well as small hamlets, such as Hot Coffee, Mississippi, with a population of less than 7,500 people. These seemingly separate communities have differing needs and differ-ing levels of access to resources, but they are connected geographically, historically, and economically.
SOCIAL CHARACTERISTICS
The counties within the Lower Mississippi Delta are bound together not only through geographical proxim-ity, but also by a common cultural history and debilitat-ing racial legacy. With a population of more than 8.9 million people, the LMD is more populated than 41 states. More than one-half (51 percent or 4.5 million) of all LMD residents live in rural areas, 36.8 percent (3.3 million) live in suburban communities, and 12.2 percent (1.1 million) in urban areas.
While the nation’s population has grown by more than 9.7 percent over the last decade, the population of the LMD remained virtually unchanged from 2000 to 2009. More than one-half of all LMD counties (59 percent) lost population from 2000 to 2009. Overall, the population grew by 102,000 people or 1 percent over the decade. This stagnant population rate is a refl ection of the health and well-being of Delta resi-dents, the impact of natural disasters that have driven residents away from their communities, and the limited opportunities the region provides for its young residents.
The region has some of the highest mortality and low-est birth rates in the nation.6 Many Delta communi-ties have soaring rates of diabetes, hypertension, and stroke, conditions that are connected to the region’s low birth rates. More than one-half (58.9 percent) of the Delta’s counties have experienced dramatic population loss. While a signifi cant amount of the population loss occurred in Louisiana parishes that were hard hit by a series of hurricanes, counties throughout the region have experienced similar losses. From 2000 to 2009, Delta counties and parishes that experienced a popula-tion loss did so at a rate of 7 percent.
In an analysis of migration patterns in the Mississippi Delta, researchers found that the greatest out-migra-tion rates among higher educated young people in the Delta are reported in the region’s rural communi-ties.7 Whereas highly educated Delta residents living in urban centers (e.g., Jackson, New Orleans) tend to remain in their communities, highly educated rural residents are more likely to migrate to other commu-nities in search of jobs and opportunities. Young and educated people are leaving the community in search of greater opportunities, while the less educated and elderly remain.
While educational attainment is a laudable goal, it represents a double-edged sword for many rural Delta communities. Increasing educational opportu-nities is an important public investment as it builds community resources that can strengthen the com-munity’s economy; however, without job opportuni-ties to support this newly educated population, the community ultimately loses this vital resource. Rural Delta communities have made some strides in terms of education, as 76.5 percent of rural residents have a high school diploma and 14.2 percent have earned a bachelor’s or higher degree.
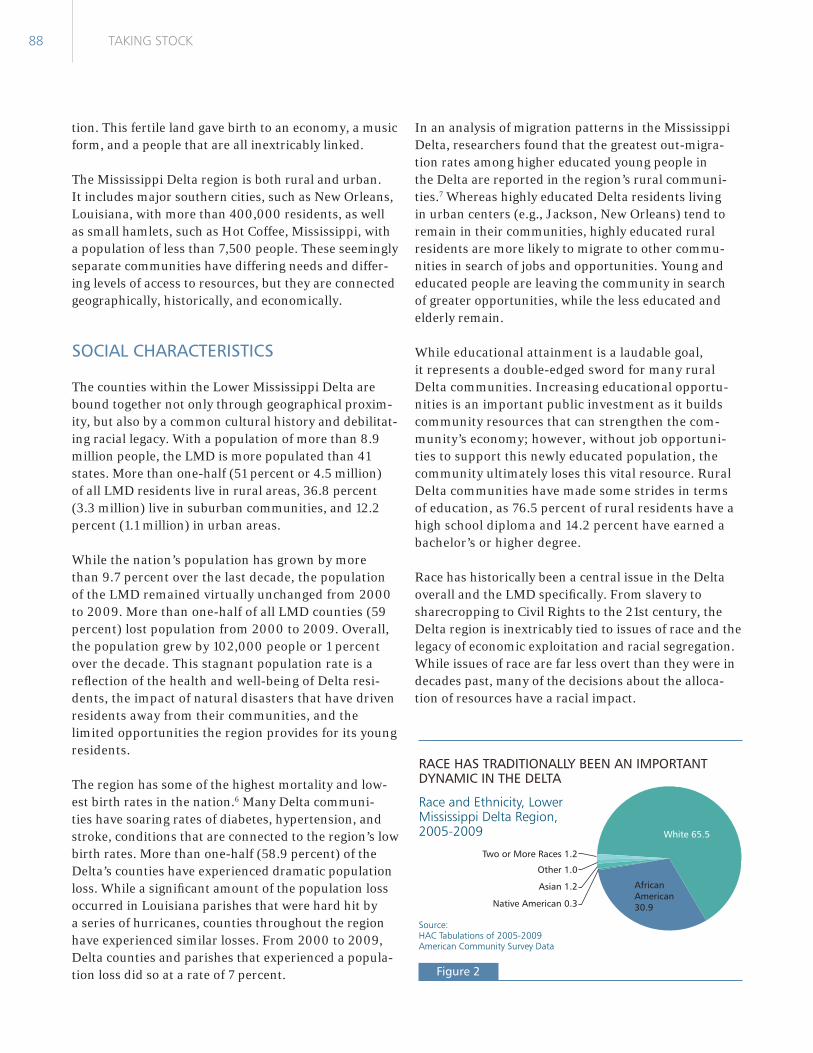
Race has historically been a central issue in the Delta overall and the LMD specifi cally. From slavery to sharecropping to Civil Rights to the 21st century, the Delta region is inextricably tied to issues of race and the legacy of economic exploitation and racial segregation. While issues of race are far less overt than they were in decades past, many of the decisions about the alloca-tion of resources have a racial impact.
Figure 2
RACE HAS TRADITIONALLY BEEN AN IMPORTANT DYNAMIC IN THE DELTA
Race and Ethnicity, Lower Mississippi Delta Region, 2005-2009
Source: HAC Tabulations of 2005-2009 American Community Survey Data
Native American 0.3
Asian 1.2
Other 1.0
Two or More Races 1.2
White 65.5
African American 30.9

89HIGH POVERTY RURAL AREAS AND POPULATIONS IN THE UNITED STATES
LOW
ER M
ISSI
SSIP
PI D
ELTA
Overall, almost two-thirds (63.8 percent) of the region’s population is white non-Hispanic and 30.9 percent is African American. The rural LMD, however, has a much larger white population (74 percent) and a smaller African-American population (23 percent).
Although whites constitute the majority population in the LMD region, in many counties throughout the region they are in the minority. For example, in 16 Mis-sissippi counties African Americans exceed 60 percent of the population; the same is the case in the Louisiana parishes of Orleans (62.3 percent) and East Carroll (67.6 percent) as well as in Phillips County, Arkansas (61.5 percent). Many of these majority minority coun-ties are also among the poorest counties in the region and the nation.
The Hispanic population has grown slightly, from 2.0 percent in 2000 to 2.8 percent in 2009. Local stake-holders have noted that in certain parts of the region, Hispanic residents have been drawn to jobs in the food processing industry, contributing to the growth in this ethnic group.8 Additionally, many of the workers who migrated to the Gulf region after Hurricane Katrina to aid in the cleanup and construction were Hispanic.
ECONOMIC CHARACTERISTICS
The LMD is a site of widespread economic distress, exacerbated by anachronistic social and political in-frastructures. The Delta has a higher concentration of poor African Americans than any other region in the
Figure 3
AFRICAN-AMERICAN POPULATION
Lower Mississippi Delta Region, 2009
Source: HAC Tabulations of 2005-2009 American Community Survey Data

90 TAKING STOCK
country. According to the 2009 American Community Survey, 19.7 percent of the Lower Mississippi Delta population is living in poverty and more than 21.9 per-cent of the rural LMD population is living in poverty, compared to the national rate of 13.5 percent.
High poverty rates are symptomatic of local economies that have, for the most part, not been able to create jobs that would enable residents to earn higher wages. As of 2009, more than one-third of all Delta residents had incomes below $25,000 per year and almost one-quarter have no earnings. A signifi cant proportion of the region’s residents are dependent upon government assistance; 36.1 percent of Delta residents receive Social Security Insurance payments (this includes SSI) and 2.3 percent receive some form of public assistance. Many Delta households (16.2 percent) use food assistance.
The DRA Regional Development Plan refl ects the frus-tration of stakeholders over the economic stagnation of the region. The data clearly show that Delta incomes continue to lag behind those in the rest of the nation and that pockets of poverty have in some cases deepened in recent decades. The region’s rural per capita income is among the lowest at $18,315 (compared to $27,041 for the nation). In light of these challenges, the DRA is charged with promoting innovative economic and com-munity development strategies that will enable the region to become more competitive. The region is recognizing the need for economies that are built on more than the agricultural pursuits that once made this region great.
The traditional economy of the LMD was built on cotton and the slave labor that planted and harvested this crop. The Civil War drastically changed the labor structure, and the mechanization of farming ultimately brought about further changes that resulted in signifi cant reductions in wages for farm labor. With increased competition from foreign markets and other structural changes, the agricul-tural sector has not created or sustained the level of jobs needed to support the region. In 2010 agriculture ac-counted for less than 3.2 percent of the Delta’s economy. The job losses associated with this sector, and the paucity of other economic drivers in many communities, have left many feeling that the Delta is on the cusp of extinction.
In light of reduced agricultural prospects, many Delta communities have pursued alternative economic develop-ment efforts to bring jobs and revenue to dying communi-ties. The transitional economy strategy includes a range
of service and manufacturing efforts as well as tourism and prison development. Some communities have tried these approaches, and in some cases failed, so now look to economic development alternatives, including gaming.
HOUSING CHARACTERISTICS
The socioeconomic problems plaguing the region are serious, and housing conditions are nearly impossi-ble to disarticulate from the larger economic realities within the region. Many of the housing challenges faced by people in the Delta are more pronounced in the rural areas of the region and among the region’s African-American population.
Slightly more than one-half (51.0 percent) of the region’s population lives in rural areas and more than one-half (53.0 percent or 2.08 million) of the region’s 3.9 million housing units are located in rural communities. Every county and parish in the region had a net increase in the number of housing units during the 2000s with the exception of Orleans, Jefferson, Plaquemines, and St. Bernard parishes, all of which lost thousands of hous-ing units due to the natural disasters that devastated the region over the decade.9 Overall, the region gained more than 250,000 housing units in this decade.
A higher proportion of rural units are vacant than in the rest of the region (15.1 and 13.9 percent, respec-tively) and a larger proportion of units are dedicated to seasonal, recreational, or occasional use (3.9 and 2.5 percent, respectively). The vast majority of units in the region are single-family detached homes: 70.9 percent in rural areas and 68.6 percent throughout the region. A signifi cant proportion of the region’s housing stock is made up of manufactured homes, specifi cally in rural Delta communities (17.1 percent, compared to 12.2 percent regionally).
As is the case in the nation as a whole, the level of inad-equate housing in the LMD declined signifi cantly over the past few decades. Still, more than 13,622 occupied units (0.8 percent) in the rural LMD lack complete kitchen facilities and 11,271 (0.6 percent) lack adequate plumbing. A signifi cant proportion of these units are occupied by African Americans. Crowding – defi ned as more than one person per room – is not a signifi cant problem in the Delta; however, crowding is substan-tially more problematic for renters and minorities.

91HIGH POVERTY RURAL AREAS AND POPULATIONS IN THE UNITED STATES
LOW
ER M
ISSI
SSIP
PI D
ELTA
Less than 30 percent of all rural LMD units are renter occupied, a slightly lower percentage than rental rates in the region overall (32.0 percent). Homeownership is overwhelmingly the preferred form of tenure among Delta residents; on average, 67.9 percent of all Delta units are owner-occupied. It is signifi cantly higher in the rural LMD than in urban areas, 70.9 and 51.4 percent, respectively. However, low homeownership rates, substandard housing, and crowding are common problems among the region’s African-American popula-tion. Just over half of all African-American households in the LMD are homeowners, a rate signifi cantly lower than the overall homeownership rate in the LMD.
Housing values in rural America are typically lower than in the rest of the nation. Almost one-half (49.5 percent) of all units in the region and almost two-thirds (62.2 percent) of all housing units in the rural LMD are valued under $99,000. Despite the lower cost of housing in the LMD, housing affordability is still a problem for many low-income households. Almost one-quarter (23 percent) of all LMD households are cost burdened – paying 30 percent or more of their earnings for housing. Cost-burden rates are higher for renters in the region (51.3 percent) than for those who own their homes (23.4 percent).
Homeownership, housing value, and asset retention are heavily dependent on access to mortgage fi nancing. Rural areas generally have fewer conventional banks and fi nancial institutions than urban centers. This is a major factor in the proliferation of subprime lending, particularly in rural areas with high minority popula-tions; these lenders are more active in low-income and minority communities.10 According to 2009 Home Mortgage Disclosure Act data, 5.1 percent of all report-ed home loans were considered high-cost loans. In the
Delta, a greater proportion of rural mortgages are high cost, particularly among African-American residents. The rate of high-cost lending in the LMD is more than twice the national rate (12.5 percent). It is almost 19 percent for rural Delta residents, and it is more than 22 percent for rural African Americans living in the Delta. While not all high-cost loans are predatory in nature, higher fees and aggressive lending practices and terms, in general, can rob an owner of equity and reduce the benefi ts of owning one’s home.11
ADDRESSING THE NEEDS
Nonprofi ts have been a critical part of the effort to revi-talize the Delta and bring improvements to the region. The network of nonprofi t organizations in the region has limited capacity, however, and has struggled to compete for dwindling sources of funding.
With a number of new but fragile organizations, the nonprofi t housing providers in the Delta tend to be un-derstaffed and to have limited administrative resources. Nonetheless, these organizations operate across large service areas. Many housing providers develop a small number of housing units each year and the productiv-ity of these organizations is limited by their ability to secure government funding. Other income streams beyond public funds are utilized by many groups; how-ever, these sources provide only a modest amount of money for the organizations. Most of the Delta organi-zations have administrative budgets of under $100,000 and engage primarily in new construction and rehabili-tation of single-family homes. A Housing Assistance Council report on the organizational capacity of hous-ing nonprofi ts in the Lower Mississippi Delta highlights several characteristics that may be helpful in planning effective housing and community development efforts in the region.12
Several regional entities are working to help meet the economic and community development needs of the region. The Enterprise Corporation of the Delta, Foun-dation for the Mid South, and others have provided the capital, capacity development expertise, and technical support needed by local nonprofi t organizations. Ad-ditionally, the Delta Regional Authority has outlined its vision for a more sustainable economic development model that includes investments in technology, infra-structure, and job creation.

92 TAKING STOCK
WEST FELICIANA PARISH, LOUISIANA
West Feliciana Parish, Louisiana is a place of contradictions. It is a nature lover’s paradise comprised of beautiful open spaces and it is home to one of the nation’s most notorious prisons – the Louisiana State Penitentiary at Angola. African American and white residents live together, yet separately, and poverty exists alongside significant affluence. Racial issues continue to drive some of the politics and decision-making in the parish.13 The antebellum plantation homes are a source of pride for many West Feliciana Parish residents; however, a significant amount of substandard housing as well as run-down manufactured homes also characterize the area.
Poverty remains over 20 percent in West Feliciana, where it has hovered since 2000.* Poverty rates measured by the past four decennial censuses have exceeded 20 percent and unemployment rates are consistently high.
As of 2010, West Feliciana has 15,625 residents, including more than 5,000 living in the Louisiana State Penitentiary at Angola. In addition to increasing the overall population growth rate, the imprisoned population skews certain demographic data related to the parish. Slightly more than one-half of the parish’s population is white and 46.5 percent is African American, with the majority of African Americans residing in the western portion of the parish where the prison is located.
In addition to the school system, three major employers operate in the parish: the prison, a paper mill, and a nuclear plant. Less than 10 percent of employees at these major employers are West Feliciana residents, however. The nuclear plant has also been the parish’s largest source of tax revenue in recent years; however, the plant is now depreciating, and the revenue from this source will continue to decline.14 The parish now struggles to identify resources to replace these critical dollars, leading to renewed efforts to find an economic development plan that will generate the level of prosperity required to meet current and future needs. At least one positive event occurred in early 2012, when the paper mill, which had declared bankruptcy in 2011, was reopened.15
While many social and economic conditions have improved somewhat in West Feliciana Parish over the past few decades, housing conditions have remained largely unchanged. The lack of decent, affordable housing in the parish is an issue not only for the community’s low-income population; it also affects young and moderate-income residents who wish to remain in the parish but cannot afford housing. The parish has a high homeownership rate, but rental units are in short supply. More than one-quarter of all units in the parish are manufactured homes. Local real estate agents note that investors often buy manufactured homes and rent them to others.16 In addition, the parish has a very high rate of household crowding, which is often a proxy for homelessness, as family members and friends often take in others when no affordable housing options are available.17 Segregated living patterns have a significant impact – particularly on the community’s African American population – as the traditionally African American communities have poor drainage and homes that flood often.
Dedicated community residents have tried to advance several different, often conflicting, economic development strategies to bring more revenue and jobs to the community. Local stakeholders have been interested in exploring the potential of
local ecotourism and luring visitors to the parish and local plantation homes. West Feliciana Parish is a community that can achieve much when it dedicates itself to addressing problems. The community decided to improve its educational system, and it is now ranked as one of the top three school districts in the state. The very real issues of race surrounding segregated high school proms and representation on the police jury have been resolved. There are ongoing tensions, however, surrounding leadership, representation of interests, and direction.
*The 2010 Small Area Income and Poverty Estimates (SAIPE) estimate that 20.9 percent of West Feliciana Parish residents live below the poverty line. 2005-2009 ACS five year estimates, on the other hand, measure 10.2 percent poverty and a seven percentage point decline in poverty since 2000. This report prefers the SAIPE estimate, as stakeholders on the ground have not witnessed a shift in the parish to account for the large change in the ACS data. Moreover, the ACS estimate may have been impacted by the lower poverty rates in the 2005 to 2007 period, when the economy was stronger.
While many social and economic conditions have improved some-what in West Feliciana Parish over the past few decades, housing conditions have remained largely unchanged.


![TAX-FREE INCOMES - Income Tax Department free incomes final.pdf · [As amended by Finance Act, 2017] TAX-FREE INCOMES Agricultural Income [Section 10(1)] As per section 10(1), agricultural](https://img.pdfslide.net/doc/110x75/5a79f2947f8b9adf778b5aec/tax-free-incomes-income-tax-free-incomes-finalpdfas-amended-by-finance-act.jpg)