Embed Size (px)
Citation preview
0
ENVIRONMENTAL MANAGEMENT PLAN
FOR
PROPOSED 170 TPH COAL FIRED BOILER
Of
M/s. SILKROAD SUGAR PVT LTD. VAKALAPUDI VILLAGE,
KAKINADA RURAL, EAST GODAVARI Dt.,
ANDHRA PRADESH.
PREPARED BY
SV ENVIRO LABS & CONSULTANTS
Environmental engineers & consultants in pollution control
Head Office Branch Office
H.No. 38-19-44/2/2&3, H.No. 2-53,
Jyothi Nagar, Mahipala Street,
Marripalem, Yanam – 533 464.
Visakhapatnam – 18. Phone: 0884-321528
Cell: 0891-2797377. Cell : 94403 38628

1
CHAPTER-I
INTRODUCTION
2
1.1 INTRODUCTION
M/s. SILKROAD Sugar Private Limited is situated at Vakalapudi village, Kakinada Rural in
East Godavari District, Andhra Pradesh. The integrated industrial complex includes facilities
for Refined Sugar manufacturing unit and Gas turbine based power plant of capacities 3000
TPD and 35 MW respectively. These units were commissioned during Aug-2010.
M/s. SILKROAD Sugar Pvt. Ltd., was given allocation of 1,00,000/- SCMD of natural gas
against the requirement of 3,50,000/-SCMD. With this allocation only 3 to 3.5 MW of power
is being generated and from the exhaust gases 25 TPH of steam generated form the HRSG.
Due to this lower steam availability the Sugar Refinery is being operated at 500TPD capacity
as against the designed capacity of 3,000 TPD.
In order to meet the full efficiency and the installed capacities and to generate licensed
products, it is un-avoidable for the unit to go for the installation of total 170 TPH (90 + 80 )
capacity boilers which will run on coal based (Indian and Imported coal) as the gas supply is
not available fully. This proposed system will be a fallback arrangement for the existing gas
turbine and Heat Recovery Steam Generator (HRSG).
3
DETAILS ABOUT THE PROJECT SITE
M/s. SILKROAD Sugar Private Limited is situated at Vakalapudi village, Kakinada Rural in
East Godavari District, Andhra Pradesh and the proposed installation of 1 x 90 TPH and 1X
80 TPH boilers will be within the premises only to meet licensed production.
Details about Project Site as per table:
Longitude 820 15’ 36’’ E
Latitude 160 59’ 29’’ N
Annual rainfall 1080 mm
Min and max temp. 220C and 470 C
Avg. relative humidity 75 %
Avg. wind speed 10-12 KMPH
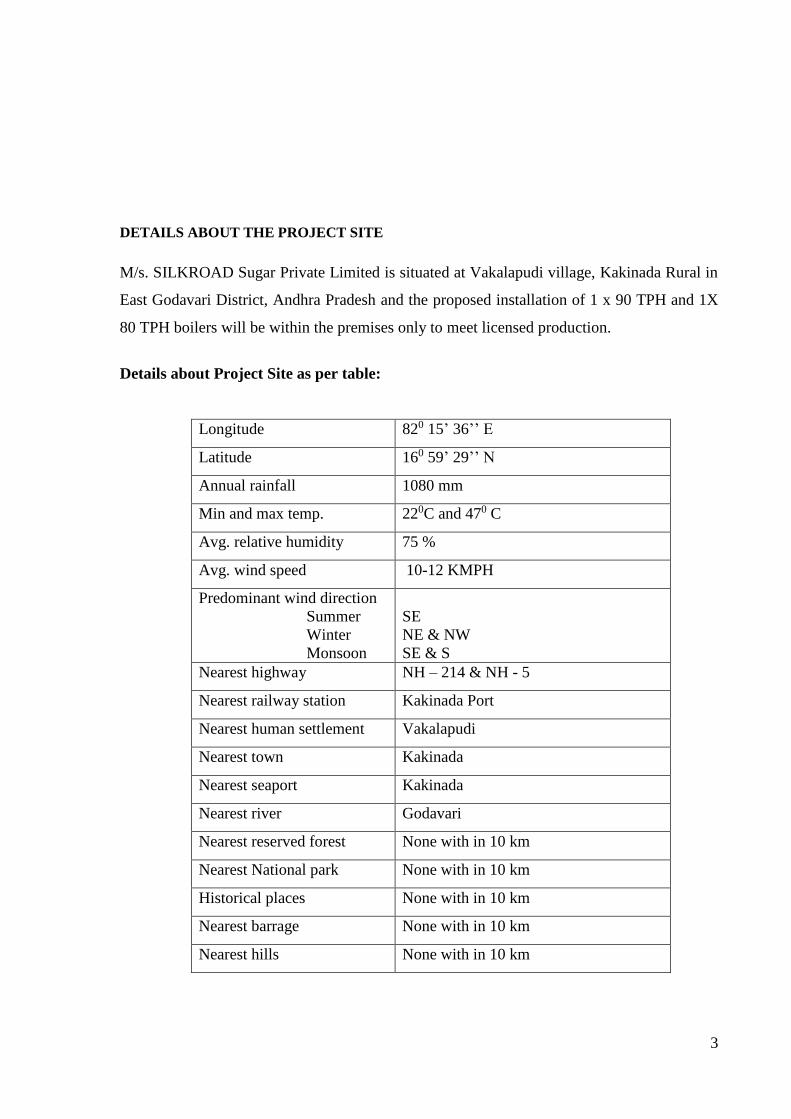
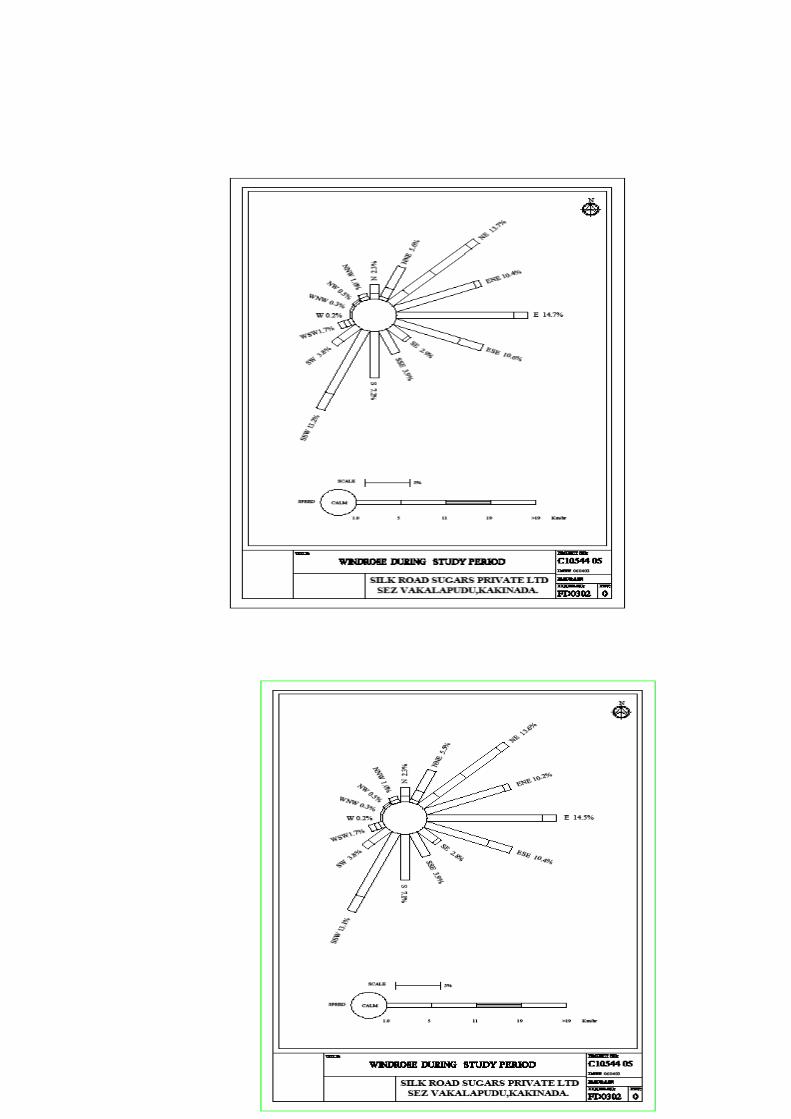
Predominant wind direction
Summer
Winter
Monsoon
SE
NE & NW
SE & S
Nearest highway NH – 214 & NH - 5
Nearest railway station Kakinada Port
Nearest human settlement Vakalapudi
Nearest town Kakinada
Nearest seaport Kakinada
Nearest river Godavari
Nearest reserved forest None with in 10 km
Nearest National park None with in 10 km
Historical places None with in 10 km
Nearest barrage None with in 10 km
Nearest hills None with in 10 km
4
5
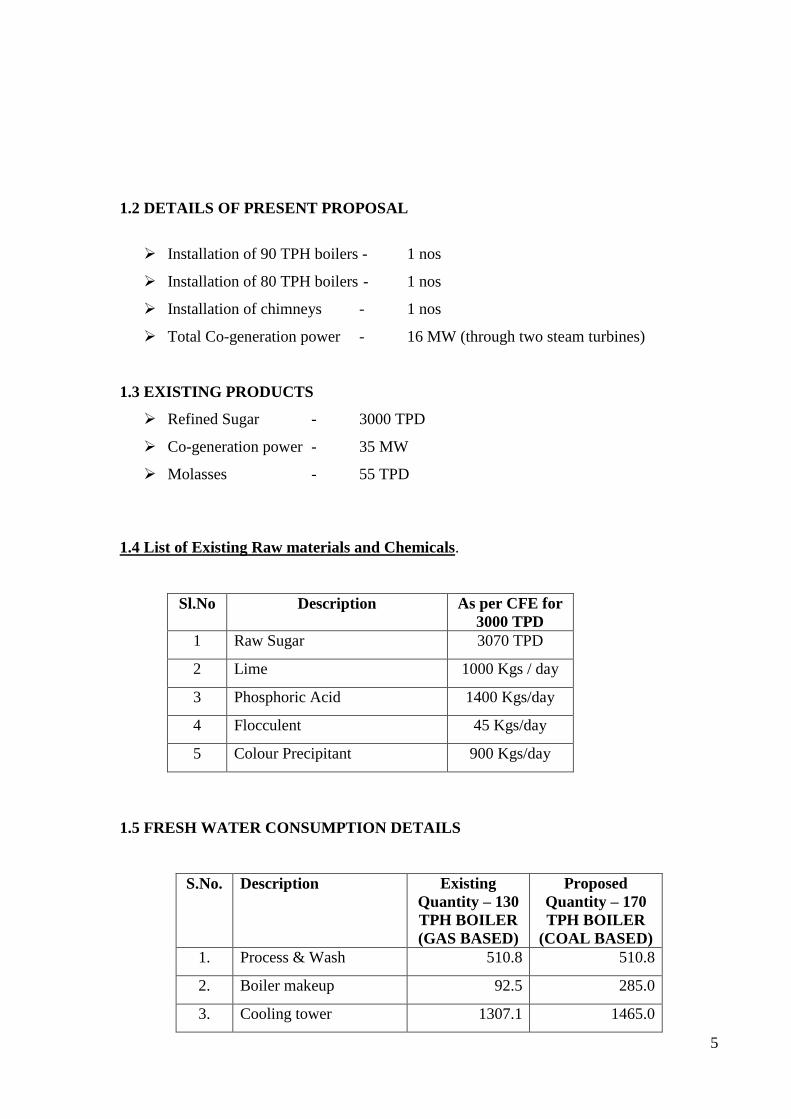
1.2 DETAILS OF PRESENT PROPOSAL
Installation of 90 TPH boilers - 1 nos
Installation of 80 TPH boilers - 1 nos
Installation of chimneys - 1 nos
Total Co-generation power - 16 MW (through two steam turbines)
1.3 EXISTING PRODUCTS
Refined Sugar - 3000 TPD
Co-generation power - 35 MW
Molasses - 55 TPD
1.4 List of Existing Raw materials and Chemicals.
Sl.No Description As per CFE for
3000 TPD
1 Raw Sugar 3070 TPD
2 Lime 1000 Kgs / day
3 Phosphoric Acid 1400 Kgs/day
4 Flocculent 45 Kgs/day
5 Colour Precipitant 900 Kgs/day
1.5 FRESH WATER CONSUMPTION DETAILS
S.No. Description Existing
Quantity – 130
TPH BOILER
(GAS BASED)
Proposed
Quantity – 170
TPH BOILER
(COAL BASED)
1. Process & Wash 510.8 510.8
2. Boiler makeup 92.5 285.0
3. Cooling tower 1307.1 1465.0
6
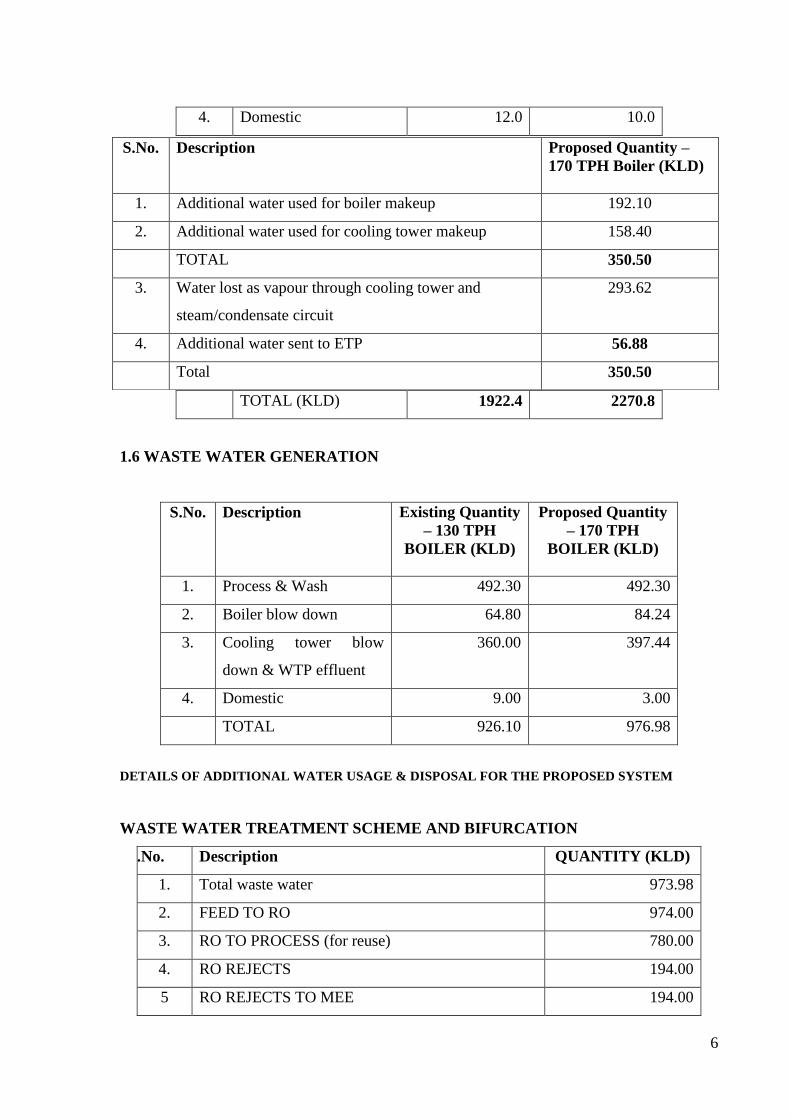
4. Domestic 12.0 10.0
TOTAL (KLD) 1922.4 2270.8
1.6 WASTE WATER GENERATION
S.No. Description Existing Quantity
– 130 TPH
BOILER (KLD)
Proposed Quantity
– 170 TPH
BOILER (KLD)
1. Process & Wash 492.30 492.30
2. Boiler blow down 64.80 84.24
3. Cooling tower blow
down & WTP effluent
360.00 397.44
4. Domestic 9.00 3.00
TOTAL 926.10 976.98
DETAILS OF ADDITIONAL WATER USAGE & DISPOSAL FOR THE PROPOSED SYSTEM
WASTE WATER TREATMENT SCHEME AND BIFURCATION
S.No. Description QUANTITY (KLD)
1. Total waste water 973.98
2. FEED TO RO 974.00
3. RO TO PROCESS (for reuse) 780.00
4. RO REJECTS 194.00
5 RO REJECTS TO MEE 194.00
S.No. Description Proposed Quantity –
170 TPH Boiler (KLD)
1. Additional water used for boiler makeup 192.10
2. Additional water used for cooling tower makeup 158.40
TOTAL 350.50
3. Water lost as vapour through cooling tower and
steam/condensate circuit
293.62
4. Additional water sent to ETP 56.88
Total 350.50
7
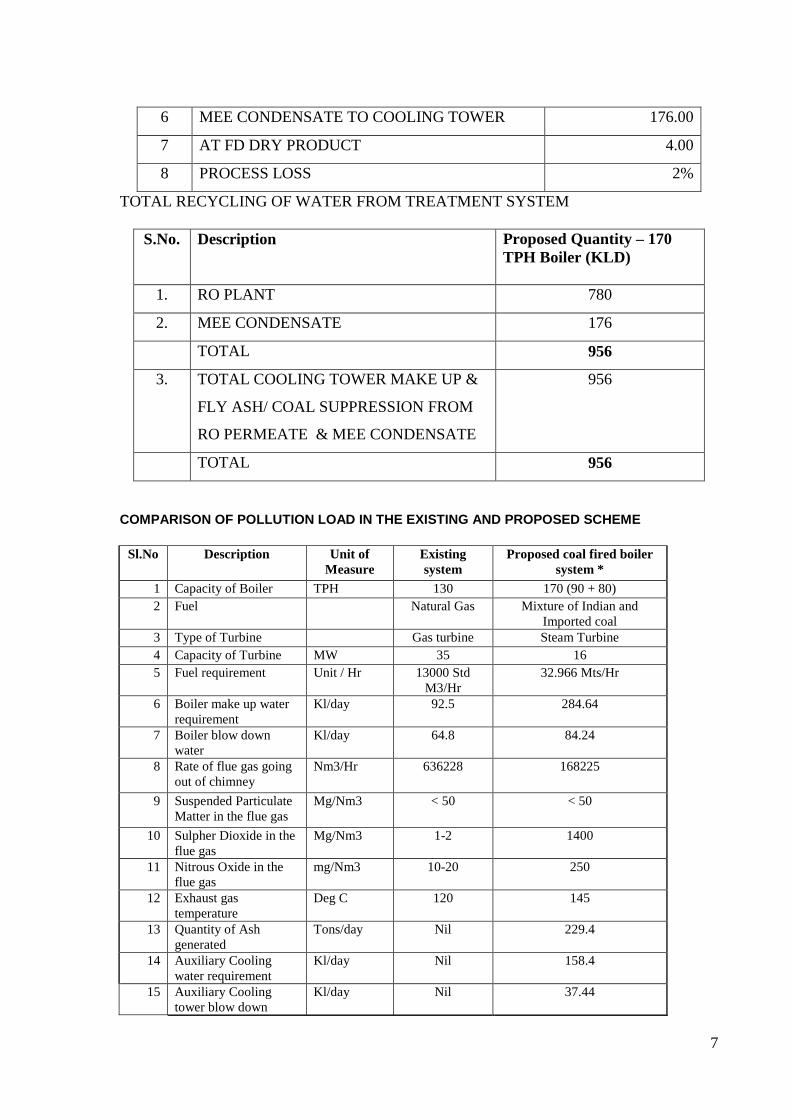
6 MEE CONDENSATE TO COOLING TOWER 176.00
7 AT FD DRY PRODUCT 4.00
8 PROCESS LOSS 2%
TOTAL RECYCLING OF WATER FROM TREATMENT SYSTEM
S.No. Description Proposed Quantity – 170
TPH Boiler (KLD)
1. RO PLANT 780
2. MEE CONDENSATE 176
TOTAL 956
3. TOTAL COOLING TOWER MAKE UP &
FLY ASH/ COAL SUPPRESSION FROM
RO PERMEATE & MEE CONDENSATE
956
TOTAL 956
COMPARISON OF POLLUTION LOAD IN THE EXISTING AND PROPOSED SCHEME
Sl.No Description Unit of
Measure
Existing
system
Proposed coal fired boiler
system *
1 Capacity of Boiler TPH 130 170 (90 + 80)
2 Fuel Natural Gas Mixture of Indian and
Imported coal
3 Type of Turbine Gas turbine Steam Turbine
4 Capacity of Turbine MW 35 16
5 Fuel requirement Unit / Hr 13000 Std
M3/Hr
32.966 Mts/Hr
6 Boiler make up water
requirement
Kl/day 92.5 284.64
7 Boiler blow down
water
Kl/day 64.8 84.24
8 Rate of flue gas going
out of chimney
Nm3/Hr 636228 168225
9 Suspended Particulate
Matter in the flue gas
Mg/Nm3 < 50 < 50
10 Sulpher Dioxide in the
flue gas
Mg/Nm3 1-2 1400
11 Nitrous Oxide in the
flue gas
mg/Nm3 10-20 250
12 Exhaust gas
temperature
Deg C 120 145
13 Quantity of Ash
generated
Tons/day Nil 229.4
14 Auxiliary Cooling
water requirement
Kl/day Nil 158.4
15 Auxiliary Cooling
tower blow down
Kl/day Nil 37.44

8
Note: * Proposed coal fired boiler system is designed for 100% fall back to the existing
gas fuel system. Same will be operated along with the existing system to the extent of
shortage in gas supply to meet steam requirement for 3000 TPD sugar refining.
9
CHAPER-II
PROCESS DESCRIPTION
2.0 PROCESS DESCRIPTION
Power Plant
To meet the power and steam requirement of the refinery, a 35 MW (42.1MW ISO rating)
gas based power plant is installed. The power requirement of the refinery is about 8 MW and
the balance power generated is exported to the state power grid. The steam produced from
the flue gasses, about 130t/hr, is used in the process.
SUGAR REFINERY
Raw Material:
Raw material for the refinery is Raw sugar imported with the colour level of 900 to 1200
ICU, regulated % of moisture, non sugar and other components present in it.
10
Melting:
The raw sugar is charged into floor level conveyors using dumpers which carry the sugar to
melter. Here the sugar is mixed with water, usually sweet water recycled from the process
and a raw sugar solution of about 65 brix is prepared. Heating is applied to aid dissolution
and the temperature at the outlet of the melter is about 80 deg C. Colour precipitant is added
to precipitate the colouring matter to the possible extent in clarifier.
Clarification:
Phosphatation and deep bed filtration: This process is carried out in continuous clarifiers to
partially remove coloured impurities from sugar. Lime and phosphoric acid are added to the
melt along with flocculants which results in calcium phosphate scum formation which carries
by occlusion a substantial part of the colouring matter in sugar.
The scum is separated by floatation and washed in a 3 stage scum de-sweetening system to
remove the sugar content, dewatered and separated in a filter press. This calcium phosphate
has higher nutrient value and can be used as manure.
The clarified liquor contains some scum from the clarifier stage and is filtered in a deep bed
filter which is packed with sand, gravel and anthracite to get clear scum free liquor. The filter
is backwashed with filtered melt from time to time to remove the scum accumulated in the
bed.
Ion Exchange:
The clear liquor is then passed through ion exchange columns which contain a bed of acrylic
and styrene polymer based resins which adsorb the colouring matter in sugar solution. The
liquor coming out of the bed is substantially decolourised and is ready for concentration.
The ion exchange beds are regenerated from time to time, when the adsorption capacity is
exhausted, using an alkaline brine solution.
The decolourised liquor is filtered through fine filter to remove any suspended matter and
sent for evaporation.
11
The alkaline brine which is used for regeneration of the ion exchange resins is passed
through membrane filters to separate the excess brine for recycle. The retentate from the
membrane filters which contains the colouring matter from sugar is sent to Multiple Effect
Evaporator for concentration and mixed with Molasses.
Evaporation:
The decolourised liquor is concentrated in a triple effect evaporator from a concentration of
63 brix to 72 brix prior to pan boiling.
Pan Boiling and crystallization:
The concentrated liquor is boiled in a series of vacuum pans to a brix of 88 to 90 with
seeding to crystallize the sugar in solution. The massecuite is transferred to crystallisers
before feeding to centrifugals.
Depending on the quality of product desired, the molasses is boiled 3 or 4 times in
subsequent stages to get progressively darker coloured product.
After the 4th boiling the molasses is sent to the recovery section to recover the residual sugar
before sending the final molasses out.
Centrifugation:
The massecuite in each stage is filtered in basket centrifuges to separate molasses from the
crystals as well as washing the crystals. The crystals vary in colour depending on which stage
the massecuite is from.
The crystals are discharged batch wise from the bottom of the centrifuge to a hopper for
feeding to the dryer.
Dryer
12
The wet sugar is passed through a rotary dryer to remove the residual moisture content in the
sugar. The dryer is a long, cylindrical drum with slight inclination, rotating on rollers, Hot air
is passed from one side and wet sugar from the other. The sugar is discharged from the other
end dry.
Storage and packing
The dry sugar from the dryer is sent to silos for intermediate storage through a grader where
over size and under size crystals are removed. Several silos are provided to store sugar of
different quality.
Depending on the market requirement different grades of sugar are blended in a blender and
packed in bags of different sizes and sent to the refined sugar warehouse for export.
Recovery section:
The molasses from the pan station still contains some high purity sugar. This is recovered in
recovery pans as dark coloured sugar which is sent to the melting station for reprocessing.
Sugar from excess sweet water is also recovered in this section.
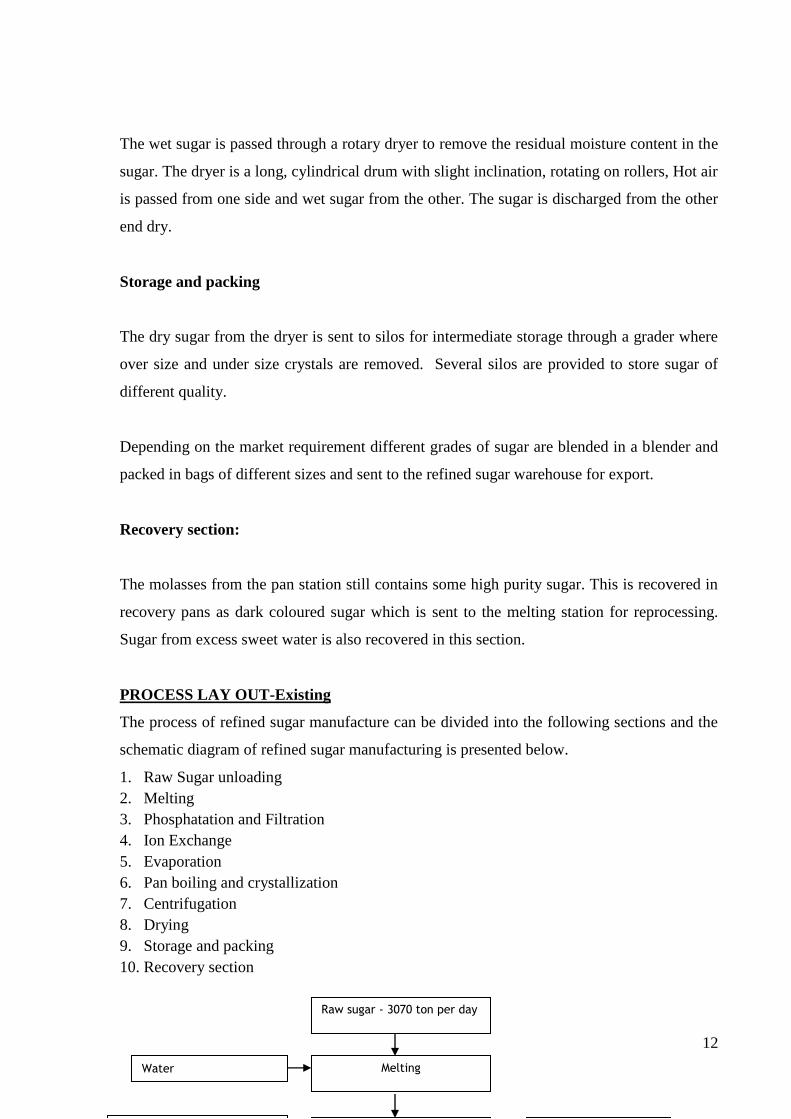
PROCESS LAY OUT-Existing
The process of refined sugar manufacture can be divided into the following sections and the
schematic diagram of refined sugar manufacturing is presented below.
1. Raw Sugar unloading
2. Melting
3. Phosphatation and Filtration
4. Ion Exchange
5. Evaporation
6. Pan boiling and crystallization
7. Centrifugation
8. Drying
9. Storage and packing
10. Recovery section
Raw sugar - 3070 ton per day
Melting
Water
13
PROCESS DEISCRIPTION FOR PROPOSED 170 TPH COAL FIRED BOILER
The major equipments of the plant are
a. Boilers
b. Electrostatic precipitator
c. Turbo generators
d. Coal storage
e. Coal handling system
f. Ash handling system
g. Ash storage
h. Cooling water system
14
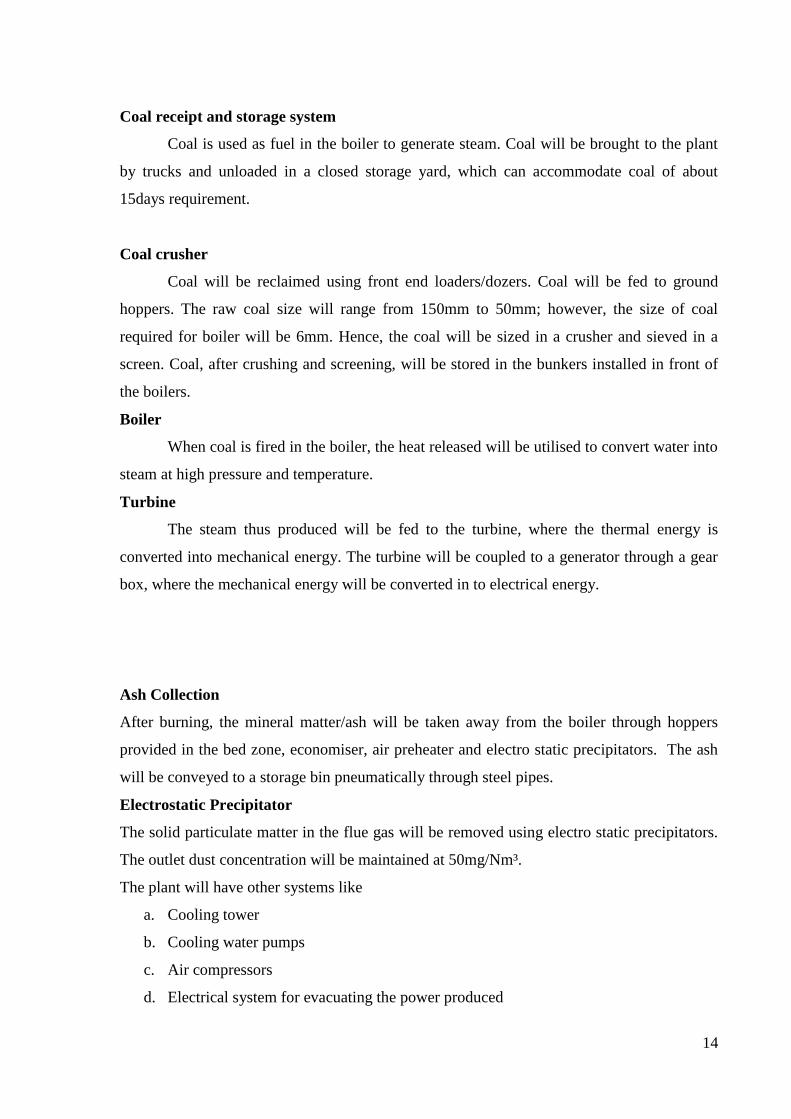
Coal receipt and storage system
Coal is used as fuel in the boiler to generate steam. Coal will be brought to the plant
by trucks and unloaded in a closed storage yard, which can accommodate coal of about
15days requirement.
Coal crusher
Coal will be reclaimed using front end loaders/dozers. Coal will be fed to ground
hoppers. The raw coal size will range from 150mm to 50mm; however, the size of coal
required for boiler will be 6mm. Hence, the coal will be sized in a crusher and sieved in a
screen. Coal, after crushing and screening, will be stored in the bunkers installed in front of
the boilers.
Boiler
When coal is fired in the boiler, the heat released will be utilised to convert water into
steam at high pressure and temperature.
Turbine
The steam thus produced will be fed to the turbine, where the thermal energy is
converted into mechanical energy. The turbine will be coupled to a generator through a gear
box, where the mechanical energy will be converted in to electrical energy.
Ash Collection
After burning, the mineral matter/ash will be taken away from the boiler through hoppers
provided in the bed zone, economiser, air preheater and electro static precipitators. The ash
will be conveyed to a storage bin pneumatically through steel pipes.
Electrostatic Precipitator
The solid particulate matter in the flue gas will be removed using electro static precipitators.
The outlet dust concentration will be maintained at 50mg/Nm³.
The plant will have other systems like
a. Cooling tower
b. Cooling water pumps
c. Air compressors
d. Electrical system for evacuating the power produced
15
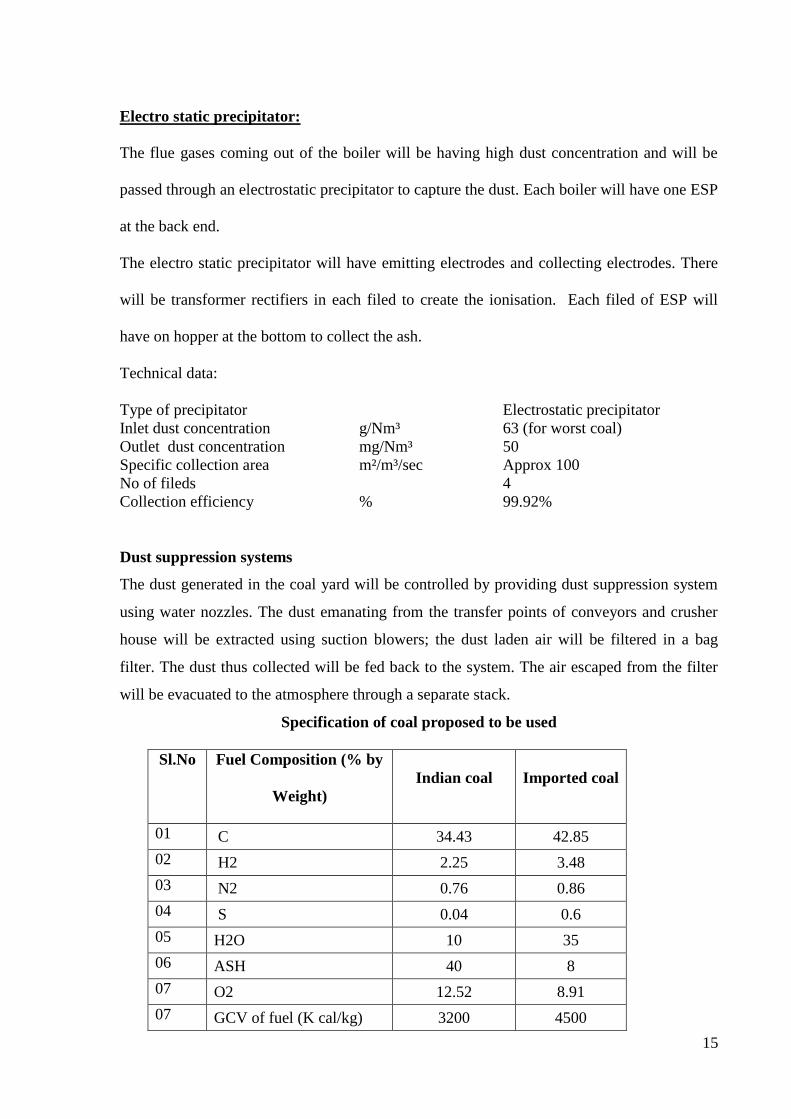
Electro static precipitator:
The flue gases coming out of the boiler will be having high dust concentration and will be
passed through an electrostatic precipitator to capture the dust. Each boiler will have one ESP
at the back end.
The electro static precipitator will have emitting electrodes and collecting electrodes. There
will be transformer rectifiers in each filed to create the ionisation. Each filed of ESP will
have on hopper at the bottom to collect the ash.
Technical data:
Type of precipitator Electrostatic precipitator
Inlet dust concentration g/Nm³ 63 (for worst coal)
Outlet dust concentration mg/Nm³ 50
Specific collection area m²/m³/sec Approx 100
No of fileds 4
Collection efficiency % 99.92%
Dust suppression systems
The dust generated in the coal yard will be controlled by providing dust suppression system
using water nozzles. The dust emanating from the transfer points of conveyors and crusher
house will be extracted using suction blowers; the dust laden air will be filtered in a bag
filter. The dust thus collected will be fed back to the system. The air escaped from the filter
will be evacuated to the atmosphere through a separate stack.
Specification of coal proposed to be used
Sl.No Fuel Composition (% by
Weight)
Indian coal Imported coal
01 C 34.43 42.85
02 H2 2.25 3.48
03 N2 0.76 0.86
04 S 0.04 0.6
05 H2O 10 35
06 ASH 40 8
07 O2 12.52 8.91
07 GCV of fuel (K cal/kg) 3200 4500
16
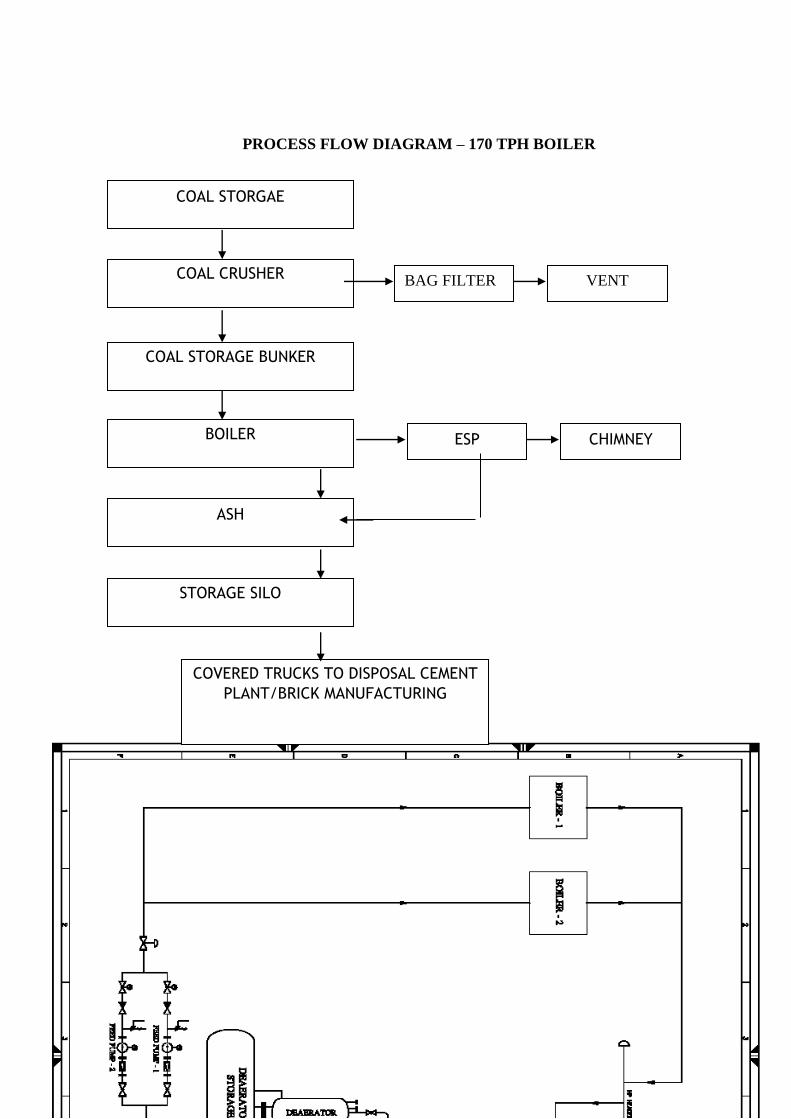
PROCESS FLOW DIAGRAM – 170 TPH BOILER
COAL STORGAE
COAL CRUSHER
COAL STORAGE BUNKER
BOILER
ASH
STORAGE SILO
COVERED TRUCKS TO DISPOSAL CEMENT
PLANT/BRICK MANUFACTURING
CHIMNEY ESP
VENT BAG FILTER

17
CHAPTER-III
ENVIRONMENTAL MANAGEMENT PLAN
18
3.0 ENVIRONMENTAL MANAGEMENT PLAN
Any type of development project exerts certain benefits and adverse impacts on the
surroundings.
Environmental Management Plan includes protection/mitigation/enhancement measures as
well as suggesting post project monitoring programme. Environmental management plan
may often suggest additional project operations that have to be incorporated in the
conventional operation.
The Environment Management Plan (EMP) is required to ensure sustainable development in
the study area of the proposed plant site, hence it needs to be all encompassive plan for which
the proposed industry, Government, regulating agencies like pollution control board working
in the region
The management action plan aims at controlling pollution at the source level to the possible
extent with the available and affordable technology followed by treatment measures before
they are discharged.
Environmental management plan aims at the preservation of ecosystem by considering the
pollution abatement facilities at the plant inception. In Silkroad Sugar pvt. Ltd., pollution
abatement has become an integral part of planning and designs along with techno economic
factors.
19
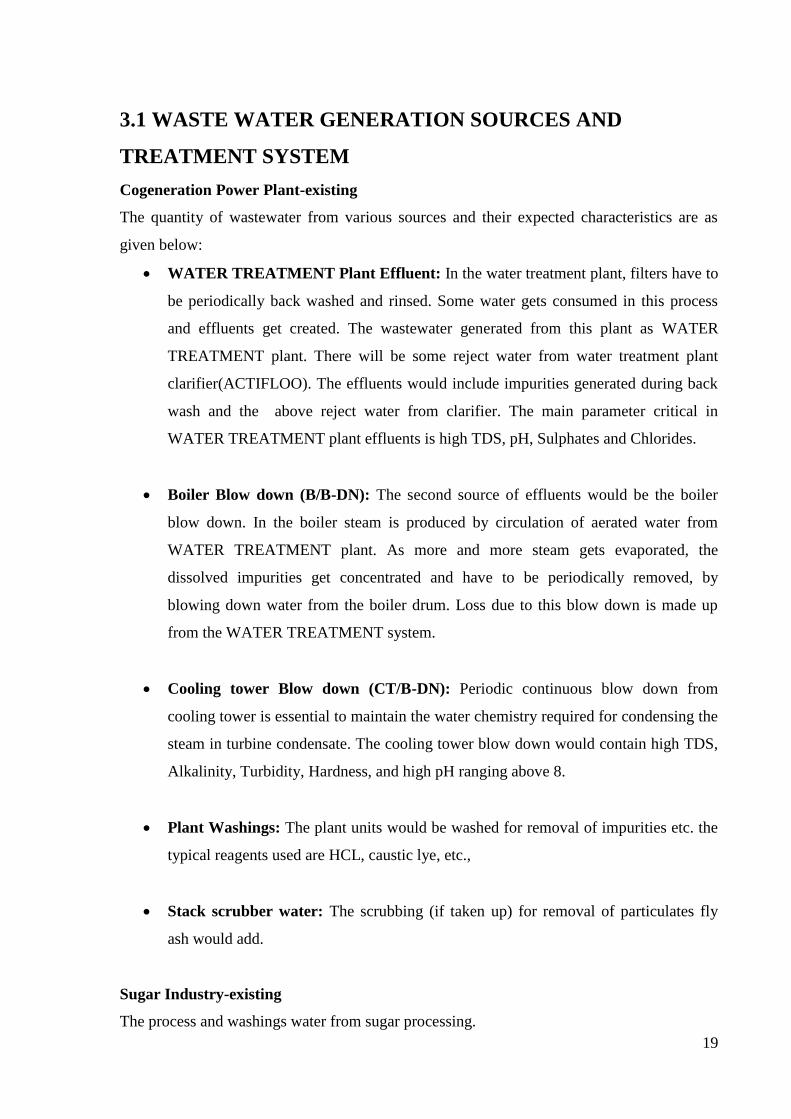
3.1 WASTE WATER GENERATION SOURCES AND
TREATMENT SYSTEM
Cogeneration Power Plant-existing
The quantity of wastewater from various sources and their expected characteristics are as
given below:
WATER TREATMENT Plant Effluent: In the water treatment plant, filters have to
be periodically back washed and rinsed. Some water gets consumed in this process
and effluents get created. The wastewater generated from this plant as WATER
TREATMENT plant. There will be some reject water from water treatment plant
clarifier(ACTIFLOO). The effluents would include impurities generated during back
wash and the above reject water from clarifier. The main parameter critical in
WATER TREATMENT plant effluents is high TDS, pH, Sulphates and Chlorides.
Boiler Blow down (B/B-DN): The second source of effluents would be the boiler
blow down. In the boiler steam is produced by circulation of aerated water from
WATER TREATMENT plant. As more and more steam gets evaporated, the
dissolved impurities get concentrated and have to be periodically removed, by
blowing down water from the boiler drum. Loss due to this blow down is made up
from the WATER TREATMENT system.
Cooling tower Blow down (CT/B-DN): Periodic continuous blow down from
cooling tower is essential to maintain the water chemistry required for condensing the
steam in turbine condensate. The cooling tower blow down would contain high TDS,
Alkalinity, Turbidity, Hardness, and high pH ranging above 8.
Plant Washings: The plant units would be washed for removal of impurities etc. the
typical reagents used are HCL, caustic lye, etc.,
Stack scrubber water: The scrubbing (if taken up) for removal of particulates fly
ash would add.
Sugar Industry-existing
The process and washings water from sugar processing.
20
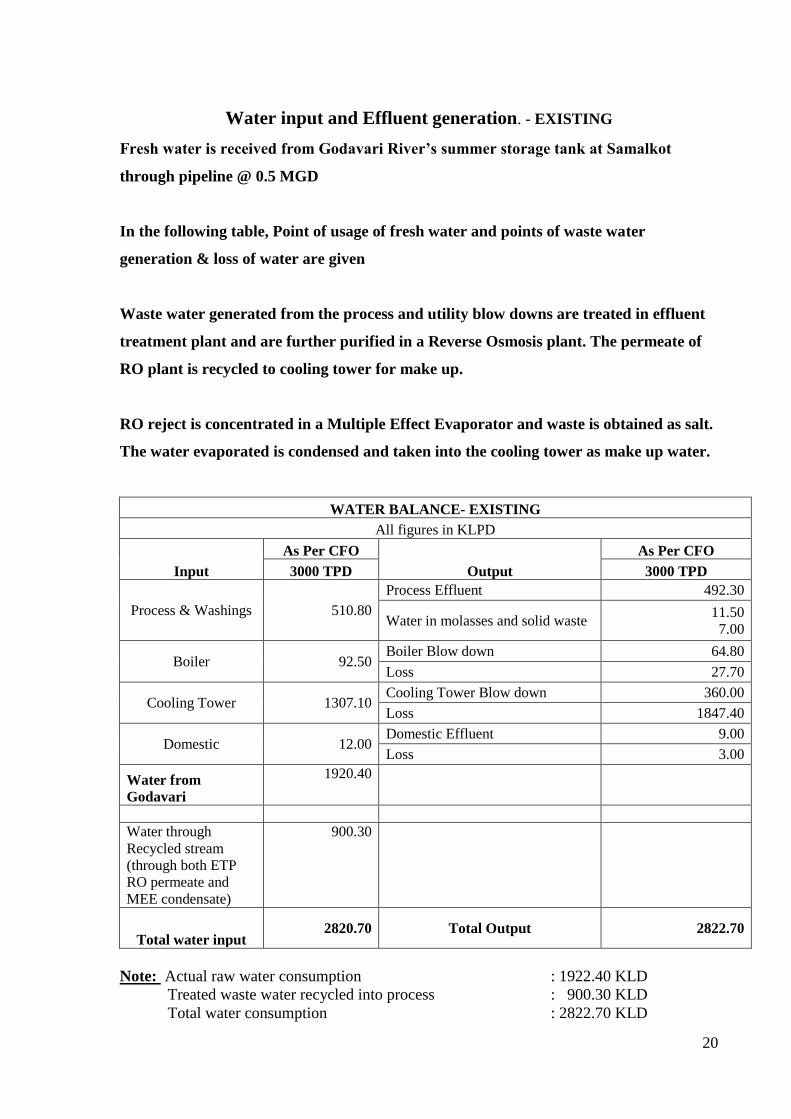
Water input and Effluent generation. - EXISTING
Fresh water is received from Godavari River’s summer storage tank at Samalkot
through pipeline @ 0.5 MGD
In the following table, Point of usage of fresh water and points of waste water
generation & loss of water are given
Waste water generated from the process and utility blow downs are treated in effluent
treatment plant and are further purified in a Reverse Osmosis plant. The permeate of
RO plant is recycled to cooling tower for make up.
RO reject is concentrated in a Multiple Effect Evaporator and waste is obtained as salt.
The water evaporated is condensed and taken into the cooling tower as make up water.
WATER BALANCE- EXISTING
All figures in KLPD
Input
As Per CFO
Output
As Per CFO
3000 TPD 3000 TPD
Process & Washings 510.80
Process Effluent 492.30
Water in molasses and solid waste 11.50
7.00
Boiler 92.50 Boiler Blow down 64.80
Loss 27.70
Cooling Tower 1307.10 Cooling Tower Blow down 360.00
Loss 1847.40
Domestic 12.00 Domestic Effluent 9.00
Loss 3.00
Water from
Godavari
1920.40
Water through
Recycled stream
(through both ETP
RO permeate and
MEE condensate)
900.30
Total water input 2820.70 Total Output 2822.70
Note: Actual raw water consumption : 1922.40 KLD
Treated waste water recycled into process : 900.30 KLD
Total water consumption : 2822.70 KLD
21
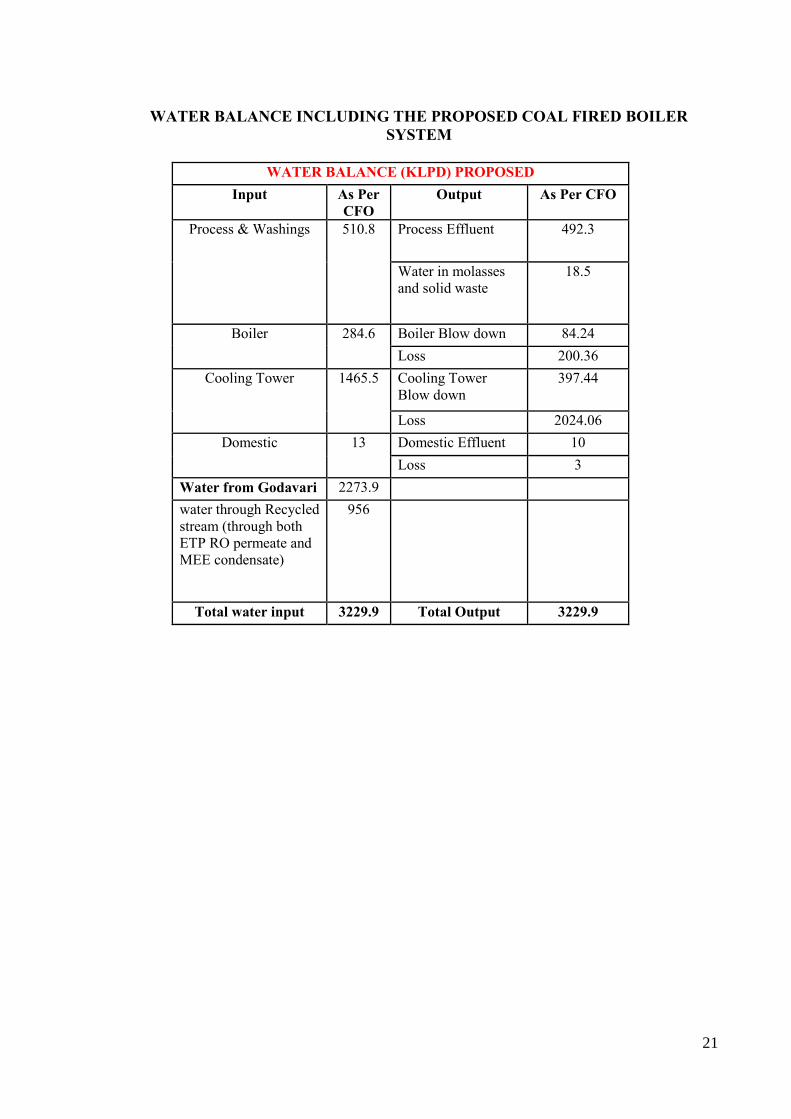
WATER BALANCE INCLUDING THE PROPOSED COAL FIRED BOILER
SYSTEM
WATER BALANCE (KLPD) PROPOSED
Input As Per
CFO
Output As Per CFO
Process & Washings 510.8 Process Effluent 492.3
Water in molasses
and solid waste
18.5
Boiler 284.6 Boiler Blow down 84.24
Loss 200.36
Cooling Tower 1465.5 Cooling Tower
Blow down
397.44
Loss 2024.06
Domestic 13 Domestic Effluent 10
Loss 3
Water from Godavari 2273.9
water through Recycled
stream (through both
ETP RO permeate and
MEE condensate)
956
Total water input 3229.9 Total Output 3229.9
22
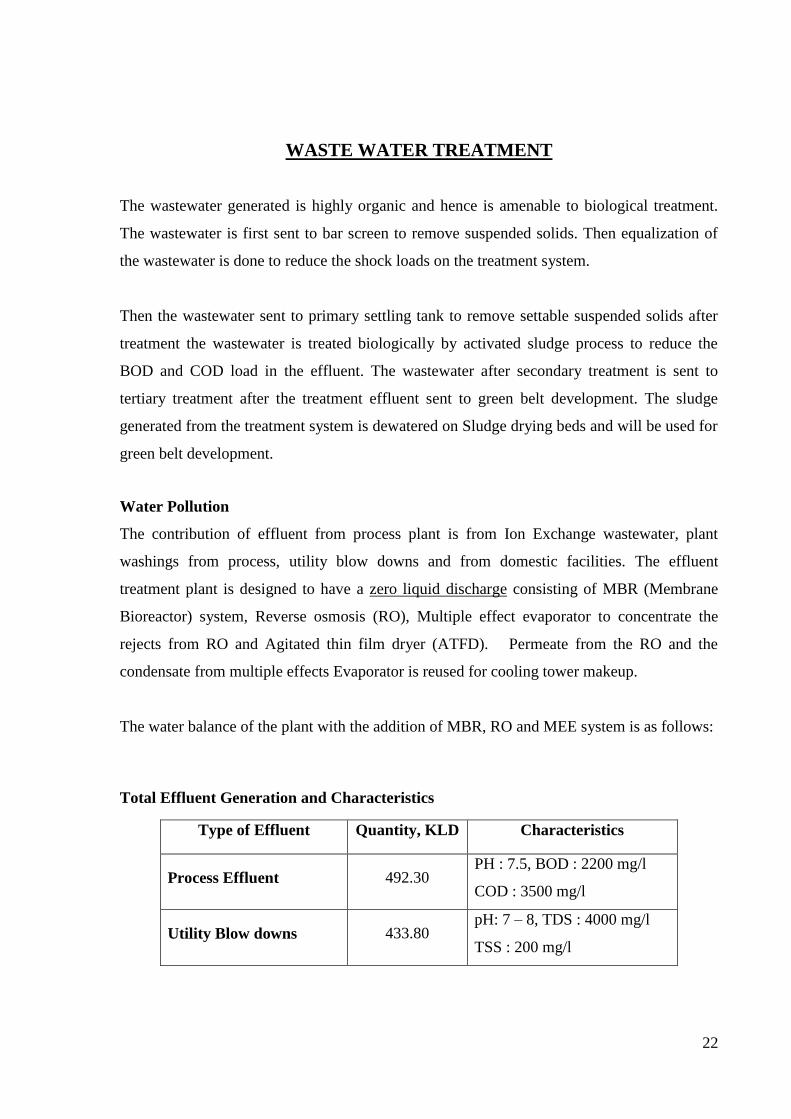
WASTE WATER TREATMENT
The wastewater generated is highly organic and hence is amenable to biological treatment.
The wastewater is first sent to bar screen to remove suspended solids. Then equalization of
the wastewater is done to reduce the shock loads on the treatment system.
Then the wastewater sent to primary settling tank to remove settable suspended solids after
treatment the wastewater is treated biologically by activated sludge process to reduce the
BOD and COD load in the effluent. The wastewater after secondary treatment is sent to
tertiary treatment after the treatment effluent sent to green belt development. The sludge
generated from the treatment system is dewatered on Sludge drying beds and will be used for
green belt development.
Water Pollution
The contribution of effluent from process plant is from Ion Exchange wastewater, plant
washings from process, utility blow downs and from domestic facilities. The effluent
treatment plant is designed to have a zero liquid discharge consisting of MBR (Membrane
Bioreactor) system, Reverse osmosis (RO), Multiple effect evaporator to concentrate the
rejects from RO and Agitated thin film dryer (ATFD). Permeate from the RO and the
condensate from multiple effects Evaporator is reused for cooling tower makeup.
The water balance of the plant with the addition of MBR, RO and MEE system is as follows:
Total Effluent Generation and Characteristics
Type of Effluent Quantity, KLD Characteristics
Process Effluent 492.30 PH : 7.5, BOD : 2200 mg/l
COD : 3500 mg/l
Utility Blow downs 433.80 pH: 7 – 8, TDS : 4000 mg/l
TSS : 200 mg/l
23
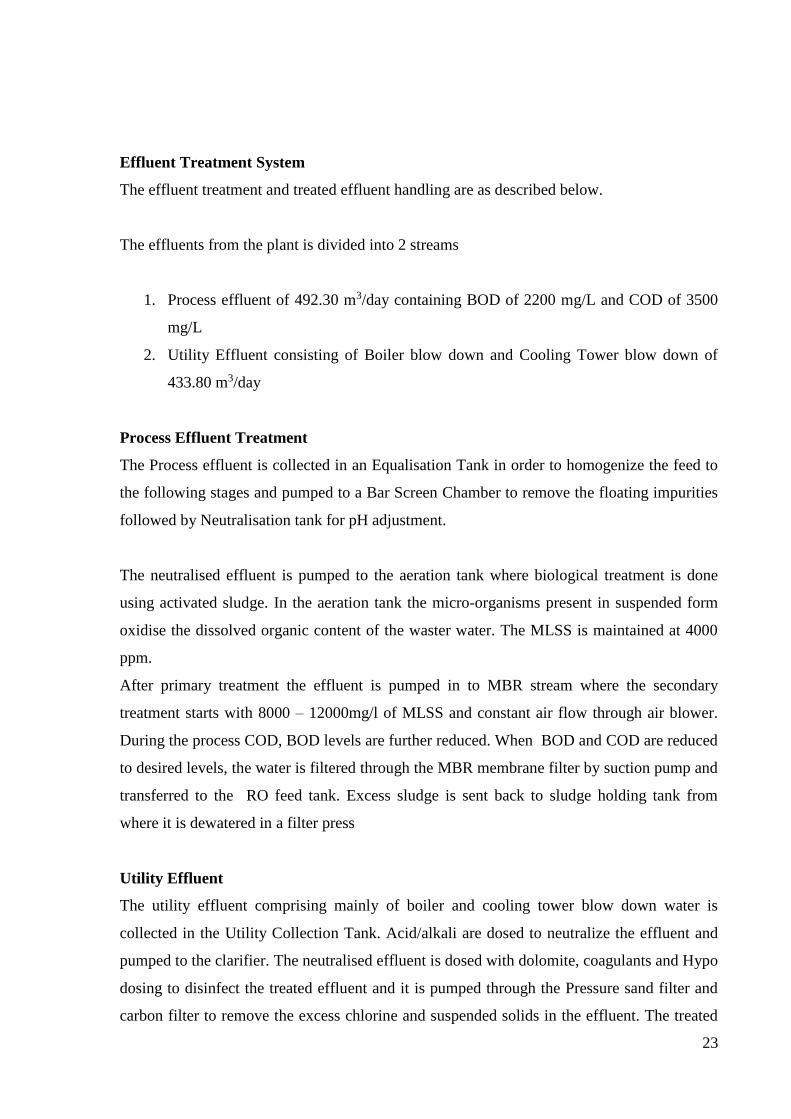
Effluent Treatment System
The effluent treatment and treated effluent handling are as described below.
The effluents from the plant is divided into 2 streams
1. Process effluent of 492.30 m3/day containing BOD of 2200 mg/L and COD of 3500
mg/L
2. Utility Effluent consisting of Boiler blow down and Cooling Tower blow down of
433.80 m3/day
Process Effluent Treatment
The Process effluent is collected in an Equalisation Tank in order to homogenize the feed to
the following stages and pumped to a Bar Screen Chamber to remove the floating impurities
followed by Neutralisation tank for pH adjustment.
The neutralised effluent is pumped to the aeration tank where biological treatment is done
using activated sludge. In the aeration tank the micro-organisms present in suspended form
oxidise the dissolved organic content of the waster water. The MLSS is maintained at 4000
ppm.
After primary treatment the effluent is pumped in to MBR stream where the secondary
treatment starts with 8000 – 12000mg/l of MLSS and constant air flow through air blower.
During the process COD, BOD levels are further reduced. When BOD and COD are reduced
to desired levels, the water is filtered through the MBR membrane filter by suction pump and
transferred to the RO feed tank. Excess sludge is sent back to sludge holding tank from
where it is dewatered in a filter press
Utility Effluent
The utility effluent comprising mainly of boiler and cooling tower blow down water is
collected in the Utility Collection Tank. Acid/alkali are dosed to neutralize the effluent and
pumped to the clarifier. The neutralised effluent is dosed with dolomite, coagulants and Hypo
dosing to disinfect the treated effluent and it is pumped through the Pressure sand filter and
carbon filter to remove the excess chlorine and suspended solids in the effluent. The treated
24
effluent is collected in the UF Feed tank and is pumped to Ultra Filtration system vide basket
strainer. Ultra filtration removes the following RO fouling materials like: Particulate matter,
suspended solids, bacteria, viruses, Colloidal materials (non-reactive silica, silt etc.,) and
High molecular weight organic compounds. This minimizes RO cleaning protocols and
reduces operating pressures and enhances membrane life. The filtrate from the UF is sent to
the RO feed tank
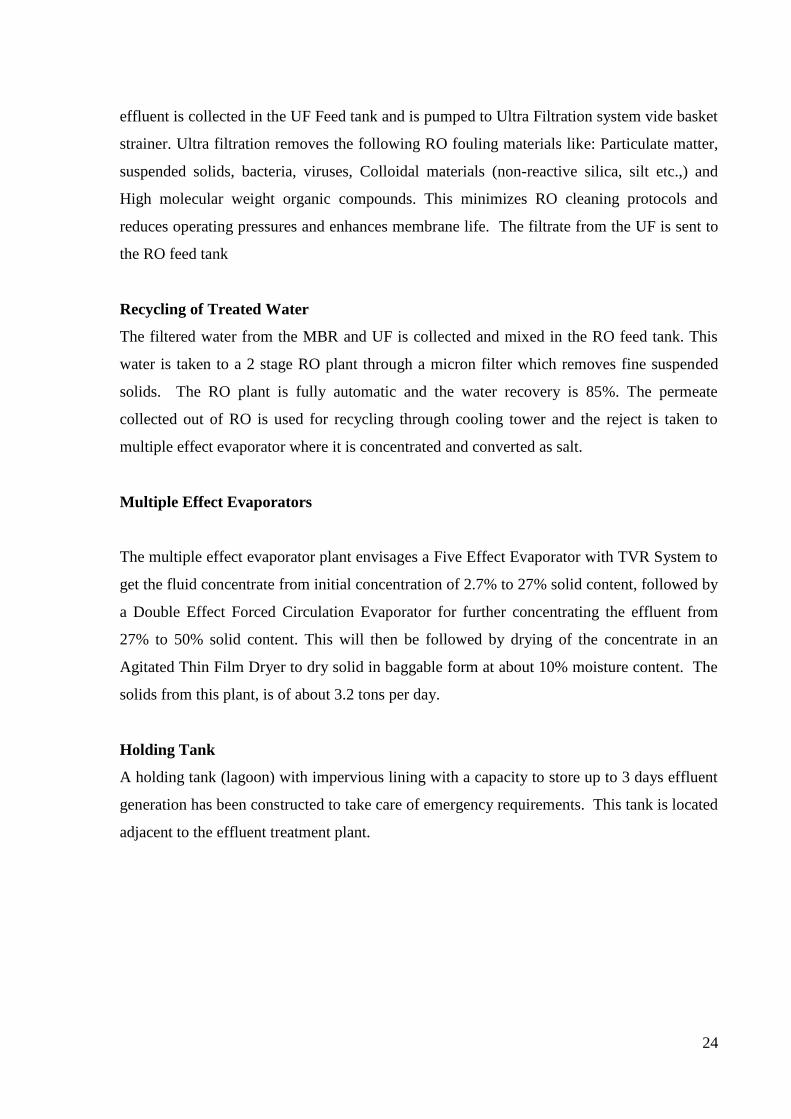
Recycling of Treated Water
The filtered water from the MBR and UF is collected and mixed in the RO feed tank. This
water is taken to a 2 stage RO plant through a micron filter which removes fine suspended
solids. The RO plant is fully automatic and the water recovery is 85%. The permeate
collected out of RO is used for recycling through cooling tower and the reject is taken to
multiple effect evaporator where it is concentrated and converted as salt.
Multiple Effect Evaporators
The multiple effect evaporator plant envisages a Five Effect Evaporator with TVR System to
get the fluid concentrate from initial concentration of 2.7% to 27% solid content, followed by
a Double Effect Forced Circulation Evaporator for further concentrating the effluent from
27% to 50% solid content. This will then be followed by drying of the concentrate in an
Agitated Thin Film Dryer to dry solid in baggable form at about 10% moisture content. The
solids from this plant, is of about 3.2 tons per day.
Holding Tank
A holding tank (lagoon) with impervious lining with a capacity to store up to 3 days effluent
generation has been constructed to take care of emergency requirements. This tank is located
adjacent to the effluent treatment plant.
25
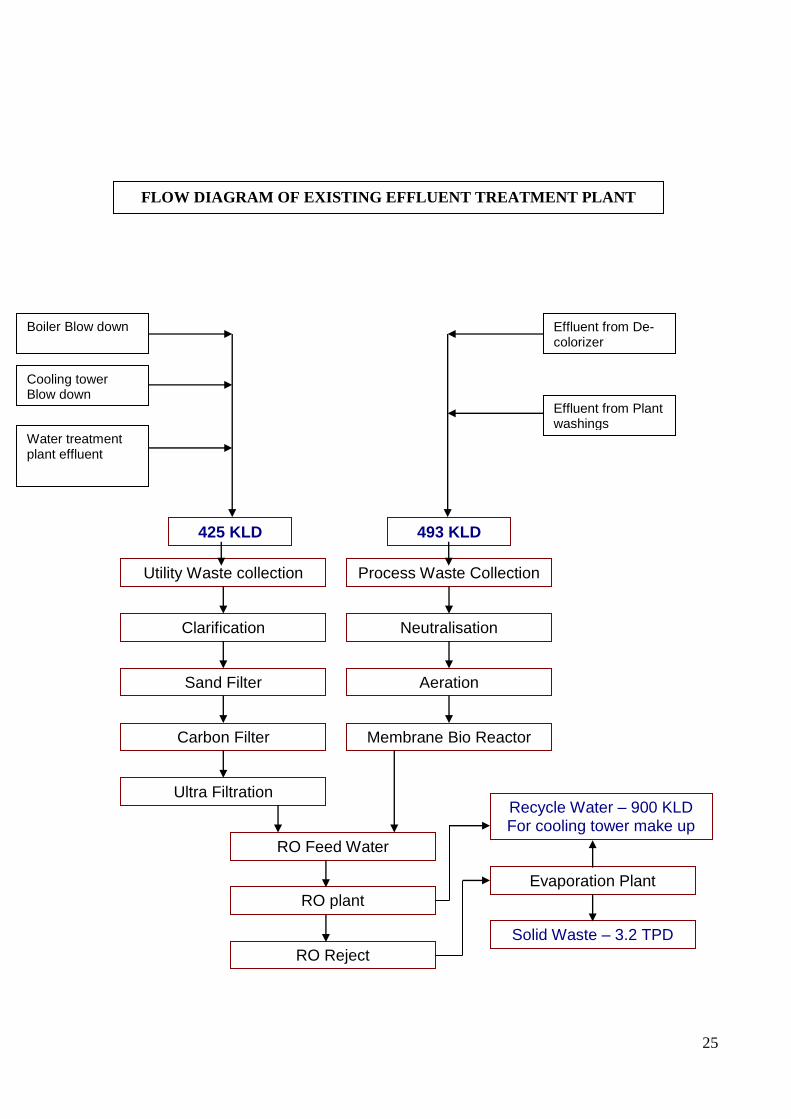
Utility Waste collection
Clarification
Sand Filter
Carbon Filter
Ultra Filtration
RO Feed Water
Process Waste Collection
Neutralisation
Aeration
Membrane Bio Reactor
RO Reject
Evaporation Plant
425 KLD 493 KLD
RO plant
Recycle Water – 900 KLD For cooling tower make up
Solid Waste – 3.2 TPD
Boiler Blow down
Cooling tower Blow down
Water treatment plant effluent
Effluent from De-colorizer
Effluent from Plant washings
FLOW DIAGRAM OF EXISTING EFFLUENT TREATMENT PLANT
26
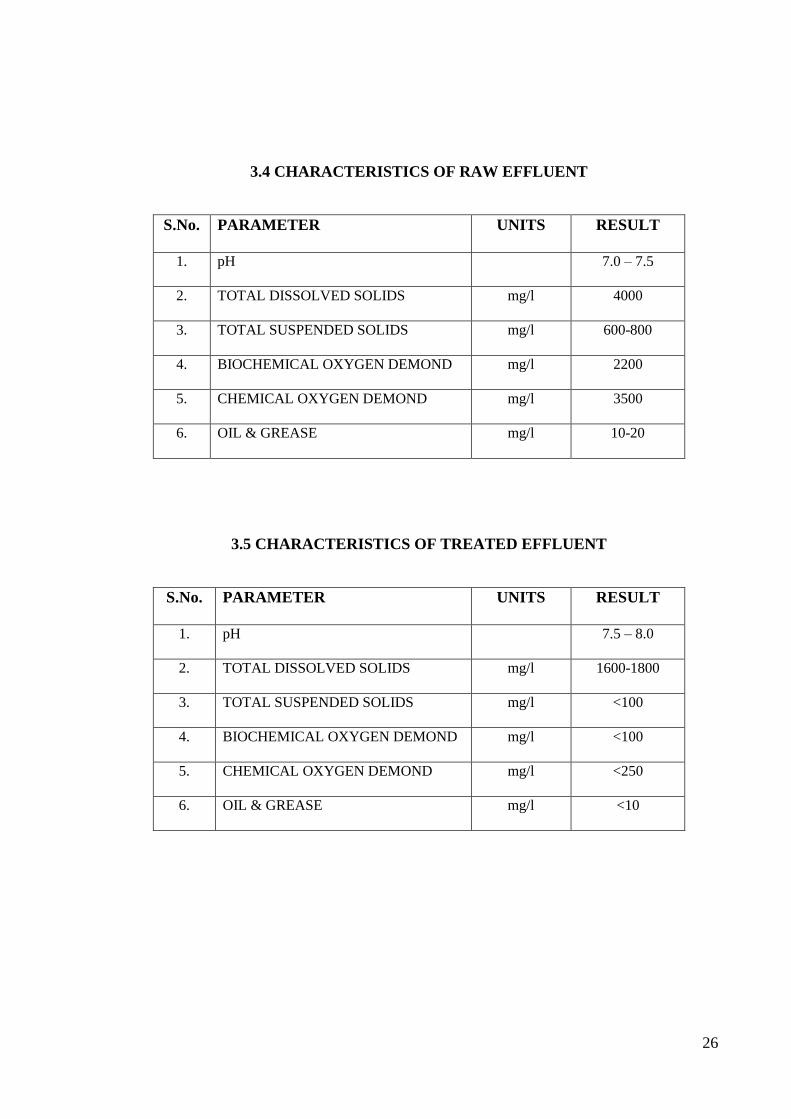
3.4 CHARACTERISTICS OF RAW EFFLUENT
S.No. PARAMETER UNITS RESULT
1. pH 7.0 – 7.5
2. TOTAL DISSOLVED SOLIDS mg/l 4000
3. TOTAL SUSPENDED SOLIDS mg/l 600-800
4. BIOCHEMICAL OXYGEN DEMOND mg/l 2200
5. CHEMICAL OXYGEN DEMOND mg/l 3500
6. OIL & GREASE mg/l 10-20
3.5 CHARACTERISTICS OF TREATED EFFLUENT
S.No. PARAMETER UNITS RESULT
1. pH 7.5 – 8.0
2. TOTAL DISSOLVED SOLIDS mg/l 1600-1800
3. TOTAL SUSPENDED SOLIDS mg/l <100
4. BIOCHEMICAL OXYGEN DEMOND mg/l <100
5. CHEMICAL OXYGEN DEMOND mg/l <250
6. OIL & GREASE mg/l <10
27
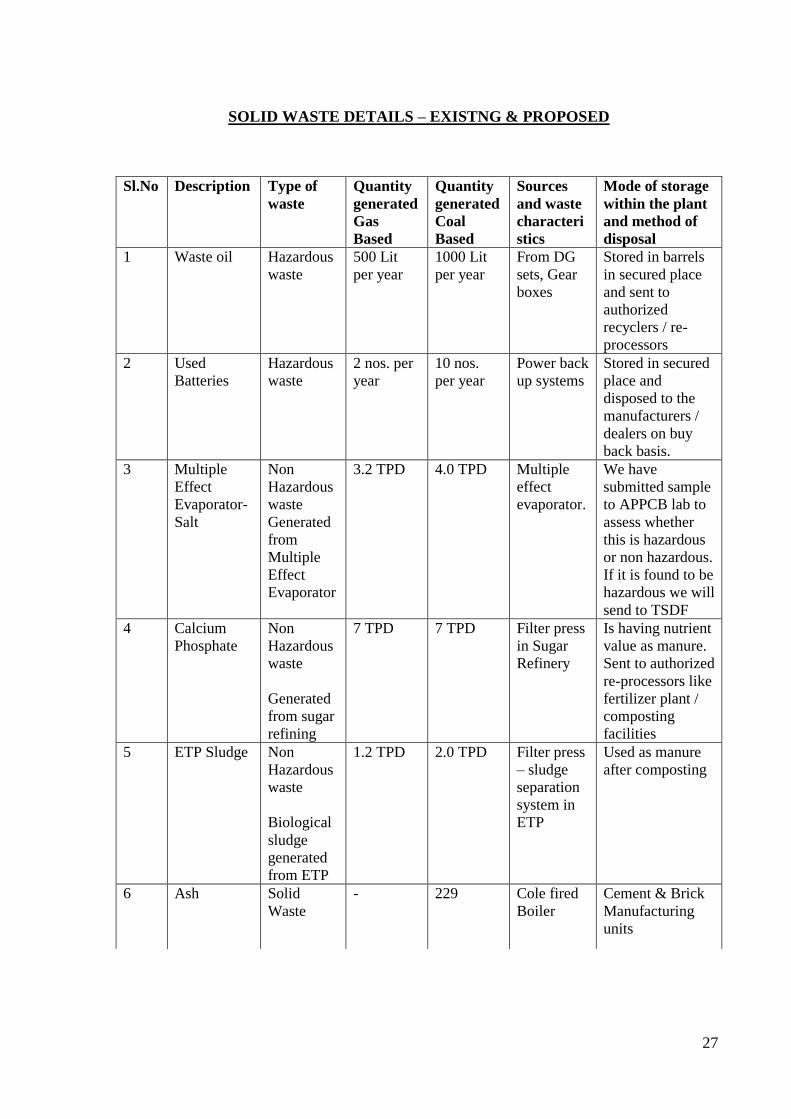
SOLID WASTE DETAILS – EXISTNG & PROPOSED
Sl.No Description Type of
waste
Quantity
generated
Gas
Based
Quantity
generated
Coal
Based
Sources
and waste
characteri
stics
Mode of storage
within the plant
and method of
disposal
1 Waste oil Hazardous
waste
500 Lit
per year
1000 Lit
per year
From DG
sets, Gear
boxes
Stored in barrels
in secured place
and sent to
authorized
recyclers / re-
processors
2 Used
Batteries
Hazardous
waste
2 nos. per
year
10 nos.
per year
Power back
up systems
Stored in secured
place and
disposed to the
manufacturers /
dealers on buy
back basis.
3 Multiple
Effect
Evaporator-
Salt
Non
Hazardous
waste
Generated
from
Multiple
Effect
Evaporator
3.2 TPD 4.0 TPD Multiple
effect
evaporator.
We have
submitted sample
to APPCB lab to
assess whether
this is hazardous
or non hazardous.
If it is found to be
hazardous we will
send to TSDF
4 Calcium
Phosphate
Non
Hazardous
waste
Generated
from sugar
refining
7 TPD 7 TPD Filter press
in Sugar
Refinery
Is having nutrient
value as manure.
Sent to authorized
re-processors like
fertilizer plant /
composting
facilities
5 ETP Sludge Non
Hazardous
waste
Biological
sludge
generated
from ETP
1.2 TPD 2.0 TPD Filter press
– sludge
separation
system in
ETP
Used as manure
after composting
6 Ash Solid
Waste
- 229 Cole fired
Boiler
Cement & Brick
Manufacturing
units
28
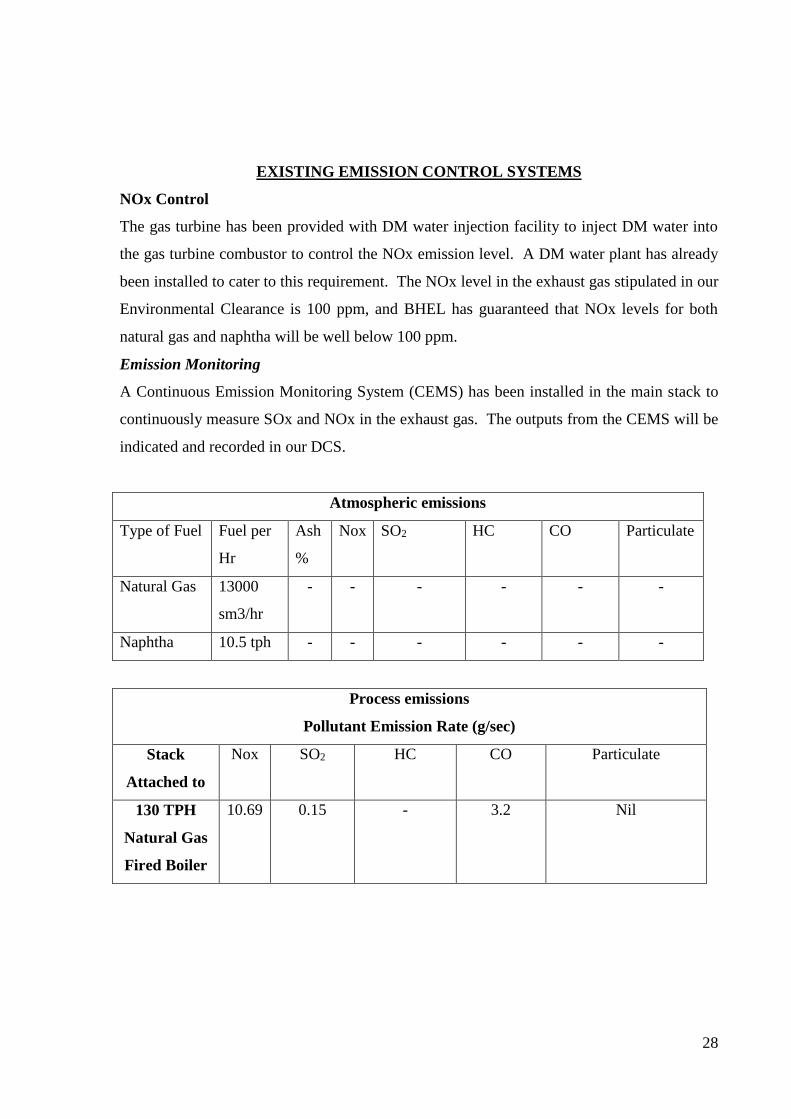
EXISTING EMISSION CONTROL SYSTEMS
NOx Control
The gas turbine has been provided with DM water injection facility to inject DM water into
the gas turbine combustor to control the NOx emission level. A DM water plant has already
been installed to cater to this requirement. The NOx level in the exhaust gas stipulated in our
Environmental Clearance is 100 ppm, and BHEL has guaranteed that NOx levels for both
natural gas and naphtha will be well below 100 ppm.
Emission Monitoring
A Continuous Emission Monitoring System (CEMS) has been installed in the main stack to
continuously measure SOx and NOx in the exhaust gas. The outputs from the CEMS will be
indicated and recorded in our DCS.
Atmospheric emissions
Type of Fuel Fuel per
Hr
Ash
%
Nox SO2 HC CO Particulate
Natural Gas 13000
sm3/hr
- - - - - -
Naphtha 10.5 tph - - - - - -
Process emissions
Pollutant Emission Rate (g/sec)
Stack
Attached to
Nox SO2 HC CO Particulate
130 TPH
Natural Gas
Fired Boiler
10.69 0.15 - 3.2 Nil
29
PROPOSED EMISSION CONTROL
SYSTEM FOR COAL FIRED BOILER
30
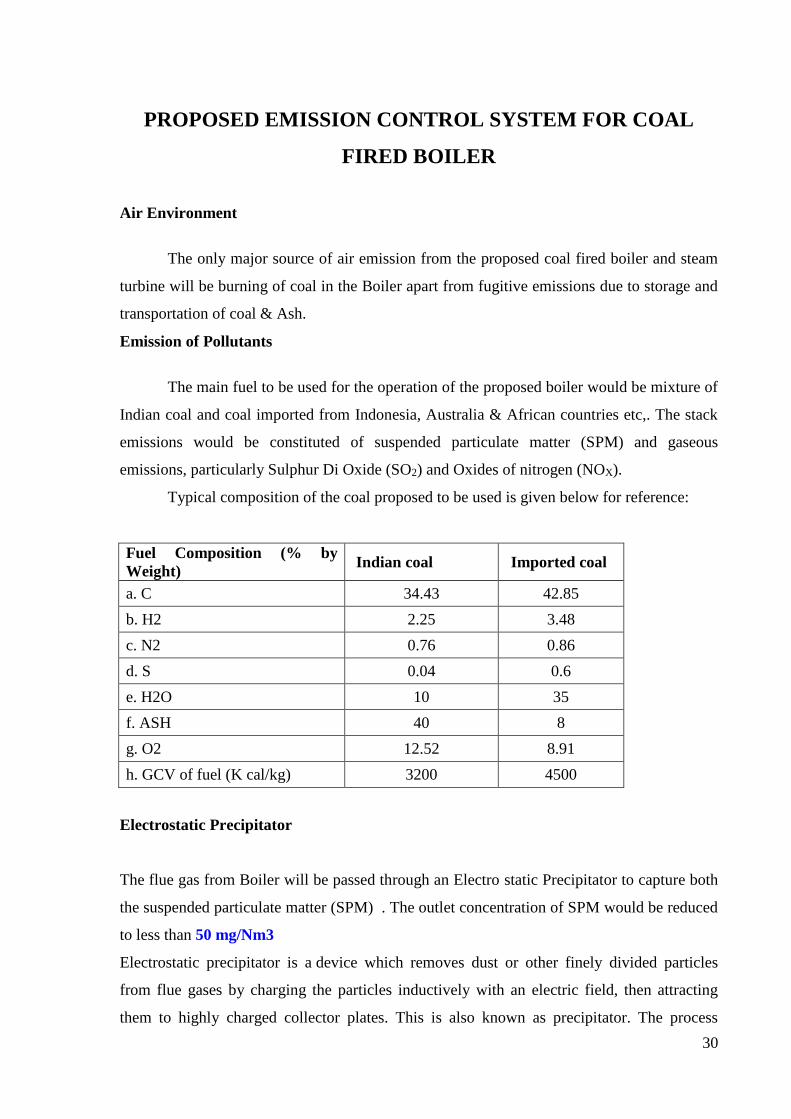
PROPOSED EMISSION CONTROL SYSTEM FOR COAL
FIRED BOILER
Air Environment
The only major source of air emission from the proposed coal fired boiler and steam
turbine will be burning of coal in the Boiler apart from fugitive emissions due to storage and
transportation of coal & Ash.
Emission of Pollutants
The main fuel to be used for the operation of the proposed boiler would be mixture of
Indian coal and coal imported from Indonesia, Australia & African countries etc,. The stack
emissions would be constituted of suspended particulate matter (SPM) and gaseous
emissions, particularly Sulphur Di Oxide (SO2) and Oxides of nitrogen (NOX).
Typical composition of the coal proposed to be used is given below for reference:
Fuel Composition (% by
Weight) Indian coal Imported coal
a. C 34.43 42.85
b. H2 2.25 3.48
c. N2 0.76 0.86
d. S 0.04 0.6
e. H2O 10 35
f. ASH 40 8
g. O2 12.52 8.91
h. GCV of fuel (K cal/kg) 3200 4500
Electrostatic Precipitator
The flue gas from Boiler will be passed through an Electro static Precipitator to capture both
the suspended particulate matter (SPM) . The outlet concentration of SPM would be reduced
to less than 50 mg/Nm3
Electrostatic precipitator is a device which removes dust or other finely divided particles
from flue gases by charging the particles inductively with an electric field, then attracting
them to highly charged collector plates. This is also known as precipitator. The process
31
depends on two steps. In the first step the suspension passes through an electric discharge
(corona discharge) area where ionization of the gas occurs. The ions produced collide with
the suspended particles and confer on them an electric charge. The charged particles drift
toward an electrode of opposite sign and are deposited on the electrode where their electric
charge is neutralized. The phenomenon would be more correctly designated as electrode
position from the gas phase. Pnuematic conveying system will be employed for extraction of
flyash from the ESP
Gaseous emissions
Sulphur is present to an extent of 0.5% in Indian coal and up to 0.8% in imported coal
received from Indonesia. When mixture of both the coals is fired in the boiler, it generates
suplhur dioxide to the tune of about 310 Kgs/Hr. The stack and emission characteristics are
presented in the following Table
Emission details
Particulars Value
Stack height
Number of stacks
Volume Flow Rate (m3/s)
Temperature of flue gas (°C)
Density of Flue Gas
85 m
1
35.8
145
0.858
The rate of SO2 emission using Indian and Imported coal mixture is given below
SO2 emission = 309.88 kg/hr
Stack height calculation:
H = 14 Q0.3
Where, H = height of the Stack
Q = SO2 Concentration in Kg/hr.
Hence Q = 309.88 Kg/hr.
Hence H = 78.25 m
32
To be on the safer side it is decided to go for a Stack Height of 85 meters.
Nitrous Oxide (NOx)
Emission of Nitrous oxide in flue gas will be less than 250 PPM
Air pollution monitoring system
Presence of SO2, NOx, CO will be monitored through an online stack emission monitoring
system and the emissions will be controlled within limits effectively using the data captured
through the on line system. Suspended particulate matter (SPM) and Respirable Particulate
Matter (RPM) present in the flue gas will be monitored at the frequency of once in fortnight.
Ambient air quality will be monitored once in a fortnight at four locations of the site. SPM,
RPM, SO2, NOx and CO will be monitored in ambient air quality measurement.
During Construction Phase
During excavation and transportation over roads near the proposed boiler house area, there is
a scope for local dust emissions. Frequent water sprinkling in the vicinity of the construction
activity is proposed to be done. It is proposed to make provision for water sprinklers.
Coal storage:
There is a possibility of coal dust to fly from the coal storage yard. To avoid this, we propose
to construct covered shed and coal will be stored in such covered shed. Over and above this
arrangement, water sprinklers will be provided in such shed to suppress the coal dust.
Coal dust emission from coal crushers
There is a possibility of coal dust emission from the proposed coal crusher house. Hence
suitable dust extraction cum bag filter arrangement will be installed to suck the dust coming
out of crusher house.
Coal dust emission from coal conveyors
All coal transporting conveyors will be covered with metallic sheet to prevent flying of dust
at the time of coal transportation through conveyors. In order to prevent the coal dust
33
emission from the conveyor transfer points, dust extraction hoods with bag filter will be
installed.
Dust emission from Roads
All internal roads will be asphalted to avoid generation of dust due to movement of vehicles
carrying both coal and ash. In addition to this water spray system also will be established
along side of the road to suppress the dust generation if any.
Ash handling system:
Fly ash has the potential to create air pollution. In order to eliminate this, right from the stage
of electrostatic precipitator the primary ash generation point to the ash storage silos, ash will
be handled only in closed pipes through pneumatic conveying system. Ash from silos will be
filled in covered trucks to avoid flying of ash at the time of transportation.
Handling of solid waste generated out of boiler system:
Ash is the only solid waste generated from the proposed coal fired boiler and turbine system.
Ash generated in the boiler will be safely collected in storage silos without any spills.
Such collected ash will be filled in covered trucks and transported mainly to the cement
industry for the production of cement. Apart from cement manufacture, ash will be supplied
for the manufacture of fly ash bricks, construction of roads etc., as specified in the fly ash
notification.
Green Belt development:
Since there is likelihood of dust emission from the coal handling and storage system, we will
develop green belt along the boundaries of the proposed boiler house and storage area. Apart
from this we will also develop green belt as an ongoing activity.
34
CHAPTER-IV
PREDICTION OF IMPACTS
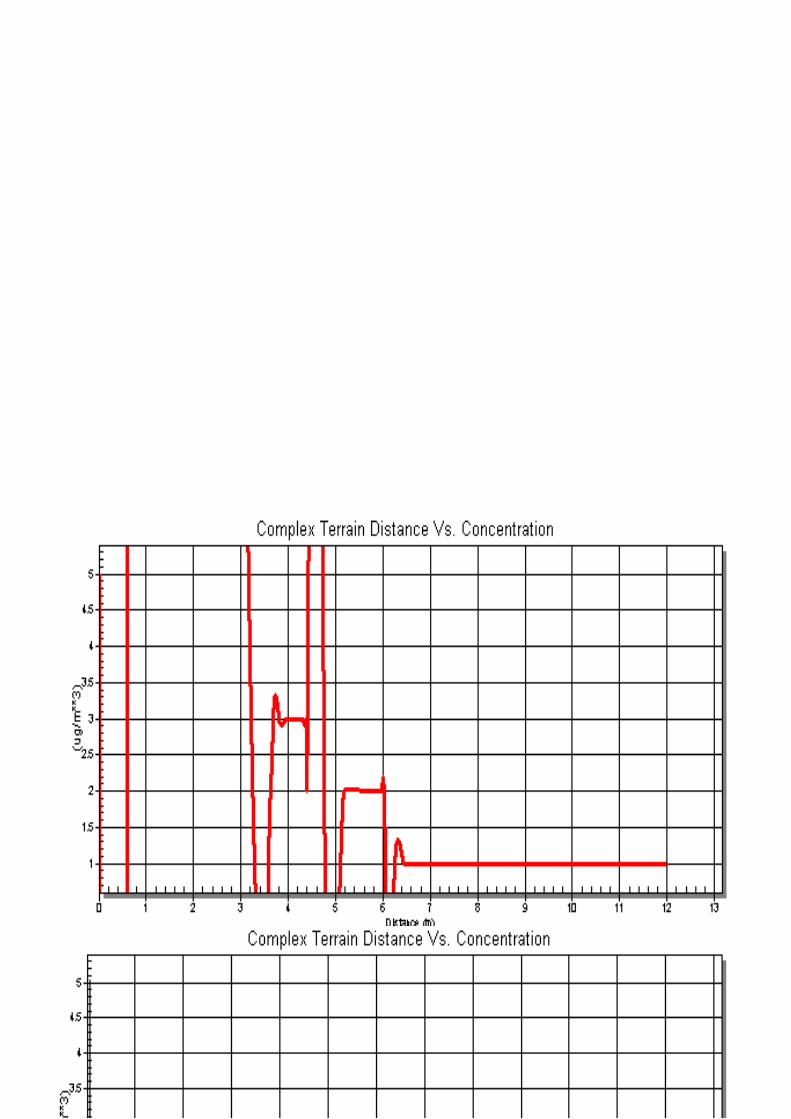
REDICTED GROUND LEVEL CONCENTRATIONS
AR QUALITY MODELLING FOR SO2 DISPERSION
SILK ROAD SUGARS LIMITED 16/09/11
10:25:52
35
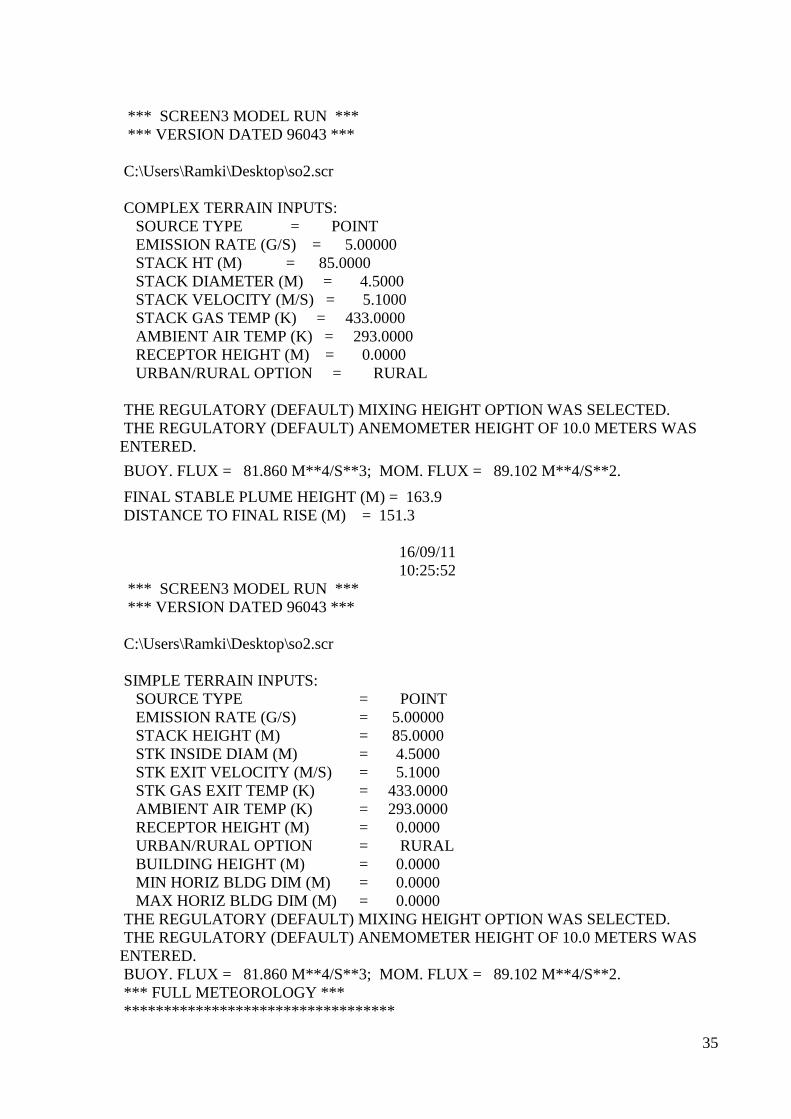
*** SCREEN3 MODEL RUN ***
*** VERSION DATED 96043 ***
C:\Users\Ramki\Desktop\so2.scr
COMPLEX TERRAIN INPUTS:
SOURCE TYPE = POINT
EMISSION RATE (G/S) = 5.00000
STACK HT (M) = 85.0000
STACK DIAMETER (M) = 4.5000
STACK VELOCITY (M/S) = 5.1000
STACK GAS TEMP (K) = 433.0000
AMBIENT AIR TEMP (K) = 293.0000
RECEPTOR HEIGHT (M) = 0.0000
URBAN/RURAL OPTION = RURAL
THE REGULATORY (DEFAULT) MIXING HEIGHT OPTION WAS SELECTED.
THE REGULATORY (DEFAULT) ANEMOMETER HEIGHT OF 10.0 METERS WAS
ENTERED.
BUOY. FLUX = 81.860 M**4/S**3; MOM. FLUX = 89.102 M**4/S**2.
FINAL STABLE PLUME HEIGHT (M) = 163.9
DISTANCE TO FINAL RISE (M) = 151.3
16/09/11
10:25:52
*** SCREEN3 MODEL RUN ***
*** VERSION DATED 96043 ***
C:\Users\Ramki\Desktop\so2.scr
SIMPLE TERRAIN INPUTS:
SOURCE TYPE = POINT
EMISSION RATE (G/S) = 5.00000
STACK HEIGHT (M) = 85.0000
STK INSIDE DIAM (M) = 4.5000
STK EXIT VELOCITY (M/S) = 5.1000
STK GAS EXIT TEMP (K) = 433.0000
AMBIENT AIR TEMP (K) = 293.0000
RECEPTOR HEIGHT (M) = 0.0000
URBAN/RURAL OPTION = RURAL
BUILDING HEIGHT (M) = 0.0000
MIN HORIZ BLDG DIM (M) = 0.0000
MAX HORIZ BLDG DIM (M) = 0.0000
THE REGULATORY (DEFAULT) MIXING HEIGHT OPTION WAS SELECTED.
THE REGULATORY (DEFAULT) ANEMOMETER HEIGHT OF 10.0 METERS WAS
ENTERED.
BUOY. FLUX = 81.860 M**4/S**3; MOM. FLUX = 89.102 M**4/S**2.
*** FULL METEOROLOGY ***
**********************************
36
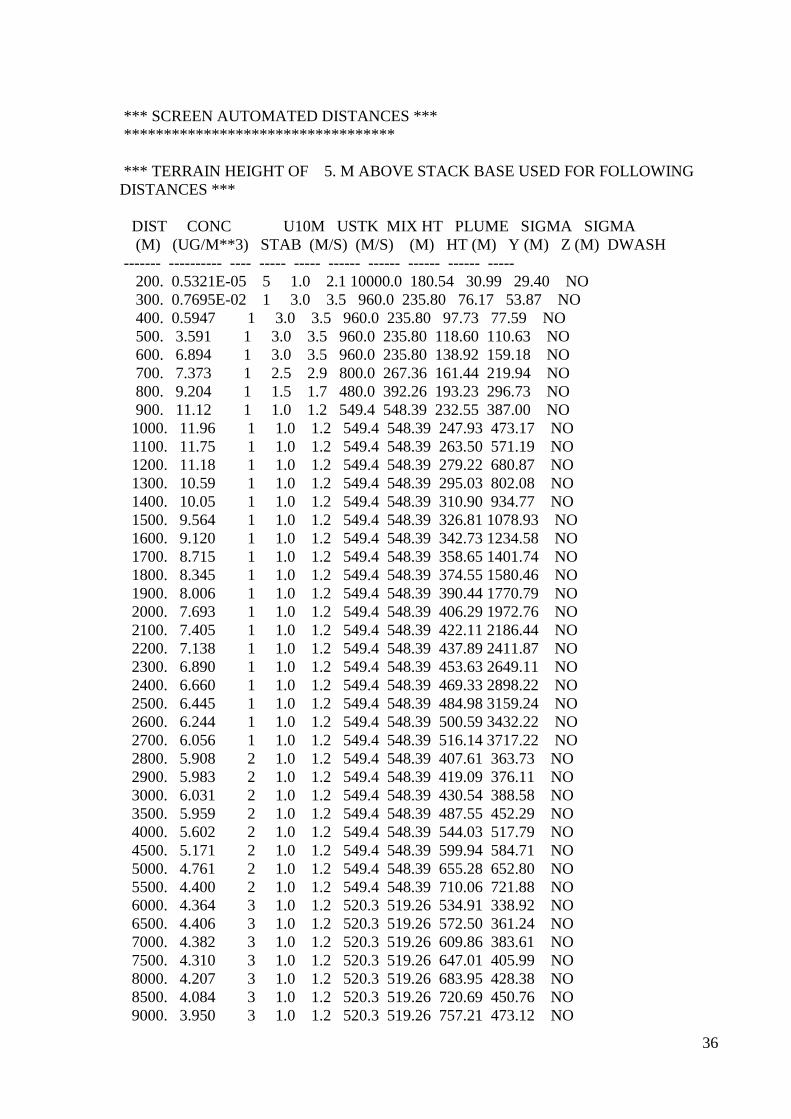
*** SCREEN AUTOMATED DISTANCES ***
**********************************
*** TERRAIN HEIGHT OF 5. M ABOVE STACK BASE USED FOR FOLLOWING
DISTANCES ***
DIST CONC U10M USTK MIX HT PLUME SIGMA SIGMA
(M) (UG/M**3) STAB (M/S) (M/S) (M) HT (M) Y (M) Z (M) DWASH
------- ---------- ---- ----- ----- ------ ------ ------ ------ -----
200. 0.5321E-05 5 1.0 2.1 10000.0 180.54 30.99 29.40 NO
300. 0.7695E-02 1 3.0 3.5 960.0 235.80 76.17 53.87 NO
400. 0.5947 1 3.0 3.5 960.0 235.80 97.73 77.59 NO
500. 3.591 1 3.0 3.5 960.0 235.80 118.60 110.63 NO
600. 6.894 1 3.0 3.5 960.0 235.80 138.92 159.18 NO
700. 7.373 1 2.5 2.9 800.0 267.36 161.44 219.94 NO
800. 9.204 1 1.5 1.7 480.0 392.26 193.23 296.73 NO
900. 11.12 1 1.0 1.2 549.4 548.39 232.55 387.00 NO
1000. 11.96 1 1.0 1.2 549.4 548.39 247.93 473.17 NO
1100. 11.75 1 1.0 1.2 549.4 548.39 263.50 571.19 NO
1200. 11.18 1 1.0 1.2 549.4 548.39 279.22 680.87 NO
1300. 10.59 1 1.0 1.2 549.4 548.39 295.03 802.08 NO
1400. 10.05 1 1.0 1.2 549.4 548.39 310.90 934.77 NO
1500. 9.564 1 1.0 1.2 549.4 548.39 326.81 1078.93 NO
1600. 9.120 1 1.0 1.2 549.4 548.39 342.73 1234.58 NO
1700. 8.715 1 1.0 1.2 549.4 548.39 358.65 1401.74 NO
1800. 8.345 1 1.0 1.2 549.4 548.39 374.55 1580.46 NO
1900. 8.006 1 1.0 1.2 549.4 548.39 390.44 1770.79 NO
2000. 7.693 1 1.0 1.2 549.4 548.39 406.29 1972.76 NO
2100. 7.405 1 1.0 1.2 549.4 548.39 422.11 2186.44 NO
2200. 7.138 1 1.0 1.2 549.4 548.39 437.89 2411.87 NO
2300. 6.890 1 1.0 1.2 549.4 548.39 453.63 2649.11 NO
2400. 6.660 1 1.0 1.2 549.4 548.39 469.33 2898.22 NO
2500. 6.445 1 1.0 1.2 549.4 548.39 484.98 3159.24 NO
2600. 6.244 1 1.0 1.2 549.4 548.39 500.59 3432.22 NO
2700. 6.056 1 1.0 1.2 549.4 548.39 516.14 3717.22 NO
2800. 5.908 2 1.0 1.2 549.4 548.39 407.61 363.73 NO
2900. 5.983 2 1.0 1.2 549.4 548.39 419.09 376.11 NO
3000. 6.031 2 1.0 1.2 549.4 548.39 430.54 388.58 NO
3500. 5.959 2 1.0 1.2 549.4 548.39 487.55 452.29 NO
4000. 5.602 2 1.0 1.2 549.4 548.39 544.03 517.79 NO
4500. 5.171 2 1.0 1.2 549.4 548.39 599.94 584.71 NO
5000. 4.761 2 1.0 1.2 549.4 548.39 655.28 652.80 NO
5500. 4.400 2 1.0 1.2 549.4 548.39 710.06 721.88 NO
6000. 4.364 3 1.0 1.2 520.3 519.26 534.91 338.92 NO
6500. 4.406 3 1.0 1.2 520.3 519.26 572.50 361.24 NO
7000. 4.382 3 1.0 1.2 520.3 519.26 609.86 383.61 NO
7500. 4.310 3 1.0 1.2 520.3 519.26 647.01 405.99 NO
8000. 4.207 3 1.0 1.2 520.3 519.26 683.95 428.38 NO
8500. 4.084 3 1.0 1.2 520.3 519.26 720.69 450.76 NO
9000. 3.950 3 1.0 1.2 520.3 519.26 757.21 473.12 NO
37
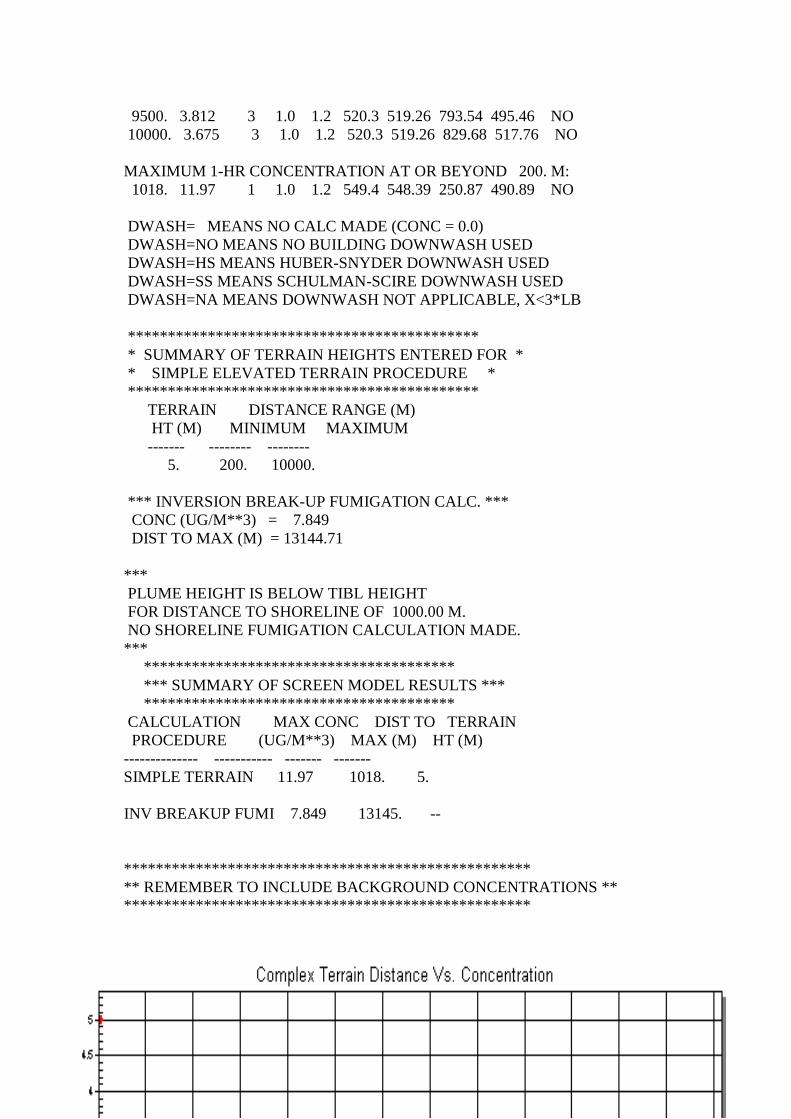
9500. 3.812 3 1.0 1.2 520.3 519.26 793.54 495.46 NO
10000. 3.675 3 1.0 1.2 520.3 519.26 829.68 517.76 NO
MAXIMUM 1-HR CONCENTRATION AT OR BEYOND 200. M:
1018. 11.97 1 1.0 1.2 549.4 548.39 250.87 490.89 NO
DWASH= MEANS NO CALC MADE (CONC = 0.0)
DWASH=NO MEANS NO BUILDING DOWNWASH USED
DWASH=HS MEANS HUBER-SNYDER DOWNWASH USED
DWASH=SS MEANS SCHULMAN-SCIRE DOWNWASH USED
DWASH=NA MEANS DOWNWASH NOT APPLICABLE, X<3*LB
********************************************
* SUMMARY OF TERRAIN HEIGHTS ENTERED FOR *
* SIMPLE ELEVATED TERRAIN PROCEDURE *
********************************************
TERRAIN DISTANCE RANGE (M)
HT (M) MINIMUM MAXIMUM
------- -------- --------
5. 200. 10000.
*** INVERSION BREAK-UP FUMIGATION CALC. ***
CONC (UG/M**3) = 7.849
DIST TO MAX (M) = 13144.71
***
PLUME HEIGHT IS BELOW TIBL HEIGHT
FOR DISTANCE TO SHORELINE OF 1000.00 M.
NO SHORELINE FUMIGATION CALCULATION MADE.
***
***************************************
*** SUMMARY OF SCREEN MODEL RESULTS ***
***************************************
CALCULATION MAX CONC DIST TO TERRAIN
PROCEDURE (UG/M**3) MAX (M) HT (M)
-------------- ----------- ------- -------
SIMPLE TERRAIN 11.97 1018. 5.
INV BREAKUP FUMI 7.849 13145. --
***************************************************
** REMEMBER TO INCLUDE BACKGROUND CONCENTRATIONS **
***************************************************
38
39
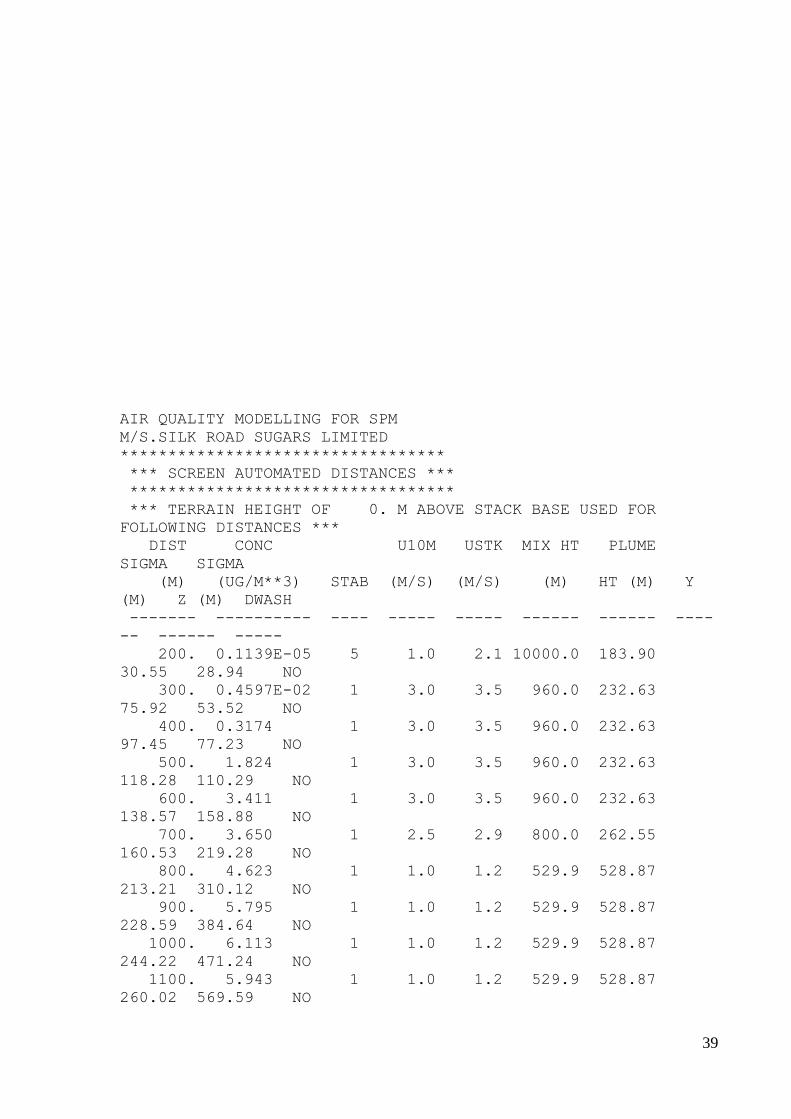
AIR QUALITY MODELLING FOR SPM
M/S.SILK ROAD SUGARS LIMITED
**********************************
*** SCREEN AUTOMATED DISTANCES ***
**********************************
*** TERRAIN HEIGHT OF 0. M ABOVE STACK BASE USED FOR
FOLLOWING DISTANCES ***
DIST CONC U10M USTK MIX HT PLUME
SIGMA SIGMA
(M) (UG/M**3) STAB (M/S) (M/S) (M) HT (M) Y
(M) Z (M) DWASH
------- ---------- ---- ----- ----- ------ ------ ----
-- ------ -----
200. 0.1139E-05 5 1.0 2.1 10000.0 183.90
30.55 28.94 NO
300. 0.4597E-02 1 3.0 3.5 960.0 232.63
75.92 53.52 NO
400. 0.3174 1 3.0 3.5 960.0 232.63
97.45 77.23 NO
500. 1.824 1 3.0 3.5 960.0 232.63
118.28 110.29 NO
600. 3.411 1 3.0 3.5 960.0 232.63
138.57 158.88 NO
700. 3.650 1 2.5 2.9 800.0 262.55
160.53 219.28 NO
800. 4.623 1 1.0 1.2 529.9 528.87
213.21 310.12 NO
900. 5.795 1 1.0 1.2 529.9 528.87
228.59 384.64 NO
1000. 6.113 1 1.0 1.2 529.9 528.87
244.22 471.24 NO
1100. 5.943 1 1.0 1.2 529.9 528.87
260.02 569.59 NO
40
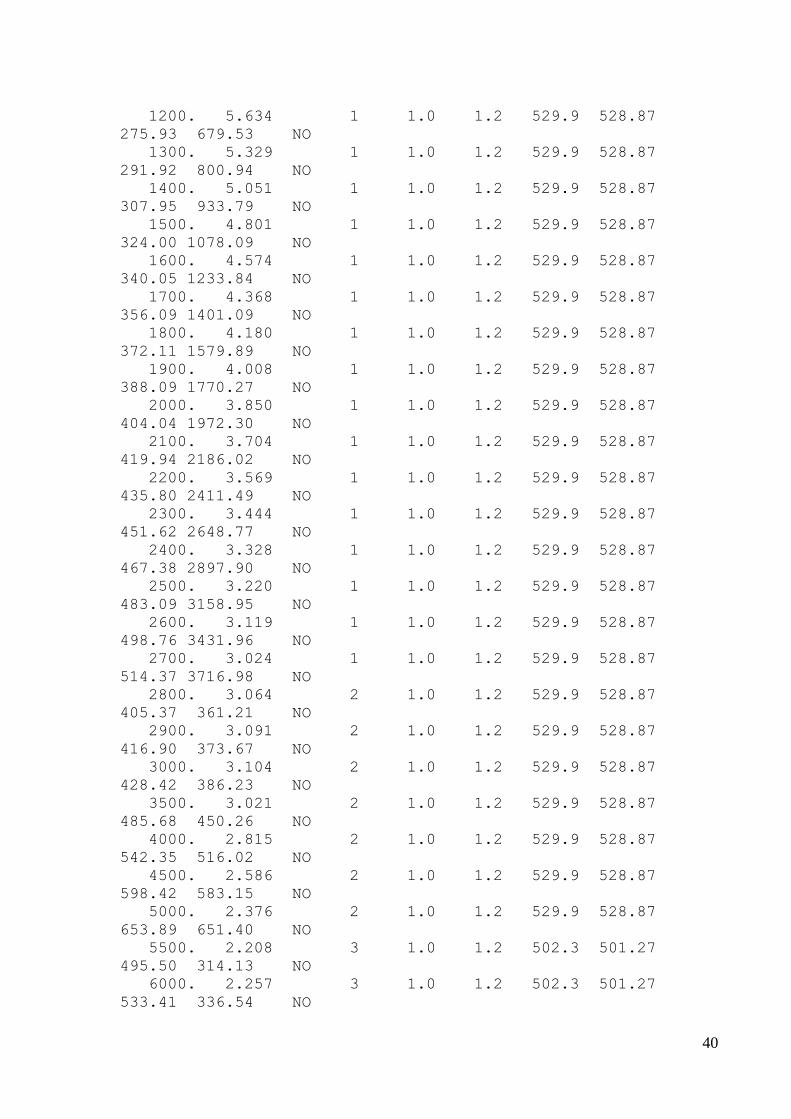
1200. 5.634 1 1.0 1.2 529.9 528.87
275.93 679.53 NO
1300. 5.329 1 1.0 1.2 529.9 528.87
291.92 800.94 NO
1400. 5.051 1 1.0 1.2 529.9 528.87
307.95 933.79 NO
1500. 4.801 1 1.0 1.2 529.9 528.87
324.00 1078.09 NO
1600. 4.574 1 1.0 1.2 529.9 528.87
340.05 1233.84 NO
1700. 4.368 1 1.0 1.2 529.9 528.87
356.09 1401.09 NO
1800. 4.180 1 1.0 1.2 529.9 528.87
372.11 1579.89 NO
1900. 4.008 1 1.0 1.2 529.9 528.87
388.09 1770.27 NO
2000. 3.850 1 1.0 1.2 529.9 528.87
404.04 1972.30 NO
2100. 3.704 1 1.0 1.2 529.9 528.87
419.94 2186.02 NO
2200. 3.569 1 1.0 1.2 529.9 528.87
435.80 2411.49 NO
2300. 3.444 1 1.0 1.2 529.9 528.87
451.62 2648.77 NO
2400. 3.328 1 1.0 1.2 529.9 528.87
467.38 2897.90 NO
2500. 3.220 1 1.0 1.2 529.9 528.87
483.09 3158.95 NO
2600. 3.119 1 1.0 1.2 529.9 528.87
498.76 3431.96 NO
2700. 3.024 1 1.0 1.2 529.9 528.87
514.37 3716.98 NO
2800. 3.064 2 1.0 1.2 529.9 528.87
405.37 361.21 NO
2900. 3.091 2 1.0 1.2 529.9 528.87
416.90 373.67 NO
3000. 3.104 2 1.0 1.2 529.9 528.87
428.42 386.23 NO
3500. 3.021 2 1.0 1.2 529.9 528.87
485.68 450.26 NO
4000. 2.815 2 1.0 1.2 529.9 528.87
542.35 516.02 NO
4500. 2.586 2 1.0 1.2 529.9 528.87
598.42 583.15 NO
5000. 2.376 2 1.0 1.2 529.9 528.87
653.89 651.40 NO
5500. 2.208 3 1.0 1.2 502.3 501.27
495.50 314.13 NO
6000. 2.257 3 1.0 1.2 502.3 501.27
533.41 336.54 NO
41
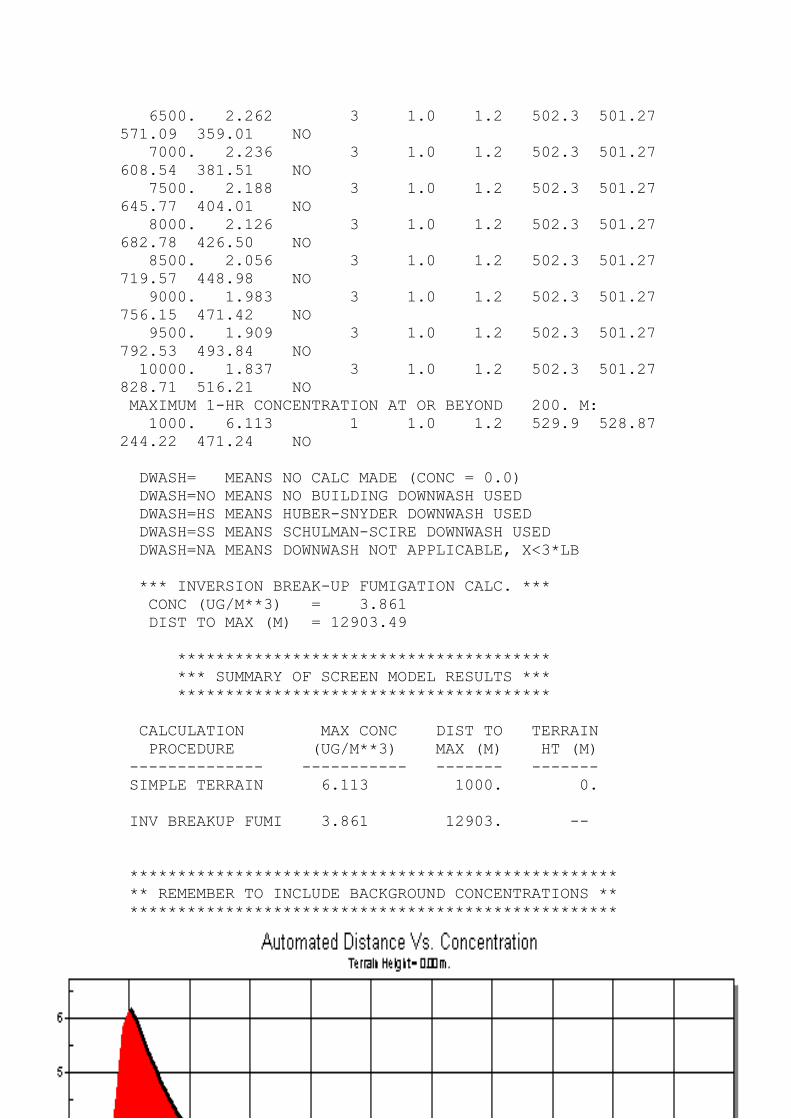
6500. 2.262 3 1.0 1.2 502.3 501.27
571.09 359.01 NO
7000. 2.236 3 1.0 1.2 502.3 501.27
608.54 381.51 NO
7500. 2.188 3 1.0 1.2 502.3 501.27
645.77 404.01 NO
8000. 2.126 3 1.0 1.2 502.3 501.27
682.78 426.50 NO
8500. 2.056 3 1.0 1.2 502.3 501.27
719.57 448.98 NO
9000. 1.983 3 1.0 1.2 502.3 501.27
756.15 471.42 NO
9500. 1.909 3 1.0 1.2 502.3 501.27
792.53 493.84 NO
10000. 1.837 3 1.0 1.2 502.3 501.27
828.71 516.21 NO
MAXIMUM 1-HR CONCENTRATION AT OR BEYOND 200. M:
1000. 6.113 1 1.0 1.2 529.9 528.87
244.22 471.24 NO
DWASH= MEANS NO CALC MADE (CONC = 0.0)
DWASH=NO MEANS NO BUILDING DOWNWASH USED
DWASH=HS MEANS HUBER-SNYDER DOWNWASH USED
DWASH=SS MEANS SCHULMAN-SCIRE DOWNWASH USED
DWASH=NA MEANS DOWNWASH NOT APPLICABLE, X<3*LB
*** INVERSION BREAK-UP FUMIGATION CALC. ***
CONC (UG/M**3) = 3.861
DIST TO MAX (M) = 12903.49
***************************************
*** SUMMARY OF SCREEN MODEL RESULTS ***
***************************************
CALCULATION MAX CONC DIST TO TERRAIN
PROCEDURE (UG/M**3) MAX (M) HT (M)
-------------- ----------- ------- -------
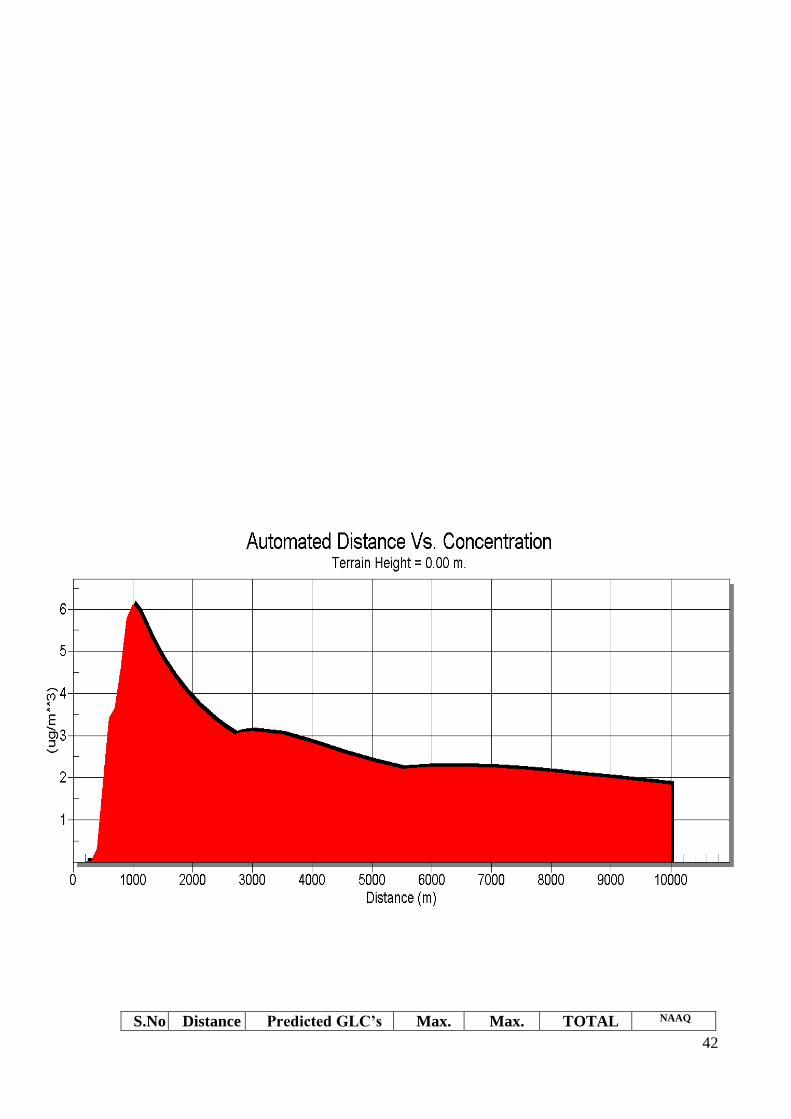
SIMPLE TERRAIN 6.113 1000. 0.
INV BREAKUP FUMI 3.861 12903. --
***************************************************
** REMEMBER TO INCLUDE BACKGROUND CONCENTRATIONS **
***************************************************
42
S.No Distance Predicted GLC’s Max. Max. TOTAL NAAQ
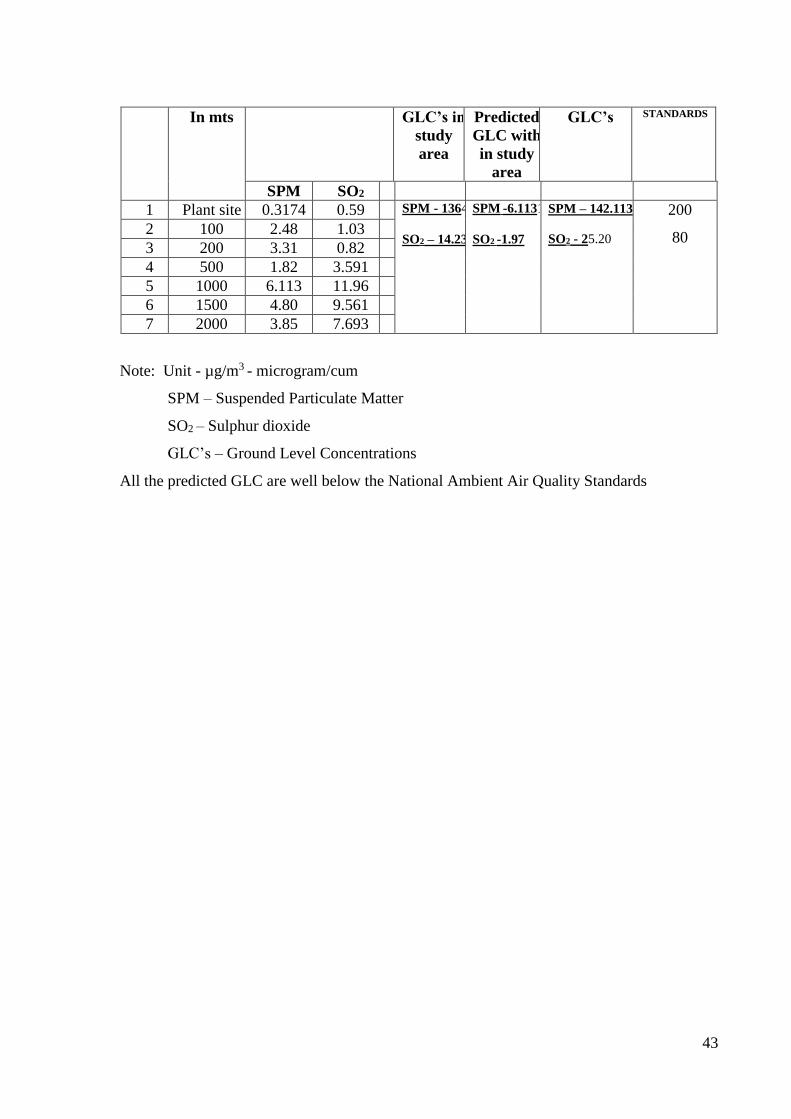
43
In mts GLC’s in
study
area
Predicted
GLC with
in study
area
GLC’s STANDARDS
SPM SO2
1 Plant site 0.3174 0.59 SPM - 1364
SO2 – 14.23
SPM -6.1131
SO2 -1.97
SPM – 142.113
SO2 - 25.20
200
80
2 100 2.48 1.03
3 200 3.31 0.82
4 500 1.82 3.591
5 1000 6.113 11.96
6 1500 4.80 9.561
7 2000 3.85 7.693
Note: Unit - µg/m3 - microgram/cum
SPM – Suspended Particulate Matter
SO2 – Sulphur dioxide
GLC’s – Ground Level Concentrations
All the predicted GLC are well below the National Ambient Air Quality Standards
44
CHAPTER-V
CONTROLING PARAMETERS FOR
TREATMENT PLANT
45
5.1 CONTROLLING PARAMETERS FOR TREATMENT PLANT
Various parameters play an Important role in smooth running of the treatment plant, some
important parameters and their effects on the plant are:
pH
The pH of the effluent entering the aeration tank has to be carefully monitored. The pH
should invariably maintained neutral. If the pH falls below 6.5 the fungi compeate with
bacteria and if the pH is above 8.5 the rate of metabolism in bacteria decreases.
FOOD TO MICROBES RATIO
The concentration of organic food substrate per unit mass of active biological solids present
in the aeration tank is termed as F/M ratio. If F/M ratio is not maintained within the
prescribed limits the efficiency of treatment is reduced. Proper F/M ratio results in good
sludge settlement.
F/M ratio can be defined as KgBOD5 applied / kg MLVSS. Hence to calculate F/M ratio the
BOD value has to be know. But as BOD test results are obtained after 3 days. COD is used
for calculating BOD of using BOD to COD ratio. F/M ratio of 0.14 has to be maintained in
this plant.
MIXED LIQUOR SUSPENDED SOLIDS
The concentration of suspended solids in mixed liquor has to be checked daily. In the
aeration tank MLSS of 4000 mg/l has to be maintained. This is maintained by returning the
sludge from Membrane Bio Reactor (MBR) to the required amount. If MLSS is above
4000mg/l, sludge from aeration tank has to be wasted.
46
5.2 SLUDGE HANDLING AND DISPOSAL
RETURN SLUDGE
The sludge recycled to the aeration tank from the bottom of the clarifier is called return
sludge. This is done to maintain the MLSS.
The Functions of return sludge are
a) To read influent with active biological life.
b) To keep the sludge fresh
c) To dilute the influent coming into aeration tank
d) To prevent loss of sludge during storms
The condition of the return sludge is observed from the following action.
1) Presence of bacteria : The return sludge should contain bacteria, protozoa
etc.,
2) Sludge age : The return sludge should not be too old. As this might
result in inactive sludge.
3) Relative volume : It should be seen that there is no excess of MLSS
than prescribed.
EXCESS SLUDGE
The Excess Sludge from the Membrane Bio Reactor (MBR) is send to the filter tress feed
tank. The filtrate from filter tress is fed to aeration tank. The cake discharge from filter tress
is collected and used as manure.

47
CHAPTER-VI
ANALYSIS AND SIGNIFICANCE OF TESTS
48
6.0 ANLYSIS AND SIGNIFICANCE OF TESTS
Introduction
Analysis of water and wastewater is necessary right at the planning stage of any water
purification and wastewater treatment projects. Analysis can tell the correct characteristics of
water and waste water, which depends on the proper and economical solution to the problem
of treatment. It is aid in adjustments in operation and control it is an important tool in
conducting research on the unit process and to find out simple, economical and efficient
methods of treatment.
Purpose of Analysis
The essential purpose of wastewater analysis is to the concentration and condition of the
effluent from the treatment plants and the potential effects of its discharge into receiving
body of water or onto land. It is from the out come of the analysis we say that the effluent has
met prescribed standards.
Physical analysis
The determination made in physical analysis is may include temperature, colour, odor and
turbidity.
Chemical analysis
Chemical analysis include determination of pH, TDS, SS, DO, COD, BOD, fixed and
volatile solids etc.,
49
Significance of some common tests
Temperature
It has different types of significance in sedimentation, it reflects the viscosity of fluid, in
sewage treatment, if determines the rates of extortion of BOD because temperature is a vital
factor which determines the biological growth and activity.
Turbidity :Turbidity measures are generally restricted to water/occasionally used on
sewage effluents. Turbidity in water is caused by suspension of silt clay finely divided
organic matter, microscopic organisms.
Colour : Colour of natural water is due to dissolved or colloidal substances coming from
industrial wastes contain dyes and other coloring substances. The colour of sewage reflects
its strength and condition. Fresh Sewage is Grey and stale sewage is black in colour.
Odor : It is caused by volatile substances associated with organic matter, living
organisms give specific odors like distillery waters, tannery wastes.
Taste : Taste is due to presence of chloride or sulfate ions associated with sodium,
calcium and Magnesium ions.
pH : pH is measured by pH meter using glass electrode which generate a potential varying
linearly with the pH of the solution in which it is immersed.
Solids : Solids refer to matter suspended of dissolved in water or wastewater. Solids
affect water or effluent quality adversely in a number of ways. Analysis is important in
the control of biological and physical water treatment processes.
Total Solids : A well-mixed sample is evaporated in a weighed dish and dried to
constant weight in an oven at 103 to 105 degrees centigrade. The increase in weight over
that of the empty dish represents the total solids.
Calculation
Total Solids mg/l = (A-B) X 1000/volume of ml
50
A = Weight of dried residue + dish in mg
B = Weight of dish in mg
Total dissolved solids
A well-mixed sample is filtered though a glass fiber filter and the filtrate if evaporated to
dryness in a weighed dish and dried to constant weight represents the total dissolved solids.
Calculation
Total dissolved solids mg/l = (A-B)/ sample weight mg
A = Weight of dried residue + dish in mg.
B = Weight of dish in mg
Total suspended solids
A well-mixed sample is filtered through a weighed standard glass fiber filter and the residue
retained on the filter is dried to constant weightier at 1030 to 1050 C. The increase in weight
of filter represents the total suspended solids. The difference between the total solids and
total dissolved solids provide an estimate of the total suspended solids.
Calculation
A = Weight of filter paper = dried residue in mg.
Total suspended solids = (A-B) X 1000/sample volume m1
B = Weight of filter paper in mg.
Dissolved oxygen
It represents the amount of oxygen present in the dissolved conditions no dissolved oxygen,
unless the sewage is very fresh or very weak. Presence of dissolved oxygen in sewage or
effluent from a treatment plant means that as long as D.O. remaining putrefaction odors will
not be given off. The D.O. constant decreases with the depth of the liquid.
Biochemical oxygen demand (BOD)
51
B.O.D. is usually defined as the amount of oxygen required by bacteria while stabilizing
decomposable organic matter under aerobic condition. It is the principal test applied to
sewage and industrial wasters to determine strength in terms of oxygen requirements for
stabilization B.O.D. is therefore a useful criteria for stream pollution control. The test is used
to evaluate the efficiency of various with.
Calculation
BOD mg/l = (A-B) X (Seed correction) X Initial day D.O. in sample
Sample volume ml
A = Initial day D.O. in sample
B = 3rd day D.O. in sample
Seed correction: Initial day D.O. in blank - 3rd D.O. in blank.
Chemical oxygen demand (COD)
The chemical oxygen demand is used as measure of the oxygen equivalent of the organic
matter content of a sample that is susceptible to oxidation by a strong chemical oxidant.
Most types of organic matter are destroyed by boiling with a mixture of dichromate and
sulphuric acid.
Calculation
COD mg/l = (A-B) x N x 8000/sample volume ml
Where
A = ml of Fe(NH4)2 (SO4)2 used for blank
B = ml of Fe (NH4) (SO4)2 used for sample
N = Normality of FAS
Sulphate
Sulphate is precipitated in a acidic medium of barium sulphate by addition of barium
chloride, the precipitation is carried out near the boiling temperature and after period
digestion the precipitate is filtered, washed free of chloride ignited or dried and weighed as
barium sulphate.
Calculation
Sulphate mg/l = (mg f BaSo4) x 411.6/ Sample volume
A = final weight filter paper
B = Initial weight of filter paper
52
CHAPTER-VII
OPERATIONAL PROBLEMS AND MAINTENANCE
53
7.0 OPERATIONAL PROBLEMS AND MAINTENANCE
6.1 FOAMING
Wastewater contains normally surfactants that produce foam when the wastewater aerated, if
the concentration of mixed liquor suspended solids is high the foaming tendency is
maximized. The foaming action produces a foam that contain sludge solids, grease and large
number of wastewater bacteria.
It is essential to have some method for controlling floc formation. A commonly used system
consists of a spray nozzles mounted along the top of edge of the aeration tank. Effluent or
clean water is sprayed.
Another approach is to add a small quantity of anti foaming chemical additive into the inlet
of the aeration tank.
6.2 BULKING OF SLUDGE
The bulked is one that has poor settling characteristics and poor compatibility. The two
principal types of sludge bulking problems have been identified
Caused by the growth of filamentous organisms or organisms that can grow in a
filamentous from under adverse conditions.
Caused by bound water in bacterial cells composing the floc swell through the
addition of water to the extent the density is reduced and they will not settle. The
causes of sludge bulking and are most commonly sited.
Physical and chemical characteristics.
Include flocculation in flow and strength, pH, Temperature, Staleness, and Nutrient
content.
Design limitations
54
Air supply, classifier design, return sludge pumping capacity limitations and short-
circuiting or poor mixing.
Operational causes
Low dissolved oxygen in the aeration tank, organic waste over loading of aeration
tanks and final clarifier operation.
Limited dissolved oxygen has been noted more frequently than any other cause of
bulking. If the problem is due to limited dissolved oxygen it can usually be
confirmed by operation the air blowers at full capacity. This can maintain at least 2
mg/l of dissolved oxygen; in the aeration tank.
To avoid internal plant overloading it should be determined that the liquid removed
from the sludge during mechanical sludge dewatering, or other similar operations is
not being returned to plant flow during times of peak hydraulic and organic loadings.
In an emergency situation chloride and H2O2 may be used to provide temporary
help. Chlorination of water or of return sludge has been practiced as a means of
controlling bulking.
6.3 RISING SLUDGE
Occasionally sludge that has good setting characteristics will be observed to rise or float to
the surface after a relatively short settling period. This is due to forming of Nitrogen gas at
sludge layer.
This problem can be return come by
Increasing the rate of return sludge
Decreasing the rate of flow of aeration liquor into the offending tank.
Increasing the speed of sludge collecting mechanism
Decreasing the mean cell residence time by thickening the sludge.
55
CHAPTER-VIII
SPECIAL INSTRUCTIONS TO THE OPERATOR
56
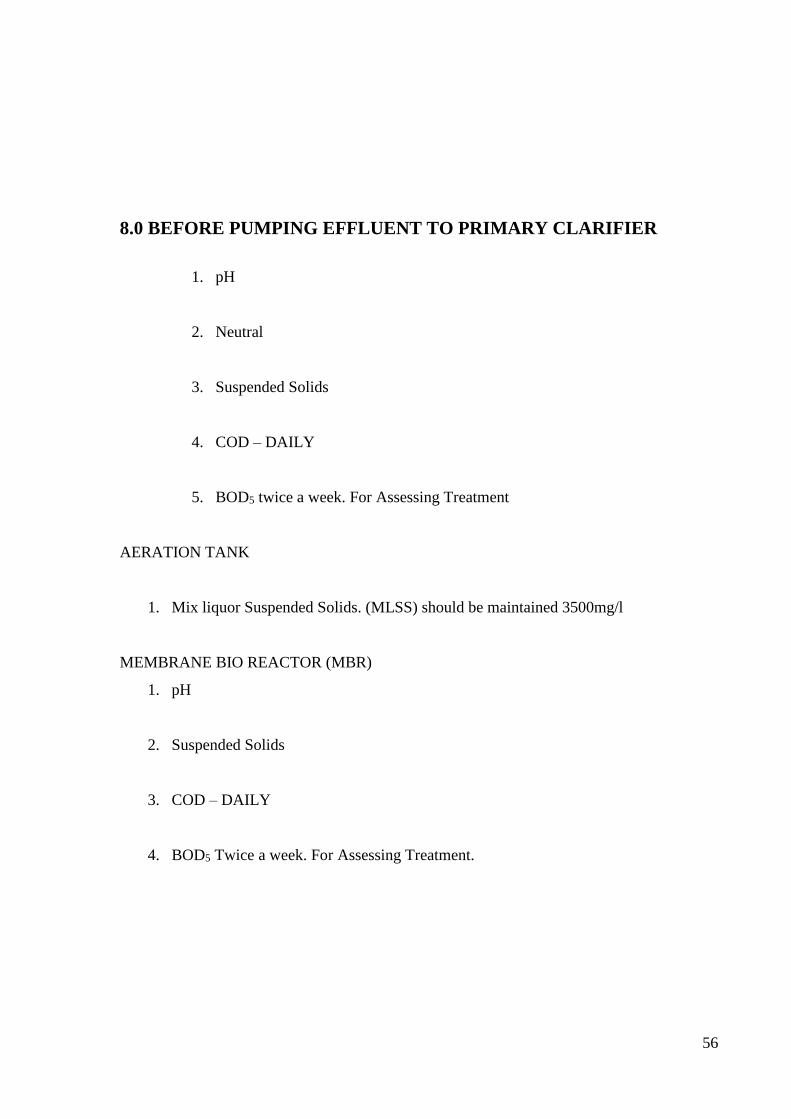
8.0 BEFORE PUMPING EFFLUENT TO PRIMARY CLARIFIER
1. pH
2. Neutral
3. Suspended Solids
4. COD – DAILY
5. BOD5 twice a week. For Assessing Treatment
AERATION TANK
1. Mix liquor Suspended Solids. (MLSS) should be maintained 3500mg/l
MEMBRANE BIO REACTOR (MBR)
1. pH
2. Suspended Solids
3. COD – DAILY
4. BOD5 Twice a week. For Assessing Treatment.
57
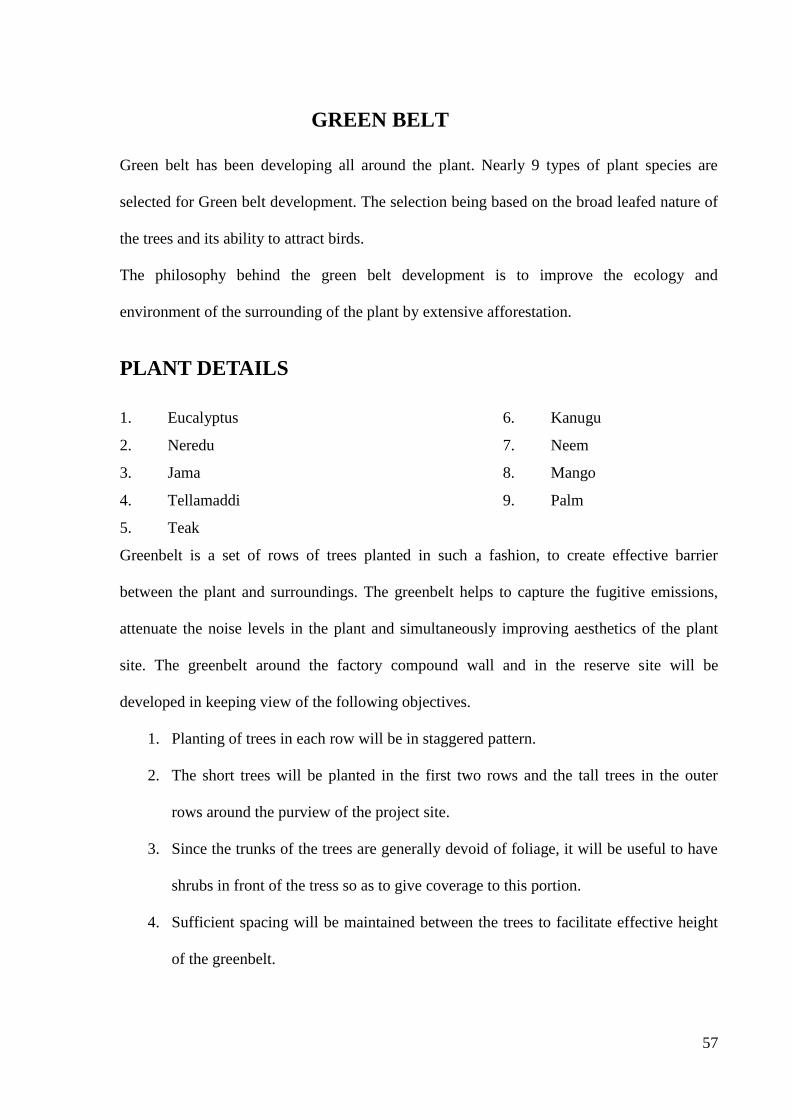
GREEN BELT
Green belt has been developing all around the plant. Nearly 9 types of plant species are
selected for Green belt development. The selection being based on the broad leafed nature of
the trees and its ability to attract birds.
The philosophy behind the green belt development is to improve the ecology and
environment of the surrounding of the plant by extensive afforestation.
PLANT DETAILS
1. Eucalyptus 6. Kanugu
2. Neredu 7. Neem
3. Jama 8. Mango
4. Tellamaddi 9. Palm
5. Teak
Greenbelt is a set of rows of trees planted in such a fashion, to create effective barrier
between the plant and surroundings. The greenbelt helps to capture the fugitive emissions,
attenuate the noise levels in the plant and simultaneously improving aesthetics of the plant
site. The greenbelt around the factory compound wall and in the reserve site will be
developed in keeping view of the following objectives.
1. Planting of trees in each row will be in staggered pattern.
2. The short trees will be planted in the first two rows and the tall trees in the outer
rows around the purview of the project site.
3. Since the trunks of the trees are generally devoid of foliage, it will be useful to have
shrubs in front of the tress so as to give coverage to this portion.
4. Sufficient spacing will be maintained between the trees to facilitate effective height
of the greenbelt.
58
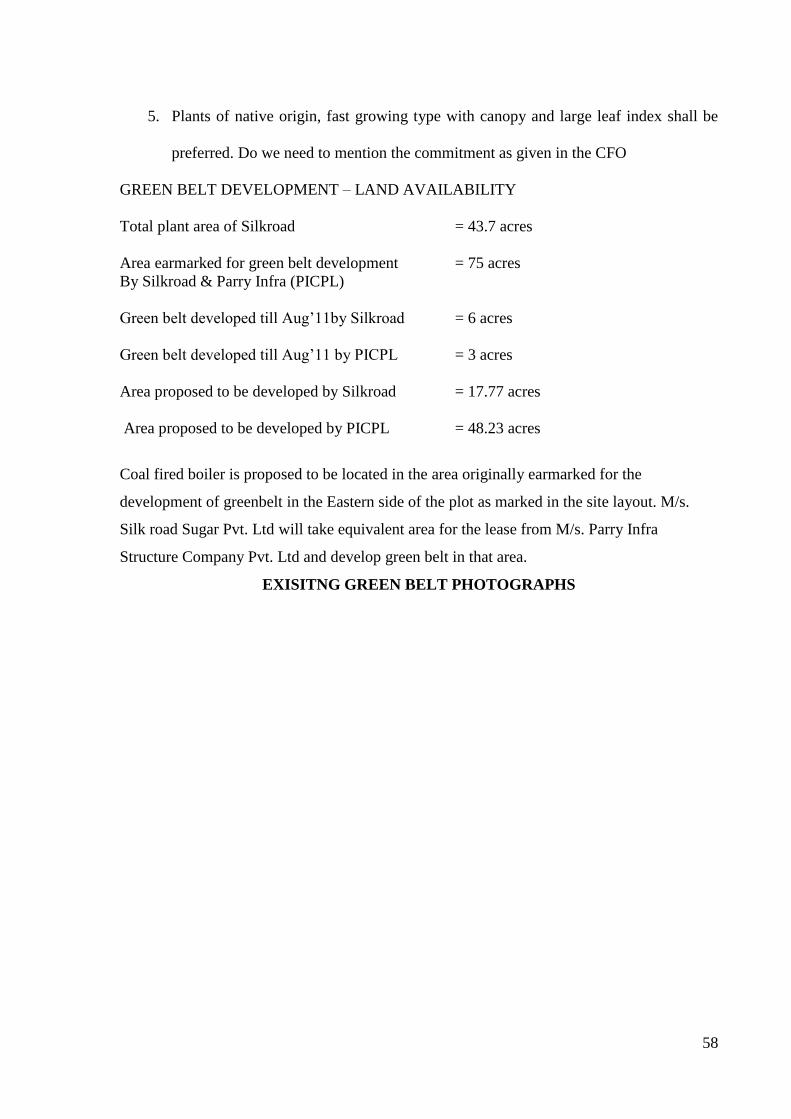
5. Plants of native origin, fast growing type with canopy and large leaf index shall be
preferred. Do we need to mention the commitment as given in the CFO
GREEN BELT DEVELOPMENT – LAND AVAILABILITY
Total plant area of Silkroad = 43.7 acres
Area earmarked for green belt development = 75 acres
By Silkroad & Parry Infra (PICPL)
Green belt developed till Aug’11by Silkroad = 6 acres
Green belt developed till Aug’11 by PICPL = 3 acres
Area proposed to be developed by Silkroad = 17.77 acres
Area proposed to be developed by PICPL = 48.23 acres
Coal fired boiler is proposed to be located in the area originally earmarked for the
development of greenbelt in the Eastern side of the plot as marked in the site layout. M/s.
Silk road Sugar Pvt. Ltd will take equivalent area for the lease from M/s. Parry Infra
Structure Company Pvt. Ltd and develop green belt in that area.
EXISITNG GREEN BELT PHOTOGRAPHS
59
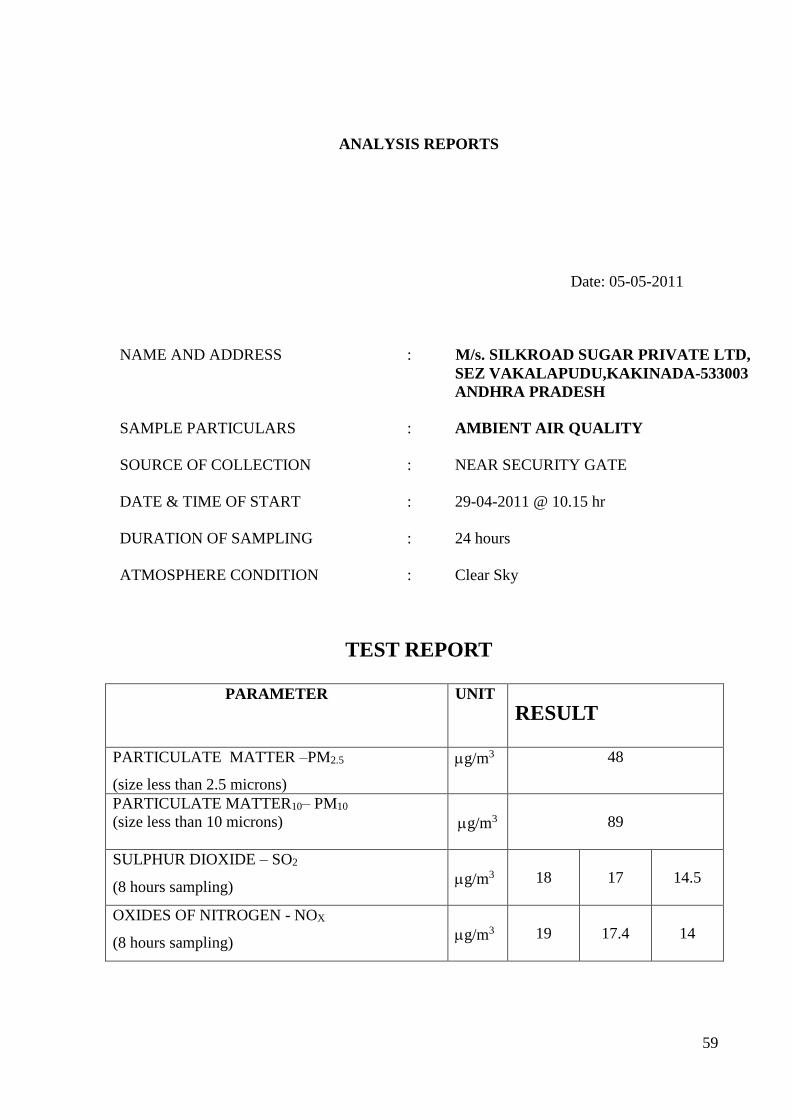
ANALYSIS REPORTS
Date: 05-05-2011
NAME AND ADDRESS : M/s. SILKROAD SUGAR PRIVATE LTD,
SEZ VAKALAPUDU,KAKINADA-533003
ANDHRA PRADESH
SAMPLE PARTICULARS : AMBIENT AIR QUALITY
SOURCE OF COLLECTION : NEAR SECURITY GATE
DATE & TIME OF START : 29-04-2011 @ 10.15 hr
DURATION OF SAMPLING : 24 hours
ATMOSPHERE CONDITION : Clear Sky
TEST REPORT
PARAMETER UNIT
RESULT
PARTICULATE MATTER –PM2.5
(size less than 2.5 microns)
g/m3 48
PARTICULATE MATTER10– PM10
(size less than 10 microns)
g/m3
89
SULPHUR DIOXIDE – SO2
(8 hours sampling)
g/m3
18
17
14.5
OXIDES OF NITROGEN - NOX
(8 hours sampling)
g/m3
19
17.4
14
60
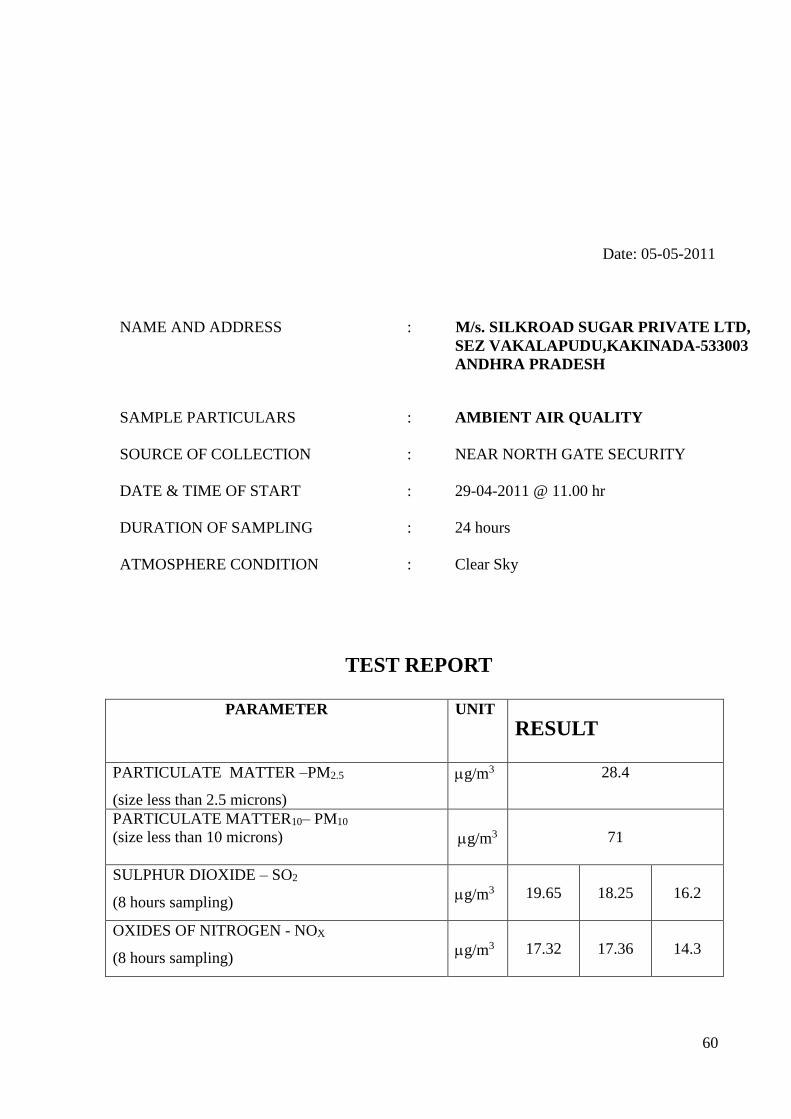
Date: 05-05-2011
NAME AND ADDRESS : M/s. SILKROAD SUGAR PRIVATE LTD,
SEZ VAKALAPUDU,KAKINADA-533003
ANDHRA PRADESH
SAMPLE PARTICULARS : AMBIENT AIR QUALITY
SOURCE OF COLLECTION : NEAR NORTH GATE SECURITY
DATE & TIME OF START : 29-04-2011 @ 11.00 hr
DURATION OF SAMPLING : 24 hours
ATMOSPHERE CONDITION : Clear Sky
TEST REPORT
PARAMETER UNIT
RESULT
PARTICULATE MATTER –PM2.5
(size less than 2.5 microns)
g/m3 28.4
PARTICULATE MATTER10– PM10
(size less than 10 microns)
g/m3
71
SULPHUR DIOXIDE – SO2
(8 hours sampling)
g/m3
19.65
18.25
16.2
OXIDES OF NITROGEN - NOX
(8 hours sampling)
g/m3
17.32
17.36
14.3
61
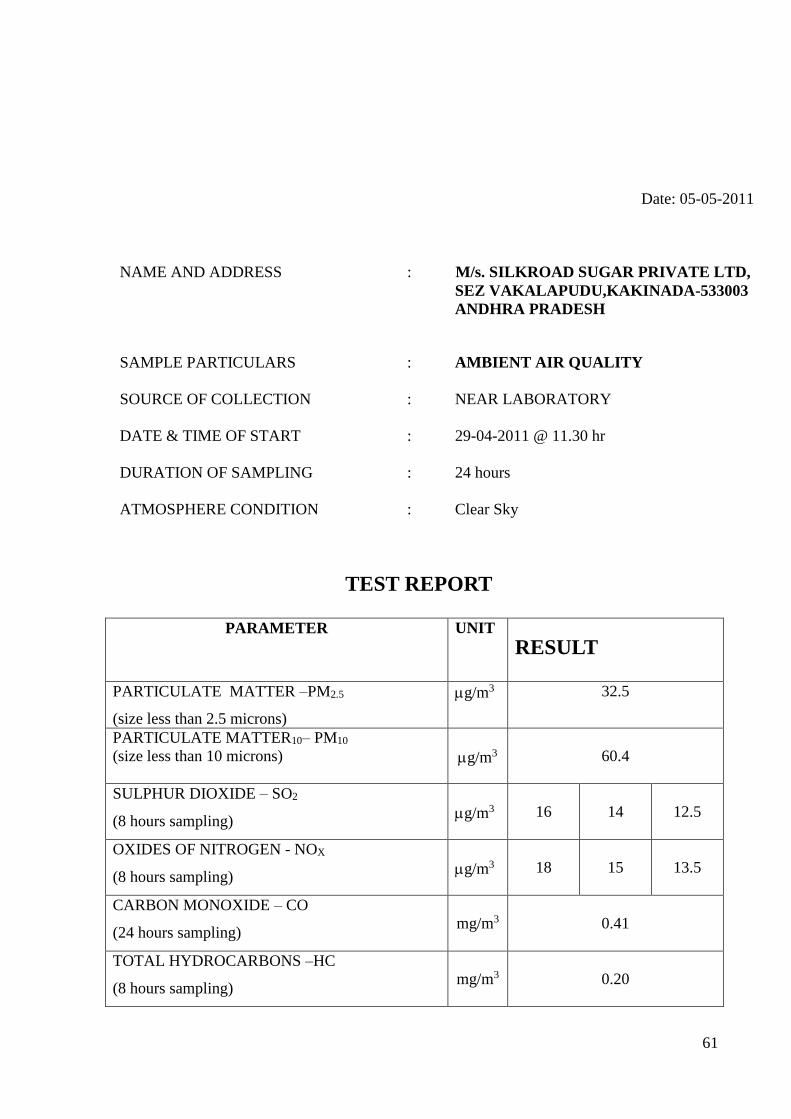
Date: 05-05-2011
NAME AND ADDRESS : M/s. SILKROAD SUGAR PRIVATE LTD,
SEZ VAKALAPUDU,KAKINADA-533003
ANDHRA PRADESH
SAMPLE PARTICULARS : AMBIENT AIR QUALITY
SOURCE OF COLLECTION : NEAR LABORATORY
DATE & TIME OF START : 29-04-2011 @ 11.30 hr
DURATION OF SAMPLING : 24 hours
ATMOSPHERE CONDITION : Clear Sky
TEST REPORT
PARAMETER UNIT
RESULT
PARTICULATE MATTER –PM2.5
(size less than 2.5 microns)
g/m3 32.5
PARTICULATE MATTER10– PM10
(size less than 10 microns)
g/m3
60.4
SULPHUR DIOXIDE – SO2
(8 hours sampling)
g/m3
16
14
12.5
OXIDES OF NITROGEN - NOX
(8 hours sampling)
g/m3
18
15
13.5
CARBON MONOXIDE – CO
(24 hours sampling)
mg/m3
0.41
TOTAL HYDROCARBONS –HC
(8 hours sampling)
mg/m3
0.20
62
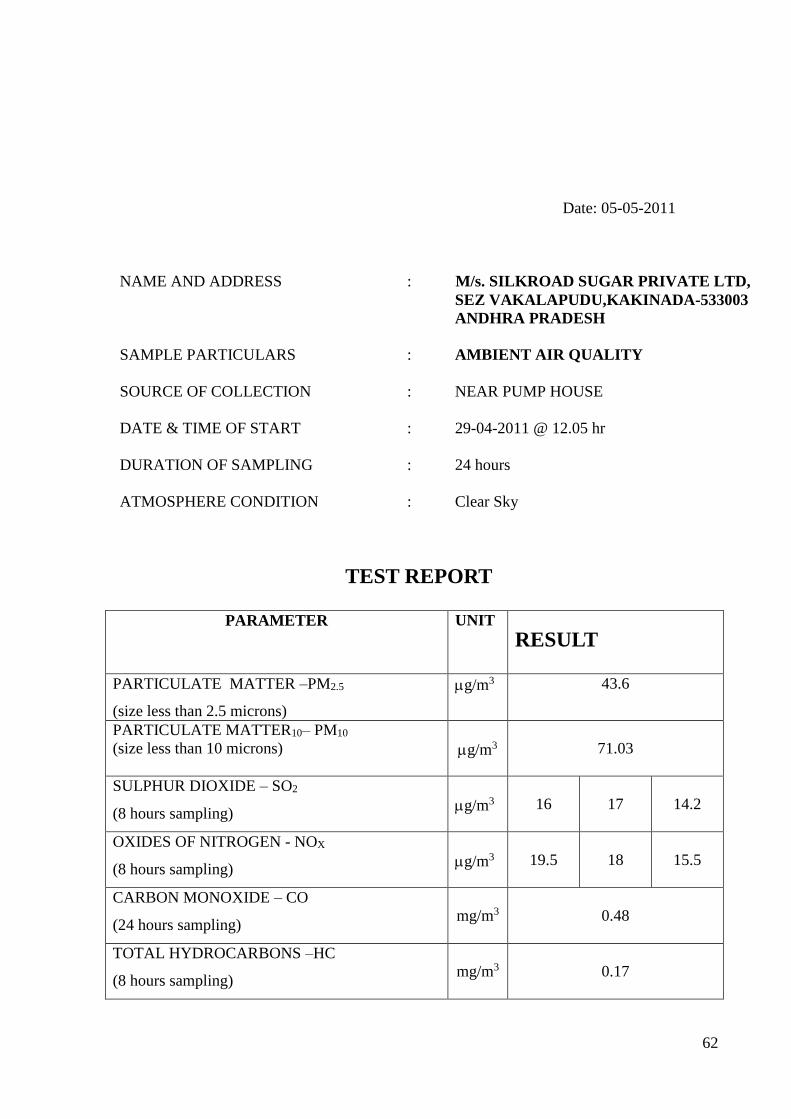
Date: 05-05-2011
NAME AND ADDRESS : M/s. SILKROAD SUGAR PRIVATE LTD,
SEZ VAKALAPUDU,KAKINADA-533003
ANDHRA PRADESH
SAMPLE PARTICULARS : AMBIENT AIR QUALITY
SOURCE OF COLLECTION : NEAR PUMP HOUSE
DATE & TIME OF START : 29-04-2011 @ 12.05 hr
DURATION OF SAMPLING : 24 hours
ATMOSPHERE CONDITION : Clear Sky
TEST REPORT
PARAMETER UNIT
RESULT
PARTICULATE MATTER –PM2.5
(size less than 2.5 microns)
g/m3 43.6
PARTICULATE MATTER10– PM10
(size less than 10 microns)
g/m3
71.03
SULPHUR DIOXIDE – SO2
(8 hours sampling)
g/m3
16
17
14.2
OXIDES OF NITROGEN - NOX
(8 hours sampling)
g/m3
19.5
18
15.5
CARBON MONOXIDE – CO
(24 hours sampling)
mg/m3
0.48
TOTAL HYDROCARBONS –HC
(8 hours sampling)
mg/m3
0.17
63
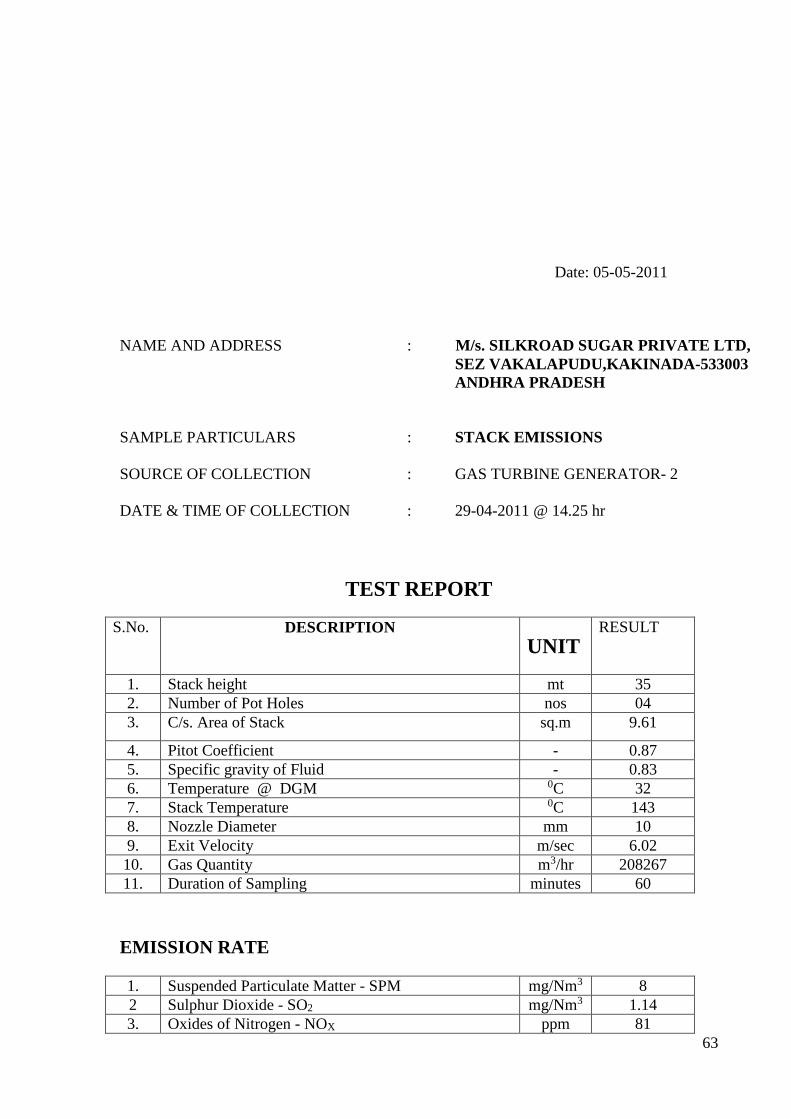
Date: 05-05-2011
NAME AND ADDRESS : M/s. SILKROAD SUGAR PRIVATE LTD,
SEZ VAKALAPUDU,KAKINADA-533003
ANDHRA PRADESH
SAMPLE PARTICULARS : STACK EMISSIONS
SOURCE OF COLLECTION : GAS TURBINE GENERATOR- 2
DATE & TIME OF COLLECTION : 29-04-2011 @ 14.25 hr
TEST REPORT
S.No. DESCRIPTION
UNIT RESULT
1. Stack height mt 35
2. Number of Pot Holes nos 04
3. C/s. Area of Stack sq.m 9.61
4. Pitot Coefficient - 0.87
5. Specific gravity of Fluid - 0.83
6. Temperature @ DGM 0C 32
7. Stack Temperature 0C 143
8. Nozzle Diameter mm 10
9. Exit Velocity m/sec 6.02
10. Gas Quantity m3/hr 208267
11. Duration of Sampling minutes 60
EMISSION RATE
1. Suspended Particulate Matter - SPM mg/Nm3 8
2 Sulphur Dioxide - SO2 mg/Nm3 1.14
3. Oxides of Nitrogen - NOX ppm 81
64
Date: 05-05-2011
NAME AND ADDRESS : M/s. SILKROAD SUGAR PRIVATE LTD,
SEZ VAKALAPUDU,KAKINADA-533003
ANDHRA PRADESH
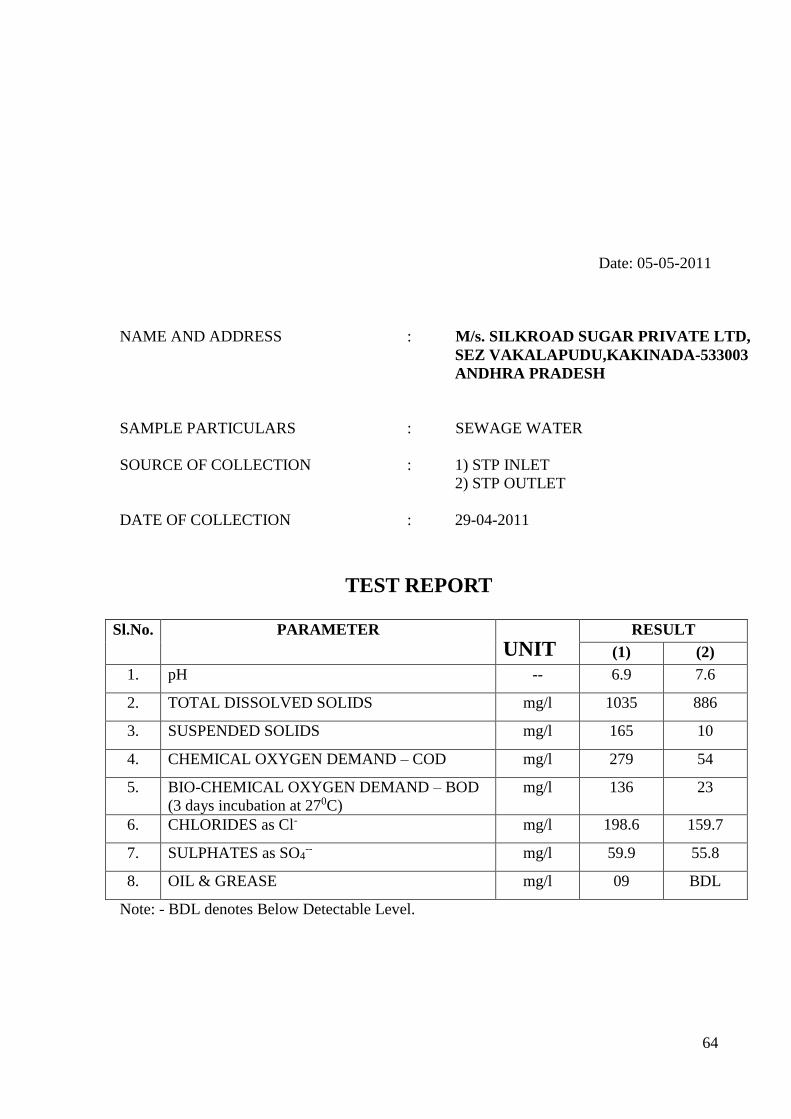
SAMPLE PARTICULARS : SEWAGE WATER
SOURCE OF COLLECTION : 1) STP INLET
2) STP OUTLET
DATE OF COLLECTION : 29-04-2011
TEST REPORT
Sl.No. PARAMETER
UNIT RESULT
(1) (2)
1. pH -- 6.9 7.6
2. TOTAL DISSOLVED SOLIDS mg/l 1035 886
3. SUSPENDED SOLIDS mg/l 165 10
4. CHEMICAL OXYGEN DEMAND – COD mg/l 279 54
5. BIO-CHEMICAL OXYGEN DEMAND – BOD
(3 days incubation at 270C)
mg/l 136 23
6. CHLORIDES as Cl- mg/l 198.6 159.7
7. SULPHATES as SO4-- mg/l 59.9 55.8
8. OIL & GREASE mg/l 09 BDL
Note: - BDL denotes Below Detectable Level.
65
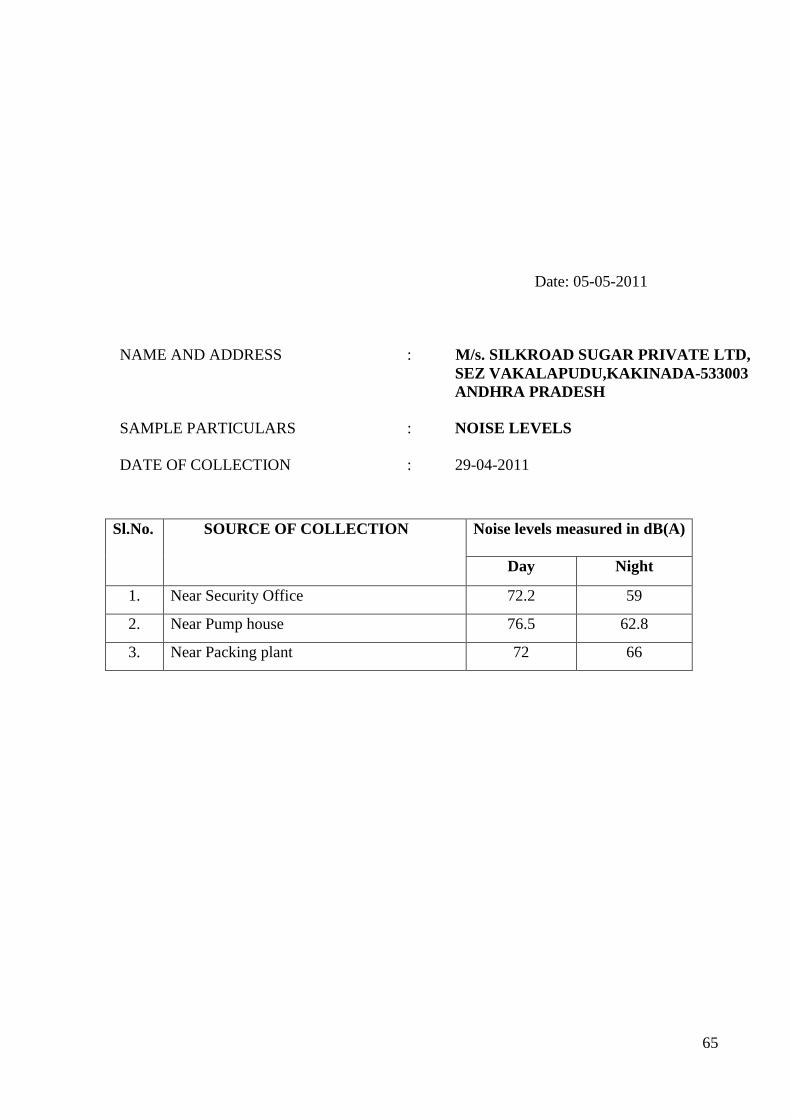
Date: 05-05-2011
NAME AND ADDRESS : M/s. SILKROAD SUGAR PRIVATE LTD,
SEZ VAKALAPUDU,KAKINADA-533003
ANDHRA PRADESH
SAMPLE PARTICULARS : NOISE LEVELS
DATE OF COLLECTION : 29-04-2011
Sl.No. SOURCE OF COLLECTION Noise levels measured in dB(A)
Day Night
1. Near Security Office 72.2 59
2. Near Pump house 76.5 62.8
3. Near Packing plant 72 66
66
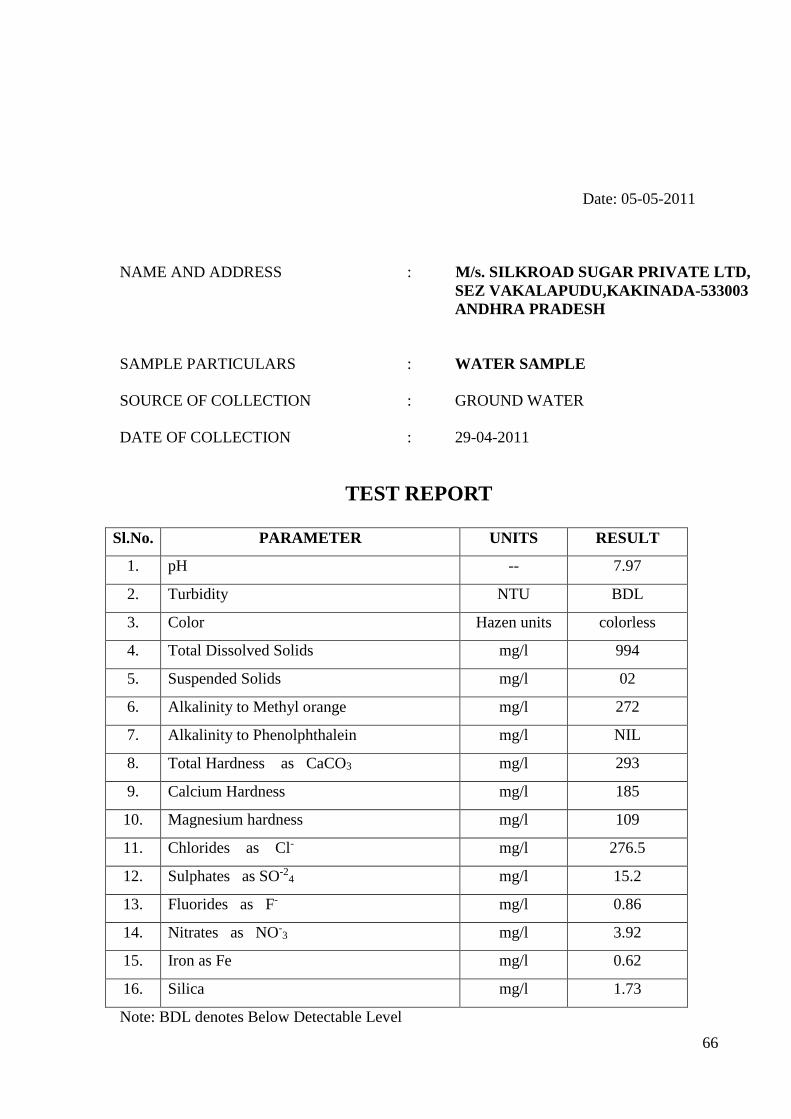
Date: 05-05-2011
NAME AND ADDRESS : M/s. SILKROAD SUGAR PRIVATE LTD,
SEZ VAKALAPUDU,KAKINADA-533003
ANDHRA PRADESH
SAMPLE PARTICULARS : WATER SAMPLE
SOURCE OF COLLECTION : GROUND WATER
DATE OF COLLECTION : 29-04-2011
TEST REPORT
Sl.No. PARAMETER UNITS RESULT
1. pH -- 7.97
2. Turbidity NTU BDL
3. Color Hazen units colorless
4. Total Dissolved Solids mg/l 994
5. Suspended Solids mg/l 02
6. Alkalinity to Methyl orange mg/l 272
7. Alkalinity to Phenolphthalein mg/l NIL
8. Total Hardness as CaCO3 mg/l 293
9. Calcium Hardness mg/l 185
10. Magnesium hardness mg/l 109
11. Chlorides as Cl- mg/l 276.5
12. Sulphates as SO-24 mg/l 15.2
13. Fluorides as F- mg/l 0.86
14. Nitrates as NO-3 mg/l 3.92
15. Iron as Fe mg/l 0.62
16. Silica mg/l 1.73
Note: BDL denotes Below Detectable Level
67
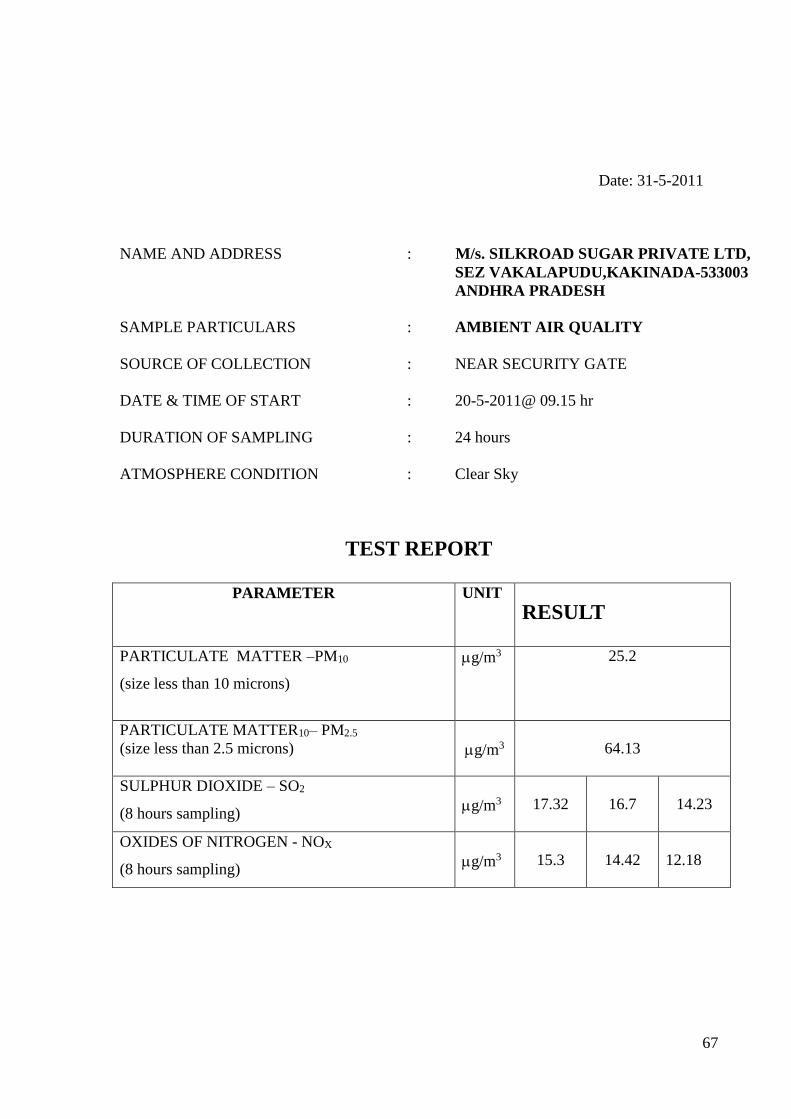
Date: 31-5-2011
NAME AND ADDRESS : M/s. SILKROAD SUGAR PRIVATE LTD,
SEZ VAKALAPUDU,KAKINADA-533003
ANDHRA PRADESH
SAMPLE PARTICULARS : AMBIENT AIR QUALITY
SOURCE OF COLLECTION : NEAR SECURITY GATE
DATE & TIME OF START : 20-5-2011@ 09.15 hr
DURATION OF SAMPLING : 24 hours
ATMOSPHERE CONDITION : Clear Sky
TEST REPORT
PARAMETER UNIT
RESULT
PARTICULATE MATTER –PM10
(size less than 10 microns)
g/m3 25.2
PARTICULATE MATTER10– PM2.5
(size less than 2.5 microns)
g/m3
64.13
SULPHUR DIOXIDE – SO2
(8 hours sampling)
g/m3
17.32
16.7
14.23
OXIDES OF NITROGEN - NOX
(8 hours sampling)
g/m3
15.3
14.42
12.18
68
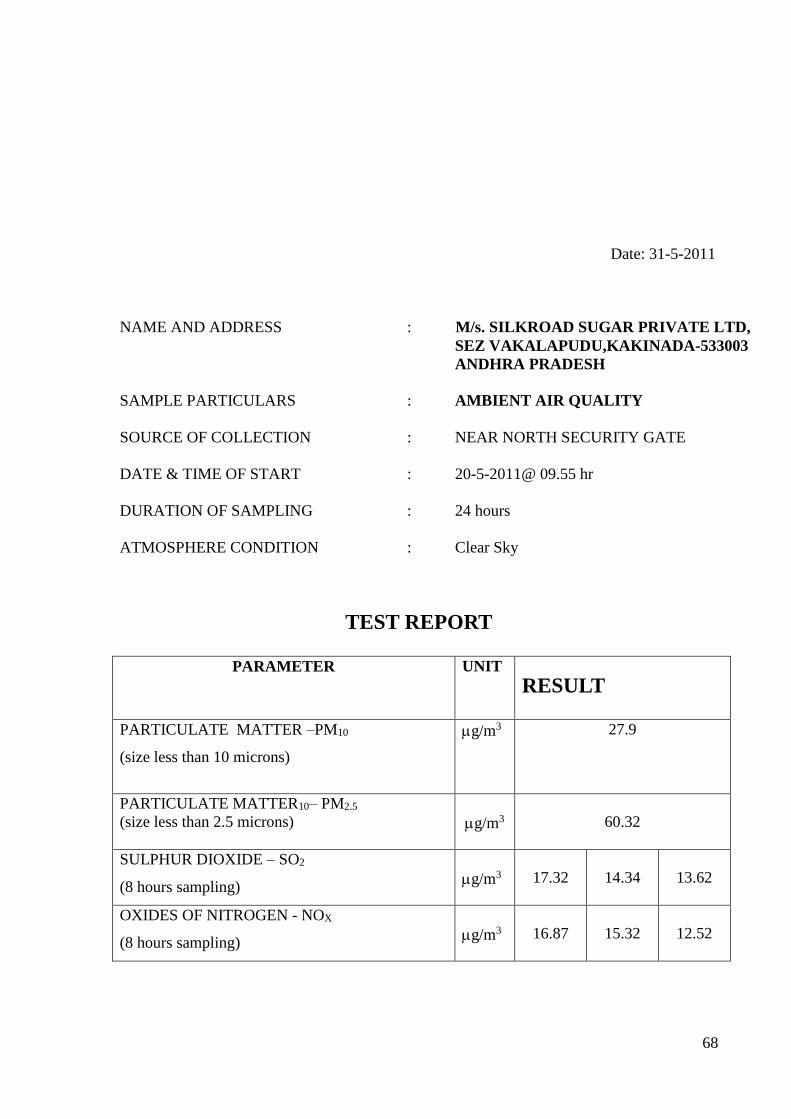
Date: 31-5-2011
NAME AND ADDRESS : M/s. SILKROAD SUGAR PRIVATE LTD,
SEZ VAKALAPUDU,KAKINADA-533003
ANDHRA PRADESH
SAMPLE PARTICULARS : AMBIENT AIR QUALITY
SOURCE OF COLLECTION : NEAR NORTH SECURITY GATE
DATE & TIME OF START : 20-5-2011@ 09.55 hr
DURATION OF SAMPLING : 24 hours
ATMOSPHERE CONDITION : Clear Sky
TEST REPORT
PARAMETER UNIT
RESULT
PARTICULATE MATTER –PM10
(size less than 10 microns)
g/m3 27.9
PARTICULATE MATTER10– PM2.5
(size less than 2.5 microns)
g/m3
60.32
SULPHUR DIOXIDE – SO2
(8 hours sampling)
g/m3
17.32
14.34
13.62
OXIDES OF NITROGEN - NOX
(8 hours sampling)
g/m3
16.87
15.32
12.52
69
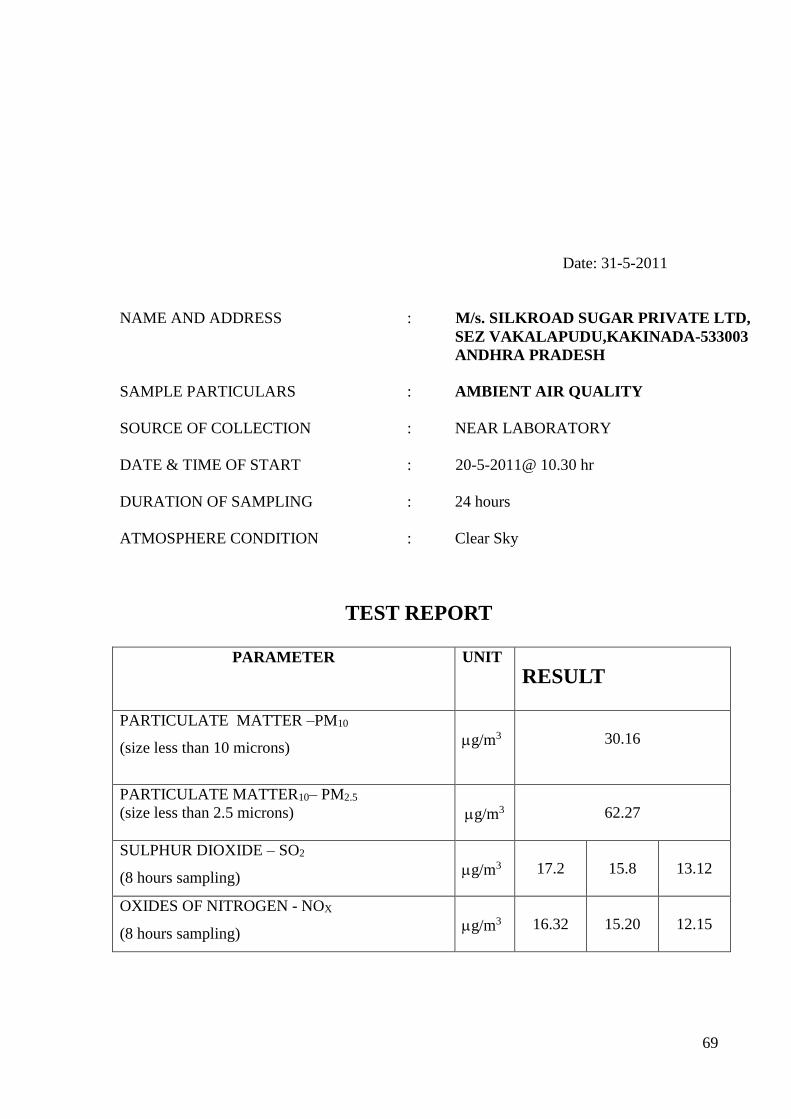
Date: 31-5-2011
NAME AND ADDRESS : M/s. SILKROAD SUGAR PRIVATE LTD,
SEZ VAKALAPUDU,KAKINADA-533003
ANDHRA PRADESH
SAMPLE PARTICULARS : AMBIENT AIR QUALITY
SOURCE OF COLLECTION : NEAR LABORATORY
DATE & TIME OF START : 20-5-2011@ 10.30 hr
DURATION OF SAMPLING : 24 hours
ATMOSPHERE CONDITION : Clear Sky
TEST REPORT
PARAMETER UNIT
RESULT
PARTICULATE MATTER –PM10
(size less than 10 microns)
g/m3
30.16
PARTICULATE MATTER10– PM2.5
(size less than 2.5 microns)
g/m3
62.27
SULPHUR DIOXIDE – SO2
(8 hours sampling)
g/m3
17.2
15.8
13.12
OXIDES OF NITROGEN - NOX
(8 hours sampling)
g/m3
16.32
15.20
12.15

70
Date: 31-5-2011
NAME AND ADDRESS : M/s. SILKROAD SUGAR PRIVATE LTD,
SEZ VAKALAPUDU,KAKINADA-533003
ANDHRA PRADESH
SAMPLE PARTICULARS : AMBIENT AIR QUALITY
SOURCE OF COLLECTION : NEAR PUMP HOUSE
DATE & TIME OF START : 20-5-2011@ 11.05 hr
DURATION OF SAMPLING : 24 hours
ATMOSPHERE CONDITION : Clear Sky
TEST REPORT
PARAMETER UNIT
RESULT
PARTICULATE MATTER –PM10
(size less than 10 microns)
g/m3
32.6
PARTICULATE MATTER10– PM2.5
(size less than 2.5 microns)
g/m3
65.18
SULPHUR DIOXIDE – SO2
(8 hours sampling)
g/m3
17.50
15.14
13.2
OXIDES OF NITROGEN - NOX
(8 hours sampling)
g/m3
15.68
14.19
13.6
71
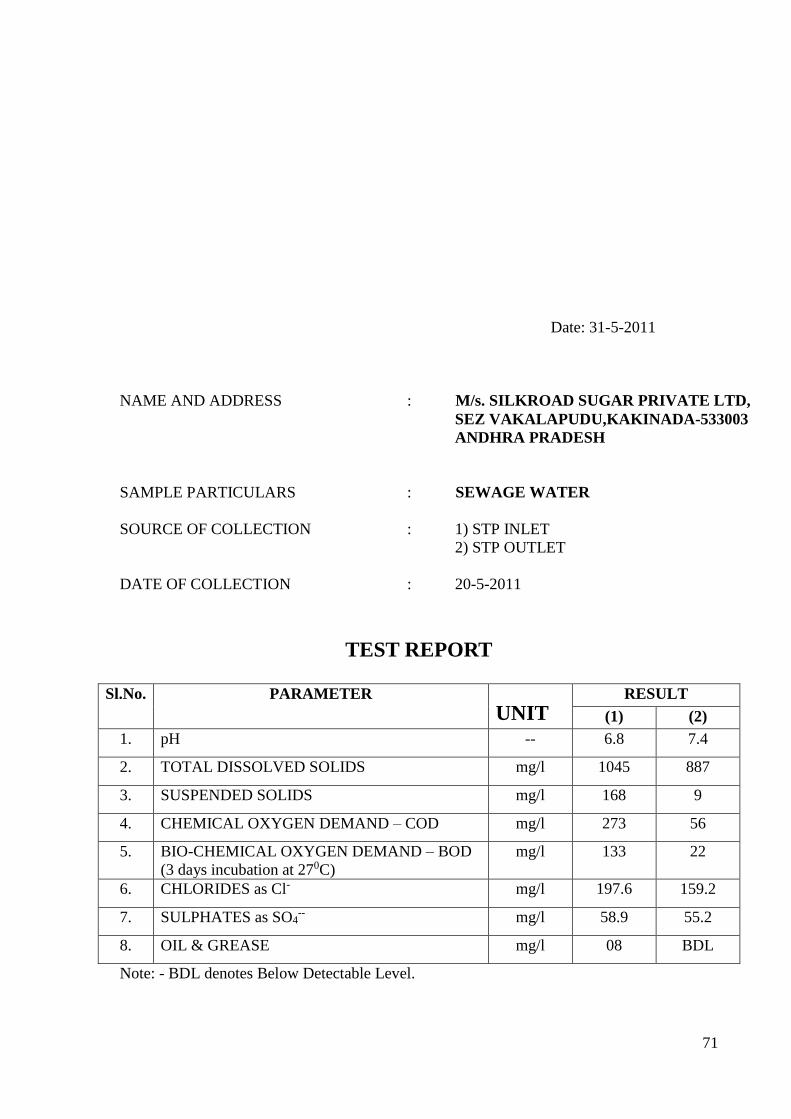
Date: 31-5-2011
NAME AND ADDRESS : M/s. SILKROAD SUGAR PRIVATE LTD,
SEZ VAKALAPUDU,KAKINADA-533003
ANDHRA PRADESH
SAMPLE PARTICULARS : SEWAGE WATER
SOURCE OF COLLECTION : 1) STP INLET
2) STP OUTLET
DATE OF COLLECTION : 20-5-2011
TEST REPORT
Sl.No. PARAMETER
UNIT RESULT
(1) (2)
1. pH -- 6.8 7.4
2. TOTAL DISSOLVED SOLIDS mg/l 1045 887
3. SUSPENDED SOLIDS mg/l 168 9
4. CHEMICAL OXYGEN DEMAND – COD mg/l 273 56
5. BIO-CHEMICAL OXYGEN DEMAND – BOD
(3 days incubation at 270C)
mg/l 133 22
6. CHLORIDES as Cl- mg/l 197.6 159.2
7. SULPHATES as SO4-- mg/l 58.9 55.2
8. OIL & GREASE mg/l 08 BDL
Note: - BDL denotes Below Detectable Level.
72
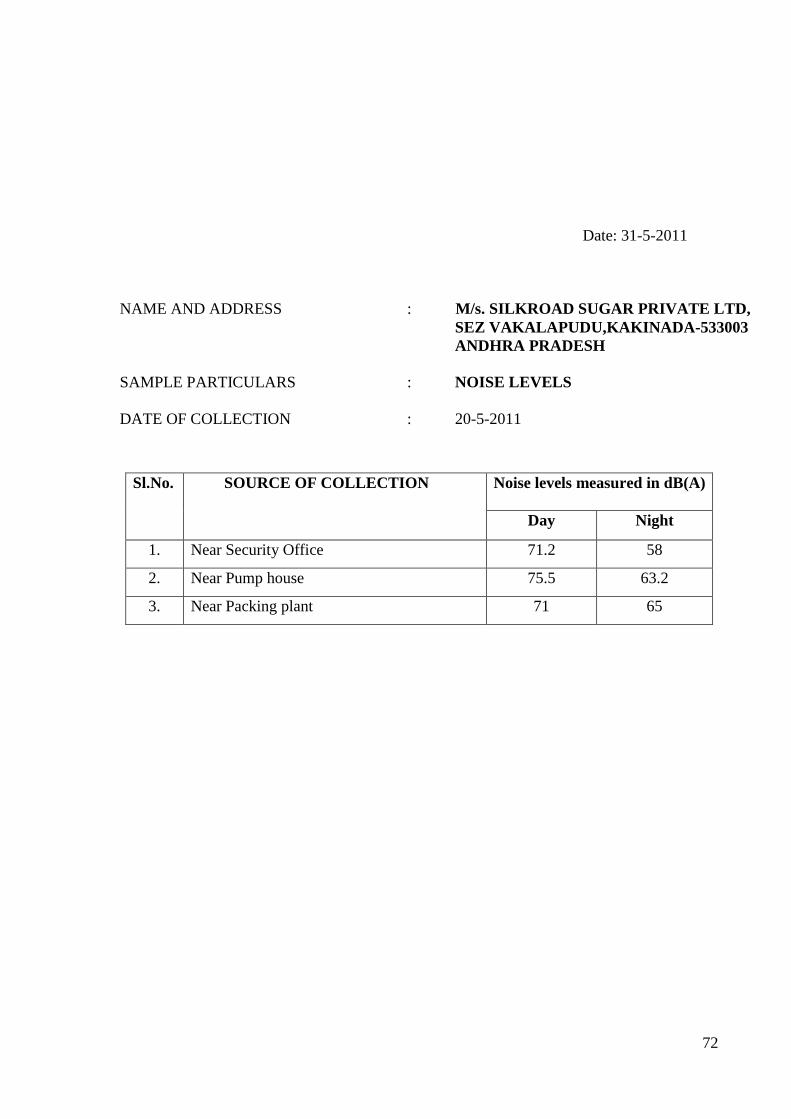
Date: 31-5-2011
NAME AND ADDRESS : M/s. SILKROAD SUGAR PRIVATE LTD,
SEZ VAKALAPUDU,KAKINADA-533003
ANDHRA PRADESH
SAMPLE PARTICULARS : NOISE LEVELS
DATE OF COLLECTION : 20-5-2011
Sl.No. SOURCE OF COLLECTION Noise levels measured in dB(A)
Day Night
1. Near Security Office 71.2 58
2. Near Pump house 75.5 63.2
3. Near Packing plant 71 65
73
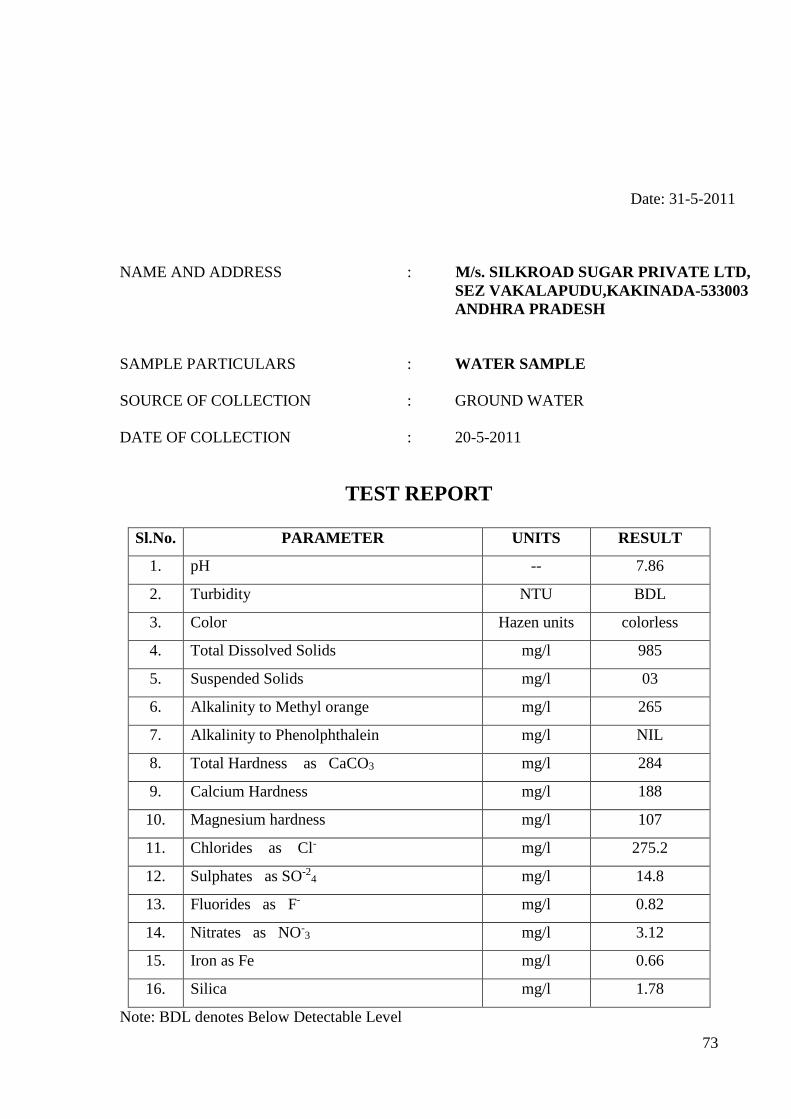
Date: 31-5-2011
NAME AND ADDRESS : M/s. SILKROAD SUGAR PRIVATE LTD,
SEZ VAKALAPUDU,KAKINADA-533003
ANDHRA PRADESH
SAMPLE PARTICULARS : WATER SAMPLE
SOURCE OF COLLECTION : GROUND WATER
DATE OF COLLECTION : 20-5-2011
TEST REPORT
Sl.No. PARAMETER UNITS RESULT
1. pH -- 7.86
2. Turbidity NTU BDL
3. Color Hazen units colorless
4. Total Dissolved Solids mg/l 985
5. Suspended Solids mg/l 03
6. Alkalinity to Methyl orange mg/l 265
7. Alkalinity to Phenolphthalein mg/l NIL
8. Total Hardness as CaCO3 mg/l 284
9. Calcium Hardness mg/l 188
10. Magnesium hardness mg/l 107
11. Chlorides as Cl- mg/l 275.2
12. Sulphates as SO-24 mg/l 14.8
13. Fluorides as F- mg/l 0.82
14. Nitrates as NO-3 mg/l 3.12
15. Iron as Fe mg/l 0.66
16. Silica mg/l 1.78
Note: BDL denotes Below Detectable Level

74