Embed Size (px)
Citation preview

Report No. 2017-143 November 2017
Office of Missouri State Auditor
Nicole Galloway, CPA
auditor.mo.gov
2017 Property Tax Rates
November 2017 Nicole Galloway, CPA
Missouri State Auditor CITIZENS SUMMARY
Findings in the review of 2017 Property Tax Rates
Property taxes largely fund public schools and are the main source of revenue for many of Missouri's special purpose political subdivisions and county boards. The State Auditor's Office and county officials assist local government officials in determining the data necessary to complete the tax rate computations. Taxing authorities are required to file final proposed tax rates and data supporting the proposed property tax rates with the county, using forms prescribed by the State Auditor. The counties submit the supporting data received to the State Auditor for review. The data is reviewed and a finding is returned to both the county and the taxing authority advising whether the proposed rates comply with Missouri law. Rate ceilings set the limit for the amount of taxes that can be levied. Each tax rate ceiling is determined annually and is adjusted to ensure revenue neutrality. The review of each tax rate ceiling is based on the assessed valuation for the entire political subdivision and is not calculated on an individual taxpayer basis. The 2017 tax rate ceilings were determined based on the requirements of Section 137.073, RSMo, and Missouri Constitution, Article X, Section 22, commonly referred to as the Hancock Amendment, which limits taxation by the state and local governments. In 2017, the State Auditor received supporting data and reviewed 4,813 property tax rates for 2,799 taxing authorities. Of the rates reviewed, 499 are debt service tax rates, 158 are new property tax rates approved by voters, and 51 are existing property tax rates that were increased by voter approval. We reviewed the remaining 4,105 tax rates for revenue neutrality. This is the third year since the review of property tax rates started in 1985 that no taxing authorities levied a tax rate that exceeded the tax rate certified. The State Auditor's Office has no authority to determine or review individual tax assessments. All individual tax assessment matters are the responsibility of the county assessor and board of equalization. Appeals to the state on tax assessment matters are handled by the Missouri State Tax Commission.
The complete 2017 Property Tax Rates Report is available on our Web site: auditor.mo.gov.
Background
Rate Calculations
Results
Additional Comments
Because of the limited objective of this review, no overall rating is provided.
1
2 Summary ........................................................................................................ 3 Methodology .................................................................................................. 3 Appendix I. Summary of Changes in Assessed Valuation for Local
Governments Levying a Single Tax Rate on All Property .................. 6 II. Summary of Changes in Assessed Valuation for Local
Governments Levying a Separate Tax Rate for Each Subclass of Property ........................................................................................... 7
III. Summary of Changes in Tax Rate Ceilings for Local
Governments Levying a Single Tax Rate on All Property .................. 8 IV. Summary of Changes in Tax Rate Ceilings for Local
Governments Levying a Separate Tax Rate for Each Subclass of Property ........................................................................................... 9
V. 2016 - 2017 Percentage Change in Total Assessed Valuations by
County, Overall County Valuation Changes Prior to Adjustments ....................................................................................... 10
VI. 2016 - 2017 Percentage Change in Adjusted Assessed
Valuations by County ........................................................................ 11
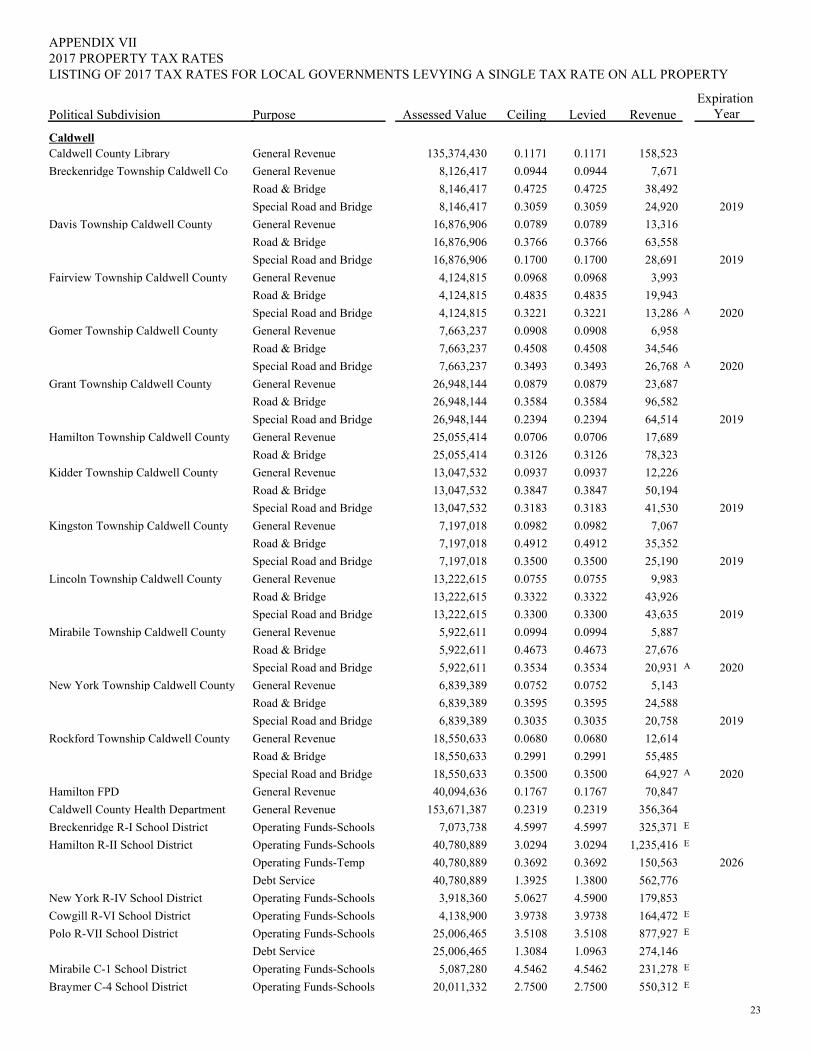
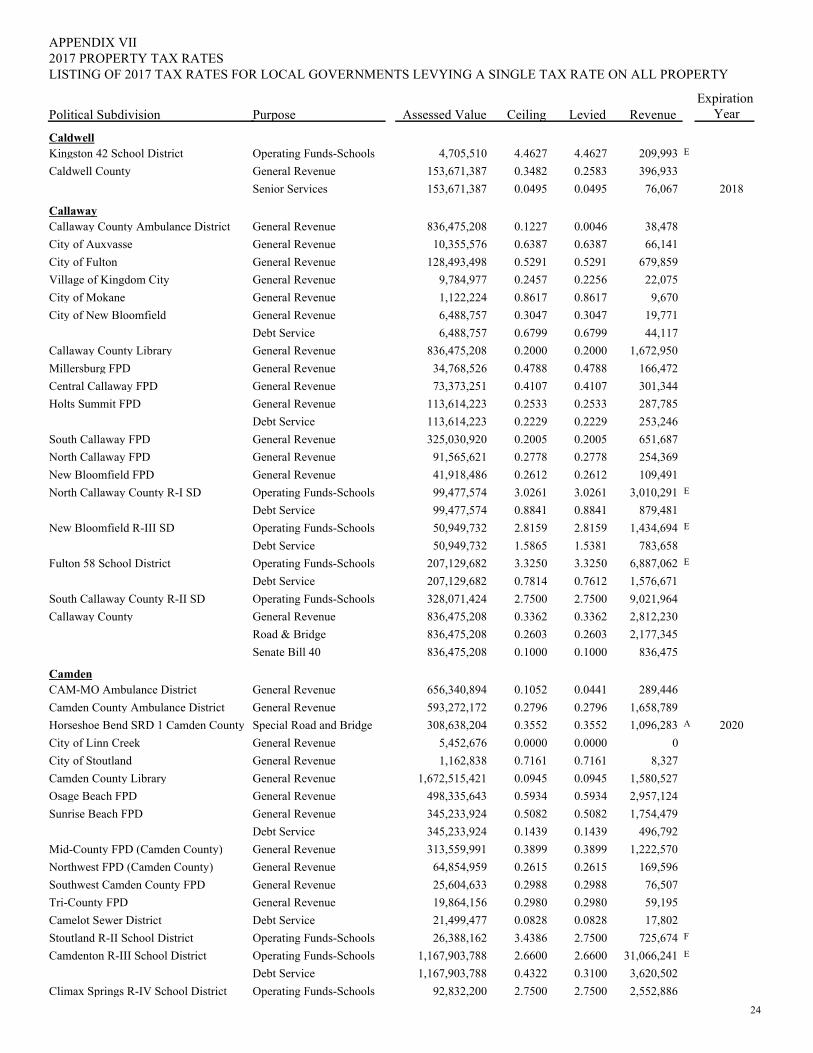
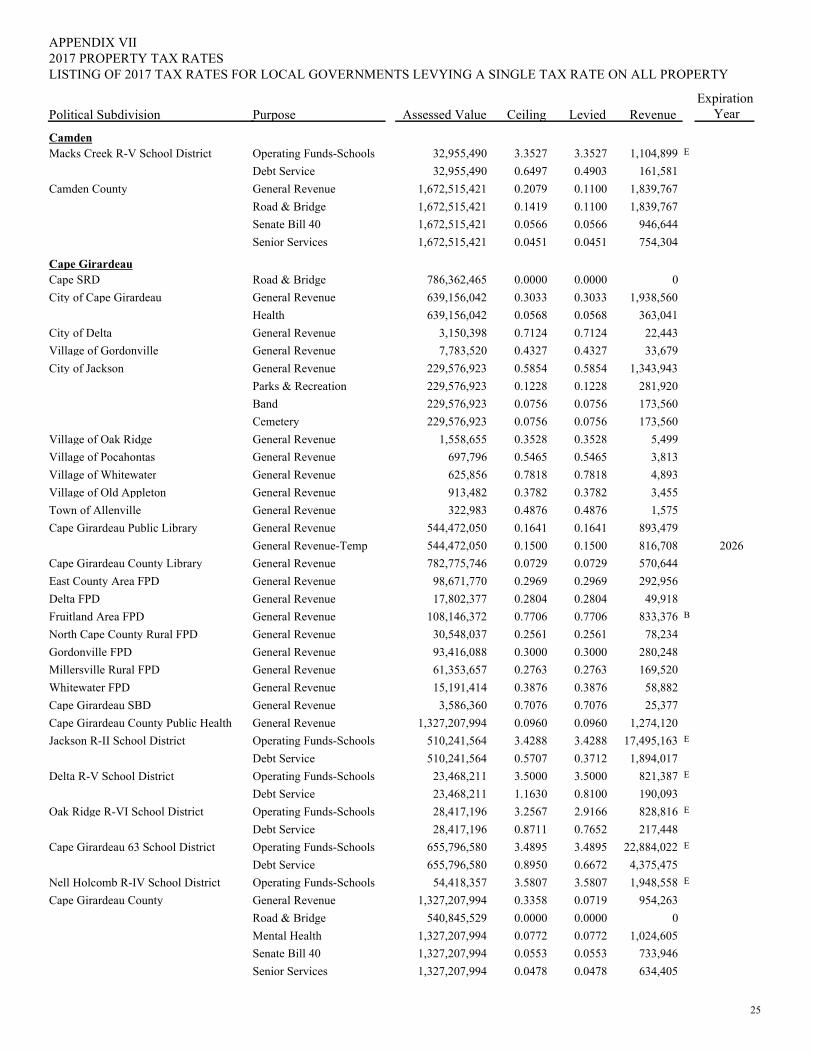
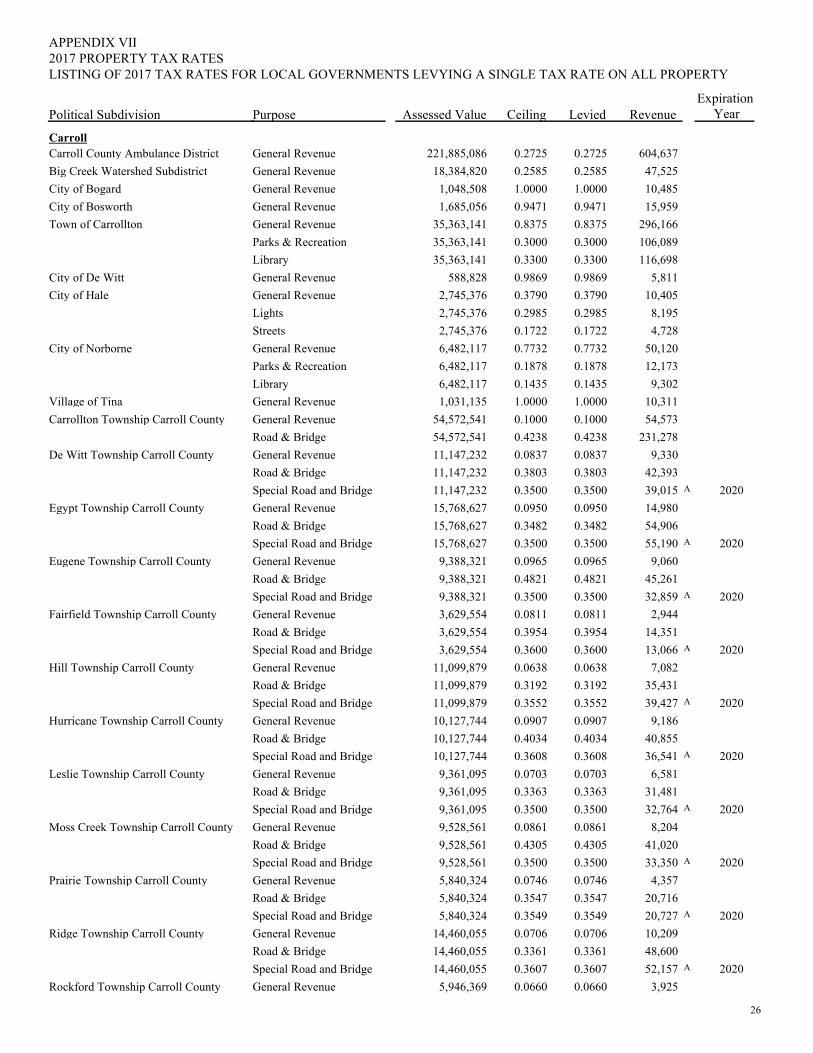
VII. Listing of 2017 Tax Rates for Local Governments Levying a Single Tax Rate on All Property ........................................................ 12
VIII. Listing of 2017 Tax Rates for Local Governments Levying a
Separate Tax Rate for Each Subclass of Property ........................... 109
State Auditor's Report
Results
2017 Property Tax Rates Table of Contents
Appendixes
NICOLE GALLOWAY, CPA Missouri State Auditor
2
Honorable Eric R. Greitens, Governor and Members of the General Assembly Jefferson City, Missouri The State Auditor's Office is required by Section 137.073, RSMo, to annually review local property tax rates of all taxing authorities in the state. The primary objectives of this review were to determine whether:
1. Local governing boards levied taxes in accordance with the Missouri Constitution and state law.
2. Local property tax rates were adjusted to ensure property reassessments were revenue
neutral. Reassessments of existing property are not intended to increase property tax revenue but to equitably reallocate the existing tax burden based on the relative value of property owned by taxpayers. For 2017, we received supporting data on 4,813 property tax rates of 2,799 taxing authorities. This is the third year since the State Auditor's Office started reviewing property tax rates that no taxing authorities levied a tax rate that exceeded the tax rate certified. Property taxes are the main source of revenue for many of Missouri's special purpose political subdivisions and county boards. The bulk of property taxes, however, fund public schools. General acceptance of these taxes is dependent on fair and equitable assessment practices and public understanding and input regarding the setting of rates. If the tax burden is increased without voter approval, confidence in the fairness and assessment practices can be eroded. Nicole R. Galloway, CPA State Auditor The following auditors participated in the preparation of this report: Director of Audits: Randall Gordon, M.Acct., CPA, CGAP Senior Analyst: Jill Wilson, MBA
3
2017 Property Tax Rates Results
The State Auditor received supporting data and reviewed 4,813 property tax rates for 2,799 taxing authorities. Of the rates reviewed, 499 are debt service tax rates, 158 are new property tax rates approved by voters, and 51 are existing property tax rates that were increased by voter approval. We reviewed the remaining 4,105 tax rates for revenue neutrality. This is the third year since the review of property tax rates started in 1985 that no taxing authorities levied a tax rate that exceeded the tax rate certified. The State Auditor's Office and county officials assist local government officials in determining the data necessary to complete the tax rate computations. Taxing authorities are required to file final proposed tax rates and data supporting the proposed property tax rates with the county, using forms prescribed by the State Auditor. The counties submit the supporting data received to the State Auditor for review. The data is reviewed and a finding is returned to both the county and the taxing authority advising whether the proposed rates comply with Missouri law. The 2017 tax rate ceilings were determined based on the requirements of Section 137.073, RSMo, and Missouri Constitution, Article X, Section 22 (commonly referred to as the Hancock Amendment). Each tax rate ceiling is determined annually and is adjusted to ensure revenue neutrality. The review of each tax rate ceiling is based on the assessed valuation for the entire political subdivision and is not calculated on an individual taxpayer basis. To ensure taxing authorities do not receive a windfall from reassessment, the review of property tax rates begins with the prior year allowed revenue. Current year tax rate ceilings must be set to yield the same gross revenue as allowed in the prior year. In addition, an adjustment is made for additional revenue permitted for assessment growth. That adjustment is the lower of (1) the actual growth rate, (2) the inflation rate as determined by the consumer price index, or (3) 5 percent. Factors such as new construction and improvements, newly added territory, newly separated territory, and changes from locally assessed to state assessed property also affect the tax rate ceiling calculation. Counties and the City of St. Louis use the tax rates set by each taxing authority to assess taxes on all property including new construction and improvements. Voters may authorize increases beyond the annual revenue neutral tax rate ceiling. Voter-approved increases are reviewed for compliance with applicable laws and stated ballot restrictions. In addition to reviewing new and existing property tax levies for revenue neutrality, the State Auditor's Office also reviews debt service tax rates. A tax levied to meet the annual debt service requirement is compliant if the revenue to be generated plus the existing fund balance does not exceed the current payment requirements plus a reserve for the following year's payments.
Summary
2017 Property Tax Rates Results
Methodology
4
2017 Property Tax Rates Results
Sections 137.073.5(3) and 137.073.5(4), RSMo, provide that a voluntary reduction taken in a non-reassessment year (even numbered year) results in a reduced tax rate ceiling during the following reassessment year (odd numbered year). These provisions also allow taxing authorities that voluntarily reduce a tax rate in a previous even numbered year to reverse the impact of the voluntary reduction to reinstate a higher tax rate ceiling in the following even numbered year. To increase the tax rate in the following even numbered year, the taxing authority must conduct a public hearing, and adopt an ordinance, a resolution, or a policy statement justifying its action before setting and certifying its tax rate. Section 137.073.6(3), RSMo, allows a taxing authority to submit amended tax rate forms to the State Auditor's Office in the event the taxing authority incorrectly completed the forms or made clerical errors. These changes are factored into the current year's tax rate ceiling calculation. A taxing authority's total assessed valuation submitted by the county clerk or a representative of the taxing authority is used in the State Auditor's Office review of property taxes. The State Auditor's Office does not review the assessed valuation of individual pieces of property. Chapter 138, RSMo, governs the appeals process for assessed valuations. Citizens may appeal their individual assessed valuations calculated by the county assessor to the local Board of Equalization. Citizens not satisfied with the resolution by the Board of Equalization may appeal the decision to the Missouri State Tax Commission. Any decision of the Missouri State Tax Commission may be reviewed by a court of law. As assessed valuations increase, tax rate ceilings generally decrease, depending on the amount of the increase, to produce substantially the same amount of revenue as allowed in the prior year. As assessed valuations decrease, tax rate ceilings may increase to produce substantially the same revenue as allowed in the prior year from existing property, limited by voter authorization. See Appendixes I and II for a summary of the changes in assessed valuation by type of taxing authority, and Appendixes III and IV for a summary of changes in tax rate ceilings by type of taxing authority. In addition, Appendix V is a map that provides a statewide geographical perspective of total county valuation changes prior to adjustments for new construction and reassessment. The total assessed valuation is the value used to bill the property tax rates. Appendix VI is a map of the adjusted assessed valuation by county. The adjusted assessed valuation is the value of last year's property in the current year. This map reflects the inflationary change in each county's valuation from the previous year. A significant inflationary change generally indicates a major reassessment occurred. However, 2017 assessed valuations indicate the majority of county adjusted assessed valuation changes were less than the consumer price index, which does not indicate a major reassessment increase. The comparison of assessed valuations and tax rate ceilings from 2016 to 2017 for Appendixes I through
5
2017 Property Tax Rates Results
VI give consideration to revisions submitted by taxing authorities to the State Auditor's Office for changes to assessments occurring after setting the 2016 property tax rate. Taxing authorities are listed by primary county (as designated by the taxing authority when established) in Appendixes VII and VIII and categorized by type of taxing authority. The counties are listed alphabetically (Adair through Wright followed by the City of St. Louis). A taxing authority located in more than one county is listed under the primary county only. The assessed valuations presented for taxing authorities in Appendixes VII and VIII, except school districts, include all taxable locally assessed and state assessed property. The assessed valuations presented for school districts include only taxable locally assessed property. The abated portions of property valuations that are not taxable under various economic development programs are omitted from the taxable assessed valuations used to compute the annual tax rate ceiling. Prior years' tax rate reports are available on the State Auditor's website at auditor.mo.gov. We do not review sales tax rollbacks required by law for some county levies as part of this report. Any concerns in that area would be addressed in audit reports we issue for individual counties. Sales tax (Proposition C) rollbacks for school levies were subjected to a limited review to ensure the district did not waive all or part of the rollback without voter approval in order to generate additional local revenues. A majority of the 516 school districts have obtained voter approved waivers of the required sales tax rollback of their property tax, including 453 with a full waiver and 36 with a partial waiver. Appendixes VII and VIII indicate the 489 school districts that have either full or partial waivers of Proposition C reductions.
Type of Taxing Authority
Number of Taxing
Authorities
Number of Tax Rates Authorized
With Increases In
Assessed Valuation
With Decreases In
Assessed Valuation
With No Change In Assessed Valuation Other (1)
Number of Tax Rates
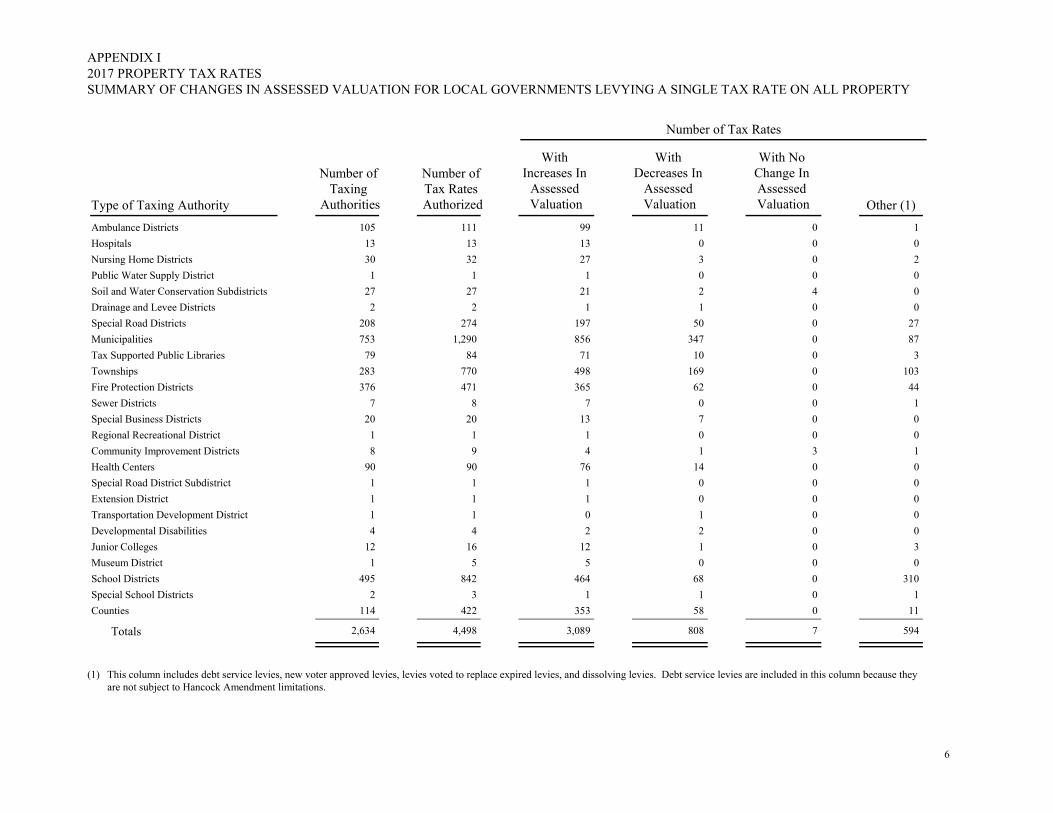
SUMMARY OF CHANGES IN ASSESSED VALUATION FOR LOCAL GOVERNMENTS LEVYING A SINGLE TAX RATE ON ALL PROPERTY
APPENDIX I2017 PROPERTY TAX RATES
Ambulance Districts 105 111 99 11 0 1Hospitals 13 13 13 0 0 0Nursing Home Districts 30 32 27 3 0 2Public Water Supply District 1 1 1 0 0 0Soil and Water Conservation Subdistricts 27 27 21 2 4 0Drainage and Levee Districts 2 2 1 1 0 0Special Road Districts 208 274 197 50 0 27Municipalities 753 1,290 856 347 0 87Tax Supported Public Libraries 79 84 71 10 0 3Townships 283 770 498 169 0 103Fire Protection Districts 376 471 365 62 0 44Sewer Districts 7 8 7 0 0 1Special Business Districts 20 20 13 7 0 0Regional Recreational District 1 1 1 0 0 0Community Improvement Districts 8 9 4 1 3 1Health Centers 90 90 76 14 0 0Special Road District Subdistrict 1 1 1 0 0 0Extension District 1 1 1 0 0 0Transportation Development District 1 1 0 1 0 0Developmental Disabilities 4 4 2 2 0 0Junior Colleges 12 16 12 1 0 3Museum District 1 5 5 0 0 0School Districts 495 842 464 68 0 310Special School Districts 2 3 1 1 0 1Counties 114 422 353 58 0 11
4,498 7 5948083,0892,634Totals
(1) This column includes debt service levies, new voter approved levies, levies voted to replace expired levies, and dissolving levies. Debt service levies are included in this column because they are not subject to Hancock Amendment limitations.
6
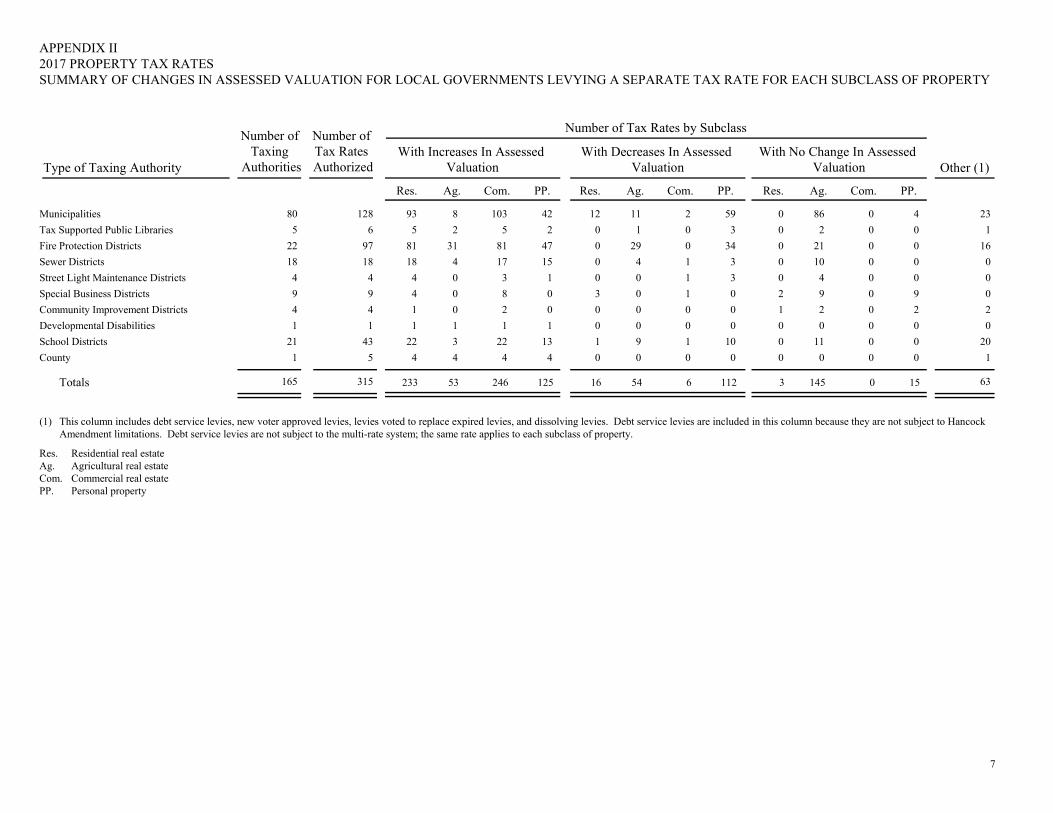
Type of Taxing Authority
Number of Taxing
Authorities
Number of Tax Rates Authorized
With Increases In Assessed Valuation
With Decreases In Assessed Valuation
With No Change In Assessed Valuation Other (1)
Number of Tax Rates by Subclass
2017 PROPERTY TAX RATESAPPENDIX II
Res. Ag. Com. PP. Res. Ag. Com. PP. Res. Ag. Com. PP.
SUMMARY OF CHANGES IN ASSESSED VALUATION FOR LOCAL GOVERNMENTS LEVYING A SEPARATE TAX RATE FOR EACH SUBCLASS OF PROPERTY
80 128 93 8 103 42 12 11 2 59 0 86 0 4 23Municipalities 5 6 5 2 5 2 0 1 0 3 0 2 0 0 1Tax Supported Public Libraries
22 97 81 31 81 47 0 29 0 34 0 21 0 0 16Fire Protection Districts 18 18 18 4 17 15 0 4 1 3 0 10 0 0 0Sewer Districts 4 4 4 0 3 1 0 0 1 3 0 4 0 0 0Street Light Maintenance Districts 9 9 4 0 8 0 3 0 1 0 2 9 0 9 0Special Business Districts4 4 1 0 2 0 0 0 0 0 1 2 0 2 2Community Improvement Districts 1 1 1 1 1 1 0 0 0 0 0 0 0 0 0Developmental Disabilities
21 43 22 3 22 13 1 9 1 10 0 11 0 0 20School Districts 1 5 4 4 4 4 0 0 0 0 0 0 0 0 1County
315 3 6353233165Totals 246 125 145 0 1516 54 6 112
(1)
Res.Ag. Com.PP.
This column includes debt service levies, new voter approved levies, levies voted to replace expired levies, and dissolving levies. Debt service levies are included in this column because they are not subject to Hancock Amendment limitations. Debt service levies are not subject to the multi-rate system; the same rate applies to each subclass of property.
Residential real estateAgricultural real estateCommercial real estatePersonal property
7
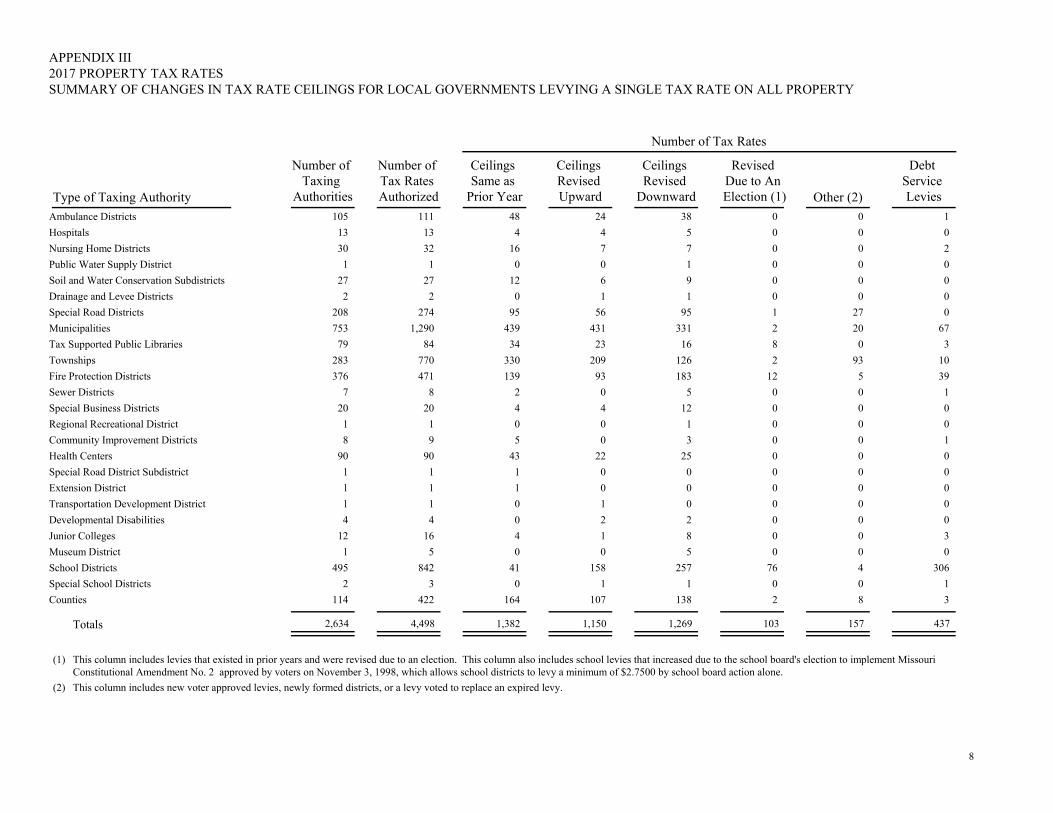
Type of Taxing Authority
Number of Taxing
Authorities
Ceilings Revised
Downward
Revised Due to An Election (1) Other (2)
Ceilings Revised Upward
Debt Service Levies
Ceilings Same as
Prior Year
Number of Tax Rates Authorized
APPENDIX III2017 PROPERTY TAX RATESSUMMARY OF CHANGES IN TAX RATE CEILINGS FOR LOCAL GOVERNMENTS LEVYING A SINGLE TAX RATE ON ALL PROPERTY
Number of Tax Rates
111 38 0 024 148105Ambulance Districts 13 5 0 04 0413Hospitals 32 7 0 07 21630Nursing Home Districts 1 1 0 00 001Public Water Supply District
27 9 0 06 01227Soil and Water Conservation Subdistricts2 1 0 01 002Drainage and Levee Districts
274 95 1 2756 095208Special Road Districts 1,290 331 2 20431 67439753Municipalities
84 16 8 023 33479Tax Supported Public Libraries 770 126 2 93209 10330283Townships 471 183 12 593 39139376Fire Protection Districts
8 5 0 00 127Sewer Districts 20 12 0 04 0420Special Business Districts1 1 0 00 001Regional Recreational District 9 3 0 00 158Community Improvement Districts
90 25 0 022 04390Health Centers 1 0 0 00 011Special Road District Subdistrict 1 0 0 00 011Extension District1 0 0 01 001Transportation Development District 4 2 0 02 004Developmental Disabilities
16 8 0 01 3412Junior Colleges 5 5 0 00 001Museum District
842 257 76 4158 30641495School Districts 3 1 0 01 102Special School Districts
422 138 2 8107 3164114Counties
(1) (2)
4,498 1031,269 1571,150 4371,3822,634Totals
This column includes levies that existed in prior years and were revised due to an election. This column also includes school levies that increased due to the school board's election to implement Missouri Constitutional Amendment No. 2 approved by voters on November 3, 1998, which allows school districts to levy a minimum of $2.7500 by school board action alone.This column includes new voter approved levies, newly formed districts, or a levy voted to replace an expired levy.
8
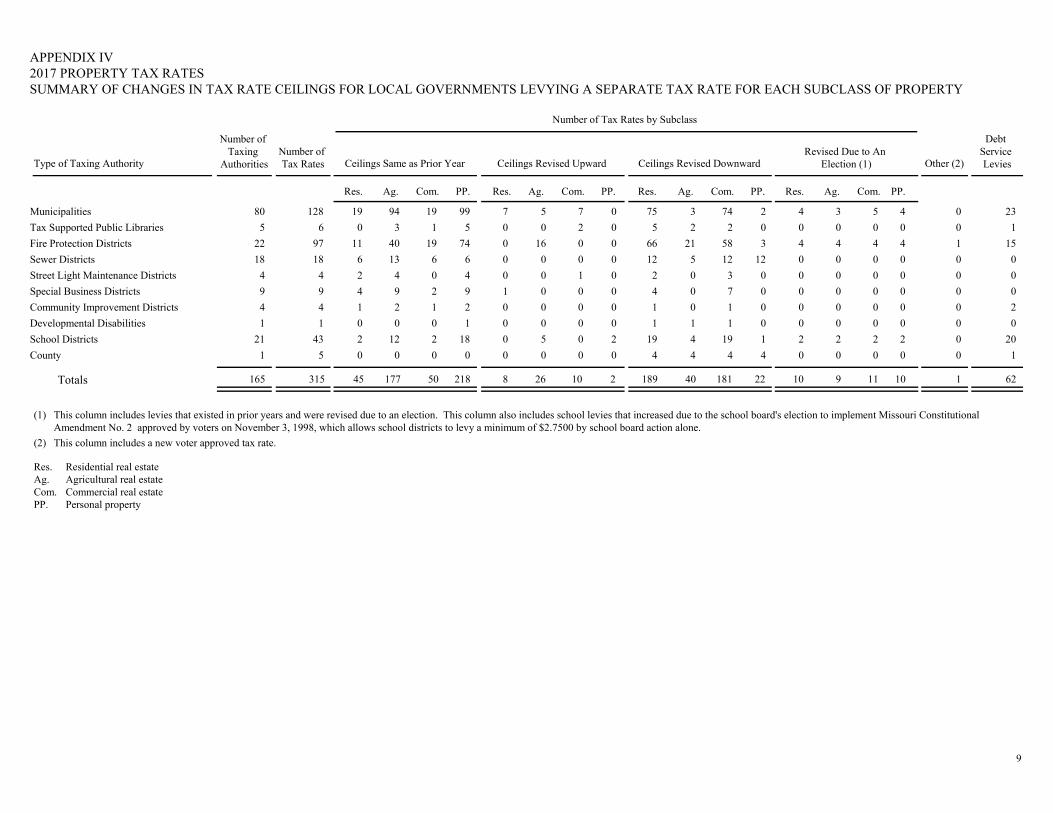
Type of Taxing Authority
Number of Taxing
Authorities Ceilings Revised DownwardRevised Due to An
Election (1) Other (2)Ceilings Revised Upward
Debt Service LeviesCeilings Same as Prior Year
Number of Tax Rates
APPENDIX IV2017 PROPERTY TAX RATES
Res. Ag. Com. PP. Res. Ag. Com. PP. Res. Ag. Com. PP. Res. Ag. Com. PP.
SUMMARY OF CHANGES IN TAX RATE CEILINGS FOR LOCAL GOVERNMENTS LEVYING A SEPARATE TAX RATE FOR EACH SUBCLASS OF PROPERTY
Number of Tax Rates by Subclass
12880 19 94 19 99 7 5 7 0 75 3 74 2 0 234 3 5 4Municipalities 65 0 3 1 5 0 0 2 0 5 2 2 0 0 10 0 0 0Tax Supported Public Libraries
9722 11 40 19 74 0 16 0 0 66 21 58 3 1 154 4 4 4Fire Protection Districts 1818 6 13 6 6 0 0 0 0 12 5 12 12 0 00 0 0 0Sewer Districts
44 2 4 0 4 0 0 1 0 2 0 3 0 0 00 0 0 0Street Light Maintenance Districts 99 4 9 2 9 1 0 0 0 4 0 7 0 0 00 0 0 0Special Business Districts44 1 2 1 2 0 0 0 0 1 0 1 0 0 20 0 0 0Community Improvement Districts 11 0 0 0 1 0 0 0 0 1 1 1 0 0 00 0 0 0Developmental Disabilities
4321 2 12 2 18 0 5 0 2 19 4 19 1 0 202 2 2 2School Districts 51 0 0 0 0 0 0 0 0 4 4 4 4 0 10 0 0 0County
(1)
(2)
315165Totals 45 177 50 218 8 26 10 2 189 40 181 22 1 6210 9 11 10
Res.Ag.Com.PP.
This column includes levies that existed in prior years and were revised due to an election. This column also includes school levies that increased due to the school board's election to implement Missouri Constitutional Amendment No. 2 approved by voters on November 3, 1998, which allows school districts to levy a minimum of $2.7500 by school board action alone.This column includes a new voter approved tax rate.
Residential real estateAgricultural real estateCommercial real estatePersonal property
9
Warren
NodawayWorth
Holt
Andrew
Gentry
Harrison
DeKalb
Buchanan Clinton
Daviess
Caldwell
Mercer
Grundy
Livingston
Putnam
Sullivan
Linn
Chariton
Adair
Schuyler
Macon
ScotlandClark
Knox Lewis
Shelby Marion
Ralls Monroe Randolph
Audrain
Boone
Howard Saline
Carroll Ray Clay
Platte
Jackson Lafayette
Cass
Johnson Pettis Cooper
Moniteau
Callaway
MORGANBenton
Henry
St Clair
Hickory
Miller
Laclede Dallas Polk
Cedar
Pulaski
Maries
Cole Osage
Bates
Vernon
Barton
Jasper
Newton
Dade
Lawrence
Greene Webster
Christian
Barry Stone
Douglas
McDonald Taney Ozark
Wright Texas
Howell
Phelps
Dent
Shannon
Oregon
Carter
Ripley
Reynolds
Crawford
Iron
Washington
Butler
Wayne
Madison
Bollinger
Stoddard
St Francois
Ste. Genevieve
Perry
CapeGirardeau
Scott
Mississippi
NewMadrid
Dunklin
Pemiscot
Pike
Lincoln
St Charles
Franklin
St Louis
Jefferson
Atchison
Ga
sco
na
de
M
on
tgo
me
ry
Camden
Morgan
-0.40-0.16
1.02
-0.66
5.26
1.57
1.03 1.40
7.193.10 4.40
2.85
28.433.30
6.07
-1.22 2.272.40 4.02
1.671.68
4.46
2.741.10 3.62
2.64-1.93
7.874.27 5.63
0.41
2.532.87
1.03 1.66
-1.90
7.40 8.22
1.11 1.42
3.35
2.73
3.65
0.4114.94
8.851.481.02 -0.901.93
2.93
1.10 4.90
0.88
4.06
1.79
1.32
3.84
5.77
7.53
8.261.50
0.84
1.55
1.50
0.62
3.20
2.866.79 2.52
2.78
1.78
1.001.12
5.75
3.103.16 3.59
3.13
-0.792.15
4.54
2.35
-5.14
2.55
6.89
2.542.81
1.07
-4.954.67
1.24-0.22
1.28
7.99
9.35
6.44 2.95
5.05
1.380.43 6.11
1.75
0.76 0.49 -5.80
1.54
-0.60
-0.08
-0.78
2.77
8.89
City of St Louis
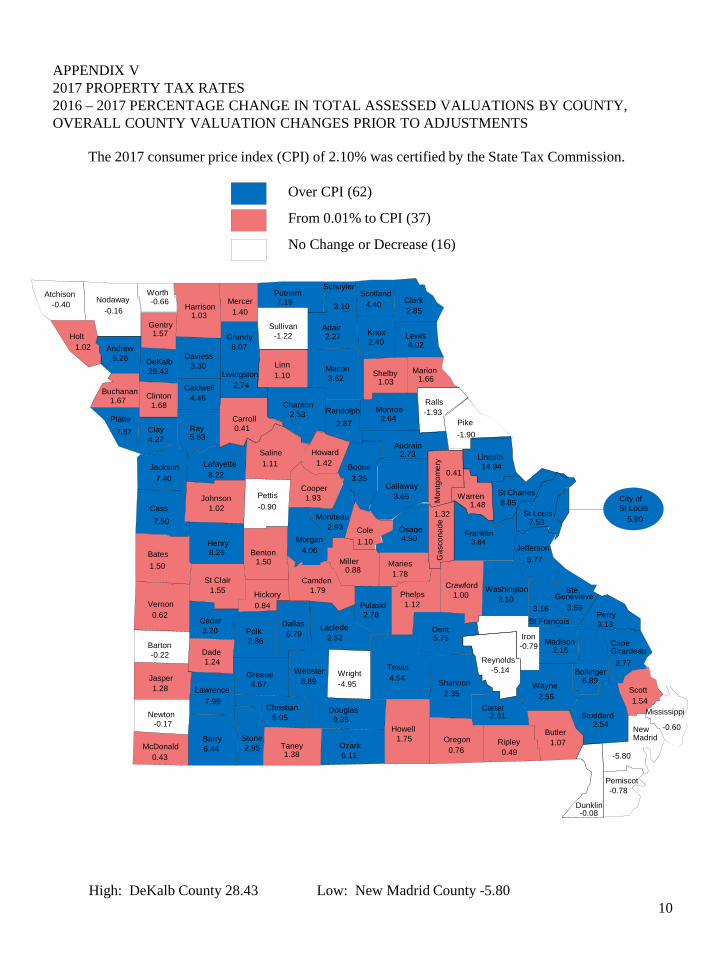
APPENDIX V2017 PROPERTY TAX RATES2016 – 2017 PERCENTAGE CHANGE IN TOTAL ASSESSED VALUATIONS BY COUNTY,OVERALL COUNTY VALUATION CHANGES PRIOR TO ADJUSTMENTS
High: DeKalb County 28.43 Low: New Madrid County -5.8010
Over CPI (62)
From 0.01% to CPI (37)
No Change or Decrease (16)
The 2017 consumer price index (CPI) of 2.10% was certified by the State Tax Commission.
5.807.50
-0.17
Laclede
Warren
NodawayWorth
Holt
Andrew
Gentry
Harrison
DeKalb
Buchanan Clinton
Daviess
Caldwell
Mercer
Grundy
Livingston
Putnam
Sullivan
Linn
Chariton
Adair
Schuyler
Macon
ScotlandClark
Knox Lewis
Shelby Marion
Ralls Monroe Randolph
Audrain
Boone
Howard Saline
Carroll Ray Clay
Platte
Jackson Lafayette
Cass
Johnson Pettis Cooper
Moniteau
Callaway
Benton Henry
St Clair
Hickory
Miller
Dallas Cedar
Pulaski
Maries
Cole Osage
Bates
Vernon
Barton
Jasper
Newton
Dade
Lawrence
Greene Webster
Christian
Barry Stone
Douglas
McDonald Taney Ozark
Wright Texas
Howell
Phelps
Dent
Shannon
Oregon
Carter
Ripley
Reynolds
Crawford
Iron
Washington
Butler
Wayne
Madison
Bollinger
Stoddard
St Francois
Ste Genevieve
Perry
CapeGirardeau
Scott
Mississippi
NewMadrid
Dunklin
Pemiscot
Pike
Lincoln
St Charles
Franklin
St Louis
Jefferson
Atchison
Ga
sco
na
de
M
on
tgo
me
ry
Camden
Morgan
-0.81-1.00
5.42
-1.51
3.07
0.35
-0.06 0.57
5.820.04 -0.57
0.89
4.150.96
4.64
-1.62 0.470.76 2.41
0.000.35
3.15
0.64
0.50 2.56
0.30-1.93
4.282.23 2.52
0.06
0.940.98
-0.54 0.00
-2.46
5.75 7.08
0.21 -0.28
0.38
1.12
0.29
-0.5412.18
6.640.17
5.200.11 -1.72
0.50
2.19
0.08 2.88
-0.35
2.38
0.64
0.39
2.23
4.90
6.36
4.560.20
-0.13
-0.58
0.01
-0.19
-0.06 0.664.64 0.62
0.37
-0.79
-0.32-0.14
3.05
-0.020.38 0.17
2.36
-1.95 -0.16
0.45
-0.04
-5.31
0.29
4.42
1.600.41
-0.33
-5.932.59
-0.20-0.80
-0.92
5.51
7.92-1.06
4.05 0.65
1.66
-0.22-0.40 4.69
0.59
-0.31 -0.87 -8.84
0.90
-1.26
-0.43-1.21
1.37
6.94
City of St Louis
4.22
Polk
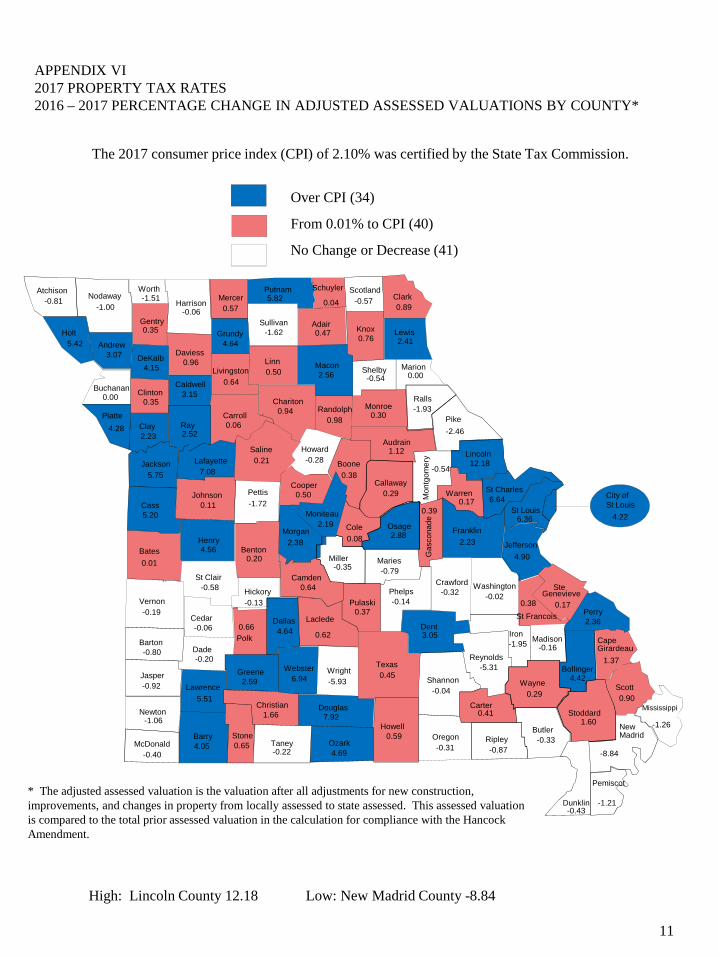
APPENDIX VI2017 PROPERTY TAX RATES2016 – 2017 PERCENTAGE CHANGE IN ADJUSTED ASSESSED VALUATIONS BY COUNTY*
High: Lincoln County 12.18 Low: New Madrid County -8.84
11
Over CPI (34)
From 0.01% to CPI (40)
No Change or Decrease (41)
* The adjusted assessed valuation is the valuation after all adjustments for new construction, improvements, and changes in property from locally assessed to state assessed. This assessed valuation is compared to the total prior assessed valuation in the calculation for compliance with the Hancock Amendment.
The 2017 consumer price index (CPI) of 2.10% was certified by the State Tax Commission.
PurposePolitical Subdivision
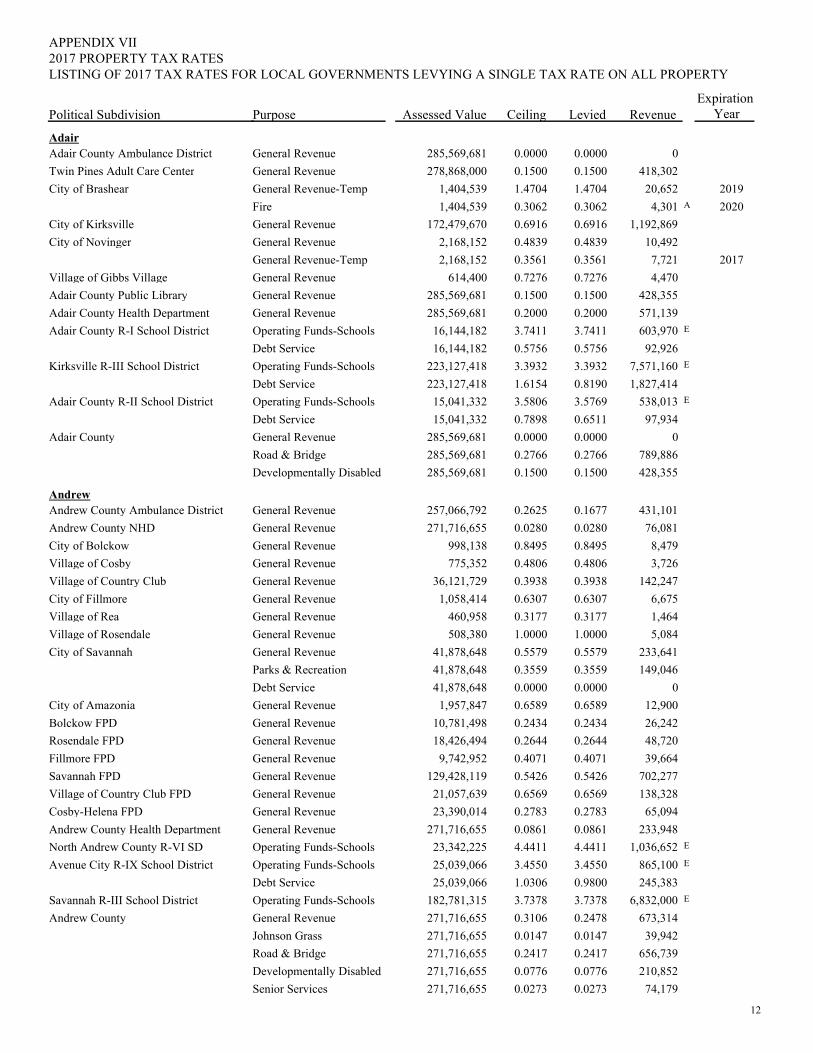
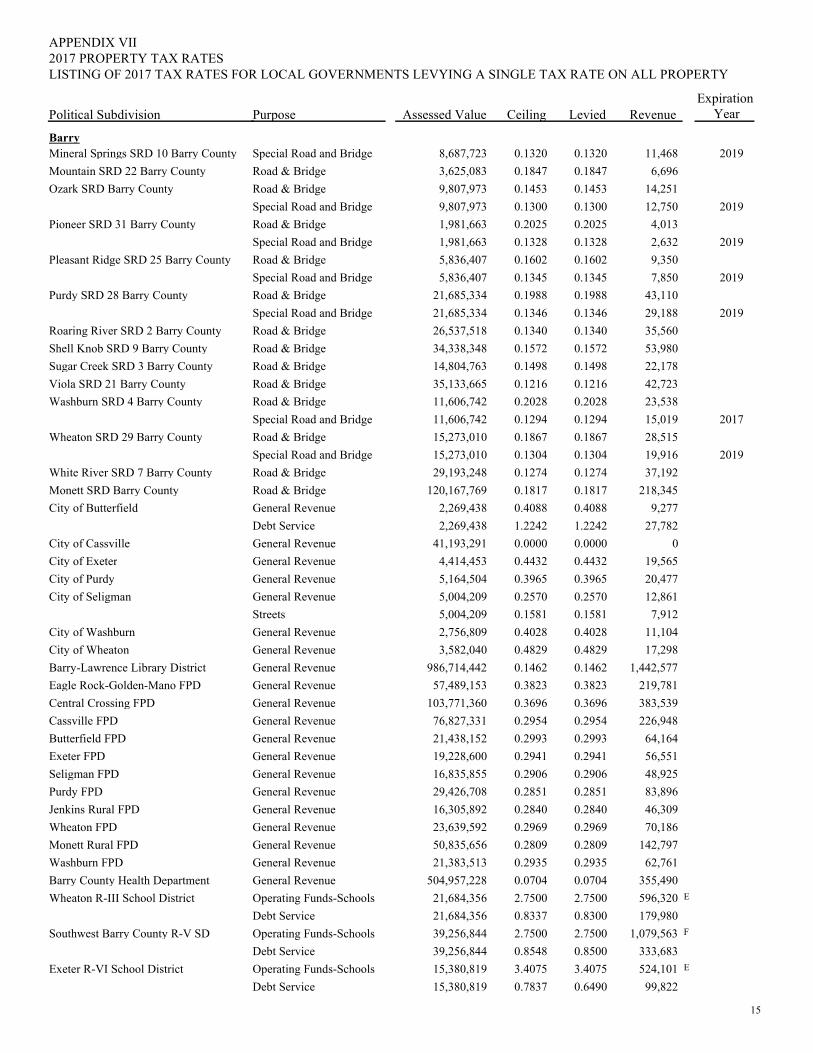
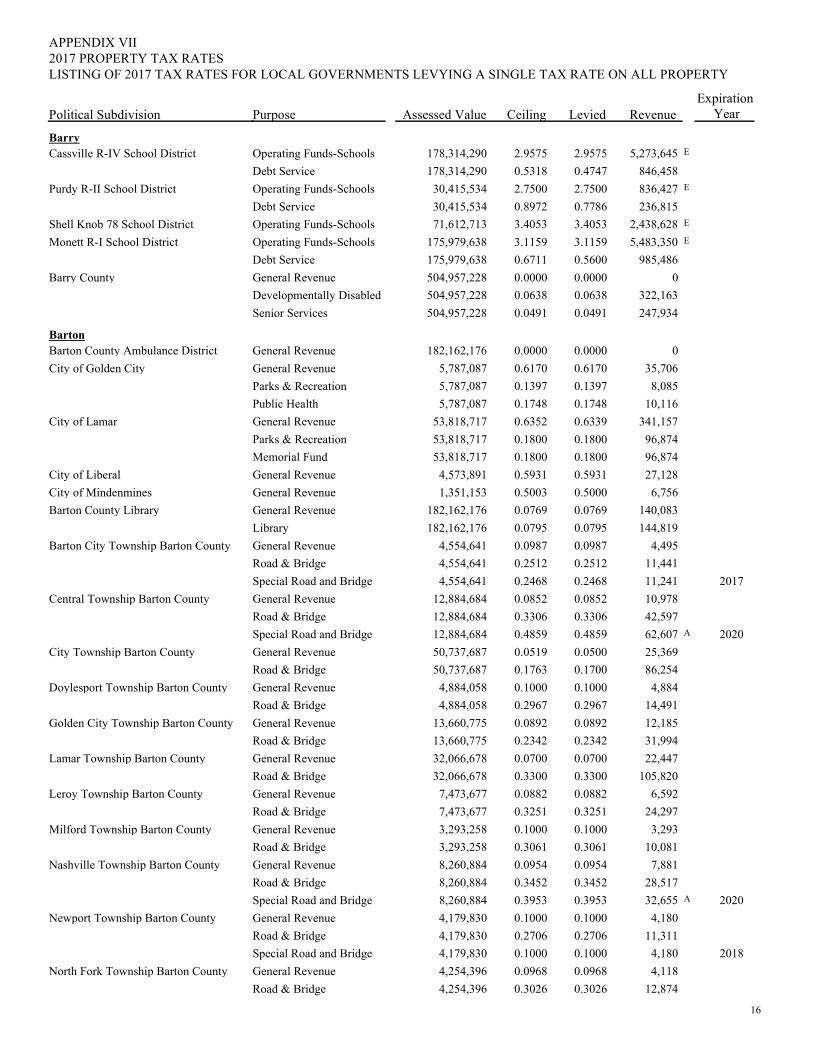
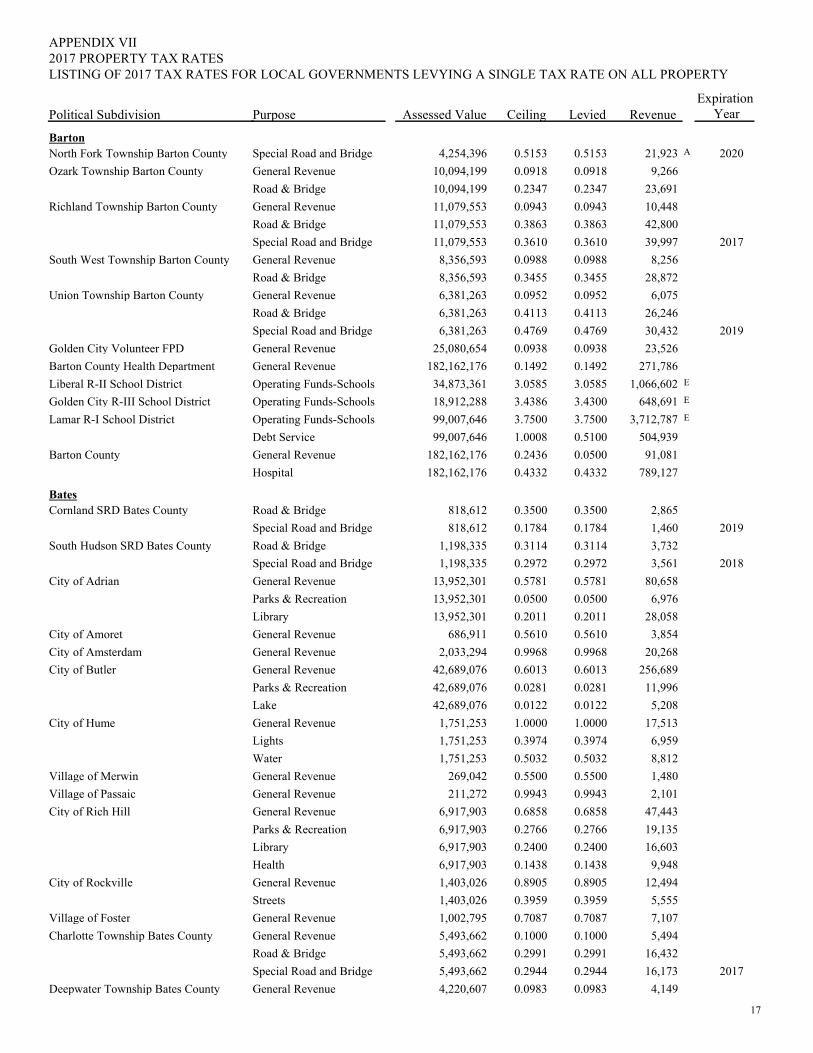
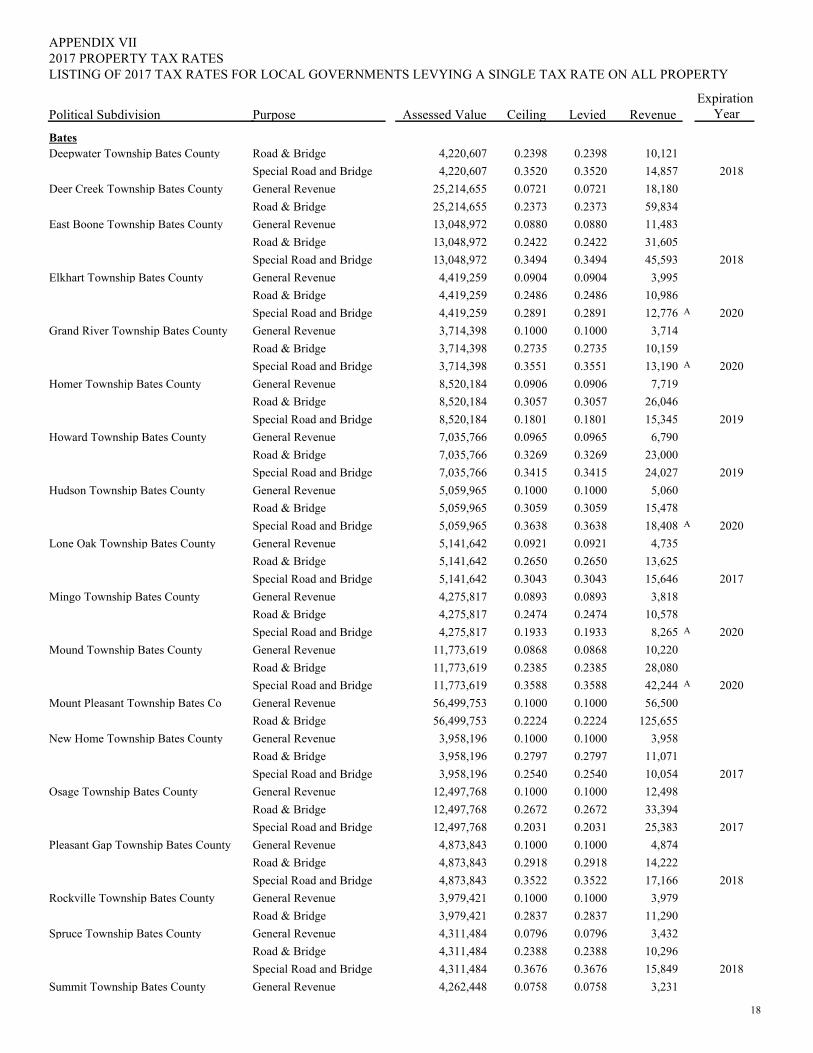
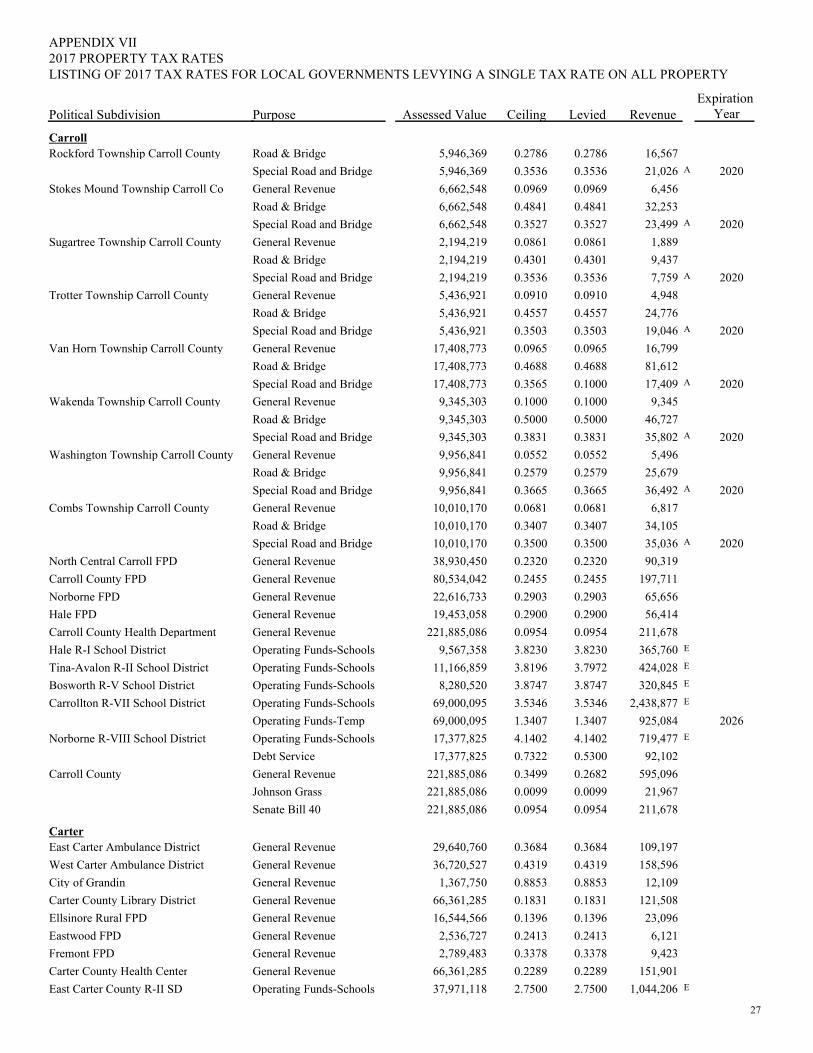
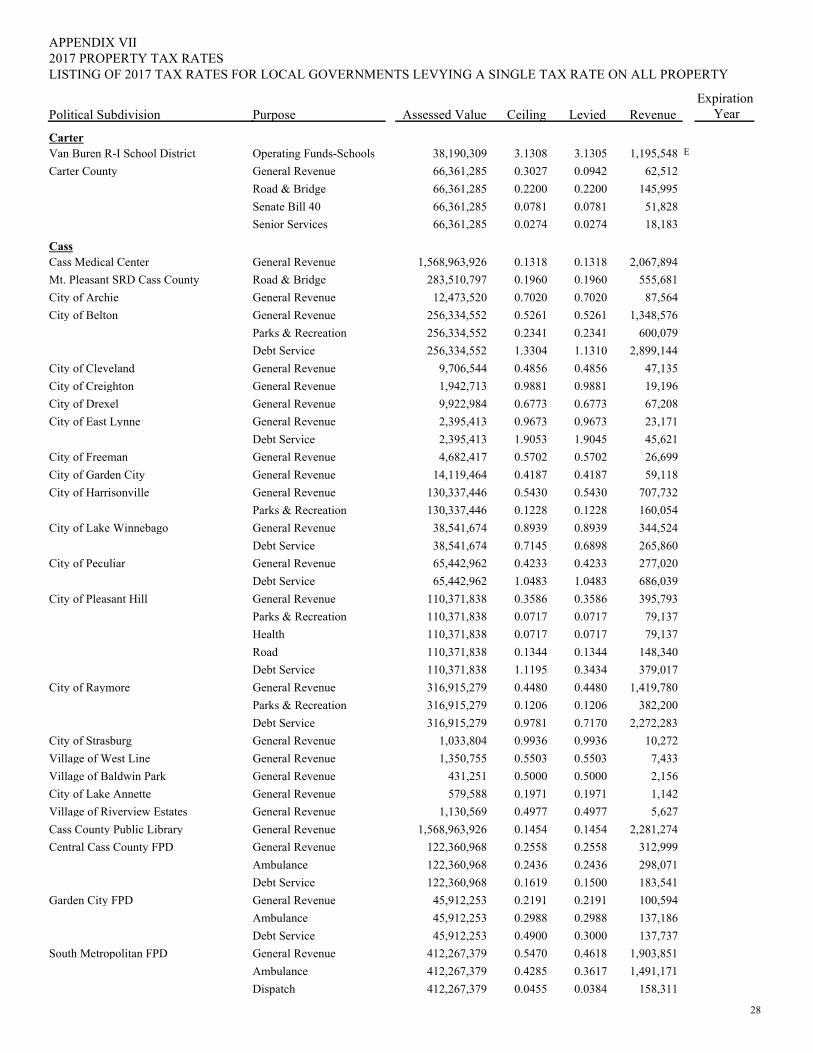
2017 PROPERTY TAX RATESAPPENDIX VII
Assessed Value Ceiling Levied RevenueExpiration
Year
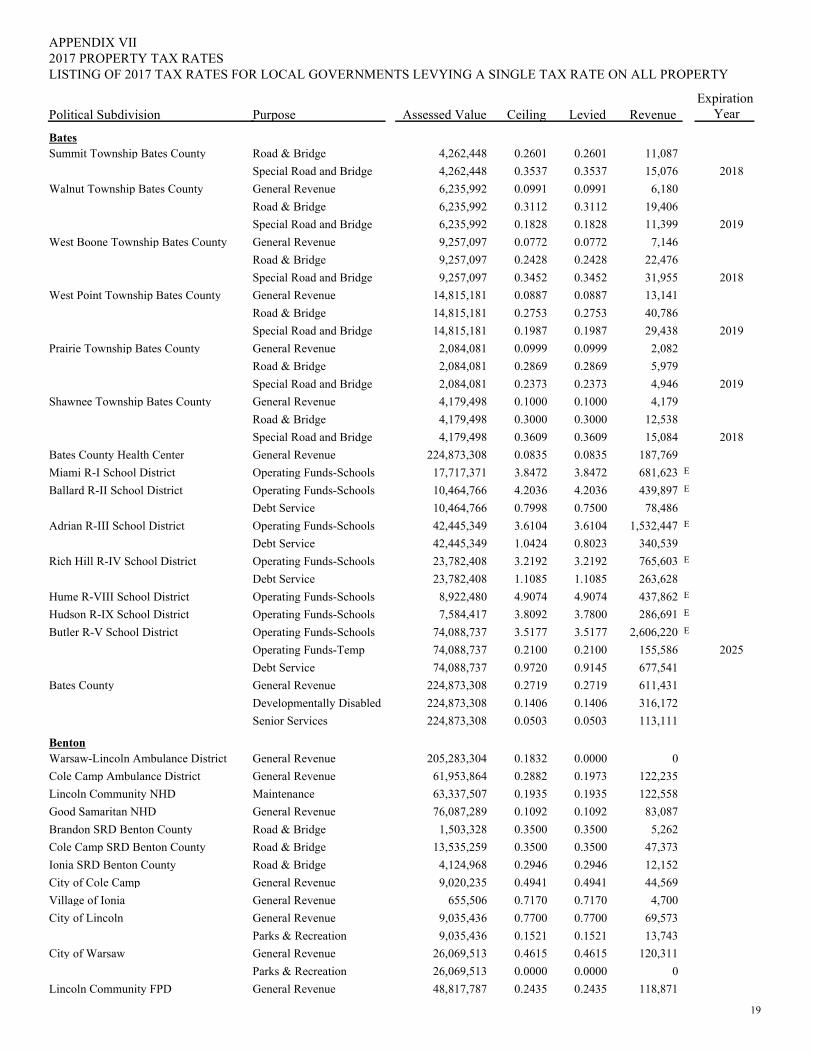
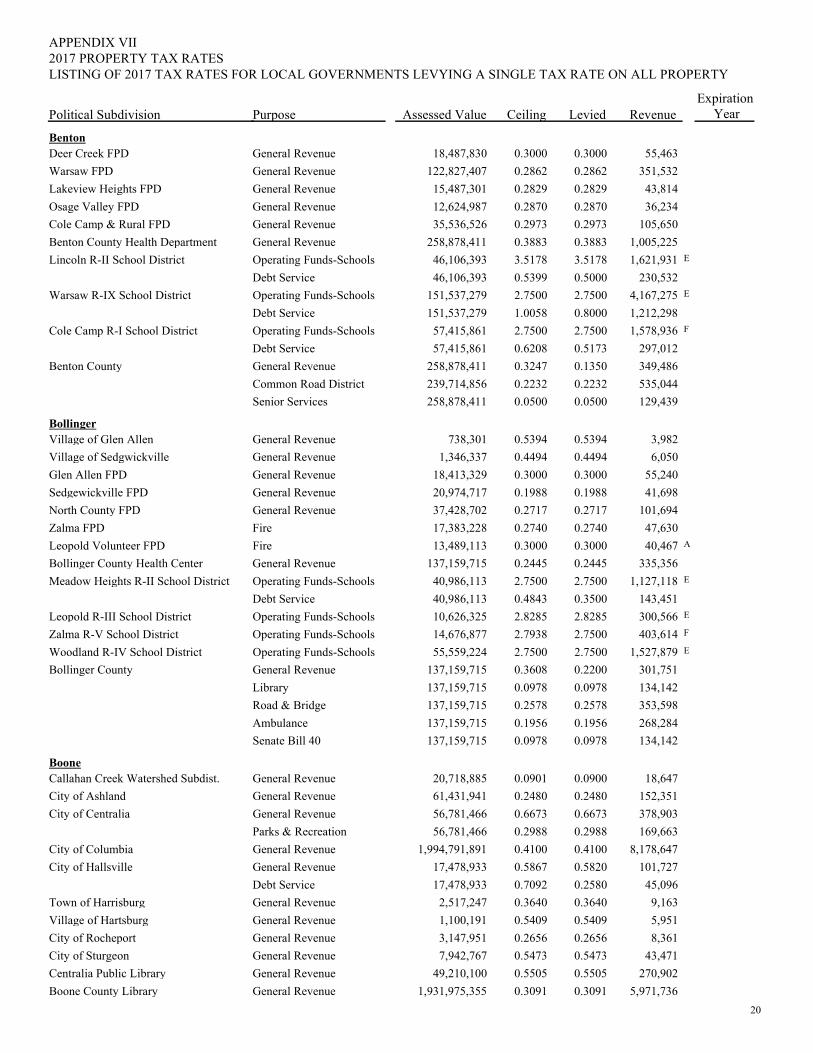
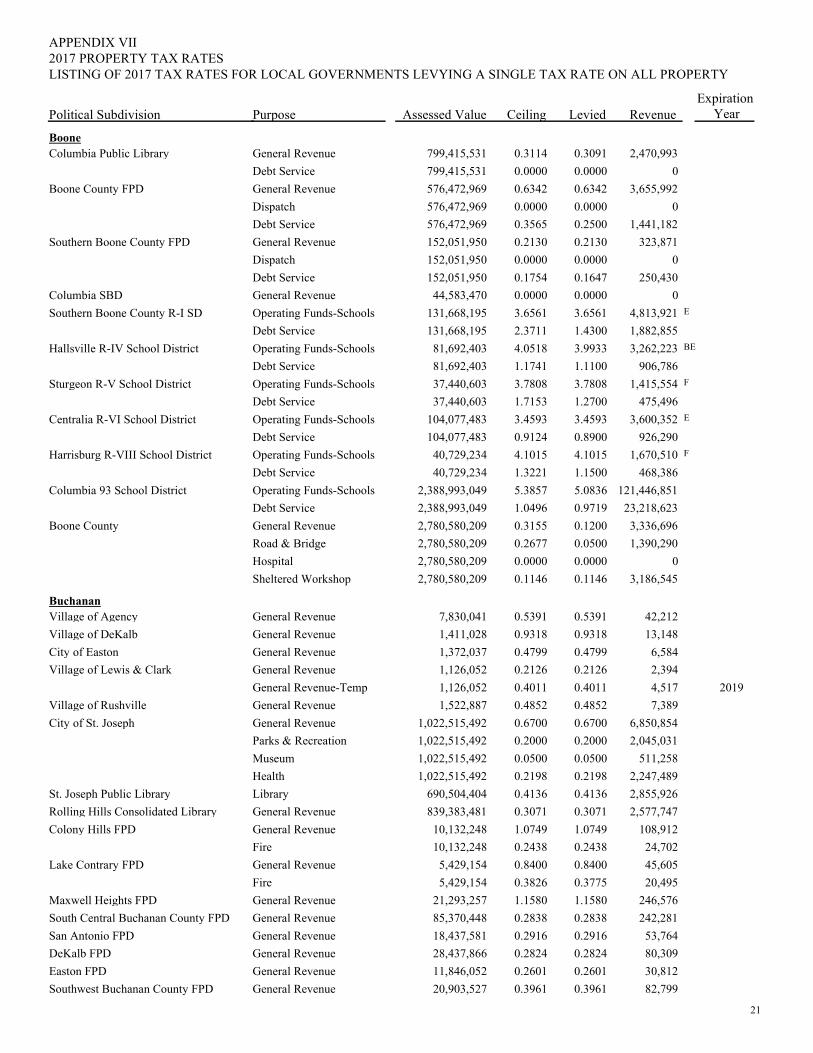
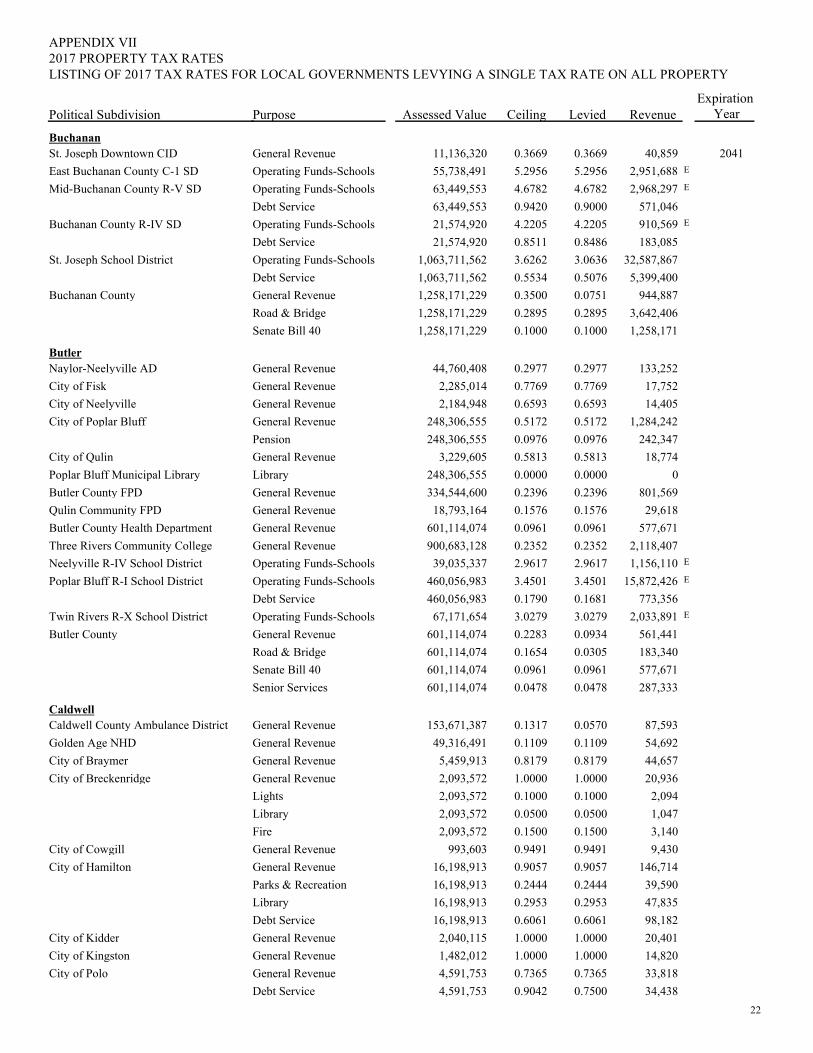
LISTING OF 2017 TAX RATES FOR LOCAL GOVERNMENTS LEVYING A SINGLE TAX RATE ON ALL PROPERTY
AdairAdair County Ambulance District General Revenue 0.00000.0000285,569,681 0Twin Pines Adult Care Center General Revenue 0.15000.1500278,868,000 418,302City of Brashear General Revenue-Temp 1.47041.47041,404,539 20,652 2019
Fire 0.30620.30621,404,539 A4,301 2020City of Kirksville General Revenue 0.69160.6916172,479,670 1,192,869City of Novinger General Revenue 0.48390.48392,168,152 10,492
General Revenue-Temp 0.35610.35612,168,152 7,721 2017Village of Gibbs Village General Revenue 0.72760.7276614,400 4,470Adair County Public Library General Revenue 0.15000.1500285,569,681 428,355Adair County Health Department General Revenue 0.20000.2000285,569,681 571,139Adair County R-I School District Operating Funds-Schools 3.74113.741116,144,182 E603,970
Debt Service 0.57560.575616,144,182 92,926Kirksville R-III School District Operating Funds-Schools 3.39323.3932223,127,418 E7,571,160
Debt Service 0.81901.6154223,127,418 1,827,414Adair County R-II School District Operating Funds-Schools 3.57693.580615,041,332 E538,013
Debt Service 0.65110.789815,041,332 97,934Adair County General Revenue 0.00000.0000285,569,681 0
Road & Bridge 0.27660.2766285,569,681 789,886Developmentally Disabled 0.15000.1500285,569,681 428,355
AndrewAndrew County Ambulance District General Revenue 0.16770.2625257,066,792 431,101Andrew County NHD General Revenue 0.02800.0280271,716,655 76,081City of Bolckow General Revenue 0.84950.8495998,138 8,479Village of Cosby General Revenue 0.48060.4806775,352 3,726Village of Country Club General Revenue 0.39380.393836,121,729 142,247City of Fillmore General Revenue 0.63070.63071,058,414 6,675Village of Rea General Revenue 0.31770.3177460,958 1,464Village of Rosendale General Revenue 1.00001.0000508,380 5,084City of Savannah General Revenue 0.55790.557941,878,648 233,641
Parks & Recreation 0.35590.355941,878,648 149,046Debt Service 0.00000.000041,878,648 0
City of Amazonia General Revenue 0.65890.65891,957,847 12,900Bolckow FPD General Revenue 0.24340.243410,781,498 26,242Rosendale FPD General Revenue 0.26440.264418,426,494 48,720Fillmore FPD General Revenue 0.40710.40719,742,952 39,664Savannah FPD General Revenue 0.54260.5426129,428,119 702,277Village of Country Club FPD General Revenue 0.65690.656921,057,639 138,328Cosby-Helena FPD General Revenue 0.27830.278323,390,014 65,094Andrew County Health Department General Revenue 0.08610.0861271,716,655 233,948North Andrew County R-VI SD Operating Funds-Schools 4.44114.441123,342,225 E1,036,652Avenue City R-IX School District Operating Funds-Schools 3.45503.455025,039,066 E865,100
Debt Service 0.98001.030625,039,066 245,383Savannah R-III School District Operating Funds-Schools 3.73783.7378182,781,315 E6,832,000Andrew County General Revenue 0.24780.3106271,716,655 673,314
Johnson Grass 0.01470.0147271,716,655 39,942Road & Bridge 0.24170.2417271,716,655 656,739Developmentally Disabled 0.07760.0776271,716,655 210,852Senior Services 0.02730.0273271,716,655 74,179
12
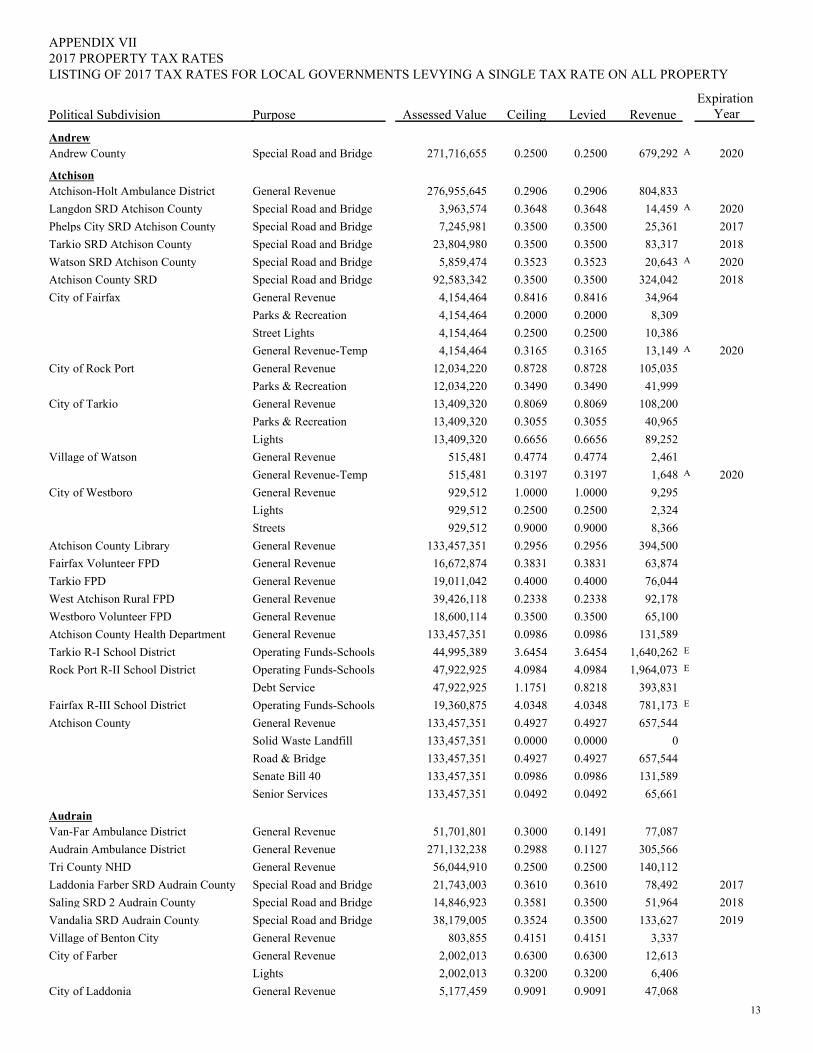
PurposePolitical Subdivision
2017 PROPERTY TAX RATESAPPENDIX VII
Assessed Value Ceiling Levied RevenueExpiration
Year
LISTING OF 2017 TAX RATES FOR LOCAL GOVERNMENTS LEVYING A SINGLE TAX RATE ON ALL PROPERTY
AndrewAndrew County Special Road and Bridge 0.25000.2500271,716,655 A679,292 2020
AtchisonAtchison-Holt Ambulance District General Revenue 0.29060.2906276,955,645 804,833Langdon SRD Atchison County Special Road and Bridge 0.36480.36483,963,574 A14,459 2020Phelps City SRD Atchison County Special Road and Bridge 0.35000.35007,245,981 25,361 2017Tarkio SRD Atchison County Special Road and Bridge 0.35000.350023,804,980 83,317 2018Watson SRD Atchison County Special Road and Bridge 0.35230.35235,859,474 A20,643 2020Atchison County SRD Special Road and Bridge 0.35000.350092,583,342 324,042 2018City of Fairfax General Revenue 0.84160.84164,154,464 34,964
Parks & Recreation 0.20000.20004,154,464 8,309Street Lights 0.25000.25004,154,464 10,386General Revenue-Temp 0.31650.31654,154,464 A13,149 2020
City of Rock Port General Revenue 0.87280.872812,034,220 105,035Parks & Recreation 0.34900.349012,034,220 41,999
City of Tarkio General Revenue 0.80690.806913,409,320 108,200Parks & Recreation 0.30550.305513,409,320 40,965Lights 0.66560.665613,409,320 89,252
Village of Watson General Revenue 0.47740.4774515,481 2,461General Revenue-Temp 0.31970.3197515,481 A1,648 2020
City of Westboro General Revenue 1.00001.0000929,512 9,295Lights 0.25000.2500929,512 2,324Streets 0.90000.9000929,512 8,366
Atchison County Library General Revenue 0.29560.2956133,457,351 394,500Fairfax Volunteer FPD General Revenue 0.38310.383116,672,874 63,874Tarkio FPD General Revenue 0.40000.400019,011,042 76,044West Atchison Rural FPD General Revenue 0.23380.233839,426,118 92,178Westboro Volunteer FPD General Revenue 0.35000.350018,600,114 65,100Atchison County Health Department General Revenue 0.09860.0986133,457,351 131,589Tarkio R-I School District Operating Funds-Schools 3.64543.645444,995,389 E1,640,262Rock Port R-II School District Operating Funds-Schools 4.09844.098447,922,925 E1,964,073
Debt Service 0.82181.175147,922,925 393,831Fairfax R-III School District Operating Funds-Schools 4.03484.034819,360,875 E781,173Atchison County General Revenue 0.49270.4927133,457,351 657,544
Solid Waste Landfill 0.00000.0000133,457,351 0Road & Bridge 0.49270.4927133,457,351 657,544Senate Bill 40 0.09860.0986133,457,351 131,589Senior Services 0.04920.0492133,457,351 65,661
AudrainVan-Far Ambulance District General Revenue 0.14910.300051,701,801 77,087Audrain Ambulance District General Revenue 0.11270.2988271,132,238 305,566Tri County NHD General Revenue 0.25000.250056,044,910 140,112Laddonia Farber SRD Audrain County Special Road and Bridge 0.36100.361021,743,003 78,492 2017Saling SRD 2 Audrain County Special Road and Bridge 0.35000.358114,846,923 51,964 2018Vandalia SRD Audrain County Special Road and Bridge 0.35000.352438,179,005 133,627 2019Village of Benton City General Revenue 0.41510.4151803,855 3,337City of Farber General Revenue 0.63000.63002,002,013 12,613
Lights 0.32000.32002,002,013 6,406City of Laddonia General Revenue 0.90910.90915,177,459 47,068
13
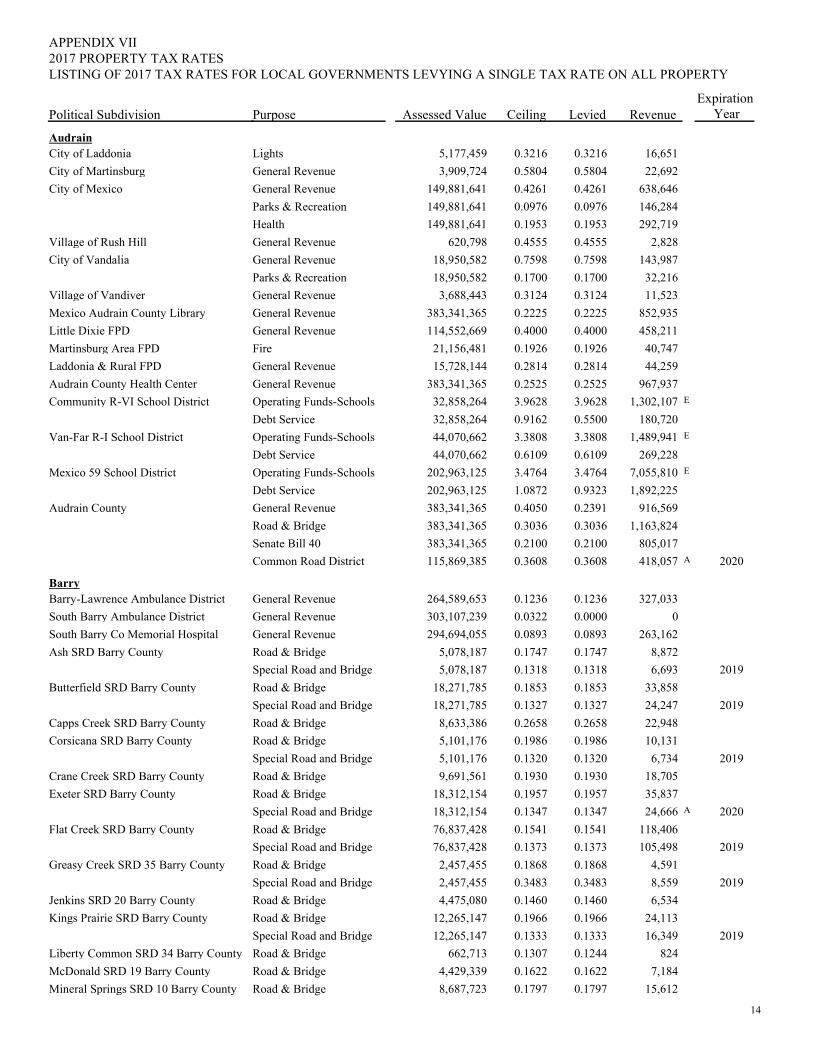
PurposePolitical Subdivision
2017 PROPERTY TAX RATESAPPENDIX VII
Assessed Value Ceiling Levied RevenueExpiration
Year
LISTING OF 2017 TAX RATES FOR LOCAL GOVERNMENTS LEVYING A SINGLE TAX RATE ON ALL PROPERTY
AudrainCity of Laddonia Lights 0.32160.32165,177,459 16,651City of Martinsburg General Revenue 0.58040.58043,909,724 22,692City of Mexico General Revenue 0.42610.4261149,881,641 638,646
Parks & Recreation 0.09760.0976149,881,641 146,284Health 0.19530.1953149,881,641 292,719
Village of Rush Hill General Revenue 0.45550.4555620,798 2,828City of Vandalia General Revenue 0.75980.759818,950,582 143,987
Parks & Recreation 0.17000.170018,950,582 32,216Village of Vandiver General Revenue 0.31240.31243,688,443 11,523Mexico Audrain County Library General Revenue 0.22250.2225383,341,365 852,935Little Dixie FPD General Revenue 0.40000.4000114,552,669 458,211Martinsburg Area FPD Fire 0.19260.192621,156,481 40,747Laddonia & Rural FPD General Revenue 0.28140.281415,728,144 44,259Audrain County Health Center General Revenue 0.25250.2525383,341,365 967,937Community R-VI School District Operating Funds-Schools 3.96283.962832,858,264 E1,302,107
Debt Service 0.55000.916232,858,264 180,720Van-Far R-I School District Operating Funds-Schools 3.38083.380844,070,662 E1,489,941
Debt Service 0.61090.610944,070,662 269,228Mexico 59 School District Operating Funds-Schools 3.47643.4764202,963,125 E7,055,810
Debt Service 0.93231.0872202,963,125 1,892,225Audrain County General Revenue 0.23910.4050383,341,365 916,569
Road & Bridge 0.30360.3036383,341,365 1,163,824Senate Bill 40 0.21000.2100383,341,365 805,017Common Road District 0.36080.3608115,869,385 A418,057 2020
BarryBarry-Lawrence Ambulance District General Revenue 0.12360.1236264,589,653 327,033South Barry Ambulance District General Revenue 0.00000.0322303,107,239 0South Barry Co Memorial Hospital General Revenue 0.08930.0893294,694,055 263,162Ash SRD Barry County Road & Bridge 0.17470.17475,078,187 8,872
Special Road and Bridge 0.13180.13185,078,187 6,693 2019Butterfield SRD Barry County Road & Bridge 0.18530.185318,271,785 33,858
Special Road and Bridge 0.13270.132718,271,785 24,247 2019Capps Creek SRD Barry County Road & Bridge 0.26580.26588,633,386 22,948Corsicana SRD Barry County Road & Bridge 0.19860.19865,101,176 10,131
Special Road and Bridge 0.13200.13205,101,176 6,734 2019Crane Creek SRD Barry County Road & Bridge 0.19300.19309,691,561 18,705Exeter SRD Barry County Road & Bridge 0.19570.195718,312,154 35,837
Special Road and Bridge 0.13470.134718,312,154 A24,666 2020Flat Creek SRD Barry County Road & Bridge 0.15410.154176,837,428 118,406
Special Road and Bridge 0.13730.137376,837,428 105,498 2019Greasy Creek SRD 35 Barry County Road & Bridge 0.18680.18682,457,455 4,591
Special Road and Bridge 0.34830.34832,457,455 8,559 2019Jenkins SRD 20 Barry County Road & Bridge 0.14600.14604,475,080 6,534Kings Prairie SRD Barry County Road & Bridge 0.19660.196612,265,147 24,113
Special Road and Bridge 0.13330.133312,265,147 16,349 2019Liberty Common SRD 34 Barry County Road & Bridge 0.12440.1307662,713 824McDonald SRD 19 Barry County Road & Bridge 0.16220.16224,429,339 7,184Mineral Springs SRD 10 Barry County Road & Bridge 0.17970.17978,687,723 15,612
14
PurposePolitical Subdivision
2017 PROPERTY TAX RATESAPPENDIX VII
Assessed Value Ceiling Levied RevenueExpiration
Year
LISTING OF 2017 TAX RATES FOR LOCAL GOVERNMENTS LEVYING A SINGLE TAX RATE ON ALL PROPERTY
BarryMineral Springs SRD 10 Barry County Special Road and Bridge 0.13200.13208,687,723 11,468 2019Mountain SRD 22 Barry County Road & Bridge 0.18470.18473,625,083 6,696Ozark SRD Barry County Road & Bridge 0.14530.14539,807,973 14,251
Special Road and Bridge 0.13000.13009,807,973 12,750 2019Pioneer SRD 31 Barry County Road & Bridge 0.20250.20251,981,663 4,013
Special Road and Bridge 0.13280.13281,981,663 2,632 2019Pleasant Ridge SRD 25 Barry County Road & Bridge 0.16020.16025,836,407 9,350
Special Road and Bridge 0.13450.13455,836,407 7,850 2019Purdy SRD 28 Barry County Road & Bridge 0.19880.198821,685,334 43,110
Special Road and Bridge 0.13460.134621,685,334 29,188 2019Roaring River SRD 2 Barry County Road & Bridge 0.13400.134026,537,518 35,560Shell Knob SRD 9 Barry County Road & Bridge 0.15720.157234,338,348 53,980Sugar Creek SRD 3 Barry County Road & Bridge 0.14980.149814,804,763 22,178Viola SRD 21 Barry County Road & Bridge 0.12160.121635,133,665 42,723Washburn SRD 4 Barry County Road & Bridge 0.20280.202811,606,742 23,538
Special Road and Bridge 0.12940.129411,606,742 15,019 2017Wheaton SRD 29 Barry County Road & Bridge 0.18670.186715,273,010 28,515
Special Road and Bridge 0.13040.130415,273,010 19,916 2019White River SRD 7 Barry County Road & Bridge 0.12740.127429,193,248 37,192Monett SRD Barry County Road & Bridge 0.18170.1817120,167,769 218,345City of Butterfield General Revenue 0.40880.40882,269,438 9,277
Debt Service 1.22421.22422,269,438 27,782City of Cassville General Revenue 0.00000.000041,193,291 0City of Exeter General Revenue 0.44320.44324,414,453 19,565City of Purdy General Revenue 0.39650.39655,164,504 20,477City of Seligman General Revenue 0.25700.25705,004,209 12,861
Streets 0.15810.15815,004,209 7,912City of Washburn General Revenue 0.40280.40282,756,809 11,104City of Wheaton General Revenue 0.48290.48293,582,040 17,298Barry-Lawrence Library District General Revenue 0.14620.1462986,714,442 1,442,577Eagle Rock-Golden-Mano FPD General Revenue 0.38230.382357,489,153 219,781Central Crossing FPD General Revenue 0.36960.3696103,771,360 383,539Cassville FPD General Revenue 0.29540.295476,827,331 226,948Butterfield FPD General Revenue 0.29930.299321,438,152 64,164Exeter FPD General Revenue 0.29410.294119,228,600 56,551Seligman FPD General Revenue 0.29060.290616,835,855 48,925Purdy FPD General Revenue 0.28510.285129,426,708 83,896Jenkins Rural FPD General Revenue 0.28400.284016,305,892 46,309Wheaton FPD General Revenue 0.29690.296923,639,592 70,186Monett Rural FPD General Revenue 0.28090.280950,835,656 142,797Washburn FPD General Revenue 0.29350.293521,383,513 62,761Barry County Health Department General Revenue 0.07040.0704504,957,228 355,490Wheaton R-III School District Operating Funds-Schools 2.75002.750021,684,356 E596,320
Debt Service 0.83000.833721,684,356 179,980Southwest Barry County R-V SD Operating Funds-Schools 2.75002.750039,256,844 F1,079,563
Debt Service 0.85000.854839,256,844 333,683Exeter R-VI School District Operating Funds-Schools 3.40753.407515,380,819 E524,101
Debt Service 0.64900.783715,380,819 99,822
15
PurposePolitical Subdivision
2017 PROPERTY TAX RATESAPPENDIX VII
Assessed Value Ceiling Levied RevenueExpiration
Year
LISTING OF 2017 TAX RATES FOR LOCAL GOVERNMENTS LEVYING A SINGLE TAX RATE ON ALL PROPERTY
BarryCassville R-IV School District Operating Funds-Schools 2.95752.9575178,314,290 E5,273,645
Debt Service 0.47470.5318178,314,290 846,458Purdy R-II School District Operating Funds-Schools 2.75002.750030,415,534 E836,427
Debt Service 0.77860.897230,415,534 236,815Shell Knob 78 School District Operating Funds-Schools 3.40533.405371,612,713 E2,438,628Monett R-I School District Operating Funds-Schools 3.11593.1159175,979,638 E5,483,350
Debt Service 0.56000.6711175,979,638 985,486Barry County General Revenue 0.00000.0000504,957,228 0
Developmentally Disabled 0.06380.0638504,957,228 322,163Senior Services 0.04910.0491504,957,228 247,934
BartonBarton County Ambulance District General Revenue 0.00000.0000182,162,176 0City of Golden City General Revenue 0.61700.61705,787,087 35,706
Parks & Recreation 0.13970.13975,787,087 8,085Public Health 0.17480.17485,787,087 10,116
City of Lamar General Revenue 0.63390.635253,818,717 341,157Parks & Recreation 0.18000.180053,818,717 96,874Memorial Fund 0.18000.180053,818,717 96,874
City of Liberal General Revenue 0.59310.59314,573,891 27,128City of Mindenmines General Revenue 0.50000.50031,351,153 6,756Barton County Library General Revenue 0.07690.0769182,162,176 140,083
Library 0.07950.0795182,162,176 144,819Barton City Township Barton County General Revenue 0.09870.09874,554,641 4,495
Road & Bridge 0.25120.25124,554,641 11,441Special Road and Bridge 0.24680.24684,554,641 11,241 2017
Central Township Barton County General Revenue 0.08520.085212,884,684 10,978Road & Bridge 0.33060.330612,884,684 42,597Special Road and Bridge 0.48590.485912,884,684 A62,607 2020
City Township Barton County General Revenue 0.05000.051950,737,687 25,369Road & Bridge 0.17000.176350,737,687 86,254
Doylesport Township Barton County General Revenue 0.10000.10004,884,058 4,884Road & Bridge 0.29670.29674,884,058 14,491
Golden City Township Barton County General Revenue 0.08920.089213,660,775 12,185Road & Bridge 0.23420.234213,660,775 31,994
Lamar Township Barton County General Revenue 0.07000.070032,066,678 22,447Road & Bridge 0.33000.330032,066,678 105,820
Leroy Township Barton County General Revenue 0.08820.08827,473,677 6,592Road & Bridge 0.32510.32517,473,677 24,297
Milford Township Barton County General Revenue 0.10000.10003,293,258 3,293Road & Bridge 0.30610.30613,293,258 10,081
Nashville Township Barton County General Revenue 0.09540.09548,260,884 7,881Road & Bridge 0.34520.34528,260,884 28,517Special Road and Bridge 0.39530.39538,260,884 A32,655 2020
Newport Township Barton County General Revenue 0.10000.10004,179,830 4,180Road & Bridge 0.27060.27064,179,830 11,311Special Road and Bridge 0.10000.10004,179,830 4,180 2018
North Fork Township Barton County General Revenue 0.09680.09684,254,396 4,118Road & Bridge 0.30260.30264,254,396 12,874
16
PurposePolitical Subdivision
2017 PROPERTY TAX RATESAPPENDIX VII
Assessed Value Ceiling Levied RevenueExpiration
Year
LISTING OF 2017 TAX RATES FOR LOCAL GOVERNMENTS LEVYING A SINGLE TAX RATE ON ALL PROPERTY
BartonNorth Fork Township Barton County Special Road and Bridge 0.51530.51534,254,396 A21,923 2020Ozark Township Barton County General Revenue 0.09180.091810,094,199 9,266
Road & Bridge 0.23470.234710,094,199 23,691Richland Township Barton County General Revenue 0.09430.094311,079,553 10,448
Road & Bridge 0.38630.386311,079,553 42,800Special Road and Bridge 0.36100.361011,079,553 39,997 2017
South West Township Barton County General Revenue 0.09880.09888,356,593 8,256Road & Bridge 0.34550.34558,356,593 28,872
Union Township Barton County General Revenue 0.09520.09526,381,263 6,075Road & Bridge 0.41130.41136,381,263 26,246Special Road and Bridge 0.47690.47696,381,263 30,432 2019
Golden City Volunteer FPD General Revenue 0.09380.093825,080,654 23,526Barton County Health Department General Revenue 0.14920.1492182,162,176 271,786Liberal R-II School District Operating Funds-Schools 3.05853.058534,873,361 E1,066,602Golden City R-III School District Operating Funds-Schools 3.43003.438618,912,288 E648,691Lamar R-I School District Operating Funds-Schools 3.75003.750099,007,646 E3,712,787
Debt Service 0.51001.000899,007,646 504,939Barton County General Revenue 0.05000.2436182,162,176 91,081
Hospital 0.43320.4332182,162,176 789,127
BatesCornland SRD Bates County Road & Bridge 0.35000.3500818,612 2,865
Special Road and Bridge 0.17840.1784818,612 1,460 2019South Hudson SRD Bates County Road & Bridge 0.31140.31141,198,335 3,732
Special Road and Bridge 0.29720.29721,198,335 3,561 2018City of Adrian General Revenue 0.57810.578113,952,301 80,658
Parks & Recreation 0.05000.050013,952,301 6,976Library 0.20110.201113,952,301 28,058
City of Amoret General Revenue 0.56100.5610686,911 3,854City of Amsterdam General Revenue 0.99680.99682,033,294 20,268City of Butler General Revenue 0.60130.601342,689,076 256,689
Parks & Recreation 0.02810.028142,689,076 11,996Lake 0.01220.012242,689,076 5,208
City of Hume General Revenue 1.00001.00001,751,253 17,513Lights 0.39740.39741,751,253 6,959Water 0.50320.50321,751,253 8,812
Village of Merwin General Revenue 0.55000.5500269,042 1,480Village of Passaic General Revenue 0.99430.9943211,272 2,101City of Rich Hill General Revenue 0.68580.68586,917,903 47,443
Parks & Recreation 0.27660.27666,917,903 19,135Library 0.24000.24006,917,903 16,603Health 0.14380.14386,917,903 9,948
City of Rockville General Revenue 0.89050.89051,403,026 12,494Streets 0.39590.39591,403,026 5,555
Village of Foster General Revenue 0.70870.70871,002,795 7,107Charlotte Township Bates County General Revenue 0.10000.10005,493,662 5,494
Road & Bridge 0.29910.29915,493,662 16,432Special Road and Bridge 0.29440.29445,493,662 16,173 2017
Deepwater Township Bates County General Revenue 0.09830.09834,220,607 4,149
17
PurposePolitical Subdivision
2017 PROPERTY TAX RATESAPPENDIX VII
Assessed Value Ceiling Levied RevenueExpiration
Year
LISTING OF 2017 TAX RATES FOR LOCAL GOVERNMENTS LEVYING A SINGLE TAX RATE ON ALL PROPERTY
BatesDeepwater Township Bates County Road & Bridge 0.23980.23984,220,607 10,121
Special Road and Bridge 0.35200.35204,220,607 14,857 2018Deer Creek Township Bates County General Revenue 0.07210.072125,214,655 18,180
Road & Bridge 0.23730.237325,214,655 59,834East Boone Township Bates County General Revenue 0.08800.088013,048,972 11,483
Road & Bridge 0.24220.242213,048,972 31,605Special Road and Bridge 0.34940.349413,048,972 45,593 2018
Elkhart Township Bates County General Revenue 0.09040.09044,419,259 3,995Road & Bridge 0.24860.24864,419,259 10,986Special Road and Bridge 0.28910.28914,419,259 A12,776 2020
Grand River Township Bates County General Revenue 0.10000.10003,714,398 3,714Road & Bridge 0.27350.27353,714,398 10,159Special Road and Bridge 0.35510.35513,714,398 A13,190 2020
Homer Township Bates County General Revenue 0.09060.09068,520,184 7,719Road & Bridge 0.30570.30578,520,184 26,046Special Road and Bridge 0.18010.18018,520,184 15,345 2019
Howard Township Bates County General Revenue 0.09650.09657,035,766 6,790Road & Bridge 0.32690.32697,035,766 23,000Special Road and Bridge 0.34150.34157,035,766 24,027 2019
Hudson Township Bates County General Revenue 0.10000.10005,059,965 5,060Road & Bridge 0.30590.30595,059,965 15,478Special Road and Bridge 0.36380.36385,059,965 A18,408 2020
Lone Oak Township Bates County General Revenue 0.09210.09215,141,642 4,735Road & Bridge 0.26500.26505,141,642 13,625Special Road and Bridge 0.30430.30435,141,642 15,646 2017
Mingo Township Bates County General Revenue 0.08930.08934,275,817 3,818Road & Bridge 0.24740.24744,275,817 10,578Special Road and Bridge 0.19330.19334,275,817 A8,265 2020
Mound Township Bates County General Revenue 0.08680.086811,773,619 10,220Road & Bridge 0.23850.238511,773,619 28,080Special Road and Bridge 0.35880.358811,773,619 A42,244 2020
Mount Pleasant Township Bates Co General Revenue 0.10000.100056,499,753 56,500Road & Bridge 0.22240.222456,499,753 125,655
New Home Township Bates County General Revenue 0.10000.10003,958,196 3,958Road & Bridge 0.27970.27973,958,196 11,071Special Road and Bridge 0.25400.25403,958,196 10,054 2017
Osage Township Bates County General Revenue 0.10000.100012,497,768 12,498Road & Bridge 0.26720.267212,497,768 33,394Special Road and Bridge 0.20310.203112,497,768 25,383 2017
Pleasant Gap Township Bates County General Revenue 0.10000.10004,873,843 4,874Road & Bridge 0.29180.29184,873,843 14,222Special Road and Bridge 0.35220.35224,873,843 17,166 2018
Rockville Township Bates County General Revenue 0.10000.10003,979,421 3,979Road & Bridge 0.28370.28373,979,421 11,290
Spruce Township Bates County General Revenue 0.07960.07964,311,484 3,432Road & Bridge 0.23880.23884,311,484 10,296Special Road and Bridge 0.36760.36764,311,484 15,849 2018
Summit Township Bates County General Revenue 0.07580.07584,262,448 3,231
18
PurposePolitical Subdivision
2017 PROPERTY TAX RATESAPPENDIX VII
Assessed Value Ceiling Levied RevenueExpiration
Year
LISTING OF 2017 TAX RATES FOR LOCAL GOVERNMENTS LEVYING A SINGLE TAX RATE ON ALL PROPERTY
BatesSummit Township Bates County Road & Bridge 0.26010.26014,262,448 11,087
Special Road and Bridge 0.35370.35374,262,448 15,076 2018Walnut Township Bates County General Revenue 0.09910.09916,235,992 6,180
Road & Bridge 0.31120.31126,235,992 19,406Special Road and Bridge 0.18280.18286,235,992 11,399 2019
West Boone Township Bates County General Revenue 0.07720.07729,257,097 7,146Road & Bridge 0.24280.24289,257,097 22,476Special Road and Bridge 0.34520.34529,257,097 31,955 2018
West Point Township Bates County General Revenue 0.08870.088714,815,181 13,141Road & Bridge 0.27530.275314,815,181 40,786Special Road and Bridge 0.19870.198714,815,181 29,438 2019
Prairie Township Bates County General Revenue 0.09990.09992,084,081 2,082Road & Bridge 0.28690.28692,084,081 5,979Special Road and Bridge 0.23730.23732,084,081 4,946 2019
Shawnee Township Bates County General Revenue 0.10000.10004,179,498 4,179Road & Bridge 0.30000.30004,179,498 12,538Special Road and Bridge 0.36090.36094,179,498 15,084 2018
Bates County Health Center General Revenue 0.08350.0835224,873,308 187,769Miami R-I School District Operating Funds-Schools 3.84723.847217,717,371 E681,623Ballard R-II School District Operating Funds-Schools 4.20364.203610,464,766 E439,897
Debt Service 0.75000.799810,464,766 78,486Adrian R-III School District Operating Funds-Schools 3.61043.610442,445,349 E1,532,447
Debt Service 0.80231.042442,445,349 340,539Rich Hill R-IV School District Operating Funds-Schools 3.21923.219223,782,408 E765,603
Debt Service 1.10851.108523,782,408 263,628Hume R-VIII School District Operating Funds-Schools 4.90744.90748,922,480 E437,862Hudson R-IX School District Operating Funds-Schools 3.78003.80927,584,417 E286,691Butler R-V School District Operating Funds-Schools 3.51773.517774,088,737 E2,606,220
Operating Funds-Temp 0.21000.210074,088,737 155,586 2025Debt Service 0.91450.972074,088,737 677,541
Bates County General Revenue 0.27190.2719224,873,308 611,431Developmentally Disabled 0.14060.1406224,873,308 316,172Senior Services 0.05030.0503224,873,308 113,111
BentonWarsaw-Lincoln Ambulance District General Revenue 0.00000.1832205,283,304 0Cole Camp Ambulance District General Revenue 0.19730.288261,953,864 122,235Lincoln Community NHD Maintenance 0.19350.193563,337,507 122,558Good Samaritan NHD General Revenue 0.10920.109276,087,289 83,087Brandon SRD Benton County Road & Bridge 0.35000.35001,503,328 5,262Cole Camp SRD Benton County Road & Bridge 0.35000.350013,535,259 47,373Ionia SRD Benton County Road & Bridge 0.29460.29464,124,968 12,152City of Cole Camp General Revenue 0.49410.49419,020,235 44,569Village of Ionia General Revenue 0.71700.7170655,506 4,700City of Lincoln General Revenue 0.77000.77009,035,436 69,573
Parks & Recreation 0.15210.15219,035,436 13,743City of Warsaw General Revenue 0.46150.461526,069,513 120,311
Parks & Recreation 0.00000.000026,069,513 0Lincoln Community FPD General Revenue 0.24350.243548,817,787 118,871
19
PurposePolitical Subdivision
2017 PROPERTY TAX RATESAPPENDIX VII
Assessed Value Ceiling Levied RevenueExpiration
Year
LISTING OF 2017 TAX RATES FOR LOCAL GOVERNMENTS LEVYING A SINGLE TAX RATE ON ALL PROPERTY
BentonDeer Creek FPD General Revenue 0.30000.300018,487,830 55,463Warsaw FPD General Revenue 0.28620.2862122,827,407 351,532Lakeview Heights FPD General Revenue 0.28290.282915,487,301 43,814Osage Valley FPD General Revenue 0.28700.287012,624,987 36,234Cole Camp & Rural FPD General Revenue 0.29730.297335,536,526 105,650Benton County Health Department General Revenue 0.38830.3883258,878,411 1,005,225Lincoln R-II School District Operating Funds-Schools 3.51783.517846,106,393 E1,621,931
Debt Service 0.50000.539946,106,393 230,532Warsaw R-IX School District Operating Funds-Schools 2.75002.7500151,537,279 E4,167,275
Debt Service 0.80001.0058151,537,279 1,212,298Cole Camp R-I School District Operating Funds-Schools 2.75002.750057,415,861 F1,578,936
Debt Service 0.51730.620857,415,861 297,012Benton County General Revenue 0.13500.3247258,878,411 349,486
Common Road District 0.22320.2232239,714,856 535,044Senior Services 0.05000.0500258,878,411 129,439
BollingerVillage of Glen Allen General Revenue 0.53940.5394738,301 3,982Village of Sedgwickville General Revenue 0.44940.44941,346,337 6,050Glen Allen FPD General Revenue 0.30000.300018,413,329 55,240Sedgewickville FPD General Revenue 0.19880.198820,974,717 41,698North County FPD General Revenue 0.27170.271737,428,702 101,694Zalma FPD Fire 0.27400.274017,383,228 47,630Leopold Volunteer FPD Fire 0.30000.300013,489,113 A40,467Bollinger County Health Center General Revenue 0.24450.2445137,159,715 335,356Meadow Heights R-II School District Operating Funds-Schools 2.75002.750040,986,113 E1,127,118
Debt Service 0.35000.484340,986,113 143,451Leopold R-III School District Operating Funds-Schools 2.82852.828510,626,325 E300,566Zalma R-V School District Operating Funds-Schools 2.75002.793814,676,877 F403,614Woodland R-IV School District Operating Funds-Schools 2.75002.750055,559,224 E1,527,879Bollinger County General Revenue 0.22000.3608137,159,715 301,751
Library 0.09780.0978137,159,715 134,142Road & Bridge 0.25780.2578137,159,715 353,598Ambulance 0.19560.1956137,159,715 268,284Senate Bill 40 0.09780.0978137,159,715 134,142
BooneCallahan Creek Watershed Subdist. General Revenue 0.09000.090120,718,885 18,647City of Ashland General Revenue 0.24800.248061,431,941 152,351City of Centralia General Revenue 0.66730.667356,781,466 378,903
Parks & Recreation 0.29880.298856,781,466 169,663City of Columbia General Revenue 0.41000.41001,994,791,891 8,178,647City of Hallsville General Revenue 0.58200.586717,478,933 101,727
Debt Service 0.25800.709217,478,933 45,096Town of Harrisburg General Revenue 0.36400.36402,517,247 9,163Village of Hartsburg General Revenue 0.54090.54091,100,191 5,951City of Rocheport General Revenue 0.26560.26563,147,951 8,361City of Sturgeon General Revenue 0.54730.54737,942,767 43,471Centralia Public Library General Revenue 0.55050.550549,210,100 270,902Boone County Library General Revenue 0.30910.30911,931,975,355 5,971,736
20
PurposePolitical Subdivision
2017 PROPERTY TAX RATESAPPENDIX VII
Assessed Value Ceiling Levied RevenueExpiration
Year
LISTING OF 2017 TAX RATES FOR LOCAL GOVERNMENTS LEVYING A SINGLE TAX RATE ON ALL PROPERTY
BooneColumbia Public Library General Revenue 0.30910.3114799,415,531 2,470,993
Debt Service 0.00000.0000799,415,531 0Boone County FPD General Revenue 0.63420.6342576,472,969 3,655,992
Dispatch 0.00000.0000576,472,969 0Debt Service 0.25000.3565576,472,969 1,441,182
Southern Boone County FPD General Revenue 0.21300.2130152,051,950 323,871Dispatch 0.00000.0000152,051,950 0Debt Service 0.16470.1754152,051,950 250,430
Columbia SBD General Revenue 0.00000.000044,583,470 0Southern Boone County R-I SD Operating Funds-Schools 3.65613.6561131,668,195 E4,813,921
Debt Service 1.43002.3711131,668,195 1,882,855Hallsville R-IV School District Operating Funds-Schools 3.99334.051881,692,403 BE3,262,223
Debt Service 1.11001.174181,692,403 906,786Sturgeon R-V School District Operating Funds-Schools 3.78083.780837,440,603 F1,415,554
Debt Service 1.27001.715337,440,603 475,496Centralia R-VI School District Operating Funds-Schools 3.45933.4593104,077,483 E3,600,352
Debt Service 0.89000.9124104,077,483 926,290Harrisburg R-VIII School District Operating Funds-Schools 4.10154.101540,729,234 F1,670,510
Debt Service 1.15001.322140,729,234 468,386Columbia 93 School District Operating Funds-Schools 5.08365.38572,388,993,049 121,446,851
Debt Service 0.97191.04962,388,993,049 23,218,623Boone County General Revenue 0.12000.31552,780,580,209 3,336,696
Road & Bridge 0.05000.26772,780,580,209 1,390,290Hospital 0.00000.00002,780,580,209 0Sheltered Workshop 0.11460.11462,780,580,209 3,186,545
BuchananVillage of Agency General Revenue 0.53910.53917,830,041 42,212Village of DeKalb General Revenue 0.93180.93181,411,028 13,148City of Easton General Revenue 0.47990.47991,372,037 6,584Village of Lewis & Clark General Revenue 0.21260.21261,126,052 2,394
General Revenue-Temp 0.40110.40111,126,052 4,517 2019Village of Rushville General Revenue 0.48520.48521,522,887 7,389City of St. Joseph General Revenue 0.67000.67001,022,515,492 6,850,854
Parks & Recreation 0.20000.20001,022,515,492 2,045,031Museum 0.05000.05001,022,515,492 511,258Health 0.21980.21981,022,515,492 2,247,489
St. Joseph Public Library Library 0.41360.4136690,504,404 2,855,926Rolling Hills Consolidated Library General Revenue 0.30710.3071839,383,481 2,577,747Colony Hills FPD General Revenue 1.07491.074910,132,248 108,912
Fire 0.24380.243810,132,248 24,702Lake Contrary FPD General Revenue 0.84000.84005,429,154 45,605
Fire 0.37750.38265,429,154 20,495Maxwell Heights FPD General Revenue 1.15801.158021,293,257 246,576South Central Buchanan County FPD General Revenue 0.28380.283885,370,448 242,281San Antonio FPD General Revenue 0.29160.291618,437,581 53,764DeKalb FPD General Revenue 0.28240.282428,437,866 80,309Easton FPD General Revenue 0.26010.260111,846,052 30,812Southwest Buchanan County FPD General Revenue 0.39610.396120,903,527 82,799
21
PurposePolitical Subdivision
2017 PROPERTY TAX RATESAPPENDIX VII
Assessed Value Ceiling Levied RevenueExpiration
Year
LISTING OF 2017 TAX RATES FOR LOCAL GOVERNMENTS LEVYING A SINGLE TAX RATE ON ALL PROPERTY
BuchananSt. Joseph Downtown CID General Revenue 0.36690.366911,136,320 40,859 2041East Buchanan County C-1 SD Operating Funds-Schools 5.29565.295655,738,491 E2,951,688Mid-Buchanan County R-V SD Operating Funds-Schools 4.67824.678263,449,553 E2,968,297
Debt Service 0.90000.942063,449,553 571,046Buchanan County R-IV SD Operating Funds-Schools 4.22054.220521,574,920 E910,569
Debt Service 0.84860.851121,574,920 183,085St. Joseph School District Operating Funds-Schools 3.06363.62621,063,711,562 32,587,867
Debt Service 0.50760.55341,063,711,562 5,399,400Buchanan County General Revenue 0.07510.35001,258,171,229 944,887
Road & Bridge 0.28950.28951,258,171,229 3,642,406Senate Bill 40 0.10000.10001,258,171,229 1,258,171
ButlerNaylor-Neelyville AD General Revenue 0.29770.297744,760,408 133,252City of Fisk General Revenue 0.77690.77692,285,014 17,752City of Neelyville General Revenue 0.65930.65932,184,948 14,405City of Poplar Bluff General Revenue 0.51720.5172248,306,555 1,284,242
Pension 0.09760.0976248,306,555 242,347City of Qulin General Revenue 0.58130.58133,229,605 18,774Poplar Bluff Municipal Library Library 0.00000.0000248,306,555 0Butler County FPD General Revenue 0.23960.2396334,544,600 801,569Qulin Community FPD General Revenue 0.15760.157618,793,164 29,618Butler County Health Department General Revenue 0.09610.0961601,114,074 577,671Three Rivers Community College General Revenue 0.23520.2352900,683,128 2,118,407Neelyville R-IV School District Operating Funds-Schools 2.96172.961739,035,337 E1,156,110Poplar Bluff R-I School District Operating Funds-Schools 3.45013.4501460,056,983 E15,872,426
Debt Service 0.16810.1790460,056,983 773,356Twin Rivers R-X School District Operating Funds-Schools 3.02793.027967,171,654 E2,033,891Butler County General Revenue 0.09340.2283601,114,074 561,441
Road & Bridge 0.03050.1654601,114,074 183,340Senate Bill 40 0.09610.0961601,114,074 577,671Senior Services 0.04780.0478601,114,074 287,333
CaldwellCaldwell County Ambulance District General Revenue 0.05700.1317153,671,387 87,593Golden Age NHD General Revenue 0.11090.110949,316,491 54,692City of Braymer General Revenue 0.81790.81795,459,913 44,657City of Breckenridge General Revenue 1.00001.00002,093,572 20,936
Lights 0.10000.10002,093,572 2,094Library 0.05000.05002,093,572 1,047Fire 0.15000.15002,093,572 3,140
City of Cowgill General Revenue 0.94910.9491993,603 9,430City of Hamilton General Revenue 0.90570.905716,198,913 146,714
Parks & Recreation 0.24440.244416,198,913 39,590Library 0.29530.295316,198,913 47,835Debt Service 0.60610.606116,198,913 98,182
City of Kidder General Revenue 1.00001.00002,040,115 20,401City of Kingston General Revenue 1.00001.00001,482,012 14,820City of Polo General Revenue 0.73650.73654,591,753 33,818
Debt Service 0.75000.90424,591,753 34,43822
PurposePolitical Subdivision
2017 PROPERTY TAX RATESAPPENDIX VII
Assessed Value Ceiling Levied RevenueExpiration
Year
LISTING OF 2017 TAX RATES FOR LOCAL GOVERNMENTS LEVYING A SINGLE TAX RATE ON ALL PROPERTY
CaldwellCaldwell County Library General Revenue 0.11710.1171135,374,430 158,523Breckenridge Township Caldwell Co General Revenue 0.09440.09448,126,417 7,671
Road & Bridge 0.47250.47258,146,417 38,492Special Road and Bridge 0.30590.30598,146,417 24,920 2019
Davis Township Caldwell County General Revenue 0.07890.078916,876,906 13,316Road & Bridge 0.37660.376616,876,906 63,558Special Road and Bridge 0.17000.170016,876,906 28,691 2019
Fairview Township Caldwell County General Revenue 0.09680.09684,124,815 3,993Road & Bridge 0.48350.48354,124,815 19,943Special Road and Bridge 0.32210.32214,124,815 A13,286 2020
Gomer Township Caldwell County General Revenue 0.09080.09087,663,237 6,958Road & Bridge 0.45080.45087,663,237 34,546Special Road and Bridge 0.34930.34937,663,237 A26,768 2020
Grant Township Caldwell County General Revenue 0.08790.087926,948,144 23,687Road & Bridge 0.35840.358426,948,144 96,582Special Road and Bridge 0.23940.239426,948,144 64,514 2019
Hamilton Township Caldwell County General Revenue 0.07060.070625,055,414 17,689Road & Bridge 0.31260.312625,055,414 78,323
Kidder Township Caldwell County General Revenue 0.09370.093713,047,532 12,226Road & Bridge 0.38470.384713,047,532 50,194Special Road and Bridge 0.31830.318313,047,532 41,530 2019
Kingston Township Caldwell County General Revenue 0.09820.09827,197,018 7,067Road & Bridge 0.49120.49127,197,018 35,352Special Road and Bridge 0.35000.35007,197,018 25,190 2019
Lincoln Township Caldwell County General Revenue 0.07550.075513,222,615 9,983Road & Bridge 0.33220.332213,222,615 43,926Special Road and Bridge 0.33000.330013,222,615 43,635 2019
Mirabile Township Caldwell County General Revenue 0.09940.09945,922,611 5,887Road & Bridge 0.46730.46735,922,611 27,676Special Road and Bridge 0.35340.35345,922,611 A20,931 2020
New York Township Caldwell County General Revenue 0.07520.07526,839,389 5,143Road & Bridge 0.35950.35956,839,389 24,588Special Road and Bridge 0.30350.30356,839,389 20,758 2019
Rockford Township Caldwell County General Revenue 0.06800.068018,550,633 12,614Road & Bridge 0.29910.299118,550,633 55,485Special Road and Bridge 0.35000.350018,550,633 A64,927 2020
Hamilton FPD General Revenue 0.17670.176740,094,636 70,847Caldwell County Health Department General Revenue 0.23190.2319153,671,387 356,364Breckenridge R-I School District Operating Funds-Schools 4.59974.59977,073,738 E325,371Hamilton R-II School District Operating Funds-Schools 3.02943.029440,780,889 E1,235,416
Operating Funds-Temp 0.36920.369240,780,889 150,563 2026Debt Service 1.38001.392540,780,889 562,776
New York R-IV School District Operating Funds-Schools 4.59005.06273,918,360 179,853Cowgill R-VI School District Operating Funds-Schools 3.97383.97384,138,900 E164,472Polo R-VII School District Operating Funds-Schools 3.51083.510825,006,465 E877,927
Debt Service 1.09631.308425,006,465 274,146Mirabile C-1 School District Operating Funds-Schools 4.54624.54625,087,280 E231,278Braymer C-4 School District Operating Funds-Schools 2.75002.750020,011,332 E550,312
23
PurposePolitical Subdivision
2017 PROPERTY TAX RATESAPPENDIX VII
Assessed Value Ceiling Levied RevenueExpiration
Year
LISTING OF 2017 TAX RATES FOR LOCAL GOVERNMENTS LEVYING A SINGLE TAX RATE ON ALL PROPERTY
CaldwellKingston 42 School District Operating Funds-Schools 4.46274.46274,705,510 E209,993Caldwell County General Revenue 0.25830.3482153,671,387 396,933
Senior Services 0.04950.0495153,671,387 76,067 2018
CallawayCallaway County Ambulance District General Revenue 0.00460.1227836,475,208 38,478City of Auxvasse General Revenue 0.63870.638710,355,576 66,141City of Fulton General Revenue 0.52910.5291128,493,498 679,859Village of Kingdom City General Revenue 0.22560.24579,784,977 22,075City of Mokane General Revenue 0.86170.86171,122,224 9,670City of New Bloomfield General Revenue 0.30470.30476,488,757 19,771
Debt Service 0.67990.67996,488,757 44,117Callaway County Library General Revenue 0.20000.2000836,475,208 1,672,950Millersburg FPD General Revenue 0.47880.478834,768,526 166,472Central Callaway FPD General Revenue 0.41070.410773,373,251 301,344Holts Summit FPD General Revenue 0.25330.2533113,614,223 287,785
Debt Service 0.22290.2229113,614,223 253,246South Callaway FPD General Revenue 0.20050.2005325,030,920 651,687North Callaway FPD General Revenue 0.27780.277891,565,621 254,369New Bloomfield FPD General Revenue 0.26120.261241,918,486 109,491North Callaway County R-I SD Operating Funds-Schools 3.02613.026199,477,574 E3,010,291
Debt Service 0.88410.884199,477,574 879,481New Bloomfield R-III SD Operating Funds-Schools 2.81592.815950,949,732 E1,434,694
Debt Service 1.53811.586550,949,732 783,658Fulton 58 School District Operating Funds-Schools 3.32503.3250207,129,682 E6,887,062
Debt Service 0.76120.7814207,129,682 1,576,671South Callaway County R-II SD Operating Funds-Schools 2.75002.7500328,071,424 9,021,964Callaway County General Revenue 0.33620.3362836,475,208 2,812,230
Road & Bridge 0.26030.2603836,475,208 2,177,345Senate Bill 40 0.10000.1000836,475,208 836,475
CamdenCAM-MO Ambulance District General Revenue 0.04410.1052656,340,894 289,446Camden County Ambulance District General Revenue 0.27960.2796593,272,172 1,658,789Horseshoe Bend SRD 1 Camden County Special Road and Bridge 0.35520.3552308,638,204 A1,096,283 2020City of Linn Creek General Revenue 0.00000.00005,452,676 0City of Stoutland General Revenue 0.71610.71611,162,838 8,327Camden County Library General Revenue 0.09450.09451,672,515,421 1,580,527Osage Beach FPD General Revenue 0.59340.5934498,335,643 2,957,124Sunrise Beach FPD General Revenue 0.50820.5082345,233,924 1,754,479
Debt Service 0.14390.1439345,233,924 496,792Mid-County FPD (Camden County) General Revenue 0.38990.3899313,559,991 1,222,570Northwest FPD (Camden County) General Revenue 0.26150.261564,854,959 169,596Southwest Camden County FPD General Revenue 0.29880.298825,604,633 76,507Tri-County FPD General Revenue 0.29800.298019,864,156 59,195Camelot Sewer District Debt Service 0.08280.082821,499,477 17,802Stoutland R-II School District Operating Funds-Schools 2.75003.438626,388,162 F725,674Camdenton R-III School District Operating Funds-Schools 2.66002.66001,167,903,788 E31,066,241
Debt Service 0.31000.43221,167,903,788 3,620,502Climax Springs R-IV School District Operating Funds-Schools 2.75002.750092,832,200 2,552,886
24
PurposePolitical Subdivision
2017 PROPERTY TAX RATESAPPENDIX VII
Assessed Value Ceiling Levied RevenueExpiration
Year
LISTING OF 2017 TAX RATES FOR LOCAL GOVERNMENTS LEVYING A SINGLE TAX RATE ON ALL PROPERTY
CamdenMacks Creek R-V School District Operating Funds-Schools 3.35273.352732,955,490 E1,104,899
Debt Service 0.49030.649732,955,490 161,581Camden County General Revenue 0.11000.20791,672,515,421 1,839,767
Road & Bridge 0.11000.14191,672,515,421 1,839,767Senate Bill 40 0.05660.05661,672,515,421 946,644Senior Services 0.04510.04511,672,515,421 754,304
Cape GirardeauCape SRD Road & Bridge 0.00000.0000786,362,465 0City of Cape Girardeau General Revenue 0.30330.3033639,156,042 1,938,560
Health 0.05680.0568639,156,042 363,041City of Delta General Revenue 0.71240.71243,150,398 22,443Village of Gordonville General Revenue 0.43270.43277,783,520 33,679City of Jackson General Revenue 0.58540.5854229,576,923 1,343,943
Parks & Recreation 0.12280.1228229,576,923 281,920Band 0.07560.0756229,576,923 173,560Cemetery 0.07560.0756229,576,923 173,560
Village of Oak Ridge General Revenue 0.35280.35281,558,655 5,499Village of Pocahontas General Revenue 0.54650.5465697,796 3,813Village of Whitewater General Revenue 0.78180.7818625,856 4,893Village of Old Appleton General Revenue 0.37820.3782913,482 3,455Town of Allenville General Revenue 0.48760.4876322,983 1,575Cape Girardeau Public Library General Revenue 0.16410.1641544,472,050 893,479
General Revenue-Temp 0.15000.1500544,472,050 816,708 2026Cape Girardeau County Library General Revenue 0.07290.0729782,775,746 570,644East County Area FPD General Revenue 0.29690.296998,671,770 292,956Delta FPD General Revenue 0.28040.280417,802,377 49,918Fruitland Area FPD General Revenue 0.77060.7706108,146,372 B833,376North Cape County Rural FPD General Revenue 0.25610.256130,548,037 78,234Gordonville FPD General Revenue 0.30000.300093,416,088 280,248Millersville Rural FPD General Revenue 0.27630.276361,353,657 169,520Whitewater FPD General Revenue 0.38760.387615,191,414 58,882Cape Girardeau SBD General Revenue 0.70760.70763,586,360 25,377Cape Girardeau County Public Health General Revenue 0.09600.09601,327,207,994 1,274,120Jackson R-II School District Operating Funds-Schools 3.42883.4288510,241,564 E17,495,163
Debt Service 0.37120.5707510,241,564 1,894,017Delta R-V School District Operating Funds-Schools 3.50003.500023,468,211 E821,387
Debt Service 0.81001.163023,468,211 190,093Oak Ridge R-VI School District Operating Funds-Schools 2.91663.256728,417,196 E828,816
Debt Service 0.76520.871128,417,196 217,448Cape Girardeau 63 School District Operating Funds-Schools 3.48953.4895655,796,580 E22,884,022
Debt Service 0.66720.8950655,796,580 4,375,475Nell Holcomb R-IV School District Operating Funds-Schools 3.58073.580754,418,357 E1,948,558Cape Girardeau County General Revenue 0.07190.33581,327,207,994 954,263
Road & Bridge 0.00000.0000540,845,529 0Mental Health 0.07720.07721,327,207,994 1,024,605Senate Bill 40 0.05530.05531,327,207,994 733,946Senior Services 0.04780.04781,327,207,994 634,405
25
PurposePolitical Subdivision
2017 PROPERTY TAX RATESAPPENDIX VII
Assessed Value Ceiling Levied RevenueExpiration
Year
LISTING OF 2017 TAX RATES FOR LOCAL GOVERNMENTS LEVYING A SINGLE TAX RATE ON ALL PROPERTY
CarrollCarroll County Ambulance District General Revenue 0.27250.2725221,885,086 604,637Big Creek Watershed Subdistrict General Revenue 0.25850.258518,384,820 47,525City of Bogard General Revenue 1.00001.00001,048,508 10,485City of Bosworth General Revenue 0.94710.94711,685,056 15,959Town of Carrollton General Revenue 0.83750.837535,363,141 296,166
Parks & Recreation 0.30000.300035,363,141 106,089Library 0.33000.330035,363,141 116,698
City of De Witt General Revenue 0.98690.9869588,828 5,811City of Hale General Revenue 0.37900.37902,745,376 10,405
Lights 0.29850.29852,745,376 8,195Streets 0.17220.17222,745,376 4,728
City of Norborne General Revenue 0.77320.77326,482,117 50,120Parks & Recreation 0.18780.18786,482,117 12,173Library 0.14350.14356,482,117 9,302
Village of Tina General Revenue 1.00001.00001,031,135 10,311Carrollton Township Carroll County General Revenue 0.10000.100054,572,541 54,573
Road & Bridge 0.42380.423854,572,541 231,278De Witt Township Carroll County General Revenue 0.08370.083711,147,232 9,330
Road & Bridge 0.38030.380311,147,232 42,393Special Road and Bridge 0.35000.350011,147,232 A39,015 2020
Egypt Township Carroll County General Revenue 0.09500.095015,768,627 14,980Road & Bridge 0.34820.348215,768,627 54,906Special Road and Bridge 0.35000.350015,768,627 A55,190 2020
Eugene Township Carroll County General Revenue 0.09650.09659,388,321 9,060Road & Bridge 0.48210.48219,388,321 45,261Special Road and Bridge 0.35000.35009,388,321 A32,859 2020
Fairfield Township Carroll County General Revenue 0.08110.08113,629,554 2,944Road & Bridge 0.39540.39543,629,554 14,351Special Road and Bridge 0.36000.36003,629,554 A13,066 2020
Hill Township Carroll County General Revenue 0.06380.063811,099,879 7,082Road & Bridge 0.31920.319211,099,879 35,431Special Road and Bridge 0.35520.355211,099,879 A39,427 2020
Hurricane Township Carroll County General Revenue 0.09070.090710,127,744 9,186Road & Bridge 0.40340.403410,127,744 40,855Special Road and Bridge 0.36080.360810,127,744 A36,541 2020
Leslie Township Carroll County General Revenue 0.07030.07039,361,095 6,581Road & Bridge 0.33630.33639,361,095 31,481Special Road and Bridge 0.35000.35009,361,095 A32,764 2020
Moss Creek Township Carroll County General Revenue 0.08610.08619,528,561 8,204Road & Bridge 0.43050.43059,528,561 41,020Special Road and Bridge 0.35000.35009,528,561 A33,350 2020
Prairie Township Carroll County General Revenue 0.07460.07465,840,324 4,357Road & Bridge 0.35470.35475,840,324 20,716Special Road and Bridge 0.35490.35495,840,324 A20,727 2020
Ridge Township Carroll County General Revenue 0.07060.070614,460,055 10,209Road & Bridge 0.33610.336114,460,055 48,600Special Road and Bridge 0.36070.360714,460,055 A52,157 2020
Rockford Township Carroll County General Revenue 0.06600.06605,946,369 3,925
26
PurposePolitical Subdivision
2017 PROPERTY TAX RATESAPPENDIX VII
Assessed Value Ceiling Levied RevenueExpiration
Year
LISTING OF 2017 TAX RATES FOR LOCAL GOVERNMENTS LEVYING A SINGLE TAX RATE ON ALL PROPERTY
CarrollRockford Township Carroll County Road & Bridge 0.27860.27865,946,369 16,567
Special Road and Bridge 0.35360.35365,946,369 A21,026 2020Stokes Mound Township Carroll Co General Revenue 0.09690.09696,662,548 6,456
Road & Bridge 0.48410.48416,662,548 32,253Special Road and Bridge 0.35270.35276,662,548 A23,499 2020
Sugartree Township Carroll County General Revenue 0.08610.08612,194,219 1,889Road & Bridge 0.43010.43012,194,219 9,437Special Road and Bridge 0.35360.35362,194,219 A7,759 2020
Trotter Township Carroll County General Revenue 0.09100.09105,436,921 4,948Road & Bridge 0.45570.45575,436,921 24,776Special Road and Bridge 0.35030.35035,436,921 A19,046 2020
Van Horn Township Carroll County General Revenue 0.09650.096517,408,773 16,799Road & Bridge 0.46880.468817,408,773 81,612Special Road and Bridge 0.10000.356517,408,773 A17,409 2020
Wakenda Township Carroll County General Revenue 0.10000.10009,345,303 9,345Road & Bridge 0.50000.50009,345,303 46,727Special Road and Bridge 0.38310.38319,345,303 A35,802 2020
Washington Township Carroll County General Revenue 0.05520.05529,956,841 5,496Road & Bridge 0.25790.25799,956,841 25,679Special Road and Bridge 0.36650.36659,956,841 A36,492 2020
Combs Township Carroll County General Revenue 0.06810.068110,010,170 6,817Road & Bridge 0.34070.340710,010,170 34,105Special Road and Bridge 0.35000.350010,010,170 A35,036 2020
North Central Carroll FPD General Revenue 0.23200.232038,930,450 90,319Carroll County FPD General Revenue 0.24550.245580,534,042 197,711Norborne FPD General Revenue 0.29030.290322,616,733 65,656Hale FPD General Revenue 0.29000.290019,453,058 56,414Carroll County Health Department General Revenue 0.09540.0954221,885,086 211,678Hale R-I School District Operating Funds-Schools 3.82303.82309,567,358 E365,760Tina-Avalon R-II School District Operating Funds-Schools 3.79723.819611,166,859 E424,028Bosworth R-V School District Operating Funds-Schools 3.87473.87478,280,520 E320,845Carrollton R-VII School District Operating Funds-Schools 3.53463.534669,000,095 E2,438,877
Operating Funds-Temp 1.34071.340769,000,095 925,084 2026Norborne R-VIII School District Operating Funds-Schools 4.14024.140217,377,825 E719,477
Debt Service 0.53000.732217,377,825 92,102Carroll County General Revenue 0.26820.3499221,885,086 595,096
Johnson Grass 0.00990.0099221,885,086 21,967Senate Bill 40 0.09540.0954221,885,086 211,678
CarterEast Carter Ambulance District General Revenue 0.36840.368429,640,760 109,197West Carter Ambulance District General Revenue 0.43190.431936,720,527 158,596City of Grandin General Revenue 0.88530.88531,367,750 12,109Carter County Library District General Revenue 0.18310.183166,361,285 121,508Ellsinore Rural FPD General Revenue 0.13960.139616,544,566 23,096Eastwood FPD General Revenue 0.24130.24132,536,727 6,121Fremont FPD General Revenue 0.33780.33782,789,483 9,423Carter County Health Center General Revenue 0.22890.228966,361,285 151,901East Carter County R-II SD Operating Funds-Schools 2.75002.750037,971,118 E1,044,206
27
PurposePolitical Subdivision
2017 PROPERTY TAX RATESAPPENDIX VII
Assessed Value Ceiling Levied RevenueExpiration
Year
LISTING OF 2017 TAX RATES FOR LOCAL GOVERNMENTS LEVYING A SINGLE TAX RATE ON ALL PROPERTY
CarterVan Buren R-I School District Operating Funds-Schools 3.13053.130838,190,309 E1,195,548Carter County General Revenue 0.09420.302766,361,285 62,512
Road & Bridge 0.22000.220066,361,285 145,995Senate Bill 40 0.07810.078166,361,285 51,828Senior Services 0.02740.027466,361,285 18,183
CassCass Medical Center General Revenue 0.13180.13181,568,963,926 2,067,894Mt. Pleasant SRD Cass County Road & Bridge 0.19600.1960283,510,797 555,681City of Archie General Revenue 0.70200.702012,473,520 87,564City of Belton General Revenue 0.52610.5261256,334,552 1,348,576
Parks & Recreation 0.23410.2341256,334,552 600,079Debt Service 1.13101.3304256,334,552 2,899,144
City of Cleveland General Revenue 0.48560.48569,706,544 47,135City of Creighton General Revenue 0.98810.98811,942,713 19,196City of Drexel General Revenue 0.67730.67739,922,984 67,208City of East Lynne General Revenue 0.96730.96732,395,413 23,171
Debt Service 1.90451.90532,395,413 45,621City of Freeman General Revenue 0.57020.57024,682,417 26,699City of Garden City General Revenue 0.41870.418714,119,464 59,118City of Harrisonville General Revenue 0.54300.5430130,337,446 707,732
Parks & Recreation 0.12280.1228130,337,446 160,054City of Lake Winnebago General Revenue 0.89390.893938,541,674 344,524
Debt Service 0.68980.714538,541,674 265,860City of Peculiar General Revenue 0.42330.423365,442,962 277,020
Debt Service 1.04831.048365,442,962 686,039City of Pleasant Hill General Revenue 0.35860.3586110,371,838 395,793
Parks & Recreation 0.07170.0717110,371,838 79,137Health 0.07170.0717110,371,838 79,137Road 0.13440.1344110,371,838 148,340Debt Service 0.34341.1195110,371,838 379,017
City of Raymore General Revenue 0.44800.4480316,915,279 1,419,780Parks & Recreation 0.12060.1206316,915,279 382,200Debt Service 0.71700.9781316,915,279 2,272,283
City of Strasburg General Revenue 0.99360.99361,033,804 10,272Village of West Line General Revenue 0.55030.55031,350,755 7,433Village of Baldwin Park General Revenue 0.50000.5000431,251 2,156City of Lake Annette General Revenue 0.19710.1971579,588 1,142Village of Riverview Estates General Revenue 0.49770.49771,130,569 5,627Cass County Public Library General Revenue 0.14540.14541,568,963,926 2,281,274Central Cass County FPD General Revenue 0.25580.2558122,360,968 312,999
Ambulance 0.24360.2436122,360,968 298,071Debt Service 0.15000.1619122,360,968 183,541
Garden City FPD General Revenue 0.21910.219145,912,253 100,594Ambulance 0.29880.298845,912,253 137,186Debt Service 0.30000.490045,912,253 137,737
South Metropolitan FPD General Revenue 0.46180.5470412,267,379 1,903,851Ambulance 0.36170.4285412,267,379 1,491,171Dispatch 0.03840.0455412,267,379 158,311
28
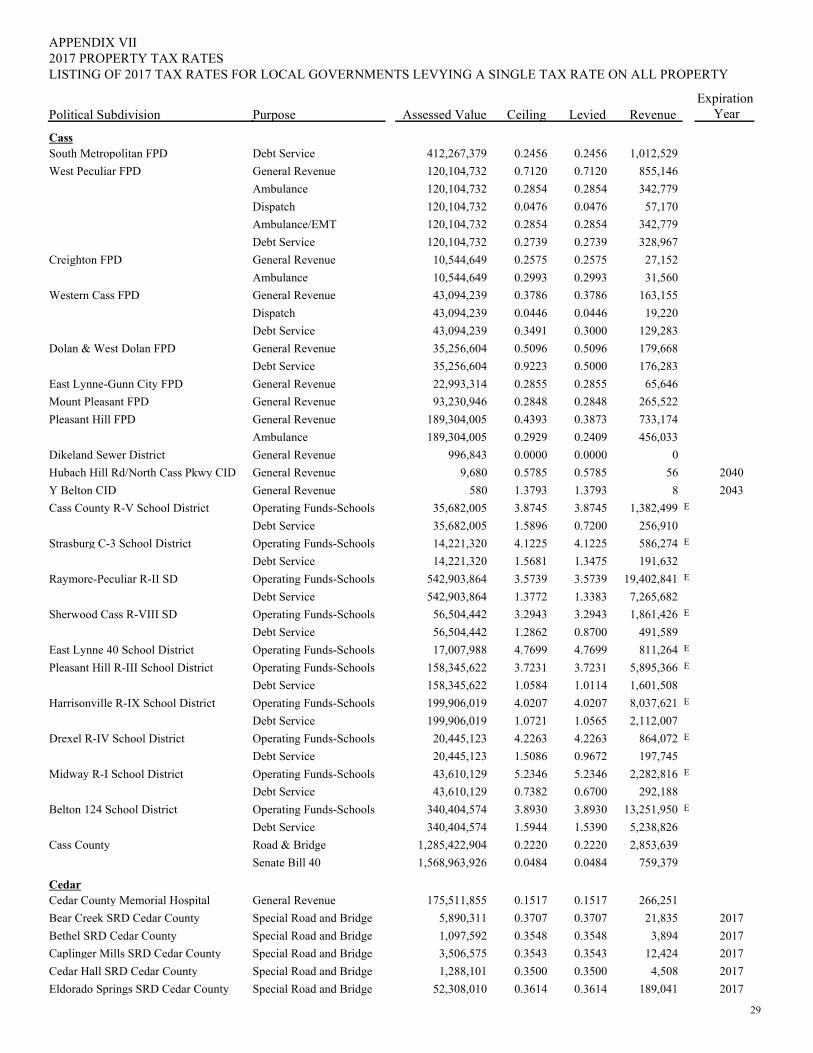
PurposePolitical Subdivision
2017 PROPERTY TAX RATESAPPENDIX VII
Assessed Value Ceiling Levied RevenueExpiration
Year
LISTING OF 2017 TAX RATES FOR LOCAL GOVERNMENTS LEVYING A SINGLE TAX RATE ON ALL PROPERTY
CassSouth Metropolitan FPD Debt Service 0.24560.2456412,267,379 1,012,529West Peculiar FPD General Revenue 0.71200.7120120,104,732 855,146
Ambulance 0.28540.2854120,104,732 342,779Dispatch 0.04760.0476120,104,732 57,170Ambulance/EMT 0.28540.2854120,104,732 342,779Debt Service 0.27390.2739120,104,732 328,967
Creighton FPD General Revenue 0.25750.257510,544,649 27,152Ambulance 0.29930.299310,544,649 31,560
Western Cass FPD General Revenue 0.37860.378643,094,239 163,155Dispatch 0.04460.044643,094,239 19,220Debt Service 0.30000.349143,094,239 129,283
Dolan & West Dolan FPD General Revenue 0.50960.509635,256,604 179,668Debt Service 0.50000.922335,256,604 176,283
East Lynne-Gunn City FPD General Revenue 0.28550.285522,993,314 65,646Mount Pleasant FPD General Revenue 0.28480.284893,230,946 265,522Pleasant Hill FPD General Revenue 0.38730.4393189,304,005 733,174
Ambulance 0.24090.2929189,304,005 456,033Dikeland Sewer District General Revenue 0.00000.0000996,843 0Hubach Hill Rd/North Cass Pkwy CID General Revenue 0.57850.57859,680 56 2040Y Belton CID General Revenue 1.37931.3793580 8 2043Cass County R-V School District Operating Funds-Schools 3.87453.874535,682,005 E1,382,499
Debt Service 0.72001.589635,682,005 256,910Strasburg C-3 School District Operating Funds-Schools 4.12254.122514,221,320 E586,274
Debt Service 1.34751.568114,221,320 191,632Raymore-Peculiar R-II SD Operating Funds-Schools 3.57393.5739542,903,864 E19,402,841
Debt Service 1.33831.3772542,903,864 7,265,682Sherwood Cass R-VIII SD Operating Funds-Schools 3.29433.294356,504,442 E1,861,426
Debt Service 0.87001.286256,504,442 491,589East Lynne 40 School District Operating Funds-Schools 4.76994.769917,007,988 E811,264Pleasant Hill R-III School District Operating Funds-Schools 3.72313.7231158,345,622 E5,895,366
Debt Service 1.01141.0584158,345,622 1,601,508Harrisonville R-IX School District Operating Funds-Schools 4.02074.0207199,906,019 E8,037,621
Debt Service 1.05651.0721199,906,019 2,112,007Drexel R-IV School District Operating Funds-Schools 4.22634.226320,445,123 E864,072
Debt Service 0.96721.508620,445,123 197,745Midway R-I School District Operating Funds-Schools 5.23465.234643,610,129 E2,282,816
Debt Service 0.67000.738243,610,129 292,188Belton 124 School District Operating Funds-Schools 3.89303.8930340,404,574 E13,251,950
Debt Service 1.53901.5944340,404,574 5,238,826Cass County Road & Bridge 0.22200.22201,285,422,904 2,853,639
Senate Bill 40 0.04840.04841,568,963,926 759,379
CedarCedar County Memorial Hospital General Revenue 0.15170.1517175,511,855 266,251Bear Creek SRD Cedar County Special Road and Bridge 0.37070.37075,890,311 21,835 2017Bethel SRD Cedar County Special Road and Bridge 0.35480.35481,097,592 3,894 2017Caplinger Mills SRD Cedar County Special Road and Bridge 0.35430.35433,506,575 12,424 2017Cedar Hall SRD Cedar County Special Road and Bridge 0.35000.35001,288,101 4,508 2017Eldorado Springs SRD Cedar County Special Road and Bridge 0.36140.361452,308,010 189,041 2017
29
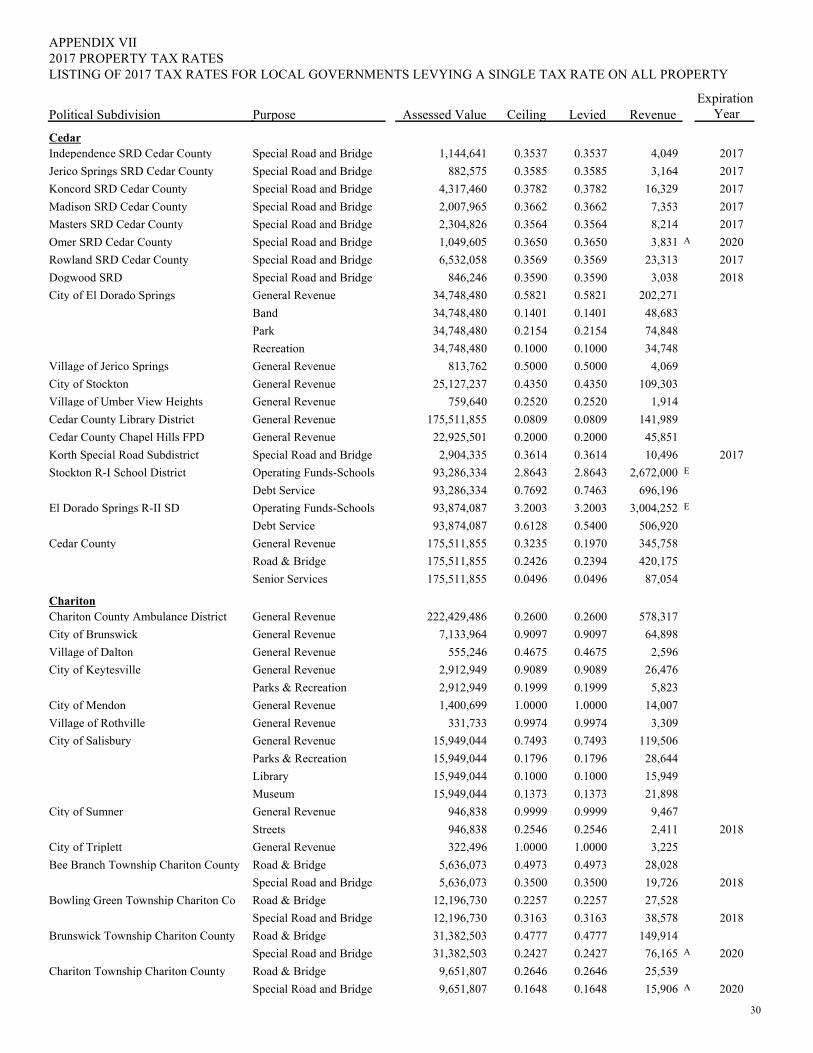
PurposePolitical Subdivision
2017 PROPERTY TAX RATESAPPENDIX VII
Assessed Value Ceiling Levied RevenueExpiration
Year
LISTING OF 2017 TAX RATES FOR LOCAL GOVERNMENTS LEVYING A SINGLE TAX RATE ON ALL PROPERTY
CedarIndependence SRD Cedar County Special Road and Bridge 0.35370.35371,144,641 4,049 2017Jerico Springs SRD Cedar County Special Road and Bridge 0.35850.3585882,575 3,164 2017Koncord SRD Cedar County Special Road and Bridge 0.37820.37824,317,460 16,329 2017Madison SRD Cedar County Special Road and Bridge 0.36620.36622,007,965 7,353 2017Masters SRD Cedar County Special Road and Bridge 0.35640.35642,304,826 8,214 2017Omer SRD Cedar County Special Road and Bridge 0.36500.36501,049,605 A3,831 2020Rowland SRD Cedar County Special Road and Bridge 0.35690.35696,532,058 23,313 2017Dogwood SRD Special Road and Bridge 0.35900.3590846,246 3,038 2018City of El Dorado Springs General Revenue 0.58210.582134,748,480 202,271
Band 0.14010.140134,748,480 48,683Park 0.21540.215434,748,480 74,848Recreation 0.10000.100034,748,480 34,748
Village of Jerico Springs General Revenue 0.50000.5000813,762 4,069City of Stockton General Revenue 0.43500.435025,127,237 109,303Village of Umber View Heights General Revenue 0.25200.2520759,640 1,914Cedar County Library District General Revenue 0.08090.0809175,511,855 141,989Cedar County Chapel Hills FPD General Revenue 0.20000.200022,925,501 45,851Korth Special Road Subdistrict Special Road and Bridge 0.36140.36142,904,335 10,496 2017Stockton R-I School District Operating Funds-Schools 2.86432.864393,286,334 E2,672,000
Debt Service 0.74630.769293,286,334 696,196El Dorado Springs R-II SD Operating Funds-Schools 3.20033.200393,874,087 E3,004,252
Debt Service 0.54000.612893,874,087 506,920Cedar County General Revenue 0.19700.3235175,511,855 345,758
Road & Bridge 0.23940.2426175,511,855 420,175Senior Services 0.04960.0496175,511,855 87,054
CharitonChariton County Ambulance District General Revenue 0.26000.2600222,429,486 578,317City of Brunswick General Revenue 0.90970.90977,133,964 64,898Village of Dalton General Revenue 0.46750.4675555,246 2,596City of Keytesville General Revenue 0.90890.90892,912,949 26,476
Parks & Recreation 0.19990.19992,912,949 5,823City of Mendon General Revenue 1.00001.00001,400,699 14,007Village of Rothville General Revenue 0.99740.9974331,733 3,309City of Salisbury General Revenue 0.74930.749315,949,044 119,506
Parks & Recreation 0.17960.179615,949,044 28,644Library 0.10000.100015,949,044 15,949Museum 0.13730.137315,949,044 21,898
City of Sumner General Revenue 0.99990.9999946,838 9,467Streets 0.25460.2546946,838 2,411 2018
City of Triplett General Revenue 1.00001.0000322,496 3,225Bee Branch Township Chariton County Road & Bridge 0.49730.49735,636,073 28,028
Special Road and Bridge 0.35000.35005,636,073 19,726 2018Bowling Green Township Chariton Co Road & Bridge 0.22570.225712,196,730 27,528
Special Road and Bridge 0.31630.316312,196,730 38,578 2018Brunswick Township Chariton County Road & Bridge 0.47770.477731,382,503 149,914
Special Road and Bridge 0.24270.242731,382,503 A76,165 2020Chariton Township Chariton County Road & Bridge 0.26460.26469,651,807 25,539
Special Road and Bridge 0.16480.16489,651,807 A15,906 2020
30
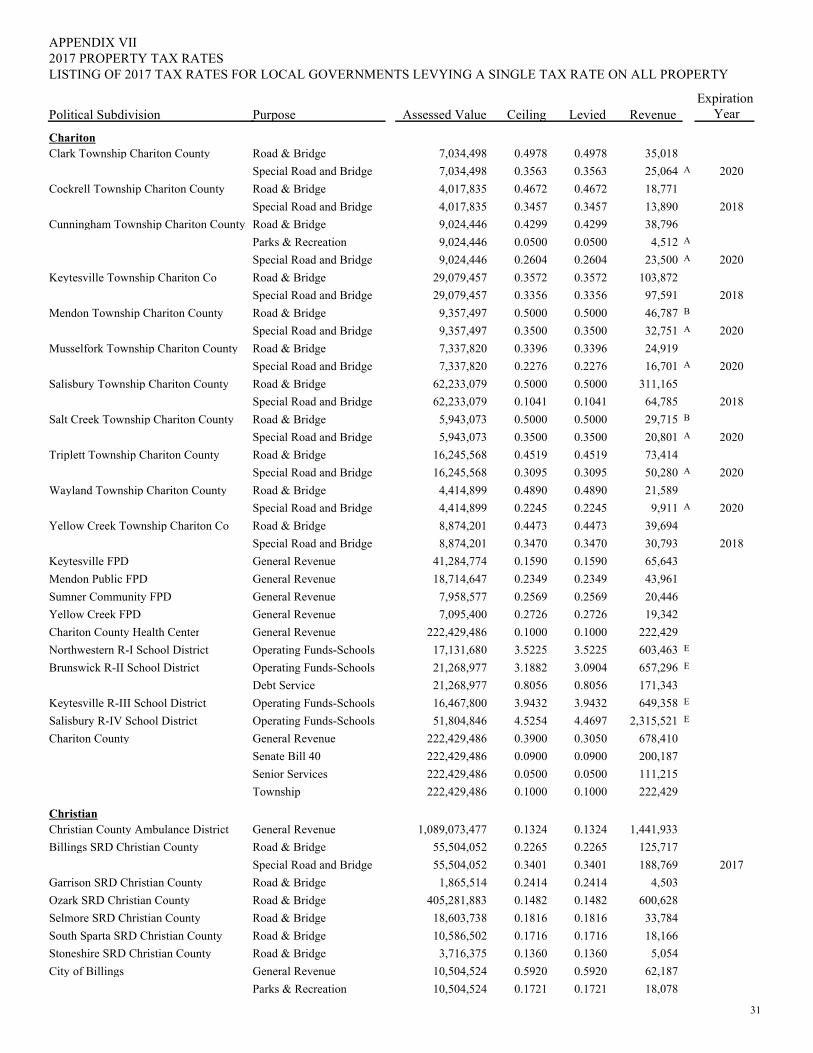
PurposePolitical Subdivision
2017 PROPERTY TAX RATESAPPENDIX VII
Assessed Value Ceiling Levied RevenueExpiration
Year
LISTING OF 2017 TAX RATES FOR LOCAL GOVERNMENTS LEVYING A SINGLE TAX RATE ON ALL PROPERTY
CharitonClark Township Chariton County Road & Bridge 0.49780.49787,034,498 35,018
Special Road and Bridge 0.35630.35637,034,498 A25,064 2020Cockrell Township Chariton County Road & Bridge 0.46720.46724,017,835 18,771
Special Road and Bridge 0.34570.34574,017,835 13,890 2018Cunningham Township Chariton County Road & Bridge 0.42990.42999,024,446 38,796
Parks & Recreation 0.05000.05009,024,446 A4,512Special Road and Bridge 0.26040.26049,024,446 A23,500 2020
Keytesville Township Chariton Co Road & Bridge 0.35720.357229,079,457 103,872Special Road and Bridge 0.33560.335629,079,457 97,591 2018
Mendon Township Chariton County Road & Bridge 0.50000.50009,357,497 B46,787Special Road and Bridge 0.35000.35009,357,497 A32,751 2020
Musselfork Township Chariton County Road & Bridge 0.33960.33967,337,820 24,919Special Road and Bridge 0.22760.22767,337,820 A16,701 2020
Salisbury Township Chariton County Road & Bridge 0.50000.500062,233,079 311,165Special Road and Bridge 0.10410.104162,233,079 64,785 2018
Salt Creek Township Chariton County Road & Bridge 0.50000.50005,943,073 B29,715Special Road and Bridge 0.35000.35005,943,073 A20,801 2020
Triplett Township Chariton County Road & Bridge 0.45190.451916,245,568 73,414Special Road and Bridge 0.30950.309516,245,568 A50,280 2020
Wayland Township Chariton County Road & Bridge 0.48900.48904,414,899 21,589Special Road and Bridge 0.22450.22454,414,899 A9,911 2020
Yellow Creek Township Chariton Co Road & Bridge 0.44730.44738,874,201 39,694Special Road and Bridge 0.34700.34708,874,201 30,793 2018
Keytesville FPD General Revenue 0.15900.159041,284,774 65,643Mendon Public FPD General Revenue 0.23490.234918,714,647 43,961Sumner Community FPD General Revenue 0.25690.25697,958,577 20,446Yellow Creek FPD General Revenue 0.27260.27267,095,400 19,342Chariton County Health Center General Revenue 0.10000.1000222,429,486 222,429Northwestern R-I School District Operating Funds-Schools 3.52253.522517,131,680 E603,463Brunswick R-II School District Operating Funds-Schools 3.09043.188221,268,977 E657,296
Debt Service 0.80560.805621,268,977 171,343Keytesville R-III School District Operating Funds-Schools 3.94323.943216,467,800 E649,358Salisbury R-IV School District Operating Funds-Schools 4.46974.525451,804,846 E2,315,521Chariton County General Revenue 0.30500.3900222,429,486 678,410
Senate Bill 40 0.09000.0900222,429,486 200,187Senior Services 0.05000.0500222,429,486 111,215Township 0.10000.1000222,429,486 222,429
ChristianChristian County Ambulance District General Revenue 0.13240.13241,089,073,477 1,441,933Billings SRD Christian County Road & Bridge 0.22650.226555,504,052 125,717
Special Road and Bridge 0.34010.340155,504,052 188,769 2017Garrison SRD Christian County Road & Bridge 0.24140.24141,865,514 4,503Ozark SRD Christian County Road & Bridge 0.14820.1482405,281,883 600,628Selmore SRD Christian County Road & Bridge 0.18160.181618,603,738 33,784South Sparta SRD Christian County Road & Bridge 0.17160.171610,586,502 18,166Stoneshire SRD Christian County Road & Bridge 0.13600.13603,716,375 5,054City of Billings General Revenue 0.59200.592010,504,524 62,187
Parks & Recreation 0.17210.172110,504,524 18,078
31
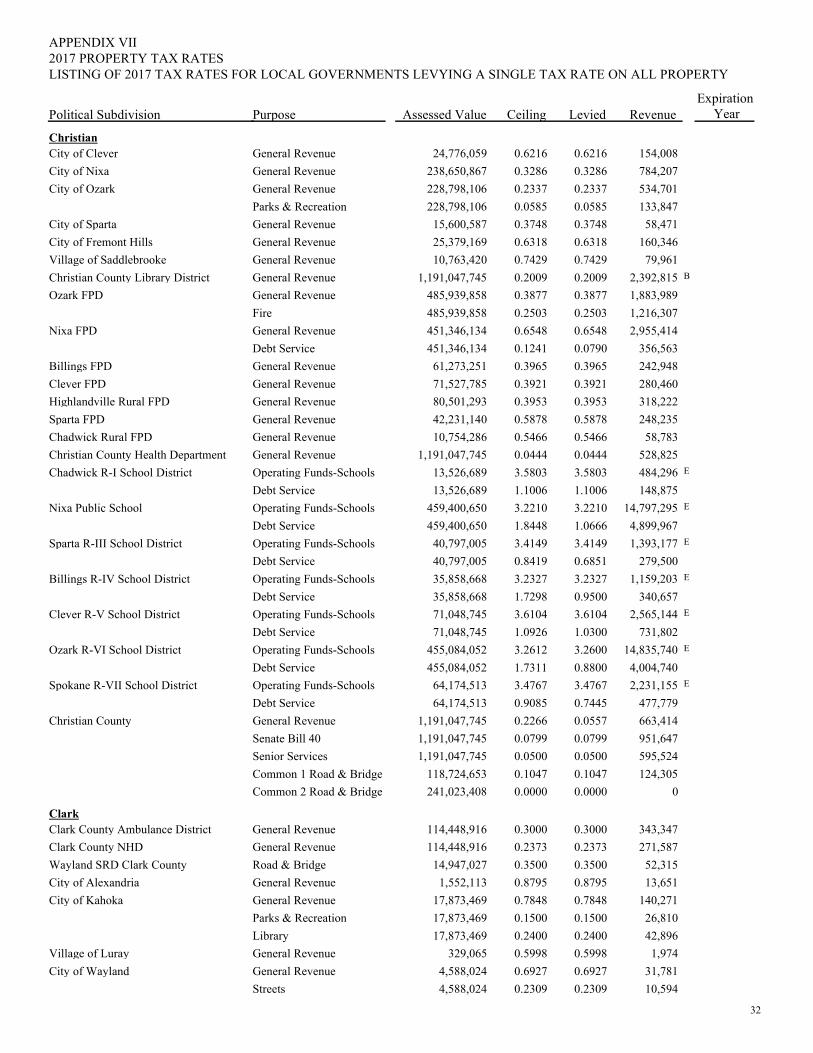
PurposePolitical Subdivision
2017 PROPERTY TAX RATESAPPENDIX VII
Assessed Value Ceiling Levied RevenueExpiration
Year
LISTING OF 2017 TAX RATES FOR LOCAL GOVERNMENTS LEVYING A SINGLE TAX RATE ON ALL PROPERTY
ChristianCity of Clever General Revenue 0.62160.621624,776,059 154,008City of Nixa General Revenue 0.32860.3286238,650,867 784,207City of Ozark General Revenue 0.23370.2337228,798,106 534,701
Parks & Recreation 0.05850.0585228,798,106 133,847City of Sparta General Revenue 0.37480.374815,600,587 58,471City of Fremont Hills General Revenue 0.63180.631825,379,169 160,346Village of Saddlebrooke General Revenue 0.74290.742910,763,420 79,961Christian County Library District General Revenue 0.20090.20091,191,047,745 B2,392,815Ozark FPD General Revenue 0.38770.3877485,939,858 1,883,989
Fire 0.25030.2503485,939,858 1,216,307Nixa FPD General Revenue 0.65480.6548451,346,134 2,955,414
Debt Service 0.07900.1241451,346,134 356,563Billings FPD General Revenue 0.39650.396561,273,251 242,948Clever FPD General Revenue 0.39210.392171,527,785 280,460Highlandville Rural FPD General Revenue 0.39530.395380,501,293 318,222Sparta FPD General Revenue 0.58780.587842,231,140 248,235Chadwick Rural FPD General Revenue 0.54660.546610,754,286 58,783Christian County Health Department General Revenue 0.04440.04441,191,047,745 528,825Chadwick R-I School District Operating Funds-Schools 3.58033.580313,526,689 E484,296
Debt Service 1.10061.100613,526,689 148,875Nixa Public School Operating Funds-Schools 3.22103.2210459,400,650 E14,797,295
Debt Service 1.06661.8448459,400,650 4,899,967Sparta R-III School District Operating Funds-Schools 3.41493.414940,797,005 E1,393,177
Debt Service 0.68510.841940,797,005 279,500Billings R-IV School District Operating Funds-Schools 3.23273.232735,858,668 E1,159,203
Debt Service 0.95001.729835,858,668 340,657Clever R-V School District Operating Funds-Schools 3.61043.610471,048,745 E2,565,144
Debt Service 1.03001.092671,048,745 731,802Ozark R-VI School District Operating Funds-Schools 3.26003.2612455,084,052 E14,835,740
Debt Service 0.88001.7311455,084,052 4,004,740Spokane R-VII School District Operating Funds-Schools 3.47673.476764,174,513 E2,231,155
Debt Service 0.74450.908564,174,513 477,779Christian County General Revenue 0.05570.22661,191,047,745 663,414
Senate Bill 40 0.07990.07991,191,047,745 951,647Senior Services 0.05000.05001,191,047,745 595,524Common 1 Road & Bridge 0.10470.1047118,724,653 124,305Common 2 Road & Bridge 0.00000.0000241,023,408 0
ClarkClark County Ambulance District General Revenue 0.30000.3000114,448,916 343,347Clark County NHD General Revenue 0.23730.2373114,448,916 271,587Wayland SRD Clark County Road & Bridge 0.35000.350014,947,027 52,315City of Alexandria General Revenue 0.87950.87951,552,113 13,651City of Kahoka General Revenue 0.78480.784817,873,469 140,271
Parks & Recreation 0.15000.150017,873,469 26,810Library 0.24000.240017,873,469 42,896
Village of Luray General Revenue 0.59980.5998329,065 1,974City of Wayland General Revenue 0.69270.69274,588,024 31,781
Streets 0.23090.23094,588,024 10,594
32
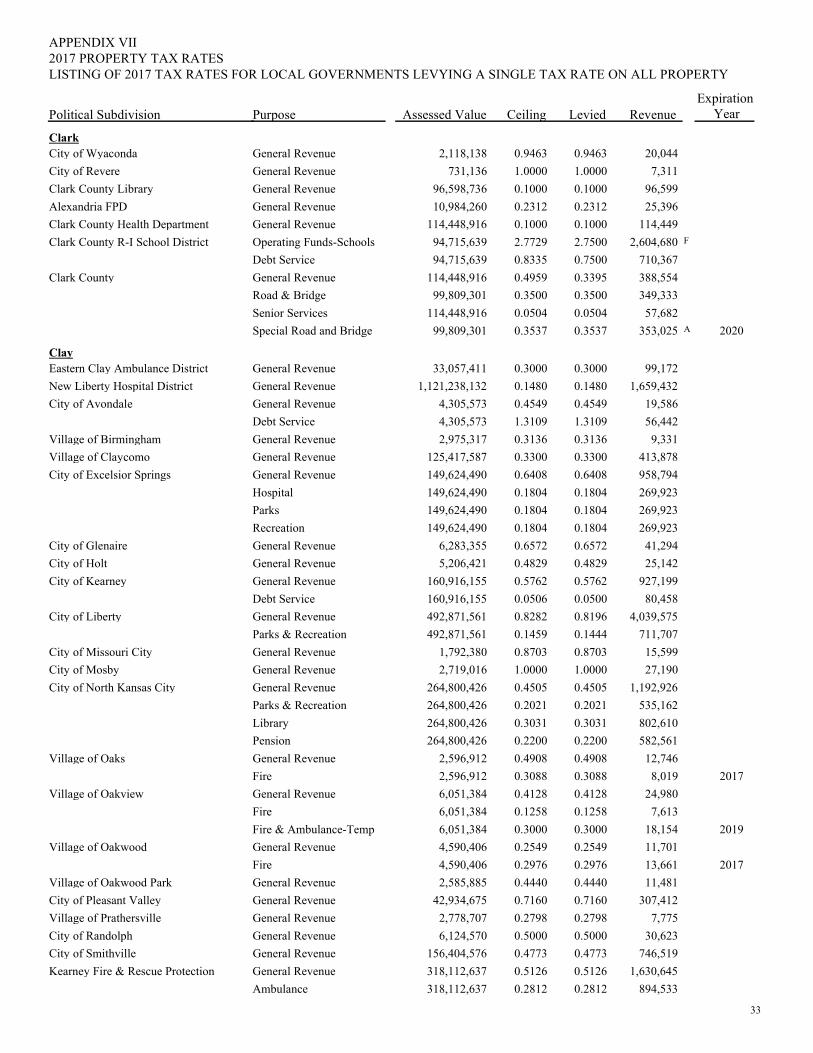
PurposePolitical Subdivision
2017 PROPERTY TAX RATESAPPENDIX VII
Assessed Value Ceiling Levied RevenueExpiration
Year
LISTING OF 2017 TAX RATES FOR LOCAL GOVERNMENTS LEVYING A SINGLE TAX RATE ON ALL PROPERTY
ClarkCity of Wyaconda General Revenue 0.94630.94632,118,138 20,044City of Revere General Revenue 1.00001.0000731,136 7,311Clark County Library General Revenue 0.10000.100096,598,736 96,599Alexandria FPD General Revenue 0.23120.231210,984,260 25,396Clark County Health Department General Revenue 0.10000.1000114,448,916 114,449Clark County R-I School District Operating Funds-Schools 2.75002.772994,715,639 F2,604,680
Debt Service 0.75000.833594,715,639 710,367Clark County General Revenue 0.33950.4959114,448,916 388,554
Road & Bridge 0.35000.350099,809,301 349,333Senior Services 0.05040.0504114,448,916 57,682Special Road and Bridge 0.35370.353799,809,301 A353,025 2020
ClayEastern Clay Ambulance District General Revenue 0.30000.300033,057,411 99,172New Liberty Hospital District General Revenue 0.14800.14801,121,238,132 1,659,432City of Avondale General Revenue 0.45490.45494,305,573 19,586
Debt Service 1.31091.31094,305,573 56,442Village of Birmingham General Revenue 0.31360.31362,975,317 9,331Village of Claycomo General Revenue 0.33000.3300125,417,587 413,878City of Excelsior Springs General Revenue 0.64080.6408149,624,490 958,794
Hospital 0.18040.1804149,624,490 269,923Parks 0.18040.1804149,624,490 269,923Recreation 0.18040.1804149,624,490 269,923
City of Glenaire General Revenue 0.65720.65726,283,355 41,294City of Holt General Revenue 0.48290.48295,206,421 25,142City of Kearney General Revenue 0.57620.5762160,916,155 927,199
Debt Service 0.05000.0506160,916,155 80,458City of Liberty General Revenue 0.81960.8282492,871,561 4,039,575
Parks & Recreation 0.14440.1459492,871,561 711,707City of Missouri City General Revenue 0.87030.87031,792,380 15,599City of Mosby General Revenue 1.00001.00002,719,016 27,190City of North Kansas City General Revenue 0.45050.4505264,800,426 1,192,926
Parks & Recreation 0.20210.2021264,800,426 535,162Library 0.30310.3031264,800,426 802,610Pension 0.22000.2200264,800,426 582,561
Village of Oaks General Revenue 0.49080.49082,596,912 12,746Fire 0.30880.30882,596,912 8,019 2017
Village of Oakview General Revenue 0.41280.41286,051,384 24,980Fire 0.12580.12586,051,384 7,613Fire & Ambulance-Temp 0.30000.30006,051,384 18,154 2019
Village of Oakwood General Revenue 0.25490.25494,590,406 11,701Fire 0.29760.29764,590,406 13,661 2017
Village of Oakwood Park General Revenue 0.44400.44402,585,885 11,481City of Pleasant Valley General Revenue 0.71600.716042,934,675 307,412Village of Prathersville General Revenue 0.27980.27982,778,707 7,775City of Randolph General Revenue 0.50000.50006,124,570 30,623City of Smithville General Revenue 0.47730.4773156,404,576 746,519Kearney Fire & Rescue Protection General Revenue 0.51260.5126318,112,637 1,630,645
Ambulance 0.28120.2812318,112,637 894,533
33
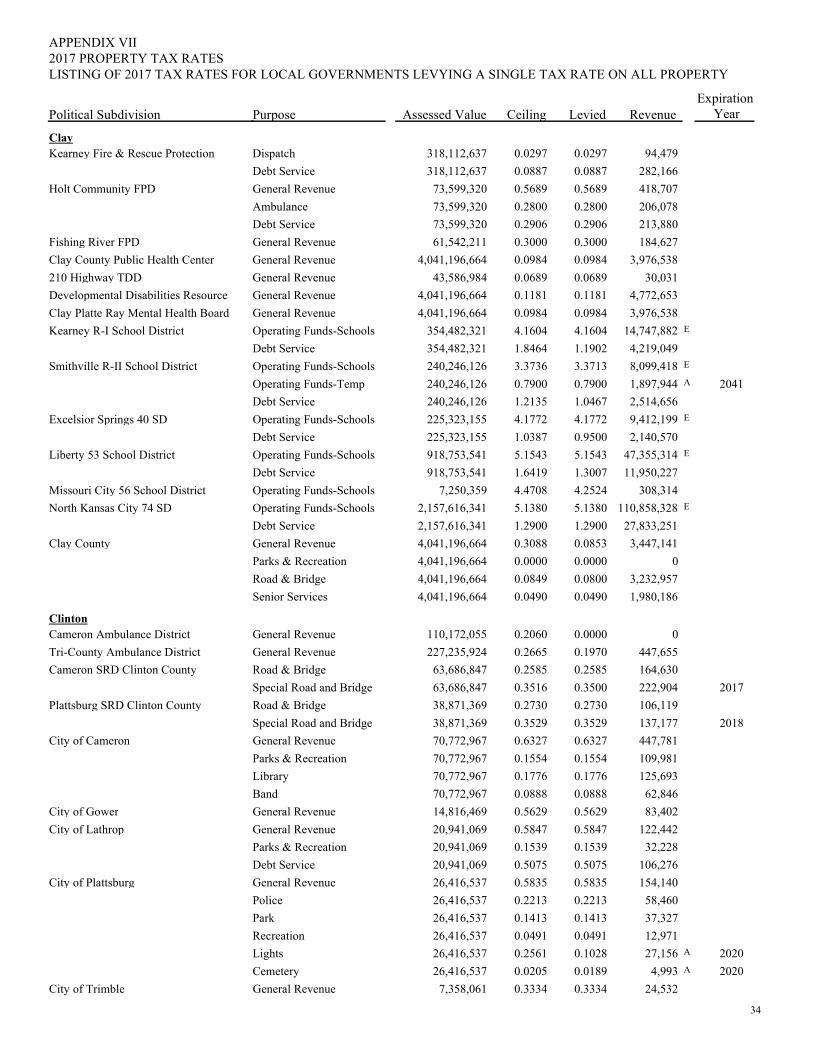
PurposePolitical Subdivision
2017 PROPERTY TAX RATESAPPENDIX VII
Assessed Value Ceiling Levied RevenueExpiration
Year
LISTING OF 2017 TAX RATES FOR LOCAL GOVERNMENTS LEVYING A SINGLE TAX RATE ON ALL PROPERTY
ClayKearney Fire & Rescue Protection Dispatch 0.02970.0297318,112,637 94,479
Debt Service 0.08870.0887318,112,637 282,166Holt Community FPD General Revenue 0.56890.568973,599,320 418,707
Ambulance 0.28000.280073,599,320 206,078Debt Service 0.29060.290673,599,320 213,880
Fishing River FPD General Revenue 0.30000.300061,542,211 184,627Clay County Public Health Center General Revenue 0.09840.09844,041,196,664 3,976,538210 Highway TDD General Revenue 0.06890.068943,586,984 30,031Developmental Disabilities Resource General Revenue 0.11810.11814,041,196,664 4,772,653Clay Platte Ray Mental Health Board General Revenue 0.09840.09844,041,196,664 3,976,538Kearney R-I School District Operating Funds-Schools 4.16044.1604354,482,321 E14,747,882
Debt Service 1.19021.8464354,482,321 4,219,049Smithville R-II School District Operating Funds-Schools 3.37133.3736240,246,126 E8,099,418
Operating Funds-Temp 0.79000.7900240,246,126 A1,897,944 2041Debt Service 1.04671.2135240,246,126 2,514,656
Excelsior Springs 40 SD Operating Funds-Schools 4.17724.1772225,323,155 E9,412,199Debt Service 0.95001.0387225,323,155 2,140,570
Liberty 53 School District Operating Funds-Schools 5.15435.1543918,753,541 E47,355,314Debt Service 1.30071.6419918,753,541 11,950,227
Missouri City 56 School District Operating Funds-Schools 4.25244.47087,250,359 308,314North Kansas City 74 SD Operating Funds-Schools 5.13805.13802,157,616,341 E110,858,328
Debt Service 1.29001.29002,157,616,341 27,833,251Clay County General Revenue 0.08530.30884,041,196,664 3,447,141
Parks & Recreation 0.00000.00004,041,196,664 0Road & Bridge 0.08000.08494,041,196,664 3,232,957Senior Services 0.04900.04904,041,196,664 1,980,186
ClintonCameron Ambulance District General Revenue 0.00000.2060110,172,055 0Tri-County Ambulance District General Revenue 0.19700.2665227,235,924 447,655Cameron SRD Clinton County Road & Bridge 0.25850.258563,686,847 164,630
Special Road and Bridge 0.35000.351663,686,847 222,904 2017Plattsburg SRD Clinton County Road & Bridge 0.27300.273038,871,369 106,119
Special Road and Bridge 0.35290.352938,871,369 137,177 2018City of Cameron General Revenue 0.63270.632770,772,967 447,781
Parks & Recreation 0.15540.155470,772,967 109,981Library 0.17760.177670,772,967 125,693Band 0.08880.088870,772,967 62,846
City of Gower General Revenue 0.56290.562914,816,469 83,402City of Lathrop General Revenue 0.58470.584720,941,069 122,442
Parks & Recreation 0.15390.153920,941,069 32,228Debt Service 0.50750.507520,941,069 106,276
City of Plattsburg General Revenue 0.58350.583526,416,537 154,140Police 0.22130.221326,416,537 58,460Park 0.14130.141326,416,537 37,327Recreation 0.04910.049126,416,537 12,971Lights 0.10280.256126,416,537 A27,156 2020Cemetery 0.01890.020526,416,537 A4,993 2020
City of Trimble General Revenue 0.33340.33347,358,061 24,532
34
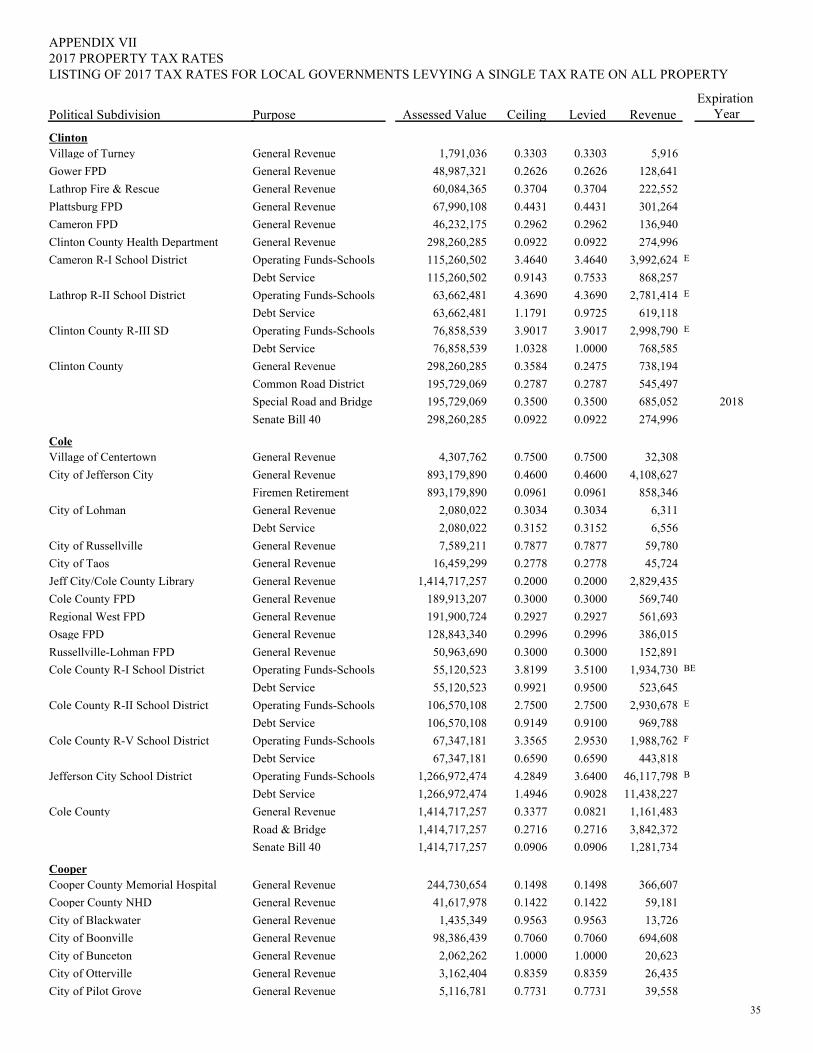
PurposePolitical Subdivision
2017 PROPERTY TAX RATESAPPENDIX VII
Assessed Value Ceiling Levied RevenueExpiration
Year
LISTING OF 2017 TAX RATES FOR LOCAL GOVERNMENTS LEVYING A SINGLE TAX RATE ON ALL PROPERTY
ClintonVillage of Turney General Revenue 0.33030.33031,791,036 5,916Gower FPD General Revenue 0.26260.262648,987,321 128,641Lathrop Fire & Rescue General Revenue 0.37040.370460,084,365 222,552Plattsburg FPD General Revenue 0.44310.443167,990,108 301,264Cameron FPD General Revenue 0.29620.296246,232,175 136,940Clinton County Health Department General Revenue 0.09220.0922298,260,285 274,996Cameron R-I School District Operating Funds-Schools 3.46403.4640115,260,502 E3,992,624
Debt Service 0.75330.9143115,260,502 868,257Lathrop R-II School District Operating Funds-Schools 4.36904.369063,662,481 E2,781,414
Debt Service 0.97251.179163,662,481 619,118Clinton County R-III SD Operating Funds-Schools 3.90173.901776,858,539 E2,998,790
Debt Service 1.00001.032876,858,539 768,585Clinton County General Revenue 0.24750.3584298,260,285 738,194
Common Road District 0.27870.2787195,729,069 545,497Special Road and Bridge 0.35000.3500195,729,069 685,052 2018Senate Bill 40 0.09220.0922298,260,285 274,996
ColeVillage of Centertown General Revenue 0.75000.75004,307,762 32,308City of Jefferson City General Revenue 0.46000.4600893,179,890 4,108,627
Firemen Retirement 0.09610.0961893,179,890 858,346City of Lohman General Revenue 0.30340.30342,080,022 6,311
Debt Service 0.31520.31522,080,022 6,556City of Russellville General Revenue 0.78770.78777,589,211 59,780City of Taos General Revenue 0.27780.277816,459,299 45,724Jeff City/Cole County Library General Revenue 0.20000.20001,414,717,257 2,829,435Cole County FPD General Revenue 0.30000.3000189,913,207 569,740Regional West FPD General Revenue 0.29270.2927191,900,724 561,693Osage FPD General Revenue 0.29960.2996128,843,340 386,015Russellville-Lohman FPD General Revenue 0.30000.300050,963,690 152,891Cole County R-I School District Operating Funds-Schools 3.51003.819955,120,523 BE1,934,730
Debt Service 0.95000.992155,120,523 523,645Cole County R-II School District Operating Funds-Schools 2.75002.7500106,570,108 E2,930,678
Debt Service 0.91000.9149106,570,108 969,788Cole County R-V School District Operating Funds-Schools 2.95303.356567,347,181 F1,988,762
Debt Service 0.65900.659067,347,181 443,818Jefferson City School District Operating Funds-Schools 3.64004.28491,266,972,474 B46,117,798
Debt Service 0.90281.49461,266,972,474 11,438,227Cole County General Revenue 0.08210.33771,414,717,257 1,161,483
Road & Bridge 0.27160.27161,414,717,257 3,842,372Senate Bill 40 0.09060.09061,414,717,257 1,281,734
CooperCooper County Memorial Hospital General Revenue 0.14980.1498244,730,654 366,607Cooper County NHD General Revenue 0.14220.142241,617,978 59,181City of Blackwater General Revenue 0.95630.95631,435,349 13,726City of Boonville General Revenue 0.70600.706098,386,439 694,608City of Bunceton General Revenue 1.00001.00002,062,262 20,623City of Otterville General Revenue 0.83590.83593,162,404 26,435City of Pilot Grove General Revenue 0.77310.77315,116,781 39,558
35
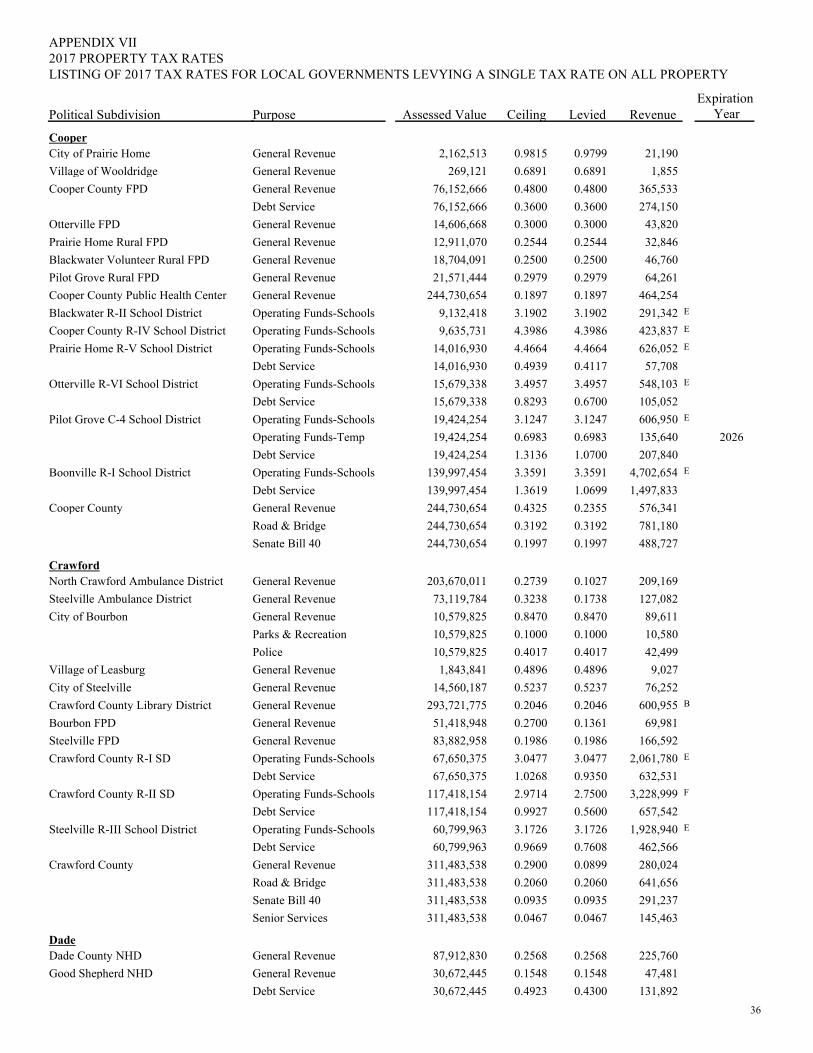
PurposePolitical Subdivision
2017 PROPERTY TAX RATESAPPENDIX VII
Assessed Value Ceiling Levied RevenueExpiration
Year
LISTING OF 2017 TAX RATES FOR LOCAL GOVERNMENTS LEVYING A SINGLE TAX RATE ON ALL PROPERTY
CooperCity of Prairie Home General Revenue 0.97990.98152,162,513 21,190Village of Wooldridge General Revenue 0.68910.6891269,121 1,855Cooper County FPD General Revenue 0.48000.480076,152,666 365,533
Debt Service 0.36000.360076,152,666 274,150Otterville FPD General Revenue 0.30000.300014,606,668 43,820Prairie Home Rural FPD General Revenue 0.25440.254412,911,070 32,846Blackwater Volunteer Rural FPD General Revenue 0.25000.250018,704,091 46,760Pilot Grove Rural FPD General Revenue 0.29790.297921,571,444 64,261Cooper County Public Health Center General Revenue 0.18970.1897244,730,654 464,254Blackwater R-II School District Operating Funds-Schools 3.19023.19029,132,418 E291,342Cooper County R-IV School District Operating Funds-Schools 4.39864.39869,635,731 E423,837Prairie Home R-V School District Operating Funds-Schools 4.46644.466414,016,930 E626,052
Debt Service 0.41170.493914,016,930 57,708Otterville R-VI School District Operating Funds-Schools 3.49573.495715,679,338 E548,103
Debt Service 0.67000.829315,679,338 105,052Pilot Grove C-4 School District Operating Funds-Schools 3.12473.124719,424,254 E606,950
Operating Funds-Temp 0.69830.698319,424,254 135,640 2026Debt Service 1.07001.313619,424,254 207,840
Boonville R-I School District Operating Funds-Schools 3.35913.3591139,997,454 E4,702,654Debt Service 1.06991.3619139,997,454 1,497,833
Cooper County General Revenue 0.23550.4325244,730,654 576,341Road & Bridge 0.31920.3192244,730,654 781,180Senate Bill 40 0.19970.1997244,730,654 488,727
CrawfordNorth Crawford Ambulance District General Revenue 0.10270.2739203,670,011 209,169Steelville Ambulance District General Revenue 0.17380.323873,119,784 127,082City of Bourbon General Revenue 0.84700.847010,579,825 89,611
Parks & Recreation 0.10000.100010,579,825 10,580Police 0.40170.401710,579,825 42,499
Village of Leasburg General Revenue 0.48960.48961,843,841 9,027City of Steelville General Revenue 0.52370.523714,560,187 76,252Crawford County Library District General Revenue 0.20460.2046293,721,775 B600,955Bourbon FPD General Revenue 0.13610.270051,418,948 69,981Steelville FPD General Revenue 0.19860.198683,882,958 166,592Crawford County R-I SD Operating Funds-Schools 3.04773.047767,650,375 E2,061,780
Debt Service 0.93501.026867,650,375 632,531Crawford County R-II SD Operating Funds-Schools 2.75002.9714117,418,154 F3,228,999
Debt Service 0.56000.9927117,418,154 657,542Steelville R-III School District Operating Funds-Schools 3.17263.172660,799,963 E1,928,940
Debt Service 0.76080.966960,799,963 462,566Crawford County General Revenue 0.08990.2900311,483,538 280,024
Road & Bridge 0.20600.2060311,483,538 641,656Senate Bill 40 0.09350.0935311,483,538 291,237Senior Services 0.04670.0467311,483,538 145,463
DadeDade County NHD General Revenue 0.25680.256887,912,830 225,760Good Shepherd NHD General Revenue 0.15480.154830,672,445 47,481
Debt Service 0.43000.492330,672,445 131,89236
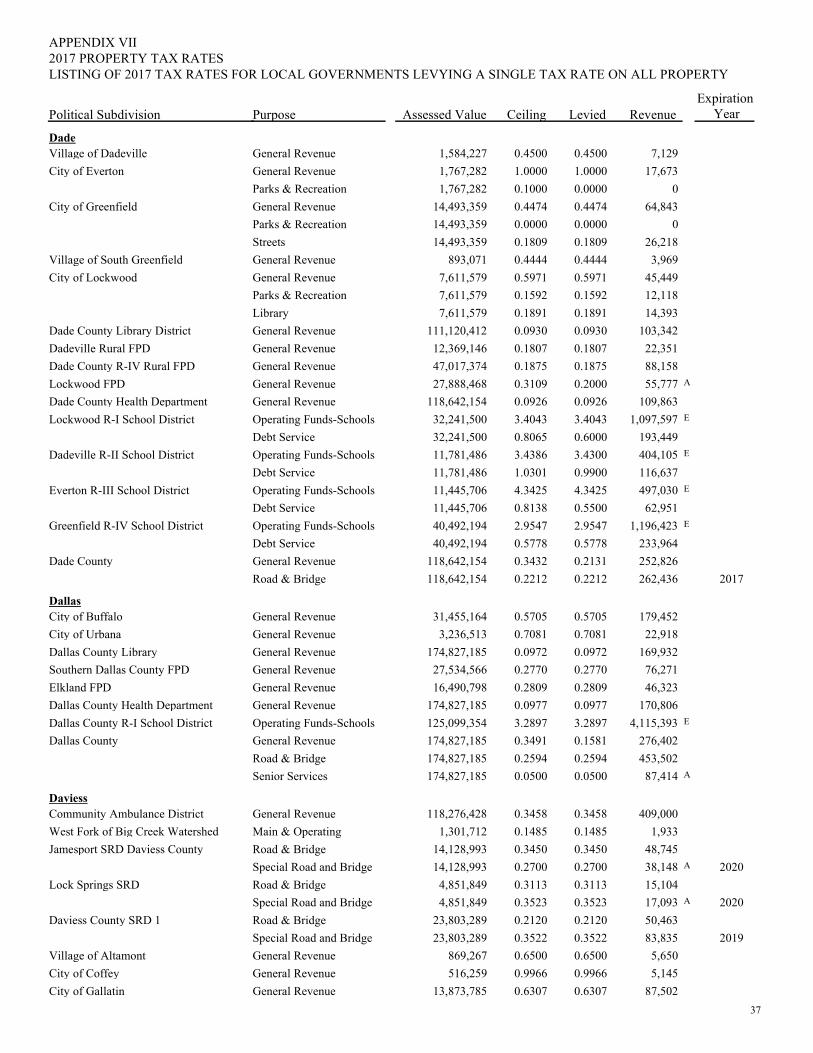
PurposePolitical Subdivision
2017 PROPERTY TAX RATESAPPENDIX VII
Assessed Value Ceiling Levied RevenueExpiration
Year
LISTING OF 2017 TAX RATES FOR LOCAL GOVERNMENTS LEVYING A SINGLE TAX RATE ON ALL PROPERTY
DadeVillage of Dadeville General Revenue 0.45000.45001,584,227 7,129City of Everton General Revenue 1.00001.00001,767,282 17,673
Parks & Recreation 0.00000.10001,767,282 0City of Greenfield General Revenue 0.44740.447414,493,359 64,843
Parks & Recreation 0.00000.000014,493,359 0Streets 0.18090.180914,493,359 26,218
Village of South Greenfield General Revenue 0.44440.4444893,071 3,969City of Lockwood General Revenue 0.59710.59717,611,579 45,449
Parks & Recreation 0.15920.15927,611,579 12,118Library 0.18910.18917,611,579 14,393
Dade County Library District General Revenue 0.09300.0930111,120,412 103,342Dadeville Rural FPD General Revenue 0.18070.180712,369,146 22,351Dade County R-IV Rural FPD General Revenue 0.18750.187547,017,374 88,158Lockwood FPD General Revenue 0.20000.310927,888,468 A55,777Dade County Health Department General Revenue 0.09260.0926118,642,154 109,863Lockwood R-I School District Operating Funds-Schools 3.40433.404332,241,500 E1,097,597
Debt Service 0.60000.806532,241,500 193,449Dadeville R-II School District Operating Funds-Schools 3.43003.438611,781,486 E404,105
Debt Service 0.99001.030111,781,486 116,637Everton R-III School District Operating Funds-Schools 4.34254.342511,445,706 E497,030
Debt Service 0.55000.813811,445,706 62,951Greenfield R-IV School District Operating Funds-Schools 2.95472.954740,492,194 E1,196,423
Debt Service 0.57780.577840,492,194 233,964Dade County General Revenue 0.21310.3432118,642,154 252,826
Road & Bridge 0.22120.2212118,642,154 262,436 2017
DallasCity of Buffalo General Revenue 0.57050.570531,455,164 179,452City of Urbana General Revenue 0.70810.70813,236,513 22,918Dallas County Library General Revenue 0.09720.0972174,827,185 169,932Southern Dallas County FPD General Revenue 0.27700.277027,534,566 76,271Elkland FPD General Revenue 0.28090.280916,490,798 46,323Dallas County Health Department General Revenue 0.09770.0977174,827,185 170,806Dallas County R-I School District Operating Funds-Schools 3.28973.2897125,099,354 E4,115,393Dallas County General Revenue 0.15810.3491174,827,185 276,402
Road & Bridge 0.25940.2594174,827,185 453,502Senior Services 0.05000.0500174,827,185 A87,414
DaviessCommunity Ambulance District General Revenue 0.34580.3458118,276,428 409,000West Fork of Big Creek Watershed Main & Operating 0.14850.14851,301,712 1,933Jamesport SRD Daviess County Road & Bridge 0.34500.345014,128,993 48,745
Special Road and Bridge 0.27000.270014,128,993 A38,148 2020Lock Springs SRD Road & Bridge 0.31130.31134,851,849 15,104
Special Road and Bridge 0.35230.35234,851,849 A17,093 2020Daviess County SRD 1 Road & Bridge 0.21200.212023,803,289 50,463
Special Road and Bridge 0.35220.352223,803,289 83,835 2019Village of Altamont General Revenue 0.65000.6500869,267 5,650City of Coffey General Revenue 0.99660.9966516,259 5,145City of Gallatin General Revenue 0.63070.630713,873,785 87,502
37
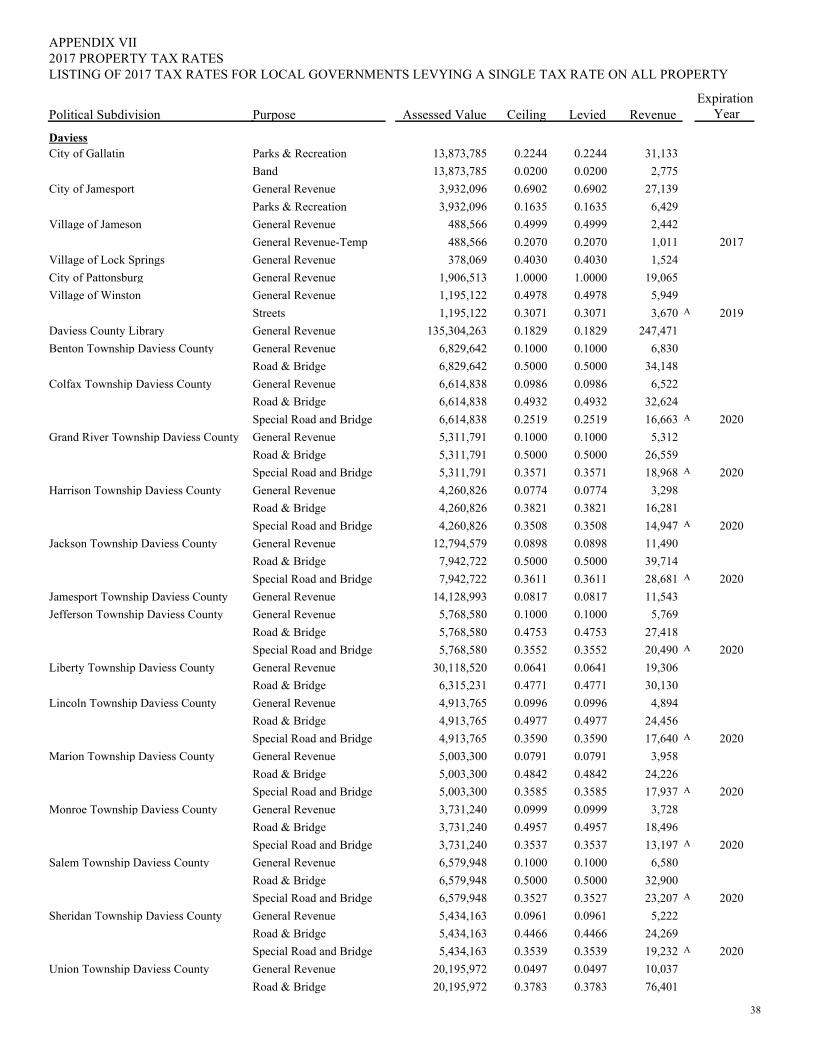
PurposePolitical Subdivision
2017 PROPERTY TAX RATESAPPENDIX VII
Assessed Value Ceiling Levied RevenueExpiration
Year
LISTING OF 2017 TAX RATES FOR LOCAL GOVERNMENTS LEVYING A SINGLE TAX RATE ON ALL PROPERTY
DaviessCity of Gallatin Parks & Recreation 0.22440.224413,873,785 31,133
Band 0.02000.020013,873,785 2,775City of Jamesport General Revenue 0.69020.69023,932,096 27,139
Parks & Recreation 0.16350.16353,932,096 6,429Village of Jameson General Revenue 0.49990.4999488,566 2,442
General Revenue-Temp 0.20700.2070488,566 1,011 2017Village of Lock Springs General Revenue 0.40300.4030378,069 1,524City of Pattonsburg General Revenue 1.00001.00001,906,513 19,065Village of Winston General Revenue 0.49780.49781,195,122 5,949
Streets 0.30710.30711,195,122 A3,670 2019Daviess County Library General Revenue 0.18290.1829135,304,263 247,471Benton Township Daviess County General Revenue 0.10000.10006,829,642 6,830
Road & Bridge 0.50000.50006,829,642 34,148Colfax Township Daviess County General Revenue 0.09860.09866,614,838 6,522
Road & Bridge 0.49320.49326,614,838 32,624Special Road and Bridge 0.25190.25196,614,838 A16,663 2020
Grand River Township Daviess County General Revenue 0.10000.10005,311,791 5,312Road & Bridge 0.50000.50005,311,791 26,559Special Road and Bridge 0.35710.35715,311,791 A18,968 2020
Harrison Township Daviess County General Revenue 0.07740.07744,260,826 3,298Road & Bridge 0.38210.38214,260,826 16,281Special Road and Bridge 0.35080.35084,260,826 A14,947 2020
Jackson Township Daviess County General Revenue 0.08980.089812,794,579 11,490Road & Bridge 0.50000.50007,942,722 39,714Special Road and Bridge 0.36110.36117,942,722 A28,681 2020
Jamesport Township Daviess County General Revenue 0.08170.081714,128,993 11,543Jefferson Township Daviess County General Revenue 0.10000.10005,768,580 5,769
Road & Bridge 0.47530.47535,768,580 27,418Special Road and Bridge 0.35520.35525,768,580 A20,490 2020
Liberty Township Daviess County General Revenue 0.06410.064130,118,520 19,306Road & Bridge 0.47710.47716,315,231 30,130
Lincoln Township Daviess County General Revenue 0.09960.09964,913,765 4,894Road & Bridge 0.49770.49774,913,765 24,456Special Road and Bridge 0.35900.35904,913,765 A17,640 2020
Marion Township Daviess County General Revenue 0.07910.07915,003,300 3,958Road & Bridge 0.48420.48425,003,300 24,226Special Road and Bridge 0.35850.35855,003,300 A17,937 2020
Monroe Township Daviess County General Revenue 0.09990.09993,731,240 3,728Road & Bridge 0.49570.49573,731,240 18,496Special Road and Bridge 0.35370.35373,731,240 A13,197 2020
Salem Township Daviess County General Revenue 0.10000.10006,579,948 6,580Road & Bridge 0.50000.50006,579,948 32,900Special Road and Bridge 0.35270.35276,579,948 A23,207 2020
Sheridan Township Daviess County General Revenue 0.09610.09615,434,163 5,222Road & Bridge 0.44660.44665,434,163 24,269Special Road and Bridge 0.35390.35395,434,163 A19,232 2020
Union Township Daviess County General Revenue 0.04970.049720,195,972 10,037Road & Bridge 0.37830.378320,195,972 76,401
38
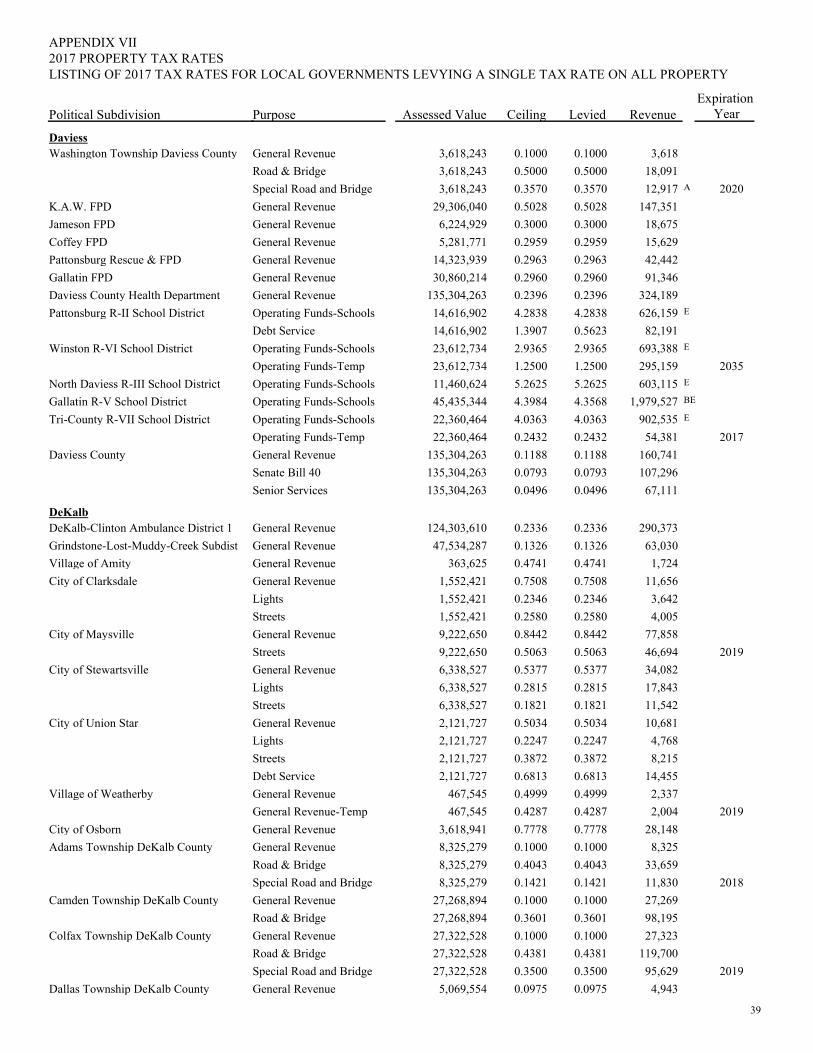
PurposePolitical Subdivision
2017 PROPERTY TAX RATESAPPENDIX VII
Assessed Value Ceiling Levied RevenueExpiration
Year
LISTING OF 2017 TAX RATES FOR LOCAL GOVERNMENTS LEVYING A SINGLE TAX RATE ON ALL PROPERTY
DaviessWashington Township Daviess County General Revenue 0.10000.10003,618,243 3,618
Road & Bridge 0.50000.50003,618,243 18,091Special Road and Bridge 0.35700.35703,618,243 A12,917 2020
K.A.W. FPD General Revenue 0.50280.502829,306,040 147,351Jameson FPD General Revenue 0.30000.30006,224,929 18,675Coffey FPD General Revenue 0.29590.29595,281,771 15,629Pattonsburg Rescue & FPD General Revenue 0.29630.296314,323,939 42,442Gallatin FPD General Revenue 0.29600.296030,860,214 91,346Daviess County Health Department General Revenue 0.23960.2396135,304,263 324,189Pattonsburg R-II School District Operating Funds-Schools 4.28384.283814,616,902 E626,159
Debt Service 0.56231.390714,616,902 82,191Winston R-VI School District Operating Funds-Schools 2.93652.936523,612,734 E693,388
Operating Funds-Temp 1.25001.250023,612,734 295,159 2035North Daviess R-III School District Operating Funds-Schools 5.26255.262511,460,624 E603,115Gallatin R-V School District Operating Funds-Schools 4.35684.398445,435,344 BE1,979,527Tri-County R-VII School District Operating Funds-Schools 4.03634.036322,360,464 E902,535
Operating Funds-Temp 0.24320.243222,360,464 54,381 2017Daviess County General Revenue 0.11880.1188135,304,263 160,741
Senate Bill 40 0.07930.0793135,304,263 107,296Senior Services 0.04960.0496135,304,263 67,111
DeKalbDeKalb-Clinton Ambulance District 1 General Revenue 0.23360.2336124,303,610 290,373Grindstone-Lost-Muddy-Creek Subdist General Revenue 0.13260.132647,534,287 63,030Village of Amity General Revenue 0.47410.4741363,625 1,724City of Clarksdale General Revenue 0.75080.75081,552,421 11,656
Lights 0.23460.23461,552,421 3,642Streets 0.25800.25801,552,421 4,005
City of Maysville General Revenue 0.84420.84429,222,650 77,858Streets 0.50630.50639,222,650 46,694 2019
City of Stewartsville General Revenue 0.53770.53776,338,527 34,082Lights 0.28150.28156,338,527 17,843Streets 0.18210.18216,338,527 11,542
City of Union Star General Revenue 0.50340.50342,121,727 10,681Lights 0.22470.22472,121,727 4,768Streets 0.38720.38722,121,727 8,215Debt Service 0.68130.68132,121,727 14,455
Village of Weatherby General Revenue 0.49990.4999467,545 2,337General Revenue-Temp 0.42870.4287467,545 2,004 2019
City of Osborn General Revenue 0.77780.77783,618,941 28,148Adams Township DeKalb County General Revenue 0.10000.10008,325,279 8,325
Road & Bridge 0.40430.40438,325,279 33,659Special Road and Bridge 0.14210.14218,325,279 11,830 2018
Camden Township DeKalb County General Revenue 0.10000.100027,268,894 27,269Road & Bridge 0.36010.360127,268,894 98,195
Colfax Township DeKalb County General Revenue 0.10000.100027,322,528 27,323Road & Bridge 0.43810.438127,322,528 119,700Special Road and Bridge 0.35000.350027,322,528 95,629 2019
Dallas Township DeKalb County General Revenue 0.09750.09755,069,554 4,943
39
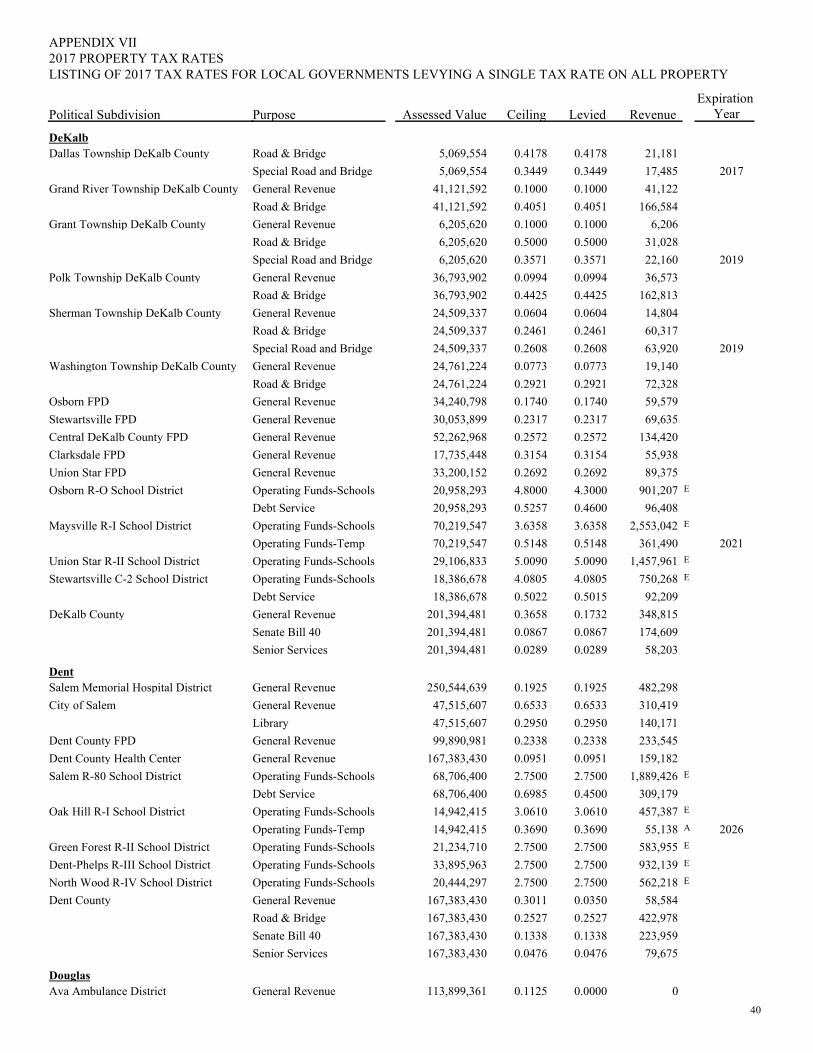
PurposePolitical Subdivision
2017 PROPERTY TAX RATESAPPENDIX VII
Assessed Value Ceiling Levied RevenueExpiration
Year
LISTING OF 2017 TAX RATES FOR LOCAL GOVERNMENTS LEVYING A SINGLE TAX RATE ON ALL PROPERTY
DeKalbDallas Township DeKalb County Road & Bridge 0.41780.41785,069,554 21,181
Special Road and Bridge 0.34490.34495,069,554 17,485 2017Grand River Township DeKalb County General Revenue 0.10000.100041,121,592 41,122
Road & Bridge 0.40510.405141,121,592 166,584Grant Township DeKalb County General Revenue 0.10000.10006,205,620 6,206
Road & Bridge 0.50000.50006,205,620 31,028Special Road and Bridge 0.35710.35716,205,620 22,160 2019
Polk Township DeKalb County General Revenue 0.09940.099436,793,902 36,573Road & Bridge 0.44250.442536,793,902 162,813
Sherman Township DeKalb County General Revenue 0.06040.060424,509,337 14,804Road & Bridge 0.24610.246124,509,337 60,317Special Road and Bridge 0.26080.260824,509,337 63,920 2019
Washington Township DeKalb County General Revenue 0.07730.077324,761,224 19,140Road & Bridge 0.29210.292124,761,224 72,328
Osborn FPD General Revenue 0.17400.174034,240,798 59,579Stewartsville FPD General Revenue 0.23170.231730,053,899 69,635Central DeKalb County FPD General Revenue 0.25720.257252,262,968 134,420Clarksdale FPD General Revenue 0.31540.315417,735,448 55,938Union Star FPD General Revenue 0.26920.269233,200,152 89,375Osborn R-O School District Operating Funds-Schools 4.30004.800020,958,293 E901,207
Debt Service 0.46000.525720,958,293 96,408Maysville R-I School District Operating Funds-Schools 3.63583.635870,219,547 E2,553,042
Operating Funds-Temp 0.51480.514870,219,547 361,490 2021Union Star R-II School District Operating Funds-Schools 5.00905.009029,106,833 E1,457,961Stewartsville C-2 School District Operating Funds-Schools 4.08054.080518,386,678 E750,268
Debt Service 0.50150.502218,386,678 92,209DeKalb County General Revenue 0.17320.3658201,394,481 348,815
Senate Bill 40 0.08670.0867201,394,481 174,609Senior Services 0.02890.0289201,394,481 58,203
DentSalem Memorial Hospital District General Revenue 0.19250.1925250,544,639 482,298City of Salem General Revenue 0.65330.653347,515,607 310,419
Library 0.29500.295047,515,607 140,171Dent County FPD General Revenue 0.23380.233899,890,981 233,545Dent County Health Center General Revenue 0.09510.0951167,383,430 159,182Salem R-80 School District Operating Funds-Schools 2.75002.750068,706,400 E1,889,426
Debt Service 0.45000.698568,706,400 309,179Oak Hill R-I School District Operating Funds-Schools 3.06103.061014,942,415 E457,387
Operating Funds-Temp 0.36900.369014,942,415 A55,138 2026Green Forest R-II School District Operating Funds-Schools 2.75002.750021,234,710 E583,955Dent-Phelps R-III School District Operating Funds-Schools 2.75002.750033,895,963 E932,139North Wood R-IV School District Operating Funds-Schools 2.75002.750020,444,297 E562,218Dent County General Revenue 0.03500.3011167,383,430 58,584
Road & Bridge 0.25270.2527167,383,430 422,978Senate Bill 40 0.13380.1338167,383,430 223,959Senior Services 0.04760.0476167,383,430 79,675
DouglasAva Ambulance District General Revenue 0.00000.1125113,899,361 0
40
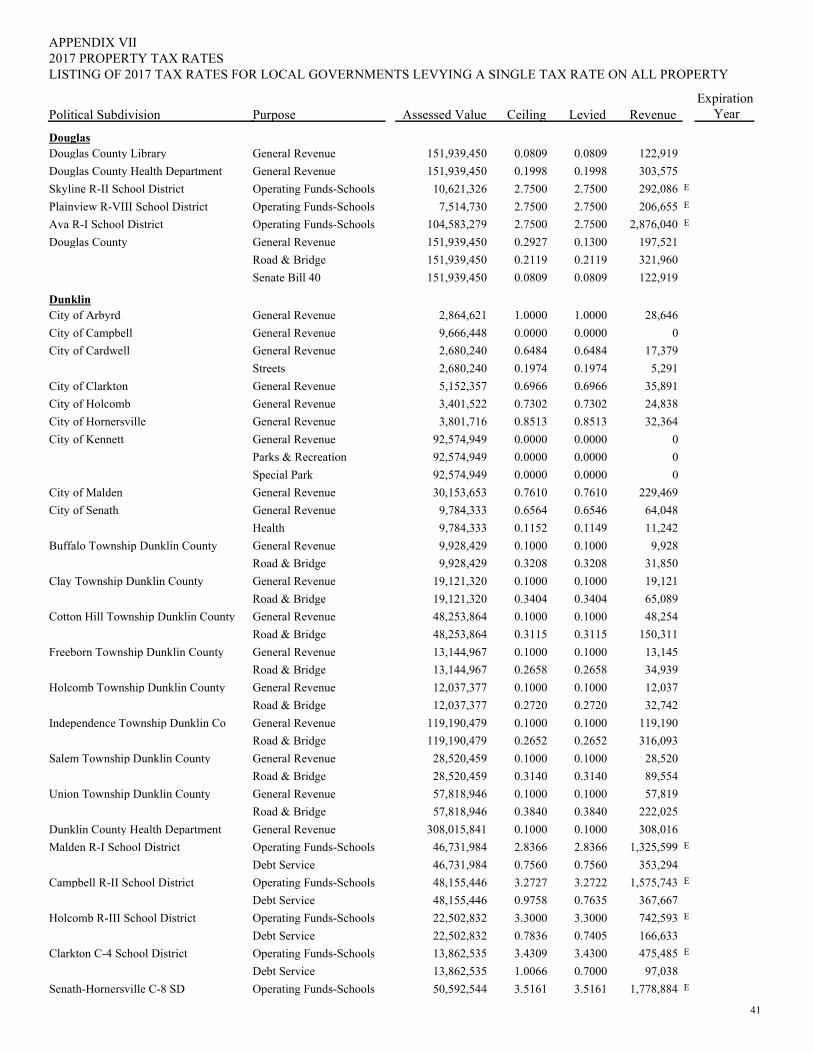
PurposePolitical Subdivision
2017 PROPERTY TAX RATESAPPENDIX VII
Assessed Value Ceiling Levied RevenueExpiration
Year
LISTING OF 2017 TAX RATES FOR LOCAL GOVERNMENTS LEVYING A SINGLE TAX RATE ON ALL PROPERTY
DouglasDouglas County Library General Revenue 0.08090.0809151,939,450 122,919Douglas County Health Department General Revenue 0.19980.1998151,939,450 303,575Skyline R-II School District Operating Funds-Schools 2.75002.750010,621,326 E292,086Plainview R-VIII School District Operating Funds-Schools 2.75002.75007,514,730 E206,655Ava R-I School District Operating Funds-Schools 2.75002.7500104,583,279 E2,876,040Douglas County General Revenue 0.13000.2927151,939,450 197,521
Road & Bridge 0.21190.2119151,939,450 321,960Senate Bill 40 0.08090.0809151,939,450 122,919
DunklinCity of Arbyrd General Revenue 1.00001.00002,864,621 28,646City of Campbell General Revenue 0.00000.00009,666,448 0City of Cardwell General Revenue 0.64840.64842,680,240 17,379
Streets 0.19740.19742,680,240 5,291City of Clarkton General Revenue 0.69660.69665,152,357 35,891City of Holcomb General Revenue 0.73020.73023,401,522 24,838City of Hornersville General Revenue 0.85130.85133,801,716 32,364City of Kennett General Revenue 0.00000.000092,574,949 0
Parks & Recreation 0.00000.000092,574,949 0Special Park 0.00000.000092,574,949 0
City of Malden General Revenue 0.76100.761030,153,653 229,469City of Senath General Revenue 0.65460.65649,784,333 64,048
Health 0.11490.11529,784,333 11,242Buffalo Township Dunklin County General Revenue 0.10000.10009,928,429 9,928
Road & Bridge 0.32080.32089,928,429 31,850Clay Township Dunklin County General Revenue 0.10000.100019,121,320 19,121
Road & Bridge 0.34040.340419,121,320 65,089Cotton Hill Township Dunklin County General Revenue 0.10000.100048,253,864 48,254
Road & Bridge 0.31150.311548,253,864 150,311Freeborn Township Dunklin County General Revenue 0.10000.100013,144,967 13,145
Road & Bridge 0.26580.265813,144,967 34,939Holcomb Township Dunklin County General Revenue 0.10000.100012,037,377 12,037
Road & Bridge 0.27200.272012,037,377 32,742Independence Township Dunklin Co General Revenue 0.10000.1000119,190,479 119,190
Road & Bridge 0.26520.2652119,190,479 316,093Salem Township Dunklin County General Revenue 0.10000.100028,520,459 28,520
Road & Bridge 0.31400.314028,520,459 89,554Union Township Dunklin County General Revenue 0.10000.100057,818,946 57,819
Road & Bridge 0.38400.384057,818,946 222,025Dunklin County Health Department General Revenue 0.10000.1000308,015,841 308,016Malden R-I School District Operating Funds-Schools 2.83662.836646,731,984 E1,325,599
Debt Service 0.75600.756046,731,984 353,294Campbell R-II School District Operating Funds-Schools 3.27223.272748,155,446 E1,575,743
Debt Service 0.76350.975848,155,446 367,667Holcomb R-III School District Operating Funds-Schools 3.30003.300022,502,832 E742,593
Debt Service 0.74050.783622,502,832 166,633Clarkton C-4 School District Operating Funds-Schools 3.43003.430913,862,535 E475,485
Debt Service 0.70001.006613,862,535 97,038Senath-Hornersville C-8 SD Operating Funds-Schools 3.51613.516150,592,544 E1,778,884
41
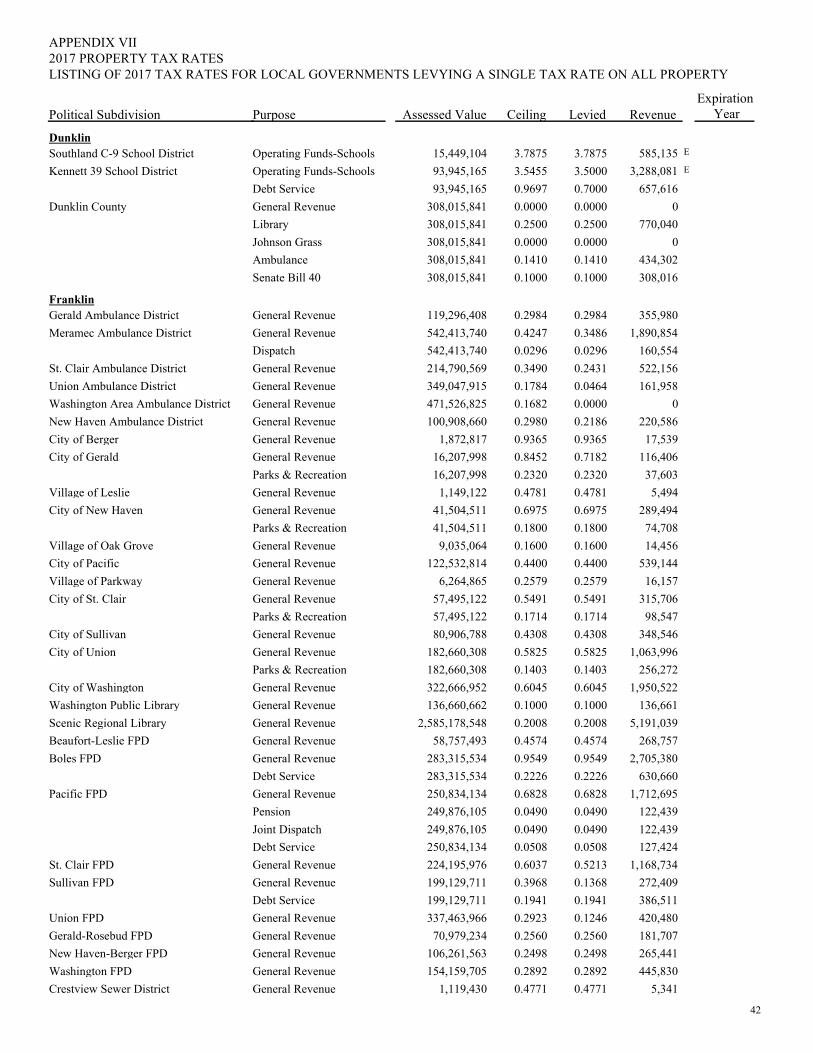
PurposePolitical Subdivision
2017 PROPERTY TAX RATESAPPENDIX VII
Assessed Value Ceiling Levied RevenueExpiration
Year
LISTING OF 2017 TAX RATES FOR LOCAL GOVERNMENTS LEVYING A SINGLE TAX RATE ON ALL PROPERTY
DunklinSouthland C-9 School District Operating Funds-Schools 3.78753.787515,449,104 E585,135Kennett 39 School District Operating Funds-Schools 3.50003.545593,945,165 E3,288,081
Debt Service 0.70000.969793,945,165 657,616Dunklin County General Revenue 0.00000.0000308,015,841 0
Library 0.25000.2500308,015,841 770,040Johnson Grass 0.00000.0000308,015,841 0Ambulance 0.14100.1410308,015,841 434,302Senate Bill 40 0.10000.1000308,015,841 308,016
FranklinGerald Ambulance District General Revenue 0.29840.2984119,296,408 355,980Meramec Ambulance District General Revenue 0.34860.4247542,413,740 1,890,854
Dispatch 0.02960.0296542,413,740 160,554St. Clair Ambulance District General Revenue 0.24310.3490214,790,569 522,156Union Ambulance District General Revenue 0.04640.1784349,047,915 161,958Washington Area Ambulance District General Revenue 0.00000.1682471,526,825 0New Haven Ambulance District General Revenue 0.21860.2980100,908,660 220,586City of Berger General Revenue 0.93650.93651,872,817 17,539City of Gerald General Revenue 0.71820.845216,207,998 116,406
Parks & Recreation 0.23200.232016,207,998 37,603Village of Leslie General Revenue 0.47810.47811,149,122 5,494City of New Haven General Revenue 0.69750.697541,504,511 289,494
Parks & Recreation 0.18000.180041,504,511 74,708Village of Oak Grove General Revenue 0.16000.16009,035,064 14,456City of Pacific General Revenue 0.44000.4400122,532,814 539,144Village of Parkway General Revenue 0.25790.25796,264,865 16,157City of St. Clair General Revenue 0.54910.549157,495,122 315,706
Parks & Recreation 0.17140.171457,495,122 98,547City of Sullivan General Revenue 0.43080.430880,906,788 348,546City of Union General Revenue 0.58250.5825182,660,308 1,063,996
Parks & Recreation 0.14030.1403182,660,308 256,272City of Washington General Revenue 0.60450.6045322,666,952 1,950,522Washington Public Library General Revenue 0.10000.1000136,660,662 136,661Scenic Regional Library General Revenue 0.20080.20082,585,178,548 5,191,039Beaufort-Leslie FPD General Revenue 0.45740.457458,757,493 268,757Boles FPD General Revenue 0.95490.9549283,315,534 2,705,380
Debt Service 0.22260.2226283,315,534 630,660Pacific FPD General Revenue 0.68280.6828250,834,134 1,712,695
Pension 0.04900.0490249,876,105 122,439Joint Dispatch 0.04900.0490249,876,105 122,439Debt Service 0.05080.0508250,834,134 127,424
St. Clair FPD General Revenue 0.52130.6037224,195,976 1,168,734Sullivan FPD General Revenue 0.13680.3968199,129,711 272,409
Debt Service 0.19410.1941199,129,711 386,511Union FPD General Revenue 0.12460.2923337,463,966 420,480Gerald-Rosebud FPD General Revenue 0.25600.256070,979,234 181,707New Haven-Berger FPD General Revenue 0.24980.2498106,261,563 265,441Washington FPD General Revenue 0.28920.2892154,159,705 445,830Crestview Sewer District General Revenue 0.47710.47711,119,430 5,341
42
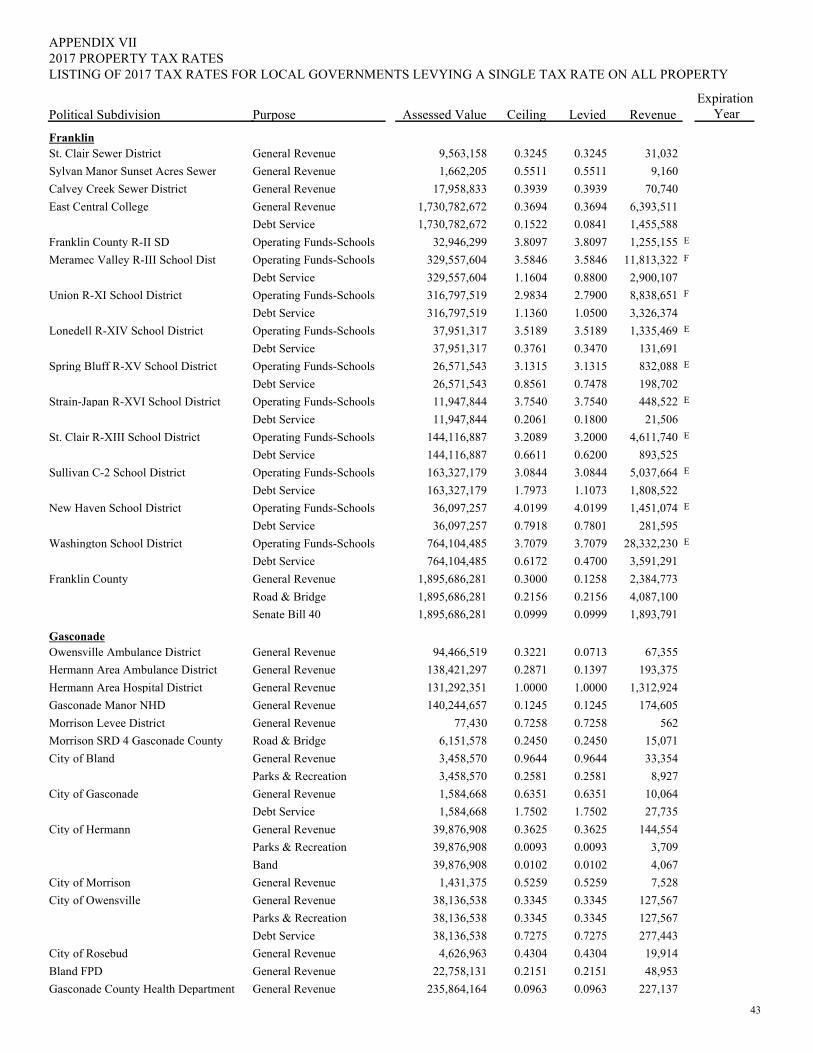
PurposePolitical Subdivision
2017 PROPERTY TAX RATESAPPENDIX VII
Assessed Value Ceiling Levied RevenueExpiration
Year
LISTING OF 2017 TAX RATES FOR LOCAL GOVERNMENTS LEVYING A SINGLE TAX RATE ON ALL PROPERTY
FranklinSt. Clair Sewer District General Revenue 0.32450.32459,563,158 31,032Sylvan Manor Sunset Acres Sewer General Revenue 0.55110.55111,662,205 9,160Calvey Creek Sewer District General Revenue 0.39390.393917,958,833 70,740East Central College General Revenue 0.36940.36941,730,782,672 6,393,511
Debt Service 0.08410.15221,730,782,672 1,455,588Franklin County R-II SD Operating Funds-Schools 3.80973.809732,946,299 E1,255,155Meramec Valley R-III School Dist Operating Funds-Schools 3.58463.5846329,557,604 F11,813,322
Debt Service 0.88001.1604329,557,604 2,900,107Union R-XI School District Operating Funds-Schools 2.79002.9834316,797,519 F8,838,651
Debt Service 1.05001.1360316,797,519 3,326,374Lonedell R-XIV School District Operating Funds-Schools 3.51893.518937,951,317 E1,335,469
Debt Service 0.34700.376137,951,317 131,691Spring Bluff R-XV School District Operating Funds-Schools 3.13153.131526,571,543 E832,088
Debt Service 0.74780.856126,571,543 198,702Strain-Japan R-XVI School District Operating Funds-Schools 3.75403.754011,947,844 E448,522
Debt Service 0.18000.206111,947,844 21,506St. Clair R-XIII School District Operating Funds-Schools 3.20003.2089144,116,887 E4,611,740
Debt Service 0.62000.6611144,116,887 893,525Sullivan C-2 School District Operating Funds-Schools 3.08443.0844163,327,179 E5,037,664
Debt Service 1.10731.7973163,327,179 1,808,522New Haven School District Operating Funds-Schools 4.01994.019936,097,257 E1,451,074
Debt Service 0.78010.791836,097,257 281,595Washington School District Operating Funds-Schools 3.70793.7079764,104,485 E28,332,230
Debt Service 0.47000.6172764,104,485 3,591,291Franklin County General Revenue 0.12580.30001,895,686,281 2,384,773
Road & Bridge 0.21560.21561,895,686,281 4,087,100Senate Bill 40 0.09990.09991,895,686,281 1,893,791
GasconadeOwensville Ambulance District General Revenue 0.07130.322194,466,519 67,355Hermann Area Ambulance District General Revenue 0.13970.2871138,421,297 193,375Hermann Area Hospital District General Revenue 1.00001.0000131,292,351 1,312,924Gasconade Manor NHD General Revenue 0.12450.1245140,244,657 174,605Morrison Levee District General Revenue 0.72580.725877,430 562Morrison SRD 4 Gasconade County Road & Bridge 0.24500.24506,151,578 15,071City of Bland General Revenue 0.96440.96443,458,570 33,354
Parks & Recreation 0.25810.25813,458,570 8,927City of Gasconade General Revenue 0.63510.63511,584,668 10,064
Debt Service 1.75021.75021,584,668 27,735City of Hermann General Revenue 0.36250.362539,876,908 144,554
Parks & Recreation 0.00930.009339,876,908 3,709Band 0.01020.010239,876,908 4,067
City of Morrison General Revenue 0.52590.52591,431,375 7,528City of Owensville General Revenue 0.33450.334538,136,538 127,567
Parks & Recreation 0.33450.334538,136,538 127,567Debt Service 0.72750.727538,136,538 277,443
City of Rosebud General Revenue 0.43040.43044,626,963 19,914Bland FPD General Revenue 0.21510.215122,758,131 48,953Gasconade County Health Department General Revenue 0.09630.0963235,864,164 227,137
43
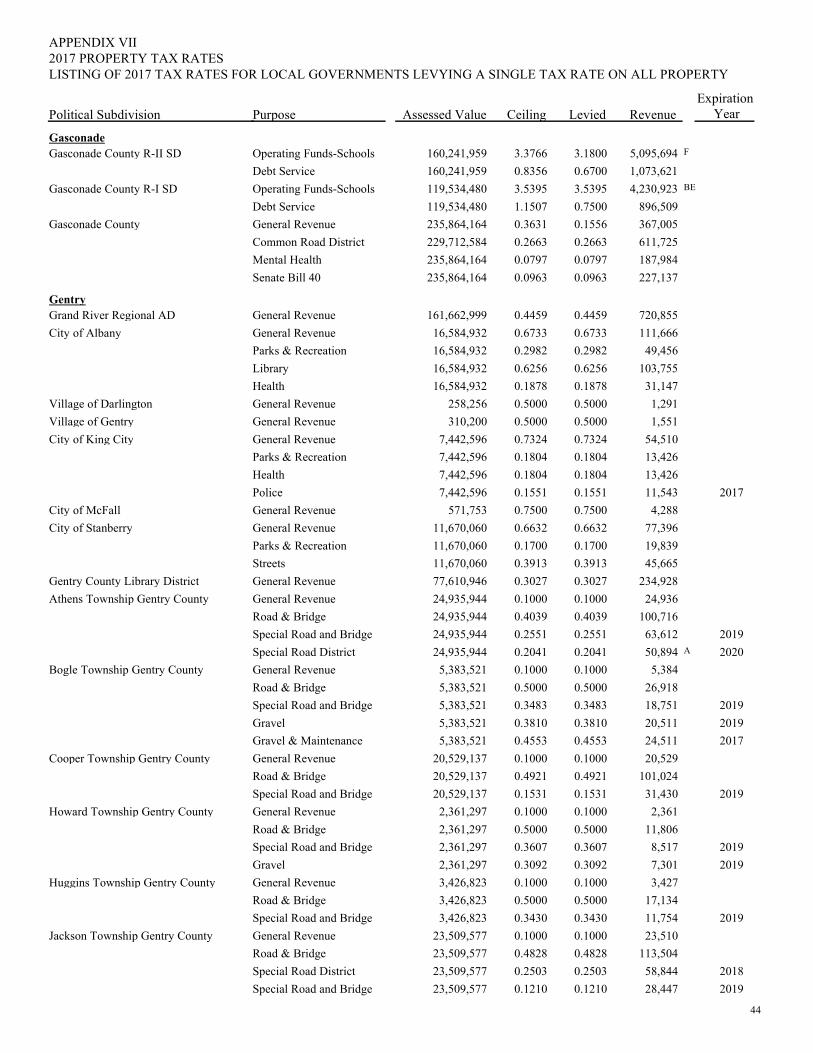
PurposePolitical Subdivision
2017 PROPERTY TAX RATESAPPENDIX VII
Assessed Value Ceiling Levied RevenueExpiration
Year
LISTING OF 2017 TAX RATES FOR LOCAL GOVERNMENTS LEVYING A SINGLE TAX RATE ON ALL PROPERTY
GasconadeGasconade County R-II SD Operating Funds-Schools 3.18003.3766160,241,959 F5,095,694
Debt Service 0.67000.8356160,241,959 1,073,621Gasconade County R-I SD Operating Funds-Schools 3.53953.5395119,534,480 BE4,230,923
Debt Service 0.75001.1507119,534,480 896,509Gasconade County General Revenue 0.15560.3631235,864,164 367,005
Common Road District 0.26630.2663229,712,584 611,725Mental Health 0.07970.0797235,864,164 187,984Senate Bill 40 0.09630.0963235,864,164 227,137
GentryGrand River Regional AD General Revenue 0.44590.4459161,662,999 720,855City of Albany General Revenue 0.67330.673316,584,932 111,666
Parks & Recreation 0.29820.298216,584,932 49,456Library 0.62560.625616,584,932 103,755Health 0.18780.187816,584,932 31,147
Village of Darlington General Revenue 0.50000.5000258,256 1,291Village of Gentry General Revenue 0.50000.5000310,200 1,551City of King City General Revenue 0.73240.73247,442,596 54,510
Parks & Recreation 0.18040.18047,442,596 13,426Health 0.18040.18047,442,596 13,426Police 0.15510.15517,442,596 11,543 2017
City of McFall General Revenue 0.75000.7500571,753 4,288City of Stanberry General Revenue 0.66320.663211,670,060 77,396
Parks & Recreation 0.17000.170011,670,060 19,839Streets 0.39130.391311,670,060 45,665
Gentry County Library District General Revenue 0.30270.302777,610,946 234,928Athens Township Gentry County General Revenue 0.10000.100024,935,944 24,936
Road & Bridge 0.40390.403924,935,944 100,716Special Road and Bridge 0.25510.255124,935,944 63,612 2019Special Road District 0.20410.204124,935,944 A50,894 2020
Bogle Township Gentry County General Revenue 0.10000.10005,383,521 5,384Road & Bridge 0.50000.50005,383,521 26,918Special Road and Bridge 0.34830.34835,383,521 18,751 2019Gravel 0.38100.38105,383,521 20,511 2019Gravel & Maintenance 0.45530.45535,383,521 24,511 2017
Cooper Township Gentry County General Revenue 0.10000.100020,529,137 20,529Road & Bridge 0.49210.492120,529,137 101,024Special Road and Bridge 0.15310.153120,529,137 31,430 2019
Howard Township Gentry County General Revenue 0.10000.10002,361,297 2,361Road & Bridge 0.50000.50002,361,297 11,806Special Road and Bridge 0.36070.36072,361,297 8,517 2019Gravel 0.30920.30922,361,297 7,301 2019
Huggins Township Gentry County General Revenue 0.10000.10003,426,823 3,427Road & Bridge 0.50000.50003,426,823 17,134Special Road and Bridge 0.34300.34303,426,823 11,754 2019
Jackson Township Gentry County General Revenue 0.10000.100023,509,577 23,510Road & Bridge 0.48280.482823,509,577 113,504Special Road District 0.25030.250323,509,577 58,844 2018Special Road and Bridge 0.12100.121023,509,577 28,447 2019
44
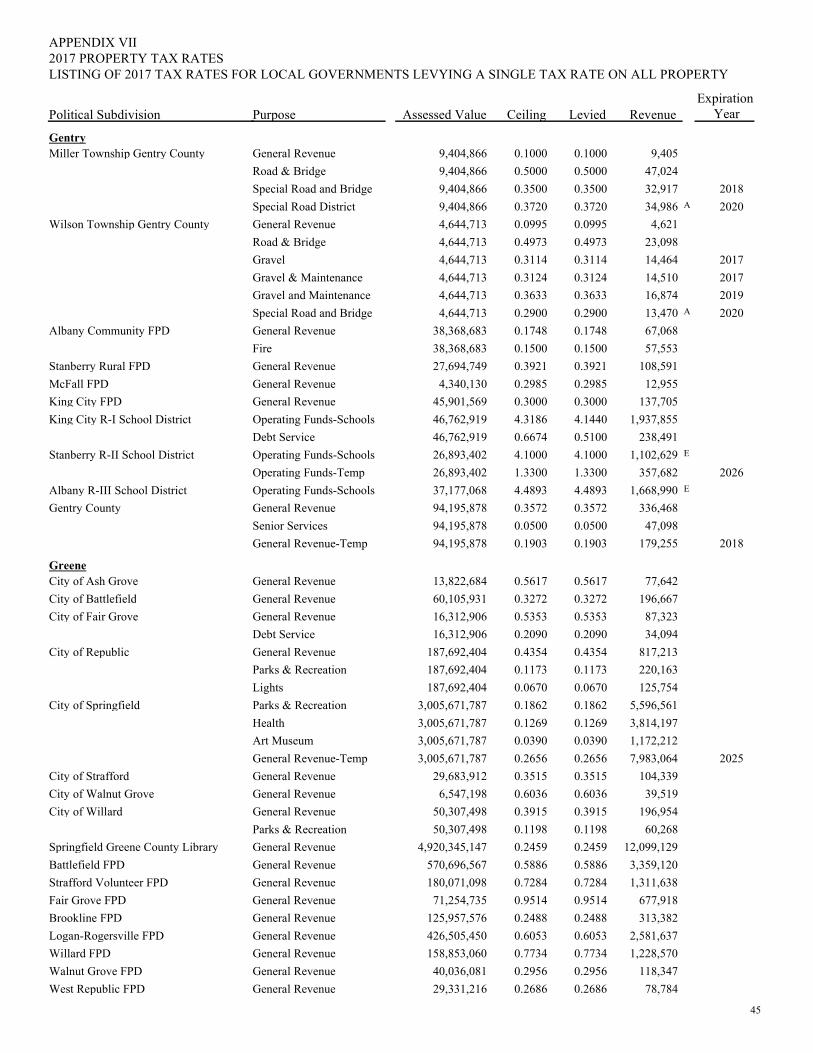
PurposePolitical Subdivision
2017 PROPERTY TAX RATESAPPENDIX VII
Assessed Value Ceiling Levied RevenueExpiration
Year
LISTING OF 2017 TAX RATES FOR LOCAL GOVERNMENTS LEVYING A SINGLE TAX RATE ON ALL PROPERTY
GentryMiller Township Gentry County General Revenue 0.10000.10009,404,866 9,405
Road & Bridge 0.50000.50009,404,866 47,024Special Road and Bridge 0.35000.35009,404,866 32,917 2018Special Road District 0.37200.37209,404,866 A34,986 2020
Wilson Township Gentry County General Revenue 0.09950.09954,644,713 4,621Road & Bridge 0.49730.49734,644,713 23,098Gravel 0.31140.31144,644,713 14,464 2017Gravel & Maintenance 0.31240.31244,644,713 14,510 2017Gravel and Maintenance 0.36330.36334,644,713 16,874 2019Special Road and Bridge 0.29000.29004,644,713 A13,470 2020
Albany Community FPD General Revenue 0.17480.174838,368,683 67,068Fire 0.15000.150038,368,683 57,553
Stanberry Rural FPD General Revenue 0.39210.392127,694,749 108,591McFall FPD General Revenue 0.29850.29854,340,130 12,955King City FPD General Revenue 0.30000.300045,901,569 137,705King City R-I School District Operating Funds-Schools 4.14404.318646,762,919 1,937,855
Debt Service 0.51000.667446,762,919 238,491Stanberry R-II School District Operating Funds-Schools 4.10004.100026,893,402 E1,102,629
Operating Funds-Temp 1.33001.330026,893,402 357,682 2026Albany R-III School District Operating Funds-Schools 4.48934.489337,177,068 E1,668,990Gentry County General Revenue 0.35720.357294,195,878 336,468
Senior Services 0.05000.050094,195,878 47,098General Revenue-Temp 0.19030.190394,195,878 179,255 2018
GreeneCity of Ash Grove General Revenue 0.56170.561713,822,684 77,642City of Battlefield General Revenue 0.32720.327260,105,931 196,667City of Fair Grove General Revenue 0.53530.535316,312,906 87,323
Debt Service 0.20900.209016,312,906 34,094City of Republic General Revenue 0.43540.4354187,692,404 817,213
Parks & Recreation 0.11730.1173187,692,404 220,163Lights 0.06700.0670187,692,404 125,754
City of Springfield Parks & Recreation 0.18620.18623,005,671,787 5,596,561Health 0.12690.12693,005,671,787 3,814,197Art Museum 0.03900.03903,005,671,787 1,172,212General Revenue-Temp 0.26560.26563,005,671,787 7,983,064 2025
City of Strafford General Revenue 0.35150.351529,683,912 104,339City of Walnut Grove General Revenue 0.60360.60366,547,198 39,519City of Willard General Revenue 0.39150.391550,307,498 196,954
Parks & Recreation 0.11980.119850,307,498 60,268Springfield Greene County Library General Revenue 0.24590.24594,920,345,147 12,099,129Battlefield FPD General Revenue 0.58860.5886570,696,567 3,359,120Strafford Volunteer FPD General Revenue 0.72840.7284180,071,098 1,311,638Fair Grove FPD General Revenue 0.95140.951471,254,735 677,918Brookline FPD General Revenue 0.24880.2488125,957,576 313,382Logan-Rogersville FPD General Revenue 0.60530.6053426,505,450 2,581,637Willard FPD General Revenue 0.77340.7734158,853,060 1,228,570Walnut Grove FPD General Revenue 0.29560.295640,036,081 118,347West Republic FPD General Revenue 0.26860.268629,331,216 78,784
45
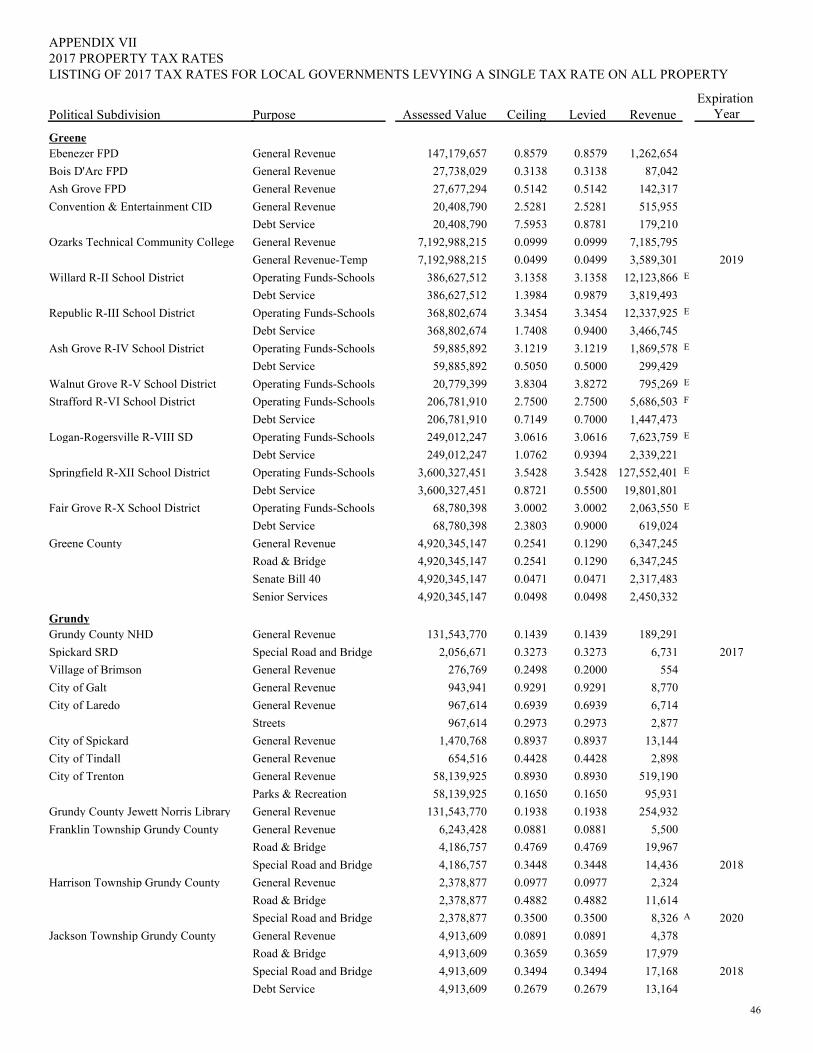
PurposePolitical Subdivision
2017 PROPERTY TAX RATESAPPENDIX VII
Assessed Value Ceiling Levied RevenueExpiration
Year
LISTING OF 2017 TAX RATES FOR LOCAL GOVERNMENTS LEVYING A SINGLE TAX RATE ON ALL PROPERTY
GreeneEbenezer FPD General Revenue 0.85790.8579147,179,657 1,262,654Bois D'Arc FPD General Revenue 0.31380.313827,738,029 87,042Ash Grove FPD General Revenue 0.51420.514227,677,294 142,317Convention & Entertainment CID General Revenue 2.52812.528120,408,790 515,955
Debt Service 0.87817.595320,408,790 179,210Ozarks Technical Community College General Revenue 0.09990.09997,192,988,215 7,185,795
General Revenue-Temp 0.04990.04997,192,988,215 3,589,301 2019Willard R-II School District Operating Funds-Schools 3.13583.1358386,627,512 E12,123,866
Debt Service 0.98791.3984386,627,512 3,819,493Republic R-III School District Operating Funds-Schools 3.34543.3454368,802,674 E12,337,925
Debt Service 0.94001.7408368,802,674 3,466,745Ash Grove R-IV School District Operating Funds-Schools 3.12193.121959,885,892 E1,869,578
Debt Service 0.50000.505059,885,892 299,429Walnut Grove R-V School District Operating Funds-Schools 3.82723.830420,779,399 E795,269Strafford R-VI School District Operating Funds-Schools 2.75002.7500206,781,910 F5,686,503
Debt Service 0.70000.7149206,781,910 1,447,473Logan-Rogersville R-VIII SD Operating Funds-Schools 3.06163.0616249,012,247 E7,623,759
Debt Service 0.93941.0762249,012,247 2,339,221Springfield R-XII School District Operating Funds-Schools 3.54283.54283,600,327,451 E127,552,401
Debt Service 0.55000.87213,600,327,451 19,801,801Fair Grove R-X School District Operating Funds-Schools 3.00023.000268,780,398 E2,063,550
Debt Service 0.90002.380368,780,398 619,024Greene County General Revenue 0.12900.25414,920,345,147 6,347,245
Road & Bridge 0.12900.25414,920,345,147 6,347,245Senate Bill 40 0.04710.04714,920,345,147 2,317,483Senior Services 0.04980.04984,920,345,147 2,450,332
GrundyGrundy County NHD General Revenue 0.14390.1439131,543,770 189,291Spickard SRD Special Road and Bridge 0.32730.32732,056,671 6,731 2017Village of Brimson General Revenue 0.20000.2498276,769 554City of Galt General Revenue 0.92910.9291943,941 8,770City of Laredo General Revenue 0.69390.6939967,614 6,714
Streets 0.29730.2973967,614 2,877City of Spickard General Revenue 0.89370.89371,470,768 13,144City of Tindall General Revenue 0.44280.4428654,516 2,898City of Trenton General Revenue 0.89300.893058,139,925 519,190
Parks & Recreation 0.16500.165058,139,925 95,931Grundy County Jewett Norris Library General Revenue 0.19380.1938131,543,770 254,932Franklin Township Grundy County General Revenue 0.08810.08816,243,428 5,500
Road & Bridge 0.47690.47694,186,757 19,967Special Road and Bridge 0.34480.34484,186,757 14,436 2018
Harrison Township Grundy County General Revenue 0.09770.09772,378,877 2,324Road & Bridge 0.48820.48822,378,877 11,614Special Road and Bridge 0.35000.35002,378,877 A8,326 2020
Jackson Township Grundy County General Revenue 0.08910.08914,913,609 4,378Road & Bridge 0.36590.36594,913,609 17,979Special Road and Bridge 0.34940.34944,913,609 17,168 2018Debt Service 0.26790.26794,913,609 13,164
46
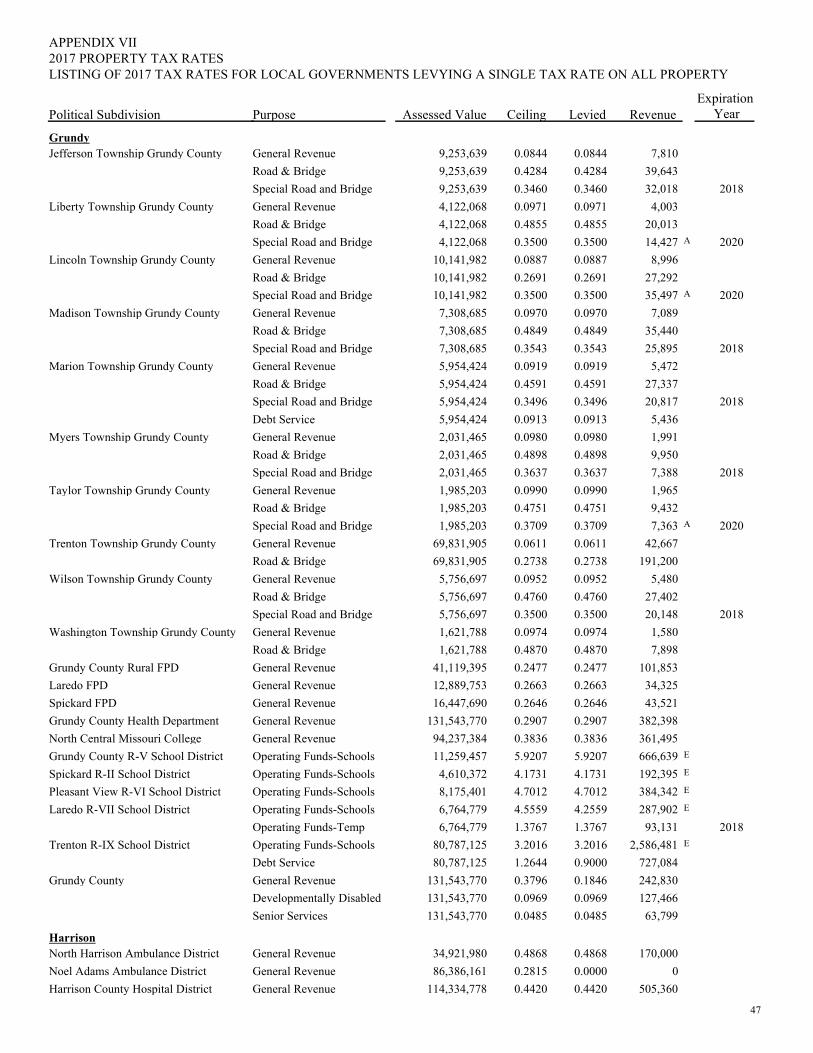
PurposePolitical Subdivision
2017 PROPERTY TAX RATESAPPENDIX VII
Assessed Value Ceiling Levied RevenueExpiration
Year
LISTING OF 2017 TAX RATES FOR LOCAL GOVERNMENTS LEVYING A SINGLE TAX RATE ON ALL PROPERTY
GrundyJefferson Township Grundy County General Revenue 0.08440.08449,253,639 7,810
Road & Bridge 0.42840.42849,253,639 39,643Special Road and Bridge 0.34600.34609,253,639 32,018 2018
Liberty Township Grundy County General Revenue 0.09710.09714,122,068 4,003Road & Bridge 0.48550.48554,122,068 20,013Special Road and Bridge 0.35000.35004,122,068 A14,427 2020
Lincoln Township Grundy County General Revenue 0.08870.088710,141,982 8,996Road & Bridge 0.26910.269110,141,982 27,292Special Road and Bridge 0.35000.350010,141,982 A35,497 2020
Madison Township Grundy County General Revenue 0.09700.09707,308,685 7,089Road & Bridge 0.48490.48497,308,685 35,440Special Road and Bridge 0.35430.35437,308,685 25,895 2018
Marion Township Grundy County General Revenue 0.09190.09195,954,424 5,472Road & Bridge 0.45910.45915,954,424 27,337Special Road and Bridge 0.34960.34965,954,424 20,817 2018Debt Service 0.09130.09135,954,424 5,436
Myers Township Grundy County General Revenue 0.09800.09802,031,465 1,991Road & Bridge 0.48980.48982,031,465 9,950Special Road and Bridge 0.36370.36372,031,465 7,388 2018
Taylor Township Grundy County General Revenue 0.09900.09901,985,203 1,965Road & Bridge 0.47510.47511,985,203 9,432Special Road and Bridge 0.37090.37091,985,203 A7,363 2020
Trenton Township Grundy County General Revenue 0.06110.061169,831,905 42,667Road & Bridge 0.27380.273869,831,905 191,200
Wilson Township Grundy County General Revenue 0.09520.09525,756,697 5,480Road & Bridge 0.47600.47605,756,697 27,402Special Road and Bridge 0.35000.35005,756,697 20,148 2018
Washington Township Grundy County General Revenue 0.09740.09741,621,788 1,580Road & Bridge 0.48700.48701,621,788 7,898
Grundy County Rural FPD General Revenue 0.24770.247741,119,395 101,853Laredo FPD General Revenue 0.26630.266312,889,753 34,325Spickard FPD General Revenue 0.26460.264616,447,690 43,521Grundy County Health Department General Revenue 0.29070.2907131,543,770 382,398North Central Missouri College General Revenue 0.38360.383694,237,384 361,495Grundy County R-V School District Operating Funds-Schools 5.92075.920711,259,457 E666,639Spickard R-II School District Operating Funds-Schools 4.17314.17314,610,372 E192,395Pleasant View R-VI School District Operating Funds-Schools 4.70124.70128,175,401 E384,342Laredo R-VII School District Operating Funds-Schools 4.25594.55596,764,779 E287,902
Operating Funds-Temp 1.37671.37676,764,779 93,131 2018Trenton R-IX School District Operating Funds-Schools 3.20163.201680,787,125 E2,586,481
Debt Service 0.90001.264480,787,125 727,084Grundy County General Revenue 0.18460.3796131,543,770 242,830
Developmentally Disabled 0.09690.0969131,543,770 127,466Senior Services 0.04850.0485131,543,770 63,799
HarrisonNorth Harrison Ambulance District General Revenue 0.48680.486834,921,980 170,000Noel Adams Ambulance District General Revenue 0.00000.281586,386,161 0Harrison County Hospital District General Revenue 0.44200.4420114,334,778 505,360
47
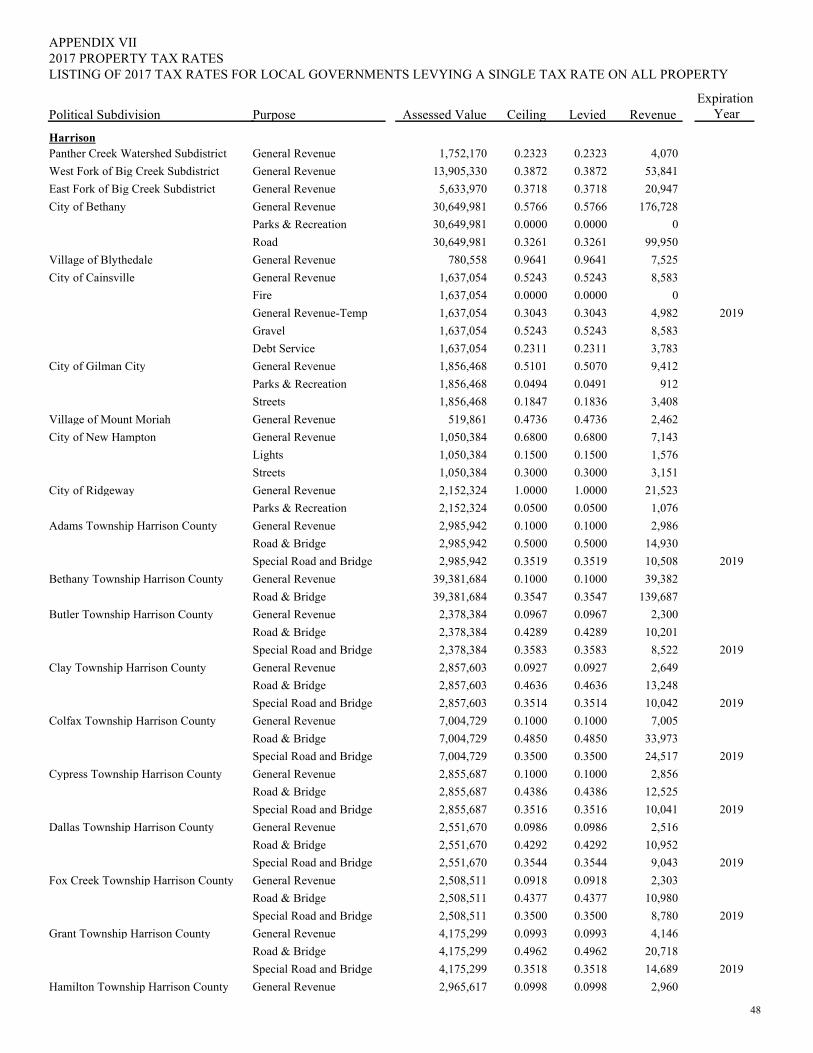
PurposePolitical Subdivision
2017 PROPERTY TAX RATESAPPENDIX VII
Assessed Value Ceiling Levied RevenueExpiration
Year
LISTING OF 2017 TAX RATES FOR LOCAL GOVERNMENTS LEVYING A SINGLE TAX RATE ON ALL PROPERTY
HarrisonPanther Creek Watershed Subdistrict General Revenue 0.23230.23231,752,170 4,070West Fork of Big Creek Subdistrict General Revenue 0.38720.387213,905,330 53,841East Fork of Big Creek Subdistrict General Revenue 0.37180.37185,633,970 20,947City of Bethany General Revenue 0.57660.576630,649,981 176,728
Parks & Recreation 0.00000.000030,649,981 0Road 0.32610.326130,649,981 99,950
Village of Blythedale General Revenue 0.96410.9641780,558 7,525City of Cainsville General Revenue 0.52430.52431,637,054 8,583
Fire 0.00000.00001,637,054 0General Revenue-Temp 0.30430.30431,637,054 4,982 2019Gravel 0.52430.52431,637,054 8,583Debt Service 0.23110.23111,637,054 3,783
City of Gilman City General Revenue 0.50700.51011,856,468 9,412Parks & Recreation 0.04910.04941,856,468 912Streets 0.18360.18471,856,468 3,408
Village of Mount Moriah General Revenue 0.47360.4736519,861 2,462City of New Hampton General Revenue 0.68000.68001,050,384 7,143
Lights 0.15000.15001,050,384 1,576Streets 0.30000.30001,050,384 3,151
City of Ridgeway General Revenue 1.00001.00002,152,324 21,523Parks & Recreation 0.05000.05002,152,324 1,076
Adams Township Harrison County General Revenue 0.10000.10002,985,942 2,986Road & Bridge 0.50000.50002,985,942 14,930Special Road and Bridge 0.35190.35192,985,942 10,508 2019
Bethany Township Harrison County General Revenue 0.10000.100039,381,684 39,382Road & Bridge 0.35470.354739,381,684 139,687
Butler Township Harrison County General Revenue 0.09670.09672,378,384 2,300Road & Bridge 0.42890.42892,378,384 10,201Special Road and Bridge 0.35830.35832,378,384 8,522 2019
Clay Township Harrison County General Revenue 0.09270.09272,857,603 2,649Road & Bridge 0.46360.46362,857,603 13,248Special Road and Bridge 0.35140.35142,857,603 10,042 2019
Colfax Township Harrison County General Revenue 0.10000.10007,004,729 7,005Road & Bridge 0.48500.48507,004,729 33,973Special Road and Bridge 0.35000.35007,004,729 24,517 2019
Cypress Township Harrison County General Revenue 0.10000.10002,855,687 2,856Road & Bridge 0.43860.43862,855,687 12,525Special Road and Bridge 0.35160.35162,855,687 10,041 2019
Dallas Township Harrison County General Revenue 0.09860.09862,551,670 2,516Road & Bridge 0.42920.42922,551,670 10,952Special Road and Bridge 0.35440.35442,551,670 9,043 2019
Fox Creek Township Harrison County General Revenue 0.09180.09182,508,511 2,303Road & Bridge 0.43770.43772,508,511 10,980Special Road and Bridge 0.35000.35002,508,511 8,780 2019
Grant Township Harrison County General Revenue 0.09930.09934,175,299 4,146Road & Bridge 0.49620.49624,175,299 20,718Special Road and Bridge 0.35180.35184,175,299 14,689 2019
Hamilton Township Harrison County General Revenue 0.09980.09982,965,617 2,960
48
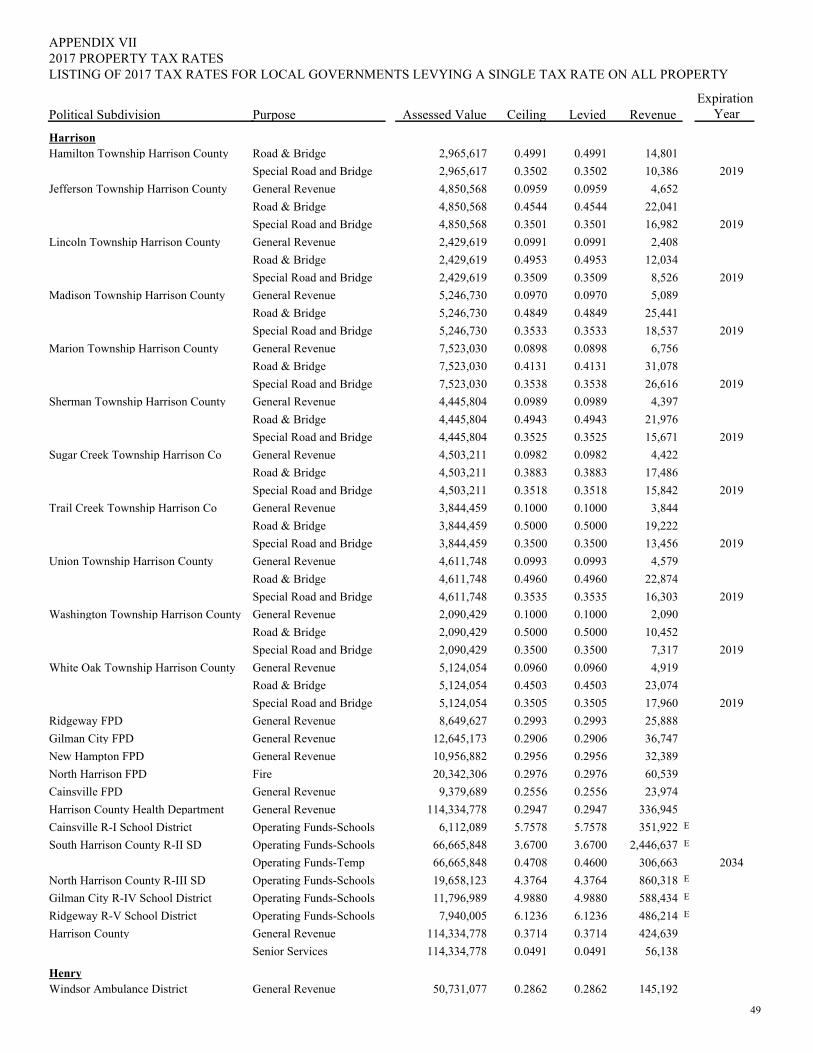
PurposePolitical Subdivision
2017 PROPERTY TAX RATESAPPENDIX VII
Assessed Value Ceiling Levied RevenueExpiration
Year
LISTING OF 2017 TAX RATES FOR LOCAL GOVERNMENTS LEVYING A SINGLE TAX RATE ON ALL PROPERTY
HarrisonHamilton Township Harrison County Road & Bridge 0.49910.49912,965,617 14,801
Special Road and Bridge 0.35020.35022,965,617 10,386 2019Jefferson Township Harrison County General Revenue 0.09590.09594,850,568 4,652
Road & Bridge 0.45440.45444,850,568 22,041Special Road and Bridge 0.35010.35014,850,568 16,982 2019
Lincoln Township Harrison County General Revenue 0.09910.09912,429,619 2,408Road & Bridge 0.49530.49532,429,619 12,034Special Road and Bridge 0.35090.35092,429,619 8,526 2019
Madison Township Harrison County General Revenue 0.09700.09705,246,730 5,089Road & Bridge 0.48490.48495,246,730 25,441Special Road and Bridge 0.35330.35335,246,730 18,537 2019
Marion Township Harrison County General Revenue 0.08980.08987,523,030 6,756Road & Bridge 0.41310.41317,523,030 31,078Special Road and Bridge 0.35380.35387,523,030 26,616 2019
Sherman Township Harrison County General Revenue 0.09890.09894,445,804 4,397Road & Bridge 0.49430.49434,445,804 21,976Special Road and Bridge 0.35250.35254,445,804 15,671 2019
Sugar Creek Township Harrison Co General Revenue 0.09820.09824,503,211 4,422Road & Bridge 0.38830.38834,503,211 17,486Special Road and Bridge 0.35180.35184,503,211 15,842 2019
Trail Creek Township Harrison Co General Revenue 0.10000.10003,844,459 3,844Road & Bridge 0.50000.50003,844,459 19,222Special Road and Bridge 0.35000.35003,844,459 13,456 2019
Union Township Harrison County General Revenue 0.09930.09934,611,748 4,579Road & Bridge 0.49600.49604,611,748 22,874Special Road and Bridge 0.35350.35354,611,748 16,303 2019
Washington Township Harrison County General Revenue 0.10000.10002,090,429 2,090Road & Bridge 0.50000.50002,090,429 10,452Special Road and Bridge 0.35000.35002,090,429 7,317 2019
White Oak Township Harrison County General Revenue 0.09600.09605,124,054 4,919Road & Bridge 0.45030.45035,124,054 23,074Special Road and Bridge 0.35050.35055,124,054 17,960 2019
Ridgeway FPD General Revenue 0.29930.29938,649,627 25,888Gilman City FPD General Revenue 0.29060.290612,645,173 36,747New Hampton FPD General Revenue 0.29560.295610,956,882 32,389North Harrison FPD Fire 0.29760.297620,342,306 60,539Cainsville FPD General Revenue 0.25560.25569,379,689 23,974Harrison County Health Department General Revenue 0.29470.2947114,334,778 336,945Cainsville R-I School District Operating Funds-Schools 5.75785.75786,112,089 E351,922South Harrison County R-II SD Operating Funds-Schools 3.67003.670066,665,848 E2,446,637
Operating Funds-Temp 0.46000.470866,665,848 306,663 2034North Harrison County R-III SD Operating Funds-Schools 4.37644.376419,658,123 E860,318Gilman City R-IV School District Operating Funds-Schools 4.98804.988011,796,989 E588,434Ridgeway R-V School District Operating Funds-Schools 6.12366.12367,940,005 E486,214Harrison County General Revenue 0.37140.3714114,334,778 424,639
Senior Services 0.04910.0491114,334,778 56,138
HenryWindsor Ambulance District General Revenue 0.28620.286250,731,077 145,192
49
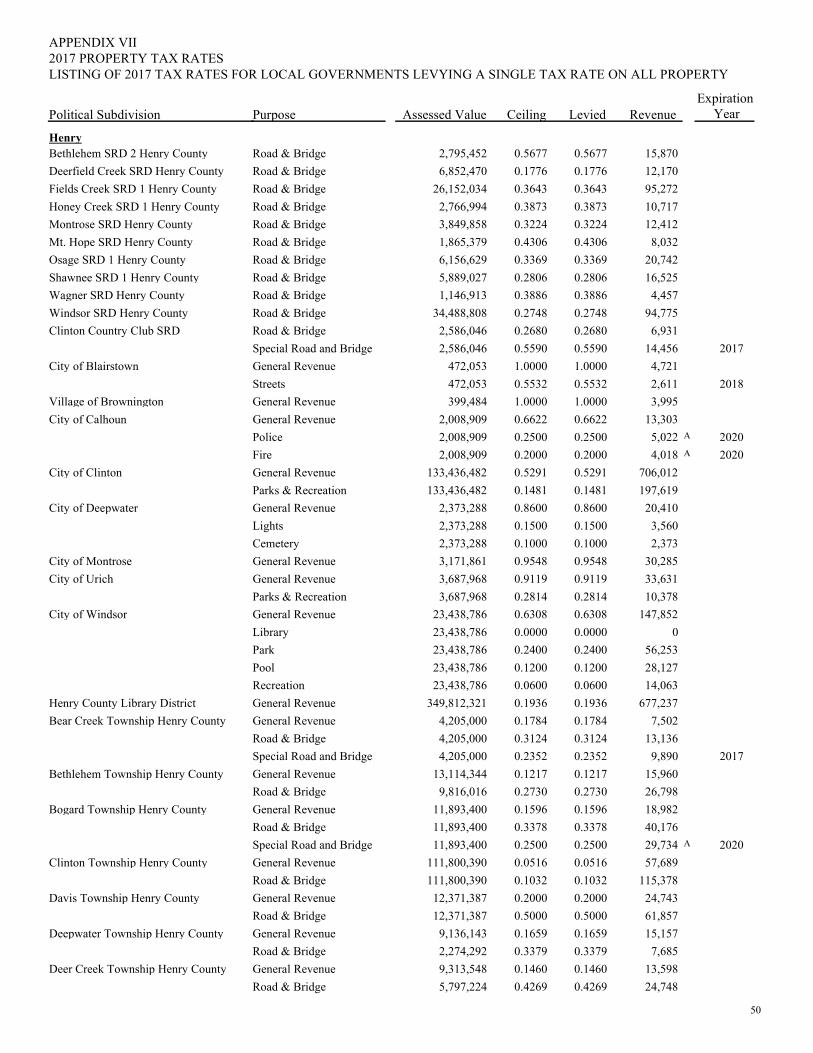
PurposePolitical Subdivision
2017 PROPERTY TAX RATESAPPENDIX VII
Assessed Value Ceiling Levied RevenueExpiration
Year
LISTING OF 2017 TAX RATES FOR LOCAL GOVERNMENTS LEVYING A SINGLE TAX RATE ON ALL PROPERTY
HenryBethlehem SRD 2 Henry County Road & Bridge 0.56770.56772,795,452 15,870Deerfield Creek SRD Henry County Road & Bridge 0.17760.17766,852,470 12,170Fields Creek SRD 1 Henry County Road & Bridge 0.36430.364326,152,034 95,272Honey Creek SRD 1 Henry County Road & Bridge 0.38730.38732,766,994 10,717Montrose SRD Henry County Road & Bridge 0.32240.32243,849,858 12,412Mt. Hope SRD Henry County Road & Bridge 0.43060.43061,865,379 8,032Osage SRD 1 Henry County Road & Bridge 0.33690.33696,156,629 20,742Shawnee SRD 1 Henry County Road & Bridge 0.28060.28065,889,027 16,525Wagner SRD Henry County Road & Bridge 0.38860.38861,146,913 4,457Windsor SRD Henry County Road & Bridge 0.27480.274834,488,808 94,775Clinton Country Club SRD Road & Bridge 0.26800.26802,586,046 6,931
Special Road and Bridge 0.55900.55902,586,046 14,456 2017City of Blairstown General Revenue 1.00001.0000472,053 4,721
Streets 0.55320.5532472,053 2,611 2018Village of Brownington General Revenue 1.00001.0000399,484 3,995City of Calhoun General Revenue 0.66220.66222,008,909 13,303
Police 0.25000.25002,008,909 A5,022 2020Fire 0.20000.20002,008,909 A4,018 2020
City of Clinton General Revenue 0.52910.5291133,436,482 706,012Parks & Recreation 0.14810.1481133,436,482 197,619
City of Deepwater General Revenue 0.86000.86002,373,288 20,410Lights 0.15000.15002,373,288 3,560Cemetery 0.10000.10002,373,288 2,373
City of Montrose General Revenue 0.95480.95483,171,861 30,285City of Urich General Revenue 0.91190.91193,687,968 33,631
Parks & Recreation 0.28140.28143,687,968 10,378City of Windsor General Revenue 0.63080.630823,438,786 147,852
Library 0.00000.000023,438,786 0Park 0.24000.240023,438,786 56,253Pool 0.12000.120023,438,786 28,127Recreation 0.06000.060023,438,786 14,063
Henry County Library District General Revenue 0.19360.1936349,812,321 677,237Bear Creek Township Henry County General Revenue 0.17840.17844,205,000 7,502
Road & Bridge 0.31240.31244,205,000 13,136Special Road and Bridge 0.23520.23524,205,000 9,890 2017
Bethlehem Township Henry County General Revenue 0.12170.121713,114,344 15,960Road & Bridge 0.27300.27309,816,016 26,798
Bogard Township Henry County General Revenue 0.15960.159611,893,400 18,982Road & Bridge 0.33780.337811,893,400 40,176Special Road and Bridge 0.25000.250011,893,400 A29,734 2020
Clinton Township Henry County General Revenue 0.05160.0516111,800,390 57,689Road & Bridge 0.10320.1032111,800,390 115,378
Davis Township Henry County General Revenue 0.20000.200012,371,387 24,743Road & Bridge 0.50000.500012,371,387 61,857
Deepwater Township Henry County General Revenue 0.16590.16599,136,143 15,157Road & Bridge 0.33790.33792,274,292 7,685
Deer Creek Township Henry County General Revenue 0.14600.14609,313,548 13,598Road & Bridge 0.42690.42695,797,224 24,748
50
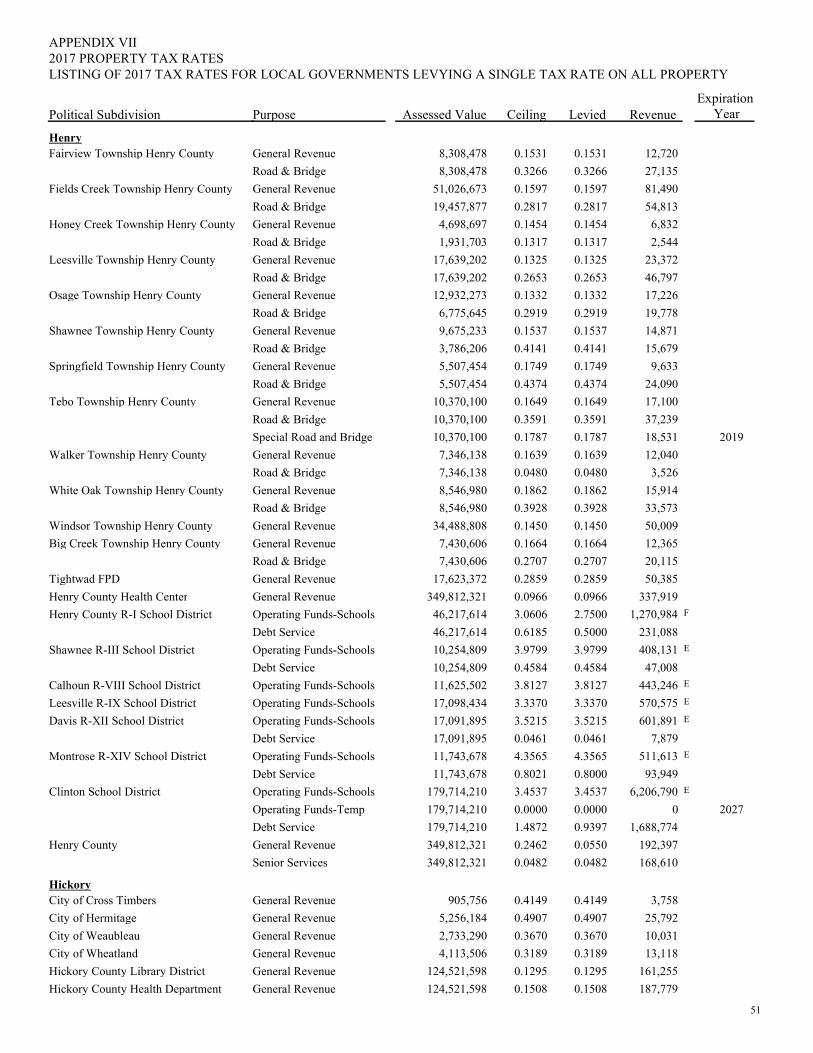
PurposePolitical Subdivision
2017 PROPERTY TAX RATESAPPENDIX VII
Assessed Value Ceiling Levied RevenueExpiration
Year
LISTING OF 2017 TAX RATES FOR LOCAL GOVERNMENTS LEVYING A SINGLE TAX RATE ON ALL PROPERTY
HenryFairview Township Henry County General Revenue 0.15310.15318,308,478 12,720
Road & Bridge 0.32660.32668,308,478 27,135Fields Creek Township Henry County General Revenue 0.15970.159751,026,673 81,490
Road & Bridge 0.28170.281719,457,877 54,813Honey Creek Township Henry County General Revenue 0.14540.14544,698,697 6,832
Road & Bridge 0.13170.13171,931,703 2,544Leesville Township Henry County General Revenue 0.13250.132517,639,202 23,372
Road & Bridge 0.26530.265317,639,202 46,797Osage Township Henry County General Revenue 0.13320.133212,932,273 17,226
Road & Bridge 0.29190.29196,775,645 19,778Shawnee Township Henry County General Revenue 0.15370.15379,675,233 14,871
Road & Bridge 0.41410.41413,786,206 15,679Springfield Township Henry County General Revenue 0.17490.17495,507,454 9,633
Road & Bridge 0.43740.43745,507,454 24,090Tebo Township Henry County General Revenue 0.16490.164910,370,100 17,100
Road & Bridge 0.35910.359110,370,100 37,239Special Road and Bridge 0.17870.178710,370,100 18,531 2019
Walker Township Henry County General Revenue 0.16390.16397,346,138 12,040Road & Bridge 0.04800.04807,346,138 3,526
White Oak Township Henry County General Revenue 0.18620.18628,546,980 15,914Road & Bridge 0.39280.39288,546,980 33,573
Windsor Township Henry County General Revenue 0.14500.145034,488,808 50,009Big Creek Township Henry County General Revenue 0.16640.16647,430,606 12,365
Road & Bridge 0.27070.27077,430,606 20,115Tightwad FPD General Revenue 0.28590.285917,623,372 50,385Henry County Health Center General Revenue 0.09660.0966349,812,321 337,919Henry County R-I School District Operating Funds-Schools 2.75003.060646,217,614 F1,270,984
Debt Service 0.50000.618546,217,614 231,088Shawnee R-III School District Operating Funds-Schools 3.97993.979910,254,809 E408,131
Debt Service 0.45840.458410,254,809 47,008Calhoun R-VIII School District Operating Funds-Schools 3.81273.812711,625,502 E443,246Leesville R-IX School District Operating Funds-Schools 3.33703.337017,098,434 E570,575Davis R-XII School District Operating Funds-Schools 3.52153.521517,091,895 E601,891
Debt Service 0.04610.046117,091,895 7,879Montrose R-XIV School District Operating Funds-Schools 4.35654.356511,743,678 E511,613
Debt Service 0.80000.802111,743,678 93,949Clinton School District Operating Funds-Schools 3.45373.4537179,714,210 E6,206,790
Operating Funds-Temp 0.00000.0000179,714,210 0 2027Debt Service 0.93971.4872179,714,210 1,688,774
Henry County General Revenue 0.05500.2462349,812,321 192,397Senior Services 0.04820.0482349,812,321 168,610
HickoryCity of Cross Timbers General Revenue 0.41490.4149905,756 3,758City of Hermitage General Revenue 0.49070.49075,256,184 25,792City of Weaubleau General Revenue 0.36700.36702,733,290 10,031City of Wheatland General Revenue 0.31890.31894,113,506 13,118Hickory County Library District General Revenue 0.12950.1295124,521,598 161,255Hickory County Health Department General Revenue 0.15080.1508124,521,598 187,779
51
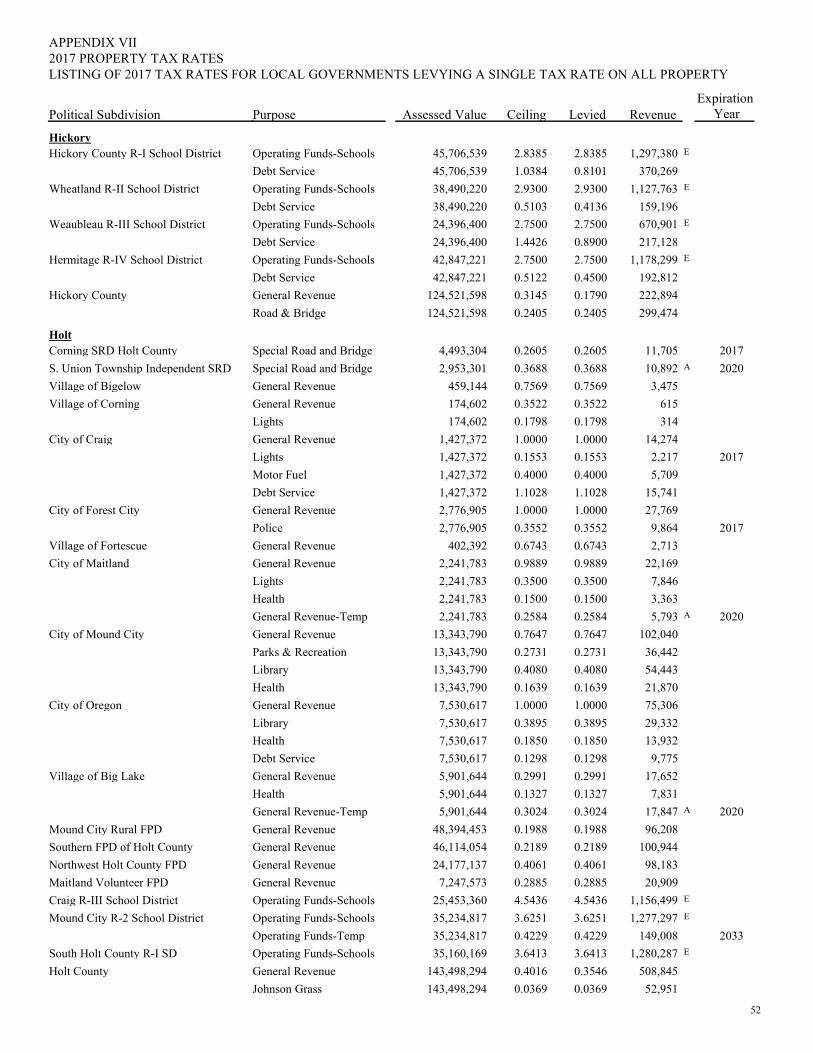
PurposePolitical Subdivision
2017 PROPERTY TAX RATESAPPENDIX VII
Assessed Value Ceiling Levied RevenueExpiration
Year
LISTING OF 2017 TAX RATES FOR LOCAL GOVERNMENTS LEVYING A SINGLE TAX RATE ON ALL PROPERTY
HickoryHickory County R-I School District Operating Funds-Schools 2.83852.838545,706,539 E1,297,380
Debt Service 0.81011.038445,706,539 370,269Wheatland R-II School District Operating Funds-Schools 2.93002.930038,490,220 E1,127,763
Debt Service 0.41360.510338,490,220 159,196Weaubleau R-III School District Operating Funds-Schools 2.75002.750024,396,400 E670,901
Debt Service 0.89001.442624,396,400 217,128Hermitage R-IV School District Operating Funds-Schools 2.75002.750042,847,221 E1,178,299
Debt Service 0.45000.512242,847,221 192,812Hickory County General Revenue 0.17900.3145124,521,598 222,894
Road & Bridge 0.24050.2405124,521,598 299,474
HoltCorning SRD Holt County Special Road and Bridge 0.26050.26054,493,304 11,705 2017S. Union Township Independent SRD Special Road and Bridge 0.36880.36882,953,301 A10,892 2020Village of Bigelow General Revenue 0.75690.7569459,144 3,475Village of Corning General Revenue 0.35220.3522174,602 615
Lights 0.17980.1798174,602 314City of Craig General Revenue 1.00001.00001,427,372 14,274
Lights 0.15530.15531,427,372 2,217 2017Motor Fuel 0.40000.40001,427,372 5,709Debt Service 1.10281.10281,427,372 15,741
City of Forest City General Revenue 1.00001.00002,776,905 27,769Police 0.35520.35522,776,905 9,864 2017
Village of Fortescue General Revenue 0.67430.6743402,392 2,713City of Maitland General Revenue 0.98890.98892,241,783 22,169
Lights 0.35000.35002,241,783 7,846Health 0.15000.15002,241,783 3,363General Revenue-Temp 0.25840.25842,241,783 A5,793 2020
City of Mound City General Revenue 0.76470.764713,343,790 102,040Parks & Recreation 0.27310.273113,343,790 36,442Library 0.40800.408013,343,790 54,443Health 0.16390.163913,343,790 21,870
City of Oregon General Revenue 1.00001.00007,530,617 75,306Library 0.38950.38957,530,617 29,332Health 0.18500.18507,530,617 13,932Debt Service 0.12980.12987,530,617 9,775
Village of Big Lake General Revenue 0.29910.29915,901,644 17,652Health 0.13270.13275,901,644 7,831General Revenue-Temp 0.30240.30245,901,644 A17,847 2020
Mound City Rural FPD General Revenue 0.19880.198848,394,453 96,208Southern FPD of Holt County General Revenue 0.21890.218946,114,054 100,944Northwest Holt County FPD General Revenue 0.40610.406124,177,137 98,183Maitland Volunteer FPD General Revenue 0.28850.28857,247,573 20,909Craig R-III School District Operating Funds-Schools 4.54364.543625,453,360 E1,156,499Mound City R-2 School District Operating Funds-Schools 3.62513.625135,234,817 E1,277,297
Operating Funds-Temp 0.42290.422935,234,817 149,008 2033South Holt County R-I SD Operating Funds-Schools 3.64133.641335,160,169 E1,280,287Holt County General Revenue 0.35460.4016143,498,294 508,845
Johnson Grass 0.03690.0369143,498,294 52,951
52
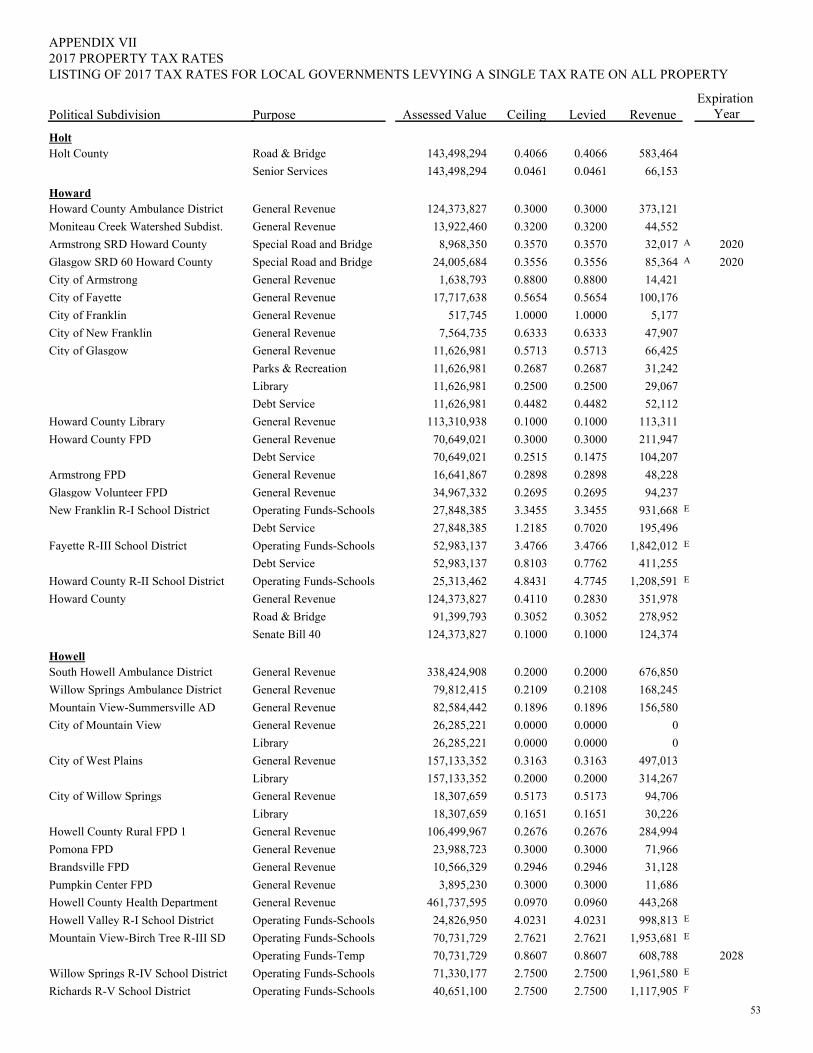
PurposePolitical Subdivision
2017 PROPERTY TAX RATESAPPENDIX VII
Assessed Value Ceiling Levied RevenueExpiration
Year
LISTING OF 2017 TAX RATES FOR LOCAL GOVERNMENTS LEVYING A SINGLE TAX RATE ON ALL PROPERTY
HoltHolt County Road & Bridge 0.40660.4066143,498,294 583,464
Senior Services 0.04610.0461143,498,294 66,153
HowardHoward County Ambulance District General Revenue 0.30000.3000124,373,827 373,121Moniteau Creek Watershed Subdist. General Revenue 0.32000.320013,922,460 44,552Armstrong SRD Howard County Special Road and Bridge 0.35700.35708,968,350 A32,017 2020Glasgow SRD 60 Howard County Special Road and Bridge 0.35560.355624,005,684 A85,364 2020City of Armstrong General Revenue 0.88000.88001,638,793 14,421City of Fayette General Revenue 0.56540.565417,717,638 100,176City of Franklin General Revenue 1.00001.0000517,745 5,177City of New Franklin General Revenue 0.63330.63337,564,735 47,907City of Glasgow General Revenue 0.57130.571311,626,981 66,425
Parks & Recreation 0.26870.268711,626,981 31,242Library 0.25000.250011,626,981 29,067Debt Service 0.44820.448211,626,981 52,112
Howard County Library General Revenue 0.10000.1000113,310,938 113,311Howard County FPD General Revenue 0.30000.300070,649,021 211,947
Debt Service 0.14750.251570,649,021 104,207Armstrong FPD General Revenue 0.28980.289816,641,867 48,228Glasgow Volunteer FPD General Revenue 0.26950.269534,967,332 94,237New Franklin R-I School District Operating Funds-Schools 3.34553.345527,848,385 E931,668
Debt Service 0.70201.218527,848,385 195,496Fayette R-III School District Operating Funds-Schools 3.47663.476652,983,137 E1,842,012
Debt Service 0.77620.810352,983,137 411,255Howard County R-II School District Operating Funds-Schools 4.77454.843125,313,462 E1,208,591Howard County General Revenue 0.28300.4110124,373,827 351,978
Road & Bridge 0.30520.305291,399,793 278,952Senate Bill 40 0.10000.1000124,373,827 124,374
HowellSouth Howell Ambulance District General Revenue 0.20000.2000338,424,908 676,850Willow Springs Ambulance District General Revenue 0.21080.210979,812,415 168,245Mountain View-Summersville AD General Revenue 0.18960.189682,584,442 156,580City of Mountain View General Revenue 0.00000.000026,285,221 0
Library 0.00000.000026,285,221 0City of West Plains General Revenue 0.31630.3163157,133,352 497,013
Library 0.20000.2000157,133,352 314,267City of Willow Springs General Revenue 0.51730.517318,307,659 94,706
Library 0.16510.165118,307,659 30,226Howell County Rural FPD 1 General Revenue 0.26760.2676106,499,967 284,994Pomona FPD General Revenue 0.30000.300023,988,723 71,966Brandsville FPD General Revenue 0.29460.294610,566,329 31,128Pumpkin Center FPD General Revenue 0.30000.30003,895,230 11,686Howell County Health Department General Revenue 0.09600.0970461,737,595 443,268Howell Valley R-I School District Operating Funds-Schools 4.02314.023124,826,950 E998,813Mountain View-Birch Tree R-III SD Operating Funds-Schools 2.76212.762170,731,729 E1,953,681
Operating Funds-Temp 0.86070.860770,731,729 608,788 2028Willow Springs R-IV School District Operating Funds-Schools 2.75002.750071,330,177 E1,961,580Richards R-V School District Operating Funds-Schools 2.75002.750040,651,100 F1,117,905
53
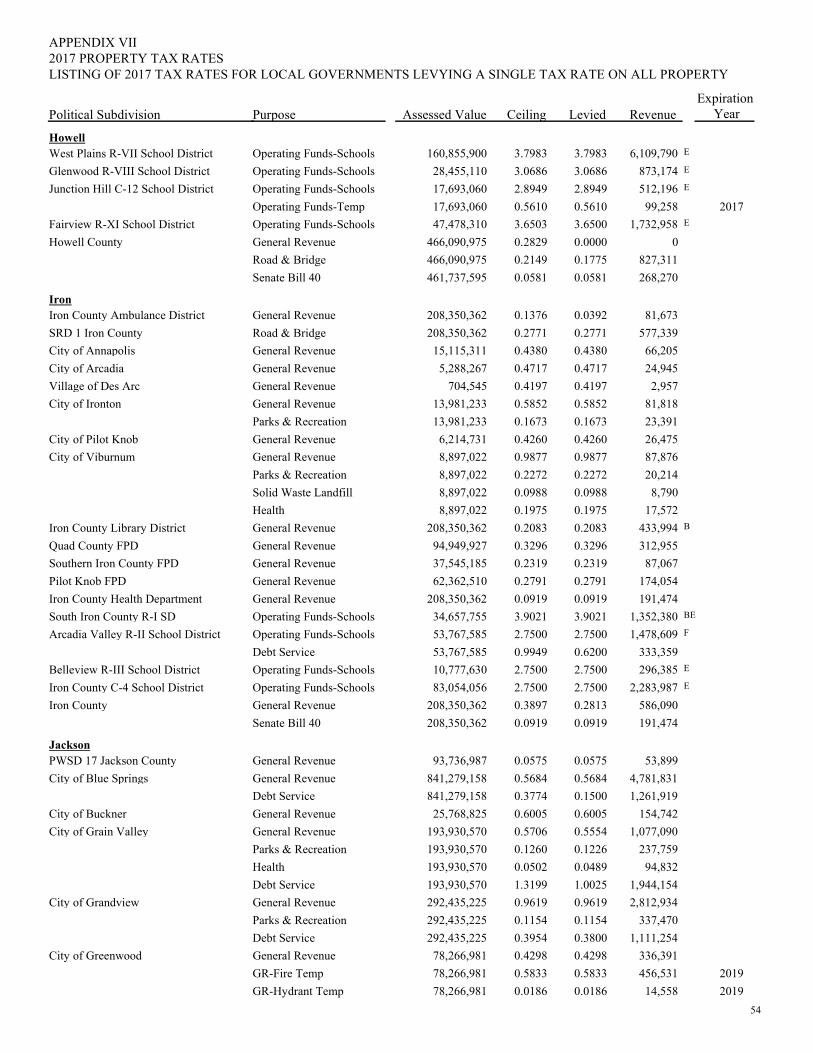
PurposePolitical Subdivision
2017 PROPERTY TAX RATESAPPENDIX VII
Assessed Value Ceiling Levied RevenueExpiration
Year
LISTING OF 2017 TAX RATES FOR LOCAL GOVERNMENTS LEVYING A SINGLE TAX RATE ON ALL PROPERTY
HowellWest Plains R-VII School District Operating Funds-Schools 3.79833.7983160,855,900 E6,109,790Glenwood R-VIII School District Operating Funds-Schools 3.06863.068628,455,110 E873,174Junction Hill C-12 School District Operating Funds-Schools 2.89492.894917,693,060 E512,196
Operating Funds-Temp 0.56100.561017,693,060 99,258 2017Fairview R-XI School District Operating Funds-Schools 3.65003.650347,478,310 E1,732,958Howell County General Revenue 0.00000.2829466,090,975 0
Road & Bridge 0.17750.2149466,090,975 827,311Senate Bill 40 0.05810.0581461,737,595 268,270
IronIron County Ambulance District General Revenue 0.03920.1376208,350,362 81,673SRD 1 Iron County Road & Bridge 0.27710.2771208,350,362 577,339City of Annapolis General Revenue 0.43800.438015,115,311 66,205City of Arcadia General Revenue 0.47170.47175,288,267 24,945Village of Des Arc General Revenue 0.41970.4197704,545 2,957City of Ironton General Revenue 0.58520.585213,981,233 81,818
Parks & Recreation 0.16730.167313,981,233 23,391City of Pilot Knob General Revenue 0.42600.42606,214,731 26,475City of Viburnum General Revenue 0.98770.98778,897,022 87,876
Parks & Recreation 0.22720.22728,897,022 20,214Solid Waste Landfill 0.09880.09888,897,022 8,790Health 0.19750.19758,897,022 17,572
Iron County Library District General Revenue 0.20830.2083208,350,362 B433,994Quad County FPD General Revenue 0.32960.329694,949,927 312,955Southern Iron County FPD General Revenue 0.23190.231937,545,185 87,067Pilot Knob FPD General Revenue 0.27910.279162,362,510 174,054Iron County Health Department General Revenue 0.09190.0919208,350,362 191,474South Iron County R-I SD Operating Funds-Schools 3.90213.902134,657,755 BE1,352,380Arcadia Valley R-II School District Operating Funds-Schools 2.75002.750053,767,585 F1,478,609
Debt Service 0.62000.994953,767,585 333,359Belleview R-III School District Operating Funds-Schools 2.75002.750010,777,630 E296,385Iron County C-4 School District Operating Funds-Schools 2.75002.750083,054,056 E2,283,987Iron County General Revenue 0.28130.3897208,350,362 586,090
Senate Bill 40 0.09190.0919208,350,362 191,474
JacksonPWSD 17 Jackson County General Revenue 0.05750.057593,736,987 53,899City of Blue Springs General Revenue 0.56840.5684841,279,158 4,781,831
Debt Service 0.15000.3774841,279,158 1,261,919City of Buckner General Revenue 0.60050.600525,768,825 154,742City of Grain Valley General Revenue 0.55540.5706193,930,570 1,077,090
Parks & Recreation 0.12260.1260193,930,570 237,759Health 0.04890.0502193,930,570 94,832Debt Service 1.00251.3199193,930,570 1,944,154
City of Grandview General Revenue 0.96190.9619292,435,225 2,812,934Parks & Recreation 0.11540.1154292,435,225 337,470Debt Service 0.38000.3954292,435,225 1,111,254
City of Greenwood General Revenue 0.42980.429878,266,981 336,391GR-Fire Temp 0.58330.583378,266,981 456,531 2019GR-Hydrant Temp 0.01860.018678,266,981 14,558 2019
54
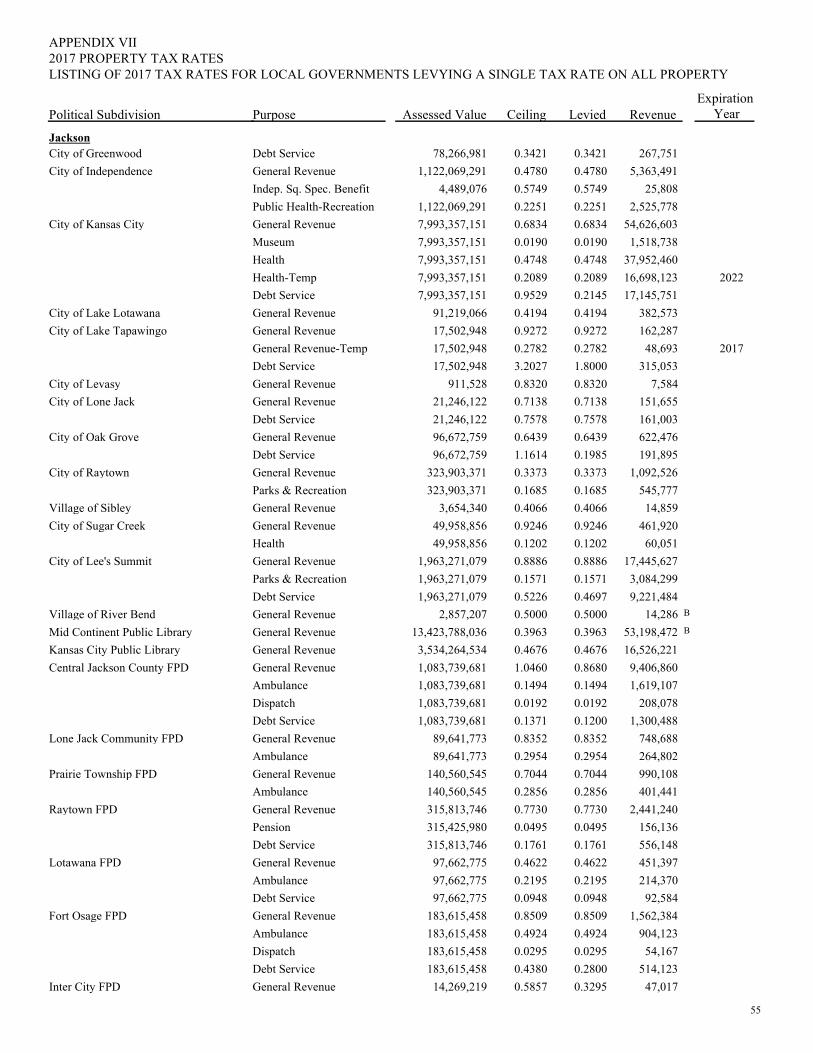
PurposePolitical Subdivision
2017 PROPERTY TAX RATESAPPENDIX VII
Assessed Value Ceiling Levied RevenueExpiration
Year
LISTING OF 2017 TAX RATES FOR LOCAL GOVERNMENTS LEVYING A SINGLE TAX RATE ON ALL PROPERTY
JacksonCity of Greenwood Debt Service 0.34210.342178,266,981 267,751City of Independence General Revenue 0.47800.47801,122,069,291 5,363,491
Indep. Sq. Spec. Benefit 0.57490.57494,489,076 25,808Public Health-Recreation 0.22510.22511,122,069,291 2,525,778
City of Kansas City General Revenue 0.68340.68347,993,357,151 54,626,603Museum 0.01900.01907,993,357,151 1,518,738Health 0.47480.47487,993,357,151 37,952,460Health-Temp 0.20890.20897,993,357,151 16,698,123 2022Debt Service 0.21450.95297,993,357,151 17,145,751
City of Lake Lotawana General Revenue 0.41940.419491,219,066 382,573City of Lake Tapawingo General Revenue 0.92720.927217,502,948 162,287
General Revenue-Temp 0.27820.278217,502,948 48,693 2017Debt Service 1.80003.202717,502,948 315,053
City of Levasy General Revenue 0.83200.8320911,528 7,584City of Lone Jack General Revenue 0.71380.713821,246,122 151,655
Debt Service 0.75780.757821,246,122 161,003City of Oak Grove General Revenue 0.64390.643996,672,759 622,476
Debt Service 0.19851.161496,672,759 191,895City of Raytown General Revenue 0.33730.3373323,903,371 1,092,526
Parks & Recreation 0.16850.1685323,903,371 545,777Village of Sibley General Revenue 0.40660.40663,654,340 14,859City of Sugar Creek General Revenue 0.92460.924649,958,856 461,920
Health 0.12020.120249,958,856 60,051City of Lee's Summit General Revenue 0.88860.88861,963,271,079 17,445,627
Parks & Recreation 0.15710.15711,963,271,079 3,084,299Debt Service 0.46970.52261,963,271,079 9,221,484
Village of River Bend General Revenue 0.50000.50002,857,207 B14,286Mid Continent Public Library General Revenue 0.39630.396313,423,788,036 B53,198,472Kansas City Public Library General Revenue 0.46760.46763,534,264,534 16,526,221Central Jackson County FPD General Revenue 0.86801.04601,083,739,681 9,406,860
Ambulance 0.14940.14941,083,739,681 1,619,107Dispatch 0.01920.01921,083,739,681 208,078Debt Service 0.12000.13711,083,739,681 1,300,488
Lone Jack Community FPD General Revenue 0.83520.835289,641,773 748,688Ambulance 0.29540.295489,641,773 264,802
Prairie Township FPD General Revenue 0.70440.7044140,560,545 990,108Ambulance 0.28560.2856140,560,545 401,441
Raytown FPD General Revenue 0.77300.7730315,813,746 2,441,240Pension 0.04950.0495315,425,980 156,136Debt Service 0.17610.1761315,813,746 556,148
Lotawana FPD General Revenue 0.46220.462297,662,775 451,397Ambulance 0.21950.219597,662,775 214,370Debt Service 0.09480.094897,662,775 92,584
Fort Osage FPD General Revenue 0.85090.8509183,615,458 1,562,384Ambulance 0.49240.4924183,615,458 904,123Dispatch 0.02950.0295183,615,458 54,167Debt Service 0.28000.4380183,615,458 514,123
Inter City FPD General Revenue 0.32950.585714,269,219 47,017
55
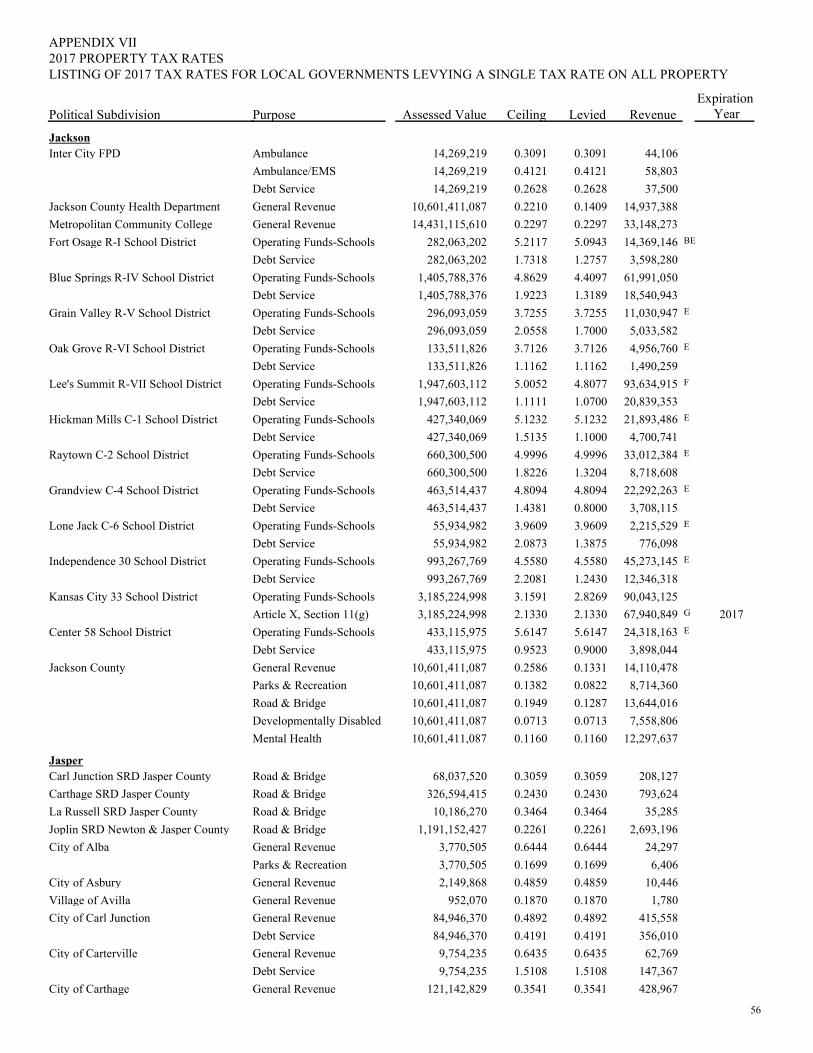
PurposePolitical Subdivision
2017 PROPERTY TAX RATESAPPENDIX VII
Assessed Value Ceiling Levied RevenueExpiration
Year
LISTING OF 2017 TAX RATES FOR LOCAL GOVERNMENTS LEVYING A SINGLE TAX RATE ON ALL PROPERTY
JacksonInter City FPD Ambulance 0.30910.309114,269,219 44,106
Ambulance/EMS 0.41210.412114,269,219 58,803Debt Service 0.26280.262814,269,219 37,500
Jackson County Health Department General Revenue 0.14090.221010,601,411,087 14,937,388Metropolitan Community College General Revenue 0.22970.229714,431,115,610 33,148,273Fort Osage R-I School District Operating Funds-Schools 5.09435.2117282,063,202 BE14,369,146
Debt Service 1.27571.7318282,063,202 3,598,280Blue Springs R-IV School District Operating Funds-Schools 4.40974.86291,405,788,376 61,991,050
Debt Service 1.31891.92231,405,788,376 18,540,943Grain Valley R-V School District Operating Funds-Schools 3.72553.7255296,093,059 E11,030,947
Debt Service 1.70002.0558296,093,059 5,033,582Oak Grove R-VI School District Operating Funds-Schools 3.71263.7126133,511,826 E4,956,760
Debt Service 1.11621.1162133,511,826 1,490,259Lee's Summit R-VII School District Operating Funds-Schools 4.80775.00521,947,603,112 F93,634,915
Debt Service 1.07001.11111,947,603,112 20,839,353Hickman Mills C-1 School District Operating Funds-Schools 5.12325.1232427,340,069 E21,893,486
Debt Service 1.10001.5135427,340,069 4,700,741Raytown C-2 School District Operating Funds-Schools 4.99964.9996660,300,500 E33,012,384
Debt Service 1.32041.8226660,300,500 8,718,608Grandview C-4 School District Operating Funds-Schools 4.80944.8094463,514,437 E22,292,263
Debt Service 0.80001.4381463,514,437 3,708,115Lone Jack C-6 School District Operating Funds-Schools 3.96093.960955,934,982 E2,215,529
Debt Service 1.38752.087355,934,982 776,098Independence 30 School District Operating Funds-Schools 4.55804.5580993,267,769 E45,273,145
Debt Service 1.24302.2081993,267,769 12,346,318Kansas City 33 School District Operating Funds-Schools 2.82693.15913,185,224,998 90,043,125
Article X, Section 11(g) 2.13302.13303,185,224,998 G67,940,849 2017Center 58 School District Operating Funds-Schools 5.61475.6147433,115,975 E24,318,163
Debt Service 0.90000.9523433,115,975 3,898,044Jackson County General Revenue 0.13310.258610,601,411,087 14,110,478
Parks & Recreation 0.08220.138210,601,411,087 8,714,360Road & Bridge 0.12870.194910,601,411,087 13,644,016Developmentally Disabled 0.07130.071310,601,411,087 7,558,806Mental Health 0.11600.116010,601,411,087 12,297,637
JasperCarl Junction SRD Jasper County Road & Bridge 0.30590.305968,037,520 208,127Carthage SRD Jasper County Road & Bridge 0.24300.2430326,594,415 793,624La Russell SRD Jasper County Road & Bridge 0.34640.346410,186,270 35,285Joplin SRD Newton & Jasper County Road & Bridge 0.22610.22611,191,152,427 2,693,196City of Alba General Revenue 0.64440.64443,770,505 24,297
Parks & Recreation 0.16990.16993,770,505 6,406City of Asbury General Revenue 0.48590.48592,149,868 10,446Village of Avilla General Revenue 0.18700.1870952,070 1,780City of Carl Junction General Revenue 0.48920.489284,946,370 415,558
Debt Service 0.41910.419184,946,370 356,010City of Carterville General Revenue 0.64350.64359,754,235 62,769
Debt Service 1.51081.51089,754,235 147,367City of Carthage General Revenue 0.35410.3541121,142,829 428,967
56
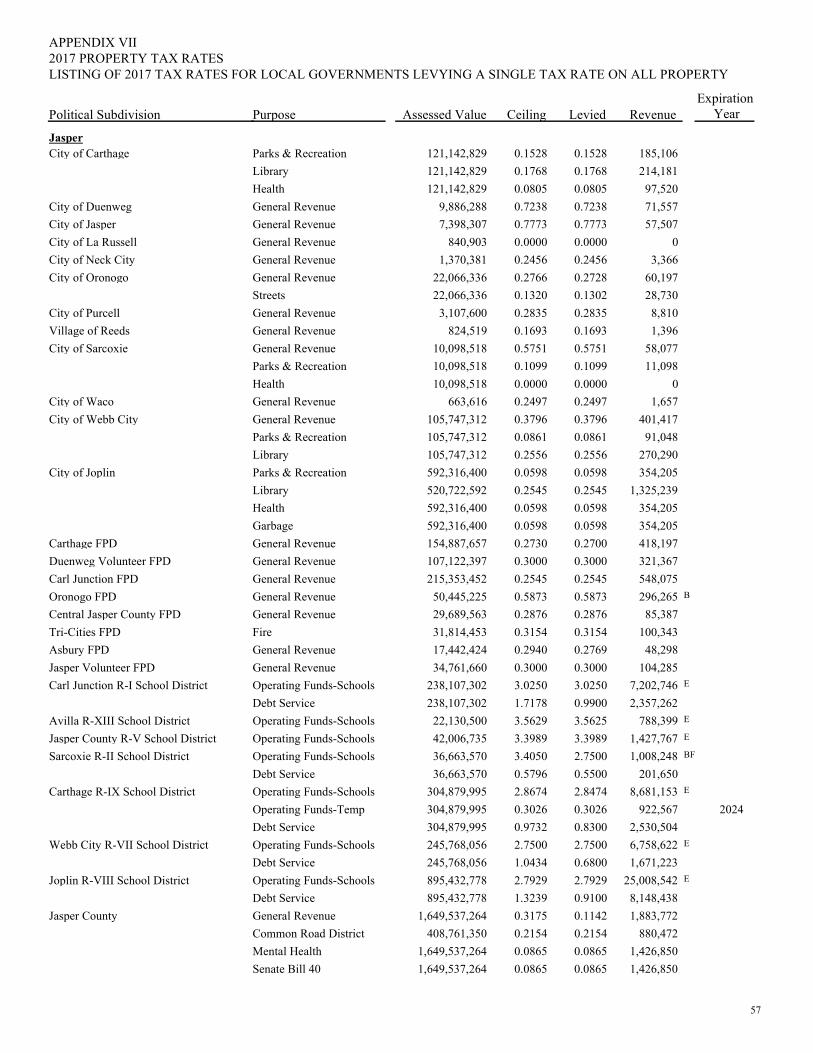
PurposePolitical Subdivision
2017 PROPERTY TAX RATESAPPENDIX VII
Assessed Value Ceiling Levied RevenueExpiration
Year
LISTING OF 2017 TAX RATES FOR LOCAL GOVERNMENTS LEVYING A SINGLE TAX RATE ON ALL PROPERTY
JasperCity of Carthage Parks & Recreation 0.15280.1528121,142,829 185,106
Library 0.17680.1768121,142,829 214,181Health 0.08050.0805121,142,829 97,520
City of Duenweg General Revenue 0.72380.72389,886,288 71,557City of Jasper General Revenue 0.77730.77737,398,307 57,507City of La Russell General Revenue 0.00000.0000840,903 0City of Neck City General Revenue 0.24560.24561,370,381 3,366City of Oronogo General Revenue 0.27280.276622,066,336 60,197
Streets 0.13020.132022,066,336 28,730City of Purcell General Revenue 0.28350.28353,107,600 8,810Village of Reeds General Revenue 0.16930.1693824,519 1,396City of Sarcoxie General Revenue 0.57510.575110,098,518 58,077
Parks & Recreation 0.10990.109910,098,518 11,098Health 0.00000.000010,098,518 0
City of Waco General Revenue 0.24970.2497663,616 1,657City of Webb City General Revenue 0.37960.3796105,747,312 401,417
Parks & Recreation 0.08610.0861105,747,312 91,048Library 0.25560.2556105,747,312 270,290
City of Joplin Parks & Recreation 0.05980.0598592,316,400 354,205Library 0.25450.2545520,722,592 1,325,239Health 0.05980.0598592,316,400 354,205Garbage 0.05980.0598592,316,400 354,205
Carthage FPD General Revenue 0.27000.2730154,887,657 418,197Duenweg Volunteer FPD General Revenue 0.30000.3000107,122,397 321,367Carl Junction FPD General Revenue 0.25450.2545215,353,452 548,075Oronogo FPD General Revenue 0.58730.587350,445,225 B296,265Central Jasper County FPD General Revenue 0.28760.287629,689,563 85,387Tri-Cities FPD Fire 0.31540.315431,814,453 100,343Asbury FPD General Revenue 0.27690.294017,442,424 48,298Jasper Volunteer FPD General Revenue 0.30000.300034,761,660 104,285Carl Junction R-I School District Operating Funds-Schools 3.02503.0250238,107,302 E7,202,746
Debt Service 0.99001.7178238,107,302 2,357,262Avilla R-XIII School District Operating Funds-Schools 3.56253.562922,130,500 E788,399Jasper County R-V School District Operating Funds-Schools 3.39893.398942,006,735 E1,427,767Sarcoxie R-II School District Operating Funds-Schools 2.75003.405036,663,570 BF1,008,248
Debt Service 0.55000.579636,663,570 201,650Carthage R-IX School District Operating Funds-Schools 2.84742.8674304,879,995 E8,681,153
Operating Funds-Temp 0.30260.3026304,879,995 922,567 2024Debt Service 0.83000.9732304,879,995 2,530,504
Webb City R-VII School District Operating Funds-Schools 2.75002.7500245,768,056 E6,758,622Debt Service 0.68001.0434245,768,056 1,671,223
Joplin R-VIII School District Operating Funds-Schools 2.79292.7929895,432,778 E25,008,542Debt Service 0.91001.3239895,432,778 8,148,438
Jasper County General Revenue 0.11420.31751,649,537,264 1,883,772Common Road District 0.21540.2154408,761,350 880,472Mental Health 0.08650.08651,649,537,264 1,426,850Senate Bill 40 0.08650.08651,649,537,264 1,426,850
57
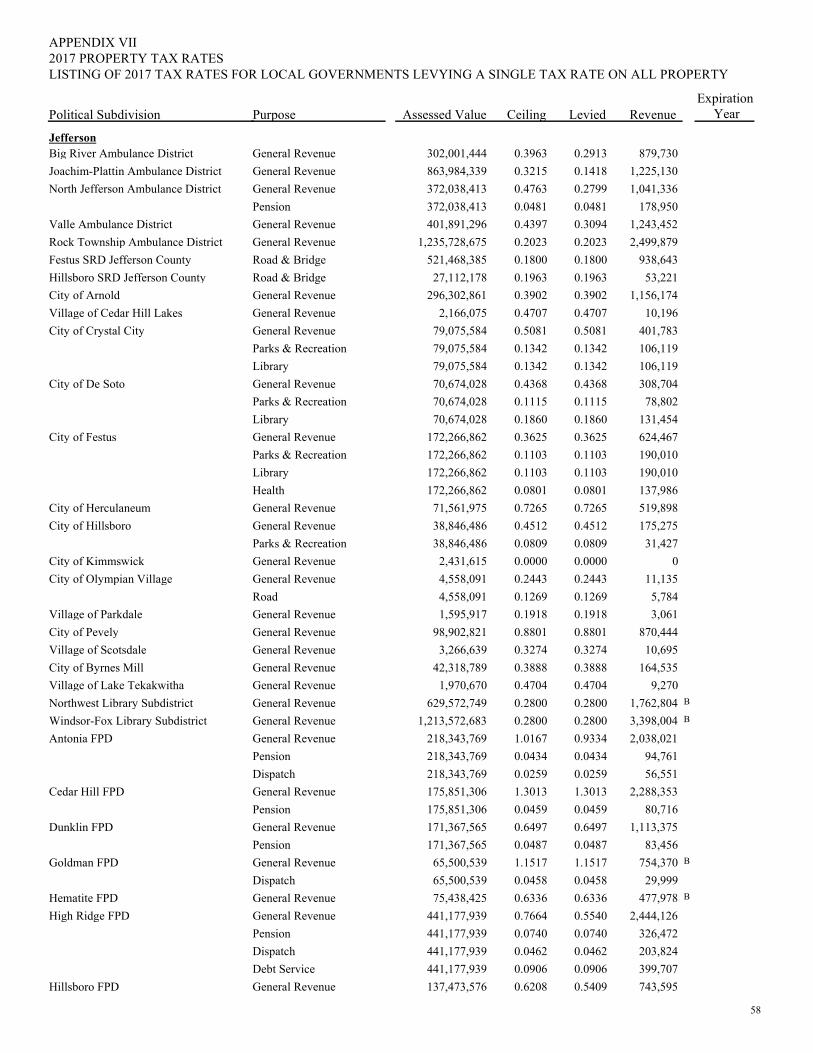
PurposePolitical Subdivision
2017 PROPERTY TAX RATESAPPENDIX VII
Assessed Value Ceiling Levied RevenueExpiration
Year
LISTING OF 2017 TAX RATES FOR LOCAL GOVERNMENTS LEVYING A SINGLE TAX RATE ON ALL PROPERTY
JeffersonBig River Ambulance District General Revenue 0.29130.3963302,001,444 879,730Joachim-Plattin Ambulance District General Revenue 0.14180.3215863,984,339 1,225,130North Jefferson Ambulance District General Revenue 0.27990.4763372,038,413 1,041,336
Pension 0.04810.0481372,038,413 178,950Valle Ambulance District General Revenue 0.30940.4397401,891,296 1,243,452Rock Township Ambulance District General Revenue 0.20230.20231,235,728,675 2,499,879Festus SRD Jefferson County Road & Bridge 0.18000.1800521,468,385 938,643Hillsboro SRD Jefferson County Road & Bridge 0.19630.196327,112,178 53,221City of Arnold General Revenue 0.39020.3902296,302,861 1,156,174Village of Cedar Hill Lakes General Revenue 0.47070.47072,166,075 10,196City of Crystal City General Revenue 0.50810.508179,075,584 401,783
Parks & Recreation 0.13420.134279,075,584 106,119Library 0.13420.134279,075,584 106,119
City of De Soto General Revenue 0.43680.436870,674,028 308,704Parks & Recreation 0.11150.111570,674,028 78,802Library 0.18600.186070,674,028 131,454
City of Festus General Revenue 0.36250.3625172,266,862 624,467Parks & Recreation 0.11030.1103172,266,862 190,010Library 0.11030.1103172,266,862 190,010Health 0.08010.0801172,266,862 137,986
City of Herculaneum General Revenue 0.72650.726571,561,975 519,898City of Hillsboro General Revenue 0.45120.451238,846,486 175,275
Parks & Recreation 0.08090.080938,846,486 31,427City of Kimmswick General Revenue 0.00000.00002,431,615 0City of Olympian Village General Revenue 0.24430.24434,558,091 11,135
Road 0.12690.12694,558,091 5,784Village of Parkdale General Revenue 0.19180.19181,595,917 3,061City of Pevely General Revenue 0.88010.880198,902,821 870,444Village of Scotsdale General Revenue 0.32740.32743,266,639 10,695City of Byrnes Mill General Revenue 0.38880.388842,318,789 164,535Village of Lake Tekakwitha General Revenue 0.47040.47041,970,670 9,270Northwest Library Subdistrict General Revenue 0.28000.2800629,572,749 B1,762,804Windsor-Fox Library Subdistrict General Revenue 0.28000.28001,213,572,683 B3,398,004Antonia FPD General Revenue 0.93341.0167218,343,769 2,038,021
Pension 0.04340.0434218,343,769 94,761Dispatch 0.02590.0259218,343,769 56,551
Cedar Hill FPD General Revenue 1.30131.3013175,851,306 2,288,353Pension 0.04590.0459175,851,306 80,716
Dunklin FPD General Revenue 0.64970.6497171,367,565 1,113,375Pension 0.04870.0487171,367,565 83,456
Goldman FPD General Revenue 1.15171.151765,500,539 B754,370Dispatch 0.04580.045865,500,539 29,999
Hematite FPD General Revenue 0.63360.633675,438,425 B477,978High Ridge FPD General Revenue 0.55400.7664441,177,939 2,444,126
Pension 0.07400.0740441,177,939 326,472Dispatch 0.04620.0462441,177,939 203,824Debt Service 0.09060.0906441,177,939 399,707
Hillsboro FPD General Revenue 0.54090.6208137,473,576 743,595
58
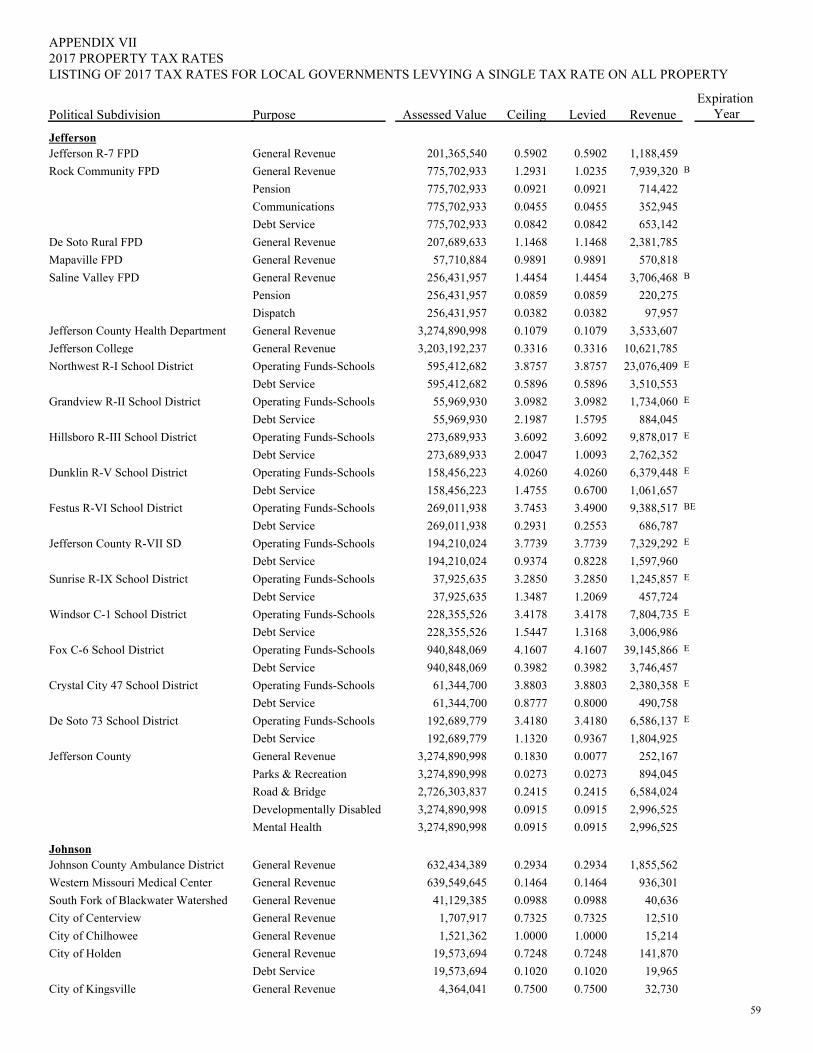
PurposePolitical Subdivision
2017 PROPERTY TAX RATESAPPENDIX VII
Assessed Value Ceiling Levied RevenueExpiration
Year
LISTING OF 2017 TAX RATES FOR LOCAL GOVERNMENTS LEVYING A SINGLE TAX RATE ON ALL PROPERTY
JeffersonJefferson R-7 FPD General Revenue 0.59020.5902201,365,540 1,188,459Rock Community FPD General Revenue 1.02351.2931775,702,933 B7,939,320
Pension 0.09210.0921775,702,933 714,422Communications 0.04550.0455775,702,933 352,945Debt Service 0.08420.0842775,702,933 653,142
De Soto Rural FPD General Revenue 1.14681.1468207,689,633 2,381,785Mapaville FPD General Revenue 0.98910.989157,710,884 570,818Saline Valley FPD General Revenue 1.44541.4454256,431,957 B3,706,468
Pension 0.08590.0859256,431,957 220,275Dispatch 0.03820.0382256,431,957 97,957
Jefferson County Health Department General Revenue 0.10790.10793,274,890,998 3,533,607Jefferson College General Revenue 0.33160.33163,203,192,237 10,621,785Northwest R-I School District Operating Funds-Schools 3.87573.8757595,412,682 E23,076,409
Debt Service 0.58960.5896595,412,682 3,510,553Grandview R-II School District Operating Funds-Schools 3.09823.098255,969,930 E1,734,060
Debt Service 1.57952.198755,969,930 884,045Hillsboro R-III School District Operating Funds-Schools 3.60923.6092273,689,933 E9,878,017
Debt Service 1.00932.0047273,689,933 2,762,352Dunklin R-V School District Operating Funds-Schools 4.02604.0260158,456,223 E6,379,448
Debt Service 0.67001.4755158,456,223 1,061,657Festus R-VI School District Operating Funds-Schools 3.49003.7453269,011,938 BE9,388,517
Debt Service 0.25530.2931269,011,938 686,787Jefferson County R-VII SD Operating Funds-Schools 3.77393.7739194,210,024 E7,329,292
Debt Service 0.82280.9374194,210,024 1,597,960Sunrise R-IX School District Operating Funds-Schools 3.28503.285037,925,635 E1,245,857
Debt Service 1.20691.348737,925,635 457,724Windsor C-1 School District Operating Funds-Schools 3.41783.4178228,355,526 E7,804,735
Debt Service 1.31681.5447228,355,526 3,006,986Fox C-6 School District Operating Funds-Schools 4.16074.1607940,848,069 E39,145,866
Debt Service 0.39820.3982940,848,069 3,746,457Crystal City 47 School District Operating Funds-Schools 3.88033.880361,344,700 E2,380,358
Debt Service 0.80000.877761,344,700 490,758De Soto 73 School District Operating Funds-Schools 3.41803.4180192,689,779 E6,586,137
Debt Service 0.93671.1320192,689,779 1,804,925Jefferson County General Revenue 0.00770.18303,274,890,998 252,167
Parks & Recreation 0.02730.02733,274,890,998 894,045Road & Bridge 0.24150.24152,726,303,837 6,584,024Developmentally Disabled 0.09150.09153,274,890,998 2,996,525Mental Health 0.09150.09153,274,890,998 2,996,525
JohnsonJohnson County Ambulance District General Revenue 0.29340.2934632,434,389 1,855,562Western Missouri Medical Center General Revenue 0.14640.1464639,549,645 936,301South Fork of Blackwater Watershed General Revenue 0.09880.098841,129,385 40,636City of Centerview General Revenue 0.73250.73251,707,917 12,510City of Chilhowee General Revenue 1.00001.00001,521,362 15,214City of Holden General Revenue 0.72480.724819,573,694 141,870
Debt Service 0.10200.102019,573,694 19,965City of Kingsville General Revenue 0.75000.75004,364,041 32,730
59
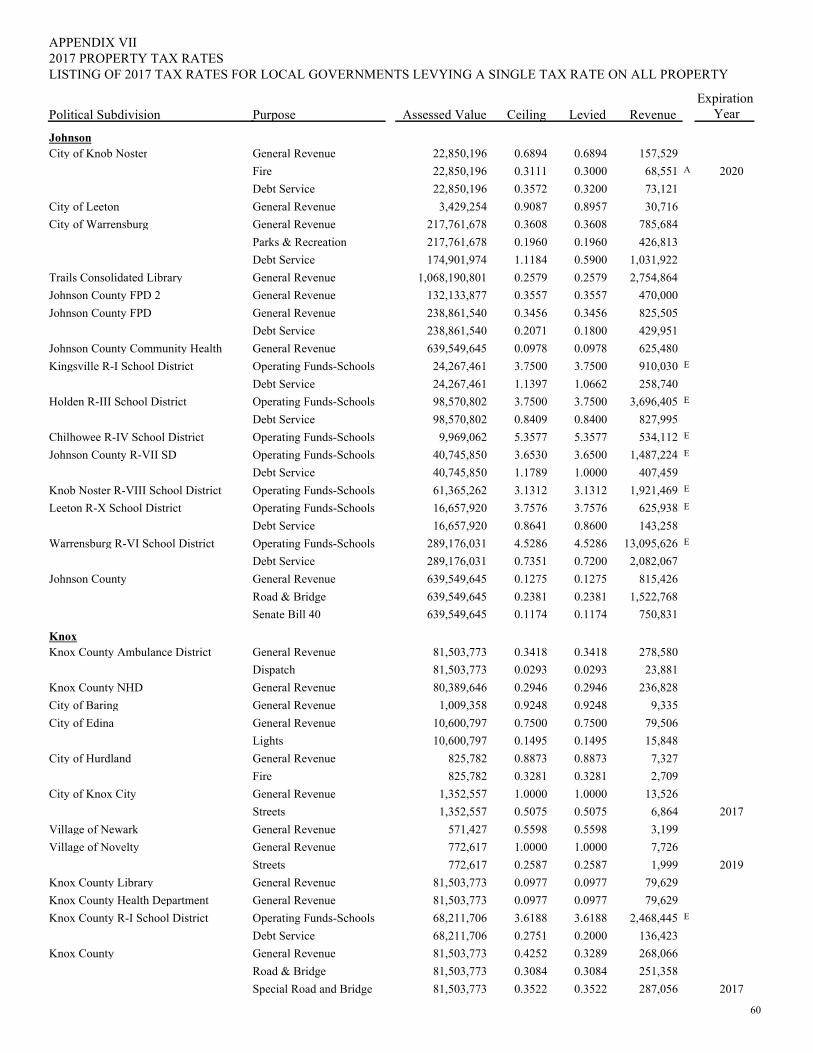
PurposePolitical Subdivision
2017 PROPERTY TAX RATESAPPENDIX VII
Assessed Value Ceiling Levied RevenueExpiration
Year
LISTING OF 2017 TAX RATES FOR LOCAL GOVERNMENTS LEVYING A SINGLE TAX RATE ON ALL PROPERTY
JohnsonCity of Knob Noster General Revenue 0.68940.689422,850,196 157,529
Fire 0.30000.311122,850,196 A68,551 2020Debt Service 0.32000.357222,850,196 73,121
City of Leeton General Revenue 0.89570.90873,429,254 30,716City of Warrensburg General Revenue 0.36080.3608217,761,678 785,684
Parks & Recreation 0.19600.1960217,761,678 426,813Debt Service 0.59001.1184174,901,974 1,031,922
Trails Consolidated Library General Revenue 0.25790.25791,068,190,801 2,754,864Johnson County FPD 2 General Revenue 0.35570.3557132,133,877 470,000Johnson County FPD General Revenue 0.34560.3456238,861,540 825,505
Debt Service 0.18000.2071238,861,540 429,951Johnson County Community Health General Revenue 0.09780.0978639,549,645 625,480Kingsville R-I School District Operating Funds-Schools 3.75003.750024,267,461 E910,030
Debt Service 1.06621.139724,267,461 258,740Holden R-III School District Operating Funds-Schools 3.75003.750098,570,802 E3,696,405
Debt Service 0.84000.840998,570,802 827,995Chilhowee R-IV School District Operating Funds-Schools 5.35775.35779,969,062 E534,112Johnson County R-VII SD Operating Funds-Schools 3.65003.653040,745,850 E1,487,224
Debt Service 1.00001.178940,745,850 407,459Knob Noster R-VIII School District Operating Funds-Schools 3.13123.131261,365,262 E1,921,469Leeton R-X School District Operating Funds-Schools 3.75763.757616,657,920 E625,938
Debt Service 0.86000.864116,657,920 143,258Warrensburg R-VI School District Operating Funds-Schools 4.52864.5286289,176,031 E13,095,626
Debt Service 0.72000.7351289,176,031 2,082,067Johnson County General Revenue 0.12750.1275639,549,645 815,426
Road & Bridge 0.23810.2381639,549,645 1,522,768Senate Bill 40 0.11740.1174639,549,645 750,831
KnoxKnox County Ambulance District General Revenue 0.34180.341881,503,773 278,580
Dispatch 0.02930.029381,503,773 23,881Knox County NHD General Revenue 0.29460.294680,389,646 236,828City of Baring General Revenue 0.92480.92481,009,358 9,335City of Edina General Revenue 0.75000.750010,600,797 79,506
Lights 0.14950.149510,600,797 15,848City of Hurdland General Revenue 0.88730.8873825,782 7,327
Fire 0.32810.3281825,782 2,709City of Knox City General Revenue 1.00001.00001,352,557 13,526
Streets 0.50750.50751,352,557 6,864 2017Village of Newark General Revenue 0.55980.5598571,427 3,199Village of Novelty General Revenue 1.00001.0000772,617 7,726
Streets 0.25870.2587772,617 1,999 2019Knox County Library General Revenue 0.09770.097781,503,773 79,629Knox County Health Department General Revenue 0.09770.097781,503,773 79,629Knox County R-I School District Operating Funds-Schools 3.61883.618868,211,706 E2,468,445
Debt Service 0.20000.275168,211,706 136,423Knox County General Revenue 0.32890.425281,503,773 268,066
Road & Bridge 0.30840.308481,503,773 251,358Special Road and Bridge 0.35220.352281,503,773 287,056 2017
60
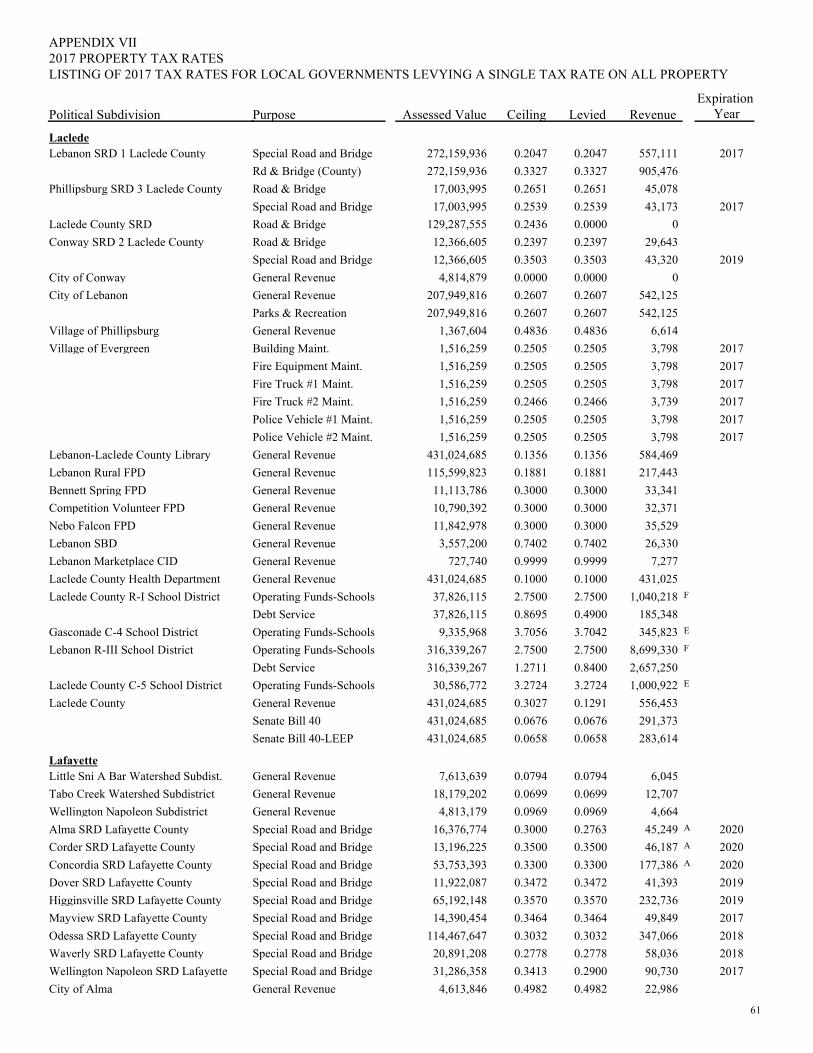
PurposePolitical Subdivision
2017 PROPERTY TAX RATESAPPENDIX VII
Assessed Value Ceiling Levied RevenueExpiration
Year
LISTING OF 2017 TAX RATES FOR LOCAL GOVERNMENTS LEVYING A SINGLE TAX RATE ON ALL PROPERTY
LacledeLebanon SRD 1 Laclede County Special Road and Bridge 0.20470.2047272,159,936 557,111 2017
Rd & Bridge (County) 0.33270.3327272,159,936 905,476Phillipsburg SRD 3 Laclede County Road & Bridge 0.26510.265117,003,995 45,078
Special Road and Bridge 0.25390.253917,003,995 43,173 2017Laclede County SRD Road & Bridge 0.00000.2436129,287,555 0Conway SRD 2 Laclede County Road & Bridge 0.23970.239712,366,605 29,643
Special Road and Bridge 0.35030.350312,366,605 43,320 2019City of Conway General Revenue 0.00000.00004,814,879 0City of Lebanon General Revenue 0.26070.2607207,949,816 542,125
Parks & Recreation 0.26070.2607207,949,816 542,125Village of Phillipsburg General Revenue 0.48360.48361,367,604 6,614Village of Evergreen Building Maint. 0.25050.25051,516,259 3,798 2017
Fire Equipment Maint. 0.25050.25051,516,259 3,798 2017Fire Truck #1 Maint. 0.25050.25051,516,259 3,798 2017Fire Truck #2 Maint. 0.24660.24661,516,259 3,739 2017Police Vehicle #1 Maint. 0.25050.25051,516,259 3,798 2017Police Vehicle #2 Maint. 0.25050.25051,516,259 3,798 2017
Lebanon-Laclede County Library General Revenue 0.13560.1356431,024,685 584,469Lebanon Rural FPD General Revenue 0.18810.1881115,599,823 217,443Bennett Spring FPD General Revenue 0.30000.300011,113,786 33,341Competition Volunteer FPD General Revenue 0.30000.300010,790,392 32,371Nebo Falcon FPD General Revenue 0.30000.300011,842,978 35,529Lebanon SBD General Revenue 0.74020.74023,557,200 26,330Lebanon Marketplace CID General Revenue 0.99990.9999727,740 7,277Laclede County Health Department General Revenue 0.10000.1000431,024,685 431,025Laclede County R-I School District Operating Funds-Schools 2.75002.750037,826,115 F1,040,218
Debt Service 0.49000.869537,826,115 185,348Gasconade C-4 School District Operating Funds-Schools 3.70423.70569,335,968 E345,823Lebanon R-III School District Operating Funds-Schools 2.75002.7500316,339,267 F8,699,330
Debt Service 0.84001.2711316,339,267 2,657,250Laclede County C-5 School District Operating Funds-Schools 3.27243.272430,586,772 E1,000,922Laclede County General Revenue 0.12910.3027431,024,685 556,453
Senate Bill 40 0.06760.0676431,024,685 291,373Senate Bill 40-LEEP 0.06580.0658431,024,685 283,614
LafayetteLittle Sni A Bar Watershed Subdist. General Revenue 0.07940.07947,613,639 6,045Tabo Creek Watershed Subdistrict General Revenue 0.06990.069918,179,202 12,707Wellington Napoleon Subdistrict General Revenue 0.09690.09694,813,179 4,664Alma SRD Lafayette County Special Road and Bridge 0.27630.300016,376,774 A45,249 2020Corder SRD Lafayette County Special Road and Bridge 0.35000.350013,196,225 A46,187 2020Concordia SRD Lafayette County Special Road and Bridge 0.33000.330053,753,393 A177,386 2020Dover SRD Lafayette County Special Road and Bridge 0.34720.347211,922,087 41,393 2019Higginsville SRD Lafayette County Special Road and Bridge 0.35700.357065,192,148 232,736 2019Mayview SRD Lafayette County Special Road and Bridge 0.34640.346414,390,454 49,849 2017Odessa SRD Lafayette County Special Road and Bridge 0.30320.3032114,467,647 347,066 2018Waverly SRD Lafayette County Special Road and Bridge 0.27780.277820,891,208 58,036 2018Wellington Napoleon SRD Lafayette Special Road and Bridge 0.29000.341331,286,358 90,730 2017City of Alma General Revenue 0.49820.49824,613,846 22,986
61
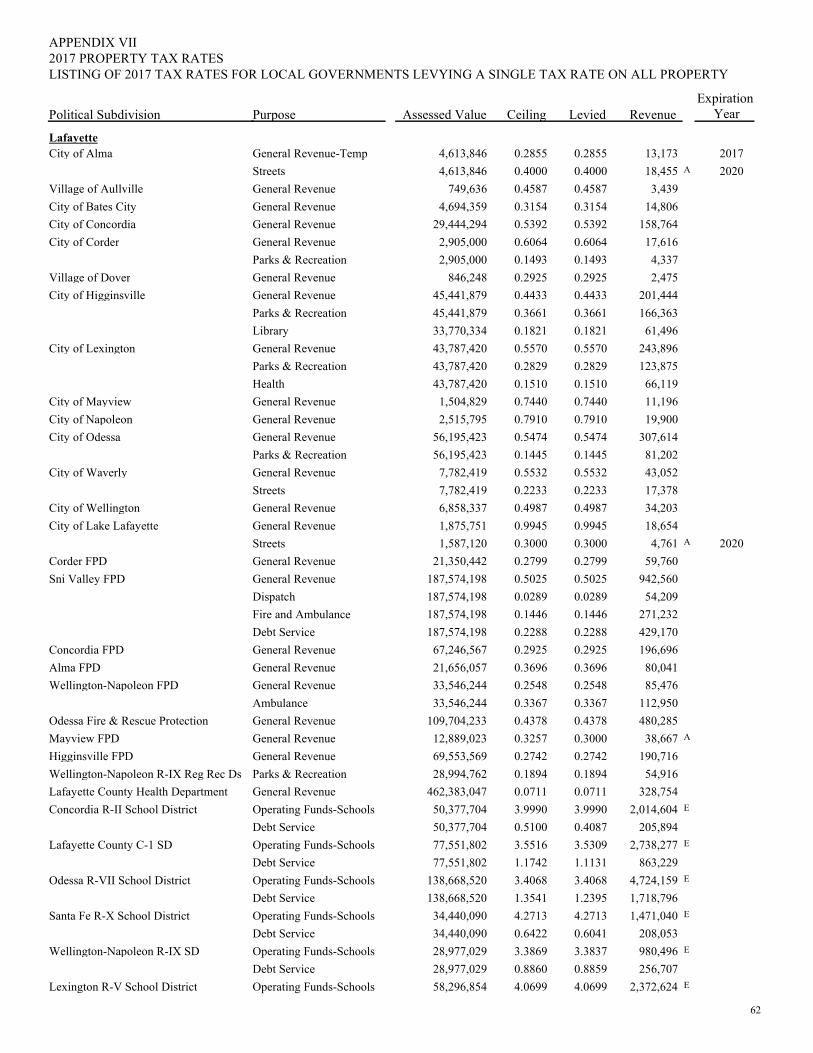
PurposePolitical Subdivision
2017 PROPERTY TAX RATESAPPENDIX VII
Assessed Value Ceiling Levied RevenueExpiration
Year
LISTING OF 2017 TAX RATES FOR LOCAL GOVERNMENTS LEVYING A SINGLE TAX RATE ON ALL PROPERTY
LafayetteCity of Alma General Revenue-Temp 0.28550.28554,613,846 13,173 2017
Streets 0.40000.40004,613,846 A18,455 2020Village of Aullville General Revenue 0.45870.4587749,636 3,439City of Bates City General Revenue 0.31540.31544,694,359 14,806City of Concordia General Revenue 0.53920.539229,444,294 158,764City of Corder General Revenue 0.60640.60642,905,000 17,616
Parks & Recreation 0.14930.14932,905,000 4,337Village of Dover General Revenue 0.29250.2925846,248 2,475City of Higginsville General Revenue 0.44330.443345,441,879 201,444
Parks & Recreation 0.36610.366145,441,879 166,363Library 0.18210.182133,770,334 61,496
City of Lexington General Revenue 0.55700.557043,787,420 243,896Parks & Recreation 0.28290.282943,787,420 123,875Health 0.15100.151043,787,420 66,119
City of Mayview General Revenue 0.74400.74401,504,829 11,196City of Napoleon General Revenue 0.79100.79102,515,795 19,900City of Odessa General Revenue 0.54740.547456,195,423 307,614
Parks & Recreation 0.14450.144556,195,423 81,202City of Waverly General Revenue 0.55320.55327,782,419 43,052
Streets 0.22330.22337,782,419 17,378City of Wellington General Revenue 0.49870.49876,858,337 34,203City of Lake Lafayette General Revenue 0.99450.99451,875,751 18,654
Streets 0.30000.30001,587,120 A4,761 2020Corder FPD General Revenue 0.27990.279921,350,442 59,760Sni Valley FPD General Revenue 0.50250.5025187,574,198 942,560
Dispatch 0.02890.0289187,574,198 54,209Fire and Ambulance 0.14460.1446187,574,198 271,232Debt Service 0.22880.2288187,574,198 429,170
Concordia FPD General Revenue 0.29250.292567,246,567 196,696Alma FPD General Revenue 0.36960.369621,656,057 80,041Wellington-Napoleon FPD General Revenue 0.25480.254833,546,244 85,476
Ambulance 0.33670.336733,546,244 112,950Odessa Fire & Rescue Protection General Revenue 0.43780.4378109,704,233 480,285Mayview FPD General Revenue 0.30000.325712,889,023 A38,667Higginsville FPD General Revenue 0.27420.274269,553,569 190,716Wellington-Napoleon R-IX Reg Rec Ds Parks & Recreation 0.18940.189428,994,762 54,916Lafayette County Health Department General Revenue 0.07110.0711462,383,047 328,754Concordia R-II School District Operating Funds-Schools 3.99903.999050,377,704 E2,014,604
Debt Service 0.40870.510050,377,704 205,894Lafayette County C-1 SD Operating Funds-Schools 3.53093.551677,551,802 E2,738,277
Debt Service 1.11311.174277,551,802 863,229Odessa R-VII School District Operating Funds-Schools 3.40683.4068138,668,520 E4,724,159
Debt Service 1.23951.3541138,668,520 1,718,796Santa Fe R-X School District Operating Funds-Schools 4.27134.271334,440,090 E1,471,040
Debt Service 0.60410.642234,440,090 208,053Wellington-Napoleon R-IX SD Operating Funds-Schools 3.38373.386928,977,029 E980,496
Debt Service 0.88590.886028,977,029 256,707Lexington R-V School District Operating Funds-Schools 4.06994.069958,296,854 E2,372,624
62
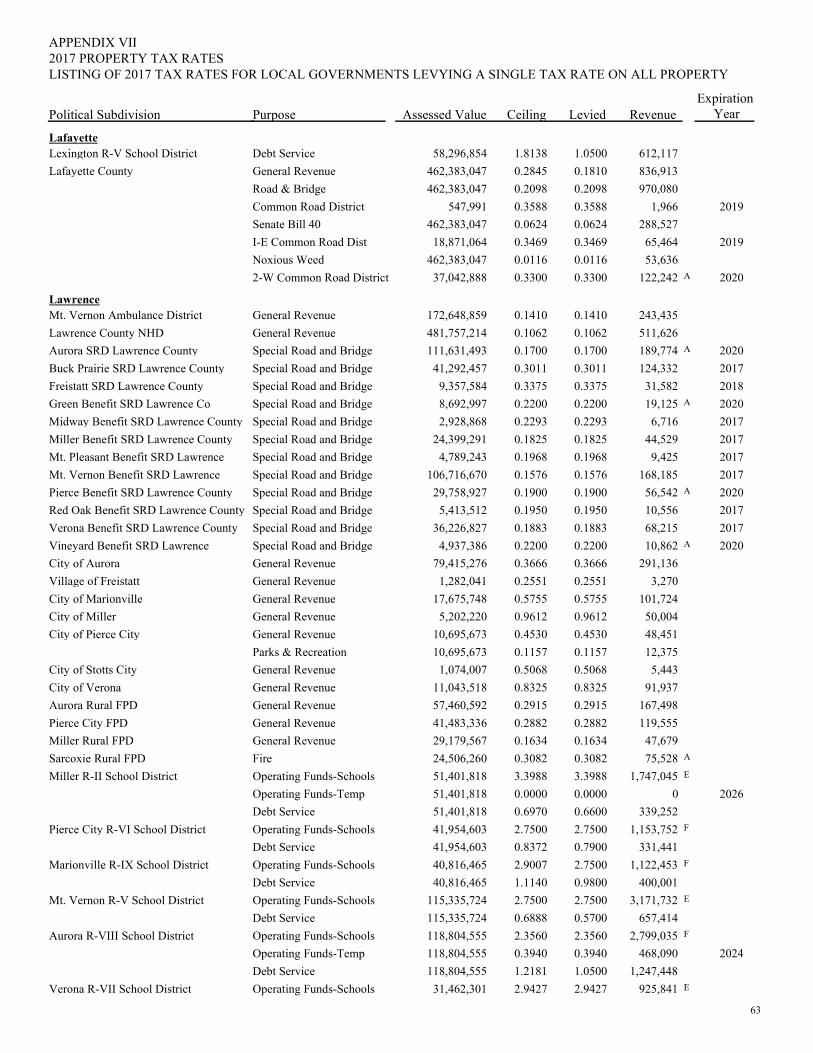
PurposePolitical Subdivision
2017 PROPERTY TAX RATESAPPENDIX VII
Assessed Value Ceiling Levied RevenueExpiration
Year
LISTING OF 2017 TAX RATES FOR LOCAL GOVERNMENTS LEVYING A SINGLE TAX RATE ON ALL PROPERTY
LafayetteLexington R-V School District Debt Service 1.05001.813858,296,854 612,117Lafayette County General Revenue 0.18100.2845462,383,047 836,913
Road & Bridge 0.20980.2098462,383,047 970,080Common Road District 0.35880.3588547,991 1,966 2019Senate Bill 40 0.06240.0624462,383,047 288,527I-E Common Road Dist 0.34690.346918,871,064 65,464 2019Noxious Weed 0.01160.0116462,383,047 53,6362-W Common Road District 0.33000.330037,042,888 A122,242 2020
LawrenceMt. Vernon Ambulance District General Revenue 0.14100.1410172,648,859 243,435Lawrence County NHD General Revenue 0.10620.1062481,757,214 511,626Aurora SRD Lawrence County Special Road and Bridge 0.17000.1700111,631,493 A189,774 2020Buck Prairie SRD Lawrence County Special Road and Bridge 0.30110.301141,292,457 124,332 2017Freistatt SRD Lawrence County Special Road and Bridge 0.33750.33759,357,584 31,582 2018Green Benefit SRD Lawrence Co Special Road and Bridge 0.22000.22008,692,997 A19,125 2020Midway Benefit SRD Lawrence County Special Road and Bridge 0.22930.22932,928,868 6,716 2017Miller Benefit SRD Lawrence County Special Road and Bridge 0.18250.182524,399,291 44,529 2017Mt. Pleasant Benefit SRD Lawrence Special Road and Bridge 0.19680.19684,789,243 9,425 2017Mt. Vernon Benefit SRD Lawrence Special Road and Bridge 0.15760.1576106,716,670 168,185 2017Pierce Benefit SRD Lawrence County Special Road and Bridge 0.19000.190029,758,927 A56,542 2020Red Oak Benefit SRD Lawrence County Special Road and Bridge 0.19500.19505,413,512 10,556 2017Verona Benefit SRD Lawrence County Special Road and Bridge 0.18830.188336,226,827 68,215 2017Vineyard Benefit SRD Lawrence Special Road and Bridge 0.22000.22004,937,386 A10,862 2020City of Aurora General Revenue 0.36660.366679,415,276 291,136Village of Freistatt General Revenue 0.25510.25511,282,041 3,270City of Marionville General Revenue 0.57550.575517,675,748 101,724City of Miller General Revenue 0.96120.96125,202,220 50,004City of Pierce City General Revenue 0.45300.453010,695,673 48,451
Parks & Recreation 0.11570.115710,695,673 12,375City of Stotts City General Revenue 0.50680.50681,074,007 5,443City of Verona General Revenue 0.83250.832511,043,518 91,937Aurora Rural FPD General Revenue 0.29150.291557,460,592 167,498Pierce City FPD General Revenue 0.28820.288241,483,336 119,555Miller Rural FPD General Revenue 0.16340.163429,179,567 47,679Sarcoxie Rural FPD Fire 0.30820.308224,506,260 A75,528Miller R-II School District Operating Funds-Schools 3.39883.398851,401,818 E1,747,045
Operating Funds-Temp 0.00000.000051,401,818 0 2026Debt Service 0.66000.697051,401,818 339,252
Pierce City R-VI School District Operating Funds-Schools 2.75002.750041,954,603 F1,153,752Debt Service 0.79000.837241,954,603 331,441
Marionville R-IX School District Operating Funds-Schools 2.75002.900740,816,465 F1,122,453Debt Service 0.98001.114040,816,465 400,001
Mt. Vernon R-V School District Operating Funds-Schools 2.75002.7500115,335,724 E3,171,732Debt Service 0.57000.6888115,335,724 657,414
Aurora R-VIII School District Operating Funds-Schools 2.35602.3560118,804,555 F2,799,035Operating Funds-Temp 0.39400.3940118,804,555 468,090 2024Debt Service 1.05001.2181118,804,555 1,247,448
Verona R-VII School District Operating Funds-Schools 2.94272.942731,462,301 E925,841
63
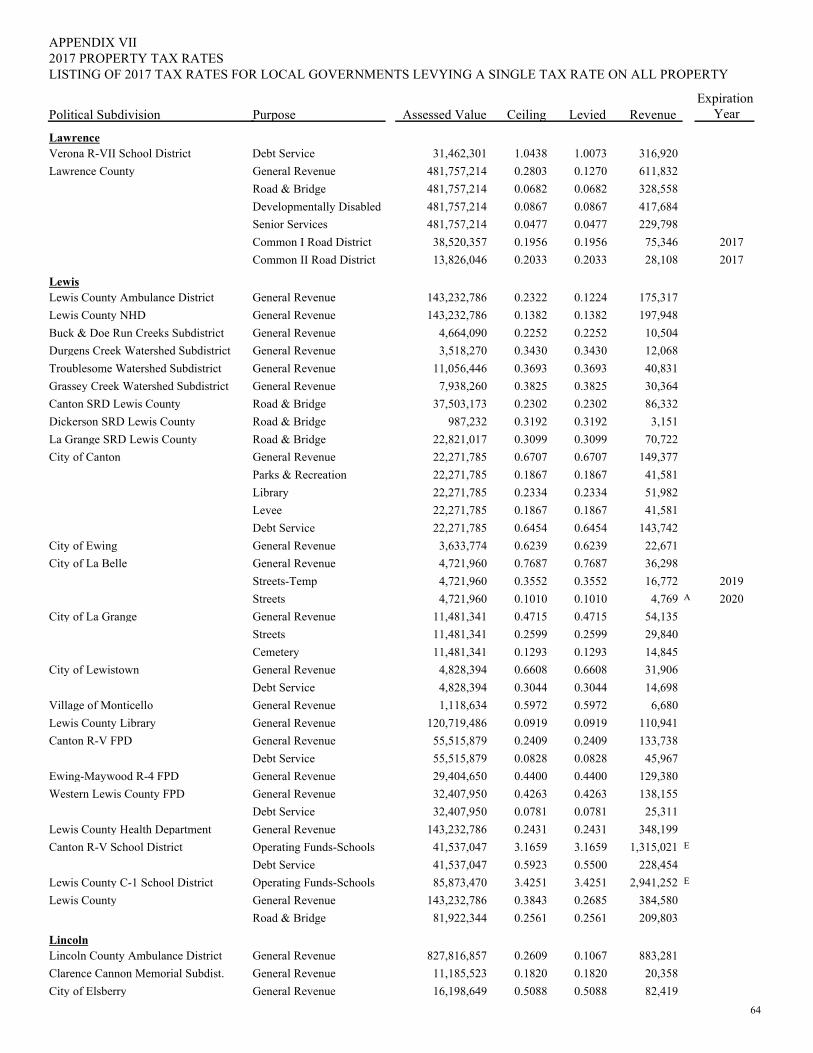
PurposePolitical Subdivision
2017 PROPERTY TAX RATESAPPENDIX VII
Assessed Value Ceiling Levied RevenueExpiration
Year
LISTING OF 2017 TAX RATES FOR LOCAL GOVERNMENTS LEVYING A SINGLE TAX RATE ON ALL PROPERTY
LawrenceVerona R-VII School District Debt Service 1.00731.043831,462,301 316,920Lawrence County General Revenue 0.12700.2803481,757,214 611,832
Road & Bridge 0.06820.0682481,757,214 328,558Developmentally Disabled 0.08670.0867481,757,214 417,684Senior Services 0.04770.0477481,757,214 229,798Common I Road District 0.19560.195638,520,357 75,346 2017Common II Road District 0.20330.203313,826,046 28,108 2017
LewisLewis County Ambulance District General Revenue 0.12240.2322143,232,786 175,317Lewis County NHD General Revenue 0.13820.1382143,232,786 197,948Buck & Doe Run Creeks Subdistrict General Revenue 0.22520.22524,664,090 10,504Durgens Creek Watershed Subdistrict General Revenue 0.34300.34303,518,270 12,068Troublesome Watershed Subdistrict General Revenue 0.36930.369311,056,446 40,831Grassey Creek Watershed Subdistrict General Revenue 0.38250.38257,938,260 30,364Canton SRD Lewis County Road & Bridge 0.23020.230237,503,173 86,332Dickerson SRD Lewis County Road & Bridge 0.31920.3192987,232 3,151La Grange SRD Lewis County Road & Bridge 0.30990.309922,821,017 70,722City of Canton General Revenue 0.67070.670722,271,785 149,377
Parks & Recreation 0.18670.186722,271,785 41,581Library 0.23340.233422,271,785 51,982Levee 0.18670.186722,271,785 41,581Debt Service 0.64540.645422,271,785 143,742
City of Ewing General Revenue 0.62390.62393,633,774 22,671City of La Belle General Revenue 0.76870.76874,721,960 36,298
Streets-Temp 0.35520.35524,721,960 16,772 2019Streets 0.10100.10104,721,960 A4,769 2020
City of La Grange General Revenue 0.47150.471511,481,341 54,135Streets 0.25990.259911,481,341 29,840Cemetery 0.12930.129311,481,341 14,845
City of Lewistown General Revenue 0.66080.66084,828,394 31,906Debt Service 0.30440.30444,828,394 14,698
Village of Monticello General Revenue 0.59720.59721,118,634 6,680Lewis County Library General Revenue 0.09190.0919120,719,486 110,941Canton R-V FPD General Revenue 0.24090.240955,515,879 133,738
Debt Service 0.08280.082855,515,879 45,967Ewing-Maywood R-4 FPD General Revenue 0.44000.440029,404,650 129,380Western Lewis County FPD General Revenue 0.42630.426332,407,950 138,155
Debt Service 0.07810.078132,407,950 25,311Lewis County Health Department General Revenue 0.24310.2431143,232,786 348,199Canton R-V School District Operating Funds-Schools 3.16593.165941,537,047 E1,315,021
Debt Service 0.55000.592341,537,047 228,454Lewis County C-1 School District Operating Funds-Schools 3.42513.425185,873,470 E2,941,252Lewis County General Revenue 0.26850.3843143,232,786 384,580
Road & Bridge 0.25610.256181,922,344 209,803
LincolnLincoln County Ambulance District General Revenue 0.10670.2609827,816,857 883,281Clarence Cannon Memorial Subdist. General Revenue 0.18200.182011,185,523 20,358City of Elsberry General Revenue 0.50880.508816,198,649 82,419
64
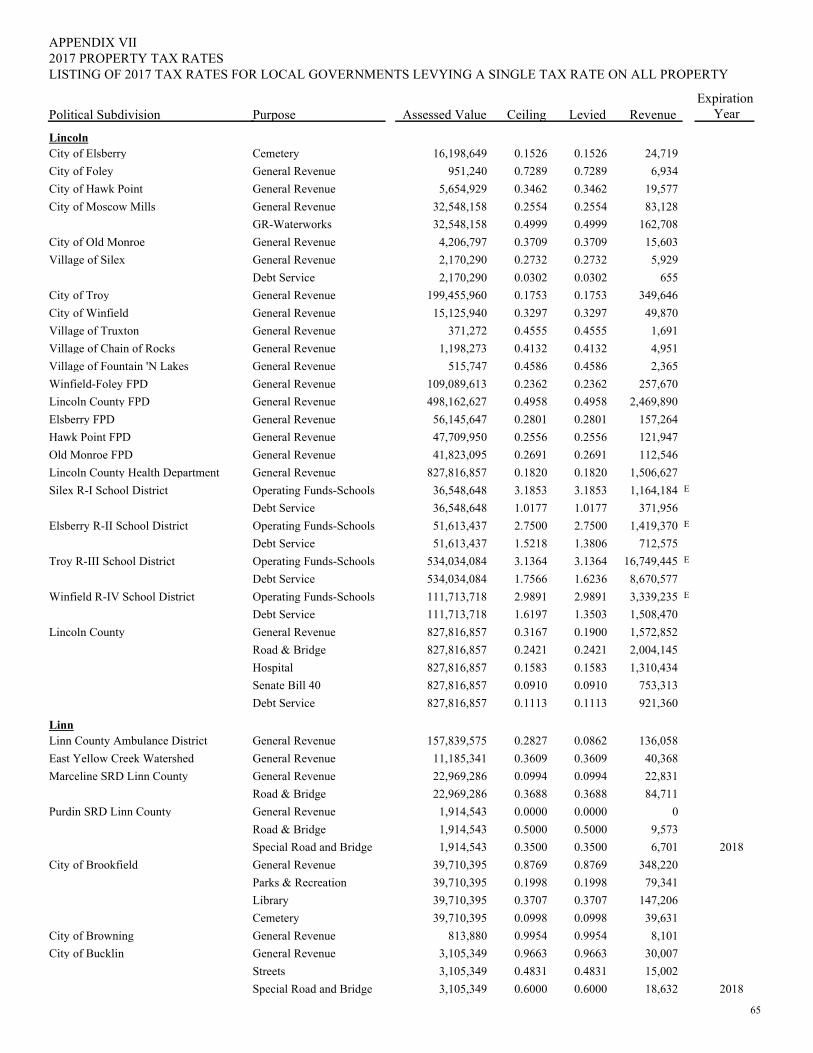
PurposePolitical Subdivision
2017 PROPERTY TAX RATESAPPENDIX VII
Assessed Value Ceiling Levied RevenueExpiration
Year
LISTING OF 2017 TAX RATES FOR LOCAL GOVERNMENTS LEVYING A SINGLE TAX RATE ON ALL PROPERTY
LincolnCity of Elsberry Cemetery 0.15260.152616,198,649 24,719City of Foley General Revenue 0.72890.7289951,240 6,934City of Hawk Point General Revenue 0.34620.34625,654,929 19,577City of Moscow Mills General Revenue 0.25540.255432,548,158 83,128
GR-Waterworks 0.49990.499932,548,158 162,708City of Old Monroe General Revenue 0.37090.37094,206,797 15,603Village of Silex General Revenue 0.27320.27322,170,290 5,929
Debt Service 0.03020.03022,170,290 655City of Troy General Revenue 0.17530.1753199,455,960 349,646City of Winfield General Revenue 0.32970.329715,125,940 49,870Village of Truxton General Revenue 0.45550.4555371,272 1,691Village of Chain of Rocks General Revenue 0.41320.41321,198,273 4,951Village of Fountain 'N Lakes General Revenue 0.45860.4586515,747 2,365Winfield-Foley FPD General Revenue 0.23620.2362109,089,613 257,670Lincoln County FPD General Revenue 0.49580.4958498,162,627 2,469,890Elsberry FPD General Revenue 0.28010.280156,145,647 157,264Hawk Point FPD General Revenue 0.25560.255647,709,950 121,947Old Monroe FPD General Revenue 0.26910.269141,823,095 112,546Lincoln County Health Department General Revenue 0.18200.1820827,816,857 1,506,627Silex R-I School District Operating Funds-Schools 3.18533.185336,548,648 E1,164,184
Debt Service 1.01771.017736,548,648 371,956Elsberry R-II School District Operating Funds-Schools 2.75002.750051,613,437 E1,419,370
Debt Service 1.38061.521851,613,437 712,575Troy R-III School District Operating Funds-Schools 3.13643.1364534,034,084 E16,749,445
Debt Service 1.62361.7566534,034,084 8,670,577Winfield R-IV School District Operating Funds-Schools 2.98912.9891111,713,718 E3,339,235
Debt Service 1.35031.6197111,713,718 1,508,470Lincoln County General Revenue 0.19000.3167827,816,857 1,572,852
Road & Bridge 0.24210.2421827,816,857 2,004,145Hospital 0.15830.1583827,816,857 1,310,434Senate Bill 40 0.09100.0910827,816,857 753,313Debt Service 0.11130.1113827,816,857 921,360
LinnLinn County Ambulance District General Revenue 0.08620.2827157,839,575 136,058East Yellow Creek Watershed General Revenue 0.36090.360911,185,341 40,368Marceline SRD Linn County General Revenue 0.09940.099422,969,286 22,831
Road & Bridge 0.36880.368822,969,286 84,711Purdin SRD Linn County General Revenue 0.00000.00001,914,543 0
Road & Bridge 0.50000.50001,914,543 9,573Special Road and Bridge 0.35000.35001,914,543 6,701 2018
City of Brookfield General Revenue 0.87690.876939,710,395 348,220Parks & Recreation 0.19980.199839,710,395 79,341Library 0.37070.370739,710,395 147,206Cemetery 0.09980.099839,710,395 39,631
City of Browning General Revenue 0.99540.9954813,880 8,101City of Bucklin General Revenue 0.96630.96633,105,349 30,007
Streets 0.48310.48313,105,349 15,002Special Road and Bridge 0.60000.60003,105,349 18,632 2018
65
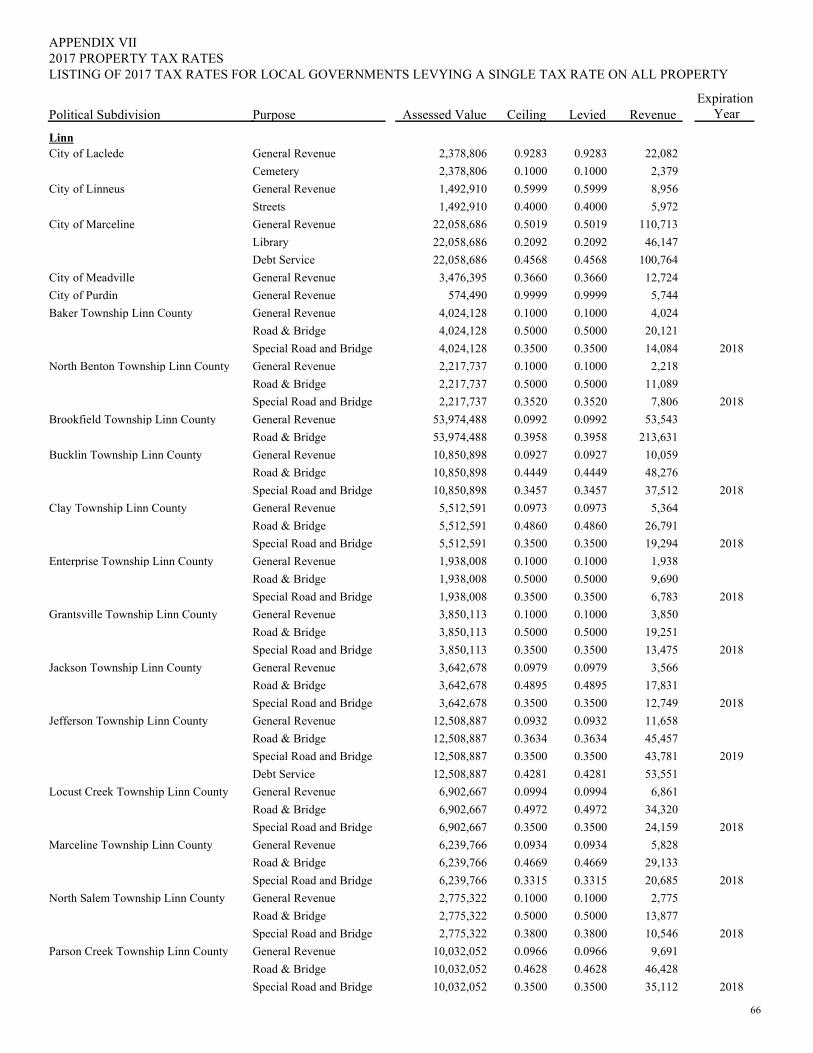
PurposePolitical Subdivision
2017 PROPERTY TAX RATESAPPENDIX VII
Assessed Value Ceiling Levied RevenueExpiration
Year
LISTING OF 2017 TAX RATES FOR LOCAL GOVERNMENTS LEVYING A SINGLE TAX RATE ON ALL PROPERTY
LinnCity of Laclede General Revenue 0.92830.92832,378,806 22,082
Cemetery 0.10000.10002,378,806 2,379City of Linneus General Revenue 0.59990.59991,492,910 8,956
Streets 0.40000.40001,492,910 5,972City of Marceline General Revenue 0.50190.501922,058,686 110,713
Library 0.20920.209222,058,686 46,147Debt Service 0.45680.456822,058,686 100,764
City of Meadville General Revenue 0.36600.36603,476,395 12,724City of Purdin General Revenue 0.99990.9999574,490 5,744Baker Township Linn County General Revenue 0.10000.10004,024,128 4,024
Road & Bridge 0.50000.50004,024,128 20,121Special Road and Bridge 0.35000.35004,024,128 14,084 2018
North Benton Township Linn County General Revenue 0.10000.10002,217,737 2,218Road & Bridge 0.50000.50002,217,737 11,089Special Road and Bridge 0.35200.35202,217,737 7,806 2018
Brookfield Township Linn County General Revenue 0.09920.099253,974,488 53,543Road & Bridge 0.39580.395853,974,488 213,631
Bucklin Township Linn County General Revenue 0.09270.092710,850,898 10,059Road & Bridge 0.44490.444910,850,898 48,276Special Road and Bridge 0.34570.345710,850,898 37,512 2018
Clay Township Linn County General Revenue 0.09730.09735,512,591 5,364Road & Bridge 0.48600.48605,512,591 26,791Special Road and Bridge 0.35000.35005,512,591 19,294 2018
Enterprise Township Linn County General Revenue 0.10000.10001,938,008 1,938Road & Bridge 0.50000.50001,938,008 9,690Special Road and Bridge 0.35000.35001,938,008 6,783 2018
Grantsville Township Linn County General Revenue 0.10000.10003,850,113 3,850Road & Bridge 0.50000.50003,850,113 19,251Special Road and Bridge 0.35000.35003,850,113 13,475 2018
Jackson Township Linn County General Revenue 0.09790.09793,642,678 3,566Road & Bridge 0.48950.48953,642,678 17,831Special Road and Bridge 0.35000.35003,642,678 12,749 2018
Jefferson Township Linn County General Revenue 0.09320.093212,508,887 11,658Road & Bridge 0.36340.363412,508,887 45,457Special Road and Bridge 0.35000.350012,508,887 43,781 2019Debt Service 0.42810.428112,508,887 53,551
Locust Creek Township Linn County General Revenue 0.09940.09946,902,667 6,861Road & Bridge 0.49720.49726,902,667 34,320Special Road and Bridge 0.35000.35006,902,667 24,159 2018
Marceline Township Linn County General Revenue 0.09340.09346,239,766 5,828Road & Bridge 0.46690.46696,239,766 29,133Special Road and Bridge 0.33150.33156,239,766 20,685 2018
North Salem Township Linn County General Revenue 0.10000.10002,775,322 2,775Road & Bridge 0.50000.50002,775,322 13,877Special Road and Bridge 0.38000.38002,775,322 10,546 2018
Parson Creek Township Linn County General Revenue 0.09660.096610,032,052 9,691Road & Bridge 0.46280.462810,032,052 46,428Special Road and Bridge 0.35000.350010,032,052 35,112 2018
66
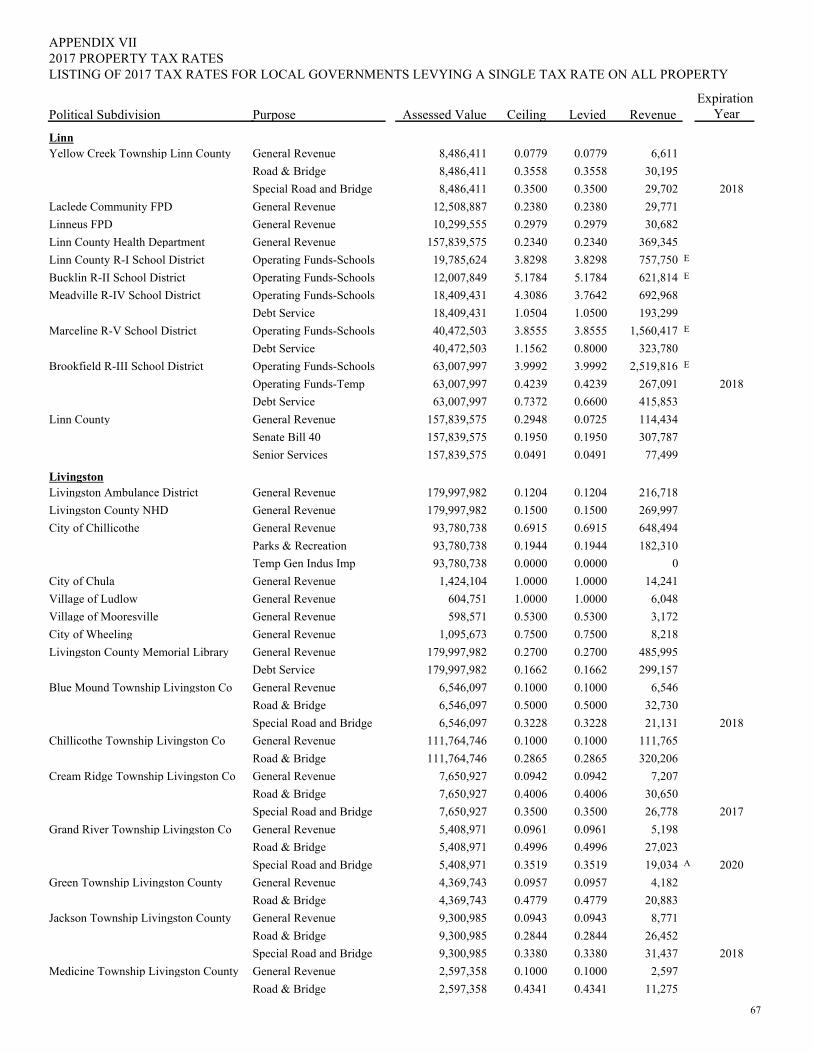
PurposePolitical Subdivision
2017 PROPERTY TAX RATESAPPENDIX VII
Assessed Value Ceiling Levied RevenueExpiration
Year
LISTING OF 2017 TAX RATES FOR LOCAL GOVERNMENTS LEVYING A SINGLE TAX RATE ON ALL PROPERTY
LinnYellow Creek Township Linn County General Revenue 0.07790.07798,486,411 6,611
Road & Bridge 0.35580.35588,486,411 30,195Special Road and Bridge 0.35000.35008,486,411 29,702 2018
Laclede Community FPD General Revenue 0.23800.238012,508,887 29,771Linneus FPD General Revenue 0.29790.297910,299,555 30,682Linn County Health Department General Revenue 0.23400.2340157,839,575 369,345Linn County R-I School District Operating Funds-Schools 3.82983.829819,785,624 E757,750Bucklin R-II School District Operating Funds-Schools 5.17845.178412,007,849 E621,814Meadville R-IV School District Operating Funds-Schools 3.76424.308618,409,431 692,968
Debt Service 1.05001.050418,409,431 193,299Marceline R-V School District Operating Funds-Schools 3.85553.855540,472,503 E1,560,417
Debt Service 0.80001.156240,472,503 323,780Brookfield R-III School District Operating Funds-Schools 3.99923.999263,007,997 E2,519,816
Operating Funds-Temp 0.42390.423963,007,997 267,091 2018Debt Service 0.66000.737263,007,997 415,853
Linn County General Revenue 0.07250.2948157,839,575 114,434Senate Bill 40 0.19500.1950157,839,575 307,787Senior Services 0.04910.0491157,839,575 77,499
LivingstonLivingston Ambulance District General Revenue 0.12040.1204179,997,982 216,718Livingston County NHD General Revenue 0.15000.1500179,997,982 269,997City of Chillicothe General Revenue 0.69150.691593,780,738 648,494
Parks & Recreation 0.19440.194493,780,738 182,310Temp Gen Indus Imp 0.00000.000093,780,738 0
City of Chula General Revenue 1.00001.00001,424,104 14,241Village of Ludlow General Revenue 1.00001.0000604,751 6,048Village of Mooresville General Revenue 0.53000.5300598,571 3,172City of Wheeling General Revenue 0.75000.75001,095,673 8,218Livingston County Memorial Library General Revenue 0.27000.2700179,997,982 485,995
Debt Service 0.16620.1662179,997,982 299,157Blue Mound Township Livingston Co General Revenue 0.10000.10006,546,097 6,546
Road & Bridge 0.50000.50006,546,097 32,730Special Road and Bridge 0.32280.32286,546,097 21,131 2018
Chillicothe Township Livingston Co General Revenue 0.10000.1000111,764,746 111,765Road & Bridge 0.28650.2865111,764,746 320,206
Cream Ridge Township Livingston Co General Revenue 0.09420.09427,650,927 7,207Road & Bridge 0.40060.40067,650,927 30,650Special Road and Bridge 0.35000.35007,650,927 26,778 2017
Grand River Township Livingston Co General Revenue 0.09610.09615,408,971 5,198Road & Bridge 0.49960.49965,408,971 27,023Special Road and Bridge 0.35190.35195,408,971 A19,034 2020
Green Township Livingston County General Revenue 0.09570.09574,369,743 4,182Road & Bridge 0.47790.47794,369,743 20,883
Jackson Township Livingston County General Revenue 0.09430.09439,300,985 8,771Road & Bridge 0.28440.28449,300,985 26,452Special Road and Bridge 0.33800.33809,300,985 31,437 2018
Medicine Township Livingston County General Revenue 0.10000.10002,597,358 2,597Road & Bridge 0.43410.43412,597,358 11,275
67
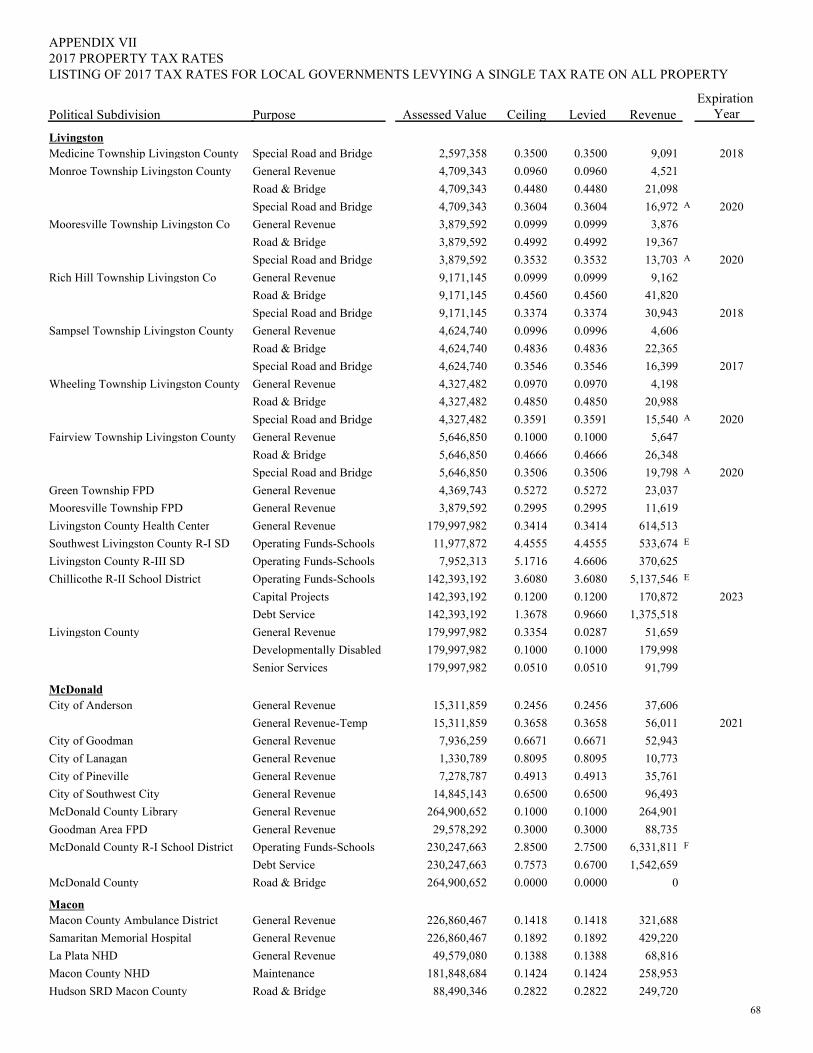
PurposePolitical Subdivision
2017 PROPERTY TAX RATESAPPENDIX VII
Assessed Value Ceiling Levied RevenueExpiration
Year
LISTING OF 2017 TAX RATES FOR LOCAL GOVERNMENTS LEVYING A SINGLE TAX RATE ON ALL PROPERTY
LivingstonMedicine Township Livingston County Special Road and Bridge 0.35000.35002,597,358 9,091 2018Monroe Township Livingston County General Revenue 0.09600.09604,709,343 4,521
Road & Bridge 0.44800.44804,709,343 21,098Special Road and Bridge 0.36040.36044,709,343 A16,972 2020
Mooresville Township Livingston Co General Revenue 0.09990.09993,879,592 3,876Road & Bridge 0.49920.49923,879,592 19,367Special Road and Bridge 0.35320.35323,879,592 A13,703 2020
Rich Hill Township Livingston Co General Revenue 0.09990.09999,171,145 9,162Road & Bridge 0.45600.45609,171,145 41,820Special Road and Bridge 0.33740.33749,171,145 30,943 2018
Sampsel Township Livingston County General Revenue 0.09960.09964,624,740 4,606Road & Bridge 0.48360.48364,624,740 22,365Special Road and Bridge 0.35460.35464,624,740 16,399 2017
Wheeling Township Livingston County General Revenue 0.09700.09704,327,482 4,198Road & Bridge 0.48500.48504,327,482 20,988Special Road and Bridge 0.35910.35914,327,482 A15,540 2020
Fairview Township Livingston County General Revenue 0.10000.10005,646,850 5,647Road & Bridge 0.46660.46665,646,850 26,348Special Road and Bridge 0.35060.35065,646,850 A19,798 2020
Green Township FPD General Revenue 0.52720.52724,369,743 23,037Mooresville Township FPD General Revenue 0.29950.29953,879,592 11,619Livingston County Health Center General Revenue 0.34140.3414179,997,982 614,513Southwest Livingston County R-I SD Operating Funds-Schools 4.45554.455511,977,872 E533,674Livingston County R-III SD Operating Funds-Schools 4.66065.17167,952,313 370,625Chillicothe R-II School District Operating Funds-Schools 3.60803.6080142,393,192 E5,137,546
Capital Projects 0.12000.1200142,393,192 170,872 2023Debt Service 0.96601.3678142,393,192 1,375,518
Livingston County General Revenue 0.02870.3354179,997,982 51,659Developmentally Disabled 0.10000.1000179,997,982 179,998Senior Services 0.05100.0510179,997,982 91,799
McDonaldCity of Anderson General Revenue 0.24560.245615,311,859 37,606
General Revenue-Temp 0.36580.365815,311,859 56,011 2021City of Goodman General Revenue 0.66710.66717,936,259 52,943City of Lanagan General Revenue 0.80950.80951,330,789 10,773City of Pineville General Revenue 0.49130.49137,278,787 35,761City of Southwest City General Revenue 0.65000.650014,845,143 96,493McDonald County Library General Revenue 0.10000.1000264,900,652 264,901Goodman Area FPD General Revenue 0.30000.300029,578,292 88,735McDonald County R-I School District Operating Funds-Schools 2.75002.8500230,247,663 F6,331,811
Debt Service 0.67000.7573230,247,663 1,542,659McDonald County Road & Bridge 0.00000.0000264,900,652 0
MaconMacon County Ambulance District General Revenue 0.14180.1418226,860,467 321,688Samaritan Memorial Hospital General Revenue 0.18920.1892226,860,467 429,220La Plata NHD General Revenue 0.13880.138849,579,080 68,816Macon County NHD Maintenance 0.14240.1424181,848,684 258,953Hudson SRD Macon County Road & Bridge 0.28220.282288,490,346 249,720
68
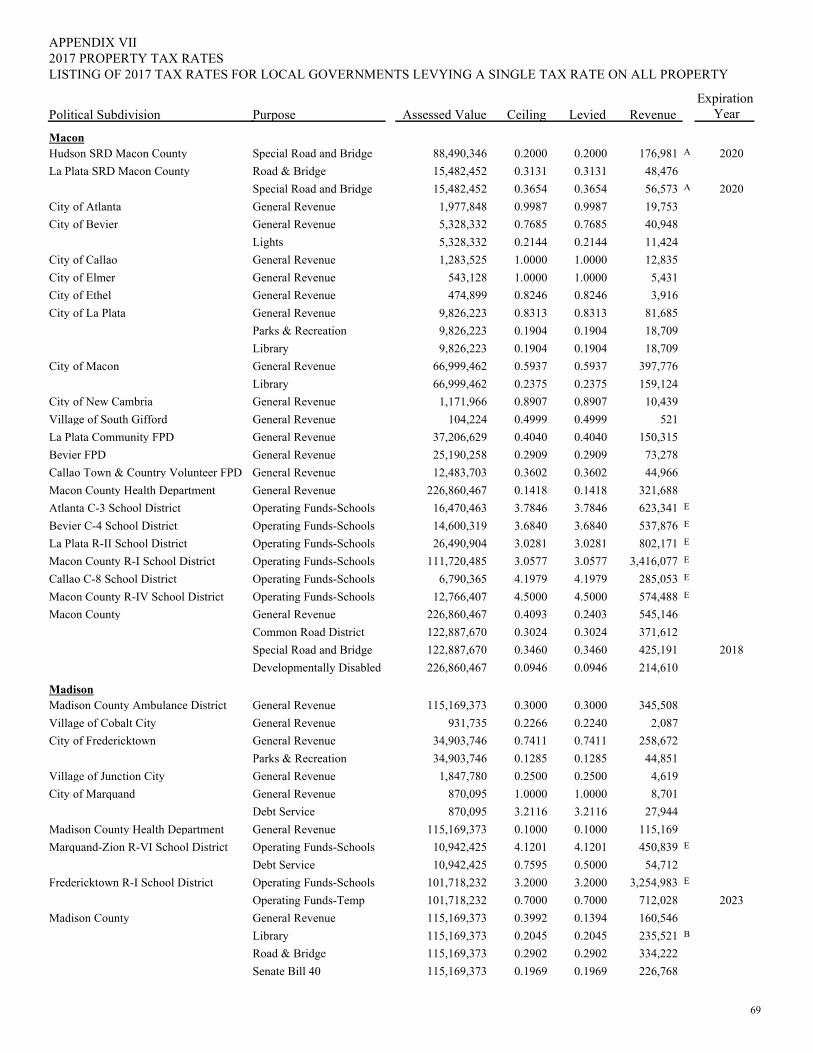
PurposePolitical Subdivision
2017 PROPERTY TAX RATESAPPENDIX VII
Assessed Value Ceiling Levied RevenueExpiration
Year
LISTING OF 2017 TAX RATES FOR LOCAL GOVERNMENTS LEVYING A SINGLE TAX RATE ON ALL PROPERTY
MaconHudson SRD Macon County Special Road and Bridge 0.20000.200088,490,346 A176,981 2020La Plata SRD Macon County Road & Bridge 0.31310.313115,482,452 48,476
Special Road and Bridge 0.36540.365415,482,452 A56,573 2020City of Atlanta General Revenue 0.99870.99871,977,848 19,753City of Bevier General Revenue 0.76850.76855,328,332 40,948
Lights 0.21440.21445,328,332 11,424City of Callao General Revenue 1.00001.00001,283,525 12,835City of Elmer General Revenue 1.00001.0000543,128 5,431City of Ethel General Revenue 0.82460.8246474,899 3,916City of La Plata General Revenue 0.83130.83139,826,223 81,685
Parks & Recreation 0.19040.19049,826,223 18,709Library 0.19040.19049,826,223 18,709
City of Macon General Revenue 0.59370.593766,999,462 397,776Library 0.23750.237566,999,462 159,124
City of New Cambria General Revenue 0.89070.89071,171,966 10,439Village of South Gifford General Revenue 0.49990.4999104,224 521La Plata Community FPD General Revenue 0.40400.404037,206,629 150,315Bevier FPD General Revenue 0.29090.290925,190,258 73,278Callao Town & Country Volunteer FPD General Revenue 0.36020.360212,483,703 44,966Macon County Health Department General Revenue 0.14180.1418226,860,467 321,688Atlanta C-3 School District Operating Funds-Schools 3.78463.784616,470,463 E623,341Bevier C-4 School District Operating Funds-Schools 3.68403.684014,600,319 E537,876La Plata R-II School District Operating Funds-Schools 3.02813.028126,490,904 E802,171Macon County R-I School District Operating Funds-Schools 3.05773.0577111,720,485 E3,416,077Callao C-8 School District Operating Funds-Schools 4.19794.19796,790,365 E285,053Macon County R-IV School District Operating Funds-Schools 4.50004.500012,766,407 E574,488Macon County General Revenue 0.24030.4093226,860,467 545,146
Common Road District 0.30240.3024122,887,670 371,612Special Road and Bridge 0.34600.3460122,887,670 425,191 2018Developmentally Disabled 0.09460.0946226,860,467 214,610
MadisonMadison County Ambulance District General Revenue 0.30000.3000115,169,373 345,508Village of Cobalt City General Revenue 0.22400.2266931,735 2,087City of Fredericktown General Revenue 0.74110.741134,903,746 258,672
Parks & Recreation 0.12850.128534,903,746 44,851Village of Junction City General Revenue 0.25000.25001,847,780 4,619City of Marquand General Revenue 1.00001.0000870,095 8,701
Debt Service 3.21163.2116870,095 27,944Madison County Health Department General Revenue 0.10000.1000115,169,373 115,169Marquand-Zion R-VI School District Operating Funds-Schools 4.12014.120110,942,425 E450,839
Debt Service 0.50000.759510,942,425 54,712Fredericktown R-I School District Operating Funds-Schools 3.20003.2000101,718,232 E3,254,983
Operating Funds-Temp 0.70000.7000101,718,232 712,028 2023Madison County General Revenue 0.13940.3992115,169,373 160,546
Library 0.20450.2045115,169,373 B235,521Road & Bridge 0.29020.2902115,169,373 334,222Senate Bill 40 0.19690.1969115,169,373 226,768
69
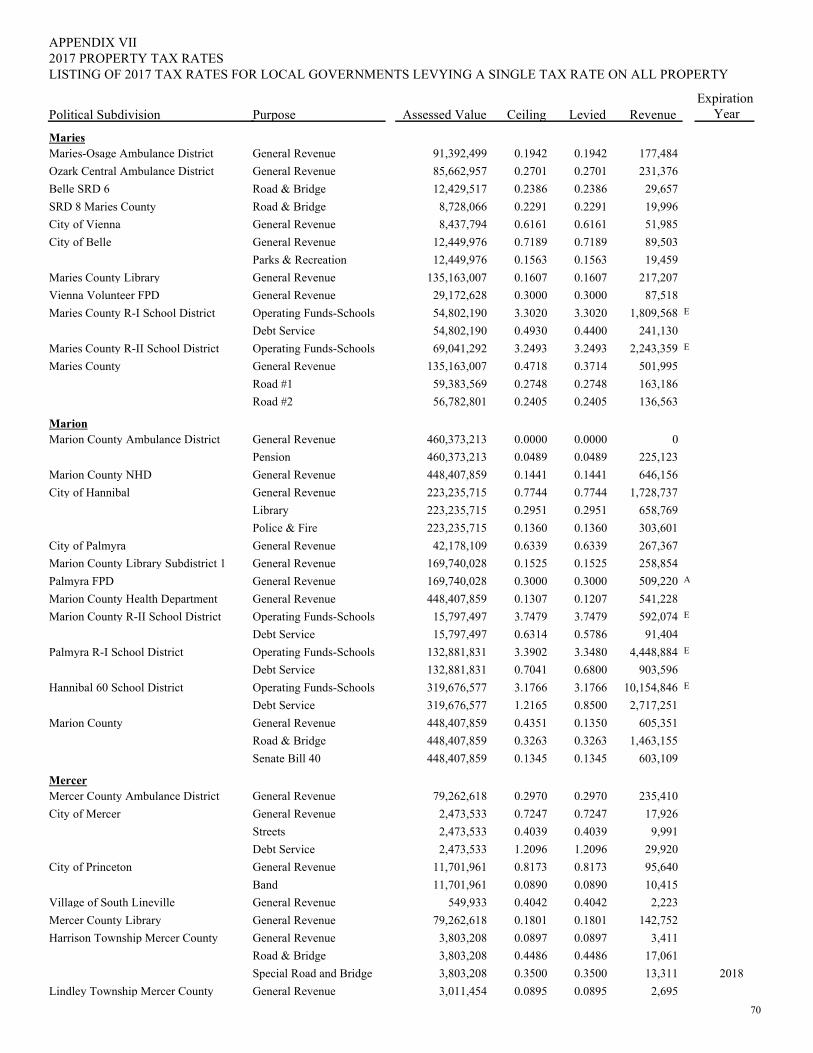
PurposePolitical Subdivision
2017 PROPERTY TAX RATESAPPENDIX VII
Assessed Value Ceiling Levied RevenueExpiration
Year
LISTING OF 2017 TAX RATES FOR LOCAL GOVERNMENTS LEVYING A SINGLE TAX RATE ON ALL PROPERTY
MariesMaries-Osage Ambulance District General Revenue 0.19420.194291,392,499 177,484Ozark Central Ambulance District General Revenue 0.27010.270185,662,957 231,376Belle SRD 6 Road & Bridge 0.23860.238612,429,517 29,657SRD 8 Maries County Road & Bridge 0.22910.22918,728,066 19,996City of Vienna General Revenue 0.61610.61618,437,794 51,985City of Belle General Revenue 0.71890.718912,449,976 89,503
Parks & Recreation 0.15630.156312,449,976 19,459Maries County Library General Revenue 0.16070.1607135,163,007 217,207Vienna Volunteer FPD General Revenue 0.30000.300029,172,628 87,518Maries County R-I School District Operating Funds-Schools 3.30203.302054,802,190 E1,809,568
Debt Service 0.44000.493054,802,190 241,130Maries County R-II School District Operating Funds-Schools 3.24933.249369,041,292 E2,243,359Maries County General Revenue 0.37140.4718135,163,007 501,995
Road #1 0.27480.274859,383,569 163,186Road #2 0.24050.240556,782,801 136,563
MarionMarion County Ambulance District General Revenue 0.00000.0000460,373,213 0
Pension 0.04890.0489460,373,213 225,123Marion County NHD General Revenue 0.14410.1441448,407,859 646,156City of Hannibal General Revenue 0.77440.7744223,235,715 1,728,737
Library 0.29510.2951223,235,715 658,769Police & Fire 0.13600.1360223,235,715 303,601
City of Palmyra General Revenue 0.63390.633942,178,109 267,367Marion County Library Subdistrict 1 General Revenue 0.15250.1525169,740,028 258,854Palmyra FPD General Revenue 0.30000.3000169,740,028 A509,220Marion County Health Department General Revenue 0.12070.1307448,407,859 541,228Marion County R-II School District Operating Funds-Schools 3.74793.747915,797,497 E592,074
Debt Service 0.57860.631415,797,497 91,404Palmyra R-I School District Operating Funds-Schools 3.34803.3902132,881,831 E4,448,884
Debt Service 0.68000.7041132,881,831 903,596Hannibal 60 School District Operating Funds-Schools 3.17663.1766319,676,577 E10,154,846
Debt Service 0.85001.2165319,676,577 2,717,251Marion County General Revenue 0.13500.4351448,407,859 605,351
Road & Bridge 0.32630.3263448,407,859 1,463,155Senate Bill 40 0.13450.1345448,407,859 603,109
MercerMercer County Ambulance District General Revenue 0.29700.297079,262,618 235,410City of Mercer General Revenue 0.72470.72472,473,533 17,926
Streets 0.40390.40392,473,533 9,991Debt Service 1.20961.20962,473,533 29,920
City of Princeton General Revenue 0.81730.817311,701,961 95,640Band 0.08900.089011,701,961 10,415
Village of South Lineville General Revenue 0.40420.4042549,933 2,223Mercer County Library General Revenue 0.18010.180179,262,618 142,752Harrison Township Mercer County General Revenue 0.08970.08973,803,208 3,411
Road & Bridge 0.44860.44863,803,208 17,061Special Road and Bridge 0.35000.35003,803,208 13,311 2018
Lindley Township Mercer County General Revenue 0.08950.08953,011,454 2,69570
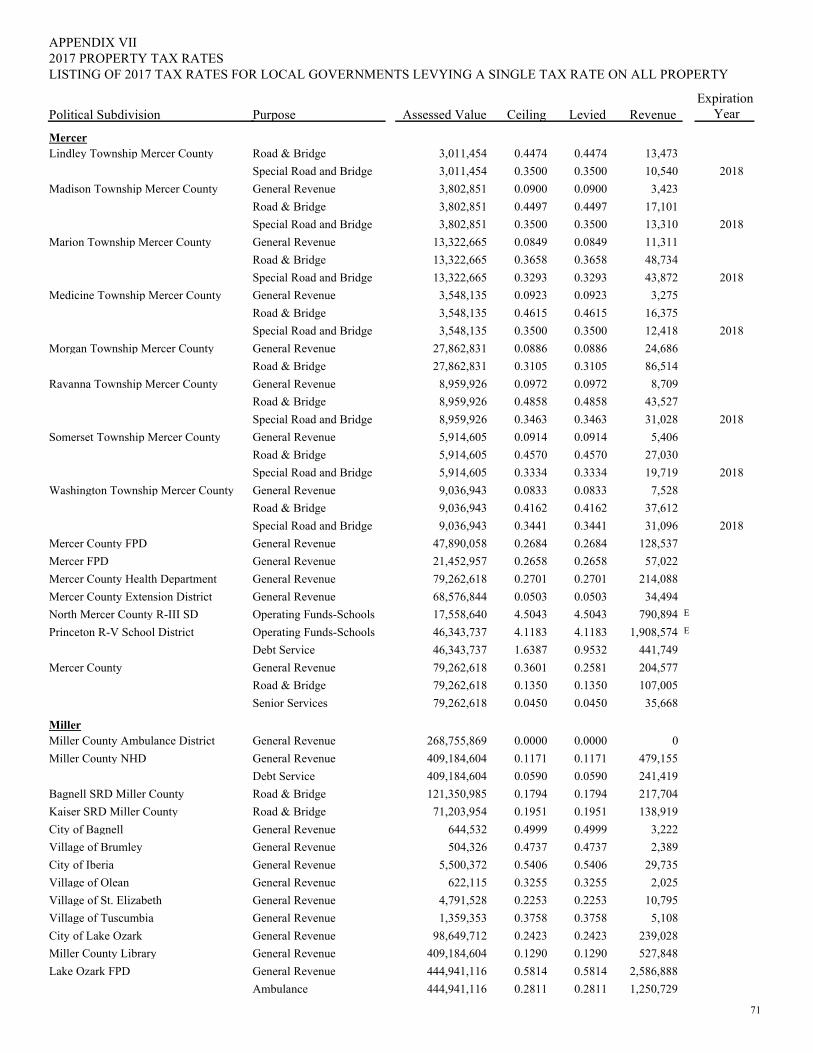
PurposePolitical Subdivision
2017 PROPERTY TAX RATESAPPENDIX VII
Assessed Value Ceiling Levied RevenueExpiration
Year
LISTING OF 2017 TAX RATES FOR LOCAL GOVERNMENTS LEVYING A SINGLE TAX RATE ON ALL PROPERTY
MercerLindley Township Mercer County Road & Bridge 0.44740.44743,011,454 13,473
Special Road and Bridge 0.35000.35003,011,454 10,540 2018Madison Township Mercer County General Revenue 0.09000.09003,802,851 3,423
Road & Bridge 0.44970.44973,802,851 17,101Special Road and Bridge 0.35000.35003,802,851 13,310 2018
Marion Township Mercer County General Revenue 0.08490.084913,322,665 11,311Road & Bridge 0.36580.365813,322,665 48,734Special Road and Bridge 0.32930.329313,322,665 43,872 2018
Medicine Township Mercer County General Revenue 0.09230.09233,548,135 3,275Road & Bridge 0.46150.46153,548,135 16,375Special Road and Bridge 0.35000.35003,548,135 12,418 2018
Morgan Township Mercer County General Revenue 0.08860.088627,862,831 24,686Road & Bridge 0.31050.310527,862,831 86,514
Ravanna Township Mercer County General Revenue 0.09720.09728,959,926 8,709Road & Bridge 0.48580.48588,959,926 43,527Special Road and Bridge 0.34630.34638,959,926 31,028 2018
Somerset Township Mercer County General Revenue 0.09140.09145,914,605 5,406Road & Bridge 0.45700.45705,914,605 27,030Special Road and Bridge 0.33340.33345,914,605 19,719 2018
Washington Township Mercer County General Revenue 0.08330.08339,036,943 7,528Road & Bridge 0.41620.41629,036,943 37,612Special Road and Bridge 0.34410.34419,036,943 31,096 2018
Mercer County FPD General Revenue 0.26840.268447,890,058 128,537Mercer FPD General Revenue 0.26580.265821,452,957 57,022Mercer County Health Department General Revenue 0.27010.270179,262,618 214,088Mercer County Extension District General Revenue 0.05030.050368,576,844 34,494North Mercer County R-III SD Operating Funds-Schools 4.50434.504317,558,640 E790,894Princeton R-V School District Operating Funds-Schools 4.11834.118346,343,737 E1,908,574
Debt Service 0.95321.638746,343,737 441,749Mercer County General Revenue 0.25810.360179,262,618 204,577
Road & Bridge 0.13500.135079,262,618 107,005Senior Services 0.04500.045079,262,618 35,668
MillerMiller County Ambulance District General Revenue 0.00000.0000268,755,869 0Miller County NHD General Revenue 0.11710.1171409,184,604 479,155
Debt Service 0.05900.0590409,184,604 241,419Bagnell SRD Miller County Road & Bridge 0.17940.1794121,350,985 217,704Kaiser SRD Miller County Road & Bridge 0.19510.195171,203,954 138,919City of Bagnell General Revenue 0.49990.4999644,532 3,222Village of Brumley General Revenue 0.47370.4737504,326 2,389City of Iberia General Revenue 0.54060.54065,500,372 29,735Village of Olean General Revenue 0.32550.3255622,115 2,025Village of St. Elizabeth General Revenue 0.22530.22534,791,528 10,795Village of Tuscumbia General Revenue 0.37580.37581,359,353 5,108City of Lake Ozark General Revenue 0.24230.242398,649,712 239,028Miller County Library General Revenue 0.12900.1290409,184,604 527,848Lake Ozark FPD General Revenue 0.58140.5814444,941,116 2,586,888
Ambulance 0.28110.2811444,941,116 1,250,729
71
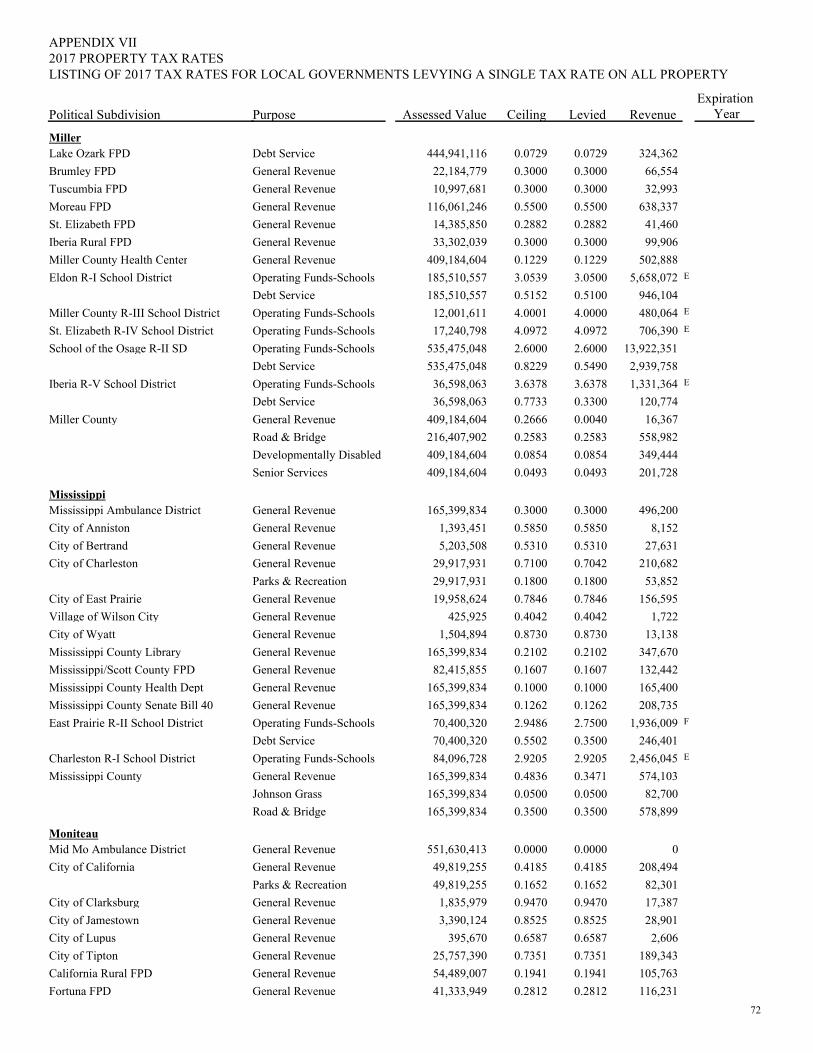
PurposePolitical Subdivision
2017 PROPERTY TAX RATESAPPENDIX VII
Assessed Value Ceiling Levied RevenueExpiration
Year
LISTING OF 2017 TAX RATES FOR LOCAL GOVERNMENTS LEVYING A SINGLE TAX RATE ON ALL PROPERTY
MillerLake Ozark FPD Debt Service 0.07290.0729444,941,116 324,362Brumley FPD General Revenue 0.30000.300022,184,779 66,554Tuscumbia FPD General Revenue 0.30000.300010,997,681 32,993Moreau FPD General Revenue 0.55000.5500116,061,246 638,337St. Elizabeth FPD General Revenue 0.28820.288214,385,850 41,460Iberia Rural FPD General Revenue 0.30000.300033,302,039 99,906Miller County Health Center General Revenue 0.12290.1229409,184,604 502,888Eldon R-I School District Operating Funds-Schools 3.05003.0539185,510,557 E5,658,072
Debt Service 0.51000.5152185,510,557 946,104Miller County R-III School District Operating Funds-Schools 4.00004.000112,001,611 E480,064St. Elizabeth R-IV School District Operating Funds-Schools 4.09724.097217,240,798 E706,390School of the Osage R-II SD Operating Funds-Schools 2.60002.6000535,475,048 13,922,351
Debt Service 0.54900.8229535,475,048 2,939,758Iberia R-V School District Operating Funds-Schools 3.63783.637836,598,063 E1,331,364
Debt Service 0.33000.773336,598,063 120,774Miller County General Revenue 0.00400.2666409,184,604 16,367
Road & Bridge 0.25830.2583216,407,902 558,982Developmentally Disabled 0.08540.0854409,184,604 349,444Senior Services 0.04930.0493409,184,604 201,728
MississippiMississippi Ambulance District General Revenue 0.30000.3000165,399,834 496,200City of Anniston General Revenue 0.58500.58501,393,451 8,152City of Bertrand General Revenue 0.53100.53105,203,508 27,631City of Charleston General Revenue 0.70420.710029,917,931 210,682
Parks & Recreation 0.18000.180029,917,931 53,852City of East Prairie General Revenue 0.78460.784619,958,624 156,595Village of Wilson City General Revenue 0.40420.4042425,925 1,722City of Wyatt General Revenue 0.87300.87301,504,894 13,138Mississippi County Library General Revenue 0.21020.2102165,399,834 347,670Mississippi/Scott County FPD General Revenue 0.16070.160782,415,855 132,442Mississippi County Health Dept General Revenue 0.10000.1000165,399,834 165,400Mississippi County Senate Bill 40 General Revenue 0.12620.1262165,399,834 208,735East Prairie R-II School District Operating Funds-Schools 2.75002.948670,400,320 F1,936,009
Debt Service 0.35000.550270,400,320 246,401Charleston R-I School District Operating Funds-Schools 2.92052.920584,096,728 E2,456,045Mississippi County General Revenue 0.34710.4836165,399,834 574,103
Johnson Grass 0.05000.0500165,399,834 82,700Road & Bridge 0.35000.3500165,399,834 578,899
MoniteauMid Mo Ambulance District General Revenue 0.00000.0000551,630,413 0City of California General Revenue 0.41850.418549,819,255 208,494
Parks & Recreation 0.16520.165249,819,255 82,301City of Clarksburg General Revenue 0.94700.94701,835,979 17,387City of Jamestown General Revenue 0.85250.85253,390,124 28,901City of Lupus General Revenue 0.65870.6587395,670 2,606City of Tipton General Revenue 0.73510.735125,757,390 189,343California Rural FPD General Revenue 0.19410.194154,489,007 105,763Fortuna FPD General Revenue 0.28120.281241,333,949 116,231
72
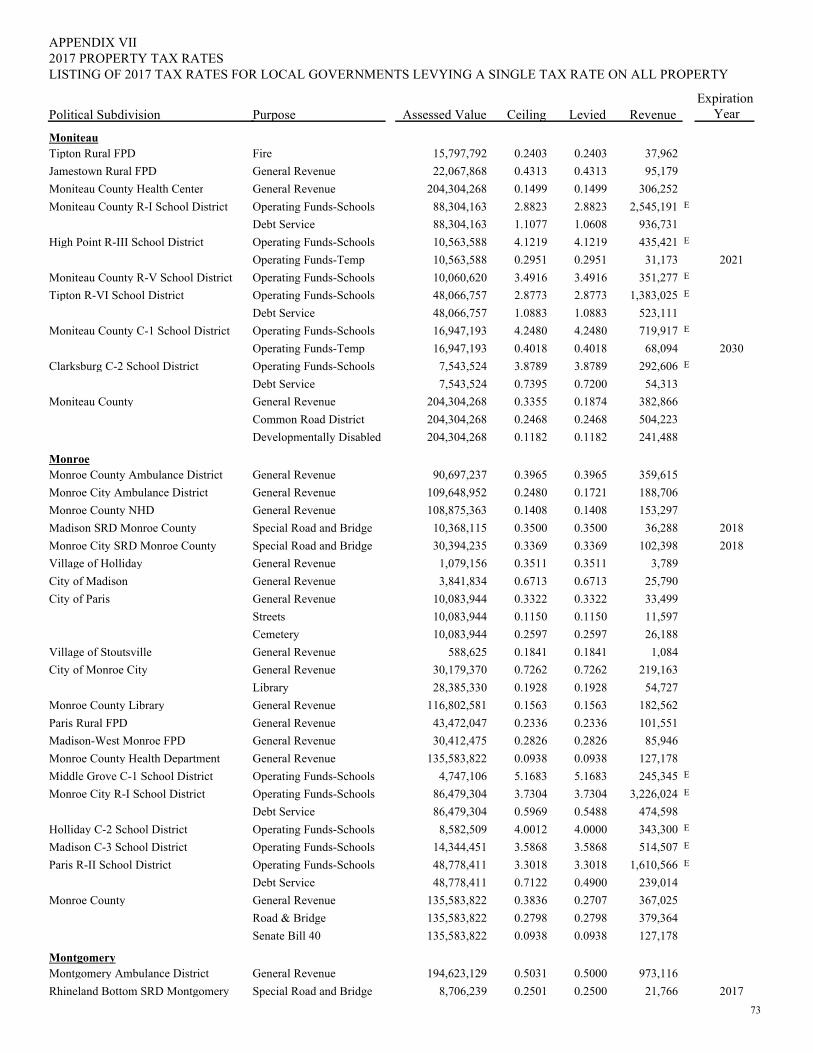
PurposePolitical Subdivision
2017 PROPERTY TAX RATESAPPENDIX VII
Assessed Value Ceiling Levied RevenueExpiration
Year
LISTING OF 2017 TAX RATES FOR LOCAL GOVERNMENTS LEVYING A SINGLE TAX RATE ON ALL PROPERTY
MoniteauTipton Rural FPD Fire 0.24030.240315,797,792 37,962Jamestown Rural FPD General Revenue 0.43130.431322,067,868 95,179Moniteau County Health Center General Revenue 0.14990.1499204,304,268 306,252Moniteau County R-I School District Operating Funds-Schools 2.88232.882388,304,163 E2,545,191
Debt Service 1.06081.107788,304,163 936,731High Point R-III School District Operating Funds-Schools 4.12194.121910,563,588 E435,421
Operating Funds-Temp 0.29510.295110,563,588 31,173 2021Moniteau County R-V School District Operating Funds-Schools 3.49163.491610,060,620 E351,277Tipton R-VI School District Operating Funds-Schools 2.87732.877348,066,757 E1,383,025
Debt Service 1.08831.088348,066,757 523,111Moniteau County C-1 School District Operating Funds-Schools 4.24804.248016,947,193 E719,917
Operating Funds-Temp 0.40180.401816,947,193 68,094 2030Clarksburg C-2 School District Operating Funds-Schools 3.87893.87897,543,524 E292,606
Debt Service 0.72000.73957,543,524 54,313Moniteau County General Revenue 0.18740.3355204,304,268 382,866
Common Road District 0.24680.2468204,304,268 504,223Developmentally Disabled 0.11820.1182204,304,268 241,488
MonroeMonroe County Ambulance District General Revenue 0.39650.396590,697,237 359,615Monroe City Ambulance District General Revenue 0.17210.2480109,648,952 188,706Monroe County NHD General Revenue 0.14080.1408108,875,363 153,297Madison SRD Monroe County Special Road and Bridge 0.35000.350010,368,115 36,288 2018Monroe City SRD Monroe County Special Road and Bridge 0.33690.336930,394,235 102,398 2018Village of Holliday General Revenue 0.35110.35111,079,156 3,789City of Madison General Revenue 0.67130.67133,841,834 25,790City of Paris General Revenue 0.33220.332210,083,944 33,499
Streets 0.11500.115010,083,944 11,597Cemetery 0.25970.259710,083,944 26,188
Village of Stoutsville General Revenue 0.18410.1841588,625 1,084City of Monroe City General Revenue 0.72620.726230,179,370 219,163
Library 0.19280.192828,385,330 54,727Monroe County Library General Revenue 0.15630.1563116,802,581 182,562Paris Rural FPD General Revenue 0.23360.233643,472,047 101,551Madison-West Monroe FPD General Revenue 0.28260.282630,412,475 85,946Monroe County Health Department General Revenue 0.09380.0938135,583,822 127,178Middle Grove C-1 School District Operating Funds-Schools 5.16835.16834,747,106 E245,345Monroe City R-I School District Operating Funds-Schools 3.73043.730486,479,304 E3,226,024
Debt Service 0.54880.596986,479,304 474,598Holliday C-2 School District Operating Funds-Schools 4.00004.00128,582,509 E343,300Madison C-3 School District Operating Funds-Schools 3.58683.586814,344,451 E514,507Paris R-II School District Operating Funds-Schools 3.30183.301848,778,411 E1,610,566
Debt Service 0.49000.712248,778,411 239,014Monroe County General Revenue 0.27070.3836135,583,822 367,025
Road & Bridge 0.27980.2798135,583,822 379,364Senate Bill 40 0.09380.0938135,583,822 127,178
MontgomeryMontgomery Ambulance District General Revenue 0.50000.5031194,623,129 973,116Rhineland Bottom SRD Montgomery Special Road and Bridge 0.25000.25018,706,239 21,766 2017
73
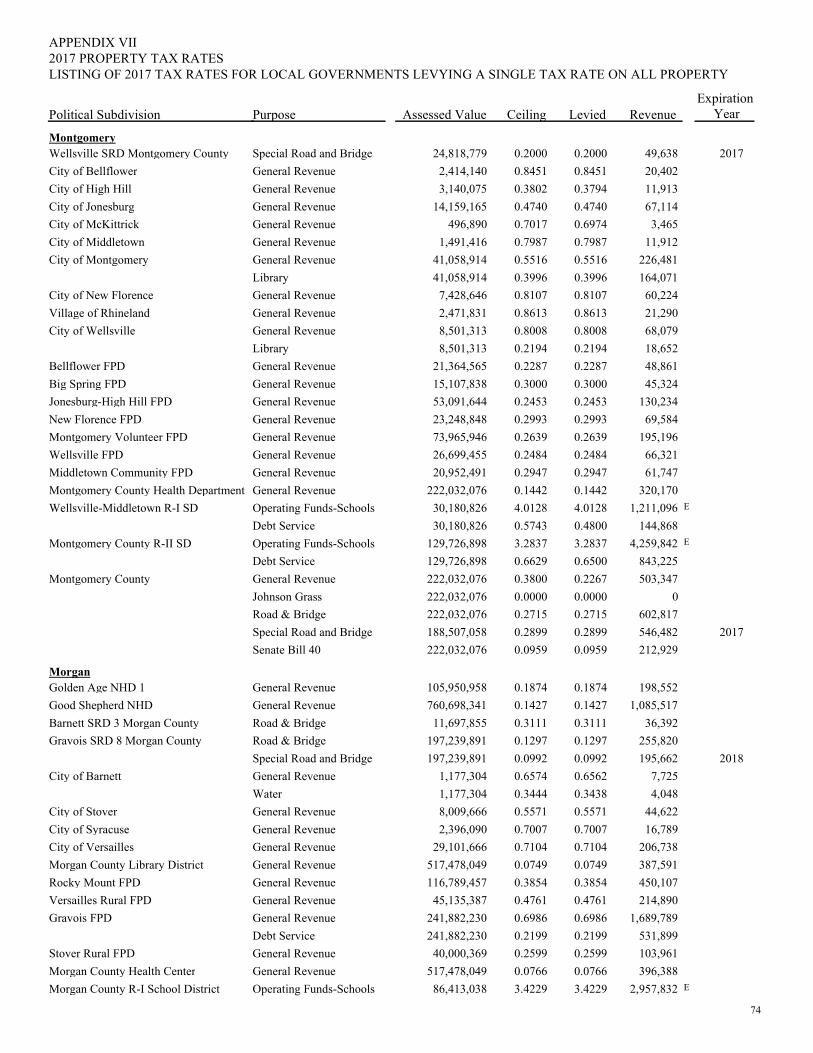
PurposePolitical Subdivision
2017 PROPERTY TAX RATESAPPENDIX VII
Assessed Value Ceiling Levied RevenueExpiration
Year
LISTING OF 2017 TAX RATES FOR LOCAL GOVERNMENTS LEVYING A SINGLE TAX RATE ON ALL PROPERTY
MontgomeryWellsville SRD Montgomery County Special Road and Bridge 0.20000.200024,818,779 49,638 2017City of Bellflower General Revenue 0.84510.84512,414,140 20,402City of High Hill General Revenue 0.37940.38023,140,075 11,913City of Jonesburg General Revenue 0.47400.474014,159,165 67,114City of McKittrick General Revenue 0.69740.7017496,890 3,465City of Middletown General Revenue 0.79870.79871,491,416 11,912City of Montgomery General Revenue 0.55160.551641,058,914 226,481
Library 0.39960.399641,058,914 164,071City of New Florence General Revenue 0.81070.81077,428,646 60,224Village of Rhineland General Revenue 0.86130.86132,471,831 21,290City of Wellsville General Revenue 0.80080.80088,501,313 68,079
Library 0.21940.21948,501,313 18,652Bellflower FPD General Revenue 0.22870.228721,364,565 48,861Big Spring FPD General Revenue 0.30000.300015,107,838 45,324Jonesburg-High Hill FPD General Revenue 0.24530.245353,091,644 130,234New Florence FPD General Revenue 0.29930.299323,248,848 69,584Montgomery Volunteer FPD General Revenue 0.26390.263973,965,946 195,196Wellsville FPD General Revenue 0.24840.248426,699,455 66,321Middletown Community FPD General Revenue 0.29470.294720,952,491 61,747Montgomery County Health Department General Revenue 0.14420.1442222,032,076 320,170Wellsville-Middletown R-I SD Operating Funds-Schools 4.01284.012830,180,826 E1,211,096
Debt Service 0.48000.574330,180,826 144,868Montgomery County R-II SD Operating Funds-Schools 3.28373.2837129,726,898 E4,259,842
Debt Service 0.65000.6629129,726,898 843,225Montgomery County General Revenue 0.22670.3800222,032,076 503,347
Johnson Grass 0.00000.0000222,032,076 0Road & Bridge 0.27150.2715222,032,076 602,817Special Road and Bridge 0.28990.2899188,507,058 546,482 2017Senate Bill 40 0.09590.0959222,032,076 212,929
MorganGolden Age NHD 1 General Revenue 0.18740.1874105,950,958 198,552Good Shepherd NHD General Revenue 0.14270.1427760,698,341 1,085,517Barnett SRD 3 Morgan County Road & Bridge 0.31110.311111,697,855 36,392Gravois SRD 8 Morgan County Road & Bridge 0.12970.1297197,239,891 255,820
Special Road and Bridge 0.09920.0992197,239,891 195,662 2018City of Barnett General Revenue 0.65620.65741,177,304 7,725
Water 0.34380.34441,177,304 4,048City of Stover General Revenue 0.55710.55718,009,666 44,622City of Syracuse General Revenue 0.70070.70072,396,090 16,789City of Versailles General Revenue 0.71040.710429,101,666 206,738Morgan County Library District General Revenue 0.07490.0749517,478,049 387,591Rocky Mount FPD General Revenue 0.38540.3854116,789,457 450,107Versailles Rural FPD General Revenue 0.47610.476145,135,387 214,890Gravois FPD General Revenue 0.69860.6986241,882,230 1,689,789
Debt Service 0.21990.2199241,882,230 531,899Stover Rural FPD General Revenue 0.25990.259940,000,369 103,961Morgan County Health Center General Revenue 0.07660.0766517,478,049 396,388Morgan County R-I School District Operating Funds-Schools 3.42293.422986,413,038 E2,957,832
74
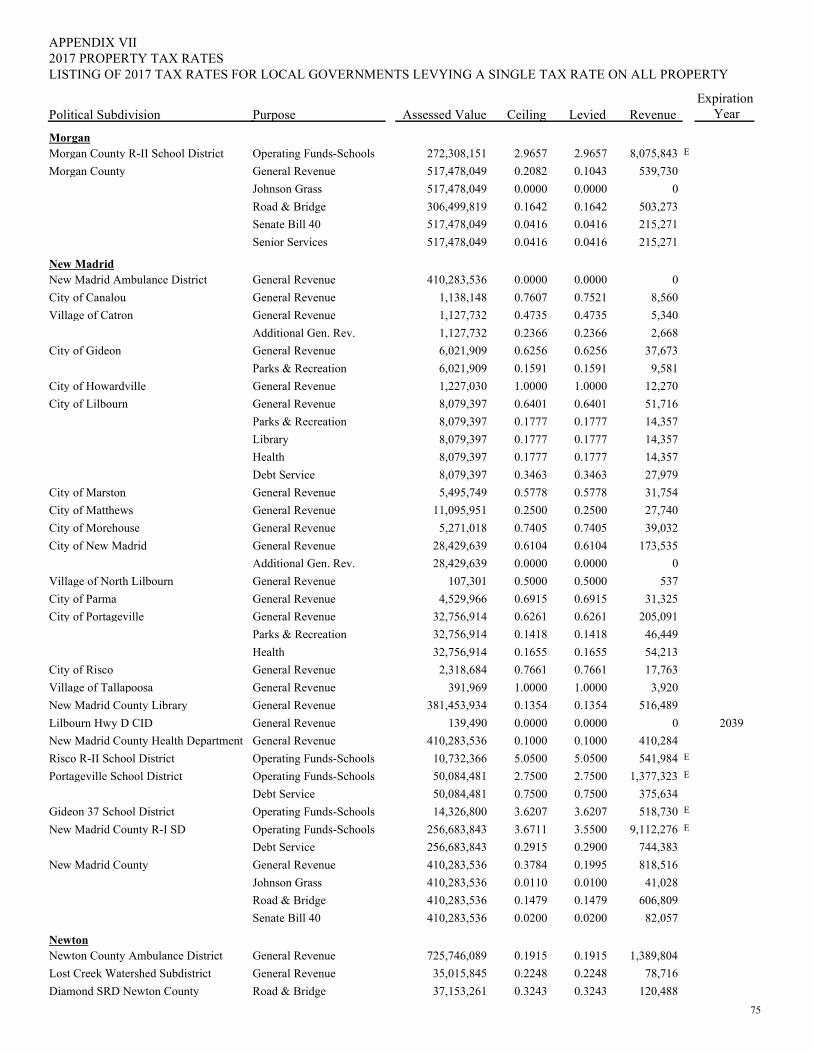
PurposePolitical Subdivision
2017 PROPERTY TAX RATESAPPENDIX VII
Assessed Value Ceiling Levied RevenueExpiration
Year
LISTING OF 2017 TAX RATES FOR LOCAL GOVERNMENTS LEVYING A SINGLE TAX RATE ON ALL PROPERTY
MorganMorgan County R-II School District Operating Funds-Schools 2.96572.9657272,308,151 E8,075,843Morgan County General Revenue 0.10430.2082517,478,049 539,730
Johnson Grass 0.00000.0000517,478,049 0Road & Bridge 0.16420.1642306,499,819 503,273Senate Bill 40 0.04160.0416517,478,049 215,271Senior Services 0.04160.0416517,478,049 215,271
New MadridNew Madrid Ambulance District General Revenue 0.00000.0000410,283,536 0City of Canalou General Revenue 0.75210.76071,138,148 8,560Village of Catron General Revenue 0.47350.47351,127,732 5,340
Additional Gen. Rev. 0.23660.23661,127,732 2,668City of Gideon General Revenue 0.62560.62566,021,909 37,673
Parks & Recreation 0.15910.15916,021,909 9,581City of Howardville General Revenue 1.00001.00001,227,030 12,270City of Lilbourn General Revenue 0.64010.64018,079,397 51,716
Parks & Recreation 0.17770.17778,079,397 14,357Library 0.17770.17778,079,397 14,357Health 0.17770.17778,079,397 14,357Debt Service 0.34630.34638,079,397 27,979
City of Marston General Revenue 0.57780.57785,495,749 31,754City of Matthews General Revenue 0.25000.250011,095,951 27,740City of Morehouse General Revenue 0.74050.74055,271,018 39,032City of New Madrid General Revenue 0.61040.610428,429,639 173,535
Additional Gen. Rev. 0.00000.000028,429,639 0Village of North Lilbourn General Revenue 0.50000.5000107,301 537City of Parma General Revenue 0.69150.69154,529,966 31,325City of Portageville General Revenue 0.62610.626132,756,914 205,091
Parks & Recreation 0.14180.141832,756,914 46,449Health 0.16550.165532,756,914 54,213
City of Risco General Revenue 0.76610.76612,318,684 17,763Village of Tallapoosa General Revenue 1.00001.0000391,969 3,920New Madrid County Library General Revenue 0.13540.1354381,453,934 516,489Lilbourn Hwy D CID General Revenue 0.00000.0000139,490 0 2039New Madrid County Health Department General Revenue 0.10000.1000410,283,536 410,284Risco R-II School District Operating Funds-Schools 5.05005.050010,732,366 E541,984Portageville School District Operating Funds-Schools 2.75002.750050,084,481 E1,377,323
Debt Service 0.75000.750050,084,481 375,634Gideon 37 School District Operating Funds-Schools 3.62073.620714,326,800 E518,730New Madrid County R-I SD Operating Funds-Schools 3.55003.6711256,683,843 E9,112,276
Debt Service 0.29000.2915256,683,843 744,383New Madrid County General Revenue 0.19950.3784410,283,536 818,516
Johnson Grass 0.01000.0110410,283,536 41,028Road & Bridge 0.14790.1479410,283,536 606,809Senate Bill 40 0.02000.0200410,283,536 82,057
NewtonNewton County Ambulance District General Revenue 0.19150.1915725,746,089 1,389,804Lost Creek Watershed Subdistrict General Revenue 0.22480.224835,015,845 78,716Diamond SRD Newton County Road & Bridge 0.32430.324337,153,261 120,488
75
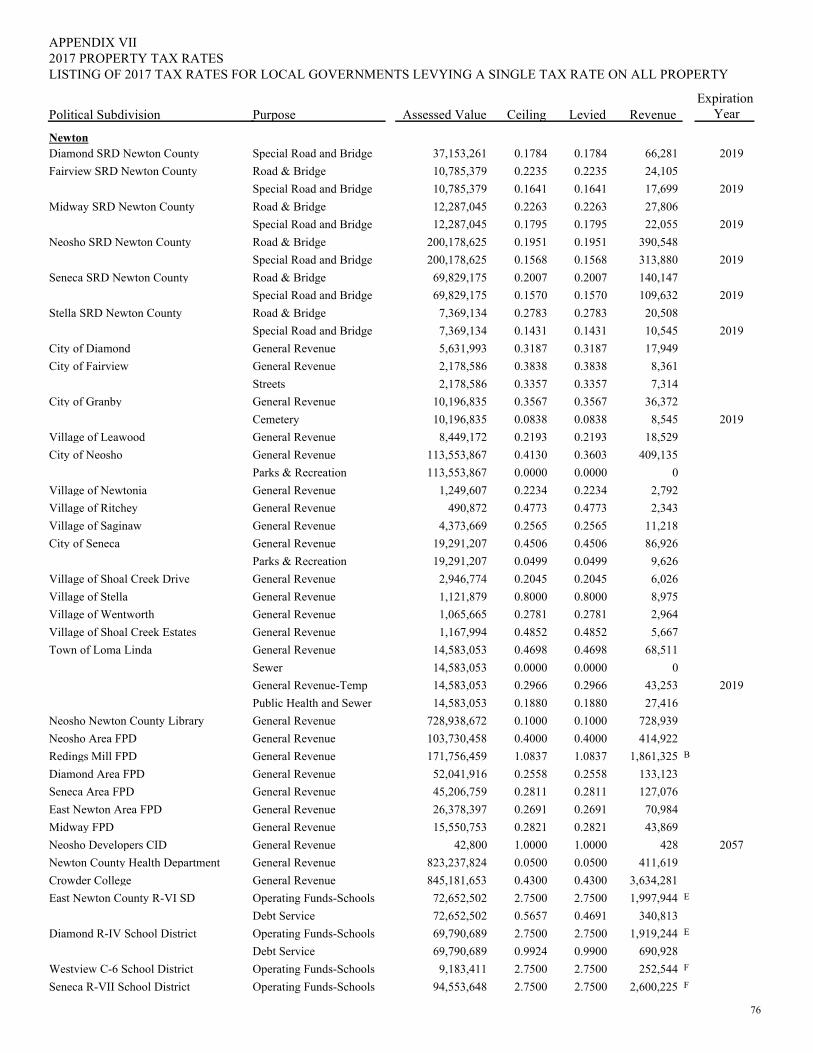
PurposePolitical Subdivision
2017 PROPERTY TAX RATESAPPENDIX VII
Assessed Value Ceiling Levied RevenueExpiration
Year
LISTING OF 2017 TAX RATES FOR LOCAL GOVERNMENTS LEVYING A SINGLE TAX RATE ON ALL PROPERTY
NewtonDiamond SRD Newton County Special Road and Bridge 0.17840.178437,153,261 66,281 2019Fairview SRD Newton County Road & Bridge 0.22350.223510,785,379 24,105
Special Road and Bridge 0.16410.164110,785,379 17,699 2019Midway SRD Newton County Road & Bridge 0.22630.226312,287,045 27,806
Special Road and Bridge 0.17950.179512,287,045 22,055 2019Neosho SRD Newton County Road & Bridge 0.19510.1951200,178,625 390,548
Special Road and Bridge 0.15680.1568200,178,625 313,880 2019Seneca SRD Newton County Road & Bridge 0.20070.200769,829,175 140,147
Special Road and Bridge 0.15700.157069,829,175 109,632 2019Stella SRD Newton County Road & Bridge 0.27830.27837,369,134 20,508
Special Road and Bridge 0.14310.14317,369,134 10,545 2019City of Diamond General Revenue 0.31870.31875,631,993 17,949City of Fairview General Revenue 0.38380.38382,178,586 8,361
Streets 0.33570.33572,178,586 7,314City of Granby General Revenue 0.35670.356710,196,835 36,372
Cemetery 0.08380.083810,196,835 8,545 2019Village of Leawood General Revenue 0.21930.21938,449,172 18,529City of Neosho General Revenue 0.36030.4130113,553,867 409,135
Parks & Recreation 0.00000.0000113,553,867 0Village of Newtonia General Revenue 0.22340.22341,249,607 2,792Village of Ritchey General Revenue 0.47730.4773490,872 2,343Village of Saginaw General Revenue 0.25650.25654,373,669 11,218City of Seneca General Revenue 0.45060.450619,291,207 86,926
Parks & Recreation 0.04990.049919,291,207 9,626Village of Shoal Creek Drive General Revenue 0.20450.20452,946,774 6,026Village of Stella General Revenue 0.80000.80001,121,879 8,975Village of Wentworth General Revenue 0.27810.27811,065,665 2,964Village of Shoal Creek Estates General Revenue 0.48520.48521,167,994 5,667Town of Loma Linda General Revenue 0.46980.469814,583,053 68,511
Sewer 0.00000.000014,583,053 0General Revenue-Temp 0.29660.296614,583,053 43,253 2019Public Health and Sewer 0.18800.188014,583,053 27,416
Neosho Newton County Library General Revenue 0.10000.1000728,938,672 728,939Neosho Area FPD General Revenue 0.40000.4000103,730,458 414,922Redings Mill FPD General Revenue 1.08371.0837171,756,459 B1,861,325Diamond Area FPD General Revenue 0.25580.255852,041,916 133,123Seneca Area FPD General Revenue 0.28110.281145,206,759 127,076East Newton Area FPD General Revenue 0.26910.269126,378,397 70,984Midway FPD General Revenue 0.28210.282115,550,753 43,869Neosho Developers CID General Revenue 1.00001.000042,800 428 2057Newton County Health Department General Revenue 0.05000.0500823,237,824 411,619Crowder College General Revenue 0.43000.4300845,181,653 3,634,281East Newton County R-VI SD Operating Funds-Schools 2.75002.750072,652,502 E1,997,944
Debt Service 0.46910.565772,652,502 340,813Diamond R-IV School District Operating Funds-Schools 2.75002.750069,790,689 E1,919,244
Debt Service 0.99000.992469,790,689 690,928Westview C-6 School District Operating Funds-Schools 2.75002.75009,183,411 F252,544Seneca R-VII School District Operating Funds-Schools 2.75002.750094,553,648 F2,600,225
76
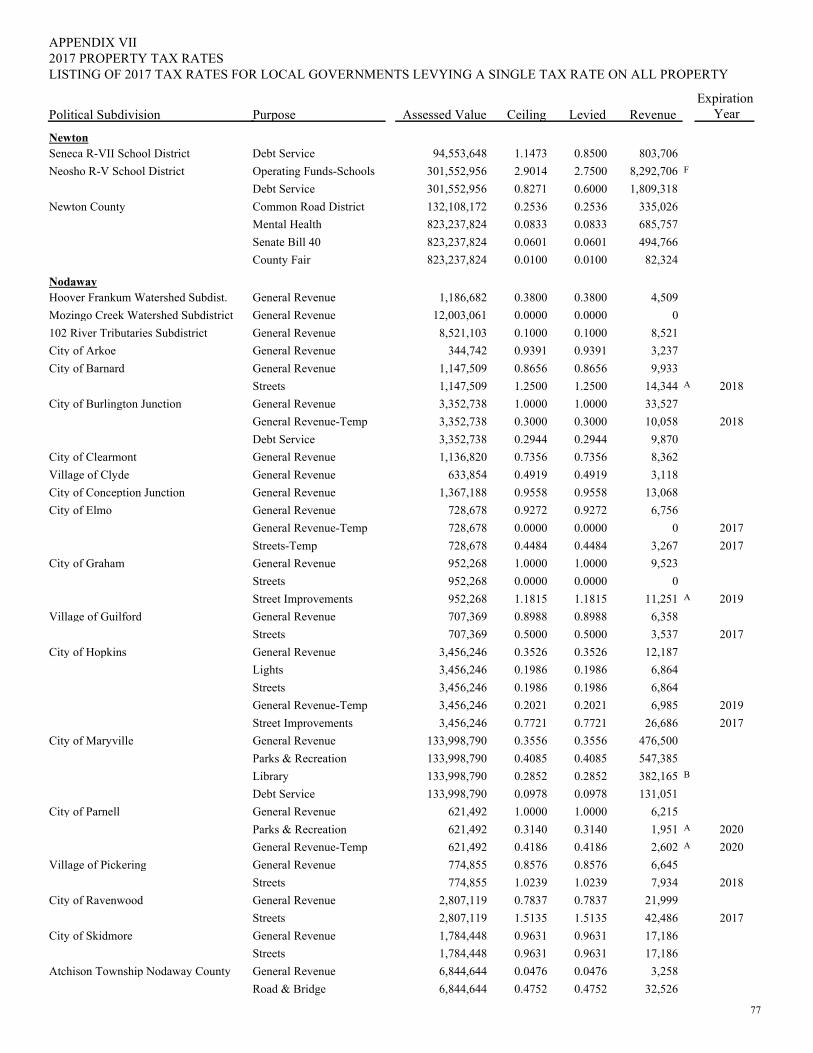
PurposePolitical Subdivision
2017 PROPERTY TAX RATESAPPENDIX VII
Assessed Value Ceiling Levied RevenueExpiration
Year
LISTING OF 2017 TAX RATES FOR LOCAL GOVERNMENTS LEVYING A SINGLE TAX RATE ON ALL PROPERTY
NewtonSeneca R-VII School District Debt Service 0.85001.147394,553,648 803,706Neosho R-V School District Operating Funds-Schools 2.75002.9014301,552,956 F8,292,706
Debt Service 0.60000.8271301,552,956 1,809,318Newton County Common Road District 0.25360.2536132,108,172 335,026
Mental Health 0.08330.0833823,237,824 685,757Senate Bill 40 0.06010.0601823,237,824 494,766County Fair 0.01000.0100823,237,824 82,324
NodawayHoover Frankum Watershed Subdist. General Revenue 0.38000.38001,186,682 4,509Mozingo Creek Watershed Subdistrict General Revenue 0.00000.000012,003,061 0102 River Tributaries Subdistrict General Revenue 0.10000.10008,521,103 8,521City of Arkoe General Revenue 0.93910.9391344,742 3,237City of Barnard General Revenue 0.86560.86561,147,509 9,933
Streets 1.25001.25001,147,509 A14,344 2018City of Burlington Junction General Revenue 1.00001.00003,352,738 33,527
General Revenue-Temp 0.30000.30003,352,738 10,058 2018Debt Service 0.29440.29443,352,738 9,870
City of Clearmont General Revenue 0.73560.73561,136,820 8,362Village of Clyde General Revenue 0.49190.4919633,854 3,118City of Conception Junction General Revenue 0.95580.95581,367,188 13,068City of Elmo General Revenue 0.92720.9272728,678 6,756
General Revenue-Temp 0.00000.0000728,678 0 2017Streets-Temp 0.44840.4484728,678 3,267 2017
City of Graham General Revenue 1.00001.0000952,268 9,523Streets 0.00000.0000952,268 0Street Improvements 1.18151.1815952,268 A11,251 2019
Village of Guilford General Revenue 0.89880.8988707,369 6,358Streets 0.50000.5000707,369 3,537 2017
City of Hopkins General Revenue 0.35260.35263,456,246 12,187Lights 0.19860.19863,456,246 6,864Streets 0.19860.19863,456,246 6,864General Revenue-Temp 0.20210.20213,456,246 6,985 2019Street Improvements 0.77210.77213,456,246 26,686 2017
City of Maryville General Revenue 0.35560.3556133,998,790 476,500Parks & Recreation 0.40850.4085133,998,790 547,385Library 0.28520.2852133,998,790 B382,165Debt Service 0.09780.0978133,998,790 131,051
City of Parnell General Revenue 1.00001.0000621,492 6,215Parks & Recreation 0.31400.3140621,492 A1,951 2020General Revenue-Temp 0.41860.4186621,492 A2,602 2020
Village of Pickering General Revenue 0.85760.8576774,855 6,645Streets 1.02391.0239774,855 7,934 2018
City of Ravenwood General Revenue 0.78370.78372,807,119 21,999Streets 1.51351.51352,807,119 42,486 2017
City of Skidmore General Revenue 0.96310.96311,784,448 17,186Streets 0.96310.96311,784,448 17,186
Atchison Township Nodaway County General Revenue 0.04760.04766,844,644 3,258Road & Bridge 0.47520.47526,844,644 32,526
77
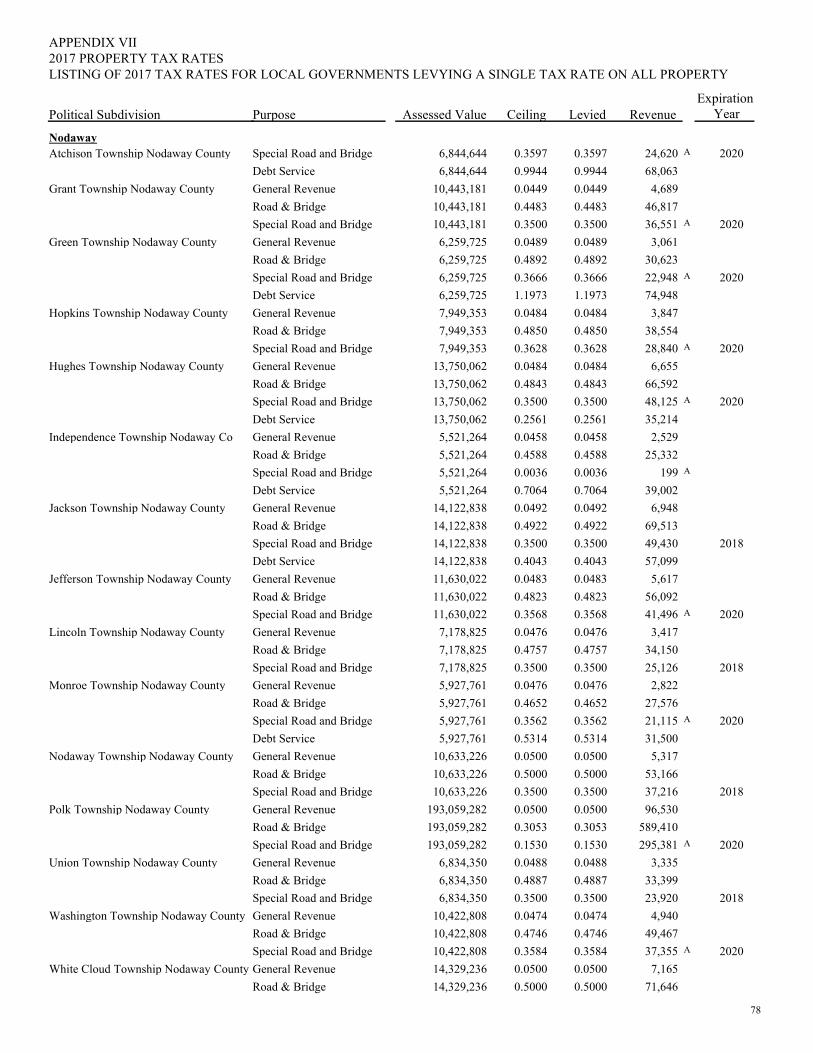
PurposePolitical Subdivision
2017 PROPERTY TAX RATESAPPENDIX VII
Assessed Value Ceiling Levied RevenueExpiration
Year
LISTING OF 2017 TAX RATES FOR LOCAL GOVERNMENTS LEVYING A SINGLE TAX RATE ON ALL PROPERTY
NodawayAtchison Township Nodaway County Special Road and Bridge 0.35970.35976,844,644 A24,620 2020
Debt Service 0.99440.99446,844,644 68,063Grant Township Nodaway County General Revenue 0.04490.044910,443,181 4,689
Road & Bridge 0.44830.448310,443,181 46,817Special Road and Bridge 0.35000.350010,443,181 A36,551 2020
Green Township Nodaway County General Revenue 0.04890.04896,259,725 3,061Road & Bridge 0.48920.48926,259,725 30,623Special Road and Bridge 0.36660.36666,259,725 A22,948 2020Debt Service 1.19731.19736,259,725 74,948
Hopkins Township Nodaway County General Revenue 0.04840.04847,949,353 3,847Road & Bridge 0.48500.48507,949,353 38,554Special Road and Bridge 0.36280.36287,949,353 A28,840 2020
Hughes Township Nodaway County General Revenue 0.04840.048413,750,062 6,655Road & Bridge 0.48430.484313,750,062 66,592Special Road and Bridge 0.35000.350013,750,062 A48,125 2020Debt Service 0.25610.256113,750,062 35,214
Independence Township Nodaway Co General Revenue 0.04580.04585,521,264 2,529Road & Bridge 0.45880.45885,521,264 25,332Special Road and Bridge 0.00360.00365,521,264 A199Debt Service 0.70640.70645,521,264 39,002
Jackson Township Nodaway County General Revenue 0.04920.049214,122,838 6,948Road & Bridge 0.49220.492214,122,838 69,513Special Road and Bridge 0.35000.350014,122,838 49,430 2018Debt Service 0.40430.404314,122,838 57,099
Jefferson Township Nodaway County General Revenue 0.04830.048311,630,022 5,617Road & Bridge 0.48230.482311,630,022 56,092Special Road and Bridge 0.35680.356811,630,022 A41,496 2020
Lincoln Township Nodaway County General Revenue 0.04760.04767,178,825 3,417Road & Bridge 0.47570.47577,178,825 34,150Special Road and Bridge 0.35000.35007,178,825 25,126 2018
Monroe Township Nodaway County General Revenue 0.04760.04765,927,761 2,822Road & Bridge 0.46520.46525,927,761 27,576Special Road and Bridge 0.35620.35625,927,761 A21,115 2020Debt Service 0.53140.53145,927,761 31,500
Nodaway Township Nodaway County General Revenue 0.05000.050010,633,226 5,317Road & Bridge 0.50000.500010,633,226 53,166Special Road and Bridge 0.35000.350010,633,226 37,216 2018
Polk Township Nodaway County General Revenue 0.05000.0500193,059,282 96,530Road & Bridge 0.30530.3053193,059,282 589,410Special Road and Bridge 0.15300.1530193,059,282 A295,381 2020
Union Township Nodaway County General Revenue 0.04880.04886,834,350 3,335Road & Bridge 0.48870.48876,834,350 33,399Special Road and Bridge 0.35000.35006,834,350 23,920 2018
Washington Township Nodaway County General Revenue 0.04740.047410,422,808 4,940Road & Bridge 0.47460.474610,422,808 49,467Special Road and Bridge 0.35840.358410,422,808 A37,355 2020
White Cloud Township Nodaway County General Revenue 0.05000.050014,329,236 7,165Road & Bridge 0.50000.500014,329,236 71,646
78
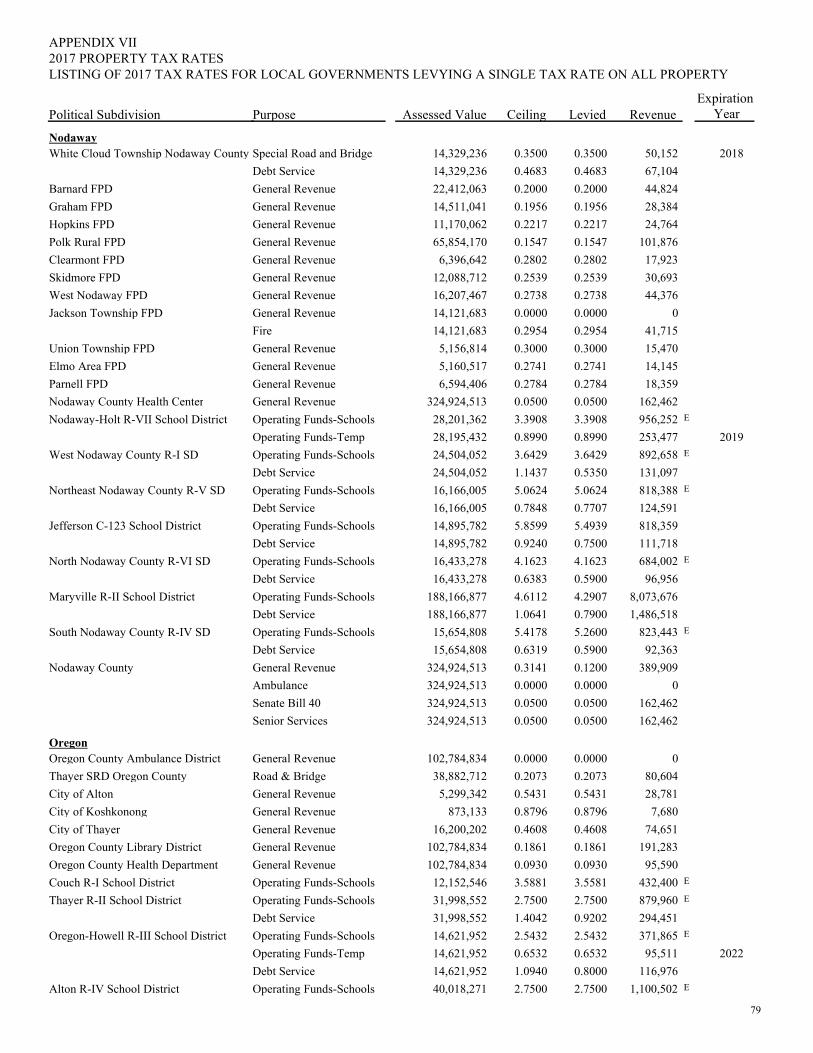
PurposePolitical Subdivision
2017 PROPERTY TAX RATESAPPENDIX VII
Assessed Value Ceiling Levied RevenueExpiration
Year
LISTING OF 2017 TAX RATES FOR LOCAL GOVERNMENTS LEVYING A SINGLE TAX RATE ON ALL PROPERTY
NodawayWhite Cloud Township Nodaway County Special Road and Bridge 0.35000.350014,329,236 50,152 2018
Debt Service 0.46830.468314,329,236 67,104Barnard FPD General Revenue 0.20000.200022,412,063 44,824Graham FPD General Revenue 0.19560.195614,511,041 28,384Hopkins FPD General Revenue 0.22170.221711,170,062 24,764Polk Rural FPD General Revenue 0.15470.154765,854,170 101,876Clearmont FPD General Revenue 0.28020.28026,396,642 17,923Skidmore FPD General Revenue 0.25390.253912,088,712 30,693West Nodaway FPD General Revenue 0.27380.273816,207,467 44,376Jackson Township FPD General Revenue 0.00000.000014,121,683 0
Fire 0.29540.295414,121,683 41,715Union Township FPD General Revenue 0.30000.30005,156,814 15,470Elmo Area FPD General Revenue 0.27410.27415,160,517 14,145Parnell FPD General Revenue 0.27840.27846,594,406 18,359Nodaway County Health Center General Revenue 0.05000.0500324,924,513 162,462Nodaway-Holt R-VII School District Operating Funds-Schools 3.39083.390828,201,362 E956,252
Operating Funds-Temp 0.89900.899028,195,432 253,477 2019West Nodaway County R-I SD Operating Funds-Schools 3.64293.642924,504,052 E892,658
Debt Service 0.53501.143724,504,052 131,097Northeast Nodaway County R-V SD Operating Funds-Schools 5.06245.062416,166,005 E818,388
Debt Service 0.77070.784816,166,005 124,591Jefferson C-123 School District Operating Funds-Schools 5.49395.859914,895,782 818,359
Debt Service 0.75000.924014,895,782 111,718North Nodaway County R-VI SD Operating Funds-Schools 4.16234.162316,433,278 E684,002
Debt Service 0.59000.638316,433,278 96,956Maryville R-II School District Operating Funds-Schools 4.29074.6112188,166,877 8,073,676
Debt Service 0.79001.0641188,166,877 1,486,518South Nodaway County R-IV SD Operating Funds-Schools 5.26005.417815,654,808 E823,443
Debt Service 0.59000.631915,654,808 92,363Nodaway County General Revenue 0.12000.3141324,924,513 389,909
Ambulance 0.00000.0000324,924,513 0Senate Bill 40 0.05000.0500324,924,513 162,462Senior Services 0.05000.0500324,924,513 162,462
OregonOregon County Ambulance District General Revenue 0.00000.0000102,784,834 0Thayer SRD Oregon County Road & Bridge 0.20730.207338,882,712 80,604City of Alton General Revenue 0.54310.54315,299,342 28,781City of Koshkonong General Revenue 0.87960.8796873,133 7,680City of Thayer General Revenue 0.46080.460816,200,202 74,651Oregon County Library District General Revenue 0.18610.1861102,784,834 191,283Oregon County Health Department General Revenue 0.09300.0930102,784,834 95,590Couch R-I School District Operating Funds-Schools 3.55813.588112,152,546 E432,400Thayer R-II School District Operating Funds-Schools 2.75002.750031,998,552 E879,960
Debt Service 0.92021.404231,998,552 294,451Oregon-Howell R-III School District Operating Funds-Schools 2.54322.543214,621,952 E371,865
Operating Funds-Temp 0.65320.653214,621,952 95,511 2022Debt Service 0.80001.094014,621,952 116,976
Alton R-IV School District Operating Funds-Schools 2.75002.750040,018,271 E1,100,502
79
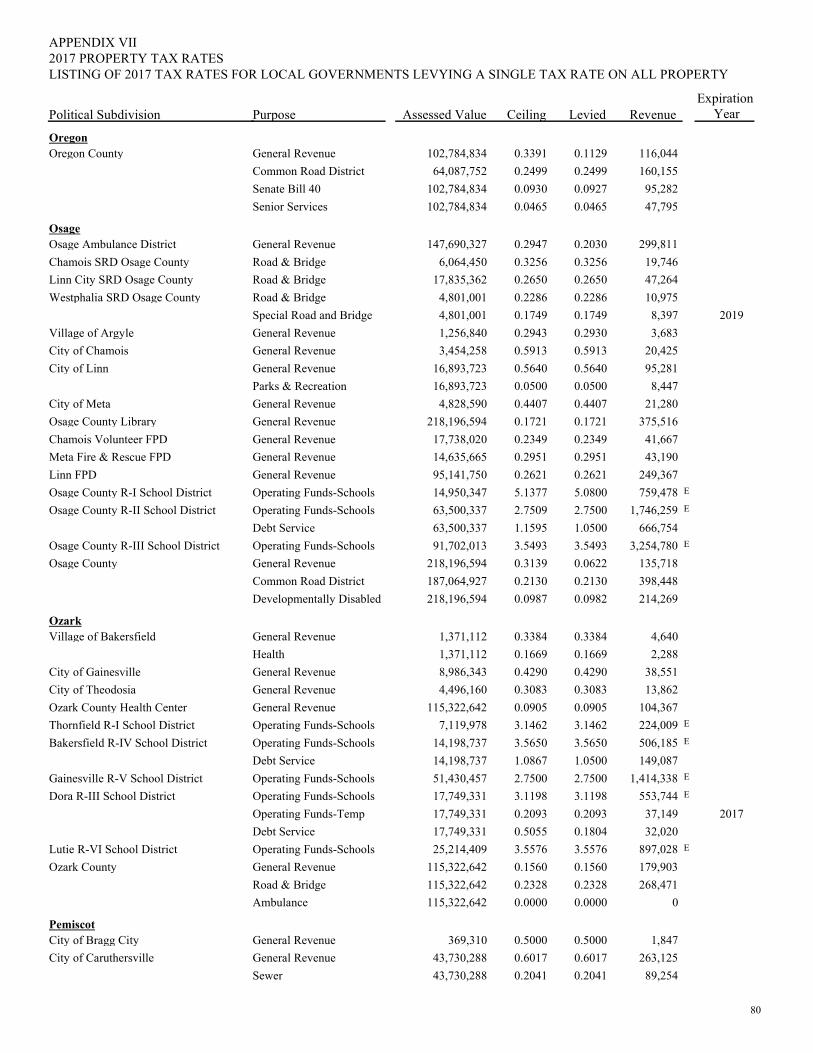
PurposePolitical Subdivision
2017 PROPERTY TAX RATESAPPENDIX VII
Assessed Value Ceiling Levied RevenueExpiration
Year
LISTING OF 2017 TAX RATES FOR LOCAL GOVERNMENTS LEVYING A SINGLE TAX RATE ON ALL PROPERTY
OregonOregon County General Revenue 0.11290.3391102,784,834 116,044
Common Road District 0.24990.249964,087,752 160,155Senate Bill 40 0.09270.0930102,784,834 95,282Senior Services 0.04650.0465102,784,834 47,795
OsageOsage Ambulance District General Revenue 0.20300.2947147,690,327 299,811Chamois SRD Osage County Road & Bridge 0.32560.32566,064,450 19,746Linn City SRD Osage County Road & Bridge 0.26500.265017,835,362 47,264Westphalia SRD Osage County Road & Bridge 0.22860.22864,801,001 10,975
Special Road and Bridge 0.17490.17494,801,001 8,397 2019Village of Argyle General Revenue 0.29300.29431,256,840 3,683City of Chamois General Revenue 0.59130.59133,454,258 20,425City of Linn General Revenue 0.56400.564016,893,723 95,281
Parks & Recreation 0.05000.050016,893,723 8,447City of Meta General Revenue 0.44070.44074,828,590 21,280Osage County Library General Revenue 0.17210.1721218,196,594 375,516Chamois Volunteer FPD General Revenue 0.23490.234917,738,020 41,667Meta Fire & Rescue FPD General Revenue 0.29510.295114,635,665 43,190Linn FPD General Revenue 0.26210.262195,141,750 249,367Osage County R-I School District Operating Funds-Schools 5.08005.137714,950,347 E759,478Osage County R-II School District Operating Funds-Schools 2.75002.750963,500,337 E1,746,259
Debt Service 1.05001.159563,500,337 666,754Osage County R-III School District Operating Funds-Schools 3.54933.549391,702,013 E3,254,780Osage County General Revenue 0.06220.3139218,196,594 135,718
Common Road District 0.21300.2130187,064,927 398,448Developmentally Disabled 0.09820.0987218,196,594 214,269
OzarkVillage of Bakersfield General Revenue 0.33840.33841,371,112 4,640
Health 0.16690.16691,371,112 2,288City of Gainesville General Revenue 0.42900.42908,986,343 38,551City of Theodosia General Revenue 0.30830.30834,496,160 13,862Ozark County Health Center General Revenue 0.09050.0905115,322,642 104,367Thornfield R-I School District Operating Funds-Schools 3.14623.14627,119,978 E224,009Bakersfield R-IV School District Operating Funds-Schools 3.56503.565014,198,737 E506,185
Debt Service 1.05001.086714,198,737 149,087Gainesville R-V School District Operating Funds-Schools 2.75002.750051,430,457 E1,414,338Dora R-III School District Operating Funds-Schools 3.11983.119817,749,331 E553,744
Operating Funds-Temp 0.20930.209317,749,331 37,149 2017Debt Service 0.18040.505517,749,331 32,020
Lutie R-VI School District Operating Funds-Schools 3.55763.557625,214,409 E897,028Ozark County General Revenue 0.15600.1560115,322,642 179,903
Road & Bridge 0.23280.2328115,322,642 268,471Ambulance 0.00000.0000115,322,642 0
PemiscotCity of Bragg City General Revenue 0.50000.5000369,310 1,847City of Caruthersville General Revenue 0.60170.601743,730,288 263,125
Sewer 0.20410.204143,730,288 89,254
80
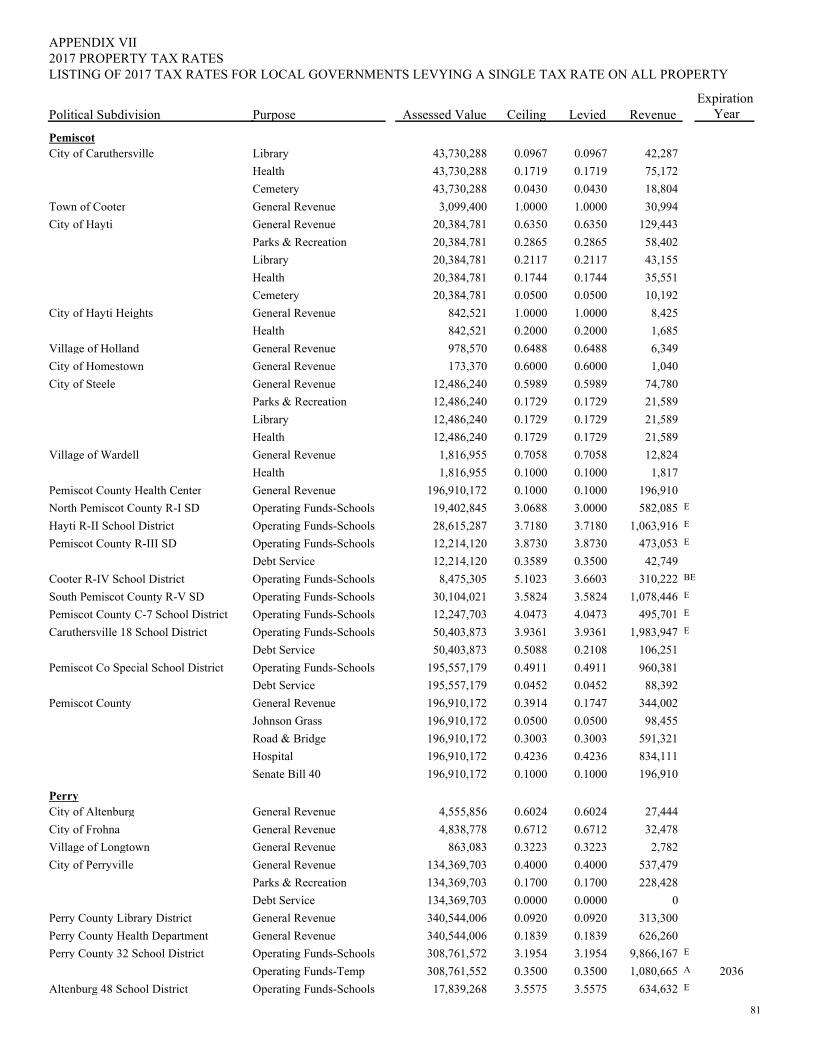
PurposePolitical Subdivision
2017 PROPERTY TAX RATESAPPENDIX VII
Assessed Value Ceiling Levied RevenueExpiration
Year
LISTING OF 2017 TAX RATES FOR LOCAL GOVERNMENTS LEVYING A SINGLE TAX RATE ON ALL PROPERTY
PemiscotCity of Caruthersville Library 0.09670.096743,730,288 42,287
Health 0.17190.171943,730,288 75,172Cemetery 0.04300.043043,730,288 18,804
Town of Cooter General Revenue 1.00001.00003,099,400 30,994City of Hayti General Revenue 0.63500.635020,384,781 129,443
Parks & Recreation 0.28650.286520,384,781 58,402Library 0.21170.211720,384,781 43,155Health 0.17440.174420,384,781 35,551Cemetery 0.05000.050020,384,781 10,192
City of Hayti Heights General Revenue 1.00001.0000842,521 8,425Health 0.20000.2000842,521 1,685
Village of Holland General Revenue 0.64880.6488978,570 6,349City of Homestown General Revenue 0.60000.6000173,370 1,040City of Steele General Revenue 0.59890.598912,486,240 74,780
Parks & Recreation 0.17290.172912,486,240 21,589Library 0.17290.172912,486,240 21,589Health 0.17290.172912,486,240 21,589
Village of Wardell General Revenue 0.70580.70581,816,955 12,824Health 0.10000.10001,816,955 1,817
Pemiscot County Health Center General Revenue 0.10000.1000196,910,172 196,910North Pemiscot County R-I SD Operating Funds-Schools 3.00003.068819,402,845 E582,085Hayti R-II School District Operating Funds-Schools 3.71803.718028,615,287 E1,063,916Pemiscot County R-III SD Operating Funds-Schools 3.87303.873012,214,120 E473,053
Debt Service 0.35000.358912,214,120 42,749Cooter R-IV School District Operating Funds-Schools 3.66035.10238,475,305 BE310,222South Pemiscot County R-V SD Operating Funds-Schools 3.58243.582430,104,021 E1,078,446Pemiscot County C-7 School District Operating Funds-Schools 4.04734.047312,247,703 E495,701Caruthersville 18 School District Operating Funds-Schools 3.93613.936150,403,873 E1,983,947
Debt Service 0.21080.508850,403,873 106,251Pemiscot Co Special School District Operating Funds-Schools 0.49110.4911195,557,179 960,381
Debt Service 0.04520.0452195,557,179 88,392Pemiscot County General Revenue 0.17470.3914196,910,172 344,002
Johnson Grass 0.05000.0500196,910,172 98,455Road & Bridge 0.30030.3003196,910,172 591,321Hospital 0.42360.4236196,910,172 834,111Senate Bill 40 0.10000.1000196,910,172 196,910
PerryCity of Altenburg General Revenue 0.60240.60244,555,856 27,444City of Frohna General Revenue 0.67120.67124,838,778 32,478Village of Longtown General Revenue 0.32230.3223863,083 2,782City of Perryville General Revenue 0.40000.4000134,369,703 537,479
Parks & Recreation 0.17000.1700134,369,703 228,428Debt Service 0.00000.0000134,369,703 0
Perry County Library District General Revenue 0.09200.0920340,544,006 313,300Perry County Health Department General Revenue 0.18390.1839340,544,006 626,260Perry County 32 School District Operating Funds-Schools 3.19543.1954308,761,572 E9,866,167
Operating Funds-Temp 0.35000.3500308,761,552 A1,080,665 2036Altenburg 48 School District Operating Funds-Schools 3.55753.557517,839,268 E634,632
81
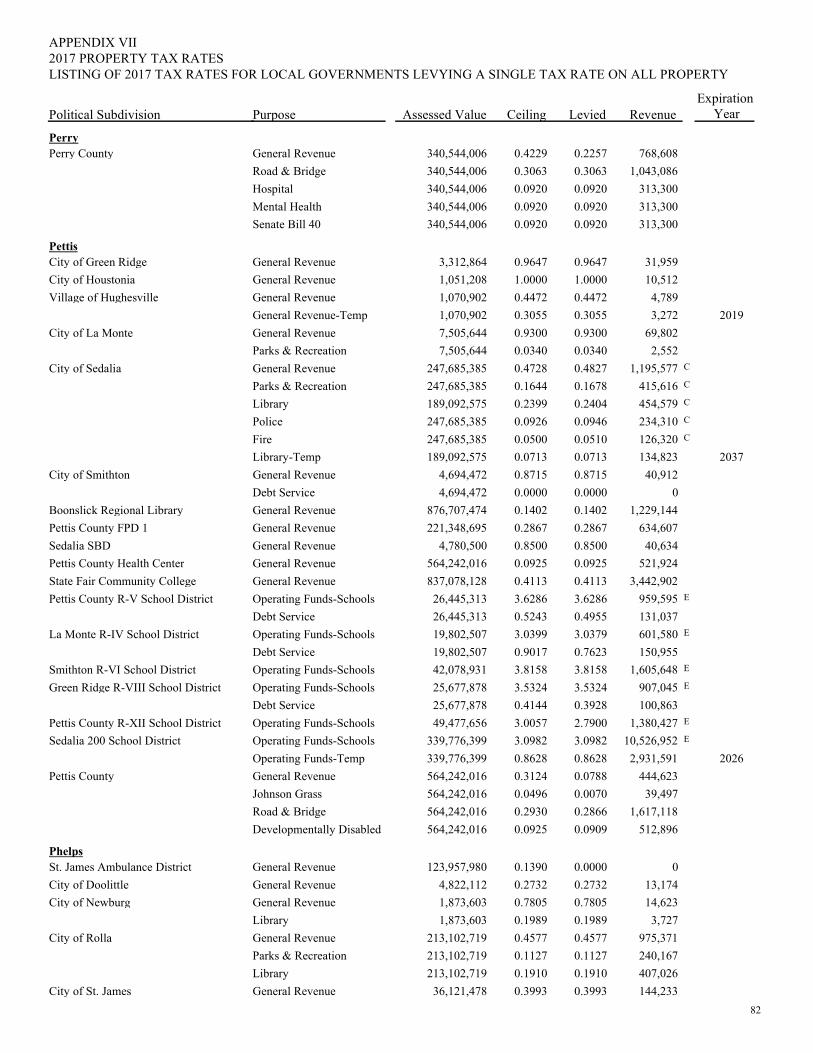
PurposePolitical Subdivision
2017 PROPERTY TAX RATESAPPENDIX VII
Assessed Value Ceiling Levied RevenueExpiration
Year
LISTING OF 2017 TAX RATES FOR LOCAL GOVERNMENTS LEVYING A SINGLE TAX RATE ON ALL PROPERTY
PerryPerry County General Revenue 0.22570.4229340,544,006 768,608
Road & Bridge 0.30630.3063340,544,006 1,043,086Hospital 0.09200.0920340,544,006 313,300Mental Health 0.09200.0920340,544,006 313,300Senate Bill 40 0.09200.0920340,544,006 313,300
PettisCity of Green Ridge General Revenue 0.96470.96473,312,864 31,959City of Houstonia General Revenue 1.00001.00001,051,208 10,512Village of Hughesville General Revenue 0.44720.44721,070,902 4,789
General Revenue-Temp 0.30550.30551,070,902 3,272 2019City of La Monte General Revenue 0.93000.93007,505,644 69,802
Parks & Recreation 0.03400.03407,505,644 2,552City of Sedalia General Revenue 0.48270.4728247,685,385 C1,195,577
Parks & Recreation 0.16780.1644247,685,385 C415,616Library 0.24040.2399189,092,575 C454,579Police 0.09460.0926247,685,385 C234,310Fire 0.05100.0500247,685,385 C126,320Library-Temp 0.07130.0713189,092,575 134,823 2037
City of Smithton General Revenue 0.87150.87154,694,472 40,912Debt Service 0.00000.00004,694,472 0
Boonslick Regional Library General Revenue 0.14020.1402876,707,474 1,229,144Pettis County FPD 1 General Revenue 0.28670.2867221,348,695 634,607Sedalia SBD General Revenue 0.85000.85004,780,500 40,634Pettis County Health Center General Revenue 0.09250.0925564,242,016 521,924State Fair Community College General Revenue 0.41130.4113837,078,128 3,442,902Pettis County R-V School District Operating Funds-Schools 3.62863.628626,445,313 E959,595
Debt Service 0.49550.524326,445,313 131,037La Monte R-IV School District Operating Funds-Schools 3.03793.039919,802,507 E601,580
Debt Service 0.76230.901719,802,507 150,955Smithton R-VI School District Operating Funds-Schools 3.81583.815842,078,931 E1,605,648Green Ridge R-VIII School District Operating Funds-Schools 3.53243.532425,677,878 E907,045
Debt Service 0.39280.414425,677,878 100,863Pettis County R-XII School District Operating Funds-Schools 2.79003.005749,477,656 E1,380,427Sedalia 200 School District Operating Funds-Schools 3.09823.0982339,776,399 E10,526,952
Operating Funds-Temp 0.86280.8628339,776,399 2,931,591 2026Pettis County General Revenue 0.07880.3124564,242,016 444,623
Johnson Grass 0.00700.0496564,242,016 39,497Road & Bridge 0.28660.2930564,242,016 1,617,118Developmentally Disabled 0.09090.0925564,242,016 512,896
PhelpsSt. James Ambulance District General Revenue 0.00000.1390123,957,980 0City of Doolittle General Revenue 0.27320.27324,822,112 13,174City of Newburg General Revenue 0.78050.78051,873,603 14,623
Library 0.19890.19891,873,603 3,727City of Rolla General Revenue 0.45770.4577213,102,719 975,371
Parks & Recreation 0.11270.1127213,102,719 240,167Library 0.19100.1910213,102,719 407,026
City of St. James General Revenue 0.39930.399336,121,478 144,23382
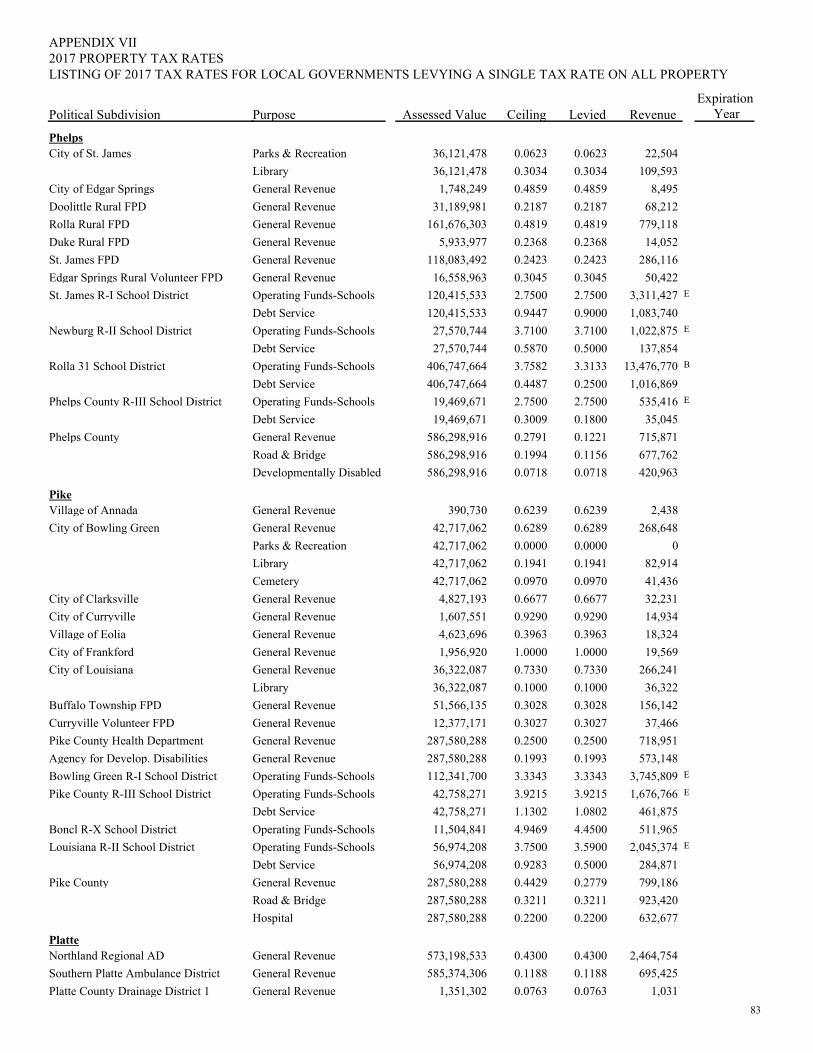
PurposePolitical Subdivision
2017 PROPERTY TAX RATESAPPENDIX VII
Assessed Value Ceiling Levied RevenueExpiration
Year
LISTING OF 2017 TAX RATES FOR LOCAL GOVERNMENTS LEVYING A SINGLE TAX RATE ON ALL PROPERTY
PhelpsCity of St. James Parks & Recreation 0.06230.062336,121,478 22,504
Library 0.30340.303436,121,478 109,593City of Edgar Springs General Revenue 0.48590.48591,748,249 8,495Doolittle Rural FPD General Revenue 0.21870.218731,189,981 68,212Rolla Rural FPD General Revenue 0.48190.4819161,676,303 779,118Duke Rural FPD General Revenue 0.23680.23685,933,977 14,052St. James FPD General Revenue 0.24230.2423118,083,492 286,116Edgar Springs Rural Volunteer FPD General Revenue 0.30450.304516,558,963 50,422St. James R-I School District Operating Funds-Schools 2.75002.7500120,415,533 E3,311,427
Debt Service 0.90000.9447120,415,533 1,083,740Newburg R-II School District Operating Funds-Schools 3.71003.710027,570,744 E1,022,875
Debt Service 0.50000.587027,570,744 137,854Rolla 31 School District Operating Funds-Schools 3.31333.7582406,747,664 B13,476,770
Debt Service 0.25000.4487406,747,664 1,016,869Phelps County R-III School District Operating Funds-Schools 2.75002.750019,469,671 E535,416
Debt Service 0.18000.300919,469,671 35,045Phelps County General Revenue 0.12210.2791586,298,916 715,871
Road & Bridge 0.11560.1994586,298,916 677,762Developmentally Disabled 0.07180.0718586,298,916 420,963
PikeVillage of Annada General Revenue 0.62390.6239390,730 2,438City of Bowling Green General Revenue 0.62890.628942,717,062 268,648
Parks & Recreation 0.00000.000042,717,062 0Library 0.19410.194142,717,062 82,914Cemetery 0.09700.097042,717,062 41,436
City of Clarksville General Revenue 0.66770.66774,827,193 32,231City of Curryville General Revenue 0.92900.92901,607,551 14,934Village of Eolia General Revenue 0.39630.39634,623,696 18,324City of Frankford General Revenue 1.00001.00001,956,920 19,569City of Louisiana General Revenue 0.73300.733036,322,087 266,241
Library 0.10000.100036,322,087 36,322Buffalo Township FPD General Revenue 0.30280.302851,566,135 156,142Curryville Volunteer FPD General Revenue 0.30270.302712,377,171 37,466Pike County Health Department General Revenue 0.25000.2500287,580,288 718,951Agency for Develop. Disabilities General Revenue 0.19930.1993287,580,288 573,148Bowling Green R-I School District Operating Funds-Schools 3.33433.3343112,341,700 E3,745,809Pike County R-III School District Operating Funds-Schools 3.92153.921542,758,271 E1,676,766
Debt Service 1.08021.130242,758,271 461,875Boncl R-X School District Operating Funds-Schools 4.45004.946911,504,841 511,965Louisiana R-II School District Operating Funds-Schools 3.59003.750056,974,208 E2,045,374
Debt Service 0.50000.928356,974,208 284,871Pike County General Revenue 0.27790.4429287,580,288 799,186
Road & Bridge 0.32110.3211287,580,288 923,420Hospital 0.22000.2200287,580,288 632,677
PlatteNorthland Regional AD General Revenue 0.43000.4300573,198,533 2,464,754Southern Platte Ambulance District General Revenue 0.11880.1188585,374,306 695,425Platte County Drainage District 1 General Revenue 0.07630.07631,351,302 1,031
83
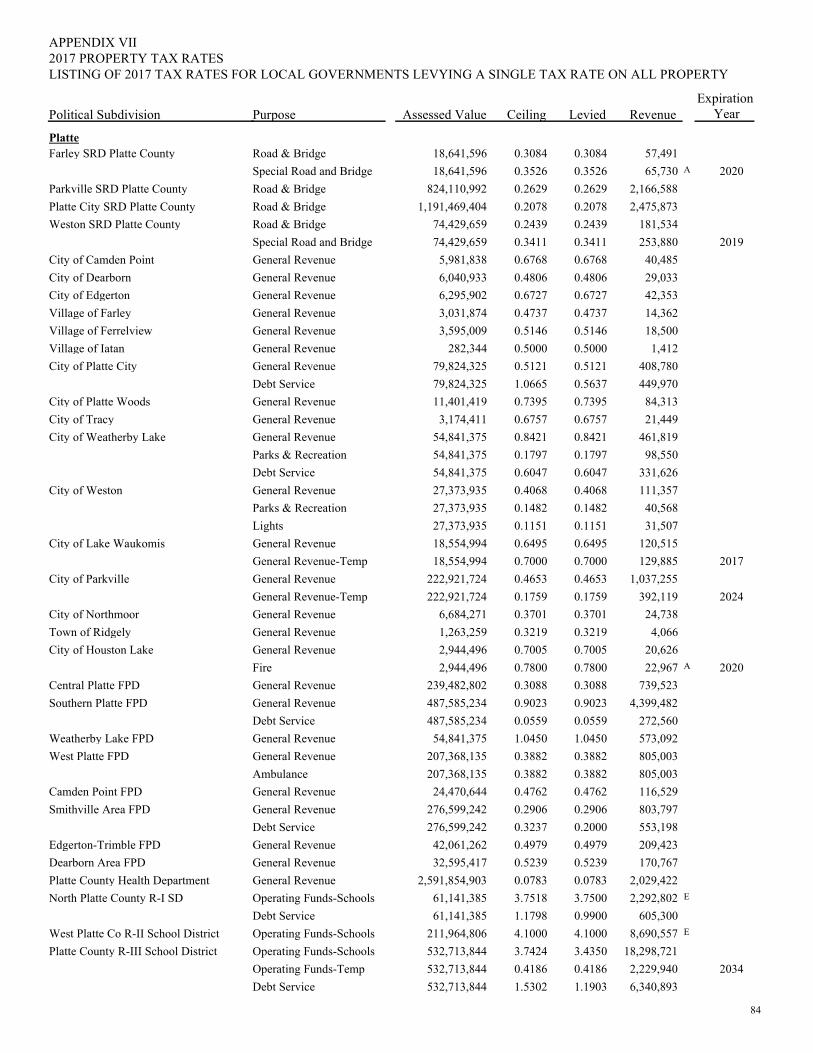
PurposePolitical Subdivision
2017 PROPERTY TAX RATESAPPENDIX VII
Assessed Value Ceiling Levied RevenueExpiration
Year
LISTING OF 2017 TAX RATES FOR LOCAL GOVERNMENTS LEVYING A SINGLE TAX RATE ON ALL PROPERTY
PlatteFarley SRD Platte County Road & Bridge 0.30840.308418,641,596 57,491
Special Road and Bridge 0.35260.352618,641,596 A65,730 2020Parkville SRD Platte County Road & Bridge 0.26290.2629824,110,992 2,166,588Platte City SRD Platte County Road & Bridge 0.20780.20781,191,469,404 2,475,873Weston SRD Platte County Road & Bridge 0.24390.243974,429,659 181,534
Special Road and Bridge 0.34110.341174,429,659 253,880 2019City of Camden Point General Revenue 0.67680.67685,981,838 40,485City of Dearborn General Revenue 0.48060.48066,040,933 29,033City of Edgerton General Revenue 0.67270.67276,295,902 42,353Village of Farley General Revenue 0.47370.47373,031,874 14,362Village of Ferrelview General Revenue 0.51460.51463,595,009 18,500Village of Iatan General Revenue 0.50000.5000282,344 1,412City of Platte City General Revenue 0.51210.512179,824,325 408,780
Debt Service 0.56371.066579,824,325 449,970City of Platte Woods General Revenue 0.73950.739511,401,419 84,313City of Tracy General Revenue 0.67570.67573,174,411 21,449City of Weatherby Lake General Revenue 0.84210.842154,841,375 461,819
Parks & Recreation 0.17970.179754,841,375 98,550Debt Service 0.60470.604754,841,375 331,626
City of Weston General Revenue 0.40680.406827,373,935 111,357Parks & Recreation 0.14820.148227,373,935 40,568Lights 0.11510.115127,373,935 31,507
City of Lake Waukomis General Revenue 0.64950.649518,554,994 120,515General Revenue-Temp 0.70000.700018,554,994 129,885 2017
City of Parkville General Revenue 0.46530.4653222,921,724 1,037,255General Revenue-Temp 0.17590.1759222,921,724 392,119 2024
City of Northmoor General Revenue 0.37010.37016,684,271 24,738Town of Ridgely General Revenue 0.32190.32191,263,259 4,066City of Houston Lake General Revenue 0.70050.70052,944,496 20,626
Fire 0.78000.78002,944,496 A22,967 2020Central Platte FPD General Revenue 0.30880.3088239,482,802 739,523Southern Platte FPD General Revenue 0.90230.9023487,585,234 4,399,482
Debt Service 0.05590.0559487,585,234 272,560Weatherby Lake FPD General Revenue 1.04501.045054,841,375 573,092West Platte FPD General Revenue 0.38820.3882207,368,135 805,003
Ambulance 0.38820.3882207,368,135 805,003Camden Point FPD General Revenue 0.47620.476224,470,644 116,529Smithville Area FPD General Revenue 0.29060.2906276,599,242 803,797
Debt Service 0.20000.3237276,599,242 553,198Edgerton-Trimble FPD General Revenue 0.49790.497942,061,262 209,423Dearborn Area FPD General Revenue 0.52390.523932,595,417 170,767Platte County Health Department General Revenue 0.07830.07832,591,854,903 2,029,422North Platte County R-I SD Operating Funds-Schools 3.75003.751861,141,385 E2,292,802
Debt Service 0.99001.179861,141,385 605,300West Platte Co R-II School District Operating Funds-Schools 4.10004.1000211,964,806 E8,690,557Platte County R-III School District Operating Funds-Schools 3.43503.7424532,713,844 18,298,721
Operating Funds-Temp 0.41860.4186532,713,844 2,229,940 2034Debt Service 1.19031.5302532,713,844 6,340,893
84
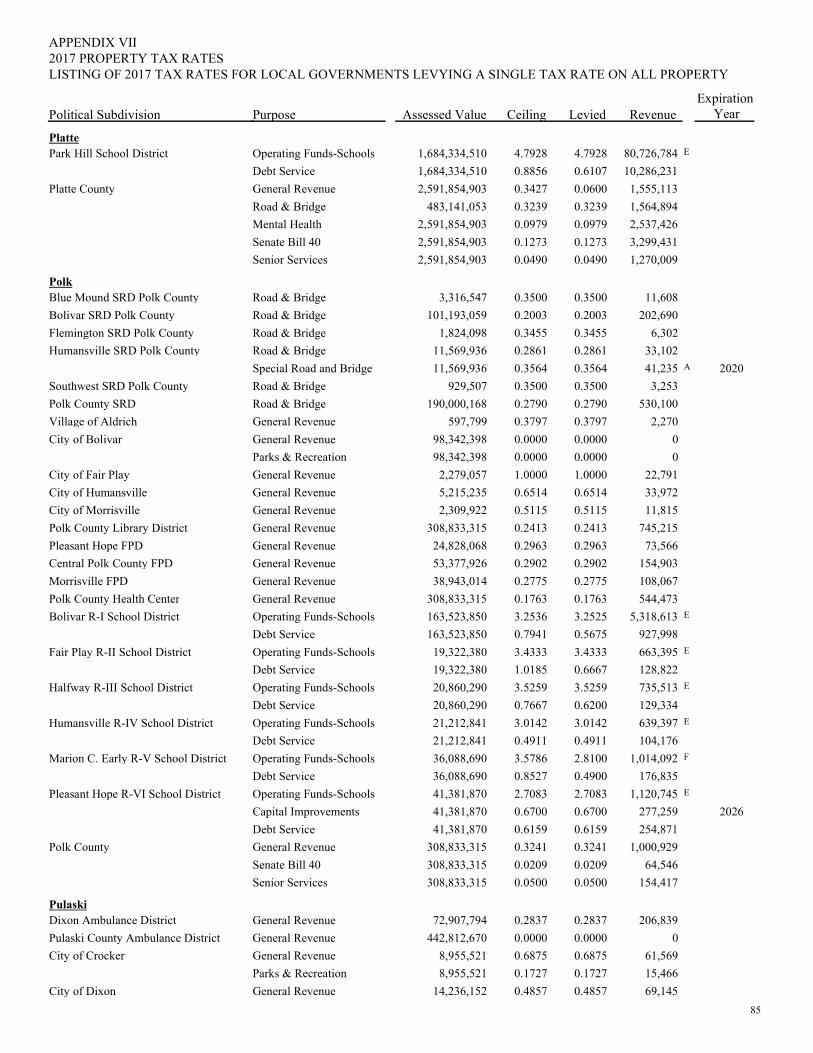
PurposePolitical Subdivision
2017 PROPERTY TAX RATESAPPENDIX VII
Assessed Value Ceiling Levied RevenueExpiration
Year
LISTING OF 2017 TAX RATES FOR LOCAL GOVERNMENTS LEVYING A SINGLE TAX RATE ON ALL PROPERTY
PlattePark Hill School District Operating Funds-Schools 4.79284.79281,684,334,510 E80,726,784
Debt Service 0.61070.88561,684,334,510 10,286,231Platte County General Revenue 0.06000.34272,591,854,903 1,555,113
Road & Bridge 0.32390.3239483,141,053 1,564,894Mental Health 0.09790.09792,591,854,903 2,537,426Senate Bill 40 0.12730.12732,591,854,903 3,299,431Senior Services 0.04900.04902,591,854,903 1,270,009
PolkBlue Mound SRD Polk County Road & Bridge 0.35000.35003,316,547 11,608Bolivar SRD Polk County Road & Bridge 0.20030.2003101,193,059 202,690Flemington SRD Polk County Road & Bridge 0.34550.34551,824,098 6,302Humansville SRD Polk County Road & Bridge 0.28610.286111,569,936 33,102
Special Road and Bridge 0.35640.356411,569,936 A41,235 2020Southwest SRD Polk County Road & Bridge 0.35000.3500929,507 3,253Polk County SRD Road & Bridge 0.27900.2790190,000,168 530,100Village of Aldrich General Revenue 0.37970.3797597,799 2,270City of Bolivar General Revenue 0.00000.000098,342,398 0
Parks & Recreation 0.00000.000098,342,398 0City of Fair Play General Revenue 1.00001.00002,279,057 22,791City of Humansville General Revenue 0.65140.65145,215,235 33,972City of Morrisville General Revenue 0.51150.51152,309,922 11,815Polk County Library District General Revenue 0.24130.2413308,833,315 745,215Pleasant Hope FPD General Revenue 0.29630.296324,828,068 73,566Central Polk County FPD General Revenue 0.29020.290253,377,926 154,903Morrisville FPD General Revenue 0.27750.277538,943,014 108,067Polk County Health Center General Revenue 0.17630.1763308,833,315 544,473Bolivar R-I School District Operating Funds-Schools 3.25253.2536163,523,850 E5,318,613
Debt Service 0.56750.7941163,523,850 927,998Fair Play R-II School District Operating Funds-Schools 3.43333.433319,322,380 E663,395
Debt Service 0.66671.018519,322,380 128,822Halfway R-III School District Operating Funds-Schools 3.52593.525920,860,290 E735,513
Debt Service 0.62000.766720,860,290 129,334Humansville R-IV School District Operating Funds-Schools 3.01423.014221,212,841 E639,397
Debt Service 0.49110.491121,212,841 104,176Marion C. Early R-V School District Operating Funds-Schools 2.81003.578636,088,690 F1,014,092
Debt Service 0.49000.852736,088,690 176,835Pleasant Hope R-VI School District Operating Funds-Schools 2.70832.708341,381,870 E1,120,745
Capital Improvements 0.67000.670041,381,870 277,259 2026Debt Service 0.61590.615941,381,870 254,871
Polk County General Revenue 0.32410.3241308,833,315 1,000,929Senate Bill 40 0.02090.0209308,833,315 64,546Senior Services 0.05000.0500308,833,315 154,417
PulaskiDixon Ambulance District General Revenue 0.28370.283772,907,794 206,839Pulaski County Ambulance District General Revenue 0.00000.0000442,812,670 0City of Crocker General Revenue 0.68750.68758,955,521 61,569
Parks & Recreation 0.17270.17278,955,521 15,466City of Dixon General Revenue 0.48570.485714,236,152 69,145
85
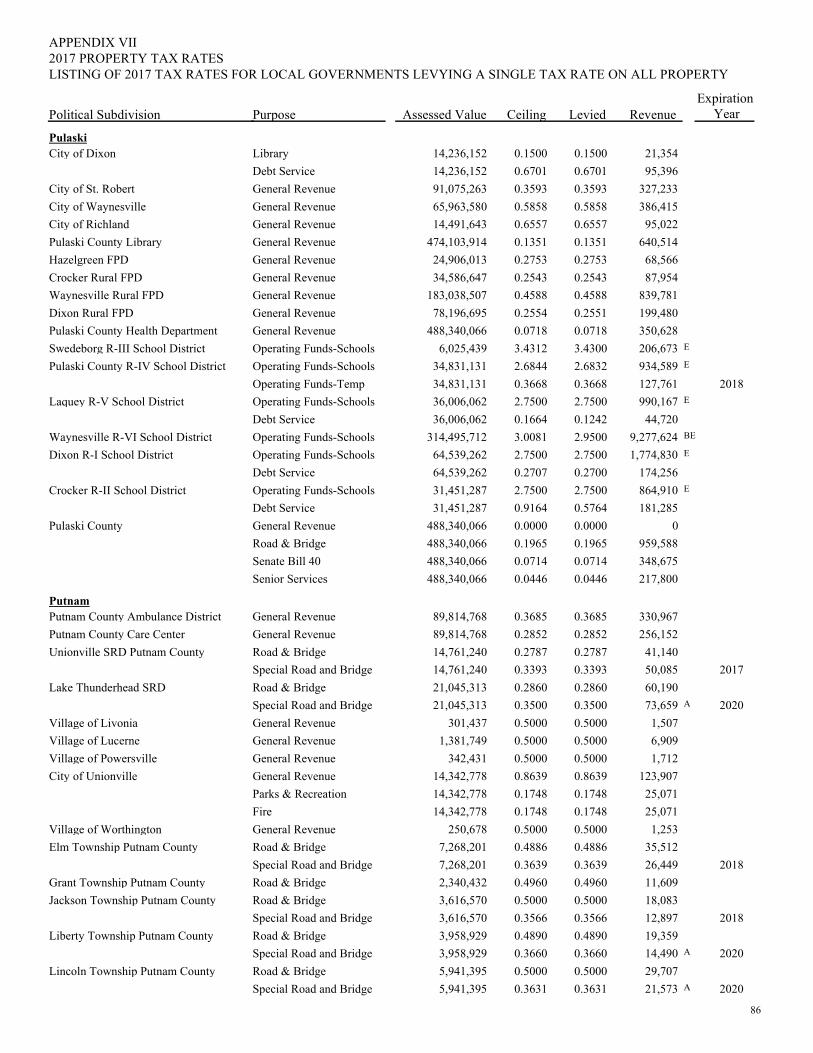
PurposePolitical Subdivision
2017 PROPERTY TAX RATESAPPENDIX VII
Assessed Value Ceiling Levied RevenueExpiration
Year
LISTING OF 2017 TAX RATES FOR LOCAL GOVERNMENTS LEVYING A SINGLE TAX RATE ON ALL PROPERTY
PulaskiCity of Dixon Library 0.15000.150014,236,152 21,354
Debt Service 0.67010.670114,236,152 95,396City of St. Robert General Revenue 0.35930.359391,075,263 327,233City of Waynesville General Revenue 0.58580.585865,963,580 386,415City of Richland General Revenue 0.65570.655714,491,643 95,022Pulaski County Library General Revenue 0.13510.1351474,103,914 640,514Hazelgreen FPD General Revenue 0.27530.275324,906,013 68,566Crocker Rural FPD General Revenue 0.25430.254334,586,647 87,954Waynesville Rural FPD General Revenue 0.45880.4588183,038,507 839,781Dixon Rural FPD General Revenue 0.25510.255478,196,695 199,480Pulaski County Health Department General Revenue 0.07180.0718488,340,066 350,628Swedeborg R-III School District Operating Funds-Schools 3.43003.43126,025,439 E206,673Pulaski County R-IV School District Operating Funds-Schools 2.68322.684434,831,131 E934,589
Operating Funds-Temp 0.36680.366834,831,131 127,761 2018Laquey R-V School District Operating Funds-Schools 2.75002.750036,006,062 E990,167
Debt Service 0.12420.166436,006,062 44,720Waynesville R-VI School District Operating Funds-Schools 2.95003.0081314,495,712 BE9,277,624Dixon R-I School District Operating Funds-Schools 2.75002.750064,539,262 E1,774,830
Debt Service 0.27000.270764,539,262 174,256Crocker R-II School District Operating Funds-Schools 2.75002.750031,451,287 E864,910
Debt Service 0.57640.916431,451,287 181,285Pulaski County General Revenue 0.00000.0000488,340,066 0
Road & Bridge 0.19650.1965488,340,066 959,588Senate Bill 40 0.07140.0714488,340,066 348,675Senior Services 0.04460.0446488,340,066 217,800
PutnamPutnam County Ambulance District General Revenue 0.36850.368589,814,768 330,967Putnam County Care Center General Revenue 0.28520.285289,814,768 256,152Unionville SRD Putnam County Road & Bridge 0.27870.278714,761,240 41,140
Special Road and Bridge 0.33930.339314,761,240 50,085 2017Lake Thunderhead SRD Road & Bridge 0.28600.286021,045,313 60,190
Special Road and Bridge 0.35000.350021,045,313 A73,659 2020Village of Livonia General Revenue 0.50000.5000301,437 1,507Village of Lucerne General Revenue 0.50000.50001,381,749 6,909Village of Powersville General Revenue 0.50000.5000342,431 1,712City of Unionville General Revenue 0.86390.863914,342,778 123,907
Parks & Recreation 0.17480.174814,342,778 25,071Fire 0.17480.174814,342,778 25,071
Village of Worthington General Revenue 0.50000.5000250,678 1,253Elm Township Putnam County Road & Bridge 0.48860.48867,268,201 35,512
Special Road and Bridge 0.36390.36397,268,201 26,449 2018Grant Township Putnam County Road & Bridge 0.49600.49602,340,432 11,609Jackson Township Putnam County Road & Bridge 0.50000.50003,616,570 18,083
Special Road and Bridge 0.35660.35663,616,570 12,897 2018Liberty Township Putnam County Road & Bridge 0.48900.48903,958,929 19,359
Special Road and Bridge 0.36600.36603,958,929 A14,490 2020Lincoln Township Putnam County Road & Bridge 0.50000.50005,941,395 29,707
Special Road and Bridge 0.36310.36315,941,395 A21,573 2020
86
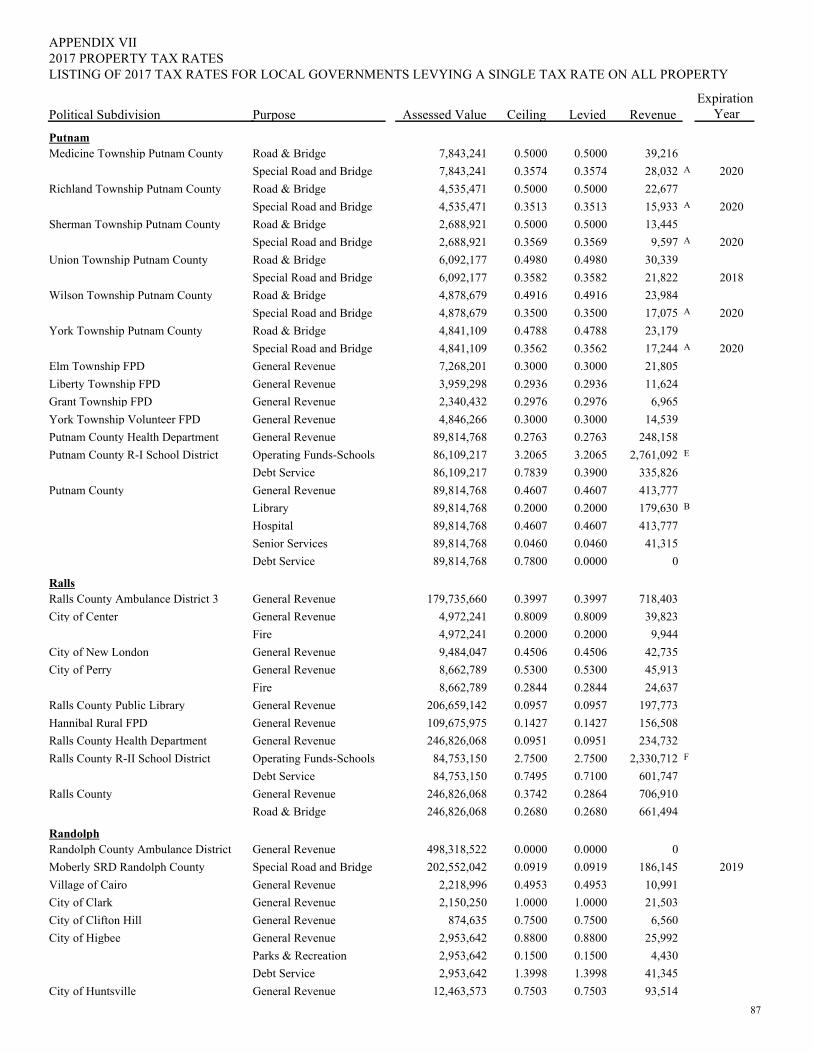
PurposePolitical Subdivision
2017 PROPERTY TAX RATESAPPENDIX VII
Assessed Value Ceiling Levied RevenueExpiration
Year
LISTING OF 2017 TAX RATES FOR LOCAL GOVERNMENTS LEVYING A SINGLE TAX RATE ON ALL PROPERTY
PutnamMedicine Township Putnam County Road & Bridge 0.50000.50007,843,241 39,216
Special Road and Bridge 0.35740.35747,843,241 A28,032 2020Richland Township Putnam County Road & Bridge 0.50000.50004,535,471 22,677
Special Road and Bridge 0.35130.35134,535,471 A15,933 2020Sherman Township Putnam County Road & Bridge 0.50000.50002,688,921 13,445
Special Road and Bridge 0.35690.35692,688,921 A9,597 2020Union Township Putnam County Road & Bridge 0.49800.49806,092,177 30,339
Special Road and Bridge 0.35820.35826,092,177 21,822 2018Wilson Township Putnam County Road & Bridge 0.49160.49164,878,679 23,984
Special Road and Bridge 0.35000.35004,878,679 A17,075 2020York Township Putnam County Road & Bridge 0.47880.47884,841,109 23,179
Special Road and Bridge 0.35620.35624,841,109 A17,244 2020Elm Township FPD General Revenue 0.30000.30007,268,201 21,805Liberty Township FPD General Revenue 0.29360.29363,959,298 11,624Grant Township FPD General Revenue 0.29760.29762,340,432 6,965York Township Volunteer FPD General Revenue 0.30000.30004,846,266 14,539Putnam County Health Department General Revenue 0.27630.276389,814,768 248,158Putnam County R-I School District Operating Funds-Schools 3.20653.206586,109,217 E2,761,092
Debt Service 0.39000.783986,109,217 335,826Putnam County General Revenue 0.46070.460789,814,768 413,777
Library 0.20000.200089,814,768 B179,630Hospital 0.46070.460789,814,768 413,777Senior Services 0.04600.046089,814,768 41,315Debt Service 0.00000.780089,814,768 0
RallsRalls County Ambulance District 3 General Revenue 0.39970.3997179,735,660 718,403City of Center General Revenue 0.80090.80094,972,241 39,823
Fire 0.20000.20004,972,241 9,944City of New London General Revenue 0.45060.45069,484,047 42,735City of Perry General Revenue 0.53000.53008,662,789 45,913
Fire 0.28440.28448,662,789 24,637Ralls County Public Library General Revenue 0.09570.0957206,659,142 197,773Hannibal Rural FPD General Revenue 0.14270.1427109,675,975 156,508Ralls County Health Department General Revenue 0.09510.0951246,826,068 234,732Ralls County R-II School District Operating Funds-Schools 2.75002.750084,753,150 F2,330,712
Debt Service 0.71000.749584,753,150 601,747Ralls County General Revenue 0.28640.3742246,826,068 706,910
Road & Bridge 0.26800.2680246,826,068 661,494
RandolphRandolph County Ambulance District General Revenue 0.00000.0000498,318,522 0Moberly SRD Randolph County Special Road and Bridge 0.09190.0919202,552,042 186,145 2019Village of Cairo General Revenue 0.49530.49532,218,996 10,991City of Clark General Revenue 1.00001.00002,150,250 21,503City of Clifton Hill General Revenue 0.75000.7500874,635 6,560City of Higbee General Revenue 0.88000.88002,953,642 25,992
Parks & Recreation 0.15000.15002,953,642 4,430Debt Service 1.39981.39982,953,642 41,345
City of Huntsville General Revenue 0.75030.750312,463,573 93,51487
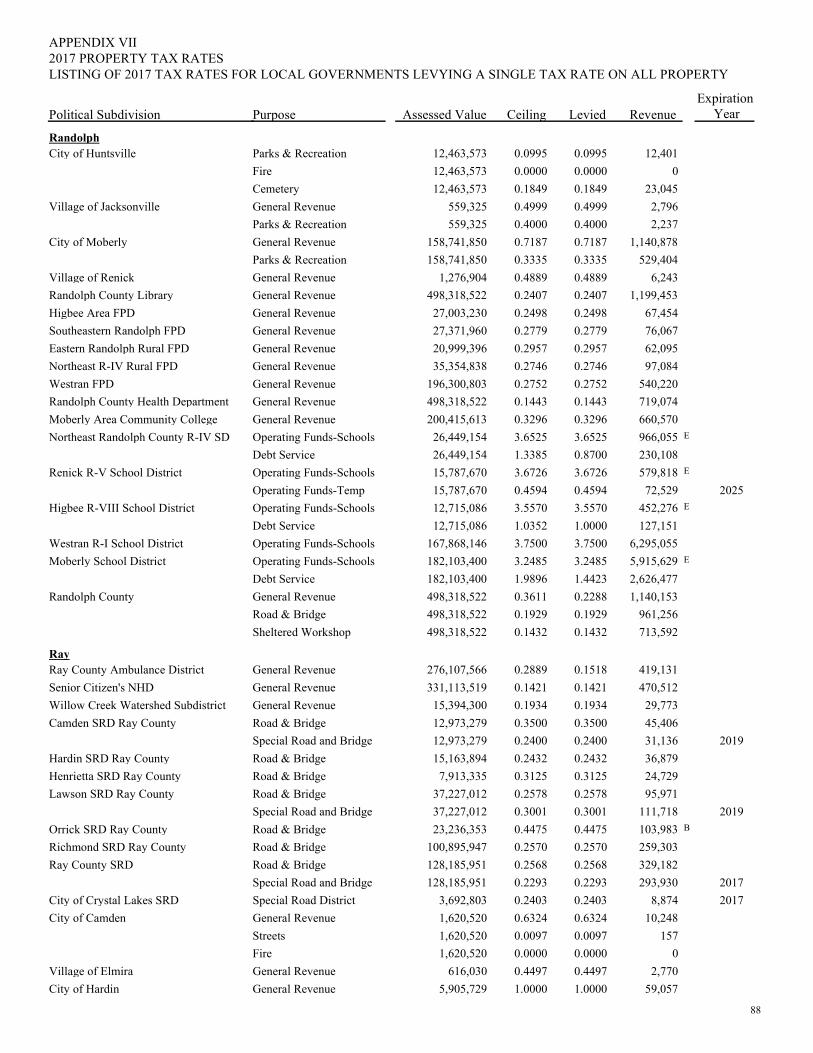
PurposePolitical Subdivision
2017 PROPERTY TAX RATESAPPENDIX VII
Assessed Value Ceiling Levied RevenueExpiration
Year
LISTING OF 2017 TAX RATES FOR LOCAL GOVERNMENTS LEVYING A SINGLE TAX RATE ON ALL PROPERTY
RandolphCity of Huntsville Parks & Recreation 0.09950.099512,463,573 12,401
Fire 0.00000.000012,463,573 0Cemetery 0.18490.184912,463,573 23,045
Village of Jacksonville General Revenue 0.49990.4999559,325 2,796Parks & Recreation 0.40000.4000559,325 2,237
City of Moberly General Revenue 0.71870.7187158,741,850 1,140,878Parks & Recreation 0.33350.3335158,741,850 529,404
Village of Renick General Revenue 0.48890.48891,276,904 6,243Randolph County Library General Revenue 0.24070.2407498,318,522 1,199,453Higbee Area FPD General Revenue 0.24980.249827,003,230 67,454Southeastern Randolph FPD General Revenue 0.27790.277927,371,960 76,067Eastern Randolph Rural FPD General Revenue 0.29570.295720,999,396 62,095Northeast R-IV Rural FPD General Revenue 0.27460.274635,354,838 97,084Westran FPD General Revenue 0.27520.2752196,300,803 540,220Randolph County Health Department General Revenue 0.14430.1443498,318,522 719,074Moberly Area Community College General Revenue 0.32960.3296200,415,613 660,570Northeast Randolph County R-IV SD Operating Funds-Schools 3.65253.652526,449,154 E966,055
Debt Service 0.87001.338526,449,154 230,108Renick R-V School District Operating Funds-Schools 3.67263.672615,787,670 E579,818
Operating Funds-Temp 0.45940.459415,787,670 72,529 2025Higbee R-VIII School District Operating Funds-Schools 3.55703.557012,715,086 E452,276
Debt Service 1.00001.035212,715,086 127,151Westran R-I School District Operating Funds-Schools 3.75003.7500167,868,146 6,295,055Moberly School District Operating Funds-Schools 3.24853.2485182,103,400 E5,915,629
Debt Service 1.44231.9896182,103,400 2,626,477Randolph County General Revenue 0.22880.3611498,318,522 1,140,153
Road & Bridge 0.19290.1929498,318,522 961,256Sheltered Workshop 0.14320.1432498,318,522 713,592
RayRay County Ambulance District General Revenue 0.15180.2889276,107,566 419,131Senior Citizen's NHD General Revenue 0.14210.1421331,113,519 470,512Willow Creek Watershed Subdistrict General Revenue 0.19340.193415,394,300 29,773Camden SRD Ray County Road & Bridge 0.35000.350012,973,279 45,406
Special Road and Bridge 0.24000.240012,973,279 31,136 2019Hardin SRD Ray County Road & Bridge 0.24320.243215,163,894 36,879Henrietta SRD Ray County Road & Bridge 0.31250.31257,913,335 24,729Lawson SRD Ray County Road & Bridge 0.25780.257837,227,012 95,971
Special Road and Bridge 0.30010.300137,227,012 111,718 2019Orrick SRD Ray County Road & Bridge 0.44750.447523,236,353 B103,983Richmond SRD Ray County Road & Bridge 0.25700.2570100,895,947 259,303Ray County SRD Road & Bridge 0.25680.2568128,185,951 329,182
Special Road and Bridge 0.22930.2293128,185,951 293,930 2017City of Crystal Lakes SRD Special Road District 0.24030.24033,692,803 8,874 2017City of Camden General Revenue 0.63240.63241,620,520 10,248
Streets 0.00970.00971,620,520 157Fire 0.00000.00001,620,520 0
Village of Elmira General Revenue 0.44970.4497616,030 2,770City of Hardin General Revenue 1.00001.00005,905,729 59,057
88
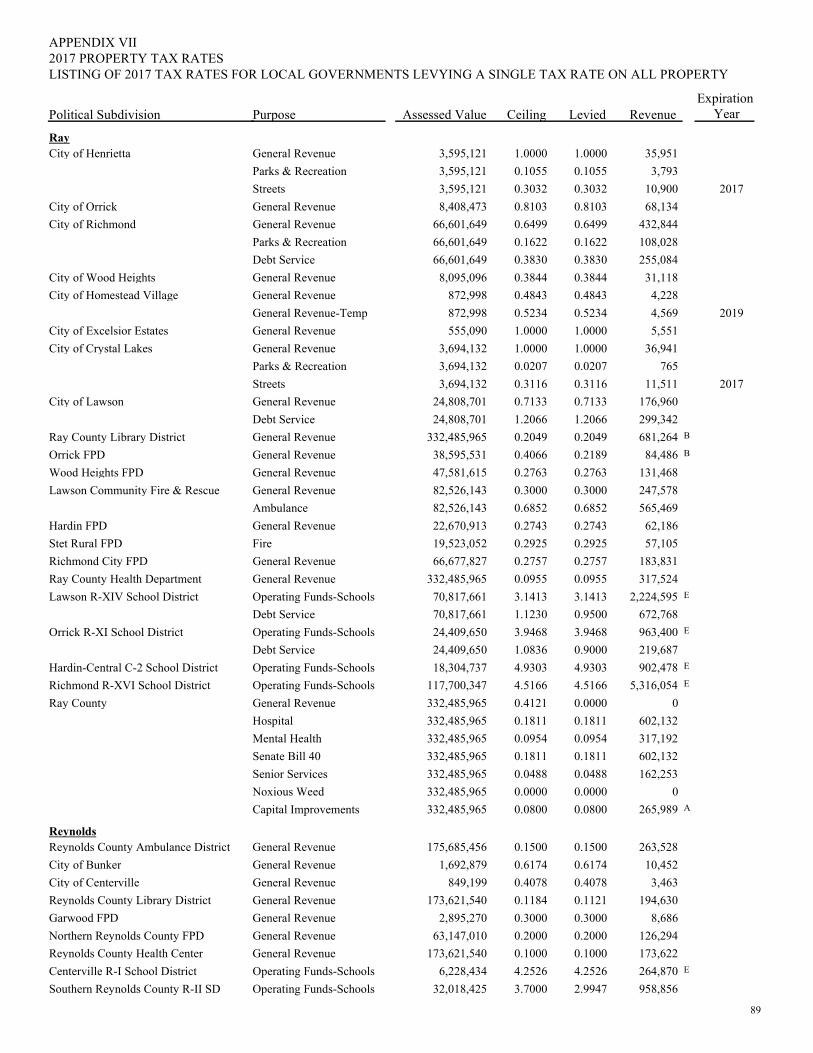
PurposePolitical Subdivision
2017 PROPERTY TAX RATESAPPENDIX VII
Assessed Value Ceiling Levied RevenueExpiration
Year
LISTING OF 2017 TAX RATES FOR LOCAL GOVERNMENTS LEVYING A SINGLE TAX RATE ON ALL PROPERTY
RayCity of Henrietta General Revenue 1.00001.00003,595,121 35,951
Parks & Recreation 0.10550.10553,595,121 3,793Streets 0.30320.30323,595,121 10,900 2017
City of Orrick General Revenue 0.81030.81038,408,473 68,134City of Richmond General Revenue 0.64990.649966,601,649 432,844
Parks & Recreation 0.16220.162266,601,649 108,028Debt Service 0.38300.383066,601,649 255,084
City of Wood Heights General Revenue 0.38440.38448,095,096 31,118City of Homestead Village General Revenue 0.48430.4843872,998 4,228
General Revenue-Temp 0.52340.5234872,998 4,569 2019City of Excelsior Estates General Revenue 1.00001.0000555,090 5,551City of Crystal Lakes General Revenue 1.00001.00003,694,132 36,941
Parks & Recreation 0.02070.02073,694,132 765Streets 0.31160.31163,694,132 11,511 2017
City of Lawson General Revenue 0.71330.713324,808,701 176,960Debt Service 1.20661.206624,808,701 299,342
Ray County Library District General Revenue 0.20490.2049332,485,965 B681,264Orrick FPD General Revenue 0.21890.406638,595,531 B84,486Wood Heights FPD General Revenue 0.27630.276347,581,615 131,468Lawson Community Fire & Rescue General Revenue 0.30000.300082,526,143 247,578
Ambulance 0.68520.685282,526,143 565,469Hardin FPD General Revenue 0.27430.274322,670,913 62,186Stet Rural FPD Fire 0.29250.292519,523,052 57,105Richmond City FPD General Revenue 0.27570.275766,677,827 183,831Ray County Health Department General Revenue 0.09550.0955332,485,965 317,524Lawson R-XIV School District Operating Funds-Schools 3.14133.141370,817,661 E2,224,595
Debt Service 0.95001.123070,817,661 672,768Orrick R-XI School District Operating Funds-Schools 3.94683.946824,409,650 E963,400
Debt Service 0.90001.083624,409,650 219,687Hardin-Central C-2 School District Operating Funds-Schools 4.93034.930318,304,737 E902,478Richmond R-XVI School District Operating Funds-Schools 4.51664.5166117,700,347 E5,316,054Ray County General Revenue 0.00000.4121332,485,965 0
Hospital 0.18110.1811332,485,965 602,132Mental Health 0.09540.0954332,485,965 317,192Senate Bill 40 0.18110.1811332,485,965 602,132Senior Services 0.04880.0488332,485,965 162,253Noxious Weed 0.00000.0000332,485,965 0Capital Improvements 0.08000.0800332,485,965 A265,989
ReynoldsReynolds County Ambulance District General Revenue 0.15000.1500175,685,456 263,528City of Bunker General Revenue 0.61740.61741,692,879 10,452City of Centerville General Revenue 0.40780.4078849,199 3,463Reynolds County Library District General Revenue 0.11210.1184173,621,540 194,630Garwood FPD General Revenue 0.30000.30002,895,270 8,686Northern Reynolds County FPD General Revenue 0.20000.200063,147,010 126,294Reynolds County Health Center General Revenue 0.10000.1000173,621,540 173,622Centerville R-I School District Operating Funds-Schools 4.25264.25266,228,434 E264,870Southern Reynolds County R-II SD Operating Funds-Schools 2.99473.700032,018,425 958,856
89
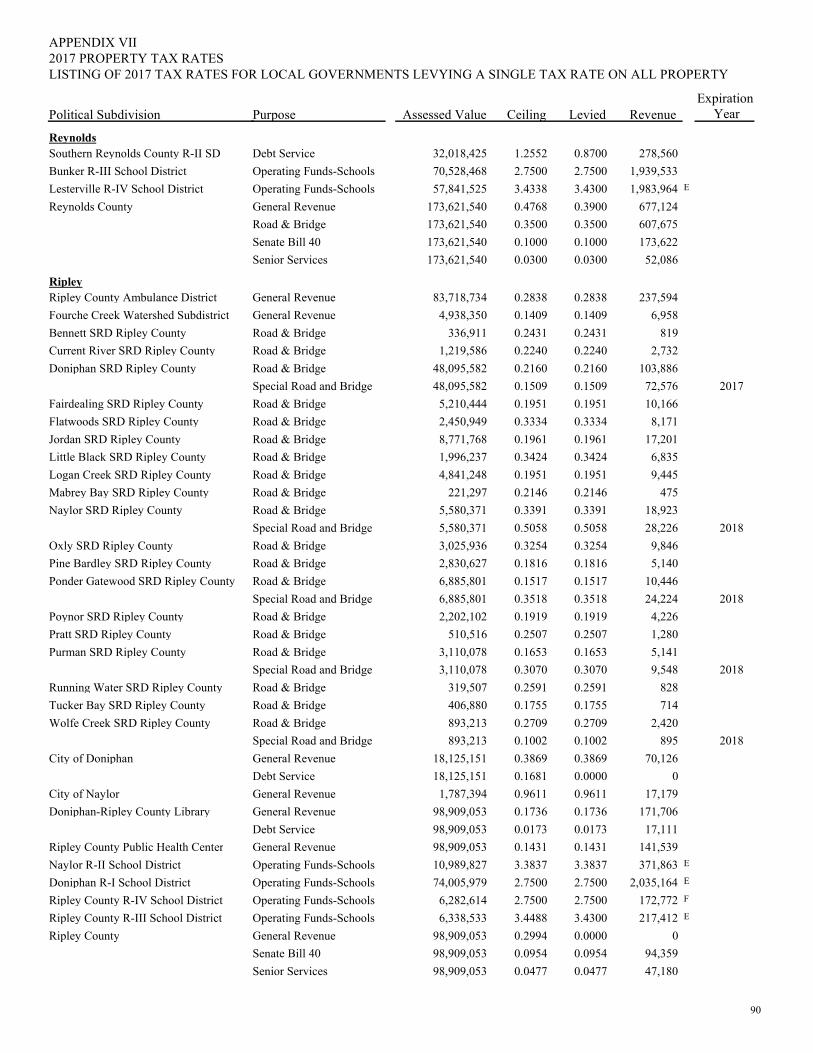
PurposePolitical Subdivision
2017 PROPERTY TAX RATESAPPENDIX VII
Assessed Value Ceiling Levied RevenueExpiration
Year
LISTING OF 2017 TAX RATES FOR LOCAL GOVERNMENTS LEVYING A SINGLE TAX RATE ON ALL PROPERTY
ReynoldsSouthern Reynolds County R-II SD Debt Service 0.87001.255232,018,425 278,560Bunker R-III School District Operating Funds-Schools 2.75002.750070,528,468 1,939,533Lesterville R-IV School District Operating Funds-Schools 3.43003.433857,841,525 E1,983,964Reynolds County General Revenue 0.39000.4768173,621,540 677,124
Road & Bridge 0.35000.3500173,621,540 607,675Senate Bill 40 0.10000.1000173,621,540 173,622Senior Services 0.03000.0300173,621,540 52,086
RipleyRipley County Ambulance District General Revenue 0.28380.283883,718,734 237,594Fourche Creek Watershed Subdistrict General Revenue 0.14090.14094,938,350 6,958Bennett SRD Ripley County Road & Bridge 0.24310.2431336,911 819Current River SRD Ripley County Road & Bridge 0.22400.22401,219,586 2,732Doniphan SRD Ripley County Road & Bridge 0.21600.216048,095,582 103,886
Special Road and Bridge 0.15090.150948,095,582 72,576 2017Fairdealing SRD Ripley County Road & Bridge 0.19510.19515,210,444 10,166Flatwoods SRD Ripley County Road & Bridge 0.33340.33342,450,949 8,171Jordan SRD Ripley County Road & Bridge 0.19610.19618,771,768 17,201Little Black SRD Ripley County Road & Bridge 0.34240.34241,996,237 6,835Logan Creek SRD Ripley County Road & Bridge 0.19510.19514,841,248 9,445Mabrey Bay SRD Ripley County Road & Bridge 0.21460.2146221,297 475Naylor SRD Ripley County Road & Bridge 0.33910.33915,580,371 18,923
Special Road and Bridge 0.50580.50585,580,371 28,226 2018Oxly SRD Ripley County Road & Bridge 0.32540.32543,025,936 9,846Pine Bardley SRD Ripley County Road & Bridge 0.18160.18162,830,627 5,140Ponder Gatewood SRD Ripley County Road & Bridge 0.15170.15176,885,801 10,446
Special Road and Bridge 0.35180.35186,885,801 24,224 2018Poynor SRD Ripley County Road & Bridge 0.19190.19192,202,102 4,226Pratt SRD Ripley County Road & Bridge 0.25070.2507510,516 1,280Purman SRD Ripley County Road & Bridge 0.16530.16533,110,078 5,141
Special Road and Bridge 0.30700.30703,110,078 9,548 2018Running Water SRD Ripley County Road & Bridge 0.25910.2591319,507 828Tucker Bay SRD Ripley County Road & Bridge 0.17550.1755406,880 714Wolfe Creek SRD Ripley County Road & Bridge 0.27090.2709893,213 2,420
Special Road and Bridge 0.10020.1002893,213 895 2018City of Doniphan General Revenue 0.38690.386918,125,151 70,126
Debt Service 0.00000.168118,125,151 0City of Naylor General Revenue 0.96110.96111,787,394 17,179Doniphan-Ripley County Library General Revenue 0.17360.173698,909,053 171,706
Debt Service 0.01730.017398,909,053 17,111Ripley County Public Health Center General Revenue 0.14310.143198,909,053 141,539Naylor R-II School District Operating Funds-Schools 3.38373.383710,989,827 E371,863Doniphan R-I School District Operating Funds-Schools 2.75002.750074,005,979 E2,035,164Ripley County R-IV School District Operating Funds-Schools 2.75002.75006,282,614 F172,772Ripley County R-III School District Operating Funds-Schools 3.43003.44886,338,533 E217,412Ripley County General Revenue 0.00000.299498,909,053 0
Senate Bill 40 0.09540.095498,909,053 94,359Senior Services 0.04770.047798,909,053 47,180
90
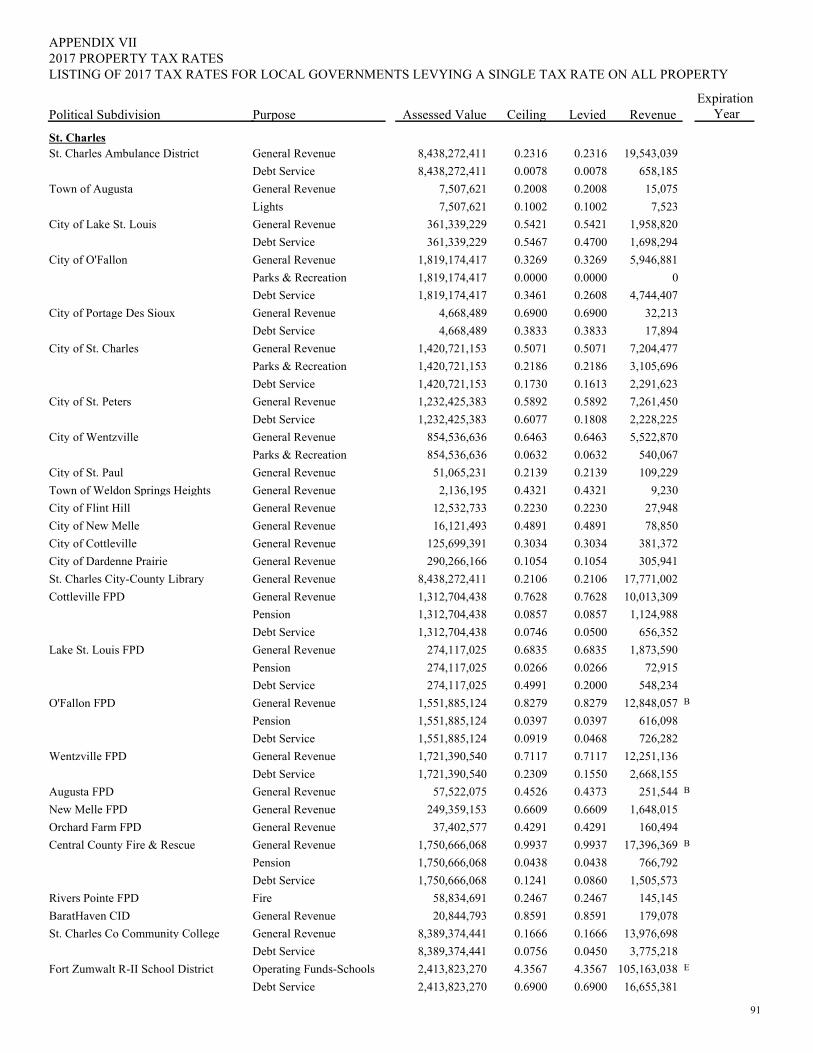
PurposePolitical Subdivision
2017 PROPERTY TAX RATESAPPENDIX VII
Assessed Value Ceiling Levied RevenueExpiration
Year
LISTING OF 2017 TAX RATES FOR LOCAL GOVERNMENTS LEVYING A SINGLE TAX RATE ON ALL PROPERTY
St. CharlesSt. Charles Ambulance District General Revenue 0.23160.23168,438,272,411 19,543,039
Debt Service 0.00780.00788,438,272,411 658,185Town of Augusta General Revenue 0.20080.20087,507,621 15,075
Lights 0.10020.10027,507,621 7,523City of Lake St. Louis General Revenue 0.54210.5421361,339,229 1,958,820
Debt Service 0.47000.5467361,339,229 1,698,294City of O'Fallon General Revenue 0.32690.32691,819,174,417 5,946,881
Parks & Recreation 0.00000.00001,819,174,417 0Debt Service 0.26080.34611,819,174,417 4,744,407
City of Portage Des Sioux General Revenue 0.69000.69004,668,489 32,213Debt Service 0.38330.38334,668,489 17,894
City of St. Charles General Revenue 0.50710.50711,420,721,153 7,204,477Parks & Recreation 0.21860.21861,420,721,153 3,105,696Debt Service 0.16130.17301,420,721,153 2,291,623
City of St. Peters General Revenue 0.58920.58921,232,425,383 7,261,450Debt Service 0.18080.60771,232,425,383 2,228,225
City of Wentzville General Revenue 0.64630.6463854,536,636 5,522,870Parks & Recreation 0.06320.0632854,536,636 540,067
City of St. Paul General Revenue 0.21390.213951,065,231 109,229Town of Weldon Springs Heights General Revenue 0.43210.43212,136,195 9,230City of Flint Hill General Revenue 0.22300.223012,532,733 27,948City of New Melle General Revenue 0.48910.489116,121,493 78,850City of Cottleville General Revenue 0.30340.3034125,699,391 381,372City of Dardenne Prairie General Revenue 0.10540.1054290,266,166 305,941St. Charles City-County Library General Revenue 0.21060.21068,438,272,411 17,771,002Cottleville FPD General Revenue 0.76280.76281,312,704,438 10,013,309
Pension 0.08570.08571,312,704,438 1,124,988Debt Service 0.05000.07461,312,704,438 656,352
Lake St. Louis FPD General Revenue 0.68350.6835274,117,025 1,873,590Pension 0.02660.0266274,117,025 72,915Debt Service 0.20000.4991274,117,025 548,234
O'Fallon FPD General Revenue 0.82790.82791,551,885,124 B12,848,057Pension 0.03970.03971,551,885,124 616,098Debt Service 0.04680.09191,551,885,124 726,282
Wentzville FPD General Revenue 0.71170.71171,721,390,540 12,251,136Debt Service 0.15500.23091,721,390,540 2,668,155
Augusta FPD General Revenue 0.43730.452657,522,075 B251,544New Melle FPD General Revenue 0.66090.6609249,359,153 1,648,015Orchard Farm FPD General Revenue 0.42910.429137,402,577 160,494Central County Fire & Rescue General Revenue 0.99370.99371,750,666,068 B17,396,369
Pension 0.04380.04381,750,666,068 766,792Debt Service 0.08600.12411,750,666,068 1,505,573
Rivers Pointe FPD Fire 0.24670.246758,834,691 145,145BaratHaven CID General Revenue 0.85910.859120,844,793 179,078St. Charles Co Community College General Revenue 0.16660.16668,389,374,441 13,976,698
Debt Service 0.04500.07568,389,374,441 3,775,218Fort Zumwalt R-II School District Operating Funds-Schools 4.35674.35672,413,823,270 E105,163,038
Debt Service 0.69000.69002,413,823,270 16,655,381
91
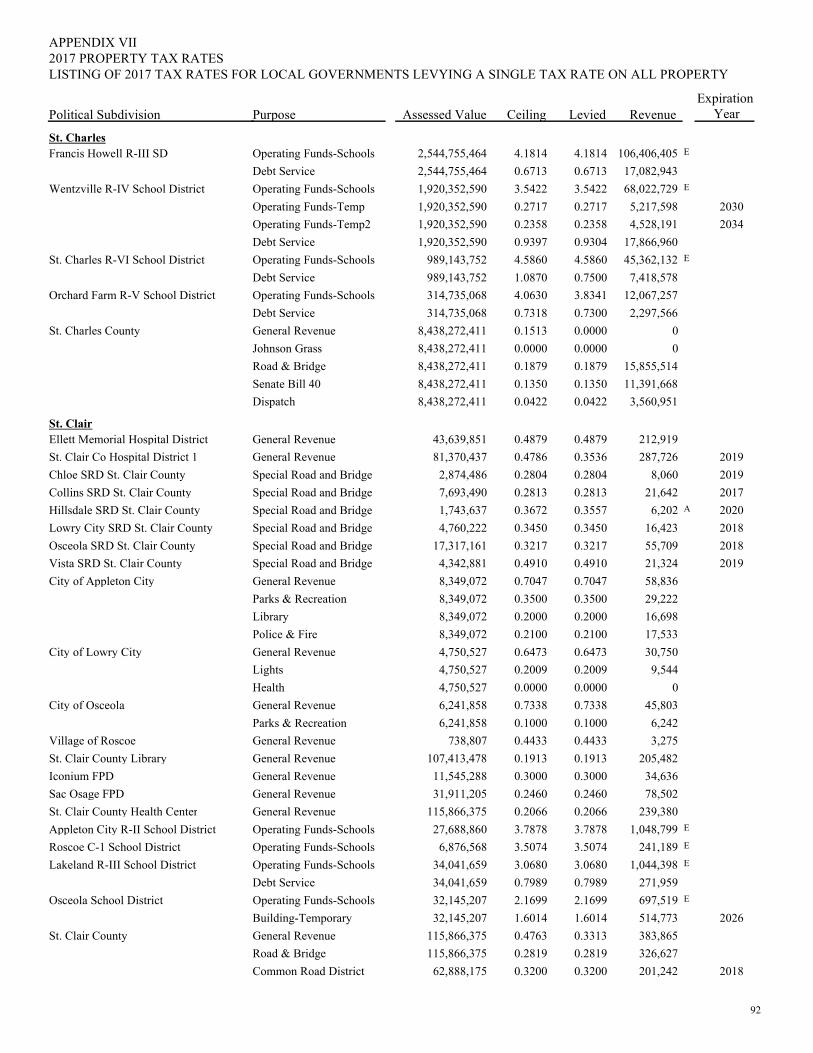
PurposePolitical Subdivision
2017 PROPERTY TAX RATESAPPENDIX VII
Assessed Value Ceiling Levied RevenueExpiration
Year
LISTING OF 2017 TAX RATES FOR LOCAL GOVERNMENTS LEVYING A SINGLE TAX RATE ON ALL PROPERTY
St. CharlesFrancis Howell R-III SD Operating Funds-Schools 4.18144.18142,544,755,464 E106,406,405
Debt Service 0.67130.67132,544,755,464 17,082,943Wentzville R-IV School District Operating Funds-Schools 3.54223.54221,920,352,590 E68,022,729
Operating Funds-Temp 0.27170.27171,920,352,590 5,217,598 2030Operating Funds-Temp2 0.23580.23581,920,352,590 4,528,191 2034Debt Service 0.93040.93971,920,352,590 17,866,960
St. Charles R-VI School District Operating Funds-Schools 4.58604.5860989,143,752 E45,362,132Debt Service 0.75001.0870989,143,752 7,418,578
Orchard Farm R-V School District Operating Funds-Schools 3.83414.0630314,735,068 12,067,257Debt Service 0.73000.7318314,735,068 2,297,566
St. Charles County General Revenue 0.00000.15138,438,272,411 0Johnson Grass 0.00000.00008,438,272,411 0Road & Bridge 0.18790.18798,438,272,411 15,855,514Senate Bill 40 0.13500.13508,438,272,411 11,391,668Dispatch 0.04220.04228,438,272,411 3,560,951
St. ClairEllett Memorial Hospital District General Revenue 0.48790.487943,639,851 212,919St. Clair Co Hospital District 1 General Revenue 0.35360.478681,370,437 287,726 2019Chloe SRD St. Clair County Special Road and Bridge 0.28040.28042,874,486 8,060 2019Collins SRD St. Clair County Special Road and Bridge 0.28130.28137,693,490 21,642 2017Hillsdale SRD St. Clair County Special Road and Bridge 0.35570.36721,743,637 A6,202 2020Lowry City SRD St. Clair County Special Road and Bridge 0.34500.34504,760,222 16,423 2018Osceola SRD St. Clair County Special Road and Bridge 0.32170.321717,317,161 55,709 2018Vista SRD St. Clair County Special Road and Bridge 0.49100.49104,342,881 21,324 2019City of Appleton City General Revenue 0.70470.70478,349,072 58,836
Parks & Recreation 0.35000.35008,349,072 29,222Library 0.20000.20008,349,072 16,698Police & Fire 0.21000.21008,349,072 17,533
City of Lowry City General Revenue 0.64730.64734,750,527 30,750Lights 0.20090.20094,750,527 9,544Health 0.00000.00004,750,527 0
City of Osceola General Revenue 0.73380.73386,241,858 45,803Parks & Recreation 0.10000.10006,241,858 6,242
Village of Roscoe General Revenue 0.44330.4433738,807 3,275St. Clair County Library General Revenue 0.19130.1913107,413,478 205,482Iconium FPD General Revenue 0.30000.300011,545,288 34,636Sac Osage FPD General Revenue 0.24600.246031,911,205 78,502St. Clair County Health Center General Revenue 0.20660.2066115,866,375 239,380Appleton City R-II School District Operating Funds-Schools 3.78783.787827,688,860 E1,048,799Roscoe C-1 School District Operating Funds-Schools 3.50743.50746,876,568 E241,189Lakeland R-III School District Operating Funds-Schools 3.06803.068034,041,659 E1,044,398
Debt Service 0.79890.798934,041,659 271,959Osceola School District Operating Funds-Schools 2.16992.169932,145,207 E697,519
Building-Temporary 1.60141.601432,145,207 514,773 2026St. Clair County General Revenue 0.33130.4763115,866,375 383,865
Road & Bridge 0.28190.2819115,866,375 326,627Common Road District 0.32000.320062,888,175 201,242 2018
92
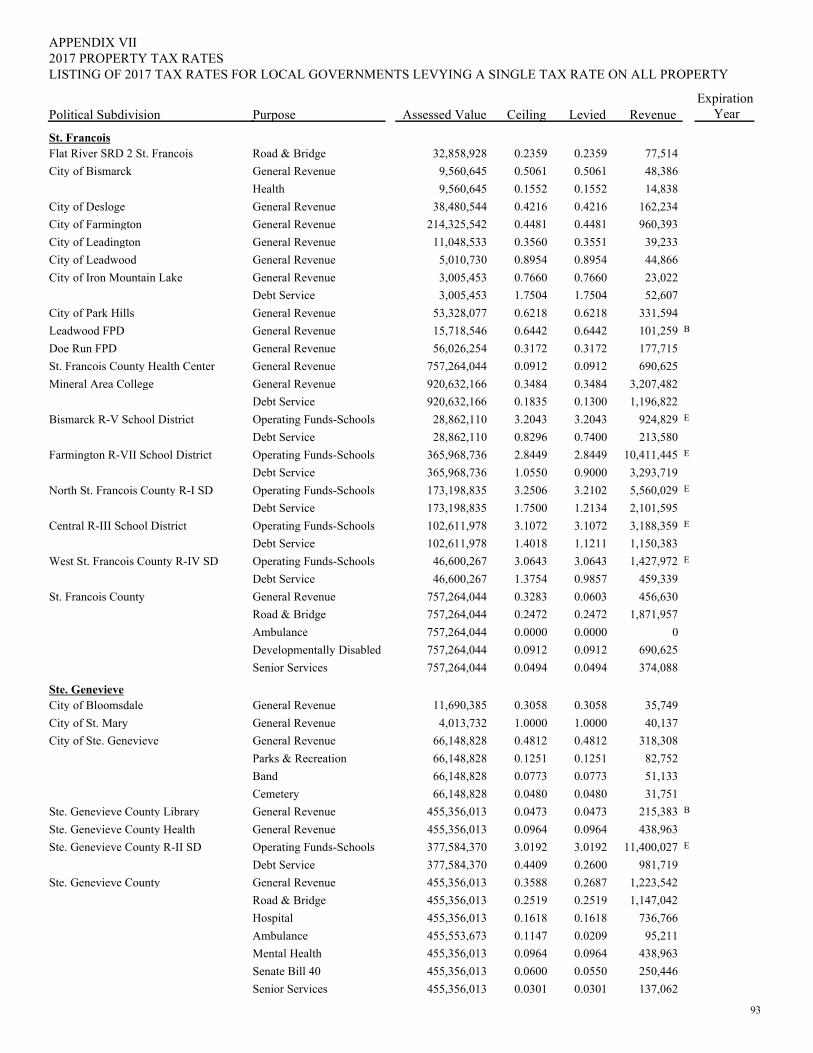
PurposePolitical Subdivision
2017 PROPERTY TAX RATESAPPENDIX VII
Assessed Value Ceiling Levied RevenueExpiration
Year
LISTING OF 2017 TAX RATES FOR LOCAL GOVERNMENTS LEVYING A SINGLE TAX RATE ON ALL PROPERTY
St. FrancoisFlat River SRD 2 St. Francois Road & Bridge 0.23590.235932,858,928 77,514City of Bismarck General Revenue 0.50610.50619,560,645 48,386
Health 0.15520.15529,560,645 14,838City of Desloge General Revenue 0.42160.421638,480,544 162,234City of Farmington General Revenue 0.44810.4481214,325,542 960,393City of Leadington General Revenue 0.35510.356011,048,533 39,233City of Leadwood General Revenue 0.89540.89545,010,730 44,866City of Iron Mountain Lake General Revenue 0.76600.76603,005,453 23,022
Debt Service 1.75041.75043,005,453 52,607City of Park Hills General Revenue 0.62180.621853,328,077 331,594Leadwood FPD General Revenue 0.64420.644215,718,546 B101,259Doe Run FPD General Revenue 0.31720.317256,026,254 177,715St. Francois County Health Center General Revenue 0.09120.0912757,264,044 690,625Mineral Area College General Revenue 0.34840.3484920,632,166 3,207,482
Debt Service 0.13000.1835920,632,166 1,196,822Bismarck R-V School District Operating Funds-Schools 3.20433.204328,862,110 E924,829
Debt Service 0.74000.829628,862,110 213,580Farmington R-VII School District Operating Funds-Schools 2.84492.8449365,968,736 E10,411,445
Debt Service 0.90001.0550365,968,736 3,293,719North St. Francois County R-I SD Operating Funds-Schools 3.21023.2506173,198,835 E5,560,029
Debt Service 1.21341.7500173,198,835 2,101,595Central R-III School District Operating Funds-Schools 3.10723.1072102,611,978 E3,188,359
Debt Service 1.12111.4018102,611,978 1,150,383West St. Francois County R-IV SD Operating Funds-Schools 3.06433.064346,600,267 E1,427,972
Debt Service 0.98571.375446,600,267 459,339St. Francois County General Revenue 0.06030.3283757,264,044 456,630
Road & Bridge 0.24720.2472757,264,044 1,871,957Ambulance 0.00000.0000757,264,044 0Developmentally Disabled 0.09120.0912757,264,044 690,625Senior Services 0.04940.0494757,264,044 374,088
Ste. GenevieveCity of Bloomsdale General Revenue 0.30580.305811,690,385 35,749City of St. Mary General Revenue 1.00001.00004,013,732 40,137City of Ste. Genevieve General Revenue 0.48120.481266,148,828 318,308
Parks & Recreation 0.12510.125166,148,828 82,752Band 0.07730.077366,148,828 51,133Cemetery 0.04800.048066,148,828 31,751
Ste. Genevieve County Library General Revenue 0.04730.0473455,356,013 B215,383Ste. Genevieve County Health General Revenue 0.09640.0964455,356,013 438,963Ste. Genevieve County R-II SD Operating Funds-Schools 3.01923.0192377,584,370 E11,400,027
Debt Service 0.26000.4409377,584,370 981,719Ste. Genevieve County General Revenue 0.26870.3588455,356,013 1,223,542
Road & Bridge 0.25190.2519455,356,013 1,147,042Hospital 0.16180.1618455,356,013 736,766Ambulance 0.02090.1147455,553,673 95,211Mental Health 0.09640.0964455,356,013 438,963Senate Bill 40 0.05500.0600455,356,013 250,446Senior Services 0.03010.0301455,356,013 137,062
93
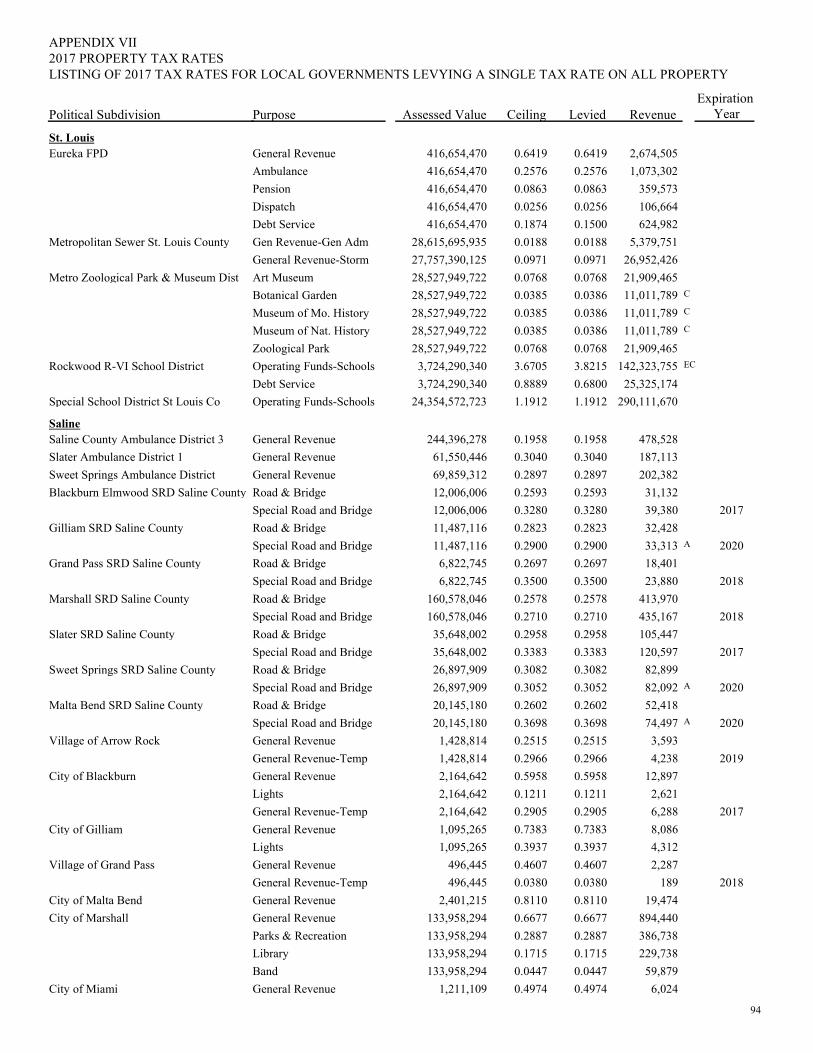
PurposePolitical Subdivision
2017 PROPERTY TAX RATESAPPENDIX VII
Assessed Value Ceiling Levied RevenueExpiration
Year
LISTING OF 2017 TAX RATES FOR LOCAL GOVERNMENTS LEVYING A SINGLE TAX RATE ON ALL PROPERTY
St. LouisEureka FPD General Revenue 0.64190.6419416,654,470 2,674,505
Ambulance 0.25760.2576416,654,470 1,073,302Pension 0.08630.0863416,654,470 359,573Dispatch 0.02560.0256416,654,470 106,664Debt Service 0.15000.1874416,654,470 624,982
Metropolitan Sewer St. Louis County Gen Revenue-Gen Adm 0.01880.018828,615,695,935 5,379,751General Revenue-Storm 0.09710.097127,757,390,125 26,952,426
Metro Zoological Park & Museum Dist Art Museum 0.07680.076828,527,949,722 21,909,465Botanical Garden 0.03860.038528,527,949,722 C11,011,789Museum of Mo. History 0.03860.038528,527,949,722 C11,011,789Museum of Nat. History 0.03860.038528,527,949,722 C11,011,789Zoological Park 0.07680.076828,527,949,722 21,909,465
Rockwood R-VI School District Operating Funds-Schools 3.82153.67053,724,290,340 EC142,323,755Debt Service 0.68000.88893,724,290,340 25,325,174
Special School District St Louis Co Operating Funds-Schools 1.19121.191224,354,572,723 290,111,670
SalineSaline County Ambulance District 3 General Revenue 0.19580.1958244,396,278 478,528Slater Ambulance District 1 General Revenue 0.30400.304061,550,446 187,113Sweet Springs Ambulance District General Revenue 0.28970.289769,859,312 202,382Blackburn Elmwood SRD Saline County Road & Bridge 0.25930.259312,006,006 31,132
Special Road and Bridge 0.32800.328012,006,006 39,380 2017Gilliam SRD Saline County Road & Bridge 0.28230.282311,487,116 32,428
Special Road and Bridge 0.29000.290011,487,116 A33,313 2020Grand Pass SRD Saline County Road & Bridge 0.26970.26976,822,745 18,401
Special Road and Bridge 0.35000.35006,822,745 23,880 2018Marshall SRD Saline County Road & Bridge 0.25780.2578160,578,046 413,970
Special Road and Bridge 0.27100.2710160,578,046 435,167 2018Slater SRD Saline County Road & Bridge 0.29580.295835,648,002 105,447
Special Road and Bridge 0.33830.338335,648,002 120,597 2017Sweet Springs SRD Saline County Road & Bridge 0.30820.308226,897,909 82,899
Special Road and Bridge 0.30520.305226,897,909 A82,092 2020Malta Bend SRD Saline County Road & Bridge 0.26020.260220,145,180 52,418
Special Road and Bridge 0.36980.369820,145,180 A74,497 2020Village of Arrow Rock General Revenue 0.25150.25151,428,814 3,593
General Revenue-Temp 0.29660.29661,428,814 4,238 2019City of Blackburn General Revenue 0.59580.59582,164,642 12,897
Lights 0.12110.12112,164,642 2,621General Revenue-Temp 0.29050.29052,164,642 6,288 2017
City of Gilliam General Revenue 0.73830.73831,095,265 8,086Lights 0.39370.39371,095,265 4,312
Village of Grand Pass General Revenue 0.46070.4607496,445 2,287General Revenue-Temp 0.03800.0380496,445 189 2018
City of Malta Bend General Revenue 0.81100.81102,401,215 19,474City of Marshall General Revenue 0.66770.6677133,958,294 894,440
Parks & Recreation 0.28870.2887133,958,294 386,738Library 0.17150.1715133,958,294 229,738Band 0.04470.0447133,958,294 59,879
City of Miami General Revenue 0.49740.49741,211,109 6,024
94
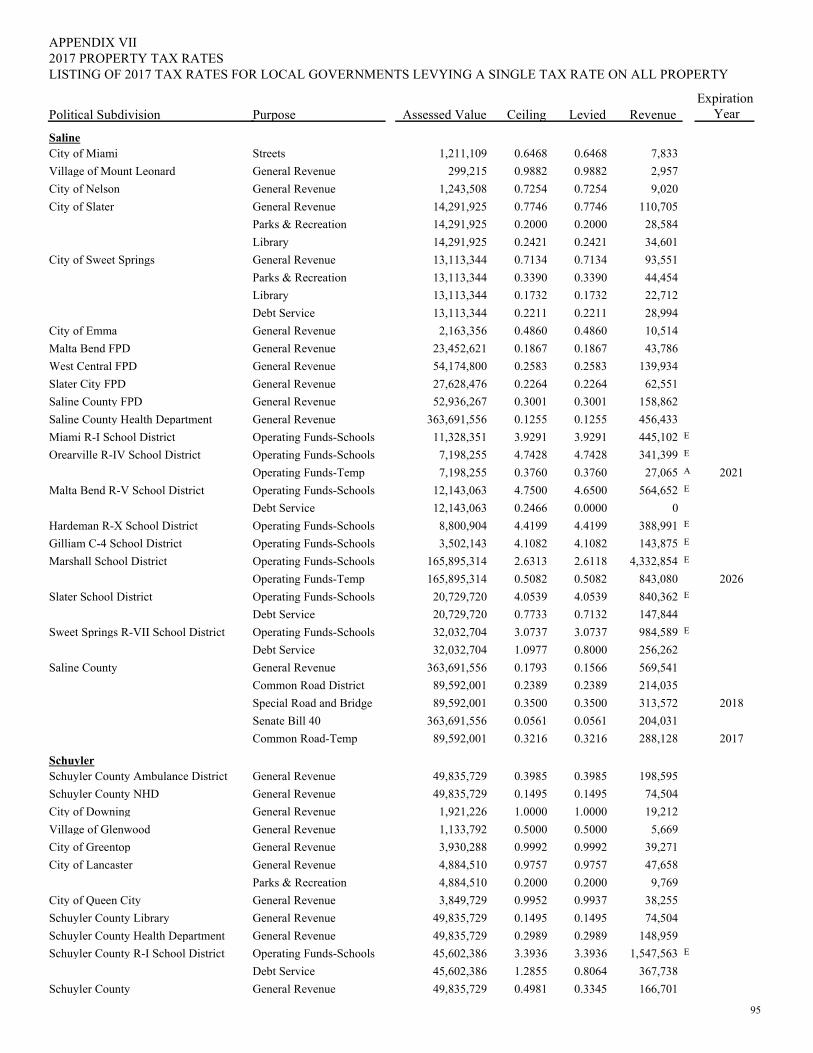
PurposePolitical Subdivision
2017 PROPERTY TAX RATESAPPENDIX VII
Assessed Value Ceiling Levied RevenueExpiration
Year
LISTING OF 2017 TAX RATES FOR LOCAL GOVERNMENTS LEVYING A SINGLE TAX RATE ON ALL PROPERTY
SalineCity of Miami Streets 0.64680.64681,211,109 7,833Village of Mount Leonard General Revenue 0.98820.9882299,215 2,957City of Nelson General Revenue 0.72540.72541,243,508 9,020City of Slater General Revenue 0.77460.774614,291,925 110,705
Parks & Recreation 0.20000.200014,291,925 28,584Library 0.24210.242114,291,925 34,601
City of Sweet Springs General Revenue 0.71340.713413,113,344 93,551Parks & Recreation 0.33900.339013,113,344 44,454Library 0.17320.173213,113,344 22,712Debt Service 0.22110.221113,113,344 28,994
City of Emma General Revenue 0.48600.48602,163,356 10,514Malta Bend FPD General Revenue 0.18670.186723,452,621 43,786West Central FPD General Revenue 0.25830.258354,174,800 139,934Slater City FPD General Revenue 0.22640.226427,628,476 62,551Saline County FPD General Revenue 0.30010.300152,936,267 158,862Saline County Health Department General Revenue 0.12550.1255363,691,556 456,433Miami R-I School District Operating Funds-Schools 3.92913.929111,328,351 E445,102Orearville R-IV School District Operating Funds-Schools 4.74284.74287,198,255 E341,399
Operating Funds-Temp 0.37600.37607,198,255 A27,065 2021Malta Bend R-V School District Operating Funds-Schools 4.65004.750012,143,063 E564,652
Debt Service 0.00000.246612,143,063 0Hardeman R-X School District Operating Funds-Schools 4.41994.41998,800,904 E388,991Gilliam C-4 School District Operating Funds-Schools 4.10824.10823,502,143 E143,875Marshall School District Operating Funds-Schools 2.61182.6313165,895,314 E4,332,854
Operating Funds-Temp 0.50820.5082165,895,314 843,080 2026Slater School District Operating Funds-Schools 4.05394.053920,729,720 E840,362
Debt Service 0.71320.773320,729,720 147,844Sweet Springs R-VII School District Operating Funds-Schools 3.07373.073732,032,704 E984,589
Debt Service 0.80001.097732,032,704 256,262Saline County General Revenue 0.15660.1793363,691,556 569,541
Common Road District 0.23890.238989,592,001 214,035Special Road and Bridge 0.35000.350089,592,001 313,572 2018Senate Bill 40 0.05610.0561363,691,556 204,031Common Road-Temp 0.32160.321689,592,001 288,128 2017
SchuylerSchuyler County Ambulance District General Revenue 0.39850.398549,835,729 198,595Schuyler County NHD General Revenue 0.14950.149549,835,729 74,504City of Downing General Revenue 1.00001.00001,921,226 19,212Village of Glenwood General Revenue 0.50000.50001,133,792 5,669City of Greentop General Revenue 0.99920.99923,930,288 39,271City of Lancaster General Revenue 0.97570.97574,884,510 47,658
Parks & Recreation 0.20000.20004,884,510 9,769City of Queen City General Revenue 0.99370.99523,849,729 38,255Schuyler County Library General Revenue 0.14950.149549,835,729 74,504Schuyler County Health Department General Revenue 0.29890.298949,835,729 148,959Schuyler County R-I School District Operating Funds-Schools 3.39363.393645,602,386 E1,547,563
Debt Service 0.80641.285545,602,386 367,738Schuyler County General Revenue 0.33450.498149,835,729 166,701
95
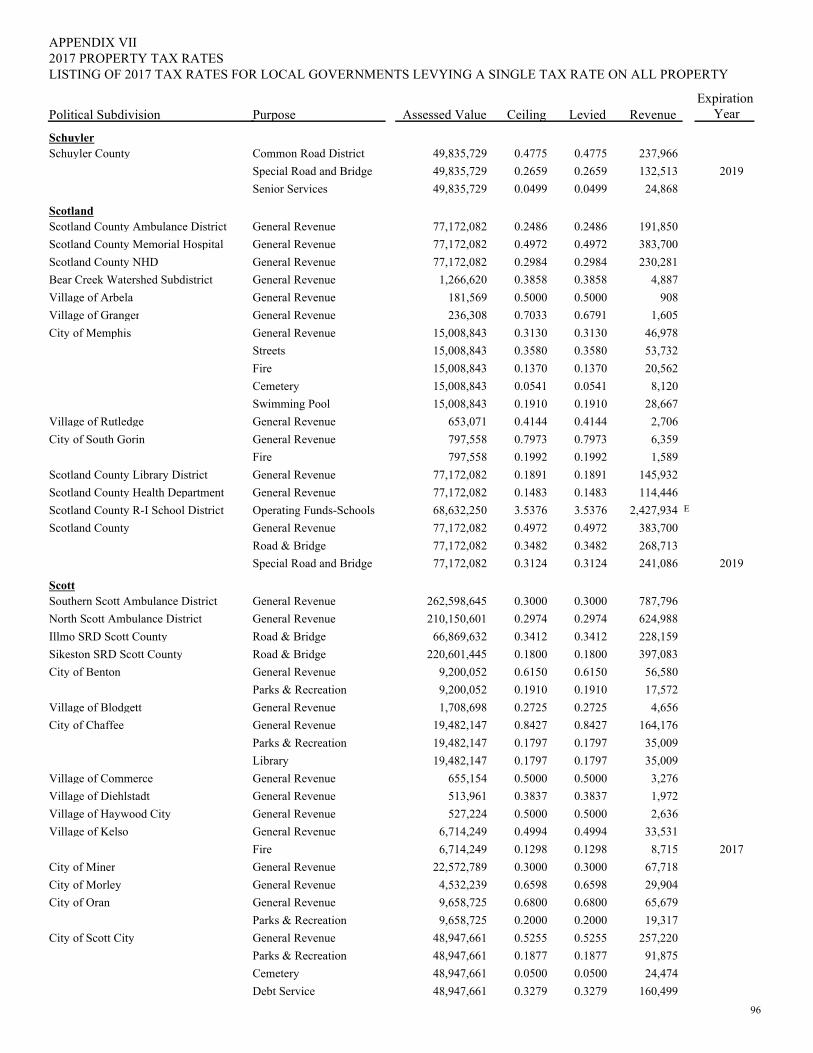
PurposePolitical Subdivision
2017 PROPERTY TAX RATESAPPENDIX VII
Assessed Value Ceiling Levied RevenueExpiration
Year
LISTING OF 2017 TAX RATES FOR LOCAL GOVERNMENTS LEVYING A SINGLE TAX RATE ON ALL PROPERTY
SchuylerSchuyler County Common Road District 0.47750.477549,835,729 237,966
Special Road and Bridge 0.26590.265949,835,729 132,513 2019Senior Services 0.04990.049949,835,729 24,868
ScotlandScotland County Ambulance District General Revenue 0.24860.248677,172,082 191,850Scotland County Memorial Hospital General Revenue 0.49720.497277,172,082 383,700Scotland County NHD General Revenue 0.29840.298477,172,082 230,281Bear Creek Watershed Subdistrict General Revenue 0.38580.38581,266,620 4,887Village of Arbela General Revenue 0.50000.5000181,569 908Village of Granger General Revenue 0.67910.7033236,308 1,605City of Memphis General Revenue 0.31300.313015,008,843 46,978
Streets 0.35800.358015,008,843 53,732Fire 0.13700.137015,008,843 20,562Cemetery 0.05410.054115,008,843 8,120Swimming Pool 0.19100.191015,008,843 28,667
Village of Rutledge General Revenue 0.41440.4144653,071 2,706City of South Gorin General Revenue 0.79730.7973797,558 6,359
Fire 0.19920.1992797,558 1,589Scotland County Library District General Revenue 0.18910.189177,172,082 145,932Scotland County Health Department General Revenue 0.14830.148377,172,082 114,446Scotland County R-I School District Operating Funds-Schools 3.53763.537668,632,250 E2,427,934Scotland County General Revenue 0.49720.497277,172,082 383,700
Road & Bridge 0.34820.348277,172,082 268,713Special Road and Bridge 0.31240.312477,172,082 241,086 2019
ScottSouthern Scott Ambulance District General Revenue 0.30000.3000262,598,645 787,796North Scott Ambulance District General Revenue 0.29740.2974210,150,601 624,988Illmo SRD Scott County Road & Bridge 0.34120.341266,869,632 228,159Sikeston SRD Scott County Road & Bridge 0.18000.1800220,601,445 397,083City of Benton General Revenue 0.61500.61509,200,052 56,580
Parks & Recreation 0.19100.19109,200,052 17,572Village of Blodgett General Revenue 0.27250.27251,708,698 4,656City of Chaffee General Revenue 0.84270.842719,482,147 164,176
Parks & Recreation 0.17970.179719,482,147 35,009Library 0.17970.179719,482,147 35,009
Village of Commerce General Revenue 0.50000.5000655,154 3,276Village of Diehlstadt General Revenue 0.38370.3837513,961 1,972Village of Haywood City General Revenue 0.50000.5000527,224 2,636Village of Kelso General Revenue 0.49940.49946,714,249 33,531
Fire 0.12980.12986,714,249 8,715 2017City of Miner General Revenue 0.30000.300022,572,789 67,718City of Morley General Revenue 0.65980.65984,532,239 29,904City of Oran General Revenue 0.68000.68009,658,725 65,679
Parks & Recreation 0.20000.20009,658,725 19,317City of Scott City General Revenue 0.52550.525548,947,661 257,220
Parks & Recreation 0.18770.187748,947,661 91,875Cemetery 0.05000.050048,947,661 24,474Debt Service 0.32790.327948,947,661 160,499
96
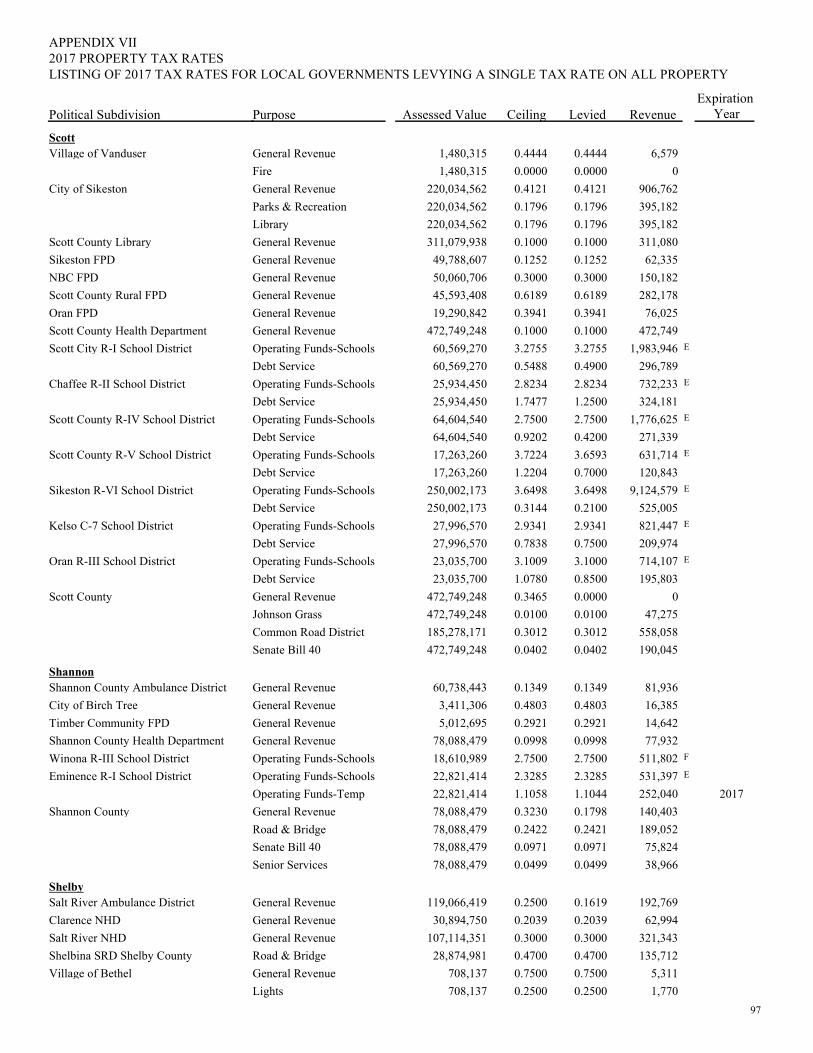
PurposePolitical Subdivision
2017 PROPERTY TAX RATESAPPENDIX VII
Assessed Value Ceiling Levied RevenueExpiration
Year
LISTING OF 2017 TAX RATES FOR LOCAL GOVERNMENTS LEVYING A SINGLE TAX RATE ON ALL PROPERTY
ScottVillage of Vanduser General Revenue 0.44440.44441,480,315 6,579
Fire 0.00000.00001,480,315 0City of Sikeston General Revenue 0.41210.4121220,034,562 906,762
Parks & Recreation 0.17960.1796220,034,562 395,182Library 0.17960.1796220,034,562 395,182
Scott County Library General Revenue 0.10000.1000311,079,938 311,080Sikeston FPD General Revenue 0.12520.125249,788,607 62,335NBC FPD General Revenue 0.30000.300050,060,706 150,182Scott County Rural FPD General Revenue 0.61890.618945,593,408 282,178Oran FPD General Revenue 0.39410.394119,290,842 76,025Scott County Health Department General Revenue 0.10000.1000472,749,248 472,749Scott City R-I School District Operating Funds-Schools 3.27553.275560,569,270 E1,983,946
Debt Service 0.49000.548860,569,270 296,789Chaffee R-II School District Operating Funds-Schools 2.82342.823425,934,450 E732,233
Debt Service 1.25001.747725,934,450 324,181Scott County R-IV School District Operating Funds-Schools 2.75002.750064,604,540 E1,776,625
Debt Service 0.42000.920264,604,540 271,339Scott County R-V School District Operating Funds-Schools 3.65933.722417,263,260 E631,714
Debt Service 0.70001.220417,263,260 120,843Sikeston R-VI School District Operating Funds-Schools 3.64983.6498250,002,173 E9,124,579
Debt Service 0.21000.3144250,002,173 525,005Kelso C-7 School District Operating Funds-Schools 2.93412.934127,996,570 E821,447
Debt Service 0.75000.783827,996,570 209,974Oran R-III School District Operating Funds-Schools 3.10003.100923,035,700 E714,107
Debt Service 0.85001.078023,035,700 195,803Scott County General Revenue 0.00000.3465472,749,248 0
Johnson Grass 0.01000.0100472,749,248 47,275Common Road District 0.30120.3012185,278,171 558,058Senate Bill 40 0.04020.0402472,749,248 190,045
ShannonShannon County Ambulance District General Revenue 0.13490.134960,738,443 81,936City of Birch Tree General Revenue 0.48030.48033,411,306 16,385Timber Community FPD General Revenue 0.29210.29215,012,695 14,642Shannon County Health Department General Revenue 0.09980.099878,088,479 77,932Winona R-III School District Operating Funds-Schools 2.75002.750018,610,989 F511,802Eminence R-I School District Operating Funds-Schools 2.32852.328522,821,414 E531,397
Operating Funds-Temp 1.10441.105822,821,414 252,040 2017Shannon County General Revenue 0.17980.323078,088,479 140,403
Road & Bridge 0.24210.242278,088,479 189,052Senate Bill 40 0.09710.097178,088,479 75,824Senior Services 0.04990.049978,088,479 38,966
ShelbySalt River Ambulance District General Revenue 0.16190.2500119,066,419 192,769Clarence NHD General Revenue 0.20390.203930,894,750 62,994Salt River NHD General Revenue 0.30000.3000107,114,351 321,343Shelbina SRD Shelby County Road & Bridge 0.47000.470028,874,981 135,712Village of Bethel General Revenue 0.75000.7500708,137 5,311
Lights 0.25000.2500708,137 1,77097
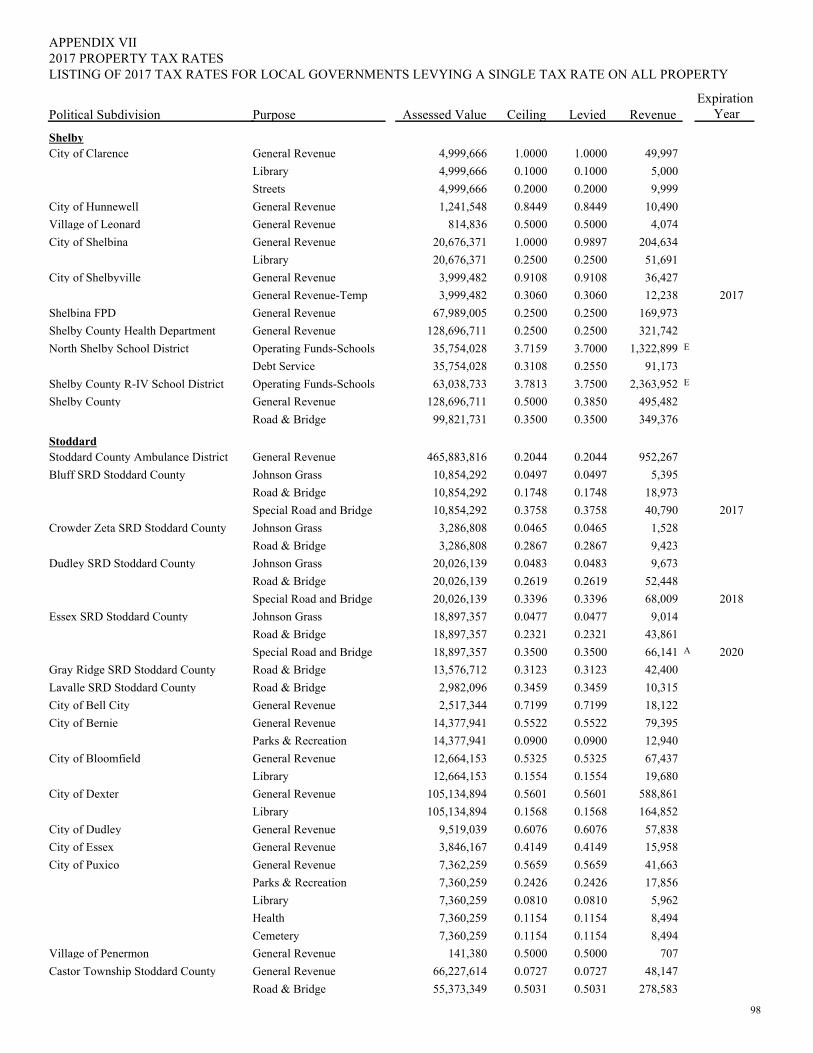
PurposePolitical Subdivision
2017 PROPERTY TAX RATESAPPENDIX VII
Assessed Value Ceiling Levied RevenueExpiration
Year
LISTING OF 2017 TAX RATES FOR LOCAL GOVERNMENTS LEVYING A SINGLE TAX RATE ON ALL PROPERTY
ShelbyCity of Clarence General Revenue 1.00001.00004,999,666 49,997
Library 0.10000.10004,999,666 5,000Streets 0.20000.20004,999,666 9,999
City of Hunnewell General Revenue 0.84490.84491,241,548 10,490Village of Leonard General Revenue 0.50000.5000814,836 4,074City of Shelbina General Revenue 0.98971.000020,676,371 204,634
Library 0.25000.250020,676,371 51,691City of Shelbyville General Revenue 0.91080.91083,999,482 36,427
General Revenue-Temp 0.30600.30603,999,482 12,238 2017Shelbina FPD General Revenue 0.25000.250067,989,005 169,973Shelby County Health Department General Revenue 0.25000.2500128,696,711 321,742North Shelby School District Operating Funds-Schools 3.70003.715935,754,028 E1,322,899
Debt Service 0.25500.310835,754,028 91,173Shelby County R-IV School District Operating Funds-Schools 3.75003.781363,038,733 E2,363,952Shelby County General Revenue 0.38500.5000128,696,711 495,482
Road & Bridge 0.35000.350099,821,731 349,376
StoddardStoddard County Ambulance District General Revenue 0.20440.2044465,883,816 952,267Bluff SRD Stoddard County Johnson Grass 0.04970.049710,854,292 5,395
Road & Bridge 0.17480.174810,854,292 18,973Special Road and Bridge 0.37580.375810,854,292 40,790 2017
Crowder Zeta SRD Stoddard County Johnson Grass 0.04650.04653,286,808 1,528Road & Bridge 0.28670.28673,286,808 9,423
Dudley SRD Stoddard County Johnson Grass 0.04830.048320,026,139 9,673Road & Bridge 0.26190.261920,026,139 52,448Special Road and Bridge 0.33960.339620,026,139 68,009 2018
Essex SRD Stoddard County Johnson Grass 0.04770.047718,897,357 9,014Road & Bridge 0.23210.232118,897,357 43,861Special Road and Bridge 0.35000.350018,897,357 A66,141 2020
Gray Ridge SRD Stoddard County Road & Bridge 0.31230.312313,576,712 42,400Lavalle SRD Stoddard County Road & Bridge 0.34590.34592,982,096 10,315City of Bell City General Revenue 0.71990.71992,517,344 18,122City of Bernie General Revenue 0.55220.552214,377,941 79,395
Parks & Recreation 0.09000.090014,377,941 12,940City of Bloomfield General Revenue 0.53250.532512,664,153 67,437
Library 0.15540.155412,664,153 19,680City of Dexter General Revenue 0.56010.5601105,134,894 588,861
Library 0.15680.1568105,134,894 164,852City of Dudley General Revenue 0.60760.60769,519,039 57,838City of Essex General Revenue 0.41490.41493,846,167 15,958City of Puxico General Revenue 0.56590.56597,362,259 41,663
Parks & Recreation 0.24260.24267,360,259 17,856Library 0.08100.08107,360,259 5,962Health 0.11540.11547,360,259 8,494Cemetery 0.11540.11547,360,259 8,494
Village of Penermon General Revenue 0.50000.5000141,380 707Castor Township Stoddard County General Revenue 0.07270.072766,227,614 48,147
Road & Bridge 0.50310.503155,373,349 278,583
98
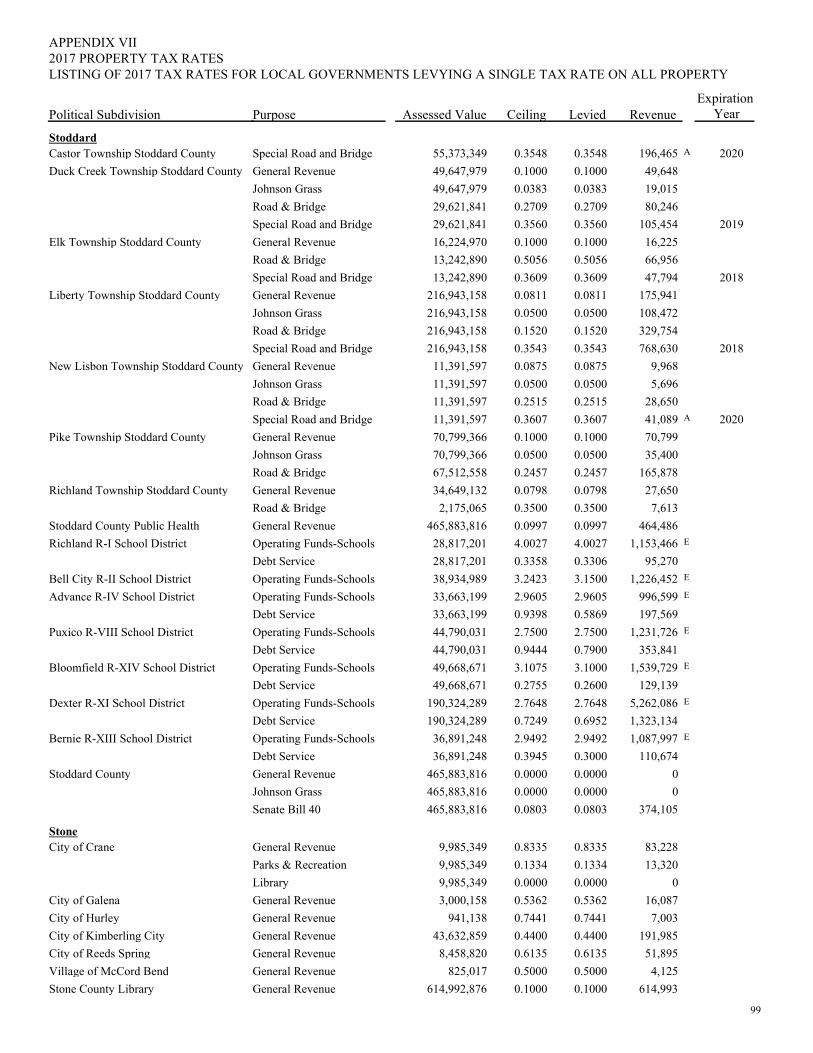
PurposePolitical Subdivision
2017 PROPERTY TAX RATESAPPENDIX VII
Assessed Value Ceiling Levied RevenueExpiration
Year
LISTING OF 2017 TAX RATES FOR LOCAL GOVERNMENTS LEVYING A SINGLE TAX RATE ON ALL PROPERTY
StoddardCastor Township Stoddard County Special Road and Bridge 0.35480.354855,373,349 A196,465 2020Duck Creek Township Stoddard County General Revenue 0.10000.100049,647,979 49,648
Johnson Grass 0.03830.038349,647,979 19,015Road & Bridge 0.27090.270929,621,841 80,246Special Road and Bridge 0.35600.356029,621,841 105,454 2019
Elk Township Stoddard County General Revenue 0.10000.100016,224,970 16,225Road & Bridge 0.50560.505613,242,890 66,956Special Road and Bridge 0.36090.360913,242,890 47,794 2018
Liberty Township Stoddard County General Revenue 0.08110.0811216,943,158 175,941Johnson Grass 0.05000.0500216,943,158 108,472Road & Bridge 0.15200.1520216,943,158 329,754Special Road and Bridge 0.35430.3543216,943,158 768,630 2018
New Lisbon Township Stoddard County General Revenue 0.08750.087511,391,597 9,968Johnson Grass 0.05000.050011,391,597 5,696Road & Bridge 0.25150.251511,391,597 28,650Special Road and Bridge 0.36070.360711,391,597 A41,089 2020
Pike Township Stoddard County General Revenue 0.10000.100070,799,366 70,799Johnson Grass 0.05000.050070,799,366 35,400Road & Bridge 0.24570.245767,512,558 165,878
Richland Township Stoddard County General Revenue 0.07980.079834,649,132 27,650Road & Bridge 0.35000.35002,175,065 7,613
Stoddard County Public Health General Revenue 0.09970.0997465,883,816 464,486Richland R-I School District Operating Funds-Schools 4.00274.002728,817,201 E1,153,466
Debt Service 0.33060.335828,817,201 95,270Bell City R-II School District Operating Funds-Schools 3.15003.242338,934,989 E1,226,452Advance R-IV School District Operating Funds-Schools 2.96052.960533,663,199 E996,599
Debt Service 0.58690.939833,663,199 197,569Puxico R-VIII School District Operating Funds-Schools 2.75002.750044,790,031 E1,231,726
Debt Service 0.79000.944444,790,031 353,841Bloomfield R-XIV School District Operating Funds-Schools 3.10003.107549,668,671 E1,539,729
Debt Service 0.26000.275549,668,671 129,139Dexter R-XI School District Operating Funds-Schools 2.76482.7648190,324,289 E5,262,086
Debt Service 0.69520.7249190,324,289 1,323,134Bernie R-XIII School District Operating Funds-Schools 2.94922.949236,891,248 E1,087,997
Debt Service 0.30000.394536,891,248 110,674Stoddard County General Revenue 0.00000.0000465,883,816 0
Johnson Grass 0.00000.0000465,883,816 0Senate Bill 40 0.08030.0803465,883,816 374,105
StoneCity of Crane General Revenue 0.83350.83359,985,349 83,228
Parks & Recreation 0.13340.13349,985,349 13,320Library 0.00000.00009,985,349 0
City of Galena General Revenue 0.53620.53623,000,158 16,087City of Hurley General Revenue 0.74410.7441941,138 7,003City of Kimberling City General Revenue 0.44000.440043,632,859 191,985City of Reeds Spring General Revenue 0.61350.61358,458,820 51,895Village of McCord Bend General Revenue 0.50000.5000825,017 4,125Stone County Library General Revenue 0.10000.1000614,992,876 614,993
99
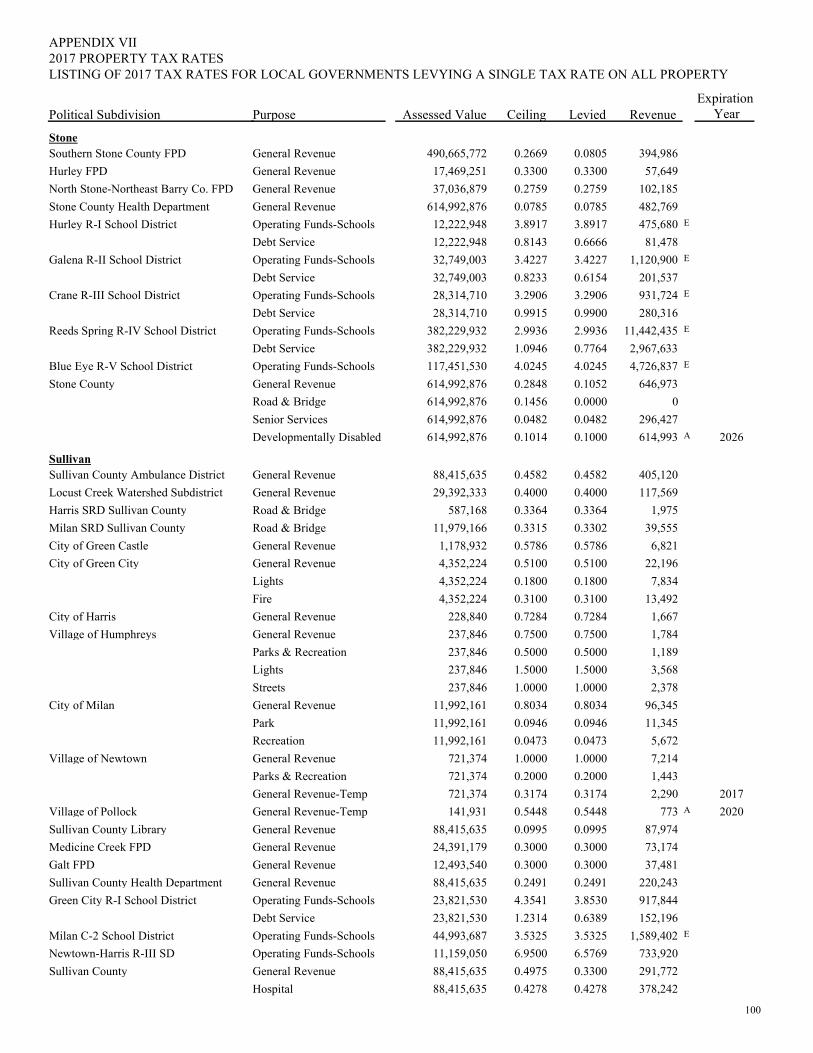
PurposePolitical Subdivision
2017 PROPERTY TAX RATESAPPENDIX VII
Assessed Value Ceiling Levied RevenueExpiration
Year
LISTING OF 2017 TAX RATES FOR LOCAL GOVERNMENTS LEVYING A SINGLE TAX RATE ON ALL PROPERTY
StoneSouthern Stone County FPD General Revenue 0.08050.2669490,665,772 394,986Hurley FPD General Revenue 0.33000.330017,469,251 57,649North Stone-Northeast Barry Co. FPD General Revenue 0.27590.275937,036,879 102,185Stone County Health Department General Revenue 0.07850.0785614,992,876 482,769Hurley R-I School District Operating Funds-Schools 3.89173.891712,222,948 E475,680
Debt Service 0.66660.814312,222,948 81,478Galena R-II School District Operating Funds-Schools 3.42273.422732,749,003 E1,120,900
Debt Service 0.61540.823332,749,003 201,537Crane R-III School District Operating Funds-Schools 3.29063.290628,314,710 E931,724
Debt Service 0.99000.991528,314,710 280,316Reeds Spring R-IV School District Operating Funds-Schools 2.99362.9936382,229,932 E11,442,435
Debt Service 0.77641.0946382,229,932 2,967,633Blue Eye R-V School District Operating Funds-Schools 4.02454.0245117,451,530 E4,726,837Stone County General Revenue 0.10520.2848614,992,876 646,973
Road & Bridge 0.00000.1456614,992,876 0Senior Services 0.04820.0482614,992,876 296,427Developmentally Disabled 0.10000.1014614,992,876 A614,993 2026
SullivanSullivan County Ambulance District General Revenue 0.45820.458288,415,635 405,120Locust Creek Watershed Subdistrict General Revenue 0.40000.400029,392,333 117,569Harris SRD Sullivan County Road & Bridge 0.33640.3364587,168 1,975Milan SRD Sullivan County Road & Bridge 0.33020.331511,979,166 39,555City of Green Castle General Revenue 0.57860.57861,178,932 6,821City of Green City General Revenue 0.51000.51004,352,224 22,196
Lights 0.18000.18004,352,224 7,834Fire 0.31000.31004,352,224 13,492
City of Harris General Revenue 0.72840.7284228,840 1,667Village of Humphreys General Revenue 0.75000.7500237,846 1,784
Parks & Recreation 0.50000.5000237,846 1,189Lights 1.50001.5000237,846 3,568Streets 1.00001.0000237,846 2,378
City of Milan General Revenue 0.80340.803411,992,161 96,345Park 0.09460.094611,992,161 11,345Recreation 0.04730.047311,992,161 5,672
Village of Newtown General Revenue 1.00001.0000721,374 7,214Parks & Recreation 0.20000.2000721,374 1,443General Revenue-Temp 0.31740.3174721,374 2,290 2017
Village of Pollock General Revenue-Temp 0.54480.5448141,931 A773 2020Sullivan County Library General Revenue 0.09950.099588,415,635 87,974Medicine Creek FPD General Revenue 0.30000.300024,391,179 73,174Galt FPD General Revenue 0.30000.300012,493,540 37,481Sullivan County Health Department General Revenue 0.24910.249188,415,635 220,243Green City R-I School District Operating Funds-Schools 3.85304.354123,821,530 917,844
Debt Service 0.63891.231423,821,530 152,196Milan C-2 School District Operating Funds-Schools 3.53253.532544,993,687 E1,589,402Newtown-Harris R-III SD Operating Funds-Schools 6.57696.950011,159,050 733,920Sullivan County General Revenue 0.33000.497588,415,635 291,772
Hospital 0.42780.427888,415,635 378,242
100
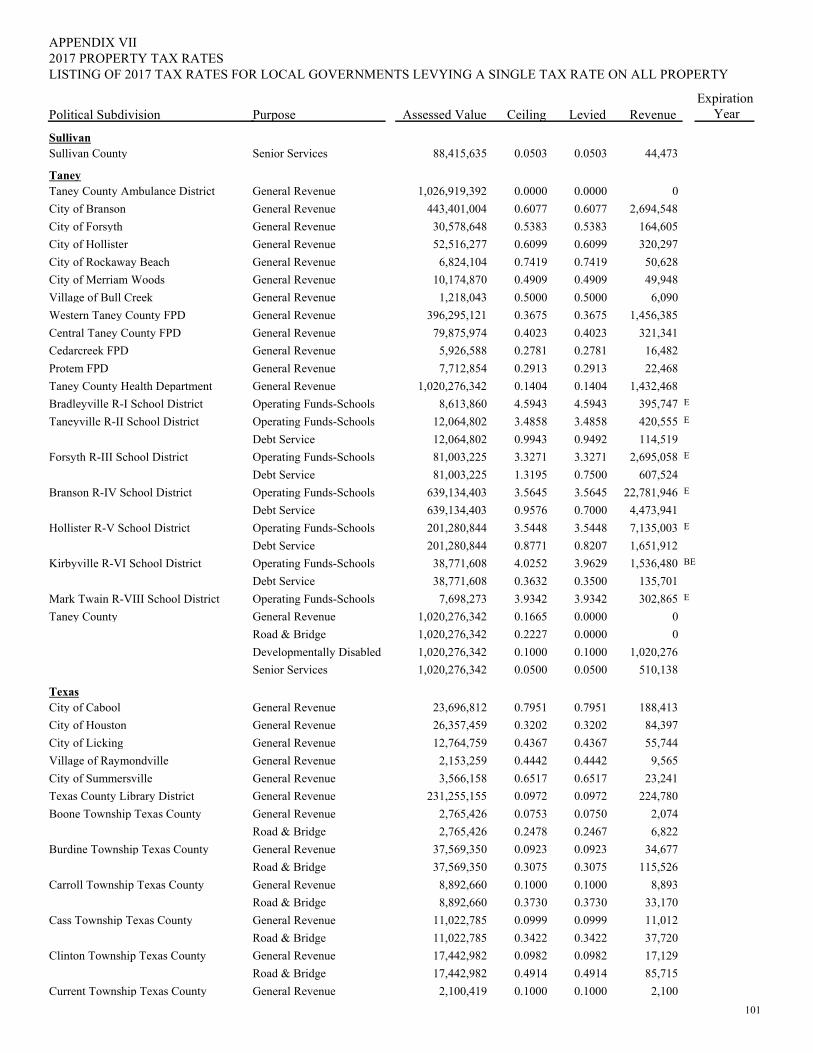
PurposePolitical Subdivision
2017 PROPERTY TAX RATESAPPENDIX VII
Assessed Value Ceiling Levied RevenueExpiration
Year
LISTING OF 2017 TAX RATES FOR LOCAL GOVERNMENTS LEVYING A SINGLE TAX RATE ON ALL PROPERTY
SullivanSullivan County Senior Services 0.05030.050388,415,635 44,473
TaneyTaney County Ambulance District General Revenue 0.00000.00001,026,919,392 0City of Branson General Revenue 0.60770.6077443,401,004 2,694,548City of Forsyth General Revenue 0.53830.538330,578,648 164,605City of Hollister General Revenue 0.60990.609952,516,277 320,297City of Rockaway Beach General Revenue 0.74190.74196,824,104 50,628City of Merriam Woods General Revenue 0.49090.490910,174,870 49,948Village of Bull Creek General Revenue 0.50000.50001,218,043 6,090Western Taney County FPD General Revenue 0.36750.3675396,295,121 1,456,385Central Taney County FPD General Revenue 0.40230.402379,875,974 321,341Cedarcreek FPD General Revenue 0.27810.27815,926,588 16,482Protem FPD General Revenue 0.29130.29137,712,854 22,468Taney County Health Department General Revenue 0.14040.14041,020,276,342 1,432,468Bradleyville R-I School District Operating Funds-Schools 4.59434.59438,613,860 E395,747Taneyville R-II School District Operating Funds-Schools 3.48583.485812,064,802 E420,555
Debt Service 0.94920.994312,064,802 114,519Forsyth R-III School District Operating Funds-Schools 3.32713.327181,003,225 E2,695,058
Debt Service 0.75001.319581,003,225 607,524Branson R-IV School District Operating Funds-Schools 3.56453.5645639,134,403 E22,781,946
Debt Service 0.70000.9576639,134,403 4,473,941Hollister R-V School District Operating Funds-Schools 3.54483.5448201,280,844 E7,135,003
Debt Service 0.82070.8771201,280,844 1,651,912Kirbyville R-VI School District Operating Funds-Schools 3.96294.025238,771,608 BE1,536,480
Debt Service 0.35000.363238,771,608 135,701Mark Twain R-VIII School District Operating Funds-Schools 3.93423.93427,698,273 E302,865Taney County General Revenue 0.00000.16651,020,276,342 0
Road & Bridge 0.00000.22271,020,276,342 0Developmentally Disabled 0.10000.10001,020,276,342 1,020,276Senior Services 0.05000.05001,020,276,342 510,138
TexasCity of Cabool General Revenue 0.79510.795123,696,812 188,413City of Houston General Revenue 0.32020.320226,357,459 84,397City of Licking General Revenue 0.43670.436712,764,759 55,744Village of Raymondville General Revenue 0.44420.44422,153,259 9,565City of Summersville General Revenue 0.65170.65173,566,158 23,241Texas County Library District General Revenue 0.09720.0972231,255,155 224,780Boone Township Texas County General Revenue 0.07500.07532,765,426 2,074
Road & Bridge 0.24670.24782,765,426 6,822Burdine Township Texas County General Revenue 0.09230.092337,569,350 34,677
Road & Bridge 0.30750.307537,569,350 115,526Carroll Township Texas County General Revenue 0.10000.10008,892,660 8,893
Road & Bridge 0.37300.37308,892,660 33,170Cass Township Texas County General Revenue 0.09990.099911,022,785 11,012
Road & Bridge 0.34220.342211,022,785 37,720Clinton Township Texas County General Revenue 0.09820.098217,442,982 17,129
Road & Bridge 0.49140.491417,442,982 85,715Current Township Texas County General Revenue 0.10000.10002,100,419 2,100
101
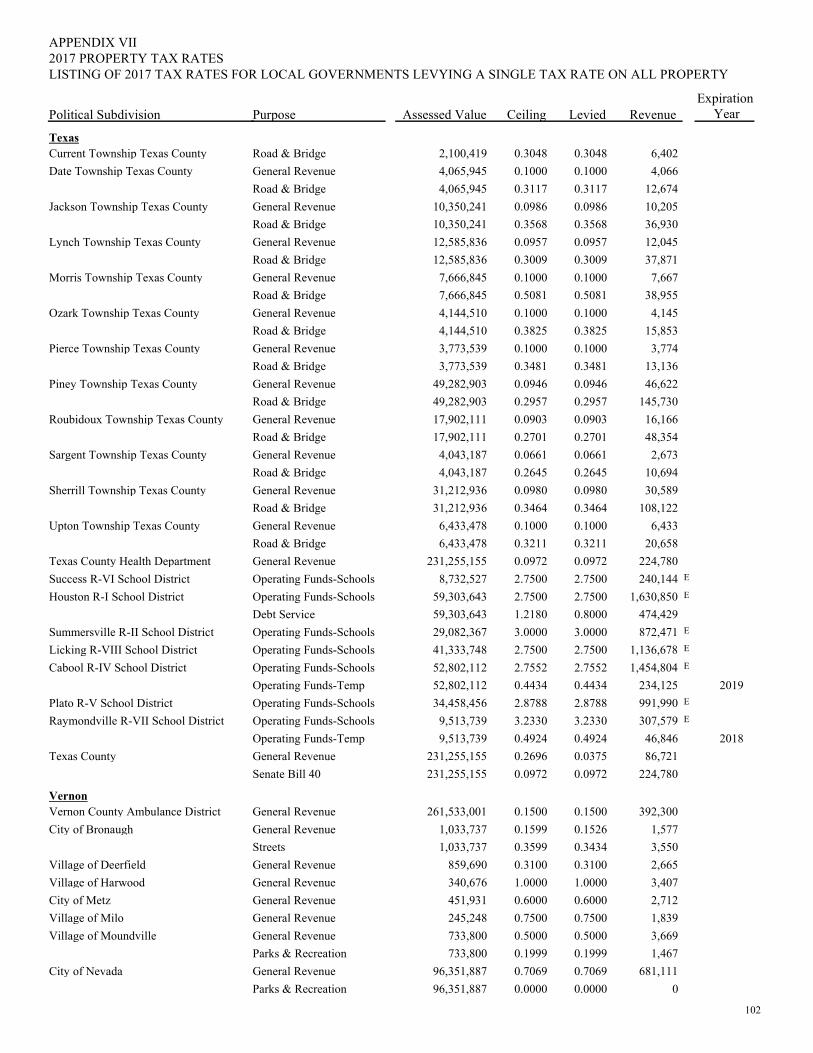
PurposePolitical Subdivision
2017 PROPERTY TAX RATESAPPENDIX VII
Assessed Value Ceiling Levied RevenueExpiration
Year
LISTING OF 2017 TAX RATES FOR LOCAL GOVERNMENTS LEVYING A SINGLE TAX RATE ON ALL PROPERTY
TexasCurrent Township Texas County Road & Bridge 0.30480.30482,100,419 6,402Date Township Texas County General Revenue 0.10000.10004,065,945 4,066
Road & Bridge 0.31170.31174,065,945 12,674Jackson Township Texas County General Revenue 0.09860.098610,350,241 10,205
Road & Bridge 0.35680.356810,350,241 36,930Lynch Township Texas County General Revenue 0.09570.095712,585,836 12,045
Road & Bridge 0.30090.300912,585,836 37,871Morris Township Texas County General Revenue 0.10000.10007,666,845 7,667
Road & Bridge 0.50810.50817,666,845 38,955Ozark Township Texas County General Revenue 0.10000.10004,144,510 4,145
Road & Bridge 0.38250.38254,144,510 15,853Pierce Township Texas County General Revenue 0.10000.10003,773,539 3,774
Road & Bridge 0.34810.34813,773,539 13,136Piney Township Texas County General Revenue 0.09460.094649,282,903 46,622
Road & Bridge 0.29570.295749,282,903 145,730Roubidoux Township Texas County General Revenue 0.09030.090317,902,111 16,166
Road & Bridge 0.27010.270117,902,111 48,354Sargent Township Texas County General Revenue 0.06610.06614,043,187 2,673
Road & Bridge 0.26450.26454,043,187 10,694Sherrill Township Texas County General Revenue 0.09800.098031,212,936 30,589
Road & Bridge 0.34640.346431,212,936 108,122Upton Township Texas County General Revenue 0.10000.10006,433,478 6,433
Road & Bridge 0.32110.32116,433,478 20,658Texas County Health Department General Revenue 0.09720.0972231,255,155 224,780Success R-VI School District Operating Funds-Schools 2.75002.75008,732,527 E240,144Houston R-I School District Operating Funds-Schools 2.75002.750059,303,643 E1,630,850
Debt Service 0.80001.218059,303,643 474,429Summersville R-II School District Operating Funds-Schools 3.00003.000029,082,367 E872,471Licking R-VIII School District Operating Funds-Schools 2.75002.750041,333,748 E1,136,678Cabool R-IV School District Operating Funds-Schools 2.75522.755252,802,112 E1,454,804
Operating Funds-Temp 0.44340.443452,802,112 234,125 2019Plato R-V School District Operating Funds-Schools 2.87882.878834,458,456 E991,990Raymondville R-VII School District Operating Funds-Schools 3.23303.23309,513,739 E307,579
Operating Funds-Temp 0.49240.49249,513,739 46,846 2018Texas County General Revenue 0.03750.2696231,255,155 86,721
Senate Bill 40 0.09720.0972231,255,155 224,780
VernonVernon County Ambulance District General Revenue 0.15000.1500261,533,001 392,300City of Bronaugh General Revenue 0.15260.15991,033,737 1,577
Streets 0.34340.35991,033,737 3,550Village of Deerfield General Revenue 0.31000.3100859,690 2,665Village of Harwood General Revenue 1.00001.0000340,676 3,407City of Metz General Revenue 0.60000.6000451,931 2,712Village of Milo General Revenue 0.75000.7500245,248 1,839Village of Moundville General Revenue 0.50000.5000733,800 3,669
Parks & Recreation 0.19990.1999733,800 1,467City of Nevada General Revenue 0.70690.706996,351,887 681,111
Parks & Recreation 0.00000.000096,351,887 0
102
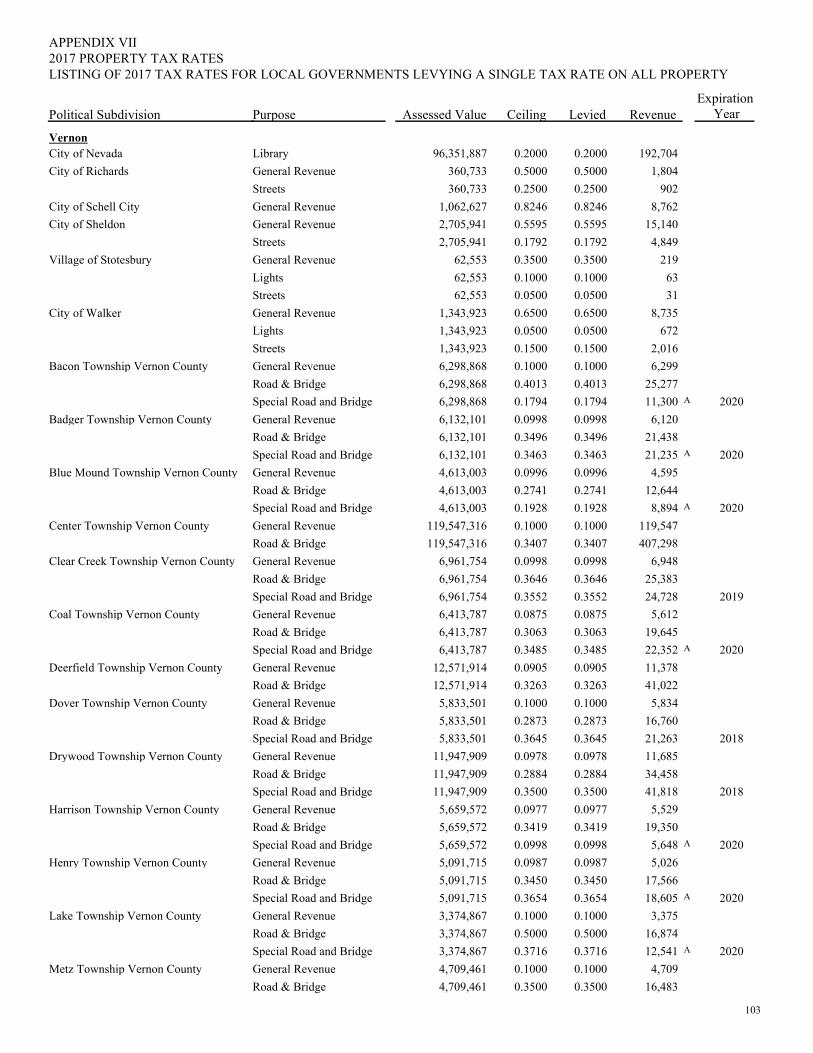
PurposePolitical Subdivision
2017 PROPERTY TAX RATESAPPENDIX VII
Assessed Value Ceiling Levied RevenueExpiration
Year
LISTING OF 2017 TAX RATES FOR LOCAL GOVERNMENTS LEVYING A SINGLE TAX RATE ON ALL PROPERTY
VernonCity of Nevada Library 0.20000.200096,351,887 192,704City of Richards General Revenue 0.50000.5000360,733 1,804
Streets 0.25000.2500360,733 902City of Schell City General Revenue 0.82460.82461,062,627 8,762City of Sheldon General Revenue 0.55950.55952,705,941 15,140
Streets 0.17920.17922,705,941 4,849Village of Stotesbury General Revenue 0.35000.350062,553 219
Lights 0.10000.100062,553 63Streets 0.05000.050062,553 31
City of Walker General Revenue 0.65000.65001,343,923 8,735Lights 0.05000.05001,343,923 672Streets 0.15000.15001,343,923 2,016
Bacon Township Vernon County General Revenue 0.10000.10006,298,868 6,299Road & Bridge 0.40130.40136,298,868 25,277Special Road and Bridge 0.17940.17946,298,868 A11,300 2020
Badger Township Vernon County General Revenue 0.09980.09986,132,101 6,120Road & Bridge 0.34960.34966,132,101 21,438Special Road and Bridge 0.34630.34636,132,101 A21,235 2020
Blue Mound Township Vernon County General Revenue 0.09960.09964,613,003 4,595Road & Bridge 0.27410.27414,613,003 12,644Special Road and Bridge 0.19280.19284,613,003 A8,894 2020
Center Township Vernon County General Revenue 0.10000.1000119,547,316 119,547Road & Bridge 0.34070.3407119,547,316 407,298
Clear Creek Township Vernon County General Revenue 0.09980.09986,961,754 6,948Road & Bridge 0.36460.36466,961,754 25,383Special Road and Bridge 0.35520.35526,961,754 24,728 2019
Coal Township Vernon County General Revenue 0.08750.08756,413,787 5,612Road & Bridge 0.30630.30636,413,787 19,645Special Road and Bridge 0.34850.34856,413,787 A22,352 2020
Deerfield Township Vernon County General Revenue 0.09050.090512,571,914 11,378Road & Bridge 0.32630.326312,571,914 41,022
Dover Township Vernon County General Revenue 0.10000.10005,833,501 5,834Road & Bridge 0.28730.28735,833,501 16,760Special Road and Bridge 0.36450.36455,833,501 21,263 2018
Drywood Township Vernon County General Revenue 0.09780.097811,947,909 11,685Road & Bridge 0.28840.288411,947,909 34,458Special Road and Bridge 0.35000.350011,947,909 41,818 2018
Harrison Township Vernon County General Revenue 0.09770.09775,659,572 5,529Road & Bridge 0.34190.34195,659,572 19,350Special Road and Bridge 0.09980.09985,659,572 A5,648 2020
Henry Township Vernon County General Revenue 0.09870.09875,091,715 5,026Road & Bridge 0.34500.34505,091,715 17,566Special Road and Bridge 0.36540.36545,091,715 A18,605 2020
Lake Township Vernon County General Revenue 0.10000.10003,374,867 3,375Road & Bridge 0.50000.50003,374,867 16,874Special Road and Bridge 0.37160.37163,374,867 A12,541 2020
Metz Township Vernon County General Revenue 0.10000.10004,709,461 4,709Road & Bridge 0.35000.35004,709,461 16,483
103
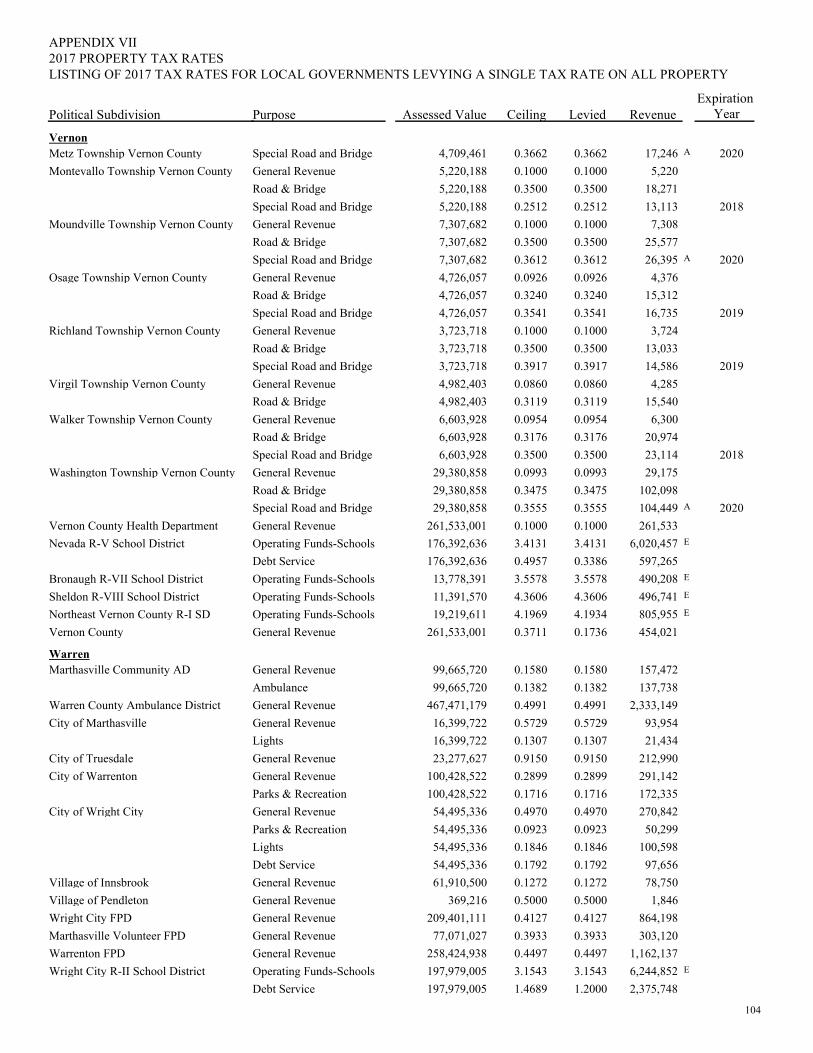
PurposePolitical Subdivision
2017 PROPERTY TAX RATESAPPENDIX VII
Assessed Value Ceiling Levied RevenueExpiration
Year
LISTING OF 2017 TAX RATES FOR LOCAL GOVERNMENTS LEVYING A SINGLE TAX RATE ON ALL PROPERTY
VernonMetz Township Vernon County Special Road and Bridge 0.36620.36624,709,461 A17,246 2020Montevallo Township Vernon County General Revenue 0.10000.10005,220,188 5,220
Road & Bridge 0.35000.35005,220,188 18,271Special Road and Bridge 0.25120.25125,220,188 13,113 2018
Moundville Township Vernon County General Revenue 0.10000.10007,307,682 7,308Road & Bridge 0.35000.35007,307,682 25,577Special Road and Bridge 0.36120.36127,307,682 A26,395 2020
Osage Township Vernon County General Revenue 0.09260.09264,726,057 4,376Road & Bridge 0.32400.32404,726,057 15,312Special Road and Bridge 0.35410.35414,726,057 16,735 2019
Richland Township Vernon County General Revenue 0.10000.10003,723,718 3,724Road & Bridge 0.35000.35003,723,718 13,033Special Road and Bridge 0.39170.39173,723,718 14,586 2019
Virgil Township Vernon County General Revenue 0.08600.08604,982,403 4,285Road & Bridge 0.31190.31194,982,403 15,540
Walker Township Vernon County General Revenue 0.09540.09546,603,928 6,300Road & Bridge 0.31760.31766,603,928 20,974Special Road and Bridge 0.35000.35006,603,928 23,114 2018
Washington Township Vernon County General Revenue 0.09930.099329,380,858 29,175Road & Bridge 0.34750.347529,380,858 102,098Special Road and Bridge 0.35550.355529,380,858 A104,449 2020
Vernon County Health Department General Revenue 0.10000.1000261,533,001 261,533Nevada R-V School District Operating Funds-Schools 3.41313.4131176,392,636 E6,020,457
Debt Service 0.33860.4957176,392,636 597,265Bronaugh R-VII School District Operating Funds-Schools 3.55783.557813,778,391 E490,208Sheldon R-VIII School District Operating Funds-Schools 4.36064.360611,391,570 E496,741Northeast Vernon County R-I SD Operating Funds-Schools 4.19344.196919,219,611 E805,955Vernon County General Revenue 0.17360.3711261,533,001 454,021
WarrenMarthasville Community AD General Revenue 0.15800.158099,665,720 157,472
Ambulance 0.13820.138299,665,720 137,738Warren County Ambulance District General Revenue 0.49910.4991467,471,179 2,333,149City of Marthasville General Revenue 0.57290.572916,399,722 93,954
Lights 0.13070.130716,399,722 21,434City of Truesdale General Revenue 0.91500.915023,277,627 212,990City of Warrenton General Revenue 0.28990.2899100,428,522 291,142
Parks & Recreation 0.17160.1716100,428,522 172,335City of Wright City General Revenue 0.49700.497054,495,336 270,842
Parks & Recreation 0.09230.092354,495,336 50,299Lights 0.18460.184654,495,336 100,598Debt Service 0.17920.179254,495,336 97,656
Village of Innsbrook General Revenue 0.12720.127261,910,500 78,750Village of Pendleton General Revenue 0.50000.5000369,216 1,846Wright City FPD General Revenue 0.41270.4127209,401,111 864,198Marthasville Volunteer FPD General Revenue 0.39330.393377,071,027 303,120Warrenton FPD General Revenue 0.44970.4497258,424,938 1,162,137Wright City R-II School District Operating Funds-Schools 3.15433.1543197,979,005 E6,244,852
Debt Service 1.20001.4689197,979,005 2,375,748
104
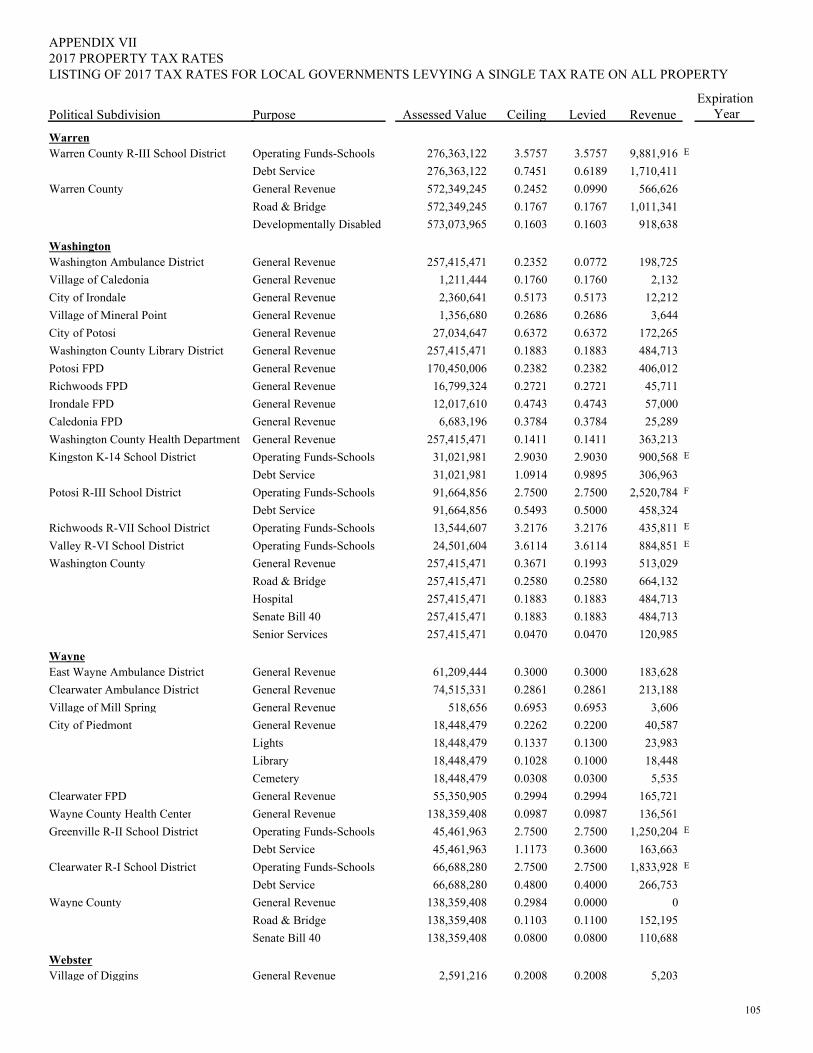
PurposePolitical Subdivision
2017 PROPERTY TAX RATESAPPENDIX VII
Assessed Value Ceiling Levied RevenueExpiration
Year
LISTING OF 2017 TAX RATES FOR LOCAL GOVERNMENTS LEVYING A SINGLE TAX RATE ON ALL PROPERTY
WarrenWarren County R-III School District Operating Funds-Schools 3.57573.5757276,363,122 E9,881,916
Debt Service 0.61890.7451276,363,122 1,710,411Warren County General Revenue 0.09900.2452572,349,245 566,626
Road & Bridge 0.17670.1767572,349,245 1,011,341Developmentally Disabled 0.16030.1603573,073,965 918,638
WashingtonWashington Ambulance District General Revenue 0.07720.2352257,415,471 198,725Village of Caledonia General Revenue 0.17600.17601,211,444 2,132City of Irondale General Revenue 0.51730.51732,360,641 12,212Village of Mineral Point General Revenue 0.26860.26861,356,680 3,644City of Potosi General Revenue 0.63720.637227,034,647 172,265Washington County Library District General Revenue 0.18830.1883257,415,471 484,713Potosi FPD General Revenue 0.23820.2382170,450,006 406,012Richwoods FPD General Revenue 0.27210.272116,799,324 45,711Irondale FPD General Revenue 0.47430.474312,017,610 57,000Caledonia FPD General Revenue 0.37840.37846,683,196 25,289Washington County Health Department General Revenue 0.14110.1411257,415,471 363,213Kingston K-14 School District Operating Funds-Schools 2.90302.903031,021,981 E900,568
Debt Service 0.98951.091431,021,981 306,963Potosi R-III School District Operating Funds-Schools 2.75002.750091,664,856 F2,520,784
Debt Service 0.50000.549391,664,856 458,324Richwoods R-VII School District Operating Funds-Schools 3.21763.217613,544,607 E435,811Valley R-VI School District Operating Funds-Schools 3.61143.611424,501,604 E884,851Washington County General Revenue 0.19930.3671257,415,471 513,029
Road & Bridge 0.25800.2580257,415,471 664,132Hospital 0.18830.1883257,415,471 484,713Senate Bill 40 0.18830.1883257,415,471 484,713Senior Services 0.04700.0470257,415,471 120,985
WayneEast Wayne Ambulance District General Revenue 0.30000.300061,209,444 183,628Clearwater Ambulance District General Revenue 0.28610.286174,515,331 213,188Village of Mill Spring General Revenue 0.69530.6953518,656 3,606City of Piedmont General Revenue 0.22000.226218,448,479 40,587
Lights 0.13000.133718,448,479 23,983Library 0.10000.102818,448,479 18,448Cemetery 0.03000.030818,448,479 5,535
Clearwater FPD General Revenue 0.29940.299455,350,905 165,721Wayne County Health Center General Revenue 0.09870.0987138,359,408 136,561Greenville R-II School District Operating Funds-Schools 2.75002.750045,461,963 E1,250,204
Debt Service 0.36001.117345,461,963 163,663Clearwater R-I School District Operating Funds-Schools 2.75002.750066,688,280 E1,833,928
Debt Service 0.40000.480066,688,280 266,753Wayne County General Revenue 0.00000.2984138,359,408 0
Road & Bridge 0.11000.1103138,359,408 152,195Senate Bill 40 0.08000.0800138,359,408 110,688
WebsterVillage of Diggins General Revenue 0.20080.20082,591,216 5,203
105
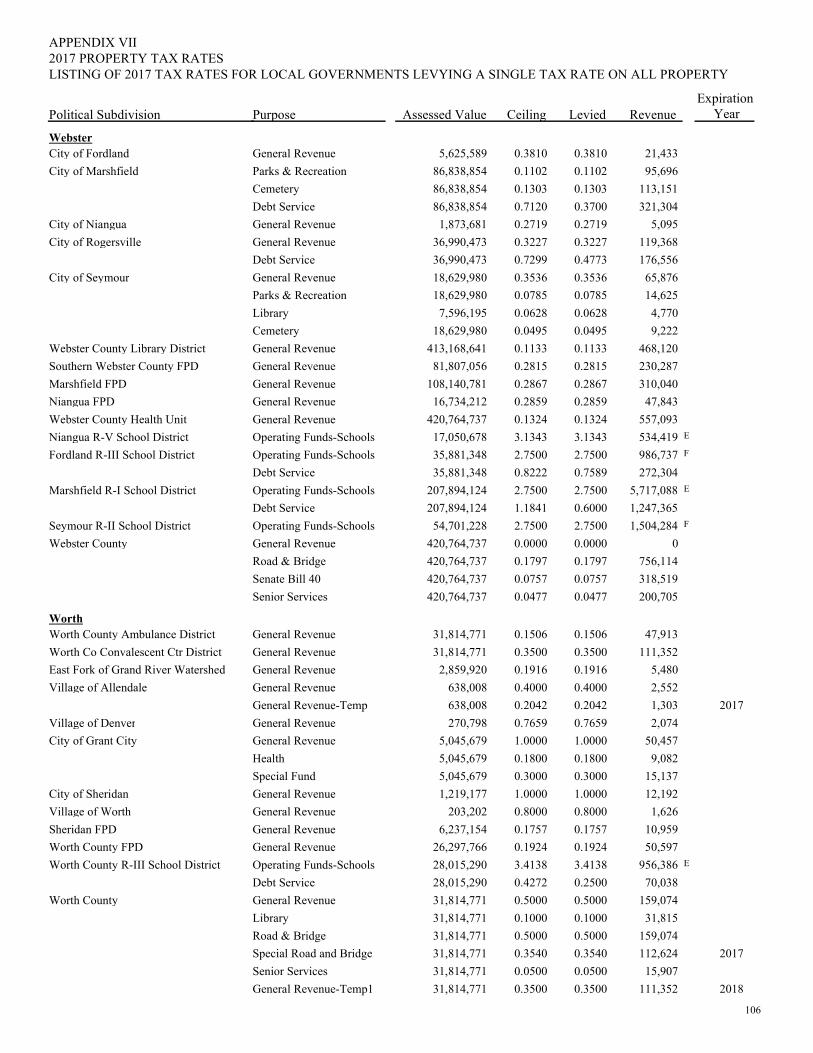
PurposePolitical Subdivision
2017 PROPERTY TAX RATESAPPENDIX VII
Assessed Value Ceiling Levied RevenueExpiration
Year
LISTING OF 2017 TAX RATES FOR LOCAL GOVERNMENTS LEVYING A SINGLE TAX RATE ON ALL PROPERTY
WebsterCity of Fordland General Revenue 0.38100.38105,625,589 21,433City of Marshfield Parks & Recreation 0.11020.110286,838,854 95,696
Cemetery 0.13030.130386,838,854 113,151Debt Service 0.37000.712086,838,854 321,304
City of Niangua General Revenue 0.27190.27191,873,681 5,095City of Rogersville General Revenue 0.32270.322736,990,473 119,368
Debt Service 0.47730.729936,990,473 176,556City of Seymour General Revenue 0.35360.353618,629,980 65,876
Parks & Recreation 0.07850.078518,629,980 14,625Library 0.06280.06287,596,195 4,770Cemetery 0.04950.049518,629,980 9,222
Webster County Library District General Revenue 0.11330.1133413,168,641 468,120Southern Webster County FPD General Revenue 0.28150.281581,807,056 230,287Marshfield FPD General Revenue 0.28670.2867108,140,781 310,040Niangua FPD General Revenue 0.28590.285916,734,212 47,843Webster County Health Unit General Revenue 0.13240.1324420,764,737 557,093Niangua R-V School District Operating Funds-Schools 3.13433.134317,050,678 E534,419Fordland R-III School District Operating Funds-Schools 2.75002.750035,881,348 F986,737
Debt Service 0.75890.822235,881,348 272,304Marshfield R-I School District Operating Funds-Schools 2.75002.7500207,894,124 E5,717,088
Debt Service 0.60001.1841207,894,124 1,247,365Seymour R-II School District Operating Funds-Schools 2.75002.750054,701,228 F1,504,284Webster County General Revenue 0.00000.0000420,764,737 0
Road & Bridge 0.17970.1797420,764,737 756,114Senate Bill 40 0.07570.0757420,764,737 318,519Senior Services 0.04770.0477420,764,737 200,705
WorthWorth County Ambulance District General Revenue 0.15060.150631,814,771 47,913Worth Co Convalescent Ctr District General Revenue 0.35000.350031,814,771 111,352East Fork of Grand River Watershed General Revenue 0.19160.19162,859,920 5,480Village of Allendale General Revenue 0.40000.4000638,008 2,552
General Revenue-Temp 0.20420.2042638,008 1,303 2017Village of Denver General Revenue 0.76590.7659270,798 2,074City of Grant City General Revenue 1.00001.00005,045,679 50,457
Health 0.18000.18005,045,679 9,082Special Fund 0.30000.30005,045,679 15,137
City of Sheridan General Revenue 1.00001.00001,219,177 12,192Village of Worth General Revenue 0.80000.8000203,202 1,626Sheridan FPD General Revenue 0.17570.17576,237,154 10,959Worth County FPD General Revenue 0.19240.192426,297,766 50,597Worth County R-III School District Operating Funds-Schools 3.41383.413828,015,290 E956,386
Debt Service 0.25000.427228,015,290 70,038Worth County General Revenue 0.50000.500031,814,771 159,074
Library 0.10000.100031,814,771 31,815Road & Bridge 0.50000.500031,814,771 159,074Special Road and Bridge 0.35400.354031,814,771 112,624 2017Senior Services 0.05000.050031,814,771 15,907General Revenue-Temp1 0.35000.350031,814,771 111,352 2018
106
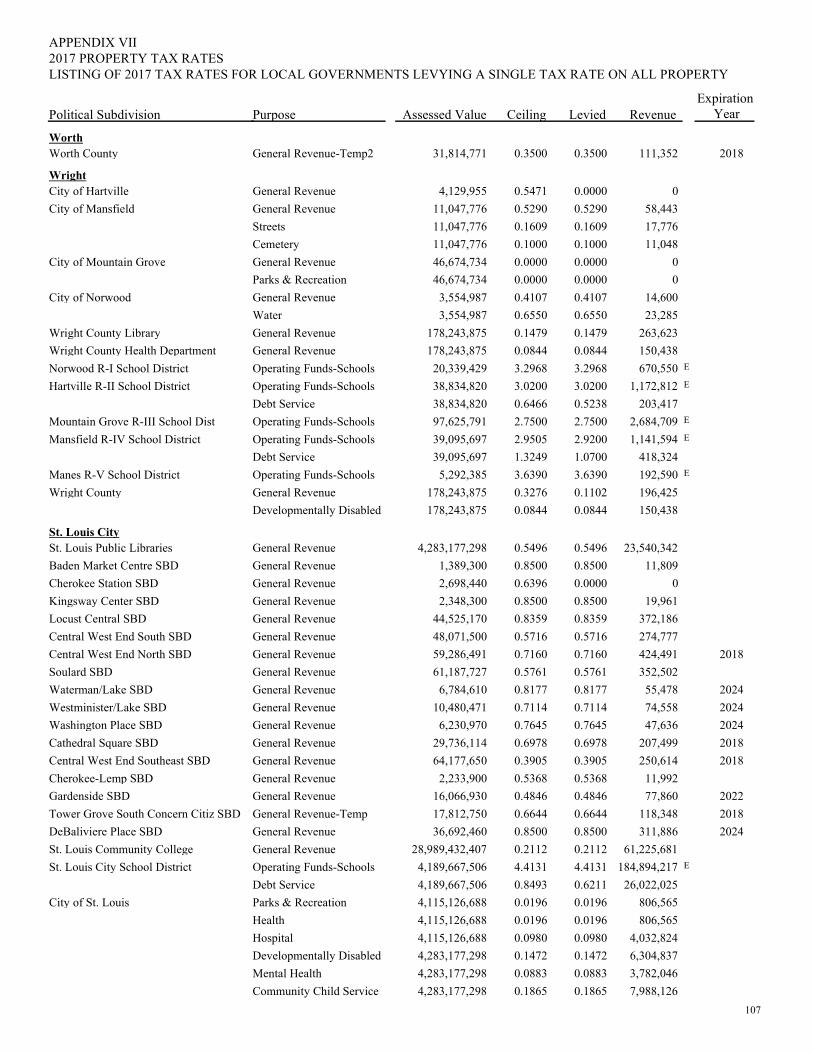
PurposePolitical Subdivision
2017 PROPERTY TAX RATESAPPENDIX VII
Assessed Value Ceiling Levied RevenueExpiration
Year
LISTING OF 2017 TAX RATES FOR LOCAL GOVERNMENTS LEVYING A SINGLE TAX RATE ON ALL PROPERTY
WorthWorth County General Revenue-Temp2 0.35000.350031,814,771 111,352 2018
WrightCity of Hartville General Revenue 0.00000.54714,129,955 0City of Mansfield General Revenue 0.52900.529011,047,776 58,443
Streets 0.16090.160911,047,776 17,776Cemetery 0.10000.100011,047,776 11,048
City of Mountain Grove General Revenue 0.00000.000046,674,734 0Parks & Recreation 0.00000.000046,674,734 0
City of Norwood General Revenue 0.41070.41073,554,987 14,600Water 0.65500.65503,554,987 23,285
Wright County Library General Revenue 0.14790.1479178,243,875 263,623Wright County Health Department General Revenue 0.08440.0844178,243,875 150,438Norwood R-I School District Operating Funds-Schools 3.29683.296820,339,429 E670,550Hartville R-II School District Operating Funds-Schools 3.02003.020038,834,820 E1,172,812
Debt Service 0.52380.646638,834,820 203,417Mountain Grove R-III School Dist Operating Funds-Schools 2.75002.750097,625,791 E2,684,709Mansfield R-IV School District Operating Funds-Schools 2.92002.950539,095,697 E1,141,594
Debt Service 1.07001.324939,095,697 418,324Manes R-V School District Operating Funds-Schools 3.63903.63905,292,385 E192,590Wright County General Revenue 0.11020.3276178,243,875 196,425
Developmentally Disabled 0.08440.0844178,243,875 150,438
St. Louis CitySt. Louis Public Libraries General Revenue 0.54960.54964,283,177,298 23,540,342Baden Market Centre SBD General Revenue 0.85000.85001,389,300 11,809Cherokee Station SBD General Revenue 0.00000.63962,698,440 0Kingsway Center SBD General Revenue 0.85000.85002,348,300 19,961Locust Central SBD General Revenue 0.83590.835944,525,170 372,186Central West End South SBD General Revenue 0.57160.571648,071,500 274,777Central West End North SBD General Revenue 0.71600.716059,286,491 424,491 2018Soulard SBD General Revenue 0.57610.576161,187,727 352,502Waterman/Lake SBD General Revenue 0.81770.81776,784,610 55,478 2024Westminister/Lake SBD General Revenue 0.71140.711410,480,471 74,558 2024Washington Place SBD General Revenue 0.76450.76456,230,970 47,636 2024Cathedral Square SBD General Revenue 0.69780.697829,736,114 207,499 2018Central West End Southeast SBD General Revenue 0.39050.390564,177,650 250,614 2018Cherokee-Lemp SBD General Revenue 0.53680.53682,233,900 11,992Gardenside SBD General Revenue 0.48460.484616,066,930 77,860 2022Tower Grove South Concern Citiz SBD General Revenue-Temp 0.66440.664417,812,750 118,348 2018DeBaliviere Place SBD General Revenue 0.85000.850036,692,460 311,886 2024St. Louis Community College General Revenue 0.21120.211228,989,432,407 61,225,681St. Louis City School District Operating Funds-Schools 4.41314.41314,189,667,506 E184,894,217
Debt Service 0.62110.84934,189,667,506 26,022,025City of St. Louis Parks & Recreation 0.01960.01964,115,126,688 806,565
Health 0.01960.01964,115,126,688 806,565Hospital 0.09800.09804,115,126,688 4,032,824Developmentally Disabled 0.14720.14724,283,177,298 6,304,837Mental Health 0.08830.08834,283,177,298 3,782,046Community Child Service 0.18650.18654,283,177,298 7,988,126
107
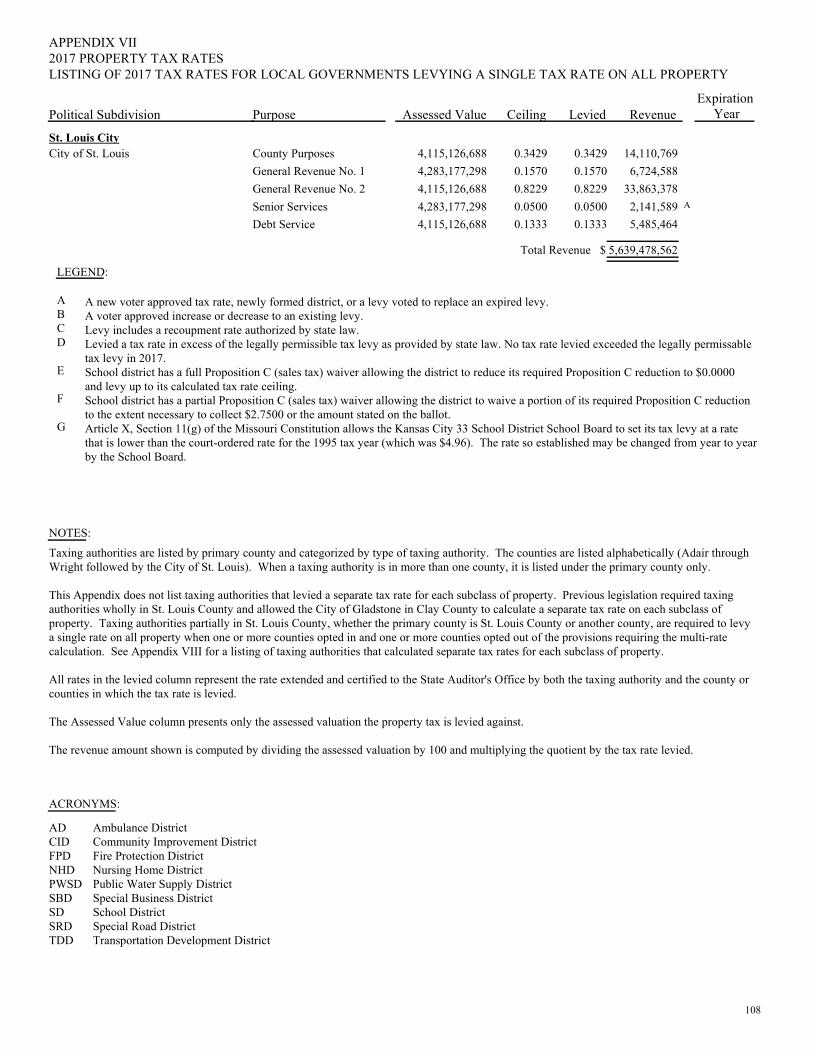
PurposePolitical Subdivision
2017 PROPERTY TAX RATESAPPENDIX VII
Assessed Value Ceiling Levied RevenueExpiration
Year
LISTING OF 2017 TAX RATES FOR LOCAL GOVERNMENTS LEVYING A SINGLE TAX RATE ON ALL PROPERTY
St. Louis CityCity of St. Louis County Purposes 0.34290.34294,115,126,688 14,110,769
General Revenue No. 1 0.15700.15704,283,177,298 6,724,588General Revenue No. 2 0.82290.82294,115,126,688 33,863,378Senior Services 0.05000.05004,283,177,298 A2,141,589Debt Service 0.13330.13334,115,126,688 5,485,464
Taxing authorities are listed by primary county and categorized by type of taxing authority. The counties are listed alphabetically (Adair through Wright followed by the City of St. Louis). When a taxing authority is in more than one county, it is listed under the primary county only.
This Appendix does not list taxing authorities that levied a separate tax rate for each subclass of property. Previous legislation required taxing authorities wholly in St. Louis County and allowed the City of Gladstone in Clay County to calculate a separate tax rate on each subclass of property. Taxing authorities partially in St. Louis County, whether the primary county is St. Louis County or another county, are required to levy a single rate on all property when one or more counties opted in and one or more counties opted out of the provisions requiring the multi-rate calculation. See Appendix VIII for a listing of taxing authorities that calculated separate tax rates for each subclass of property.
All rates in the levied column represent the rate extended and certified to the State Auditor's Office by both the taxing authority and the county or counties in which the tax rate is levied.
The Assessed Value column presents only the assessed valuation the property tax is levied against.
The revenue amount shown is computed by dividing the assessed valuation by 100 and multiplying the quotient by the tax rate levied.
NOTES:
LEGEND:
ABCD
E
F
G
A new voter approved tax rate, newly formed district, or a levy voted to replace an expired levy.A voter approved increase or decrease to an existing levy.Levy includes a recoupment rate authorized by state law.Levied a tax rate in excess of the legally permissible tax levy as provided by state law. No tax rate levied exceeded the legally permissable tax levy in 2017.School district has a full Proposition C (sales tax) waiver allowing the district to reduce its required Proposition C reduction to $0.0000 and levy up to its calculated tax rate ceiling.School district has a partial Proposition C (sales tax) waiver allowing the district to waive a portion of its required Proposition C reduction to the extent necessary to collect $2.7500 or the amount stated on the ballot.Article X, Section 11(g) of the Missouri Constitution allows the Kansas City 33 School District School Board to set its tax levy at a rate that is lower than the court-ordered rate for the 1995 tax year (which was $4.96). The rate so established may be changed from year to year by the School Board.
5,639,478,562Total Revenue $
ACRONYMS:
ADCID FPDNHDPWSDSBDSD SRDTDD
Ambulance DistrictCommunity Improvement DistrictFire Protection DistrictNursing Home DistrictPublic Water Supply DistrictSpecial Business DistrictSchool DistrictSpecial Road DistrictTransportation Development District
108
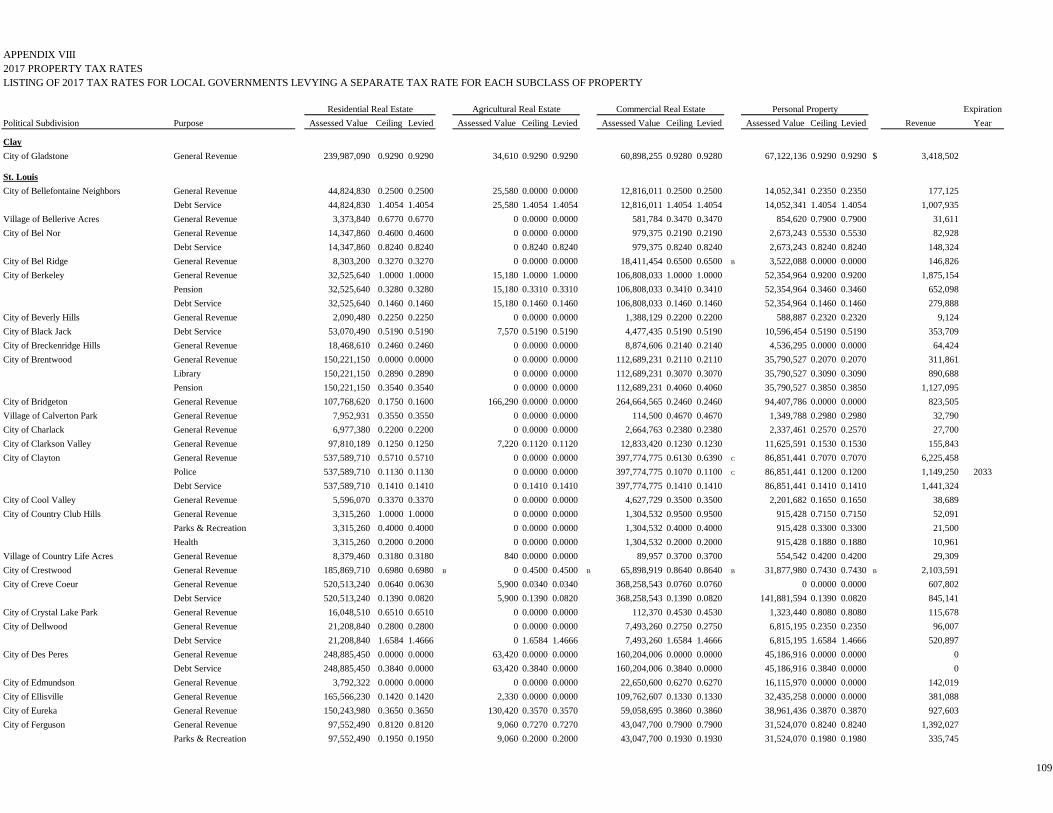
APPENDIX VIII2017 PROPERTY TAX RATESLISTING OF 2017 TAX RATES FOR LOCAL GOVERNMENTS LEVYING A SEPARATE TAX RATE FOR EACH SUBCLASS OF PROPERTY
Residential Real Estate Agricultural Real Estate Commercial Real Estate Personal Property ExpirationPolitical Subdivision Purpose Assessed Value Ceiling Levied Assessed Value Ceiling Levied Assessed Value Ceiling Levied Assessed Value Ceiling Levied Revenue Year
ClayCity of Gladstone General Revenue 239,987,090 0.9290 0.9290 34,610 0.9290 0.9290 60,898,255 0.9280 0.9280 67,122,136 0.9290 0.9290 $ 3,418,502
St. LouisCity of Bellefontaine Neighbors General Revenue 44,824,830 0.2500 0.2500 25,580 0.0000 0.0000 12,816,011 0.2500 0.2500 14,052,341 0.2350 0.2350 177,125
Debt Service 44,824,830 1.4054 1.4054 25,580 1.4054 1.4054 12,816,011 1.4054 1.4054 14,052,341 1.4054 1.4054 1,007,935Village of Bellerive Acres General Revenue 3,373,840 0.6770 0.6770 0 0.0000 0.0000 581,784 0.3470 0.3470 854,620 0.7900 0.7900 31,611City of Bel Nor General Revenue 14,347,860 0.4600 0.4600 0 0.0000 0.0000 979,375 0.2190 0.2190 2,673,243 0.5530 0.5530 82,928
Debt Service 14,347,860 0.8240 0.8240 0 0.8240 0.8240 979,375 0.8240 0.8240 2,673,243 0.8240 0.8240 148,324City of Bel Ridge General Revenue 8,303,200 0.3270 0.3270 0 0.0000 0.0000 18,411,454 0.6500 0.6500 B 3,522,088 0.0000 0.0000 146,826City of Berkeley General Revenue 32,525,640 1.0000 1.0000 15,180 1.0000 1.0000 106,808,033 1.0000 1.0000 52,354,964 0.9200 0.9200 1,875,154
Pension 32,525,640 0.3280 0.3280 15,180 0.3310 0.3310 106,808,033 0.3410 0.3410 52,354,964 0.3460 0.3460 652,098Debt Service 32,525,640 0.1460 0.1460 15,180 0.1460 0.1460 106,808,033 0.1460 0.1460 52,354,964 0.1460 0.1460 279,888
City of Beverly Hills General Revenue 2,090,480 0.2250 0.2250 0 0.0000 0.0000 1,388,129 0.2200 0.2200 588,887 0.2320 0.2320 9,124City of Black Jack Debt Service 53,070,490 0.5190 0.5190 7,570 0.5190 0.5190 4,477,435 0.5190 0.5190 10,596,454 0.5190 0.5190 353,709City of Breckenridge Hills General Revenue 18,468,610 0.2460 0.2460 0 0.0000 0.0000 8,874,606 0.2140 0.2140 4,536,295 0.0000 0.0000 64,424City of Brentwood General Revenue 150,221,150 0.0000 0.0000 0 0.0000 0.0000 112,689,231 0.2110 0.2110 35,790,527 0.2070 0.2070 311,861
Library 150,221,150 0.2890 0.2890 0 0.0000 0.0000 112,689,231 0.3070 0.3070 35,790,527 0.3090 0.3090 890,688Pension 150,221,150 0.3540 0.3540 0 0.0000 0.0000 112,689,231 0.4060 0.4060 35,790,527 0.3850 0.3850 1,127,095
City of Bridgeton General Revenue 107,768,620 0.1750 0.1600 166,290 0.0000 0.0000 264,664,565 0.2460 0.2460 94,407,786 0.0000 0.0000 823,505Village of Calverton Park General Revenue 7,952,931 0.3550 0.3550 0 0.0000 0.0000 114,500 0.4670 0.4670 1,349,788 0.2980 0.2980 32,790City of Charlack General Revenue 6,977,380 0.2200 0.2200 0 0.0000 0.0000 2,664,763 0.2380 0.2380 2,337,461 0.2570 0.2570 27,700City of Clarkson Valley General Revenue 97,810,189 0.1250 0.1250 7,220 0.1120 0.1120 12,833,420 0.1230 0.1230 11,625,591 0.1530 0.1530 155,843City of Clayton General Revenue 537,589,710 0.5710 0.5710 0 0.0000 0.0000 397,774,775 0.6130 0.6390 C 86,851,441 0.7070 0.7070 6,225,458
Police 537,589,710 0.1130 0.1130 0 0.0000 0.0000 397,774,775 0.1070 0.1100 C 86,851,441 0.1200 0.1200 1,149,250 2033Debt Service 537,589,710 0.1410 0.1410 0 0.1410 0.1410 397,774,775 0.1410 0.1410 86,851,441 0.1410 0.1410 1,441,324
City of Cool Valley General Revenue 5,596,070 0.3370 0.3370 0 0.0000 0.0000 4,627,729 0.3500 0.3500 2,201,682 0.1650 0.1650 38,689City of Country Club Hills General Revenue 3,315,260 1.0000 1.0000 0 0.0000 0.0000 1,304,532 0.9500 0.9500 915,428 0.7150 0.7150 52,091
Parks & Recreation 3,315,260 0.4000 0.4000 0 0.0000 0.0000 1,304,532 0.4000 0.4000 915,428 0.3300 0.3300 21,500Health 3,315,260 0.2000 0.2000 0 0.0000 0.0000 1,304,532 0.2000 0.2000 915,428 0.1880 0.1880 10,961
Village of Country Life Acres General Revenue 8,379,460 0.3180 0.3180 840 0.0000 0.0000 89,957 0.3700 0.3700 554,542 0.4200 0.4200 29,309City of Crestwood General Revenue 185,869,710 0.6980 0.6980 B 0 0.4500 0.4500 B 65,898,919 0.8640 0.8640 B 31,877,980 0.7430 0.7430 B 2,103,591City of Creve Coeur General Revenue 520,513,240 0.0640 0.0630 5,900 0.0340 0.0340 368,258,543 0.0760 0.0760 0 0.0000 0.0000 607,802
Debt Service 520,513,240 0.1390 0.0820 5,900 0.1390 0.0820 368,258,543 0.1390 0.0820 141,881,594 0.1390 0.0820 845,141City of Crystal Lake Park General Revenue 16,048,510 0.6510 0.6510 0 0.0000 0.0000 112,370 0.4530 0.4530 1,323,440 0.8080 0.8080 115,678City of Dellwood General Revenue 21,208,840 0.2800 0.2800 0 0.0000 0.0000 7,493,260 0.2750 0.2750 6,815,195 0.2350 0.2350 96,007
Debt Service 21,208,840 1.6584 1.4666 0 1.6584 1.4666 7,493,260 1.6584 1.4666 6,815,195 1.6584 1.4666 520,897City of Des Peres General Revenue 248,885,450 0.0000 0.0000 63,420 0.0000 0.0000 160,204,006 0.0000 0.0000 45,186,916 0.0000 0.0000 0
Debt Service 248,885,450 0.3840 0.0000 63,420 0.3840 0.0000 160,204,006 0.3840 0.0000 45,186,916 0.3840 0.0000 0City of Edmundson General Revenue 3,792,322 0.0000 0.0000 0 0.0000 0.0000 22,650,600 0.6270 0.6270 16,115,970 0.0000 0.0000 142,019City of Ellisville General Revenue 165,566,230 0.1420 0.1420 2,330 0.0000 0.0000 109,762,607 0.1330 0.1330 32,435,258 0.0000 0.0000 381,088City of Eureka General Revenue 150,243,980 0.3650 0.3650 130,420 0.3570 0.3570 59,058,695 0.3860 0.3860 38,961,436 0.3870 0.3870 927,603City of Ferguson General Revenue 97,552,490 0.8120 0.8120 9,060 0.7270 0.7270 43,047,700 0.7900 0.7900 31,524,070 0.8240 0.8240 1,392,027
Parks & Recreation 97,552,490 0.1950 0.1950 9,060 0.2000 0.2000 43,047,700 0.1930 0.1930 31,524,070 0.1980 0.1980 335,745
109
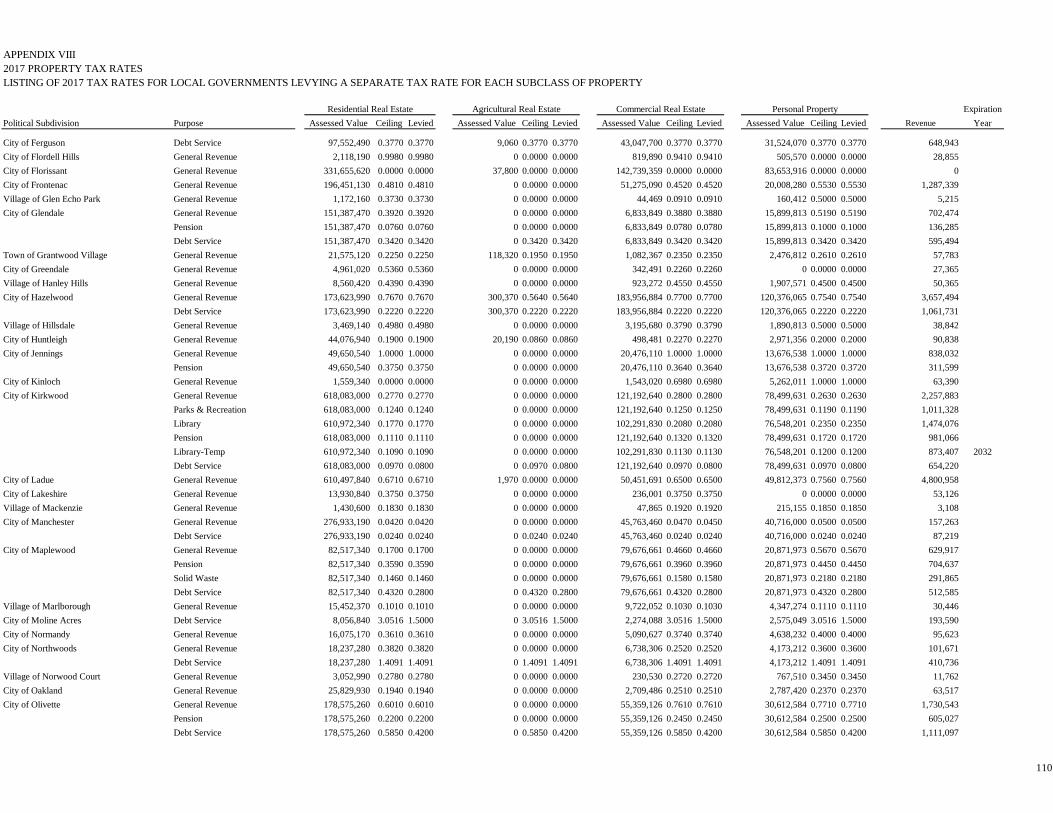
APPENDIX VIII2017 PROPERTY TAX RATESLISTING OF 2017 TAX RATES FOR LOCAL GOVERNMENTS LEVYING A SEPARATE TAX RATE FOR EACH SUBCLASS OF PROPERTY
Residential Real Estate Agricultural Real Estate Commercial Real Estate Personal Property ExpirationPolitical Subdivision Purpose Assessed Value Ceiling Levied Assessed Value Ceiling Levied Assessed Value Ceiling Levied Assessed Value Ceiling Levied Revenue Year
City of Ferguson Debt Service 97,552,490 0.3770 0.3770 9,060 0.3770 0.3770 43,047,700 0.3770 0.3770 31,524,070 0.3770 0.3770 648,943City of Flordell Hills General Revenue 2,118,190 0.9980 0.9980 0 0.0000 0.0000 819,890 0.9410 0.9410 505,570 0.0000 0.0000 28,855City of Florissant General Revenue 331,655,620 0.0000 0.0000 37,800 0.0000 0.0000 142,739,359 0.0000 0.0000 83,653,916 0.0000 0.0000 0City of Frontenac General Revenue 196,451,130 0.4810 0.4810 0 0.0000 0.0000 51,275,090 0.4520 0.4520 20,008,280 0.5530 0.5530 1,287,339Village of Glen Echo Park General Revenue 1,172,160 0.3730 0.3730 0 0.0000 0.0000 44,469 0.0910 0.0910 160,412 0.5000 0.5000 5,215City of Glendale General Revenue 151,387,470 0.3920 0.3920 0 0.0000 0.0000 6,833,849 0.3880 0.3880 15,899,813 0.5190 0.5190 702,474
Pension 151,387,470 0.0760 0.0760 0 0.0000 0.0000 6,833,849 0.0780 0.0780 15,899,813 0.1000 0.1000 136,285Debt Service 151,387,470 0.3420 0.3420 0 0.3420 0.3420 6,833,849 0.3420 0.3420 15,899,813 0.3420 0.3420 595,494
Town of Grantwood Village General Revenue 21,575,120 0.2250 0.2250 118,320 0.1950 0.1950 1,082,367 0.2350 0.2350 2,476,812 0.2610 0.2610 57,783City of Greendale General Revenue 4,961,020 0.5360 0.5360 0 0.0000 0.0000 342,491 0.2260 0.2260 0 0.0000 0.0000 27,365Village of Hanley Hills General Revenue 8,560,420 0.4390 0.4390 0 0.0000 0.0000 923,272 0.4550 0.4550 1,907,571 0.4500 0.4500 50,365City of Hazelwood General Revenue 173,623,990 0.7670 0.7670 300,370 0.5640 0.5640 183,956,884 0.7700 0.7700 120,376,065 0.7540 0.7540 3,657,494
Debt Service 173,623,990 0.2220 0.2220 300,370 0.2220 0.2220 183,956,884 0.2220 0.2220 120,376,065 0.2220 0.2220 1,061,731Village of Hillsdale General Revenue 3,469,140 0.4980 0.4980 0 0.0000 0.0000 3,195,680 0.3790 0.3790 1,890,813 0.5000 0.5000 38,842City of Huntleigh General Revenue 44,076,940 0.1900 0.1900 20,190 0.0860 0.0860 498,481 0.2270 0.2270 2,971,356 0.2000 0.2000 90,838City of Jennings General Revenue 49,650,540 1.0000 1.0000 0 0.0000 0.0000 20,476,110 1.0000 1.0000 13,676,538 1.0000 1.0000 838,032
Pension 49,650,540 0.3750 0.3750 0 0.0000 0.0000 20,476,110 0.3640 0.3640 13,676,538 0.3720 0.3720 311,599City of Kinloch General Revenue 1,559,340 0.0000 0.0000 0 0.0000 0.0000 1,543,020 0.6980 0.6980 5,262,011 1.0000 1.0000 63,390City of Kirkwood General Revenue 618,083,000 0.2770 0.2770 0 0.0000 0.0000 121,192,640 0.2800 0.2800 78,499,631 0.2630 0.2630 2,257,883
Parks & Recreation 618,083,000 0.1240 0.1240 0 0.0000 0.0000 121,192,640 0.1250 0.1250 78,499,631 0.1190 0.1190 1,011,328Library 610,972,340 0.1770 0.1770 0 0.0000 0.0000 102,291,830 0.2080 0.2080 76,548,201 0.2350 0.2350 1,474,076Pension 618,083,000 0.1110 0.1110 0 0.0000 0.0000 121,192,640 0.1320 0.1320 78,499,631 0.1720 0.1720 981,066Library-Temp 610,972,340 0.1090 0.1090 0 0.0000 0.0000 102,291,830 0.1130 0.1130 76,548,201 0.1200 0.1200 873,407 2032Debt Service 618,083,000 0.0970 0.0800 0 0.0970 0.0800 121,192,640 0.0970 0.0800 78,499,631 0.0970 0.0800 654,220
City of Ladue General Revenue 610,497,840 0.6710 0.6710 1,970 0.0000 0.0000 50,451,691 0.6500 0.6500 49,812,373 0.7560 0.7560 4,800,958City of Lakeshire General Revenue 13,930,840 0.3750 0.3750 0 0.0000 0.0000 236,001 0.3750 0.3750 0 0.0000 0.0000 53,126Village of Mackenzie General Revenue 1,430,600 0.1830 0.1830 0 0.0000 0.0000 47,865 0.1920 0.1920 215,155 0.1850 0.1850 3,108City of Manchester General Revenue 276,933,190 0.0420 0.0420 0 0.0000 0.0000 45,763,460 0.0470 0.0450 40,716,000 0.0500 0.0500 157,263
Debt Service 276,933,190 0.0240 0.0240 0 0.0240 0.0240 45,763,460 0.0240 0.0240 40,716,000 0.0240 0.0240 87,219City of Maplewood General Revenue 82,517,340 0.1700 0.1700 0 0.0000 0.0000 79,676,661 0.4660 0.4660 20,871,973 0.5670 0.5670 629,917
Pension 82,517,340 0.3590 0.3590 0 0.0000 0.0000 79,676,661 0.3960 0.3960 20,871,973 0.4450 0.4450 704,637Solid Waste 82,517,340 0.1460 0.1460 0 0.0000 0.0000 79,676,661 0.1580 0.1580 20,871,973 0.2180 0.2180 291,865Debt Service 82,517,340 0.4320 0.2800 0 0.4320 0.2800 79,676,661 0.4320 0.2800 20,871,973 0.4320 0.2800 512,585
Village of Marlborough General Revenue 15,452,370 0.1010 0.1010 0 0.0000 0.0000 9,722,052 0.1030 0.1030 4,347,274 0.1110 0.1110 30,446City of Moline Acres Debt Service 8,056,840 3.0516 1.5000 0 3.0516 1.5000 2,274,088 3.0516 1.5000 2,575,049 3.0516 1.5000 193,590City of Normandy General Revenue 16,075,170 0.3610 0.3610 0 0.0000 0.0000 5,090,627 0.3740 0.3740 4,638,232 0.4000 0.4000 95,623City of Northwoods General Revenue 18,237,280 0.3820 0.3820 0 0.0000 0.0000 6,738,306 0.2520 0.2520 4,173,212 0.3600 0.3600 101,671
Debt Service 18,237,280 1.4091 1.4091 0 1.4091 1.4091 6,738,306 1.4091 1.4091 4,173,212 1.4091 1.4091 410,736Village of Norwood Court General Revenue 3,052,990 0.2780 0.2780 0 0.0000 0.0000 230,530 0.2720 0.2720 767,510 0.3450 0.3450 11,762City of Oakland General Revenue 25,829,930 0.1940 0.1940 0 0.0000 0.0000 2,709,486 0.2510 0.2510 2,787,420 0.2370 0.2370 63,517City of Olivette General Revenue 178,575,260 0.6010 0.6010 0 0.0000 0.0000 55,359,126 0.7610 0.7610 30,612,584 0.7710 0.7710 1,730,543
Pension 178,575,260 0.2200 0.2200 0 0.0000 0.0000 55,359,126 0.2450 0.2450 30,612,584 0.2500 0.2500 605,027Debt Service 178,575,260 0.5850 0.4200 0 0.5850 0.4200 55,359,126 0.5850 0.4200 30,612,584 0.5850 0.4200 1,111,097
110
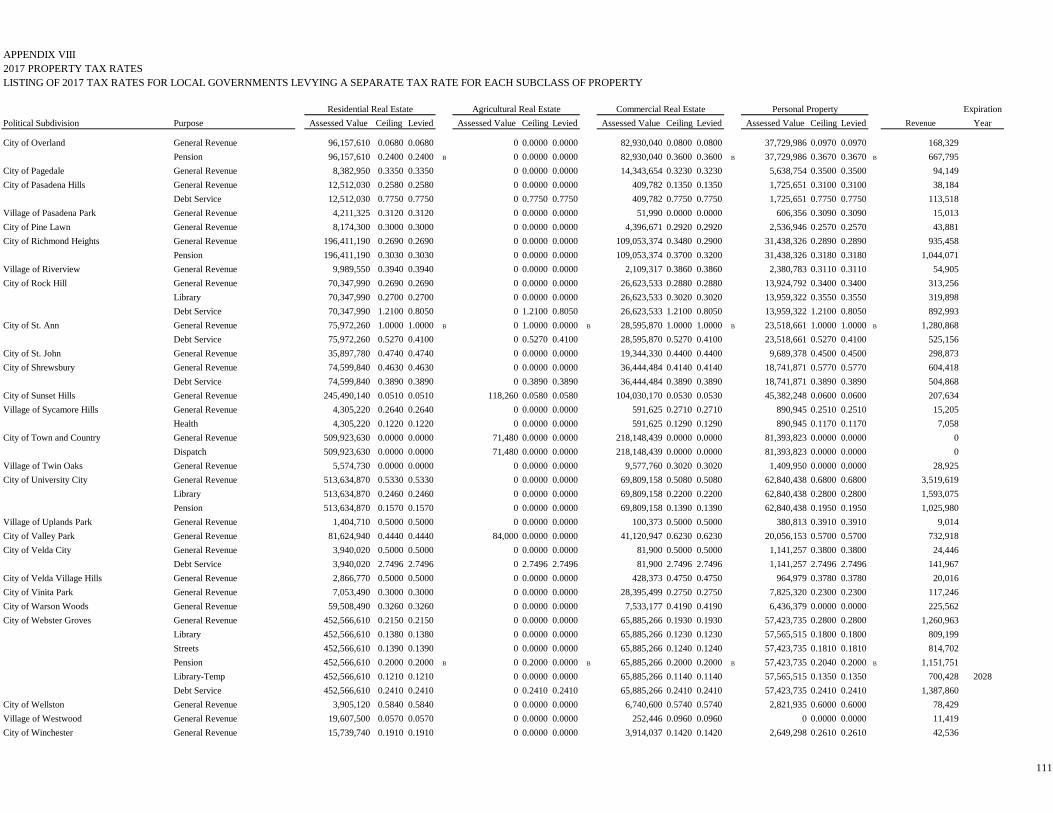
APPENDIX VIII2017 PROPERTY TAX RATESLISTING OF 2017 TAX RATES FOR LOCAL GOVERNMENTS LEVYING A SEPARATE TAX RATE FOR EACH SUBCLASS OF PROPERTY
Residential Real Estate Agricultural Real Estate Commercial Real Estate Personal Property ExpirationPolitical Subdivision Purpose Assessed Value Ceiling Levied Assessed Value Ceiling Levied Assessed Value Ceiling Levied Assessed Value Ceiling Levied Revenue Year
City of Overland General Revenue 96,157,610 0.0680 0.0680 0 0.0000 0.0000 82,930,040 0.0800 0.0800 37,729,986 0.0970 0.0970 168,329Pension 96,157,610 0.2400 0.2400 B 0 0.0000 0.0000 82,930,040 0.3600 0.3600 B 37,729,986 0.3670 0.3670 B 667,795
City of Pagedale General Revenue 8,382,950 0.3350 0.3350 0 0.0000 0.0000 14,343,654 0.3230 0.3230 5,638,754 0.3500 0.3500 94,149City of Pasadena Hills General Revenue 12,512,030 0.2580 0.2580 0 0.0000 0.0000 409,782 0.1350 0.1350 1,725,651 0.3100 0.3100 38,184
Debt Service 12,512,030 0.7750 0.7750 0 0.7750 0.7750 409,782 0.7750 0.7750 1,725,651 0.7750 0.7750 113,518Village of Pasadena Park General Revenue 4,211,325 0.3120 0.3120 0 0.0000 0.0000 51,990 0.0000 0.0000 606,356 0.3090 0.3090 15,013City of Pine Lawn General Revenue 8,174,300 0.3000 0.3000 0 0.0000 0.0000 4,396,671 0.2920 0.2920 2,536,946 0.2570 0.2570 43,881City of Richmond Heights General Revenue 196,411,190 0.2690 0.2690 0 0.0000 0.0000 109,053,374 0.3480 0.2900 31,438,326 0.2890 0.2890 935,458
Pension 196,411,190 0.3030 0.3030 0 0.0000 0.0000 109,053,374 0.3700 0.3200 31,438,326 0.3180 0.3180 1,044,071Village of Riverview General Revenue 9,989,550 0.3940 0.3940 0 0.0000 0.0000 2,109,317 0.3860 0.3860 2,380,783 0.3110 0.3110 54,905City of Rock Hill General Revenue 70,347,990 0.2690 0.2690 0 0.0000 0.0000 26,623,533 0.2880 0.2880 13,924,792 0.3400 0.3400 313,256
Library 70,347,990 0.2700 0.2700 0 0.0000 0.0000 26,623,533 0.3020 0.3020 13,959,322 0.3550 0.3550 319,898Debt Service 70,347,990 1.2100 0.8050 0 1.2100 0.8050 26,623,533 1.2100 0.8050 13,959,322 1.2100 0.8050 892,993
City of St. Ann General Revenue 75,972,260 1.0000 1.0000 B 0 1.0000 0.0000 B 28,595,870 1.0000 1.0000 B 23,518,661 1.0000 1.0000 B 1,280,868Debt Service 75,972,260 0.5270 0.4100 0 0.5270 0.4100 28,595,870 0.5270 0.4100 23,518,661 0.5270 0.4100 525,156
City of St. John General Revenue 35,897,780 0.4740 0.4740 0 0.0000 0.0000 19,344,330 0.4400 0.4400 9,689,378 0.4500 0.4500 298,873City of Shrewsbury General Revenue 74,599,840 0.4630 0.4630 0 0.0000 0.0000 36,444,484 0.4140 0.4140 18,741,871 0.5770 0.5770 604,418
Debt Service 74,599,840 0.3890 0.3890 0 0.3890 0.3890 36,444,484 0.3890 0.3890 18,741,871 0.3890 0.3890 504,868City of Sunset Hills General Revenue 245,490,140 0.0510 0.0510 118,260 0.0580 0.0580 104,030,170 0.0530 0.0530 45,382,248 0.0600 0.0600 207,634Village of Sycamore Hills General Revenue 4,305,220 0.2640 0.2640 0 0.0000 0.0000 591,625 0.2710 0.2710 890,945 0.2510 0.2510 15,205
Health 4,305,220 0.1220 0.1220 0 0.0000 0.0000 591,625 0.1290 0.1290 890,945 0.1170 0.1170 7,058City of Town and Country General Revenue 509,923,630 0.0000 0.0000 71,480 0.0000 0.0000 218,148,439 0.0000 0.0000 81,393,823 0.0000 0.0000 0
Dispatch 509,923,630 0.0000 0.0000 71,480 0.0000 0.0000 218,148,439 0.0000 0.0000 81,393,823 0.0000 0.0000 0Village of Twin Oaks General Revenue 5,574,730 0.0000 0.0000 0 0.0000 0.0000 9,577,760 0.3020 0.3020 1,409,950 0.0000 0.0000 28,925City of University City General Revenue 513,634,870 0.5330 0.5330 0 0.0000 0.0000 69,809,158 0.5080 0.5080 62,840,438 0.6800 0.6800 3,519,619
Library 513,634,870 0.2460 0.2460 0 0.0000 0.0000 69,809,158 0.2200 0.2200 62,840,438 0.2800 0.2800 1,593,075Pension 513,634,870 0.1570 0.1570 0 0.0000 0.0000 69,809,158 0.1390 0.1390 62,840,438 0.1950 0.1950 1,025,980
Village of Uplands Park General Revenue 1,404,710 0.5000 0.5000 0 0.0000 0.0000 100,373 0.5000 0.5000 380,813 0.3910 0.3910 9,014City of Valley Park General Revenue 81,624,940 0.4440 0.4440 84,000 0.0000 0.0000 41,120,947 0.6230 0.6230 20,056,153 0.5700 0.5700 732,918City of Velda City General Revenue 3,940,020 0.5000 0.5000 0 0.0000 0.0000 81,900 0.5000 0.5000 1,141,257 0.3800 0.3800 24,446
Debt Service 3,940,020 2.7496 2.7496 0 2.7496 2.7496 81,900 2.7496 2.7496 1,141,257 2.7496 2.7496 141,967City of Velda Village Hills General Revenue 2,866,770 0.5000 0.5000 0 0.0000 0.0000 428,373 0.4750 0.4750 964,979 0.3780 0.3780 20,016City of Vinita Park General Revenue 7,053,490 0.3000 0.3000 0 0.0000 0.0000 28,395,499 0.2750 0.2750 7,825,320 0.2300 0.2300 117,246City of Warson Woods General Revenue 59,508,490 0.3260 0.3260 0 0.0000 0.0000 7,533,177 0.4190 0.4190 6,436,379 0.0000 0.0000 225,562City of Webster Groves General Revenue 452,566,610 0.2150 0.2150 0 0.0000 0.0000 65,885,266 0.1930 0.1930 57,423,735 0.2800 0.2800 1,260,963
Library 452,566,610 0.1380 0.1380 0 0.0000 0.0000 65,885,266 0.1230 0.1230 57,565,515 0.1800 0.1800 809,199Streets 452,566,610 0.1390 0.1390 0 0.0000 0.0000 65,885,266 0.1240 0.1240 57,423,735 0.1810 0.1810 814,702Pension 452,566,610 0.2000 0.2000 B 0 0.2000 0.0000 B 65,885,266 0.2000 0.2000 B 57,423,735 0.2040 0.2000 B 1,151,751Library-Temp 452,566,610 0.1210 0.1210 0 0.0000 0.0000 65,885,266 0.1140 0.1140 57,565,515 0.1350 0.1350 700,428 2028Debt Service 452,566,610 0.2410 0.2410 0 0.2410 0.2410 65,885,266 0.2410 0.2410 57,423,735 0.2410 0.2410 1,387,860
City of Wellston General Revenue 3,905,120 0.5840 0.5840 0 0.0000 0.0000 6,740,600 0.5740 0.5740 2,821,935 0.6000 0.6000 78,429Village of Westwood General Revenue 19,607,500 0.0570 0.0570 0 0.0000 0.0000 252,446 0.0960 0.0960 0 0.0000 0.0000 11,419City of Winchester General Revenue 15,739,740 0.1910 0.1910 0 0.0000 0.0000 3,914,037 0.1420 0.1420 2,649,298 0.2610 0.2610 42,536
111
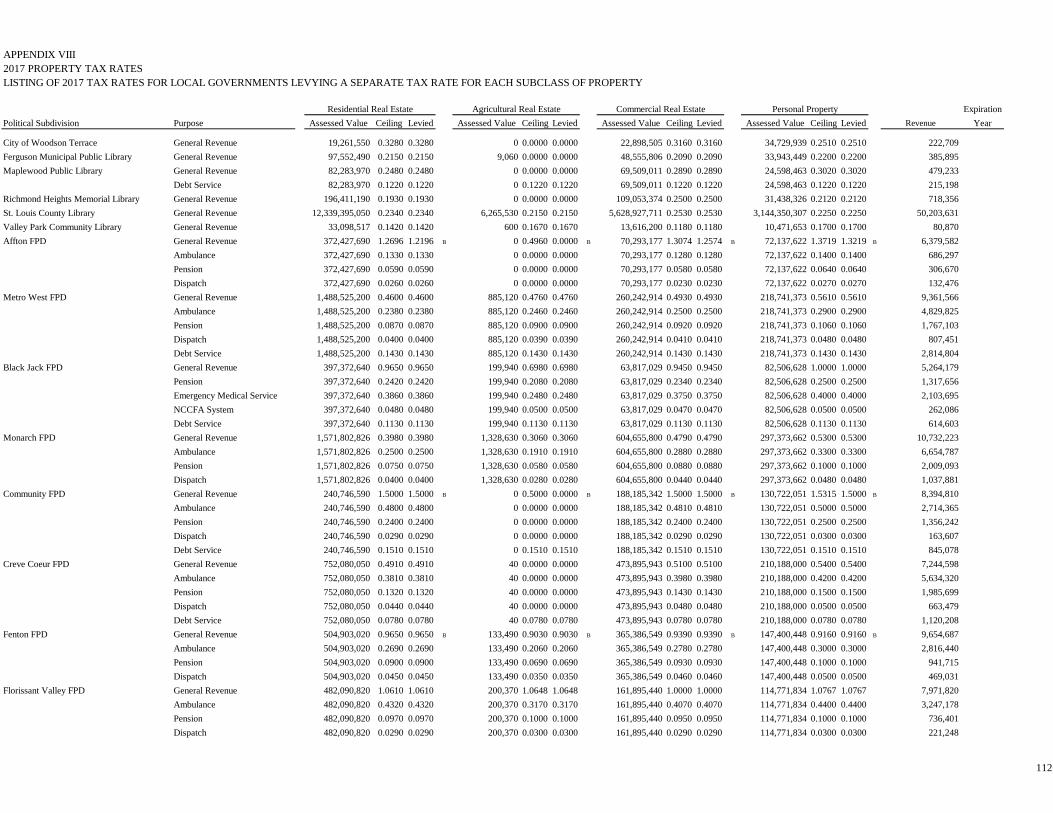
APPENDIX VIII2017 PROPERTY TAX RATESLISTING OF 2017 TAX RATES FOR LOCAL GOVERNMENTS LEVYING A SEPARATE TAX RATE FOR EACH SUBCLASS OF PROPERTY
Residential Real Estate Agricultural Real Estate Commercial Real Estate Personal Property ExpirationPolitical Subdivision Purpose Assessed Value Ceiling Levied Assessed Value Ceiling Levied Assessed Value Ceiling Levied Assessed Value Ceiling Levied Revenue Year
City of Woodson Terrace General Revenue 19,261,550 0.3280 0.3280 0 0.0000 0.0000 22,898,505 0.3160 0.3160 34,729,939 0.2510 0.2510 222,709Ferguson Municipal Public Library General Revenue 97,552,490 0.2150 0.2150 9,060 0.0000 0.0000 48,555,806 0.2090 0.2090 33,943,449 0.2200 0.2200 385,895Maplewood Public Library General Revenue 82,283,970 0.2480 0.2480 0 0.0000 0.0000 69,509,011 0.2890 0.2890 24,598,463 0.3020 0.3020 479,233
Debt Service 82,283,970 0.1220 0.1220 0 0.1220 0.1220 69,509,011 0.1220 0.1220 24,598,463 0.1220 0.1220 215,198Richmond Heights Memorial Library General Revenue 196,411,190 0.1930 0.1930 0 0.0000 0.0000 109,053,374 0.2500 0.2500 31,438,326 0.2120 0.2120 718,356St. Louis County Library General Revenue 12,339,395,050 0.2340 0.2340 6,265,530 0.2150 0.2150 5,628,927,711 0.2530 0.2530 3,144,350,307 0.2250 0.2250 50,203,631Valley Park Community Library General Revenue 33,098,517 0.1420 0.1420 600 0.1670 0.1670 13,616,200 0.1180 0.1180 10,471,653 0.1700 0.1700 80,870Affton FPD General Revenue 372,427,690 1.2696 1.2196 B 0 0.4960 0.0000 B 70,293,177 1.3074 1.2574 B 72,137,622 1.3719 1.3219 B 6,379,582
Ambulance 372,427,690 0.1330 0.1330 0 0.0000 0.0000 70,293,177 0.1280 0.1280 72,137,622 0.1400 0.1400 686,297Pension 372,427,690 0.0590 0.0590 0 0.0000 0.0000 70,293,177 0.0580 0.0580 72,137,622 0.0640 0.0640 306,670Dispatch 372,427,690 0.0260 0.0260 0 0.0000 0.0000 70,293,177 0.0230 0.0230 72,137,622 0.0270 0.0270 132,476
Metro West FPD General Revenue 1,488,525,200 0.4600 0.4600 885,120 0.4760 0.4760 260,242,914 0.4930 0.4930 218,741,373 0.5610 0.5610 9,361,566Ambulance 1,488,525,200 0.2380 0.2380 885,120 0.2460 0.2460 260,242,914 0.2500 0.2500 218,741,373 0.2900 0.2900 4,829,825Pension 1,488,525,200 0.0870 0.0870 885,120 0.0900 0.0900 260,242,914 0.0920 0.0920 218,741,373 0.1060 0.1060 1,767,103Dispatch 1,488,525,200 0.0400 0.0400 885,120 0.0390 0.0390 260,242,914 0.0410 0.0410 218,741,373 0.0480 0.0480 807,451Debt Service 1,488,525,200 0.1430 0.1430 885,120 0.1430 0.1430 260,242,914 0.1430 0.1430 218,741,373 0.1430 0.1430 2,814,804
Black Jack FPD General Revenue 397,372,640 0.9650 0.9650 199,940 0.6980 0.6980 63,817,029 0.9450 0.9450 82,506,628 1.0000 1.0000 5,264,179Pension 397,372,640 0.2420 0.2420 199,940 0.2080 0.2080 63,817,029 0.2340 0.2340 82,506,628 0.2500 0.2500 1,317,656Emergency Medical Service 397,372,640 0.3860 0.3860 199,940 0.2480 0.2480 63,817,029 0.3750 0.3750 82,506,628 0.4000 0.4000 2,103,695NCCFA System 397,372,640 0.0480 0.0480 199,940 0.0500 0.0500 63,817,029 0.0470 0.0470 82,506,628 0.0500 0.0500 262,086Debt Service 397,372,640 0.1130 0.1130 199,940 0.1130 0.1130 63,817,029 0.1130 0.1130 82,506,628 0.1130 0.1130 614,603
Monarch FPD General Revenue 1,571,802,826 0.3980 0.3980 1,328,630 0.3060 0.3060 604,655,800 0.4790 0.4790 297,373,662 0.5300 0.5300 10,732,223Ambulance 1,571,802,826 0.2500 0.2500 1,328,630 0.1910 0.1910 604,655,800 0.2880 0.2880 297,373,662 0.3300 0.3300 6,654,787Pension 1,571,802,826 0.0750 0.0750 1,328,630 0.0580 0.0580 604,655,800 0.0880 0.0880 297,373,662 0.1000 0.1000 2,009,093Dispatch 1,571,802,826 0.0400 0.0400 1,328,630 0.0280 0.0280 604,655,800 0.0440 0.0440 297,373,662 0.0480 0.0480 1,037,881
Community FPD General Revenue 240,746,590 1.5000 1.5000 B 0 0.5000 0.0000 B 188,185,342 1.5000 1.5000 B 130,722,051 1.5315 1.5000 B 8,394,810Ambulance 240,746,590 0.4800 0.4800 0 0.0000 0.0000 188,185,342 0.4810 0.4810 130,722,051 0.5000 0.5000 2,714,365Pension 240,746,590 0.2400 0.2400 0 0.0000 0.0000 188,185,342 0.2400 0.2400 130,722,051 0.2500 0.2500 1,356,242Dispatch 240,746,590 0.0290 0.0290 0 0.0000 0.0000 188,185,342 0.0290 0.0290 130,722,051 0.0300 0.0300 163,607Debt Service 240,746,590 0.1510 0.1510 0 0.1510 0.1510 188,185,342 0.1510 0.1510 130,722,051 0.1510 0.1510 845,078
Creve Coeur FPD General Revenue 752,080,050 0.4910 0.4910 40 0.0000 0.0000 473,895,943 0.5100 0.5100 210,188,000 0.5400 0.5400 7,244,598Ambulance 752,080,050 0.3810 0.3810 40 0.0000 0.0000 473,895,943 0.3980 0.3980 210,188,000 0.4200 0.4200 5,634,320Pension 752,080,050 0.1320 0.1320 40 0.0000 0.0000 473,895,943 0.1430 0.1430 210,188,000 0.1500 0.1500 1,985,699Dispatch 752,080,050 0.0440 0.0440 40 0.0000 0.0000 473,895,943 0.0480 0.0480 210,188,000 0.0500 0.0500 663,479Debt Service 752,080,050 0.0780 0.0780 40 0.0780 0.0780 473,895,943 0.0780 0.0780 210,188,000 0.0780 0.0780 1,120,208
Fenton FPD General Revenue 504,903,020 0.9650 0.9650 B 133,490 0.9030 0.9030 B 365,386,549 0.9390 0.9390 B 147,400,448 0.9160 0.9160 B 9,654,687Ambulance 504,903,020 0.2690 0.2690 133,490 0.2060 0.2060 365,386,549 0.2780 0.2780 147,400,448 0.3000 0.3000 2,816,440Pension 504,903,020 0.0900 0.0900 133,490 0.0690 0.0690 365,386,549 0.0930 0.0930 147,400,448 0.1000 0.1000 941,715Dispatch 504,903,020 0.0450 0.0450 133,490 0.0350 0.0350 365,386,549 0.0460 0.0460 147,400,448 0.0500 0.0500 469,031
Florissant Valley FPD General Revenue 482,090,820 1.0610 1.0610 200,370 1.0648 1.0648 161,895,440 1.0000 1.0000 114,771,834 1.0767 1.0767 7,971,820Ambulance 482,090,820 0.4320 0.4320 200,370 0.3170 0.3170 161,895,440 0.4070 0.4070 114,771,834 0.4400 0.4400 3,247,178Pension 482,090,820 0.0970 0.0970 200,370 0.1000 0.1000 161,895,440 0.0950 0.0950 114,771,834 0.1000 0.1000 736,401Dispatch 482,090,820 0.0290 0.0290 200,370 0.0300 0.0300 161,895,440 0.0290 0.0290 114,771,834 0.0300 0.0300 221,248
112
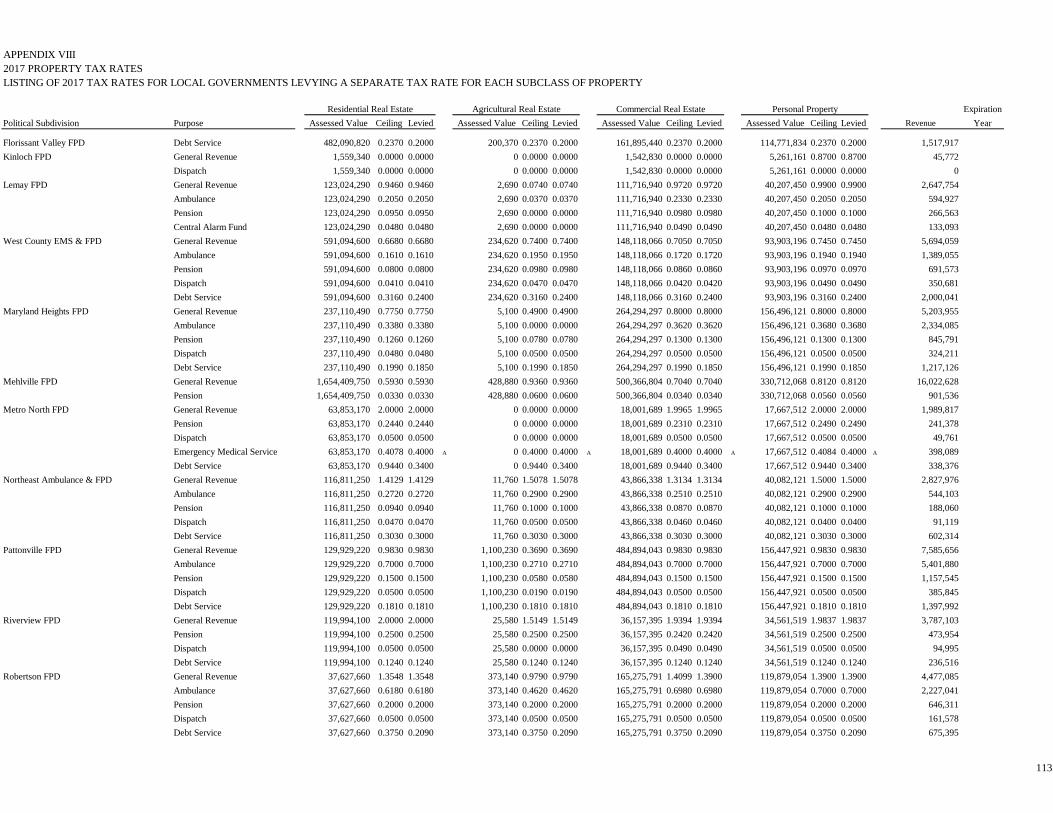
APPENDIX VIII2017 PROPERTY TAX RATESLISTING OF 2017 TAX RATES FOR LOCAL GOVERNMENTS LEVYING A SEPARATE TAX RATE FOR EACH SUBCLASS OF PROPERTY
Residential Real Estate Agricultural Real Estate Commercial Real Estate Personal Property ExpirationPolitical Subdivision Purpose Assessed Value Ceiling Levied Assessed Value Ceiling Levied Assessed Value Ceiling Levied Assessed Value Ceiling Levied Revenue Year
Florissant Valley FPD Debt Service 482,090,820 0.2370 0.2000 200,370 0.2370 0.2000 161,895,440 0.2370 0.2000 114,771,834 0.2370 0.2000 1,517,917Kinloch FPD General Revenue 1,559,340 0.0000 0.0000 0 0.0000 0.0000 1,542,830 0.0000 0.0000 5,261,161 0.8700 0.8700 45,772
Dispatch 1,559,340 0.0000 0.0000 0 0.0000 0.0000 1,542,830 0.0000 0.0000 5,261,161 0.0000 0.0000 0Lemay FPD General Revenue 123,024,290 0.9460 0.9460 2,690 0.0740 0.0740 111,716,940 0.9720 0.9720 40,207,450 0.9900 0.9900 2,647,754
Ambulance 123,024,290 0.2050 0.2050 2,690 0.0370 0.0370 111,716,940 0.2330 0.2330 40,207,450 0.2050 0.2050 594,927Pension 123,024,290 0.0950 0.0950 2,690 0.0000 0.0000 111,716,940 0.0980 0.0980 40,207,450 0.1000 0.1000 266,563Central Alarm Fund 123,024,290 0.0480 0.0480 2,690 0.0000 0.0000 111,716,940 0.0490 0.0490 40,207,450 0.0480 0.0480 133,093
West County EMS & FPD General Revenue 591,094,600 0.6680 0.6680 234,620 0.7400 0.7400 148,118,066 0.7050 0.7050 93,903,196 0.7450 0.7450 5,694,059Ambulance 591,094,600 0.1610 0.1610 234,620 0.1950 0.1950 148,118,066 0.1720 0.1720 93,903,196 0.1940 0.1940 1,389,055Pension 591,094,600 0.0800 0.0800 234,620 0.0980 0.0980 148,118,066 0.0860 0.0860 93,903,196 0.0970 0.0970 691,573Dispatch 591,094,600 0.0410 0.0410 234,620 0.0470 0.0470 148,118,066 0.0420 0.0420 93,903,196 0.0490 0.0490 350,681Debt Service 591,094,600 0.3160 0.2400 234,620 0.3160 0.2400 148,118,066 0.3160 0.2400 93,903,196 0.3160 0.2400 2,000,041
Maryland Heights FPD General Revenue 237,110,490 0.7750 0.7750 5,100 0.4900 0.4900 264,294,297 0.8000 0.8000 156,496,121 0.8000 0.8000 5,203,955Ambulance 237,110,490 0.3380 0.3380 5,100 0.0000 0.0000 264,294,297 0.3620 0.3620 156,496,121 0.3680 0.3680 2,334,085Pension 237,110,490 0.1260 0.1260 5,100 0.0780 0.0780 264,294,297 0.1300 0.1300 156,496,121 0.1300 0.1300 845,791Dispatch 237,110,490 0.0480 0.0480 5,100 0.0500 0.0500 264,294,297 0.0500 0.0500 156,496,121 0.0500 0.0500 324,211Debt Service 237,110,490 0.1990 0.1850 5,100 0.1990 0.1850 264,294,297 0.1990 0.1850 156,496,121 0.1990 0.1850 1,217,126
Mehlville FPD General Revenue 1,654,409,750 0.5930 0.5930 428,880 0.9360 0.9360 500,366,804 0.7040 0.7040 330,712,068 0.8120 0.8120 16,022,628Pension 1,654,409,750 0.0330 0.0330 428,880 0.0600 0.0600 500,366,804 0.0340 0.0340 330,712,068 0.0560 0.0560 901,536
Metro North FPD General Revenue 63,853,170 2.0000 2.0000 0 0.0000 0.0000 18,001,689 1.9965 1.9965 17,667,512 2.0000 2.0000 1,989,817Pension 63,853,170 0.2440 0.2440 0 0.0000 0.0000 18,001,689 0.2310 0.2310 17,667,512 0.2490 0.2490 241,378Dispatch 63,853,170 0.0500 0.0500 0 0.0000 0.0000 18,001,689 0.0500 0.0500 17,667,512 0.0500 0.0500 49,761Emergency Medical Service 63,853,170 0.4078 0.4000 A 0 0.4000 0.4000 A 18,001,689 0.4000 0.4000 A 17,667,512 0.4084 0.4000 A 398,089Debt Service 63,853,170 0.9440 0.3400 0 0.9440 0.3400 18,001,689 0.9440 0.3400 17,667,512 0.9440 0.3400 338,376
Northeast Ambulance & FPD General Revenue 116,811,250 1.4129 1.4129 11,760 1.5078 1.5078 43,866,338 1.3134 1.3134 40,082,121 1.5000 1.5000 2,827,976Ambulance 116,811,250 0.2720 0.2720 11,760 0.2900 0.2900 43,866,338 0.2510 0.2510 40,082,121 0.2900 0.2900 544,103Pension 116,811,250 0.0940 0.0940 11,760 0.1000 0.1000 43,866,338 0.0870 0.0870 40,082,121 0.1000 0.1000 188,060Dispatch 116,811,250 0.0470 0.0470 11,760 0.0500 0.0500 43,866,338 0.0460 0.0460 40,082,121 0.0400 0.0400 91,119Debt Service 116,811,250 0.3030 0.3000 11,760 0.3030 0.3000 43,866,338 0.3030 0.3000 40,082,121 0.3030 0.3000 602,314
Pattonville FPD General Revenue 129,929,220 0.9830 0.9830 1,100,230 0.3690 0.3690 484,894,043 0.9830 0.9830 156,447,921 0.9830 0.9830 7,585,656Ambulance 129,929,220 0.7000 0.7000 1,100,230 0.2710 0.2710 484,894,043 0.7000 0.7000 156,447,921 0.7000 0.7000 5,401,880Pension 129,929,220 0.1500 0.1500 1,100,230 0.0580 0.0580 484,894,043 0.1500 0.1500 156,447,921 0.1500 0.1500 1,157,545Dispatch 129,929,220 0.0500 0.0500 1,100,230 0.0190 0.0190 484,894,043 0.0500 0.0500 156,447,921 0.0500 0.0500 385,845Debt Service 129,929,220 0.1810 0.1810 1,100,230 0.1810 0.1810 484,894,043 0.1810 0.1810 156,447,921 0.1810 0.1810 1,397,992
Riverview FPD General Revenue 119,994,100 2.0000 2.0000 25,580 1.5149 1.5149 36,157,395 1.9394 1.9394 34,561,519 1.9837 1.9837 3,787,103Pension 119,994,100 0.2500 0.2500 25,580 0.2500 0.2500 36,157,395 0.2420 0.2420 34,561,519 0.2500 0.2500 473,954Dispatch 119,994,100 0.0500 0.0500 25,580 0.0000 0.0000 36,157,395 0.0490 0.0490 34,561,519 0.0500 0.0500 94,995Debt Service 119,994,100 0.1240 0.1240 25,580 0.1240 0.1240 36,157,395 0.1240 0.1240 34,561,519 0.1240 0.1240 236,516
Robertson FPD General Revenue 37,627,660 1.3548 1.3548 373,140 0.9790 0.9790 165,275,791 1.4099 1.3900 119,879,054 1.3900 1.3900 4,477,085Ambulance 37,627,660 0.6180 0.6180 373,140 0.4620 0.4620 165,275,791 0.6980 0.6980 119,879,054 0.7000 0.7000 2,227,041Pension 37,627,660 0.2000 0.2000 373,140 0.2000 0.2000 165,275,791 0.2000 0.2000 119,879,054 0.2000 0.2000 646,311Dispatch 37,627,660 0.0500 0.0500 373,140 0.0500 0.0500 165,275,791 0.0500 0.0500 119,879,054 0.0500 0.0500 161,578Debt Service 37,627,660 0.3750 0.2090 373,140 0.3750 0.2090 165,275,791 0.3750 0.2090 119,879,054 0.3750 0.2090 675,395
113
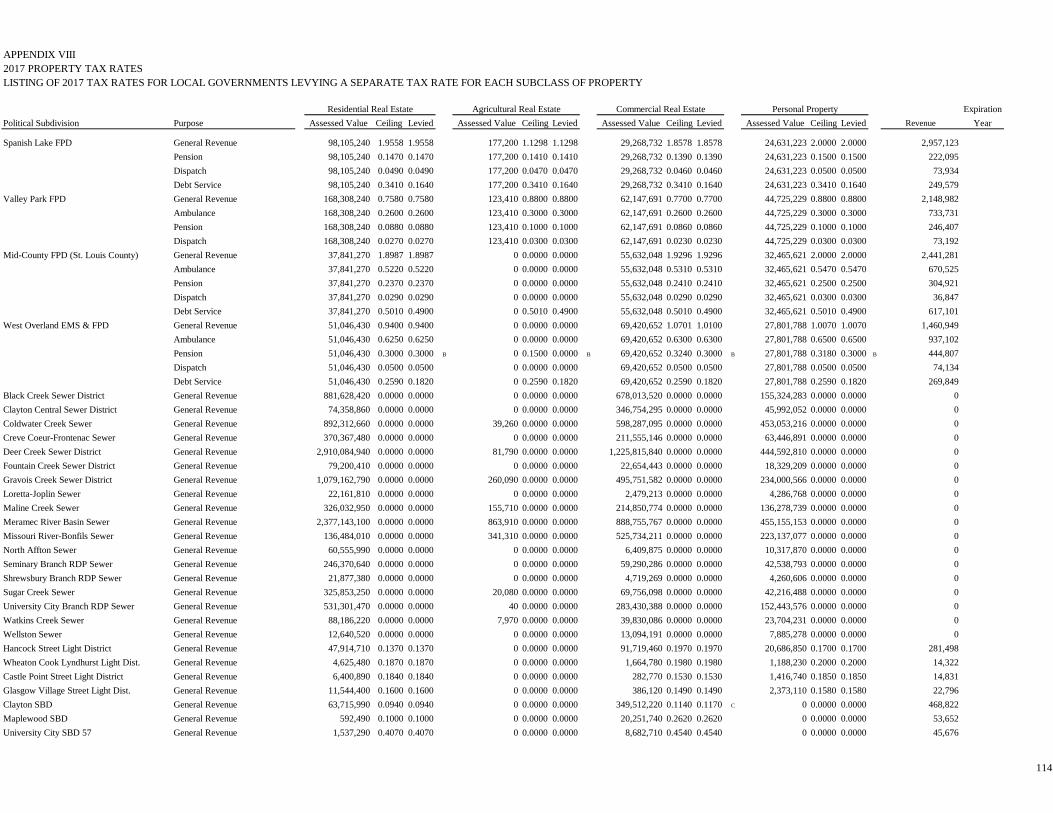
APPENDIX VIII2017 PROPERTY TAX RATESLISTING OF 2017 TAX RATES FOR LOCAL GOVERNMENTS LEVYING A SEPARATE TAX RATE FOR EACH SUBCLASS OF PROPERTY
Residential Real Estate Agricultural Real Estate Commercial Real Estate Personal Property ExpirationPolitical Subdivision Purpose Assessed Value Ceiling Levied Assessed Value Ceiling Levied Assessed Value Ceiling Levied Assessed Value Ceiling Levied Revenue Year
Spanish Lake FPD General Revenue 98,105,240 1.9558 1.9558 177,200 1.1298 1.1298 29,268,732 1.8578 1.8578 24,631,223 2.0000 2.0000 2,957,123Pension 98,105,240 0.1470 0.1470 177,200 0.1410 0.1410 29,268,732 0.1390 0.1390 24,631,223 0.1500 0.1500 222,095Dispatch 98,105,240 0.0490 0.0490 177,200 0.0470 0.0470 29,268,732 0.0460 0.0460 24,631,223 0.0500 0.0500 73,934Debt Service 98,105,240 0.3410 0.1640 177,200 0.3410 0.1640 29,268,732 0.3410 0.1640 24,631,223 0.3410 0.1640 249,579
Valley Park FPD General Revenue 168,308,240 0.7580 0.7580 123,410 0.8800 0.8800 62,147,691 0.7700 0.7700 44,725,229 0.8800 0.8800 2,148,982Ambulance 168,308,240 0.2600 0.2600 123,410 0.3000 0.3000 62,147,691 0.2600 0.2600 44,725,229 0.3000 0.3000 733,731Pension 168,308,240 0.0880 0.0880 123,410 0.1000 0.1000 62,147,691 0.0860 0.0860 44,725,229 0.1000 0.1000 246,407Dispatch 168,308,240 0.0270 0.0270 123,410 0.0300 0.0300 62,147,691 0.0230 0.0230 44,725,229 0.0300 0.0300 73,192
Mid-County FPD (St. Louis County) General Revenue 37,841,270 1.8987 1.8987 0 0.0000 0.0000 55,632,048 1.9296 1.9296 32,465,621 2.0000 2.0000 2,441,281Ambulance 37,841,270 0.5220 0.5220 0 0.0000 0.0000 55,632,048 0.5310 0.5310 32,465,621 0.5470 0.5470 670,525Pension 37,841,270 0.2370 0.2370 0 0.0000 0.0000 55,632,048 0.2410 0.2410 32,465,621 0.2500 0.2500 304,921Dispatch 37,841,270 0.0290 0.0290 0 0.0000 0.0000 55,632,048 0.0290 0.0290 32,465,621 0.0300 0.0300 36,847Debt Service 37,841,270 0.5010 0.4900 0 0.5010 0.4900 55,632,048 0.5010 0.4900 32,465,621 0.5010 0.4900 617,101
West Overland EMS & FPD General Revenue 51,046,430 0.9400 0.9400 0 0.0000 0.0000 69,420,652 1.0701 1.0100 27,801,788 1.0070 1.0070 1,460,949Ambulance 51,046,430 0.6250 0.6250 0 0.0000 0.0000 69,420,652 0.6300 0.6300 27,801,788 0.6500 0.6500 937,102Pension 51,046,430 0.3000 0.3000 B 0 0.1500 0.0000 B 69,420,652 0.3240 0.3000 B 27,801,788 0.3180 0.3000 B 444,807Dispatch 51,046,430 0.0500 0.0500 0 0.0000 0.0000 69,420,652 0.0500 0.0500 27,801,788 0.0500 0.0500 74,134Debt Service 51,046,430 0.2590 0.1820 0 0.2590 0.1820 69,420,652 0.2590 0.1820 27,801,788 0.2590 0.1820 269,849
Black Creek Sewer District General Revenue 881,628,420 0.0000 0.0000 0 0.0000 0.0000 678,013,520 0.0000 0.0000 155,324,283 0.0000 0.0000 0Clayton Central Sewer District General Revenue 74,358,860 0.0000 0.0000 0 0.0000 0.0000 346,754,295 0.0000 0.0000 45,992,052 0.0000 0.0000 0Coldwater Creek Sewer General Revenue 892,312,660 0.0000 0.0000 39,260 0.0000 0.0000 598,287,095 0.0000 0.0000 453,053,216 0.0000 0.0000 0Creve Coeur-Frontenac Sewer General Revenue 370,367,480 0.0000 0.0000 0 0.0000 0.0000 211,555,146 0.0000 0.0000 63,446,891 0.0000 0.0000 0Deer Creek Sewer District General Revenue 2,910,084,940 0.0000 0.0000 81,790 0.0000 0.0000 1,225,815,840 0.0000 0.0000 444,592,810 0.0000 0.0000 0Fountain Creek Sewer District General Revenue 79,200,410 0.0000 0.0000 0 0.0000 0.0000 22,654,443 0.0000 0.0000 18,329,209 0.0000 0.0000 0Gravois Creek Sewer District General Revenue 1,079,162,790 0.0000 0.0000 260,090 0.0000 0.0000 495,751,582 0.0000 0.0000 234,000,566 0.0000 0.0000 0Loretta-Joplin Sewer General Revenue 22,161,810 0.0000 0.0000 0 0.0000 0.0000 2,479,213 0.0000 0.0000 4,286,768 0.0000 0.0000 0Maline Creek Sewer General Revenue 326,032,950 0.0000 0.0000 155,710 0.0000 0.0000 214,850,774 0.0000 0.0000 136,278,739 0.0000 0.0000 0Meramec River Basin Sewer General Revenue 2,377,143,100 0.0000 0.0000 863,910 0.0000 0.0000 888,755,767 0.0000 0.0000 455,155,153 0.0000 0.0000 0Missouri River-Bonfils Sewer General Revenue 136,484,010 0.0000 0.0000 341,310 0.0000 0.0000 525,734,211 0.0000 0.0000 223,137,077 0.0000 0.0000 0North Affton Sewer General Revenue 60,555,990 0.0000 0.0000 0 0.0000 0.0000 6,409,875 0.0000 0.0000 10,317,870 0.0000 0.0000 0Seminary Branch RDP Sewer General Revenue 246,370,640 0.0000 0.0000 0 0.0000 0.0000 59,290,286 0.0000 0.0000 42,538,793 0.0000 0.0000 0Shrewsbury Branch RDP Sewer General Revenue 21,877,380 0.0000 0.0000 0 0.0000 0.0000 4,719,269 0.0000 0.0000 4,260,606 0.0000 0.0000 0Sugar Creek Sewer General Revenue 325,853,250 0.0000 0.0000 20,080 0.0000 0.0000 69,756,098 0.0000 0.0000 42,216,488 0.0000 0.0000 0University City Branch RDP Sewer General Revenue 531,301,470 0.0000 0.0000 40 0.0000 0.0000 283,430,388 0.0000 0.0000 152,443,576 0.0000 0.0000 0Watkins Creek Sewer General Revenue 88,186,220 0.0000 0.0000 7,970 0.0000 0.0000 39,830,086 0.0000 0.0000 23,704,231 0.0000 0.0000 0Wellston Sewer General Revenue 12,640,520 0.0000 0.0000 0 0.0000 0.0000 13,094,191 0.0000 0.0000 7,885,278 0.0000 0.0000 0Hancock Street Light District General Revenue 47,914,710 0.1370 0.1370 0 0.0000 0.0000 91,719,460 0.1970 0.1970 20,686,850 0.1700 0.1700 281,498Wheaton Cook Lyndhurst Light Dist. General Revenue 4,625,480 0.1870 0.1870 0 0.0000 0.0000 1,664,780 0.1980 0.1980 1,188,230 0.2000 0.2000 14,322Castle Point Street Light District General Revenue 6,400,890 0.1840 0.1840 0 0.0000 0.0000 282,770 0.1530 0.1530 1,416,740 0.1850 0.1850 14,831Glasgow Village Street Light Dist. General Revenue 11,544,400 0.1600 0.1600 0 0.0000 0.0000 386,120 0.1490 0.1490 2,373,110 0.1580 0.1580 22,796Clayton SBD General Revenue 63,715,990 0.0940 0.0940 0 0.0000 0.0000 349,512,220 0.1140 0.1170 C 0 0.0000 0.0000 468,822Maplewood SBD General Revenue 592,490 0.1000 0.1000 0 0.0000 0.0000 20,251,740 0.2620 0.2620 0 0.0000 0.0000 53,652University City SBD 57 General Revenue 1,537,290 0.4070 0.4070 0 0.0000 0.0000 8,682,710 0.4540 0.4540 0 0.0000 0.0000 45,676
114
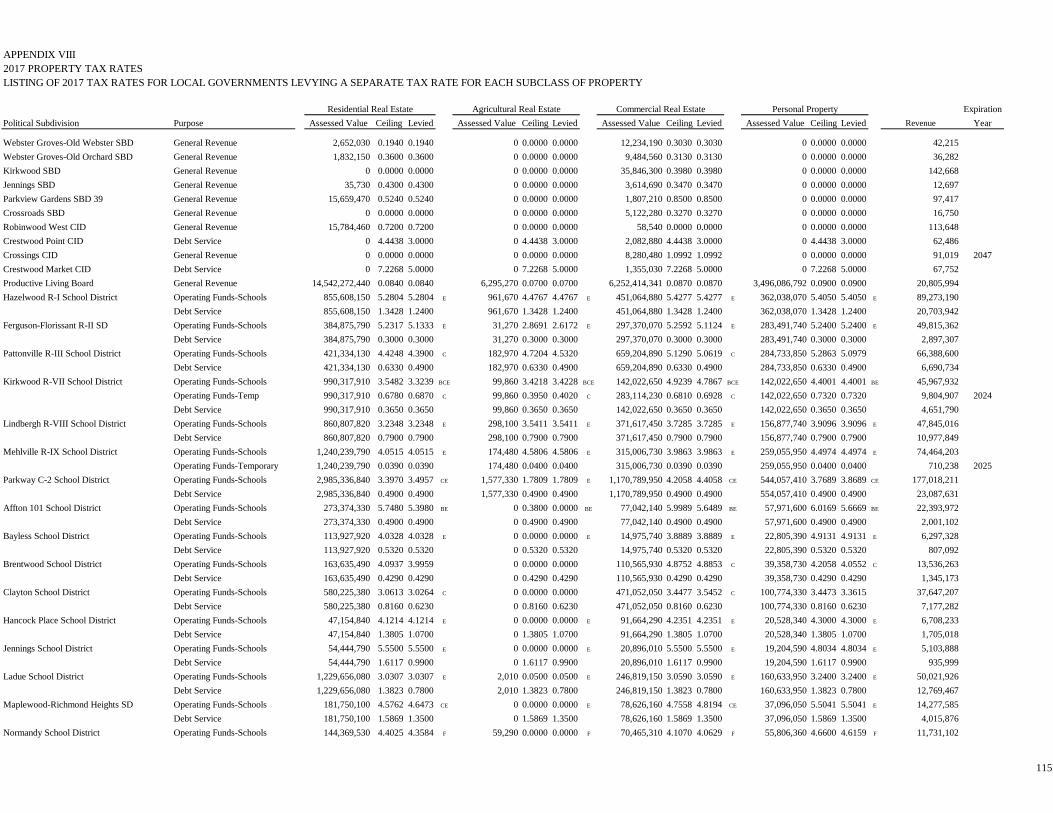
APPENDIX VIII2017 PROPERTY TAX RATESLISTING OF 2017 TAX RATES FOR LOCAL GOVERNMENTS LEVYING A SEPARATE TAX RATE FOR EACH SUBCLASS OF PROPERTY
Residential Real Estate Agricultural Real Estate Commercial Real Estate Personal Property ExpirationPolitical Subdivision Purpose Assessed Value Ceiling Levied Assessed Value Ceiling Levied Assessed Value Ceiling Levied Assessed Value Ceiling Levied Revenue Year
Webster Groves-Old Webster SBD General Revenue 2,652,030 0.1940 0.1940 0 0.0000 0.0000 12,234,190 0.3030 0.3030 0 0.0000 0.0000 42,215Webster Groves-Old Orchard SBD General Revenue 1,832,150 0.3600 0.3600 0 0.0000 0.0000 9,484,560 0.3130 0.3130 0 0.0000 0.0000 36,282Kirkwood SBD General Revenue 0 0.0000 0.0000 0 0.0000 0.0000 35,846,300 0.3980 0.3980 0 0.0000 0.0000 142,668Jennings SBD General Revenue 35,730 0.4300 0.4300 0 0.0000 0.0000 3,614,690 0.3470 0.3470 0 0.0000 0.0000 12,697Parkview Gardens SBD 39 General Revenue 15,659,470 0.5240 0.5240 0 0.0000 0.0000 1,807,210 0.8500 0.8500 0 0.0000 0.0000 97,417Crossroads SBD General Revenue 0 0.0000 0.0000 0 0.0000 0.0000 5,122,280 0.3270 0.3270 0 0.0000 0.0000 16,750Robinwood West CID General Revenue 15,784,460 0.7200 0.7200 0 0.0000 0.0000 58,540 0.0000 0.0000 0 0.0000 0.0000 113,648Crestwood Point CID Debt Service 0 4.4438 3.0000 0 4.4438 3.0000 2,082,880 4.4438 3.0000 0 4.4438 3.0000 62,486Crossings CID General Revenue 0 0.0000 0.0000 0 0.0000 0.0000 8,280,480 1.0992 1.0992 0 0.0000 0.0000 91,019 2047Crestwood Market CID Debt Service 0 7.2268 5.0000 0 7.2268 5.0000 1,355,030 7.2268 5.0000 0 7.2268 5.0000 67,752Productive Living Board General Revenue 14,542,272,440 0.0840 0.0840 6,295,270 0.0700 0.0700 6,252,414,341 0.0870 0.0870 3,496,086,792 0.0900 0.0900 20,805,994Hazelwood R-I School District Operating Funds-Schools 855,608,150 5.2804 5.2804 E 961,670 4.4767 4.4767 E 451,064,880 5.4277 5.4277 E 362,038,070 5.4050 5.4050 E 89,273,190
Debt Service 855,608,150 1.3428 1.2400 961,670 1.3428 1.2400 451,064,880 1.3428 1.2400 362,038,070 1.3428 1.2400 20,703,942Ferguson-Florissant R-II SD Operating Funds-Schools 384,875,790 5.2317 5.1333 E 31,270 2.8691 2.6172 E 297,370,070 5.2592 5.1124 E 283,491,740 5.2400 5.2400 E 49,815,362
Debt Service 384,875,790 0.3000 0.3000 31,270 0.3000 0.3000 297,370,070 0.3000 0.3000 283,491,740 0.3000 0.3000 2,897,307Pattonville R-III School District Operating Funds-Schools 421,334,130 4.4248 4.3900 C 182,970 4.7204 4.5320 659,204,890 5.1290 5.0619 C 284,733,850 5.2863 5.0979 66,388,600
Debt Service 421,334,130 0.6330 0.4900 182,970 0.6330 0.4900 659,204,890 0.6330 0.4900 284,733,850 0.6330 0.4900 6,690,734Kirkwood R-VII School District Operating Funds-Schools 990,317,910 3.5482 3.3239 BCE 99,860 3.4218 3.4228 BCE 142,022,650 4.9239 4.7867 BCE 142,022,650 4.4001 4.4001 BE 45,967,932
Operating Funds-Temp 990,317,910 0.6780 0.6870 C 99,860 0.3950 0.4020 C 283,114,230 0.6810 0.6928 C 142,022,650 0.7320 0.7320 9,804,907 2024Debt Service 990,317,910 0.3650 0.3650 99,860 0.3650 0.3650 142,022,650 0.3650 0.3650 142,022,650 0.3650 0.3650 4,651,790
Lindbergh R-VIII School District Operating Funds-Schools 860,807,820 3.2348 3.2348 E 298,100 3.5411 3.5411 E 371,617,450 3.7285 3.7285 E 156,877,740 3.9096 3.9096 E 47,845,016Debt Service 860,807,820 0.7900 0.7900 298,100 0.7900 0.7900 371,617,450 0.7900 0.7900 156,877,740 0.7900 0.7900 10,977,849
Mehlville R-IX School District Operating Funds-Schools 1,240,239,790 4.0515 4.0515 E 174,480 4.5806 4.5806 E 315,006,730 3.9863 3.9863 E 259,055,950 4.4974 4.4974 E 74,464,203Operating Funds-Temporary 1,240,239,790 0.0390 0.0390 174,480 0.0400 0.0400 315,006,730 0.0390 0.0390 259,055,950 0.0400 0.0400 710,238 2025
Parkway C-2 School District Operating Funds-Schools 2,985,336,840 3.3970 3.4957 CE 1,577,330 1.7809 1.7809 E 1,170,789,950 4.2058 4.4058 CE 544,057,410 3.7689 3.8689 CE 177,018,211Debt Service 2,985,336,840 0.4900 0.4900 1,577,330 0.4900 0.4900 1,170,789,950 0.4900 0.4900 554,057,410 0.4900 0.4900 23,087,631
Affton 101 School District Operating Funds-Schools 273,374,330 5.7480 5.3980 BE 0 0.3800 0.0000 BE 77,042,140 5.9989 5.6489 BE 57,971,600 6.0169 5.6669 BE 22,393,972Debt Service 273,374,330 0.4900 0.4900 0 0.4900 0.4900 77,042,140 0.4900 0.4900 57,971,600 0.4900 0.4900 2,001,102
Bayless School District Operating Funds-Schools 113,927,920 4.0328 4.0328 E 0 0.0000 0.0000 E 14,975,740 3.8889 3.8889 E 22,805,390 4.9131 4.9131 E 6,297,328Debt Service 113,927,920 0.5320 0.5320 0 0.5320 0.5320 14,975,740 0.5320 0.5320 22,805,390 0.5320 0.5320 807,092
Brentwood School District Operating Funds-Schools 163,635,490 4.0937 3.9959 0 0.0000 0.0000 110,565,930 4.8752 4.8853 C 39,358,730 4.2058 4.0552 C 13,536,263Debt Service 163,635,490 0.4290 0.4290 0 0.4290 0.4290 110,565,930 0.4290 0.4290 39,358,730 0.4290 0.4290 1,345,173
Clayton School District Operating Funds-Schools 580,225,380 3.0613 3.0264 C 0 0.0000 0.0000 471,052,050 3.4477 3.5452 C 100,774,330 3.4473 3.3615 37,647,207Debt Service 580,225,380 0.8160 0.6230 0 0.8160 0.6230 471,052,050 0.8160 0.6230 100,774,330 0.8160 0.6230 7,177,282
Hancock Place School District Operating Funds-Schools 47,154,840 4.1214 4.1214 E 0 0.0000 0.0000 E 91,664,290 4.2351 4.2351 E 20,528,340 4.3000 4.3000 E 6,708,233Debt Service 47,154,840 1.3805 1.0700 0 1.3805 1.0700 91,664,290 1.3805 1.0700 20,528,340 1.3805 1.0700 1,705,018
Jennings School District Operating Funds-Schools 54,444,790 5.5500 5.5500 E 0 0.0000 0.0000 E 20,896,010 5.5500 5.5500 E 19,204,590 4.8034 4.8034 E 5,103,888Debt Service 54,444,790 1.6117 0.9900 0 1.6117 0.9900 20,896,010 1.6117 0.9900 19,204,590 1.6117 0.9900 935,999
Ladue School District Operating Funds-Schools 1,229,656,080 3.0307 3.0307 E 2,010 0.0500 0.0500 E 246,819,150 3.0590 3.0590 E 160,633,950 3.2400 3.2400 E 50,021,926Debt Service 1,229,656,080 1.3823 0.7800 2,010 1.3823 0.7800 246,819,150 1.3823 0.7800 160,633,950 1.3823 0.7800 12,769,467
Maplewood-Richmond Heights SD Operating Funds-Schools 181,750,100 4.5762 4.6473 CE 0 0.0000 0.0000 E 78,626,160 4.7558 4.8194 CE 37,096,050 5.5041 5.5041 E 14,277,585Debt Service 181,750,100 1.5869 1.3500 0 1.5869 1.3500 78,626,160 1.5869 1.3500 37,096,050 1.5869 1.3500 4,015,876
Normandy School District Operating Funds-Schools 144,369,530 4.4025 4.3584 F 59,290 0.0000 0.0000 F 70,465,310 4.1070 4.0629 F 55,806,360 4.6600 4.6159 F 11,731,102
115
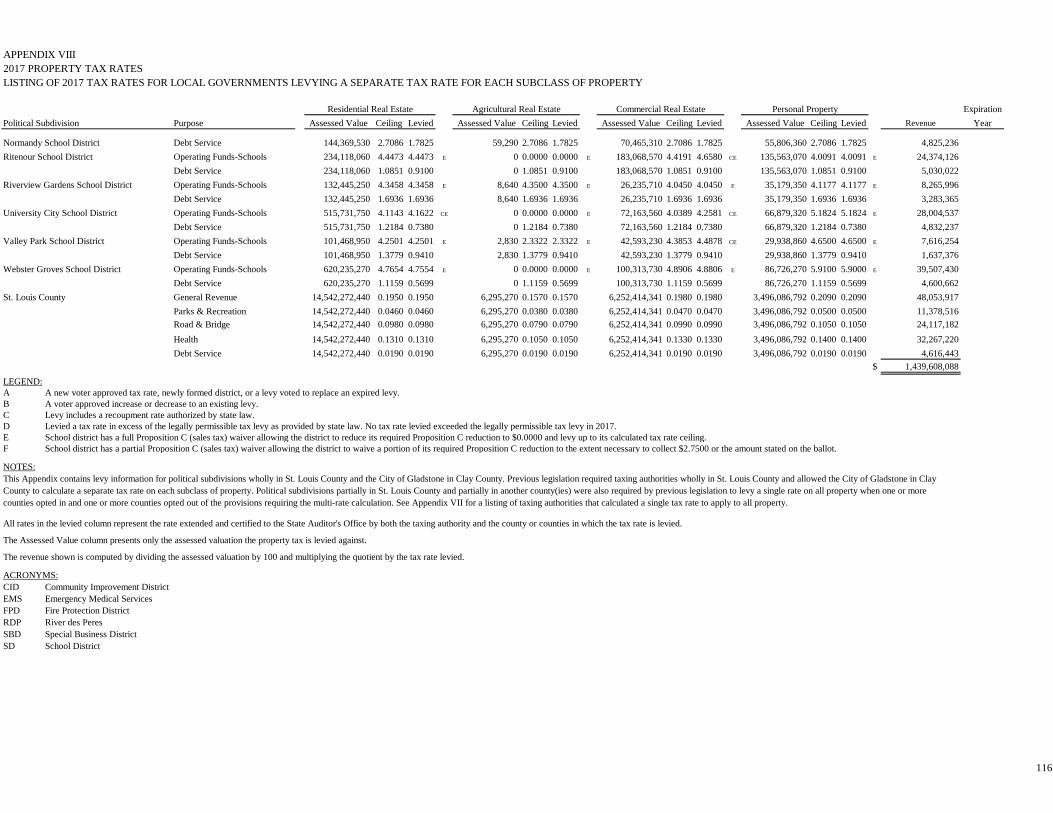
APPENDIX VIII2017 PROPERTY TAX RATESLISTING OF 2017 TAX RATES FOR LOCAL GOVERNMENTS LEVYING A SEPARATE TAX RATE FOR EACH SUBCLASS OF PROPERTY
Residential Real Estate Agricultural Real Estate Commercial Real Estate Personal Property ExpirationPolitical Subdivision Purpose Assessed Value Ceiling Levied Assessed Value Ceiling Levied Assessed Value Ceiling Levied Assessed Value Ceiling Levied Revenue Year
Normandy School District Debt Service 144,369,530 2.7086 1.7825 59,290 2.7086 1.7825 70,465,310 2.7086 1.7825 55,806,360 2.7086 1.7825 4,825,236Ritenour School District Operating Funds-Schools 234,118,060 4.4473 4.4473 E 0 0.0000 0.0000 E 183,068,570 4.4191 4.6580 CE 135,563,070 4.0091 4.0091 E 24,374,126
Debt Service 234,118,060 1.0851 0.9100 0 1.0851 0.9100 183,068,570 1.0851 0.9100 135,563,070 1.0851 0.9100 5,030,022Riverview Gardens School District Operating Funds-Schools 132,445,250 4.3458 4.3458 E 8,640 4.3500 4.3500 E 26,235,710 4.0450 4.0450 E 35,179,350 4.1177 4.1177 E 8,265,996
Debt Service 132,445,250 1.6936 1.6936 8,640 1.6936 1.6936 26,235,710 1.6936 1.6936 35,179,350 1.6936 1.6936 3,283,365University City School District Operating Funds-Schools 515,731,750 4.1143 4.1622 CE 0 0.0000 0.0000 E 72,163,560 4.0389 4.2581 CE 66,879,320 5.1824 5.1824 E 28,004,537
Debt Service 515,731,750 1.2184 0.7380 0 1.2184 0.7380 72,163,560 1.2184 0.7380 66,879,320 1.2184 0.7380 4,832,237Valley Park School District Operating Funds-Schools 101,468,950 4.2501 4.2501 E 2,830 2.3322 2.3322 E 42,593,230 4.3853 4.4878 CE 29,938,860 4.6500 4.6500 E 7,616,254
Debt Service 101,468,950 1.3779 0.9410 2,830 1.3779 0.9410 42,593,230 1.3779 0.9410 29,938,860 1.3779 0.9410 1,637,376Webster Groves School District Operating Funds-Schools 620,235,270 4.7654 4.7554 E 0 0.0000 0.0000 E 100,313,730 4.8906 4.8806 E 86,726,270 5.9100 5.9000 E 39,507,430
Debt Service 620,235,270 1.1159 0.5699 0 1.1159 0.5699 100,313,730 1.1159 0.5699 86,726,270 1.1159 0.5699 4,600,662St. Louis County General Revenue 14,542,272,440 0.1950 0.1950 6,295,270 0.1570 0.1570 6,252,414,341 0.1980 0.1980 3,496,086,792 0.2090 0.2090 48,053,917
Parks & Recreation 14,542,272,440 0.0460 0.0460 6,295,270 0.0380 0.0380 6,252,414,341 0.0470 0.0470 3,496,086,792 0.0500 0.0500 11,378,516Road & Bridge 14,542,272,440 0.0980 0.0980 6,295,270 0.0790 0.0790 6,252,414,341 0.0990 0.0990 3,496,086,792 0.1050 0.1050 24,117,182Health 14,542,272,440 0.1310 0.1310 6,295,270 0.1050 0.1050 6,252,414,341 0.1330 0.1330 3,496,086,792 0.1400 0.1400 32,267,220Debt Service 14,542,272,440 0.0190 0.0190 6,295,270 0.0190 0.0190 6,252,414,341 0.0190 0.0190 3,496,086,792 0.0190 0.0190 4,616,443
$ 1,439,608,088LEGEND:A A new voter approved tax rate, newly formed district, or a levy voted to replace an expired levy.B A voter approved increase or decrease to an existing levy.C Levy includes a recoupment rate authorized by state law.D Levied a tax rate in excess of the legally permissible tax levy as provided by state law. No tax rate levied exceeded the legally permissible tax levy in 2017.E School district has a full Proposition C (sales tax) waiver allowing the district to reduce its required Proposition C reduction to $0.0000 and levy up to its calculated tax rate ceiling.F School district has a partial Proposition C (sales tax) waiver allowing the district to waive a portion of its required Proposition C reduction to the extent necessary to collect $2.7500 or the amount stated on the ballot.
NOTES:
All rates in the levied column represent the rate extended and certified to the State Auditor's Office by both the taxing authority and the county or counties in which the tax rate is levied.
The Assessed Value column presents only the assessed valuation the property tax is levied against.
The revenue shown is computed by dividing the assessed valuation by 100 and multiplying the quotient by the tax rate levied.
ACRONYMS:CID Community Improvement DistrictEMS Emergency Medical ServicesFPD Fire Protection DistrictRDP River des PeresSBD Special Business DistrictSD School District
This Appendix contains levy information for political subdivisions wholly in St. Louis County and the City of Gladstone in Clay County. Previous legislation required taxing authorities wholly in St. Louis County and allowed the City of Gladstone in Clay County to calculate a separate tax rate on each subclass of property. Political subdivisions partially in St. Louis County and partially in another county(ies) were also required by previous legislation to levy a single rate on all property when one or more counties opted in and one or more counties opted out of the provisions requiring the multi-rate calculation. See Appendix VII for a listing of taxing authorities that calculated a single tax rate to apply to all property.
116