Embed Size (px)
Citation preview

Oklahoma State University Waste Stream Analysis
Spring 2017
Caleb Anthony, Destiny Barker, Kevin Courtney, Thomas Spadea, Dusti Thompson

1
Contents
Literature Review…………………………………………………………………. 2
Introduction………………………………………………………………………... 5
Recycling Research………………………………………………………………… 5
OSU-Stillwater……………………………………………………………… 5
Oklahoma City……………………………………………………………… 6
Tulsa………………………………………………………………………… 8
Stillwater……………………………………………………………………. 9
University of Oklahoma…………………………………………………….. 9
Pepperdine University………………………………………………………. 10
Methods and Materials……………………………………………………………. 11
Results………………………………………………………………………………. 12
Classroom Building North…………………………………………………... 12
Family and Graduate Student Housing………………………………………. 14
Agricultural Hall……………………………………………………………... 16
Student Union………………………………………………………………… 18
Henry Bellmon Research Center……………………………………………… 20
Kamm-Peterson-Friend Residence Halls……………………………………… 22
All six buildings together……………………………………………………… 24
Discussion and Recommendations………………………………………………….. 26
References……………………………………………………………………………. 30
Appendix A—Categories…………………………………………………………… 32
Appendix B—Waste Audit Pictures………………………………………………. 34

2
Literature Review
Solid waste, as an irrefutable fact, follows human colonization wherever it goes. Since humans
ceased their nomadic tendencies and began stationary civilization, solid waste has been an issue.
Early civilizations did not have an effective system to rid themselves of their waste and simply
threw it in the floor. In Troy during the times of the Ancient Greek, things like bones, food
waste, and broken pottery would be thrown in the floor of their dwellings. Once the smell
became intolerable, a fresh load of soil would be brought in to cover the waste, and the process
would continue for centuries (BASD, 2017). Once the pile-up of waste and soil became too high,
instead of removing the rubbish, the roofs and doorways of the house would be altered to
accommodate for the new height of the floor (Sustaining Our World, 2017).
Humans have come a long way since the times of Ancient Greece. We now have a
sophisticated waste system that involves disposing the waste in landfills. Most of these landfills
are periodically covered with layers of soil, similar to the tactics of the Ancient Greeks. There is
some concern, though, about whether or not landfills will continue to be sustainable with the
increasing human population. The average American currently produces about 4.3 pounds of
waste per day. This means the average American produces their weight (180 lbs) in waste every
6 weeks, which also means the average American produces over twice as much waste than
people in other developed countries (Thompson, 2012). In total, Americans produce as much as
258 million tons of waste each year. 258 million tons equates to over 707 empire state buildings.
About 134.1 million tons (52%) of this waste finds its way to landfills, 90.4 million tons (35%) is
recycled, and 33.5 million tons (13%) is burned to produce energy (Payne, 2017). According to
the Environmental Protection Agency (EPA), about 52% of municipal solid waste (MSW) could

3
be recycled and 28% is made of organic matter such as food, yard trimmings and wood. This
organic matter is material that could be composted and used by farmers (EPA, 2017).
Organic matter in landfills is problematic. Under normal conditions, organic matter
decomposes because the conditions are aerobic, which means there is enough oxygen to sustain
the bacteria that break down the matter. In landfills, there is not enough time for the organic
matter to break down before more garbage is put on top of it. Soil is also periodically layered on
top of most landfills, and this creates anaerobic conditions, or conditions that do not have the
amount of oxygen necessary for the decomposition of organic matter. This buildup of organic
matter leads to an increase in the production of methane, one of the major greenhouse gases
responsible for climate change. According to the EPA, almost 18% of all methane produced in
the United States comes from landfills. This amount of methane is equivalent to 110 million US
tons of carbon being released into the atmosphere (Piccirilli Dorsey, Inc., 2017).
Advantages of recycling include a reduction in the need for raw materials, or materials
that have not been processed. This ensures the sustainability of natural resources for future
generations and decreases the amount of stress put on the environment required to produce those
materials. Recycling also decreases the energy needed to manufacture goods. This includes a
reduction in transportation, machine operations, and human energy used to gather the raw
materials (EPA, 2017). Jobs are also created with the implementation of recycling. For every
10,000 tons of waste that is dumped into landfills, 6 jobs are created. For the same amount of
waste that is recycled, 36 jobs are created. If the US implements a 75% recycling rate by 2020,
this would create 1.1 million new jobs (Bailey, 2017). As the world population increases, the
amount of space needed for things like housing development and agriculture also increases.
Recycling decreases the amount of space needed for landfills so that area can be utilized in more

4
important ways (Conserve Energy Future, 2017). Recycling is preferred over both simple
incineration, which turns the waste into ash and heat, and waste-to-energy incineration, which
turns the waste into heat that can be produced into energy. This is because both forms of
incineration produce gases that are more harmful to the environment and can be avoided by
recycling (EPA, 2017).
Recycling is also met by some challenges. For instance, recycling is not always the most
cost effective option. Between the cost of building a new facility, purchasing special trucks for
transportation, and the cost of transportation, it is difficult to make money. Sometimes products
made from recycled materials are not always the most durable. This is because when products
are made from recycled materials, the material used is pulled from a large pile. This could
include materials that have been over-used and no longer have the quality of raw materials
(Conserve Energy Future, 2017). It is also sometimes cheaper to make products from raw
materials than to produce them from recycled substances. This happens to be the case for
producing some plastics because the compounds used to make plastic are made during the
process of refining crude oil into gas (American Chemistry Council, 2015). Because so much of
the compound is already produced, it is cheaper to use the raw materials than to go through the
recycling process. One of the most hindering challenges of recycling is that it requires extra
effort from the person recycling (Conserve Energy Future, 2017). Products usually have to be
clean, which requires washing before disposal. Recycling also requires conscious effort to be
placed in the proper bin, an act most people are disinterested in performing because it is much
easier to throw away everything into one place instead of 2 or 3. Because of these challenges,
recycling may not be the most economical process used to make products, but it is the most
sensible decision when considering the sustainability of the earth for future generations.

5
Abstract
Replicating the 2013 waste audit performed by Bhuvana Kandula and OSU sustainability, this
capstone group audited the trash for a single day, from a variety of dumpsters on the OSU
campus. Percentage weight and volume were measured and compared to the 2013 audit. Results
were analyzed to recommend potential areas of improvement for OSU recycling.
Introduction
In spring 2013, a civil engineering graduate student conducted the first waste audit of the OSU
Stillwater campus. Six buildings were audited on campus, the purpose of using these buildings
was to include dining, offices, classrooms, laboratories, residential, and a combination of two or
more. Six bags were taken from each building’s dumpster the day before a normal trash
collection. The 36 bags were then sorted into 21 categories and weighed. Recommendations
from the 2013 waste audit included the implementation of composting due to the high amount of
food waste, the reduction of single use material, such as drinking cups and paper towels,
education, and the implementation of a more intense recycling program on campus.
Summary of Intent: The intent of this paper is to give an account of the 2017 OSU waste audit,
compare the data from the 2017 and 2013 waste audits, and make recommendations to further
OSU’s ambition of being a greener campus.
Research
To achieve the goal of becoming a greener campus, we must compare OSU Stillwater’s
recycling and waste protocols with other universities and municipalities. This comparison is to
evaluate where OSU Stillwater can improve and what makes other universities and

6
municipalities successful. Below are recycling and waste procedure descriptions for OSU
Stillwater, OU Norman, Stillwater, Oklahoma City, and Tulsa.
OSU Stillwater:
OSU Stillwater has two recycling programs on campus: OSU Recycles and Res Life Recycles.
OSU recycles is implemented in classroom buildings, dining areas, and outside walking paths.
Res Life Recycles is implemented in student housing buildings on campus. OSU recycles takes
recyclable paper* and cardboard in one bin, and plastic bottles and aluminum cans in another
bin. Res Life Recycles takes recyclable paper, cardboard, clean food cans, and plastics #1-5, all
single stream*. Paper and cardboard recycled through OSU Recycles is baled and sold to the
highest bidder. Plastic bottles and aluminum cans are taken away by Oklahoma City Waste
Management. Recycling from Res Life Recycles is taken to Supporting Community Lifestyles in
Stillwater, and sorted there.
Since the 2013 waste audit, the university has tried to reduce the amount of organic waste by
composting lawn waste and pre consumer food waste, such as coffee grounds and produce
scraps. Lawn waste is used as mulch or is sold outside of the university to be used as mulch or
composting. The pre consumer food waste is given to local farmers to be composted and used on
their land.
The OSU Stillwater Recycling Department has not conducted a full scale cost/benefit analysis,
but it is estimated the program is breaking even. Collecting recyclables does not cost the
university any more than if the recyclables were to be sent with the trash to the landfill. The
department is mostly paid for by the savings created by diverting recycling from landfills, and
the profit on the cardboard, paper, and scrap metals that are sold.

7
Oklahoma City Recycling:
Average diversion rates are 692 US Tons and include 369 of Newspaper and 206 US Tons of
Glass, which are the largest amounts. Total recyclable material is 8,307 US tons that was
diverted from the landfill.
Fiscal Year 2016 - Waste Management
Average residential rates were 27% based on the average times recycling bins were set out taken
from the total number of homes enrolled in the recycling program.
Fiscal Year 2016 - Waste Management

8
Based on the amount of recycling material collected from the amount of total trash collected 4%
of residential refuse was diverted from the landfill. This includes bulky waste as well as recycled
material collected from the drop-off facility.
Fiscal Year 2016 - Waste Management
Tulsa Recycling:
City of Tulsa recycling collection was 21% based on amount of residential recycling collected
from the amount of residential refuse collected. The participation rate was 30% taken from the
set-out rate and the total number of households enrolled in the recycling program. This does not
include bulky refuse or recycling collected.
Residential Refuse – 101,914 US Tons
Residential Recycling – 20,903 US Tons (Tulsa Residential Trash and Recycling Center – TRT)
Calendar year 2016 – Tulsa City of Streets and Stormwater Dept.
Tulsa Area Recycling – (Metropolitan Environmental Trust – MET)

9
MET total collection broken down by type of material collected.
Metropolitan Environmental Trust 2016
Graphically, the data broken down by type and amount reveals the majority of recycling material
collected was 2.7 million pounds (1,225 metric tons) of Paper/Cardboard and 1.1 million pounds
(454 metric tons) of Glass.
Metropolitan Environmental Trust 2016
Stillwater Recycling:
The City of Stillwater recycling service diverted 16% from the landfill and had a 57%
participation rate from residential collection. It also included a 6% diversion rate with a 7%
participation rate.
Residential Refuse – 8,578 US Tons
Residential Recycling – 118 US Tons
City of Stillwater – Fiscal Year 2016

10
University of Oklahoma:
The University of Oklahoma has an energy program called Crimson and Green. Oklahoma has
taken many steps to become a climate neutral university. Their recycling program has a distinct
advantage over the Oklahoma State program that, if implemented at OSU, would likely improve
our recycling efforts. This advantage is the clear, and easy to understand, labeling of their
recycling bins. Their recycling bins are clearly labeled with the type of materials that you can
throw into them. They do not look as aesthetically appealing as OSU’s bins, but the functionality
seems to outweigh the external appeal. Many students we have spoken with report just throwing
away their recyclables because it was too time consuming to determine which bins they could
throw their trash into (Oklahoma).
Pepperdine University:
Pepperdine University has a recycling program that is recognized nationwide. Perhaps the
greatest benefit they have with their recycling efforts is all recyclables are to be thrown in a
single bin. Pepperdine then pays a vendor to come pick the recyclables up and sort them
offsite. The cost for this may be more than the current Oklahoma State system, but the amount
of waste taken to landfills could be significantly reduced. Pepperdine claims to divert 80 percent
of its waste from landfills (Pepperdine). They are able to do this because they use one bin that
makes it easy for the average person to discard those things they know to be recyclable without
wasting time and eventually giving up because they cannot figure out which bin to throw their
recyclables into.
The main point we are getting at with improving the recycling efforts at OSU is to make it
easier for the consumer to recycle. Whether that be with clearer bins, or having everything be

11
thrown into one bin which is sorted somewhere else instead of by the consumer. Making it
easier to recycle is the key to reducing the amount of waste that the university produces.
Methods and Materials
The 2017 waste stream audit was very similar to the 2013 audit. Six trash bags were collected
from the same dumpsters at the same six buildings as the 2013 audit. The six different buildings
were the Student Union, Classroom Building North, Physical Sciences (Henry Bellmon Research
Center side), Ag Hall, Kamm-Peterson Friend residence hall and Family/Graduate student
housing.
The bags were collected on Thursday, February 23rd, and held at the OSU recycling center until
Saturday when the waste audit was done. Before the audit was done everyone received an
Environmental Health and Safety training by personnel from EHS personnel. The audit was
performed by members of the OSU facilities management sustainability department, the OSU
Environmental Science Club, the SGA Sustainability Committee, as well as this capstone
group. The recycling was sorted into the same 21 categories as in 2013 (See Appendix A for
categories). All of trash was sorted into their respective categories, and any recyclable materials
were taken by OSU Recycling.
The percentage weight for each category was determined by subtracting the weight of the liner
and bucket from the tared weight and dividing by the total weight of all 6 bags for that
building. We also measured volume in each category by estimating how much of a 5 gallon
bucket the waste occupied. The percent weight and volume allowed us to assess how much
waste could have been recycled and give us a clue as to what methods would be most effective in
terms of increasing diversion from landfill rate for each building as well as OSU in general.

12
Results
Classroom Building North (CLBN):
A total of 58.3 lbs and 100 gal was sorted from Classroom Building North. The largest
percentages of weight were taken up by food waste at 33.6% and non-recyclable paper at 12.5%.
Plastic bags/film was a significant category taking up 11.8% of the weight and 15.0% of the
volume. Corrugated Cardboard and Plastics #3-6 were both significant as they accounted for
15.5% and 12.0% of the volume respectively.
Figure 1: Pie chart representing the percentage of weight in each category for Classroom Building North.
Figure 2: Pie chart representing the percentage of volume in each category for Classroom Building North.
Non- Recyclable Paper
Food Waste/Organics
Plastic Bags
Corrugated Cardboard
Plastics #3-6
Plastic Bags

13
Waste Category
Weight (lbs)
Volume (gal)
% Total Weight
% Total Volume
White Paper (clean, dry) 0.1 1 0.2 1.0
Colored Paper 0.2 0.5 0.3 0.5
Newspapers, Magazines 0.2 3.5 0.3 3.5
Non-Recyclable Paper 7.3 7.5 12.5 7.5
Paperboard/Chipboard 1.1 4 1.9 4.0
Plastics #1 and #2 3.5 10.5 6.0 10.5
Plastics #3-#6 2.6 12 4.5 12.0
#7 Plastic and PLA 1 4.5 1.7 4.5
Plastic Bags/Film 6.9 15 11.8 15.0 Styrofoam
0.2
4.5
0.3
4.5
Other Plastics 1 4 1.7 4.0
Glass 1.7 0.5 2.9 0.5
Aluminum 2.7 4 4.6 4.0
Metals (non-aluminum) 0.1 0.1 0.2 0.1
Drink Boxes (Milk Cartons) 0.2 1.5 0.3 1.5
Corrugated Cardboard 6.5 15.5 11.2 15.5
Food Waste/ Organics 19.6 6.5 33.6 6.5
Batteries 0 0 0.0 0.0
Trash 3.4 5 5.8 5.0
Other (very out of place) 0 0 0.0 0.0
Hazardous Materials 0 0 0.0 0.0
Total 58.3 100.1 100 100
Table 1: Data Table showing weight and volume distribution for each category in Classroom Building North. Top in weight is yellow, top in volume is blue, and top in both is green.
14
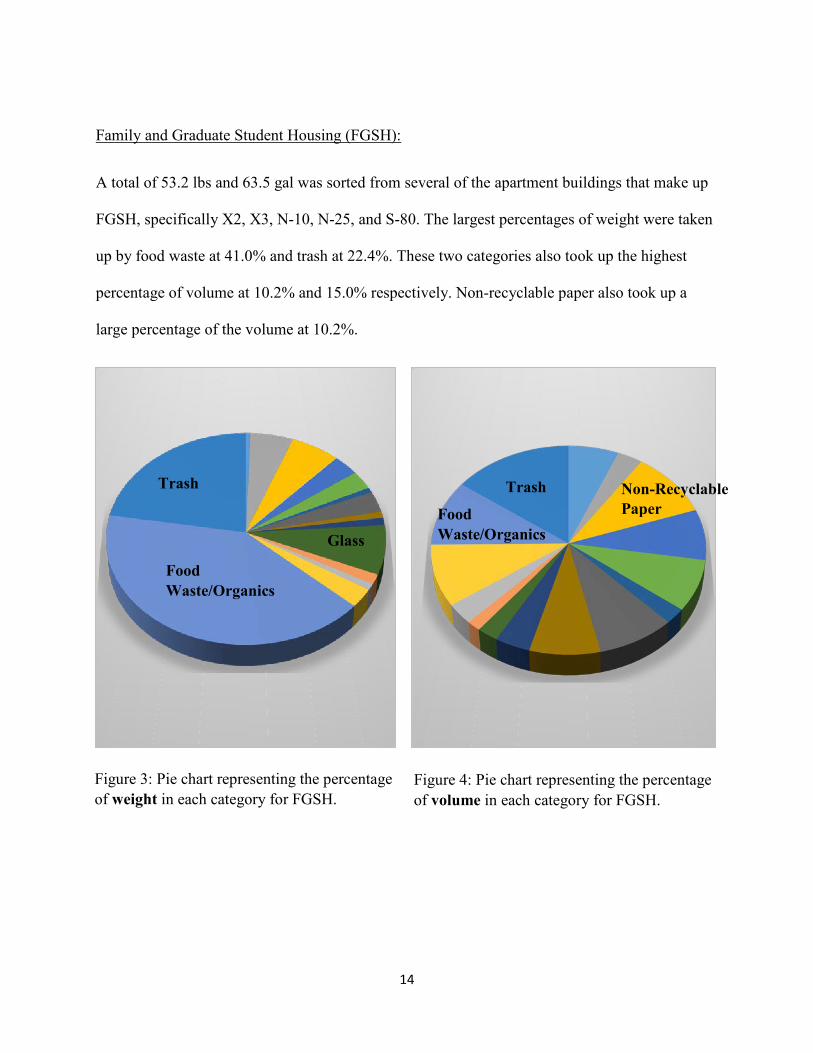
Family and Graduate Student Housing (FGSH):
A total of 53.2 lbs and 63.5 gal was sorted from several of the apartment buildings that make up
FGSH, specifically X2, X3, N-10, N-25, and S-80. The largest percentages of weight were taken
up by food waste at 41.0% and trash at 22.4%. These two categories also took up the highest
percentage of volume at 10.2% and 15.0% respectively. Non-recyclable paper also took up a
large percentage of the volume at 10.2%.
Figure 3: Pie chart representing the percentage of weight in each category for FGSH.
Figure 4: Pie chart representing the percentage of volume in each category for FGSH.
Trash
Glass
Food Waste/Organics
Trash
Food Waste/Organics
Non-Recyclable Paper

15
Waste Category
Weight (lbs)
Volume (gal)
% Total Weight
% Total Volume
White Paper (clean, dry) 0.3 4 0.6 6.3
Colored Paper 0 0 0.0 0.0
Newspapers, Magazines 2.8 2 5.3 3.2
Non-Recyclable Paper 3.2 6.5 6.0 10.2
Paperboard/Chipboard 1.7 5 3.2 7.9
Plastics #1 and #2 1.5 5 2.8 7.9
Plastics #3-#6 0.4 1.5 0.8 2.4
#7 Plastic and PLA 0 0 0.0 0.0
Plastic Bags/Film 1.7 5.5 3.2 8.7
Styrofoam 0.5 5 0.9 7.9 Other Plastics 0.6 2.5 1.1 3.9
Glass 4 1.5 7.5 2.4
Aluminum 0 0 0.0 0.0
Metals (non-aluminum) 0.8 1 1.5 1.6
Drink Boxes (Milk Cartons) 0.5 2 0.9 3.2
Corrugated Cardboard 1.5 6 2.8 9.5
Food Waste/ Organics 21.8 6.5 41.0 10.2
Batteries 0 0 0.0 0.0
Trash 11.9 9.5 22.4 15.0
Other (very out of place) 0 0 0.0 0.0
Hazardous Materials 0 0 0.0 0.0
Total 53.2 63.5 100 100
Table 2: Data Table showing weight and volume distribution for each category in Family and Graduate Student Housing. Top in weight is yellow, top in volume is blue, and top in both is green.

16
Agricultural Hall (AGH):
A total of 64.3 lbs and 102 gal was sorted from Ag Hall. The largest percentages of weight was
taken up by the non-recyclable paper category at 36.2%, which also took up the largest
percentage of volume at 25.44%. Clean white paper and food waste also accounted for large
percentages of weight, at 17.4% and 15.7% respectively. Plastic bags took up the third most
volume accounting for 10.4%.
Figure 5: Pie chart representing the percentage Figure 6: Pie chart representing the percentage of weight in each category for Ag Hall. of volume in each category for Ag Hall.
White Paper
Food Waste
Non-Recyclable Paper
Non-Recyclable Paper
Plastic Bags
White Paper

17
Waste Category
Weight (lbs)
Volume (gal)
% Total Weight
% Total Vol
White Paper (clean, dry) 11.2 12 17.4 11.7
Colored Paper 0.4 5 0.6 4.9
Newspapers, Magazines 0.6 0.5 0.9 0.5
Non-Recyclable Paper 23.3 26 36.2 25.4
Paperboard/Chipboard 0.2 5 0.3 4.9
Plastics #1 and #2 2.5 7.5 3.9 7.3
Plastics #3-#6 1.1 5 1.7 4.9
#7 Plastic and PLA 0.2 0.5 0.3 0.5
Plastic Bags/Film 4.5 10.6 7.0 10.4 Styrofoam
0.8
5.5
1.2
5.4
Other Plastics 1.3 5 2.0 4.9
Glass 0.4 0.1 0.6 0.1
Aluminum 0.6 2 0.9 2.0
Metals (non-aluminum) 0.4 0.2 0.6 0.2
Drink Boxes (Milk Cartons) 0.2 0.2 0.3 0.2
Corrugated Cardboard 1.5 5.5 2.3 5.4
Food Waste/ Organics 10.1 2.5 15.7 2.5
Batteries 0.2 0.1 0.3 0.1
Trash 2.2 5 3.4 4.9
Other (very out of place) 2.6 4 4.0 3.9
Hazardous Materials 0 0 0.0 0.0
Total 64.3 102.2 100 100
Table 3: Data Table showing weight and volume distribution for each category in Agricultural Hall. Top in weight is yellow, top in volume is blue, and top in both is green.

18
Student Union (SU):
A total of 51.7 lbs and 85.7 gal of waste was sorted from the Student Union. Non-recyclable
paper accounted for the most weight and volume in this building, taking up 24.2% of the weight
and 17.5% of the volume. Food waste and white paper also took up large percentages of weight,
accounting for 23.6% and 13.7% respectively. Styrofoam and plastic bags took up large
percentages of volume, accounting for 16.3% and 11.1% respectively.
Figure 7: Pie chart representing the percentage of weight in each category for the Student Union.
Figure 8: Pie chart representing the percentage of volume in each category for the Student Union.
White Paper
Food Waste Non-Recyclable Paper
Plastic Bags
Non-Recyclable Paper Styrofoam

19
Waste Category
Weight (lbs)
Volume (gal)
% Total Weight
% Total Vol
White Paper (clean, dry) 7.1 5 13.7 5.8
Colored Paper 0.2 3 0.4 3.5
Newspapers, Magazines 0.4 5 0.8 5.8
Non-Recyclable Paper 12.5 15 24.2 17.5
Paperboard/Chipboard 1.1 4.5 2.1 5.3
Plastics #1 and #2 1.8 7 3.5 8.2
Plastics #3-#6 1 5 1.9 5.8
#7 Plastic and PLA 0 0 0.0 0.0
Plastic Bags/Film 3.3 9.5 6.4 11.1
Styrofoam 3 14 5.8 16.3
Other Plastics 2.2 5 4.3 5.8
Glass 1.3 0.2 2.5 0.2
Aluminum 0.4 0.5 0.8 0.6
Metals (non-aluminum) 0.4 0.5 0.8 0.6
Drink Boxes (Milk Cartons) 0.4 2 0.8 2.3
Corrugated Cardboard 0.2 0.5 0.4 0.6
Food Waste/ Organics 12.2 1.5 23.6 1.8
Batteries 0 0 0.0 0.0
Trash 4.2 7.5 8.1 8.8
Other (very out of place) 0 0 0.0 0.0
Hazardous Materials 0 0 0.0 0.0
Total 51.7 85.7 100 100
Table 4: Data Table showing weight and volume distribution for each category in the Student Union. Top in weight is yellow, top in volume is blue, and top in both is green.

20
Henry Bellmon Research Center (HBRC):
A total of 69.8 lbs and 93.8 gal of waste was sorted from HBRC. The food waste and “other”
categories were two of the highest in weight, accounting for 28.4% and 14.3% respectively.
Styrofoam and Plastics #3-6 were two of the highest in volume, accounting for 11.7% and 11.2%
respectively. Trash took up significant percentages of both, accounting for 21.4% of the weight
and 12.8% of the volume.
Figure 9: Pie chart representing the percentage of weight in each category for HBRC.
Figure 10: Pie chart representing the percentage of volume in each category for HBRC.
Other
Trash
Food Waste
Trash
Plastics 3-6
Styrofoam

21
Waste Category
Weight (lbs)
Volume (gal)
% Total Weight
% Total Vol
White Paper (clean, dry) 0.4 0.1 0.6 0.1
Colored Paper 0 0 0.0 0.0
Newspapers, Magazines 0.3 0.5 0.4 0.5
Non-Recyclable Paper 6.6 9 9.5 9.6
Paperboard/Chipboard 0.4 1 0.6 1.1
Plastics #1 and #2 3.6 8.6 5.2 9.2
Plastics #3-#6 2.1 10.5 3.0 11.2
#7 Plastic and PLA 1.1 4.5 1.6 4.8
Plastic Bags/Film 2.4 4.5 3.4 4.8 Styrofoam
1.3
11
1.9
11.7
Other Plastics 2.1 7 3.0 7.5
Glass 0.6 0.1 0.9 0.1
Aluminum 1.1 4.5 1.6 4.8
Metals (non-aluminum) 2.2 2 3.2 2.1
Drink Boxes (Milk Cartons) 0.3 0.5 0.4 0.5
Corrugated Cardboard 0.6 3.5 0.9 3.7
Food Waste/ Organics 19.8 4.5 28.4 4.8
Batteries 0 0 0.0 0.0
Trash 14.9 12 21.4 12.8
Other (very out of place) 10 10 14.3 10.7
Hazardous Materials 0 0 0.0 0.0
Total 69.8 93.8 100 100
Table 5: Data Table showing weight and volume distribution for each category in the Henry Bellmon Research Center. Top in weight is yellow, top in volume is blue, and top in both is green.

22
Kamm-Peterson-Friend Residence Halls (KPF):
A total of 47.7 lbs and 80.4 gal of waste was sorted from KPF. Non-recyclable paper accounted
for the highest percentage of both sections, taking up 18.9% of the weight and 12.4% of the
volume. Food waste and glass took up high percentages of weight, accounting for 17.4% and
12.0% respectively. Plastic bags/film and plastics #1 and 2 took up high percentages of volume,
accounting for 12.4% and 10.6% respectively.
Figure 11: Pie chart representing the Figure 12: Pie chart representing the percentage of weight in each category for percentage of volume in each category for KPF. KPF.
Glass
Non-Recyclable paper Food Waste
Non-Recyclable paper
Plastics 1 and 2
Plastic Bags

23
Waste Category
Weight (lbs)
Volume (gal)
% Total Weight
% Total Vol
White Paper (clean, dry) 4 4.5 8.4 5.6
Colored Paper 0.5 0.5 1.0 0.6
Newspapers, Magazines 0.3 0.1 0.6 0.1
Non-Recyclable Paper 9 10 18.9 12.4
Paperboard/Chipboard 2 5 4.2 6.2
Plastics #1 and #2 2.8 8.5 5.9 10.6
Plastics #3-#6 0.9 3 1.9 3.7
#7 Plastic and PLA 0.4 1 0.8 1.2
Plastic Bags/Film 2.7 10 5.7 12.4 Styrofoam
0.7
8
1.5
10.0
Other Plastics 0.6 4.5 1.3 5.6
Glass 5.7 3 11.9 3.7
Aluminum 1.2 6 2.5 7.5
Metals (non-aluminum) 0.3 0.1 0.6 0.1
Drink Boxes (Milk Cartons) 0.1 0.1 0.2 0.1
Corrugated Cardboard 0.9 3 1.9 3.7
Food Waste/ Organics 8.3 4 17.4 5.0
Batteries 0.3 0.1 0.6 0.1
Trash 5.5 6 11.5 7.5
Other (very out of place) 1.5 3 3.1 3.7
Hazardous Materials 0 0 0.0 0.0
Total 47.7 80.4 100 100
Table 6: Data Table showing weight and volume distribution for each category in the Kamm- Peterson-Friend Residence Halls. Top in weight is yellow, top in volume is blue, and top in both is green.

24
All Six Buildings Together:
A total of 345 lbs and 522 gal of waste was sorted from the OSU-Stillwater campus. Food waste
constituted the highest amount of weight, accounting for 26.6%. Non-recyclable paper took up
large percentages in both sections, accounting for 17.9% of the weight and 14.2% of the volume.
Plastic bags and Styrofoam both took up large percentages of volume, accounting for 10.6% and
9.2% respectively. These four categories were our highest concern when coming up with
recommendations.
Figure 13: Pie chart representing the Figure 14: Pie chart representing the percentage of weight in each category for all percentage of volume in each category for buildings together. all buildings together.
Trash
Non-Recyclable Paper
Food Waste
Plastic Bags
Styrofoam
Non-Recyclable Paper

25
Waste Category Weight (lbs) Volume (gal) % Total Weight % Total Vol
White Paper (clean, dry) 23.1 26.6 6.7 5.1
Colored Paper 1.3 9 0.4 1.7
Newspapers, Magazines 4.6 11.6 1.3 2.2
Non-Recyclable Paper 61.9 74 17.9 14.2
Paperboard/Chipboard 6.5 24.5 1.9 4.7
Plastics #1 and #2 15.7 47.1 4.6 9.0
Plastics #3-#6 8.1 37 2.3 7.1
#7 Plastic and PLA 2.7 10.5 0.8 2.0
Plastic Bags/Film 21.5 55.1 6.2 10.6
Styrofoam 6.5 48 1.9 9.2
Other Plastics 7.8 28 2.3 5.4
Glass 13.7 5.4 4.0 1.0
Aluminum 6 17 1.7 3.3
Metals (non-aluminum) 4.2 3.9 1.2 0.7
Drink Boxes (Milk Cartons) 1.7 2.3 0.5 0.4
Corrugated Cardboard 11.2 34 3.2 6.5
Food Waste/ Organics 91.8 25.5 26.6 4.9
Batteries 0.5 0.2 0.1 0.0
Trash 42.1 45 12.2 8.6
Other (very out of place) 14.1 17 4.1 3.3
Hazardous Materials 0 0 0.0 0.0
Total 345 521.7 100 100
Table 6: Data Table showing weight and volume distribution for each category in all six buildings together. Top in weight is yellow, top in volume is blue, and top in both is green.

26
Discussion and Recommendations
After the 2013 Waste Audit, the author found that the most significant categories in weight
included food waste and plastics 1 & 2. Thus, her recommendations focused on food waste
composting and working harder towards removing recyclables from the waste stream. We found
less recyclables like plastics 1 & 2 in the waste stream, however food waste continues to be a
significant category. Unique to this study was the finding of non-recyclable paper being
significant as well as plastic bags and Styrofoam due to the additional recording of volume
measurements. These specific categories directly impacted our recommendations, other
recommendations were made based on our supplemental research.
One of the goals of the OSU Sustainability Department is to become a zero waste campus at
some point in the future (fm.okstate.edu). We’ve compared the university’s waste production and
found a decrease from 3727 tons to 3650 tons since 2013. What is interesting is that there was a
17% drop in waste production from 2013 to 2014 and waste production has been rising since
then. It would make sense to correlate that rise with increasing student enrollment, but according
to OSU’s website, total student enrollment at Stillwater’s campus has only risen by a few
hundred students over the last four years (irim.okstate.edu). Therefore we must come to the
conclusion that improvements must be made and these recommendations must be taken
seriously.
Waste Audit Recommendations:
• Plastic bag recycling
o Plastic bags cannot currently be recycled on campus as they cause the baler to
jam, so in order to recycle them they would need to be shipped elsewhere. In
27
some residence halls there are bins available for students to place their bags but it
is up to students to deliver those bags to locations that do recycle them. It would
be worthwhile to expand this program by adding more of these bins around
campus, specifically all residence halls and convenience stores, and have a
student organization officially take care of transporting them.
• Further implementation of reusable bags and cups
o This will further help reduce plastic bag waste as well as Styrofoam waste, as
most of the Styrofoam came from cups. A way to incentivize students to reuse
more is by providing discounts on their purchases for using these bags and cups as
well as charging extra for using plastic bags or Styrofoam cups.
• Better marketing for white paper recycling
o Much of the non-recyclable paper was in fact white paper that was thrown out and
soiled by food or coffee grounds in the trash. Ways to minimize this waste would
be to increase convenience and awareness. Examples would be to have white
paper recycling bins next to all trash cans and to have flyers or signs in as many
offices and labs as possible reminding faculty to recycle their paper.
• Electric hand dryers
o Another large portion of the non-recyclable paper was paper towels from
bathrooms. Ways to limit this is by installing electric hand dryers. Some buildings
like the Colvin already have them and it could help reduce this category of waste
if they were put into other buildings as well.
• Actively seek a food waste composter

28
o At this point it is not feasible for OSU to implement a food waste composting
program, however they should not just wait someone to come along and do it for
them. Food waste accounts for the largest amount of weight found in the waste
stream and if any large effort is to be made to reduce waste production this must
be addressed. It would be most beneficial for the university to actively seek out
potential entrepreneurs to implement a composting facility in the region, or to
discuss a partnered venture with the City of Stillwater.
Research Recommendations:
• Make “OSU Recycles” single stream
o We’ve learned from places like Pepperdine that convenience is key when it comes
to recycling, and OSU is already doing some single stream recycling with “Res
Life Recycles.” Taking out the confusion of sorting things into the right bin could
help encourage students to recycle more.
• Modify bin appearance, location, and amount
o The more recycling bins there are and the closer they are to trash cans, the easier
it is for students and faculty to use them. Also, bins across campus in various
locations don’t all look the same, which can be confusing. Uniform appearance
for specific streams would help that. And with appearance, having a large, simple
picture on the bin to identify it is easier to interpret than posters and signs full of
words.
• Perform a cost audit

29
o The Recycling Department currently does not know how much exactly they are
spending or gaining with recycling. Performing an audit to figure this out will let
them know how much they might be able to spend on improving the program.
• Regular waste auditing
o Performing a waste audit like this every few years will help keep the university up
to date on how what their waste stream is composed of. No one strategy will take
a university to zero waste, so studies like this will help OSU adapt and address
problems bit by bit.

30
References
[1] "Advantages and Disadvantages of Recycling." Conserve Energy Future. N.p., 16 Jan. 2017.
Web. 15 Mar. 2017.
[2] Bailey, Kate. "Zero Waste Creates Jobs." Ecocycle.org mobile. Eco-cycle, Inc, n.d. Web. 5
Apr. 2017.
[3] “Enrollment Projections.” OSU Institutional Research and Information Management.
Oklahoma State University. Web. 15 April 2017.
[4] "Frequently Asked Questions." Frequently Asked Questions | Pepperdine University | Seaver
College. N.p., n.d. Web. 09 Mar. 2017.
[5] "Municipal Solid Waste." EPA. Environmental Protection Agency, n.d. Web. 20 Apr. 2017.
[6] "OSU Recycles-Mission, Vision, Goals, and Objectives." OSU Facilities Management.
Oklahoma State University, 11 Sept. 2013. Web. 15 Apr. 2017.
[7] "The past, present, and future of solid waste disposal." Sustaining Our World. N.p., 27 Feb.
2017. Web. 29 Apr. 2017.
[8] Payne, Colin. "Breaking Down America's D on Infrastructure." Breaking Down America's D
on Infrastructure > ENGINEERING.com. Engineering.com, Inc, 31 Mar. 2017. Web. 5
Apr. 2017.
[9] Piccirilli Dorsey, Inc. "Fact Sheet: Landfill Methane | White Papers | EESI". Eesi.org. N.p.,
2017. Web. 15 Mar. 2017.
[10] "Plastics." How Plastics Are Made. American Chemistry Council, Inc, 2015. Web. 29 Apr.
2017.
[11] "Sustainable Materials Management: Non-Hazardous Materials and Waste Management
Hierarchy." EPA. Environmental Protection Agency, 12 Apr. 2017. Web. 20 Apr. 2017.

31
[12] Thompson, Derek. "2.6 Trillion Pounds of Garbage: Where Does the World's Trash Go?"
The Atlantic. Atlantic Media Company, 07 June 2012. Web. 15 Mar. 2017.
[13] "University of Oklahoma - Most Widespread." Sustainability. N.p., n.d. Web. 09 Mar. 2017.
[14] Kandula, Bhuvana. “Oklahoma State University Waste Audit Report Spring 2013.”
Department of Civil and Environmental Engineering. Oklahoma State University. Mar.
2017.
[15] "The Waste Stream: Garbage through the ages." The Waste Stream - Page 3. N.p., n.d. Web.
15 Mar. 2017.

32
Appendix A—Categories (Every Category must be relatively clean and dry to be recyclable)
- Copied directly from 2013 report by Bhuvana Kandula.
1. White Paper: Most valuable version of paper which can be recycled.
2. Colored Paper: This category is determined by tearing to determine base color.
3. Newspapers, Magazines, and Journals
4. Non-Recyclable Paper: Paper towels, napkins, tissues, food wrappers, wet or soiled
paper
5. Paperboard or Chipboard: Ex- Cereal boxes
6. #1 and #2:
#1 - PET or PETE (Polyethylene Terephtalate): Usually green or clear, this type of plastic
is shiny and rigid and generally used for soft drink bottles, peanut butter containers, water
and beer bottles, salad dressings, oil containers, and microwavable food trays.
#2 - HDPE (High Density Polyethylene): These plastics have milky or solid colors and
are rigid containers; they are used in making detergent bottles, pens, and shampoo bottles.
7. #3-#6 Plastic Containers:
#3: PVC (Polyvinyl Chloride): This plastic is semi-rigid, used as dashboards, clear food
packing, cables etc.
#4: LDPE (Low Density Polyethylene): It is a flexible plastic, used in squeezable bottles,
tote bags etc.
#5.PP (Polypropylene): This plastic is semi-rigid, it is generally solid white or colored, it
is used in yogurt containers, ketchup bottles etc.
#6.Polystyrene: This plastic is brittle and glossy, used in medicine bottles, CD cases etc.

33
8. #7 Plastic Containers and PLA (corn starch plastic):
PLA plastics are made from corn and cane sugar. It is an easily moldable plastic, giving it
the ability to protect items during shipping. Examples of PLA plastics are plastic
wrapping around items you buy at the store, such as fruits.
9. Plastic Bags/ Films
10. Styrofoam
11. Other Plastic Containers and Plastic Container Lids: Things like restaurant plastic
cups that do not fit into other categories.
12. Glass
13. Aluminum: Soda Cans and aluminum foil
14. Metals (Non- Aluminum): Steel or tin cans which have a flat bottom and other metals
like brass, and copper.
15. Drink Boxes: Ex - Milk Cartons
16. Corrugated Cardboard: Cardboard with waffle like construction that makes up the walls
the cardboard.
17. Food Waste
18. Household Batteries: Rechargeable and regular.
19. Trash
20. Other
21. Hazardous Waste: Examples are cleaning fluids, pesticides, and by products of
manufacturing processes.

34
Appendix B—Waste Audit Pictures
Volunteers sorting the trash

35
Measuring and recording weight and volume