Embed Size (px)
Citation preview
V
UNITED STATESSECURITIES AND EXCHANGE COMMISSION
Washington, D.C. 20549
FORM 10-K(Mark One) ANNUAL REPORT PURSUANT TO SECTION 13 OR 15(d) OF THE SECURITIES EXCHANGE ACT OF
1934For the fiscal year ended December 31, 2018
OR
TRANSITION REPORT PURSUANT TO SECTION 13 OR 15(d) OF THE SECURITIES EXCHANGE ACT OF 1934
For the transition period from to
Commission file number 000-50039
OLD DOMINION ELECTRIC COOPERATIVE(Exact name of Registrant as specified in its charter)
VIRGINIA 23-7048405(State or other jurisdiction of
incorporation or organization)(I.R.S. employer
identification no.)
4201 Dominion Boulevard, Glen Allen, Virginia 23060(Address of principal executive offices) (Zip code)
(804) 747-0592(Registrant’s telephone number, including area code)
Securities registered pursuant to Section 12(b) of the Act: NONE
Securities registered pursuant to Section 12(g) of the Act: NONE
Indicate by check mark if the Registrant is a well-known seasoned issuer, as defined in Rule 405 of the Securities Act? Yes No
Indicate by check mark if the Registrant is not required to file reports pursuant to Section 13 or Section 15(d) of the Securities Exchange Act (the “Exchange Act”). Yes No
Indicate by check mark whether the Registrant: (1) has filed all reports required to be filed by Section 13 or 15(d) of the Exchange Act during the preceding 12 months (or for such shorter period that the Registrant was required to file such reports), and (2) has been subject to such filing requirements for the past 90 days. Yes No
Indicate by check mark whether the registrant has submitted electronically every Interactive Data File required to be submitted pursuant to Rule 405 of Regulation S-T (§232.405 of this chapter) during the preceding 12 months (or for such shorter period that the registrant was required to submit such files). Yes No
Indicate by check mark if disclosure of delinquent filers pursuant to Item 405 of Regulation S-K (§ 229.405) is not contained herein, and will not be contained, to the best of Registrant’s knowledge, in definitive proxy or information statements incorporated by reference in Part III of this Form 10-K or any amendment to this form 10-K.
Indicate by check mark whether the Registrant is a large accelerated filer, an accelerated filer, a non-accelerated filer, a smaller reporting company, or an emerging growth company. See the definitions of “large accelerated filer,” “accelerated filer,” “smaller reporting company,” and “emerging growth company” in Rule 12b-2 of the Exchange Act.
Large accelerated filer Accelerated filer Non-accelerated filer Smaller reporting company Emerging growth company
If an emerging growth company, indicate by check mark if the registrant has elected not to use the extended transition period for complying with any new or revised financial accounting standards provided pursuant to Section 13(a) of the Exchange Act. Indicate by check mark whether the Registrant is a shell company (as defined in Exchange Act Rule 12b-2). Yes No
State the aggregate market value of the voting and non-voting common equity held by non-affiliates of the Registrant. NONE
Indicate the number of shares outstanding of each of the Registrant’s classes of common stock. The Registrant is a membership corporation and has no authorized or outstanding equity securities.
Documents incorporated by reference: NONE
OLD DOMINION ELECTRIC COOPERATIVE
2018 ANNUAL REPORT ON FORM 10-K ItemNumber
PageNumber
Glossary of Terms 2
PART I
1. Business 41A. Risk Factors 161B. Unresolved Staff Comments 222. Properties 223. Legal Proceedings 244. Mine Safety Disclosures 25
PART II
5. Market for Registrant’s Common Equity, Related Stockholder Matters and Issuer Purchases of Equity Securities 25
6. Selected Financial Data 257. Management’s Discussion and Analysis of Financial Condition and Results of Operations 27
7A. Quantitative and Qualitative Disclosures About Market Risk 448. Financial Statements and Supplementary Data 469. Changes in and Disagreements With Accountants on Accounting and Financial Disclosure 75
9A. Controls and Procedures 759B. Other Information 76
PART III
10. Directors, Executive Officers and Corporate Governance 7711. Executive Compensation 8012. Security Ownership of Certain Beneficial Owners and Management and Related Stockholder Matters 8813. Certain Relationships and Related Transactions, and Director Independence 8814. Principal Accounting Fees and Services 89
PART IV
15. Exhibits, Financial Statement Schedules 9016. Form 10-K Summary 93
SIGNATURES
2
GLOSSARY OF TERMS
The following abbreviations or acronyms used in this Form 10-K are defined below:
Abbreviation or Acronym DefinitionACE Affordable Clean Energy RuleACES Alliance for Cooperative Energy Services Power Marketing, LLCAlstom Alstom Power, Inc.Bear Island Bear Island Paper WB LLCCAA Clean Air ActCCRs Coal combustion residualsCEC Choptank Electric Cooperative, Inc.CEO Chief Executive OfficerCFO Chief Financial OfficerClover Clover Power StationCO2 Carbon dioxideCOO Chief Operating OfficerCSAPR Cross-State Air Pollution RuleD.C. Circuit U.S. Court of Appeals for the District of Columbia CircuitDEC Delaware Electric Cooperative, Inc.DPSC Delaware Public Service CommissionDOE U.S. Department of EnergyEGU Electric generating unitEPA Environmental Protection AgencyEPACT Energy Policy Act of 2005, as amendedEPC Engineering, procurement, and constructionEPRS Essential Power Rock Springs, LLCFASB Financial Accounting Standards BoardFERC Federal Energy Regulatory CommissionFitch Fitch Ratings, Inc.GAAP Accounting principles generally accepted in the United StatesGHG Greenhouse gasesIndenture Second Amended and Restated Indenture of Mortgage and Deed of Trust, dated
January 1, 2011, of ODEC with Branch Banking and Trust Company, as trustee, as amended and supplemented
IRC Internal Revenue Code of 1986, as amendedkV KilovoltLIBOR London Interbank Offered RateMATS Mercury and Air Toxics StandardsMitsubishi Mitsubishi Hitachi Power Systems Americas, Inc.Moody’s Moody’s Investors ServiceMPSC Maryland Public Service CommissionMW Megawatt(s)MWh Megawatt hour(s)NAAQS National Ambient Air Quality StandardsNERC North American Electric Reliability CorporationNorth Anna North Anna Nuclear Power StationNorth Anna Unit 3 A potential additional nuclear-powered generating unit at North AnnaNOVEC Northern Virginia Electric CooperativeNOx Nitrogen oxideNRC U.S. Nuclear Regulatory CommissionNRECA National Rural Electric Cooperative AssociationNYMEX New York Mercantile ExchangeODEC, We, Our, Us Old Dominion Electric Cooperative
3
Abbreviation or Acronym DefinitionPJM PJM Interconnection, LLCPPA Pension Protection ActRCRA Resource Conservation and Recovery Act, as amendedREC Rappahannock Electric CooperativeRICE Reciprocating Internal Combustion Engine National Emissions Standards for
Hazardous Air PollutantsRGGI Regional Greenhouse Gas InitiativeRPM Reliability Pricing ModelRPS Renewable portfolio standardsRTO Regional transmission organizationRUS U.S. Department of Agriculture Rural Utilities ServiceS&P Standard & Poor’s Ratings ServicesSEPA Southeastern Power AdministrationSIP State Implementation PlanSO2 Sulfur dioxideSVEC Shenandoah Valley Electric CooperativeTEC TEC Trading, Inc.VDEQ Virginia Department of Environmental QualityVirginia Power Virginia Electric and Power CompanyVMDAEC Virginia, Maryland, and Delaware Association of Electric CooperativesVSCC Virginia State Corporation CommissionWildcat Point Wildcat Point Generation FacilityWOPC White Oak Power ConstructorsXBRL Extensible Business Reporting Language
4
PART I
ITEM 1. BUSINESS
OVERVIEW
Old Dominion Electric Cooperative was incorporated under the laws of the Commonwealth of Virginia in 1948 as a not-for-profit power supply cooperative. We are organized for the purpose of supplying the power our member distribution cooperatives require to serve their customers on a cost-effective basis. We serve their power requirements pursuant to long-term, all-requirements wholesale power contracts. Through our member distribution cooperatives, we served approximately 590,000 retail electric customers (meters), representing a total population of approximately 1.4 million people in 2018.
We supply our member distribution cooperatives’ power requirements, consisting of demand requirements and energy requirements, through a portfolio of resources including owned generating facilities, power purchase contracts, and spot market energy purchases. Our generating facilities are fueled by a mix of natural gas, coal, nuclear, and fuel oil. We are a member of a regional transmission organization, PJM, and we participate in its energy, capacity, and transmission services markets to serve our member distribution cooperatives. See “Power Supply Resources” below and “Properties” in Item 2 for a description of these resources.
We are owned entirely by our members, which are the primary purchasers of the power we sell. We have two classes of members. Our Class A members are customer-owned electric distribution cooperatives that supply the power requirements of their retail customers. Electric distribution cooperatives own and maintain nearly half of the distribution lines in the United States and serve almost three-quarters of the United States’ land mass. Our sole Class B member is TEC, a taxable corporation owned by our member distribution cooperatives. Our member distribution cooperatives primarily serve rural, suburban, and recreational areas of the mid-Atlantic region. See “Members—Service Territories and Customers” below.
We are a power supply cooperative. In general, a cooperative is a business organization owned by its members, which are also either the cooperative’s wholesale or retail customers. Cooperatives are designed to give their members the opportunity to satisfy their collective needs in a particular area of business more effectively than if the members acted independently. As not-for-profit organizations, cooperatives are intended to provide services to their members on a cost-effective basis, in part by eliminating the need to produce profits or a return on equity in excess of required margins. Margins not distributed to members constitute patronage capital, a cooperative’s principal source of equity. Patronage capital is held for the account of the members without interest and returned when the board of directors of the cooperative deems it appropriate to do so.
Electric distribution cooperatives form power supply cooperatives to acquire power supply resources, typically through the construction of generating facilities or the development of other power purchase arrangements, at a lower cost than if they were acquiring those resources alone.
We are a not-for-profit electric cooperative and currently are exempt from federal income taxation under IRC Section 501(c)(12).
We are not a party to any collective bargaining agreement. We had 140 employees as of March 1, 2019.
Our principal executive office is located at 4201 Dominion Boulevard, Glen Allen, Virginia 23060. Our telephone number is (804) 747-0592.
5
MEMBERS
Member Distribution Cooperatives
General
Our member distribution cooperatives provide electric services, consisting of power supply, transmission services, and distribution services (including metering and billing services) to residential, commercial, and industrial customers. We have eleven member distribution cooperatives that serve customers in 70 counties in Virginia, Delaware, and Maryland. The member distribution cooperatives’ distribution business involves the operation of substations, transformers, and electric lines that deliver power to their customers.
Eight of our member distribution cooperatives provide electric services on the Virginia mainland:
BARC Electric CooperativeCommunity Electric CooperativeMecklenburg Electric CooperativeNorthern Neck Electric CooperativePrince George Electric CooperativeRappahannock Electric CooperativeShenandoah Valley Electric CooperativeSouthside Electric Cooperative
Three of our member distribution cooperatives provide electric services on the Delmarva Peninsula:
A&N Electric Cooperative in VirginiaChoptank Electric Cooperative, Inc. in MarylandDelaware Electric Cooperative, Inc. in Delaware
The member distribution cooperatives are not our subsidiaries, but rather our owners. We have no interest in their assets, liabilities, equity, revenues, or margins.
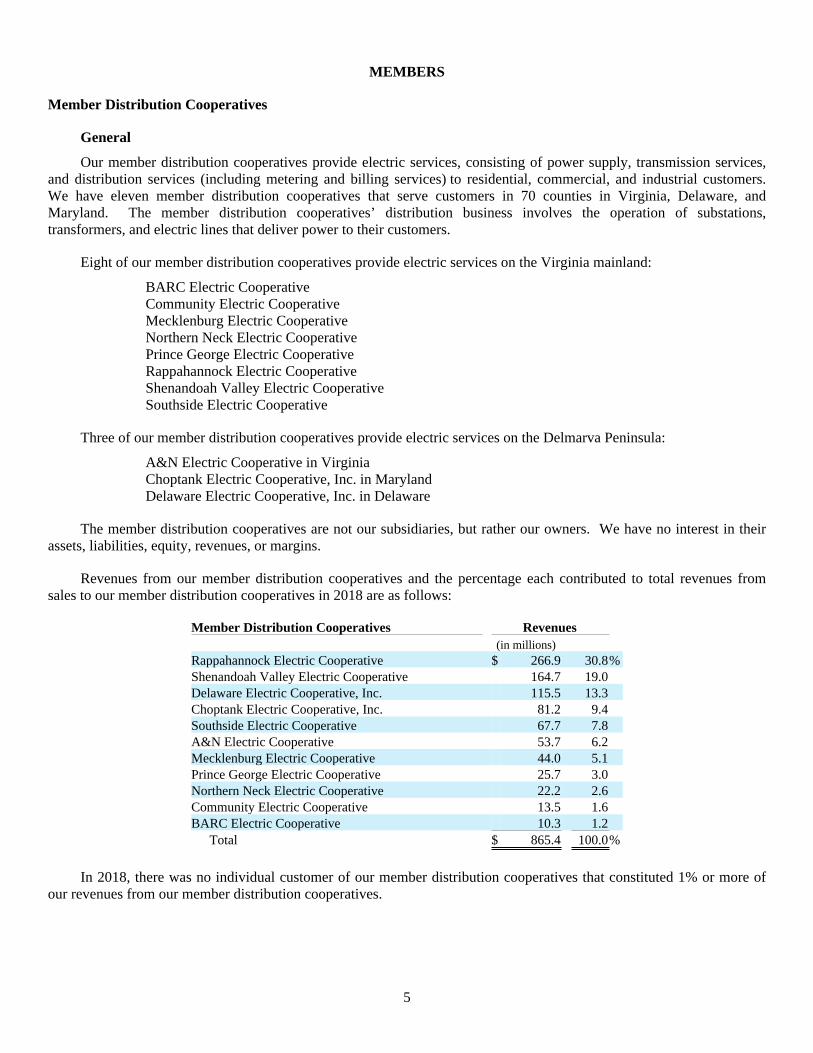
Revenues from our member distribution cooperatives and the percentage each contributed to total revenues from sales to our member distribution cooperatives in 2018 are as follows:
Member Distribution Cooperatives Revenues (in millions)
Rappahannock Electric Cooperative $ 266.9 30.8%Shenandoah Valley Electric Cooperative 164.7 19.0 Delaware Electric Cooperative, Inc. 115.5 13.3 Choptank Electric Cooperative, Inc. 81.2 9.4 Southside Electric Cooperative 67.7 7.8 A&N Electric Cooperative 53.7 6.2 Mecklenburg Electric Cooperative 44.0 5.1 Prince George Electric Cooperative 25.7 3.0 Northern Neck Electric Cooperative 22.2 2.6 Community Electric Cooperative 13.5 1.6 BARC Electric Cooperative 10.3 1.2
Total $ 865.4 100.0%
In 2018, there was no individual customer of our member distribution cooperatives that constituted 1% or more of our revenues from our member distribution cooperatives.
6
Service Territories and Customers
The territories served by our member distribution cooperatives cover large portions of Virginia, Delaware, and Maryland. These service territories range from the extended suburbs of Washington, D.C. to the North Carolina border and from the Atlantic shores of Virginia, Delaware, and Maryland to the Appalachian Mountains.
Our member distribution cooperatives’ service territories encompass primarily rural, suburban, and recreational areas. Our member distribution cooperatives’ customers’ requirements for capacity and energy generally are seasonal and increase in winter and summer as home heating and cooling needs increase and then decline in the spring and fall as the weather becomes milder. Our member distribution cooperatives also serve major industries which include manufacturing, poultry, telecommunications, agriculture, forestry and wood products, health care, and recreation.
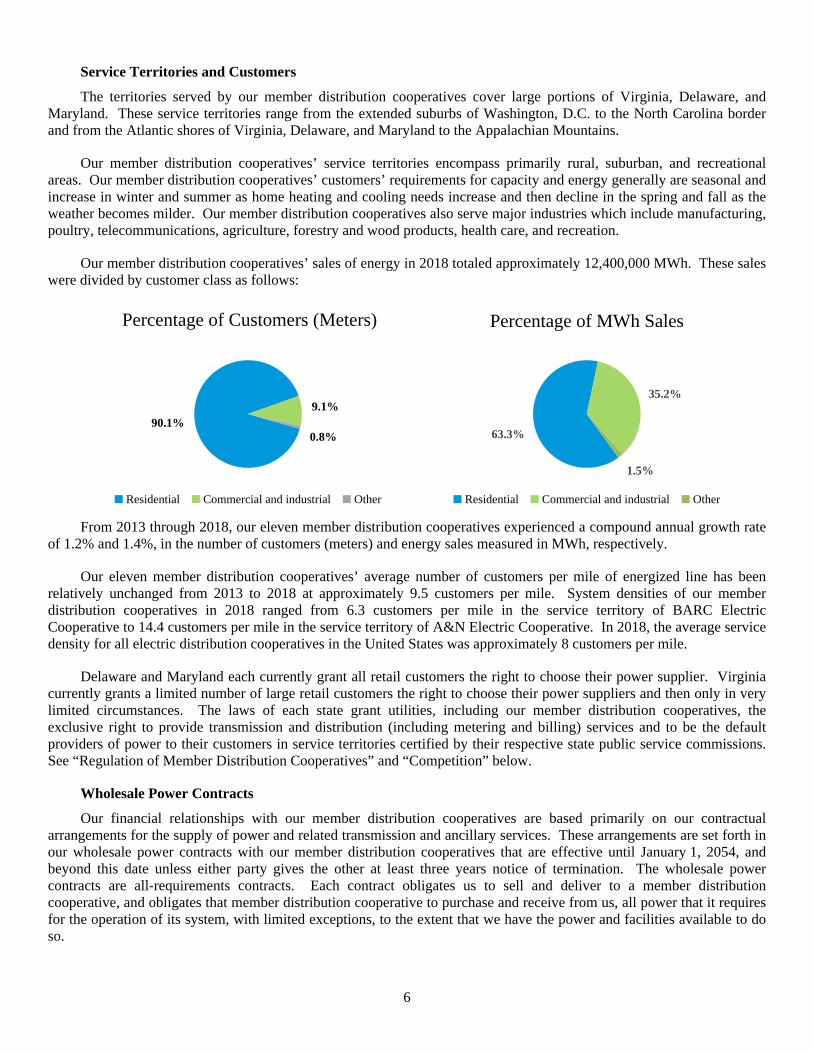
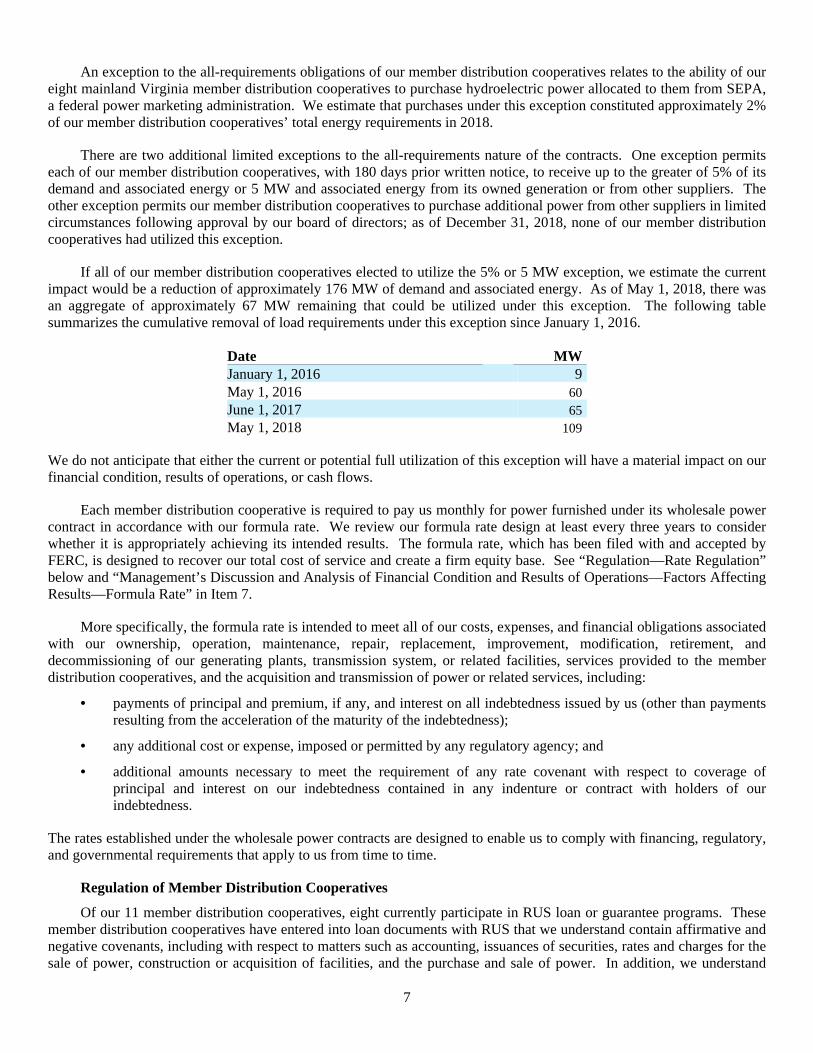
Our member distribution cooperatives’ sales of energy in 2018 totaled approximately 12,400,000 MWh. These sales were divided by customer class as follows:
90.1%9.1%
0.8%
Residential Commercial and industrial Other
Percentage of Customers (Meters)
63.3%
35.2%
1.5%
Residential Commercial and industrial Other
Percentage of MWh Sales
From 2013 through 2018, our eleven member distribution cooperatives experienced a compound annual growth rate of 1.2% and 1.4%, in the number of customers (meters) and energy sales measured in MWh, respectively.
Our eleven member distribution cooperatives’ average number of customers per mile of energized line has been relatively unchanged from 2013 to 2018 at approximately 9.5 customers per mile. System densities of our member distribution cooperatives in 2018 ranged from 6.3 customers per mile in the service territory of BARC Electric Cooperative to 14.4 customers per mile in the service territory of A&N Electric Cooperative. In 2018, the average service density for all electric distribution cooperatives in the United States was approximately 8 customers per mile.
Delaware and Maryland each currently grant all retail customers the right to choose their power supplier. Virginia currently grants a limited number of large retail customers the right to choose their power suppliers and then only in very limited circumstances. The laws of each state grant utilities, including our member distribution cooperatives, the exclusive right to provide transmission and distribution (including metering and billing) services and to be the default providers of power to their customers in service territories certified by their respective state public service commissions. See “Regulation of Member Distribution Cooperatives” and “Competition” below.
Wholesale Power Contracts
Our financial relationships with our member distribution cooperatives are based primarily on our contractual arrangements for the supply of power and related transmission and ancillary services. These arrangements are set forth in our wholesale power contracts with our member distribution cooperatives that are effective until January 1, 2054, and beyond this date unless either party gives the other at least three years notice of termination. The wholesale power contracts are all-requirements contracts. Each contract obligates us to sell and deliver to a member distribution cooperative, and obligates that member distribution cooperative to purchase and receive from us, all power that it requires for the operation of its system, with limited exceptions, to the extent that we have the power and facilities available to do so.
7
An exception to the all-requirements obligations of our member distribution cooperatives relates to the ability of our eight mainland Virginia member distribution cooperatives to purchase hydroelectric power allocated to them from SEPA, a federal power marketing administration. We estimate that purchases under this exception constituted approximately 2% of our member distribution cooperatives’ total energy requirements in 2018.
There are two additional limited exceptions to the all-requirements nature of the contracts. One exception permits each of our member distribution cooperatives, with 180 days prior written notice, to receive up to the greater of 5% of its demand and associated energy or 5 MW and associated energy from its owned generation or from other suppliers. The other exception permits our member distribution cooperatives to purchase additional power from other suppliers in limited circumstances following approval by our board of directors; as of December 31, 2018, none of our member distribution cooperatives had utilized this exception.
If all of our member distribution cooperatives elected to utilize the 5% or 5 MW exception, we estimate the current impact would be a reduction of approximately 176 MW of demand and associated energy. As of May 1, 2018, there was an aggregate of approximately 67 MW remaining that could be utilized under this exception. The following table summarizes the cumulative removal of load requirements under this exception since January 1, 2016.
Date MW January 1, 2016 9May 1, 2016 60June 1, 2017 65May 1, 2018 109
We do not anticipate that either the current or potential full utilization of this exception will have a material impact on our financial condition, results of operations, or cash flows.
Each member distribution cooperative is required to pay us monthly for power furnished under its wholesale power contract in accordance with our formula rate. We review our formula rate design at least every three years to consider whether it is appropriately achieving its intended results. The formula rate, which has been filed with and accepted by FERC, is designed to recover our total cost of service and create a firm equity base. See “Regulation—Rate Regulation” below and “Management’s Discussion and Analysis of Financial Condition and Results of Operations—Factors Affecting Results—Formula Rate” in Item 7.
More specifically, the formula rate is intended to meet all of our costs, expenses, and financial obligations associated with our ownership, operation, maintenance, repair, replacement, improvement, modification, retirement, and decommissioning of our generating plants, transmission system, or related facilities, services provided to the member distribution cooperatives, and the acquisition and transmission of power or related services, including:
• payments of principal and premium, if any, and interest on all indebtedness issued by us (other than payments resulting from the acceleration of the maturity of the indebtedness);
• any additional cost or expense, imposed or permitted by any regulatory agency; and
• additional amounts necessary to meet the requirement of any rate covenant with respect to coverage of principal and interest on our indebtedness contained in any indenture or contract with holders of our indebtedness.
The rates established under the wholesale power contracts are designed to enable us to comply with financing, regulatory, and governmental requirements that apply to us from time to time.
Regulation of Member Distribution Cooperatives
Of our 11 member distribution cooperatives, eight currently participate in RUS loan or guarantee programs. These member distribution cooperatives have entered into loan documents with RUS that we understand contain affirmative and negative covenants, including with respect to matters such as accounting, issuances of securities, rates and charges for the sale of power, construction or acquisition of facilities, and the purchase and sale of power. In addition, we understand
8
financial covenants in these member distribution cooperatives’ loan documents require them to design rates to achieve an interest coverage ratio and a debt service coverage ratio. Finally, we understand that the principal loan documentation of our member distribution cooperatives that do not participate in RUS loan or guarantee programs contains similar covenants.
Our member distribution cooperatives in Virginia are subject to rate regulation by the VSCC in the provision of electric services to their customers, but they have the ability to pass through changes in their wholesale power costs, including the demand and energy costs we charge our member distribution cooperatives, to their customers. Our Virginia member distribution cooperatives also may adjust their rates for distribution service by a maximum net increase or decrease of 5%, on a cumulative basis, in any three-year period without approval by the VSCC. Additionally, they may make adjustments to their rates to collect fixed costs through a new or modified fixed monthly charge rather than through volumetric charges associated with energy usage, so long as such adjustments are revenue neutral.
The MPSC regulates the rates and services offered by our Maryland member distribution cooperative, CEC, other than wholesale power costs, which are a pass-through to CEC’s customers. Our Delaware member distribution cooperative, DEC, is not regulated by the DPSC, including with respect to wholesale power costs, which are a pass-through to its customers.
We are not subject to any RPS, however, DEC is subject to RPS. DEC meets the RPS through purchases of renewable energy credits, and owned and purchased resources pursuant to the 5% or 5 MW exception in its wholesale power contract with us. See “Wholesale Power Contracts” above.
Competition
Delaware and Maryland each have laws unbundling the power component (also known as the generation component) of electric service to retail customers, while maintaining regulation of transmission and distribution services. All retail customers in Delaware, including customers of DEC, are currently permitted to purchase power from a registered supplier only after DEC approves the supplier’s ability to do business in its service territory. All retail customers in Maryland, including customers of CEC, are currently permitted to purchase power from the registered supplier of their choice. As of March 1, 2019, no retail customer of DEC or CEC has switched to an alternative power supplier.
In Virginia, retail choice in the selection of a power supplier is available to customers that consume at least 5 MW of power individually or in the aggregate (with aggregation subject to the approval of the VSCC) and that do not account for more than 1% of the incumbent utility's peak load during the past year. Currently, no customer of our member distribution cooperatives has elected to choose an alternate supplier under this provision. Retail choice is also available to any customer whose noncoincident peak demand exceeds 90 MW. Beginning June 1, 2016, Bear Island, an industrial customer of REC and the only customer of any of our member distribution cooperatives that has noncoincident peak demand that exceeds 90 MW, elected to purchase its power requirements from an alternate supplier. Additionally, all Virginia retail customers are permitted to select an alternative power supplier that provides 100% renewable energy if their incumbent utility, such as one of our member distribution cooperatives, does not offer this same option. As of December 31, 2018, eight of our nine Virginia member distribution cooperatives provided this option.
Currently, we do not anticipate that any of these limited rights to retail choice of our member distribution cooperatives’ customers, individually or in the aggregate, will have a material impact on our financial condition, results of operations, or cash flows.
TEC
TEC is owned by our member distribution cooperatives and currently is our only Class B member. We have a power sales contract with TEC under which we may sell to TEC power that we do not need to meet the needs of our member distribution cooperatives. TEC then sells this power to the market under market-based rate authority granted by FERC. Additionally, we have a separate contract under which we may purchase natural gas from TEC. TEC does not engage in speculative trading.
9
POWER SUPPLY RESOURCES
General
We provide power to our members through a combination of our interests in Wildcat Point, a natural gas-fired combined cycle generation facility; North Anna, a nuclear power station; Clover, a coal-fired generation facility; three natural gas-fired combustion turbine facilities (Louisa, Marsh Run, and prior to September 14, 2018, Rock Springs); diesel-fired distributed generation facilities; and physically-delivered forward power purchase contracts and spot market energy purchases. Our energy supply resources for the past three years were as follows:
Year Ended December 31, 2018 2017 2016 (in MWh and percentages)
Generated: Wildcat Point (1) 3,126,313 23.0% — —% — —%North Anna 1,855,680 13.7 1,870,626 15.7 1,766,491 13.9 Clover 1,437,719 10.6 1,616,377 13.6 2,714,966 21.3 Louisa 544,390 4.0 262,797 2.2 366,274 2.9 Marsh Run 572,434 4.2 472,447 4.0 553,597 4.3 Rock Springs (2) 212,957 1.6 143,571 1.2 362,738 2.8 Distributed Generation 1,434 — 605 — 1,066 —
Total Generated 7,750,927 57.1 4,366,423 36.7 5,765,132 45.2 Purchased:
Other than renewable: Long-term and short-term 2,924,477 21.5 4,913,333 41.3 5,211,045 40.9 Spot market 2,091,063 15.4 1,849,489 15.5 993,413 7.8
Total Other than renewable 5,015,540 36.9 6,762,822 56.8 6,204,458 48.7 Renewable (3) 808,052 6.0 777,505 6.5 782,871 6.1
Total Purchased 5,823,592 42.9 7,540,327 63.3 6,987,329 54.8 Total Available Energy 13,574,519 100.0% 11,906,750 100.0% 12,752,461 100.0%
(1) Wildcat Point achieved commercial operation on April 17, 2018.
(2) We sold our interest in Rock Springs and related assets to EPRS on September 14, 2018.
(3) Related to our contracts from renewable facilities from which we obtain renewable energy credits. We sell these renewable energy credits to our member distribution cooperatives and non-members.
In 2018, our generating facilities satisfied approximately 88.3% of our PJM capacity obligation. For a description of our generating facilities, see “Properties” in Item 2. In 2018, we obtained the remainder of our PJM capacity obligation through the PJM RPM capacity auction process and purchased capacity contracts. See “PJM” below. The energy requirements not met by our owned generating facilities were obtained from multiple suppliers under various long-term and short-term physically-delivered forward power purchase contracts and spot market purchases. See “Power Purchase Contracts” below.
In 2018, our peak demand obligation to our member distribution cooperatives occurred in January and was 3,348 MW.
We plan to continue purchasing energy in the future by utilizing a combination of physically-delivered forward power purchase contracts, as well as spot market purchases. As we have done in the past, we expect to adjust our portfolio of power supply resources to reflect our projected power requirements and changes in the market. To assist us in these efforts, we engage ACES, an energy trading and risk management company. Specifically, ACES assists us in negotiating power purchase contracts, evaluating the credit risk of counterparties, modeling our power requirements, bidding and dispatch of the generating facilities that we operate, and executing and settling energy transactions. See “Quantitative and Qualitative Disclosures About Market Risk” in Item 7A.
10
Power Supply Planning
By utilizing various long-term and short-term planning processes and models, we continually evaluate power supply options available to us to meet the needs of our member distribution cooperatives. We have policies that establish targets that define how our projected power needs will be met, and one of the ways we manage these targets is the utilization of hedging. We use hedging instruments, including forwards, futures, financial transmission rights, and options, to manage our power market price risks. These hedging instruments have varying time periods ranging from one month to multiple years in advance. Additionally, we evaluate other power supply options including the acquisition, development, or disposition of generating facilities.
PJM
PJM is an RTO that coordinates the transmission of wholesale electricity in all or parts of 13 states and the District of Columbia. As a federally regulated RTO, PJM must act independently and impartially in managing the regional transmission system and the wholesale electricity market. PJM is primarily responsible for ensuring the reliability of the largest centrally dispatched energy market in North America. PJM coordinates the continuous buying, selling, and delivery of wholesale electricity throughout its members’ service territories. PJM system operators continuously conduct dispatch operations and monitor the status of the transmission grid of its participants. PJM also oversees a regional planning process for transmission expansion to ensure the continued reliability of the PJM electric system. PJM coordinates and establishes policies for the generation, purchase, and sale of capacity and energy in the control areas of its members.
All of our member distribution cooperatives’ service territories are in PJM. As a member of PJM, we are subject to the operations of PJM, and our generating facilities are under dispatch control of PJM. We transmit power to our member distribution cooperatives through the transmission facilities subject to operational control of PJM. We have agreements with PJM that provide us with access to transmission facilities under PJM’s operational control as necessary to deliver energy to our member distribution cooperatives. We own a limited amount of transmission facilities. See “Properties—Transmission” in Item 2.
PJM balances its participants’ power requirements with the power resources available to supply those requirements. Based on this evaluation of supply and demand, PJM schedules and dispatches available generating facilities throughout its region in a manner intended to meet the demand for energy in the most reliable and cost-effective manner. Thus PJM directs the dispatch of these facilities even though it does not own them. When PJM cannot dispatch the most economical generating facilities due to transmission constraints, PJM will dispatch more expensive generating facilities to meet the required power requirements. PJM participants whose power requirements cause the redispatch are obligated to pay the additional costs to dispatch the more expensive generating facilities. These additional costs are commonly referred to as congestion costs. PJM conducts the auction of financial transmission rights for future periods to provide market participants an opportunity to hedge these congestion costs.
The PJM energy market consists of day-ahead and real-time markets. PJM’s day-ahead market is a forward market in which hourly locational marginal prices are calculated for the following day based on the prices at which the owners of generating facilities, including ODEC, offer to run their facilities to meet the requirements of energy customers. PJM’s real-time market is a spot market in which current locational marginal prices are calculated at five-minute intervals.
PJM rules require that load serving entities, such as ODEC, meet certain minimum capacity obligations. These obligations can be met through a combination of owned generation resources and purchases under bilateral agreements and from forward capacity auctions under PJM’s capacity construct, known as RPM. The purpose of PJM’s capacity construct is to develop a longer-term pricing program for capacity resources, to provide localized pricing for capacity, and to reduce the resulting investment risk to owners of generating resources, thus encouraging new investment in generating facilities. The value of capacity resources can vary by location and RPM provides for the recognition of the locational value. To date, PJM has conducted capacity auctions for capacity to be supplied through May 31, 2022. Each annual auction is held 36 months before each subsequent delivery year, and incremental auctions may be held at prescribed dates after the base residual auction for each delivery year to adjust for changes to the load forecast and the availability of capacity.
11
Concurrent with the PJM delivery year beginning June 1, 2016, the PJM tariff provides for a new component referred to as capacity performance, which is intended to improve the reliability of the power grid by increasing the availability of generating units, especially during emergency conditions. Generation owners, such as ODEC, could earn increased compensation for capacity for some of their generating units and will be exposed to significantly higher charges if their generation units do not perform during emergency conditions. For the PJM delivery year beginning June 1, 2016, qualifying generating units were allowed to be voluntarily offered into PJM’s capacity auction as a capacity performance unit. A unit not offered as a capacity performance unit, known as a base capacity unit, will be excluded from the assessment of the charges for non-performance during the winter months. Starting with the delivery year beginning June 1, 2020, PJM will require the majority of generating resources to be offered as capacity performance units, eliminating the base capacity option. We continue to evaluate our bidding strategy for our generating units for the PJM capacity auctions.
Power Purchase Contracts
We purchase significant amounts of power in the market from investor-owned utilities and power marketers through long-term and short-term physically-delivered forward power purchase contracts. We also purchase power in the spot energy market. This approach to meeting our member distribution cooperatives’ energy requirements is not without risks. See “Risk Factors” in Item 1A. To mitigate these risks, we attempt to match our energy purchases with our energy needs to reduce our spot market purchases of energy and sales of excess energy. Additionally, we utilize policies, procedures, and various hedging instruments to manage our power market price risks. These policies and procedures, developed in consultation with ACES, are designed to strike an appropriate balance between minimizing costs and reducing energy cost volatility. See “Quantitative and Qualitative Disclosures About Market Risk” in Item 7A.
Renewables
We have contracts with companies that own and operate wind, solar, and landfill gas facilities. These contracts allow us to buy output, including renewable energy credits, from the renewable facilities at a predetermined price. We sell these renewable energy credits to our member distribution cooperatives and non-members. We do not own or operate any of these facilities and are not responsible for their operational costs or performance.
Fuel Supply
Natural Gas
Wildcat Point and our combustion turbine facilities are fueled by natural gas and are located adjacent to natural gas transmission pipelines. We are responsible for procuring the natural gas to be used by all of our units at these facilities and have developed and utilize a natural gas supply strategy for providing natural gas. The strategy includes securing transportation contracts and incorporating the ability to use No. 2 distillate fuel oil as a backup fuel for Louisa and Marsh Run. We have identified our primary natural gas suppliers and have negotiated the contracts needed for procurement of physical natural gas. We have put in place strategies and mechanisms to financially hedge our natural gas needs. We anticipate that sufficient supplies of natural gas will be available in the future to support the operation of Wildcat Point and our combustion turbine facilities, but significant price volatility may occur. See “Quantitative and Qualitative Disclosures About Market Risk” in Item 7A.
Nuclear
Virginia Power, as operating agent of North Anna, has the sole authority and responsibility to procure nuclear fuel for the facility. Virginia Power advises us that it primarily uses long-term contracts to support North Anna’s nuclear fuel requirements and that worldwide market conditions are continuously evaluated to ensure a range of supply options at reasonable prices, which are dependent upon the market environment. We are not a direct party to any of these procurement contracts and we do not control their terms or duration. Virginia Power advises us that current agreements, inventories, and spot market availability are expected to support North Anna’s current and planned fuel supply needs for the near term and that additional fuel is purchased as required to attempt to ensure optimal cost and inventory levels.
Under the Nuclear Waste Policy Act of 1982, the DOE is required to provide for the permanent disposal of spent nuclear fuel produced by nuclear facilities, such as North Anna, in accordance with contracts executed with the DOE. The DOE did not begin accepting spent fuel in 1998 as specified in its contract with Virginia Power. As a result, Virginia
12
Power sought reimbursement for certain spent nuclear fuel-related costs incurred and in 2012 signed a settlement agreement with the DOE. See Note 1 of the Notes to Consolidated Financial Statements in Item 8.
Coal
Virginia Power, as operating agent of Clover, has the sole authority and responsibility to procure coal for the facility. Virginia Power advises us that it uses both long-term contracts and short-term spot agreements to acquire the low sulfur bituminous coal used to fuel the facility. We are not a direct party to any of these procurement contracts and we do not control their terms or duration. As of December 31, 2018 and December 31, 2017, based on Clover running at full capacity, there was a 34-day and a 54-day supply of coal, respectively. We anticipate that sufficient supplies of coal will be available in the future to operate the facility when dispatched by PJM. See “Quantitative and Qualitative Disclosures About Market Risk” in Item 7A.
REGULATION
General
We are subject to regulation by FERC and, to a limited extent, state public service commissions. Some of our operations also are subject to regulation by the VDEQ, the Maryland Department of the Environment, the DOE, the NRC, and other federal, state, and local authorities. Compliance with future laws or regulations may increase our operating and capital costs by requiring, among other things, changes in the design or operation of our generating facilities.
Rate Regulation
We establish our rates for power furnished to our member distribution cooperatives pursuant to our formula rate, which has been accepted by FERC. The VSCC, the DPSC, and the MPSC do not have jurisdiction over our rates, charges, and services.
Our formula rate is intended to permit us to collect revenues, which, together with revenues from all other sources, are equal to all of our costs and expenses, plus a targeted amount equal to 20% of our total interest charges, plus additional equity contributions as approved by our board of directors. See “Management’s Discussion and Analysis of Financial Condition and Results of Operations—Factors Affecting Results—Formula Rate” in Item 7. Our current formula rate was accepted by FERC and became effective January 1, 2014, subject to refund, and a final order from FERC was received on March 22, 2018.
FERC may review our rates upon its own initiative or upon complaint and order a reduction of any rates determined to be unjust, unreasonable, or otherwise unlawful and order a refund for amounts collected during such proceedings in excess of the just, reasonable, and lawful rates.
Our charges to TEC are established under our market-based sales tariff filed with FERC.
Other Regulation
In addition to its jurisdiction over rates, FERC also regulates the issuance of securities and assumption of liabilities by us, as well as mergers, consolidations, the acquisition of securities of other utilities, and the disposition of property under FERC jurisdiction. Under FERC regulations, we are prohibited from selling, leasing, or otherwise disposing of the whole of our facilities subject to FERC jurisdiction, or any part of such facilities having a value in excess of $10 million without FERC approval. We are also required to seek FERC approval prior to merging or consolidating our facilities with those of any other entity having a value in excess of $10 million.
The VSCC, the DPSC, and the MPSC oversee the siting of our utility facilities in their respective jurisdictions.
Environmental
We are subject to federal, state, and local laws and regulations, and permits designed to both protect human health and the environment and to regulate the emission, discharge, or release of pollutants into the environment. We believe
13
that we are in material compliance with all current requirements of such environmental laws and regulations and permits. However, as with all electric utilities, the operation of our generating units could be affected by future changes in environmental laws and regulations. We continue to monitor activity related to changes in environmental laws and regulations, including new requirements. Capital expenditures and increased operating costs required to comply with any future regulations could be significant. See “Risk Factors” in Item 1A. Our capital expenditures for environmental improvements at our generating facilities were approximately $5.1 million and $3.8 million in 2018 and 2017, respectively.
Clean Air Act (“CAA”)
Currently, the most significant environmental law affecting our operations is the CAA. The CAA requires, among other things, that owners and operators of fossil fuel-fired power stations limit emissions of SO2, particulate matter, mercury, and NOx. Additionally, regulatory programs are in place for new units and are being proposed for existing units to limit emissions of CO2 and other GHG. Discussed below are certain standards and regulations under the CAA that impact us.
• Cross-State Air Pollution Rule
• Acid Rain Program
• Mercury and Air Toxics Standards
• National Ambient Air Quality Standards
• CO2 New Source Performance Standards for EGUs
• Affordable Clean Energy Rule
• Greenhouse Gas Prevention of Significant Deterioration Permitting
Cross-State Air Pollution Rule (“CSAPR”)
CSAPR requires 27 states and the District of Columbia to significantly improve air quality by reducing power plant SO2 and NOx emissions that contribute to ozone and fine particle pollution in other states. Based upon published allocations/new source set-aside allowances for Virginia and Maryland, we anticipate that we will have to purchase a large number of NOx and a limited number of SO2 CSAPR allowances for Clover. Wildcat Point will apply for new source set-aside NOx allowances from Maryland and will purchase allowances for any emissions that exceed the number of new source set-aside allowances received. Currently, there is an adequate supply of NOx allowances available for purchase for Wildcat Point. The number of set-aside allowances available for Wildcat Point will depend on the number of new sources requesting the allowances. Because the CSAPR allowance market is relatively new, we cannot predict the potential financial impact of such purchases.
Acid Rain Program
Under the CAA’s Acid Rain Program, each of our fossil fuel-fired plants must have SO2 allowances equal to the number of tons of SO2 they emit into the atmosphere annually. The total number of SO2 allowances for all facilities is capped, and individual allowances are issued to facilities on the basis of past utilization and other factors. SO2 allowances issued to individual sources can be traded. As a facility that was built before the Acid Rain Program, Clover receives an annual allocation of SO2 allowances at no cost based upon its baseline operations. Our newer facilities, Louisa, Marsh Run, and Wildcat Point, need to obtain allowances under the Acid Rain Program. Because they are primarily gas-fired generating facilities, the number of SO2 allowances these newer facilities must obtain is typically minimal and can be supplied from any excess SO2 allowances allocated to Clover.
Mercury and Air Toxics Standards (“MATS”)
MATS regulates mercury, acid gases, and other air toxic organic compounds from coal and oil-fired power plants. Coal and oil-fired power plants were required to meet maximum achievable control technology standards to control the pollutants regulated by MATS by April 16, 2015. Clover has demonstrated compliance with this rule and continues to submit periodic reports. We do not anticipate that any additional emissions control measures will be required to continue
14
to comply with MATS due to the existing pollution control equipment, which removes greater than 90% of the mercury emitted from the facility.
National Ambient Air Quality Standards (“NAAQS”)
As part of the NAAQS, states will be required to develop and implement plans to address sources emitting pollutants which contribute to the formation of ozone. In November 2016, the EPA published the proposed designations and SIP requirements for implementation. The EPA finalized the designations of the 2015 ozone NAAQS in June 2018. Compliance requirements are dependent upon the attainment designation and we currently anticipate that compliance may begin in 2020 and go through 2027. We currently do not anticipate any emissions control requirement changes for our existing facilities. The EPA is still developing the implementation guidance related to the NAAQS. We will continue to follow this rulemaking in order to determine potential impacts related to our facilities.
CO2 New Source Performance Standards for EGUs
In 2015, the EPA finalized the national standards for CO2 emissions from new fossil fuel-fired electric generating units under 111(b) of the CAA. The standards limit CO2 emissions from new fossil fuel-fired electric generating units, newly constructed and reconstructed fossil fuel-fired stationary combustion turbines, and baseload natural gas-fired units. This rule would affect permitting and operational requirements applicable to new, fossil fuel-fired facilities. We do not currently know the cost of compliance or the extent of control requirements that might be applicable to any future facilities.
Affordable Clean Energy Rule (“ACE”)
The Clean Power Plan, which took effect December 23, 2015, was stayed on February 9, 2016, by the courts. On October 16, 2017, the EPA proposed a rule to repeal the Clean Power Plan and on August 21, 2018, a replacement rule for the Clean Power Plan, ACE, was proposed. If implemented, ACE requires that each state implement plans to meet state-specific carbon emissions reductions. We have ownership interests in generating facilities in Virginia and Maryland and are exposed to the impact of inconsistent standards between states as well as the uncertainty of the implementation plans. We are closely monitoring the rulemaking related to ACE, and we currently cannot predict the impact of ACE on our existing facilities due to the uncertainties and complexities of the regulations and the unclear status of efforts to repeal the Clean Power Plan.
Greenhouse Gas Prevention of Significant Deterioration Permitting
In 2010, the EPA issued the Tailoring Rule to address GHG emissions from stationary sources under the CAA permitting programs. The final rule set thresholds for GHG emissions that define when permits under the New Source Review Prevention of Significant Deterioration and Title V Operating Permit programs are required for new and existing industrial facilities. Regulation of GHG emissions may affect the future renewal of Title V Operating Permits for Clover, Louisa, Marsh Run, and Wildcat Point, as the rules will require that existing facilities quantify their GHGs emissions and may establish limits in their reissued operating permits.
Regional Greenhouse Gas Initiative (“RGGI”)
RGGI provides for a cap-and-trade program to regulate CO2 emissions among participating northeastern and Mid-Atlantic States, including Delaware and Maryland. We are required to purchase RGGI CO2 allowances for each ton of CO2 emitted by Wildcat Point. We anticipate that Wildcat Point will apply for and be awarded a portion of the allowances from the Maryland clean generation set-aside account through the year 2022. We continue to project that there will be an adequate quantity of CO2 allowances available for purchase to support Wildcat Point. We currently expect that Virginia will be joining RGGI through linkage or direct auction. See “Virginia CO2 Regulation” below.
15
Virginia CO2 Regulation
The governor of the Commonwealth of Virginia issued an executive directive on May 16, 2017, directing VDEQ to develop a proposed regulation by the end of 2017 to abate, control, or limit CO2 emissions from electric power facilities. The proposed rule was presented to the Virginia Air Pollution Control Board for approval and was subsequently published in the Virginia Register of Regulations on January 8, 2018, with a 90-day public comment period. After the comment period, a re-proposal of the regulation was made to the Virginia Air Pollution Control Board and on October 29, 2018, it approved the publication and an additional public comment period. On February 4, 2019, the re-proposed regulation was published with a final rule expected by mid-year. The major initial implementation components of the regulation include: (1) the linkage to RGGI through a consignment auction, and (2) a provision allowing direct auction of allowances without consignment in accordance with any requirements established by the Virginia General Assembly. In the case of a direct auction, the auction proceeds would be distributed as directed by the Virginia General Assembly. There is considerable uncertainty as to the impact on ODEC’s Virginia facilities given (1) the proposed consignment auction approach has never been used before under the RGGI model, (2) all other participating RGGI states have deregulated electric markets, and (3) the reduction in the initial Virginia budget cap in relation to the overall RGGI cap. We will be providing significant comment on this re-proposed rule and will be following the process closely.
Clean Water Act
The Clean Water Act and applicable state laws regulate water intake structures, discharges of cooling water, storm water runoff, and other wastewater discharges at our generating facilities. Our water permits are subject to periodic review and renewal proceedings, and can be made more restrictive over time. Limitations on the thermal discharges in cooling water, or withdrawal of cooling water during low flow conditions, can restrict our operations. In 2013, the EPA proposed revising limits on certain toxic pollutants that would require most steam electric (including coal and combined cycle, natural gas) facilities to strengthen existing, or implement new, controls to manage water discharges from their sites. The final rule, known as the Steam Electric Effluent Limitation Guidelines, revised the guidelines to set the first limits on the levels of toxic metals in wastewater that can be discharged from power plants. The final rule sets new or additional requirements for wastewater streams from flue gas desulfurization, fly ash, bottom ash, flue gas mercury control, and gasification of fuels such as coal and petroleum coke.
In 2016, several industry parties represented by the Utility Water Act Group filed briefs in a proceeding objecting to the final rule. The briefs alleged several instances where it is believed that the EPA violated standards and procedures in producing the guidelines. On September 13, 2017, a final rule was issued postponing compliance dates for “best available technology economically achievable” effluent limitations and pretreatment standards for two waste streams of existing sources, bottom ash transport water and flue-gas desulfurization wastewater, for a period of two years. The EPA has announced a timetable for proposed rules to be published in March of 2019 with the final rule expected by late 2019 or early 2020.
We do not currently expect there to be a significant impact on facility operations. We are currently in compliance and will continue to follow this rulemaking in order to determine potential future impacts related to our facilities.
Resource Conservation and Recovery Act, as amended (“RCRA”)
The EPA regulates CCRs under the RCRA to address the risks from disposal of CCRs generated by coal combustion at electric generating facilities. The regulations governing the “Disposal of Coal Combustion Residuals for Electric Utilities” address risks related to coal ash disposal, such as leaking of contaminants into groundwater, blowing of contaminants into the air as dust, and the catastrophic failure of coal ash surface impoundments. The regulations establish technical requirements for CCR landfills and surface impoundments, and for monitoring and cleanup of affected soil or groundwater. Virginia Power, as operator of Clover, is currently making modifications to Clover to comply with RCRA. Also, under the regulations, facilities are subject to recordkeeping requirements, requirements to notify the state, and a requirement to develop and maintain a publicly available internet site containing information on its actions to comply with the elements of the final rule.
Since the regulations were adopted, the EPA has proposed revisions that are risk-based and would extend the compliance deadlines. We currently anticipate final revisions to the regulations in 2019. We continue to monitor these revisions to the regulations and the potential impact on the operations at Clover.
16
Future Regulation
New legislative and regulatory proposals are frequently introduced on both the federal level and state level that would modify the environmental regulatory programs applicable to our facilities. Changing regulatory requirements can increase our capital and operating costs and adversely affect the ability to operate our existing facilities, as well as restrict the construction of new facilities.
ITEM 1A. – RISK FACTORS
RISK FACTORS
The following risk factors and all other information contained in this report should be considered carefully when evaluating ODEC. These risk factors could affect our actual results and cause these results to differ materially from those expressed in any forward-looking statements of ODEC. Other risks and uncertainties, in addition to those that are described below, may also impair our business operations. We consider the risks listed below to be material, but you may view risks differently than we do and we may omit a risk that we consider immaterial but you consider important. An adverse outcome of any of the following risks could materially affect our business or financial condition. These risk factors should be read in conjunction with the other detailed information set forth elsewhere in this report, including “Management’s Discussion and Analysis of Financial Condition and Results of Operations” in Item 7, including “Caution Regarding Forward-looking Statements,” and the notes to Consolidated Financial Statements.
Our financial condition is largely dependent upon our member distribution cooperatives.
Our financial condition is largely dependent upon our member distribution cooperatives satisfying their obligations to us under the wholesale power contract that each has executed with us. The wholesale power contracts require our member distribution cooperatives to pay us for power furnished to them in accordance with our FERC formula rate. Our board of directors, which is composed of representatives of our members, can approve changes in the rates we charge to our member distribution cooperatives without seeking FERC approval, with limited exceptions. In 2018, 63.1% of our revenues from sales to our member distribution cooperatives were received from our three largest members, REC, SVEC, and DEC.
Our member distribution cooperatives’ ability to collect their costs from their members may have an impact on our financial condition. Economic conditions may make it difficult for some customers of our member distribution cooperatives to pay their power bills in a timely manner, which could ultimately affect the timeliness of our member distribution cooperatives’ payments to us.
We rely on purchases of fuel and energy from other suppliers which exposes us to market price risk and could increase our operating costs.
We supply our member distribution cooperatives with all of their power (energy and demand) requirements, with limited exceptions. Our costs to provide this energy and demand are passed through to our member distribution cooperatives under our wholesale power contracts. We obtain the power to serve their requirements from our generating facilities and purchases of power from other power suppliers.
We are subject to changes in fuel costs for our generating facilities, which could increase the cost of generating power. We are also exposed to changes in purchased power costs. Increases in fuel costs and purchased power costs increase the cost to our member distribution cooperatives. Factors that could influence fuel and purchased power costs include:
• weather;
• supply and demand;
• the availability of competitively priced alternative energy sources;
• constraints related to the transportation of fuels;
• price competition among fuels used to produce electricity, including natural gas, coal, and oil;
17
• availability and efficient operation of our generating facilities;
• energy transmission capacity constraints;
• the impact of implementation of new technologies in the power industry, such as batteries;
• federal, state, and local energy and environmental regulation and legislation, including increased regulation of the extraction of natural gas and coal; and
• natural disasters, war, terrorism, and other catastrophic events.
Historically, our power supply strategy had relied substantially on purchases of energy from other power suppliers. However, in 2018, our Wildcat Point generation facility achieved commercial operation, which increased our purchases of fuel and reduced our reliance on purchases of energy. In 2018, we purchased approximately 42.9% of our energy resources. These purchases consisted of a combination of purchases under physically-delivered forward contracts and purchases of energy in the spot market. Our reliance on purchases of energy from other suppliers will continue in the future. Our reliance on energy purchases could also increase because the operation of our generating facilities is subject to many risks, including changes in their dispatch, shutdown, or breakdown or failure of equipment.
Purchasing power helps us mitigate high fixed costs related to the ownership of generating facilities but exposes us to significant market price risk because energy prices can fluctuate substantially. When we enter into long-term power purchase contracts or agree to purchase energy at a date in the future, we utilize our judgment and assumptions in our models. Our judgment and assumptions relate to factors such as future demand for power and market prices of energy and the price of commodities, such as natural gas, used to generate electricity. Our models cannot predict what will actually occur and our results may vary materially from what our models forecast, which may in turn impact our resulting costs to our members. Our models become less reliable the further into the future that the estimates are made. Although we have developed strategies to attempt to meet our power requirements in an economical manner and we have implemented a hedging strategy to limit our exposure to variability in the market, we still may purchase energy at a price which is higher than other utilities’ costs of generating energy or future market prices of energy. For further discussion of our market price risk, see “Quantitative and Qualitative Disclosures About Market Risk” in Item 7A.
Technological advancements and other changes impacting power requirements of our member distribution cooperatives’ customers may reduce demand for power from us.
Technological advancements are occurring in the electric industry, including advancements related to self-generation and distributed energy technologies. Distributed energy technologies include fuel cells, batteries, micro turbines, wind turbines and solar cells. The increased adoption of these technologies and a greater degree of the adoption of energy efficiency technology and conservation by our member distribution cooperatives’ customers, along with the impact of regional economic conditions, could reduce our member distribution cooperatives’ demand for power from us and cause our long-term load expectations to be materially less than planned.
Environmental regulation may limit our operations or increase our costs or both.
We are required to comply with numerous federal, state, and local laws and regulations, relating to the protection of the environment. We believe that we have obtained all material environmental approvals currently required to own and operate our existing facilities or that necessary approvals have been applied for and will be issued in a timely manner. We may incur significant additional costs because of compliance with these requirements. Failure to comply with environmental laws and regulations could have a material effect on us, including potential civil or criminal liability and the imposition of fines or expenditures of funds to bring our facilities into compliance. Delay in obtaining, or failure to obtain and maintain in effect, any environmental approvals, or the delay or failure to satisfy any applicable environmental regulatory requirements related to the operation of our existing facilities or the sale of energy from these facilities could result in significant additional cost to us.
18
The Clean Power Plan, which took effect December 23, 2015, was stayed on February 9, 2016, by the courts. On October 16, 2017, the EPA proposed a rule to repeal the Clean Power Plan and on August 21, 2018, a replacement rule for the Clean Power Plan, ACE, was proposed. If implemented, ACE requires that each state implement plans to meet state-specific carbon emissions reductions. We have ownership interests in generating facilities in Virginia and Maryland and are exposed to the impact of inconsistent standards between states as well as the uncertainty of the implementation plans. We are closely monitoring the rulemaking related to ACE, and we currently cannot predict the impact of ACE on our existing facilities due to the uncertainties and complexities of the regulations and the unclear status of efforts to repeal the Clean Power Plan.
Regulation has been proposed in Virginia that would abate, control, or limit CO2 from electric power facilities. This proposed regulation could result in increased costs to generate power in Virginia. See “Item 1 Business—Regulation—Virginia CO2 Regulation.”
We cannot predict the cost or the effect of any future environmental legislation or regulation. New environmental laws or regulations, the revision or reinterpretation of existing environmental laws or regulations, or penalties imposed for non-compliance with existing environmental laws or regulations may require us to incur additional expenses and could have a material adverse effect on the cost of power we supply our member distribution cooperatives. See “Regulation—Environmental” in Item 1.
We are subject to risks associated with owning an interest in a nuclear generating facility.
We have an 11.6% undivided ownership interest in North Anna, which provided approximately 13.7% of our energy requirements in 2018. Ownership of an interest in a nuclear generating facility involves risks, including:
• potential liabilities relating to harmful effects on the environment and human health resulting from the operation of the facility and the storage, handling, and disposal of radioactive materials;
• significant capital expenditures relating to maintenance, operation, and repair of the facility, including repairs required by the NRC;
• limitations on the amounts and types of insurance commercially available to cover losses that might arise in connection with operation of the facility;
• liability for damages resulting from nuclear incidents at facilities owned by others pursuant to the Price-Anderson Act of 1988, which can result in retroactive nuclear insurance premiums; and
• uncertainties regarding the technological and financial aspects of decommissioning a nuclear plant at the end of its licensed life.
The NRC has broad authority under federal law to impose licensing and safety-related requirements for the operation of North Anna. If the facility is not in compliance, the NRC may impose fines or shut down the units until compliance is achieved, or both depending upon its assessment of the situation. Revised safety requirements issued by the NRC have, in the past, necessitated substantial capital expenditures at other nuclear generating facilities. North Anna’s operating and safety procedures may be subject to additional federal or state regulatory scrutiny as a result of worldwide events related to nuclear facilities. In addition, if a serious nuclear incident at North Anna did occur, it could have a material but presently indeterminable adverse effect on our operations or financial condition. Further, any unexpected shut down at North Anna as a result of regulatory non-compliance or unexpected maintenance will require us to purchase replacement energy.
19
We may have operational deficiencies or catastrophic events related to our generating facilities.
The operation of our generating or transmission facilities involves risks, including the breakdown or failure of power generation equipment, transmission lines, pipes or other equipment or processes, fuel supply delivery, and performance below expected levels of output or efficiency. The occurrence of any of these events could result in:
• substantial charges assessed by PJM as a result of the expectation that generating facilities would be available if called upon to be dispatched;
• significant additional capital expenditures to repair or replace the affected facilities; or
• the purchase of potentially more costly replacement power on the open market.
We may not complete generating facility construction projects that we commence, or we may complete such projects on materially different terms or timing than initially anticipated and we may not be able to achieve the intended benefits of any such projects, if completed.
Construction projects, such as investments in generating assets, carry with them the risk that decisions made today can have implications well into the future. Failure to anticipate market, technology, and regulatory risks regarding particular capital assets can impact their cost to operate and value in the future. Construction carries with it risks relating to timely completion and operational effectiveness. We may not be able to complete the construction or expansion projects on time or at all as a result of weather conditions, delays in obtaining or failure to obtain regulatory approvals, delays in obtaining key materials, labor difficulties, other construction delays, difficulties with partners, contractors, or suppliers, or other factors beyond our control. Even if the construction and expansion projects are completed, the total costs of the construction and expansion projects may be higher than anticipated and the performance of our business following the construction and expansion projects may not meet expectations. Further, we may not be able to timely and effectively integrate the construction and expansion projects into our operations, or the integration may result in unforeseen operating difficulties or unanticipated costs. Any of these or other factors could adversely affect our ability to realize the anticipated benefits from construction and expansion projects.
We are currently in litigation with the EPC contractor, WOPC, for the construction of Wildcat Point. Unfavorable resolution of this legal proceeding could increase our costs associated with the construction of the project. See “Legal Proceedings—Wildcat Point” in Item 3.
If we are unable to protect our information systems against service interruption, misappropriation of data, or breaches of security, our operations could be disrupted and our reputation may be damaged.
We operate in a highly regulated industry that requires the continued operation of advanced information technology systems and network infrastructure. We rely on networks, information systems, and other technology, including the internet and third-party hosted servers, to support a variety of business processes and activities. Cyber security incidents could compromise our information related to our generating facilities and could adversely affect our ability to operate or manage our facilities effectively. We also use third-party vendors to electronically process certain of our business transactions. Information systems, both ours and those of third-party information processors, are vulnerable to cyber security breach. Our generating facilities and information technology systems, or those of Virginia Power, the co-owner of North Anna and Clover, could be directly or indirectly affected by deliberate or unintentional cyber incidents. These incidents may be caused by failures during routine operations such as system upgrades or user errors, as well as network or hardware failures, malicious or disruptive software, computer hackers, rogue employees or contractors, cyber-attacks by criminal groups or activist organizations, geopolitical events, natural disasters, failures or impairments of telecommunications networks, or other catastrophic events. In addition, such incidents could result in unauthorized disclosure of material confidential information, including personal information or sensitive business information.
If our technology systems are breached or otherwise fail, we may be unable to fulfill critical business functions, including the operation of our generating facilities and our ability to effectively maintain certain internal controls over financial reporting. Further, our generating facilities rely on an integrated transmission system, a disruption of which could negatively impact our ability to deliver power to our member distribution cooperatives. A major cyber incident could result in significant business disruption and expense to repair security breaches or system damage and could lead to
20
litigation, regulatory action, including penalties or fines, and an adverse effect on our reputation. We also may have future compliance obligations related to new mandatory and enforceable NERC reliability standards which address the impacts of geomagnetic disturbances and other physical security risks to the reliable operation of the bulk power system.
Counterparties under power purchase and natural gas arrangements may fail to perform their obligations to us.
Because we rely substantially on the purchase of energy and natural gas from other suppliers, we are exposed to the risk that counterparties will default in performance of their obligations to us. On an on-going basis, we analyze and monitor the default risks of counterparties and other credit issues related to these purchases, and we may require our counterparties to post collateral with us; however, defaults may still occur. Defaults may take the form of failure to physically deliver the purchased energy or natural gas. If a default occurs, we may be forced to enter into alternative contractual arrangements or purchase energy or natural gas in the forward or spot markets at then-current market prices that may exceed the prices previously agreed upon with the defaulting counterparty.
The use of hedging instruments could impact our liquidity.
We use various hedging instruments, including forwards, futures, financial transmission rights, and options, to manage our power market price risks. These hedging instruments generally include collateral requirements that require us to deposit funds or post letters of credit with counterparties when a counterparty’s credit exposure to us is in excess of agreed upon credit limits. When commodity prices decrease to levels below the levels where we have hedged future costs, we may be required to use a material portion of our cash or revolving credit facility to cover these collateral requirements.
Adverse changes in our credit ratings may require us to provide credit support for some of our obligations and could negatively impact our liquidity and our ability to access capital.
S&P, Moody’s, and Fitch currently rate our outstanding obligations issued under our Indenture at “A+,” “A2,” and “A,” respectively. Additionally, we have an issuer credit rating of “A+” from S&P, and an implied senior unsecured rating of “A” from Fitch. If these agencies were to downgrade our ratings, particularly below investment grade, we may be required to deposit funds or post letters of credit related to our power purchase arrangements, which may reduce our available liquidity and impact our access to future liquidity resources. To the extent that we would have to provide additional credit support as a result of a downgrade in our credit ratings, our ability to access additional credit may be limited and our liquidity may be materially impaired. Also, we may be required to pay higher interest rates on our revolving credit facility and financings that we may need to undertake in the future, and our potential pool of investors and funding sources could decrease.
War, acts and threats of terrorism, sabotage, natural disaster, and other significant events could adversely affect our operations.
We cannot predict the impact that any future terrorist attack, sabotage, or natural disaster may have on the energy industry in general, or on our business in particular. Infrastructure facilities, such as electric generating, transmission, and distribution facilities, and RTOs, could be direct targets of, or indirect casualties of, an act of terror, or sabotage. The physical compromise of our facilities could adversely affect our ability to operate or manage our facilities effectively. Additionally, any military strikes or sustained military campaign may affect the operation of our facilities in unpredictable ways, such as changes in financial markets, and disruptions of fuel supplies and energy markets. Instability in financial markets as a result of terrorism, war, sabotage, natural disasters, pandemic, credit crises, recession, or other factors could have a significant negative effect on the U.S. economy, and in the increased cost of financing and insurance coverage, which could negatively impact our results of operations and financial condition.
Failure to comply with regulatory reliability standards, and other regulatory requirements could subject us to substantial monetary penalties.
As a result of EPACT, owners, operators, and users of bulk electric systems, including ODEC, are subject to mandatory reliability standards enacted by NERC and its regional entities, and enforced by FERC. We must follow these standards, which are in place to require that proper functions are performed to ensure the reliability of the bulk power system. Although the standards are developed by the NERC Standards Committee, which includes representatives of

21
various electric energy sectors, and must be just and reasonable, the standards are legally binding and compliance may require increased capital expenditures and costs to provide electricity to our member distribution cooperatives under our wholesale power contracts. If we are found to be in non-compliance with any mandatory reliability standards we could be subject to sanctions, including potentially substantial monetary penalties. New, revised or reinterpreted laws or regulations related to reliability standards or participation in wholesale power markets could also result in substantial monetary penalties if ODEC is found to have violated or failed to comply with applicable standards, laws, and regulations.
Poor market performance will affect the asset values in our nuclear decommissioning trust and our defined benefit retirement plans, which may increase our costs.
We are required to maintain a funded trust to satisfy our future obligation to decommission North Anna. A decline in the market value of those assets due to poor investment performance or other factors may increase our funding requirements for these obligations which may increase our costs.
We participate in the NRECA Retirement Security Plan and the Deferred Compensation Pension Restoration Plan. The cost of these plans is funded by our payments to NRECA. Poor performance of investments in these benefit plans may increase our costs to make up our allocable portion of any underfunding.
Potential changes in accounting practices may adversely affect our financial results.
We cannot predict the impact that future changes in accounting standards or practices may have on public companies in general, the energy industry, or our operations specifically. New accounting standards could be issued that could change the way we record revenues, expenses, assets, and liabilities. These changes in accounting standards could adversely affect our reported earnings or could increase reported liabilities.
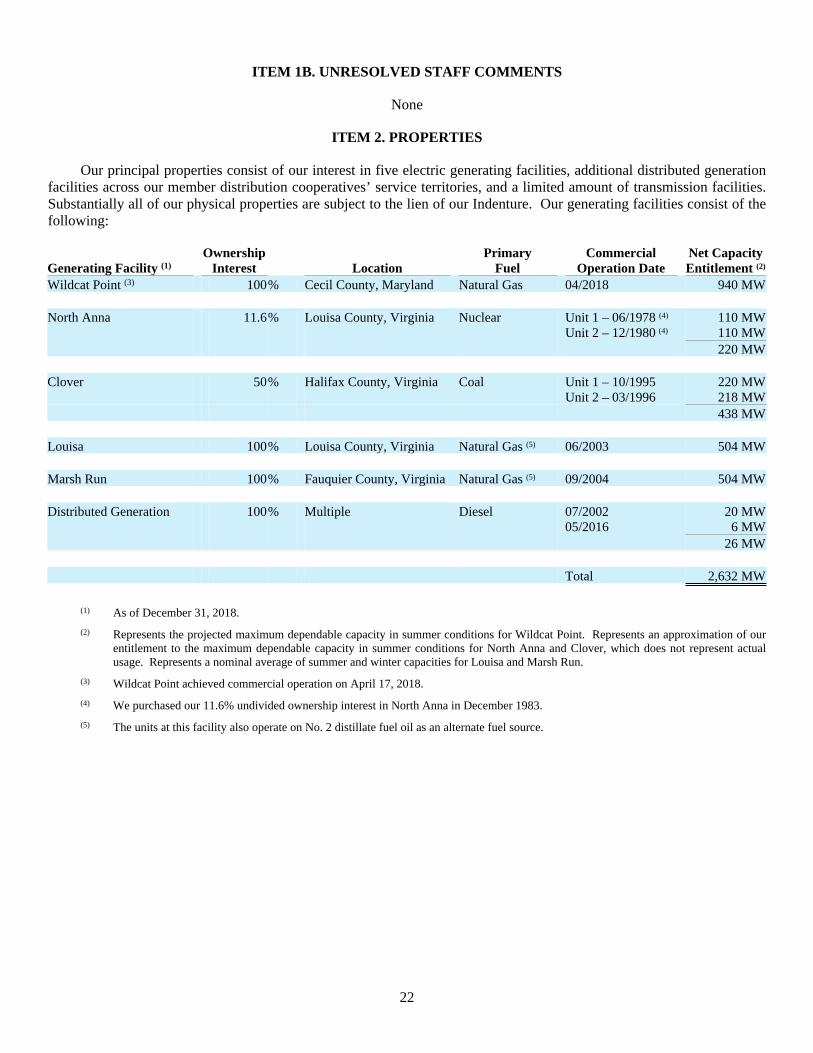
22
ITEM 1B. UNRESOLVED STAFF COMMENTS
None
ITEM 2. PROPERTIES
Our principal properties consist of our interest in five electric generating facilities, additional distributed generation facilities across our member distribution cooperatives’ service territories, and a limited amount of transmission facilities. Substantially all of our physical properties are subject to the lien of our Indenture. Our generating facilities consist of the following:
Generating Facility (1) Ownership
Interest Location Primary
Fuel Commercial
Operation Date Net CapacityEntitlement (2)
Wildcat Point (3) 100% Cecil County, Maryland Natural Gas 04/2018 940 MW North Anna
11.6%
Louisa County, Virginia
Nuclear
Unit 1 – 06/1978 (4)
Unit 2 – 12/1980 (4) 110 MW110 MW
220 MW Clover
50%
Halifax County, Virginia
Coal
Unit 1 – 10/1995Unit 2 – 03/1996
220 MW218 MW
438 MW Louisa 100% Louisa County, Virginia Natural Gas (5) 06/2003 504 MW Marsh Run 100% Fauquier County, Virginia Natural Gas (5) 09/2004 504 MW Distributed Generation
100%
Multiple
Diesel
07/200205/2016
20 MW6 MW
26 MW Total 2,632 MW
(1) As of December 31, 2018.
(2) Represents the projected maximum dependable capacity in summer conditions for Wildcat Point. Represents an approximation of our entitlement to the maximum dependable capacity in summer conditions for North Anna and Clover, which does not represent actual usage. Represents a nominal average of summer and winter capacities for Louisa and Marsh Run.
(3) Wildcat Point achieved commercial operation on April 17, 2018.
(4) We purchased our 11.6% undivided ownership interest in North Anna in December 1983.
(5) The units at this facility also operate on No. 2 distillate fuel oil as an alternate fuel source.
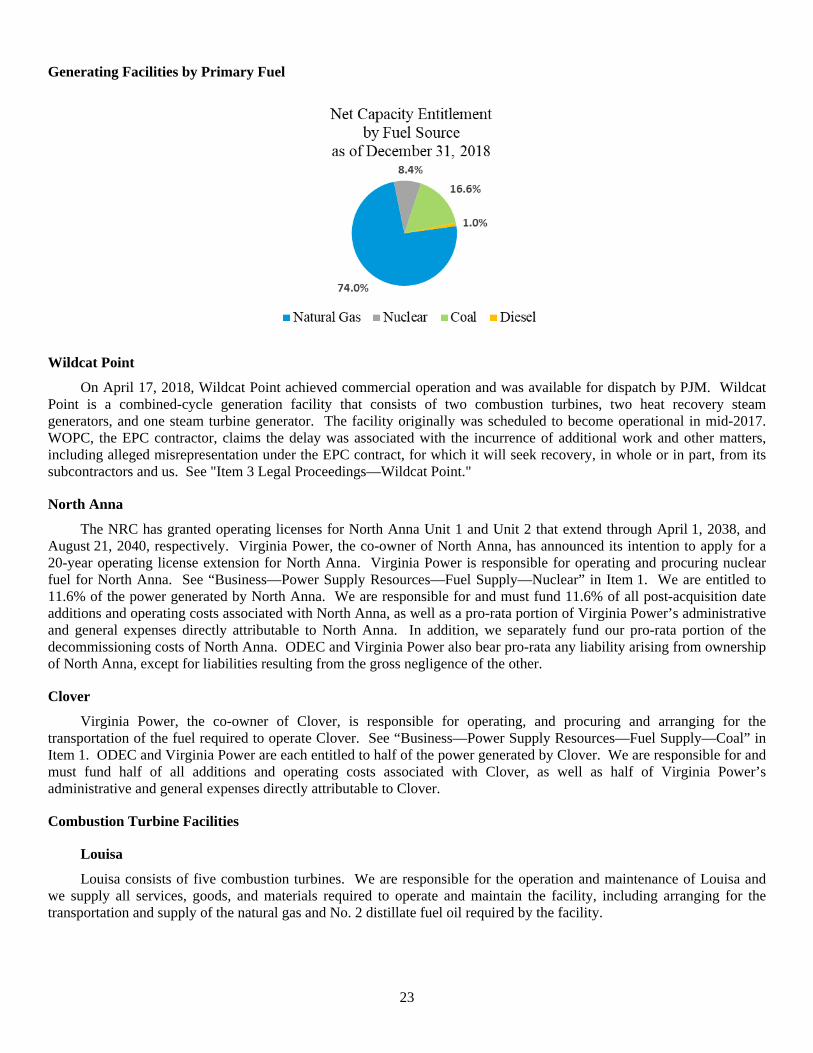
23
Generating Facilities by Primary Fuel
Wildcat Point
On April 17, 2018, Wildcat Point achieved commercial operation and was available for dispatch by PJM. Wildcat Point is a combined-cycle generation facility that consists of two combustion turbines, two heat recovery steam generators, and one steam turbine generator. The facility originally was scheduled to become operational in mid-2017. WOPC, the EPC contractor, claims the delay was associated with the incurrence of additional work and other matters, including alleged misrepresentation under the EPC contract, for which it will seek recovery, in whole or in part, from its subcontractors and us. See "Item 3 Legal Proceedings—Wildcat Point."
North Anna
The NRC has granted operating licenses for North Anna Unit 1 and Unit 2 that extend through April 1, 2038, and August 21, 2040, respectively. Virginia Power, the co-owner of North Anna, has announced its intention to apply for a 20-year operating license extension for North Anna. Virginia Power is responsible for operating and procuring nuclear fuel for North Anna. See “Business—Power Supply Resources—Fuel Supply—Nuclear” in Item 1. We are entitled to 11.6% of the power generated by North Anna. We are responsible for and must fund 11.6% of all post-acquisition date additions and operating costs associated with North Anna, as well as a pro-rata portion of Virginia Power’s administrative and general expenses directly attributable to North Anna. In addition, we separately fund our pro-rata portion of the decommissioning costs of North Anna. ODEC and Virginia Power also bear pro-rata any liability arising from ownership of North Anna, except for liabilities resulting from the gross negligence of the other.
Clover
Virginia Power, the co-owner of Clover, is responsible for operating, and procuring and arranging for the transportation of the fuel required to operate Clover. See “Business—Power Supply Resources—Fuel Supply—Coal” in Item 1. ODEC and Virginia Power are each entitled to half of the power generated by Clover. We are responsible for and must fund half of all additions and operating costs associated with Clover, as well as half of Virginia Power’s administrative and general expenses directly attributable to Clover.
Combustion Turbine Facilities
Louisa
Louisa consists of five combustion turbines. We are responsible for the operation and maintenance of Louisa and we supply all services, goods, and materials required to operate and maintain the facility, including arranging for the transportation and supply of the natural gas and No. 2 distillate fuel oil required by the facility.
24
Marsh Run
Marsh Run consists of three combustion turbines. We are also responsible for the operation and maintenance of Marsh Run and we supply all services, goods, and materials required to operate and maintain the facility, including arranging for the transportation and supply of the natural gas and No. 2 distillate fuel oil required by the facility.
Rock Springs
On September 14, 2018, we sold our interest in Rock Springs and related assets to EPRS for $115 million. Prior to the sale, we and EPRS had each individually owned two natural gas-fired combustion turbine units and a 50% undivided interest in related common facilities at Rock Springs.
Distributed Generation Facilities
We have six distributed generation facilities in our member distribution cooperatives’ service territories primarily to enhance our system’s reliability. We have 14 MW and 12 MW of distributed generation to serve our member distribution cooperatives in the Virginia mainland territory and the Delmarva Peninsula territory, respectively.
Transmission
We own approximately 110 miles of transmission lines on the Virginia portion of the Delmarva Peninsula. As a transmission owner in PJM, we have relinquished dispatch control of these transmission facilities to PJM and contracted with third parties to operate and maintain them.
Indenture
The Indenture grants a lien on substantially all of our real property and tangible personal property and some of our intangible personal property in favor of the trustee, with limited exceptions. The obligations outstanding under the Indenture, including all of our long-term indebtedness, are secured equally and ratably by the trust estate under the Indenture.
ITEM 3. LEGAL PROCEEDINGS
Recovery of Costs from PJM
In 2014, we filed a petition at FERC seeking recovery from PJM of approximately $14.9 million of unreimbursed costs, which were incurred during the first quarter of 2014 related to the dispatch of our combustion turbine facilities. In 2015, FERC denied our petition, we filed a request for rehearing, and FERC issued an order granting rehearing for the limited purpose of FERC's further consideration of the matter. In 2016, FERC denied our request for rehearing and, on June 15, 2018, the United States Court of Appeals for the District of Columbia Circuit denied our Petition for Review. We are pursuing this matter in the Circuit Court for the County of Henrico in the Commonwealth of Virginia. We have not recorded a receivable related to this matter.
Wildcat Point
On April 17, 2018, Wildcat Point achieved commercial operation and was available for dispatch by PJM. The facility originally was scheduled to become operational in mid-2017. WOPC, a joint venture between PCL Industrial Construction Company and Sargent & Lundy, L.L.C., as the EPC contractor, claims the delay was associated with the incurrence of additional work and other matters, including alleged misrepresentation in the EPC contract, for which it will seek recovery, in whole or in part, from its subcontractors and us. In 2017, WOPC filed a complaint against Alstom and us, in the United States District Court for the District of Maryland. Venue was later transferred from the United States District Court for the District of Maryland to the United States District Court for the Eastern District of Virginia. We have reviewed the asserted claims of WOPC against us and believe they are without merit. We have not recorded any liability related to these claims as we do not believe any liability is estimable or probable. We intend to vigorously defend against these claims.
Additionally, in 2017, we filed a complaint in the United States District Court for the Eastern District of Virginia against WOPC, alleging that WOPC breached the EPC contract. Later that year, the United States District Court for the
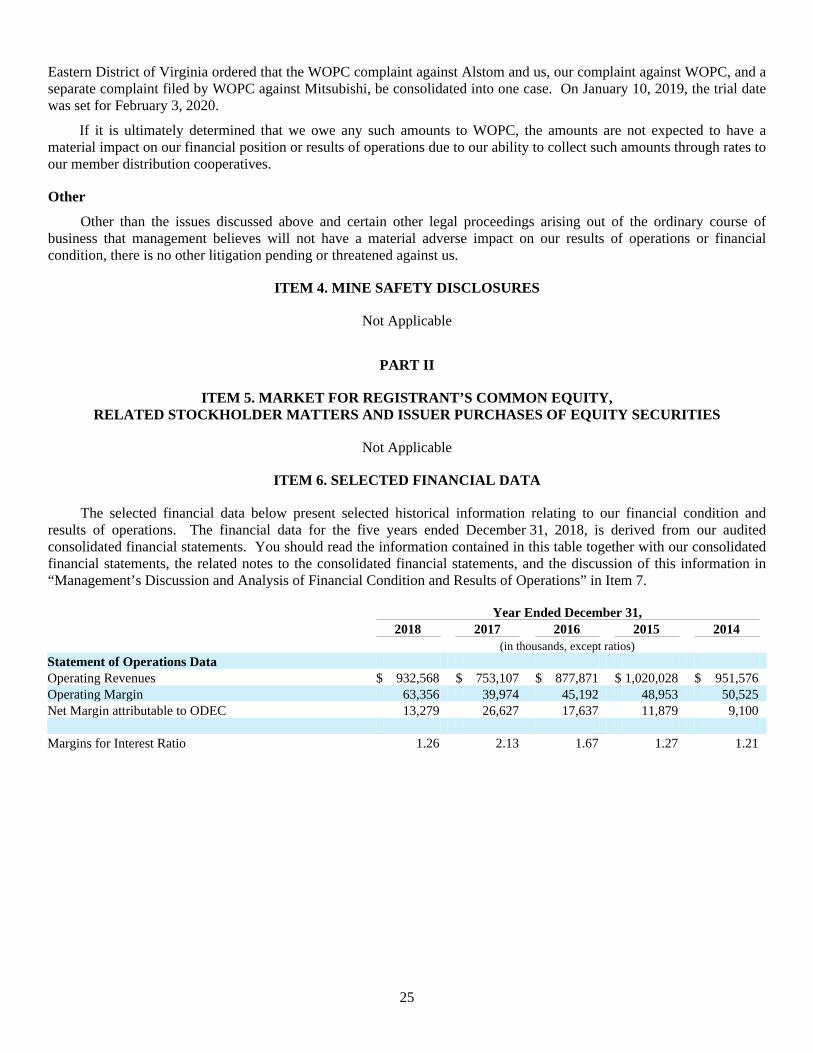
25
Eastern District of Virginia ordered that the WOPC complaint against Alstom and us, our complaint against WOPC, and a separate complaint filed by WOPC against Mitsubishi, be consolidated into one case. On January 10, 2019, the trial date was set for February 3, 2020.
If it is ultimately determined that we owe any such amounts to WOPC, the amounts are not expected to have a material impact on our financial position or results of operations due to our ability to collect such amounts through rates to our member distribution cooperatives.
Other
Other than the issues discussed above and certain other legal proceedings arising out of the ordinary course of business that management believes will not have a material adverse impact on our results of operations or financial condition, there is no other litigation pending or threatened against us.
ITEM 4. MINE SAFETY DISCLOSURES
Not Applicable
PART II
ITEM 5. MARKET FOR REGISTRANT’S COMMON EQUITY,RELATED STOCKHOLDER MATTERS AND ISSUER PURCHASES OF EQUITY SECURITIES
Not Applicable
ITEM 6. SELECTED FINANCIAL DATA
The selected financial data below present selected historical information relating to our financial condition and results of operations. The financial data for the five years ended December 31, 2018, is derived from our audited consolidated financial statements. You should read the information contained in this table together with our consolidated financial statements, the related notes to the consolidated financial statements, and the discussion of this information in “Management’s Discussion and Analysis of Financial Condition and Results of Operations” in Item 7.
Year Ended December 31, 2018 2017 2016 2015 2014 (in thousands, except ratios)
Statement of Operations Data Operating Revenues $ 932,568 $ 753,107 $ 877,871 $ 1,020,028 $ 951,576 Operating Margin 63,356 39,974 45,192 48,953 50,525 Net Margin attributable to ODEC 13,279 26,627 17,637 11,879 9,100 Margins for Interest Ratio 1.26 2.13 1.67 1.27 1.21
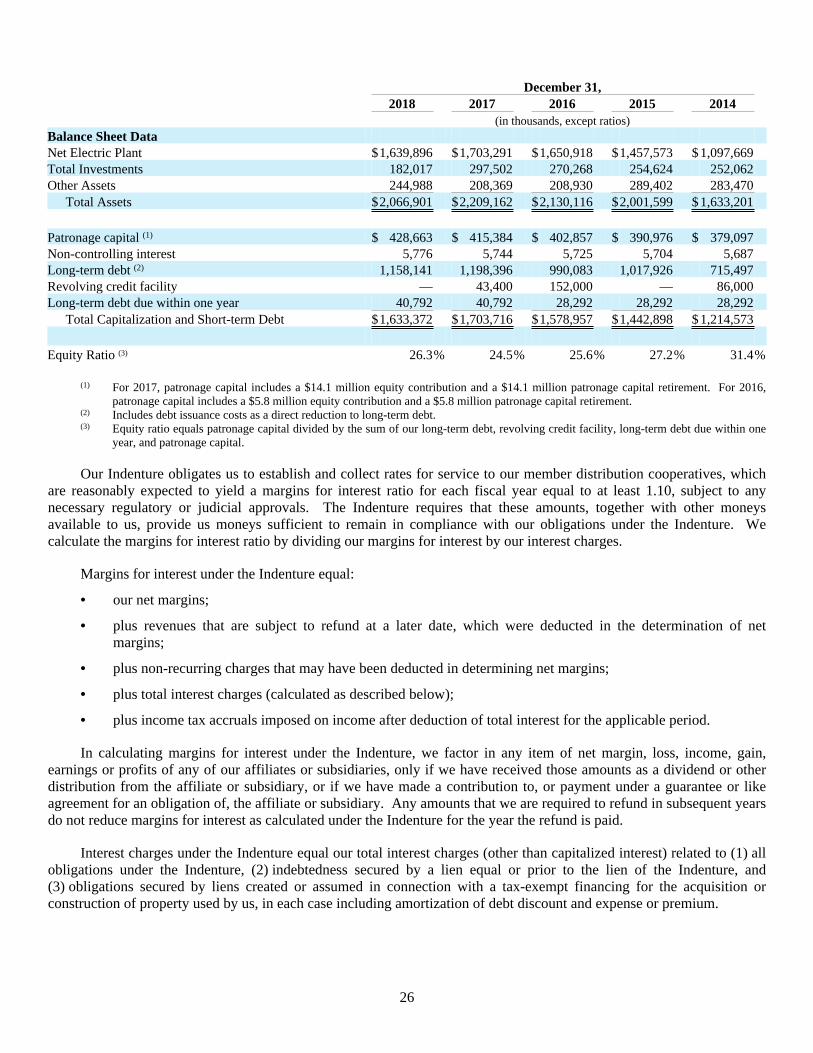
26
December 31, 2018 2017 2016 2015 2014 (in thousands, except ratios)
Balance Sheet Data Net Electric Plant $1,639,896 $1,703,291 $1,650,918 $1,457,573 $ 1,097,669 Total Investments 182,017 297,502 270,268 254,624 252,062 Other Assets 244,988 208,369 208,930 289,402 283,470
Total Assets $2,066,901 $2,209,162 $2,130,116 $2,001,599 $ 1,633,201
Patronage capital (1) $ 428,663 $ 415,384 $ 402,857 $ 390,976 $ 379,097 Non-controlling interest 5,776 5,744 5,725 5,704 5,687 Long-term debt (2) 1,158,141 1,198,396 990,083 1,017,926 715,497 Revolving credit facility — 43,400 152,000 — 86,000 Long-term debt due within one year 40,792 40,792 28,292 28,292 28,292
Total Capitalization and Short-term Debt $1,633,372 $1,703,716 $1,578,957 $1,442,898 $ 1,214,573
Equity Ratio (3) 26.3% 24.5% 25.6% 27.2% 31.4%
(1) For 2017, patronage capital includes a $14.1 million equity contribution and a $14.1 million patronage capital retirement. For 2016, patronage capital includes a $5.8 million equity contribution and a $5.8 million patronage capital retirement.
(2) Includes debt issuance costs as a direct reduction to long-term debt.(3) Equity ratio equals patronage capital divided by the sum of our long-term debt, revolving credit facility, long-term debt due within one
year, and patronage capital.
Our Indenture obligates us to establish and collect rates for service to our member distribution cooperatives, which are reasonably expected to yield a margins for interest ratio for each fiscal year equal to at least 1.10, subject to any necessary regulatory or judicial approvals. The Indenture requires that these amounts, together with other moneys available to us, provide us moneys sufficient to remain in compliance with our obligations under the Indenture. We calculate the margins for interest ratio by dividing our margins for interest by our interest charges.
Margins for interest under the Indenture equal:
• our net margins;
• plus revenues that are subject to refund at a later date, which were deducted in the determination of net margins;
• plus non-recurring charges that may have been deducted in determining net margins;
• plus total interest charges (calculated as described below);
• plus income tax accruals imposed on income after deduction of total interest for the applicable period.
In calculating margins for interest under the Indenture, we factor in any item of net margin, loss, income, gain, earnings or profits of any of our affiliates or subsidiaries, only if we have received those amounts as a dividend or other distribution from the affiliate or subsidiary, or if we have made a contribution to, or payment under a guarantee or like agreement for an obligation of, the affiliate or subsidiary. Any amounts that we are required to refund in subsequent years do not reduce margins for interest as calculated under the Indenture for the year the refund is paid.
Interest charges under the Indenture equal our total interest charges (other than capitalized interest) related to (1) all obligations under the Indenture, (2) indebtedness secured by a lien equal or prior to the lien of the Indenture, and (3) obligations secured by liens created or assumed in connection with a tax-exempt financing for the acquisition or construction of property used by us, in each case including amortization of debt discount and expense or premium.
27
ITEM 7. MANAGEMENT’S DISCUSSION AND ANALYSIS OF FINANCIAL CONDITIONAND RESULTS OF OPERATIONS
Caution Regarding Forward-looking Statements
Management’s Discussion and Analysis of Financial Condition and Results of Operations contains forward-looking statements regarding matters that could have an impact on our business, financial condition, and future operations. These statements, based on our expectations and estimates, are not guarantees of future performance and are subject to risks, uncertainties, and other factors. These risks, uncertainties, and other factors include, but are not limited to, general business conditions, demand for energy, federal and state legislative and regulatory actions and legal and administrative proceedings, changes in and compliance with environmental laws and regulations, general credit and capital market conditions, weather conditions, the cost of commodities used in our industry, and unanticipated changes in operating expenses and capital expenditures. Our actual results may vary materially from those discussed in the forward-looking statements as a result of these and other factors. Any forward-looking statement speaks only as of the date on which the statement is made, and we undertake no obligation to update any forward-looking statement or statements to reflect events or circumstances after the date on which the statement is made even if new information becomes available or other events occur in the future.
Overview
We are a not-for-profit power supply cooperative owned entirely by our eleven Class A member distribution cooperatives and a Class B member, TEC. We supply our member distribution cooperatives’ energy and demand requirements through a portfolio of resources including generating facilities, long-term and short-term physically-delivered forward power purchase contracts, and spot market energy purchases. We also supply the transmission services necessary to deliver this power to our member distribution cooperatives.
Our results for the year ended December 31, 2018, were primarily impacted by the commercial operation of Wildcat Point, and weather that resulted in increases in our member distribution cooperatives’ requirements for power and the dispatch of our generating facilities. Additionally, in 2018 we increased our total energy rate and completed the sale of our Rock Springs combustion turbine facility and related assets.
• Wildcat Point, which achieved commercial operation and was available for dispatch by PJM on April 17, 2018, generated 23.0% of our total available energy in 2018, resulting in increased fuel expense. Once commercial operation was achieved, we began recognizing expenses related to operations and maintenance, administrative and general, depreciation, and interest charges.
• Generation from our combustion turbine facilities increased 51.3% as compared to 2017, due to PJM’s economic dispatch of these facilities, which resulted in increased fuel expense.
• Due to the increased generation from our owned generating facilities, our non-member sales increased as compared to 2017.
• Our revenues from sales to our member distribution cooperatives increased 18.3% as compared to 2017. Energy revenues increased 18.6% due to the increase in the average total cost of energy sold to our member distribution cooperatives and an increase in energy sales in MWh to our member distribution cooperatives. The average total cost of energy sold to our member distribution cooperatives increased 14.1% due to the total energy rate increases implemented in 2018. Energy sales in MWh to our member distribution cooperatives increased 4.0%. Demand revenues increased 17.9%, primarily due to the increase in transmission expense and recognition of Wildcat Point-related expenses.
• As a result of higher costs, we under-collected energy costs by $52.3 million in the first quarter of 2018. As of March 31, 2018, our deferred energy balance was $55.9 million under-collected. To address the under-collection, we increased our total energy rate 3.7% effective April 1, 2018. As of December 3, 2018, our deferred energy balance was $26.1 million under-collected.
• On September 14, 2018, we sold our interest in Rock Springs and related assets for $115 million. We utilized a portion of the funds to repay outstanding borrowings under our revolving credit facility. The sale of Rock
28
Springs resulted in a gain of $42.7 million, which our board of directors approved to defer as a regulatory liability. We amortized $5.0 million of the gain in 2018 and will amortize the remaining balance in 2019. See “Factors Affecting Results—Generating Facilities—Sale of Rock Springs Combustion Turbine Facility.”
Basis of Presentation
The accompanying financial statements reflect the consolidated accounts of ODEC and TEC. See “Note 1—Summary of Significant Accounting Policies in the Notes to the Consolidated Financial Statements” in Item 8.
Critical Accounting Policies
The preparation of our financial statements in conformity with generally accepted accounting principles requires that our management make estimates and assumptions that affect the amounts reported in our financial statements. We base these estimates and assumptions on information available as of the date of the financial statements. We consider the following accounting policies to be critical accounting policies due to the estimation involved in each.
Accounting for Regulated Operations
We are a rate-regulated entity and, as a result, are subject to the accounting requirements of Accounting for Regulated Operations. In accordance with Accounting for Regulated Operations, certain of our revenues and expenses can be deferred at the discretion of our board of directors, which has budgetary and rate setting authority, if it is probable that these amounts will be collected or returned through our formula rate in future periods. Regulatory assets represent costs that we expect to collect from our member distribution cooperatives based on rates approved by our board of directors in accordance with our formula rate. Regulatory liabilities represent probable future reductions in our revenues associated with amounts that we expect to return to our member distribution cooperatives based on rates approved by our board of directors in accordance with our formula rate. See “Factors Affecting Results—Formula Rate” below. Regulatory assets are generally included in deferred charges and regulatory liabilities are generally included in deferred credits and other liabilities. Deferred energy, which can be either a regulatory asset or regulatory liability, is included in current assets or current liabilities, respectively. We recognize regulatory assets and liabilities as expenses or as a reduction in expenses, respectively, concurrent with their recovery through rates.
Deferred Energy
In accordance with Accounting for Regulated Operations, we use the deferral method of accounting to recognize differences between our energy expenses and our energy revenues collected from our member distribution cooperatives. Deferred energy on our Consolidated Statements of Revenues, Expenses, and Patronage Capital represents the difference between energy revenues, which are based upon energy rates approved by our board, and energy expenses, which are based upon actual energy costs incurred. The deferred energy balance on our Consolidated Balance Sheet represents the net accumulation of any under- or over-collection of energy costs. Under-collected energy costs appear as an asset and will be collected from our member distribution cooperatives in subsequent periods through our formula rate. Conversely, over-collected energy costs appear as a liability and will be returned to our member distribution cooperatives in subsequent periods through our formula rate.
Margin Stabilization
Margin Stabilization allows us to review our actual demand-related costs of service and demand revenues and adjust revenues from our member distribution cooperatives to meet our financial coverage requirements and accumulate additional equity as approved by our board of directors. Our formula rate allows us to collect and return amounts utilizing Margin Stabilization. We record all adjustments, whether increases or decreases, in the year affected and allocate any adjustments to our member distribution cooperatives based on power sales during that year. We collect these increases from our member distribution cooperatives, or offset decreases against amounts owed by our member distribution cooperatives to us, generally in the succeeding calendar year. We adjust operating revenues and accounts receivable–members or accounts payable–members, as appropriate, to reflect these adjustments. These adjustments are treated as due, owed, incurred, and accrued for the year to which the adjustment relates. See “Factors Affecting Results—Formula
29
Rate” below. The following table details the reduction in revenues utilizing Margin Stabilization for the past three years:
Year Ended December 31, 2018 2017 2016 (in thousands)
Margin Stabilization adjustment $15,312 $34,144 $15,123
Accounting for Asset Retirement and Environmental Obligations
Accounting for Asset Retirement and Environmental Obligations requires legal obligations associated with the retirement of long-lived assets to be recognized at fair value when incurred and capitalized as part of the related long-lived asset. In the absence of quoted market prices, we estimate the fair value of our asset retirement obligations using present value techniques, in which estimates of future cash flows associated with retirement activities are discounted using a credit-adjusted risk-free rate. Asset retirement obligations currently reported on our Consolidated Balance Sheet were measured during a period of historically low interest rates. The impact on measurements of new asset retirement obligations using different rates in the future may be significant.
A significant portion of our asset retirement obligations relates to our share of the future costs to decommission North Anna. As of December 31, 2018 and 2017, our share of North Anna’s nuclear decommissioning asset retirement obligation totaled $110.2 million, or 84.5% of total asset retirement obligations, and $105.8 million, or 83.7% of our total asset retirement obligations, respectively. Approximately every four years, a new decommissioning study for North Anna is performed by third-party experts. The third-party experts provide us with periodic site-specific “base year” cost studies in order to estimate the nature, cost, and timing of planned decommissioning activities for North Anna. These cost studies are based on relevant information available at the time they are performed; however, estimates of future cash flows for extended periods are by nature highly uncertain and may vary significantly from actual results. In addition, these estimates are dependent on subjective factors, including the selection of cost escalation rates, which we consider to be a critical assumption. Our current estimate is based on a study that was performed in 2014 and adopted effective December 1, 2014. We are not aware of any events that have occurred since the 2014 study that would materially impact our estimate. We anticipate that the next study will be performed in 2019. See "Note 3 of the Notes to Consolidated Financial Statements" in Item 8.
We determine cost escalation rates, which represent projected cost increases over time, due to both general inflation and increases in the cost of specific decommissioning activities. The following table details the weighted average cost escalation rates used by the study:
Year StudyPerformed
WeightedAverage Cost
Escalation Rate 2002 3.27%2005 2.42 2009 2.30 2014 2.04
The weighted average cost escalation rate was applied if the cash flows increased as compared to the previous study. The original weighted average cost escalation rate was applied if the cash flows decreased as compared to the previous study. The use of alternative rates would have been material to the liabilities recognized. For example, had we increased the cost escalation rates by 0.5%, the amount recognized as of December 31, 2018, for our asset retirement obligations related to nuclear decommissioning would have been $21.4 million higher.
Accounting for Derivatives and Hedging
We primarily purchase power under both long-term and short-term physically-delivered forward contracts to supply power to our member distribution cooperatives. These forward purchase contracts meet the accounting definition of a
30
derivative; however, a majority of these forward purchase derivative contracts qualify for the normal purchases/normal sales accounting exception under Accounting for Derivatives and Hedging. As a result, these contracts are not recorded at fair value. We record a liability and purchased power expense when the power under the physically-delivered forward contract is delivered. We also purchase natural gas futures generally for three years or less to hedge the price of natural gas for our facilities which utilize natural gas. These derivatives do not qualify for the normal purchases/normal sales accounting exception.
For all derivative contracts that do not qualify for the normal purchases/normal sales accounting exception, we defer all unrealized gains and losses on a net basis as a regulatory liability or regulatory asset, respectively, in accordance with Accounting for Regulated Operations. These amounts are subsequently reclassified as purchased power or fuel expense on our Consolidated Statements of Revenues, Expenses, and Patronage Capital as the power or fuel is delivered and/or the contract settles.
Generally, derivatives are reported at fair value on our Consolidated Balance Sheet in the regulatory assets or regulatory liabilities account, and deferred charges–other or deferred credits and other liabilities–other. The measurement of fair value is based on actively quoted market prices, if available. Otherwise, we seek indicative price information from external sources, including broker quotes and industry publications.
Factors Affecting Results
Margins
We operate on a not-for-profit basis and, accordingly, seek to generate revenues sufficient to recover our cost of service and produce margins sufficient to establish reasonable reserves, meet financial coverage requirements, and accumulate additional equity approved by our board of directors. Revenues in excess of expenses in any year are designated as net margin attributable to ODEC on our Consolidated Statements of Revenues, Expenses, and Patronage Capital. We designate retained net margins attributable to ODEC on our Consolidated Balance Sheet as patronage capital, which we assign to each of our members on the basis of its class of membership and business with us.
Formula Rate
Our power sales are comprised of two power products – energy and demand. Energy is the physical electricity delivered through transmission and distribution facilities to customers. We must have sufficient committed energy available to us for delivery to our member distribution cooperatives to meet their maximum energy needs at any time, with limited exceptions. This committed available energy at any time is referred to as demand.
The rates we charge our member distribution cooperatives for sales of energy and demand are determined by a formula rate accepted by FERC. On December 2, 2013, FERC accepted our formula rate effective January 1, 2014, subject to refund, and established hearing and settlement procedures. On January 19, 2017, FERC directed us to submit a compliance filing making certain revisions to the formula rate. These revisions to the formula rate did not change our overall revenue requirements. On March 22, 2018, FERC accepted our compliance filing and required us to file a refund report to calculate the difference between rates charged under our rate schedule since January 1, 2014, and rates that would have been charged under the revised rate schedule submitted in our compliance filing. On July 24, 2018, FERC accepted the refund report, which resulted in a reallocation of costs among our member distribution cooperatives and did not result in any change to our operating revenues.
Our formula rate is intended to permit collection of revenues which will equal the sum of:
• all of our costs and expenses;
• 20% of our total interest charges (margin requirement); and
• additional equity contributions approved by our board of directors.
The formula rate identifies the cost components that we can collect through rates, but not the actual amounts to be collected. With limited minor exceptions, we can change our rates periodically to match the costs we have incurred and we expect to incur without seeking FERC approval.
31
Energy costs, which are primarily variable costs, such as natural gas, nuclear, and coal fuel costs, and the energy costs under our power purchase contracts with third parties, are recovered through two separate rates, the base energy rate and the energy adjustment rate (collectively referred to as the total energy rate). The base energy rate is developed annually to collect energy costs as estimated in our budget including amounts in the deferred energy account from the prior year. As of January 1 of each year, the base energy rate is reset in accordance with our budget and the energy adjustment rate is reset to zero. We can revise the energy adjustment rate during the year if it becomes apparent that the total energy rate is over-collecting or under-collecting our actual and anticipated energy costs. Any revision to the energy adjustment rate requires board approval and that the resulting change to the total energy rate is at least 2%.
Demand costs, which are primarily fixed costs, such as depreciation expense, interest expense, administrative and general expenses, capacity costs under power purchase contracts with third parties, transmission costs, margin requirement, and additional equity contributions approved by our board of directors, are recovered through our demand rates. The formula rate allows us to change the actual demand rates we charge as our demand-related costs change, without FERC approval, with the exception of decommissioning cost, which is a fixed number in the formula rate that requires FERC approval prior to any adjustment. FERC approval is also needed to change account classifications currently in the formula or to add accounts not otherwise included in the current formula. Additionally, depreciation studies are required to be filed with FERC for its approval if they would result in a change in our depreciation rates. We collect our total demand costs through the following three separate rates:
• transmission service rate – designed to collect transmission-related and distribution-related costs;
• RTO capacity service rate – designed to collect capacity costs in PJM that PJM allocates to ODEC and all other PJM members; and
• remaining owned capacity service rate – designed to collect all remaining demand costs not billed and/or recovered under the transmission service and RTO capacity service rates.
As stated above, our margin requirement, and additional equity contributions approved by our board of directors are recovered through our demand rates. We establish our demand rates to produce a net margin attributable to ODEC equal to 20% of our budgeted total interest charges, plus additional equity contributions approved by our board of directors. The formula rate permits us to adjust revenues from the member distribution cooperatives to equal our actual total demand costs incurred, including a net margin attributable to ODEC equal to 20% of actual interest charges, plus additional equity contributions approved by our board. We make these adjustments utilizing Margin Stabilization. See “Critical Accounting Policies—Margin Stabilization” above.
We may revise our budget at any time to the extent that our current budget does not accurately reflect our costs and expenses or estimates of our sales of power. Increases or decreases in our budget automatically amend the energy and/or the demand components of our formula rate, as necessary. If at any time our board of directors determines that the formula does not meet all of our costs and expenses, it may adopt a new formula to meet those costs and expenses, subject to any necessary regulatory review and approval.
Recognition of Revenue
Our operating revenues reflect the actual demand-related costs we incurred plus the energy costs that we collected. Estimated demand-related costs are collected during the period through the demand components of our formula rate. In accordance with Margin Stabilization, these costs, as well as operating revenues, are adjusted at the end of each reporting period to reflect actual demand-related costs incurred during that period. See “Critical Accounting Policies—Margin Stabilization” above. Estimated energy costs are collected during the period through the energy components of our formula rate. Operating revenues are not adjusted at the end of each reporting period to reflect actual energy costs incurred during that period. The difference between actual energy costs incurred and energy costs collected during each period is recorded as deferred energy expense, which may be a positive or negative number. See “Critical Accounting Policies—Deferred Energy” above.
We bill energy to each of our member and non-member customers based on the total MWh delivered to them each month. We bill demand costs through three separate rates: a transmission service rate, an RTO capacity service rate, and a remaining owned capacity service rate. See “—Formula Rate” above. The transmission service rate is billed to
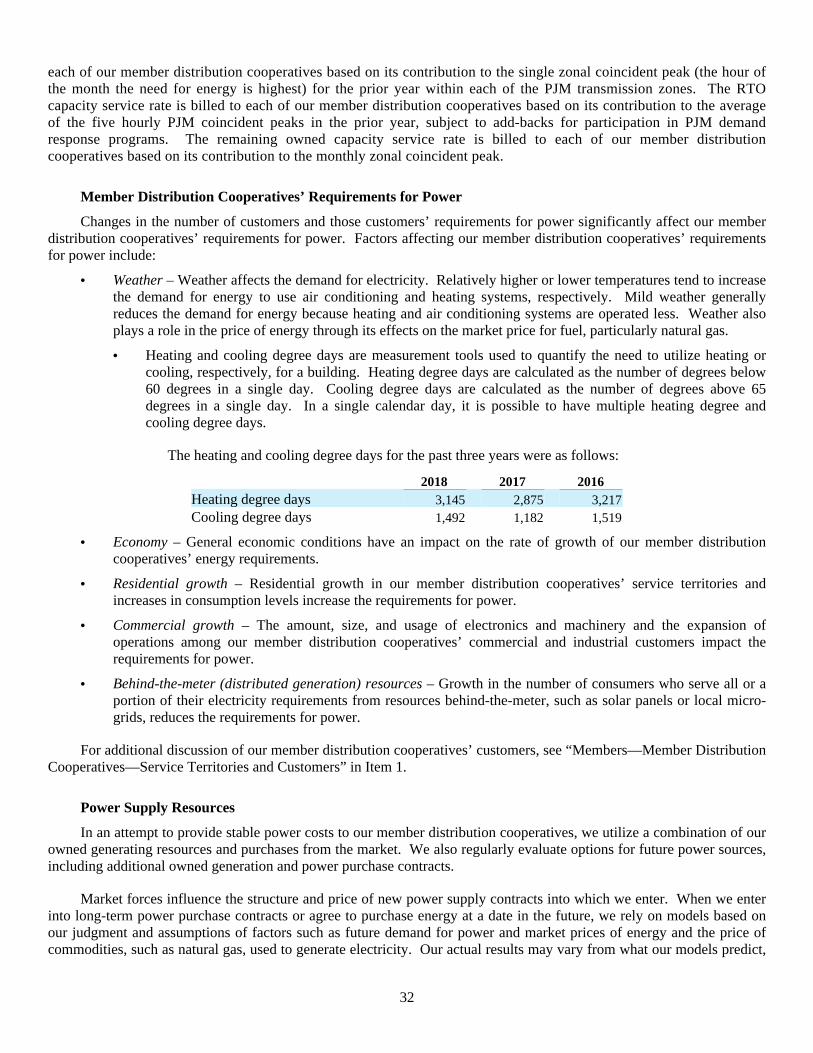
32
each of our member distribution cooperatives based on its contribution to the single zonal coincident peak (the hour of the month the need for energy is highest) for the prior year within each of the PJM transmission zones. The RTO capacity service rate is billed to each of our member distribution cooperatives based on its contribution to the average of the five hourly PJM coincident peaks in the prior year, subject to add-backs for participation in PJM demand response programs. The remaining owned capacity service rate is billed to each of our member distribution cooperatives based on its contribution to the monthly zonal coincident peak.
Member Distribution Cooperatives’ Requirements for Power
Changes in the number of customers and those customers’ requirements for power significantly affect our member distribution cooperatives’ requirements for power. Factors affecting our member distribution cooperatives’ requirements for power include:
• Weather – Weather affects the demand for electricity. Relatively higher or lower temperatures tend to increase the demand for energy to use air conditioning and heating systems, respectively. Mild weather generally reduces the demand for energy because heating and air conditioning systems are operated less. Weather also plays a role in the price of energy through its effects on the market price for fuel, particularly natural gas.
• Heating and cooling degree days are measurement tools used to quantify the need to utilize heating or cooling, respectively, for a building. Heating degree days are calculated as the number of degrees below 60 degrees in a single day. Cooling degree days are calculated as the number of degrees above 65 degrees in a single day. In a single calendar day, it is possible to have multiple heating degree and cooling degree days.
The heating and cooling degree days for the past three years were as follows:
2018 2017 2016Heating degree days 3,145 2,875 3,217Cooling degree days 1,492 1,182 1,519
• Economy – General economic conditions have an impact on the rate of growth of our member distribution cooperatives’ energy requirements.
• Residential growth – Residential growth in our member distribution cooperatives’ service territories and increases in consumption levels increase the requirements for power.
• Commercial growth – The amount, size, and usage of electronics and machinery and the expansion of operations among our member distribution cooperatives’ commercial and industrial customers impact the requirements for power.
• Behind-the-meter (distributed generation) resources – Growth in the number of consumers who serve all or a portion of their electricity requirements from resources behind-the-meter, such as solar panels or local micro-grids, reduces the requirements for power.
For additional discussion of our member distribution cooperatives’ customers, see “Members—Member Distribution Cooperatives—Service Territories and Customers” in Item 1.
Power Supply Resources
In an attempt to provide stable power costs to our member distribution cooperatives, we utilize a combination of our owned generating resources and purchases from the market. We also regularly evaluate options for future power sources, including additional owned generation and power purchase contracts.
Market forces influence the structure and price of new power supply contracts into which we enter. When we enter into long-term power purchase contracts or agree to purchase energy at a date in the future, we rely on models based on our judgment and assumptions of factors such as future demand for power and market prices of energy and the price of commodities, such as natural gas, used to generate electricity. Our actual results may vary from what our models predict,
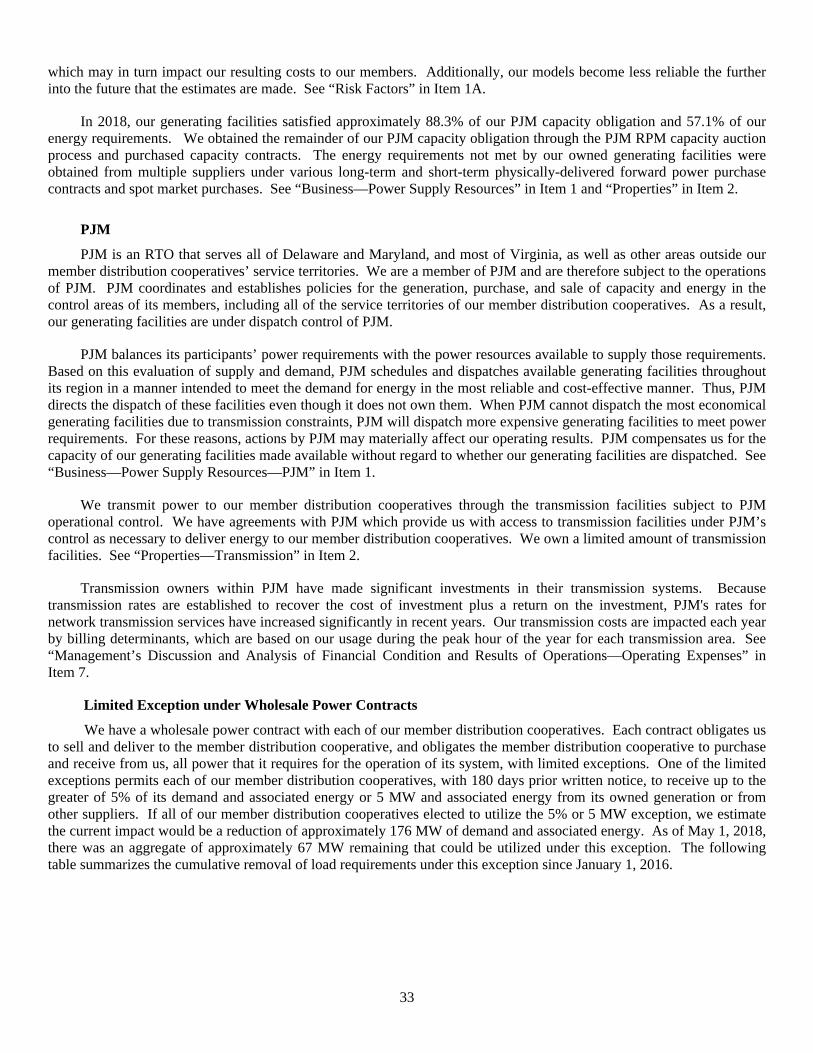
33
which may in turn impact our resulting costs to our members. Additionally, our models become less reliable the further into the future that the estimates are made. See “Risk Factors” in Item 1A.
In 2018, our generating facilities satisfied approximately 88.3% of our PJM capacity obligation and 57.1% of our energy requirements. We obtained the remainder of our PJM capacity obligation through the PJM RPM capacity auction process and purchased capacity contracts. The energy requirements not met by our owned generating facilities were obtained from multiple suppliers under various long-term and short-term physically-delivered forward power purchase contracts and spot market purchases. See “Business—Power Supply Resources” in Item 1 and “Properties” in Item 2.
PJM
PJM is an RTO that serves all of Delaware and Maryland, and most of Virginia, as well as other areas outside our member distribution cooperatives’ service territories. We are a member of PJM and are therefore subject to the operations of PJM. PJM coordinates and establishes policies for the generation, purchase, and sale of capacity and energy in the control areas of its members, including all of the service territories of our member distribution cooperatives. As a result, our generating facilities are under dispatch control of PJM.
PJM balances its participants’ power requirements with the power resources available to supply those requirements. Based on this evaluation of supply and demand, PJM schedules and dispatches available generating facilities throughout its region in a manner intended to meet the demand for energy in the most reliable and cost-effective manner. Thus, PJM directs the dispatch of these facilities even though it does not own them. When PJM cannot dispatch the most economical generating facilities due to transmission constraints, PJM will dispatch more expensive generating facilities to meet power requirements. For these reasons, actions by PJM may materially affect our operating results. PJM compensates us for the capacity of our generating facilities made available without regard to whether our generating facilities are dispatched. See “Business—Power Supply Resources—PJM” in Item 1.
We transmit power to our member distribution cooperatives through the transmission facilities subject to PJM operational control. We have agreements with PJM which provide us with access to transmission facilities under PJM’s control as necessary to deliver energy to our member distribution cooperatives. We own a limited amount of transmission facilities. See “Properties—Transmission” in Item 2.
Transmission owners within PJM have made significant investments in their transmission systems. Because transmission rates are established to recover the cost of investment plus a return on the investment, PJM's rates for network transmission services have increased significantly in recent years. Our transmission costs are impacted each year by billing determinants, which are based on our usage during the peak hour of the year for each transmission area. See “Management’s Discussion and Analysis of Financial Condition and Results of Operations—Operating Expenses” in Item 7.
Limited Exception under Wholesale Power Contracts
We have a wholesale power contract with each of our member distribution cooperatives. Each contract obligates us to sell and deliver to the member distribution cooperative, and obligates the member distribution cooperative to purchase and receive from us, all power that it requires for the operation of its system, with limited exceptions. One of the limited exceptions permits each of our member distribution cooperatives, with 180 days prior written notice, to receive up to the greater of 5% of its demand and associated energy or 5 MW and associated energy from its owned generation or from other suppliers. If all of our member distribution cooperatives elected to utilize the 5% or 5 MW exception, we estimate the current impact would be a reduction of approximately 176 MW of demand and associated energy. As of May 1, 2018, there was an aggregate of approximately 67 MW remaining that could be utilized under this exception. The following table summarizes the cumulative removal of load requirements under this exception since January 1, 2016.
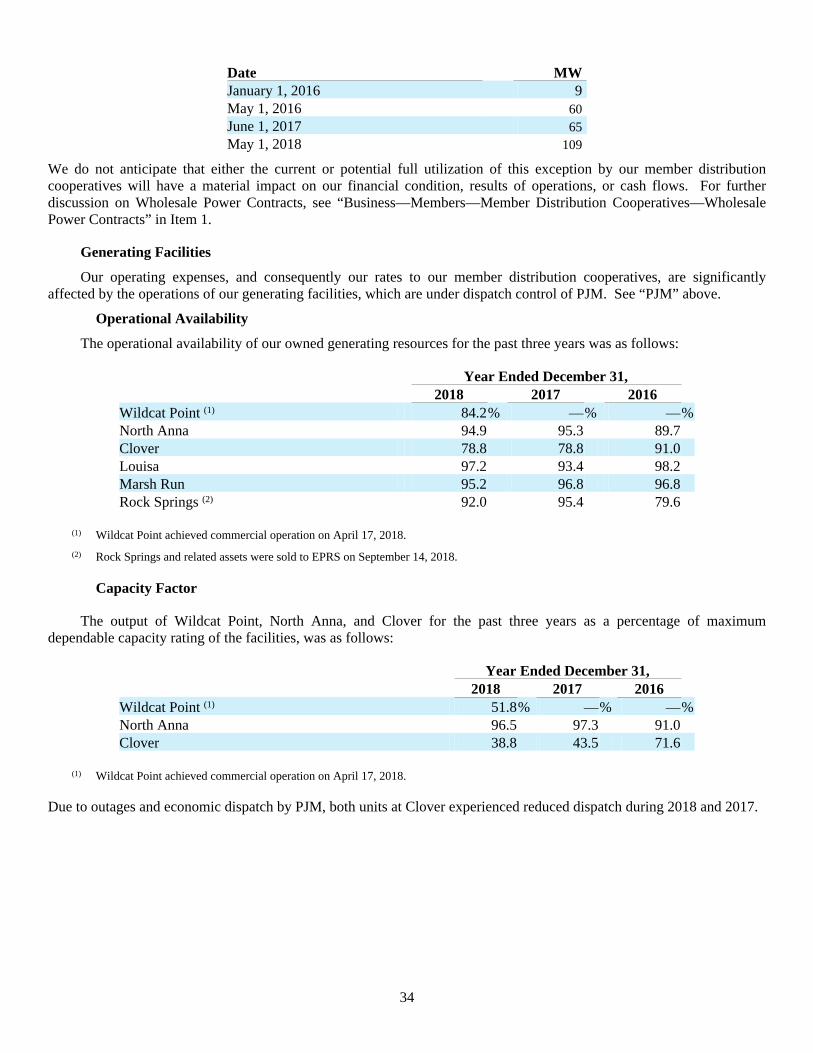
34
Date MW January 1, 2016 9May 1, 2016 60June 1, 2017 65May 1, 2018 109
We do not anticipate that either the current or potential full utilization of this exception by our member distribution cooperatives will have a material impact on our financial condition, results of operations, or cash flows. For further discussion on Wholesale Power Contracts, see “Business—Members—Member Distribution Cooperatives—Wholesale Power Contracts” in Item 1.
Generating Facilities
Our operating expenses, and consequently our rates to our member distribution cooperatives, are significantly affected by the operations of our generating facilities, which are under dispatch control of PJM. See “PJM” above.
Operational Availability
The operational availability of our owned generating resources for the past three years was as follows:
Year Ended December 31, 2018 2017 2016
Wildcat Point (1) 84.2% —% —%North Anna 94.9 95.3 89.7 Clover 78.8 78.8 91.0 Louisa 97.2 93.4 98.2 Marsh Run 95.2 96.8 96.8 Rock Springs (2) 92.0 95.4 79.6
(1) Wildcat Point achieved commercial operation on April 17, 2018.
(2) Rock Springs and related assets were sold to EPRS on September 14, 2018.
Capacity Factor
The output of Wildcat Point, North Anna, and Clover for the past three years as a percentage of maximum dependable capacity rating of the facilities, was as follows:
Year Ended December 31, 2018 2017 2016 Wildcat Point (1) 51.8% —% —%North Anna 96.5 97.3 91.0 Clover 38.8 43.5 71.6
(1) Wildcat Point achieved commercial operation on April 17, 2018.
Due to outages and economic dispatch by PJM, both units at Clover experienced reduced dispatch during 2018 and 2017.
35
Each unit at North Anna is scheduled for refueling approximately every 18 months. While only one unit is refueled at a time, this refueling schedule typically results in both units being off-line for refueling during the same calendar year once every three years. During 2018 and 2017, one unit at North Anna was off-line for refueling. During 2016, both units at North Anna were off-line for refueling.
Sale of Rock Springs Combustion Turbine Facility
On September 14, 2018, we sold our interest in Rock Springs and related assets to EPRS for $115 million. Prior to the sale, we and EPRS had each individually owned two natural gas-fired combustion turbine units and a 50% undivided interest in related common facilities at Rock Springs. The transaction resulted in a gain of $42.7 million, which our board of directors approved to defer as a regulatory liability. We amortized $5.0 million of the gain in 2018 and the remaining $37.7 million will be amortized ratably in 2019.
Changing Environmental Regulation
We are subject to extensive federal and state regulation regarding environmental matters. This regulation is becoming increasingly stringent through amendments to federal and state statutes and the development of regulations authorized by existing law. Future federal and state legislation and regulations present the potential for even greater obligations to limit the impact on the environment from the operation of our generating and transmission facilities. See “Business—Regulation— Environmental” in Item 1 and “Risk Factors” in Item 1A.
Sales to Member Distribution Cooperatives
Revenues from sales to our member distribution cooperatives are a function of our formula rate for sales of power and sales of renewable energy credits to our member distribution cooperatives, and our member distribution cooperatives’ customers’ requirements for power. See "—Member Distribution Cooperatives' Requirements for Power" above. Our formula rate is based on our cost of service in meeting these requirements. See “—Formula Rate” above.
Sales to Non-members
Revenues from sales to non-members consist of sales of excess purchased and generated energy and sales of renewable energy credits. We primarily sell excess energy to PJM under its rates for providing energy imbalance service. Excess energy is the result of changes in our purchased power portfolio, differences between actual and forecasted needs, and changes in market conditions.
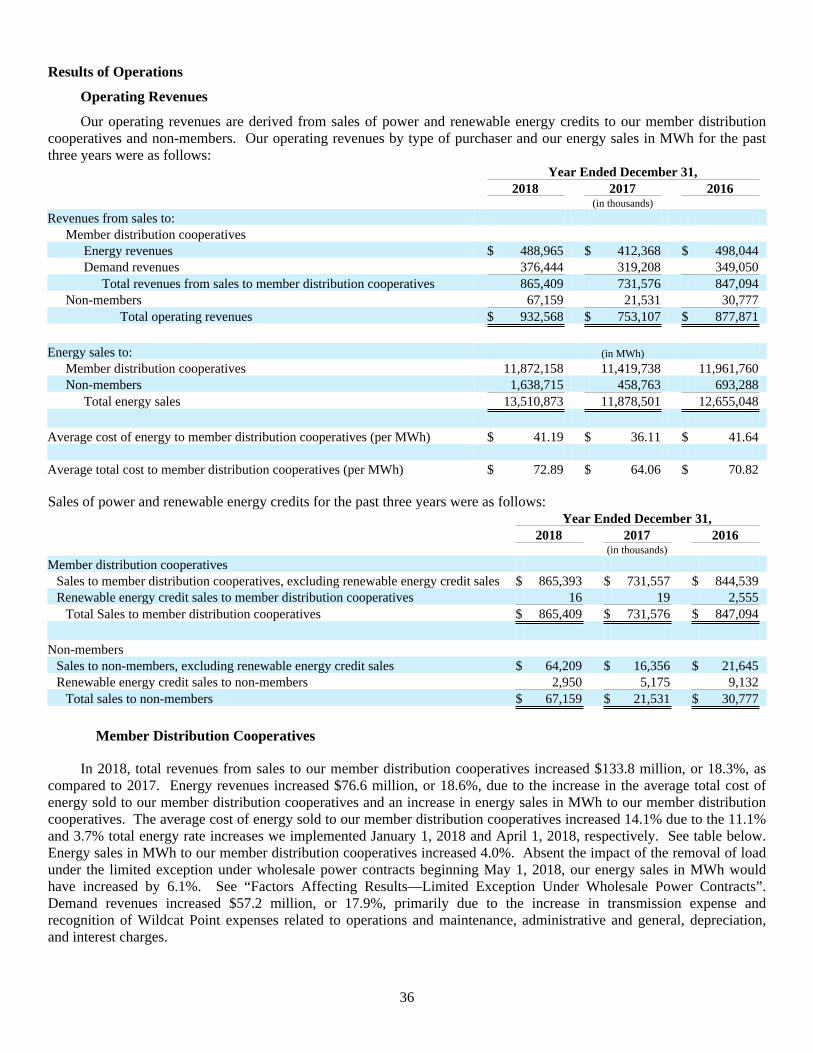
36
Results of Operations
Operating Revenues
Our operating revenues are derived from sales of power and renewable energy credits to our member distribution cooperatives and non-members. Our operating revenues by type of purchaser and our energy sales in MWh for the past three years were as follows:
Year Ended December 31, 2018 2017 2016 (in thousands)
Revenues from sales to: Member distribution cooperatives
Energy revenues $ 488,965 $ 412,368 $ 498,044 Demand revenues 376,444 319,208 349,050
Total revenues from sales to member distribution cooperatives 865,409 731,576 847,094 Non-members 67,159 21,531 30,777
Total operating revenues $ 932,568 $ 753,107 $ 877,871
Energy sales to: (in MWh)
Member distribution cooperatives 11,872,158 11,419,738 11,961,760 Non-members 1,638,715 458,763 693,288
Total energy sales 13,510,873 11,878,501 12,655,048
Average cost of energy to member distribution cooperatives (per MWh) $ 41.19 $ 36.11 $ 41.64 Average total cost to member distribution cooperatives (per MWh) $ 72.89 $ 64.06 $ 70.82
Sales of power and renewable energy credits for the past three years were as follows: Year Ended December 31, 2018 2017 2016 (in thousands)
Member distribution cooperatives Sales to member distribution cooperatives, excluding renewable energy credit sales $ 865,393 $ 731,557 $ 844,539 Renewable energy credit sales to member distribution cooperatives 16 19 2,555
Total Sales to member distribution cooperatives $ 865,409 $ 731,576 $ 847,094
Non-members
Sales to non-members, excluding renewable energy credit sales $ 64,209 $ 16,356 $ 21,645 Renewable energy credit sales to non-members 2,950 5,175 9,132
Total sales to non-members $ 67,159 $ 21,531 $ 30,777
Member Distribution Cooperatives
In 2018, total revenues from sales to our member distribution cooperatives increased $133.8 million, or 18.3%, as compared to 2017. Energy revenues increased $76.6 million, or 18.6%, due to the increase in the average total cost of energy sold to our member distribution cooperatives and an increase in energy sales in MWh to our member distribution cooperatives. The average cost of energy sold to our member distribution cooperatives increased 14.1% due to the 11.1% and 3.7% total energy rate increases we implemented January 1, 2018 and April 1, 2018, respectively. See table below. Energy sales in MWh to our member distribution cooperatives increased 4.0%. Absent the impact of the removal of load under the limited exception under wholesale power contracts beginning May 1, 2018, our energy sales in MWh would have increased by 6.1%. See “Factors Affecting Results—Limited Exception Under Wholesale Power Contracts”. Demand revenues increased $57.2 million, or 17.9%, primarily due to the increase in transmission expense and recognition of Wildcat Point expenses related to operations and maintenance, administrative and general, depreciation, and interest charges.
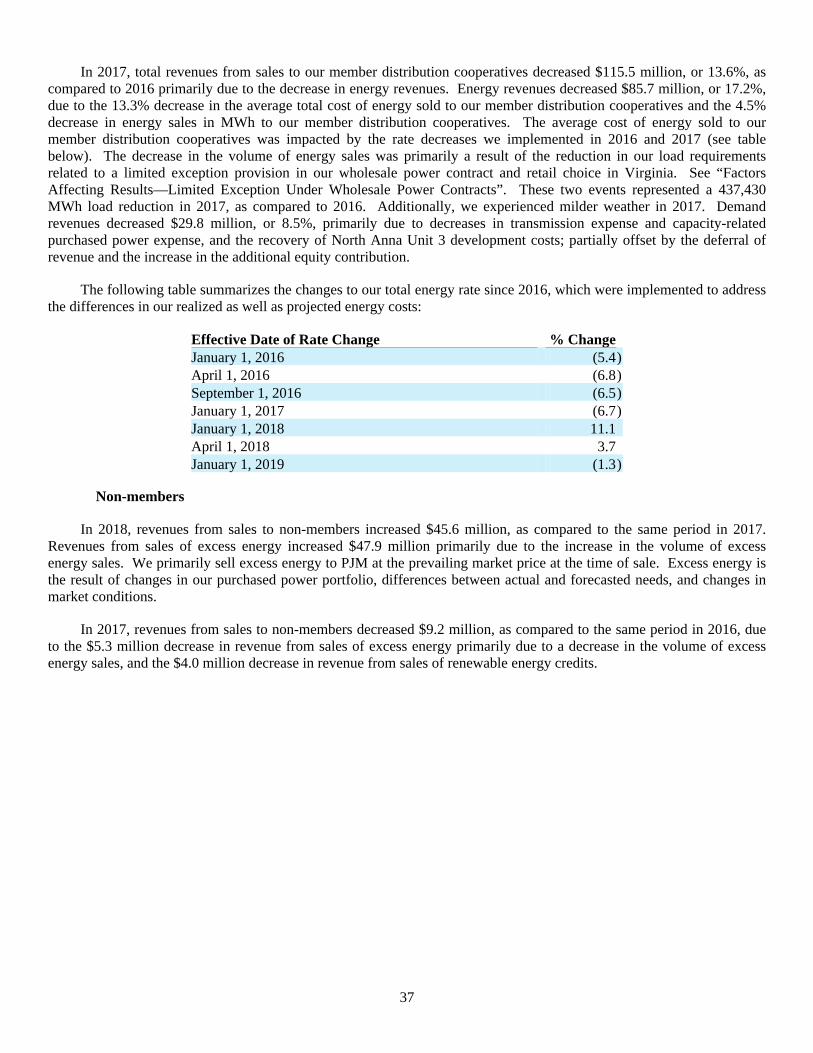
37
In 2017, total revenues from sales to our member distribution cooperatives decreased $115.5 million, or 13.6%, as compared to 2016 primarily due to the decrease in energy revenues. Energy revenues decreased $85.7 million, or 17.2%, due to the 13.3% decrease in the average total cost of energy sold to our member distribution cooperatives and the 4.5% decrease in energy sales in MWh to our member distribution cooperatives. The average cost of energy sold to our member distribution cooperatives was impacted by the rate decreases we implemented in 2016 and 2017 (see table below). The decrease in the volume of energy sales was primarily a result of the reduction in our load requirements related to a limited exception provision in our wholesale power contract and retail choice in Virginia. See “Factors Affecting Results—Limited Exception Under Wholesale Power Contracts”. These two events represented a 437,430 MWh load reduction in 2017, as compared to 2016. Additionally, we experienced milder weather in 2017. Demand revenues decreased $29.8 million, or 8.5%, primarily due to decreases in transmission expense and capacity-related purchased power expense, and the recovery of North Anna Unit 3 development costs; partially offset by the deferral of revenue and the increase in the additional equity contribution.
The following table summarizes the changes to our total energy rate since 2016, which were implemented to address the differences in our realized as well as projected energy costs:
Effective Date of Rate Change % Change January 1, 2016 (5.4)April 1, 2016 (6.8)September 1, 2016 (6.5)January 1, 2017 (6.7)January 1, 2018 11.1 April 1, 2018 3.7 January 1, 2019 (1.3)
Non-members
In 2018, revenues from sales to non-members increased $45.6 million, as compared to the same period in 2017. Revenues from sales of excess energy increased $47.9 million primarily due to the increase in the volume of excess energy sales. We primarily sell excess energy to PJM at the prevailing market price at the time of sale. Excess energy is the result of changes in our purchased power portfolio, differences between actual and forecasted needs, and changes in market conditions.
In 2017, revenues from sales to non-members decreased $9.2 million, as compared to the same period in 2016, due to the $5.3 million decrease in revenue from sales of excess energy primarily due to a decrease in the volume of excess energy sales, and the $4.0 million decrease in revenue from sales of renewable energy credits.
38
Operating Expenses
The following is a summary of the components of our operating expenses for the past three years.
Year Ended December 31, 2018 2017 2016 (in thousands)
Fuel $ 187,118 $ 94,603 $ 138,391 Purchased power 397,589 397,387 408,006 Transmission 135,567 97,302 121,456 Deferred energy (22,400) (43,698) 12,194 Operations and maintenance 64,705 48,508 50,088 Administrative and general 45,171 42,182 41,477 Depreciation and amortization 62,503 45,433 45,739 Amortization of regulatory asset/(liability), net (15,853) 18,156 2,233 Accretion of asset retirement obligations 5,319 5,044 4,839 Taxes, other than income taxes 9,493 8,216 8,256
Total Operating Expenses $ 869,212 $ 713,133 $ 832,679
Our operating expenses are comprised of the costs that we incur to generate and purchase power to meet the needs of our member distribution cooperatives, and the costs associated with any sales of power to non-members. Our energy costs generally are variable and include the energy portion of our purchased power expense, fuel expense, and the variable portion of operations and maintenance expense. Our demand costs generally are fixed and include transmission expense, the capacity portion of our purchased power expense, the fixed portion of operations and maintenance expense, administrative and general expense, and depreciation and amortization expense. Additionally, all non-operating expenses and income items, including interest charges, net and investment income, are components of our demand costs. See “Factors Affecting Results—Formula Rate” above.
Total operating expenses increased $156.1 million, or 21.9%, for 2018 as compared to 2017, primarily as a result of the increases in fuel expense, transmission expense, deferred energy, depreciation and amortization, and operations and maintenance expense, partially offset by the decrease in amortization of regulatory asset/(liability), net.
• Fuel expense increased $92.5 million, or 97.8%. Wildcat Point achieved commercial operation on April 17, 2018, and generated 23.0% of our total available energy in 2018. Additionally, generation from our combustion turbine facilities increased 51.3% due to PJM’s economic dispatch of the facilities.
• Transmission expense increased $38.3 million, or 39.3%, primarily due to increases in PJM charges for network transmission services.
• Deferred energy expense increased $21.3 million. In 2018, we under-collected $22.4 million and in 2017 we under-collected $43.7 million. Deferred energy expense represents the difference between energy revenues and energy expenses.
• Depreciation and amortization increased $17.1 million, or 37.6%, primarily due to depreciation expense related to Wildcat Point.
• Operations and maintenance expense increased $16.2 million, or 33.4%, primarily due to the commercial operation of Wildcat Point, partially offset by a reduction in expenses related to Clover.
• Amortization of regulatory asset/(liability), net decreased $34.1 million. In 2017, our board of directors approved a revenue deferral of $15.0 million, which was recorded as an expense to amortization of regulatory asset/(liability), net. In 2018, we amortized this entire amount. Additionally, we amortized $5.0 million of the $42.7 million gain on the sale of Rock Springs and related assets.
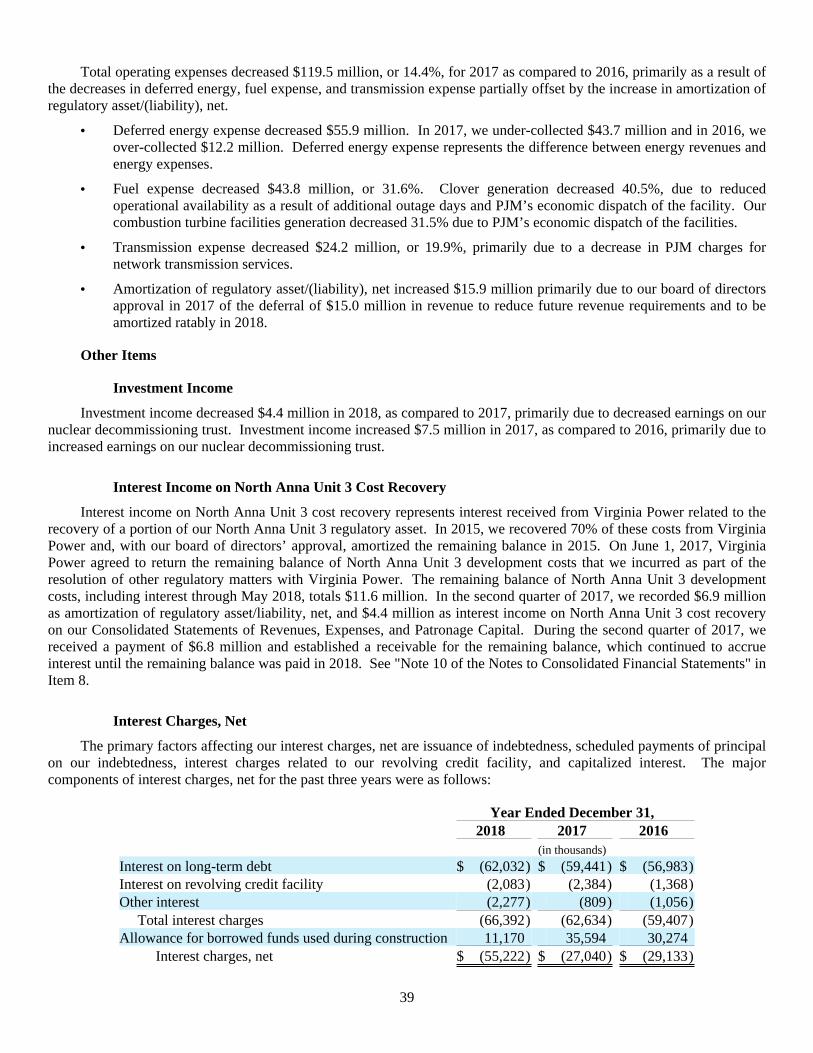
39
Total operating expenses decreased $119.5 million, or 14.4%, for 2017 as compared to 2016, primarily as a result of the decreases in deferred energy, fuel expense, and transmission expense partially offset by the increase in amortization of regulatory asset/(liability), net.
• Deferred energy expense decreased $55.9 million. In 2017, we under-collected $43.7 million and in 2016, we over-collected $12.2 million. Deferred energy expense represents the difference between energy revenues and energy expenses.
• Fuel expense decreased $43.8 million, or 31.6%. Clover generation decreased 40.5%, due to reduced operational availability as a result of additional outage days and PJM’s economic dispatch of the facility. Our combustion turbine facilities generation decreased 31.5% due to PJM’s economic dispatch of the facilities.
• Transmission expense decreased $24.2 million, or 19.9%, primarily due to a decrease in PJM charges for network transmission services.
• Amortization of regulatory asset/(liability), net increased $15.9 million primarily due to our board of directors approval in 2017 of the deferral of $15.0 million in revenue to reduce future revenue requirements and to be amortized ratably in 2018.
Other Items
Investment Income
Investment income decreased $4.4 million in 2018, as compared to 2017, primarily due to decreased earnings on our nuclear decommissioning trust. Investment income increased $7.5 million in 2017, as compared to 2016, primarily due to increased earnings on our nuclear decommissioning trust.
Interest Income on North Anna Unit 3 Cost Recovery
Interest income on North Anna Unit 3 cost recovery represents interest received from Virginia Power related to the recovery of a portion of our North Anna Unit 3 regulatory asset. In 2015, we recovered 70% of these costs from Virginia Power and, with our board of directors’ approval, amortized the remaining balance in 2015. On June 1, 2017, Virginia Power agreed to return the remaining balance of North Anna Unit 3 development costs that we incurred as part of the resolution of other regulatory matters with Virginia Power. The remaining balance of North Anna Unit 3 development costs, including interest through May 2018, totals $11.6 million. In the second quarter of 2017, we recorded $6.9 million as amortization of regulatory asset/liability, net, and $4.4 million as interest income on North Anna Unit 3 cost recovery on our Consolidated Statements of Revenues, Expenses, and Patronage Capital. During the second quarter of 2017, we received a payment of $6.8 million and established a receivable for the remaining balance, which continued to accrue interest until the remaining balance was paid in 2018. See "Note 10 of the Notes to Consolidated Financial Statements" in Item 8.
Interest Charges, Net
The primary factors affecting our interest charges, net are issuance of indebtedness, scheduled payments of principal on our indebtedness, interest charges related to our revolving credit facility, and capitalized interest. The major components of interest charges, net for the past three years were as follows:
Year Ended December 31, 2018 2017 2016 (in thousands)
Interest on long-term debt $ (62,032) $ (59,441) $ (56,983)Interest on revolving credit facility (2,083) (2,384) (1,368)Other interest (2,277) (809) (1,056)
Total interest charges (66,392) (62,634) (59,407)Allowance for borrowed funds used during construction 11,170 35,594 30,274
Interest charges, net $ (55,222) $ (27,040) $ (29,133)
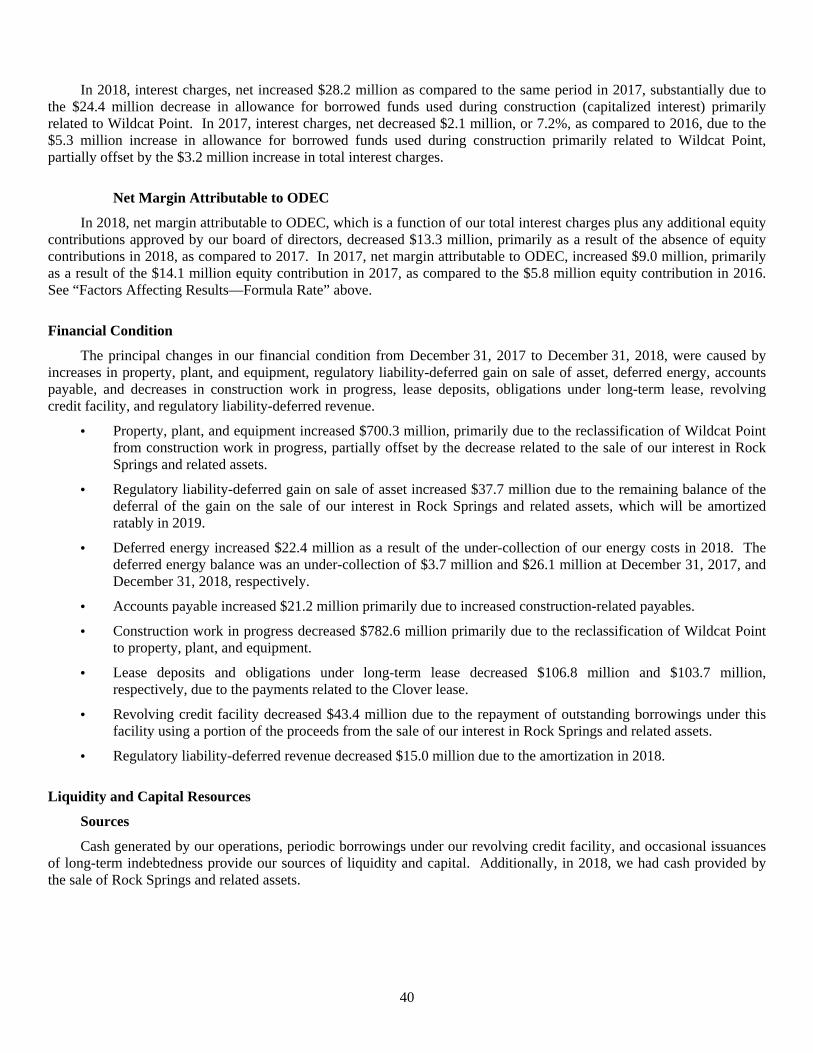
40
In 2018, interest charges, net increased $28.2 million as compared to the same period in 2017, substantially due to the $24.4 million decrease in allowance for borrowed funds used during construction (capitalized interest) primarily related to Wildcat Point. In 2017, interest charges, net decreased $2.1 million, or 7.2%, as compared to 2016, due to the $5.3 million increase in allowance for borrowed funds used during construction primarily related to Wildcat Point, partially offset by the $3.2 million increase in total interest charges.
Net Margin Attributable to ODEC
In 2018, net margin attributable to ODEC, which is a function of our total interest charges plus any additional equity contributions approved by our board of directors, decreased $13.3 million, primarily as a result of the absence of equity contributions in 2018, as compared to 2017. In 2017, net margin attributable to ODEC, increased $9.0 million, primarily as a result of the $14.1 million equity contribution in 2017, as compared to the $5.8 million equity contribution in 2016. See “Factors Affecting Results—Formula Rate” above.
Financial Condition
The principal changes in our financial condition from December 31, 2017 to December 31, 2018, were caused by increases in property, plant, and equipment, regulatory liability-deferred gain on sale of asset, deferred energy, accounts payable, and decreases in construction work in progress, lease deposits, obligations under long-term lease, revolving credit facility, and regulatory liability-deferred revenue.
• Property, plant, and equipment increased $700.3 million, primarily due to the reclassification of Wildcat Point from construction work in progress, partially offset by the decrease related to the sale of our interest in Rock Springs and related assets.
• Regulatory liability-deferred gain on sale of asset increased $37.7 million due to the remaining balance of the deferral of the gain on the sale of our interest in Rock Springs and related assets, which will be amortized ratably in 2019.
• Deferred energy increased $22.4 million as a result of the under-collection of our energy costs in 2018. The deferred energy balance was an under-collection of $3.7 million and $26.1 million at December 31, 2017, and December 31, 2018, respectively.
• Accounts payable increased $21.2 million primarily due to increased construction-related payables.
• Construction work in progress decreased $782.6 million primarily due to the reclassification of Wildcat Point to property, plant, and equipment.
• Lease deposits and obligations under long-term lease decreased $106.8 million and $103.7 million, respectively, due to the payments related to the Clover lease.
• Revolving credit facility decreased $43.4 million due to the repayment of outstanding borrowings under this facility using a portion of the proceeds from the sale of our interest in Rock Springs and related assets.
• Regulatory liability-deferred revenue decreased $15.0 million due to the amortization in 2018.
Liquidity and Capital Resources
Sources
Cash generated by our operations, periodic borrowings under our revolving credit facility, and occasional issuances of long-term indebtedness provide our sources of liquidity and capital. Additionally, in 2018, we had cash provided by the sale of Rock Springs and related assets.
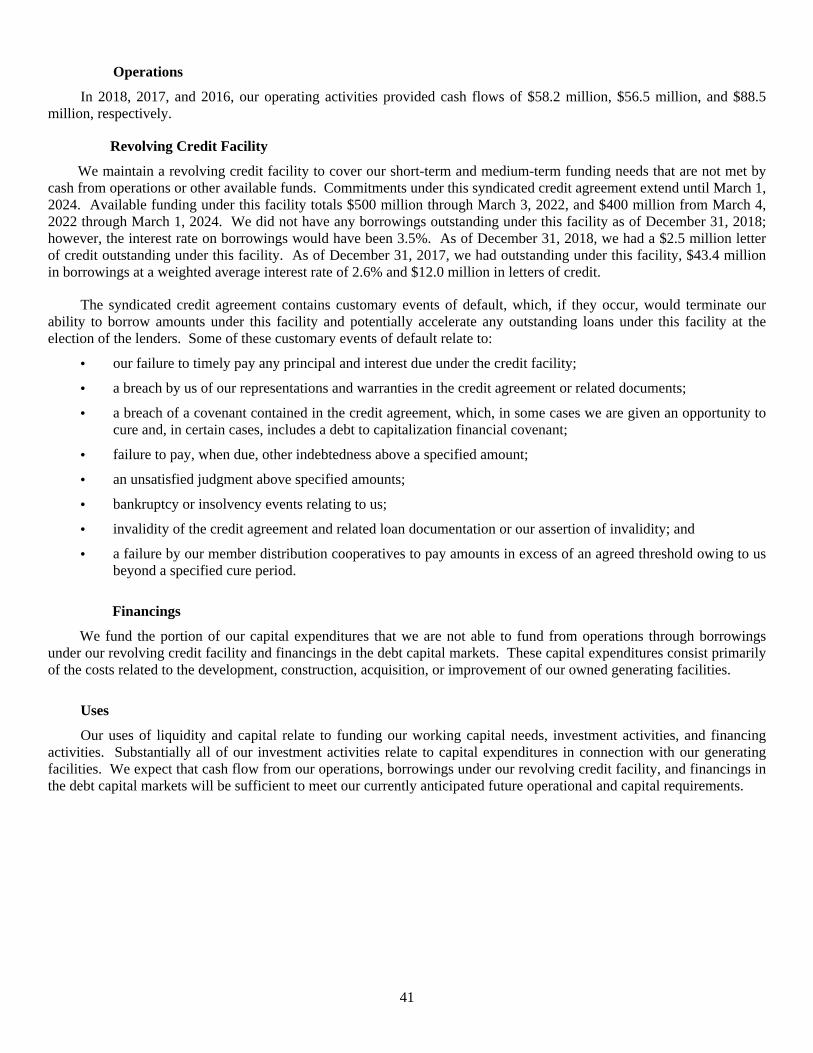
41
Operations
In 2018, 2017, and 2016, our operating activities provided cash flows of $58.2 million, $56.5 million, and $88.5 million, respectively.
Revolving Credit Facility
We maintain a revolving credit facility to cover our short-term and medium-term funding needs that are not met by cash from operations or other available funds. Commitments under this syndicated credit agreement extend until March 1, 2024. Available funding under this facility totals $500 million through March 3, 2022, and $400 million from March 4, 2022 through March 1, 2024. We did not have any borrowings outstanding under this facility as of December 31, 2018; however, the interest rate on borrowings would have been 3.5%. As of December 31, 2018, we had a $2.5 million letter of credit outstanding under this facility. As of December 31, 2017, we had outstanding under this facility, $43.4 million in borrowings at a weighted average interest rate of 2.6% and $12.0 million in letters of credit.
The syndicated credit agreement contains customary events of default, which, if they occur, would terminate our ability to borrow amounts under this facility and potentially accelerate any outstanding loans under this facility at the election of the lenders. Some of these customary events of default relate to:
• our failure to timely pay any principal and interest due under the credit facility;
• a breach by us of our representations and warranties in the credit agreement or related documents;
• a breach of a covenant contained in the credit agreement, which, in some cases we are given an opportunity to cure and, in certain cases, includes a debt to capitalization financial covenant;
• failure to pay, when due, other indebtedness above a specified amount;
• an unsatisfied judgment above specified amounts;
• bankruptcy or insolvency events relating to us;
• invalidity of the credit agreement and related loan documentation or our assertion of invalidity; and
• a failure by our member distribution cooperatives to pay amounts in excess of an agreed threshold owing to us beyond a specified cure period.
Financings
We fund the portion of our capital expenditures that we are not able to fund from operations through borrowings under our revolving credit facility and financings in the debt capital markets. These capital expenditures consist primarily of the costs related to the development, construction, acquisition, or improvement of our owned generating facilities.
Uses
Our uses of liquidity and capital relate to funding our working capital needs, investment activities, and financing activities. Substantially all of our investment activities relate to capital expenditures in connection with our generating facilities. We expect that cash flow from our operations, borrowings under our revolving credit facility, and financings in the debt capital markets will be sufficient to meet our currently anticipated future operational and capital requirements.
42
Capital Expenditures
We regularly forecast our capital expenditures as part of our long-term business planning activities. We review these projections periodically in order to update our calculations to reflect changes in our future plans, construction costs, market factors, and other items affecting our forecasts. Our actual capital expenditures could vary significantly from these projections. The table below summarizes our actual and projected capital expenditures on a cash flow basis, including capitalized interest, for 2016 through 2021:
Actual
Year Ended December 31, Projected
Year Ended December 31, 2016 2017 2018 2019 2020 2021
(in millions)
Wildcat Point $ 232.7 $ 118.2 $ 31.6 $ 44.8 $ 1.9 $ 0.5 North Anna nuclear fuel 9.6 17.0 8.8 4.3 14.1 6.7 North Anna 6.5 3.5 7.1 13.0 15.4 18.4 Clover 7.1 7.1 11.4 8.8 3.8 3.3 Transmission 4.4 1.8 0.6 2.7 13.7 25.9 Combustion turbine facilities 0.9 4.9 1.1 3.4 0.3 0.1 Other 2.6 1.4 1.0 0.8 0.4 0.4
Total $ 263.8 $ 153.9 $ 61.6 $ 77.8 $ 49.6 $ 55.3
Nearly all of our capital expenditures consist of additions to electric plant and equipment, particularly for the construction of Wildcat Point. Capital expenditures for North Anna include $4.6 million, $11.1 million, and $13.4 million, for 2019, 2020, and 2021, respectively, for costs related to license extension. Capital expenditures for Other include costs related to our administrative and general assets, and distributed generation facilities. We intend to use our cash flow from operations, borrowings under our revolving credit facility, and financings in the debt capital markets to fund all of our currently projected capital requirements through 2021.
Contractual Obligations
In the normal course of business, we enter into long-term arrangements relating to the construction, operation and maintenance of our generating facilities, power purchases for capacity and energy, the financing of our operations, and other matters. See “Business—Power Supply Resources—Power Purchase Contracts” in Item 1. The following table summarizes our long-term contractual obligations as of December 31, 2018:
Payments due by Period
Total 2019 2020-2021
2022-2023
2024 andThereafter
(in millions) Long-term debt obligations $ 2,107.8 $ 97.9 $ 197.8 $ 196.4 $ 1,615.7 Power purchase obligations 287.1 201.7 85.1 0.3 — Asset retirement obligations 387.6 — — — 387.6 Operating lease obligations 3.1 0.5 1.0 1.0 0.6 Construction obligations 42.8 42.8 — — —
Total $ 2,828.4 $ 342.9 $ 283.9 $ 197.7 $ 2,003.9
We expect to fund these obligations with cash flow from operations, borrowings under our revolving credit facility, and financings in the debt capital markets.
43
Long-term Debt Obligations
As of December 31, 2018, our long-term debt obligations include long-term debt issued privately and to the public under the Indenture. Long-term debt includes both the principal of and interest on long-term debt, and long-term debt due within one year.
Power Purchase Obligations
As part of our power supply strategy, we entered into a number of agreements for the purchase of energy or capacity, or both, in order to meet our member distribution cooperatives’ requirements. See “Business—Power Supply Resources—Power Purchase Contracts” in Item 1.
Asset Retirement Obligations
We account for our asset retirement obligations in accordance with Accounting for Asset Retirement and Environmental Obligations which requires legal obligations associated with the retirement of long-lived assets to be recognized at fair value when incurred and capitalized as part of the related long-lived asset. A significant portion of our asset retirement obligations relates to our share of the future costs to decommission North Anna. See “Critical Accounting Policies—Accounting for Asset Retirement and Environmental Obligations” above.
Operating Lease Obligations
Our obligation described above with respect to operating lease obligations relates to our lease for our headquarters building.
Construction Obligations
Our construction obligations include payments related to Wildcat Point EPC contractor payments and major equipment purchase contracts.
Significant Contingent Obligations
In addition to these existing contractual obligations, we have significant contingent obligations. These obligations primarily relate to power purchase arrangements and our arrangement with TEC. Some of our power purchase contracts obligate us to provide credit support if our obligations issued under the Indenture are rated below specified thresholds by S&P and Moody’s.
Power Purchase Arrangements
Under the terms of most of our hedging instruments, we typically agree to provide collateral under certain circumstances and we require comparable terms from our counterparties. The collateral we may be required to post with a counterparty, and vice versa, is normally a function of the collateral thresholds we negotiate with a counterparty relative to a range of credit ratings as well as the value of our transaction(s) under a contract with a respective counterparty. As of December 31, 2018, the collateral we had posted with counterparties pursuant to the hedging instruments we have in place totaled $6.7 million. Typically, collateral thresholds under our contracts are zero once an entity is rated below investment grade by S&P or Moody’s (i.e., “BBB-” or “Baa3,” respectively). As of December 31, 2018, if our credit ratings had been below investment grade we estimate we would have been obligated to post between $250 million and $300 million of collateral with our counterparties. This calculation is based on energy prices on December 31, 2018, and delivered power for which we have not yet paid. Depending on the difference between the price of power under our contracts and the price of power in the market at the time of the calculation, this amount could increase or decrease.
44
Additionally, in accordance with its credit policy, PJM subjects each applicant, participant and member of PJM to a credit evaluation to determine its creditworthiness, and whether it must provide any collateral to support its obligations in connection with its PJM transactions. A material change in our financial condition, including the downgrading of our credit rating by any rating agency, could cause PJM to re-evaluate our creditworthiness and require that we provide collateral. As of December 31, 2018, if PJM had determined that we needed to provide collateral to support our obligations, PJM could have asked us to provide up to approximately $11.4 million as collateral.
TEC Guarantees
TEC is considered a variable interest entity for which we are the primary beneficiary, and we have consolidated its results and eliminated all intercompany balances and transactions in consolidation. To facilitate the ability of TEC to sell power in the market, we have agreed to guarantee up to a maximum of $200 million of TEC’s delivery and payment obligations associated with its energy trades, if requested. See “Business—Members—TEC” in Item 1. Our agreement to guarantee these obligations continues in effect until we elect to terminate it by providing at least 30 days' prior written notice of termination or until all amounts owed to us by TEC have been paid. Our guarantee of TEC’s obligations will enable it to maintain sufficient credit support to meet its delivery and payment obligations associated with its energy trades. As of December 31, 2018, we did not have any guarantees outstanding in support of TEC’s obligations.
Off-Balance Sheet Arrangements
We have no off-balance sheet arrangements.
ITEM 7A. QUANTITATIVE AND QUALITATIVE DISCLOSURES ABOUT MARKET RISK
The operation of our business exposes us to several common market risks, including changes in market prices for power and fuel, and interest rates and equity prices.
Market Price Risk
We are exposed to market price risk by purchasing power to supply the power requirements of our member distribution cooperatives that are not met by our owned generation. See “Business—Power Supply Resources” in Item 1. In addition, the purchase of fuel to operate our generating facilities also exposes us to market price risk.
The fair value of the hedging instruments we use to mitigate market price risk is impacted by changes in market prices. As of December 31, 2018, we estimate that the fair value of our purchased power agreements and forward purchases of natural gas was between $675 million and $725 million. Approximately 39% of the fair value of this portfolio is estimable using observable market prices. The remaining 61% of the fair value of this portfolio is related to less liquid products and the fair values of these products are not directly estimable using observable market prices. In the absence of observable market prices, the valuation of the 61% of this portfolio that relates to less liquid products involves management judgment, the use of estimates, and the underlying assumptions in our portfolio model. As a result, changes in estimates and underlying assumptions or use of alternate valuation methods could affect the estimated fair value of this portfolio. As an example of our portfolio’s exposure to market price risk, we estimate that a 10% change in the price of the commodities hedged by the portion of this portfolio with observable market prices would have changed the fair value of this portion of the portfolio by approximately $27.7 million as of December 31, 2018. To the extent all or portions of our portfolio are liquidated above or below our original cost, these gains or losses are factored into the costs billed to our member distribution cooperatives pursuant to our formula rate. See “Management’s Discussion and Analysis of Financial Condition and Results of Operations—Factors Affecting Results—Formula Rate” in Item 7.
45
We have formulated policies and procedures to manage the risks associated with these market price fluctuations. Additionally, we use various hedging instruments, including forwards, futures, financial transmission rights, and options, to manage our power market price risks. ACES assists us in managing our market price risks by:
• maintaining a portfolio model that identifies our power producing resources (including our power purchase contract positions and generating capacity, and fuel supply, transportation, and storage arrangements) and analyzing the optimal use of these resources in light of costs and market risks associated with using these resources;
• modeling our power obligations and assisting us with analyzing alternatives to meet our member distribution cooperatives’ power requirements;
• selling excess power as our agent; and
• executing hedge trades to stabilize the cost of fuel requirements, primarily natural gas used to operate our generating facilities.
We also are subject to market price risk relating to purchases of fuel for North Anna and Clover. We manage these risks indirectly through our participation in the management arrangements for these facilities. However, Virginia Power, as operator of these facilities, has the sole authority and responsibility to procure nuclear fuel and coal for North Anna and Clover, respectively.
Virginia Power advises us that it primarily uses long-term contracts to support North Anna’s nuclear fuel requirements and that worldwide market conditions are continuously evaluated to ensure a range of supply options at reasonable prices, which are dependent upon the market environment. See “Business—Power Supply Resources—Fuel Supply—Nuclear” in Item 1. In addition, Virginia Power advises us that it uses both long-term contracts and short-term spot agreements to acquire the low sulfur bituminous coal used to fuel Clover. See “Business—Power Supply Resources—Fuel Supply—Coal” in Item 1.
Interest Rate Risk and Equity Price Risk
In 2018, all of our outstanding long-term debt accrued interest at fixed rates.
We maintain a revolving credit facility. See “Management’s Discussion and Analysis of Financial Condition and Results of Operations—Liquidity and Capital Resources—Sources—Revolving Credit Facility” in Item 7. Any amounts we borrow under this facility will accrue interest at a variable rate. We did not have any borrowings outstanding under this facility as of December 31, 2018; however, the average interest rate on borrowings would have been 3.5%. As of December 31, 2018, we had a $2.5 million letter of credit outstanding under this facility.
We accrue decommissioning costs over the expected service life of North Anna and have made periodic deposits to a trust so that the trust balance will cover the estimated costs to decommission North Anna at the time of decommissioning. As of December 31, 2018, $114.8 million, $59.0 million, and $0.2 million were invested in equity securities, debt securities, and cash, respectively. The value of these debt and equity securities will be impacted by changes in interest rates and price fluctuations in equity markets. To minimize adverse changes in the aggregate value of the trust, we actively monitor our portfolio by measuring the performance of the investments against market indices and by maintaining and reviewing established target allocation percentages of assets in the trust to various investment options. We believe the trust’s exposure to changes in interest rates and price fluctuations in equity markets will not have a material impact on our financial results.
46
ITEM 8. FINANCIAL STATEMENTS AND SUPPLEMENTARY DATA
CONSOLIDATED FINANCIAL STATEMENTSINDEX
Page
Number
Report of Management on ODEC’s Internal Control over Financial Reporting 47Report of Independent Registered Public Accounting Firm 48Consolidated Balance Sheets 49Consolidated Statements of Revenues, Expenses, and Patronage Capital 50Consolidated Statements of Cash Flows 51Notes to Consolidated Financial Statements 52
47
Report of Management on ODEC’s Internal Control over Financial Reporting
Management of Old Dominion Electric Cooperative (“ODEC”) has assessed ODEC’s internal control over financial reporting as of December 31, 2018, based on criteria for effective internal control over financial reporting described in the “2013 Internal Control – Integrated Framework” issued by the Committee of Sponsoring Organizations of the Treadway Commission. Based on this assessment, management believes that as of December 31, 2018, our system of internal control over financial reporting was properly designed and operating effectively based upon the specified criteria.
Management of ODEC is responsible for establishing and maintaining adequate internal control over financial reporting. ODEC’s internal control over financial reporting is comprised of policies, procedures, and reports designed to provide reasonable assurance to ODEC’s management and board of directors that the financial reporting and the preparation of the financial statements for external reporting purposes have been handled in accordance with accounting principles generally accepted in the United States. Internal control over financial reporting includes those policies and procedures that (1) govern records to accurately and fairly reflect the transactions and dispositions of assets of ODEC; (2) provide reasonable assurance that transactions are recorded as necessary to permit preparation of financial statements in accordance with generally accepted accounting principles and that receipts and expenditures of ODEC are being made only in accordance with authorizations of the management and directors of ODEC; and (3) provide reasonable safeguards against or timely detection of material unauthorized acquisition, use or disposition of ODEC’s assets.
Internal controls over financial reporting may not prevent or detect all misstatements. Accordingly, even effective internal control can provide only reasonable assurance regarding the reliability of financial reporting and the preparation of financial statements for external purposes in accordance with U.S. generally accepted accounting principles. March 6, 2019
/s/ MARCUS M. HARRIS /s/ BRYAN S. ROGERS Marcus M. Harris Bryan S. RogersPresident and Chief Executive Officer Senior Vice President and Chief Financial Officer
48
Report of Independent Registered Public Accounting Firm
The Board of Directors and Members of Old Dominion Electric Cooperative
Opinion on the Financial Statements
We have audited the accompanying consolidated balance sheets of Old Dominion Electric Cooperative (the Cooperative) as of December 31, 2018 and 2017, and the related consolidated statements of revenues, expenses, and patronage capital, and cash flows for each of the three years in the period ended December 31, 2018, and the related notes (collectively referred to as the “consolidated financial statements”). In our opinion, the consolidated financial statements present fairly, in all material respects, the financial position of the Cooperative at December 31, 2018 and 2017, and the results of its operations and its cash flows for each of the three years in the period ended December 31, 2018, in conformity with U.S. generally accepted accounting principles.
Basis for Opinion
These financial statements are the responsibility of the Cooperative's management. Our responsibility is to express an opinion on the Cooperative’s financial statements based on our audits. We are a public accounting firm registered with the Public Company Accounting Oversight Board (United States) (PCAOB) and are required to be independent with respect to the Cooperative in accordance with the U.S. federal securities laws and the applicable rules and regulations of the Securities and Exchange Commission and the PCAOB.
We conducted our audits in accordance with the standards of the PCAOB and in accordance with auditing standards generally accepted in the United States of America. Those standards require that we plan and perform the audit to obtain reasonable assurance about whether the financial statement are free of material misstatement, whether due to error or fraud. The Cooperative is not required to have, nor were we engaged to perform, an audit of its internal control over financial reporting. As part of our audits we are required to obtain an understanding of internal control over financial reporting but not for the purpose of expressing an opinion on the effectiveness of the Cooperative's internal control over financial reporting. Accordingly, we express no such opinion.
Our audits included performing procedures to assess the risks of material misstatement of the financial statements, whether due to error or fraud, and performing procedures that respond to those risks. Such procedures included examining, on a test basis, evidence regarding the amounts and disclosures in the financial statements. Our audits also included evaluating the accounting principles used and significant estimates made by management, as well as evaluating the overall presentation of the financial statements. We believe that our audits provide a reasonable basis for our opinion.
/s/ Ernst & Young LLP
We have served as the Cooperative’s auditor since 2000.Richmond, VirginiaMarch 6, 2019
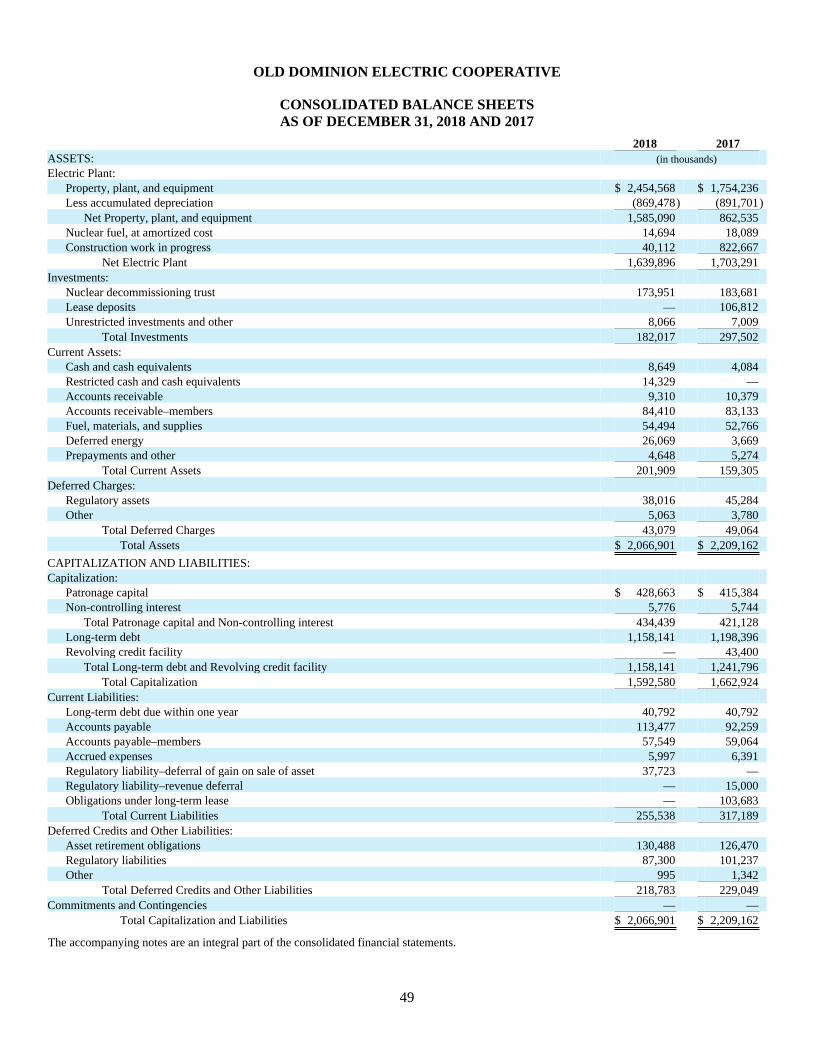
49
OLD DOMINION ELECTRIC COOPERATIVE
CONSOLIDATED BALANCE SHEETSAS OF DECEMBER 31, 2018 AND 2017
2018 2017 ASSETS: (in thousands) Electric Plant:
Property, plant, and equipment $ 2,454,568 $ 1,754,236 Less accumulated depreciation (869,478) (891,701)
Net Property, plant, and equipment 1,585,090 862,535 Nuclear fuel, at amortized cost 14,694 18,089 Construction work in progress 40,112 822,667
Net Electric Plant 1,639,896 1,703,291 Investments:
Nuclear decommissioning trust 173,951 183,681 Lease deposits — 106,812 Unrestricted investments and other 8,066 7,009
Total Investments 182,017 297,502 Current Assets:
Cash and cash equivalents 8,649 4,084 Restricted cash and cash equivalents 14,329 — Accounts receivable 9,310 10,379 Accounts receivable–members 84,410 83,133 Fuel, materials, and supplies 54,494 52,766 Deferred energy 26,069 3,669 Prepayments and other 4,648 5,274
Total Current Assets 201,909 159,305 Deferred Charges:
Regulatory assets 38,016 45,284 Other 5,063 3,780
Total Deferred Charges 43,079 49,064 Total Assets $ 2,066,901 $ 2,209,162
CAPITALIZATION AND LIABILITIES: Capitalization:
Patronage capital $ 428,663 $ 415,384 Non-controlling interest 5,776 5,744
Total Patronage capital and Non-controlling interest 434,439 421,128 Long-term debt 1,158,141 1,198,396 Revolving credit facility — 43,400
Total Long-term debt and Revolving credit facility 1,158,141 1,241,796 Total Capitalization 1,592,580 1,662,924
Current Liabilities: Long-term debt due within one year 40,792 40,792 Accounts payable 113,477 92,259 Accounts payable–members 57,549 59,064 Accrued expenses 5,997 6,391 Regulatory liability–deferral of gain on sale of asset 37,723 — Regulatory liability–revenue deferral — 15,000 Obligations under long-term lease — 103,683
Total Current Liabilities 255,538 317,189 Deferred Credits and Other Liabilities:
Asset retirement obligations 130,488 126,470 Regulatory liabilities 87,300 101,237 Other 995 1,342
Total Deferred Credits and Other Liabilities 218,783 229,049 Commitments and Contingencies — —
Total Capitalization and Liabilities $ 2,066,901 $ 2,209,162
The accompanying notes are an integral part of the consolidated financial statements.
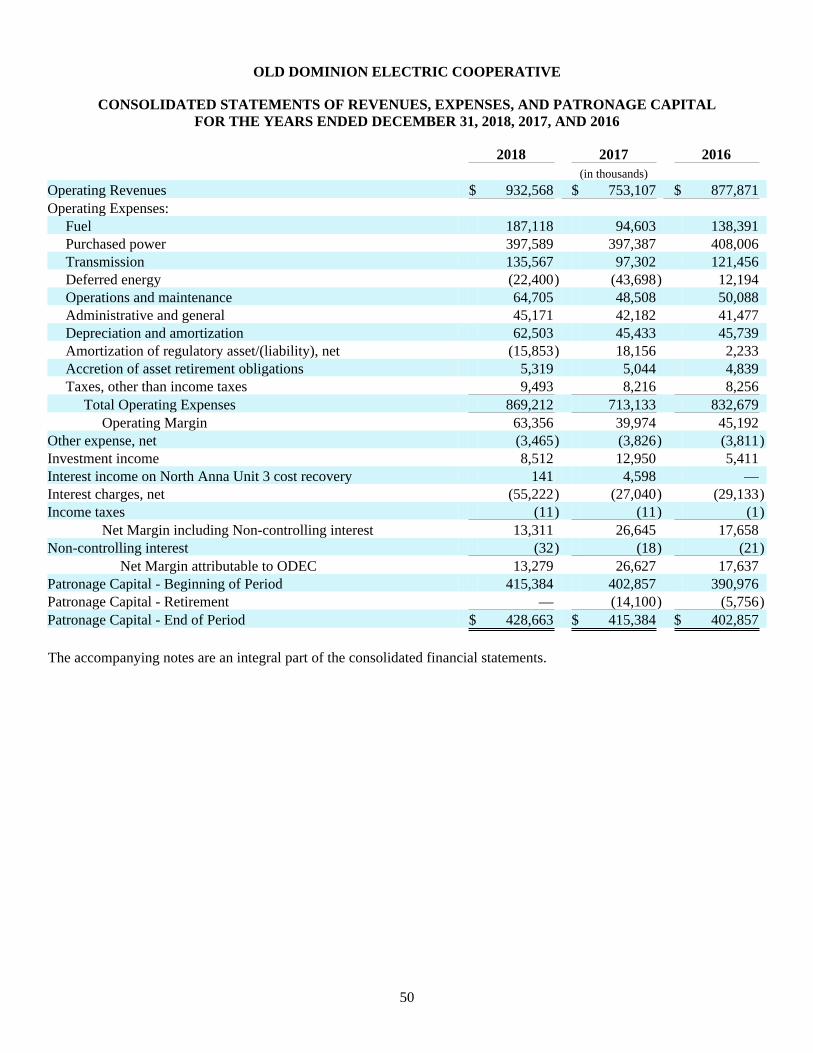
50
OLD DOMINION ELECTRIC COOPERATIVE
CONSOLIDATED STATEMENTS OF REVENUES, EXPENSES, AND PATRONAGE CAPITALFOR THE YEARS ENDED DECEMBER 31, 2018, 2017, AND 2016
2018 2017 2016 (in thousands)
Operating Revenues $ 932,568 $ 753,107 $ 877,871 Operating Expenses:
Fuel 187,118 94,603 138,391 Purchased power 397,589 397,387 408,006 Transmission 135,567 97,302 121,456 Deferred energy (22,400) (43,698) 12,194 Operations and maintenance 64,705 48,508 50,088 Administrative and general 45,171 42,182 41,477 Depreciation and amortization 62,503 45,433 45,739 Amortization of regulatory asset/(liability), net (15,853) 18,156 2,233 Accretion of asset retirement obligations 5,319 5,044 4,839 Taxes, other than income taxes 9,493 8,216 8,256
Total Operating Expenses 869,212 713,133 832,679 Operating Margin 63,356 39,974 45,192
Other expense, net (3,465) (3,826) (3,811)Investment income 8,512 12,950 5,411 Interest income on North Anna Unit 3 cost recovery 141 4,598 — Interest charges, net (55,222) (27,040) (29,133)Income taxes (11) (11) (1)
Net Margin including Non-controlling interest 13,311 26,645 17,658 Non-controlling interest (32) (18) (21)
Net Margin attributable to ODEC 13,279 26,627 17,637 Patronage Capital - Beginning of Period 415,384 402,857 390,976 Patronage Capital - Retirement — (14,100) (5,756)Patronage Capital - End of Period $ 428,663 $ 415,384 $ 402,857
The accompanying notes are an integral part of the consolidated financial statements.
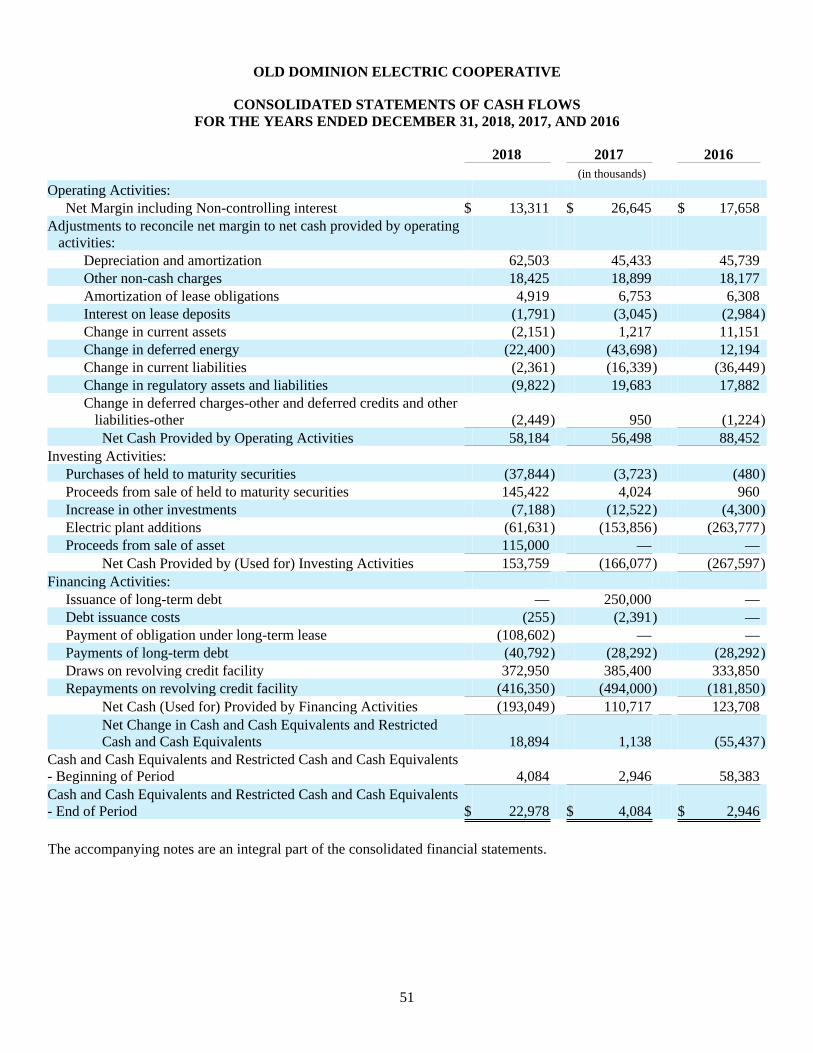
51
OLD DOMINION ELECTRIC COOPERATIVE
CONSOLIDATED STATEMENTS OF CASH FLOWSFOR THE YEARS ENDED DECEMBER 31, 2018, 2017, AND 2016
2018 2017 2016 (in thousands)
Operating Activities: Net Margin including Non-controlling interest $ 13,311 $ 26,645 $ 17,658
Adjustments to reconcile net margin to net cash provided by operating activities:
Depreciation and amortization 62,503 45,433 45,739 Other non-cash charges 18,425 18,899 18,177 Amortization of lease obligations 4,919 6,753 6,308 Interest on lease deposits (1,791) (3,045) (2,984)Change in current assets (2,151) 1,217 11,151 Change in deferred energy (22,400) (43,698) 12,194 Change in current liabilities (2,361) (16,339) (36,449)Change in regulatory assets and liabilities (9,822) 19,683 17,882 Change in deferred charges-other and deferred credits and other liabilities-other (2,449) 950 (1,224)
Net Cash Provided by Operating Activities 58,184 56,498 88,452 Investing Activities:
Purchases of held to maturity securities (37,844) (3,723) (480)Proceeds from sale of held to maturity securities 145,422 4,024 960 Increase in other investments (7,188) (12,522) (4,300)Electric plant additions (61,631) (153,856) (263,777)Proceeds from sale of asset 115,000 — —
Net Cash Provided by (Used for) Investing Activities 153,759 (166,077) (267,597)Financing Activities:
Issuance of long-term debt — 250,000 — Debt issuance costs (255) (2,391) — Payment of obligation under long-term lease (108,602) — — Payments of long-term debt (40,792) (28,292) (28,292)Draws on revolving credit facility 372,950 385,400 333,850 Repayments on revolving credit facility (416,350) (494,000) (181,850)
Net Cash (Used for) Provided by Financing Activities (193,049) 110,717 123,708 Net Change in Cash and Cash Equivalents and Restricted Cash and Cash Equivalents 18,894 1,138 (55,437)
Cash and Cash Equivalents and Restricted Cash and Cash Equivalents - Beginning of Period 4,084 2,946 58,383 Cash and Cash Equivalents and Restricted Cash and Cash Equivalents - End of Period $ 22,978 $ 4,084 $ 2,946
The accompanying notes are an integral part of the consolidated financial statements.
52
OLD DOMINION ELECTRIC COOPERATIVE
NOTES TO CONSOLIDATED FINANCIAL STATEMENTS
NOTE 1—Summary of Significant Accounting Policies
General
The accompanying financial statements reflect the consolidated accounts of Old Dominion Electric Cooperative and TEC. In accordance with Consolidation Accounting, TEC is considered a variable interest entity for which we are the primary beneficiary. We have eliminated all intercompany balances and transactions in consolidation. The assets and liabilities, and non-controlling interest of TEC are recorded at carrying value and the consolidated assets were $5.8 million and $5.7 million, as of December 31, 2018 and December 31, 2017, respectively. The income taxes reported on our Consolidated Statements of Revenues, Expenses, and Patronage Capital relate to the tax provision for TEC, which is a taxable corporation. As TEC is 100% owned by our Class A members, its equity is presented as a non-controlling interest on our consolidated financial statements. Our non-controlling, 50% or less, ownership interest in other entities for which we have significant influence is recorded using the equity method of accounting. We have a power sales contract with TEC under which we may sell to TEC, power that we do not need to meet the needs of our member distribution cooperatives. TEC then sells this power to the market under market-based rate authority granted by FERC. Additionally, we have a separate contract under which we may purchase natural gas from TEC. TEC does not engage in speculative trading.
We are a not-for-profit wholesale power supply cooperative, incorporated under the laws of the Commonwealth of Virginia in 1948. We have two classes of members. Our eleven Class A members are customer-owned electric distribution cooperatives engaged in the retail sale of power to customers located in Virginia, Delaware, and Maryland. Our sole Class B member is TEC. Our board of directors is composed of two representatives from each of the member distribution cooperatives and one representative from TEC. Our rates are set periodically by a formula that was accepted for filing by FERC, and are not regulated by the public service commissions of the states in which our member distribution cooperatives operate.
We comply with the Uniform System of Accounts prescribed by FERC. In conformity with GAAP, the accounting policies and practices applied by us in the determination of rates are also employed for financial reporting purposes.
The preparation of our consolidated financial statements in conformity with GAAP requires management to make estimates and assumptions that affect the amounts reported therein. Actual results could differ from those estimates.
We did not have any other comprehensive income for the periods presented.
Electric Plant
Electric plant is stated at original cost when first placed in service. Such cost includes contract work, direct labor and materials, allocable overhead, an allowance for borrowed funds used during construction and asset retirement costs. Upon the partial sale or retirement of plant assets, the original asset cost and current disposal costs less sale proceeds, if any, are charged or credited to accumulated depreciation. In accordance with industry practice, no profit or loss is recognized in connection with normal sales and retirements of property units.
Maintenance and repair costs are expensed as incurred. Replacements and renewals of items considered to be units of property are capitalized to the property accounts.
Depreciation
We use the group method of depreciation and conduct depreciation studies approximately every five years. Our last depreciation study was performed in 2016 and implemented in 2017. Our depreciation rates were as follows:
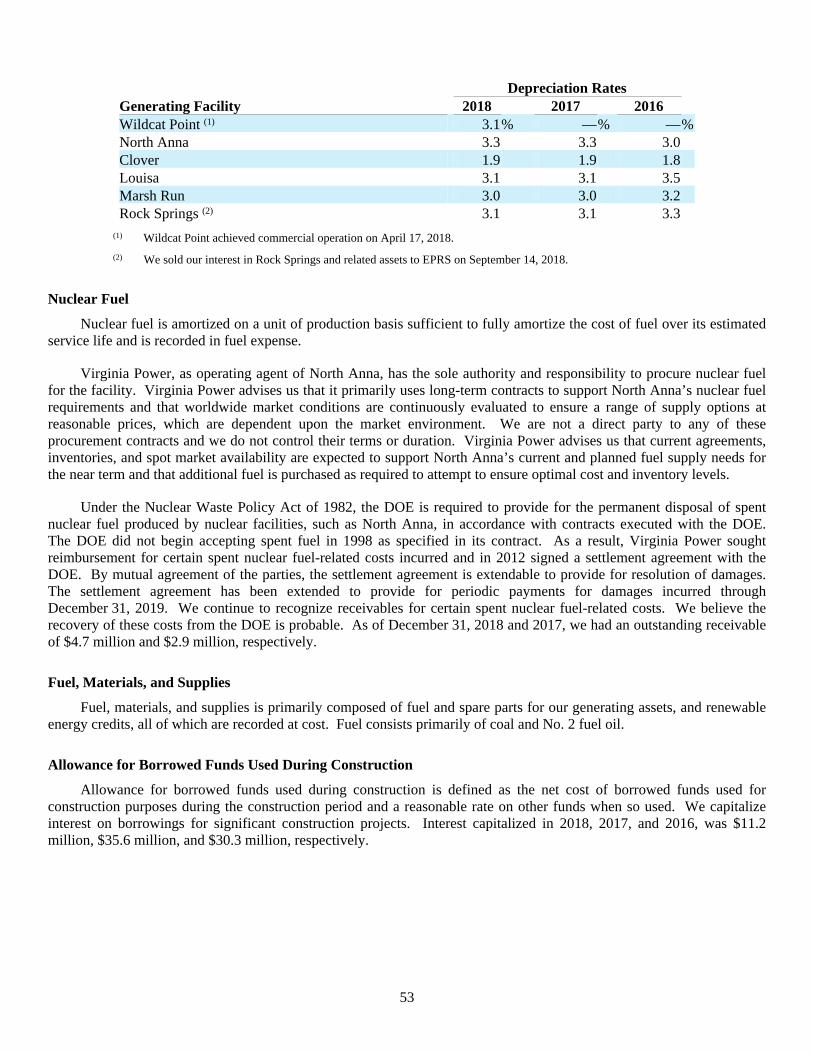
53
Depreciation Rates Generating Facility 2018 2017 2016 Wildcat Point (1) 3.1% —% —%North Anna 3.3 3.3 3.0 Clover 1.9 1.9 1.8 Louisa 3.1 3.1 3.5 Marsh Run 3.0 3.0 3.2 Rock Springs (2) 3.1 3.1 3.3
(1) Wildcat Point achieved commercial operation on April 17, 2018.
(2) We sold our interest in Rock Springs and related assets to EPRS on September 14, 2018.
Nuclear Fuel
Nuclear fuel is amortized on a unit of production basis sufficient to fully amortize the cost of fuel over its estimated service life and is recorded in fuel expense.
Virginia Power, as operating agent of North Anna, has the sole authority and responsibility to procure nuclear fuel for the facility. Virginia Power advises us that it primarily uses long-term contracts to support North Anna’s nuclear fuel requirements and that worldwide market conditions are continuously evaluated to ensure a range of supply options at reasonable prices, which are dependent upon the market environment. We are not a direct party to any of these procurement contracts and we do not control their terms or duration. Virginia Power advises us that current agreements, inventories, and spot market availability are expected to support North Anna’s current and planned fuel supply needs for the near term and that additional fuel is purchased as required to attempt to ensure optimal cost and inventory levels.
Under the Nuclear Waste Policy Act of 1982, the DOE is required to provide for the permanent disposal of spent nuclear fuel produced by nuclear facilities, such as North Anna, in accordance with contracts executed with the DOE. The DOE did not begin accepting spent fuel in 1998 as specified in its contract. As a result, Virginia Power sought reimbursement for certain spent nuclear fuel-related costs incurred and in 2012 signed a settlement agreement with the DOE. By mutual agreement of the parties, the settlement agreement is extendable to provide for resolution of damages. The settlement agreement has been extended to provide for periodic payments for damages incurred through December 31, 2019. We continue to recognize receivables for certain spent nuclear fuel-related costs. We believe the recovery of these costs from the DOE is probable. As of December 31, 2018 and 2017, we had an outstanding receivable of $4.7 million and $2.9 million, respectively.
Fuel, Materials, and Supplies
Fuel, materials, and supplies is primarily composed of fuel and spare parts for our generating assets, and renewable energy credits, all of which are recorded at cost. Fuel consists primarily of coal and No. 2 fuel oil.
Allowance for Borrowed Funds Used During Construction
Allowance for borrowed funds used during construction is defined as the net cost of borrowed funds used for construction purposes during the construction period and a reasonable rate on other funds when so used. We capitalize interest on borrowings for significant construction projects. Interest capitalized in 2018, 2017, and 2016, was $11.2 million, $35.6 million, and $30.3 million, respectively.
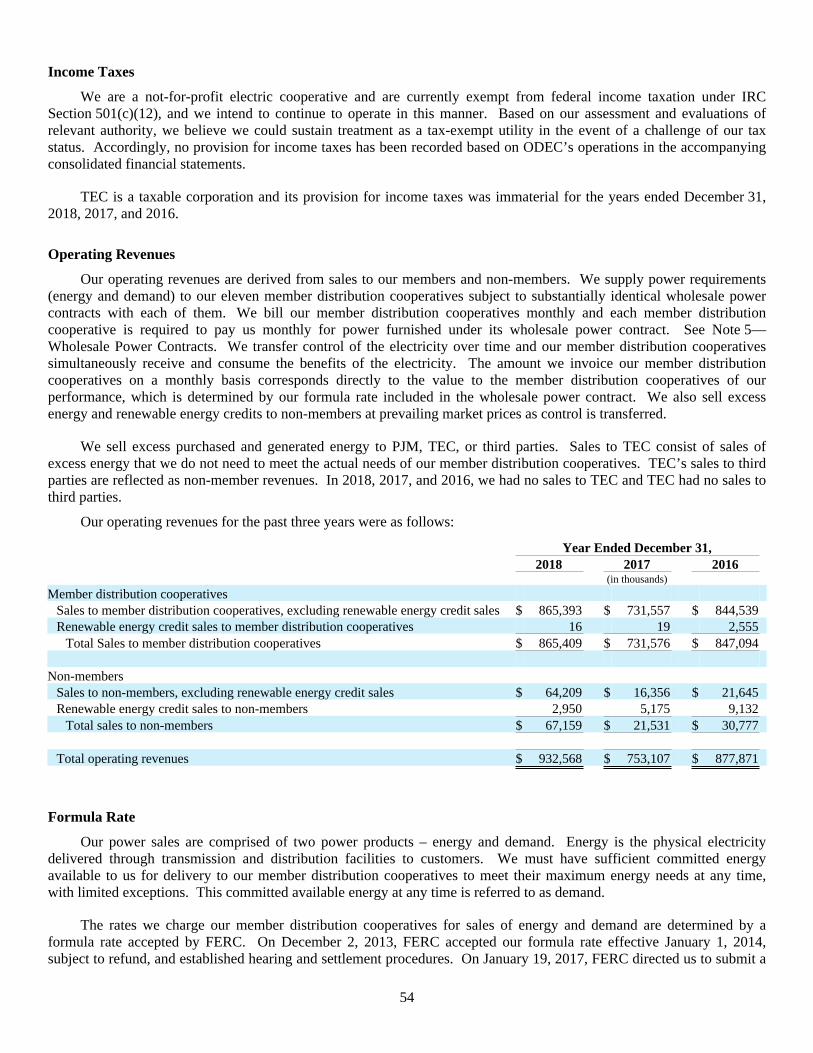
54
Income Taxes
We are a not-for-profit electric cooperative and are currently exempt from federal income taxation under IRC Section 501(c)(12), and we intend to continue to operate in this manner. Based on our assessment and evaluations of relevant authority, we believe we could sustain treatment as a tax-exempt utility in the event of a challenge of our tax status. Accordingly, no provision for income taxes has been recorded based on ODEC’s operations in the accompanying consolidated financial statements.
TEC is a taxable corporation and its provision for income taxes was immaterial for the years ended December 31, 2018, 2017, and 2016.
Operating Revenues
Our operating revenues are derived from sales to our members and non-members. We supply power requirements (energy and demand) to our eleven member distribution cooperatives subject to substantially identical wholesale power contracts with each of them. We bill our member distribution cooperatives monthly and each member distribution cooperative is required to pay us monthly for power furnished under its wholesale power contract. See Note 5—Wholesale Power Contracts. We transfer control of the electricity over time and our member distribution cooperatives simultaneously receive and consume the benefits of the electricity. The amount we invoice our member distribution cooperatives on a monthly basis corresponds directly to the value to the member distribution cooperatives of our performance, which is determined by our formula rate included in the wholesale power contract. We also sell excess energy and renewable energy credits to non-members at prevailing market prices as control is transferred.
We sell excess purchased and generated energy to PJM, TEC, or third parties. Sales to TEC consist of sales of excess energy that we do not need to meet the actual needs of our member distribution cooperatives. TEC’s sales to third parties are reflected as non-member revenues. In 2018, 2017, and 2016, we had no sales to TEC and TEC had no sales to third parties.
Our operating revenues for the past three years were as follows:
Year Ended December 31, 2018 2017 2016 (in thousands)
Member distribution cooperatives Sales to member distribution cooperatives, excluding renewable energy credit sales $ 865,393 $ 731,557 $ 844,539 Renewable energy credit sales to member distribution cooperatives 16 19 2,555
Total Sales to member distribution cooperatives $ 865,409 $ 731,576 $ 847,094
Non-members Sales to non-members, excluding renewable energy credit sales $ 64,209 $ 16,356 $ 21,645 Renewable energy credit sales to non-members 2,950 5,175 9,132
Total sales to non-members $ 67,159 $ 21,531 $ 30,777
Total operating revenues $ 932,568 $ 753,107 $ 877,871
Formula Rate
Our power sales are comprised of two power products – energy and demand. Energy is the physical electricity delivered through transmission and distribution facilities to customers. We must have sufficient committed energy available to us for delivery to our member distribution cooperatives to meet their maximum energy needs at any time, with limited exceptions. This committed available energy at any time is referred to as demand.
The rates we charge our member distribution cooperatives for sales of energy and demand are determined by a formula rate accepted by FERC. On December 2, 2013, FERC accepted our formula rate effective January 1, 2014, subject to refund, and established hearing and settlement procedures. On January 19, 2017, FERC directed us to submit a
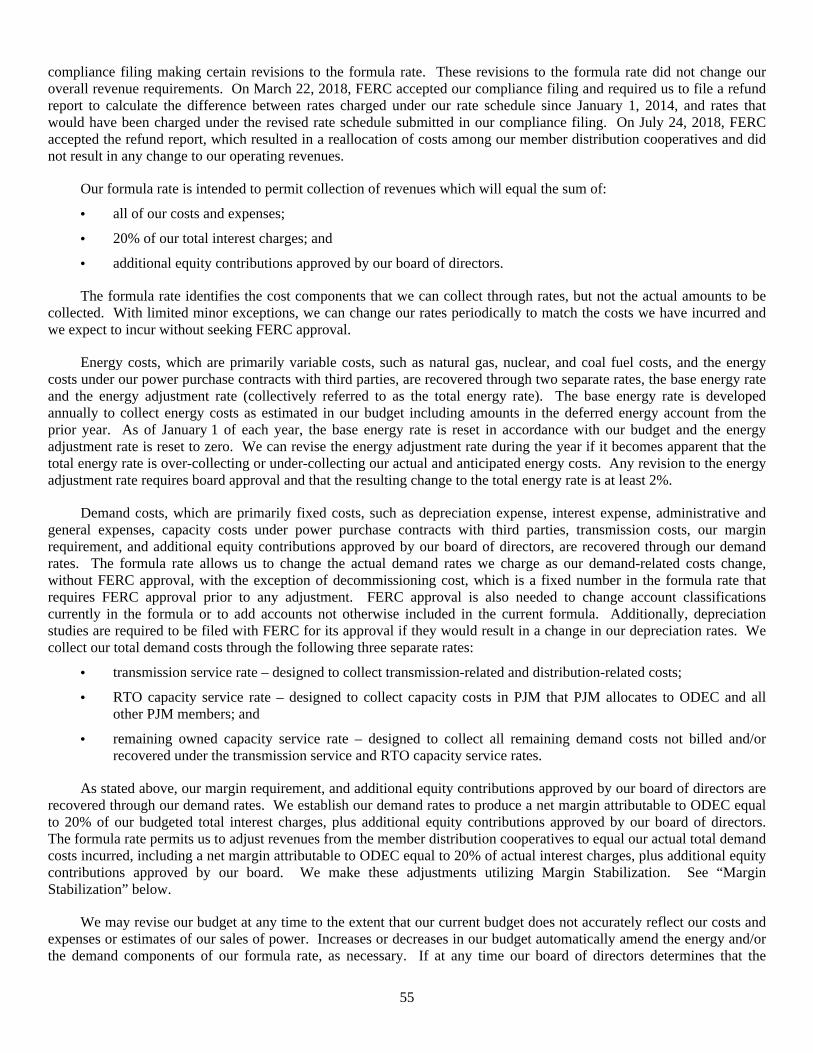
55
compliance filing making certain revisions to the formula rate. These revisions to the formula rate did not change our overall revenue requirements. On March 22, 2018, FERC accepted our compliance filing and required us to file a refund report to calculate the difference between rates charged under our rate schedule since January 1, 2014, and rates that would have been charged under the revised rate schedule submitted in our compliance filing. On July 24, 2018, FERC accepted the refund report, which resulted in a reallocation of costs among our member distribution cooperatives and did not result in any change to our operating revenues.
Our formula rate is intended to permit collection of revenues which will equal the sum of:
• all of our costs and expenses;
• 20% of our total interest charges; and
• additional equity contributions approved by our board of directors.
The formula rate identifies the cost components that we can collect through rates, but not the actual amounts to be collected. With limited minor exceptions, we can change our rates periodically to match the costs we have incurred and we expect to incur without seeking FERC approval.
Energy costs, which are primarily variable costs, such as natural gas, nuclear, and coal fuel costs, and the energy costs under our power purchase contracts with third parties, are recovered through two separate rates, the base energy rate and the energy adjustment rate (collectively referred to as the total energy rate). The base energy rate is developed annually to collect energy costs as estimated in our budget including amounts in the deferred energy account from the prior year. As of January 1 of each year, the base energy rate is reset in accordance with our budget and the energy adjustment rate is reset to zero. We can revise the energy adjustment rate during the year if it becomes apparent that the total energy rate is over-collecting or under-collecting our actual and anticipated energy costs. Any revision to the energy adjustment rate requires board approval and that the resulting change to the total energy rate is at least 2%.
Demand costs, which are primarily fixed costs, such as depreciation expense, interest expense, administrative and general expenses, capacity costs under power purchase contracts with third parties, transmission costs, our margin requirement, and additional equity contributions approved by our board of directors, are recovered through our demand rates. The formula rate allows us to change the actual demand rates we charge as our demand-related costs change, without FERC approval, with the exception of decommissioning cost, which is a fixed number in the formula rate that requires FERC approval prior to any adjustment. FERC approval is also needed to change account classifications currently in the formula or to add accounts not otherwise included in the current formula. Additionally, depreciation studies are required to be filed with FERC for its approval if they would result in a change in our depreciation rates. We collect our total demand costs through the following three separate rates:
• transmission service rate – designed to collect transmission-related and distribution-related costs;
• RTO capacity service rate – designed to collect capacity costs in PJM that PJM allocates to ODEC and all other PJM members; and
• remaining owned capacity service rate – designed to collect all remaining demand costs not billed and/or recovered under the transmission service and RTO capacity service rates.
As stated above, our margin requirement, and additional equity contributions approved by our board of directors are recovered through our demand rates. We establish our demand rates to produce a net margin attributable to ODEC equal to 20% of our budgeted total interest charges, plus additional equity contributions approved by our board of directors. The formula rate permits us to adjust revenues from the member distribution cooperatives to equal our actual total demand costs incurred, including a net margin attributable to ODEC equal to 20% of actual interest charges, plus additional equity contributions approved by our board. We make these adjustments utilizing Margin Stabilization. See “Margin Stabilization” below.
We may revise our budget at any time to the extent that our current budget does not accurately reflect our costs and expenses or estimates of our sales of power. Increases or decreases in our budget automatically amend the energy and/or the demand components of our formula rate, as necessary. If at any time our board of directors determines that the
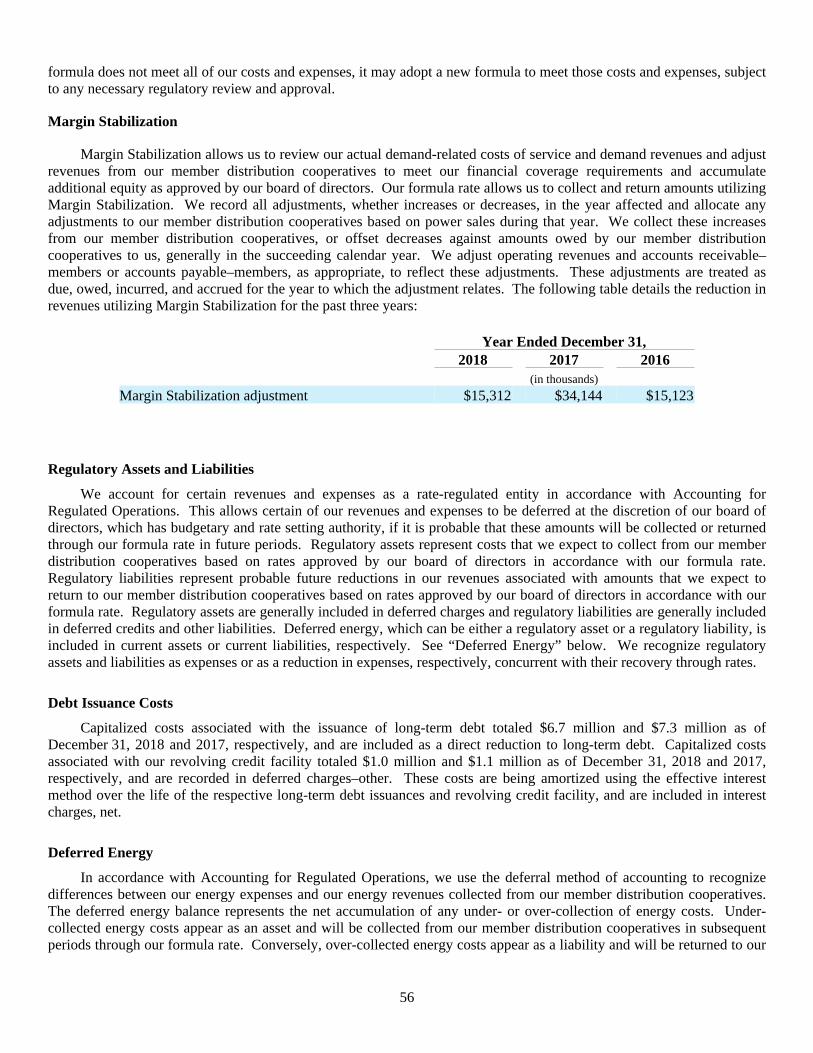
56
formula does not meet all of our costs and expenses, it may adopt a new formula to meet those costs and expenses, subject to any necessary regulatory review and approval.
Margin Stabilization
Margin Stabilization allows us to review our actual demand-related costs of service and demand revenues and adjust revenues from our member distribution cooperatives to meet our financial coverage requirements and accumulate additional equity as approved by our board of directors. Our formula rate allows us to collect and return amounts utilizing Margin Stabilization. We record all adjustments, whether increases or decreases, in the year affected and allocate any adjustments to our member distribution cooperatives based on power sales during that year. We collect these increases from our member distribution cooperatives, or offset decreases against amounts owed by our member distribution cooperatives to us, generally in the succeeding calendar year. We adjust operating revenues and accounts receivable–members or accounts payable–members, as appropriate, to reflect these adjustments. These adjustments are treated as due, owed, incurred, and accrued for the year to which the adjustment relates. The following table details the reduction in revenues utilizing Margin Stabilization for the past three years:
Year Ended December 31, 2018 2017 2016 (in thousands)
Margin Stabilization adjustment $15,312 $34,144 $15,123
Regulatory Assets and Liabilities
We account for certain revenues and expenses as a rate-regulated entity in accordance with Accounting for Regulated Operations. This allows certain of our revenues and expenses to be deferred at the discretion of our board of directors, which has budgetary and rate setting authority, if it is probable that these amounts will be collected or returned through our formula rate in future periods. Regulatory assets represent costs that we expect to collect from our member distribution cooperatives based on rates approved by our board of directors in accordance with our formula rate. Regulatory liabilities represent probable future reductions in our revenues associated with amounts that we expect to return to our member distribution cooperatives based on rates approved by our board of directors in accordance with our formula rate. Regulatory assets are generally included in deferred charges and regulatory liabilities are generally included in deferred credits and other liabilities. Deferred energy, which can be either a regulatory asset or a regulatory liability, is included in current assets or current liabilities, respectively. See “Deferred Energy” below. We recognize regulatory assets and liabilities as expenses or as a reduction in expenses, respectively, concurrent with their recovery through rates.
Debt Issuance Costs
Capitalized costs associated with the issuance of long-term debt totaled $6.7 million and $7.3 million as of December 31, 2018 and 2017, respectively, and are included as a direct reduction to long-term debt. Capitalized costs associated with our revolving credit facility totaled $1.0 million and $1.1 million as of December 31, 2018 and 2017, respectively, and are recorded in deferred charges–other. These costs are being amortized using the effective interest method over the life of the respective long-term debt issuances and revolving credit facility, and are included in interest charges, net.
Deferred Energy
In accordance with Accounting for Regulated Operations, we use the deferral method of accounting to recognize differences between our energy expenses and our energy revenues collected from our member distribution cooperatives. The deferred energy balance represents the net accumulation of any under- or over-collection of energy costs. Under-collected energy costs appear as an asset and will be collected from our member distribution cooperatives in subsequent periods through our formula rate. Conversely, over-collected energy costs appear as a liability and will be returned to our
57
member distribution cooperatives in subsequent periods through our formula rate. As of December 31, 2018 and 2017, we had an under-collected deferred energy balance of $26.1 million and $3.7 million, respectively.
The following table summarizes the changes to our total energy rate since 2016, which were implemented to address the differences in our realized as well as projected energy costs:
Effective Date of Rate Change % ChangeJanuary 1, 2016 (5.4)April 1, 2016 (6.8)September 1, 2016 (6.5)January 1, 2017 (6.7)January 1, 2018 11.1April 1, 2018 3.7January 1, 2019 (1.3)
Financial Instruments (including Derivatives)
Investments included in the nuclear decommissioning trust are carried at fair value. Unrealized gains and losses on investments held in the nuclear decommissioning trust are deferred as a regulatory liability or a regulatory asset, respectively, until realized.
Unrestricted investments in debt securities that we have the positive intent and ability to hold to maturity are recorded at amortized cost. Non-marketable equity investments, which are accounted for under the equity method, are included in other investments and recorded at cost. Equity securities in other investments are recorded at fair value. See Note 9—Investments.
We primarily purchase power under both long-term and short-term physically-delivered forward contracts to supply power to our member distribution cooperatives. These forward purchase contracts meet the accounting definition of a derivative; however, a majority of these forward purchase derivative contracts qualify for the normal purchases/normal sales accounting exception under Accounting for Derivatives and Hedging. As a result, these contracts are not recorded at fair value. We record a liability and purchased power expense when the power under the physically-delivered forward contract is delivered. We also purchase natural gas futures generally for three years or less to hedge the price of natural gas for our facilities which utilize natural gas. These derivatives do not qualify for the normal purchases/normal sales accounting exception.
For all derivative contracts that do not qualify for the normal purchases/normal sales accounting exception, we defer all remaining gains and losses on a net basis as a regulatory liability or regulatory asset, respectively, in accordance with Accounting for Regulated Operations. These amounts are subsequently reclassified as purchased power or fuel expense as the power or fuel is delivered and/or the contract settles.
Generally, derivatives are reported at fair value on the Consolidated Balance Sheet in the regulatory assets or regulatory liabilities account, and deferred charges–other or deferred credits and other liabilities–other. The measurement of fair value is based on actively quoted market prices, if available. Otherwise, we seek indicative price information from external sources, including broker quotes and industry publications. For individual contracts, the use of differing assumptions could have a material effect on the contract’s estimated fair value.
Patronage Capital
We are organized and operate as a cooperative. Patronage capital represents our retained net margins, which have been allocated to our members based upon their respective power purchases in accordance with our bylaws. Any distributions of patronage capital are subject to the discretion of our board of directors and the restrictions contained in our Indenture. See Note 11—Long-term Debt for discussion of the restrictions contained in the Indenture.
58
We operate on a not-for-profit basis and, accordingly, seek to generate revenues sufficient to recover our cost of service and produce margins sufficient to establish reasonable reserves, meet financial coverage requirements, and accumulate additional equity approved by our board of directors. On November 7, 2017, and December 13, 2016, our board of directors approved an additional equity contribution of $14.1 million and $5.8 million, respectively. Revenues in excess of expenses in any year are designated as net margin attributable to ODEC on our Consolidated Statements of Revenues, Expenses, and Patronage Capital. We designate retained net margins attributable to ODEC on our Consolidated Balance Sheet as patronage capital, which we assign to each of our members on the basis of its class of membership and business with us. On November 7, 2017, and December 13, 2016, our board of directors declared a patronage capital retirement of $14.1 million and $5.8 million, respectively. The $14.1 million patronage capital retirement was paid on April 2, 2018. The $5.8 million patronage capital retirement was paid on April 3, 2017. As a result of the November 7, 2017, and December 13, 2016, declarations, we reduced patronage capital and increased accounts payable–members by $14.1 million and $5.8 million, respectively.
Concentrations of Credit Risk
Financial instruments that potentially subject us to concentrations of credit risk consist of cash equivalents, investments, derivatives, and receivables arising from sales to our members and non-members. Concentrations of credit risk with respect to receivables arising from sales to our member distribution cooperatives as reflected by accounts receivable–members were $84.4 million and $83.1 million, as of December 31, 2018 and 2017, respectively.
Segment
We are organized for the purpose of supplying the power our member distribution cooperatives require to serve their customers on a cost-effective basis. Our President and CEO serves as our chief decision-maker who manages and reviews our operating results as one operating, and therefore one reportable, segment. We supply our member distribution cooperatives’ energy and demand requirements through a portfolio of resources including generating facilities, physically-delivered forward power purchase contracts, and spot market energy purchases.
Cash and Cash Equivalents
For purposes of our Consolidated Statements of Cash Flows, we consider all unrestricted highly liquid debt instruments purchased with an original maturity of three months or less to be cash equivalents.
The following table provides a reconciliation of cash and cash equivalents and restricted cash and cash equivalents reported within the Consolidated Balance Sheets that sum to the total of the same amounts shown in the Consolidated Statements of Cash Flows:
As of December 31, 2018 2017 (in thousands)
Cash and cash equivalents $ 8,649 $ 4,084 Restricted cash and cash equivalents 14,329 0
Total $ 22,978 $ 4,084
Restricted cash and cash equivalents relates to funds held in escrow for payments related to the construction of Wildcat Point.
New Accounting Pronouncements
In May 2014, the FASB issued Accounting Standards Update 2014-09 Revenue from Contracts with Customers (Topic 606). This update requires entities to recognize revenue when the transfer of promised goods or services to customers occurs in an amount that reflects the consideration to which the entity expects to be entitled in exchange for those goods or services. We supply power requirements (energy and demand) to our eleven member distribution
59
cooperatives subject to substantially identical wholesale power contracts with each of them. The revenues from these wholesale power contracts constituted at least 90% of our total revenues for the past three years. We bill our member distribution cooperatives monthly and each member distribution cooperative is required to pay us monthly for power furnished under its wholesale power contract. We transfer control of the electricity over time and our member distribution cooperatives simultaneously receive and consume the benefits of the electricity. The amount we invoice our member distribution cooperatives on a monthly basis corresponds directly to the value to the member distribution cooperatives of our performance, which is determined by our formula rate included in the wholesale power contract. We also sell excess energy and renewable energy credits to non-members at prevailing market prices as control is transferred. We have completed our contract review of our wholesale power and other contracts within the scope of Topic 606, and have finalized our analysis. We have not identified any material impact to our recognition of revenue from the sale of power to our member distribution cooperatives or non-members. We adopted this standard effective January 1, 2018, using the modified retrospective approach. There was no material impact to our recognition of revenue from the sale of power to our member distribution cooperatives or non-members, and there has been no cumulative effect adjustment recognized. See “Operating Revenues” above.
In January 2016, the FASB issued Accounting Standards Update 2016-01 Recognition and Measurement of Financial Assets and Financial Liabilities. This update retained the current framework for accounting for financial instruments in GAAP but made targeted improvements to address certain aspects of recognition, measurement, presentation, and disclosure of financial instruments. We adopted this update during 2018. The update requires us to measure equity investments at fair value and recognize any changes in fair value in net margin. We account for certain revenues and expenses as a rate-regulated entity in accordance with Accounting for Regulated Operations. With approval from our board of directors, changes in fair value of certain equity investments are recognized as a change in our regulatory liability account on our Consolidated Balance Sheet. See Note 9—Investments.
In February 2016, the FASB issued Accounting Standards Update 2016-02 Leases (Subtopic 835-30). This update revised accounting guidance for the recognition, measurement, presentation, and disclosure of leasing arrangements. The update requires the recognition of lease assets and liabilities for those leases currently classified as operating leases while also refining the definition of a lease. In addition, lessees will be required to disclose key information about the amount, timing, and uncertainty of cash flows arising from leasing arrangements. In July 2018, the FASB issued Accounting Standards Update 2018-11 Leases (Topic 842): Targeted Improvements, which provides an adoption method that would allow companies to apply the new guidance to the financial statements in the period of adoption and thereafter, and not apply the new guidance to comparative periods presented. We have substantially completed our review of the new accounting guidance related to leases on our financial statements and related disclosure and are finalizing the last steps of our analysis. We have identified certain practical expedients we plan to utilize. We currently do not anticipate a material impact from adopting this standard and will adopt it in the first quarter of 2019.
In November 2016, the FASB issued Accounting Standards Update 2016-18 Statement of Cash Flows (Topic 230): Restricted Cash. This update revised accounting guidance for the classification and presentation of restricted cash in the statement of cash flows. We adopted this update effective January 1, 2018, and it requires a reconciliation of cash and cash equivalents and restricted cash and cash equivalents within the Consolidated Balance Sheet and the amounts shown in the Consolidated Statement of Cash Flows. See “Cash and Cash Equivalents” above.
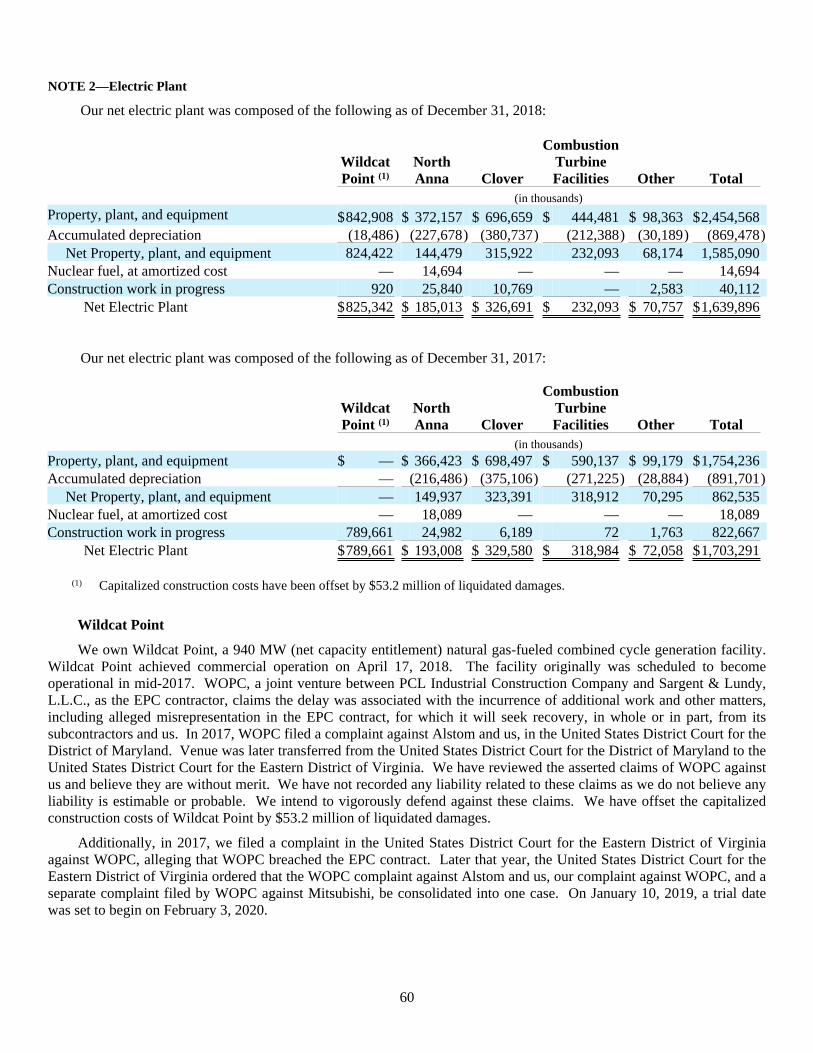
60
NOTE 2—Electric Plant
Our net electric plant was composed of the following as of December 31, 2018:
WildcatPoint (1)
NorthAnna Clover
CombustionTurbineFacilities Other Total
(in thousands)
Property, plant, and equipment $842,908 $ 372,157 $ 696,659 $ 444,481 $ 98,363 $2,454,568 Accumulated depreciation (18,486) (227,678) (380,737) (212,388) (30,189) (869,478)
Net Property, plant, and equipment 824,422 144,479 315,922 232,093 68,174 1,585,090 Nuclear fuel, at amortized cost — 14,694 — — — 14,694 Construction work in progress 920 25,840 10,769 — 2,583 40,112
Net Electric Plant $825,342 $ 185,013 $ 326,691 $ 232,093 $ 70,757 $1,639,896
Our net electric plant was composed of the following as of December 31, 2017:
WildcatPoint (1)
NorthAnna Clover
CombustionTurbineFacilities Other Total
(in thousands)
Property, plant, and equipment $ — $ 366,423 $ 698,497 $ 590,137 $ 99,179 $1,754,236 Accumulated depreciation — (216,486) (375,106) (271,225) (28,884) (891,701)
Net Property, plant, and equipment — 149,937 323,391 318,912 70,295 862,535 Nuclear fuel, at amortized cost — 18,089 — — — 18,089 Construction work in progress 789,661 24,982 6,189 72 1,763 822,667
Net Electric Plant $789,661 $ 193,008 $ 329,580 $ 318,984 $ 72,058 $1,703,291
(1) Capitalized construction costs have been offset by $53.2 million of liquidated damages.
Wildcat Point
We own Wildcat Point, a 940 MW (net capacity entitlement) natural gas-fueled combined cycle generation facility. Wildcat Point achieved commercial operation on April 17, 2018. The facility originally was scheduled to become operational in mid-2017. WOPC, a joint venture between PCL Industrial Construction Company and Sargent & Lundy, L.L.C., as the EPC contractor, claims the delay was associated with the incurrence of additional work and other matters, including alleged misrepresentation in the EPC contract, for which it will seek recovery, in whole or in part, from its subcontractors and us. In 2017, WOPC filed a complaint against Alstom and us, in the United States District Court for the District of Maryland. Venue was later transferred from the United States District Court for the District of Maryland to the United States District Court for the Eastern District of Virginia. We have reviewed the asserted claims of WOPC against us and believe they are without merit. We have not recorded any liability related to these claims as we do not believe any liability is estimable or probable. We intend to vigorously defend against these claims. We have offset the capitalized construction costs of Wildcat Point by $53.2 million of liquidated damages.
Additionally, in 2017, we filed a complaint in the United States District Court for the Eastern District of Virginia against WOPC, alleging that WOPC breached the EPC contract. Later that year, the United States District Court for the Eastern District of Virginia ordered that the WOPC complaint against Alstom and us, our complaint against WOPC, and a separate complaint filed by WOPC against Mitsubishi, be consolidated into one case. On January 10, 2019, a trial date was set to begin on February 3, 2020.
61
If it is ultimately determined that we owe any such amounts to WOPC, the amounts are not expected to have a material impact on our financial position or results of operations due to our ability to collect such amounts through rates to our member distribution cooperatives.
North Anna
We hold an 11.6% undivided ownership interest in North Anna, a two-unit, 1,892 MW (net capacity entitlement) nuclear power facility operated by Virginia Power, which owns the balance of the plant. We are responsible for and must fund 11.6% of all post-acquisition date additions and operating costs associated with North Anna, as well as a pro-rata portion of Virginia Power’s administrative and general expenses directly attributable to North Anna. Our portion of assets, liabilities, and operating expenses associated with North Anna are included on our consolidated financial statements in accordance with proportionate consolidation accounting. As of December 31, 2018 and 2017, we had an outstanding accounts payable balance of $6.6 million and $8.8 million, respectively, due to Virginia Power for operation, maintenance, and capital investment at North Anna.
Clover
We hold a 50% undivided ownership interest in Clover, a two-unit, 877 MW (net capacity entitlement) coal-fired electric generation facility operated by Virginia Power, which owns the balance of the plant. We are responsible for and must fund half of all additions and operating costs associated with Clover, as well as half of Virginia Power’s administrative and general expenses directly attributable to Clover. Our portion of assets, liabilities, and operating expenses associated with Clover are included on our consolidated financial statements in accordance with proportionate consolidation accounting. As of December 31, 2018 and 2017, we had an outstanding accounts payable balance of $12.3 million and $10.4 million, respectively, due to Virginia Power for operation, maintenance, and capital investment at Clover.
Combustion Turbine Facilities
We own two combustion turbine facilities, Louisa and Marsh Run, that are primarily fueled by natural gas.
Prior to September 14, 2018, we owned a third combustion turbine facility, Rock Springs. On September 14, 2018, we sold our interest in Rock Springs and related assets to EPRS for $115 million. Prior to the sale, we and EPRS had each individually owned two natural gas-fired combustion turbine units and a 50% undivided interest in related common facilities at Rock Springs. The transaction resulted in a gain of $42.7 million, which our board of directors approved to defer as a regulatory liability. We amortized $5.0 million of the gain in 2018 and the remaining $37.7 million will be amortized ratably in 2019.
Other
We also own six distributed generation facilities and approximately 110 miles of transmission lines on the Virginia portion of the Delmarva Peninsula. NOTE 3—Accounting for Asset Retirement and Environmental Obligations
We account for our asset retirement obligations in accordance with Accounting for Asset Retirement and Environmental Obligations. This requires that legal obligations associated with the retirement of long-lived assets be recognized at fair value when incurred and capitalized as part of the related long-lived asset. Over time, the liability is accreted to its present value each period, and the capitalized asset is depreciated over the useful life of the long-lived asset.
In the absence of quoted market prices, we estimate the fair value of our asset retirement obligations using present value techniques, in which estimates of future cash flows associated with retirement activities are discounted using a credit-adjusted risk-free rate. Our estimated liability could change significantly if actual costs vary from assumptions or if governmental regulations change significantly.
62
A significant portion of our asset retirement obligations relates to our share of the future costs to decommission North Anna. At December 31, 2018 and 2017, our share of North Anna’s nuclear decommissioning asset retirement obligation totaled $110.2 million and $105.8 million, respectively. Approximately every four years, a new decommissioning study for North Anna is performed by third-party experts. Our current estimate is based on a study that was performed in 2014 and adopted effective December 1, 2014. This study resulted in an additional layer related to the asset retirement obligation associated with North Anna. The additional layer resulted in an increase to our asset retirement cost and our asset retirement obligation of $18.0 million. Increased spent fuel costs, including interim storage, insurance premiums, and regulatory and environmental permits and fees, as a result of the DOE delay for acceptance of spent fuel, are the primary drivers for the increase in the asset retirement obligation. We are not aware of any events that have occurred since the 2014 study that would materially impact our estimate. We anticipate that the next study will be performed in 2019. We are required to maintain a funded trust to satisfy our future obligation to decommission the North Anna facility. See Note 9—Investments.
In 2017, we established a $2.1 million asset retirement obligation related to Wildcat Point and a $0.1 million asset retirement obligation related to one of our distributed generation facilities. In 2018, we recorded a $0.2 million decrease in the asset retirement obligation related to the sale of our Rock Springs facility and related assets. In 2018, we also recorded a $0.4 million decrease in the asset retirement obligation related to Clover as a result of a difference in estimated and actual costs for an asset retirement obligation.
The following represents changes in our asset retirement obligations for the years ended December 31, 2018 and 2017 (in thousands):
Asset retirement obligations as of December 31, 2016 $ 120,083 Accretion expense 5,044 Additional asset retirement obligations 2,210 Payments (867)
Asset retirement obligations as of December 31, 2017 $ 126,470 Accretion expense 5,319 Decrease in asset retirement obligations (570)Payments (731)
Asset retirement obligations as of December 31, 2018 $ 130,488
The cash flow estimates for North Anna’s asset retirement obligation are based upon the 20-year life extension which was granted in 2003 and extends the life of Unit 1 to April 1, 2038, and the life of Unit 2 to August 21, 2040. Given the life extension, the nuclear decommissioning trust was, and currently is, estimated to be adequate to fund North Anna’s asset retirement obligation and no additional funding was, or is, currently required. We ceased collection of decommissioning expense in August 2003 with the approval of FERC. As we are not currently collecting decommissioning expense in our rates, we are deferring the difference between the earnings on the nuclear decommissioning trust and the total asset retirement obligation related depreciation and accretion expense for North Anna as part of our asset retirement obligation regulatory liability. See Note 10—Regulatory Assets and Liabilities. Virginia Power, the co-owner of North Anna, has announced its intention to apply for an additional 20-year operating license extension for North Anna.
NOTE 4—Power Purchase Agreements
In 2018, 2017, and 2016, our owned generating facilities together furnished approximately 57.1%, 36.7%, and 45.2%, respectively, of our energy requirements. The remaining needs were satisfied through purchases of power in the market from investor owned utilities and power marketers through long-term and short-term physically-delivered forward power purchase contracts. We also purchased power in the spot energy market. This approach to meeting our member distribution cooperatives’ energy requirements is not without risks. To mitigate these risks, we attempt to match our energy purchases with our energy needs to reduce our spot market purchases of energy and sales of excess energy. Additionally, we utilize policies, procedures, and various hedging instruments to manage our power market price risks. These policies and procedures, developed in consultation with ACES, an energy trading and risk management company,
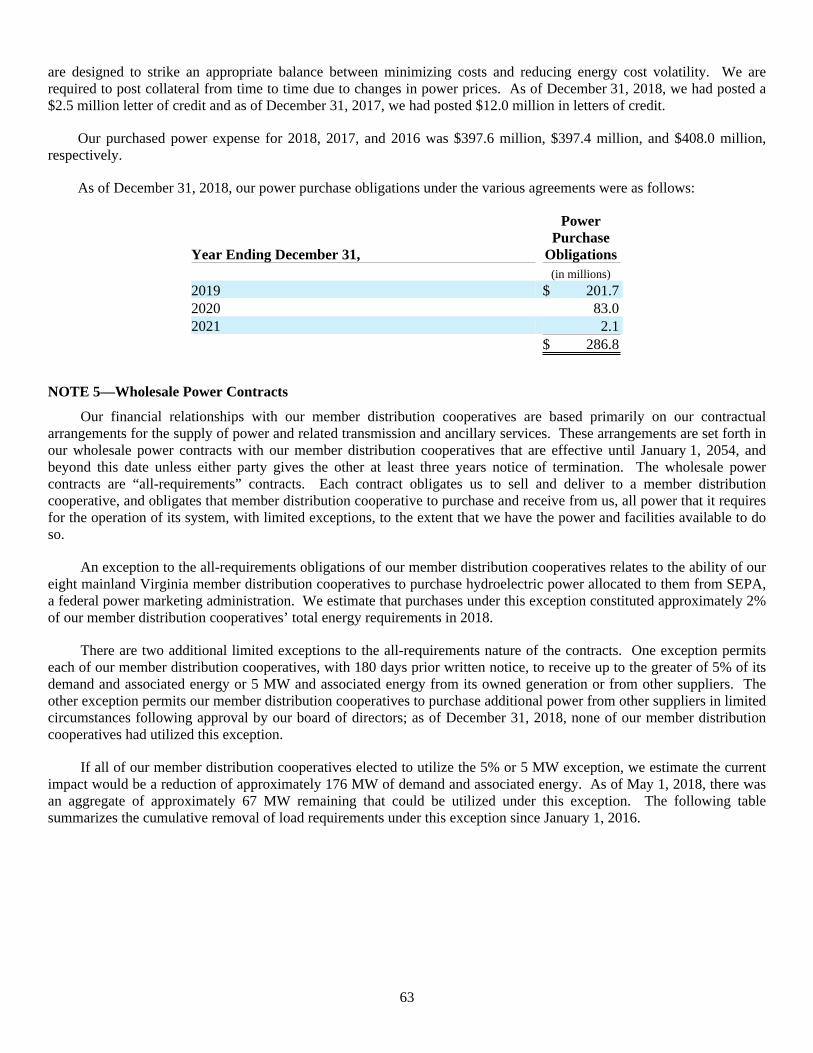
63
are designed to strike an appropriate balance between minimizing costs and reducing energy cost volatility. We are required to post collateral from time to time due to changes in power prices. As of December 31, 2018, we had posted a $2.5 million letter of credit and as of December 31, 2017, we had posted $12.0 million in letters of credit.
Our purchased power expense for 2018, 2017, and 2016 was $397.6 million, $397.4 million, and $408.0 million, respectively.
As of December 31, 2018, our power purchase obligations under the various agreements were as follows:
Year Ending December 31,
Power Purchase
Obligations (in millions)
2019 $ 201.7 2020 83.0 2021 2.1 $ 286.8
NOTE 5—Wholesale Power Contracts
Our financial relationships with our member distribution cooperatives are based primarily on our contractual arrangements for the supply of power and related transmission and ancillary services. These arrangements are set forth in our wholesale power contracts with our member distribution cooperatives that are effective until January 1, 2054, and beyond this date unless either party gives the other at least three years notice of termination. The wholesale power contracts are “all-requirements” contracts. Each contract obligates us to sell and deliver to a member distribution cooperative, and obligates that member distribution cooperative to purchase and receive from us, all power that it requires for the operation of its system, with limited exceptions, to the extent that we have the power and facilities available to do so.
An exception to the all-requirements obligations of our member distribution cooperatives relates to the ability of our eight mainland Virginia member distribution cooperatives to purchase hydroelectric power allocated to them from SEPA, a federal power marketing administration. We estimate that purchases under this exception constituted approximately 2% of our member distribution cooperatives’ total energy requirements in 2018.
There are two additional limited exceptions to the all-requirements nature of the contracts. One exception permits each of our member distribution cooperatives, with 180 days prior written notice, to receive up to the greater of 5% of its demand and associated energy or 5 MW and associated energy from its owned generation or from other suppliers. The other exception permits our member distribution cooperatives to purchase additional power from other suppliers in limited circumstances following approval by our board of directors; as of December 31, 2018, none of our member distribution cooperatives had utilized this exception.
If all of our member distribution cooperatives elected to utilize the 5% or 5 MW exception, we estimate the current impact would be a reduction of approximately 176 MW of demand and associated energy. As of May 1, 2018, there was an aggregate of approximately 67 MW remaining that could be utilized under this exception. The following table summarizes the cumulative removal of load requirements under this exception since January 1, 2016.
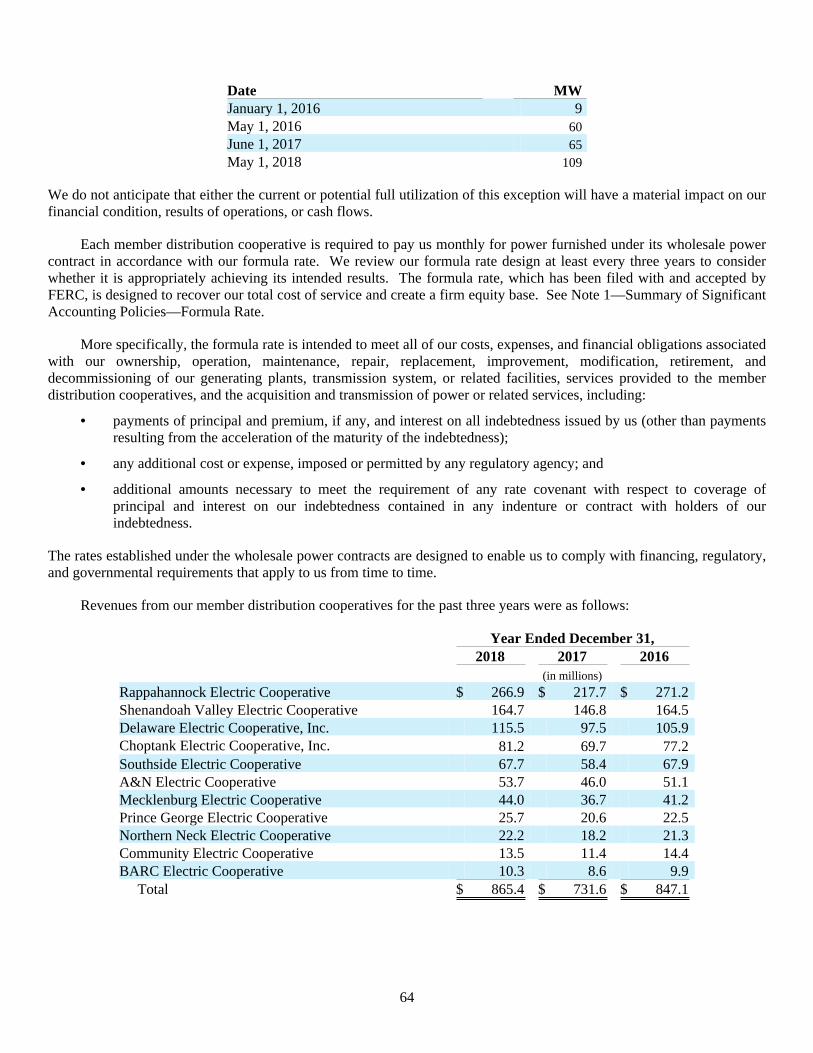
64
Date MW January 1, 2016 9May 1, 2016 60June 1, 2017 65May 1, 2018 109
We do not anticipate that either the current or potential full utilization of this exception will have a material impact on our financial condition, results of operations, or cash flows.
Each member distribution cooperative is required to pay us monthly for power furnished under its wholesale power contract in accordance with our formula rate. We review our formula rate design at least every three years to consider whether it is appropriately achieving its intended results. The formula rate, which has been filed with and accepted by FERC, is designed to recover our total cost of service and create a firm equity base. See Note 1—Summary of Significant Accounting Policies—Formula Rate.
More specifically, the formula rate is intended to meet all of our costs, expenses, and financial obligations associated with our ownership, operation, maintenance, repair, replacement, improvement, modification, retirement, and decommissioning of our generating plants, transmission system, or related facilities, services provided to the member distribution cooperatives, and the acquisition and transmission of power or related services, including:
• payments of principal and premium, if any, and interest on all indebtedness issued by us (other than payments resulting from the acceleration of the maturity of the indebtedness);
• any additional cost or expense, imposed or permitted by any regulatory agency; and
• additional amounts necessary to meet the requirement of any rate covenant with respect to coverage of principal and interest on our indebtedness contained in any indenture or contract with holders of our indebtedness.
The rates established under the wholesale power contracts are designed to enable us to comply with financing, regulatory, and governmental requirements that apply to us from time to time.
Revenues from our member distribution cooperatives for the past three years were as follows:
Year Ended December 31, 2018 2017 2016 (in millions)
Rappahannock Electric Cooperative $ 266.9 $ 217.7 $ 271.2 Shenandoah Valley Electric Cooperative 164.7 146.8 164.5 Delaware Electric Cooperative, Inc. 115.5 97.5 105.9 Choptank Electric Cooperative, Inc. 81.2 69.7 77.2 Southside Electric Cooperative 67.7 58.4 67.9 A&N Electric Cooperative 53.7 46.0 51.1 Mecklenburg Electric Cooperative 44.0 36.7 41.2 Prince George Electric Cooperative 25.7 20.6 22.5 Northern Neck Electric Cooperative 22.2 18.2 21.3 Community Electric Cooperative 13.5 11.4 14.4 BARC Electric Cooperative 10.3 8.6 9.9
Total $ 865.4 $ 731.6 $ 847.1

65
NOTE 6—Fair Value Measurements
The fair value hierarchy gives the highest priority to quoted prices in active markets (Level 1) and the lowest priority to unobservable data (Level 3). In some cases, the inputs used to measure fair value might fall in different levels of the fair value hierarchy. The lowest level input that is significant to a fair value measurement in its entirety determines the applicable level in the fair value hierarchy. Assessing the significance of a particular input to the fair value measurement in its entirety requires judgment, considering factors specific to the asset or liability.
The following table summarizes our financial assets and liabilities measured at fair value on a recurring basis as of December 31, 2018 and 2017:
Quoted Prices in Active Significant
Markets for Other Significant Identical Observable Unobservable December 31, Assets Inputs Inputs 2018 (Level 1) (Level 2) (Level 3) (in thousands)
Nuclear decommissioning trust (1) $ 59,150 $ 59,150 $ — $ — Nuclear decommissioning trust - net asset value (1)(2) 114,801 — — — Unrestricted investments and other (3) 394 — 394 — Derivatives - gas and power (4) 784 — 784 —
Total Financial Assets $ 175,129 $ 59,150 $ 1,178 $ —
Derivatives - gas and power (4) $ 591 $ 591 $ — $ —
Total Financial Liabilities $ 591 $ 591 $ — $ —
Quoted Prices in Active Significant
Markets for Other Significant Identical Observable Unobservable
December 31, Assets Inputs Inputs 2017 (Level 1) (Level 2) (Level 3)
(in thousands)
Nuclear decommissioning trust (1) $ 59,723 $ 59,723 $ — $ — Nuclear decommissioning trust - net asset value (1)(2) 123,958 — — — Unrestricted investments and other (3) 308 — 308 —
Total Financial Assets $ 183,989 $ 59,723 $ 308 $ —
Derivatives - gas and power (4) $ 1,034 $ 975 $ 59 $ —
Total Financial Liabilities $ 1,034 $ 975 $ 59 $ —
(1) For additional information about our nuclear decommissioning trust, see Note 9—Investments.
(2) Nuclear decommissioning trust includes investments measured at net asset value per share (or its equivalent) as a practical expedient and these investments have not been categorized in the fair value hierarchy. The fair value amounts presented in this table are intended to permit reconciliation of the fair value hierarchy to the amounts presented in the Consolidated Balance Sheet.
(3) Unrestricted investments and other includes investments that are related to equity securities.
(4) Derivatives – gas and power represent natural gas futures contracts. Level 1 are indexed against NYMEX. Level 2 are valued by ACES using observable market inputs for similar transactions. For additional information about our derivative financial instruments, see Note 1—Summary of Significant Accounting Policies.
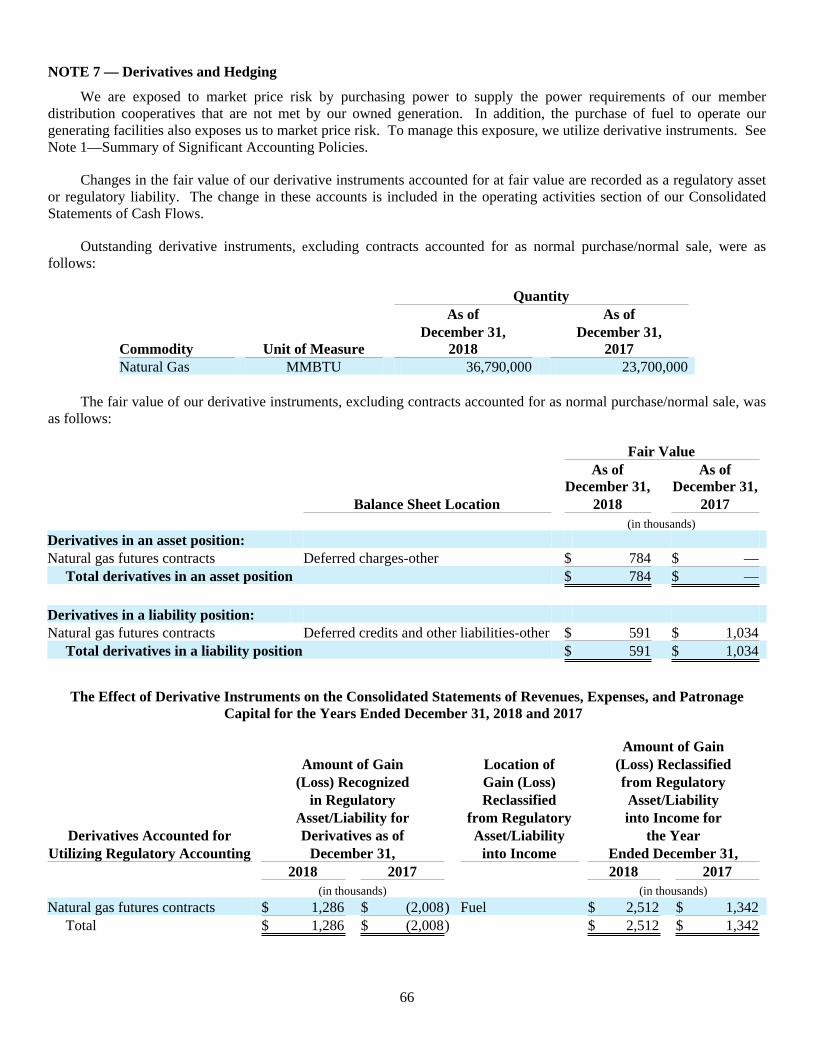
66
NOTE 7 — Derivatives and Hedging
We are exposed to market price risk by purchasing power to supply the power requirements of our member distribution cooperatives that are not met by our owned generation. In addition, the purchase of fuel to operate our generating facilities also exposes us to market price risk. To manage this exposure, we utilize derivative instruments. See Note 1—Summary of Significant Accounting Policies.
Changes in the fair value of our derivative instruments accounted for at fair value are recorded as a regulatory asset or regulatory liability. The change in these accounts is included in the operating activities section of our Consolidated Statements of Cash Flows.
Outstanding derivative instruments, excluding contracts accounted for as normal purchase/normal sale, were as follows:
Quantity As of As of
Commodity Unit of Measure December 31,
2018 December 31,
2017 Natural Gas MMBTU 36,790,000 23,700,000
The fair value of our derivative instruments, excluding contracts accounted for as normal purchase/normal sale, was as follows:
Fair Value
As of
December 31, As of
December 31, Balance Sheet Location 2018 2017
(in thousands) Derivatives in an asset position: Natural gas futures contracts Deferred charges-other $ 784 $ —
Total derivatives in an asset position $ 784 $ —
Derivatives in a liability position: Natural gas futures contracts Deferred credits and other liabilities-other $ 591 $ 1,034
Total derivatives in a liability position $ 591 $ 1,034
The Effect of Derivative Instruments on the Consolidated Statements of Revenues, Expenses, and Patronage Capital for the Years Ended December 31, 2018 and 2017
Amount of Gain Amount of Gain Location of (Loss) Reclassified (Loss) Recognized Gain (Loss) from Regulatory in Regulatory Reclassified Asset/Liability
Asset/Liability for from Regulatory into Income for Derivatives Accounted for Derivatives as of Asset/Liability the Year
Utilizing Regulatory Accounting December 31, into Income Ended December 31, 2018 2017 2018 2017 (in thousands) (in thousands)
Natural gas futures contracts $ 1,286 $ (2,008) Fuel $ 2,512 $ 1,342 Total $ 1,286 $ (2,008) $ 2,512 $ 1,342
67
NOTE 8—Long-term Lease Transaction
On March 1, 1996, we entered into a long-term lease transaction with an owner trust for the benefit of an investor. Under the terms of the transaction, we entered into a 48.8 year lease of our interest in Clover Unit 1, valued at $315.0 million, to such owner trust, and immediately after we entered into a 21.8 year lease of the interest back from such owner trust. As a result of the transaction, we recorded a deferred gain of $23.7 million, which was amortized into income ratably over the 21.8 year operating lease term, as a reduction to depreciation and amortization expense. As of December 31, 2017, the deferred gain was fully amortized.
We used a portion of the one-time rental payment of $315.0 million we received to enter into a payment undertaking agreement and to purchase an investment that would provide for substantially all of our periodic rent payments under the leaseback, and the fixed purchase price of the interest in the unit at the end of the term of the leaseback if we were to exercise our option to purchase the interest of the owner trust in the unit at that time. As of December 31, 2017, the payment undertaking agreement had a balance of $304.7 million, and the amount of debt considered to be extinguished by in substance defeasance was $304.7 million.
We elected to purchase the owner trust’s interest in the unit and terminate the lease effective January 5, 2018, for a fixed purchase price of $430.5 million. On January 5, 2018, payments under the payment undertaking agreement funded $289.7 million of this amount, and $32.2 million was provided by us and in turn paid to us as the holder of a loan to the owner trust. The remaining balance of the fixed purchase price was funded by United States Treasury securities with a maturity value of $108.6 million and was paid in four installments during 2018.
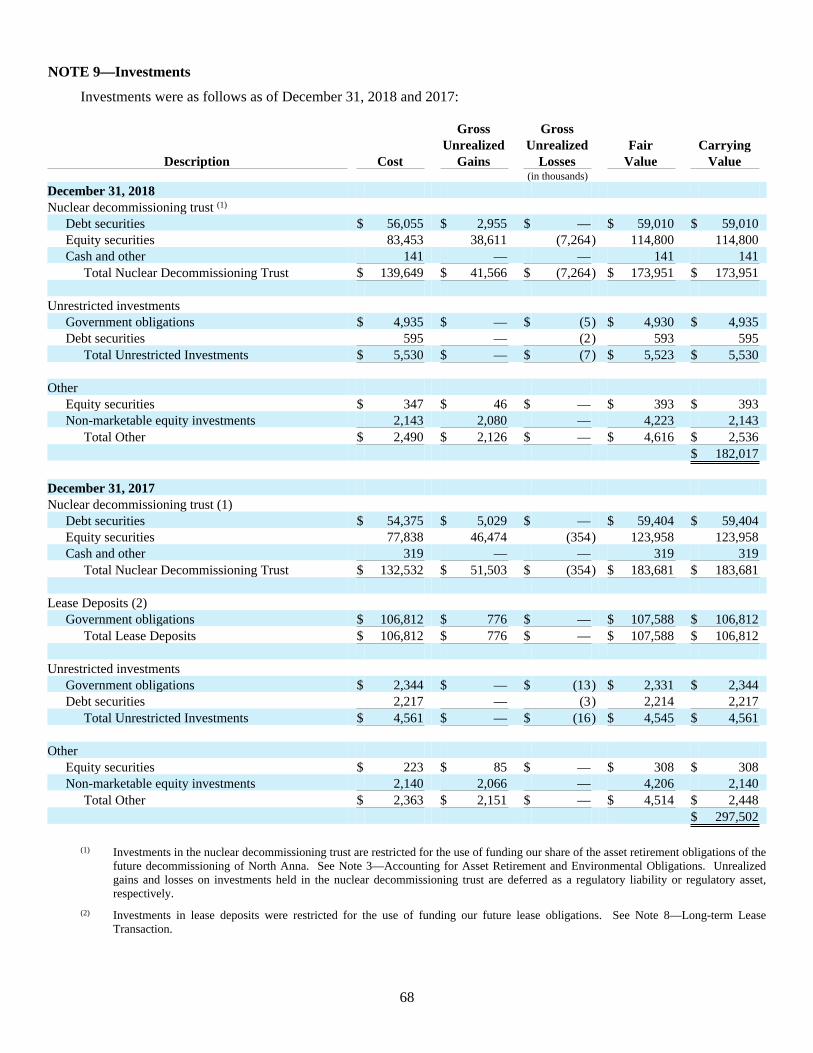
68
NOTE 9—Investments
Investments were as follows as of December 31, 2018 and 2017:
Gross Gross Unrealized Unrealized Fair Carrying
Description Cost Gains Losses Value Value (in thousands)
December 31, 2018 Nuclear decommissioning trust (1)
Debt securities $ 56,055 $ 2,955 $ — $ 59,010 $ 59,010 Equity securities 83,453 38,611 (7,264) 114,800 114,800 Cash and other 141 — — 141 141
Total Nuclear Decommissioning Trust $ 139,649 $ 41,566 $ (7,264) $ 173,951 $ 173,951 Unrestricted investments
Government obligations $ 4,935 $ — $ (5) $ 4,930 $ 4,935 Debt securities 595 — (2) 593 595
Total Unrestricted Investments $ 5,530 $ — $ (7) $ 5,523 $ 5,530 Other
Equity securities $ 347 $ 46 $ — $ 393 $ 393 Non-marketable equity investments 2,143 2,080 — 4,223 2,143
Total Other $ 2,490 $ 2,126 $ — $ 4,616 $ 2,536 $ 182,017 December 31, 2017 Nuclear decommissioning trust (1)
Debt securities $ 54,375 $ 5,029 $ — $ 59,404 $ 59,404 Equity securities 77,838 46,474 (354) 123,958 123,958 Cash and other 319 — — 319 319
Total Nuclear Decommissioning Trust $ 132,532 $ 51,503 $ (354) $ 183,681 $ 183,681 Lease Deposits (2)
Government obligations $ 106,812 $ 776 $ — $ 107,588 $ 106,812 Total Lease Deposits $ 106,812 $ 776 $ — $ 107,588 $ 106,812
Unrestricted investments
Government obligations $ 2,344 $ — $ (13) $ 2,331 $ 2,344 Debt securities 2,217 — (3) 2,214 2,217
Total Unrestricted Investments $ 4,561 $ — $ (16) $ 4,545 $ 4,561 Other
Equity securities $ 223 $ 85 $ — $ 308 $ 308 Non-marketable equity investments 2,140 2,066 — 4,206 2,140
Total Other $ 2,363 $ 2,151 $ — $ 4,514 $ 2,448 $ 297,502
(1) Investments in the nuclear decommissioning trust are restricted for the use of funding our share of the asset retirement obligations of the future decommissioning of North Anna. See Note 3—Accounting for Asset Retirement and Environmental Obligations. Unrealized gains and losses on investments held in the nuclear decommissioning trust are deferred as a regulatory liability or regulatory asset, respectively.
(2) Investments in lease deposits were restricted for the use of funding our future lease obligations. See Note 8—Long-term Lease Transaction.
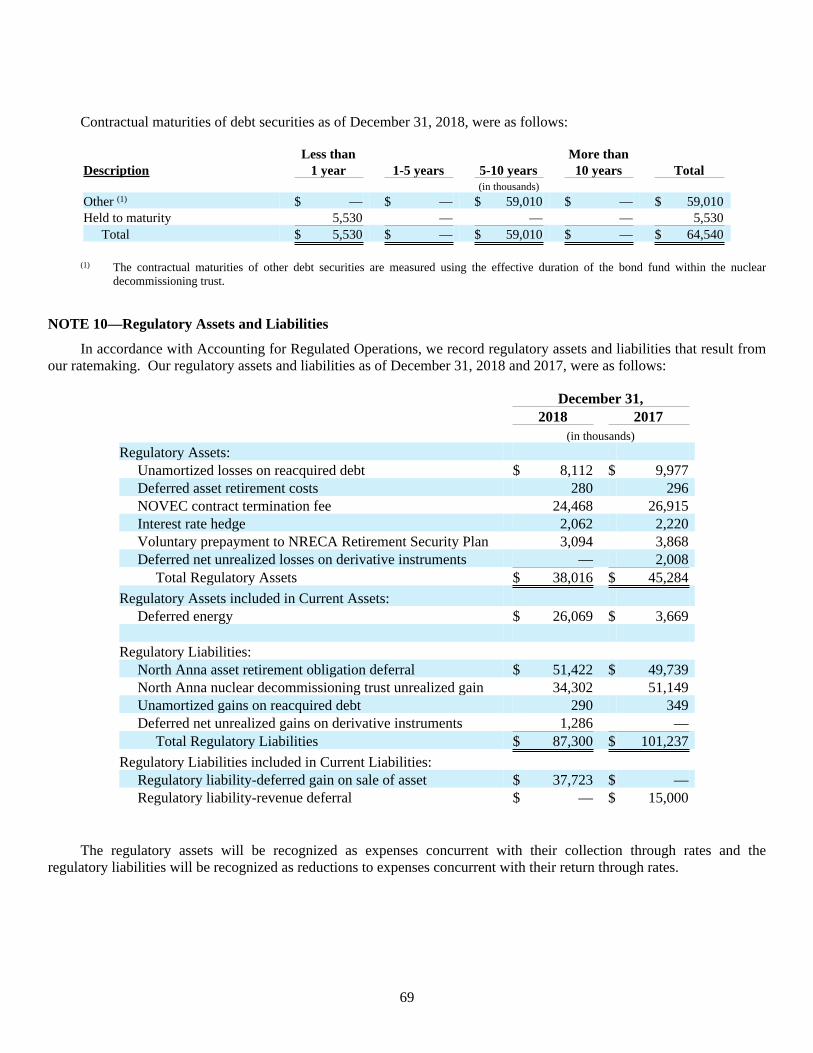
69
Contractual maturities of debt securities as of December 31, 2018, were as follows:
Less than More than Description 1 year 1-5 years 5-10 years 10 years Total (in thousands) Other (1) $ — $ — $ 59,010 $ — $ 59,010 Held to maturity 5,530 — — — 5,530
Total $ 5,530 $ — $ 59,010 $ — $ 64,540
(1) The contractual maturities of other debt securities are measured using the effective duration of the bond fund within the nuclear decommissioning trust.
NOTE 10—Regulatory Assets and Liabilities
In accordance with Accounting for Regulated Operations, we record regulatory assets and liabilities that result from our ratemaking. Our regulatory assets and liabilities as of December 31, 2018 and 2017, were as follows:
December 31, 2018 2017 (in thousands)
Regulatory Assets: Unamortized losses on reacquired debt $ 8,112 $ 9,977 Deferred asset retirement costs 280 296 NOVEC contract termination fee 24,468 26,915 Interest rate hedge 2,062 2,220 Voluntary prepayment to NRECA Retirement Security Plan 3,094 3,868 Deferred net unrealized losses on derivative instruments — 2,008
Total Regulatory Assets $ 38,016 $ 45,284
Regulatory Assets included in Current Assets: Deferred energy $ 26,069 $ 3,669
Regulatory Liabilities:
North Anna asset retirement obligation deferral $ 51,422 $ 49,739 North Anna nuclear decommissioning trust unrealized gain 34,302 51,149 Unamortized gains on reacquired debt 290 349 Deferred net unrealized gains on derivative instruments 1,286 —
Total Regulatory Liabilities $ 87,300 $ 101,237
Regulatory Liabilities included in Current Liabilities: Regulatory liability-deferred gain on sale of asset $ 37,723 $ — Regulatory liability-revenue deferral $ — $ 15,000
The regulatory assets will be recognized as expenses concurrent with their collection through rates and the regulatory liabilities will be recognized as reductions to expenses concurrent with their return through rates.
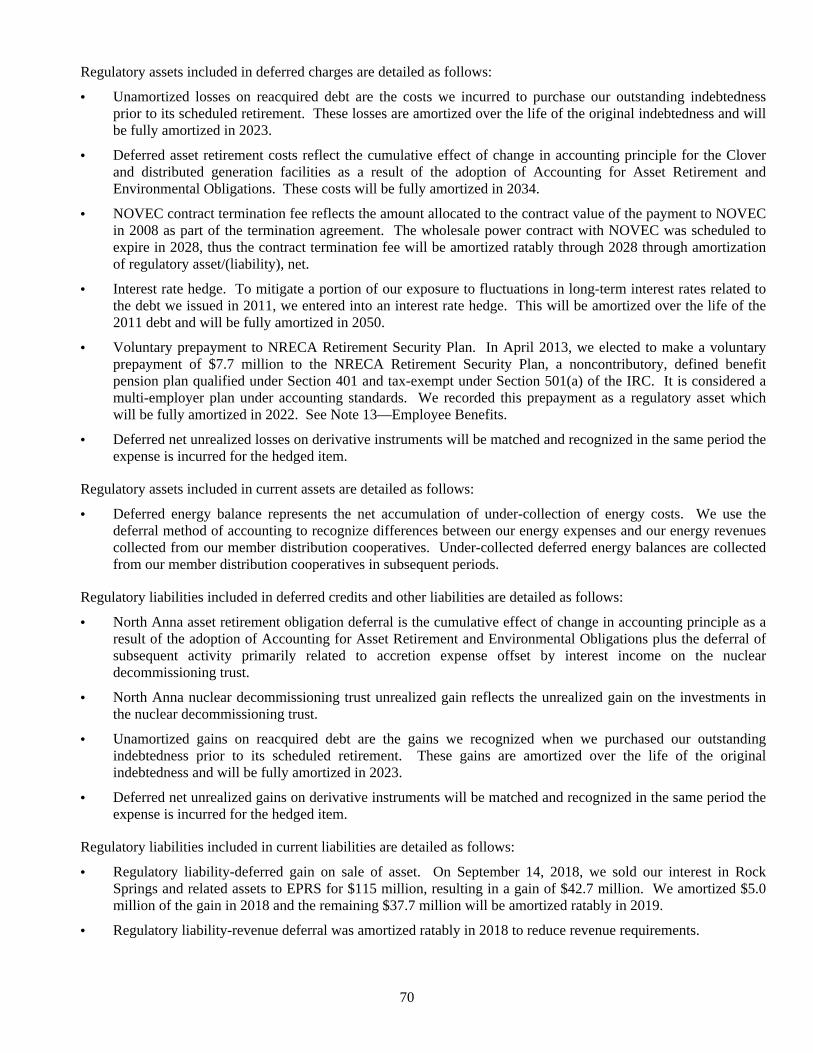
70
Regulatory assets included in deferred charges are detailed as follows:
• Unamortized losses on reacquired debt are the costs we incurred to purchase our outstanding indebtedness prior to its scheduled retirement. These losses are amortized over the life of the original indebtedness and will be fully amortized in 2023.
• Deferred asset retirement costs reflect the cumulative effect of change in accounting principle for the Clover and distributed generation facilities as a result of the adoption of Accounting for Asset Retirement and Environmental Obligations. These costs will be fully amortized in 2034.
• NOVEC contract termination fee reflects the amount allocated to the contract value of the payment to NOVEC in 2008 as part of the termination agreement. The wholesale power contract with NOVEC was scheduled to expire in 2028, thus the contract termination fee will be amortized ratably through 2028 through amortization of regulatory asset/(liability), net.
• Interest rate hedge. To mitigate a portion of our exposure to fluctuations in long-term interest rates related to the debt we issued in 2011, we entered into an interest rate hedge. This will be amortized over the life of the 2011 debt and will be fully amortized in 2050.
• Voluntary prepayment to NRECA Retirement Security Plan. In April 2013, we elected to make a voluntary prepayment of $7.7 million to the NRECA Retirement Security Plan, a noncontributory, defined benefit pension plan qualified under Section 401 and tax-exempt under Section 501(a) of the IRC. It is considered a multi-employer plan under accounting standards. We recorded this prepayment as a regulatory asset which will be fully amortized in 2022. See Note 13—Employee Benefits.
• Deferred net unrealized losses on derivative instruments will be matched and recognized in the same period the expense is incurred for the hedged item.
Regulatory assets included in current assets are detailed as follows:
• Deferred energy balance represents the net accumulation of under-collection of energy costs. We use the deferral method of accounting to recognize differences between our energy expenses and our energy revenues collected from our member distribution cooperatives. Under-collected deferred energy balances are collected from our member distribution cooperatives in subsequent periods.
Regulatory liabilities included in deferred credits and other liabilities are detailed as follows:
• North Anna asset retirement obligation deferral is the cumulative effect of change in accounting principle as a result of the adoption of Accounting for Asset Retirement and Environmental Obligations plus the deferral of subsequent activity primarily related to accretion expense offset by interest income on the nuclear decommissioning trust.
• North Anna nuclear decommissioning trust unrealized gain reflects the unrealized gain on the investments in the nuclear decommissioning trust.
• Unamortized gains on reacquired debt are the gains we recognized when we purchased our outstanding indebtedness prior to its scheduled retirement. These gains are amortized over the life of the original indebtedness and will be fully amortized in 2023.
• Deferred net unrealized gains on derivative instruments will be matched and recognized in the same period the expense is incurred for the hedged item.
Regulatory liabilities included in current liabilities are detailed as follows:
• Regulatory liability-deferred gain on sale of asset. On September 14, 2018, we sold our interest in Rock Springs and related assets to EPRS for $115 million, resulting in a gain of $42.7 million. We amortized $5.0 million of the gain in 2018 and the remaining $37.7 million will be amortized ratably in 2019.
• Regulatory liability-revenue deferral was amortized ratably in 2018 to reduce revenue requirements.
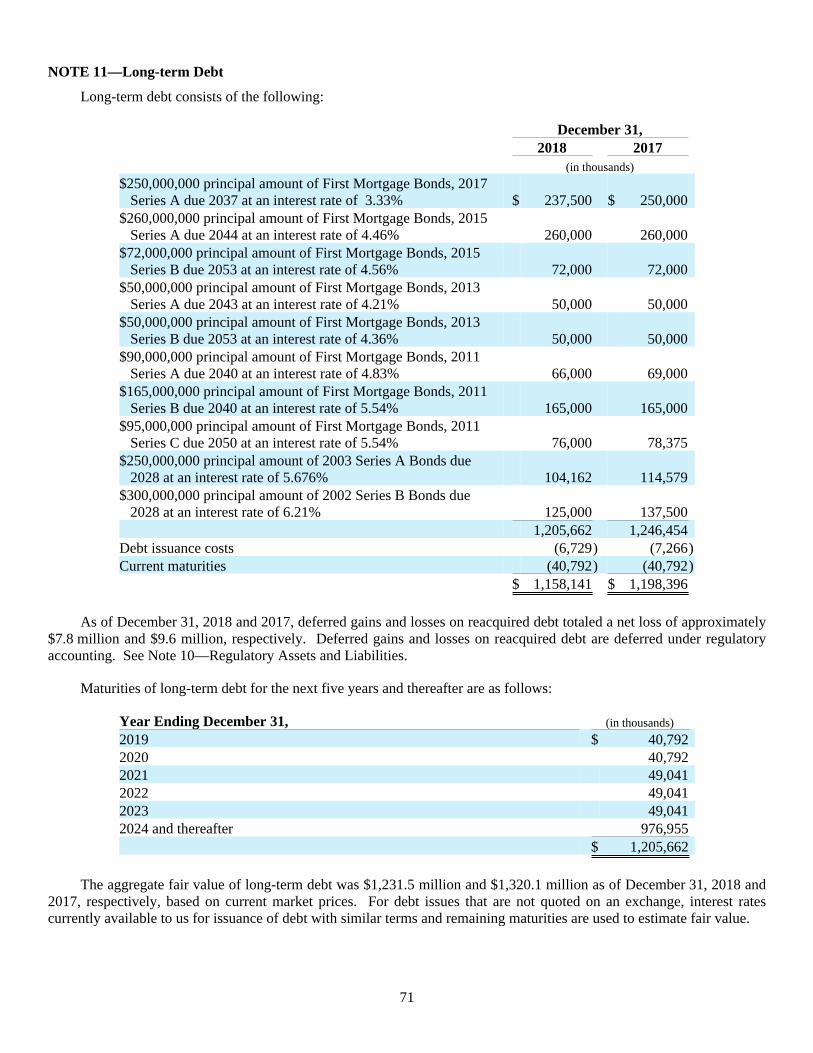
71
NOTE 11—Long-term Debt
Long-term debt consists of the following:
December 31, 2018 2017 (in thousands)
$250,000,000 principal amount of First Mortgage Bonds, 2017 Series A due 2037 at an interest rate of 3.33% $ 237,500 $ 250,000 $260,000,000 principal amount of First Mortgage Bonds, 2015 Series A due 2044 at an interest rate of 4.46% 260,000 260,000 $72,000,000 principal amount of First Mortgage Bonds, 2015 Series B due 2053 at an interest rate of 4.56% 72,000 72,000 $50,000,000 principal amount of First Mortgage Bonds, 2013 Series A due 2043 at an interest rate of 4.21% 50,000 50,000 $50,000,000 principal amount of First Mortgage Bonds, 2013 Series B due 2053 at an interest rate of 4.36% 50,000 50,000 $90,000,000 principal amount of First Mortgage Bonds, 2011 Series A due 2040 at an interest rate of 4.83% 66,000 69,000 $165,000,000 principal amount of First Mortgage Bonds, 2011 Series B due 2040 at an interest rate of 5.54% 165,000 165,000 $95,000,000 principal amount of First Mortgage Bonds, 2011 Series C due 2050 at an interest rate of 5.54% 76,000 78,375 $250,000,000 principal amount of 2003 Series A Bonds due 2028 at an interest rate of 5.676% 104,162 114,579 $300,000,000 principal amount of 2002 Series B Bonds due 2028 at an interest rate of 6.21% 125,000 137,500 1,205,662 1,246,454 Debt issuance costs (6,729) (7,266)Current maturities (40,792) (40,792) $ 1,158,141 $ 1,198,396
As of December 31, 2018 and 2017, deferred gains and losses on reacquired debt totaled a net loss of approximately $7.8 million and $9.6 million, respectively. Deferred gains and losses on reacquired debt are deferred under regulatory accounting. See Note 10—Regulatory Assets and Liabilities.
Maturities of long-term debt for the next five years and thereafter are as follows:
Year Ending December 31, (in thousands) 2019 $ 40,792 2020 40,792 2021 49,041 2022 49,041 2023 49,041 2024 and thereafter 976,955 $ 1,205,662
The aggregate fair value of long-term debt was $1,231.5 million and $1,320.1 million as of December 31, 2018 and 2017, respectively, based on current market prices. For debt issues that are not quoted on an exchange, interest rates currently available to us for issuance of debt with similar terms and remaining maturities are used to estimate fair value.
72
All of our long-term debt is secured under our Indenture. Substantially all of our real property and tangible personal property and some of our intangible personal property are pledged as collateral under the Indenture. Under the Indenture, we may not make any distribution, including a dividend or payment or retirement of patronage capital, to our members if an event of default exists under the Indenture. Otherwise, we may make a distribution to our members if (1) after the distribution, our patronage capital as of the end of the most recent fiscal quarter would be equal to or greater than 20% of our total long-term debt and patronage capital, or (2) all of our distributions for the year in which the distribution is to be made do not exceed 5% of the patronage capital as of the end of the most recent fiscal year. For this purpose, patronage capital and total long-term debt do not include any earnings retained in any of our subsidiaries or affiliates or the debt of any of our subsidiaries or affiliates.
Additionally, we maintain a revolving credit facility. See Note 12—Liquidity Resources.
NOTE 12—Liquidity Resources
We maintain a revolving credit facility to cover our short-term and medium-term funding needs that are not met by cash from operations or other available funds. Commitments under this syndicated credit agreement extend until March 1, 2024. Available funding under this facility totals $500 million through March 3, 2022, and $400 million from March 4, 2022 through March 1, 2024. We did not have any borrowings outstanding under this facility as of December 31, 2018; however, the interest rate on borrowings would have been 3.5%. As of December 31, 2018, we had a $2.5 million letter of credit outstanding under this facility. As of December 31, 2017, we had outstanding under this facility, $43.4 million in borrowings at a weighted average interest rate of 2.6% and $12.0 million in letters of credit.
Borrowings under the credit agreement that are based on Eurodollar rates bear interest at LIBOR plus a margin ranging from 0.90% to 1.5%, depending on our credit ratings. Borrowings not based on Eurodollar rates, including swingline borrowings, bear interest at the highest of (1) the federal funds effective rate plus 0.5%, (2) the prime commercial lending rate of the administrative agent, and (3) the daily LIBOR for a one-month interest period plus 1.0% , plus in each case a margin ranging from 0.0% to 0.5%. Additionally, we are also responsible for customary unused commitment fees, an administrative agent fee and letter of credit fees.
The credit agreement contains customary conditions to borrowing or the issuance of letters of credit, representations and warranties, and covenants. The credit agreement obligates us to maintain a debt to capitalization ratio of no more than 0.85 to 1.00 and to maintain a margins for interest ratio of no less than 1.10 times interest charges (calculated in accordance with our Indenture). Obligations under the credit agreement may be accelerated following, among other things:
• our failure to timely pay any principal and interest due under the credit facility;
• a breach by us of our representations and warranties in the credit agreement or related documents;
• a breach of a covenant contained in the credit agreement, which, in some cases we are given an opportunity to cure and, in certain cases, includes a debt to capitalization financial covenant;
• failure to pay, when due, other indebtedness above a specified amount;
• an unsatisfied judgment above specified amounts;
• bankruptcy or insolvency events relating to us;
• invalidity of the credit agreement and related loan documentation or our assertion of invalidity; and
• a failure by our member distribution cooperatives to pay amounts in excess of an agreed threshold owing to us beyond a specified cure period.
We are in compliance with the credit agreement.
We maintain a program which allows our member distribution cooperatives to prepay or extend payment on their monthly power bills. Under this program, we pay interest on prepayment balances at a blended investment and short-term
73
borrowing rate, and we charge interest on extended payment balances at a blended prepayment and short-term borrowing rate. Amounts prepaid by our member distribution cooperatives are included in accounts payable–members and as of December 31, 2018 and 2017, were $42.1 million and $10.8 million, respectively. Amounts extended to our member distribution cooperatives are included in accounts receivable–members and as of December 31, 2018 and 2017, were $6.4 million and $7.2 million, respectively.
NOTE 13—Employee Benefits
Substantially all of our employees participate in the NRECA Retirement Security Plan, a noncontributory, defined benefit pension plan qualified under Section 401 and tax-exempt under Section 501(a) of the IRC. It is considered a multi-employer plan under accounting standards. The legal name of the plan is the NRECA Retirement Security Plan; the employer identification number is 53–0116145, and the plan number is 333. Plan information is available publicly through the annual Form 5500, including attachments. The plan year is January 1 through December 31. In total, the NRECA Retirement Security Plan was over 80% funded on January 1, 2018 and 2017, based on the PPA funding target and PPA actuarial value of assets on those dates. The cost of the plan is funded annually by payments to NRECA to ensure that annuities in amounts established by the plan will be available to individual participants upon their retirement. We also participate in the Deferred Compensation Pension Restoration Plan, which is intended to provide a supplemental benefit for employees who would have a reduction in their pension benefit from the Retirement Security Plan because of the IRC limitations. Our required contribution to the NRECA Retirement Security Plan and the Deferred Compensation Pension Restoration Plan totaled $3.4 million, $3.2 million, and $2.7 million in 2018, 2017, and 2016, respectively. In each of these years, our contributions represented less than 5% of the total contributions made to the plan by all participating employers. In 2013, we elected to make a voluntary prepayment of $7.7 million to the NRECA Retirement Security Plan and recorded this payment as a regulatory asset which will be fully amortized in 2022. There has been no funding improvement plan or rehabilitation plan implemented nor is one pending, and we did not pay a surcharge to the plan for 2018. Pension expense, inclusive of administrative fees, was $4.2 million, $4.1 million, and $3.6 million for 2018, 2017, and 2016, respectively. Pension expense for 2018, 2017, and 2016 includes $0.8 million related to the amortization of the voluntary prepayment regulatory asset.
We have a defined contribution 401(k) retirement plan and we match up to the first 2% of each participant’s base salary. Our matching contributions were $290,000, $289,000, and $240,000 in 2018, 2017, and 2016, respectively.
NOTE 14—Supplemental Cash Flows Information
Cash paid for interest, net of amounts capitalized, in 2018, 2017, and 2016, was $52.9 million, $23.8 million, and $26.4 million, respectively. Cash paid for income taxes was immaterial in 2018, 2017, and 2016. Accrued capital expenditures in 2018, 2017, and 2016 were $46.9 million, $23.1 million, and $66.9 million, respectively.
NOTE 15—Commitments and Contingencies
Environmental
We are subject to federal, state, and local laws and regulations and permits designed to both protect human health and the environment and to regulate the emission, discharge, or release of pollutants into the environment. We believe we are in material compliance with all current requirements of such environmental laws and regulations and permits. However, as with all electric utilities, the operation of our generating units could be affected by future changes in environmental laws and regulations, including new requirements. Capital expenditures and increased operating costs required to comply with any future regulations could be significant.
Insurance
The Price-Anderson Amendments Act of 1988 provides the public up to $14.1 billion of liability protection per nuclear incident, via obligations required of owners of nuclear power plants, and is subject to change every five years for inflation and for the number of licensed reactors. Owners of nuclear facilities could be assessed up to $138 million for each of their licensed reactors not to exceed $21 million per year per reactor. There is no limit to the number of incidents
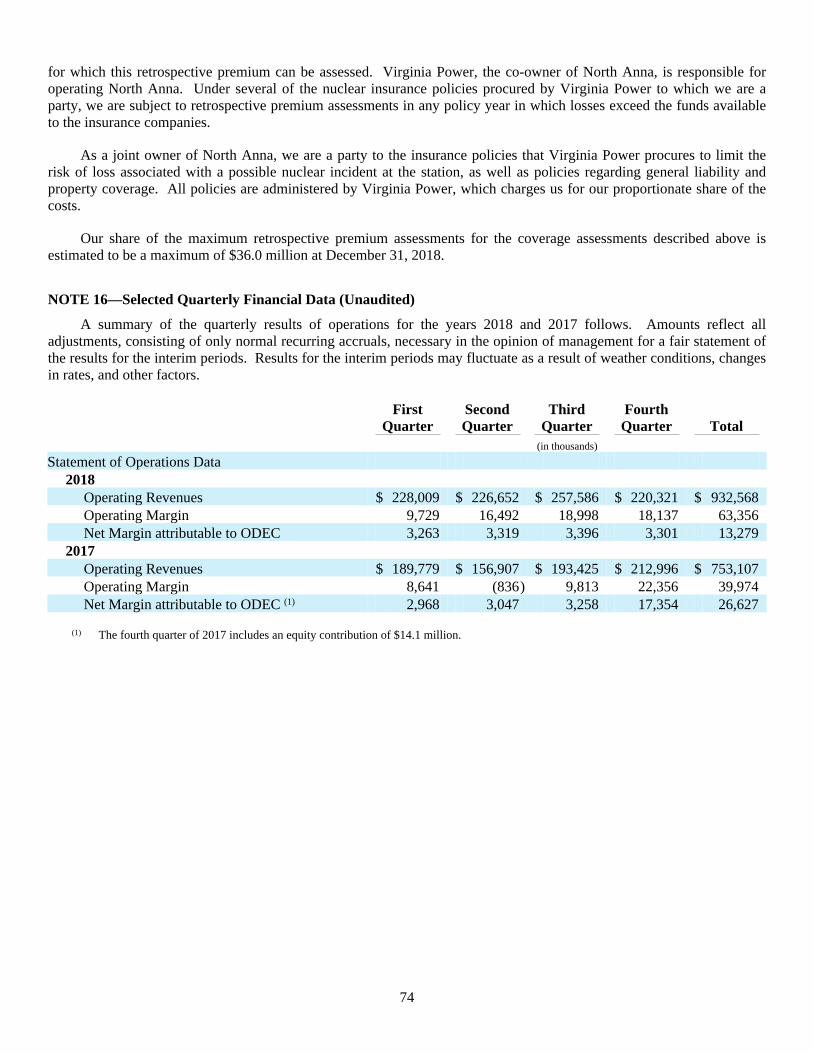
74
for which this retrospective premium can be assessed. Virginia Power, the co-owner of North Anna, is responsible for operating North Anna. Under several of the nuclear insurance policies procured by Virginia Power to which we are a party, we are subject to retrospective premium assessments in any policy year in which losses exceed the funds available to the insurance companies.
As a joint owner of North Anna, we are a party to the insurance policies that Virginia Power procures to limit the risk of loss associated with a possible nuclear incident at the station, as well as policies regarding general liability and property coverage. All policies are administered by Virginia Power, which charges us for our proportionate share of the costs.
Our share of the maximum retrospective premium assessments for the coverage assessments described above is estimated to be a maximum of $36.0 million at December 31, 2018.
NOTE 16—Selected Quarterly Financial Data (Unaudited)
A summary of the quarterly results of operations for the years 2018 and 2017 follows. Amounts reflect all adjustments, consisting of only normal recurring accruals, necessary in the opinion of management for a fair statement of the results for the interim periods. Results for the interim periods may fluctuate as a result of weather conditions, changes in rates, and other factors.
First
Quarter SecondQuarter
ThirdQuarter
FourthQuarter Total
(in thousands) Statement of Operations Data
2018 Operating Revenues $ 228,009 $ 226,652 $ 257,586 $ 220,321 $ 932,568 Operating Margin 9,729 16,492 18,998 18,137 63,356 Net Margin attributable to ODEC 3,263 3,319 3,396 3,301 13,279
2017 Operating Revenues $ 189,779 $ 156,907 $ 193,425 $ 212,996 $ 753,107 Operating Margin 8,641 (836) 9,813 22,356 39,974 Net Margin attributable to ODEC (1) 2,968 3,047 3,258 17,354 26,627
(1) The fourth quarter of 2017 includes an equity contribution of $14.1 million.
75
ITEM 9. CHANGES IN AND DISAGREEMENTS WITH ACCOUNTANTS ON ACCOUNTING AND FINANCIAL DISCLOSURE
None
ITEM 9A. CONTROLS AND PROCEDURES
Evaluation of Effectiveness of Disclosure Controls and Procedures
As of the end of the period covered by this report, our management, including the President and CEO, and the Senior Vice President and CFO, conducted an evaluation of the effectiveness of our disclosure controls and procedures. Based upon that evaluation, the President and CEO, and the Senior Vice President and CFO, concluded that our disclosure controls and procedures are effective in ensuring that all material information required to be filed in this report has been made known to them in a timely manner. We have established a Disclosure Assessment Committee composed of members of our senior and middle management to assist in this evaluation. No significant changes in our internal controls over financial reporting or in other factors that could significantly affect such controls have occurred during the previous fiscal year.
Management’s Annual Report on Internal Control over Financial Reporting
Our management has assessed our internal control over financial reporting as of December 31, 2018, based on criteria for effective internal control over financial reporting described in “2013 Internal Control – Integrated Framework” issued by the Committee of Sponsoring Organizations of the Treadway Commission. Based on this assessment, management believes that as of December 31, 2018, our system of internal control over financial reporting was properly designed and operating effectively based upon the specified criteria. We have not identified any material weaknesses in our internal control over financial reporting.
Our management is responsible for establishing and maintaining adequate internal control over financial reporting. Our internal control over financial reporting is composed of policies, procedures, and reports designed to provide reasonable assurance to our management and board of directors that the financial reporting and the preparation of the financial statements for external reporting purposes has been handled in accordance with accounting principles generally accepted in the United States. Internal control over financial reporting includes those policies and procedures that (1) govern records to accurately and fairly reflect the transactions and dispositions of assets; (2) provide reasonable assurance that transactions are recorded as necessary to permit preparation of financial statements in accordance with generally accepted accounting principles and that our receipts and expenditures are being made only in accordance with authorizations of our management and directors; and (3) provide reasonable safeguards against or timely detection of material unauthorized acquisition, use, or disposition of our assets.
Changes in Internal Control over Financial Reporting
No material changes in our internal controls over financial reporting or in other factors that could significantly affect such controls have occurred during the past fiscal year.
Inherent Limitations on Internal Control
Inherent limitations exist with respect to the effectiveness of any system of internal control over financial reporting. No control system can provide absolute assurance that all control issues and instances of error or fraud, if any, have been detected. Even the best designed system can only provide reasonable assurance that the objectives of the control system have been met. Because of these inherent limitations, our internal control over financial reporting may not prevent or detect all misstatements. Additionally, projections as to the effectiveness of internal control in future periods are subject to the risk that internal control may not continue to operate at its current effectiveness levels due to changes in personnel or in our operating environment.
76
ITEM 9B. OTHER INFORMATION
In March 2019, the following actions occurred which will result in changes in the composition of our board of directors:
• Mr. Michael I. Wheatley, President and CEO of Choptank Electric Cooperative, Inc., notified our board of directors on March 4, 2019 that, effective March 31, 2019, he will resign from our board of directors in connection with his retirement from Choptank Electric Cooperative, Inc.
• Mr. Micheal E. Malandro, President and CEO of Prince George Electric Cooperative, was named President and CEO of Choptank Electric Cooperative, Inc., effective April 1, 2019. On March 4, 2019, Mr. Malandro notified our board of directors that, effective March 31, 2019, he will resign from our board of directors as a representative of Prince George Electric Cooperative. On March 5, 2019, Mr. Malandro was elected as a representative of Choptank Electric Cooperative, Inc. to our board of directors, effective April 1, 2019.
• Mr. Carey J. Logan, Jr. was named President and CEO of Prince George Electric Cooperative, effective April 1, 2019. On March 5, 2019, Mr. Logan was elected as a representative of Prince George Electric Cooperative to our board of directors, effective April 1, 2019. Mr. Logan served as Vice President of Engineering at Prince George Electric Cooperative from July 2015 to March 2019, and as Senior Engineer at South Carolina Electric and Gas Company from June 2006 to July 2015.
77
PART III
ITEM 10. DIRECTORS, EXECUTIVE OFFICERS AND CORPORATE GOVERNANCE
Directors
We are governed by a board of 23 directors, consisting of two representatives from each of our member distribution cooperatives and one representative from TEC. Pursuant to our bylaws, each of our eleven member distribution cooperatives, in good standing, may recommend candidates that meet director qualifications to the nominating committee of our board of directors. At the annual meeting of the members, the nominating committee nominates candidates for election to our board of directors. At least one candidate from each member distribution cooperative must be a director of that member distribution cooperative. Currently and historically, the other candidate from each member distribution cooperative is the chief executive officer of that member distribution cooperative. The candidates for director are elected to our board of directors by a majority vote of the voting delegates from our members. Each member has one voting delegate. We do not control who the member distribution cooperative recommends to the nominating committee. As a result, our board of directors has not developed criteria for the composition of our board, such as diversity, for use in identifying nominees to our board of directors. One director currently serves as a director on behalf of a member distribution cooperative and TEC. Each elected candidate is authorized to represent that member for a renewable term of one year. Our board of directors sets policy and provides direction to our President and CEO. Our board of directors meets approximately 11 times each year.
Information concerning those serving on our board of directors as of December 31, 2018, including principal occupation and employment during the past five years, qualifications, and directorships in public corporations, if any, is listed below.
J. William Andrew, Jr. (65). President and CEO of Delaware Electric Cooperative, Inc. since 2005. Mr. Andrew has held executive positions in the utility industry for over two decades and has been a director of ODEC since 2005.
Paul H. Brown (73). Retired, formerly Vice President of Commercial Lending of Bank of Southside Virginia where he served from 1995 to 2012. Mr. Brown has been a director of ODEC since 2013 and a director of Prince George Electric Cooperative since 2007.
John J. Burke, Jr. (62). Associate broker of Gunther McClary Real Estate since 2004. Mr. Burke has been a director of ODEC since 2016 and a director of Choptank Electric Cooperative, Inc. since 2010.
Darlene H. Carpenter (72). Realtor with Century 21 New Millennium since 2013. Ms. Carpenter was a Realtor with Montague, Miller & Company Realtors, Inc. from 2006 to 2013. Ms. Carpenter has been a director of ODEC since 2009 and a director of Rappahannock Electric Cooperative since 1984.
Earl C. Currin, Jr. (75). Retired, formerly Provost at Southside Community College where he served from 1970 to 2007. Dr. Currin taught both accounting and economics at the college level. Dr. Currin has been a director of ODEC since 2008 and a director of Southside Electric Cooperative since 1986.
E. Garrison Drummond (67). Insurance agent of Drummond Insurance Agency, Inc. since 1984. Mr. Drummond has been a director of ODEC since 2012 and a director of A&N Electric Cooperative since 2002.
Jeffrey S. Edwards (55). President and CEO of Southside Electric Cooperative since 2007. Mr. Edwards has held executive positions in the utility industry for over two decades and has been a director of ODEC since 2007.
Kent D. Farmer (61). President and CEO of Rappahannock Electric Cooperative since 2004. Mr. Farmer has held executive positions in the utility industry for over two decades and has been a director of ODEC since 2004.
Chad N. Fowler (40). Operations manager of Roger Fowler Sales and Service since 2000. Mr. Fowler has been a director of ODEC since 2016 and a director of Community Electric Cooperative since 2007.
78
Fred C. Garber (74). Retired, formerly President of Mt. Jackson Farm Service from 1973 to 2003. Mr. Garber has been a director of ODEC since 2005 and a director of Shenandoah Valley Electric Cooperative since 1984.
Hunter R. Greenlaw, Jr. (73). President of G.L.M.G. General Contractors, a real estate development and general contracting company since 1974. Mr. Greenlaw has been a director of ODEC since 1991 and a director of Northern Neck Electric Cooperative since 1979.
Steven A. Harmon (57). President and CEO of Community Electric Cooperative since 2013. Mr. Harmon was President and CEO of H-2 Business Solutions, LLC, from 2012 to 2013. Mr. Harmon has held executive positions in the utility industry for over a decade and has been a director of ODEC since 2013.
Michael W. Hastings (58). President and CEO of Shenandoah Valley Electric Cooperative since 2016. Mr. Hastings was President and CEO of Jo-Carroll Energy, Inc. from 2005 to 2016. Mr. Hastings has been a director of ODEC since 2016.
Bruce A. Henry (73). Owner and Secretary/Treasurer of Delmarva Builders, Inc. since 1981. Mr. Henry has been a director of ODEC since 1993 and a director of Delaware Electric Cooperative, Inc. since 1978.
David J. Jones (70). Owner/operator of Big Fork Farms since 1970 and Vice President of Exchange Warehouse, Inc. from 1996 to 2006. Mr. Jones has been a director of ODEC since 1986 and a director of Mecklenburg Electric Cooperative since 1982.
Michael J. Keyser (42). CEO and General Manager of BARC Electric Cooperative since 2010. Mr. Keyser has held executive positions in the utility industry for over a decade and has been a director of ODEC since 2010.
John C. Lee, Jr. (58). President and CEO of Mecklenburg Electric Cooperative since 2008. Mr. Lee has held executive positions in the utility industry for over a decade and has been a director of ODEC since 2008.
Micheal E. Malandro (42). President and CEO of Prince George Electric Cooperative since 2015. Mr. Malandro was Vice President of Engineering of Prince George Electric Cooperative from 2004 to 2015. Mr. Malandro has been a director of ODEC since 2015.
Keith L. Swisher (64). Owner/operator of Swisher Valley Farms, LLC since 1976. Mr. Swisher has been a director of ODEC since 2008 and a director of BARC Electric Cooperative since 1981.
Michael I. Wheatley (63). President and CEO of Choptank Electric Cooperative, Inc. since 2011. Mr. Wheatley has held executive positions in the utility industry for over two decades and has been a director of ODEC since 2011.
Gregory W. White (66). President and CEO of Northern Neck Electric Cooperative since 2005. Mr. White has held executive positions in the utility industry for over two decades and has been a director of ODEC since 2005.
Belvin Williamson, Jr. (55). President and CEO of A&N Electric Cooperative since 2016. Mr. Williamson was Director–Energy Services/Key Accounts for Rappahannock Electric Cooperative from 1998 to 2016. Mr. Williamson has been a director of ODEC since 2016.
Audit Committee Financial Expert
We do not have an audit committee financial expert because of our cooperative governance structure and the resulting experience all of our directors have with matters affecting electric cooperatives in their roles as a chief executive officer or director of one of our member distribution cooperatives. In addition, the audit committee employs the services of accounting and financial consultants as it deems necessary.
79
Executive Officers
Our President and CEO administers our day-to-day business and affairs. Our executive officers as of December 31, 2018, their respective ages, positions, and relevant business experience are listed below.
Marcus M. Harris (46). President and CEO of ODEC since April 2018. Mr. Harris served as Executive Vice President and Chief Executive Officer at Kansas Electric Power Cooperative from December 2014 to March 2018. He served as General Manager, Renewable Energy at South Carolina Electric & Gas Company from September 2013 to December 2014, and Director, Wholesale Power Marketing from September 2008 to September 2013.
Bryan S. Rogers (50). Senior Vice President and CFO since July 2018. Mr. Rogers joined ODEC in 1996 and has held various accounting positions, including Vice President and Controller from April 2007 to June 2018.
D. Richard Beam (61). Senior Vice President of Power Supply since November 2013. Mr. Beam joined ODEC in 1987 and has held various power supply positions, including Vice President of Power Supply and Transmission Planning from July 2004 to March 2013 and Vice President of Power Supply from April 2013 to November 2013. Effective January 1, 2019, Mr. Beam began serving as Senior Vice President and COO.
On February 25, 2019, Mr. Kirk D. Johnson joined ODEC as Senior Vice President of Member Engagement.
Kirk D. Johnson (49). Senior Vice President of Member Engagement beginning February 2019. Mr. Johnson held various positions with NRECA, including Senior Vice President of Government Relations from March 2011 to January 2019.
Code of Ethics
We have a code of ethics which applies to all of our employees, including our President and CEO, Senior Vice President and CFO, and Vice President and Controller. A copy of our code of ethics is available without charge by sending a written request to ODEC, Attention: Ms. Allyson B. Pittman, Vice President and Controller, 4201 Dominion Boulevard, Glen Allen, VA 23060.
80
ITEM 11. EXECUTIVE COMPENSATION
COMPENSATION DISCUSSION AND ANALYSIS
General Philosophy
Our compensation philosophy has four objectives:
• attract and retain a qualified, diverse workforce through a competitive compensation program;
• provide equitable and fair compensation;
• support our business strategy; and
• ensure compliance with applicable laws and regulations.
Total Compensation Package
We compensate our President and CEO and other executive officers through the use of a total compensation package which includes base salary, competitive benefits, and the potential of a bonus. Our President and CEO’s base salary is derived from salary data provided by third parties through national compensation surveys. The national compensation survey data includes data from the labor market for positions with similar responsibilities.
Targeted Overall Compensation
Our compensation program utilizes detailed job descriptions for all of our employees including executive officers, with the exception of the President and CEO, as an instrument to establish benchmarked positions. The market compensation information for each position is derived from salary data provided by third parties through national compensation surveys and includes salary data for positions within the determined competitive labor market. Our job descriptions are reviewed annually and include job responsibilities, required knowledge, skills and abilities, and formal education and experience necessary to accomplish the requirements of the position which in turn helps us achieve operational goals. Utilizing this information, our human resources department determines a market-based salary for each position. A third-party consultant, Burton-Fuller Management, reviews the market-based salary data we compiled for reasonableness annually. We have defined market-based salary as approximately the 50th percentile of the market. Another third-party consultant, Intandem LLC, has been engaged to create a performance appraisal instrument for the President and CEO position as well as to design, distribute, and compile market valuation models and reports for the executive officers.
Process
We have a committee of our board of directors, the executive committee, which recommends all compensation for our President and CEO to the entire board of directors. The entire board of directors then approves the compensation arrangements for the President and CEO. Our board of directors has delegated to our President and CEO the authority to establish and adjust compensation for all employees other than himself. The compensation for all other employees, including executive officers other than the President and CEO, is approved by our President and CEO based upon market-based salary data. On an annual basis our board of directors reviews the performance and compensation of our President and CEO, and our President and CEO reviews the performance and compensation of the remaining executive officers.
Base Salaries
We are an electric cooperative and do not have any stock and as a result, we do not have equity-based compensation programs. For this reason, substantially all of our compensation to our executive officers is provided in the form of base salary. We want to provide our executive officers with a level of assured cash compensation in the form of base salary that is commensurate with the duties and responsibilities of their positions. These salaries are determined based on market data for positions with similar responsibilities.
81
Bonuses
Our practice has been to, on infrequent occasions, award cash bonuses related to a specific event, such as the consummation of a significant transaction. At the discretion of our board of directors, a bonus may be awarded to our President and CEO. At the discretion of our President and CEO, bonuses may be awarded to the other executive officers.
Other Benefits
We believe that companies should provide reasonable severance benefits to the President and CEO. In certain circumstances, we may provide severance benefits to other executive officers. On July 24, 2017, Mr. Reasor announced his retirement as President and CEO of ODEC effective January 15, 2018. In connection with Mr. Reasor’s retirement, ODEC amended Mr. Reasor’s employment agreement to provide for certain retirement benefits. See “Employment Agreement” below. Other than our President and CEO, none of our other executive officers have any contractual severance or termination benefits other than what is provided for under the retirement plans in which they participate.
Plans
Retirement Plans
We participate in the NRECA Retirement Security Plan, a noncontributory, defined benefit pension plan qualified under Section 401 and tax-exempt under Section 501(a) of the IRC. This plan is available to all employees, with limited exceptions, who work at least 1,000 hours per year. It is considered a multi-employer plan under accounting standards. Benefits, which accrue under the plan, are based upon the employee’s base annual salary as of November of the previous year.
We also have a 401(k) plan which is available to all employees in regular positions. Under the 401(k) plan for 2018, employees could elect to have up to 100% or $18,500, whichever is less, of their salary withheld on a pre-tax basis, subject to Internal Revenue Service limitations, and invested on their behalf. We match up to the first 2% of each participant’s base salary. Also, a catch-up contribution is available for participants in the plan once they attain age 50. The maximum catch-up contribution for 2018 was $6,000.
In addition, we have a non-qualified executive deferred compensation plan (the “Deferred Compensation Plan”). Our board of directors, at its discretion, determines who may participate in the plan as well as an annual contribution, if any, up to the maximum amount allowed by IRC regulations. Currently, our board of directors has determined that our President and CEO is the only participant in this plan. We made a $13,104 contribution to the plan for the benefit of our President and CEO in 2018.
Pension Restoration Plan
We participate in the Deferred Compensation Pension Restoration Plan, which is intended to provide a supplemental benefit for employees who would have a reduction in their pension benefit from the Retirement Security Plan because of IRC limitations. Our Senior Vice President and COO is the only current participant in this plan.
Perquisites and Other Benefits
Our board of directors reviews the perquisites that our President and CEO receives during contract discussions with our President and CEO. Mr. Harris was entitled to personal use of a company automobile which amounted to $1,523 in 2018.
The executive officers participate in our other benefit plans on the same terms as other employees. These plans include the defined benefit pension plan, the 401(k) plan, medical insurance, life insurance and accidental death and dismemberment, long-term disability, medical reimbursement and dependent care flexible spending accounts, health savings account, health club membership, vacation, holiday, and sick leave. Relocation benefits are reimbursed for all
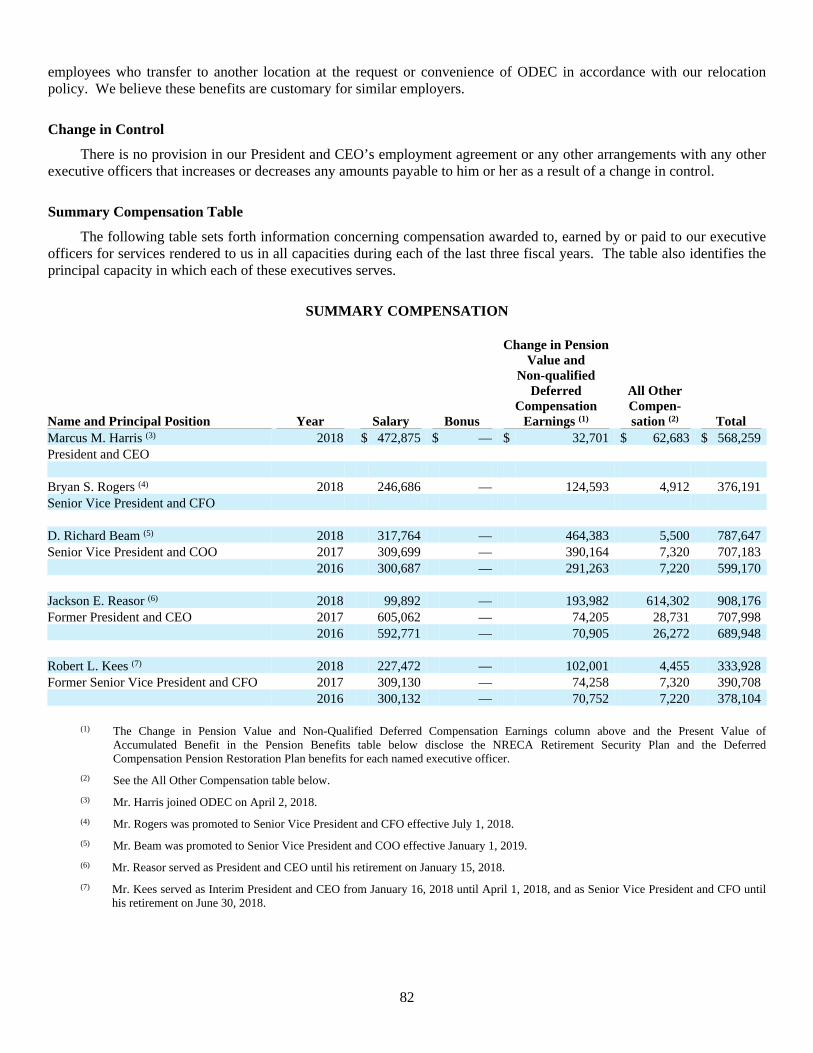
82
employees who transfer to another location at the request or convenience of ODEC in accordance with our relocation policy. We believe these benefits are customary for similar employers.
Change in Control
There is no provision in our President and CEO’s employment agreement or any other arrangements with any other executive officers that increases or decreases any amounts payable to him or her as a result of a change in control.
Summary Compensation Table
The following table sets forth information concerning compensation awarded to, earned by or paid to our executive officers for services rendered to us in all capacities during each of the last three fiscal years. The table also identifies the principal capacity in which each of these executives serves.
SUMMARY COMPENSATION
Name and Principal Position Year Salary Bonus
Change in PensionValue and
Non-qualifiedDeferred
CompensationEarnings (1)
All OtherCompen-sation (2) Total
Marcus M. Harris (3) 2018 $ 472,875 $ — $ 32,701 $ 62,683 $ 568,259 President and CEO Bryan S. Rogers (4) 2018 246,686 — 124,593 4,912 376,191 Senior Vice President and CFO D. Richard Beam (5) 2018 317,764 — 464,383 5,500 787,647 Senior Vice President and COO 2017 309,699 — 390,164 7,320 707,183 2016 300,687 — 291,263 7,220 599,170 Jackson E. Reasor (6) 2018 99,892 — 193,982 614,302 908,176 Former President and CEO 2017 605,062 — 74,205 28,731 707,998 2016 592,771 — 70,905 26,272 689,948 Robert L. Kees (7) 2018 227,472 — 102,001 4,455 333,928 Former Senior Vice President and CFO 2017 309,130 — 74,258 7,320 390,708 2016 300,132 — 70,752 7,220 378,104
(1) The Change in Pension Value and Non-Qualified Deferred Compensation Earnings column above and the Present Value of Accumulated Benefit in the Pension Benefits table below disclose the NRECA Retirement Security Plan and the Deferred Compensation Pension Restoration Plan benefits for each named executive officer.
(2) See the All Other Compensation table below.
(3) Mr. Harris joined ODEC on April 2, 2018.
(4) Mr. Rogers was promoted to Senior Vice President and CFO effective July 1, 2018.
(5) Mr. Beam was promoted to Senior Vice President and COO effective January 1, 2019.
(6) Mr. Reasor served as President and CEO until his retirement on January 15, 2018.
(7) Mr. Kees served as Interim President and CEO from January 16, 2018 until April 1, 2018, and as Senior Vice President and CFO until his retirement on June 30, 2018.
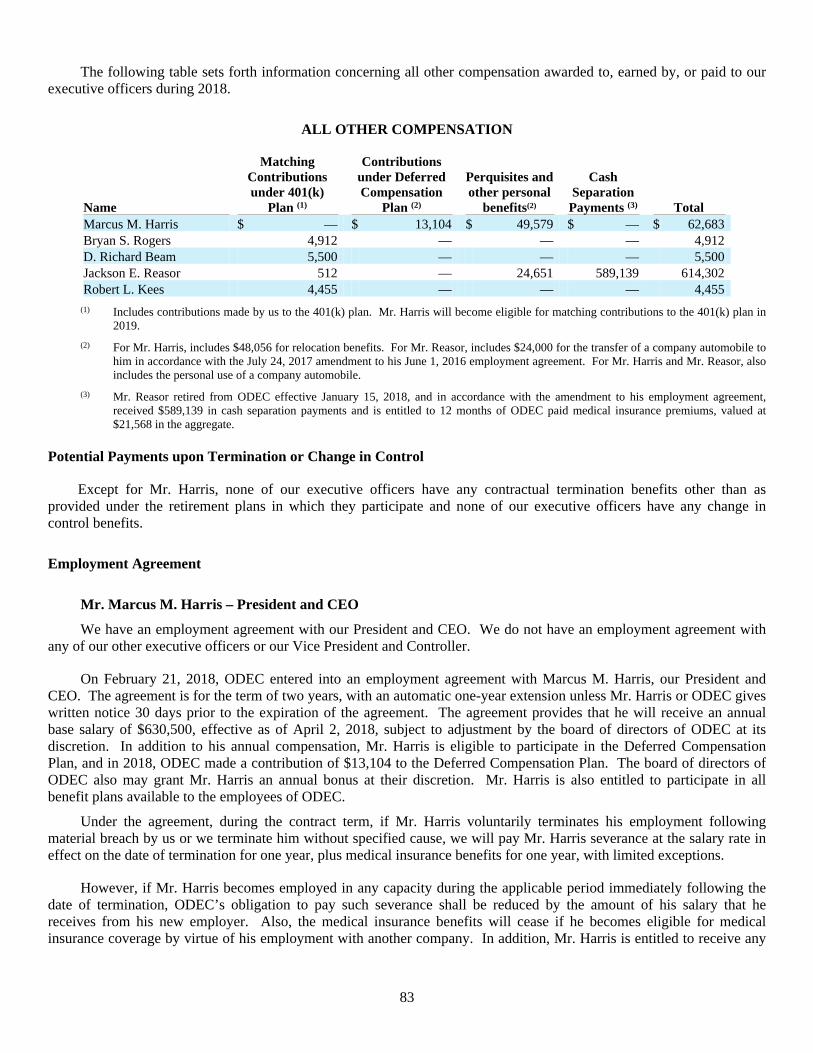
83
The following table sets forth information concerning all other compensation awarded to, earned by, or paid to our executive officers during 2018.
ALL OTHER COMPENSATION
Name
Matching Contributions under 401(k)
Plan (1)
Contributions under Deferred Compensation
Plan (2)
Perquisites and other personal
benefits(2)
Cash Separation
Payments (3) Total Marcus M. Harris $ — $ 13,104 $ 49,579 $ — $ 62,683 Bryan S. Rogers 4,912 — — — 4,912 D. Richard Beam 5,500 — — — 5,500 Jackson E. Reasor 512 — 24,651 589,139 614,302 Robert L. Kees 4,455 — — — 4,455
(1) Includes contributions made by us to the 401(k) plan. Mr. Harris will become eligible for matching contributions to the 401(k) plan in 2019.
(2) For Mr. Harris, includes $48,056 for relocation benefits. For Mr. Reasor, includes $24,000 for the transfer of a company automobile to him in accordance with the July 24, 2017 amendment to his June 1, 2016 employment agreement. For Mr. Harris and Mr. Reasor, also includes the personal use of a company automobile.
(3) Mr. Reasor retired from ODEC effective January 15, 2018, and in accordance with the amendment to his employment agreement, received $589,139 in cash separation payments and is entitled to 12 months of ODEC paid medical insurance premiums, valued at $21,568 in the aggregate.
Potential Payments upon Termination or Change in Control
Except for Mr. Harris, none of our executive officers have any contractual termination benefits other than as provided under the retirement plans in which they participate and none of our executive officers have any change in control benefits.
Employment Agreement
Mr. Marcus M. Harris – President and CEO
We have an employment agreement with our President and CEO. We do not have an employment agreement with any of our other executive officers or our Vice President and Controller.
On February 21, 2018, ODEC entered into an employment agreement with Marcus M. Harris, our President and CEO. The agreement is for the term of two years, with an automatic one-year extension unless Mr. Harris or ODEC gives written notice 30 days prior to the expiration of the agreement. The agreement provides that he will receive an annual base salary of $630,500, effective as of April 2, 2018, subject to adjustment by the board of directors of ODEC at its discretion. In addition to his annual compensation, Mr. Harris is eligible to participate in the Deferred Compensation Plan, and in 2018, ODEC made a contribution of $13,104 to the Deferred Compensation Plan. The board of directors of ODEC also may grant Mr. Harris an annual bonus at their discretion. Mr. Harris is also entitled to participate in all benefit plans available to the employees of ODEC.
Under the agreement, during the contract term, if Mr. Harris voluntarily terminates his employment following material breach by us or we terminate him without specified cause, we will pay Mr. Harris severance at the salary rate in effect on the date of termination for one year, plus medical insurance benefits for one year, with limited exceptions.
However, if Mr. Harris becomes employed in any capacity during the applicable period immediately following the date of termination, ODEC’s obligation to pay such severance shall be reduced by the amount of his salary that he receives from his new employer. Also, the medical insurance benefits will cease if he becomes eligible for medical insurance coverage by virtue of his employment with another company. In addition, Mr. Harris is entitled to receive any
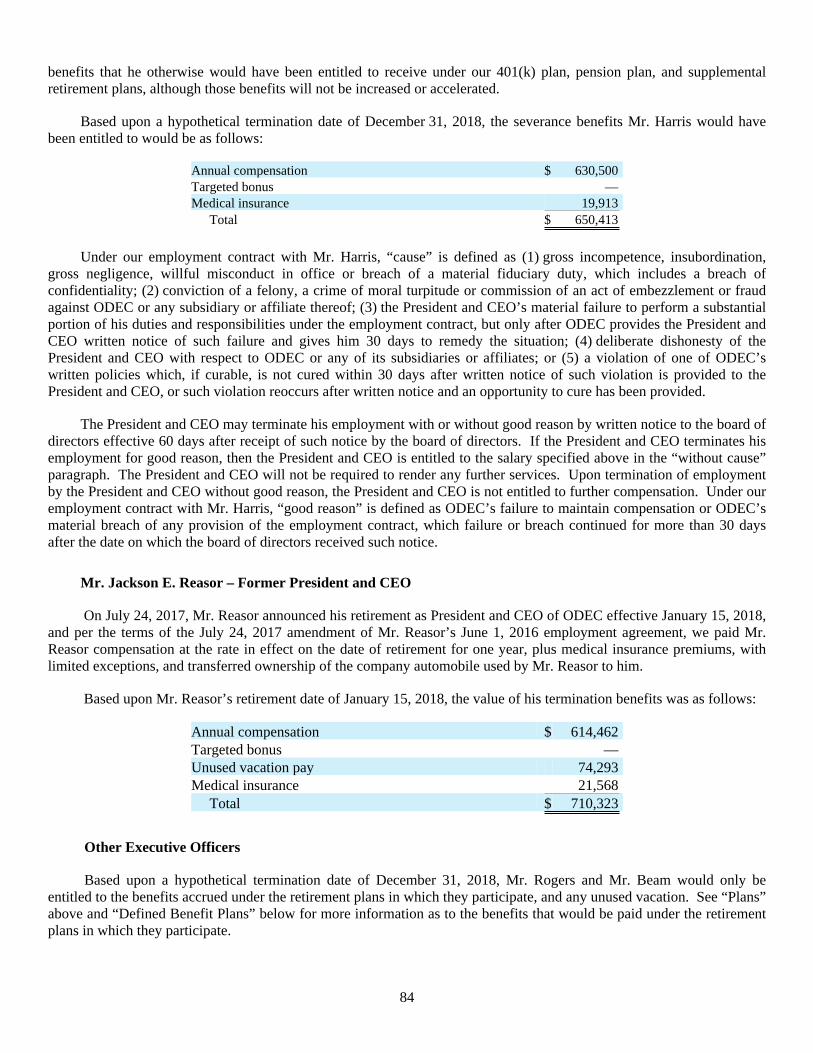
84
benefits that he otherwise would have been entitled to receive under our 401(k) plan, pension plan, and supplemental retirement plans, although those benefits will not be increased or accelerated.
Based upon a hypothetical termination date of December 31, 2018, the severance benefits Mr. Harris would have been entitled to would be as follows:
Annual compensation $ 630,500 Targeted bonus — Medical insurance 19,913
Total $ 650,413
Under our employment contract with Mr. Harris, “cause” is defined as (1) gross incompetence, insubordination, gross negligence, willful misconduct in office or breach of a material fiduciary duty, which includes a breach of confidentiality; (2) conviction of a felony, a crime of moral turpitude or commission of an act of embezzlement or fraud against ODEC or any subsidiary or affiliate thereof; (3) the President and CEO’s material failure to perform a substantial portion of his duties and responsibilities under the employment contract, but only after ODEC provides the President and CEO written notice of such failure and gives him 30 days to remedy the situation; (4) deliberate dishonesty of the President and CEO with respect to ODEC or any of its subsidiaries or affiliates; or (5) a violation of one of ODEC’s written policies which, if curable, is not cured within 30 days after written notice of such violation is provided to the President and CEO, or such violation reoccurs after written notice and an opportunity to cure has been provided.
The President and CEO may terminate his employment with or without good reason by written notice to the board of directors effective 60 days after receipt of such notice by the board of directors. If the President and CEO terminates his employment for good reason, then the President and CEO is entitled to the salary specified above in the “without cause” paragraph. The President and CEO will not be required to render any further services. Upon termination of employment by the President and CEO without good reason, the President and CEO is not entitled to further compensation. Under our employment contract with Mr. Harris, “good reason” is defined as ODEC’s failure to maintain compensation or ODEC’s material breach of any provision of the employment contract, which failure or breach continued for more than 30 days after the date on which the board of directors received such notice.
Mr. Jackson E. Reasor – Former President and CEO
On July 24, 2017, Mr. Reasor announced his retirement as President and CEO of ODEC effective January 15, 2018, and per the terms of the July 24, 2017 amendment of Mr. Reasor’s June 1, 2016 employment agreement, we paid Mr. Reasor compensation at the rate in effect on the date of retirement for one year, plus medical insurance premiums, with limited exceptions, and transferred ownership of the company automobile used by Mr. Reasor to him.
Based upon Mr. Reasor’s retirement date of January 15, 2018, the value of his termination benefits was as follows:
Annual compensation $ 614,462 Targeted bonus — Unused vacation pay 74,293 Medical insurance 21,568
Total $ 710,323
Other Executive Officers
Based upon a hypothetical termination date of December 31, 2018, Mr. Rogers and Mr. Beam would only be entitled to the benefits accrued under the retirement plans in which they participate, and any unused vacation. See “Plans” above and “Defined Benefit Plans” below for more information as to the benefits that would be paid under the retirement plans in which they participate.
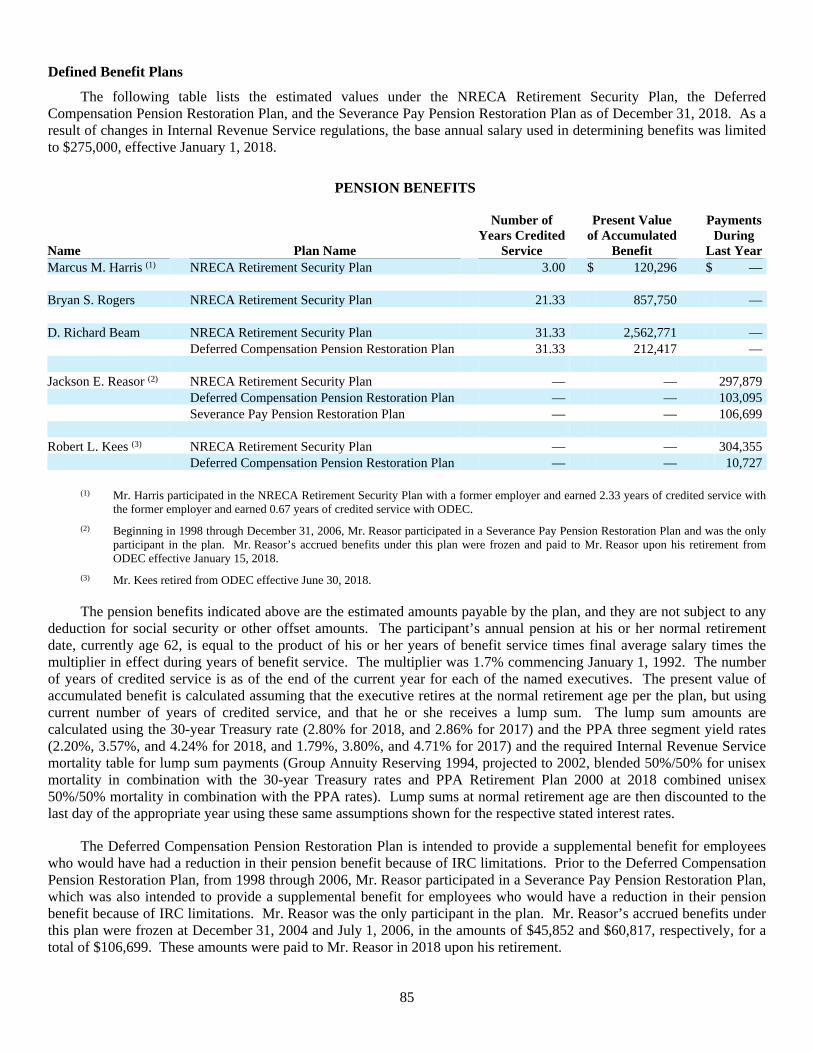
85
Defined Benefit Plans
The following table lists the estimated values under the NRECA Retirement Security Plan, the Deferred Compensation Pension Restoration Plan, and the Severance Pay Pension Restoration Plan as of December 31, 2018. As a result of changes in Internal Revenue Service regulations, the base annual salary used in determining benefits was limited to $275,000, effective January 1, 2018.
PENSION BENEFITS
Name Plan Name
Number ofYears Credited
Service
Present Valueof Accumulated
Benefit
PaymentsDuring
Last Year Marcus M. Harris (1) NRECA Retirement Security Plan 3.00 $ 120,296 $ — Bryan S. Rogers NRECA Retirement Security Plan 21.33 857,750 — D. Richard Beam NRECA Retirement Security Plan 31.33 2,562,771 — Deferred Compensation Pension Restoration Plan 31.33 212,417 — Jackson E. Reasor (2) NRECA Retirement Security Plan — — 297,879 Deferred Compensation Pension Restoration Plan — — 103,095 Severance Pay Pension Restoration Plan — — 106,699 Robert L. Kees (3) NRECA Retirement Security Plan — — 304,355 Deferred Compensation Pension Restoration Plan — — 10,727
(1) Mr. Harris participated in the NRECA Retirement Security Plan with a former employer and earned 2.33 years of credited service with the former employer and earned 0.67 years of credited service with ODEC.
(2) Beginning in 1998 through December 31, 2006, Mr. Reasor participated in a Severance Pay Pension Restoration Plan and was the only participant in the plan. Mr. Reasor’s accrued benefits under this plan were frozen and paid to Mr. Reasor upon his retirement from ODEC effective January 15, 2018.
(3) Mr. Kees retired from ODEC effective June 30, 2018.
The pension benefits indicated above are the estimated amounts payable by the plan, and they are not subject to any deduction for social security or other offset amounts. The participant’s annual pension at his or her normal retirement date, currently age 62, is equal to the product of his or her years of benefit service times final average salary times the multiplier in effect during years of benefit service. The multiplier was 1.7% commencing January 1, 1992. The number of years of credited service is as of the end of the current year for each of the named executives. The present value of accumulated benefit is calculated assuming that the executive retires at the normal retirement age per the plan, but using current number of years of credited service, and that he or she receives a lump sum. The lump sum amounts are calculated using the 30-year Treasury rate (2.80% for 2018, and 2.86% for 2017) and the PPA three segment yield rates (2.20%, 3.57%, and 4.24% for 2018, and 1.79%, 3.80%, and 4.71% for 2017) and the required Internal Revenue Service mortality table for lump sum payments (Group Annuity Reserving 1994, projected to 2002, blended 50%/50% for unisex mortality in combination with the 30-year Treasury rates and PPA Retirement Plan 2000 at 2018 combined unisex 50%/50% mortality in combination with the PPA rates). Lump sums at normal retirement age are then discounted to the last day of the appropriate year using these same assumptions shown for the respective stated interest rates.
The Deferred Compensation Pension Restoration Plan is intended to provide a supplemental benefit for employees who would have had a reduction in their pension benefit because of IRC limitations. Prior to the Deferred Compensation Pension Restoration Plan, from 1998 through 2006, Mr. Reasor participated in a Severance Pay Pension Restoration Plan, which was also intended to provide a supplemental benefit for employees who would have a reduction in their pension benefit because of IRC limitations. Mr. Reasor was the only participant in the plan. Mr. Reasor’s accrued benefits under this plan were frozen at December 31, 2004 and July 1, 2006, in the amounts of $45,852 and $60,817, respectively, for a total of $106,699. These amounts were paid to Mr. Reasor in 2018 upon his retirement.
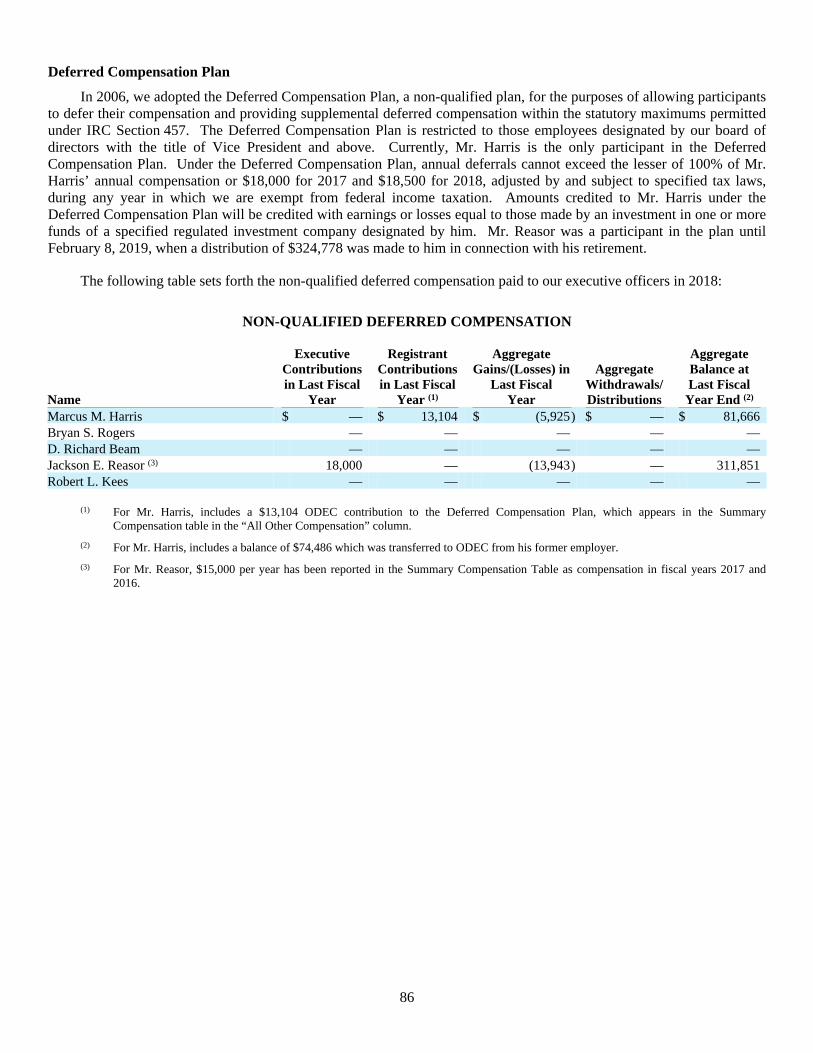
86
Deferred Compensation Plan
In 2006, we adopted the Deferred Compensation Plan, a non-qualified plan, for the purposes of allowing participants to defer their compensation and providing supplemental deferred compensation within the statutory maximums permitted under IRC Section 457. The Deferred Compensation Plan is restricted to those employees designated by our board of directors with the title of Vice President and above. Currently, Mr. Harris is the only participant in the Deferred Compensation Plan. Under the Deferred Compensation Plan, annual deferrals cannot exceed the lesser of 100% of Mr. Harris’ annual compensation or $18,000 for 2017 and $18,500 for 2018, adjusted by and subject to specified tax laws, during any year in which we are exempt from federal income taxation. Amounts credited to Mr. Harris under the Deferred Compensation Plan will be credited with earnings or losses equal to those made by an investment in one or more funds of a specified regulated investment company designated by him. Mr. Reasor was a participant in the plan until February 8, 2019, when a distribution of $324,778 was made to him in connection with his retirement.
The following table sets forth the non-qualified deferred compensation paid to our executive officers in 2018:
NON-QUALIFIED DEFERRED COMPENSATION
Name
ExecutiveContributionsin Last Fiscal
Year
RegistrantContributionsin Last Fiscal
Year (1)
AggregateGains/(Losses) in
Last FiscalYear
AggregateWithdrawals/Distributions
AggregateBalance atLast Fiscal
Year End (2) Marcus M. Harris $ — $ 13,104 $ (5,925) $ — $ 81,666 Bryan S. Rogers — — — — — D. Richard Beam — — — — — Jackson E. Reasor (3) 18,000 — (13,943) — 311,851 Robert L. Kees — — — — —
(1) For Mr. Harris, includes a $13,104 ODEC contribution to the Deferred Compensation Plan, which appears in the Summary Compensation table in the “All Other Compensation” column.
(2) For Mr. Harris, includes a balance of $74,486 which was transferred to ODEC from his former employer.
(3) For Mr. Reasor, $15,000 per year has been reported in the Summary Compensation Table as compensation in fiscal years 2017 and 2016.
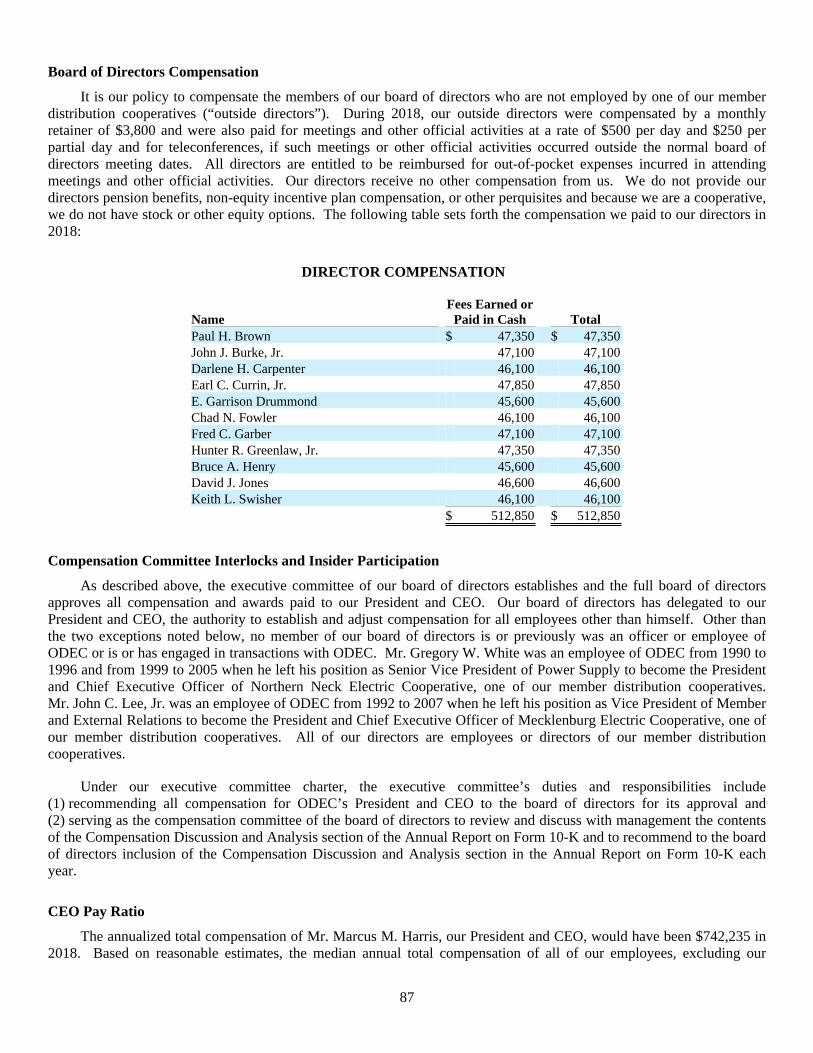
87
Board of Directors Compensation
It is our policy to compensate the members of our board of directors who are not employed by one of our member distribution cooperatives (“outside directors”). During 2018, our outside directors were compensated by a monthly retainer of $3,800 and were also paid for meetings and other official activities at a rate of $500 per day and $250 per partial day and for teleconferences, if such meetings or other official activities occurred outside the normal board of directors meeting dates. All directors are entitled to be reimbursed for out-of-pocket expenses incurred in attending meetings and other official activities. Our directors receive no other compensation from us. We do not provide our directors pension benefits, non-equity incentive plan compensation, or other perquisites and because we are a cooperative, we do not have stock or other equity options. The following table sets forth the compensation we paid to our directors in 2018:
DIRECTOR COMPENSATION
Name Fees Earned or
Paid in Cash Total Paul H. Brown $ 47,350 $ 47,350 John J. Burke, Jr. 47,100 47,100 Darlene H. Carpenter 46,100 46,100 Earl C. Currin, Jr. 47,850 47,850 E. Garrison Drummond 45,600 45,600 Chad N. Fowler 46,100 46,100 Fred C. Garber 47,100 47,100 Hunter R. Greenlaw, Jr. 47,350 47,350 Bruce A. Henry 45,600 45,600 David J. Jones 46,600 46,600 Keith L. Swisher 46,100 46,100 $ 512,850 $ 512,850
Compensation Committee Interlocks and Insider Participation
As described above, the executive committee of our board of directors establishes and the full board of directors approves all compensation and awards paid to our President and CEO. Our board of directors has delegated to our President and CEO, the authority to establish and adjust compensation for all employees other than himself. Other than the two exceptions noted below, no member of our board of directors is or previously was an officer or employee of ODEC or is or has engaged in transactions with ODEC. Mr. Gregory W. White was an employee of ODEC from 1990 to 1996 and from 1999 to 2005 when he left his position as Senior Vice President of Power Supply to become the President and Chief Executive Officer of Northern Neck Electric Cooperative, one of our member distribution cooperatives. Mr. John C. Lee, Jr. was an employee of ODEC from 1992 to 2007 when he left his position as Vice President of Member and External Relations to become the President and Chief Executive Officer of Mecklenburg Electric Cooperative, one of our member distribution cooperatives. All of our directors are employees or directors of our member distribution cooperatives.
Under our executive committee charter, the executive committee’s duties and responsibilities include (1) recommending all compensation for ODEC’s President and CEO to the board of directors for its approval and (2) serving as the compensation committee of the board of directors to review and discuss with management the contents of the Compensation Discussion and Analysis section of the Annual Report on Form 10-K and to recommend to the board of directors inclusion of the Compensation Discussion and Analysis section in the Annual Report on Form 10-K each year.
CEO Pay Ratio
The annualized total compensation of Mr. Marcus M. Harris, our President and CEO, would have been $742,235 in 2018. Based on reasonable estimates, the median annual total compensation of all of our employees, excluding our
88
President and CEO, was $116,834 for 2018. Accordingly, for 2018, the ratio of the annualized total compensation of our President and CEO to the median of the annual total compensation of all of our other employees was 6.4 to 1.
We identified our median employee based on salary earned in 2018 by each individual who was employed by us on November 15, 2018. We annualized the salary of all permanent employees who were not employed through the entire year.
Compensation Committee Report
The executive committee serves as the compensation committee of the board of directors and has reviewed and discussed with the management of ODEC the contents of the Compensation Discussion and Analysis section and, based on such review and discussion, has recommended to the board of directors its inclusion in this Annual Report on Form 10-K.
J. William Andrew, Jr., ChairPaul H. BrownEarl C. Currin, Jr.Kent D. FarmerFred C. GarberJohn C. Lee, Jr.
ITEM 12. SECURITY OWNERSHIP OF CERTAIN BENEFICIAL OWNERS AND MANAGEMENT AND RELATED STOCKHOLDER MATTERS
Not Applicable.
ITEM 13. CERTAIN RELATIONSHIPS AND RELATED TRANSACTIONSAND DIRECTOR INDEPENDENCE
Because we are a cooperative, all of our directors are representatives of our members. Our members include our member distribution cooperatives, which are our principal customers, and TEC. Due to the extent of the payments by each member distribution cooperative to us, our directors are not independent based on the definition of “independence” of the New York Stock Exchange.
89
ITEM 14. PRINCIPAL ACCOUNTING FEES AND SERVICES
The following table presents fees for services provided by Ernst & Young LLP for the two most recent fiscal years. All Audit, Audit-Related, and Tax Fees shown below were pre-approved by the Audit Committee in accordance with its established procedures.
2018 2017 Audit Fees (1) $ 347,000 $ 337,299 Audit-Related Fees (2) 11,675 15,335 Tax Fees (3) 96,452 8,150 Other — —
Total $ 455,127 $ 360,784
(1) Fees for professional services provided for the audit of our annual financial statements as well as reviews of our quarterly financial statements, accounting consultations on matters addressed during the audit or interim reviews, and SEC filings and offering memorandums including comfort letters, consents, and comment letters.
(2) Fees for professional services which principally include accounting consultations and due diligence services.
(3) Fees for professional services for tax-related advice and compliance.
For fiscal years 2018 and 2017, other than those fees listed above, we did not pay Ernst & Young LLP any fees for any other products or services.
Audit Committee Preapproval Process for the Engagement of Auditors
All audit, tax, and other services to be performed by Ernst & Young LLP for us must be pre-approved by the Audit Committee. The Audit Committee reviews the description of the services and an estimate of the anticipated costs of performing those services. Pre-approval is granted usually at regularly scheduled meetings. During 2018 and 2017, all services performed by Ernst & Young LLP were pre-approved by the Audit Committee in accordance with this policy.
90
PART IV
ITEM 15. EXHIBITS, FINANCIAL STATEMENT SCHEDULES
a) The following documents are filed as part of this Form 10-K.
1. Financial Statements
See Index on page 46
2. Financial Statement Schedules
Not applicable
3. Exhibits
Exhibits
*3.1 Amended and Restated Articles of Incorporation of Old Dominion Electric Cooperative (filed as exhibit 3.1 to the Registrant’s Form 10-Q, File No. 000-50039, filed on November 10, 2015).
*3.2 Bylaws of Old Dominion Electric Cooperative, Amended and Restated as of July 26, 2016, as amended on July 26, 2016 (filed as exhibit 3.1 to the Registrant’s Form 10-Q, File No. 000-50039, filed on August 9, 2016).
*4.1 Second Amended and Restated Indenture of Mortgage and Deed of Trust, dated as of January 1, 2011, between Old Dominion Electric Cooperative and Branch Banking and Trust Company, as Trustee (filed as exhibit 4.1 to the Registrant’s Form 10-K for the year ended December 31, 2010, File No. 000-50039, on March 16, 2011).
*4.2 First Supplemental Indenture, dated as of April 1, 2011, to the Second Amended and Restated Indenture of Mortgage and Deed of Trust, dated as of January 1, 2011, between Old Dominion Electric Cooperative and Branch Banking and Trust Company, as Trustee, including the form of the 2011 Series A, B, and C Bonds (filed as exhibit 4.1 to the Registrant’s Form 8-K dated April 7, 2011, File No. 000-50039, on April 8, 2011).
*4.3 Second Supplemental Indenture, dated as of June 1, 2013, to the Second Amended and Restated Indenture of Mortgage and Deed of Trust, dated as of January 1, 2011, between Old Dominion Electric Cooperative and Branch Banking and Trust Company, as Trustee, including the form of the 2013 Series A and B Bond (filed as exhibit 4.1 to the Registrant’s Form 8-K dated June 28, 2013, File No. 000-50039, on July 2, 2013).
*4.4 Third Supplemental Indenture, dated as of November 1, 2014, to the Second Amended and Restated Indenture of Mortgage and Deed of Trust, dated as of January 1, 2011, between Old Dominion Electric Cooperative and Branch Banking and Trust Company, as Trustee, including the form of the 2015 Series A and B Bond (filed as exhibit 4.1 to the Registrant’s Form 8-K dated January 15, 2014, File No. 000-50039, on January 16, 2015).
*, **10.1 Second Amended and Restated Wholesale Power Contract between Old Dominion Electric Cooperative and A&N Electric Cooperative, dated January 1, 2009 (filed as exhibit 10.2 and 10.3 to the Registrant’s Form 10-Q for the quarterly period ended September 30, 2008, File No. 33-46795, filed on November 12, 2008).
*10.2 Nuclear Fuel Agreement between Virginia Electric and Power Company and Old Dominion Electric Cooperative, dated as of December 28, 1982, amended and restated October 17, 1983 (filed as exhibit 10.1 to the Registrant’s Form S-1 Registration Statement, File No. 33-46795, filed on March 27, 1992).
*10.3 Purchase, Construction and Ownership Agreement between Virginia Electric and Power Company and Old Dominion Electric Cooperative, dated as of December 28, 1982, amended and restated October 17, 1983 (filed as exhibit 10.2 to the Registrant’s Form S-1 Registration Statement, File No. 33-46795, filed on March 27, 1992).
91
*10.4 Clover Purchase, Construction and Ownership Agreement between Old Dominion Electric Cooperative and Virginia Electric and Power Company, dated as of May 31, 1990 (filed as exhibit 10.4 to the Registrant’s Form S-1 Registration Statement, File No. 33-46795, filed on March 27, 1992).
*10.5 Amendment No. 1 to the Clover Purchase, Construction and Ownership Agreement between Old Dominion Electric Cooperative and Virginia Electric and Power Company, effective March 12, 1993 (filed as exhibit 10.34 to the Registrant’s Form S-1 Registration Statement, File No. 33-61326, filed on April 19, 1993).
*10.6 Clover Operating Agreement between Virginia Electric and Power Company and Old Dominion Electric Cooperative, dated as of May 31, 1990 (filed as exhibit 10.6 to the Registrant’s Form S-1 Registration Statement, File No. 33-46795, filed on March 27, 1992).
*10.7 Amendment to the Clover Operating Agreement between Virginia Electric and Power Company and Old Dominion Electric Cooperative, effective January 17, 1995 (filed as exhibit 10.8 to the Registrant’s Form 10-K for the year ended December 31, 1994, File No. 33-46795, on March 15, 1995).
*10.8 Mutual Operating Agreement, dated as of May 18, 2005, between Virginia Electric and Power Company and Old Dominion Electric Cooperative (filed as exhibit 10.66 to the Registrant's Form 10-K for the year ended December 31, 2005, File No. 000-50039, on March 21, 2006).
*10.9 Interconnection Agreement between Delmarva Power & Light Company and Old Dominion Electric Cooperative, dated November 30, 1999 (filed as exhibit 10.33 to the Registrant’s Form 10-K for the year ended December 31, 2000, File No. 33-46795, on March 19, 2001).
*10.10 First Amended and Restated Credit Agreement, dated as of March 3, 2017, among Old Dominion Electric Cooperative, the lenders party thereto, the Issuing Lenders party thereto, and Wells Fargo Bank, National Association, as Administrative Agent and Swingline Lender (filed as exhibit 10.1 to the Registrant’s Form 8-K dated March 3, 2017, File No. 000-50039, on March 8, 2017).
*10.11 Nuclear Decommissioning Trust Agreement between Old Dominion Electric Cooperative and SunTrust Bank, (formerly Crestar Bank), dated June 1, 1999 (filed as exhibit 10.8 to the Registrant's Form 10-K for the year ended December 31, 2014, File No. 000-50039, on March 11, 2015).
*†10.12 Employment Agreement, dated February 21, 2018, between Old Dominion Electric Cooperative and Marcus M. Harris and accepted by Marcus M. Harris on February 21, 2018 (filed as Exhibit 10.1 to the Registrant’s Form 8-K, File No. 000-50039, on February 23, 2018).
*†10.13 Employment letter, dated June 29, 2018, of Old Dominion Electric Cooperative and agreed and accepted by Bryan S. Rogers (filed as exhibit 10.1 to the Registrant’s Form 8-K, No. 000-50039, on July 3, 2018).
*†10.14 Employment letter, dated July 27, 2018, of Old Dominion Electric Cooperative and agreed and accepted by Allyson B. Pittman (filed as exhibit 10.1 to the Registrant’s Form 8-K, No. 000-50039, on July 31, 2018).
†10.15 Employment letter, dated December 4, 2018, of Old Dominion Electric Cooperative and agreed and accepted by Kirk D. Johnson.
*†10.16 Employment Agreement, dated June 1, 2016, between Old Dominion Electric Cooperative and Jackson E. Reasor and accepted by Jackson E. Reasor on June 1, 2016 (filed as Exhibit 10.1 to the Registrant’s Form 8-K, File No. 000-50039, on June 8, 2016).
*†10.17 Employment letter, dated November 28, 2005, of Old Dominion Electric Cooperative and agreed and accepted by Robert L. Kees (filed as exhibit 10.1 to the Registrant’s Form 8-K, No. 000-50039, on November 28, 2005).
92
*†10.18 Employment letter, dated March 30, 2007, of Old Dominion Electric Cooperative and agreed and accepted by Bryan S. Rogers (filed as exhibit 10.1 to the Registrant’s Form 8-K, No. 000-50039, on April 2, 2007).
*†10.19 Executive Deferred Compensation Plan, dated June 30, 2006, adopted on December 18, 2006 (filed as exhibit 10.2 to the Registrant’s Form 8-K File No. 000-50039, on December 21, 2006).
*†10.20 Form of Salary Continuation Plan (filed as exhibit 10.31 to the Registrant’s Form S-1 Registration Statement, File No. 33-46795, filed on March 27, 1992).
*†10.21 Amended and Restated Severance Pay Pension Restoration Plan effective January 1, 2015 (filed as exhibit 10.41 to the Registrant's Form 10-K for the year ended December 31, 2014, File No. 000-50039, on March 11, 2015).
*†10.22 Amended and Restated Deferred Compensation Pension Restoration Plan effective January 1, 2015 (filed as exhibit 10.42 to the Registrant's Form 10-K for the year ended December 31, 2014, File No. 000-50039, on March 11, 2015).
*10.23 Lease Agreement between Old Dominion Electric Cooperative and Regional Headquarters, Inc., dated July 29, 1986 (filed as exhibit 10.27 to the Registrant’s Form S-1 Registration Statement, File No. 33-46795, filed on March 27, 1992).
21 Subsidiaries of Old Dominion Electric Cooperative (not included because Old Dominion Electric Cooperative’s subsidiaries, considered in the aggregate as a single subsidiary, would not constitute a “significant subsidiary” under Rule 102(w) of Regulation S-X).
31.1 Certification of the Principal Executive Officer pursuant to Rule 13a-14(a)
31.2 Certification of the Principal Financial Officer pursuant to Rule 13a-14(a)
32.1 Certification of the Principal Executive Officer pursuant to 18 U.S.C. § 1350
32.2 Certification of the Principal Financial Officer pursuant to 18 U.S.C. § 1350
101.INS XBRL Instance Document
101.SCH XBRL Taxonomy Extension Schema Document
101.CAL XBRL Taxonomy Extension Calculation Linkbase Document
101.LAB XBRL Taxonomy Extension Label Linkbase Document
101.PRE XBRL Taxonomy Extension Presentation Linkbase Document
101.DEF XBRL Taxonomy Extension Definition Linkbase Document
* Incorporated herein by reference.
** This agreement is substantially similar in all material respects to the wholesale power contracts of our other member distribution cooperatives.
† Indicates management contract or compensatory plan.

93
ITEM 16. FORM 10-K SUMMARY
None
94
SIGNATURES
Pursuant to the requirements of Section 13 or 15(d) of the Securities Exchange Act of 1934, the Registrant has duly caused this report to be signed on its behalf by the undersigned, thereunto duly authorized.
OLD DOMINION ELECTRIC COOPERATIVE
Registrant
By: /s/ MARCUS M. HARRIS
Marcus M. HarrisPresident and Chief Executive Officer
Date: March 6, 2019
Signature Title
/s/ MARCUS M. HARRIS
Marcus M. HarrisPresident and Chief Executive Officer(Principal executive officer)
/s/ BRYAN S. ROGERS Senior Vice President and Chief Financial OfficerBryan S. Rogers (Principal financial officer)
/s/ ALLYSON B. PITTMAN
Allyson B. PittmanVice President and Controller(Principal accounting officer)
/s/ J. WILLIAM ANDREW, JR.J. William Andrew, Jr.
Director
/s/ PAUL H. BROWN
Paul H. BrownDirector
/s/ JOHN J. BURKE, JR.John J. Burke, Jr.
Director
/s/ DARLENE H. CARPENTER
Darlene H. CarpenterDirector
/s/ EARL C. CURRIN, JR.Earl C. Currin, Jr.
Director
/s/ E. GARRISON DRUMMOND
E. Garrison DrummondDirector
/s/ JEFFREY S. EDWARDS
Jeffrey S. EdwardsDirector
/s/ KENT D. FARMER
Kent D. FarmerDirector
/s/ CHAD N. FOWLER
Chad N. FowlerDirector
/s/ FRED C. GARBER
Fred C. GarberDirector
95
/s/ HUNTER R. GREENLAW, JR.Hunter R. Greenlaw, Jr.
Director
/s/ STEVEN A. HARMON
Steven A. HarmonDirector
/s/ MICHAEL W. HASTINGS
Michael W. HastingsDirector
/s/ BRUCE A. HENRY
Bruce A. HenryDirector
/s/ DAVID J. JONES
David J. JonesDirector
/s/ MICHAEL J. KEYSER
Michael J. KeyserDirector
/s/ JOHN C. LEE, JR.John C. Lee, Jr.
Director
/s/ MICHEAL E. MALANDRO
Micheal E. MalandroDirector
/s/ KEITH L. SWISHER
Keith L. SwisherDirector
/s/ MICHAEL I. WHEATLEY
Michael I. WheatleyDirector
/s/ GREGORY W. WHITE
Gregory W. WhiteDirector
/s/ BELVIN WILLIAMSON, JR.Belvin Williamson, Jr.
Director
SUPPLEMENTAL INFORMATION TO BE FURNISHED WITH REPORTS FILED PURSUANT TO SECTION 15(d) OF THE ACT BY REGISTRANTS WHICH HAVE NOT REGISTERED SECURITIES PURSUANT TO SECTION 12 OF THE ACT.
ODEC does not solicit proxies from its cooperative members and thus is not required to provide an annual report to its security holders and will not prepare such a report after filing this Form 10-K for fiscal year 2018. Accordingly, ODEC will not file an annual report with the Securities and Exchange Commission.

Exhibit 31.1
CERTIFICATIONS
I, Marcus M. Harris, certify that:
1. I have reviewed this annual report on Form 10-K of Old Dominion Electric Cooperative;
2. Based on my knowledge, this annual report does not contain any untrue statement of a material fact or omit tostate a material fact necessary to make the statements made, in light of the circumstances under which such statements were made, not misleading with respect to the period covered by this annual report;
3. Based on my knowledge, the financial statements, and other financial information included in this annual report,fairly present in all material respects the financial condition, results of operations and cash flows of the registrant as of, and for, the periods presented in this annual report;
4. The registrant’s other certifying officer and I are responsible for establishing and maintaining disclosure controlsand procedures (as defined in Exchange Act Rules 13a-15(e) and 15d-15(e) and internal control over financial reporting (as defined in Exchange Act Rules 13a-15(f) and 15d-15(f)) for the registrant and we have:
(a) designed such disclosure controls and procedures or caused such disclosure controls to be designed under our supervision, to ensure that material information relating to the registrant, including its consolidated subsidiaries, is made known to us by others within those entities, particularly during the period in which this annual report is being prepared;
(b) designed such internal control over financial reporting, or caused such internal control over financial reporting to be designed under our supervision, to provide reasonable assurance regarding the reliability of financial reporting and the preparation of financial statements for external purposes in accordance with generally accepted accounting principles;
(c) evaluated the effectiveness of the registrant’s disclosure controls and procedures and presented in this report our conclusions about the effectiveness of the disclosure controls and procedures as of the end of the period covered by this report based on such evaluation; and
(d) disclosed in this report any change in the registrant’s internal control over financial reporting that occurred during the registrant’s most recent fiscal quarter (the registrant’s fourth fiscal quarter in the case of an annual report) that has materially affected, or is reasonably likely to materially affect the registrant’s internal control over financial reporting.
5. The registrant’s other certifying officer and I have disclosed, based on my most recent evaluation of internalcontrol over financial reporting, to the registrant’s auditors and the audit committee of registrant’s board of directors (or persons performing the equivalent functions):
(a) all significant deficiencies and material weaknesses in the design or operation of internal control over financial reporting which are reasonably likely to adversely affect the registrant’s ability to record, process, summarize and report financial information; and
(b) any fraud, whether or not material, that involves management or other employees who have a significant role in the registrant’s internal control over financial reporting.
Date: March 6, 2019
/s/ MARCUS M. HARRISMarcus M. HarrisPresident and Chief Executive Officer (Principal executive officer)
Exhibit 31.2
CERTIFICATIONS
I, Bryan S. Rogers, certify that:
1. I have reviewed this annual report on Form 10-K of Old Dominion Electric Cooperative;
2. Based on my knowledge, this annual report does not contain any untrue statement of a material fact or omit tostate a material fact necessary to make the statements made, in light of the circumstances under which such statements were made, not misleading with respect to the period covered by this annual report;
3. Based on my knowledge, the financial statements, and other financial information included in this annual report,fairly present in all material respects the financial condition, results of operations and cash flows of the registrant as of, and for, the periods presented in this annual report;
4. The registrant’s other certifying officer and I are responsible for establishing and maintaining disclosure controlsand procedures (as defined in Exchange Act Rules 13a-15(e) and 15d-15(e) and internal control over financial reporting (as defined in Exchange Act Rules 13a-15(f) and 15d-15(f)) for the registrant and we have:
(a) designed such disclosure controls and procedures or caused such disclosure controls to be designed under our supervision, to ensure that material information relating to the registrant, including its consolidated subsidiaries, is made known to us by others within those entities, particularly during the period in which this annual report is being prepared;
(b) designed such internal control over financial reporting, or caused such internal control over financial reporting to be designed under our supervision, to provide reasonable assurance regarding the reliability of financial reporting and the preparation of financial statements for external purposes in accordance with generally accepted accounting principles;
(c) evaluated the effectiveness of the registrant’s disclosure controls and procedures and presented in this report our conclusions about the effectiveness of the disclosure controls and procedures as of the end of the period covered by this report based on such evaluation; and
(d) disclosed in this report any change in the registrant’s internal control over financial reporting that occurred during the registrant’s most recent fiscal quarter (the registrant’s fourth fiscal quarter in the case of an annual report) that has materially affected, or is reasonably likely to materially affect the registrant’s internal control over financial reporting.
5. The registrant’s other certifying officer and I have disclosed, based on my most recent evaluation of internalcontrol over financial reporting, to the registrant’s auditors and the audit committee of registrant’s board of directors (or persons performing the equivalent functions):
(a) all significant deficiencies and material weaknesses in the design or operation of internal control over financial reporting which are reasonably likely to adversely affect the registrant’s ability to record, process, summarize and report financial information; and
(b) any fraud, whether or not material, that involves management or other employees who have a significant role in the registrant’s internal control over financial reporting.
Date: March 6, 2019
/s/ BRYAN S. ROGERSBryan S. RogersSenior Vice President and Chief Financial Officer (Principal financial officer)
Exhibit 32.1
OLD DOMINION ELECTRIC COOPERATIVE
CERTIFICATION PURSUANT TO18 U.S.C. SECTION 1350,
AS ADOPTED PURSUANT TOSECTION 906 OF THE SARBANES-OXLEY ACT OF 2002
In connection with the Annual Report of Old Dominion Electric Cooperative (the “Company”) on Form 10-K for the period ending December 31, 2018 as filed with the Securities and Exchange Commission on the date hereof (the “Report”), I, Marcus M. Harris, President and Chief Executive Officer of the Company, certify, pursuant to 18 U.S.C. section 1350, as adopted pursuant to section 906 of the Sarbanes-Oxley Act of 2002, that:
(1) The Report fully complies with the requirements of Section 13(a) or 15(d) of the Securities Exchange Act of 1934; and
(2) The information contained in the Report fairly presents, in all material respects, the financial condition and result of operations of the Company.
Date: March 6, 2019
/s/ MARCUS M. HARRISMarcus M. HarrisPresident and Chief Executive Officer(Principal executive officer)
Exhibit 32.2
OLD DOMINION ELECTRIC COOPERATIVE
CERTIFICATION PURSUANT TO18 U.S.C. SECTION 1350,
AS ADOPTED PURSUANT TOSECTION 906 OF THE SARBANES-OXLEY ACT OF 2002
In connection with the Annual Report of Old Dominion Electric Cooperative (the “Company”) on Form 10-K for the period ending December 31, 2018 as filed with the Securities and Exchange Commission on the date hereof (the “Report”), I, Bryan S. Rogers, Senior Vice President and Chief Financial Officer of the Company, certify, pursuant to 18 U.S.C. section 1350, as adopted pursuant to section 906 of the Sarbanes-Oxley Act of 2002, that:
(1) The Report fully complies with the requirements of Section 13(a) or 15(d) of the Securities Exchange Act of 1934; and
(2) The information contained in the Report fairly presents, in all material respects, the financial condition and result of operations of the Company.
Date: March 6, 2019
/s/ BRYAN S. ROGERSBryan S. RogersSenior Vice President and Chief Financial Officer(Principal financial officer)