Embed Size (px)
Citation preview

On comparing the real and probed packet drop rates of a bottleneck
router: the TCP traffic case
S.Y. Wang
Department of Computer Science and Information Engineering, National Chiao Tung University, 1001 Ta Hsueh Road, Hsinchu 30050, Taiwan, ROC
Received 19 January 2002; revised 6 June 2002; accepted 24 June 2002
Abstract
In this paper, we address the question of whether the packet drop rate of a bottleneck router measured (experienced) by probe packets can
accurately reflect the bottleneck router’s real packet drop rate. To answer this question, we built a testbed network and conducted several real
experiments on it. In these experiments, using various traffic types and loads, we compared the probed and the real packet drop rates of the
bottleneck router. We also collected the internal queue length variation process of the bottleneck router and used it to do several post analyses
to answer some ‘what-if’ questions. This paper presents some interesting findings derived from this study.
q 2002 Elsevier Science B.V. All rights reserved.
Keywords: Network measurement; Traffic measurement; Performance evaluation
1. Introduction
Injecting probe packets to a network is a method to
measure the quality of a network. In this method, the packet
drop rates and delays experienced by probe packets are used
as estimates of the real packet drop rate and delay of the
network. Because this method does not need any support
from the network, network customers can easily use this
method to estimate the quality of their networks. To help
customers choose an Internet service provider (ISP) with the
best quality, some third parties also use the probe method to
routinely measure and publish the quality of some ISPs’
networks.
Although the probe method is widely used, it has not
been adequately studied in the literature and many
important questions still remain unsolved. For example,
suppose that we have an infinite number of probe packets,
will the measured result converge and accurately reflect the
real packet drop rate? How many probe packets are needed
to obtain a converged result? Does the distribution of the
inter-probe packet times (i.e. different sampling techniques)
affect the measured results and the convergence speed? Not
knowing these answers, a customer who uses a probe
method to estimate the quality of his network may obtain
wrong measured results, interpret the measured results
wrongly, or waste time and effort on collecting unnecessary
samples.
To answer these important questions, we built a testbed
network to collect the detailed packet arrival, departure, and
dropping events, and queue length variation process of a
bottleneck router. With these information (which cannot be
obtained by an end-to-end probe method), we conducted
several on-line probe experiments to study the difference
between the measured and real packet drop rates of a
bottleneck router, and perform several off-line post analyses
to answer some ‘what if…’ questions.
This paper presents some interesting findings about
packet drop rate measurements. These findings are derived
from the results collected on three different routers and
switches that were tested in our experiments (a FreeBSD
router, a CISCO AGS þ router, and a 3COM 3300 SM
switch). In these experiments, we used two different kinds of
network traffic to generate congestion on the bottleneck
router/switch. These two kinds of traffic are ‘greedy TCP
traffic’ and ‘greedy HTTP traffic’, respectively. The greedy
TCP traffic is used to simulate the traffic that would be
generated by FTP programs that transfer huge files. The
greedy HTTP traffic is used to simulate the traffic that would
be generated by Web clients that continuously download
small-sized web pages.
This paper is organized as follows. Section 2 surveys
related work. Section 3 defines the terms that are frequently
0140-3664/03/$ - see front matter q 2002 Elsevier Science B.V. All rights reserved.
PII: S0 14 0 -3 66 4 (0 2) 00 1 86 -X
Computer Communications 26 (2003) 591–602
www.elsevier.com/locate/comcom
E-mail address: [email protected] (S.Y. Wang).

used in the paper. Section 4 describes the experimental setup
of our testbed networks. Section 5 presents our measure-
ment method and tool. Section 6 shows our experimental
results and derived findings when the network traffic is
greedy TCP traffic. Section 7 shows our experimental results
and derived findings when the network traffic is greedy
HTTP traffic. Finally, Section 8 concludes this paper.
2. Related work
There have been some researches on studying the packet
dropping behavior in a network. In Refs. [1–4], the authors
studied the packet dropping behavior of the Internet by
injecting unicast probe packets into the Internet and
observing their dropping behavior. In Ref. [5], the authors
inferred the packet drop rate of links by injecting multicast
probe packets onto a multicast tree. In Ref. [6], the authors
used analytical methods (queueing theory) to analyze the
packet loss process in a single server queueing system under
the assumption that the packet arrival is a Poisson process.
In Ref. [7], the authors used a collected packet trace to study
the relative performance of various sampling techniques. In
Ref. [8], the author studied the loss dependence of packets
that are transmitted in the Internet. Our work differs from
these work in that we study the difference between the
probed packet drop rate and the real packet drop rate of a
bottleneck router; however, these work do not investigate
this problem.
3. Terminology
Several terms that are frequently used in this paper are
defined in this section.
Real packet drop rate is the packet drop rate of a
bottleneck output port. Suppose that, over a long period of
time, N packets arrive at a bottleneck output port and D of
them are dropped before they are transmitted, then the
packet drop rate of this bottleneck output port is D=N: In
some contexts, when there is no ambiguity, we simply call it
‘packet drop rate’. Depending on contexts, it may be used to
represent the packet drop rate of a bottleneck output port, a
bottleneck router, or a network.
Measured packet drop rate is the packet drop rate of a
bottleneck output port measured (experienced) by probe
packets over a period of time. Suppose that N probe packets
traverse through a bottleneck output port and D of them are
dropped, then the packet drop rate of the bottleneck output
port measured (experienced) by the probe packet stream is
D=N: In some contexts, we use it to represent the measured
packet drop rate of a bottleneck output port, the bottleneck
router, or the network.
Queue-full percentage is the percentage of time in which
the bottleneck output port’s queue is full. This information
can be calculated from the queue length variation process of
the output queue. A queue length variation process has
many queue-full periods. A queue-full period starts when
the current queue length goes up to maxqlen and ends when
the current queue length goes down to maxqlen-1, where
maxqlen is the configured maximum queue length for the
output queue. Any packet arriving in this period will be
dropped due to a full queue. Suppose that, during an
experiment, the total time of the experiment is T seconds
and the total time of its queue-full periods is F seconds, then
the queue-full percentage is F=T :
FIFO scheme is the most commonly used first-in-first-
out packet scheduling and drop-tail packet dropping
scheme. To save space, when there is no ambiguity, we
simply use ‘the FIFO scheme’ to represent the FIFO and
drop-tail scheme.
Greedy TCP traffic is the kind of traffic that is generated
by many greedy TCP flows. A greedy TCP flow is a TCP
connection that has infinite data to send and uses as much
bandwidth as allowed by its TCP congestion control.
Greedy HTTP traffic is the kind of traffic generated by
many greedy HTTP web clients. A greedy HTTP web client
is a program that continuously issues a new web request to
download a web page immediately when the current request
is completed. Each web request will cause a TCP connection
to be set up before the requested web page can be
downloaded. In this study, the size of the web pages is a
fixed value of 16KB. The web server program used is
Apache 1.3. The web client program used is a script
program that continuously issues the ‘ftp http://host[:port]/
file’ command. This ftp command will use the HTTP
protocol to download the requested file from a web server.
More information can be found in Ref. [9].
4. Experimental testbeds
In our experiments, we used two different kinds of traffic
to study the problem. The first kind is greedy TCP traffic and
the second kind is greedy HTTP traffic. (A HTTP session’s
transfer amount is small but it also uses TCP as its transport
protocol.) We chose TCP traffic to study because in today’s
Internet, TCP traffic is the most dominant traffic.
4.1. Greedy TCP traffic
We studied this kind of traffic because it is similar to the
traffic that would be generated when many people use ftp to
transfer huge files.
Two single-bottleneck configurations are used in this
suite of experiments. They are shown in Fig. 1. In both
configurations, there are seven sending hosts on the left and
one receiving host on the right. Between each sending host
and the receiving host, there are N greedy TCP flows and
therefore there are 7 p N greedy TCP flows in total passing
through the bottleneck router/switch, where N is varied from
4, 8 to 12. All of these hosts are PC running FreeBSD 4.2
S.Y. Wang / Computer Communications 26 (2003) 591–602592

and use Intel EtherExpress 100/10 Mbps Ethernet cards. All
links are 10-m full-duplex Ethernet cables and thus their
propagation delays are negligible. This experimental
configuration is chosen to create congestion conditions
and the bottleneck router in this configuration is expected to
represent a typical bottleneck router operating in a real
network.
Configuration (a) and (b) differ in what is used for the
bottleneck router/switch. In (a), because we want to collect
the detailed packet arrival, departure, and dropping
processes of the bottleneck router but commercial routers
and switches do not provide this information, we used a
1.6 GHz PC running FreeBSD 4.2 as the bottleneck router.
Because a PC does not have enough PCI/ISA slots to plug-in
eight Ethernet cards to connect to the seven sending hosts
and one receiving host, we set the bandwidth of the link
between the FreeBSD router and the receiving host to be
only 10 Mbps, and let the seven sending hosts and the
FreeBSD router connect to the switch (Intel 8-port
InBusiness switch) all at 100 Mbps speed.
Under this network and traffic configurations, the
bandwidth of the most-congested link (i.e. the link between
the FreeBSD router and the receiving host) is purposely set
to only 10 Mbps. Because TCP implements congestion
control, the aggregate throughput of these competing TCP
flows cannot exceed 10 Mbps in the long term. In the short
term, although the instantaneous aggregate throughput may
have a chance to exceed 10 Mbps, the difference should be
minimal. Because the bandwidth of the switch’s bottleneck
output port is 100 Mbps, which is 10 times of the bandwidth
of the most-congested link, packets of these competing TCP
flows will not have a chance to be dropped in the switch.
The reasons are that before they have a chance to be dropped
in the switch, they should have already been dropped on the
most-congested link.
In configuration (b), we used a CISCO AGS þ router
and a 3COM 3300 SM switch to repeat the experiments
conducted on configuration (a). We did this to see whether
the findings obtained from a FreeBSD router also apply to
some commercial routers/switches. The CISCO AGS þ
router was manufactured in Spring 1995 and stopped
servicing our campus in Spring 1999. We disabled the
3COM switch’s IEEE 802.3 £ flow control so that there is
no link-level flow control in our experiments. Unlike what
we did in configuration (a), since a commercial router/s-
witch has many ports, we directly connected the seven
sending hosts and one receiving host to the router/switch
without using an extra switch. Since these commercial
routers/switches do not provide the detailed packet arrival,
departure, and dropping process information, we focused
our study only on the packet drop rate of the router/switch.
This information can be calculated by the method presented
in Section 5.2 if it is not provided by the router/switch.
4.2. Greedy HTTP traffic
We studied this kind of traffic because it is similar to the
traffic that would be generated when many people
continuously download small-sized web pages.
In this suite of experiments, we used a single-bottleneck
configuration to study the problem. This configuration is
shown in Fig. 2. The network topology of configuration (c)
is the same as that of configuration (a). However, the traffic
of configuration (c) is different from that of configuration
(a). Now between each sending host and the receiving host,
there are N pairs of a web server and a greedy web client.
Therefore, in total there are 7 p N such pairs, where N is
varied from 5, 10 to 15.
We did not use the CISCO AGS þ router and the 3COM
3300 SM switch to do the greedy HTTP traffic experiments.
This is because (1) the FreeBSD router can provide more
internal information than these commercial router/switch,
and (2) the greedy TCP traffic results collected on
configuration (a) and (b) show that the CISCO AGS þ
router and the 3COM 3300 SM switch generate the same
findings as the FreeBSD router (see Section 6). Thus, in
Fig. 1. The two configurations used in the greedy TCP traffic experiments.
Fig. 2. The configuration used in the greedy HTTP traffic experiments.
S.Y. Wang / Computer Communications 26 (2003) 591–602 593

the greedy HTTP traffic case, we just used configuration (c)
to collect experimental results.
5. Measurement method and tool
This section presents (1) the method that we used to
capture the queue length variation, packet arrival, departure,
and dropping processes occurring inside a bottleneck
FreeBSD router, and (2) the method that we used to
calculate the packet drop rate of a bottleneck commercial
router/switch.
5.1. Capturing events
We used the user-level tcpdump program with a modified
kernel to capture the queue length variation process, packet
arrival, departure, and dropping events in the FreeBSD
router. The tcpdump is a user-level program that can instruct
the in-kernel Berkeley packet filter [10] to capture certain
packets, associate each captured packet with a timestamp
(with a granularity of 1 ms), and pass the information of
captured packets to the user level. Since we also wanted to
pass the in-kernel events of packet arrival, departure,
dropping, and the current queue length information to the
user level, we decided to take advantage of tcpdump to do
this job.
We modified the kernel so that the in-kernel packet filter
captures only the packets that are of interest to us. By
default, the packet filter captures the incoming and outgoing
packets of a monitored network interface. However, this is
not what we want. Actually, for a monitored interface, we
are not interested in capturing its incoming packets. Instead,
we want to capture three different kinds of packets. The first
kind is the packets that are successfully enqueued into the
output queue, the second kind is the packets that should be
enqueued but dropped due to a full queue under FIFO (or
selected to be dropped under RED [11]), the third kind is the
packets that are dequeued from the output queue for
transmission. For each of such packets, we associate it
with a timestamp to record when the corresponding event
(arrival, dropping, or departure) happens.
When we process the tcpdump output, we need to
distinguish between these three different kinds of packets.
To be able to do this, we put this ‘kind’ information into the
Ethernet source address field of a captured packet. We did
this because when a packet is captured, a copy of the packet
is generated and passed to the tcpdump for display.
Modifying the Ethernet header of the copy (the captured
packet) to convey some information to the user level does
no harm to the original packet. We set the Ethernet source
address of a captured packet that is enqueued to the output
queue, that is dropped, and that is dequeued from the output
queue to be qlen:1:1:1:1:1, qlen:2:2:2:2:2, and
qlen:3:3:3:3:3, respectively, where qlen is the current
queue length when the corresponding event occurs. Using
this approach, the tcpdump output provides detailed
information about the queue length variation, packet arrival,
dropping, and departure processes. Fig. 3 depicts this
capturing mechanism.
During our experiments, because we used a high
performance 1.6 GHz PC as the FreeBSD router and the
bottleneck link bandwidth is only 10 Mbps, the tcpdump
program did not lose any packet when capturing packets.
5.2. Calculating packet drop rates
If a commercial router/switch does not provide packet
drop count information for its output ports, we use the
method presented here to calculate the packet drop rate of an
output port. Not every commercial router/switch provides
packet drop count information. For example, the 3COM
3300 SM switch does not provide this information.
In this method, we first sum up the number of packets
successfully sent on each of the seven sending hosts. This
number S is the total number of packets that enter the
router/switch and then are directed to the bottleneck output
port. Suppose that the number of packets successfully
received by the receiving host is R. Then the number D,
which is S 2 R; is the number of packets dropped at the
bottleneck output port. Finally, we divide D by S to obtain
the packet drop rate of the bottleneck output port. We have
verified the correctness of this method by using the
FreeBSD router. In all of our verification experiments, the
packet drop rate calculated by this method is very close to
the real packet drop rate of the FreeBSD router.
6. Results and findings: the greedy TCP traffic case
In this section, we present experimental results and
findings derived when the network traffic is greedy TCP
traffic. As described in Section 4.1, 7 p N greedy TCP flows
compete for the bottleneck link’s bandwidth (N ¼ 4, 8, and
12), and some packets of these TCP flows are dropped inside
Fig. 3. The mechanism used to capture the internal queue length variation
process of a bottleneck router.
S.Y. Wang / Computer Communications 26 (2003) 591–602594
the bottleneck router/switch. Every experiment lasts at least
90 min. In the following, more specific setup information
will be provided.
6.1. Packet drop rate measurements
With the background greedy TCP traffic going on, we run
the ping program on each of the seven sending hosts to
measure the packet drop rate of the paths between the
sending and receiving hosts. The ping program sends
multiple ping request packets to the receiving host, and
requires the receiving host to send back a ping reply packet
when it receives a ping request packet. When the ping
program stops, it divides the number of received reply
packets by the number of sent request packets and reports
this number as the measured packet drop rate. Because there
is no bottleneck on the paths from the receiving host to the
sending hosts, only ping request packets may be dropped
and no ping reply packet will be dropped. The FreeBSD
router, CISCO AGS þ router, and 3COM 3300 SM switch
do not favor non-ping packets over ping packets or favor
ping packets over non-ping packets when dropping packets.
Therefore, the seven ping programs unbiasedly measure the
packet drop rate that a packet may experience at the
bottleneck output port.
Each of these ping programs uses the default time
interval of 1 s to send out its request packets. The number of
request packets sent during every experiment is at least
5000. (We need this large number of samples to obtain
converged results. See the figures and discussion in Section
6.4.) Because each request packet is only 84 bytes and each
ping program’s sending rate is 1 packet/s, the extra traffic
load placed on the bottleneck link by the seven ping
programs is only 588 bytes/s. Since this rate is only 0.045%
of the bottleneck link’s bandwidth (10 Mbps), the ping
probe packets affect the original background TCP traffic
insignificantly. Our experimental results show that the
bottleneck output port’s packet drop rate is almost the same
with or without the ping traffic.
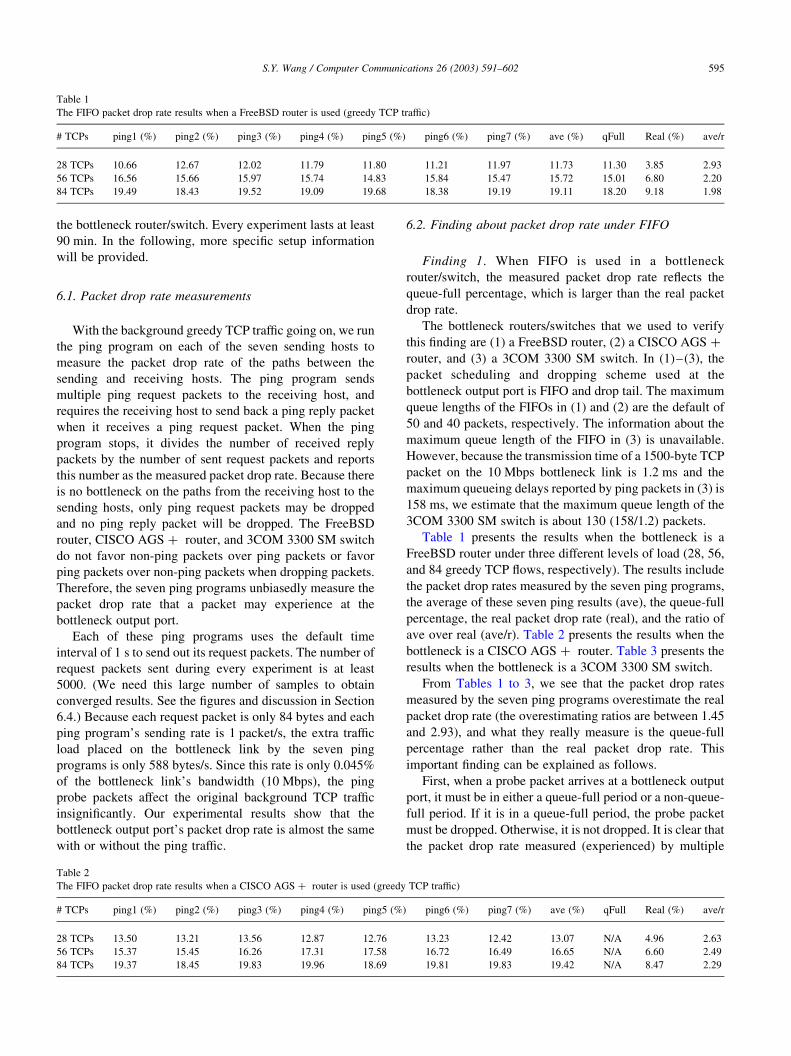
6.2. Finding about packet drop rate under FIFO
Finding 1. When FIFO is used in a bottleneck
router/switch, the measured packet drop rate reflects the
queue-full percentage, which is larger than the real packet
drop rate.
The bottleneck routers/switches that we used to verify
this finding are (1) a FreeBSD router, (2) a CISCO AGS þ
router, and (3) a 3COM 3300 SM switch. In (1)–(3), the
packet scheduling and dropping scheme used at the
bottleneck output port is FIFO and drop tail. The maximum
queue lengths of the FIFOs in (1) and (2) are the default of
50 and 40 packets, respectively. The information about the
maximum queue length of the FIFO in (3) is unavailable.
However, because the transmission time of a 1500-byte TCP
packet on the 10 Mbps bottleneck link is 1.2 ms and the
maximum queueing delays reported by ping packets in (3) is
158 ms, we estimate that the maximum queue length of the
3COM 3300 SM switch is about 130 (158/1.2) packets.
Table 1 presents the results when the bottleneck is a
FreeBSD router under three different levels of load (28, 56,
and 84 greedy TCP flows, respectively). The results include
the packet drop rates measured by the seven ping programs,
the average of these seven ping results (ave), the queue-full
percentage, the real packet drop rate (real), and the ratio of
ave over real (ave/r). Table 2 presents the results when the
bottleneck is a CISCO AGS þ router. Table 3 presents the
results when the bottleneck is a 3COM 3300 SM switch.
From Tables 1 to 3, we see that the packet drop rates
measured by the seven ping programs overestimate the real
packet drop rate (the overestimating ratios are between 1.45
and 2.93), and what they really measure is the queue-full
percentage rather than the real packet drop rate. This
important finding can be explained as follows.
First, when a probe packet arrives at a bottleneck output
port, it must be in either a queue-full period or a non-queue-
full period. If it is in a queue-full period, the probe packet
must be dropped. Otherwise, it is not dropped. It is clear that
the packet drop rate measured (experienced) by multiple
Table 1
The FIFO packet drop rate results when a FreeBSD router is used (greedy TCP traffic)
# TCPs ping1 (%) ping2 (%) ping3 (%) ping4 (%) ping5 (%) ping6 (%) ping7 (%) ave (%) qFull Real (%) ave/r
28 TCPs 10.66 12.67 12.02 11.79 11.80 11.21 11.97 11.73 11.30 3.85 2.93
56 TCPs 16.56 15.66 15.97 15.74 14.83 15.84 15.47 15.72 15.01 6.80 2.20
84 TCPs 19.49 18.43 19.52 19.09 19.68 18.38 19.19 19.11 18.20 9.18 1.98
Table 2
The FIFO packet drop rate results when a CISCO AGS þ router is used (greedy TCP traffic)
# TCPs ping1 (%) ping2 (%) ping3 (%) ping4 (%) ping5 (%) ping6 (%) ping7 (%) ave (%) qFull Real (%) ave/r
28 TCPs 13.50 13.21 13.56 12.87 12.76 13.23 12.42 13.07 N/A 4.96 2.63
56 TCPs 15.37 15.45 16.26 17.31 17.58 16.72 16.49 16.65 N/A 6.60 2.49
84 TCPs 19.37 18.45 19.83 19.96 18.69 19.81 19.83 19.42 N/A 8.47 2.29
S.Y. Wang / Computer Communications 26 (2003) 591–602 595

probe packets in the time domain actually reflects the queue-
full percentage.
Second, because in a queue-full period there may be no
packet dropping (to be discussed later) whereas a probe
packet arriving in such a period must be dropped, the queue-
full percentage does not proportionally correspond to the
real packet drop rate.
In a queue-full period, there may be no packet dropping.
Such a period is called ‘queue-full-but-no-drop’ in this
paper and may occur as follows. Suppose that the current
queue length is maxqlen-1. When a packet arrives and is
enqueued to the output queue, the current queue length will
go up to maxqlen, which starts a queue-full period. Later,
when an in-queue packet is dequeued for transmission, the
current queue length will go down to maxqlen-1, which
stops the current queue-full period. If no other packet arrives
in this period, no packet is dropped in this queue-full period.
The queue-full percentage is greater than the real packet
drop rate in experiments. This is because in these
experiments, the average packet drop rate (measured in
packet/s) in queue-full periods is less than the average
packet arrival rate. This phenomenon certainly must occur
in these experiments. Otherwise, the real packet drop rate
will be equal to or greater than the queue-full percentage,
which is not true for these experiments. (Note: For an
experiment, let N and D represent the number of packet
arrival and dropping events, and F and T represent the total
time of queue-full periods and the total time of the
experiment. If D=F , N=T is not true, then D=F $ N=T
must be true. This is equivalent to D=N $ F=T ; which means
that the real packet drop rate is equal to or greater than the
queue-full percentage and is not true.) We use the
experimental results of the 28 TCPs case of Table 1 to
show this phenomenon. In the experiment, the average
packet drop rate in queue-full periods is 286.21 packet/s.
This number is less than the average packet arrival rate of
840.61 packet/s. The results of other cases also exhibit the
same phenomenon.
When network congestion level increases, the over-
estimating ratio decreases. This phenomenon is evidenced
by the results in Tables 1–3. The reason is that as network
load increases, the queue-full-but-no-drop periods occur
less and less likely. This causes the ratio (denoted as
PDRQF=PAR) of the average packet drop rate in queue-full
periods (measured in packet/s) over the average packet
arrival rate to increase. As an evidence, for the 28 TCPs, 56
TCPs, and 84 TCPs cases of Table 1, the ratios of queue-
full-but-no-drop percentage over queue-full percentage are
0.69, 0.60, and 0.54, respectively (decreasing), and the
ratios of PDRQF=PAR are 0.34, 0.45, and 0.51, respectively
(increasing). This finding leads to Finding 3 (presented
later), which discusses how the overestimating ratio will
change under FIFO and RED when network load increases.
We can derive some implications from this finding.
† If routers/switches of a network use the FIFO scheme, an
end-to-end probe method (e.g. the most commonly used
ping) will measure the real packet drop rate too high.
Since most network users do not carefully distinguish
between a measured and the real packet drop rate of a
network, they usually incorrectly interpret a measured
packet drop rate as the real packet drop rate. Therefore, it
is unfair to their ISPs because the quality of their
networks actually is not that bad.
† A network’s packet drop rate is a composite number.
Different types of traffic in a network may experience and
have different packet drop rates. This implication is
evidenced by the different packet drop rates experienced
by probe packets and the background TCP packets listed
in Tables 1–3. If we view the seven ping packet streams
as a part of the background traffic in the first beginning
and do not view them as external probe packets, clearly
we see that TCP and ping packets experience and have
different packet drop rates at the same bottleneck.
Why ping and TCP packets experience different
packet drop rates can be explained as follows. Because
ping packets are transmitted independently of the packet
drop rate experienced by previously sent ping packets,
they unbiasedly sample the length of the bottleneck
output queue. The ratio of the number of ping packets
that encounter a queue-full period over the total number
of ping packets sent thus will converge to the queue-full
percentage. TCP packets, on the other hand, are sent
under the control of TCP congestion control, whose
actions depend on the packet drop rate experienced by
previously sent TCP packets. Because TCP packets are
not independently sent, they do not unbiasedly sample
the length of the bottleneck output queue. Therefore, the
packet-dropping ratio (measured packet drop rate) does
not correspond to the queue-full percentage.
† If the majority of traffic is TCP, using the packets of a
greedy TCP flow as probe packets can obtain a closer
estimate of the real packet drop rate.
In our experiments, the traffic flows that compete for
the bottleneck link’s bandwidth are all TCP flows and
they are homogeneous. Each of these TCP flows thus will
Table 3
The FIFO packet drop rate results when a 3COM 3300 SM switch is used (greedy TCP traffic)
# TCPs ping1 (%) ping2 (%) ping3 (%) ping4 (%) ping5 (%) ping6 (%) ping7 (%) ave (%) qFull Real (%) ave/r
28 TCPs 4.36 4.49 4.49 4.02 4.05 4.27 4.70 4.34 N/A 2.36 1.83
56 TCPs 8.24 8.24 8.22 8.39 8.25 8.34 8.56 8.32 N/A 5.45 1.52
84 TCPs 10.64 11.25 12.03 11.97 12.23 11.71 11.69 11.64 N/A 7.99 1.45
S.Y. Wang / Computer Communications 26 (2003) 591–602596

experience the same packet drop rate (the real packet
drop rate of the network). This means that if we use the
packets of a greedy TCP flow as probe packets, the
packet drop rate measured by them will reflect the real
packet drop rate. This implication is confirmed by a post
analysis of our experimental results. For example, for the
28 TCP flows case of Table 1, the packet drop rates
experienced by five individual TCP flows are 3.74, 3.80,
3.81, 3.76, 3.98, respectively. These numbers are close to
the real packet drop rate.
6.3. Finding about packet drop rate under RED
Finding 2. When RED is used in a bottleneck router and
the network is not too congested, the measured packet drop
rates are close to the real packet drop.
The bottleneck router that we used to verify this finding
is a FreeBSD router. Unlike what we did for the FIFO case,
because the CISCO AGS þ router and 3COM 3300 SM
switch do not support RED, they are not used in the
experiments. To use RED at the bottleneck output port of
the FreeBSD router, we let the router run FreeBSD 4.2 and
the ALTQ 3.0 [12] package. The ALTQ package
implements various packet scheduling and buffer manage-
ment schemes for a PC-UNIX based router. The parameter
settings for RED used in our experiments are (weight:1/512
inv_pmax:10 qthresh:(10,50) q_limit:50).
Table 4 presents the results when the bottleneck router
uses RED under three different levels of load (28, 56, and 84
greedy TCP flows, respectively). The information shown in
this table is similar to that shown in previous tables. The
only exception is that the qFull column is replaced with the
forceD (forced drop) column, which shows what percentage
of incoming packets is force-dropped. The design of RED
tries to drop incoming packets proactively before the queue
length exceeds the maximum queue length. The queue-full
percentage under RED thus is very small when the network
is not too congested. However, if the network becomes
severely congested and the queue eventually overflows,
some packets need to be dropped (called ‘forced drop’ in
RED).
From Table 4, we see that for the 28 TCP flows case, the
packet drop rates measured by the seven ping programs are
very close to the real packet drop rate. (The overestimating
ratio is only 1.04). For the 56, and 84 TCP flows cases,
although the overestimating ratio becomes larger and
increases to 1.14 and 1.25, respectively, the measured and
real packet drop rates are still quite close to each other,
compared to the FIFO results.
REDs proactive packet dropping strategy makes a
measured packet drop rate close to the real packet drop
rate. In RED, when a packet arrives at an output port, the
probability of dropping it is a linear function Drop( ) of the
exponential average of the queue length. Suppose that
the probability distribution of the exponential average queue
length seen by arriving packets is PðiÞ; i ¼ 0; 1; 2;…;
maxqlen; the average packet dropping probability (or drop
rate) for arriving packets will bePmaxqlen
i¼0 PðiÞ p DropðiÞ:
The probability distribution of the exponential average
queue length seen by probe packets is close to that seen by
TCP packets under RED. Fig. 4 shows the probability
distributions of the 28 TCP flows case of Table 4. (Note:
Because probe packets are ICMP packets, we can
distinguish probe packets from TCP packets in a tcpdump
log file.) Because the difference between PðiÞprobe (seen by
probe packets) and PðiÞTCP (seen by TCP packets) is small
and less than 1 (the maximum difference is 0.003 in Fig. 4
when i is 32), and DropðiÞ is also small and less than 1 (the
maximum value is 0.1 when i is maxqlen), the product term
ðPðiÞprobe 2 PðiÞTCPÞ p DropðiÞ becomes tiny (the maximum
value is 0.000165 when i is 32). Because every product term
is tiny and some of the product terms are positive while
some of them are negative, the sum of these product terms,
which is the difference between the packet drop rates of
probe and TCP packets, is small (0.0015).
Table 4
The RED packet drop rate results when a FreeBSD router is used (greedy TCP traffic)
# TCPs ping1 (%) ping2 (%) ping3 (%) ping4 (%) ping5 (%) ping6 (%) ping7 (%) ave (%) forceD (%) Real (%) ave/r
28 TCPs 4.78 4.96 4.82 5.08 4.99 4.78 4.87 4.89 0.08 4.68 1.04
56 TCPs 7.21 7.31 7.85 8.33 8.68 8.25 9.01 8.09 0.6 7.05 1.14
84 TCPs 10.58 10.84 10.73 11.78 11.29 11.64 12.22 11.29 1.91 9.03 1.25
Fig. 4. The probability distributions of the exponential average queue
length (rounded to integers) seen by probe and TCP packets under RED,
respectively (greedy TCP traffic).
S.Y. Wang / Computer Communications 26 (2003) 591–602 597

Using the samePmaxqlen
i¼0 PðiÞ p DropðiÞ formula, we
can show that under FIFO the packet drop rate difference
is not tiny. Under FIFO, because Drop(maxqlen) is 1 and
DropðiÞ is 0, i ¼ 0; 1; 2;…;maxqlen-1; the packet drop rate
difference becomes ðPðmaxqlenÞprobe 2 PðmaxqlenÞTCPÞ p 1:
PðmaxqlenÞprobe 2 PðmaxqlenÞTCP is close to the queue-full-
but-no-drop percentage and is not tiny. Fig. 5 shows the
probability distributions of the 28 TCP flows case of Table 1.
The difference between PðmaxqlenÞprobe and PðmaxqlenÞTCP
is about 7% (maxqlen here is 50), which is not tiny.
Finding 3. When network load increases, the over-
estimating ratio under RED increases whereas the over-
estimating ratio under FIFO decreases.
When the network congestion level increases and causes
a higher percentage of incoming packets to be force-
dropped, the overestimating ratio under RED will increase.
Table 4 shows that when the load increases from 28, 56, to
84 greedy TCP flows, the forced drop percentage increases
from 0.08, 0.6, to 1.91%, and the overestimating ratio
increases from 1.04, 1.14, to 1.25. This can be explained as
follows. When a larger and larger percentage of packets are
force-dropped, RED gradually degenerates to the FIFO
scheme. Because our previous FIFO results show that the
FIFO scheme has the overestimation problem, it is clear that
when network load becomes heavier, a measured packet
drop rate will deviate from the real packet drop rate by a
larger value.
Previously, our experimental results show that when
network load increases, the overestimating ratio under FIFO
decreases. It is interesting to calculate the packet drop rate
where the two ratios will meet each other. (Note: Because
even under severe congestion, RED at worst only degen-
erates to FIFO and will not perform worse than FIFO, these
two ratios will not cross over.) Using the regression analysis
and extrapolation method, we find that this rate would be
13% for the experiments of Tables 1 and 4.
6.4. Finding about various sampling techniques
Finding 4. Different sampling techniques generate close
measured packet drop rates and convergence speeds.
When using probe packets to measure a network’s packet
drop rate, an important question is “Will different
distributions of inter-probe packet times result in different
measured packet drop rates and convergence speeds?” By
‘convergence speed’, we mean how many samples are
needed to let a measured packet drop rate converge to what
it should eventually converge to. Another important
question is “If we have multiple probe packet streams that
measure the same bottleneck router’s packet drop rate but
each of them is launched at a different time, how soon can
their results approach each other?” (Note: In this case, we
are concerned about the convergence of the difference
among their results, not the convergence of the difference
between their results and the real packet drop rate.)
Fig. 5. The probability distributions of the queue length seen by probe and
TCP packets under FIFO, respectively (greedy TCP traffic).
Fig. 6. The convergence of measured packet drop rates under FIFO when
periodic sampling is used (greedy TCP traffic).
Fig. 7. The convergence of measured packet drop rates under FIFO when
periodic sampling with random delay is used (greedy TCP traffic).
S.Y. Wang / Computer Communications 26 (2003) 591–602598

To answer these questions, we used two queue length
variation processes collected in the FreeBSD router to
perform some post analyses. The first was collected when
the FreeBSD router uses the FIFO scheme and under the
load of 28 greedy TCP flows (the first row of Table 1). The
second was collected with RED and under the same load
(the first row of Table 4).
We test three different sampling techniques (periodic,
periodic þ random delay, Poisson) in our analyses. The
periodic sampling is the most widely used method for its
simplicity. In this technique, the inter-arrival times of probe
packets at the bottleneck output port is a fixed interval. The
periodic þ random delay sampling is used to simulate the
delay jitter that periodic probe packets may experience
before arriving at the output port. In analyses, we add a
random number generated uniformly between 230 and
30 ms to a packet’s original arrival time. That is, if the
average interval is T seconds, the arrival time of the ith probe
packet is set to be T p i þ ri; where ri is a uniform random
number between 230 and 30 ms. We also study Poisson
sampling because it is recommended in Ref. [13] for its
memoryless property [14]. In our analyses, the average inter-
arrival time for these sampling techniques is set to the same
value of 1 s (the default value used by the ping program).
In our analyses, for a N-packet probe packet stream,
given the arrival times of its packets P1;P2;…;PN ; the
measured packet drop rate up to the time when packet Pi is
issued is calculated as D=i; where D is the number of packets
between P1 and Pi that are dropped due to encountering a
full queue under FIFO or are selected to be dropped under
RED. Under FIFO, we consider a packet to be dropped if its
arrival time fall into a queue-full period of the collected
queue length variation process. Under RED, we consider a
packet to be dropped if the dropping probability function
chooses to drop it. To study the convergence speeds of a
sampling technique, in each analysis, we launch ten probe
packet streams using the same sampling technique at
0:0; 0:1; 0:2;…; 0:9 s; respectively. If a probe packet stream
needs to use random numbers (e.g. Poisson sampling), it
uses a different sequence of random numbers.
Fig. 8. The convergence of measured packet drop rates under FIFO when
Poisson sampling is used (greedy TCP traffic).
Fig. 9. The convergence of measured packet drop rates under RED when
periodic sampling is used (greedy TCP traffic).
Fig. 10. The convergence of measured packet drop rates under RED when
periodic sampling with random delay is used (greedy TCP traffic).
Fig. 11. The convergence of measured packet drop rates under RED when
Poisson sampling is used (greedy TCP traffic).
S.Y. Wang / Computer Communications 26 (2003) 591–602 599

Figs. 6–8 present the packet drop rates measured by 10
probe packet streams under FIFO. Figs. 9–11 present the
10 measured results under RED. In these figures, each of
the 10 lines in the top represents the measured packet drop
rate of a probe packet stream. The line at the bottom
represents the standard deviation (labeled ‘stddev’) of these
10 measured packet drop rates. This metric shows how soon
these measured drop rates approach each other. The line
above the stddev line represents the distance (labeled
‘distance’) between the 10 measured packet drop rates and
the packet drop rate C that they should converge to. (Note:
We have shown that under FIFO, this value is the queue-full
percentage, and under RED, it is the real packet drop rate.)
More precisely, suppose that M1;M2;…;M10 are the 10
measured packet drop rates, then the distance is the distance
between the two points ðC;C;C;C;C;C;C;C;C;CÞ and
ðM1;M2;M3;M4;M5;M6;M7;M8;M9;M10Þ in the 10-dimen-
sion space ð
ffiffiffiffiffiffiffiffiffiffiffiffiffiffiffiffiffiffiffiP10i¼1 ðMi 2 CÞ2
qÞ: This metric shows how soon
the measured packet drop rates converge to what they should
eventually converge to.
From these figures, we have some findings as follow.
† Different sampling techniques generate close measured
packet drop rates.
In the FIFO case, the periodic, periodic þ random
delay, and Poisson samplings all converge to the queue-
full percentage. In the RED case, they all converge to the
real packet drop rate. In fact, we have tried many
different distributions of the inter-arrival times of probe
packets (e.g. the normal and uniform distributions). They
all generate close packet drop rates.
† Different sampling techniques have about the same
convergence speeds.
In both the FIFO and RED cases, from the stddev and
distance lines, we see that the three different sampling
techniques have about the same convergence speeds.
† Under RED, different probe packet streams report very
close measured packet drop rates over time if their
corresponding packets (i.e. Pi) arrive at the bottleneck
output port not too far away from each other.
RED uses the exponential average of the queue length
to calculate a dropping probability. Its weighing factor is
1/512 for a new queue length sample. (Note: The
exponential average of the queue length is updated as
EA ¼ EA p 511=512 þ NewQlen p 1=512; where EA is
the exponential average and NewQlen is a new sample of
the current queue length.) Because the weighting factor is
purposely configured small to not punish bursty traffic,
the exponential average changes very slowly. Therefore,
if probe packets arrive closely at the output port, they
would receive about the same packet dropping
probabilities.
This explains why in Fig. 9, the standard deviation of
the 10 measured packet drop rates reduces to a small
value rapidly while the distance to the real packet drop
rate is still large. In Fig 9, the 10 periodic sampling
packet streams are only shifted by 0.1 s on the time axis
and use no random number in their scheduled arrival
times. Therefore, the arrival times of packet Pi of each of
the 10 probe packet streams are close to each other.
† A large number of samples are needed to obtain
converged results.
We see that for a probe packet stream to obtain a
measured packet drop rate that is close to what it should
converge to, just a few hundreds of probe packets are not
enough. At least a few thousands probe packets are
needed to let a measured packet drop rate approach what
it should converge to.
7. Results and findings: the greedy HTTP traffic case
In this section, we present experimental results and
findings derived when the network traffic is greedy HTTP
traffic. As described in Section 4.2, the reply traffic of 7 p N
Fig. 12. The probability distributions of the queue length seen by probe and
TCP packets under FIFO, respectively (greedy HTTP traffic).
Table 5
The FIFO packet drop rate results when a FreeBSD router is used (greedy HTTP traffic)
# HTTPs ping1 (%) ping2 (%) ping3 (%) ping4 (%) ping5 (%) ping6 (%) ping7 (%) ave (%) qFull (%) Real (%) ave/r
35 HTTPs 3.23 3.05 3.12 2.98 2.95 3.20 3.03 3.08 3.01 2.16 1.43
70 HTTPs 8.19 8.17 7.88 7.94 7.99 8.06 8.28 8.07 7.91 6.17 1.31
105 HTTPs 10.49 11.17 10.74 10.53 11.43 10.87 10.89 10.92 10.63 9.34 1.17
S.Y. Wang / Computer Communications 26 (2003) 591–602600

greedy Web clients compete for the bottleneck link’s
bandwidth (N ¼ 5, 10, and 15). The size of each web
transfer is 16KB. Every experiment lasts at least 90 min.
7.1. Packet drop rate measurements
LikewhatwedidinthegreedyTCPtrafficcase,withgreedy
HTTP traffic going on, we run the ping program on each of the
seven sending hosts to measure the packet drop rate of the
bottleneck FreeBSD router. The interval used by the ping
program for its request packets is the default value of 1 s.
7.2. Finding about packet drop rate under FIFO
Table 5 presents the FIFO results under three different
levels of load (35, 70, and 105 greedy HTTP sessions,
respectively). Like the results presented in Table 1, the
results in Table 5 show that the measured packet drop rates
are higher than the real packet drop rates of the bottleneck
router and actually are close to the queue-full percentages.
These results show that Finding 1, which is presented in
Section 6.2, also holds for the greedy HTTP traffic case.
Fig. 12 shows the probability distributions of the queue
length seen by probe packets and TCP packets under FIFO
for the 105 HTTP sessions case of Table 6. We can see that
probe packets experience more packet drops than TCP
packets (at the place when the queue length is 50), and their
experienced packet drop rate is close to the queue-full
percentage.
7.3. Finding about packet drop rate under RED
Table 6 presents the RED results under three different
levels of load (35, 70, and 105 greedy HTTP sessions,
respectively). Like the results presented in Table 4, the
results in Table 6 show that the measured packet drop rates
are close to the real packet drop rates of the bottleneck
router. These results show that Finding 2, which is presented
in Section 6.3, also holds for the greedy HTTP traffic case.
By comparing the results shown in Tables 5 and 6, we
can find that Finding 3, which is presented in Section 6.3,
holds for the greedy HTTP traffic case as well. That is, under
FIFO, the overestimating ratio decreases as the network
load increases whereas under RED, the overestimating ratio
increases as the network load increases.
Fig. 13 shows the probability distributions of the
exponential average queue length seen by probe packets
and TCP packets under RED for the 105 HTTP sessions
case of Table 6. We can see that these two probability
distribution curves are close to each other.
7.4. Finding about various sampling techniques
Like what we did in Section 6.4, we test the performance
of various sampling techniques when the network traffic is
greedy HTTP traffic. The performance results show that
Finding 4, which is presented in Section 6.4, holds for the
greedy HTTP traffic case as well. To space, we do not
present the performance figures of these cases in this paper.
8. Conclusions
In this paper, we study several important questions
related to using probe packets to measure a network’s real
packet drop rate. By using an instrumented FreeBSD kernel
as a bottleneck router, we were able to collect its internal
queue length variation process and derive the following
findings.
† Finding 1. When FIFO is used in a bottleneck
router/switch, the measured packet drop rate reflects
the queue-full percentage, which is larger than the real
packet drop rate.
Table 6
The RED packet drop rate results when a FreeBSD router is used (greedy HTTP traffic)
# HTTPs ping1 (%) ping2 (%) ping3 (%) ping4 (%) ping5 (%) ping6 (%) ping7 (%) ave (%) forceD (%) Real (%) ave/r
35 HTTPs 3.23 3.01 3.10 3.20 3.07 3.38 3.27 3.18 0.007 3.14 1.01
70 HTTPs 5.69 5.74 6.00 5.77 5.84 5.92 5.79 5.82 0.076 5.65 1.03
105 HTTPs 7.63 7.54 7.42 7.64 7.37 7.54 7.49 7.51 0.870 7.08 1.06
Fig. 13. The probability distributions of the exponential average queue
length (rounded to integers) seen by probe and TCP packets under RED,
respectively (greedy HTTP traffic).
S.Y. Wang / Computer Communications 26 (2003) 591–602 601

† Finding 2. When RED is used in a bottleneck router/
switch and the network is not too congested, the measured
packet drop rates are close to the real packet drop rate.
† Finding 3. When network load increases, the over-
estimating ratio under RED increases whereas the
overestimating ratio under FIFO decreases.
† Finding 4. Different sampling techniques generate close
measured packet drop rates and convergence speeds.
The above findings are derived from the results collected
on our single-bottleneck testbed network. In the future, we
plan to build a multibottleneck testbed network and repeat
our studies.
Acknowledgements
We would like to thank the anonymous reviewers for
their valuable comments. This research was supported in
part by MOE Program of Excellence Research under
contract 89-E-FA04-4, the Lee and MTI Center for
Networking Research, NCTU, NSC grant 90-2213-E-009-
157, and the Institute of Applied Science and Engineering
Research, Academia Sinica, Taiwan.
References
[1] J.-C. Bolot, End-to-End Packet Delay and Loss Behavior in the
Internet, Proceedings of SIGCOMM’93, September, 1993, pp. 289–
298.
[2] V. Paxson, End-to-end internet packet dynamics, IEEE/ACM
Transactions on Networking 7 (3) (1999) 277–292. June.
[3] M. Yajnik, S. Moon, J. Kurose, D. Towsley, Measurement and
Modeling of the Temporal Dependence in Packet Loss, Proceedings
of IEEE INFOCOM’99, March, 1999.
[4] Y. Zhang, V. Paxson, S. Shenker, On the constancy of Internet path
properties, Proceedings of ACM SIGCOMM Internet Measurement
Workshop (IMW’2001), San Francisco, California, USA, November,
2001.
[5] R. Caceres, N.G. Duffield, J. Horowitz, D. Towsley, T. Bu, Multicast-
Based Inference of Network-Internal Characteristics: Accuracy of
Packet Loss Estimation, Proceedings of IEEE INFOCOM’99, March,
1999.
[6] I. Cidon, A. Khamisy, M. Sidi, Analysis of packet loss processes in
high-speed networks, IEEE Transactions on Information Theory 39
(1) (1993) 98–108. January.
[7] K. Claffy, G. Polyzos, H.-W. Braun, Application of Sampling
Methodologies to Network Traffic Characterization, Proceedings of
ACM SIGCOMM’93, September, 1993, pp. 194–203.
[8] M.S. Borella, Measurement and interpretation of internet packet loss,
Journal of Communications and Networks 2 (2) (2000) June.
[9] FreeBSD General Commands Manual.
[10] S. McCanne, V. Jacobson, Berkeley Packet Filter: A New Archi-
tecture for User-Level Packet Capture, Proceedings of USENIX
Winter Technical Conference, January, 1993.
[11] S. Floyd, V. Jacobson, Random early detection gateways for
congestion avoidance, IEEE/ACM Transactions of Networking 1
(4) (1993) 397–413. August.
[12] K. Cho, A Framework for Alternate Queueing: Towards Traffic
Management by PC-UNIX Based Routers, Proceedings of 1998
USENIX Annual Technical Conference, June, 1998, The latest ALTQ
release can be retrieved from http://www.csl.sony.co.jp/kjc/software.
html..
[13] V. Paxson, G. Almes, J. Mahdavi, M. Mathis, Framework for IP
performance metrics, RFC 2330.
[14] R. Wolf, Poisson arrivals see time averages, Operating Research 30
(2) (1982) 223–231.
S.Y. Wang / Computer Communications 26 (2003) 591–602602