Embed Size (px)
Citation preview
IOP PUBLISHING JOURNAL OF MICROMECHANICS AND MICROENGINEERING
J. Micromech. Microeng. 20 (2010) 015039 (8pp) doi:10.1088/0960-1317/20/1/015039
On the use of shape memory alloy thinfilms to tune the dynamic response ofmicro-cantileversT Kniknie1, Y Bellouard1,3, E Homburg1, H Nijmeijer1, X Wang2 andJ J Vlassak2
1 Mechanical Engineering Department, Eindhoven University of Technology, Eindhoven,The Netherlands2 SEAS, Harvard University, Cambridge, MA, USA
E-mail: [email protected]
Received 9 September 2009, in final form 16 October 2009Published 14 December 2009Online at stacks.iop.org/JMM/20/015039
AbstractWe investigate the effect of martensitic phase transformations on the dynamic response ofcommercial AFM silicon cantilevers coated with shape memory alloy (SMA) thin films. Wepropose a simple thermo-mechanical model to predict the phase transformation. We showexperimentally that the SMA thin film dynamic response can be actively changed upon heatingand cooling. This can be used for vibration control in micro-systems.
(Some figures in this article are in colour only in the electronic version)
1. Introduction
Initially developed for scanning probe microscopy (AFM,STM) [1] micro-cantilevers are now used in a large number ofapplications, for instance mass sensing [2], gas and biologicalsensors [3], and new concepts of memory (the Millipede R© fromIBM) that features an array of cantilevers [4]. To improvethe performance of sensing micro-cantilever-based devicesand to further extend the potential applications of cantilevers,control of the dynamical behaviour of the beam is of particularinterest, for instance, to reject unwanted vibrations in sensorsapplications, to increase the positioning accuracy in actuatorsapplications, or to simply broaden the measurement range forsensing applications.
In this paper, we focus on demonstrating the use of a shapememory alloy (SMA) thin film to actively change the dynamicresponse of AFM cantilevers. More specifically, we showthat an electrical current can effectively be used to modify thefrequency response of AFM cantilevers coated with SMA.
Shape memory alloys show temperature- and stress-induced thermoelastic phase transformations between two(or more) solid-state phases [8] that lead to the well-knownshape memory effect and the so-called superelastic effect. In
3 Author to whom any correspondence should be addressed.
addition, shape memory alloys also exhibit variable dampingproperties during the transformation as well as a dramaticchange of Young’s modulus. The latter can be used toactively control the dynamical response of a mechanicalstructure.
The use of SMA for tuneable damping and frequencyresponse has been investigated for various applications suchas buildings with earthquake protection [5], skis [7], aircraft [6]and flexures [9]. Further, SMA are attractive for microsystemsin particular due to their high-work density and the possibilityof using SMA thin films. A review of applications of SMA inmicro-systems is given in [10]. More specifically, the dampingproperties of SMA thin films have been reviewed by Wuttiget al [22].
In this study, we investigate the use of a SMA coating toactively modify the dynamical response of AFM cantilevers.As a first proof-of-concept, we report on the active control ofresonant frequencies. In section 2, the experimental procedureand setup are described. There we investigate the quasi-staticthermo-mechanical behaviour. In the following section, wereport on the dynamical behaviour, and finally in section 4, weconclude on the potential use of SMA thin films to tune thedynamic response of microsystems.
0960-1317/10/015039+08$30.00 1 © 2010 IOP Publishing Ltd Printed in the UK

J. Micromech. Microeng. 20 (2010) 015039 T Kniknie et al
Figure 1. SEM picture of NiTi coated silicon micro cantilevers.
2. Quasi-static thermo-mechanical behaviour
2.1. Test specimens
We use commercially available tip-less silicon cantilevers(shown in figure 1) (Micro-Masch [18]). The cantileversare coated with an equi-atomic NiTi thin film by means ofmagnetron sputtering. The lengths are 250 μm and 300 μm,width is 35 μm and the thickness is approximately 2 μm.
The NiTi thin film has a thickness hf of ∼1 μm. Sputterdeposition takes place at room temperature in a vacuum systemwith a base pressure of better than 5×10⁻⁸ Torr and an Arworking pressure of 1.5 mTorr. After deposition, the NiTi filmis amorphous. Crystallization of the film takes place duringan annealing step at 500 ◦C for 30 min [11].
The cantilevers are part of a silicon chip (l × w × h, 3.4 ×1.6 × 0.4 mm). This chip is mounted on a steel plate for easyhandling and positioning. After sputtering and annealing, thecantilevers are bent up due to residual tensile stress present inthe film.
2.2. Thermo-mechanical experiments and modelling
The phase transformation temperatures and the influence of thephase transitions on the mechanical behaviour of the systemare investigated by measuring temperature–stress curves. Thestress in the SMA film on a silicon cantilever is estimated usingTimoshenko’s equation for the maximum stress in bimetallicthermostats [18]:
σ = 1
ρ
[2
(hs + hf )hf
(EsIs + Ef If ) +hf Ef
2
](2.1)
with curvature 1/ρ (1/m), Young’s modulus E and secondmoment of area I. For the silicon cantilever and SMA film,we use the indices s and f , respectively. The cantilever has athickness hs and the film a thickness hf . In this equation, thestress is measured at the interface between the two materials.
Equation (2.1) shows that the stress inside the film can beestimated from beam curvature measurements. Therefore, we
Figure 2. Deflection profile and curve fit of a coated cantilever withlength L = 350 μm at room temperature. Using the polynomial ofthis fitted curve, the curvature of the cantilever is computed usingequation (2.2).
Figure 3. Temperature–curvature graph of a NiTi coated siliconmicro cantilever with length L = 250 μm. Temperature is cycledbetween −100 ◦C and 140 ◦C with steps of 5 ◦C.
use the temperature–curvature graph to determine the phasetransformation behaviour of the SMA and then, to computethe stress in the material.
The deflection profile of the coated cantilever is measuredfor various temperatures starting from –100 ◦C and upto 150 ◦C. The profile is measured using a 3D opticalprofiler (Sensofar PLμ 2300) equipped with an accurateheating/cooling stage with a resolution of 0.1 ◦C. The profilermeasures height information of the cantilever. The curvatureof the cantilever is determined using the beam curvatureequation (so-called Euler’s ‘Elastica’) for various positionson the beam:
1
ρ=
∂2z∂x2[
1 +(
∂z∂x
)2]3/2. (2.2)
Once ρ is known (using equation (2.2)), we calculate thestress in the film throughout the length of the beam (usingequation (2.1)).
An example of such a deflection measurement is shownin figure 2. A polynomial curve fit is used to extract the beamcurvature from the measurements.
The temperature–curvature graph of a cantilever withlength 250 μm during a thermal cycle between −100 ◦C and140 ◦C is shown in figure 3.
Going through a temperature cycle, some interestingobservations can be made. First, the sample is cooleddown from room temperature Ts = 23.5 ◦C to −100 ◦C.
2
J. Micromech. Microeng. 20 (2010) 015039 T Kniknie et al
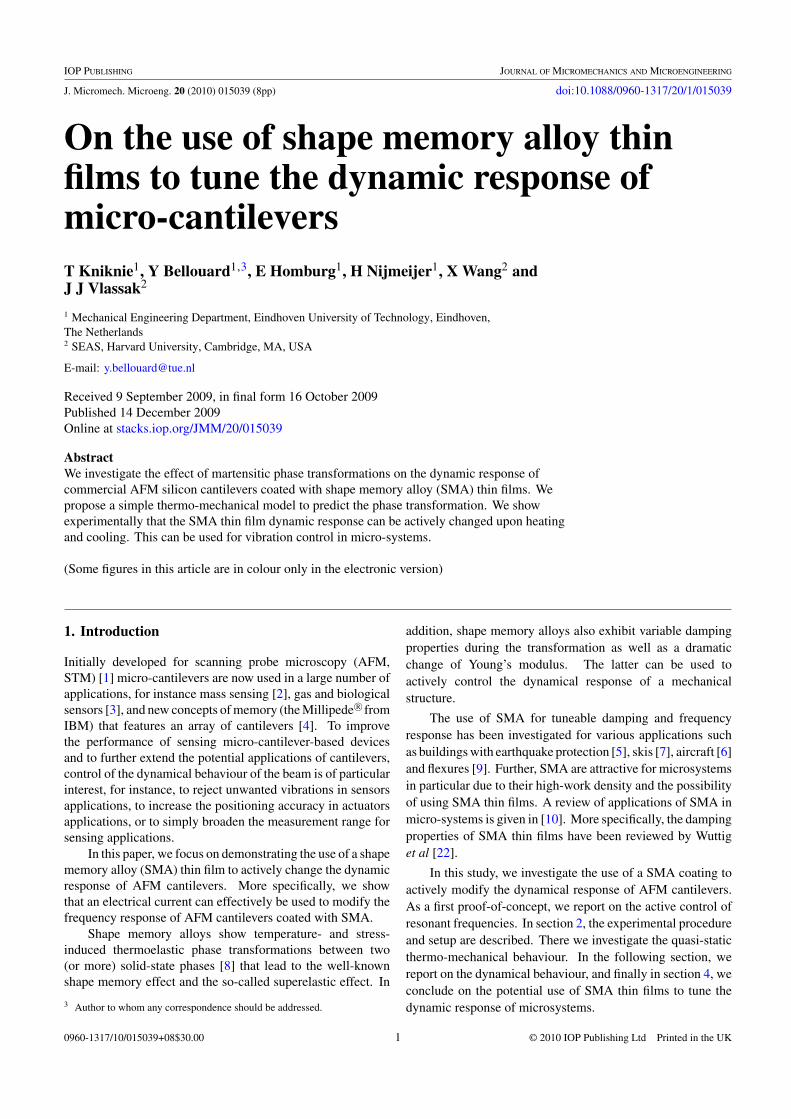
Below Mf = −56.6 ◦C, the film is fully in the martensitephase (the low-temperature crystallographic phase of thematerial). Upon increasing the temperature, the cantileverbends down due to its bimorph structure. At As = 1 ◦C,the phase transformation from martensite to austenite (thehigh-temperature crystallographic phase of the material) starts.During the phase transformation, the cantilever bends up untilthe temperature reaches 63.4 ◦C. Above this temperature,noted as Af , the material is fully transformed in the austenitephase. Further increasing the temperature again results indownward bending due to the bimorph effect. The slope ofthis part of the graph differs from the slope in the martensiticstate because both thermal expansion coefficient and Young’smodulus have changed during the phase transformation.
If the temperature is decreased, a reverse phasetransformation takes place. During cooling, an intermediatephase appears. We identify this intermediate phase as the R-phase, an intermediate crystallographic phase observed duringthe reverse transformation from austenite to martensite in Ni–Ti binary alloys. Between Rs = 58.6 ◦C and Rf = 49.0 ◦Csome small hysteresis effect is observed corresponding to theaustenite to R-phase transformation. Below Rf , the materialis in R-phase until the temperature reaches Ms = −3.8 ◦Cwhere a second transformation, from R-phase to martensitetakes place. During the transformation the cantilever bendsdownward.
Below the temperature Mf the material is fully inmartensite phase and no more phase transformations areobserved.
2.3. Discussion
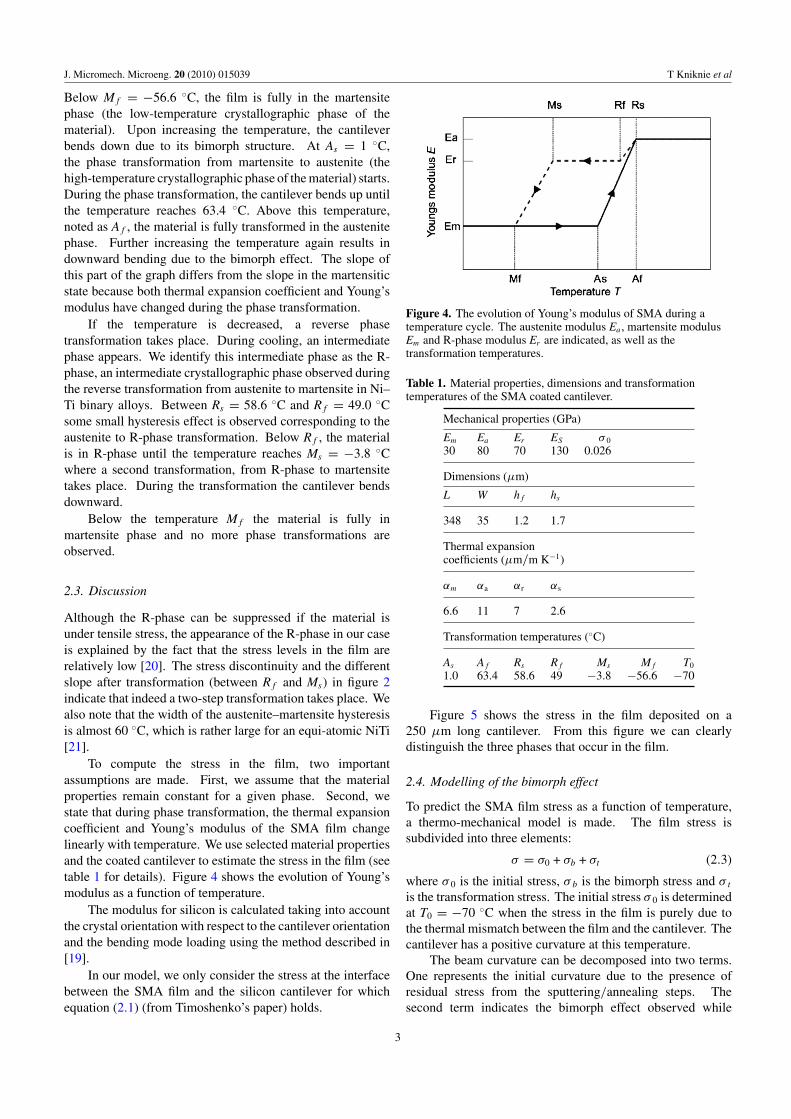
Although the R-phase can be suppressed if the material isunder tensile stress, the appearance of the R-phase in our caseis explained by the fact that the stress levels in the film arerelatively low [20]. The stress discontinuity and the differentslope after transformation (between Rf and Ms) in figure 2indicate that indeed a two-step transformation takes place. Wealso note that the width of the austenite–martensite hysteresisis almost 60 ◦C, which is rather large for an equi-atomic NiTi[21].
To compute the stress in the film, two importantassumptions are made. First, we assume that the materialproperties remain constant for a given phase. Second, westate that during phase transformation, the thermal expansioncoefficient and Young’s modulus of the SMA film changelinearly with temperature. We use selected material propertiesand the coated cantilever to estimate the stress in the film (seetable 1 for details). Figure 4 shows the evolution of Young’smodulus as a function of temperature.
The modulus for silicon is calculated taking into accountthe crystal orientation with respect to the cantilever orientationand the bending mode loading using the method described in[19].
In our model, we only consider the stress at the interfacebetween the SMA film and the silicon cantilever for whichequation (2.1) (from Timoshenko’s paper) holds.
Figure 4. The evolution of Young’s modulus of SMA during atemperature cycle. The austenite modulus Ea , martensite modulusEm and R-phase modulus Er are indicated, as well as thetransformation temperatures.
Table 1. Material properties, dimensions and transformationtemperatures of the SMA coated cantilever.
Mechanical properties (GPa)
Em Ea Er ES σ 0
30 80 70 130 0.026
Dimensions (μm)
L W hf hs
348 35 1.2 1.7
Thermal expansioncoefficients (μm/m K−1)
αm αa αr αs
6.6 11 7 2.6
Transformation temperatures (◦C)
As Af Rs Rf Ms Mf T0
1.0 63.4 58.6 49 −3.8 −56.6 −70
Figure 5 shows the stress in the film deposited on a250 μm long cantilever. From this figure we can clearlydistinguish the three phases that occur in the film.
2.4. Modelling of the bimorph effect
To predict the SMA film stress as a function of temperature,a thermo-mechanical model is made. The film stress issubdivided into three elements:
σ = σ0 + σb + σt (2.3)
where σ 0 is the initial stress, σb is the bimorph stress and σ t
is the transformation stress. The initial stress σ 0 is determinedat T0 = −70 ◦C when the stress in the film is purely due tothe thermal mismatch between the film and the cantilever. Thecantilever has a positive curvature at this temperature.
The beam curvature can be decomposed into two terms.One represents the initial curvature due to the presence ofresidual stress from the sputtering/annealing steps. Thesecond term indicates the bimorph effect observed while
3
J. Micromech. Microeng. 20 (2010) 015039 T Kniknie et al
Figure 5. Temperature–stress graph of the NiTi coated siliconcantilever with length L = 250 um. The regions corresponding tofully transformed phases are indicated. Direction of the temperaturecycle is indicated with arrows.
changing the cantilever temperature. We use Timoshenko’sequation [2.1] to describe these two terms:
ρ = ρ0 +(αf − αs)(T − T0)
hs+hf
2 + 2(EsIs+Ef If )
hs+hf
(1
Eshsw+ 1
Ef hf w
) (2.4)
where αf and αs are respectively the thermal expansioncoefficient of the film and the cantilever, and w is the width ofthe cantilever. An initial curvature ρ0 at T = T0 models initialstress σ 0 in the film.
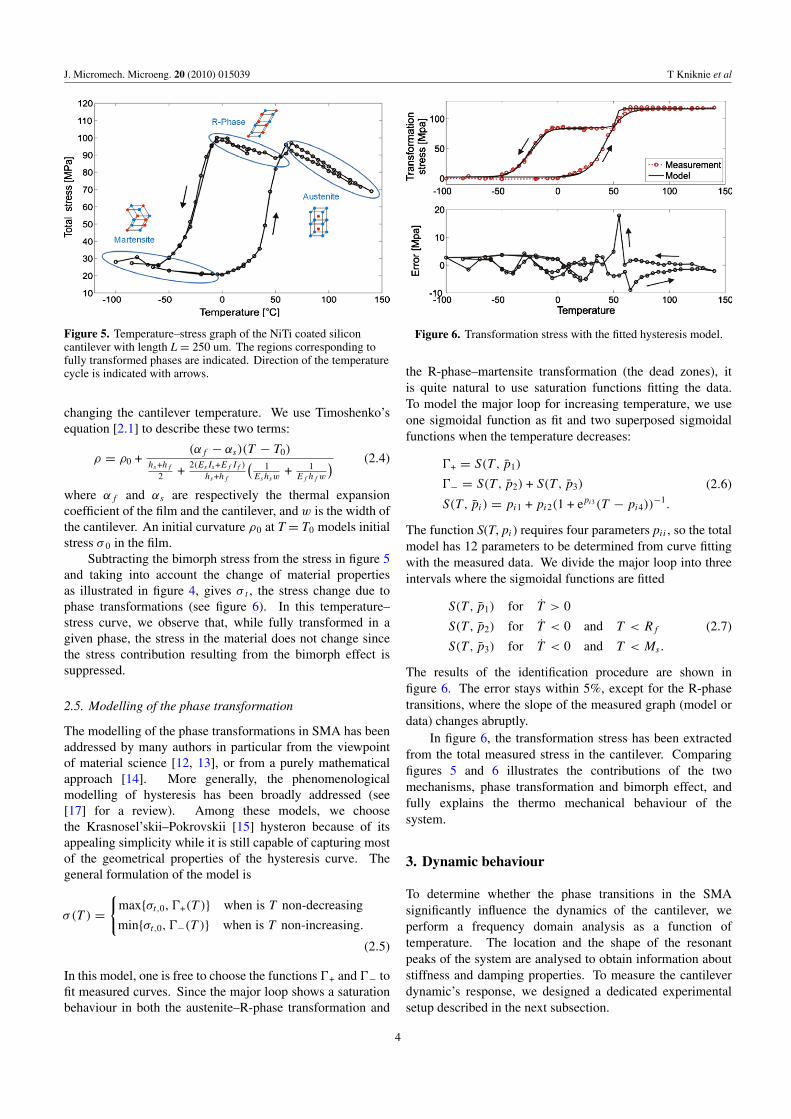
Subtracting the bimorph stress from the stress in figure 5and taking into account the change of material propertiesas illustrated in figure 4, gives σ t , the stress change due tophase transformations (see figure 6). In this temperature–stress curve, we observe that, while fully transformed in agiven phase, the stress in the material does not change sincethe stress contribution resulting from the bimorph effect issuppressed.
2.5. Modelling of the phase transformation
The modelling of the phase transformations in SMA has beenaddressed by many authors in particular from the viewpointof material science [12, 13], or from a purely mathematicalapproach [14]. More generally, the phenomenologicalmodelling of hysteresis has been broadly addressed (see[17] for a review). Among these models, we choosethe Krasnosel’skii–Pokrovskii [15] hysteron because of itsappealing simplicity while it is still capable of capturing mostof the geometrical properties of the hysteresis curve. Thegeneral formulation of the model is
σ(T ) ={
max{σt,0, �+(T )} when is T non-decreasing
min{σt,0, �−(T )} when is T non-increasing.
(2.5)
In this model, one is free to choose the functions �+ and �− tofit measured curves. Since the major loop shows a saturationbehaviour in both the austenite–R-phase transformation and
Figure 6. Transformation stress with the fitted hysteresis model.
the R-phase–martensite transformation (the dead zones), itis quite natural to use saturation functions fitting the data.To model the major loop for increasing temperature, we useone sigmoidal function as fit and two superposed sigmoidalfunctions when the temperature decreases:
�+ = S(T , p1)
�− = S(T , p2) + S(T , p3)
S(T , pi) = pi1 + pi2(1 + epi3(T − pi4))−1.
(2.6)
The function S(T, pi) requires four parameters pii , so the totalmodel has 12 parameters to be determined from curve fittingwith the measured data. We divide the major loop into threeintervals where the sigmoidal functions are fitted
S(T , p1) for T > 0
S(T , p2) for T < 0 and T < Rf
S(T , p3) for T < 0 and T < Ms.
(2.7)
The results of the identification procedure are shown infigure 6. The error stays within 5%, except for the R-phasetransitions, where the slope of the measured graph (model ordata) changes abruptly.
In figure 6, the transformation stress has been extractedfrom the total measured stress in the cantilever. Comparingfigures 5 and 6 illustrates the contributions of the twomechanisms, phase transformation and bimorph effect, andfully explains the thermo mechanical behaviour of thesystem.
3. Dynamic behaviour
To determine whether the phase transitions in the SMAsignificantly influence the dynamics of the cantilever, weperform a frequency domain analysis as a function oftemperature. The location and the shape of the resonantpeaks of the system are analysed to obtain information aboutstiffness and damping properties. To measure the cantileverdynamic’s response, we designed a dedicated experimentalsetup described in the next subsection.
4

J. Micromech. Microeng. 20 (2010) 015039 T Kniknie et al
Figure 7. Schematic representation of the measurement setup (top)and a picture of the excitation and heating stage for dynamicmeasurements (bottom). Schematic representation of the opticalmeasurement head, a laser detector grating unit (LDGU).
3.1. Experimental setup and procedure
The cantilevers are randomly excited by a piezoelectricelement while the cantilever beams are heated by passing anelectrical current through the SMA film. The tip vibrations arerecorded by an optical measurement system (further describedbelow) and compared to the input excitation. A schematicdrawing of the measurement setup and a picture of the realizedexcitation and heating stage are shown in figure 7.
The steel plate on which the silicon chip with cantileversis mounted is placed on a kinematic mount similar to thoseused in an AFM, and is coupled to the excitation stage by twoneodymium magnets.
The optical measurement system is based on a laserdetector grating unit (LDGU), schematically shown infigure 7. It consists of a laser, a diffraction grating, lensesand photodiodes. The system estimates how much thelaser beam is out of focus from the measured surface, bysubtracting and normalizing the diode signals. This techniquehas been extensively used for decades in compact-disc players.Although the measurement system is compact and simple, itprovides an accurate way for measuring small displacement athigh frequency.
We analyse the dynamic response of the cantilever asa function of the current passing through the SMA film.Ideally, it would be better to have a direct measurement
Figure 8. Calculated stress in the film as a function of temperatureand current. The left graph is a detailed measurement of thestress–temperature behaviour, as explained in section 2.2 and shownin figure 5. The right graph shows the same experimental data butwith resistive heating.
of the cantilever temperature; however, in practice this isvery difficult to implement due to the size of the micro-devices. Rather, we choose to calibrate the current responsewith respect to temperature using a heating/cooling stage tomodify the cantilever temperature in a controlled environment(figure 8). We observed a lack of repeatability in the currenttransformation curves (as can be seen in figure 8). Thisis due to some fluctuation in the contact resistance of thewire-bonds. (In our case, a four-point measurement (whichwould bypass this issue) could not be implemented due totechnical difficulties and spatial constraints.) Nevertheless, thecalibration curves illustrate quantitatively the direct relationbetween electrical current and temperature (as one mayexpect).
Starting at room temperature, the cantilever chip is excitedwith a random white noise signal. Two measurements ofthe dynamic response are recorded: the vibration amplitudesas a function of amplitude Hfixed(jω) at the fixed end ofthe cantilever and Hfree(jω) at the free end. The frequencyresponse function of the excitation signal to the dynamics of thecantilever is determined by dividing these two measurements:
Hcant = Hfree
Hfixed. (3.1)
This measurement is performed as a function of increasingcurrent through the film, i.e. indirectly, as a function ofincreasing temperature.
3.2. Experimental results
The vibration amplitude is measured as a function of frequencyand increasing current applied to the SMA film for severalcantilever lengths. We show the results for a 250 μm cantileverin figure 10 and for a 350 μm cantilever in figure 11. For the250 μm cantilever, the flexural resonance frequency is foundaround 37 kHz, as specified by the cantilever supplier. Weuse this value to estimate the frequency range of interest to
5

J. Micromech. Microeng. 20 (2010) 015039 T Kniknie et al
Figure 9. Frequency response functions of the NiTi coatedcantilever with length L = 250 μm. The amplitude is recorded forincreasing current, as indicated on the right-hand side axis. (Thegraphs related to a sharp transition are found for supplied currentbetween 190 and 225 mA.)
analyse the flexural dynamics of the coated cantilever. (For the350 μm cantilever, the frequency range of interest is estimatedaround 18 kHz.) Our setup only allows us to investigate thedynamics of the cantilever above room temperature. We startour experiments by heating up the cantilever so that the fullaustenite transformation occurs.
At low current levels, we see the first resonance peakin the figure decreasing for increasing currents (figure 9).The second peak around 41 kHz also decreases slightly.When the current is higher than 200 mA, a dramatic increaseof the first resonance peak occurs while the second peakfurther decreases. Above a certain current threshold (about200–210 mA in figure 9), the two resonance peaks merge at39 kHz resulting in a peak of higher amplitude.
In figure 10 we observe a similar behaviour but in alower frequency range. In this particular case, the two peaksgradually merge until the current reaches a certain threshold(about 200 mA). Around this threshold, we observed that thetwo peaks split and have lower amplitude.
3.3. Discussion/analysis
To explain the measured responses, we model the firstresonance frequency of the coated cantilever as a function oftemperature with a modified expression of the first resonanceflexural frequency of a cantilever beam [23]. The basicequation is
ω0 = λ2
2πL2
√E(T )I (T )
ρA(3.2)
with L the length, E the temperature-dependent averageYoung’s modulus of the bimorph cantilever, I the temperature-dependent second moment of area, ρ the density and A thecross-section of the beam. The dimensionless constant λ is thewave number, depending on the boundary conditions for which
Figure 10. Frequency response functions of the NiTi coatedcantilever with length L = 350 μm. The amplitude is recorded forincreasing current, as indicated on the right-hand side axis. (Thegraphs related to a sharp transition are found for supplied currentbetween 180 and 200 mA.)
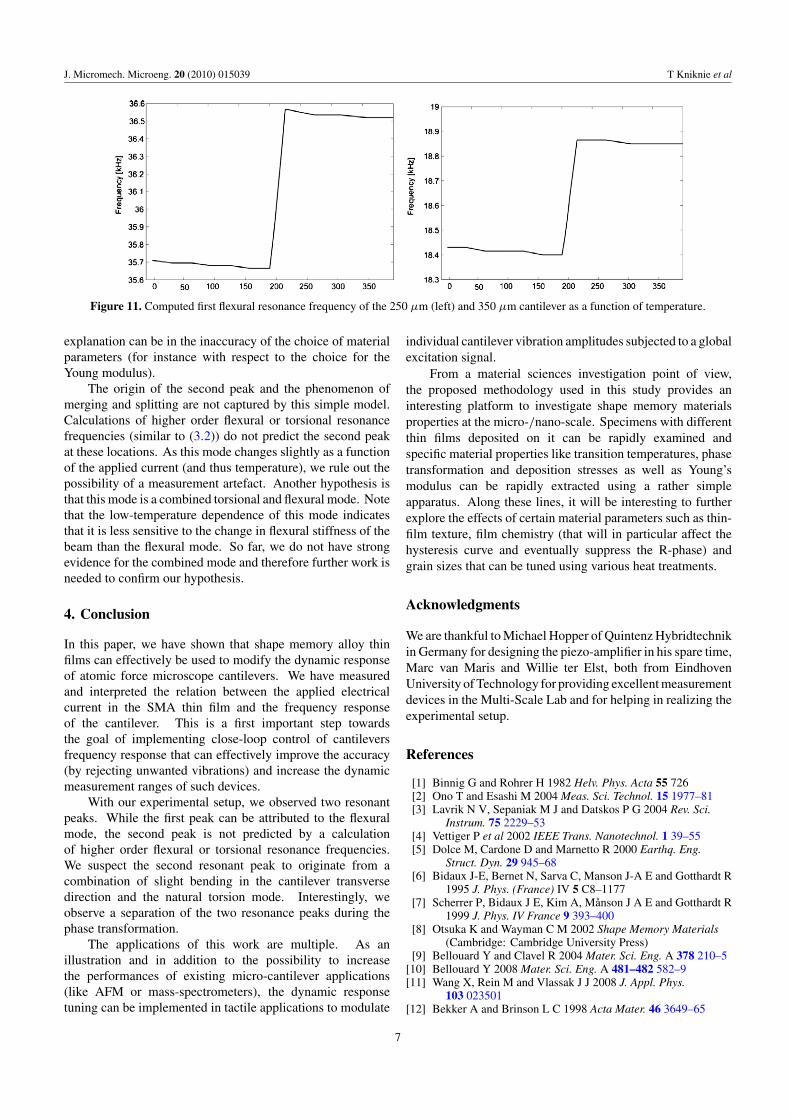
the resonance frequency is calculated [23]. For a cantileveredbeam λ = 1.875 104 07 for the first flexural resonancefrequency. As shown in the measurements in section 2.3,as one could expect from the model assumption, the Young’smodulus changes during phase transformation (according tofigure 4). The bimorph effect resulting from the CTE(coefficient of thermal expansion) mismatch between the SMAfilm and the silicon causes the curvature of the beam to changenot only along its length, but also in the transverse direction(i.e. the anticlastic curvature). Consequently, the secondmoment of inertia I of the beam changes during the phasetransformation. Including this dependence and using theparameters in table 1, we compute the first flexural resonancefrequencies as a function of temperature starting from roomtemperature. The results are shown in figure 11.
From the above figure, we note that the model predicts afrequency shift around 200 mA for the flexural mode calculatedaround 35.7 kHz (below 200 mA). In the experiments, weindeed found a resonance peak at a frequency of 37 kHz thatshifted to a higher level at 200 mA. The calculations showthat this mode decreases slightly at low temperatures whenthe bimorph effect changes the cross-section and thus thesecond moment of inertia of the beam. We note that the samebehaviour is observed experimentally for both cantilevers.After the phase transition from the R-phase to the austenitephase around 60◦, Young’s modulus of the SMA film increases,resulting in a larger flexural resonance frequency.
For the two cantilevers, there seems to be a goodagreement between the model and the experimentalobservations. We attribute this sharp change of resonantfrequency to the R-phase transformation. Indeed, we startedour experiments by heating up the cantilever so that the fullaustenite transformation occurs. The cantilever was then keptat room temperature preventing it from transforming to themartensite phase. We note that experimentally, the measuredchanges are more dramatic than the model predicts. A possible
6
J. Micromech. Microeng. 20 (2010) 015039 T Kniknie et al
Figure 11. Computed first flexural resonance frequency of the 250 μm (left) and 350 μm cantilever as a function of temperature.
explanation can be in the inaccuracy of the choice of materialparameters (for instance with respect to the choice for theYoung modulus).
The origin of the second peak and the phenomenon ofmerging and splitting are not captured by this simple model.Calculations of higher order flexural or torsional resonancefrequencies (similar to (3.2)) do not predict the second peakat these locations. As this mode changes slightly as a functionof the applied current (and thus temperature), we rule out thepossibility of a measurement artefact. Another hypothesis isthat this mode is a combined torsional and flexural mode. Notethat the low-temperature dependence of this mode indicatesthat it is less sensitive to the change in flexural stiffness of thebeam than the flexural mode. So far, we do not have strongevidence for the combined mode and therefore further work isneeded to confirm our hypothesis.
4. Conclusion
In this paper, we have shown that shape memory alloy thinfilms can effectively be used to modify the dynamic responseof atomic force microscope cantilevers. We have measuredand interpreted the relation between the applied electricalcurrent in the SMA thin film and the frequency responseof the cantilever. This is a first important step towardsthe goal of implementing close-loop control of cantileversfrequency response that can effectively improve the accuracy(by rejecting unwanted vibrations) and increase the dynamicmeasurement ranges of such devices.
With our experimental setup, we observed two resonantpeaks. While the first peak can be attributed to the flexuralmode, the second peak is not predicted by a calculationof higher order flexural or torsional resonance frequencies.We suspect the second resonant peak to originate from acombination of slight bending in the cantilever transversedirection and the natural torsion mode. Interestingly, weobserve a separation of the two resonance peaks during thephase transformation.
The applications of this work are multiple. As anillustration and in addition to the possibility to increasethe performances of existing micro-cantilever applications(like AFM or mass-spectrometers), the dynamic responsetuning can be implemented in tactile applications to modulate
individual cantilever vibration amplitudes subjected to a globalexcitation signal.
From a material sciences investigation point of view,the proposed methodology used in this study provides aninteresting platform to investigate shape memory materialsproperties at the micro-/nano-scale. Specimens with differentthin films deposited on it can be rapidly examined andspecific material properties like transition temperatures, phasetransformation and deposition stresses as well as Young’smodulus can be rapidly extracted using a rather simpleapparatus. Along these lines, it will be interesting to furtherexplore the effects of certain material parameters such as thin-film texture, film chemistry (that will in particular affect thehysteresis curve and eventually suppress the R-phase) andgrain sizes that can be tuned using various heat treatments.
Acknowledgments
We are thankful to Michael Hopper of Quintenz Hybridtechnikin Germany for designing the piezo-amplifier in his spare time,Marc van Maris and Willie ter Elst, both from EindhovenUniversity of Technology for providing excellent measurementdevices in the Multi-Scale Lab and for helping in realizing theexperimental setup.
References
[1] Binnig G and Rohrer H 1982 Helv. Phys. Acta 55 726[2] Ono T and Esashi M 2004 Meas. Sci. Technol. 15 1977–81[3] Lavrik N V, Sepaniak M J and Datskos P G 2004 Rev. Sci.
Instrum. 75 2229–53[4] Vettiger P et al 2002 IEEE Trans. Nanotechnol. 1 39–55[5] Dolce M, Cardone D and Marnetto R 2000 Earthq. Eng.
Struct. Dyn. 29 945–68[6] Bidaux J-E, Bernet N, Sarva C, Manson J-A E and Gotthardt R
1995 J. Phys. (France) IV 5 C8–1177[7] Scherrer P, Bidaux J E, Kim A, Månson J A E and Gotthardt R
1999 J. Phys. IV France 9 393–400[8] Otsuka K and Wayman C M 2002 Shape Memory Materials
(Cambridge: Cambridge University Press)[9] Bellouard Y and Clavel R 2004 Mater. Sci. Eng. A 378 210–5
[10] Bellouard Y 2008 Mater. Sci. Eng. A 481–482 582–9[11] Wang X, Rein M and Vlassak J J 2008 J. Appl. Phys.
103 023501[12] Bekker A and Brinson L C 1998 Acta Mater. 46 3649–65
7

J. Micromech. Microeng. 20 (2010) 015039 T Kniknie et al
[13] Boyd J G and Lagoudas D C 1996 Int. J. Plast. 12 805–42[14] Hughes D and Wen J T 1997 Smart Mater. Struct.
6 287–300[15] Krasnosel’skii M A and Pokrovskii A V 1989 Systems with
Hysteresis (Berlin: Springer)[16] MikroMasch http://www.spmtips.com consulted April 2007[17] Macki J W, Nistri P and Zecca P 1993 SIAM Rev.
35 94–123[18] Timoshenko S 1925 J. Opt. Soc. Am. 11 233–55
[19] Wortman J J and Evans R A 1965 J. Appl. Phys. 36 153–6[20] Wang X 2007 PhD Thesis Harvard University, Cambridge,
MA, USA[21] Wang X and Vlassak J J 2009 The effect of film thickness on
the martensitic transformation in equi-atomic NiTi thinfilms constrained by substrates submitted
[22] Wuttig M 2003 J. Alloys Compd. 355 108–12[23] Volterra E and Zachmanoglou E C 1965 Dynamics of
Vibrations (Columbus: Charles E. Merrill Books)
8