Embed Size (px)
Citation preview

One Focus: Customer Success
ANNUAL REPORT
TM
This report was printed by a WBENC-certified firm using agri-based inks on FSC®-certified paper.
Global Headquarters1 Ecolab Place, St. Paul, MN 55102www.ecolab.com 1 800 2 ECOLAB©2020 Ecolab USA Inc. All rights reserved. 55274/0800/0220
TM
REDUCE, RE-USE, RECYCLEIf you received multiple copies of this report, you may have duplicate investment accounts. Help save resources. Please contact your broker or the transfer agent to request assistance with consolidating any duplicate accounts.
All product names appearing in the text of this Annual Report are the trademarks, brand names, service marks or copyrights of Ecolab USA Inc. or affiliated Ecolab group companies.

A trusted partner at nearly three million commercial customer locations,
Ecolab Inc. is the global leader in water, hygiene and infection prevention
solutions and services. Ecolab’s more than 50,000 associates deliver
comprehensive solutions, data-driven insights and personalized service to
advance food safety, maintain clean and sanitized environments, optimize
water and energy use, and improve operational efficiencies and sustainability
for customers in the food, healthcare, hospitality, industrial and energy
markets in more than 170 countries.
From restaurants and hotels to refineries and manufacturing facilities,
Ecolab’s more than 27,500 sales-and-service associates, the industry’s largest
and best-trained direct sales-and-service force, help solve the most pressing
operational and sustainability challenges our customers face today. Many
of the world’s most recognizable brands rely on Ecolab to help ensure guest
satisfaction, product quality and brand reputation.
Ecolab is headquartered in St. Paul, Minn., and its common stock is listed
under the ticker symbol ECL on the New York Stock Exchange. For more
company information, visit www.ecolab.com, or call 1.800.2.ECOLAB.
Follow us on Twitter @ecolab, Facebook at facebook.com/ecolab,
Instagram at ecolab_inc. or LinkedIn at linkedin.com/company/ecolab.
FORWARD-LOOKING STATEMENTS AND RISK FACTORS
We refer readers to the company’s disclosure entitled “Forward-Looking
Statements and Risk Factors,” which begins on page 15 of the Form 10-K.
ECOLAB OVERVIEW
One focus: customer success
1.20
1.00
0.90
20182017 2019
1.10
1Q 2Q 3Q 4Q 1Q 2Q 3Q 4Q 1Q 2Q 3Q 4Q
EC
OL
AB
ST
OC
K P
RIC
E
EC
OL
AB
, S&
P 5
00
IN
DIC
ES
1.30
1.40
1.50
1.60
$90
$110
$100
$120
$130
$140
$150
$160
$170
$180
$190
$200
1.70
1.80
1.90
2.00
ECOLAB STOCK PRICE S&P 500 INDEXECOLAB INDEXECOLAB STOCK PERFORMANCE AND COMPARISON
HIGH LOW
2019
Q4 $199.43 $181.43
Q3 209.87 191.56
Q2 200.93 177.17
Q1 182.19 141.30
2018
Q4 $162.91 $135.77
Q3 159.92 138.65
Q2 150.46 132.79
Q1 140.50 125.74
2017
Q4 $137.96 $128.38
Q3 134.28 127.18
Q2 134.89 124.42
Q1 126.17 117.29
Ecolab Stock Performance
Board of directorsDOUGLAS M. BAKER, JR. Chairman of the Board and Chief Executive Officer of Ecolab Inc., Director since 2004, Safety, Health and Environment Committee
SHARI L. BALLARD Former Senior Executive Vice President and President, Multi-Channel Retail of Best Buy Co., Inc. (consumer electronics products and services retailer), Director since 2018, Audit and Safety, Health and Environment Committees
BARBARA J. BECK Executive Advisor to American Securities LLC (private equity firm), Director since 2008, Safety, Health and Environment* and Governance Committees
LESLIE S. BILLER Chief Executive Officer of Harborview Capital (private investment and consultive company), Director since 1997, Finance* and Compensation Committees
JEFFREY M. ETTINGER Retired Chairman of the Board of Hormel Foods Corporation (food products company), Director since 2015, Governance* and Compensation Committees and Lead Director
ARTHUR J. HIGGINS President and Chief Executive Officer of Assertio Therapeutics, Inc. (specialty pharmaceutical company), Director since 2010, Compensation and Safety, Health and Environment Committees
MICHAEL LARSON Chief investment officer to William H. Gates, III and Business Manager of Cascade Investment, L.L.C., Director since 2012, Finance and Safety, Health and Environment Committees
DAVID W. MACLENNAN Chairman and Chief Executive Officer of Cargill, Incorporated (food, agricultural, financial and industrial products and services company), Director since 2015, Audit and Governance Committees
TRACY B. MCKIBBEN Founder and Chief Executive Officer of MAC Energy Advisors LLC (consulting company for alternative energy and clean technology investments), Director since 2015, Audit and Finance Committees
LIONEL L. NOWELL, III Former Senior Vice President and Treasurer of PepsiCo, Inc. (food and beverage company), Director since 2018, Audit and Finance Committees
VICTORIA J. REICH Former Senior Vice President and Chief Financial Officer of Essendant Inc. (wholesale distributor of business products), Director since 2009, Audit* and Governance Committees
SUZANNE M. VAUTRINOT President of Kilovolt Consulting Inc. (consulting company for cyber security strategy and technology) and a retired Major General of the United States Air Force, Director since February 2014, Compensation and Finance Committees
JOHN J. ZILLMER Chief Executive Officer of Aramark (provider of food, facilities management and uniform services), Director since 2006, Compensation* and Governance Committees
*Denotes committee chair
Corporate officers
Communication with directorsStakeholders and other interested parties, including our investors and associates, with substantive matters requiring the attention of our board (e.g., governance issues or potential accounting, control or auditing irregularities) may use the contact information for our board located on our website at www.investor.ecolab.com/corporate-governance/contact-the-board.
Matters not requiring the direct attention of our board — such as employment inquiries, sales solicitations, questions about our products and other such matters — should be submitted to the company’s management at our Global Headquarters in St. Paul, Minn. In addition to online communication, interested parties may direct correspondence to our board at:
Ecolab Inc. Attn: Corporate Secretary 1 Ecolab Place St. Paul, MN 55102
ANIL ARCALGUD Executive Vice President and Chief Information Officer
DOUGLAS M. BAKER, JR. Chairman of the Board and Chief Executive Officer
CHRISTOPHE BECK President and Chief Operating Officer
LARRY L. BERGER Executive Vice President and Chief Technical Officer
DARRELL R. BROWN Executive Vice President and President — Global Industrial
DERIC D. BRYANT Executive Vice President and President — Upstream Energy
ANGELA M. BUSCH Executive Vice President — Corporate & Business Development
MACHIEL DUIJSER Executive Vice President and Chief Supply Chain Officer
ROBERTO INCHAUSTEGUI Executive Vice President — Growth Initiatives
SCOTT D. KIRKLAND Senior Vice President and Corporate Controller
KEVIN S. KRUMM Senior Vice President and Treasurer
LAURIE M. MARSH Executive Vice President — Human Resources
MICHAEL C. MCCORMICK Executive Vice President, General Counsel and Secretary
JUDY M. MCNAMARA Senior Vice President — Tax
TIMOTHY P. MULHERE Executive Vice President and President — Global Institutional & Specialty Services
JOANNE JIRIK MULLEN Chief Compliance Officer and Chief Employment Counsel
GAIL PETERSON Senior Vice President — Marketing & Communications
DANIEL J. SCHMECHEL Chief Financial Officer
ELIZABETH A. SIMERMEYER Executive Vice President and President — Healthcare and Life Sciences
JILL S. WYANT Executive Vice President and President — Global Regions
ECOLAB ANNUAL REPORT 20192

FINANCIALS
*This Annual Report includes certain non-GAAP financial measures. We refer readers to the company’s disclosure entitled “Non-GAAP Financial Measures,” which begins on page 48 of the Form 10-K.
MIDDLE EAST AND AFRICA
NORTH AMERICA
EUROPE
LATIN AMERICA
ASIA PACIFIC (INCL. GREATER CHINA)
SALES BY REGION 2019 (Percent of Total Sales)
19%
6%
12%
5%
58%
GLOBAL INSTITUTIONAL
GLOBAL INDUSTRIAL
GLOBAL ENERGY
OTHER
37%
BUSINESS MIX 2019 (Percent of Total Sales)
22%
6%
35%
2019 2018 2017 2019 2018
Net Sales $14,906.3 $14,668.2 $13,835.9 2% 6%
Net Income Attributable to Ecolab $1,558.9 $1,429.1 $1,504.6 9% (5)%
Net Income as a Percent of Sales 10.5% 9.7% 10.9% - -
Diluted Earnings per Share 5.33 4.88 5.12 9% (5)%
Adjusted Diluted Earnings per Share (non-GAAP measure) 5.82 5.25 4.68 11% 12%
Diluted Weighted-Average Common Shares Outstanding 292.5 292.8 294.0 0% 0%
Cash Dividends Declared per Common Share 1.85 1.69 1.52 9% 11%
Cash Provided by Operating Activities 2,420.7 2,277.7 2,091.3 6% 9%
Capital Expenditures 800.6 847.1 868.6 (5)% (2)%
Ecolab Shareholders’ Equity 8,685.3 8,003.2 7,583.6 9% 6%
Return to Beginning Equity 19.5% 18.8% 21.9% - -
Total Debt 6,354.1 7,045.2 7,322.7 (10)% (4)%
Total Debt to Capitalization 42.1% 46.7% 48.9% - -
Total Assets $20,869.1 $20,074.5 $19,963.5 4% 1%
SUMMARY MILLIONS, EXCEPT PER SHARE
ECOLAB ANNUAL REPORT 2019 3

A stronger, more focused company
Helping customers achieve the best results at the lowest total cost and
environmental impact.
2019 was a great end to a great decade. In both time periods, we performed well while building our future capabilities, and most importantly, continued to be a company that makes a meaningful difference in the world.
The last 10 years were an amazing period of success for us. We
grew sales to $15 billion from $6 billion and continued to invest
in our people, our infrastructure and in digital technology. Our
number of active patents tripled to more than 10,000, as we
kept innovating to meet changing customer needs. We expanded
our capabilities through more than 70 strategic acquisitions,
including our biggest — our 2011 merger with Nalco — which made
us the leader in water
management. We also
entered the life sciences
industry, grew our
healthcare capabilities,
globalized our businesses,
exited non-core businesses
and increased our customer
base and service coverage
around the world.
Along the way, we evolved into a global sustainability leader,
partnering with our customers to help them achieve their
sustainability goals by delivering solutions that use less water
and energy and reduce waste.
Most importantly, we refined our principles for delivering value:
• Helping our customers achieve the best results at the lowest
total cost and environmental impact.
• Achieving strong financial results for our shareholders while
continuing to invest in our future.
• Supporting economic growth and positive environmental and
social outcomes in our communities.
Abiding by these principles requires that we continually learn,
invest, adapt and persevere. 2019 is a good example of our
principles in action as we continued to deliver value to our
key stakeholders.
A LETTER FROM ECOLAB’S CHAIRMAN AND CHIEF EXECUTIVE OFFICER
INVESTING IN INNOVATION TO MEET EMERGING CUSTOMER NEEDS
Although the way we serve our customers continued to evolve
in 2019, the fundamental value we deliver hasn’t changed:
helping them achieve both their operational objectives and their
sustainability goals. Increasingly, that means bringing predictive
analytics and greater insights into their operations.
Our pervasive presence in
customer operations today
and the on-site presence
of our sales-and-service
force provide us a powerful
early-mover advantage that
we intend to leverage by
integrating digital solutions
into all of our divisions.
Some recent examples include:
• Our SMARTPOWER™ warewashing program delivers excellent
cleaning results, reduces labor, water and energy costs for our
institutional customers, and gives our sales-and-service team
access to data anywhere, any time – making it much easier to
proactively solve issues.
• In Healthcare, we’ve added digital dashboards to provide
greater visibility, measurement and analysis of current
hygiene practices, including predictive analytics to help
forecast and reduce healthcare-acquired infections.
• KAY® PROTECT automates food safety checklists at
quick-service restaurants and integrates data across resources
such as food safety audits, health department inspections,
and cleaning and sanitation product use. This streamlines
complex restaurant processes and protects against unique
sanitation challenges, while speeding operations and
improving data visibility and accuracy.
4

Achieving strong financial results for our shareholders while continuing to invest
in our future.
INCREASING THE GROWTH POTENTIAL FOR OUR UPSTREAM ENERGY BUSINESS
Tightening the focus on our core businesses increases our ability
to deliver value for our shareholders. In early 2019, we announced
our intention to spin off our upstream energy services business
(ChampionX) into a stand-alone company that would operate
separately from Ecolab. In December, we announced that once we
separate ChampionX from Ecolab, the business will immediately
merge with Apergy, a publicly held oilfield technology company.
The merger will create a public company with $3.5 billion in annual
revenue and more than 8,000 employees, pairing Apergy’s drilling
and artificial lift technology and ChampionX’s chemistry solutions
to better serve global oil and gas customers. This merger creates
a strong company with increased growth potential. We anticipate
that this process will be completed by the end of the second
quarter 2020.
ENABLING EXCEPTIONAL LEADERSHIP TO FOCUS ON OPPORTUNITY
This past year, we began evolving our organizational structure to
align resources with opportunity, focusing on three mega-markets
(North America, Western
Europe and Greater China)
and transitioning to a
market-based operating
mode in our other regions.
To bring businesses
together that share common
dynamics and serve similar
customer segments, we are
transitioning our global businesses into three groups: Industrial,
Institutional and Global Healthcare and Life Sciences, led by
Darrell Brown, Tim Mulhere and Beth Simermeyer, respectively.
All three bring exceptional leadership to these important roles.
Ecolab’s continued success over time has been driven by many
great leaders. One of the very best was Tom Handley, who
retired from the company in 2019. Tom joined Ecolab in 2003
and successfully filled a number of key roles for us, most recently
serving as our president and chief operating officer. Tom’s
contributions have been an important part of our success and will
have lasting impact, particularly his work to develop leaders, drive
diversity and support innovation. We thank him for his dedication.
Christophe Beck succeeded Tom as our president and chief
operating officer. Christophe joined Ecolab in 2007 and has
performed exceptionally well in multiple roles leading to this new
position, bringing great energy, innovative thinking and excellent
execution capabilities to every opportunity. Prior assignments
included service as executive vice president and president of both
our Water and Institutional businesses, running our international
regions, managing the integration of the Nalco acquisition and
leading our corporate marketing and strategy. We are confident he
will lead the broader business with the same passion, commitment
and results focus as he has in each of his prior leadership roles.
Also in 2019, Mike Hickey announced his intention to retire at
the end of February 2020, serving most recently as executive
vice president and president of our Global Institutional business.
Mike served this company for 35 years and was key to building
our corporate account sales capabilities globally, driving our
Institutional business growth and leadership as well a having a
huge impact on our leadership pipeline through his formal and
informal mentorship.
Each new generation of leaders brings new vision and new energy
to drive our growth. I’m confident that we have the right people
in the right places today to guide and develop our global team to
achieve our full potential in the years to come.
WELL POSITIONED TO ACHIEVE OUR PURPOSE
We enter the new year and decade a stronger, more focused
company. A company with huge potential to make a difference
at a time when our customers need what we have to offer more
than ever.
As I write this letter, the COVID-19 pandemic is expanding around
the world. I am proud of the way our team has stepped up to help
control the spread of this
virus. As circumstances
continue to evolve, I am
confident in our ability to
help our customers and our
communities successfully
manage through the
coronavirus pandemic.
Coronavirus is today’s
issue, and we know there
will be new problems to solve in the future. The world will continue
to change and so will we – finding better ways to do our work,
developing new capabilities and helping our customers thrive
through what is sure to be a dynamic decade. We’ll stay true to our
core business principles as we move into the future, investing in
our future while delivering for our customers, our shareholders and
our communities. I’m looking forward to all that we will accomplish
in the decade ahead.
SINCERELY,
Douglas M. Baker, Jr. CHAIRMAN AND CHIEF EXECUTIVE OFFICER
ECOLAB ANNUAL REPORT 2019 5

2019 FINANCIAL HIGHLIGHTS
$14.9 Billion
Net Sales
+2%
Diluted Earnings
$5.33 per share reported
$5.82 per share adjusted
+11%
$2.4 Billion
Cash Flow From Operations
+6%
$2.0 Billion
Operating Income
+3%
$1.85
Cash Dividends Declared per Common Share
+9%
$192.99
Year-End Share Price
+31%
adjusted
6

Through millions of customer visits throughout the world and
billions of data points collected through our digital solutions, we
gain unmatched insight into the challenges and opportunities
businesses face today and will face in the future.
OUR APPROACH TO INNOVATION
Our team of 1,600 scientists, engineers and technical specialists
use these insights to develop best-in-class solutions that meet
the unique needs of our customers. With expertise in our core
technologies, including antimicrobials, dispensing and monitoring,
personal and environmental hygiene, polymers, surfactants, solid
chemistry, water management and data analytics, we help improve
operational efficiency, product quality, safety, sustainability and
guest satisfaction for our customers.
Technology, insights and service
We serve nearly three million customer locations in more than 40 industries, and our approach is consistent throughout the world: we combine best-in-class technologies, data-driven insights and personalized service to deliver the best results at the lowest total cost to customers to help them succeed. Our industry-leading approach affords us a competitive advantage that cannot be matched.
THE ECOLAB APPROACH
With more than 100 innovations introduced to our customers, Ecolab’s 2019 innovation pipeline is projected to deliver more than $1.3 billion in annual revenue in five years and is our sixth consecutive innovation pipeline of $1 billion or more.
AT A GLANCE
Best results at the lowest
total cost
Best-in-Class Technologies
World-Class Personalized
Service
Data- Driven
Insights
50,000+associates
27,500 sales-and-service
associates
1,600 scientists, engineers and
technical specialists
10,000+ patents
ECOLAB ANNUAL REPORT 2019 7

CORPORATE RESPONSIBILITY
STRENGTHENING OUR COMMUNITIES
We support educational programs and charitable and civic
organizations in the communities where we do business
through grants to nonprofit organizations, in-kind product
donations and employee volunteerism.
In 2019, the total impact of our community giving was
$13 million, including $9 million provided by the Ecolab Foundation and donations of more than $1.7 million of cleaning and sanitizing products in support of disaster
relief efforts globally. Through our global giving program,
Solutions for Life, which enhances our mission to conserve
water and improve hygiene around the world, we reached
more than 8 million people with the Clean and Conserve
Education Program co-developed with Project WET, and we
continued efforts with The Nature Conservancy to protect
water sources in China, Mexico and the United States. Ecolab is recognized as a leading environmental, social
and governance (ESG) company for our commitment to
delivering the right results in the right way. We are focused
on operating safely and sustainably. We believe that a
diverse and inclusive workforce is critical to our success.
We abide by a strict code of conduct that guides our daily
actions. And we strive to enrich our communities.
We know that to achieve our work to make the world cleaner, safer and healthier, we need to operate ethically, responsibly and sustainably. The work we do matters, and the way we do it matters to our associates, customers, investors and the communities in which we and our customers operate.
A leader in corporate responsibility
8

Sustainability is core to our successWe are focused on continuous improvement within our own operations and to delivering sustainable solutions that help companies around the world achieve business results while minimizing environmental and social impact. And by the nature of our work, we are addressing some of the world’s most pressing sustainability challenges, including water scarcity and climate change.
SUSTAINABILITY
OUR SUSTAINABILITY GOALS
Within our own operations, we are working to reduce water withdrawals by 25%* and greenhouse gas emissions by 10%*
by the end of 2020. Building on steady efficiency gains, and
through a renewable power agreement with Clearway and its
Mesquite Star wind farm that will cover 100% of our annual U.S. energy use, we are set to surpass our greenhouse gas
emissions goal.
We also signed on to the Business Ambition for 1.5°C, a growing
group of companies pledging to do their part in decarbonizing
the economy. By joining, we are committing to reducing our carbon emissions by 50% by 2030 and to net-zero by 2050,
and working with our suppliers and customers to do the same.
As we sunset our 2020 public water withdrawal and greenhouse
gas emissions goals, we will announce new, long-term sustainability
goals in June 2020. We will be extending these goals beyond our
operational footprint to include our customers and suppliers.
We’re also helping to move the world closer to the ambition of
UN Sustainable Development Goal 6, promoting clean water
and sanitation. We do this in ways big and small, from providing
more water- and energy-efficient dishmachines to restaurants to
implementing our latest solutions to reduce water use for steel
mills, car manufacturers and power plants.
More information on Ecolab’s sustainability initiatives, including the complete Global Reporting Initiative’s (GRI) Index, are available at www.Ecolab.com/Sustainability.
Conserve
206 billiongallons of water
Reduce energy use
by more than
28 trillionBTUs
Avoid
1.5 millionmetric tonnes of
greenhouse gas emissions
Eliminate
113 millionpounds of waste
IN 2019, WE HELPED OUR CUSTOMERS:
We are well on our way to surpass our 2030 water impact goal of
conserving 300 billion gallons of water annually within our own
and our customers’ operations, equivalent to the annual drinking
water needs of more than 1 billion people.
* Percentage change from 2015 baseline, measured by intensity per million dollars in sales.
ECOLAB ANNUAL REPORT 2019 9

ECOLAB IN ACTION
One focus: customer success
Rotana has more than 100 stunning hotels in the Middle East, Africa, Eastern Europe and Turkey, and is a widely recognized and admired brand all over the world. Rotana is committed to delivering the best service and a perfect guest experience by providing impeccable environments and services.
Rotana takes a holistic approach to sustainability and partnered with Ecolab to help ensure excellence in many areas, from the kitchen, housekeeping and laundry, to pool and spa, and water solutions.
Helping Rotana improve efficiency and sustainability
EFFECTIVE SOLUTIONS
Ecolab partnered with Rotana to implement Ecolab’s advanced
warewashing program, which utilizes solid detergents that
eliminate the need for hard plastic packaging. This technology
reduces packaging waste by 80% and the solid chemistry is
safer for hotel staff to handle compared to liquid detergents.
In their on-premise laundry operations, Ecolab’s technology
enabled Rotana to clean towels and linens using less water and at
a lower temperature while maintaining high levels of cleanliness,
which has traditionally only been achieved in high-temperature
wash processes. Ecolab’s technology consistently delivers
superior clean, white, soft and fresh results. It also reduces
wash cycle times, which helps to increase the reuse lifespan
of linen by up to 20 percent.
THE RESULTS
By partnering with Ecolab, Rotana was able to:
• Reduce storage requirements
by 30%.
• Reduce utility costs by 10%
at its properties.
• Reduce water usage by more
than 65,000 cubic meters,
equivalent to the annual
drinking water needs of
over 248,000 people.
• Reduce energy consumption
by approximately 2.9 million
kilowatt hours, equivalent
to more than 260 million
smartphones charged.
10

Mondelez International is a leading global confectionery, food and beverage company with a broad brand portfolio, including Belvita, Nabisco, Ritz, Triscuit, Milka, Toblerone, Cadbury, Freia and Trident.
Mondelez International’s mission is to lead the future of snacking around the world by offering the right snack, for the right moment, made the right way. That means delivering a broader range of high-quality snacks, made with sustainable ingredients and packaging that consumers can feel good about.
Ecolab’s partnership with Mondelez spans more than 120 plants around the world. The Mondelez Burg El Arab plant in water-stressed Egypt holds a leading position among Mondelez plants in gum and candy production, supplying more than 20 countries.
Helping Mondelez achieve operating goals
SOLUTIONS TO MEET AGGRESSIVE ENVIRONMENTAL STANDARDS
To comply with government regulations and the company’s high
environmental standards, the Burg El Arab plant needed a solution
for their wastewater discharge as part of a larger plant upgrade.
Mondelez plant managers worked closely with Ecolab to identify
solutions and help optimize overall plant performance.
The project consisted of various changes to the plant’s layout
and the installation of several sustainable technologies to treat
wastewater and achieve significant water savings, including a
Dissolved Air Flotation Unit (DAF).
The solutions utilized by Ecolab’s field experts are enabling
the implementation of water recycle projects that can achieve
water savings of up to 40%, and reduce the plant’s total cost
of operation.
THE RESULTS
Ecolab is helping the Mondelez Burg El Arab Plant:
• The DAF unit installation is
reducing chemical oxygen
demand (COD) from 35,000
to 400 mg/liter, well within
the environmental limit of
1,100 mg/liter.
• Ecolab is now working with
Mondelez to completely
reuse the treated wastewater
within the plant’s cooling
towers to reduce freshwater
consumption by up to
40% and reduce the total
cost of operation.
ECOLAB ANNUAL REPORT 2019 11

We work to generate strong results for our customers and our company, and do so with a commitment to integrity, innovation, sustainability and social responsibility. We drive the right results, the right way and in 2019, received recognition from a number of leading organizations for our commitment to operating responsibly.
AWARDS & RECOGNITION
A LEADING ESG COMPANY
For the fifth consecutive year, Ecolab was named to the FTSE4Good Index, which recognizes companies for demonstrating strong environmental, social and governance practices.
A BEST CORPORATE CITIZEN
Ecolab ranked 8th on Corporate Responsibility Magazine’s list of the Best Corporate Citizens.
AN INCLUSIVE COMPANY
Ecolab ranked in the top 10% on Diversity Best Practices Inclusion Index.
A MOST SUSTAINABLE CORPORATION
Ecolab was named to Corporate Knight’s Global 100 list of the World’s Most Sustainable Corporations.
A BEST EMPLOYER FOR WOMEN
For the second consecutive year, Ecolab was named to Forbes’ list of the Best Employers for Women.
A BEST PLACE TO WORK
Ecolab was again named a Best Place to Work for LGBT Equality by the Human Rights Coalition for its perfect score on the Corporate Equality Index.
A BEST EMPLOYER FOR DIVERSITY
For the second consecutive year, Ecolab was named to Forbes’ list of the Best Employers for Diversity.
A BEST COMPANY TO SELL FOR
Ecolab was again recognized as a Best Company to Sell For by Selling Power Magazine.
A LEADING SUSTAINABLE COMPANY
Ecolab was named to the Dow Jones Sustainability Indices North America Index.
A WORLD’S MOST ADMIRED COMPANY
Ecolab was again named to Fortune’s list of the World’s Most Admired Companies, ranking second in the chemicals industry.
A WORLD’S MOST ETHICAL COMPANY
For the 13th consecutive year, Ecolab was named to Ethisphere Institute’s list of the World’s Most Ethical Companies.
A MOST SUSTAINABLE COMPANY
Ecolab ranked 26th on Barron’s 2019 list of the 100 Most Sustainable Companies.
Delivering results the right way
12

UNITED STATES SECURITIES AND EXCHANGE COMMISSION
Washington, D.C. 20549
FORM 10-K
☒ ANNUAL REPORT PURSUANT TO SECTION 13 OR 15(d) OF THE SECURITIES EXCHANGE ACT OF 1934
For the fiscal year ended December 31, 2019 OR
☐ TRANSITION REPORT PURSUANT TO SECTION 13 OR 15(d) OF THE SECURITIES EXCHANGE ACT OF 1934 For the transition period from to Commission File No. 1-9328
ECOLAB INC. (Exact name of registrant as specified in its charter)
Delaware 41-0231510 (State or other jurisdiction of incorporation or organization)
(I.R.S. Employer Identification No.)
1 Ecolab Place, St. Paul, Minnesota 55102
(Address of principal executive offices) (Zip Code)
Registrant’s telephone number, including area code: 1-800-232-6522
Securities registered pursuant to Section 12(b) of the Act:
Title of each class Trading symbol(s) Name of each exchange on which registered Common Stock, $1.00 par value
2.625% Euro Notes due 2025 1.000% Euro Notes due 2024
ECL ECL 25 ECL 24
New York Stock Exchange New York Stock Exchange New York Stock Exchange
Securities registered pursuant to Section 12(g) of the Act: None
Indicate by check mark if the registrant is a well-known seasoned issuer, as defined in Rule 405 of the Securities Act. Yes No
Indicate by check mark if the registrant is not required to file reports pursuant to Section 13 or Section 15(d) of the Act. Yes No
Indicate by check mark whether the registrant (1) has filed all reports required to be filed by Section 13 or 15(d) of the Securities Exchange Act of 1934 during the preceding 12 months (or for such shorter period that the registrant was required to file such reports), and (2) has been subject to such filing requirements for the past 90 days. Yes No
Indicate by check mark whether the registrant has submitted electronically every Interactive Data File required to be submitted pursuant to Rule 405 of Regulation S-T (§232.405 of this chapter) during the preceding 12 months (or for such shorter period that the registrant was required to submit such files. Yes No
Indicate by check mark whether the registrant is a large accelerated filer, an accelerated filer, a non-accelerated filer, a smaller reporting company, or an emerging growth company. See the definitions of “large accelerated filer,” “accelerated filer,” “smaller reporting company,” and “emerging growth company” in Rule 12b-2 of the Exchange Act.
Large accelerated filer ☒ Accelerated filer ☐ Non-accelerated filer ☐ Smaller reporting company ☐ Emerging growth company ☐
If an emerging growth company, indicate by check mark if the registrant has elected not to use the extended transition period for complying with any new or revised financial accounting standards provided pursuant to Section 13(a) of the Exchange Act. ☐
Indicate by check mark whether the registrant is a shell Company (as defined in Rule 12b-2 of the Exchange Act). ☐ YES ☒ NO
Aggregate market value of voting and non-voting common equity held by non-affiliates of registrant on June 28, 2019, the last business day of the Registrant’s most recently completed second fiscal quarter: $56,547,973,473 (see Item 12, under Part III hereof), based on a closing price of registrant’s Common Stock of $197.44 per share.
The number of shares of registrant’s Common Stock, par value $1.00 per share, outstanding as of January 31, 2020: 288,166,440 shares.
DOCUMENTS INCORPORATED BY REFERENCE
Portions of the registrant’s Proxy Statement for the Annual Meeting of Stockholders to be held May 7, 2020, and to be filed within 120 days after the registrant’s fiscal year ended December 31, 2019 (hereinafter referred to as “Proxy Statement”), are incorporated by reference into Part III.

2
ECOLAB INC. FORM 10-K
For the Year Ended December 31, 2019
TABLE OF CONTENTS Beginning
Page PART I Item 1. Business. 3 Item 1A. Risk Factors. 16 Item 1B. Unresolved Staff Comments. 21 Item 2. Properties. 21 Item 3. Legal Proceedings. 23 Item 4. Mine Safety Disclosures. 23 PART II Item 5. Market for Registrant’s Common Equity, Related Stockholder Matters and Issuer Purchases of
Equity Securities.
23
Item 6. Selected Financial Data. 24 Item 7. Management’s Discussion and Analysis of Financial Condition and Results of Operations. 25 Item 7A. Quantitative and Qualitative Disclosures about Market Risk. 48 Item 8. Financial Statements and Supplementary Data. 49 Item 9. Changes in and Disagreements with Accountants on Accounting and Financial Disclosure. 99 Item 9A. Controls and Procedures. 99 Item 9B. Other Information. 99 PART III Item 10. Directors, Executive Officers and Corporate Governance. 100 Item 11. Executive Compensation. 100 Item 12. Security Ownership of Certain Beneficial Owners and Management and Related Stockholder
Matters.
101
Item 13. Certain Relationships and Related Transactions, and Director Independence. 101 Item 14. Principal Accounting Fees and Services. 101 PART IV Item 15. Exhibits, Financial Statement Schedules. 102 Item 16. Form 10-K Summary. 108

3
PART I Except where the context otherwise requires, references in this Form 10-K to (i) “Ecolab,” “Company,” “we” and “our” are to Ecolab Inc. and its subsidiaries, collectively; (ii) “Nalco” are to Nalco Company LLC, a wholly-owned subsidiary of the Company; (iii) “Nalco transaction” are to the merger of Ecolab and Nalco Holding Company completed in December 2011; and (iv) “Champion transaction” are to our acquisition of privately held Champion Technologies and its related company Corsicana Technologies in April 2013. Item 1. Business. General Development of Business. Ecolab was incorporated as a Delaware corporation in 1924. Our fiscal year is the calendar year ending December 31. International subsidiaries are included in the consolidated financial statements on the basis of their U.S. GAAP (accounting principles generally accepted in the United States of America) November 30 fiscal year-ends to facilitate the timely inclusion of such entities in our consolidated financial reporting. On December 18, 2019, we entered into definitive agreements with ChampionX Holding Inc., a wholly owned subsidiary of Ecolab (ChampionX), and Apergy Corporation (Apergy) pursuant to which we will separate the Upstream Energy business of our Global Energy segment and combine it with Apergy in a tax-efficient reverse Morris Trust transaction. Subject to the terms and conditions of those agreements, we will transfer the Upstream Energy business of our Global Energy segment to ChampionX, after which, we will distribute by means of a split-off all of the issued and outstanding shares of common stock of ChampionX held by Ecolab, and immediately after the distribution of ChampionX common stock, a wholly owned subsidiary of Apergy will merge with and into ChampionX, with ChampionX surviving as a wholly owned subsidiary of Apergy and the shares of ChampionX common stock being converted into shares of Apergy common stock. Upon completion of the merger, ChampionX’s stockholders will receive approximately 62% of the outstanding common stock of Apergy on a fully diluted basis. Completion of the transactions is subject to the satisfaction or waiver of customary closing conditions, including approval by Apergy’s stockholders, approval by certain foreign regulatory authorities and receipt of opinions with respect to the tax-free nature of the transactions. We continued to invest in and build our business through various acquisitions that complement our strategic vision. See Part II, Item 8, Note 4 of this Form 10-K for additional information about the acquisitions and divestitures of the Company. Narrative Description of Business. General With 2019 sales of $14.9 billion, we believe we are the global leader in water, hygiene and energy technologies and services that protect people and vital resources. We deliver comprehensive programs, products and services to promote safe food, maintain clean environments, optimize water and energy use, and develop and improve operating efficiencies for customers in the food, healthcare, energy, hospitality and industrial markets in more than 170 countries around the world. Our cleaning and sanitizing programs and products, and pest elimination services, support customers in the foodservice, food and beverage processing, hospitality, healthcare, government and education, retail, textile care and commercial facilities management sectors. Our products and technologies are also used in water treatment, pollution control, energy conservation, oil production and refining, primary metals manufacturing, papermaking, mining and other industrial processes. We pursue a “Circle the Customer – Circle the Globe” strategy by providing an array of innovative programs, products and services designed to meet the specific operational and sustainability needs of our customers throughout the world. Through this strategy and our varied product and service mix, one customer may utilize the offerings of several of our operating segments. Important in our business proposition for customers is our ability to produce improved results while reducing their water and energy use. With that in mind, we focus on continually innovating to optimize both our own operations and the solutions we provide to customers, aligning with our corporate strategy to address some of the world’s most pressing and complex sustainability challenges such as water scarcity and climate change. The work we do matters, and the way we do it matters to our employees, customers, investors and the communities in which we and our customers operate. Sustainability is core to our business strategy. We deliver sustainable solutions that help companies around the world achieve their business goals while reducing environmental impacts. We partner with customers at approximately three million customer locations around the world to reduce water, energy and greenhouse gas emissions through our high-efficiency solutions in cleaning and sanitation, water, paper and energy services. By partnering with our customers to help them do more with less through the use of our innovative and differentiated solutions, we aim to help our customers conserve more than 300 billion gallons of water annually by 2030. Last year, we helped our customers conserve more than 190 billion gallons of water and avoid more than 1.2 million tons of greenhouse gas emissions. The following description of our business is based upon our reportable segments as reported in our consolidated financial statements for the year ended December 31, 2019, which are located in Item 8 of Part II of this Form 10-K. Operating segments that share similar economic characteristics and future prospects, nature of the products and production processes, end-use markets, channels of distribution and regulatory environment have been aggregated into three reportable segments: Global Industrial, Global Institutional and Global Energy. Operating segments that were not aggregated and do not exceed the quantitative criteria to be separately reported have been combined into Other. We provide similar information for Other as compared to our three reportable segments as we consider the information regarding its underlying operating segments as useful in understanding our consolidated results.
4
Global Industrial This reportable segment consists of the Water, Food & Beverage, Paper, Life Sciences and Textile Care operating segments, which provide water treatment and process applications, and cleaning and sanitizing solutions, primarily to large industrial customers within the manufacturing, food and beverage processing, transportation, chemical, primary metals and mining, power generation, pulp and paper, pharmaceutical and commercial laundry industries. The underlying operating segments exhibit similar manufacturing processes, distribution methods and economic characteristics. Descriptions of the five operating segments which comprise our Global Industrial reportable segment follow below. Water Water serves customers across industrial and institutional markets. Within Water, our light industry markets include food and beverage, manufacturing and transportation, and institutional clients including commercial buildings, hospitals, universities and hotels. Heavy industries served include power, chemicals and primary metals and mining. Water provides water treatment products and water technologies programs for cooling water, waste water, boiler water and process water applications. Our cooling water treatment programs are designed to control challenges associated with cooling water systems — corrosion, scale and microbial fouling and contamination — in open recirculating, once-through and closed systems. Our wastewater products and programs focus on improving overall plant economics, addressing compliance issues, optimizing equipment efficiency and improving operator capabilities and effectiveness. We provide integrated chemical solutions, process improvements and mechanical component modifications to optimize boiler performance and control corrosion and scale build-up. Our programs assist in the use of water for plant processes by optimizing the performance of treatment chemicals and equipment in order to minimize costs and maximize returns on investment. Our offerings include specialty products such as scale and corrosion inhibitors, antifoulants, pre-treatment solutions, membrane treatments, coagulants and flocculants, and anti-foamers, as well as our 3D TRASARTM technology, which combines chemistry, remote services and monitoring and control. We provide products and programs for water treatment and process applications aimed at combining environmental benefits with economic gains for our customers. Typically, water savings, energy savings, and operating efficiency are among our primary sources of value creation for our customers, with product quality and production enhancement improvements also providing key differentiating features for many of our offerings. Our offerings are sold primarily by our corporate account and field sales employees. We believe we are one of the leading global suppliers of products and programs for chemical applications within the industrial water treatment industry. Food & Beverage Food & Beverage addresses cleaning and sanitation to facilitate the processing of products for human consumption. Food & Beverage provides detergents, cleaners, sanitizers, lubricants and animal health products, as well as cleaning systems, electronic dispensers and chemical injectors for the application of chemical products, primarily to dairy plants, dairy farms, breweries, soft-drink bottling plants, and meat, poultry and other food processors. Food & Beverage is also a leading developer and marketer of antimicrobial products used in direct contact with meat, poultry, seafood and produce during processing in order to reduce microbial contamination. Food & Beverage also designs, engineers and installs CIP (“clean-in-place”) process control systems and facility cleaning systems for its customer base. Water savings, energy savings, and operating efficiency are among our sources of value creation for our customers. Products for use in processing facilities are sold primarily by our corporate account and field sales employees, while products for use on farms are sold through dealers and independent, third-party distributors. We believe we are one of the leading global suppliers of cleaning and sanitizing products to the dairy plant, dairy farm, food, meat and poultry, and beverage/brewery processor industries. Paper Paper provides water and process applications for the pulp and paper industries, offering a comprehensive portfolio of programs that are used in all principal steps of the papermaking process and across all grades of paper, including graphic grades, board and packaging, and tissue and towel. Paper provides its customers similar types of products and programs for water treatment and wastewater treatment as those offered by Water. Also, Paper offers two specialty programs that differentiate its offerings from Water—pulp applications and paper applications. Our pulp applications maximize process efficiency and increase pulp cleanliness and brightness in bleaching operations, as well as predict and monitor scaling potential utilizing on-line monitoring to design effective treatment programs and avoid costly failures. Our paper process applications focus on improving our customers’ operational efficiency, in part through water savings, energy savings and operating efficiency. Advanced sensing, monitoring and automation combine with innovative chemistries and detailed process knowledge to provide a broad range of customer solutions. Specialty products include flocculants, coagulants, dewatering aids, and digester yield additives. Our offerings are sold primarily by our corporate account and field sales employees. We believe we are one of the leading global suppliers of water treatment products and process aids to the pulp and papermaking industry.

5
Life Sciences Life Sciences provides end-to-end contamination control, cleaning and sanitizing solutions to personal care and pharmaceutical manufacturers. Life Sciences provides detergents, cleaners, sanitizers, disinfectants, as well as cleaning systems, electronic dispensers and chemical injectors for the application of chemical products. Additionally, we sell sterile alcohols, sterile biocides, residue removal and dilution solutions, surface wipes, dispensing equipment and aerosol sprays, which are primarily for application within clean room environments. The portfolio also includes decontamination systems and services utilizing hydrogen peroxide vapor. Products and programs are sold primarily through our field sales personnel and corporate account personnel, and to a lesser extent through distributors. Life Sciences is comprised of customers and accounts related to manufacturing in the following industries: pharmaceutical, animal health and medicine, biologic products, cosmetics and medical devices. Our tailored, comprehensive solutions and technical know-how focus on ensuring product quality, safety and compliance standards are met while improving operational efficiency in customers’ cleaning, sanitation and disinfection processes. Textile Care Textile Care provides products and services that manage the entire wash process through custom designed programs, premium products, dispensing equipment, water and energy management and reduction, and real time data management for large scale, complex commercial laundry operations including uniform rental, hospitality, linen rental and healthcare laundries. Textile Care’s programs are designed to meet our customers’ needs for exceptional cleaning, while extending the useful life of linen and reducing our customers’ overall operating costs. Products and programs are marketed primarily through our field sales employees and, to a lesser extent, through distributors. We believe we are one of the leading global suppliers in the laundry markets in which we compete. Global Institutional This reportable segment consists of the Institutional, Specialty and Healthcare operating segments, which provide specialized cleaning and sanitizing products to the foodservice, hospitality, lodging, healthcare, government, education and retail industries. The underlying operating segments exhibit similar manufacturing processes, distribution methods and economic characteristics. Descriptions of the three operating segments which comprise our Global Institutional reportable segment follow below. Institutional Institutional sells specialized cleaners and sanitizers for washing dishes, glassware, flatware, foodservice utensils and kitchen equipment (“warewashing”), plus specialized cleaners for various applications throughout food service operations, for on-premise laundries (typically used by hotel and healthcare customers) and for general housekeeping functions. We also sell food safety products and equipment, water filters, dishwasher racks and related kitchen sundries to the foodservice, lodging, educational and healthcare industries. Institutional also provides pool and spa treatment programs for hospitality and other commercial customers, as well as a broad range of janitorial cleaning and floor care products and programs to customers in hospitality, healthcare and commercial facilities. Institutional develops various chemical dispensing systems which are used by our customers to efficiently and safely dispense our cleaners and sanitizers, and through these products, systems and our on-site sales and service expertise, develop better results for our customers while also developing water savings, energy savings and operating efficiency. In addition, Institutional markets a lease program comprised of energy-efficient dishwashing machines, detergents, rinse additives and sanitizers, including full machine maintenance. Through our EcoSure Food Safety Management business, Institutional also provides customized on-site evaluations, training and quality assurance services to foodservice operations. Institutional sells its products and programs primarily through its direct field sales and corporate account sales personnel. Corporate account sales personnel establish relationships and negotiate contracts with larger multi-unit or “chain” customers. We also utilize independent, third-party foodservice, broad-line and janitorial distributors to provide logistics to end customers that prefer to work through these distributors. Many of these distributors also participate in marketing our product and service offerings to the end customers. Through our field sales personnel, we generally provide the same customer support to end-use customers supplied by these distributors as we do to direct customers. We believe we are one of the leading global suppliers of warewashing and laundry products and programs to the food service, hospitality and lodging markets.

6
Specialty Specialty supplies cleaning and sanitizing chemical products and related items primarily to regional, national and international quick service restaurant (“QSR”) chains and food retailers (i.e., supermarkets and grocery stores). Its products include specialty and general purpose hard surface cleaners, degreasers, sanitizers, polishes, hand care products and assorted cleaning tools and equipment which are primarily sold under the “Ecolab” and “Kay” brand names. Specialty’s cleaning and sanitation programs are customized to meet the needs of the market segments it serves and are designed to provide highly effective cleaning performance, promote food safety, reduce labor, water and energy costs and enhance user and guest safety. A number of dispensing options are available for products in the core product range. Specialty supports its product sales with training programs and technical support designed to meet the special needs of its customers. Both Specialty’s QSR business and its food retail business utilize their corporate account sales force which manages relationships with customers at the corporate and regional office levels (and, in the QSR market segment, at the franchisee level) and their field sales force which provides program support at the individual restaurant or store level. QSR customers are primarily supplied through third party distributors while most food retail customers utilize their own distribution networks. While Specialty’s customer base has broadened over the years, Specialty’s business remains largely dependent upon a limited number of major QSR chains and franchisees and large food retail customers. We believe we are one of the leading suppliers of cleaning and sanitizing products to the global QSR market and a leading supplier of cleaning and sanitizing products to the global food retail market. Healthcare Healthcare provides infection prevention and surgical solutions to acute care hospitals, surgery centers and medical device Original Equipment Manufacturers (“OEM”). Healthcare’s proprietary infection prevention and surgical solutions (hand hygiene, hard surface disinfection, instrument cleaning, patient drapes, equipment drapes and surgical fluid warming and cooling systems) are sold primarily under the "Ecolab," "Microtek," and “Anios” brand names to various departments within the acute care environment (Infection Control, Environmental Services, Central Sterile and Operating Room). Healthcare sells its products and programs primarily through its field sales personnel and corporate account personnel but also sells through healthcare distributors. We believe we are a leading supplier of infection prevention and surgical solutions in the United States and Europe. Global Energy This reportable segment consists of the Energy operating segment, which serves the process chemicals and water treatment needs of the global petroleum and petrochemical industries in both upstream and downstream applications. Energy provides on-site, technology-driven solutions to the global drilling and completion, oil and gas production and refining and petrochemical industries. Our product portfolio includes: additives for drilling and well stimulation, corrosion inhibitors, oil and water separation, scale control, paraffin and asphaltene control, biocides, hydrate control, hydrogen sulfide removal, oil dispersants, foamers and anti-foamers, flow improvers, anti-foulants, crude desalting, monomer inhibitors, anti-oxidants, fuel and lubricant additives, and traditional water treatment. The Energy operating segment operates under an upstream group comprised of the WellChem and Oil Field Chemicals businesses (which is being renamed ChampionX) and a downstream refinery and petrochemical processing group. ChampionX provides solutions to the oil and gas production sector, including crude oil and natural gas production, pipeline gathering/transmission systems, gas processing, heavy oil and bitumen upgrading, water management and enhanced oil recovery. ChampionX also supplies chemicals for the cementing, drilling, fracturing and acidizing phases of well drilling and stimulation. Our priority is to safely manage the critical challenges facing today’s oil and gas producers throughout the life cycle of their assets, with such an approach helping our customers minimize risk, achieve their production targets and maximize profitability. Our downstream group provides products and programs for process and water treatment applications specific to the petroleum refining and fuels industry, enabling our customers to profitably refine and upgrade hydrocarbons. Our heavy oil upgrading programs minimize operational costs and mitigate fouling, corrosion, foaming and the effects of heavy metals during the refining process. We also offer fuel additives, including corrosion inhibitors, to protect engine fuel systems and pre-market underground storage tanks and piping. Our customers include many of the largest publicly traded oil and gas companies, as well as national oil and gas companies and large independent oil and gas companies and service companies. Our Energy offerings are sold primarily by our corporate account and field sales employees and, to a lesser extent, through distributors, sales agents and joint ventures. We believe we are one of the leading global providers of specialty chemicals to the upstream oil and gas industry, and downstream refineries and petrochemical operations.

7
Other Other consists of the Pest Elimination, Colloidal Technologies Group and (prior to its sale in November 2017) Equipment Care, operating segments. These operating segments do not meet the quantitative criteria to be separately reported. We disclose these operating segments within Other as we consider the information useful in understanding our consolidated results. Pest Elimination Pest Elimination provides services designed to detect, eliminate and prevent pests, such as rodents and insects, in restaurants, food and beverage processors, educational and healthcare facilities, hotels, quick service restaurant and grocery operations and other institutional and commercial customers. The services of Pest Elimination are sold and performed by our field sales and service personnel. Pest Elimination continues to expand its geographic coverage. In addition to the United States, which constitutes the largest operation, we operate in various countries in Asia Pacific, Western Europe, Latin America and South Africa, with the largest operations in France, the United Kingdom and Greater China. We believe Pest Elimination is a leading supplier of pest elimination programs to the commercial, hospitality and institutional markets in the geographies it serves. Colloidal Technologies Group The Colloidal Technologies Group (“CTG”) produces and sells colloidal silica, which is comprised of nano-sized particles of silica in water. These products and associated programs are used primarily for binding and polishing applications. CTG serves customers across various industries, including semiconductor manufacturing, catalyst manufacturing, chemicals, and aerospace component manufacturing. CTG incorporates strong collaboration with customers to develop customized solutions that meet the technical demands of their operations. Our silica-based applications are widely used for polishing of silicon wafers, semiconductor substrates and the precision surface finishing of optics, watch crystals and other glass components. We offer a variety of silica-based particles that can be used as binders in heterogeneous catalyst systems and as silica nutrients for manufacturing specialty zeolites. Our silica products are used worldwide as a binder for precision investment casting slurries, which ultimately facilitate the manufacture of near net-shape metal parts such as turbine blades and golf club heads. Our products are sold primarily by our corporate account employees. We believe we are one of the leading global suppliers of colloidal silica. Equipment Care Prior to its sale in November 2017, Equipment Care provided equipment repair, maintenance and preventive maintenance services for the commercial food service industry. Repair services were offered for in-warranty repair, acting as the manufacturer’s authorized service agent, as well as after-warranty repair. In addition, Equipment Care operated as a parts distributor to repair service companies and end-use customers. Additional Information International Operations We directly operate in approximately 100 countries outside of the United States through wholly-owned subsidiaries or, in some cases, through a joint venture with a local partner. In certain countries, selected products are sold by our export operations to distributors, agents or licensees, although the volume of those sales is not significant in terms of our overall revenues. In general, our businesses conducted outside the United States are similar to those conducted in the United States. Our business operations outside the United States are subject to the usual risks of foreign operations, including possible changes in trade and foreign investment laws, international business laws and regulations, tax laws, currency exchange rates and economic and political conditions. The profitability of our international operations is generally lower than the profitability of our businesses in the United States, due to (i) the additional cost of operating in numerous and diverse foreign jurisdictions with varying laws and regulations, (ii) higher costs of importing certain raw materials and finished goods in some regions, (iii) the smaller scale of international operations where certain operating locations are smaller in size, and (iv) the additional reliance on distributors and agents in certain countries which can negatively impact our margins. Proportionately larger investments in sales and technical support are also necessary in certain geographies in order to facilitate the growth of our international operations.

8
Competition In general, the markets in which the businesses in our Global Industrial reportable segment compete are led by a few large companies, with the rest of the market served by smaller entities focusing on more limited geographic regions or a smaller subset of products and services. Our businesses in this segment compete on the basis of their demonstrated value, technical expertise, innovation, chemical formulations, customer support, detection equipment, monitoring capabilities, and dosing and metering equipment. The businesses in our Global Institutional reportable segment and Other have two significant classes of competitors. First, we compete with a small number of large companies selling directly or through distributors on a national or international scale. Second, we have numerous smaller regional or local competitors which focus on more limited geographies, product lines and/or end-use customer segments. We compete principally by providing superior value, premium customer support, and innovative and differentiated products to help our customers protect their brand reputation. Our Global Energy reportable segment competes with a limited number of multinational companies, with the remainder of the market comprised of smaller, regional niche companies focused on limited geographic areas. We compete in this business on the basis of our product quality, technical expertise, chemical formulations, effective global supply chain, strong customer service and emphasis on safety and environmental leadership. Sales Products, systems and services are primarily marketed in domestic and international markets by our Company-trained direct field sales personnel who also advise and assist our customers in the proper and most efficient use of the products and systems in order to meet a full range of cleaning and sanitation, water treatment and process chemistry needs. Independent, third-party distributors and, to a lesser extent, sales agents, are utilized in several markets, as described in the segment descriptions found above. Number of Employees We had 50,200 employees as of December 31, 2019. Customers and Classes of Products We believe our business is not materially dependent upon a single customer. Additionally, although we have a diverse customer base and no customer or distributor constituted 10 percent or more of our consolidated revenues in 2019, 2018 or 2017, we do have customers and independent, third-party distributors, the loss of which could have a material adverse effect on results of operations for the affected earnings periods; however, we consider it unlikely that such an event would have a material adverse impact on our financial position. No material part of our business is subject to renegotiation or termination at the election of a governmental unit. We sold one class of products within the Global Institutional reportable segment which comprised 10% or more of consolidated net sales in the last three years. Sales of warewashing products were approximately 11% of consolidated net sales in each of the years. Patents and Trademarks We own and license a number of patents, trademarks and other intellectual property. While we have an active program to protect our intellectual property by filing for patents or trademarks and pursuing legal action, when appropriate, to prevent infringement, except for the items listed below, we do not believe our overall business is materially dependent on any individual patent or trademark.
• Patents related to our TRASAR and 3D TRASAR technology, which are material to our Global Industrial reportable segment. U.S. and foreign patents protect aspects of our key TRASAR and 3D TRASAR technology until at least 2024.
• Trademarks related to Ecolab, Nalco and 3D TRASAR, which collectively are material to all of our reportable segments. The
Ecolab, Nalco and 3D TRASAR trademarks are registered or applied for in all of our key markets, and we anticipate maintaining them indefinitely.
Seasonality We experience variability in our quarterly operating results due to seasonal sales volume and business mix fluctuations in our operating segments. Part II, Item 8, Note 19, entitled “Quarterly Financial Data” of this Form 10-K is incorporated herein by reference. Investments in Equipment We have no unusual working capital requirements. We have invested in the past, and will continue to invest in the future, in process control and monitoring equipment consisting primarily of systems used by customers to dispense our products as well as to monitor water systems. The investment in such equipment is discussed under the heading "Investing Activities" in Management's Discussion and Analysis of Financial Condition and Results of Operations of this Form 10-K.

9
Manufacturing and Distribution We manufacture most of our products and related equipment in Company-operated manufacturing facilities. Some products are also produced for us by third-party contract manufacturers. Other products and equipment are purchased from third-party suppliers. Additional information on product/equipment sourcing is found in the segment discussions above and additional information on our manufacturing facilities is located under Part I, Item 2. “Properties,” of this Form 10-K. Deliveries to customers are made from our manufacturing plants and a network of distribution centers and third-party logistics service providers. We use common carriers, our own delivery vehicles, and distributors for transport. Additional information on our plant and distribution facilities is located under Part I, Item 2. “Properties,” of this Form 10-K. Raw Materials Raw materials purchased for use in manufacturing our products are inorganic chemicals, including alkalis, acids, biocides, phosphonates, phosphorous materials, silicates and salts; and organic chemicals, including acids, alcohols, amines, fatty acids, surfactants, solvents, monomers and polymers. Healthcare purchases plastic films and parts to manufacture medical devices that serve the surgical and infection prevention markets. Pesticides used by Pest Elimination are purchased as finished products under contract or purchase order from the producers or their distributors. We also purchase packaging materials for our manufactured products and components for our specialized cleaning equipment and systems. We purchase more than 10,000 raw materials, with the largest single raw material representing less than 4% of raw material purchases. Our raw materials, with the exception of a few specialized chemicals which we manufacture, are generally purchased on an annual contract basis and are ordinarily available in adequate quantities from a diverse group of suppliers globally. When practical, global sourcing is used so that purchasing or production locations can be shifted to control product costs at globally competitive levels. Research and Development Our research and development program consists principally of developing and validating the performance of new products, processes, techniques and equipment, improving the efficiency of those already existing, improving service program content, evaluating the environmental compatibility of products and technical support. Key disciplines include analytical and formulation chemistry, microbiology, data science and predictive analytics, process and packaging engineering, remote monitoring engineering and product dispensing technology. Substantially all of our principal products have been developed by our research, development and engineering personnel. We believe continued research and development activities are critical to maintaining our leadership position within the industry and will provide us with a competitive advantage as we seek additional business with new and existing customers. Joint Ventures Over time, we have entered into partnerships or joint ventures in order to meet local ownership requirements, to achieve quicker operational scale, to expand our ability to provide our customers a more fully integrated offering or to provide other benefits to our business or customers. During 2019, the impact on our consolidated net income of our joint ventures, in the aggregate, was approximately three percent. The table below identifies our most significant consolidated and non-consolidated joint ventures, summarized by the primary purpose of the joint venture.
Local Ownership Requirements / Geographic Expansion Joint Venture Location Segment
Nalco Saudi Co. Limited Saudi Arabia Global Energy, Global Industrial ChampionX Oilfield Solutions Nigeria Limited Nigeria Global Energy ChampionX Equatorial Guinea, S.A.R.L. Equatorial Guinea Global Energy ChampionX Químicos, Limitada Angola Global Energy RauanNalco LLP Kazakhstan Global Energy
Operational Scale / Geographic Critical Mass Joint Venture Location Segment
Katayama Nalco Inc. Japan Global Industrial Technology / Expanded Product Offering / Manufacturing Capability
Joint Venture Location Segment Derypol, S.A. Spain Global Industrial Century LLC United States Global Institutional
We will continue to evaluate the potential for partnerships and joint ventures that can assist us in increasing our geographic, technological and product reach.

10
Environmental and Regulatory Considerations Our businesses are subject to various legislative enactments and regulations relating to the protection of the environment and public health. While we cooperate with governmental authorities and take commercially practicable measures to meet regulatory requirements and avoid or limit environmental effects, some risks are inherent in our businesses. Among the risks are costs associated with transporting and managing hazardous materials and waste disposal and plant site clean-up, fines and penalties if we are found to be in violation of law, as well as modifications, disruptions or discontinuation of certain operations or types of operations including product recalls and reformulations. Similarly, the need for certain of our products and services is dependent upon or might be limited by governmental laws and regulations. Changes in such laws and regulations, including among others, air pollution regulations and regulations relating to oil and gas production (including those related to hydraulic fracturing), could impact the sales of some of our products or services. In addition to an increase in costs of manufacturing and delivering products, a change in production regulations or product regulations could result in interruptions to our business and potentially cause economic or consequential losses should we be unable to meet the demands of our customers for products. Additionally, although we are not currently aware of any such circumstances, there can be no assurance that future legislation or enforcement policies will not have a material adverse effect on our consolidated results of operations, financial position or cash flows. Environmental and regulatory matters most significant to us are discussed below.
Ingredient Legislation: Various laws and regulations have been enacted by state, local and foreign jurisdictions pertaining to the sale of products which contain phosphorous, volatile organic compounds, or other ingredients that may impact human health or the environment. Under California Proposition 65, for example, label disclosures are required for certain products containing chemicals listed by California. Chemical management initiatives that promote pollution prevention through research and development of safer chemicals and safer chemical processes are being advanced by certain states, including California, Maine, Maryland, Massachusetts, Minnesota, Oregon and South Carolina. Environmentally preferable purchasing programs for cleaning products have been enacted in a number of states to date, and in recent years have been considered by several other state legislatures. Cleaning product ingredient disclosure legislation has been introduced in the U.S. Congress in each of the past few years but has not passed, and several states are considering further regulations in this area. In 2017, California passed the Cleaning Product Right to Know Act of 2017, that will require ingredient transparency on-line and on-label by 2020 and 2021, respectively. New York has published ingredient disclosure guidance based on existing regulation but final compliance has been delayed due to litigation. The U.S. Government is monitoring “green chemistry” initiatives through a variety of initiatives, including its “Design for the Environment” (“DfE”)/“Safer Choice” program. DfE/Safer Choice has three broad areas of work (recognition of safer products on a DfE/Safer Choice label, development of best practices for industrial processes and evaluation of safer chemicals), and we are involved in these to varying degrees. Our Global Institutional and Global Industrial cleaning products are subject to the regulations and may incur additional stay-in-market expenses associated with conducting the required alternatives analyses for chemicals of concern. To date, we generally have been able to comply with such legislative requirements by reformulation or labeling modifications. Such legislation has not had a material adverse effect on our consolidated results of operations, financial position or cash flows to date. TSCA: The nation’s primary chemicals management law, the Toxic Substances Control Act (“TSCA”), was updated for the first time in 40 years with the passage of the Frank R. Lautenberg Chemical Safety for the 21st Century Act (“LCSA”) in 2016. The LCSA modernizes the original 1976 legislation, aiming to establish greater public confidence in the safety of chemical substances in commerce, improve the U.S. Environmental Protection Agency’s (“EPA”) capability and authority to regulate existing and new chemical substances, and prevent further state action or other notification programs like REACH (see below). For Ecolab, the TSCA changes mainly impact testing and submission costs for new chemical substances in the United States. In addition, the EPA likely will be more aggressively using the existing TSCA tools to manage chemicals of concern. We anticipate that compliance with new requirements under TSCA could be similar to the costs associated with REACH in the European Union, which is discussed below. REACH: The European Union has enacted a regulatory framework for the Registration, Evaluation and Authorization of Chemicals (“REACH”). It established a new European Chemicals Agency (“ECHA”) in Helsinki, Finland, which is responsible for evaluating data to determine hazards and risks and to manage this program for authorizing chemicals for sale and distribution in Europe. We met the pre-registration requirements of REACH, and the 2010, 2013 and 2018 registration deadlines. To help manage this program, we have been simplifying our product lines and working with chemical suppliers to comply with registration requirements. In addition, Korea, Taiwan, Turkey and other countries are implementing similar requirements. Potential costs to us are not yet fully quantifiable but are not expected to have a material adverse effect on our consolidated results of operations or cash flows in any one reporting period or on our financial position. GHS: In 2003, the United Nations adopted a standard on hazard communication and labeling of chemical products known as the Globally Harmonized System of Classification and Labeling of Chemicals (“GHS”). GHS is designed to facilitate international trade and increase safe handling and use of hazardous chemicals through a worldwide system that classifies chemicals based on their intrinsic hazards and communicates information about those hazards through standardized product labels and safety data sheets (“SDSs”). Most countries in which we operate will adopt GHS-related legislation by 2020, and numerous countries already have done so. The primary cost of compliance revolves around reclassifying products and revising SDSs and product labels. We met the 2015 deadlines in the U.S. and European Union and are working toward a phased-in approach to mitigate the costs of GHS implementation in remaining countries (e.g., Peru, Chile, India). Potential costs to us are not expected to have a material adverse effect on our consolidated results of operations or cash flows in any one reporting period or on our financial position.

11
Pesticide and Biocide Legislation: Various international, federal and state environmental laws and regulations govern the manufacture and/or use of pesticides. We manufacture and sell certain disinfecting, sanitizing and material preservation products that kill or reduce microorganisms (bacteria, viruses, fungi) on hard environmental surfaces, in process fluids and on certain food products. Such products constitute “pesticides” or “antimicrobial pesticides” under the current definitions of the Federal Insecticide, Fungicide, and Rodenticide Act (“FIFRA”), as amended by the Food Quality Protection Act of 1996, the principal federal statute governing the manufacture, labeling, handling and use of pesticides. We maintain several hundred product registrations with the U.S. Environmental Protection Agency (“EPA”). Registration entails the necessity to meet certain efficacy, toxicity and labeling requirements and to pay on-going registration fees. In addition, each state in which these products are sold requires registration and payment of a fee. In general, the states impose no substantive requirements different from those required by FIFRA. However, California and certain other states have adopted additional regulatory programs, and California imposes a tax on total pesticide sales in that state. While the cost of complying with rules as to pesticides has not had a material adverse effect on our consolidated results of operations, financial condition, or cash flows to date, the costs and delays in receiving necessary approvals for these products continue to increase. Total fees paid to the EPA and the states to obtain or maintain pesticide registrations are not expected to significantly affect our consolidated results of operations or cash flows in any one reporting period or our financial position. In Europe, the Biocidal Products Regulation established a program to evaluate and authorize marketing of biocidal active substances and products. We are working with suppliers and industry groups to manage these requirements and have met the first relevant deadline of the program by the timely submission of dossiers for active substances. Anticipated registration costs, which will be incurred through the multi-year phase-in period, will be significant; however, these costs are not expected to significantly affect our consolidated results of operations or cash flows in any one reporting period or our financial position. The same is true for emerging biocide regulations in Asia. In addition, Pest Elimination applies restricted-use pesticides that it generally purchases from third parties. That business must comply with certain standards pertaining to the use of such pesticides and to the licensing of employees who apply such pesticides. Such regulations are enforced primarily by the states or local jurisdictions in conformity with federal regulations. We have not experienced material difficulties in complying with these requirements. FDA Antimicrobial Product Requirements: Various laws and regulations have been enacted by federal, state, local and foreign jurisdictions regulating certain products manufactured and sold by us for controlling microbial growth on humans, animals and foods. In the United States, these requirements generally are administered by the U.S. Food and Drug Administration ("FDA"). However, the U.S. Department of Agriculture and EPA also may share in regulatory jurisdiction of antimicrobials applied to food. The FDA codifies regulations for these product categories in order to ensure product quality, safety and effectiveness. The FDA also has been expanding requirements applicable to such products, including proposing regulations for over-the-counter antiseptic drug products, which may impose additional requirements associated with antimicrobial hand care products and associated costs when finalized by the FDA. FDA regulations associated with the Food Safety Modernization Act may impose additional requirements related to safety product lines. To date, such requirements have not had a material adverse effect on our consolidated results of operations, financial position or cash flows. Medical Device and Drug Product Requirements: As a manufacturer, distributor and marketer of medical devices and human drugs, we also are subject to regulation by the FDA and corresponding regulatory agencies of the state, local and foreign governments in which we sell our products. These regulations govern the development, testing, manufacturing, packaging, labeling, distribution and marketing of medical devices and medicinal products. We also are required to register with the FDA as a medical device and drug manufacturer, comply with post-market reporting (e.g., Adverse Event Reporting, MDR and Recall) requirements, and to comply with the FDA’s current Good Manufacturing Practices and Quality System Regulations which require that we have a quality system for the design and production of our products intended for commercial distribution in the United States and satisfy recordkeeping requirements with respect to our manufacturing, testing and control activities. Countries in the European Union require that certain products being sold within their jurisdictions obtain a “CE mark,” an international symbol of adherence to quality assurance standards, and be manufactured in compliance with certain requirements (e.g., Medical Device Directive 93/42/EE, Medical Device Regulation, and ISO 13485). We have CE mark approval to sell various medical device and medicinal products in Europe. Our other international non-European operations also are subject to government regulation and country-specific rules and regulations. Regulators at the federal, state and local level have imposed, are currently considering and are expected to continue to impose regulations on medical devices and drug products. No prediction can be made of the potential effect of any such future regulations, and there can be no assurance that future legislation or regulations will not increase the costs of our products or prohibit the sale or use of certain products. Equipment: Ecolab’s products are dispensed by equipment that is subject to state and local regulatory requirements, as well as being subject to UL, NSF, and other approval requirements. We have both dedicated manufacturing facilities and third-party production of our equipment. We are developing processes to monitor and manage changing regulatory regimes and assist with equipment systems compliance. To date, such requirements have not had a material adverse effect on our consolidated results of operations, financial position or cash flows.

12
Other Environmental Legislation: Our manufacturing plants are subject to federal, state, local or foreign jurisdiction laws and regulations relating to discharge of hazardous substances into the environment and to the transportation, handling and disposal of such substances. The primary federal statutes that apply to our activities in the United States are the Clean Air Act, the Clean Water Act and the Resource Conservation and Recovery Act. We are also subject to the Superfund Amendments and Reauthorization Act of 1986, which imposes certain reporting requirements as to emissions of hazardous substances into the air, land and water. The products we produce and distribute into Europe are also subject to directives governing electrical waste (WEEE Directive 2012/19/EU) and restrictive substances (RoHS Directive 2011/65/EU). Similar legal requirements apply to Ecolab’s facilities globally. We make capital investments and expenditures to comply with environmental laws and regulations, to promote employee safety and to carry out our announced environmental sustainability principles. To date, such expenditures have not had a significant adverse effect on our consolidated results of operations, financial position or cash flows. Our capital expenditures for environmental, health and safety projects worldwide were approximately $54 million in 2019 and $60 million in 2018. Approximately $56 million has been budgeted globally for projects in 2020. Climate Change: Various laws and regulations pertaining to climate change have been implemented or are being considered for implementation at the international, national, regional and state levels, particularly as they relate to the reduction of greenhouse gas (“GHG”) emissions. None of these laws and regulations directly apply to Ecolab at the present time; however, as a matter of corporate policy, we support a balanced approach to reducing GHG emissions while sustaining economic growth. Furthermore, climate-related risks are assessed within our Enterprise Risk Management process and Annual Business Significance Risks Assessment, which is aligned with recommendations of the Financial Stability Board (FSB) Task Force on Climate-related Financial Disclosures (TCFD). We report TCFD disclosures in our annual Carbon Disclosure Project Climate report located at https://www.ecolab.com/sustainability/download-sustainability-reports. We are evaluating further application of the recommendations of the TCFD over the next three to five years, in alignment with the recommended timeline from the TCFD. To further bolster our climate commitment, in December 2019, we announced new goals to reduce carbon emissions in half by 2030 and to net zero by 2050 and move to 100% renewable energy with positive implications for long-term risk management. We made these commitments as a part of aligning with the United Nations Global Compact’s Business Ambition for 1.5⁰C. Our current global sustainability targets were established in 2016. They include a 25 percent reduction in water withdrawals and a 10 percent reduction in GHG emissions by 2020. In addition to our internal sustainability performance, we partner with customers at more than three million customer locations around the world to reduce energy and GHG emissions through our high-efficiency solutions in cleaning and sanitation, water, paper and energy services. We also introduced a customer impact goal for the first time. By partnering with our customers to help them do more with less through the use of our solutions, we aim to help our customers conserve more than 300 billion gallons of water annually by 2030. Environmental Remediation and Proceedings: Along with numerous other potentially responsible parties (“PRP”), we are currently involved with waste disposal site clean-up activities imposed by the federal Comprehensive Environmental Response, Compensation and Liability Act (“CERCLA”) or state equivalents at 27 sites in the United States. Additionally, we have similar liability at eight sites outside the United States. In general, under CERCLA, we and each other PRP that actually contributed hazardous substances to a Superfund site are jointly and severally liable for the costs associated with cleaning up the site. Customarily, the PRPs will work with the EPA to agree and implement a plan for site remediation. Based on an analysis of our experience with such environmental proceedings, our estimated share of all hazardous materials deposited on the sites referred to in the preceding paragraph, and our estimate of the contribution to be made by other PRPs which we believe have the financial ability to pay their shares, we have accrued our best estimate of our probable future costs relating to such known sites. In establishing accruals, potential insurance reimbursements are not included. The accrual is not discounted. It is not feasible to predict when the amounts accrued will be paid due to the uncertainties inherent in the environmental remediation and associated regulatory processes. We have also been named as a defendant in lawsuits where our products have not caused injuries, but the claimants wish to be monitored for potential future injuries. We cannot predict with certainty the outcome of any such tort claims or the involvement we or our products might have in such matters in the future, and there can be no assurance that the discovery of previously unknown conditions will not require significant expenditures. In each of these chemical exposure cases, our insurance carriers have accepted the claims on our behalf (with or without reservation) and our financial exposure should be limited to the amount of our deductible; however, we cannot predict the number of claims that we may have to defend in the future and we may not be able to continue to maintain such insurance. We have also been named as a defendant in a number of lawsuits alleging personal injury due to exposure to hazardous substances, including multi-party lawsuits alleging personal injury in connection with our products and services. While we do not believe that any of these suits will be material to us based upon present information, there can be no assurance that these environmental matters could not have, either individually or in the aggregate, a material adverse effect on our consolidated results of operations, financial position or cash flows.

13
Our worldwide net expenditures for contamination remediation were approximately $2 million in 2019 and $3 million in 2018. Our worldwide accruals at December 31, 2019 for probable future remediation expenditures, excluding potential insurance reimbursements, totaled approximately $16 million. We review our exposure for contamination remediation costs periodically and our accruals are adjusted as considered appropriate. While the final resolution of these issues could result in costs below or above current accruals and, therefore, have an impact on our consolidated financial results in a future reporting period, we believe the ultimate resolution of these matters will not have a material effect on our consolidated results of operations, financial position or cash flows.
Iran Threat Reduction and Syria Human Rights Act of 2012 Under the Iran Threat Reduction and Syria Human Rights Act of 2012, which added Section 13(r) of the Securities Exchange Act of 1934, the Company is required to disclose in its periodic reports if it or any of its affiliates knowingly engaged in certain activities, transactions or dealings relating to Iran or with entities or individuals designated pursuant to certain Executive Orders. Disclosure is required even where the activities are conducted outside the U.S. by non-U.S. affiliates in compliance with applicable law, and even if the activities are not covered or prohibited by U.S. law.
As authorized by the U.S. Treasury’s Office of Foreign Assets Control (OFAC), a non-U.S. subsidiary of the Company completed sales of products used for process and water treatment applications in upstream oil and gas production related to the operation of and production from the Rhum gas field off the Scottish coast (Rhum) totaling $0.7 million during the subsidiary’s fiscal year ended November 30, 2019, and a nominal amount of sales of such products during December 2019. The net profit before taxes associated with these sales for each period were $0.1 million and nominal, respectively. Rhum is jointly owned by Serica Energy plc and Iranian Oil Company (U.K.) Limited. Our non-U.S. subsidiary intends to continue the Rhum-related activities, consistent with a specific license obtained from OFAC by its customers, and such activities may require additional disclosure pursuant to the abovementioned statute. Available Information. We file annual, quarterly and current reports, proxy statements and other information with the SEC. The SEC maintains a website that contains reports, proxy and information statements, and other information regarding issuers, including the Company, that file electronically with the SEC at https://www.sec.gov. General information about us, including our Annual Reports on Form 10-K, Quarterly Reports on Form 10-Q and Current Reports on Form 8-K, as well as any amendments and exhibits to those reports, are available free of charge through our website at https://investor.ecolab.com as soon as reasonably practicable after we file them with, or furnish them to, the SEC. In addition, the following governance materials are available on our web site at https://investor.ecolab.com/corporate-governance: (i) charters of the Audit, Compensation, Finance, Governance and Safety, Health and Environment Committees of our Board of Directors; (ii) our Board's Corporate Governance Principles; and (iii) our Code of Conduct.

14
Executive Officers. The persons listed in the following table are our current executive officers. Officers are elected annually. There is no family relationship among any of the directors or executive officers and no executive officer has been involved during the past ten years in any legal proceedings described in applicable Securities and Exchange Commission regulations.
Name Age Office Positions Held Since
Jan. 1, 2015 Douglas M. Baker, Jr. 61 Chairman of the Board and Chief Executive Officer Jan. 2015 – Present Christophe Beck 52 President and Chief Operating Officer Apr. 2019 – Present Executive Vice President and President – Industrial May 2018 – Mar. 2019 Executive Vice President and President – Global Nalco Water May 2017 – May 2018
Executive Vice President and President – Global Water & Process Services
May 2015 – May 2017
Executive Vice President and President – Regions Jan. 2015 – May 2015 Larry L. Berger 59 Executive Vice President and Chief Technical Officer Jan. 2015 – Present Darrell R. Brown 56 Executive Vice President and President – Global Industrial Apr. 2019 – Present Executive Vice President and President – Energy Services Jan. 2018 – Mar. 2019 Executive Vice President, Global Downstream & WellChem Apr. 2017 – Dec. 2017 Executive Vice President and President – Europe Jan. 2015 – Mar. 2017 Deric D. Bryant 47 Executive Vice President and President – Upstream Energy July 2019 – Present
Executive Vice President and General Manager – Energy Services Oil Field Chemicals
Apr. 2017 – June 2019
Senior Vice President – Energy Services Oil Field Chemicals Oct. 2016 – Mar. 2017 Vice President Sales – Oil Field Chemicals Latin America CAPX Jan. 2015 – Sept. 2016 Angela M. Busch 53 Executive Vice President – Corporate & Business Development Aug. 2018 – Present Senior Vice President – Corporate Development Jan. 2015 – Aug. 2018 Machiel Duijser 48 Executive Vice President and Chief Supply Chain Officer Feb. 2020 – Present(1) Roberto Inchaustegui 64 Executive Vice President – Growth Initiatives Jan. 2020 – Present
Executive Vice President and President – Global Services and Specialty
Jan. 2015 – Jan. 2020
Scott D. Kirkland 46 Senior Vice President and Corporate Controller June 2019 – Present Senior Vice President - Finance, Global Energy Services May 2016 – May 2019 Vice President - Finance Global Institutional Jan. 2016 – Apr. 2016 Vice President - Finance Institutional North America Jan. 2015 – Dec. 2015 Laurie M. Marsh 56 Executive Vice President – Human Resources Jan. 2015 – Present Michael C. McCormick 57 Executive Vice President, General Counsel and Secretary Oct. 2017 – Present Executive Vice President, General Counsel and Assistant Secretary Mar. 2017 – Sep. 2017
Chief Compliance Officer, Deputy General Counsel and Assistant Secretary
June 2016 – Feb. 2017
Chief Compliance Officer and Assistant Secretary Jan. 2015 – May 2016 Timothy P. Mulhere
57
Executive Vice President and President – Global Institutional & Specialty Services
July 2018 – Present
Executive Vice President and President – Regions May 2015 – June 2018
Executive Vice President and President – Global Water and Process Services
Jan. 2015 – May 2015
Daniel J. Schmechel 60 Chief Financial Officer Nov. 2019 – Present Chief Financial Officer and Treasurer Jan. 2017 – Nov. 2019 Chief Financial Officer Jan. 2015 – Dec. 2016

15
Name Age Office Positions Held Since
Jan. 1, 2015 Elizabeth A. Simermeyer
55
Executive Vice President and President – Global Healthcare and Life Sciences
Dec. 2019 – Present
Executive Vice President – Global Marketing & Communications and Life Sciences
July 2015 – Dec. 2019
Senior Vice President – Global Marketing & Communications Jan. 2015 – July 2015 Jill S. Wyant 48 Executive Vice President and President – Global Regions Dec. 2019 – Present
Executive Vice President and President – Global Regions and Global Healthcare
Jan. 2018 – Dec. 2019
Executive Vice President and President – Global Food & Beverage, Healthcare and Life Sciences
May 2016 – Dec. 2017
Executive Vice President and President – Global Food & Beverage Jan. 2015 – Apr. 2016 (1) Prior to joining Ecolab in February 2020, Mr. Duijser was employed by Reckitt Benckiser (RB) Group plc as Chief Supply Officer since November 2018. Mr. Duijser joined RB from Amazon.com, Inc. where he served as Vice President Worldwide Engineering from 2015 to 2018. Forward-Looking Statements This Form 10-K, including Part I, Item 1, entitled “Business,” and the MD&A within Part II, Item 7, contains forward-looking statements within the meaning of the Private Securities Litigation Reform Act of 1995. These statements include expectations concerning items such as:
• amount, funding and timing of cash expenditures relating to our restructuring and other initiatives • future cash flows, access to capital, targeted credit rating metrics and impact of credit rating downgrade • adequacy of cash reserves • uses for cash, including dividends, share repurchases, debt repayments, capital investments and strategic business
acquisitions • global market risk • impact of oil price fluctuations, comparative performance and prospects of businesses in our Global Energy segment • long-term potential of our business • impact of changes in exchange rates and interest rates • customer retention rate • bad debt experience, non-performance of counterparties and losses due to concentration of credit risk • disputes, claims and litigation • environmental contingencies • impact and cost of complying with laws and regulations • sustainability targets • returns on pension plan assets • contributions to pension and postretirement healthcare plans • amortization expense • impact of new accounting pronouncements • income taxes, including valuation allowances, loss carryforwards, unrecognized tax benefits, uncertain tax positions and
deductibility of goodwill • recognition of share-based compensation expense • payments under operating leases • future benefit plan payments • market position • doing business relating to Iran • the completion and timing of the proposed separation of our Upstream Energy business and subsequent merger with Apergy • the expected strategic, operational and competitive benefits of the proposed separation of our Upstream Energy business, the
effect of the separation on Ecolab and its shareholders, customers and employees • the impact of the coronavirus outbreak
Without limiting the foregoing, words or phrases such as “will likely result,” “are expected to,” “will be,” “will continue,” “is anticipated,” “we believe,” “we expect,” “estimate,” “project” (including the negative or variations thereof), “intends,” “could,” or similar terminology, generally identify forward-looking statements. Forward-looking statements may also represent challenging goals for us. These statements, which represent the Company’s expectations or beliefs concerning various future events, are based on current expectations that involve a number of risks and uncertainties that could cause actual results to differ materially from those of such forward-looking statements. We caution that undue reliance should not be placed on such forward-looking statements, which speak only as of the date made. For a further discussion of these and other factors which could cause results to differ from those expressed in any forward-looking statement, see Item 1A of this Form 10-K, entitled “Risk Factors.” Except as may be required under applicable law, we undertake no duty to update our forward-looking statements.

16
Item 1A. Risk Factors. The following are important factors which could affect our financial performance and could cause our actual results for future periods to differ materially from our anticipated results or other expectations, including those expressed in any forward-looking statements made in this Form 10-K. See the section entitled “Forward-Looking Statements” set forth above. We may also refer to this disclosure to identify factors that may cause results to differ materially from those expressed in other forward-looking statements including those made in oral presentations, including telephone conferences and/or webcasts open to the public. Our results depend upon the continued vitality of the markets we serve. Economic downturns, and in particular downturns in our larger markets including the energy, foodservice, hospitality, travel, health care, food processing, pulp and paper, mining and steel industries, can adversely impact our end-users. The well completion and stimulation, oil and gas production and refinery and petrochemical plant markets served by our Global Energy segment may be impacted by substantial fluctuations in oil and gas prices; in 2015 and 2016, the Global Energy segment experienced decreased sales as a result of very challenging global energy market conditions. In recent years, the weaker global economic environment, particularly in Europe, has also negatively impacted certain of our end-markets. During these periods of weaker economic activity, our customers and potential customers may reduce or discontinue their volume of purchases of cleaning and sanitizing products and water treatment and process chemicals, which has had, and may continue to have, a material adverse effect on our business, financial condition, results of operation or cash flows. Our results are impacted by general worldwide economic factors. Economic factors such as the worldwide economy, capital flows, interest rates and currency movements, including, in particular, our exposure to foreign currency risk, have affected our business in the past and may have a material adverse impact on our business in the future. For example, in 2011 and 2012, the European Union’s sovereign debt crisis negatively impacted economic activity in that region as well as the strength of the euro versus the U.S. dollar. Additionally, the June 2016 Brexit vote resulted in a sharp decline in the value of the British pound, as compared to the U.S. dollar and other currencies, and has caused increased fluctuations and unpredictability in foreign currency exchange rates. The possibility for referendum by other EU member states may lead to further market volatility. Other regions of the world, including emerging market areas, also expose us to foreign currency risk. As a result of increasing currency controls, importation restrictions, workforce regulations, pricing constraints and local capitalization requirements, we deconsolidated our Venezuelan subsidiaries effective as of the end of the fourth quarter of 2015. Prior to deconsolidation, across the second through fourth quarters of 2015, we devalued our Venezuelan bolivar operations within our Water, Paper, Food & Beverage, Institutional and Energy operating segments. Similar currency devaluations, credit market disruptions or other economic turmoil in other countries could have a material adverse impact on our consolidated results of operations, financial position and cash flows by negatively impacting economic activity, including in our key end-markets, and by further weakening the local currency versus the U.S. dollar, resulting in reduced sales and earnings from our foreign operations, which are generated in the local currency, and then translated to U.S. dollars. If we are unsuccessful in executing on key business initiatives, including restructurings and our Enterprise Resource Planning (“ERP”) system upgrades, our business could be materially and adversely affected. We continue to execute key business initiatives, including restructurings and investments to develop business systems, as part of our ongoing efforts to improve our efficiency and returns. In particular, we are undertaking the Accelerate 2020 plan to simplify and automate processes and tasks, reduce complexity and management layers, consolidate facilities and focus on key long-term growth areas by leveraging technology and structural improvements as discussed under Note 3 entitled “Special (Gains) and Charges” of this Form 10-K. Additionally, we are continuing our implementation of our ERP system upgrades, which are expected to occur in phases over the next several years. These upgrades, which include supply chain and certain finance functions, are expected to improve the efficiency of certain financial and related transactional processes. These upgrades involve complex business process design and a failure of certain of these processes could result in business disruption. We are also making changes to our system in order to support our separation of the ChampionX business. If the projects in which we are investing or the initiatives which we are pursuing are not successfully executed, our consolidated results of operations, financial position or cash flows could materially and adversely be affected. We may be subject to information technology system failures, network disruptions and breaches in data security. We rely to a large extent upon information technology systems and infrastructure to operate our business. The size and complexity of our information technology systems make them potentially vulnerable to failure, malicious intrusion and random attack. Acquisitions have resulted in further de-centralization of systems and additional complexity in our systems infrastructure. Likewise, data security breaches by employees or others with permitted access to our systems may pose a risk that sensitive data may be exposed to unauthorized persons or to the public. While we have invested in protection of data and information technology, there can be no assurance that our efforts will prevent failures, cybersecurity attacks or breaches in our systems that could cause reputational damage, business disruption or legal and regulatory costs; could result in third-party claims; could result in compromise or misappropriation of our intellectual property, trade secrets or sensitive information; or could otherwise adversely affect our business. Certain of our customer offerings include digital components, such as remote monitoring of certain customer operations. A breach of those remote monitoring systems could expose customer data giving rise to potential third-party claims and reputational damage. There may be other related challenges and risks as we complete implementation of our ERP system upgrade.

17
We are pursuing a plan to separate and combine our Upstream Energy business with Apergy Corporation in a tax-efficient reverse Morris Trust transaction. The proposed transaction may not be completed on the currently contemplated timeline or at all and may not achieve the intended benefits. We have entered into definitive agreements with ChampionX and Apergy pursuant to which we will separate the Upstream Energy business of our Global Energy segment and combine it with Apergy in a tax-efficient reverse Morris Trust transaction. There can be no assurance of the timing of a transaction with Apergy, or whether any such transaction will take place at all. The transaction is subject to closing conditions, including approval by Apergy’s stockholders, approval by certain foreign regulatory authorities and receipt of opinions with respect to the tax-free nature of the proposed transaction, and there can be no assurance that we will receive the required approvals in a timely manner or at all, or that such approvals will not contain adverse conditions. We also have no assurance that we will be able to realize the intended benefits and tax treatment of the transaction or that the new combined company will perform as expected. The announcement and pendency of the transaction could also cause disruptions in our and Apergy’s business, including potential adverse reactions or changes to business relationships and competitive responses to the transaction. The transaction will also require significant amounts of time and effort which could divert management’s attention from operating and growing our business. In addition, depending on Apergy’s stock price at the closing of the transaction, the transaction may result in a book gain or loss to Ecolab. Any such book gain or loss would be reported in Ecolab’s financial statements as discontinued operations. Any of the foregoing could materially and adversely affect our business, financial condition and results of operations. We depend on key personnel to lead our business. Our continued success will largely depend on our ability to attract, retain and develop a high caliber of talent and on the efforts and abilities of our executive officers and certain other key employees, particularly those with sales and sales management responsibilities to drive business growth, development and profitability. As we continue to grow our business, make acquisitions, expand our geographic scope and offer new products and services, we need the organizational talent necessary to ensure effective succession for executive officer and key employee roles in order to meet the growth, development and profitability goals of our business. Our operations could be materially and adversely affected if for any reason we were unable to attract, retain or develop such officers or key employees. Our growth depends upon our ability to successfully compete with respect to value, innovation and customer support. We have numerous global, national, regional and local competitors. Our ability to compete depends in part on providing high quality and high value-added products, technology and service. We must also continue to identify, develop and commercialize innovative, profitable and high value-added products for niche applications and commercial digital applications. We have made significant investments in commercial digital product offerings, and our culture and expertise must continue to evolve to develop, support and profitably deploy commercial digital offerings, which are becoming an increasingly important part of our business. There can be no assurance that we will be able to accomplish our technology development goals or that technological developments by our competitors will not place certain of our products, technology or services at a competitive disadvantage in the future. In addition, certain of the new products that we have under development will be offered in markets in which we do not currently compete, and there can be no assurance that we will be able to compete successfully in those new markets. If we fail to introduce new technologies or commercialize our digital offerings on a timely and profitable basis, we may lose market share and our consolidated results of operations, financial position or cash flows could be materially and adversely affected. Our significant non-U.S. operations expose us to global economic, political and legal risks that could impact our profitability. We have significant operations outside the United States, including joint ventures and other alliances. We conduct business in approximately 170 countries and, in 2019, approximately 46% of our net sales originated outside the United States. There are inherent risks in our international operations, including:
• exchange controls and currency restrictions; • currency fluctuations and devaluations; • tariffs and trade barriers; • export duties and quotas; • changes in the availability and pricing of raw materials, energy and utilities; • changes in local economic conditions; • changes in laws and regulations, including the imposition of economic or trade sanctions affecting international commercial
transactions; • impact from Brexit and the possibility of similar events in other EU member states; • difficulties in managing international operations and the burden of complying with international and foreign laws; • requirements to include local ownership or management in our business; • economic and business objectives that differ from those of our joint venture partners; • exposure to possible expropriation, nationalization or other government actions; • restrictions on our ability to repatriate dividends from our subsidiaries; • unsettled political conditions, military action, civil unrest, acts of terrorism, force majeure, war or other armed conflict; and • countries whose governments have been hostile to U.S.-based businesses.
18
Effective January 31, 2020, the U.K. has formally left the European Union. The U.K.’s relationship with the EU will no longer be governed by the EU Treaties, but instead by the terms of the Withdrawal Agreement agreed between the U.K. and the EU in late 2019. The Withdrawal Agreement provides for a “transition” period, which commenced the moment the U.K. left the EU and is currently set to end on December 31, 2020. At the end of the transition period, there may be significant changes to the U.K.’s business environment. While the effects of Brexit will depend on any agreements the U.K. makes to retain access to EU markets or the failure to reach such agreements, the uncertainties created by Brexit, any resolution between the U.K. and EU countries or the failure to reach any such resolutions, could adversely affect our relationships with customers, suppliers and employees and could have a material adverse effect our business. In addition, changes in U.S. or foreign government policy on international trade, including the imposition or continuation of tariffs, could materially and adversely affect our business. In 2018, the U.S. imposed tariffs on certain imports from China and other countries, resulting in retaliatory tariffs by China and other countries. While the U.S. and China signed what is being known as the Phase One Deal in January 2020, which included the suspension and rollback of tariffs, any new tariffs imposed by the U.S., China or other countries or any additional retaliatory measures by any of these countries, could increase our costs, reduce our sales and earnings or otherwise have an adverse effect on our operations. Also, because of uncertainties regarding the interpretation and application of laws and regulations and the enforceability of intellectual property and contract rights, we face risks in some countries that our intellectual property rights and contract rights would not be enforced by local governments. We are also periodically faced with the risk of economic uncertainty, which has impacted our business in some countries. Other risks in international business also include difficulties in staffing and managing local operations, including managing credit risk to local customers and distributors. Further, our operations outside the United States require us to comply with a number of United States and international regulations, including anti-corruption laws such as the United States Foreign Corrupt Practices Act and the United Kingdom Bribery Act, as well as U.S. and international economic sanctions regulations. We have internal policies and procedures relating to such regulations; however, there is risk that such policies and procedures will not always protect us from the misconduct or reckless acts of employees or representatives, particularly in the case of recently acquired operations that may not have significant training in applicable compliance policies and procedures. Violations of such laws and regulations could result in disruptive investigations of the Company, significant fines and sanctions, which could have a material adverse effect on our consolidated results of operations, financial position or cash flows. Our overall success as a global business depends, in part, upon our ability to succeed in differing economic, social, legal and political conditions. We may not continue to succeed in developing and implementing policies and strategies that are effective in each location where we do business, which could have a material adverse effect on our consolidated results of operations, financial position or cash flows. Our results could be materially and adversely affected by difficulties in securing the supply of certain raw materials or by fluctuations in the cost of raw materials. The prices of raw materials used in our business can fluctuate from time to time, and in recent years we have experienced periods of increased raw material costs. Changes in raw material prices, unavailability of adequate and reasonably priced raw materials or substitutes for those raw materials, or the inability to obtain or renew supply agreements on favorable terms can materially and adversely affect our consolidated results of operations, financial position or cash flows. In addition, volatility and disruption in economic activity and conditions could disrupt or delay the performance of our suppliers and thus impact our ability to obtain raw materials at favorable prices or on favorable terms, which may materially and adversely affect our business. Consolidation of our customers and vendors could materially and adversely affect our results. Customers and vendors in the foodservice, hospitality, travel, healthcare, energy, food processing and pulp and paper industries, as well as other industries we serve, have consolidated in recent years and that trend may continue. This consolidation could have a material adverse impact on our ability to retain customers and on our pricing, margins and consolidated results of operations. Our business depends on our ability to comply with laws and governmental regulations, and we may be materially and adversely affected by changes in laws and regulations. Our business is subject to numerous laws and regulations relating to the environment, including evolving climate change standards, and to the manufacture, storage, distribution, sale and use of our products as well as to the conduct of our business generally, including employment and labor laws. Compliance with these laws and regulations exposes us to potential financial liability and increases our operating costs. Regulation of our products and operations continues to increase with more stringent standards, causing increased costs of operations and potential for liability if a violation occurs. The potential cost to us relating to environmental and product registration laws and regulations is uncertain due to factors such as the unknown magnitude and type of possible contamination and clean-up costs, the complexity and evolving nature of laws and regulations, and the timing and expense of compliance. Changes to current laws (including tax laws), regulations and policies could impose new restrictions, costs or prohibitions on our current practices which would have a material adverse effect on our consolidated results of operations, financial position or cash flows. Changes to labor and employment laws and regulations, as well as related rulings by courts and administrative bodies, could materially and adversely affect our operations and expose us to potential financial liability.

19
Subsidiaries of ChampionX are defendants in pending lawsuits alleging negligence and injury resulting from the use of COREXITTM dispersant in response to the Deepwater Horizon oil spill, which could expose these subsidiaries to monetary damages or settlement costs. As described in Part II, Item 8, Note 15, “Commitments and Contingencies,” of this Form 10-K, certain entities that are or will become subsidiaries of ChampionX upon completion of the transactions to separate and combine our Upstream Energy business with Apergy Corporation (collectively the “COREXIT Defendants”) are among the defendants in a number of class action and individual plaintiff lawsuits arising from the use of COREXIT™ dispersant in response to the Deepwater Horizon oil spill, which could expose the COREXIT Defendants to monetary damages or settlement costs. The plaintiffs in these matters have claimed damages under products liability, tort and other theories. There currently remain three cases pending against the COREXIT Defendants. It is expected that they will be dismissed pursuant to a November 28, 2012 order granting the COREXIT Defendants’ motion for summary judgment. ChampionX cannot predict whether there will be an appeal of the dismissal, the involvement the COREXIT Defendants might have in these matters in the future or the potential for future litigation. However, although ChampionX believes it has rights to contribution and/or indemnification from third parties in connection with these lawsuits if an appeal by plaintiffs in these lawsuits is brought and won, these suits could have a material adverse effect on the business of ChampionX and its financial condition, results of operations or cash flows. The COREXIT Defendants continue to sell the COREXIT™ oil dispersant product and previously sold product remains in the inventories of individual customers and oil spill response organizations. ChampionX cannot predict the potential for future litigation with respect to such sales or inventory. However, if one or more of such lawsuits are brought and won, these suits could have a material adverse impact on the combined company’s financial results. We enter into multi-year contracts with customers that could impact our results. Our multi-year contracts with some of our customers include terms affecting our pricing flexibility. There can be no assurance that these restraints will not have a material adverse impact on our margins and consolidated results of operations. If we are unsuccessful in integrating acquisitions, our business could be materially and adversely affected. As part of our long-term strategy, we seek to acquire complementary businesses. There can be no assurance that we will find attractive acquisition candidates or succeed at effectively managing the integration of acquired businesses into existing businesses. If the underlying business performance of such acquired businesses deteriorates, the expected synergies from such transactions do not materialize or we fail to successfully integrate new businesses into our existing businesses, our consolidated results of operations, financial position or cash flows could be materially and adversely affected. Changes in tax laws and unanticipated tax liabilities could materially and adversely affect the taxes we pay and our profitability. We are subject to income and other taxes in the United States and foreign jurisdictions, and our operations, plans and results are affected by tax and other initiatives around the world. In particular, we are affected by the impact of changes to tax laws or related authoritative interpretations in the United States, including tax reform under the 2017 Tax Cuts and Jobs Act (the “Tax Act”), which includes broad and complex changes to the United States tax code, and the state tax response to the Tax Act, including, but not limited to variability in our future tax rate. We are also subject to changes in tax law outside the United States. In addition, we are impacted by settlements of pending or any future adjustments proposed by the IRS or other taxing authorities in connection with our tax audits, all of which will depend on their timing, nature and scope. Increases in income tax rates, changes in income tax laws (including regulations which interpret the Tax Act) or unfavorable resolution of tax matters could have a material adverse impact on our financial results. Future events may impact our deferred tax position, including the utilization of foreign tax credits and undistributed earnings of international affiliates that are considered to be reinvested indefinitely. We evaluate the recoverability of deferred tax assets and the need for deferred tax liabilities based on available evidence. This process involves significant management judgment about assumptions that are subject to change from period to period based on changes in tax laws or variances between future projected operating performance and actual results. We are required to establish a valuation allowance for deferred tax assets if we determine, based on available evidence at the time the determination is made, that it is more likely than not that some portion or all of the deferred tax assets will not be realized. In making this determination, we evaluate all positive and negative evidence as of the end of each reporting period. Future adjustments (either increases or decreases), to the deferred tax asset valuation allowance are determined based upon changes in the expected realization of the net deferred tax assets. The realization of the deferred tax assets ultimately depends on the existence of sufficient taxable income in either the carry-back or carry-forward periods under the tax law. Due to significant estimates used to establish the valuation allowance and the potential for changes in facts and circumstances, it is reasonably possible that we will be required to record adjustments to the valuation allowance in future reporting periods. Changes to the valuation allowance or the amount of deferred tax liabilities could have a material adverse effect on our consolidated results of operations or financial position. Further, should we change our assertion regarding the permanent reinvestment of the undistributed earnings of international affiliates, a deferred tax liability may need to be established.

20
Our indebtedness may limit our operations and our use of our cash flow, and any failure to comply with the covenants that apply to our indebtedness could materially and adversely affect our liquidity and financial statements. As of December 31, 2019, we had approximately $6.3 billion in outstanding indebtedness, with approximately $80 million in the form of floating rate debt. Our debt level and related debt service obligations may have negative consequences, including:
• requiring us to dedicate significant cash flow from operations to the payment of principal and interest on our debt, which reduces the funds we have available for other purposes such as acquisitions and capital investment;
• reducing our flexibility in planning for or reacting to changes in our business and market conditions;
• exposing us to interest rate risk since a portion of our debt obligations are at variable rates. For example, a one percentage
point increase in the average interest rate on our floating rate debt at December 31, 2019 would increase future interest expense by approximately $1 million per year; and
• increasing our cost of funds and materially and adversely affecting our liquidity and access to the capital markets should we fail
to maintain the credit ratings assigned to us by independent rating agencies. If we add new debt, the risks described above could increase. Severe public health outbreaks may materially and adversely impact our business. Our business could be adversely affected by the effect of a public health epidemic. The United States and other countries have experienced, and may experience in the future, public health outbreaks such as coronavirus, Zika virus, Avian Flu, SARS and H1N1 influenza. A prolonged occurrence of a contagious disease such as these could result in a significant downturn in the foodservice, hospitality and travel industries and also may result in health or other government authorities imposing restrictions on travel further impacting our end markets. Any of these events could result in a significant drop in demand for some of our products and services and materially and adversely affect our business. Uncertainty with respect to the impact on our financial results of the coronavirus outbreak is discussed further in Management Discussion & Analysis located at Part II, Item 7, of this form 10-K under the heading “Global Economic and Political Environment.” We incur significant expenses related to the amortization of intangible assets and may be required to report losses resulting from the impairment of goodwill or other assets recorded in connection with the Nalco and Champion transactions and other acquisitions. We expect to continue to complete selected acquisitions and joint venture transactions in the future. In connection with acquisition and joint venture transactions, applicable accounting rules generally require the tangible and intangible assets of the acquired business to be recorded on the balance sheet of the acquiring company at their fair values. Intangible assets other than goodwill are required to be amortized over their estimated useful lives and this expense may be significant. Any excess in the purchase price paid by the acquiring company over the fair value of tangible and intangible assets of the acquired business is recorded as goodwill. If it is later determined that the anticipated future cash flows from the acquired business may be less than the carrying values of the assets and goodwill of the acquired business, the assets or goodwill may be deemed to be impaired. In this case, the acquiring company may be required under applicable accounting rules to write down the value of the assets or goodwill on its balance sheet to reflect the extent of the impairment. This write-down of assets or goodwill is generally recognized as a non-cash expense in the statement of operations of the acquiring company for the accounting period during which the write down occurs. As of December 31, 2019, we had goodwill of $7.3 billion which is maintained in various reporting units, including goodwill from the Nalco and Champion transactions. If we determine that any of the assets or goodwill recorded in connection with the Nalco and Champion transactions or any other prior or future acquisitions or joint venture transactions have become impaired, we will be required to record a loss resulting from the impairment. Impairment losses could be significant and could have a material adverse effect on our consolidated results of operations and financial position. A chemical spill or release could materially and adversely impact our business. As a manufacturer and supplier of chemical products, there is a potential for chemicals to be accidentally spilled, released or discharged, either in liquid or gaseous form, during production, transportation, storage or use. Such a release could result in environmental contamination as well as a human or animal health hazard. Accordingly, such a release could have a material adverse effect on our consolidated results of operations, financial position or cash flows. Extraordinary events may significantly impact our business. The occurrence of (a) litigation or claims, (b) the loss or insolvency of a major customer or distributor, (c) repeated or prolonged federal government shutdowns or similar events, (d) war (including acts of terrorism or hostilities which impact our markets), (e) natural or manmade disasters, (f) water shortages or (g) severe weather conditions affecting our operations or the energy, foodservice, hospitality and travel industries may have a material adverse effect on our business. Defense of litigation, particularly certain types of actions such as antitrust, patent infringement, personal injury, product liability, wage hour and class action lawsuits, can be costly and time consuming even if ultimately successful, and if not successful could have a material adverse effect on our consolidated results of operations, financial position or cash flows.
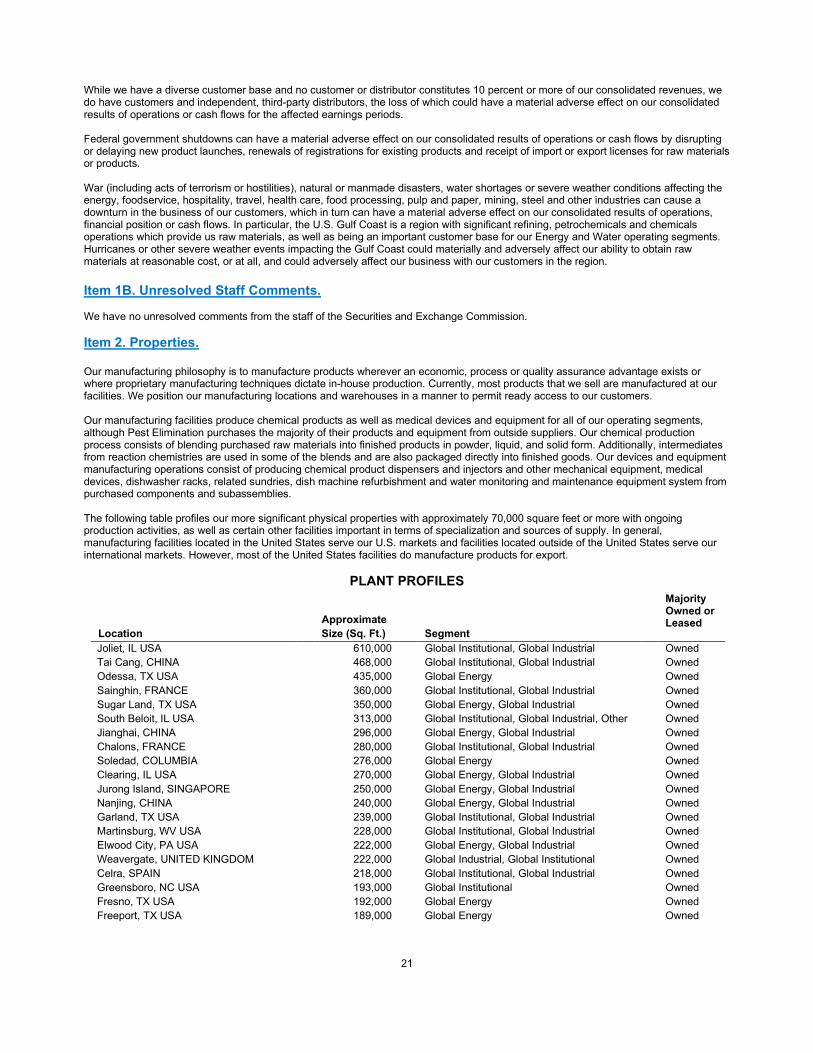
21
While we have a diverse customer base and no customer or distributor constitutes 10 percent or more of our consolidated revenues, we do have customers and independent, third-party distributors, the loss of which could have a material adverse effect on our consolidated results of operations or cash flows for the affected earnings periods. Federal government shutdowns can have a material adverse effect on our consolidated results of operations or cash flows by disrupting or delaying new product launches, renewals of registrations for existing products and receipt of import or export licenses for raw materials or products. War (including acts of terrorism or hostilities), natural or manmade disasters, water shortages or severe weather conditions affecting the energy, foodservice, hospitality, travel, health care, food processing, pulp and paper, mining, steel and other industries can cause a downturn in the business of our customers, which in turn can have a material adverse effect on our consolidated results of operations, financial position or cash flows. In particular, the U.S. Gulf Coast is a region with significant refining, petrochemicals and chemicals operations which provide us raw materials, as well as being an important customer base for our Energy and Water operating segments. Hurricanes or other severe weather events impacting the Gulf Coast could materially and adversely affect our ability to obtain raw materials at reasonable cost, or at all, and could adversely affect our business with our customers in the region. Item 1B. Unresolved Staff Comments. We have no unresolved comments from the staff of the Securities and Exchange Commission. Item 2. Properties. Our manufacturing philosophy is to manufacture products wherever an economic, process or quality assurance advantage exists or where proprietary manufacturing techniques dictate in-house production. Currently, most products that we sell are manufactured at our facilities. We position our manufacturing locations and warehouses in a manner to permit ready access to our customers. Our manufacturing facilities produce chemical products as well as medical devices and equipment for all of our operating segments, although Pest Elimination purchases the majority of their products and equipment from outside suppliers. Our chemical production process consists of blending purchased raw materials into finished products in powder, liquid, and solid form. Additionally, intermediates from reaction chemistries are used in some of the blends and are also packaged directly into finished goods. Our devices and equipment manufacturing operations consist of producing chemical product dispensers and injectors and other mechanical equipment, medical devices, dishwasher racks, related sundries, dish machine refurbishment and water monitoring and maintenance equipment system from purchased components and subassemblies. The following table profiles our more significant physical properties with approximately 70,000 square feet or more with ongoing production activities, as well as certain other facilities important in terms of specialization and sources of supply. In general, manufacturing facilities located in the United States serve our U.S. markets and facilities located outside of the United States serve our international markets. However, most of the United States facilities do manufacture products for export.
PLANT PROFILES
Location Approximate Size (Sq. Ft.) Segment
Majority Owned or Leased
Joliet, IL USA 610,000 Global Institutional, Global Industrial Owned Tai Cang, CHINA 468,000 Global Institutional, Global Industrial Owned Odessa, TX USA 435,000 Global Energy Owned Sainghin, FRANCE 360,000 Global Institutional, Global Industrial Owned Sugar Land, TX USA 350,000 Global Energy, Global Industrial Owned South Beloit, IL USA 313,000 Global Institutional, Global Industrial, Other Owned Jianghai, CHINA 296,000 Global Energy, Global Industrial Owned Chalons, FRANCE 280,000 Global Institutional, Global Industrial Owned Soledad, COLUMBIA 276,000 Global Energy Owned Clearing, IL USA 270,000 Global Energy, Global Industrial Owned Jurong Island, SINGAPORE 250,000 Global Energy, Global Industrial Owned Nanjing, CHINA 240,000 Global Energy, Global Industrial Owned Garland, TX USA 239,000 Global Institutional, Global Industrial Owned Martinsburg, WV USA 228,000 Global Institutional, Global Industrial Owned Elwood City, PA USA 222,000 Global Energy, Global Industrial Owned Weavergate, UNITED KINGDOM 222,000 Global Industrial, Global Institutional Owned Celra, SPAIN 218,000 Global Institutional, Global Industrial Owned Greensboro, NC USA 193,000 Global Institutional Owned Fresno, TX USA 192,000 Global Energy Owned Freeport, TX USA 189,000 Global Energy Owned

22
Location Approximate Size (Sq. Ft.) Segment
Majority Owned or Leased
Las Americas, DOMINICAN REPUBLIC 182,000 Global Institutional Owned Jacksonville, FL USA 181,000 Global Institutional Leased Garyville, LA USA 178,000 Global Energy, Global Industrial Owned Nieuwegein, NETHERLANDS 168,000 Global Institutional, Global Industrial Owned La Romana, DOMINICAN REPUBLIC 160,000 Global Institutional Leased Tessenderlo, BELGIUM 153,000 Global Institutional Owned Cheltenham, AUSTRALIA 145,000 Global Institutional, Global Industrial Owned Suzano, BRAZIL 142,000 Global Energy, Global Industrial Owned McDonough, GA USA 141,000 Global Institutional, Global Industrial Owned Darra, AUSTRALIA 138,000 Global Institutional, Global Industrial Owned Corsicana, TX USA 137,000 Global Energy Owned Burlington, ON CANADA 136,000 Global Energy, Global Industrial Owned Eagan, MN USA 133,000 Global Institutional, Global Industrial, Other Owned Huntington, IN USA 127,000 Global Institutional, Global Industrial Owned Rozzano, ITALY 126,000 Global Institutional, Global Industrial Owned City of Industry, CA USA 125,000 Global Institutional, Global Industrial Owned Mississauga, ON CANADA 120,000 Global Institutional, Global Industrial Leased Aberdeen, UNITED KINGDOM 118,000 Global Energy Owned Elk Grove Village, IL USA 115,000 Global Institutional Leased Biebesheim, GERMANY 109,000 Global Energy, Global Industrial Owned Fort Worth, TX USA 101,000 Global Institutional Leased Johannesburg, SOUTH AFRICA 100,000 Global Institutional, Global Industrial Owned Hamilton, NEW ZEALAND 96,000 Global Institutional, Global Industrial Owned Calgary, AB CANADA 94,000 Global Energy Owned Kwinana, AUSTRALIA 87,000 Global Institutional, Global Industrial Owned Yangsan, KOREA 85,000 Global Energy, Global Industrial Owned Cisterna, ITALY 80,000 Global Industrial Owned Cuautitlan, MEXICO 76,000 Global Institutional, Global Industrial Owned Barueri, BRAZIL 75,000 Global Institutional, Global Industrial Leased Mullingar, IRELAND 74,000 Global Institutional, Global Industrial Leased Mosta, MALTA 73,000 Global Institutional Leased Noviciado, CHILE 70,000 Global Industrial, Global Institutional Owned Navanakorn, THAILAND 67,000 Global Institutional, Global Industrial Leased Aubagne, FRANCE 65,000 Global Institutional Leased Rovigo, ITALY 60,000 Global Institutional Owned Siegsdorf, GERMANY 56,000 Global Institutional, Global Industrial Owned Verona, ITALY 55,000 Global Institutional Owned Guangzhou, CHINA 55,000 Global Institutional, Global Industrial Owned Lerma, MEXICO 49,000 Global Industrial Owned Maribor, SLOVENIA 46,400 Global Institutional, Global Industrial Owned Leeds, UNITED KINGDOM 25,000 Global Institutional Owned Baglan, UNITED KINGDOM 24,400 Global Institutional Leased Noda, JAPAN 22,000 Global Institutional, Global Industrial Owned Steritimak, RUSSIA 20,000 Global Energy, Global Industrial Owned
Generally, our manufacturing facilities are adequate to meet our existing in-house production needs. We continue to invest in our plant sites to maintain viable operations and to add capacity as necessary to meet business imperatives. Most of our manufacturing plants also serve as distribution centers. In addition, we operate distribution centers around the world, most of which are leased, and utilize third party logistics service providers to facilitate the distribution of our products and services. Our corporate headquarters is comprised of a six-story building and a 17-story building that we own in St. Paul, Minnesota. We also own a 90-acre campus in Eagan, Minnesota that houses a significant research and development center, a data center and training facilities as well as several of our administrative functions.

23
We also have a significant business presence in Naperville, Illinois, where our Water and Paper operating segments maintain their principal administrative offices and research center, as well as in Greensboro, North Carolina, where our Specialty operating segment maintains its principal administrative offices and a research center. Our Energy operating segment maintains Company-owned administrative and research facilities in Sugar Land, Texas and additional research facilities in Fresno, Texas. Significant regional administrative and/or research facilities are located in Campinas, Brazil, Leiden, Netherlands, and Pune, India, which we own, and in Dubai, UAE; Lille, France; Miramar, Florida; Monheim, Germany; Singapore, Shanghai, China; and Zurich, Switzerland; which we lease. We also have a network of small leased sales offices in the United States and, to a lesser extent, in other parts of the world. Item 3. Legal Proceedings. Discussion of legal proceedings is incorporated by reference from Part II, Item 8, Note 15, “Commitments and Contingencies,” of this Form 10-K and should be considered an integral part of Part I, Item 3, “Legal Proceedings.” Discussion of other environmental-related legal proceedings is incorporated by reference from Part I, Item 1 above, under the heading “Environmental and Regulatory Considerations.” Item 4. Mine Safety Disclosures. Not applicable.
PART II
Item 5. Market for Registrant’s Common Equity, Related Stockholder Matters and Issuer Purchases of Equity Securities. Market Information Our common stock is listed on the New York Stock Exchange under the symbol “ECL.” Our common stock is also traded on an unlisted basis on certain other United States exchanges. Holders On January 31, 2020, we had 5,698 holders of record of our Common Stock. Issuer Purchases of Equity Securities
Total number of shares Maximum number of purchased as part of shares that may yet be Total number of Average price paid publicly announced purchased under the Period shares purchased (1) per share (2) plans or programs (3) plans or programs (3) October 1-31, 2019 - $- - 6,820,810 November 1-30, 2019 2,833 192.0670 - 6,820,810 December 1-31, 2019 24,260 188.7098 15,800 6,805,010
Total 27,093 $189.0609 15,800 6,805,010 (1) Includes 11,293 shares reacquired from employees and/or directors to satisfy the exercise price of stock options or shares
surrendered to satisfy statutory tax obligations under our stock incentive plans. (2) The average price paid per share includes brokerage commissions associated with publicly announced plan purchases plus the
value of such other reacquired shares. (3) As announced on February 24, 2015, our Board of Directors authorized the repurchase of up to 20,000,000 shares. Subject to
market conditions, we expect to repurchase all shares under these authorizations, for which no expiration date has been established, in open market or privately negotiated transactions, including pursuant to Rule 10b5-1 and accelerated share repurchase program.

24
Item 6. Selected Financial Data.
(millions, except per share amounts) 2019 (1) 2018 (2) 2017 (3) 2016 (4) 2015 (5) Year ended December 31:
Net sales $14,906.3 $14,668.2 $13,835.9 $13,151.8 $13,545.1 Operating income 2,013.8 1,947.0 1,950.1 1,870.2 1,561.3 Net income attributable to Ecolab 1,558.9 1,429.1 1,504.6 1,229.0 1,002.1 Basic earnings per share 5.41 4.95 5.20 4.20 3.38 Diluted earnings per share, as reported (U.S. GAAP) 5.33 4.88 5.12 4.14 3.32 Cash dividends declared per common share 1.85 1.69 1.52 1.42 1.34
Diluted earnings per share, as reported (U.S. GAAP) Adjustments: $5.33 $4.88 $5.12 $4.14 $3.32
Special (gains) and charges 0.69 0.35 0.19 0.21 1.25 Discrete tax expense (benefits) (0.20) 0.02 (0.63) 0.01 (0.21)
Adjusted diluted earnings per share (Non-GAAP) $5.82 $5.25 $4.68 $4.37 $4.37
At December 31: Total assets $20,869.1 $20,074.5 $19,963.5 $18,331.1 $18,641.7 Long-term debt (excluding portions due within one year) 5,973.5 6,301.6 6,758.3 6,145.7 4,260.2
Selected financial data for 2015 is not presented on a comparable basis due to the adoption of ASU 2014-09, Revenue from Contracts with Customers. Per share amounts do not necessarily sum due to rounding. (1) Special (gains) and charges for 2019 include the following charges net of tax, net restructuring charges of $106.6 million, ChampionX separation charges of $71.5 million, acquisition and integration charges of $9.9 million and litigation and other charges of $7.5 million. Discrete tax expense (benefits) for 2019 include benefits associated with stock compensation excess tax benefits of $43.1 million, favorable adjustments to the estimate for U.S. tax reform one-time repatriation tax benefit of $3.1 million and other tax net benefits of $12.5 million. (2) Special (gains) and charges for 2018 include the following charges net of tax, a commitment to the Ecolab Foundation of $18.9 million, net restructuring charges of $77.2 million, acquisition and integration charges of $5.7 million and litigation and other charges of $1.0 million. Discrete tax expense (benefits) for 2018 include adjustments to the estimate for U.S. tax reform one-time repatriation tax expense of $66.0 million, benefits associated with stock compensation excess tax benefits of $28.1 million, a favorable adjustment related to changes in estimates and an IRS approved method change in the Company's filed U.S. federal tax returns of $39.9 million and other tax expense of $6.7 million. (3) Special (gains) and charges for 2017 include the following charges net of tax, acquisition and integration charges of $18.5 million, net restructuring charges of $32.4 million, charges related to a Global Energy vendor contract termination of $14.4 million and charges on extinguished debt of $13.6 million. Gains, net of tax, include gain on sale of Equipment Care of $12.4 million, tax benefits on the repatriation of cash to the U.S. of $7.8 million and a net gain of $2.7 million from other activity. Discrete tax expense (benefits) for 2017 include a net benefit of $158.9 million for repricing of U.S. deferred tax positions to the U.S. tax reform rate, offset by a one-time repatriation tax on foreign earnings and stock compensation excess tax benefits of $39.6 million. Expenses include recognizing adjustments from filing our 2016 U.S. federal income tax return and release of uncertain tax positions totaling $14.3 million. (4) Special (gains) and charges for 2016 include net of tax, charges of $50.0 million associated with the downturn in the global energy market and litigation related charges of $26.4 million. Gains, net of tax, include a net gain for restructuring and a net gain for other activity of $3.2 million. Discrete tax expense (benefits) for 2016 include net expense of $3.9 million driven primarily from adjustments to deferred tax asset and liability positions, recognizing adjustments from filing our 2015 U.S. federal income tax return, tax charges related to optimizing our business structure and settlement of international tax matters offset by benefits driven primarily by the release of reserves for uncertain tax positions due to expiration of statute of limitations in non-U.S. jurisdictions, settlement of international tax matters, remeasurements of certain deferred tax assets and liabilities resulting from the application of an updated tax rate in an international jurisdiction and valuation allowance releases. (5) Special (gains) and charges for 2015 include the following charges net of tax, Venezuelan charges of $235.7 million, restructuring charges of $75.5 million, charges of $38.3 million related to litigation related charges, a loss on the sale of a portion of our Ecovation business and the net impact of inventory reserve and inventory cost policy harmonization efforts, fixed asset impairment of $15.4 million and integration costs of $12.0 million. Discrete tax expense (benefits) for 2015 include net benefits of $63.3 million driven primarily from our ability to recognize a worthless stock deduction for the tax basis in a wholly owned domestic subsidiary, release of valuation allowances on certain deferred tax assets and a refund claim for taxes paid in a prior period resulting from updated IRS regulations, finalization of prior year IRS audits and other statute of limitation tax reserve releases offset by a change to a deferred tax liability resulting from the Naperville facility transaction.

25
Item 7. Management’s Discussion and Analysis of Financial Condition and Results of Operations. The following management discussion and analysis (“MD&A”) provides information that we believe is useful in understanding our operating results, cash flows and financial condition. We provide quantitative information about the material sales drivers including the impact of changes in volume and pricing and the effect of acquisitions and changes in foreign currency at the corporate and reportable segment level. We also provide quantitative information regarding special (gains) and charges, discrete tax items and other significant factors we believe are useful for understanding our results. Such quantitative drivers are supported by comments meant to be qualitative in nature. Qualitative factors are generally ordered based on estimated significance. The discussion should be read in conjunction with the consolidated financial statements and related notes included in this Form 10-K. Our consolidated financial statements are prepared in accordance with U.S. GAAP. This discussion contains various Non-GAAP Financial Measures and also contains various forward-looking statements within the meaning of the Private Securities Litigation Reform Act of 1995. We refer readers to the statements and information set forth in the sections entitled “Non-GAAP Financial Measures” at the end of this MD&A, and “Forward-Looking Statements” and “Risk Factors” within Items 1 and 1A of this Form 10-K. We also refer readers to the tables within the section entitled “Results of Operations” of this MD&A for reconciliation information of Non-GAAP measures to U.S. GAAP. Comparability of Results Fixed Currency Foreign Exchange Rates Management evaluates the sales and operating income performance of our non-U.S. dollar functional currency international operations based on fixed currency exchange rates, which eliminate the impact of exchange rate fluctuations on our international operations. Fixed currency amounts are updated annually at the beginning of each year based on translation into U.S. dollars at foreign currency exchange rates established by management, with all periods presented using such rates. Public currency rate data provided within the “Segment Performance” section of this MD&A reflect amounts translated at actual public average rates of exchange prevailing during the corresponding period and is provided for informational purposes only. Comparability of Reportable Segments We made immaterial changes to our reportable segments, including the movement of certain customers and cost allocations between reportable segments. All comparisons and discussion throughout the MD&A reflect these changes. Impact of Acquisitions and Divestitures Acquisition adjusted growth rates exclude the results of our acquired businesses from the first twelve months post acquisition and exclude the results of our divested businesses from the twelve months prior to divestiture.

26
EXECUTIVE SUMMARY We achieved improved sales and strong earnings growth in 2019 as we drove new product introductions, new business wins and improved operating efficiency in a generally steady market environment. Increased pricing was achieved to more than offset unfavorable sales mix. Along with higher other income and lower interest expense, adjusted diluted earnings per share leveraged the good operating income growth and delivered the year’s double-digit adjusted diluted EPS growth. Sales Reported sales increased 2% to $14.9 billion in 2019 from $14.7 billion in 2018. Sales were positively impacted by pricing. When measured in fixed rates of foreign currency exchange, fixed currency sales increased 4% compared to the prior year. Acquisition adjusted fixed currency sales increased 3% compared to the prior year. Gross Margin Our reported gross margin was 41.5% of sales for 2019, compared to our 2018 reported gross margin of 41.2%. Excluding the impact of special (gains) and charges included in cost of sales from both 2019 and 2018, our adjusted gross margin was 41.7% in 2019 and 41.3% in 2018. Operating Income Reported operating income increased 3% to $2.01 billion in 2019, compared to $1.95 billion in 2018. Adjusted operating income, excluding the impact of special (gains) and charges, increased 9% in 2019. When measured in fixed rates of foreign currency exchange, adjusted fixed currency operating income increased 11% in 2019. Earnings Attributable to Ecolab Per Common Share (“EPS”) Reported diluted EPS increased 9% to $5.33 in 2019 compared to $4.88 in 2018. Special (gains) and charges had an impact on both years. Special (gains) and charges in 2019 were driven primarily by the impact of restructuring charges, the ChampionX separation charges, discrete tax items, acquisition and integration charges, litigation and other charges. Special (gains) and charges in 2018 were driven primarily by the impact of restructuring charges and our commitment to the Ecolab Foundation. Special (gains) and charges in 2017 were driven primarily by the impact of income tax reform, restructuring charges, other discrete taxes, acquisition and integration charges and the gain on sale of Equipment Care. Adjusted diluted EPS, which exclude the impact of special (gains) and charges and discrete tax items increased 11% to $5.82 in 2019 compared to $5.25 in 2018. Balance Sheet We remain committed to maintaining “A” range ratings metrics, supported by our current credit ratings of A-/Baa1/A- by Standard & Poor’s, Moody’s Investor Services and Fitch. Our strong balance sheet has allowed us continued access to capital at attractive rates. Net Debt to EBITDA Our net debt to earnings before interest, taxes, depreciation and amortization (“EBITDA”) was 2.0 and 2.3 for 2019 and 2018, respectively. We view these ratios as important indicators of the operational and financial health of our organization. See the “Net Debt to EBITDA” table on page 43 for reconciliation information. Cash Flow Cash flow from operating activities was $2.4 billion in 2019 compared to $2.3 billion in 2018. We continued to generate strong cash flow from operations, allowing us to fund our ongoing operations, acquisitions, investments in our business, debt repayments, pension obligations and return cash to our shareholders through share repurchases and dividend payments. Dividends We increased our quarterly cash dividend 2% in December 2019 to an indicated annual rate of $1.88 per share. The increase represents our 28th consecutive annual dividend rate increase and the 83rd consecutive year we have paid cash dividends. Our outstanding dividend history reflects our continued growth and development, strong cash flows, solid financial position and confidence in our business prospects for the years ahead.

27
CRITICAL ACCOUNTING ESTIMATES Our consolidated financial statements are prepared in accordance with U.S. GAAP. We have adopted various accounting policies to prepare the consolidated financial statements in accordance with U.S. GAAP. Our significant accounting policies are disclosed in Note 2 of the Notes to the Consolidated Financial Statements (“Notes”). Preparation of our consolidated financial statements, in conformity with U.S. GAAP, requires us to make estimates and assumptions that affect the amounts reported in the consolidated financial statements and accompanying notes. Estimates are considered to be critical if they meet both of the following criteria: (1) the estimate requires assumptions to be made about matters that are highly uncertain at the time the accounting estimate is made, and (2) different estimates that we reasonably could have used for the accounting estimate in the current period, or changes in the accounting estimate that are reasonably likely to occur from period to period, have a material impact on the presentation of our financial condition or results of operations. Besides estimates that meet the “critical” estimate criteria, we make many other accounting estimates in preparing our financial statements and related disclosures. All estimates, whether or not deemed critical, affect reported amounts of assets, liabilities, revenues or expenses as well as disclosures of contingent assets and liabilities. Estimates are based on experience and other information available prior to the issuance of the financial statements. Materially different results can occur as circumstances change and additional information becomes known, even from estimates not deemed critical. Our critical accounting estimates include the following: Revenue Recognition Revenue is measured as the amount of consideration expected to be received in exchange for transferring goods or providing service. Revenue from product and sold equipment is recognized when obligations under the terms of a contract with the customer are satisfied, which generally occurs with the transfer of the product or delivery of the equipment. Revenue from service and leased equipment is recognized when the services are provided, or the customer receives the benefit from the leased equipment, which is over time. Service revenue is recognized over time utilizing an input method and aligns with when the services are provided. Typically, revenue is recognized over time using costs incurred to date because the effort provided by the field selling and service organization represents services provided, which corresponds with the transfer of control. Revenue for leased equipment is accounted for under Topic 842 Leases and recognized on a straight-line basis over the length of the lease contract. Our revenue policies do not provide for general rights of return. We record estimated reductions to revenue for customer programs and incentive offerings including pricing arrangements, promotions and other volume-based incentives based primarily on historical experience and anticipated performance over the contract period. Depending on market conditions, we may increase customer incentive offerings, which could reduce gross profit margins over the term of the incentive. We also record estimated reserves for product returns and credits based on specific circumstances and credit conditions, and when it is deemed probable that the balance is uncollectible. For additional information on our allowance for doubtful accounts, see discussion below. The revenue standard can be applied to a portfolio of contracts with similar characteristics if it is reasonable that the effects of applying the standard at the portfolio would not be significantly different than applying the standard at the individual contract level. We apply the portfolio approach primarily within each operating segment by geographical region. Application of the portfolio approach was focused on those characteristics that have the most significant accounting consequences in terms of their effect on the timing of revenue recognition or the amount of revenue recognized. We determined the key criteria to assess with respect to the portfolio approach, including the related deliverables, the characteristics of the customers and the timing and transfer of goods and services, which most closely aligned within the operating segments. In addition, the accountability for the business operations, as well as the operational decisions on how to go to market and the product offerings, are performed at the operating segment level. For additional information on revenue recognition, see Note 17. Valuation Allowances and Accrued Liabilities Allowances for Doubtful Accounts We estimate our allowance for doubtful accounts by analyzing accounts receivable balances by age and applying historical write-off and collection trend rates. In addition, our estimates also include separately providing for customer receivables based on specific circumstances and credit conditions, and when it is deemed probable the balance is uncollectible. We estimate our sales returns and allowances by analyzing historical returns and credits and apply these trend rates to calculate estimated reserves for future credits. Actual results could differ from these estimates. Our allowance for doubtful accounts balance was $62 million and $61 million, as of December 31, 2019 and 2018, respectively. These amounts include our allowance for sales returns and credits of $18 million and $17 million as of December 31, 2019 and 2018, respectively. Our bad debt expense as a percent of reported net sales was 0.1% in each of the years 2019, 2018 and 2017. We believe it is reasonably likely that future results will be consistent with historical trends and experience. However, if the financial condition of our customers were to deteriorate, resulting in an inability to make payments, or if unexpected events, economic downturns, or significant changes in future trends were to occur, additional allowances may be required. For additional information on our allowance for doubtful accounts, see Note 2.

28
Accrued Liabilities Our business and operations are subject to extensive environmental laws and regulations governing, among other things, air emissions, wastewater discharges, the use and handling of hazardous substances, waste disposal and the investigation and remediation of soil and groundwater contamination. Some risk of environmental liability is inherent in our operations. We record liabilities related to pending litigation, environmental claims and other contingencies when a loss is probable and can be reasonably estimated. Estimates used to record such liabilities are based on our best estimate of probable future costs. We record the amounts that represent the points in the range of estimates that we believe are most probable or the minimum amount when no amount within the range is a better estimate than any other amount. Potential insurance reimbursements generally are not anticipated in our accruals for environmental liabilities or other insured losses. Expected insurance proceeds are recorded as receivables when recovery is deemed certain. While the final resolution of litigation and environmental contingencies could result in amounts different than current accruals, and therefore have an impact on our consolidated financial results in a future reporting period, we believe the ultimate outcome will not have a significant impact on our consolidated financial position. For additional information on our commitments and contingencies, see Note 15. Actuarially Determined Liabilities Pension and Postretirement Healthcare Benefit Plans The measurement of our pension and postretirement benefit obligations are dependent on a variety of assumptions determined by management and used by our actuaries. These assumptions affect the amount and timing of future contributions and expenses. The significant assumptions used in developing the required estimates are the discount rate, expected return on assets, projected salary and health care cost increases and mortality table. • The discount rate assumptions for our U.S. plans are assessed using a yield curve constructed from a subset of bonds yielding
greater than the median return from a population of non-callable, corporate bond issues that have an average rating of AA when averaging available Moody’s Investor Services, Standard & Poor’s and Fitch ratings. The discount rate is calculated by matching the plans’ projected cash flows to the bond yield curve. For 2019 and 2018, we elected to measure service and interest costs by applying the specific spot rates along that yield curve to the plans’ liability cash flows. We believe this approach provides a more precise measurement of service and interest costs by aligning the timing of the plans’ liability cash flows to the corresponding spot rates on the yield curve. In determining our U.S. pension obligations for 2019, our weighted-average discount rate decreased to 3.20% from 4.34% at year-end 2018. In determining our U.S. postretirement health care obligation for 2019, our weighted-average discount rate decreased to 3.16% from 4.29% at year-end 2018.
• The expected rate of return on plan assets reflects asset allocations, investment strategies and views of investment advisors, and
represents our expected long-term return on plan assets. Our weighted-average expected return on U.S. plan assets used in determining the U.S. pension and U.S. postretirement health care expenses was 7.25% for 2020 and 2019 and 7.75% for 2018.
• Projected salary and health care cost increases are based on our long-term actual experience, the near-term outlook and assumed
inflation. Our weighted-average projected salary increase used in determining the U.S. pension expenses was 4.03% for 2019, 2018 and 2017.
• For postretirement benefit measurement purposes as of December 31, 2019, the annual rates of increase in the per capita cost of
covered health care were assumed to be 8.00% for pre-65 costs and 10.75% for post-65 costs. The rates are assumed to decrease each year until they reach 5% in 2028 and remain at those levels thereafter.
• In determining our U.S. pension and U.S. postretirement health care obligation for 2019, we utilized the most recent mortality table,
MP-2019 projection scale (applied to the Pri-2012 mortality table). The effects of actual results differing from our assumptions, as well as changes in assumptions, are reflected in the unrecognized actuarial loss and amortized over future periods and, therefore, will generally affect our recognized expense in future periods. Significant differences in actual experience or significant changes in assumptions may materially affect future pension and other postretirement obligations. The unrecognized net actuarial loss on our U.S. qualified and non-qualified pension plans increased to $632 million as of December 31, 2019 from $539 million as of December 31, 2018 (both before tax), primarily due to current year net actuarial losses.

29
The effect of a decrease in the discount rate or decrease in the expected return on assets assumption as of December 31, 2019, on the December 31, 2019 defined benefit obligation and 2020 expense is shown below, assuming no changes in benefit levels and no amortization of gains or losses for our significant U.S. plans. Expense amounts reflect the accounting for actuarial gains as a component of other comprehensive income and recognition of the impacts into income over the remaining service period:
Effect on U.S. Pension Plans Increase in Higher Assumption Recorded 2020 (millions) Change Obligation Expense Discount rate -0.25 pts $74.1 $5.3 Expected return on assets -0.25 pts N/A 5.3
Effect on U.S. Postretirement Health Care Benefits Plans Increase in Higher Assumption Recorded 2020 (millions) Change Obligation Expense Discount rate -0.25 pts $4.1 $0.2 Expected return on assets -0.25 pts N/A - Our international pension obligations and underlying plan assets represent approximately one third of our global pension plans, with the majority of the amounts held in the U.K. and Eurozone countries. We use assumptions similar to our U.S. plan assumptions to measure our international pension obligations, however, the assumptions used vary by country based on specific local country requirements and information. See Note 16 for further discussion concerning our accounting policies, estimates, funded status, contributions and overall financial positions of our pension and postretirement plan obligations. Self-Insurance Globally we have insurance policies with varying deductible levels for property and casualty losses. We are insured for losses in excess of these deductibles, subject to policy terms and conditions and have recorded both a liability and an offsetting receivable for amounts in excess of these deductibles. We are self-insured for health care claims for eligible participating employees, subject to certain deductibles and limitations. We determine our liabilities for claims on an actuarial basis. Restructuring Our restructuring activities are associated with plans to enhance our efficiency, effectiveness and sharpen the competitiveness of our businesses. These restructuring plans include net costs associated with significant actions involving employee-related severance charges, contract termination costs and asset write-downs and disposals. Employee termination costs are largely based on policies and severance plans, and include personnel reductions and related costs for severance, benefits and outplacement services. These charges are reflected in the quarter in which the actions are probable and the amounts are estimable, which typically is when management approves the associated actions. Contract termination costs include charges to terminate leases prior to the end of their respective terms and other contract termination costs. Asset write-downs and disposals include leasehold improvement write-downs, other asset write-downs associated with combining operations and disposal of assets. Restructuring charges have been included as a component of cost of sales and special (gains) and charges on the Consolidated Statement of Income. Amounts included as a component of cost of sales include supply chain related severance and other asset write-downs associated with combining operations. Restructuring liabilities have been classified as a component of both other current and other noncurrent liabilities on the Consolidated Balance Sheet. Our restructuring liability balance was $112 million and $79 million as of December 31, 2019 and 2018, respectively. For additional information on our restructuring activities, see Note 3.

30
Income Taxes Judgment is required to determine the annual effective income tax rate, deferred tax assets and liabilities, valuation allowances recorded against net deferred tax assets and uncertain tax positions. On December 22, 2017, the Tax Cuts and Jobs Act (the “Tax Act”) was enacted, which reduces the U.S. federal corporate tax rate from 35% to 21%, required companies to pay a one-time transition tax on earnings of certain foreign subsidiaries that were previously tax deferred and created new taxes on certain foreign sourced earnings. The Tax Act added many new provisions including changes to bonus depreciation, the deduction for executive compensation and interest expense, a tax on global intangible low taxed income (GILTI), the base erosion anti abuse tax (BEAT) and a deduction for foreign derived intangible income (FDII). We recorded an estimate of the one-time transition tax in the fourth quarter of 2017 of $160 million and in 2018 and 2019 we recorded additional discrete expense of $66 million and benefit of $3.1 million, respectively, primarily due to the issuance of technical guidance in both years, the finalization of certain estimates as a result of filing the 2017 and 2018 U.S. federal tax return and the finalization of the balance sheet positions used in the calculation of the transition tax. We have completed our accounting for the effects of the Tax Act as they relate to the repricing of deferred tax balances and the one-time transition tax. Additionally, proposed regulations were released during 2019. Certain of the proposed regulations may be subject to challenge; therefore, we recorded tax expense based on our interpretation of the changes in law affected by the Tax Act and not the proposed regulations. If the proposed regulations become final, we will record the impact at that time. Effective Income Tax Rate Our effective income tax rate is based on annual income, statutory tax rates and tax planning available in the various jurisdictions in which we operate. Our annual effective income tax rate includes the impact of reserve provisions. We recognize the largest amount of tax benefit that is greater than 50% likely of being realized upon settlement with a taxing authority. We adjust these reserves in light of changing facts and circumstances. This expected annual rate is then applied to our year-to-date operating results. In the event there is a significant discrete item recognized in our interim operating results, the tax attributable to that item would be separately calculated and recorded in the same period. Tax regulations require items to be included in our tax returns at different times than the items are reflected in our financial statements. As a result, the effective income tax rate reflected in our financial statements differs from that reported in our tax returns. Some of these differences are permanent, such as expenses that are not deductible on our tax return, and some are temporary differences, such as depreciation expense. Deferred Tax Assets and Liabilities and Valuation Allowances Temporary differences create deferred tax assets and liabilities. Deferred tax assets generally represent items that can be used as a tax deduction or credit in our tax return in future years for which we have already recorded the tax benefit in our income statement. We establish valuation allowances for our deferred tax assets when the amount of expected future taxable income is not likely to support the utilization of the entire deduction or credit. Relevant factors in determining the realizability of deferred tax assets include historical results, future taxable income, the expected timing of the reversal of temporary differences, tax planning strategies and the expiration dates of the various tax attributes. Deferred tax liabilities generally represent items for which we have already taken a deduction in our tax return but have not yet recognized that tax benefit in our financial statements. During 2019, due to the adoption of the new lease standard and the recording of operating lease assets and operating lease liabilities on the Consolidated Balance Sheet, we recorded related deferred tax liabilities and deferred tax assets, respectively. Uncertain Tax Positions A number of years may elapse before a particular tax matter, for which we have established a reserve, is audited and finally resolved. The number of tax years with open tax audits varies depending on the tax jurisdiction. The Internal Revenue Service (“IRS”) has completed its examinations of our U.S. federal income tax returns through 2016 and the years 2017 and 2018 are currently under audit. In addition to the U.S. federal examinations, we have ongoing audit activity in several U.S. state and foreign jurisdictions. The tax positions we take are based on our interpretations of tax laws and regulations in the applicable federal, state and international jurisdictions. We believe our tax returns properly reflect the tax consequences of our operations, and our reserves for tax contingencies are appropriate and sufficient for the positions taken. Because of the uncertainty of the final outcome of these examinations, we have reserved for potential reductions of tax benefits (including related interest and penalties) for amounts that do not meet the more-likely-than-not thresholds for recognition and measurement as required by authoritative guidance. The tax reserves are reviewed throughout the year, taking into account new legislation, regulations, case law and audit results. Settlement of any particular issue could result in offsets to other balance sheet accounts, cash payments or receipts and/or adjustments to tax expense. Tax reserves are presented in the Consolidated Balance Sheet within other non-current liabilities. Our gross liability for uncertain tax positions was $28 million and $50 million as of December 31, 2019 and 2018, respectively. For additional information on income taxes see Note 12.

31
Long-Lived Assets, Intangible Assets and Goodwill Long-Lived and Amortizable Intangible Assets We review our long-lived and amortizable intangible assets, the net value of which was $7.0 billion and $7.1 billion as of December 31, 2019 and 2018, respectively, for impairment and when significant events or changes in business circumstances indicate that the carrying value of the assets may not be recoverable. Such circumstances may include a significant decrease in the market price of an asset, a significant adverse change in the manner in which the asset is being used or in its physical condition or history of operating or cash flow losses associated with the use of the asset. Impairment losses could occur when the carrying amount of an asset exceeds the anticipated future undiscounted cash flows expected to result from the use of the asset and its eventual disposition. The amount of the impairment loss to be recorded, if any, is calculated as the excess of the asset’s carrying value over its estimated fair value. We use the straight-line method to recognize amortization expense related to our amortizable intangible assets, including our customer relationships. We consider various factors when determining the appropriate method of amortization for our customer relationships, including projected sales data, customer attrition rates and length of key customer relationships. Globally, we have a broad customer base. Our retention rate of significant customers has aligned with our acquisition assumptions, including the customer bases acquired from our Nalco and Champion transactions, which make up the majority of our unamortized customer relationships. Our historical retention rate, coupled with our consistent track record of keeping long-term relationships with our customers, supports our expectation of consistent sales generation for the foreseeable future from the acquired customer base. If our customer retention rate or other post-acquisition operational activities changed materially, we would evaluate the financial impact and any corresponding triggers which could result in an acceleration of amortization or impairment of our customer relationship intangible assets. In addition, we periodically reassess the estimated remaining useful lives of our long-lived and amortizable intangible assets. Changes to estimated useful lives would impact the amount of depreciation and amortization expense recorded in earnings. We have experienced no significant changes in the carrying value or estimated remaining useful lives of our long-lived or amortizable intangible assets. Goodwill and Indefinite Life Intangible Assets We had total goodwill of $7.3 billion and $7.1 billion as of December 31, 2019 and 2018, respectively. We test our goodwill for impairment at the reporting unit level on an annual basis during the second quarter. Our reporting units are aligned with our eleven operating segments. For our 2019 impairment assessment, we completed our assessment for goodwill impairment across our reporting units using a two-step quantitative analysis, utilizing a discounted cash flow approach. The first step of the analysis involved determining the estimated fair value of each reporting unit and comparing them to the respective carrying values, including goodwill. If the fair value of a reporting unit exceeds its carrying value, goodwill of the reporting unit is considered not to be impaired, and the second step of the impairment test is unnecessary. If the carrying amount of the reporting unit exceeds its fair value, the second step of the goodwill impairment test would be performed to measure the amount of impairment loss to be recorded, if any. Our goodwill impairment assessment for 2019 indicated the estimated fair value of each of our reporting units exceeded the unit’s carrying amount by a significant margin. We assess the need to test our reporting units for impairment during interim periods between our scheduled annual assessments when significant events or changes in business circumstances indicate that the carrying value of the reporting unit may not be recoverable. There has been no impairment of goodwill in any of the years presented. As part of the Nalco merger, we added the “Nalco” trade name as an indefinite life intangible asset, the total value of which was $1.2 billion as of December 31, 2019 and 2018. The carrying value of the indefinite life trade name was subject to annual impairment testing, using a relief from royalty assessment method, during the second quarter of 2019. Our Nalco trade name assessment for 2019 indicated the estimated fair value of the asset exceeded its carrying amount by a significant margin. We assess the need to test the Nalco trade name for impairment during interim periods between our scheduled annual assessments when significant events or changes in business circumstances indicate that the carrying value of the asset may not be recoverable. There has been no impairment of the Nalco trade name in any of the years presented.

32
RESULTS OF OPERATIONS Net Sales
Percent Change (millions) 2019 2018 2017 2019 2018
Product and equipment sales $12,238.9 $12,128.6 $11,431.8 Service and lease sales 2,667.4 2,539.6 2,404.1
Reported GAAP net sales $14,906.3 $14,668.2 $13,835.9 2 % 6 % Effect of foreign currency translation 140.6 (137.5) (37.8)
Non-GAAP fixed currency sales $15,046.9 $14,530.7 $13,798.1 4 % 5 % The percentage components of the year-over-year sales change are shown below:
(percent) 2019 2018 Volume 0% 4% Price changes 2 2
Acquisition adjusted fixed currency sales change 3 6 Acquisitions & divestitures 1 0
Fixed currency sales change 4 6 Foreign currency translation (2) 0
Reported GAAP net sales change 2% 6% Amounts do not necessarily sum due to rounding. Cost of Sales (“COS”) and Gross Profit Margin (“Gross Margin”)
2019 2018 2017 Gross Gross Gross (millions/percent) COS Margin COS Margin COS Margin
Product and equipment cost of sales $7,106.4 $7,078.5 $6,576.9 Service and lease cost of sales 1,617.0 1,547.4 1,487.3
Reported GAAP COS and gross margin $8,723.4 41.5 % $8,625.9 41.2 % $8,064.2 41.7 % Special (gains) and charges 38.5 0.2 9.3 0.1 44.0 0.3
Non-GAAP adjusted COS and gross margin $8,684.9 41.7 % $8,616.6 41.3 % $8,020.2 42.0 % Our COS values and corresponding gross margin are shown in the previous table. Our gross margin is defined as sales less cost of sales divided by sales. Our reported gross margin was 41.5%, 41.2%, and 41.7% for 2019, 2018, and 2017, respectively. Our 2019, 2018 and 2017 reported gross margins were negatively impacted by special (gains) and charges of $38.5 million, $9.3 million, and $44.0 million, respectively. Special (gains) and charges items impacting COS are shown within the “Special (Gains) and Charges” table on page 33. Excluding the impact of special (gains) and charges, our 2019 adjusted gross margin was 41.7% compared against a 2018 adjusted gross margin of 41.3%. The increase was driven primarily by pricing, which more than offset unfavorable sales mix. Excluding the impact of special (gains) and charges, our adjusted gross margin was 41.3% and 42.0% for 2018 and 2017, respectively. The decrease was driven primarily by higher delivered product costs more than offsetting the impact from increased pricing and cost savings. Selling, General and Administrative Expenses (“SG&A”)
(percent) 2019 2018 2017 SG&A Ratio 26.5 % 27.1 % 27.6 % The decreased SG&A ratio (SG&A expenses as a percentage of reported net sales) comparing 2019 against 2018 and comparing 2018 against 2017 were driven primarily by sales leverage, restructuring efforts and cost savings, which more than offset investments in the business.

33
Special (Gains) and Charges Special (gains) and charges reported on the Consolidated Statement of Income included the following items:
(millions) 2019 2018 2017 Cost of sales
Restructuring activities $20.4 $12.1 $4.6 Acquisition and integration activities 7.6 (0.6) 13.2 Other 10.5 (2.2) 26.2
Cost of sales subtotal 38.5 9.3 44.0
Special (gains) and charges Restructuring activities 116.8 89.4 39.9 ChampionX separation 77.3 - - Acquisition and integration activities 5.6 8.8 15.4 Gain on sale of business - - (46.1) Venezuela related gain - - (11.5) Other 11.9 28.5 (1.4)
Special (gains) and charges subtotal 211.6 126.7 (3.7)
Operating income subtotal 250.1 136.0 40.3
Interest expense, net 0.2 0.3 21.9 Other (income) expense 9.5 - - Total special (gains) and charges $259.8 $136.3 $62.2 For segment reporting purposes, special (gains) and charges are not allocated to reportable segments, which is consistent with our internal management reporting. Restructuring Activities Restructuring activities are primarily related to Accelerate 2020 (described below). These activities have been included as a component of cost of sales, special (gains) and charges, and other (income) expense on the Consolidated Statement of Income. Restructuring liabilities have been classified as a component of other current and other noncurrent liabilities on the Consolidated Balance Sheet. Further details related to our restructuring charges are included in Note 3. Accelerate 2020 During the third quarter of 2018, we formally commenced a restructuring plan Accelerate 2020 (“the Plan”), to leverage technology and system investments and organizational changes. In 2019, we raised our goals for the Plan to further simplify and automate processes and tasks, reduce complexity and management layers, consolidated facilitates and focus on key long-term growth areas by further leveraging technology and structural improvements. We expect that the restructuring activities will be completed by the end of 2020, with total anticipated costs of $260 million ($200 million after tax), or an estimated $0.68 per diluted share, over this period of time. Costs are expected to be primarily cash expenditures for severance costs and some facility closure costs relating to team reorganizations. Actual costs may vary from these estimates depending on actions taken. We recorded restructuring charges of $136.6 million ($104.4 million after tax) or $0.36 per diluted share in 2019. Of these expenses, $2.0 million ($1.5 million after tax) or less than $0.01 per diluted share is recorded in other (income) expense. The liability related to the Plan was $104.0 million as of the end of the year. We have recorded $241.2 million ($184.0 million after tax), or $0.63 per diluted share, of cumulative restructuring charges under the Plan. The majority of the pretax charges represent net cash expenditures which are expected to be paid over a period of a few months to several quarters which continue to be funded from operating activities. The Plan has delivered $125 million of cumulative cost savings with estimated annual cost savings of $325 million by 2021.

34
Other Restructuring Activities During 2019, we incurred restructuring charges of $4.1 million ($3.3 million after tax), or $0.01 per diluted share, related to an immaterial restructuring plan. The charges are comprised of severance, facility closure costs, including asset disposals, and consulting fees. Prior to 2018, we engaged in a number of restructuring plans. During 2017, we commenced restructuring and other cost-saving actions in order to streamline operations. These actions include a reduction of our global workforce, as well as asset disposals and lease terminations. Actions were substantially completed in 2017. We also have restructuring plans that commenced prior to 2016. During 2019, net restructuring gains related to prior year plans were $1.5 million ($1.1 million after tax) or less than $0.01 per diluted share. During 2018, net restructuring gains related to prior year plans were $3.1 million ($2.4 million after tax) or $0.01 per diluted share. The gains recorded were due to finalizing estimates upon completion of projects. During 2017, we recorded restructuring charges of $44.5 million ($32.3 million after tax) or $0.11 per diluted share. The restructuring liability balance for all plans excluding Accelerate 2020 was $7.7 million and $14.9 million as of December 31, 2019 and 2018, respectively. The reduction in liability was driven primarily by severance payments. The remaining liability is expected to be paid over a period of a few months to several quarters and will continue to be funded from operating activities. Cash payments during 2019 related to these plans were $8.3 million. ChampionX Separation On December 18, 2019, we entered into definitive agreements with ChampionX and Apergy pursuant to which we will separate the Upstream Energy business of our Global Energy segment and combine it with Apergy in a tax-efficient reverse Morris Trust transaction. During 2019, the charges associated with the separation reported in special (gains) and charges on the Consolidated Statement of Income include $77.3 million ($65.8 million after tax) or $0.22 per diluted share. The charges are primarily related to professional fees to support the separation. ChampionX separation costs reported in other (income) expense on the Consolidated Statement of Income in 2019 include $7.5 million ($5.7 million after tax) or $0.02 per diluted share related to pension curtailments and settlements due to the separation. Acquisition and integration related costs Acquisition and integration costs reported in special (gains) and charges on the Consolidated Statement of Income in 2019 include $5.6 million ($4.1 million after tax) or $0.01 per diluted share. Charges are primarily related to Bioquell PLC (“Bioquell”) and Laboratoires Anios (“Anios”) acquisitions and consist of integration costs, advisory and legal fees. Acquisition and integration costs reported in product and equipment cost of sales on the Consolidated Statement of Income in 2019 include $7.6 million ($5.6 million after tax) or $0.02 per diluted share and are related to recognition of fair value step-up in the Bioquell inventory and facility closure costs. In conjunction with our acquisitions, we incurred $0.2 million ($0.1 million after tax), or less than $0.01 per diluted share, of interest expense in 2019. During 2018, acquisition and integration costs reported in special (gains) and charges on the Consolidated Statement of Income included $8.8 million ($6.1 million after tax), or $0.02 per diluted share, of charges primarily related to Anios integration costs, advisory and legal fees. The acquisition and integration gains reported in cost of sales on the Consolidated Statement of Income in 2018 related to changes in estimates related to an early lease exist. In conjunction with our acquisitions, we incurred $0.3 million ($0.2 million after tax), or less than $0.01 per diluted share, of interest expense in 2018. During 2017, acquisition and integration costs reported in special (gains) and charges on the Consolidated Statement of Income included $15.4 million ($9.9 million after tax), or $0.03 per diluted share, of acquisition costs, advisory and legal fees, and integration charges for the Anios and Swisher acquisitions. Acquisition and integration costs reported in cost of sales on the Consolidated Statement of Income in 2017 included $13.2 million ($8.6 million after tax), or $0.03 per diluted share, which related primarily to disposal of excess inventory upon the closure of Swisher plants, accelerated rent expense, and amounts related to recognition of fair value step-up in the Anios inventory. Further information related to our acquisitions is included in Note 4. Gain on sale of business During 2017, we disposed of the Equipment Care business and recorded a gain of $46.1 million ($12.4 million after tax primarily due to non-deductible goodwill), or $0.04 per diluted share, net of working capital adjustments, costs to sell and other transaction expenses. The gain was included as a component of special (gains) and charges on the Consolidated Statement of Income. Venezuela related activities Effective as of the end of the fourth quarter of 2015, we deconsolidated our Venezuelan subsidiaries. We recorded gains due to U.S. dollar cash recoveries of intercompany receivables written off at the time of deconsolidation of $11.5 million ($7.2 million after tax) or $0.02 per diluted share in 2017. No such gains occurred in 2018 and 2019.

35
Other During 2019, we recorded other special charges of $11.9 million ($7.5 million after tax), or $0.03 per diluted share, which primarily related to legal charges partially offset by a litigation settlement. Other special charges reported in product and equipment cost of sales on the Consolidated Statement of Income in 2019 of $10.5 million ($7.1 million after tax), or $0.02 per diluted share, relate to a Healthcare product recall in Europe. During 2018, we recorded other special charges of $28.5 million ($21.5 million after tax), or $0.07 per diluted share, which primarily consisted of a $25.0 million ($18.9 million after tax), or $0.06 per diluted share, commitment to the Ecolab Foundation. Other charges, primarily litigation related charges, were minimal and have been included as a component of special (gains) and charges on the Consolidated Statement of Income. Other special gains reported in product and equipment cost of sales on the Consolidated Statement of Income in 2018 of $2.2 million ($1.7 million after tax), or $0.01 per diluted share, relate to changes in estimates for an inventory LIFO reserve. During 2017, we recorded other charges of $24.8 million ($19.0 million after tax), or $0.06 per diluted share, primarily related to fixed asset impairments, a Global Energy vendor contract termination and litigation related charges. These charges have been included as a component of both cost of sales and special (gains) and charges on the Consolidated Statement of Income. Other (Income) Expense During 2019, the Company recorded other expense of $9.5 million ($7.2 million after tax) or $0.02 per diluted share related to pension curtailments and settlements for ChampionX separation and Accelerate 2020, respectively, as discussed further above. These charges have been included as a component of other (income) expense on the Consolidated Statement of Income. Interest expense, net During 2019 and 2018, an immaterial amount of interest expense was recorded due to acquisition and integration costs. During 2017, in anticipation of U.S. tax reform and a potential limit on interest deductibility in future years, we entered into transactions to exchange or retire certain long-term debt, and incurred debt exchange and extinguishment charges of $21.9 million ($13.6 million after tax) or $0.05 per diluted share. This charge has been included as a component of interest expense, net on the Consolidated Statement of Income. Operating Income and Operating Income Margin
Percent Change (millions) 2019 2018 2017 2019 2018 Reported GAAP operating income $2,013.8 $1,947.0 $1,950.1 3 % (0) %
Special (gains) and charges 250.1 136.0 40.3 Non-GAAP adjusted operating income 2,263.9 2,083.0 1,990.4 9 5
Effect of foreign currency translation 20.4 (20.4) (12.1) Non-GAAP adjusted fixed currency operating income $2,284.3 $2,062.6 $1,978.3 11 % 4 % (percent) 2019 2018 2017 Reported GAAP operating income margin 13.5 % 13.3 % 14.1 % Non-GAAP adjusted operating income margin 15.2 % 14.2 % 14.4 % Non-GAAP adjusted fixed currency
operating income margin 15.2 % 14.2 % 14.3 % Our operating income and corresponding operating income margin are shown in the previous tables. Operating income margin is defined as operating income divided by sales. Our reported operating income increased 3% when comparing 2019 to 2018 and was flat when comparing 2018 to 2017. Our reported operating income for 2019, 2018 and 2017 was impacted by special (gains) and charges. Excluding the impact of special (gains) and charges from all three years, 2019 adjusted operating income increased 9% when compared to 2018 adjusted operating income and 2018 adjusted operating income increased 5% when compared to 2017 adjusted operating income. As shown in the previous table, foreign currency translation had a minimal impact on adjusted operating income growth for 2019 and 2018.

36
Other (Income) Expense
(millions) 2019 2018 2017 Reported GAAP other (income) expense $(76.3) $(79.9) $(67.3)
Special (gains) and charges 9.5 - - Non-GAAP adjusted other (income) expense $(85.8) $(79.9) $(67.3) Our reported other income was $76.3 million, $79.9 million and $67.3 million in 2019, 2018, and 2017, respectively. Excluding the impact of pension curtailments and settlements in 2019, our adjusted other income was $85.8 million reflecting the return on pension assets and non-service costs of our pension obligations. Interest Expense, Net
(millions) 2019 2018 2017 Reported GAAP interest expense, net $191.2 $222.3 $255.0
Special (gains) and charges 0.2 0.3 21.9 Non-GAAP adjusted interest expense, net $191.0 $222.0 $233.1 Our reported net interest expense totaled $191.2 million, $222.3 million and $255.0 million during 2019, 2018 and 2017 respectively. We incurred $0.2 million ($0.1 million after tax), or less than $0.01 per diluted share and $0.3 million ($0.2 million after tax), or less than $0.01 per diluted share, of interest expense in conjunction with our acquisitions during 2019 and 2018, respectively. During 2017, in anticipation of U.S. tax reform and a potential limit on interest deductibility in future years, we entered into transactions to exchange or retire certain long-term debt, and incurred debt exchange and extinguishment charges of $21.9 million ($13.6 million after tax) or $0.05 per diluted share. The decrease in our 2019 adjusted net interest expense compared to 2018 was driven primarily by lower outstanding debt and higher interest income. The decrease in our 2018 adjusted net interest expense compared to 2017 was driven primarily by lower interest rates on debt. Provision for Income Taxes The following table provides a summary of our tax rate:
(percent) 2019 2018 2017 Reported GAAP tax rate 17.0 % 20.2 % 13.8 % Tax rate impact of:
The Tax Act 0.1 (3.4) 8.7 Special (gains) and charges 0.6 0.3 (0.1) Discrete tax items 2.6 3.2 1.4
Non-GAAP adjusted tax rate 20.3 % 20.3 % 23.8 % Our reported tax rate was 17.0%, 20.2%, and 13.8% for 2019, 2018 and 2017, respectively. The change in our tax rate includes the tax impact of special (gains) and charges and discrete tax items, which have impacted the comparability of our historical reported tax rates, as amounts included in our special (gains) and charges are derived from tax jurisdictions with rates that vary from our tax rate, and discrete tax items are not necessarily consistent across periods. The tax impact of special (gains) and charges and discrete tax items will likely continue to impact comparability of our reported tax rate in the future. The enactment of the Tax Act also significantly impacted the comparability of our reported tax rate. We recognized total net benefit related to discrete tax items of $58.4 million during 2019. Share-based compensation excess tax benefit contributed $43.1 million in 2019. The extent of excess tax benefits is subject to variation in stock price and stock option exercises. We recognized $15.6 million tax benefit related to changes in local tax law, which primarily includes $30.4 million benefit due to the passage of the Swiss Tax Reform and AHV Financing Act, a Swiss federal tax law, offset by a tax expense of $10.2 million due to the release of the final Treasury Regulation governing taxation of foreign dividends. We recorded changes in reserves in non-U.S. and U.S. jurisdictions due to audit settlements and statutes of limitations which resulted in a $16.8 million tax benefit. We finalized the 2015 and 2016 IRS audit, which also resulted in discrete tax expense of $11.0 million. The remaining discrete tax expense was primarily related to changes in estimates in non-U.S. jurisdictions. We recognized total net expense related to discrete tax items of $4.7 million during 2018. In the third quarter of 2018, we filed U.S. federal tax returns which resulted in favorable adjustments of $39.9 million related to changes in estimates and an IRS approved method change. U.S. tax reform (as described further below) resulted in $66.0 million expense for 2018. Share-based compensation excess tax benefit contributed $28.1 million in 2018. The extent of excess tax benefits is subject to variation in stock price and stock option exercises. Included within the 2018 provision for income taxes in $44.2 million of discrete charges recorded in the fourth quarter to correct immaterial errors in prior years. The remaining discrete tax expense was primarily related to changes in reserves in non-U.S. jurisdictions, audit settlements and both international and U.S. changes in estimates.

37
On December 22, 2017, the Tax Cuts and Jobs Act (the “Tax Act”) was enacted, which reduced the U.S. federal corporate tax rate from 35% to 21%, required companies to pay a one-time transition tax on earnings of certain foreign subsidiaries that were previously tax deferred and created new taxes on certain foreign sourced earnings. The Tax Act added many new provisions including changes to bonus depreciation, the deduction for executive compensation and interest expense, a tax on global intangible low taxed income (GILTI), the base erosion anti abuse tax (BEAT) and a deduction for foreign derived intangible income (FDII). In January 2018, accounting guidance was issued requiring a company to make an accounting policy election to either treat taxes due on future U.S. inclusions in taxable income related to GILTI as a current-period expense when incurred (the "period cost method") or factor such amounts into a company’s measurement of our deferred taxes (the "deferred method"). We have elected the period cost method and included the GILTI impact in our tax expense. We initially recorded an estimate of the one-time transition tax in the fourth quarter of 2017 of $160.1 million and in 2018 we recorded additional discrete expense of $66.0 million associated with finalizing our accounting for the Tax Act, primarily due to the issuance of technical guidance during the year and finalization of estimates related to asset balances and calculation of foreign earnings and profits. Our 2017 reported rate also includes a $319.0 million tax benefit for recording deferred tax assets and liabilities at the U.S. enacted tax rate of 21%. Our 2017 reported tax rate also includes the tax impact of special (gains) and charges, as well as additional tax benefits utilized in anticipation of U.S. tax reform of $7.8 million. During 2017, we also recorded a discrete tax benefit of $39.7 million related to excess tax benefits. In addition, we recorded net discrete expenses of $14.4 million related to recognizing adjustments from filing our 2016 U.S. federal income tax return and international adjustments due to changes in estimates, partially offset by the release of reserves for uncertain tax positions due to the expiration of statute of limitations in state tax matters. The adjusted rate was 20.3% for both 2019 and 2018. The change in our adjusted tax rate from 2018 to 2017 was primarily driven by enactment of the Tax Act, global tax planning projects and geographic income mix. Future comparability of our adjusted tax rate may be impacted by various factors, including but not limited to, the Tax Act, other changes in global tax rules, further tax planning projects and geographic income mix. Net Income Attributable to Ecolab
Percent Change (millions) 2019 2018 2017 2019 2018 Reported GAAP net income attributable to Ecolab $1,558.9 $1,429.1 $1,504.6 9 % (5) % Adjustments:
Special (gains) and charges, after tax 202.6 102.8 56.0 Discrete tax net expense (benefit) (58.4) 4.7 (184.2)
Non-GAAP adjusted net income attributable to Ecolab $1,703.1 $1,536.6 $1,376.4 11 % 12 % Diluted EPS
Percent Change (dollars) 2019 2018 2017 2019 2018 Reported GAAP diluted EPS $ 5.33 $ 4.88 $ 5.12 9 % (5) % Adjustments:
Special (gains) and charges 0.69 0.35 0.19 Discrete tax net expense (benefit) (0.20) 0.02 (0.63)
Non-GAAP adjusted diluted EPS $ 5.82 $ 5.25 $ 4.68 11 % 12 % Per share amounts do not necessarily sum due to rounding. Currency translation had an unfavorable $0.13 impact on reported and adjusted diluted EPS when comparing 2019 to 2018 and minimal impact when comparing 2018 to 2017.

38
SEGMENT PERFORMANCE The non-U.S. dollar functional currency international amounts included within our reportable segments are based on translation into U.S. dollars at the fixed currency exchange rates established by management for 2019. The difference between the fixed currency exchange rates and the actual currency exchange rates is reported as “effect of foreign currency translation” in the following tables. All other accounting policies of the reportable segments are consistent with U.S. GAAP and the accounting policies described in Note 2. Additional information about our reportable segments is included in Note 18. Fixed currency net sales and operating income for 2019, 2018 and 2017 for our reportable segments are shown in the following tables.
Net Sales Percent Change (millions) 2019 2018 2017 2019 2018 Global Industrial $5,569.9 $5,220.2 $4,895.8 7 % 7 % Global Institutional 5,235.5 5,066.0 4,785.8 3 6 Global Energy 3,334.0 3,388.8 3,205.8 (2) 6 Other 907.5 855.7 910.7 6 (6)
Subtotal at fixed currency 15,046.9 14,530.7 13,798.1 4 5 Effect of foreign currency translation (140.6) 137.5 37.8 Total reported net sales $14,906.3 $14,668.2 $13,835.9 2 % 6 % Operating Income Percent Change (millions) 2019 2018 2017 2019 2018 Global Industrial $854.7 $724.4 $722.0 18 % 0 % Global Institutional 1,042.2 1,007.3 962.7 3 5 Global Energy 379.1 338.5 322.9 12 5 Other 167.3 160.0 140.7 5 14 Corporate (409.1) (303.6) (210.3)
Subtotal at fixed currency 2,034.2 1,926.6 1,938.0 6 (1) Effect of foreign currency translation (20.4) 20.4 12.1 Total reported operating income $2,013.8 $1,947.0 $1,950.1 3 % 0 % The following tables reconcile the impact of acquisitions and divestitures within our reportable segments.
Year ended December 31 Net Sales 2019 2018
(millions) Fixed
Currency
Impact of Acquisitions
and Divestitures
Acquisition Adjusted
Fixed Currency
Impact of Acquisitions
and Divestitures
Acquisition Adjusted
Global Industrial $5,569.9 $(103.3) $5,466.6 $5,220.2 $(11.9) $5,208.3 Global Institutional 5,235.5 (35.4) 5,200.1 5,066.0 - 5,066.0 Global Energy 3,334.0 (0.1) 3,333.9 3,388.8 (2.5) 3,386.3 Other 907.5 (1.6) 905.9 855.7 (0.3) 855.4
Subtotal at fixed currency 15,046.9 (140.4) 14,906.5 14,530.7 (14.7) 14,516.0 Effect of foreign currency translation (140.6) 137.5 Total reported net sales $14,906.3 $14,668.2 Operating Income 2019 2018
(millions) Fixed
Currency
Impact of Acquisitions
and Divestitures
Acquisition Adjusted
Fixed Currency
Impact of Acquisitions
and Divestitures
Acquisition Adjusted
Global Industrial $854.7 $1.3 $856.0 $724.4 $(3.0) $721.4 Global Institutional 1,042.2 4.3 1,046.5 1,007.3 - 1,007.3 Global Energy 379.1 0.3 379.4 338.5 2.6 341.1 Other 167.3 (0.4) 166.9 160.0 - 160.0 Corporate (159.0) - (159.0) (167.6) - (167.6)
Non-GAAP adjusted fixed currency operating income 2,284.3 5.5 2,289.8 2,062.6 (0.4) 2,062.2 Special (gains) and charges 250.1 136.0
Subtotal at fixed currency 2,034.2 1,926.6 Effect of foreign currency translation (20.4) 20.4 Total reported operating income $2,013.8 $1,947.0

39
Global Industrial
2019 2018 2017 Sales at fixed currency (millions) $5,569.9 $5,220.2 $4,895.8 Sales at public currency (millions) 5,500.7 5,286.5 4,918.0
Volume 2 % 4 % Price changes 3 % 2 %
Acquisition adjusted fixed currency sales change 5 % 6 % Acquisitions and divestitures 2 % 1 %
Fixed currency sales change 7 % 7 % Foreign currency translation (3) % 1 %
Public currency sales change 4 % 7 % Operating income at fixed currency (millions) $854.7 $724.4 $722.0 Operating income at public currency (millions) 844.5 735.6 727.1
Fixed currency operating income change 18 % 0 % Fixed currency operating income margin 15.3 % 13.9 % 14.7 % Acquisition adjusted fixed currency operating income change 19 % 1 % Acquisition adjusted fixed currency operating income margin 15.7 % 13.9 % * Public currency operating income change 15 % 1 %
* Not meaningful Amounts do not necessarily sum due to rounding. Net Sales Fixed currency sales growth for Global Industrial in both 2019 and 2018 was driven by pricing and volume gains. The 2019 sales increase was impacted by growth in all regions. Regional results for 2018 were impacted by good growth in North America and Europe. At an operating segment level, Water fixed currency sales increased 6% and 7% in 2019 and 2018, respectively. In both 2019 and 2018, Light industry sales growth was led by innovative technology and service offerings. Heavy industry sales benefitted from sales force investments and improved market conditions while mining sales were led by new business wins. Food & Beverage fixed currency sales increased 9% (6% acquisition adjusted) in 2019 as share gains and pricing more than offset generally flat industry trends. Globally, we saw strong growth in our dairy, food, beverage and brewing segments, with moderate growth in the protein business. Fixed currency sales growth was strong across major regions. Fixed currency sales increased 6% in 2018, benefiting from corporate account wins, share gains and pricing, which more than offset generally flat industry trends. Growth was led by the beverage and brewing, dairy and protein businesses. Paper fixed currency sales increased 1% in 2019 despite softer containerboard market conditions which reduced volumes in major regions. Fixed currency sales increased 11% (6% acquisition adjusted) in 2018 driven by business wins and pricing. Textile Care fixed currency sales increased 2% and 1% in 2019 and 2018, respectively. Life Sciences fixed currency sales increased 37% in 2019 (12% acquisition adjusted). Results were led by business wins and pricing in our cleaning and disinfection programs for both the pharmaceutical and personal care markets, with strong growth in Europe and moderate North America gains. Fixed currency sales increased 14% in 2018 driven by good growth from business wins and pricing execution in both the pharmaceutical and personal care markets. Operating Income Fixed currency operating income for Global Industrial increased in 2019 while 2018 was flat when compared to prior periods. Fixed currency operating income margins increased in 2019 and decreased in 2018. Acquisition adjusted fixed currency operating income margins increased 1.8 percentage points in 2019. The favorable impact of pricing added approximately 2.7 percentage points during 2019. Investments in the business negatively impacted margins by approximately 1.1 percentage points. Acquisition adjusted fixed currency operating income margins decreased in 2018 compared to 2017, negatively impacted by higher delivered product costs and investments in the business, partially offset by favorable impact of pricing and volume gains.

40
Global Institutional
2019 2018 2017 Sales at fixed currency (millions) $5,235.5 $5,066.0 $4,785.8 Sales at public currency (millions) 5,187.0 5,098.5 4,776.2
Volume 1 % 3 % Price changes 2 % 2 %
Acquisition adjusted fixed currency sales change 3 % 5 % Acquisitions and divestitures 1 % 1 %
Fixed currency sales change 3 % 6 % Foreign currency translation (2) % 1 %
Public currency sales change 2 % 7 % Operating income at fixed currency (millions) $1,042.2 $1,007.3 $962.7 Operating income at public currency (millions) 1,035.7 1,010.6 963.9
Fixed currency operating income change 3 % 5 % Fixed currency operating income margin 19.9 % 19.9 % 20.1 % Acquisition adjusted fixed currency operating income change 4 % 4 % Acquisition adjusted fixed currency operating income margin 20.1 % 19.9 % * Public currency operating income change 2 % 5 %
* Not meaningful Amounts do not necessarily sum due to rounding. Net Sales Fixed currency sales growth for Global Institutional in both 2019 and 2018 benefited from pricing, volume growth and acquisitions. At a regional level, the 2019 sales increases were led by good growth in North America. At an operating segment level, Institutional fixed currency sales increased 2% in 2019, reflecting the benefits of new products and business wins. Fixed currency sales increased 5% in 2018. Global lodging demand continued to show moderate growth while global full-service restaurant industry foot traffic remained soft. Specialty fixed currency sales increased 9% in 2019, reflecting strong ongoing business and program wins. Fixed currency sales increased 8% in 2018, led primarily from strong ongoing business and new account wins. Healthcare fixed currency sales increased 1% in 2019. At a regional level, good growth in Europe was offset by a product recall while North America sales were flat with good differentiated product and program growth which was partially offset by lower sales of deemphasized non-core products. Fixed currency sales increased 7% (2% acquisition adjusted) in 2018, with strong sales of environmental hygiene programs partially offset by lower sales of non-core products. Operating Income Fixed currency operating income for our Global Institutional segment increased in both 2019 and 2018 when compared to prior periods. Fixed currency operating income margins remained flat in 2019 and declined slightly in 2018. Acquisition adjusted fixed currency operating income margins increased 0.2 percentage points during 2019. The favorable impact of pricing and volume added approximately 1.9 percentage points during 2019. Investments in the business and selling related expenses negatively impacted margins by approximately 1.7 percentage points. Acquisition adjusted fixed currency operating income margins decreased in 2018, negatively impacted by investments in the business, including innovative digital technologies, and higher delivered product costs, partially offset by favorable impact of sales volume gains, pricing and cost savings.
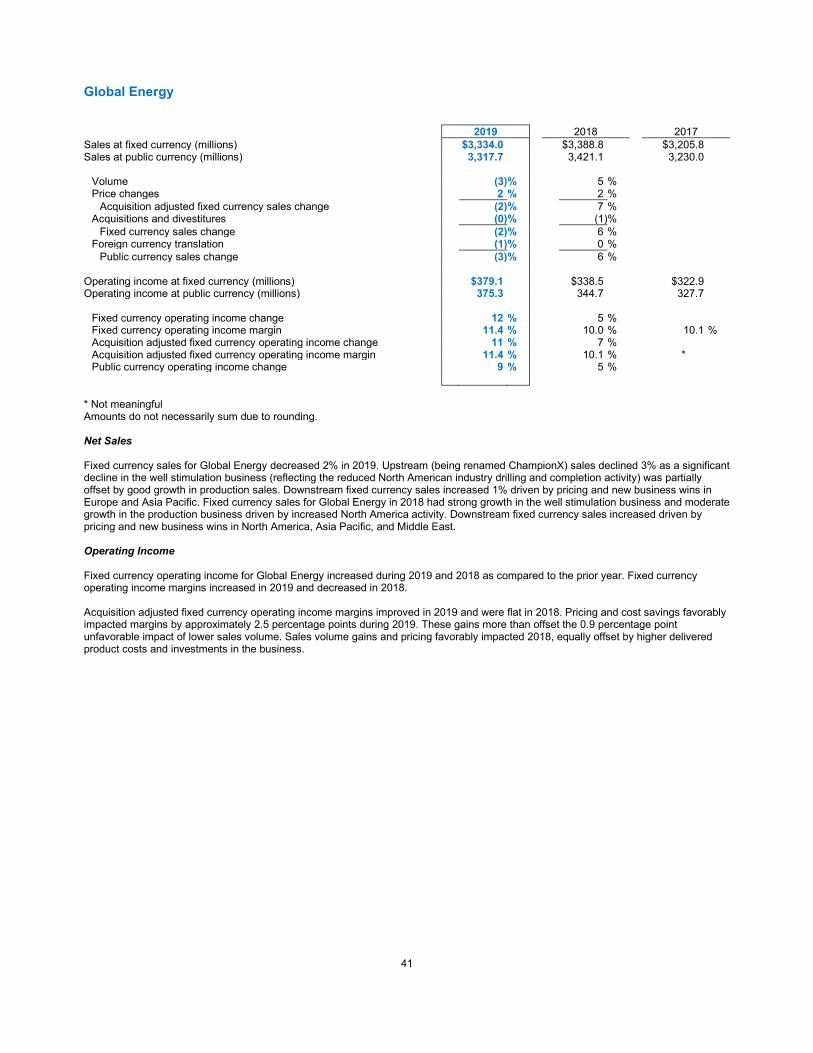
41
Global Energy
2019 2018 2017 Sales at fixed currency (millions) $3,334.0 $3,388.8 $3,205.8 Sales at public currency (millions) 3,317.7 3,421.1 3,230.0
Volume (3) % 5 % Price changes 2 % 2 %
Acquisition adjusted fixed currency sales change (2) % 7 % Acquisitions and divestitures (0) % (1) %
Fixed currency sales change (2) % 6 % Foreign currency translation (1) % 0 %
Public currency sales change (3) % 6 % Operating income at fixed currency (millions) $379.1 $338.5 $322.9 Operating income at public currency (millions) 375.3 344.7 327.7
Fixed currency operating income change 12 % 5 % Fixed currency operating income margin 11.4 % 10.0 % 10.1 % Acquisition adjusted fixed currency operating income change 11 % 7 % Acquisition adjusted fixed currency operating income margin 11.4 % 10.1 % * Public currency operating income change 9 % 5 %
* Not meaningful Amounts do not necessarily sum due to rounding. Net Sales Fixed currency sales for Global Energy decreased 2% in 2019. Upstream (being renamed ChampionX) sales declined 3% as a significant decline in the well stimulation business (reflecting the reduced North American industry drilling and completion activity) was partially offset by good growth in production sales. Downstream fixed currency sales increased 1% driven by pricing and new business wins in Europe and Asia Pacific. Fixed currency sales for Global Energy in 2018 had strong growth in the well stimulation business and moderate growth in the production business driven by increased North America activity. Downstream fixed currency sales increased driven by pricing and new business wins in North America, Asia Pacific, and Middle East. Operating Income Fixed currency operating income for Global Energy increased during 2019 and 2018 as compared to the prior year. Fixed currency operating income margins increased in 2019 and decreased in 2018. Acquisition adjusted fixed currency operating income margins improved in 2019 and were flat in 2018. Pricing and cost savings favorably impacted margins by approximately 2.5 percentage points during 2019. These gains more than offset the 0.9 percentage point unfavorable impact of lower sales volume. Sales volume gains and pricing favorably impacted 2018, equally offset by higher delivered product costs and investments in the business.
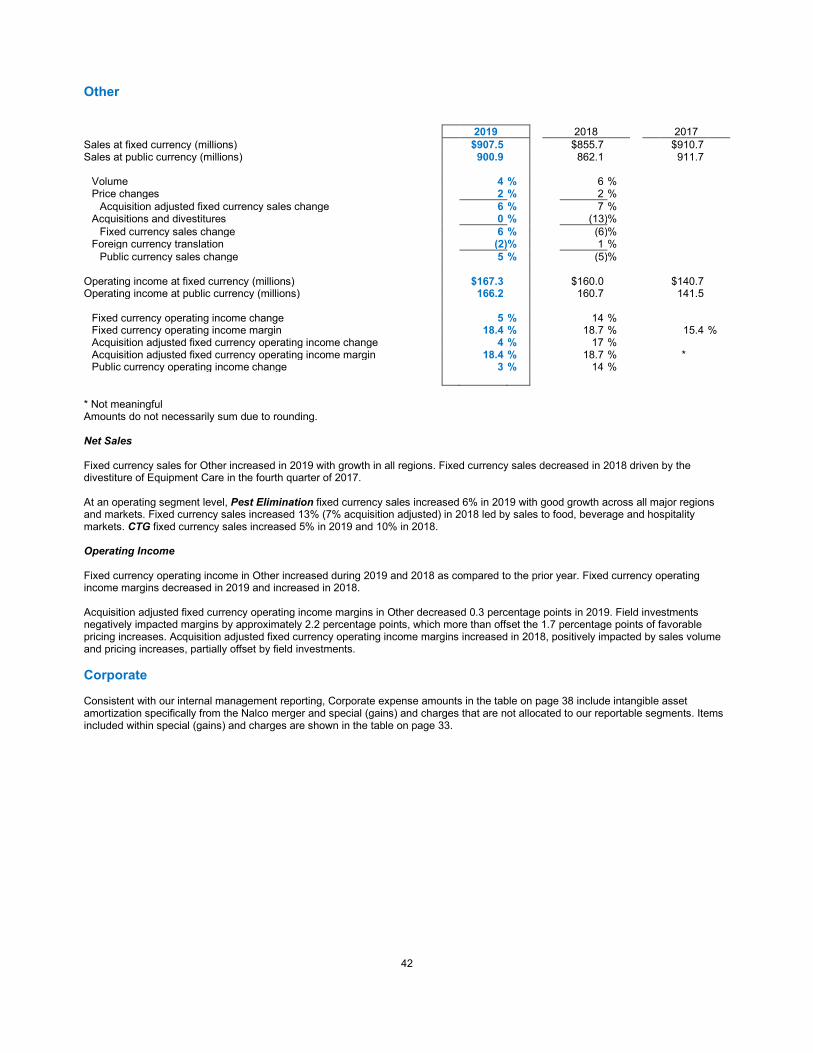
42
Other
2019 2018 2017 Sales at fixed currency (millions) $907.5 $855.7 $910.7 Sales at public currency (millions) 900.9 862.1 911.7
Volume 4 % 6 % Price changes 2 % 2 %
Acquisition adjusted fixed currency sales change 6 % 7 % Acquisitions and divestitures 0 % (13) %
Fixed currency sales change 6 % (6) % Foreign currency translation (2) % 1 %
Public currency sales change 5 % (5) % Operating income at fixed currency (millions) $167.3 $160.0 $140.7 Operating income at public currency (millions) 166.2 160.7 141.5
Fixed currency operating income change 5 % 14 % Fixed currency operating income margin 18.4 % 18.7 % 15.4 % Acquisition adjusted fixed currency operating income change 4 % 17 % Acquisition adjusted fixed currency operating income margin 18.4 % 18.7 % * Public currency operating income change 3 % 14 %
* Not meaningful Amounts do not necessarily sum due to rounding. Net Sales Fixed currency sales for Other increased in 2019 with growth in all regions. Fixed currency sales decreased in 2018 driven by the divestiture of Equipment Care in the fourth quarter of 2017. At an operating segment level, Pest Elimination fixed currency sales increased 6% in 2019 with good growth across all major regions and markets. Fixed currency sales increased 13% (7% acquisition adjusted) in 2018 led by sales to food, beverage and hospitality markets. CTG fixed currency sales increased 5% in 2019 and 10% in 2018. Operating Income Fixed currency operating income in Other increased during 2019 and 2018 as compared to the prior year. Fixed currency operating income margins decreased in 2019 and increased in 2018. Acquisition adjusted fixed currency operating income margins in Other decreased 0.3 percentage points in 2019. Field investments negatively impacted margins by approximately 2.2 percentage points, which more than offset the 1.7 percentage points of favorable pricing increases. Acquisition adjusted fixed currency operating income margins increased in 2018, positively impacted by sales volume and pricing increases, partially offset by field investments. Corporate Consistent with our internal management reporting, Corporate expense amounts in the table on page 38 include intangible asset amortization specifically from the Nalco merger and special (gains) and charges that are not allocated to our reportable segments. Items included within special (gains) and charges are shown in the table on page 33.

43
FINANCIAL POSITION, CASH FLOW AND LIQUIDITY Financial Position Total assets were $20.9 billion as of December 31, 2019, compared to total assets of $20.1 billion as of December 31, 2018. Total liabilities were $12.1 billion as of December 31, 2019, compared to total liabilities of $12.0 billion as of December 31, 2018. Total debt was $6.4 billion as of December 31, 2019 and $7.0 billion as of December 31, 2018. See further discussion of our debt activity within the “Liquidity and Capital Resources” section of this MD&A. Our net debt to EBITDA is shown in the following table. EBITDA is a non-GAAP measure discussed further in the “Non-GAAP Financial Measures” section of this MD&A.
2019 2018 2017 (ratio) Net debt to EBITDA 2.0 2.3 2.4 (millions) Total debt $6,354.1 $7,045.2 $7,322.7 Cash 186.4 114.7 211.4
Net debt $6,167.7 $6,930.5 $7,111.3 Net income including noncontrolling interest $1,576.2 $1,440.3 $1,518.6 Provision for income taxes 322.7 364.3 243.8 Interest expense, net 191.2 222.3 255.0 Depreciation 654.1 621.3 585.7 Amortization 319.2 317.0 307.6
EBITDA $3,063.4 $2,965.2 $2,910.7 Cash Flows Operating Activities
Dollar Change (millions) 2019 2018 2017 2019 2018 Cash provided by operating activities $2,420.7 $2,277.7 $2,091.3 $143.0 $186.4 We continue to generate strong cash flow from operations, allowing us to fund our ongoing operations, acquisitions, investments in the business and pension obligations along with returning cash to our shareholders through dividend payments and share repurchases. Comparability of cash generated from operating activities across 2019 to 2017 was impacted by fluctuations in accounts receivable, inventories and accounts payable (“working capital”), the combination of which increased $74 million, $192 million and $56 million in 2019, 2018 and 2017 respectively. The cash flow impact across the three years from working capital accounts was driven by changes in sales volumes and timing of collections; timing of purchases and production and usage levels; and volume of purchases and timing of payments. The impact on operating cash flows of pension and postretirement plan contributions, cash activity related to restructuring, cash paid for income taxes and cash paid for interest, are shown in the following table:
Dollar Change (millions) 2019 2018 2017 2019 2018
Pensions and postretirement plan contributions $186.0 $60.0 $144.1 $126.0 $(84.1) Restructuring payments 100.9 57.9 39.2 43.0 18.7 Income tax payments 356.3 395.2 402.8 (38.9) (7.6) Interest payments 189.4 206.4 239.3 (17.0) (32.9)

44
Investing Activities
Dollar Change (millions) 2019 2018 2017 2019 2018 Cash used for investing activities $(1,199.1) $(1,030.0) $(1,727.0) $(169.1) $697.0 Cash used for investing activities is primarily impacted by the timing of business acquisitions and dispositions as well as from capital investments in the business. Total cash paid for acquisitions, net of cash acquired and net of cash received from dispositions, in 2019, 2018 and 2017 was $385 million, $221 million and $870 million, respectively. Our acquisitions and divestitures are discussed further in Note 4. We continue to target strategic business acquisitions which complement our growth strategy and expect to continue to make capital investments and acquisitions in the future to support our long-term growth. We continue to make capital investments in the business, including merchandising and customer equipment and manufacturing facilities. Total capital expenditures were $801 million, $847 million and $869 million in 2019, 2018 and 2017, respectively. Financing Activities
Dollar Change (millions) 2019 2018 2017 2019 2018 Cash used for financing activities $(1,349.6) $(1,172.7) $(522.7) $(176.9) $(650.0) Our cash flows from financing activities primarily reflect the issuances and repayment of debt, common stock repurchases, proceeds from common stock issuances related to our equity incentive programs, dividend payments and acquisition-related contingent considerations. Shares are repurchased for the purpose of partially offsetting the dilutive effect of our equity compensation plans and stock issued in acquisitions, to manage our capital structure and to efficiently return capital to shareholders. We repurchased a total of $354 million, $562 million, and $600 million of shares in 2019, 2018 and 2017, respectively. 2017 amount includes $300 million of shares repurchased through an Accelerated Stock Repurchase (“ASR”) agreement. See Note 10 for further information regarding the ASR agreement. The impact on financing cash flows of commercial paper and notes payable repayments, long-term debt borrowings and long-term debt repayments, are shown in the following table:
Dollar Change (millions) 2019 2018 2017 2019 2018 Net issuances (repayments) of commercial paper and notes payable $(252.0) $341.8 $(43.7) $(593.8) $385.5 Long-term debt borrowings - - 1,309.4 - (1,309.4) Long-term debt repayments (400.6) (551.6) (799.0) 151.0 247.4 In December 2019, we increased our indicated annual dividend rate by 2%. This represents the 28th consecutive year we have increased our dividend. We have paid dividends on our common stock for 83 consecutive years. Cash dividends declared per share of common stock, by quarter, for each of the last three years were as follows:
First Second Third Fourth Quarter Quarter Quarter Quarter Year 2019 $0.46 $0.46 $0.46 $0.47 $1.85 2018 $0.41 $0.41 $0.41 $0.46 $1.69 2017 $0.37 $0.37 $0.37 $0.41 $1.52

45
Liquidity and Capital Resources We currently expect to fund all of our cash requirements which are reasonably foreseeable for the next twelve months, including scheduled debt repayments, new investments in the business, share repurchases, dividend payments, possible business acquisitions and pension and postretirement contributions with cash from operating activities, and as needed, additional short-term and/or long-term borrowings. We continue to expect our operating cash flow to remain strong. As of December 31, 2019, we had $186 million of cash and cash equivalents on hand, of which $159 million was held outside of the U.S. As of December 31, 2018, we had $115 million of cash and cash equivalents on hand, substantially all of which was held outside of the U.S. As of December 31, 2019, we had a $2.0 billion multi-year credit facility, which expires in November 2022. The credit facility has been established with a diverse syndicate of banks and supports our U.S. and Euro commercial paper programs. The maximum aggregate amount of commercial paper that may be issued under our U.S. commercial paper program and our Euro commercial paper program may not exceed $2.0 billion. At year-end, we had $55.1 million (€50.0 million) of commercial paper outstanding under the Euro commercial paper program and no borrowings under the U.S. commercial paper program. There were no borrowings under our credit facility as of December 31, 2019 or 2018. As of December 31, 2019, both programs were rated A-2 by Standard & Poor’s, P-2 by Moody’s and F-1 by Fitch. Additionally, we have uncommitted credit lines with major international banks and financial institutions. These credit lines support our daily global funding needs, primarily our global cash pooling structures. We have $165 million of bank supported letters of credit, surety bonds and guarantees outstanding in support of our commercial business transactions. We do not have any other significant unconditional purchase obligations or commercial commitments. As of December 31, 2019, Standard & Poor’s and Fitch both rated our long-term credit at A- (stable outlook) and Moody’s rated our long-term credit at Baa1 (positive outlook). A reduction in our credit ratings could limit or preclude our ability to issue commercial paper under our current programs or could also adversely affect our ability to renew existing, or negotiate new, credit facilities in the future and could increase the cost of these facilities. We are in compliance with our debt covenants and other requirements of our credit agreements and indentures. A schedule of our various obligations as of December 31, 2019 are summarized in the following table:
Payments Due by Period Less More Than 2-3 4-5 Than (millions) Total 1 Year Years Years 5 Years Notes payable $ 25 $ 25 $ - $ - $ - One-time transition tax 106 7 - 27 72 Long-term debt 6,271 300 1,516 1,276 3,179 Operating leases 659 174 259 105 121 Interest* 2,240 212 370 260 1,398 Total $ 9,301 $ 718 $ 2,145 $ 1,668 $ 4,770 * Interest on variable rate debt was calculated using the interest rate at year-end 2019. As of December 31, 2019, our gross liability for uncertain tax positions was $28 million. We are not able to reasonably estimate the amount by which the liability will increase or decrease over an extended period of time or whether a cash settlement of the liability will be required. Therefore, these amounts have been excluded from the schedule of contractual obligations. We do not have required minimum cash contribution obligations for our qualified pension plans in 2020. We are required to fund certain international pension benefit plans in accordance with local legal requirements. We estimate contributions to be made to our international plans will approximate $46 million in 2020. These amounts have been excluded from the schedule of contractual obligations. We lease certain sales and administrative office facilities, distribution centers, research and manufacturing facilities and other equipment under longer-term operating leases. Vehicle leases are generally shorter in duration. Vehicle leases have residual value requirements that have historically been satisfied primarily by the proceeds on the sale of the vehicles.

46
Off-Balance Sheet Arrangements We do not participate in off-balance sheet financing arrangements. Operating leases were not recorded on the Consolidated Balance Sheet in 2018 or 2017. Through the normal course of business, we have established various joint ventures, some of which have not been consolidated within our financial statements as we neither control, nor are the primary beneficiary. The joint ventures help us meet local ownership requirements, achieve quicker operational scale, expand our ability to provide customers a more fully integrated offering or provide other benefits to our business or customers. These entities have not been utilized as special purposes entities, which are sometimes established for the purpose of facilitating off-balance sheet financial arrangements or other contractually narrow or limited purposes. As such, we are not exposed to financing, liquidity, market or credit risk that could arise if we had engaged in such relationships. Market Risk We enter into contractual arrangements (derivatives) in the ordinary course of business to manage foreign currency exposure and interest rate risks. We do not enter into derivatives for speculative or trading purposes. Our use of derivatives is subject to internal policies that provide guidelines for control, counterparty risk, and ongoing monitoring and reporting, and is designed to reduce the volatility associated with movements in foreign exchange and interest rates on our income statement and cash flows. We enter into foreign currency forward contracts to hedge certain intercompany financial arrangements, and to hedge against the effect of exchange rate fluctuations on transactions related to cash flows denominated in currencies other than U.S. dollars. We use net investment hedges as hedging instruments to manage risks associated with our investments in foreign operations. As of December 31, 2019, we had a total of €1,150 million senior notes designated as net investment hedges. We manage interest expense using a mix of fixed and floating rate debt. To help manage borrowing costs, we may enter into interest rate swap agreements. Under these arrangements, we agree to exchange, at specified intervals, the difference between fixed and floating interest amounts calculated by reference to an agreed-upon notional principal amount. As of December 31, 2019, we had no interest rate swaps outstanding. See Note 8 for further information on our hedging activity. Based on a sensitivity analysis (assuming a 10% change in market rates) of our foreign exchange and interest rate derivatives and other financial instruments, changes in exchange rates or interest rates would increase/decrease our financial position and liquidity by approximately $257 million. The effect on our results of operations would be substantially offset by the impact of the hedged items. GLOBAL ECONOMIC AND POLITICAL ENVIRONMENT Energy Markets Approximately 22% of our sales are generated from our Global Energy segment, the results of which are subject to volatility in the oil and gas commodity markets. During 2019, the North American oil industry drilling and production activity slowed from 2018 levels, while international activity showed modest improvement. Demand for oil and overall energy consumption has shown modest growth with oil prices well above their lows in early 2016. Our global footprint and broad business portfolio within the Global Energy segment, as well as our strong execution capabilities are expected to provide the required resilience to perform well in the current market. As such, we continue to remain confident in the long-term growth prospects of the segment. Global Economies Almost half of our sales are outside of the United States. Our international operations subject us to changes in economic conditions and foreign currency exchange rates as well as political uncertainty in some countries which could impact future operating results. Argentina has continued to experience negative economic trends, evidenced by multiple periods of increasing inflation rates, devaluation of the Argentine Peso, and increasing borrowing rates. Argentina is classified as a highly inflationary economy in accordance with U.S. GAAP, and the U.S. dollar is the functional currency for our subsidiaries in Argentina. During 2019, sales in Argentina represented less than 1% of our consolidated sales. Assets held in Argentina at the end of 2019 represented less than 1% of our consolidated assets. The coronavirus has had a negative impact on market conditions and customer demand, starting in China. We anticipate an impact to our 2020 sales from lower market demand, but we are not yet able to estimate the full impact of the coronavirus outbreak as it continues to spread beyond China.

47
Brexit Referendum Effective on January 31, 2020, the U.K. has formally left the European Union. The U.K.’s relationship with the EU will no longer be governed by the EU Treaties, but instead by the terms of the Withdrawal Agreement agreed between the U.K. and the EU in late 2019. The Withdrawal Agreement provides for a “transition” period, which commenced the moment the U.K. leaves the EU and is currently set to end on December 31, 2020. At the end of the transition period, there may be significant changes to the U.K.’s business environment. While the effects of Brexit will depend on any agreements the U.K. makes to retain access to EU markets or the failure to reach such agreements, the uncertainties created by Brexit, any resolution between the U.K. and EU countries or the failure to reach any such resolutions, could adversely affect our relationships with customers, suppliers and employees and could adversely affect our business. During 2019, net sales of our U.K. operations were approximately 3% of our consolidated net sales. NEW ACCOUNTING PRONOUNCEMENTS Information regarding new accounting pronouncements is included in Note 2. SUBSEQUENT EVENTS Subsequent to year-end, we reached an agreement to purchase CID Lines, a leading global provider of livestock biosecurity and hygiene solutions. The acquisition is expected to close in the second quarter of 2020 subject to various regulatory clearances.
48
NON-GAAP FINANCIAL MEASURES This MD&A includes financial measures that have not been calculated in accordance with U.S. GAAP. These non-GAAP measures include:
• Fixed currency sales • Acquisition adjusted fixed currency sales • Adjusted cost of sales • Adjusted gross margin • Fixed currency operating income • Fixed currency operating income margin • Adjusted operating income • Adjusted operating income margin • Adjusted fixed currency operating income • Adjusted fixed currency operating income margin • Acquisition adjusted fixed currency operating income • Acquisition adjusted fixed currency operating income margin • Adjusted other (income) expense • Adjusted interest expense, net • EBITDA • Adjusted tax rate • Adjusted net income attributable to Ecolab • Adjusted diluted EPS
We provide these measures as additional information regarding our operating results. We use these non-GAAP measures internally to evaluate our performance and in making financial and operational decisions, including with respect to incentive compensation. We believe that our presentation of these measures provides investors with greater transparency with respect to our results of operations and that these measures are useful for period-to-period comparison of results. Our non-GAAP financial measures for cost of sales, gross margin, interest expense and operating income exclude the impact of special (gains) and charges, and our non-GAAP measures for tax rate, net income attributable to Ecolab and diluted EPS further exclude the impact of discrete tax items. We include items within special (gains) and charges and discrete tax items that we believe can significantly affect the period-over-period assessment of operating results and not necessarily reflect costs and/or income associated with historical trends and future results. After tax special (gains) and charges are derived by applying the applicable local jurisdictional tax rate to the corresponding pre-tax special (gains) and charges. EBITDA is defined as the sum of net income including non-controlling interest, provision for income taxes, net interest expense, depreciation and amortization. EBITDA is used in our net debt to EBITDA ratio, which we view as important indicators of the operational and financial health of our organization. We evaluate the performance of our international operations based on fixed currency rates of foreign exchange. Fixed currency amounts included in this Form 10-K are based on translation into U.S. dollars at the fixed foreign currency exchange rates established by management at the beginning of 2019. Fixed currency amounts during 2018 for Argentina operations are reflected at the Argentine Peso rate established by management at the beginning of the year. Acquisition adjusted growth rates exclude the results of our acquired businesses from the first twelve months post acquisition, exclude the results of our divested businesses from the twelve months prior to divestiture. These non-GAAP measures are not in accordance with, or an alternative to U.S. GAAP, and may be different from non-GAAP measures used by other companies. Investors should not rely on any single financial measure when evaluating our business. We recommend that investors view these measures in conjunction with the U.S. GAAP measures included in this MD&A and we have provided reconciliations of reported U.S. GAAP amounts to the non-GAAP amounts.
Item 7A. Quantitative and Qualitative Disclosures about Market Risk. The discussion under the heading entitled "Market Risk" and “Global Economic and Political Environment” is incorporated by reference from Part II, Item 7 of this Form 10-K.

49
Item 8. Financial Statements and Supplementary Data. REPORTS OF MANAGEMENT To our Shareholders: Management’s Responsibility for Financial Statements Management is responsible for the integrity and objectivity of the consolidated financial statements. The statements have been prepared in accordance with accounting principles generally accepted in the United States of America and, accordingly, include certain amounts based on management’s best estimates and judgments. The Board of Directors, acting through its Audit Committee composed solely of independent directors, is responsible for determining that management fulfills its responsibilities in the preparation of financial statements and maintains internal control over financial reporting. The Audit Committee recommends to the Board of Directors the appointment of the Company’s independent registered public accounting firm, subject to ratification by the shareholders. It meets regularly with management, the internal auditors and the independent registered public accounting firm. The independent registered public accounting firm has audited the consolidated financial statements included in this annual report and have expressed their opinion regarding whether these consolidated financial statements present fairly in all material respects our financial position and results of operation and cash flows as stated in their report presented separately herein. Management’s Report on Internal Control Over Financial Reporting Management is responsible for establishing and maintaining adequate internal control over financial reporting, as such term is defined in Exchange Act Rule 13a-15(f). Under the supervision and with the participation of management, including the principal executive officer and principal financial officer, an evaluation of the design and operating effectiveness of internal control over financial reporting was conducted based on the 2013 framework in Internal Control — Integrated Framework issued by the Committee of Sponsoring Organizations of the Treadway Commission. Based on the evaluation under the framework in Internal Control — Integrated Framework, management concluded that internal control over financial reporting was effective as of December 31, 2019. The Company’s independent registered public accounting firm, PricewaterhouseCoopers LLP, has audited the effectiveness of the Company’s internal control over financial reporting as of December 31, 2019 as stated in their report which is included herein.
Douglas M. Baker, Jr. Daniel J. Schmechel Chairman and Chief Executive Officer Chief Financial Officer
50
REPORT OF INDEPENDENT REGISTERED PUBLIC ACCOUNTING FIRM To the Shareholders and Board of Directors of Ecolab Inc.: Opinions on the Financial Statements and Internal Control over Financial Reporting We have audited the accompanying consolidated balance sheets of Ecolab Inc. and its subsidiaries (the “Company”) as of December 31, 2019 and 2018, and the related consolidated statements of income, comprehensive income, equity and cash flows for each of the three years in the period ended December 31, 2019, including the related notes (collectively referred to as the “consolidated financial statements”). We also have audited the Company's internal control over financial reporting as of December 31, 2019, based on criteria established in Internal Control - Integrated Framework (2013) issued by the Committee of Sponsoring Organizations of the Treadway Commission (COSO). In our opinion, the consolidated financial statements referred to above present fairly, in all material respects, the financial position of the Company as of December 31, 2019 and 2018, and the results of its operations and its cash flows for each of the three years in the period ended December 31, 2019 in conformity with accounting principles generally accepted in the United States of America. Also in our opinion, the Company maintained, in all material respects, effective internal control over financial reporting as of December 31, 2019, based on criteria established in Internal Control - Integrated Framework (2013) issued by the COSO. Change in Accounting Principle As discussed in Note 2 to the consolidated financial statements, the Company changed the manner in which it accounts for leases in 2019. Basis for Opinions The Company's management is responsible for these consolidated financial statements, for maintaining effective internal control over financial reporting, and for its assessment of the effectiveness of internal control over financial reporting, included in the accompanying Management’s Report on Internal Control over Financial Reporting. Our responsibility is to express opinions on the Company’s consolidated financial statements and on the Company's internal control over financial reporting based on our audits. We are a public accounting firm registered with the Public Company Accounting Oversight Board (United States) (“PCAOB”) and are required to be independent with respect to the Company in accordance with the U.S. federal securities laws and the applicable rules and regulations of the Securities and Exchange Commission and the PCAOB. We conducted our audits in accordance with the standards of the PCAOB. Those standards require that we plan and perform the audits to obtain reasonable assurance about whether the consolidated financial statements are free of material misstatement, whether due to error or fraud, and whether effective internal control over financial reporting was maintained in all material respects. Our audits of the consolidated financial statements included performing procedures to assess the risks of material misstatement of the consolidated financial statements, whether due to error or fraud, and performing procedures that respond to those risks. Such procedures included examining, on a test basis, evidence regarding the amounts and disclosures in the consolidated financial statements. Our audits also included evaluating the accounting principles used and significant estimates made by management, as well as evaluating the overall presentation of the consolidated financial statements. Our audit of internal control over financial reporting included obtaining an understanding of internal control over financial reporting, assessing the risk that a material weakness exists, and testing and evaluating the design and operating effectiveness of internal control based on the assessed risk. Our audits also included performing such other procedures as we considered necessary in the circumstances. We believe that our audits provide a reasonable basis for our opinions. Definition and Limitations of Internal Control over Financial Reporting A company’s internal control over financial reporting is a process designed to provide reasonable assurance regarding the reliability of financial reporting and the preparation of financial statements for external purposes in accordance with generally accepted accounting principles. A company’s internal control over financial reporting includes those policies and procedures that (i) pertain to the maintenance of records that, in reasonable detail, accurately and fairly reflect the transactions and dispositions of the assets of the company; (ii) provide reasonable assurance that transactions are recorded as necessary to permit preparation of financial statements in accordance with generally accepted accounting principles, and that receipts and expenditures of the company are being made only in accordance with authorizations of management and directors of the company; and (iii) provide reasonable assurance regarding prevention or timely detection of unauthorized acquisition, use, or disposition of the company’s assets that could have a material effect on the financial statements. Because of its inherent limitations, internal control over financial reporting may not prevent or detect misstatements. Also, projections of any evaluation of effectiveness to future periods are subject to the risk that controls may become inadequate because of changes in conditions, or that the degree of compliance with the policies or procedures may deteriorate.

51
Critical Audit Matters
The critical audit matter communicated below is a matter arising from the current period audit of the consolidated financial statements that was communicated or required to be communicated to the audit committee and that (i) relates to accounts or disclosures that are material to the consolidated financial statements and (ii) involved our especially challenging, subjective, or complex judgments. The communication of critical audit matters does not alter in any way our opinion on the consolidated financial statements, taken as a whole, and we are not, by communicating the critical audit matter below, providing a separate opinion on the critical audit matter or on the accounts or disclosures to which it relates.
Goodwill Impairment Assessment – Global Energy Reporting Unit
As described in Note 2 to the consolidated financial statements, the carrying value of goodwill was $7.3 billion as of December 31, 2019, which includes $3.1 billion allocated to the Global Energy reporting unit. During the second quarter, management completed its annual assessment for goodwill impairment across its eleven reporting units. Management continued to assess the need to test its reporting units for impairment during interim periods since its scheduled annual assessments. The goodwill impairment assessment was completed through a two-step quantitative analysis, utilizing a discounted cash flow approach, which incorporates assumptions regarding future growth rates, terminal values, and discount rates. The first step involved comparing the estimated fair value of each reporting unit to the reporting unit’s carrying value, including goodwill. If the carrying amount of the reporting unit exceeds its fair value, the second step of the goodwill impairment test would be performed to measure the amount of impairment loss to be recorded, if any.
The principal considerations for our determination that performing procedures relating to the goodwill impairment assessment of the Global Energy reporting unit is a critical audit matter are i) there was a high degree of auditor judgment and subjectivity involved in applying procedures due to the significant amount of judgment by management when estimating the fair value of the reporting unit, ii) a high degree of audit effort was necessary to perform procedures and evaluate audit evidence related to the discount rate assumption, and (iii) the audit effort involved the use of professionals with specialized skill and knowledge to assist in performing procedures and evaluating the audit evidence obtained from these procedures.
Addressing the matter involved performing procedures and evaluating audit evidence in connection with forming our overall opinion on the consolidated financial statements. These procedures included testing the effectiveness of controls relating to management’s goodwill impairment assessment, including controls over the discount rate assumption used in the discounted cash flow approach to estimate the fair value of the Global Energy reporting unit. These procedures also included, among others, testing management’s process for estimating the fair value, evaluating the appropriateness of the valuation approach used in management’s estimate, and evaluating the reasonableness of the discount rate assumption used by management. The discount rate was evaluated by considering the cost of capital of comparable businesses and other industry factors. Professionals with specialized skill and knowledge were used to assist in evaluating the Company’s valuation approach and the discount rate assumption.
PricewaterhouseCoopers LLP Minneapolis, Minnesota February 28, 2020 We have served as the Company’s auditor since 1970.

52
CONSOLIDATED STATEMENT OF INCOME
(millions, except per share amounts) 2019 2018 2017
Product and equipment sales $12,238.9 $12,128.6 $11,431.8 Service and lease sales 2,667.4 2,539.6 2,404.1
Net sales 14,906.3 14,668.2 13,835.9 Product and equipment cost of sales 7,106.4 7,078.5 6,576.9 Service and lease cost of sales 1,617.0 1,547.4 1,487.3
Cost of sales (including special charges (a)) 8,723.4 8,625.9 8,064.2 Selling, general and administrative expenses 3,957.5 3,968.6 3,825.3 Special (gains) and charges 211.6 126.7 (3.7)
Operating income 2,013.8 1,947.0 1,950.1 Other (income) expense (b) (76.3) (79.9) (67.3) Interest expense, net (c) 191.2 222.3 255.0 Income before income taxes 1,898.9 1,804.6 1,762.4 Provision for income taxes 322.7 364.3 243.8 Net income including noncontrolling interest 1,576.2 1,440.3 1,518.6 Net income attributable to noncontrolling interest 17.3 11.2 14.0 Net income attributable to Ecolab $1,558.9 $1,429.1 $1,504.6 Earnings attributable to Ecolab per common share
Basic $ 5.41 $ 4.95 $ 5.20 Diluted $ 5.33 $ 4.88 $ 5.12
Weighted-average common shares outstanding
Basic 288.1 288.6 289.6 Diluted 292.5 292.8 294.0
(a) Cost of sales includes special charges of $38.5 in 2019, $9.3 in 2018, and $44.0 in 2017, which is included in product and
equipment cost of sales. (b) Other (income) expense includes special charges of $9.5 in 2019. (c) Interest expense, net includes special charges of $0.2 in 2019, $0.3 in 2018 and $21.9 in 2017. The accompanying notes are an integral part of the consolidated financial statements.

53
CONSOLIDATED STATEMENT OF COMPREHENSIVE INCOME
(millions) 2019 2018 2017 Net income including noncontrolling interest $1,576.2 $1,440.3 $1,518.6 Other comprehensive income (loss), net of tax
Foreign currency translation adjustments Foreign currency translation (45.1) (223.3) 208.0 Gain (loss) on net investment hedges 31.4 57.5 (109.7)
Total foreign currency translation adjustments (13.7) (165.8) 98.3
Derivatives and hedging instruments (3.4) 28.4 (17.9)
Pension and postretirement benefits Current period net actuarial loss (251.1) (37.8) (33.4) Pension and postretirement prior period service (costs) and benefits (0.3) (2.3) (0.5) Amortization of net actuarial loss and prior service costs included in
net periodic pension and postretirement costs (0.2) 13.2 24.7 Postretirement benefits changes - 44.9 -
Total pension and postretirement benefits (251.6) 18.0 (9.2) Subtotal (268.7) (119.4) 71.2 Total comprehensive income, including noncontrolling interest 1,307.5 1,320.9 1,589.8 Comprehensive income attributable to noncontrolling interest 15.4 10.1 15.7 Comprehensive income attributable to Ecolab $1,292.1 $1,310.8 $1,574.1 The accompanying notes are an integral part of the consolidated financial statements.
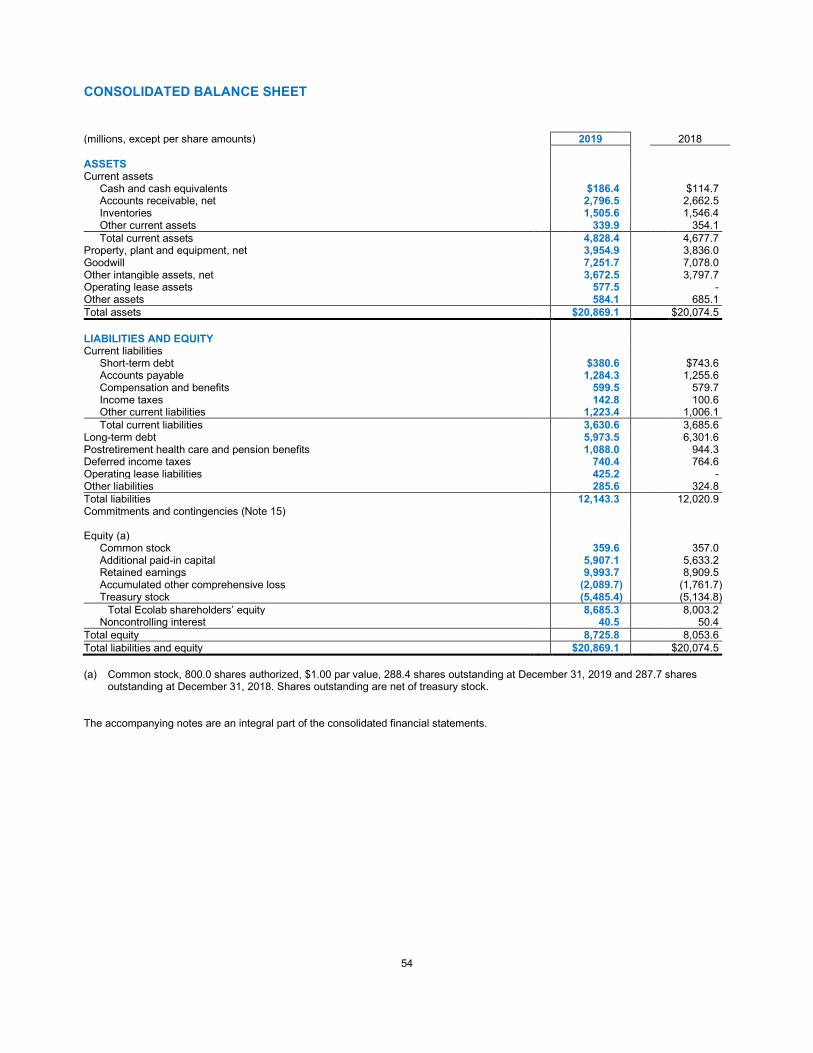
54
CONSOLIDATED BALANCE SHEET
(millions, except per share amounts) 2019 2018 ASSETS Current assets
Cash and cash equivalents $186.4 $114.7 Accounts receivable, net 2,796.5 2,662.5 Inventories 1,505.6 1,546.4 Other current assets 339.9 354.1 Total current assets 4,828.4 4,677.7
Property, plant and equipment, net 3,954.9 3,836.0 Goodwill 7,251.7 7,078.0 Other intangible assets, net 3,672.5 3,797.7 Operating lease assets 577.5 - Other assets 584.1 685.1 Total assets $20,869.1 $20,074.5 LIABILITIES AND EQUITY Current liabilities
Short-term debt $380.6 $743.6 Accounts payable 1,284.3 1,255.6 Compensation and benefits 599.5 579.7 Income taxes 142.8 100.6 Other current liabilities 1,223.4 1,006.1 Total current liabilities 3,630.6 3,685.6
Long-term debt 5,973.5 6,301.6 Postretirement health care and pension benefits 1,088.0 944.3 Deferred income taxes 740.4 764.6 Operating lease liabilities 425.2 - Other liabilities 285.6 324.8 Total liabilities 12,143.3 12,020.9 Commitments and contingencies (Note 15) Equity (a)
Common stock 359.6 357.0 Additional paid-in capital 5,907.1 5,633.2 Retained earnings 9,993.7 8,909.5 Accumulated other comprehensive loss (2,089.7) (1,761.7) Treasury stock (5,485.4) (5,134.8)
Total Ecolab shareholders’ equity 8,685.3 8,003.2 Noncontrolling interest 40.5 50.4
Total equity 8,725.8 8,053.6 Total liabilities and equity $20,869.1 $20,074.5 (a) Common stock, 800.0 shares authorized, $1.00 par value, 288.4 shares outstanding at December 31, 2019 and 287.7 shares
outstanding at December 31, 2018. Shares outstanding are net of treasury stock. The accompanying notes are an integral part of the consolidated financial statements.
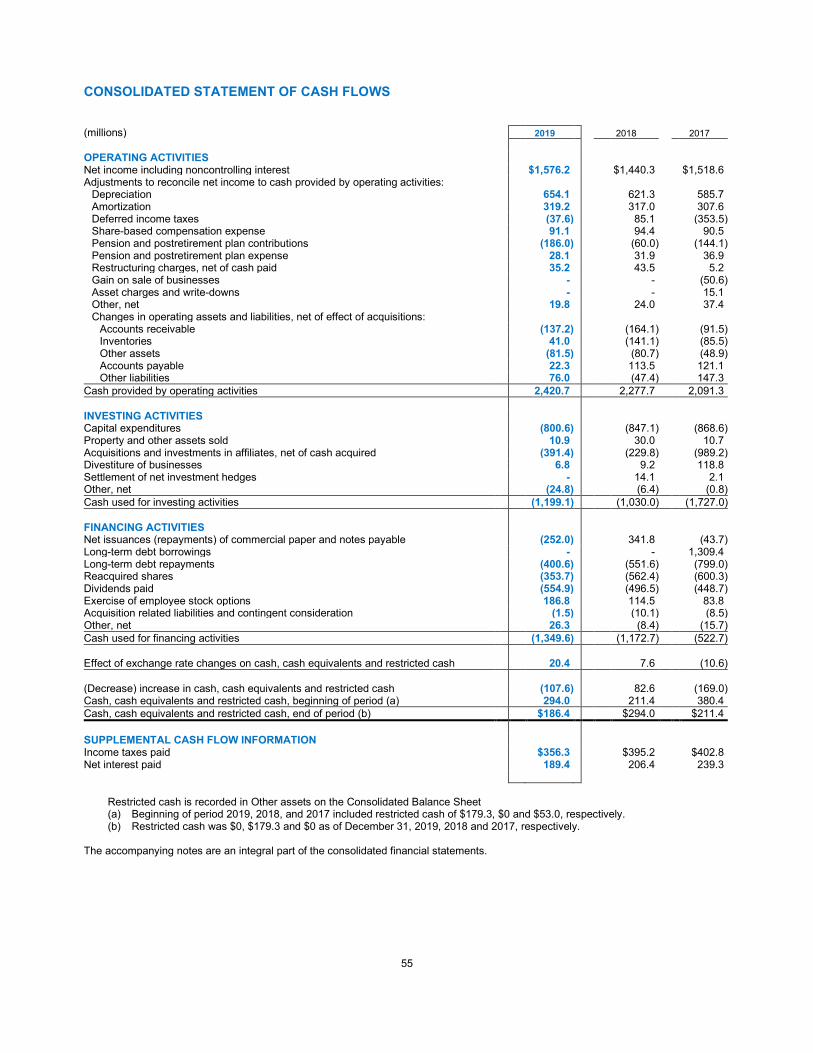
55
CONSOLIDATED STATEMENT OF CASH FLOWS
(millions) 2019 2018 2017
OPERATING ACTIVITIES Net income including noncontrolling interest $1,576.2 $1,440.3 $1,518.6 Adjustments to reconcile net income to cash provided by operating activities:
Depreciation 654.1 621.3 585.7 Amortization 319.2 317.0 307.6 Deferred income taxes (37.6) 85.1 (353.5) Share-based compensation expense 91.1 94.4 90.5 Pension and postretirement plan contributions (186.0) (60.0) (144.1) Pension and postretirement plan expense 28.1 31.9 36.9 Restructuring charges, net of cash paid 35.2 43.5 5.2 Gain on sale of businesses - - (50.6) Asset charges and write-downs - - 15.1 Other, net 19.8 24.0 37.4 Changes in operating assets and liabilities, net of effect of acquisitions:
Accounts receivable (137.2) (164.1) (91.5) Inventories 41.0 (141.1) (85.5) Other assets (81.5) (80.7) (48.9) Accounts payable 22.3 113.5 121.1 Other liabilities 76.0 (47.4) 147.3
Cash provided by operating activities 2,420.7 2,277.7 2,091.3 INVESTING ACTIVITIES Capital expenditures (800.6) (847.1) (868.6) Property and other assets sold 10.9 30.0 10.7 Acquisitions and investments in affiliates, net of cash acquired (391.4) (229.8) (989.2) Divestiture of businesses 6.8 9.2 118.8 Settlement of net investment hedges - 14.1 2.1 Other, net (24.8) (6.4) (0.8) Cash used for investing activities (1,199.1) (1,030.0) (1,727.0) FINANCING ACTIVITIES Net issuances (repayments) of commercial paper and notes payable (252.0) 341.8 (43.7) Long-term debt borrowings - - 1,309.4 Long-term debt repayments (400.6) (551.6) (799.0) Reacquired shares (353.7) (562.4) (600.3) Dividends paid (554.9) (496.5) (448.7) Exercise of employee stock options 186.8 114.5 83.8 Acquisition related liabilities and contingent consideration (1.5) (10.1) (8.5) Other, net 26.3 (8.4) (15.7) Cash used for financing activities (1,349.6) (1,172.7) (522.7) Effect of exchange rate changes on cash, cash equivalents and restricted cash 20.4 7.6 (10.6) (Decrease) increase in cash, cash equivalents and restricted cash (107.6) 82.6 (169.0) Cash, cash equivalents and restricted cash, beginning of period (a) 294.0 211.4 380.4 Cash, cash equivalents and restricted cash, end of period (b) $186.4 $294.0 $211.4 SUPPLEMENTAL CASH FLOW INFORMATION Income taxes paid $356.3 $395.2 $402.8 Net interest paid 189.4 206.4 239.3
Restricted cash is recorded in Other assets on the Consolidated Balance Sheet (a) Beginning of period 2019, 2018, and 2017 included restricted cash of $179.3, $0 and $53.0, respectively. (b) Restricted cash was $0, $179.3 and $0 as of December 31, 2019, 2018 and 2017, respectively.
The accompanying notes are an integral part of the consolidated financial statements.

56
CONSOLIDATED STATEMENT OF EQUITY
(millions, except shares and per share amounts)
Common Stock
Additional Paid-in Capital
Retained Earnings
OCI (Loss)
Treasury Stock
Ecolab Shareholders'
Equity
Non-Controlling
Interest Total
Equity Balance, December 31, 2016 $352.6 $5,270.8 $6,945.1 $(1,712.9) $(3,984.4) $6,871.2 $69.8 $6,941.0
New accounting guidance adoption (a) 1.9 1.9 1.9 Net income 1,504.6 1,504.6 14.0 1,518.6 Comprehensive income (loss) activity 69.5 69.5 1.7 71.2 Cash dividends declared (b) (440.0) (440.0) (19.3) (459.3) Acquisition of noncontrolling interests 4.0 4.0 Stock options and awards 2.1 170.3 4.3 176.7 176.7 Reacquired shares (5.4) (594.9) (600.3) (600.3)
Balance, December 31, 2017 354.7 5,435.7 8,011.6 (1,643.4) (4,575.0) 7,583.6 70.2 7,653.8
New accounting guidance adoption (c) (43.6) (43.6) (43.6) Net income 1,429.1 1,429.1 11.2 1,440.3 Comprehensive income (loss) activity (118.3) (118.3) (1.1) (119.4) Cash dividends declared (b) (487.6) (487.6) (22.7) (510.3) Changes in noncontrolling interests (7.7) (7.7) (7.2) (14.9) Stock options and awards 2.3 205.2 2.5 210.0 210.0 Reacquired shares (562.3) (562.3) (562.3)
Balance, December 31, 2018 357.0 5,633.2 8,909.5 (1,761.7) (5,134.8) 8,003.2 50.4 8,053.6
New accounting guidance adoption (d) 58.4 (61.2) (2.8) (2.8) Net income 1,558.9 1,558.9 17.3 1,576.2 Comprehensive income (loss) activity (266.8) (266.8) (1.9) (268.7) Cash dividends declared (b) (533.1) (533.1) (25.1) (558.2) Changes in noncontrolling interests 0.2 0.2 (0.2) - Stock options and awards 2.6 273.7 3.1 279.4 279.4 Reacquired shares (353.7) (353.7) (353.7)
Balance, December 31, 2019 $359.6 $5,907.1 $9,993.7 $(2,089.7) $(5,485.4) $8,685.3 $40.5 $8,725.8
(a) In 2017, upon adoption of ASU 2016-09, Compensation – Stock Compensation, the Company released a valuation allowance for previously unrecognized excess tax benefits resulting in an adjustment to retained earnings.
(b) Dividends declared per common share were $1.85, $1.69 and $1.52 in 2019, 2018 and 2017, respectively. (c) In 2018, upon adoption of ASU 2016-16, Intra-Entity Transfers of Assets Other than Inventory, the Company recorded an
adjustment to retained earnings representing the write-off of income tax effects that had been deferred from past transactions and the recording of deferred tax assets which previously were not allowed to be recognized.
(d) In 2019, upon adoption of ASU 2018-02, Income Statement – Reporting Comprehensive Income (Topic 220): Reclassification of Certain Tax Effects from Accumulated Other Comprehensive Income, the Company reclassified stranded tax effects resulting from the Tax Cut and Jobs Act from accumulated other comprehensive income to retained earnings. Also, upon adoption of ASU 2016-02, Leases (Topic 842), the Company has established right-of-use assets and lease liabilities for operating leases and the cumulative effect of applying the standard is recognized in retained earnings at the beginning of the period adopted.
See Note 2 for additional information regarding adoption of new accounting standards. COMMON STOCK ACTIVITY
2019 2018 2017 Common Treasury Common Treasury Common Treasury Year ended December 31 Stock Stock Stock Stock Stock Stock Shares, beginning of year 356,958,100 (69,243,979) 354,715,896 (65,393,098) 352,607,741 (60,782,667)
Stock options 2,220,815 41,575 1,833,004 38,679 1,714,214 41,767 Stock awards 390,319 29,173 409,200 18,481 393,941 55,431 Reacquired shares - (1,986,241) - (3,908,041) - (4,707,629)
Shares, end of year 359,569,234 (71,159,472) 356,958,100 (69,243,979) 354,715,896 (65,393,098) The accompanying notes are an integral part of the consolidated financial statements.

57
NOTES TO CONSOLIDATED FINANCIAL STATEMENTS 1. NATURE OF BUSINESS Ecolab is the global leader in water, hygiene and energy technologies and services that protect people and vital resources. The Company delivers comprehensive solutions and on-site service to promote safe food, maintain clean environments, optimize water and energy use and improve operational efficiencies for customers in the food, healthcare, energy, hospitality and industrial markets in more than 170 countries. The Company’s cleaning and sanitizing programs and products and pest elimination services support customers in the foodservice, food and beverage processing, hospitality, healthcare, government and education, retail, textile care and commercial facilities management sectors. The Company’s products and technologies are also used in water treatment, pollution control, energy conservation, oil production and refining, steelmaking, papermaking, mining and other industrial processes. ChampionX Separation On December 18, 2019, the Company entered into definitive agreements with ChampionX Holding Inc., a wholly owned subsidiary of the Company (ChampionX), and Apergy Corporation (Apergy) pursuant to which the Company will separate the Upstream Energy business of its Global Energy segment and combine it with Apergy in a tax-efficient reverse Morris Trust transaction. Subject to the terms and conditions of those agreements, the Company will transfer the Upstream Energy business of its Global Energy segment to ChampionX, after which, the Company will distribute by means of a split-off all of the issued and outstanding shares of common stock of ChampionX held by the Company, and immediately after the distribution of ChampionX common stock, a wholly owned subsidiary of Apergy, will merge with and into ChampionX, with ChampionX surviving as a wholly owned subsidiary of Apergy and the shares of ChampionX common stock being converted into shares of Apergy common stock. Upon completion of the merger, ChampionX’s stockholders will receive approximately 62% of the outstanding common stock of Apergy on a fully diluted basis. Completion of the transaction is subject to the satisfaction or waiver of customary closing conditions, including approval by Apergy’s stockholders, approval by certain foreign regulatory authorities and receipt of opinions with respect to the tax-free nature of the transaction. 2. SIGNIFICANT ACCOUNTING POLICIES Principles of Consolidation The consolidated financial statements include the accounts of the Company and all subsidiaries in which the Company has a controlling financial interest. Investments in companies, joint ventures or partnerships in which the Company does not have control but has the ability to exercise significant influence over operating and financial decisions, are reported using the equity method of accounting. The cost method of accounting is used in circumstances where the Company does not significantly influence the investee, and the investment has no readily determinable fair value. International subsidiaries are included in the financial statements on the basis of their U.S. GAAP November 30 fiscal year-ends to facilitate the timely inclusion of such entities in the Company’s consolidated financial reporting. All intercompany transactions and profits are eliminated in consolidation. Use of Estimates The preparation of the Company’s financial statements requires management to make certain estimates and assumptions that affect the reported amounts of assets and liabilities as of the date of the financial statements and the reported amounts of revenues and expenses during the reporting periods. Actual results could differ from these estimates. The Company’s critical accounting estimates include revenue recognition, valuation allowances and accrued liabilities, actuarially determined liabilities, restructuring, income taxes, long-lived assets, intangible assets and goodwill. Foreign Currency Translation Financial position and reported results of operations of the Company’s non-U.S. dollar functional currency international subsidiaries are measured using local currencies as the functional currency. Assets and liabilities of these operations are translated at the exchange rates in effect at each fiscal year end. The translation adjustments related to assets and liabilities that arise from changes in exchange rates from period to period are included in accumulated other comprehensive loss in shareholders’ equity. Income statement accounts are translated at average rates of exchange prevailing during the year. As discussed in Note 18 Operating Segments and Geographic Information, the Company evaluates its international operations based on fixed rates of exchange; however, changes in exchange rates from period to period impact the amount of reported income from consolidated operations.

58
Concentration of Credit Risk Credit risk represents the accounting loss that would be recognized at the reporting date if counterparties failed to perform as contracted. The Company believes the likelihood of incurring material losses due to concentration of credit risk is minimal. The principal financial instruments subject to credit risk are as follows: Cash and Cash Equivalents - The Company maintains cash deposits with major banks, which from time to time may exceed insured limits. The possibility of loss related to financial condition of major banks has been deemed minimal. Additionally, the Company’s investment policy limits exposure to concentrations of credit risk and changes in market conditions. Accounts Receivable - A large number of customers in diverse industries and geographies, as well as the practice of establishing reasonable credit lines, limits credit risk. Based on historical trends and experiences, the allowance for doubtful accounts is adequate to cover potential credit risk losses. Foreign Currency and Interest Rate Contracts and Derivatives - Exposure to credit risk is limited by internal policies and active monitoring of counterparty risks. In addition, the Company uses a diversified group of major international banks and financial institutions as counterparties. The Company does not anticipate nonperformance by any of these counterparties. Cash and Cash Equivalents Cash equivalents include highly-liquid investments with a maturity of three months or less when purchased. Restricted Cash Cash and cash equivalents that are restricted as to withdrawal or use under the terms of certain contractual agreements are recorded in Other assets on the Consolidated Balance Sheet and primarily relate to acquisition activities. Accounts Receivable and Allowance for Doubtful Accounts Accounts receivable are carried at the invoiced amounts, less an allowance for doubtful accounts, and generally do not bear interest. The Company estimates the balance of allowance for doubtful accounts by analyzing accounts receivable balances by age and applying historical write-off and collection trend rates. The Company’s estimates separately considered specific circumstances and credit conditions of customer receivables, and whether it is probable balances will be collected. Account balances are written off against the allowance when it is determined the receivable will not be recovered. The Company’s allowance for doubtful accounts balance also includes an allowance for the expected return of products shipped and credits related to pricing or quantities shipped of $18 million, $17 million and $15 million as of December 31, 2019, 2018, and 2017, respectively. Returns and credit activity is recorded directly as a reduction to revenue. The following table summarizes the activity in the allowance for doubtful accounts:
(millions) 2019 2018 2017 Beginning balance $60.6 $71.5 $67.6
Bad debt expense 21.7 15.7 17.1 Write-offs (19.1) (23.6) (15.7) Other (a) (1.2) (3.0) 2.5
Ending balance $62.0 $60.6 $71.5 (a) Other amounts are primarily the effects of changes in currency translations and the impact of allowance for returns and credits. Inventory Valuations Inventories are valued at the lower of cost or net realizable value. Certain U.S. inventory costs are determined on a last-in, first-out (“LIFO”) basis. LIFO inventories represented 37% of consolidated inventories as of December 31, 2019 and 2018. All other inventory costs are determined using either the average cost or first-in, first-out (“FIFO”) methods. Inventory values at FIFO, as shown in Note 5, approximate replacement cost.

59
Property, Plant and Equipment Property, plant and equipment assets are stated at cost. Merchandising and customer equipment consists principally of various dispensing systems for the Company’s cleaning and sanitizing products, warewashing machines and process control and monitoring equipment. Certain dispensing systems capitalized by the Company are accounted for on a mass asset basis, whereby equipment is capitalized and depreciated as a group and written off when fully depreciated. The Company capitalizes both internal and external costs to develop or purchase computer software. Costs incurred for data conversion, training and maintenance associated with capitalized software are expensed as incurred. Expenditures for major renewals and improvements, which significantly extend the useful lives of existing plant and equipment, are capitalized and depreciated. Expenditures for repairs and maintenance are charged to expense as incurred. Upon retirement or disposition of plant and equipment, the cost and related accumulated depreciation are removed from the accounts and any resulting gain or loss is recognized in income. Depreciation is charged to operations using the straight-line method over the assets’ estimated useful lives ranging from 5 to 40 years for buildings and leasehold improvements, 3 to 20 years for machinery and equipment, 3 to 20 years for merchandising and customer equipment and 3 to 7 years for capitalized software. The straight-line method of depreciation reflects an appropriate allocation of the cost of the assets to earnings in proportion to the amount of economic benefits obtained by the Company in each reporting period. Depreciation expense was $654 million, $621 million and $586 million for 2019, 2018 and 2017, respectively. During 2019 and 2018, the Company impaired certain assets as part of a restructuring program. During 2017, the Company impaired certain assets related to a portion of one of its businesses. See Note 3 for additional information regarding these asset impairments. Goodwill and Other Intangible Assets Goodwill Goodwill represents the excess of the purchase price over the fair value of identifiable net assets acquired in a business combination. The Company’s reporting units are its operating segments. During the second quarter of 2019, the Company completed its annual assessment for goodwill impairment across its eleven reporting units through a two-step quantitative analysis, utilizing a discounted cash flow approach, which incorporates assumptions regarding future growth rates, terminal values, and discount rates. The first step involves estimating the fair value of each reporting unit and comparing them to the respective carrying values, including goodwill. If the fair value of a reporting unit exceeds its carrying value, goodwill of the reporting unit is considered not to be impaired, and the second step of the impairment test is unnecessary. If the carrying amount of the reporting unit exceeds its fair value, the second step of the goodwill impairment test would be performed to measure the amount of impairment loss to be recorded, if any. The Company’s goodwill impairment assessment for 2019 indicated the estimated fair value of each of its reporting units exceeded its carrying amount by a significant margin. Additionally, no events occurred during the second half of 2019 that indicated a need to update the Company’s conclusions reached during the second quarter of 2019. If significant events or circumstances are identified that indicate it is more likely than not that the fair value of a reporting unit is less than its carrying value, the Company will test a reporting unit’s goodwill for impairment during interim periods between its annual tests. There has been no impairment of goodwill in any of the years presented. The changes in the carrying amount of goodwill for each of the Company’s reportable segments are as follows:
Global Global Global (millions) Industrial Institutional Energy Other Total December 31, 2017 $2,725.3 $1,027.0 $3,203.7 $211.1 $7,167.1
Current year business combinations (a) 71.6 12.4 - - 84.0 Prior year business combinations (b) (1.2) - - (0.9) (2.1) Dispositions (0.5) - (2.9) - (3.4) Effect of foreign currency translation (64.4) (24.1) (74.2) (4.9) (167.6)
December 31, 2018 $2,730.8 $1,015.3 $3,126.6 $205.3 $7,078.0 Current year business combinations (a) 92.2 142.1 - 0.7 235.0 Prior year business combinations (b) (0.2) - - - (0.2) Effect of foreign currency translation (23.6) (9.7) (26.1) (1.7) (61.1)
December 31, 2019 $2,799.2 $1,147.7 $3,100.5 $204.3 $7,251.7 (a) For 2019, $49.4 million of the goodwill related to businesses acquired is expected to be tax deductible. For 2018, the Company does
not expect any of the goodwill related to businesses acquired to be tax deductible. (b) Represents purchase price allocation adjustments for acquisitions deemed preliminary as of the end of the prior year.

60
Other Intangible Assets The Nalco trade name is the Company’s principal indefinite life intangible asset. During the second quarter of 2019, the Company completed its annual indefinite life intangible asset impairment assessment using a relief from royalty method approach, which incorporates assumptions regarding future sales projections, royalty rates and discount rates. Based on this testing, the estimated fair value of the asset exceeded its carrying value by a significant margin, therefore, no adjustment to the $1.2 billion carrying value of this asset was necessary. Additionally, no events during the second half of 2019 indicated a need to update the Company’s conclusions reached during the second quarter of 2019. There has been no impairment of the Nalco trade name intangible asset since it was acquired. The Company’s intangible assets subject to amortization primarily include customer relationships, trademarks, patents and other technology recognized at fair value from the Company’s business combinations. The fair value of identifiable intangible assets is estimated at acquisition using discounted cash flow approaches or other acceptable valuation methods. Other intangible assets are amortized on a straight-line basis over their estimated economic lives. The weighted-average useful life of amortizable intangible assets was 14 years as of both December 31, 2019 and 2018. The weighted-average useful life by type of amortizable asset at December 31, 2019 is as follows: (years)
Customer relationships 14 Trademarks 13 Patents 14 Other technology 5 The straight-line method of amortization reflects an appropriate allocation of the cost of the intangible assets to earnings in proportion to the amount of economic benefits obtained by the Company in each reporting period. The Company evaluates the remaining useful life of its intangible assets that are being amortized each reporting period to determine whether events and circumstances warrant a change to the estimated remaining period of amortization. If the estimate of an intangible asset’s remaining useful life is changed, the remaining carrying amount of the intangible asset will be amortized prospectively over the revised remaining useful life. Total amortization expense related to other intangible assets during the last three years and future estimated amortization is as follows:
(millions) 2017 $ 308 2018 317 2019 319 2020 320 2021 316 2022 309 2023 302 2024 289 Long-Lived Assets The Company reviews its long-lived and amortizable intangible assets for impairment when significant events or changes in business circumstances indicate that the carrying value of the assets may not be recoverable. Such circumstances may include a significant decrease in the market price of an asset, a significant adverse change in the manner in which the asset is being used or in its physical condition or history of operating or cash flow losses associated with the use of an asset. An impairment loss may be recognized when the carrying amount of an asset exceeds the anticipated future undiscounted cash flows expected to result from the use of the asset and its eventual disposition. The amount of the impairment loss to be recorded, if any, is calculated by the excess of the asset’s carrying value over its fair value. In addition, the Company periodically reassesses the estimated remaining useful lives of its long-lived assets. Changes to estimated useful lives would impact the amount of depreciation and amortization recorded in earnings. The Company has not experienced significant changes in the carrying value or estimated remaining useful lives of its long-lived or amortizable intangible assets.

61
Rental and Leases Lessee The Company determines whether a lease exists at the inception of the arrangement. In assessing whether a contract is or contains a lease, the Company considers a lease a contract that conveys the right to control the use of an identified asset for a period of time in exchange for consideration. The Company accounts for lease components separately from the nonlease components (e.g., common-area maintenance costs). Operating leases are recorded in operating lease assets, other current liabilities and operating lease liabilities in the Consolidated Balance Sheet. Operating lease assets and operating lease liabilities are measured and recognized based on the present value of the future minimum lease payments over the lease term at commencement date. The Company uses the rate implicit in the lease when available or determinable. When the rate implicit in the lease is not determinable, the Company uses its incremental borrowing rate based on the information available at commencement date to determine the present value of future payments. Lease expense for minimum lease payments is recognized on a straight-line basis over the lease term. Variable lease payments are not included in the lease liability and are recognized as incurred. The Company identified real estate, vehicles and other equipment as the primary classes of leases. Certain leases with a similar class of underlying assets are accounted for as a portfolio of leases. The Company does not record operating lease assets or liabilities for leases with terms of twelve months or less. Those lease payments will continue to be recognized in the Consolidated Statement of Income on a straight-line basis over the lease term. Most leases include one or more options to renew, which is at the Company’s sole discretion, with renewal terms that can extend the lease term from one month to multiple years. The lease start date is when the asset is available for use and in possession of the Company. The lease end date, which includes any options to renew that are reasonably certain to be exercised, is based on the terms of the contract. The depreciable life of assets and leasehold improvements are limited by the expected lease term, unless there is a transfer of title or purchase option reasonably certain of exercise. The Company’s lease agreements do not contain any material restrictive covenants. Lessor The Company accounts for lease and nonlease components separately. The nonlease components, such as product and service revenue, are accounted for under Topic 606 Revenue from Contracts with Customers, refer to Note 17 for more information. Revenue from leasing equipment is recognized on a straight-line basis over the life of the lease. Cost of sales includes the depreciation expense for assets under operating leases. The assets are depreciated over their estimated useful lives. Initial lease terms range from one year to five years and most leases include renewal options. Lease contracts convey the right for the customer to control the equipment for a period of time as defined by the contract. There are no options for the customer to purchase the equipment and therefore the equipment remains the property of the Company at the end of the lease term. See Note 13 for additional information regarding rental and leases. Income Taxes Income taxes are recognized during the period in which transactions enter into the determination of financial statement income, with deferred income taxes provided for the tax effect of temporary differences between the carrying amount of assets and liabilities and their tax bases. The Company records a valuation allowance to reduce its deferred tax assets when uncertainty regarding their realizability exists. The Company records liabilities for income tax uncertainties in accordance with the U.S. GAAP recognition and measurement criteria guidance. On December 22, 2017, the Tax Cuts and Jobs Act (the “Act”) was enacted, which reduced the U.S. federal corporate tax rate from 35% to 21%, requires companies to pay a one-time transition tax on earnings of certain foreign subsidiaries that were previously tax deferred and creates new taxes on certain foreign sourced earnings. The Tax Act added many new provisions including changes to bonus depreciation, the deduction for executive compensation and interest expense, a tax on global intangible low taxed income (GILTI), the base erosion anti abuse tax (BEAT) and a deduction for foreign derived intangible income (FDII). The Company has elected the period cost method and considers the estimated GILTI impact in tax expense beginning in 2018. See Note 12 for additional information regarding income taxes.

62
Share-Based Compensation The Company measures compensation expense for share-based awards at fair value at the date of grant and recognizes compensation expense over the service period for awards expected to vest. The majority of grants to retirement eligible recipients (age 55 with required years of service) are recorded to expense using the non-substantive vesting method and are fully expensed over a six-month period following the date of grant. In addition, the Company includes a forfeiture estimate in the amount of compensation expense being recognized based on an estimate of the number of outstanding awards expected to vest. All excess tax benefits or deficiencies are recognized as discrete income tax items on the Consolidated Statement of Income. The Company recorded $43.1 million, $28.1 million and $39.7 million of excess tax benefits during 2019, 2018 and 2017, respectively. The extent of excess tax benefits is subject to variation in stock price and stock option exercises. See Note 11 for additional information regarding equity compensation plans. Restructuring Activities The Company’s restructuring activities are associated with plans to enhance its efficiency, effectiveness and sharpen its competitiveness. These restructuring plans include net costs associated with significant actions involving employee-related severance charges, contract termination costs and asset write-downs and disposals. Employee termination costs are largely based on policies and severance plans, and include personnel reductions and related costs for severance, benefits and outplacement services. These charges are reflected in the quarter in which the actions are probable and the amounts are estimable, which typically is when management approves the associated actions. Contract termination costs include charges to terminate leases prior to the end of their respective terms and other contract termination costs. Asset write-downs and disposals include leasehold improvement write-downs, other asset write-downs associated with combining operations and disposal of assets. See Note 3 for additional information regarding restructuring activities. Revenue Recognition Revenue is measured as the amount of consideration expected to be received in exchange for transferring goods or providing service. Product and Sold Equipment Revenue from product and sold equipment is recognized when obligations under the terms of a contract with the customer are satisfied, which generally occurs with the transfer of the product or delivery of the equipment. Service and Lease Equipment Revenue from service and leased equipment is recognized when the services are provided, or the customer receives the benefit from the leased equipment, which is over time. Service revenue is recognized over time utilizing an input method and aligns with when the services are provided. Typically, revenue is recognized using costs incurred to date because the effort provided by the field selling and service organization represents services provided, which corresponds with the transfer of control. Revenue for leased equipment is accounted for under Topic 842 Leases and recognized on a straight-line basis over the length of the lease contract. Other Considerations Contracts with customers may include multiple performance obligations. For contracts with multiple performance obligations, the consideration is allocated between products and services based on their stand-alone selling prices. Stand-alone selling prices are generally based on the prices charged to customers or using an expected cost plus margin. Judgment is used in determining the amount of service that is embedded within the contracts, which is based on the amount of time spent on the performance obligation activities. The level of effort, including the estimated margin that would be charged, is used to determine the amount of service revenue. Depending on the terms of the contract, the Company may defer the recognition of revenue when a future performance obligation has not yet occurred. Taxes assessed by a governmental authority that are both imposed on and concurrent with a specific revenue-producing transaction, which are collected by the Company from a customer, are excluded from revenue. Shipping and handling costs associated with outbound freight are recognized in cost of sales when control over the product has transferred to the customer. Other estimates used in recognizing revenue include allocating variable consideration to customer programs and incentive offerings, including pricing arrangements, promotions and other volume-based incentives at the time the sale is recorded. These estimates are based primarily on historical experience and anticipated performance over the contract period. Based on the certainty in estimating these amounts, they are included in the transaction price of the contracts and the associated remaining performance obligations. The Company recognizes revenue when collection of the consideration expected to be received in exchange for transferring goods or providing services is probable. The Company’s revenue policies do not provide for general rights of return. Estimates used in recognizing revenue include the delay between the time that products are shipped and when they are received by customers, when title transfers and the amount of credit memos issued in subsequent periods. Depending on market conditions, the Company may increase customer incentive offerings, which could reduce gross profit margins over the term of the incentive.

63
Earnings Per Common Share The difference in the weighted average common shares outstanding for calculating basic and diluted earnings attributable to Ecolab per common share is a result of the dilution associated with the Company’s equity compensation plans. As noted in the table below, certain stock options and units outstanding under these equity compensation plans were not included in the computation of diluted earnings attributable to Ecolab per common share because they would not have had a dilutive effect. The computations of the basic and diluted earnings attributable to Ecolab per share amounts were as follows:
(millions, except per share) 2019 2018 2017
Net income attributable to Ecolab $1,558.9 $1,429.1 $1,504.6 Weighted-average common shares outstanding
Basic 288.1 288.6 289.6 Effect of dilutive stock options and units 4.4 4.2 4.4 Diluted 292.5 292.8 294.0 Basic EPS $ 5.41 $ 4.95 $ 5.20 Diluted EPS $ 5.33 $ 4.88 $ 5.12
Anti-dilutive securities excluded from the computation of diluted EPS 1.1 2.9 3.4 Amounts do not necessarily sum due to rounding. Other Significant Accounting Policies The following table includes a reference to additional significant accounting policies that are described in other notes to the financial statements, including the note number:
Policy Note Fair value measurements 7 Derivatives and hedging transactions 8 Share-based compensation 11 Research and development expenditures 14 Legal contingencies 15 Pension and post-retirement benefit plans 16 Reportable segments 18

64
New Accounting Pronouncements
Standards that are not yet adopted: Required Date of Date of Effect on the
Standard Issuance Description Adoption Financial Statements
ASU 2019-12 - Income Taxes (Topic 740): Simplifying the Accounting for Income Taxes
December 2019
Simplifies the accounting for income taxes by removing certain exceptions to the general principles in Topic 740 Income Taxes related to the approach for intraperiod tax allocation, the methodology for calculating income taxes in an interim period and recognition of deferred tax liabilities for outside basis difference. The new standard also simplifies the accounting for franchise taxes and enacted changes in tax laws or rates and clarifies the accounting for transactions that result in a step-up in the basis of goodwill.
January 1, 2021
The Company is currently evaluating the impact of adoption.
ASU 2018-15 - Intangibles - Goodwill and Other - Internal-Use Software (Subtopic 350-40): Customer’s Accounting for Implementation Costs Incurred in a Cloud Computing Arrangement That Is a Service Contract (a consensus of the FASB Emerging Issues Task Force)
August 2018
Aligns the requirements for capitalizing implementation costs incurred in a hosting arrangement that is a service contract with the requirements for capitalizing implementation costs incurred to develop or obtain internal-use software (and hosting arrangements that include an internal-use software license). The amendments require an entity (customer) in a hosting arrangement that is a service contract to determine which implementation costs to capitalize as an asset related to the service contract and which costs to expense.
January 1, 2020
The Company is anticipating adopting the ASU prospectively. Adoption of the ASU is not expected to have a material impact on the Company's financial statements.
ASU 2018-14 - Compensation - Retirement Benefits - Defined Benefit Plans - General (Subtopic 715-20): Disclosure Framework - Changes to the Disclosure Requirements for Defined Benefit Plans
August 2018
Modifies disclosure requirements for employers that sponsor defined benefit pension or other postretirement plans. This includes, but is not limited to, the removal of the requirement to disclose the amounts in accumulated other comprehensive income expected to be recognized as components of net periodic benefit cost over the next fiscal year, and the addition of a requirement to disclose the weighted-average interest crediting rates for cash balance plans and other plans with promised interest crediting rates.
January 1, 2020
The new disclosure requirements are applied on a retrospective basis to all periods presented. Adoption of the ASU is not expected to have a material impact on the Company's financial statements.
ASU 2017-04 - Intangibles - Goodwill and Other (Topic 350): Simplifying the Test for Goodwill Impairment
January 2017
Simplifies subsequent measurement of goodwill by eliminating Step 2 from the goodwill impairment test. Step 2 measures a goodwill impairment loss by comparing the implied fair value of a reporting unit’s goodwill with the carrying amount of that goodwill.
January 1, 2020
The ASU must be applied on a prospective basis upon adoption. As described in Note 2 the Company has passed Step 1 of its annual impairment assessment, accordingly, adoption of the ASU is not expected to have a material impact on the Company's financial statements when completing future impairment analyses.
Credit Losses ASUs: ASU 2019-11 - Codification Improvements to Topic 326, Financial Instruments - Credit Losses ASU 2019-05 - Financial Instruments - Credit Losses (Topic 326): Targeted Transition Relief ASU 2018-19 - Codification Improvements to Topic 326, Financial Instruments - Credit Losses ASU 2016-13 - Financial Instruments - Credit Losses (Topic 326): Measurement of Credit Losses on Financial Instruments
Various Addresses the recognition, measurement, presentation and disclosure of credit losses on trade and reinsurance receivables, loans, debt securities, net investments in leases, off-balance-sheet credit exposures and certain other instruments. Amends guidance on reporting credit losses from an incurred model to an expected model for assets held at amortized cost, such as accounts receivable, loans and held-to-maturity debt securities. Additional disclosures will also be required.
January 1, 2020 The Company has identified the financial assets to primarily include trade and notes receivable. The Company is updating current accounting policies to be in accordance with the new standard, and the impact of adoption is not expected to be material to the Company's financial statements.

65
Standards that were adopted: Date of Date of Effect on the
Standard Issuance Description Adoption Financial Statements ASU 2018-02 - Income Statement - Reporting Comprehensive Income (Topic 220): Reclassification of Certain Tax Effects from Accumulated Other Comprehensive Income
February 2018
Allows entities to reclassify stranded tax effects resulting from the Tax Cut and Jobs Act (“the Act”) from accumulated other comprehensive income to retained earnings. Tax effects stranded in other comprehensive income for reasons other than the impact of the Act cannot be reclassified.
January 1, 2019
In order to improve the usefulness and transparency, the Company made the election to reclassify $61.2 million of income tax effects of the Tax Cuts and Jobs Act from accumulated other comprehensive income to retained earnings related to pension and derivatives.
ASU 2018-16 - Derivatives and Hedging (Topic 815): Inclusion of the Secured Overnight Financing Rate (SOFR) Overnight Index Swap (OIS) Rate as a Benchmark Interest Rate for Hedge Accounting Purposes ASU 2017-12 - Derivatives and Hedging (Topic 815): Targeted Improvements to Accounting for Hedging Activities
Various Amends the hedge accounting recognition and presentation requirements. Simplifies the application of hedge accounting and the requirements for hedge documentation and effectiveness testing. Requires presentation of all items that affect earnings in the same income statement line as the hedged item. Expands the benchmark interest rates that can be used for hedge accounting.
January 1, 2019
Adoption of this guidance did not have a material impact on the results of operations, financial position or cash flows. Required disclosures under the new guidance are included in Note 8.
Lease ASUs: ASU 2019-01 - Leases (Topic 842): Codification Improvements ASU 2018-20 - Leases (Topic 842): Narrow-Scope Improvements for Lessors ASU 2018-11 - Leases (Topic 842) Targeted Improvements ASU 2018-10 - Codification Improvements to Topic 842, Leases ASU 2018-01 - Leases (Topic 842): Land Easement Practical Expedient ASU 2016-02 - Leases (Topic 842)
Various Introduces the recognition of lease assets and lease liabilities by lessees for those leases classified as operating leases under previous guidance.
January 1, 2019
See additional information regarding the impact of this guidance on the Company's financial statements at the bottom of this table in note (a).
No other new accounting pronouncement issued or effective has had or is expected to have a material impact on the Company’s consolidated financial statements. (a) Leases
On January 1, 2019, the Company adopted Topic 842 Leases (“the new lease standard”) prospectively and recorded a cumulative effect adjustment to the opening balance of retained earnings of $2.8 million. The Company elected the package of practical expedients permitted under the transition guidance within the new lease standard, which allows the Company to carryforward the historical lease classification, to not reassess whether existing contracts are or contain a lease and not to reassess initial direct costs. The Company also elected the land easement practical expedient. In addition, the Company elected the hindsight practical expedient to determine the lease term for existing leases. When applying the hindsight expedient, the Company determined that it was not reasonably certain that most renewal options would be exercised and therefore the Company did not include the renewal period in our determination of the expected lease term. The Company made an accounting policy election to not apply the recognition requirements of the new standard to leases with terms of twelve months or less and which do not include an option to purchase the underlying assets which is reasonably certain of exercise. Adoption of the new standard resulted in the recording of additional net operating lease assets and operating lease liabilities of $572.2 million and $575.0 million, respectively, as of January 1, 2019. The difference between the operating lease assets and operating lease liabilities was recorded as an adjustment to retained earnings. There was no impact to consolidated net earnings or cash flows. Further information related to the Company’s adoption of the new lease standard is included in Note 13.

66
3. SPECIAL (GAINS) AND CHARGES Special (gains) and charges reported on the Consolidated Statement of Income included the following:
(millions) 2019 2018 2017 Cost of sales
Restructuring activities $20.4 $12.1 $4.6 Acquisition and integration activities 7.6 (0.6) 13.2 Other 10.5 (2.2) 26.2
Cost of sales subtotal 38.5 9.3 44.0
Special (gains) and charges Restructuring activities 116.8 89.4 39.9 ChampionX separation 77.3 - - Acquisition and integration activities 5.6 8.8 15.4 Gain on sale of business - - (46.1) Venezuela related gain - - (11.5) Other 11.9 28.5 (1.4)
Special (gains) and charges subtotal 211.6 126.7 (3.7)
Operating income subtotal 250.1 136.0 40.3
Interest expense, net 0.2 0.3 21.9 Other (income) expense 9.5 - - Total special (gains) and charges $259.8 $136.3 $62.2 For segment reporting purposes, special (gains) and charges are not allocated to reportable segments, which is consistent with the Company’s internal management reporting. Restructuring Activities Restructuring activities in 2019 and 2018 are primarily related to Accelerate 2020 (described below). Restructuring activities have been included as a component of both cost of sales and special (gains) and charges on the Consolidated Statement of Income. Restructuring liabilities have been classified as a component of other current and other noncurrent liabilities on the Consolidated Balance Sheet. Accelerate 2020 During the third quarter of 2018, the Company formally commenced a restructuring plan Accelerate 2020 (“the Plan”), to leverage technology and systems investments and organizational changes. During the first quarter of 2019, the Company raised its goals for the Plan to simplify and automate processes and tasks, reduce complexity and management layers, consolidate facilities and focus on key long-term growth areas by leveraging technology and structural improvements. The Company expects that the restructuring activities will be completed by the end of 2020, with anticipated costs of $260 million ($200 million after tax) over this period of time. Costs are expected to be primarily cash expenditures for severance costs and some facility closure costs relating to team reorganizations. Actual costs may vary from these estimates depending on actions taken. The Company recorded restructuring charges of $136.6 million ($104.4 million after tax) and $104.6 million ($79.6 million after tax) in 2019 and 2018, respectively, primarily related to severance. Of these expenses, $2.0 million ($1.5 million after tax) is recorded in other income expense and related to pension settlements and curtailments. The liability related to this Restructuring Plan was $104.0 million and $63.9 million as of December 31, 2019 and 2018, respectively. The Company has recorded $241.2 million ($184.0 million after tax) of cumulative restructuring charges under the Plan.
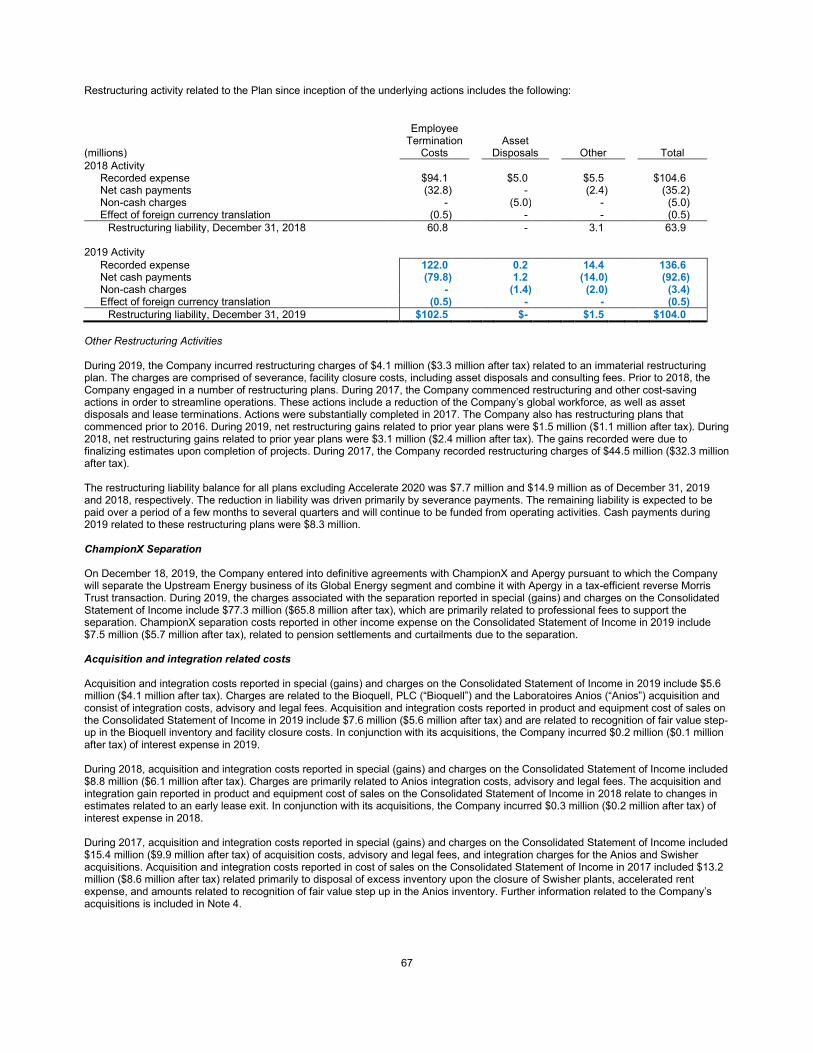
67
Restructuring activity related to the Plan since inception of the underlying actions includes the following:
Employee Termination Asset (millions) Costs Disposals Other Total 2018 Activity
Recorded expense $94.1 $5.0 $5.5 $104.6 Net cash payments (32.8) - (2.4) (35.2) Non-cash charges - (5.0) - (5.0) Effect of foreign currency translation (0.5) - - (0.5)
Restructuring liability, December 31, 2018 60.8 - 3.1 63.9
2019 Activity Recorded expense 122.0 0.2 14.4 136.6 Net cash payments (79.8) 1.2 (14.0) (92.6) Non-cash charges - (1.4) (2.0) (3.4) Effect of foreign currency translation (0.5) - - (0.5)
Restructuring liability, December 31, 2019 $102.5 $- $1.5 $104.0 Other Restructuring Activities During 2019, the Company incurred restructuring charges of $4.1 million ($3.3 million after tax) related to an immaterial restructuring plan. The charges are comprised of severance, facility closure costs, including asset disposals and consulting fees. Prior to 2018, the Company engaged in a number of restructuring plans. During 2017, the Company commenced restructuring and other cost-saving actions in order to streamline operations. These actions include a reduction of the Company’s global workforce, as well as asset disposals and lease terminations. Actions were substantially completed in 2017. The Company also has restructuring plans that commenced prior to 2016. During 2019, net restructuring gains related to prior year plans were $1.5 million ($1.1 million after tax). During 2018, net restructuring gains related to prior year plans were $3.1 million ($2.4 million after tax). The gains recorded were due to finalizing estimates upon completion of projects. During 2017, the Company recorded restructuring charges of $44.5 million ($32.3 million after tax). The restructuring liability balance for all plans excluding Accelerate 2020 was $7.7 million and $14.9 million as of December 31, 2019 and 2018, respectively. The reduction in liability was driven primarily by severance payments. The remaining liability is expected to be paid over a period of a few months to several quarters and will continue to be funded from operating activities. Cash payments during 2019 related to these restructuring plans were $8.3 million. ChampionX Separation On December 18, 2019, the Company entered into definitive agreements with ChampionX and Apergy pursuant to which the Company will separate the Upstream Energy business of its Global Energy segment and combine it with Apergy in a tax-efficient reverse Morris Trust transaction. During 2019, the charges associated with the separation reported in special (gains) and charges on the Consolidated Statement of Income include $77.3 million ($65.8 million after tax), which are primarily related to professional fees to support the separation. ChampionX separation costs reported in other income expense on the Consolidated Statement of Income in 2019 include $7.5 million ($5.7 million after tax), related to pension settlements and curtailments due to the separation. Acquisition and integration related costs Acquisition and integration costs reported in special (gains) and charges on the Consolidated Statement of Income in 2019 include $5.6 million ($4.1 million after tax). Charges are related to the Bioquell, PLC (“Bioquell”) and the Laboratoires Anios (“Anios”) acquisition and consist of integration costs, advisory and legal fees. Acquisition and integration costs reported in product and equipment cost of sales on the Consolidated Statement of Income in 2019 include $7.6 million ($5.6 million after tax) and are related to recognition of fair value step-up in the Bioquell inventory and facility closure costs. In conjunction with its acquisitions, the Company incurred $0.2 million ($0.1 million after tax) of interest expense in 2019. During 2018, acquisition and integration costs reported in special (gains) and charges on the Consolidated Statement of Income included $8.8 million ($6.1 million after tax). Charges are primarily related to Anios integration costs, advisory and legal fees. The acquisition and integration gain reported in product and equipment cost of sales on the Consolidated Statement of Income in 2018 relate to changes in estimates related to an early lease exit. In conjunction with its acquisitions, the Company incurred $0.3 million ($0.2 million after tax) of interest expense in 2018. During 2017, acquisition and integration costs reported in special (gains) and charges on the Consolidated Statement of Income included $15.4 million ($9.9 million after tax) of acquisition costs, advisory and legal fees, and integration charges for the Anios and Swisher acquisitions. Acquisition and integration costs reported in cost of sales on the Consolidated Statement of Income in 2017 included $13.2 million ($8.6 million after tax) related primarily to disposal of excess inventory upon the closure of Swisher plants, accelerated rent expense, and amounts related to recognition of fair value step up in the Anios inventory. Further information related to the Company’s acquisitions is included in Note 4.

68
Gain on sale of business During 2017, the Company disposed of the Equipment Care business and recorded a gain of $46.1 million ($12.4 million after tax primarily due to non-deductible goodwill) net of working capital adjustments, costs to sell and other transaction expenses. The gain has been included as a component of special (gains) and charges on the Consolidated Statement of Income. Venezuela related activities Effective as of the end of the fourth quarter of 2015, the Company deconsolidated its Venezuelan subsidiaries. The Company recorded gains due to U.S. dollar cash recoveries of intercompany receivables written off at the time of deconsolidation of $11.5 million ($7.2 million after tax) in 2017. No such gains occurred in 2019 or 2018. Other During 2019, the Company recorded other special charges of $11.9 million ($7.5 million after tax) which primarily related to legal charges partially offset by a litigation settlement. Other special charges reported in product and equipment cost of sales on the Consolidated Statement of Income in 2019 of $10.5 million ($7.1 million after tax) relate to a Healthcare product recall in Europe. During 2018, the Company recorded other special charges of $28.5 million ($21.5 million after tax) which primarily consisted of a $25.0 million ($18.9 million after tax) commitment to the Ecolab Foundation. Other charges, primarily litigation related charges, were minimal and have been included as a component of special (gains) and charges on the Consolidated Statement of Income. Other special gains reported in product and equipment cost of sales on the Consolidated Statement of Income in 2018 of $2.2 million ($1.7 million after tax) relate to changes in estimates for an inventory LIFO reserve. During 2017, the Company recorded other charges of $24.8 million ($19.0 million after tax), primarily related to fixed asset impairments, a Global Energy vendor contract termination and litigation related charges. These charges have been included as a component of both cost of sales and special (gains) and charges on the Consolidated Statement of Income. Other (Income) Expense During 2019, the Company recorded other expense of $9.5 million ($7.2 million after tax) related to pension curtailments and settlements due to the ChampionX separation and Accelerate 2020, respectively, as discussed further above. These charges have been included as a component of other income expense on the Consolidated Statement of Income. Interest Expense, net During 2019 and 2018, an immaterial amount of interest expense was recorded due to acquisition and integration costs. During 2017, in anticipation of U.S. tax reform and a potential limit on interest deductibility in future years, the Company entered into transactions to exchange or retire certain long-term debt, and incurred debt exchange and extinguishment charges of $21.9 million ($13.6 million after tax). This charge has been included as a component of interest expense, net on the Consolidated Statement of Income. 4. ACQUISITIONS AND DISPOSITIONS Acquisitions The Company makes business acquisitions that align with its strategic business objectives. The assets and liabilities of the acquired businesses have been recorded as of the acquisition date, at their respective fair values, and are included in the Consolidated Balance Sheet. The purchase price allocation is based on estimates of the fair value of assets acquired and liabilities assumed. The aggregate purchase price of acquisitions has been reduced for any cash or cash equivalents acquired with the acquisition. Acquisitions during 2019, 2018 and 2017 were not significant to the Company’s consolidated financial statements; therefore, pro forma financial information is not presented. 2019 Activity During 2019, the Company acquired Bioquell, a life sciences business which sells bio-decontamination products and services to the Life Sciences and Healthcare industries. This business became part of the Global Industrial reportable segment. During 2018, the Company deposited $179.3 million (£140.5 million) in an escrow account that was released upon closing of the transaction in February 2019. As shown within Note 5, this was recorded as restricted cash within other assets on the Consolidated Balance Sheet as of December 31, 2018. The Company also acquired Lobster Ink, a leading provider of end-to-end online customer training solutions. This acquired business became part of the Global Institutional reportable segment. The purchase price included an earn-out based on certain revenue thresholds in any of the full three years following the acquisition. The acquisition date fair value of the earn-out was reflected in the overall purchase consideration exchanged for the acquisition and recorded as contingent consideration. The earn-out has not yet been paid or settled and the contingent consideration liability is recorded within other liabilities as of December 31, 2019.

69
The Company also acquired Chemstar Corporation, a leading provider of cleaning and sanitizing products for the retail industry with a focus on cleaning chemicals and food safety. This acquired business became part of the Global Institutional reportable segment. The Company also acquired Gallay Medical & Scientific which sells, installs, and services medical equipment and associated chemistry primarily for hospitals, healthcare facilities, and dental clinics. The acquired business became part of the Global Institutional reportable segment. Purchase accounting for these transactions is not yet complete pending finalization of certain estimated values. The amounts recorded reflect the Company’s best estimates as of December 31, 2019 and are subject to change. Annualized pre-acquisition sales for the businesses acquired in 2019 were $134 million. There were insignificant purchase price adjustments related to prior year acquisitions. 2018 Activity During 2018, the Company acquired a water business which provides a range of services to Nalco Water institutional customers. This acquired business became part of the Company’s Global Industrial reportable segment. In addition, the Company acquired an institutional business which provides a range of cleaning and disinfection products for the hospitality, leisure, residential care, housekeeping and janitorial sectors. These acquisitions have been accounted for using the acquisition method of accounting. In addition, there were insignificant purchase price adjustments related to prior year acquisitions. 2017 Activity In 2017, the Company acquired a business which provides water solutions to automotive customers and a paper chemicals business. These businesses became part of the Company’s Global Industrial reportable segment. Also in 2017, the Company acquired U.S. based pest elimination businesses that provide specialized capabilities in food storage. These businesses became part of the Company’s Other reportable segment. Additional acquisitions were made during the year which became part of the Company’s Global Energy and Global Industrial reportable segments. Annualized pre-acquisition sales of the businesses acquired were approximately $135 million. Acquisitions The components of the cash paid for other acquisitions, excluding the Anios transaction (as further disclosed below), for transactions during 2019, 2018 and 2017, are shown in the following table.
(millions) 2019 2018 2017 Net tangible assets (liabilities) acquired and equity method investments $(8.0) $30.1 $29.8 Identifiable intangible assets
Customer relationships 115.7 101.5 67.0 Trademarks 24.1 3.9 2.5 Non-compete agreements - 2.6 0.2 Other technology 48.9 6.5 7.6
Total intangible assets 188.7 114.5 77.3
Goodwill 234.8 81.9 87.4 Total aggregate purchase price 415.5 226.5 194.5
Acquisition-related liabilities and contingent considerations (24.1) (1.5) 5.6 Net cash paid for acquisitions, including acquisition-related
liabilities and contingent considerations $391.4 $225.0 $200.1 The 2019 and 2018 acquisition-related liabilities primarily consist of holdback liabilities and contingent considerations. 2017 acquisition-related liabilities are related primarily to payments of settled liabilities from previous transactions. The weighted average useful lives of identifiable intangible assets acquired, excluding the Anios transaction were, 12,13, and 12 years as of December 31, 2019, 2018 and 2017, respectively.

70
Anios Acquisition On February 1, 2017, the Company acquired Anios for total consideration of $798.3 million, including satisfaction of outstanding debt. Anios had annualized pre-acquisition sales of approximately $245 million and is a leading European manufacturer and marketer of hygiene and disinfection products for the healthcare, food service, and food and beverage processing industries. Anios provides an innovative product line that expands the solutions the Company is able to offer, while also providing a complementary geographic footprint within the healthcare market. During 2016, the Company deposited €50 million in an escrow account that was released back to the Company upon closing of the transaction in February 2017. This was recorded as restricted cash within other assets on the Consolidated Balance Sheet as of December 31, 2016. The Company incurred certain acquisition and integration costs associated with the transaction that were expensed and are reflected in the Consolidated Statement of Income. See Note 3 for additional information related to the Company’s special (gains) and charges related to such activities. The components of the cash paid for Anios are shown in the following table.
(millions) 2017 Tangible assets $139.8 Identifiable intangible assets
Customer relationships 252.0 Trademarks 65.7 Other technology 16.1
Total assets acquired 473.6
Goodwill 511.7
Total liabilities 187.0 Total consideration transferred 798.3
Long-term debt repaid upon close 192.8 Net consideration transferred to sellers $605.5 Tangible assets are primarily comprised of accounts receivable of $64.8 million, property, plant and equipment of $24.7 million and inventory of $29.1 million. Liabilities primarily consist of deferred tax liabilities of $102.3 million and current liabilities of $62.5 million. Customer relationships, trademarks and other technology are being amortized over weighted average lives of 20, 17, and 11 years, respectively. Goodwill of $511.7 million arising from the acquisition consists largely of the synergies and economies of scale expected through adding complementary geographies and innovative products to the Company’s healthcare portfolio. The goodwill was allocated to the Institutional, Healthcare, and Specialty operating segments within the Global Institutional reportable segment and the Food & Beverage and Life Sciences operating segments within the Global Industrial reportable segment. None of the goodwill recognized is expected to be deductible for income tax purposes. Dispositions In November 2017, the Company completed the sale of its Equipment Care business to a third party for $132.6 million, net of working capital adjustments, costs to sell and other transaction expenses. Prior to its sale, Equipment Care provided equipment repair, maintenance, and preventative maintenance services for the commercial food service industry. Consideration received consisted of $118.8 million of cash, a note receivable of $15.0 million and a $5.0 million equity interest in the acquiring entity. The Company recognized a gain of $46.1 million ($12.4 million after tax, primarily due to non-deductible goodwill), which is recorded in special (gains) and charges in the Consolidated Statement of Income. Equipment Care sales were approximately $180 million in 2016 and were included in Other. No dispositions were significant to the Company’s consolidated financial statements for 2019, 2018 or 2017. Subsequent Event Activity Subsequent to year-end, the Company reached an agreement to purchase CID Lines, a leading provider of livestock biosecurity and hygiene solutions. The acquisition is expected to close in the second quarter of 2020 subject to various regulatory clearances.
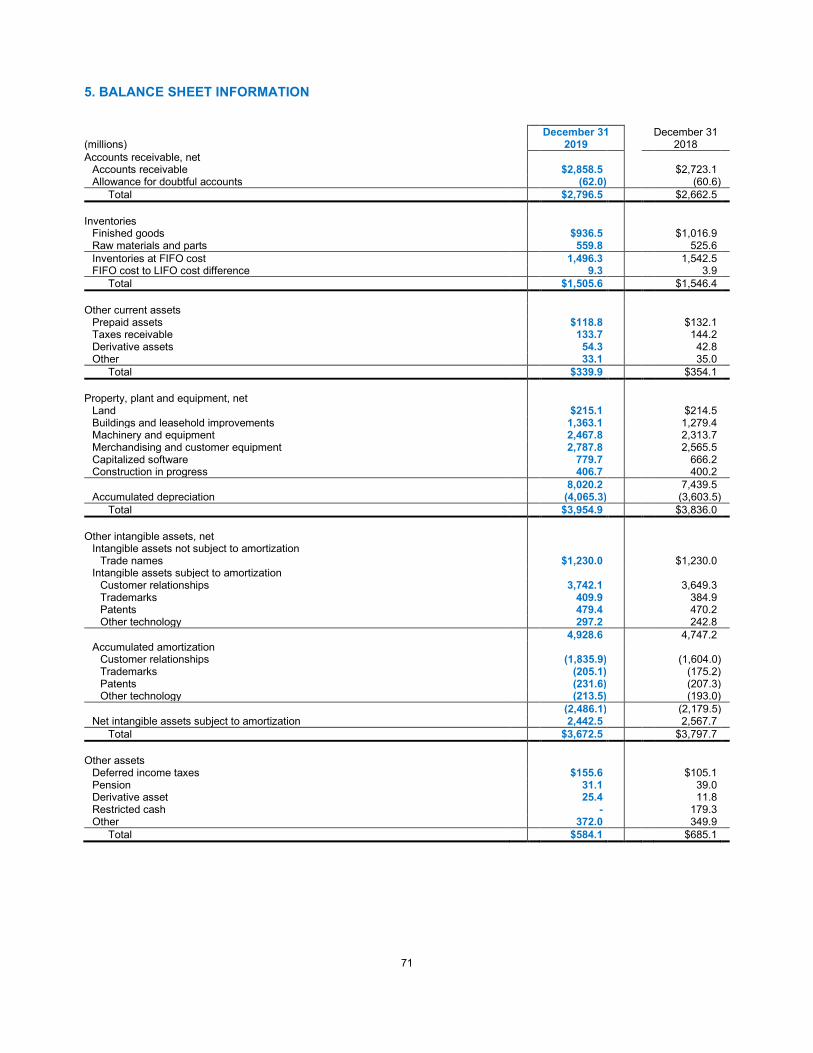
71
5. BALANCE SHEET INFORMATION
December 31 December 31 (millions) 2019 2018 Accounts receivable, net
Accounts receivable $2,858.5 $2,723.1 Allowance for doubtful accounts (62.0) (60.6)
Total $2,796.5 $2,662.5
Inventories Finished goods $936.5 $1,016.9 Raw materials and parts 559.8 525.6 Inventories at FIFO cost 1,496.3 1,542.5 FIFO cost to LIFO cost difference 9.3 3.9
Total $1,505.6 $1,546.4
Other current assets Prepaid assets $118.8 $132.1 Taxes receivable 133.7 144.2 Derivative assets 54.3 42.8 Other 33.1 35.0
Total $339.9 $354.1
Property, plant and equipment, net Land $215.1 $214.5 Buildings and leasehold improvements 1,363.1 1,279.4 Machinery and equipment 2,467.8 2,313.7 Merchandising and customer equipment 2,787.8 2,565.5 Capitalized software 779.7 666.2 Construction in progress 406.7 400.2 8,020.2 7,439.5 Accumulated depreciation (4,065.3) (3,603.5)
Total $3,954.9 $3,836.0
Other intangible assets, net Intangible assets not subject to amortization
Trade names $1,230.0 $1,230.0 Intangible assets subject to amortization
Customer relationships 3,742.1 3,649.3 Trademarks 409.9 384.9 Patents 479.4 470.2 Other technology 297.2 242.8
4,928.6 4,747.2 Accumulated amortization
Customer relationships (1,835.9) (1,604.0) Trademarks (205.1) (175.2) Patents (231.6) (207.3) Other technology (213.5) (193.0) (2,486.1) (2,179.5)
Net intangible assets subject to amortization 2,442.5 2,567.7 Total $3,672.5 $3,797.7
Other assets
Deferred income taxes $155.6 $105.1 Pension 31.1 39.0 Derivative asset 25.4 11.8 Restricted cash - 179.3 Other 372.0 349.9
Total $584.1 $685.1
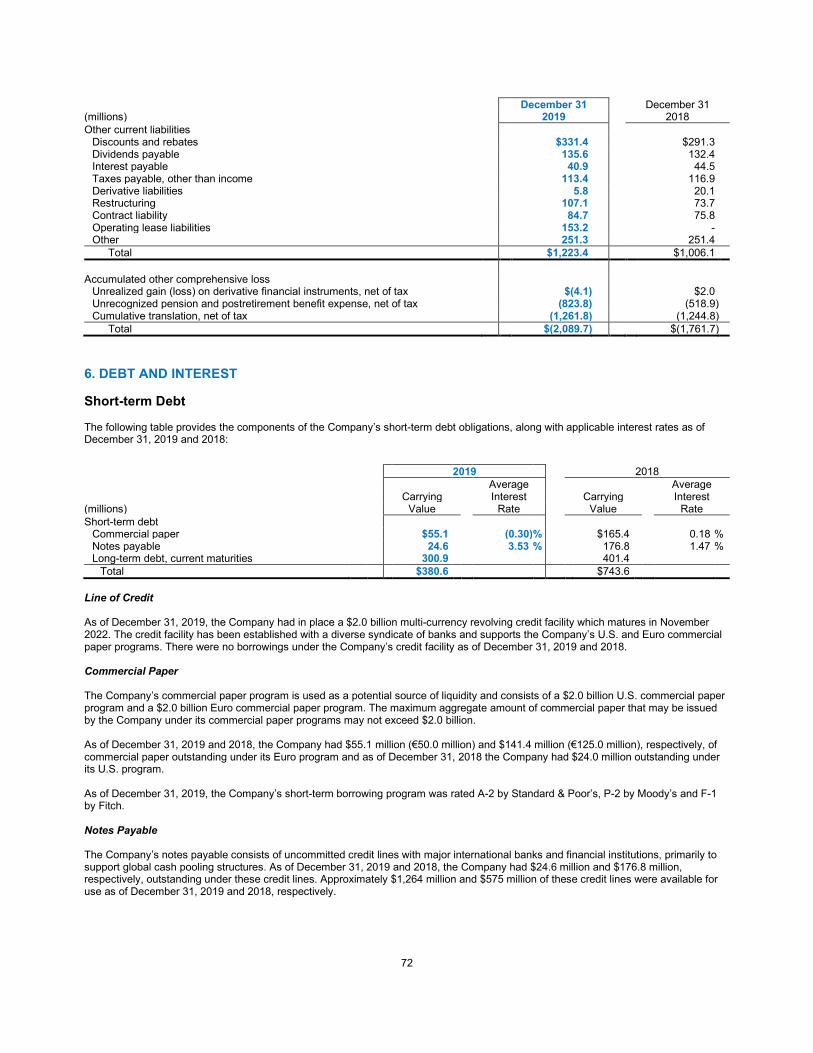
72
December 31 December 31 (millions) 2019 2018 Other current liabilities
Discounts and rebates $331.4 $291.3 Dividends payable 135.6 132.4 Interest payable 40.9 44.5 Taxes payable, other than income 113.4 116.9 Derivative liabilities 5.8 20.1 Restructuring 107.1 73.7 Contract liability 84.7 75.8 Operating lease liabilities 153.2 - Other 251.3 251.4
Total $1,223.4 $1,006.1
Accumulated other comprehensive loss Unrealized gain (loss) on derivative financial instruments, net of tax $(4.1) $2.0 Unrecognized pension and postretirement benefit expense, net of tax (823.8) (518.9) Cumulative translation, net of tax (1,261.8) (1,244.8)
Total $(2,089.7) $(1,761.7)
6. DEBT AND INTEREST Short-term Debt The following table provides the components of the Company’s short-term debt obligations, along with applicable interest rates as of December 31, 2019 and 2018:
2019 2018 Average Average Carrying Interest Carrying Interest (millions) Value Rate Value Rate Short-term debt
Commercial paper $55.1 (0.30) % $165.4 0.18 % Notes payable 24.6 3.53 % 176.8 1.47 % Long-term debt, current maturities 300.9 401.4
Total $380.6 $743.6 Line of Credit As of December 31, 2019, the Company had in place a $2.0 billion multi-currency revolving credit facility which matures in November 2022. The credit facility has been established with a diverse syndicate of banks and supports the Company’s U.S. and Euro commercial paper programs. There were no borrowings under the Company’s credit facility as of December 31, 2019 and 2018. Commercial Paper The Company’s commercial paper program is used as a potential source of liquidity and consists of a $2.0 billion U.S. commercial paper program and a $2.0 billion Euro commercial paper program. The maximum aggregate amount of commercial paper that may be issued by the Company under its commercial paper programs may not exceed $2.0 billion. As of December 31, 2019 and 2018, the Company had $55.1 million (€50.0 million) and $141.4 million (€125.0 million), respectively, of commercial paper outstanding under its Euro program and as of December 31, 2018 the Company had $24.0 million outstanding under its U.S. program. As of December 31, 2019, the Company’s short-term borrowing program was rated A-2 by Standard & Poor’s, P-2 by Moody’s and F-1 by Fitch. Notes Payable The Company’s notes payable consists of uncommitted credit lines with major international banks and financial institutions, primarily to support global cash pooling structures. As of December 31, 2019 and 2018, the Company had $24.6 million and $176.8 million, respectively, outstanding under these credit lines. Approximately $1,264 million and $575 million of these credit lines were available for use as of December 31, 2019 and 2018, respectively.

73
Long-term Debt The following table provides the components of the Company’s long-term debt obligations, along with applicable interest rates as of December 31, 2019 and 2018:
2019 2018 Stated Effective Stated Effective Maturity Carrying Interest Interest Carrying Interest Interest (millions) by Year Value Rate Rate Value Rate Rate Long-term debt Public notes (2019 principal amount)
Three year 2016 senior notes ($400 million) 2019 $ - - % - % $399.7 2.00 % 3.24 % Five year 2015 senior notes ($300 million) 2020 300.0 2.25 % 2.79 % 299.5 2.25 % 2.79 % Ten year 2011 senior notes ($1.02 billion) 2021 1,018.3 4.35 % 4.43 % 1,017.6 4.35 % 4.43 % Five year 2017 senior notes ($500 million) 2022 497.8 2.38 % 2.55 % 496.9 2.38 % 2.55 % Seven year 2016 senior notes ($400 million) 2023 398.5 3.25 % 3.49 % 398.0 3.25 % 3.49 % Seven year 2016 senior notes (€575 million) 2024 628.4 1.00 % 1.10 % 644.1 1.00 % 1.09 % Ten year 2015 senior notes (€575 million) 2025 630.0 2.63 % 2.96 % 646.3 2.63 % 2.94 % Ten year 2016 senior notes ($750 million) 2026 744.5 2.70 % 2.93 % 743.8 2.70 % 2.93 % Ten year 2017 senior notes ($500 million) 2027 495.4 3.25 % 3.37 % 494.8 3.25 % 3.37 % Thirty year 2011 senior notes ($458 million) 2041 451.9 5.50 % 5.56 % 451.6 5.50 % 5.56 % Thirty year 2016 senior notes ($250 million) 2046 246.2 3.70 % 3.76 % 246.1 3.70 % 3.76 % Thirty year 2017 senior notes ($700 million) 2047 610.4 3.95 % 4.15 % 609.0 3.95 % 4.14 %
Private notes (2019 principal amount) Series B private placement senior notes ($250 million) 2023 249.6 4.32 % 4.36 % 249.4 4.32 % 4.36 %
Finance lease obligations and other 3.4 6.2 Total debt 6,274.4 6,703.0
Long-term debt, current maturities (300.9) (401.4) Total long-term debt $5,973.5 $6,301.6
Public Notes The Company’s public notes may be redeemed by the Company at its option at redemption prices that include accrued and unpaid interest and a make-whole premium. Upon the occurrence of a change of control accompanied by a downgrade of the notes below investment grade rating, within a specified time period, the Company would be required to offer to repurchase the public notes at a price equal to 101% of the aggregate principal amount thereof, plus any accrued and unpaid interest to the date of repurchase. The public notes are senior unsecured and unsubordinated obligations of the Company and rank equally with all other senior and unsubordinated indebtedness of the Company. Private Note The Company’s private note may be redeemed by the Company at its option at a redemption price that includes accrued and unpaid interest and a make-whole premium. Upon the occurrence of specified changes of control involving the Company, the Company would be required to offer to repurchase the private note at a price equal to 100% of the aggregate principal amount thereof, plus any accrued and unpaid interest to the date of repurchase. Additionally, the Company would be required to make a similar offer to repurchase the private note upon the occurrence of specified merger events or asset sales involving the Company, when accompanied by a downgrade of the private note below investment grade rating, within a specified time period. The private note is an unsecured senior obligation of the Company and ranks equal in right of payment with all other senior indebtedness of the Company. The private note shall be unconditionally guaranteed by subsidiaries of the Company in certain circumstances, as described in the note purchase agreement as amended. Covenants and Future Maturities The Company is in compliance with all covenants under the Company’s outstanding indebtedness at December 31, 2019. As of December 31, 2019, the aggregate annual maturities of long-term debt for the next five years were:
(millions) 2020 $ 301 2021 1,020 2022 498 2023 648 2024 628

74
Net Interest Expense Interest expense and interest income incurred during 2019, 2018 and 2017 were as follows:
(millions) 2019 2018 2017 Interest expense $215.3 $237.2 $274.6 Interest income (24.1) (14.9) (19.6)
Interest expense, net $191.2 $222.3 $255.0 Interest expense generally includes the expense associated with the interest on the Company’s outstanding borrowings. Interest expense also includes the amortization of debt issuance costs and debt discounts, which are both recognized over the term of the related debt. During 2017, in anticipation of U.S. tax reform and a potential limit on interest deductibility in future years, the Company entered into transactions to exchange or retire certain long-term debt, and incurred debt exchange and extinguishment charges of $21.9 million ($13.6 million after tax) , which are included as a component of interest expense, net on the Consolidated Statement of Income. 7. FAIR VALUE MEASUREMENTS The Company’s financial instruments include cash and cash equivalents, restricted cash, accounts receivable, accounts payable, contingent consideration obligations, commercial paper, notes payable, foreign currency forward contracts, interest rate swap agreements and long-term debt. Fair value is defined as the amount that would be received to sell an asset or paid to transfer a liability in an orderly transaction between market participants as of the measurement date. A hierarchy has been established for inputs used in measuring fair value that maximizes the use of observable inputs and minimizes the use of unobservable inputs by requiring the most observable inputs be used when available. The hierarchy is broken down into three levels: Level 1 - Inputs are quoted prices in active markets that are accessible at the measurement date for identical assets or liabilities. Level 2 - Inputs include observable inputs other than quoted prices in active markets. Level 3 - Inputs are unobservable inputs for which there is little or no market data available. The carrying amount and the estimated fair value for assets and liabilities measured on a recurring basis were:
December 31, 2019 (millions) Carrying Fair Value Measurements Amount Level 1 Level 2 Level 3 Assets
Foreign currency forward contracts $83.9 $- $83.9 $-
Liabilities Foreign currency forward contracts 10.0 - 10.0 -
December 31, 2018 (millions) Carrying Fair Value Measurements Amount Level 1 Level 2 Level 3 Assets
Foreign currency forward contracts $72.3 $- $72.3 $- Liabilities
Foreign currency forward contracts 41.1 - 41.1 - Interest rate swap agreements 0.2 - 0.2 -
The carrying value of foreign currency forward contracts is at fair value, which is determined based on foreign currency exchange rates as of the balance sheet date and classified within level 2. The carrying value of interest rate swap contracts is at fair value, which is determined based on current interest rates and forward interest rates as of the balance sheet date and is classified within level 2. For purposes of fair value disclosure above, derivative values are presented gross. See further discussion of gross versus net presentation of the Company's derivatives within Note 8. Contingent consideration liabilities are recognized and measured at fair value at the acquisition date and thereafter until paid or settled. Contingent consideration is classified within level 3 as the underlying fair value is determined using income-based valuation approaches appropriate for the terms and conditions of each respective earn-out. The consideration expected to be transferred is based on the
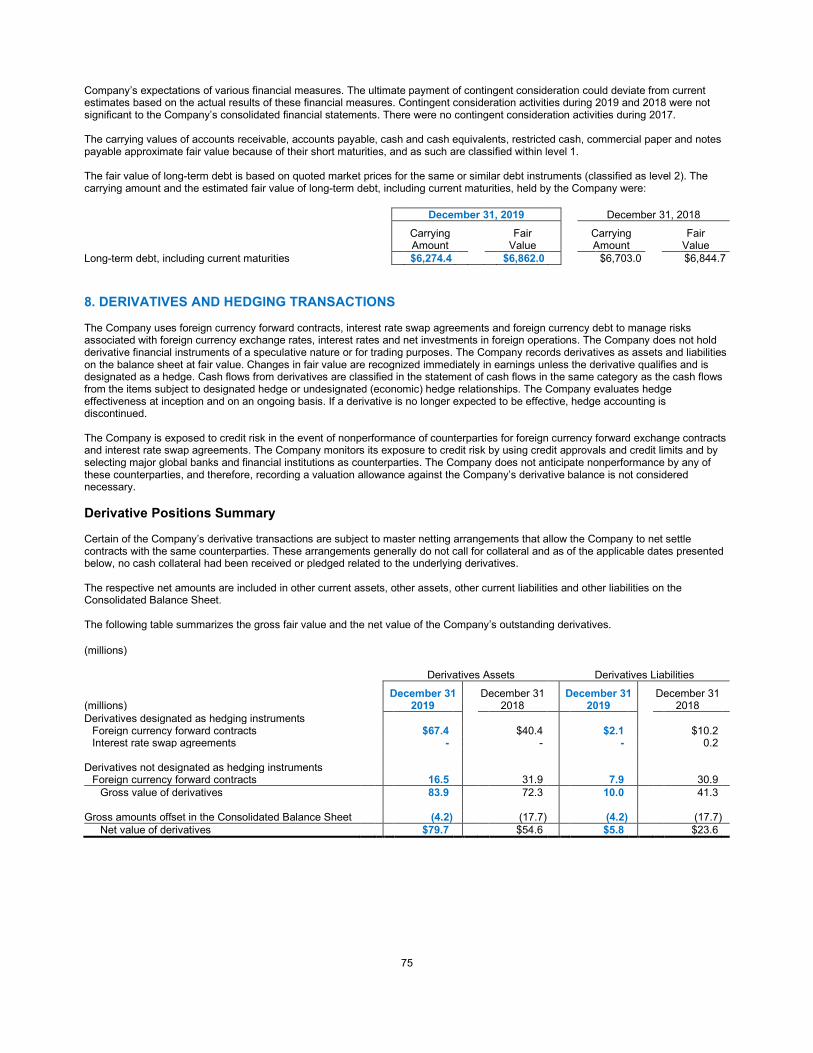
75
Company’s expectations of various financial measures. The ultimate payment of contingent consideration could deviate from current estimates based on the actual results of these financial measures. Contingent consideration activities during 2019 and 2018 were not significant to the Company’s consolidated financial statements. There were no contingent consideration activities during 2017. The carrying values of accounts receivable, accounts payable, cash and cash equivalents, restricted cash, commercial paper and notes payable approximate fair value because of their short maturities, and as such are classified within level 1. The fair value of long-term debt is based on quoted market prices for the same or similar debt instruments (classified as level 2). The carrying amount and the estimated fair value of long-term debt, including current maturities, held by the Company were:
December 31, 2019 December 31, 2018 Carrying Fair Carrying Fair
Amount Value Amount Value Long-term debt, including current maturities $6,274.4 $6,862.0 $6,703.0 $6,844.7
8. DERIVATIVES AND HEDGING TRANSACTIONS The Company uses foreign currency forward contracts, interest rate swap agreements and foreign currency debt to manage risks associated with foreign currency exchange rates, interest rates and net investments in foreign operations. The Company does not hold derivative financial instruments of a speculative nature or for trading purposes. The Company records derivatives as assets and liabilities on the balance sheet at fair value. Changes in fair value are recognized immediately in earnings unless the derivative qualifies and is designated as a hedge. Cash flows from derivatives are classified in the statement of cash flows in the same category as the cash flows from the items subject to designated hedge or undesignated (economic) hedge relationships. The Company evaluates hedge effectiveness at inception and on an ongoing basis. If a derivative is no longer expected to be effective, hedge accounting is discontinued. The Company is exposed to credit risk in the event of nonperformance of counterparties for foreign currency forward exchange contracts and interest rate swap agreements. The Company monitors its exposure to credit risk by using credit approvals and credit limits and by selecting major global banks and financial institutions as counterparties. The Company does not anticipate nonperformance by any of these counterparties, and therefore, recording a valuation allowance against the Company’s derivative balance is not considered necessary. Derivative Positions Summary Certain of the Company’s derivative transactions are subject to master netting arrangements that allow the Company to net settle contracts with the same counterparties. These arrangements generally do not call for collateral and as of the applicable dates presented below, no cash collateral had been received or pledged related to the underlying derivatives. The respective net amounts are included in other current assets, other assets, other current liabilities and other liabilities on the Consolidated Balance Sheet. The following table summarizes the gross fair value and the net value of the Company’s outstanding derivatives.
(millions) Derivatives Assets Derivatives Liabilities
December 31 December 31 December 31 December 31 (millions) 2019 2018 2019 2018 Derivatives designated as hedging instruments
Foreign currency forward contracts $67.4 $40.4 $2.1 $10.2 Interest rate swap agreements - - - 0.2
Derivatives not designated as hedging instruments
Foreign currency forward contracts 16.5 31.9 7.9 30.9 Gross value of derivatives 83.9 72.3 10.0 41.3
Gross amounts offset in the Consolidated Balance Sheet (4.2) (17.7) (4.2) (17.7) Net value of derivatives $79.7 $54.6 $5.8 $23.6

76
The following table summarizes the notional values of the Company’s outstanding derivatives.
Notional Values December 31 December 31 (millions) 2019 2018 Foreign currency forward contracts $ 4,004 $ 6,226 Interest rate agreements - 400
Cash Flow Hedges The Company utilizes foreign currency forward contracts to hedge the effect of foreign currency exchange rate fluctuations on forecasted foreign currency transactions, including inventory purchases and intercompany royalty, intercompany loans, management fee and other payments. These forward contracts are designated as cash flow hedges. The changes in fair value of these contracts are recorded in accumulated other comprehensive income (“AOCI”) until the hedged items affect earnings, at which time the gain or loss is reclassified into the same line item in the Consolidated Statement of Income as the underlying exposure being hedged. Cash flow hedged transactions impacting AOCI are forecasted to occur within the next four years. For forward contracts designated as hedges of foreign currency exchange rate risk associated with forecasted foreign currency transactions, the Company excludes the changes in fair value attributable to time value from the assessment of hedge effectiveness. The initial value of the excluded component (i.e., the forward points) is amortized on a straight-line basis over the life of the hedging instrument and recognized in the same line item in the Consolidated Statement of Income as the underlying exposure being hedged for intercompany loans. For all other cash flow hedge types, the forward points are mark-to-market monthly and recognized in the same line item in the Consolidated Statement of Income as the underlying exposure being hedged. The difference between fair value changes of the excluded component and the amount amortized in the Consolidated Statement of Income is recorded in AOCI. Fair Value Hedges The Company manages interest expense using a mix of fixed and floating rate debt. To help manage exposure to interest rate movements and to reduce borrowing costs, the Company may enter into interest rate swaps under which the Company agrees to exchange, at specified intervals, the difference between fixed and floating interest amounts calculated by reference to an agreed upon notional principal amount. The mark-to-market of these fair value hedges is recorded as gains or losses in interest expense and is offset by the gain or loss of the underlying debt instrument, which also is recorded in interest expense. These fair value hedges are highly effective and thus, there is no impact on earnings due to hedge ineffectiveness. In January 2016, the Company entered into an interest rate swap agreement that converted its $400 million 2.00% debt from a fixed interest rate to a floating interest rate. In January 2015, the Company entered into interest rate swap agreements that converted its $300 million 1.55% debt and its $250 million 3.69% debt from fixed rates to floating interest rates. In May 2014, the Company entered into an interest rate swap agreement that converted its $500 million 1.45% debt from a fixed rate to a floating interest rate. The interest rate swap agreement tied to the Company’s $500 million 1.45% debt, $300 million 1.55% debt, $250 million 3.69% and $400 million 2.00% debt expired in December 2017, January 2018, November 2018 and January 2019, respectively, upon repayment of the underlying debt. The interest rate swaps referenced above were designated as fair value hedges.
Amounts recognized in the Consolidated Balance Sheet
Carrying amount of the hedged liabilities
Cumulative amount of the fair value hedging adjustment included in the carrying amount of
the hedged liabilities (millions) 2019 2018 2017 2019 2018 2017 Long-term debt $- $399.7 $944.6 $- $0.1 $7.6 Net Investment Hedges The Company designates its outstanding $1,258 million (€1,150 million as of year-end 2019) senior notes (“euronotes”) and related accrued interest as a hedge of existing foreign currency exposures related to investments the Company has in certain euro denominated functional currency subsidiaries. Certain Euro commercial paper was also designated as a hedge of existing foreign currency exposures and matured in the fourth quarter of 2019 and third quarter of 2018. The revaluation gains and losses on the euronotes and Euro commercial paper, which are designated and effective as hedges of the Company’s net investments, have been included as a component of the cumulative translation adjustment account, and were as follows:
(millions) 2019 2018 2017 Revaluation gains (losses), net of tax $31.4 $57.5 $(109.7)

77
Derivatives Not Designated as Hedging Instruments The Company also uses foreign currency forward contracts to offset its exposure to the change in value of certain foreign currency denominated assets and liabilities held at foreign subsidiaries, primarily receivables and payables, which are remeasured at the end of each period. Although the contracts are effective economic hedges, they are not designated as accounting hedges. Therefore, changes in the value of these derivatives are recognized immediately in earnings, thereby offsetting the current earnings effect of the related foreign currency denominated assets and liabilities. Effect of all Derivative Instruments on Income The gain (loss) of all derivative instruments recognized in product and equipment cost of sales (“COS”), selling, general and administrative expenses (“SG&A”) and interest expense, net (“interest”) is summarized below:
2019 2018 2017 (millions) COS SG&A Interest COS SG&A Interest COS SG&A Interest Gain (loss) on derivatives in cash flow hedging relationship:
Foreign currency forward contracts Amount of gain (loss) reclassified from AOCI to income $15.4 $39.5 $- $(7.7) $84.1 $- $(13.7) $(157.2) $- Amount excluded from the assessment of effectiveness recognized in earnings based on changes in fair value - - 28.7 - - 37.4 - - 24.5
Interest rate swap agreements Amount of gain (loss) reclassified from AOCI to income - - (0.9) - - (5.5) - - (7.2)
Gain (loss) on derivatives in fair value hedging relationship:
Interest rate swaps Hedged items - - 0.2 - - (4.0) - - 0.7 Derivatives designated as hedging instruments - - (0.2) - - 4.0 - - (0.7)
Gain (loss) on derivatives not designated as hedging instruments:
Foreign currency forward contracts Amount of gain (loss) recognized in income - 30.0 (0.1) - 25.1 5.3 - (38.2) (3.0)
Total gain (loss) of all derivative instruments $15.4 $69.5 $27.7 $(7.7) $109.2 $37.2 $(13.7) $(195.4) $14.3

78
9. OTHER COMPREHENSIVE INCOME (LOSS) INFORMATION Other comprehensive income (loss) includes net income, foreign currency translation adjustments, unrecognized gains and losses on securities, defined benefit pension and postretirement plan adjustments, gains and losses on derivative instruments designated and effective as cash flow hedges and non-derivative instruments designated and effective as foreign currency net investment hedges that are charged or credited to the accumulated other comprehensive loss account in shareholders’ equity. The following table provides other comprehensive income (loss) information related to the Company’s derivatives and hedging instruments and pension and postretirement benefits. See Note 8 for additional information related to the Company’s derivatives and hedging transactions. See Note 16 for additional information related to the Company’s pension and postretirement benefits activity.
(millions) 2019 2018 2017 Derivative and Hedging Instruments
Unrealized gains (losses) on derivative & hedging instruments Amount recognized in AOCI $78.1 $144.4 $(173.4)
(Gains) losses reclassified from AOCI into income COS (15.4) 7.7 13.7 SG&A (39.5) (84.1) 157.2 Interest (income) expense, net (27.8) (31.9) (17.3)
(82.7) (108.3) 153.6 Other activity 0.8 - 0.2 Tax impact 0.4 (7.7) 1.7
Net of tax $(3.4) $28.4 $(17.9)
Pension and Postretirement Benefits Amount recognized in AOCI
Current period net actuarial income (loss) and prior service costs $(326.3) $(56.5) $(46.9) Amount reclassified from AOCI into income
Amortization of net actuarial loss and prior service costs and benefits 0.4 28.4 21.5 Pension and postretirement benefits changes - 59.3 -
(325.9) 31.2 (25.4) Tax impact 74.3 (13.2) 16.2
Net of tax $(251.6) $18.0 $(9.2)
10. SHAREHOLDERS’ EQUITY Authorized common stock, par value $1.00 per share, was 800 million shares at December 31, 2019, 2018 and 2017. Treasury stock is stated at cost. Dividends declared per share of common stock were $1.85 for 2019, $1.69 for 2018 and $1.52 for 2017. The Company has 15 million shares, without par value, of authorized but unissued and undesignated preferred stock. Share Repurchase Authorization In February 2015, the Company’s Board of Directors authorized the repurchase of up to 20 million additional shares of its common stock, including shares to be repurchased under Rule 10b5-1. As of December 31, 2019, 6,805,010 shares remained to be repurchased under the Company’s repurchase authorization. The Company intends to repurchase all shares under its authorization, for which no expiration date has been established, in open market or privately negotiated transactions, subject to market conditions. Accelerated Stock Repurchase (“ASR”) Agreements In February 2017, the Company entered into an ASR agreement to repurchase $300 million of its common stock and received 2,077,224 shares of its common stock, which was approximately 85% of the total number of shares the Company expected to be repurchased under the ASR, based on the price of the Company’s common stock at that time. In connection with the final settlement of the ASR agreement in June 2017, the Company received an additional 286,620 shares of common stock. The final per share purchase price and the total number of shares to be repurchased was based on the volume-weighted average price of the Company’s common stock during the term of the agreement and all shares acquired were recorded as treasury stock. During the open periods in 2017, the ASR was not dilutive to the Company’s earnings per share calculations, nor did it trigger the two-class earnings per share methodology. Additionally, the unsettled portion of ASR during the open periods met the criteria to be accounted for as a forward contract indexed to the Company’s stock and qualified as an equity transaction. The initial delivery of shares, as well as the additional receipt of shares at settlement resulted in a reduction to the Company’s common stock outstanding used to calculate earnings per share.

79
Share Repurchases During 2019 and 2018, the Company reacquired 1,986,241 and 3,908,041 shares, respectively, of its common stock, of which 1,846,384 and 3,706,716, respectively, related to share repurchases through open market or private purchases, and 139,857 and 201,325, respectively, related to shares withheld for taxes on exercise of stock options and vesting of stock awards and units. 11. EQUITY COMPENSATION PLANS The Company’s equity compensation plans provide for grants of stock options, performance-based restricted stock units (“PBRSUs”) and non-performance-based restricted stock units (“RSUs”) and restricted stock awards (“RSAs”). Common shares available for grant as of December 31, 2019, 2018 and 2017 were 9,029,645, 10,152,863 and 11,685,090, respectively. The Company generally issues authorized but previously unissued shares to satisfy stock option exercises and stock award vestings. The Company’s annual long-term incentive share-based compensation program is made up of 50% stock options and 50% PBRSUs. The Company also periodically grants RSUs. Total compensation expense related to all share-based compensation plans was $91 million ($76 million net of tax benefit), $94 million ($78 million net of tax benefit) and $90 million ($62 million net of tax benefit) for 2019, 2018 and 2017, respectively. As of December 31, 2019, there was $124 million of total measured but unrecognized compensation expense related to non-vested share-based compensation arrangements granted under all of the Company’s plans. That cost is expected to be recognized over a weighted-average period of 2.1 years. Stock Options Stock options are granted to purchase shares of the Company’s stock at the average daily share price on the date of grant. These options generally expire within ten years from the grant date. The Company generally recognizes compensation expense for these awards on a straight-line basis over the three year vesting period. Stock option grants to retirement eligible recipients are attributed to expense using the non-substantive vesting method. A summary of stock option activity and average exercise prices is as follows:
2019 2018 2017 Number of Exercise Number of Exercise Number of Exercise Options Price (a) Options Price (a) Options Price (a)
Outstanding, beginning of year 10,516,633 $ 108.28 11,380,013 $ 95.76 11,910,501 $ 84.22 Granted 879,862 184.31 1,202,314 158.23 1,491,893 136.87 Exercised (2,270,374) 82.93 (1,942,192) 64.63 (1,951,920) 56.00 Canceled (83,801) 143.08 (123,502) 127.02 (70,461) 116.44
Outstanding, end of year 9,042,320 $ 108.28 10,516,633 $ 108.28 11,380,013 $ 95.76 Exercisable, end of year 7,048,422 $ 109.34 7,993,297 $ 97.13 8,371,809 $ 84.40 Vested and expected to vest, end of year 8,923,240 $ 121.14 (a) Represents weighted average price per share. The total aggregate intrinsic value of options (the amount by which the stock price exceeded the exercise price of the option on the date of exercise) that were exercised during 2019, 2018 and 2017 was $227 million, $161 million and $142 million, respectively. The total aggregate intrinsic value of options outstanding as of December 31, 2019 was $636 million, with a corresponding weighted-average remaining contractual life of 6.3 years. The total aggregate intrinsic value of options exercisable as of December 31, 2019 was $583 million, with a corresponding weighted-average remaining contractual life of 5.5 years. The total aggregate intrinsic value of options vested and expected to vest as of December 31, 2019 was $633 million, with a corresponding weighted-average remaining contractual life of 6.2 years. The lattice (binomial) option-pricing model is used to estimate the fair value of options at grant date. The Company’s primary employee option grant occurs during the fourth quarter. The weighted-average grant-date fair value of options granted and the significant assumptions used in determining the underlying fair value of each option grant, on the date of grant were as follows:
2019 2018 2017 Weighted-average grant-date fair value of options
granted at market prices $ 40.30 $ 37.34 $ 30.34 Assumptions
Risk-free rate of return 1.6 % 2.8 % 2.2 % Expected life 6 years 6 years 6 years Expected volatility 23.0 % 22.5 % 22.7 % Expected dividend yield 1.0 % 1.2 % 1.2 %

80
The risk-free rate of return is determined based on a yield curve of U.S. treasury rates from one month to ten years and a period commensurate with the expected life of the options granted. Expected volatility is established based on historical volatility of the Company’s stock price. The expected dividend yield is determined based on the Company’s annual dividend amount as a percentage of the average stock price at the time of the grant. PBRSUs, RSUs and RSAs The expense associated with PBRSUs is based on the average of the high and low share price of the Company’s common stock on the date of grant, adjusted for the absence of future dividends. The awards vest based on the Company achieving a defined performance target and with continued service for a three year period. Upon vesting, the Company issues shares of its common stock such that one award unit equals one share of common stock. The Company assesses the probability of achieving the performance target and recognizes expense over the three year vesting period when it is probable the performance target will be met. PBRSU awards granted to retirement eligible recipients are attributed to expense using the non-substantive vesting method. The awards are generally subject to forfeiture in the event of termination of employment. The expense associated with shares of non-performance based RSUs and RSAs is based on the average of the high and low share price of the Company’s common stock on the date of grant, adjusted for the absence of future dividends and is amortized on a straight-line basis over the periods during which the restrictions lapse. The Company currently has RSUs that vest over periods between 12 and 60 months. The awards are generally subject to forfeiture in the event of termination of employment. A summary of non-vested PBRSUs and restricted stock activity is as follows:
PBRSU Grant Date RSAs and Grant Date Awards Fair Value (a) RSUs Fair Value (a) December 31, 2016 1,386,687 $ 107.70 254,387 $ 107.95
Granted 323,750 131.71 96,980 125.34 Vested / Earned (312,745) 99.65 (86,622) 102.02 Canceled (34,856) 108.16 (15,343) 109.72
December 31, 2017 1,362,836 $ 115.24 249,402 $ 116.66 Granted 284,104 152.59 109,074 138.69 Vested / Earned (324,561) 103.15 (92,032) 113.03 Canceled (55,026) 114.25 (19,975) 115.05
December 31, 2018 1,267,353 $ 126.75 246,469 $ 127.09 Granted 207,704 178.20 102,941 177.38 Vested / Earned (334,351) 114.38 (64,597) 119.08 Canceled (23,808) 135.70 (19,300) 124.77
December 31, 2019 1,116,898 $ 139.83 265,513 $ 149.46 (a) Represents weighted average price per share.

81
12. INCOME TAXES Income before income taxes consisted of:
(millions) 2019 2018 2017 United States $752.6 $728.3 $847.3 International 1,146.3 1,076.3 915.1
Total $1,898.9 $1,804.6 $1,762.4 The provision (benefit) for income taxes consisted of:
(millions) 2019 2018 2017 Federal and state $135.4 $103.5 $241.8 International 225.0 175.7 355.1
Total current 360.4 279.2 596.9 Federal and state 32.7 51.8 (331.4) International (70.4) 33.3 (21.7)
Total deferred (37.7) 85.1 (353.1) Provision for income taxes $322.7 $364.3 $243.8 The Company’s overall net deferred tax assets and deferred tax liabilities were comprised of the following:
December 31 (millions) 2019 2018 Deferred tax assets
Other accrued liabilities $141.5 $130.9 Loss carryforwards 71.3 217.2 Share-based compensation 58.4 60.5 Pension and other comprehensive income 208.6 145.8 Lease liability 117.9 - Other, net 83.0 68.5 Valuation allowance (45.4) (184.4)
Total deferred tax assets 635.3 438.5 Deferred tax liabilities
Property, plant and equipment basis differences (307.9) (268.5) Intangible assets (729.8) (783.3) Lease asset (118.4) - Other, net (64.0) (46.2)
Total deferred tax liabilities (1,220.1) (1,098.0) Net deferred tax liabilities balance $(584.8) $(659.5) As of December 31, 2019, the Company has tax effected federal, state and international net operating loss carryforwards of $0.2 million, $19.1 million and $52.0 million, respectively, which will be available to offset future taxable income. The state loss carryforwards expire from 2020 to 2040. For the international loss carryforwards, $27.1 million expire from 2020 to 2040 and $24.9 million have no expiration. The Company has valuation allowances on certain deferred tax assets of $45.4 million and $184.4 million at December 31, 2019 and 2018, respectively. The decrease in valuation allowance from year end 2018 to year end 2019 was due to changes in future utilization of losses related to an internal entity reorganization from 2018 which has subsequently been deemed a worthless asset and therefore the Company has written off both the loss carryforward and related valuation allowance. Current year losses increased the valuation allowance while foreign currency translation decreased the valuation allowance. In 2019, the Company obtained tax benefits from tax holidays in two foreign jurisdictions, the Dominican Republic and Singapore. The Company received a permit of operation, which expires in July 2021, from the National Council of Free Zones of Exportation for the Dominican Republic. Companies operating under the Free Zones are not subject to income tax in the Dominican Republic on export income. The Company has two tax incentives awarded by the Singapore Economic Development Board. These incentives provide for a preferential 10% tax rate on certain headquarter income which expires in January 2021 and a 0% tax rate on manufacturing profits generated at the Company’s facility located on Jurong Island which expires in December 2024. The tax reduction as the result of the tax holidays for 2019 was $29.8 million ($0.10 per diluted share), 2018 was $25.6 million ($0.09 per diluted share) and 2017 was $16.9 million ($0.06 per diluted share).

82
A reconciliation of the statutory U.S. federal income tax rate to the Company’s effective income tax rate is as follows:
2019 2018 2017 Statutory U.S. rate 21.0 % 21.0 % 35.0 % One-time transition tax (0.2) 3.7 9.1 State income taxes, net of federal benefit 1.8 1.2 0.4 Foreign operations 4.8 (13.5) (7.4) Domestic manufacturing deduction - - (2.2) R&D credit (1.1) (1.0) (1.0) Change in valuation allowance (7.4) 9.1 0.2 Audit settlements and refunds - (0.8) (0.1) Excess stock benefits (2.3) (1.6) (2.3) Change in federal tax rate (deferred taxes) - (0.6) (18.2) Prior year adjustments - 2.5 - Other, net 0.4 0.2 0.3
Effective income tax rate 17.0 % 20.2 % 13.8 % The change in the Company’s tax rate includes the tax impact of special (gains) and charges and discrete tax items, which have impacted the comparability of the Company’s historical reported tax rates, as amounts included in special (gains) and charges are derived from tax jurisdictions with rates that vary from the Company’s tax rate, and discrete tax items are not necessarily consistent across periods. The tax impact of special (gains) and charges and discrete tax items will likely continue to impact comparability of the Company’s reported tax rate in the future. The enactment of the Tax Act also significantly impacted the comparability of the Company’s reported tax rate. In 2017, the Company recorded a provisional amount for the income tax effects related to the one-time transition tax of $160.1 million which is subject to payment over eight years. In 2019 and 2018, the Company recorded additional discrete benefit of $3.1 million and discrete expense of $66.0 million, respectively, related to the one-time transition tax primarily due to the issuance of further technical guidance with respect to the Tax Act and the finalization of certain estimates as a result of the filing the 2017 and 2018 U.S. federal tax returns. The Company continues to assert permanent reinvestment of the undistributed earnings of international affiliates, and, if there are policy changes, the Company would record the applicable taxes in that period of change. Accordingly, no deferred taxes have been provided for withholding taxes or other taxes as it is not practical to estimate the tax liability that might be incurred if such earnings were remitted to the U.S. The Company files U.S. federal income tax returns and income tax returns in various U.S. state and non- U.S. jurisdictions. With few exceptions, the Company is no longer subject to state and foreign income tax examinations by tax authorities for years before 2016. The IRS has completed examinations of the Company’s U.S. federal income tax returns through 2016, and the years 2017 and 2018 are currently under audit. In addition to the U.S. federal examination, there is ongoing audit activity in several U.S. state and foreign jurisdictions. The Company anticipates changes to uncertain tax positions due to closing of various audit years mentioned above. The Company does not believe these changes will result in a material impact during the next twelve months. Decreases in the Company’s gross liability could result in offsets to other balance sheet accounts, cash payments, and adjustments to tax expense. The occurrence of these events and/or other events not included above within the next twelve months could change depending on a variety of factors and result in amounts different from above. The Company’s 2019 reported tax rate includes $3.1 million of net benefit associated with the Tax Act, $57.2 million of net tax benefits on special (gains) and charges, and net tax benefits of $55.3 million associated with discrete tax items. During 2019, the Company recorded a discrete tax benefit of $43.1 million related to excess tax benefits resulting from the treatment of tax benefits on share-based compensation. The extent of excess tax benefits is subject to variation in stock price and stock option exercises. The Company recognized $15.6 million tax benefit related to changes in local tax law, which primarily includes $30.4 million benefit due to the passage of the Swiss Tax Reform and AHV Financing Act, a Swiss federal tax law, offset by a tax expense of $10.2 million due to the release of the final Treasury Regulation governing taxation of foreign dividends. The Company recorded changes in reserves in non-U.S. and U.S. jurisdictions due to audit settlements and statutes of limitations which resulted in a $16.8 million tax benefit. The Company finalized the 2015 and 2016 IRS audit in 2019, which resulted in a discrete tax expense of $11.0 million. The remaining discrete tax expense was primarily related to changes in estimates in non-U.S. jurisdictions. The Company’s 2018 reported tax rate includes $66.0 million of net tax expense associated with the Tax Act, $33.5 million of net tax benefits on special (gains) and charges, and net tax benefits of $61.3 million associated with discrete tax items. During 2018, the Company recorded a discrete tax benefit of $28.1 million related to excess tax benefits resulting from the adoption of accounting changes regarding the treatment of tax benefits on share-based compensation. The extent of excess tax benefits is subject to variation in stock price and stock option exercises. In addition, the Company recorded net discrete benefit of $39.9 million related to adjustments from filing the 2017 U.S. federal income tax return and IRS approved method change. Included within the 2018 provision for income taxes is $44.2 million of discrete charges recorded in the fourth quarter to correct immaterial errors in prior years. The remaining discrete expense was primarily related to changes in reserves, audit settlements, international and U.S. changes in estimates, and accounting for internal entity reorganization.

83
The Company’s 2017 reported tax rate includes $158.9 million of net tax benefits associated with the Tax Act, $6.2 million of net tax benefits on special (gains) and charges, and net tax benefits of $25.3 million associated with discrete tax items. In connection with the Company’s initial analysis of the impact of the Tax Act, as noted above, a provisional net discrete tax benefit of $158.9 million was recorded in the period ended December 31, 2017, which includes $319.0 million tax benefit for recording deferred tax assets and liabilities at the U.S. enacted tax rate, and a net expense for the one-time transition tax of $160.1 million. Special (gains) and charges represent the tax impact of special (gains) and charges, as well as additional tax benefits utilized in anticipation of U.S. tax reform of $7.8 million. During 2017, the Company recorded a discrete tax benefit of $39.7 million related to excess tax benefits, resulting from the adoption of accounting changes regarding the treatment of tax benefits on share-based compensation. The extent of excess tax benefits is subject to variation in stock price and stock option exercises. In addition, the Company recorded net discrete expenses of $14.4 million related to recognizing adjustments from filing the 2016 U.S. federal income tax return and international adjustments due to changes in estimates, partially offset by the release of reserves for uncertain tax positions due to the expiration of statute of limitations in state tax matters. A reconciliation of the beginning and ending amount of gross liability for unrecognized tax benefits is as follows:
(millions) 2019 2018 2017 Balance at beginning of year $49.7 $61.5 $75.9
Additions based on tax positions related to the current year 2.1 3.0 3.2 Additions for tax positions of prior years 1.0 2.0 — Reductions for tax positions of prior years (18.4) (8.7) (4.9) Reductions for tax positions due to statute of limitations (5.7) (5.8) (14.0) Settlements (0.6) (0.8) (10.8) Assumed in connection with acquisitions - - 10.0 Foreign currency translation (0.4) (1.5) 2.1
Balance at end of year $27.7 $49.7 $61.5 The total amount of unrecognized tax benefits, if recognized would have affected the effective tax rate by $24.5 million as of December 31, 2019, $36.4 million as of December 31, 2018 and $47.1 million as of December 31, 2017. The Company recognizes interest and penalties related to unrecognized tax benefits in its provision for income taxes. During 2019, 2018 and 2017 the Company released $1.8 million, $1.2 million and $0.9 million related to interest and penalties, respectively. The Company had $6.2 million, $8.1 million and $9.3 million of accrued interest, including minor amounts for penalties, at December 31, 2019, 2018, and 2017, respectively. 13. RENTALS AND LEASES Lessee The Company leases sales and administrative office facilities, distribution centers, research and manufacturing facilities, as well as vehicles and other equipment under operating leases. The Company also enters into insignificant finance leases. The Company’s operating lease cost was as follows:
(millions) 2019 Operating lease cost* $219.4 *Includes immaterial short-term and variable lease costs Future maturity of operating lease liabilities as of December 31, 2019 is as follows:
(millions) 2020 174 2021 150 2022 109 2023 68 2024 37 Thereafter 121 Total lease payments 659 Less: imputed interest 81 Present value of lease liabilities $ 578

84
Total rental expense under the Company’s operating leases was $210 million in 2018 and $239 million in 2017. As of December 31, 2018, identifiable future minimum payments with non-cancelable terms in excess of one year were:
(millions) 2019 $ 172 2020 141 2021 108 2022 72 2023 37 Thereafter 104 Total $ 634 The Company’s operating leases term and discount rate were as follows:
December 31 2019 Weighted-average remaining lease terms (years) 6.03 Weighted-average discount rate 4.00% The Company’s other lease information was as follows:
(millions) 2019 Cash paid for amounts included in the measurement of lease liabilities:
Operating cash flows from operating leases $200.8 Leased assets obtained in exchange for new operating lease liabilities 181.6 Lessor The Company leases warewashing and water treatment equipment to customers under operating leases. Gross assets under operating leases recorded in Property, plant and equipment, net is $1,113.6 million and related accumulated depreciation is $621.8 million as of December 31, 2019. The Company’s operating lease revenue was as follows:
(millions) 2019 Operating lease revenue* $441.3 *Includes immaterial variable lease revenue Revenue from operating leases for existing contracts as of December 31, 2019 is as follows:
(millions) 2020 382 2021 292 2022 222 2023 143 2024 58 Thereafter 17 Total lease revenue $ 1,114 The Company mitigates the risk of residual value subsequent to the lease term by redeploying assets. As such, the Company expects to receive revenue from the operating lease assets through the remaining useful life and therefore subsequent to the initial contract termination date. 14. RESEARCH AND DEVELOPMENT EXPENDITURES Research expenditures that relate to the development of new products and processes, including significant improvements and refinements to existing products, are expensed as incurred. Such costs were $209 million in 2019, $216 million in 2018 and $201 million in 2017. The Company did not participate in any material customer sponsored research during any of the years.

85
15. COMMITMENTS AND CONTINGENCIES The Company is subject to various claims and contingencies related to, among other things, workers’ compensation, general liability (including product liability), automobile claims, health care claims, income taxes, environmental matters and lawsuits. The Company is also subject to various claims and contingencies related to income taxes, which are discussed in Note 12. The Company also has contractual obligations including to lease commitments, which are discussed in Note 13. The Company records liabilities where a contingent loss is probable and can be reasonably estimated. If the reasonable estimate of a probable loss is a range, the Company records the most probable estimate of the loss or the minimum amount when no amount within the range is a better estimate than any other amount. The Company discloses a contingent liability even if the liability is not probable or the amount is not estimable, or both, if there is a reasonable possibility that a material loss may have been incurred. Insurance Globally, the Company has insurance policies with varying deductible levels for property and casualty losses. The Company is insured for losses in excess of these deductibles, subject to policy terms and conditions and has recorded both a liability and an offsetting receivable for amounts in excess of these deductibles. The Company is self-insured for health care claims for eligible participating employees, subject to certain deductibles and limitations. The Company determines its liabilities for claims on an actuarial basis. Litigation and Environmental Matters The Company and certain subsidiaries are party to various lawsuits, claims and environmental actions that have arisen in the ordinary course of business. These include from time to time antitrust, commercial, patent infringement, product liability and wage hour lawsuits, as well as possible obligations to investigate and mitigate the effects on the environment of the disposal or release of certain chemical substances at various sites, such as Superfund sites and other operating or closed facilities. The Company has established accruals for certain lawsuits, claims and environmental matters. The Company currently believes that there is not a reasonably possible risk of material loss in excess of the amounts accrued related to these legal matters. Because litigation is inherently uncertain, and unfavorable rulings or developments could occur, there can be no certainty that the Company may not ultimately incur charges in excess of recorded liabilities. A future adverse ruling, settlement or unfavorable development could result in future charges that could have a material adverse effect on the Company’s results of operations or cash flows in the period in which they are recorded. The Company currently believes that such future charges related to suits and legal claims, if any, would not have a material adverse effect on the Company’s consolidated financial position. Environmental Matters The Company is currently participating in environmental assessments and remediation at approximately 40 locations, the majority of which are in the U.S., and environmental liabilities have been accrued reflecting management’s best estimate of future costs. Potential insurance reimbursements are not anticipated in the Company’s accruals for environmental liabilities. Matters Related to Deepwater Horizon Incident Response On April 22, 2010, the deepwater drilling platform, the Deepwater Horizon, operated by a subsidiary of BP plc, sank in the Gulf of Mexico after a catastrophic explosion and fire that began on April 20, 2010. A massive oil spill resulted. Approximately one week following the incident, subsidiaries of BP plc, under the authorization of the responding federal agencies, formally requested certain entities that are or will become subsidiaries of ChampionX upon completion of the transactions to separate and combine our Upstream Energy business with Apergy Corporation as discussed in Note 1 (collectively the “COREXIT Defendants”) to supply large quantities of COREXIT™ 9500, an oil dispersant product listed on the U.S. EPA National Contingency Plan Product Schedule. The COREXIT Defendants responded immediately by providing available COREXIT™ and increasing production to supply the product to BP’s subsidiaries for use, as authorized and directed by agencies of the federal government throughout the incident. Prior to the incident, the COREXIT Defendants had not provided products or services or otherwise had any involvement with the Deepwater Horizon platform. On July 15, 2010, BP announced that it had capped the leaking well, and the application of dispersants by the responding parties ceased shortly thereafter. On May 1, 2010, the President of the United States appointed retired U.S. Coast Guard Commandant Admiral Thad Allen to serve as the National Incident Commander in charge of the coordination of the response to the incident at the national level. The EPA directed numerous tests of all the dispersants on the National Contingency Plan Product Schedule, including those provided by the COREXIT Defendants, “to ensure decisions about ongoing dispersant use in the Gulf of Mexico are grounded in the best available science.” The COREXIT Defendants cooperated with this testing process and continued to supply COREXIT™, as requested by BP and government authorities. The use of dispersants by the responding parties was one tool used by the government and BP to avoid and reduce damage to the Gulf area from the spill. In connection with its provision of COREXIT™, the COREXIT Defendants have been named in several lawsuits as described below.

86
Cases arising out of the Deepwater Horizon accident were administratively transferred for pre-trial purposes to a judge in the United States District Court for the Eastern District of Louisiana (the “Court”) with other related cases under In Re: Oil Spill by the Oil Rig “Deepwater Horizon” in the Gulf of Mexico, on April 20, 2010, Case No. 10-md-02179 (E.D. La.) (“MDL 2179”). The COREXIT Defendants were named, along with other unaffiliated defendants, in six putative class action complaints related to the Deepwater Horizon oil spill and 21 complaints filed by individuals. Those complaints were consolidated in MDL 2179. The complaints generally allege, among other things, strict liability and negligence relating to the use of COREXIT™ dispersant in connection with the Deepwater Horizon oil spill. Pursuant to orders issued by the Court in MDL 2179, the claims were consolidated in several master complaints, including one naming the COREXIT Defendants and others that responded to the Deepwater Horizon oil spill (known as the “B3 Master Complaint”). On May 18, 2012, the COREXIT Defendants filed a motion for summary judgment against the claims in the B3 Master Complaint, on the grounds that: (i) the plaintiffs’ claims are preempted by the comprehensive oil spill response scheme set forth in the Clean Water Act and National Oil and Hazardous Substances Pollution Contingency Plan (the “National Contingency Plan”); and (ii) the COREXIT Defendants are entitled to derivative immunity from suit. On November 28, 2012, the Court granted the COREXIT Defendants’ motion and dismissed with prejudice the claims in the B3 Master Complaint asserted against the COREXIT Defendants. The Court held that such claims were preempted by the Clean Water Act and National Contingency Plan. Because claims in the B3 Master Complaint remained pending against other defendants, the Court’s decision was not a “final judgment” for purposes of appeal. Under Federal Rule of Appellate Procedure 4(a), plaintiffs will have 30 days after entry of final judgment to appeal the Court’s decision. In December 2012 and January 2013, the MDL 2179 court issued final orders approving two settlements between BP and plaintiffs’ class counsel: (1) a proposed Medical Benefits Class Action Settlement; and (2) a proposed Economic and Property Damages Class Action Settlement. Pursuant to the proposed settlements, class members agree to release claims against BP and other released parties, including the COREXIT Defendants. The COREXIT Defendants, the incident defendants and the other responder defendants have been named as first party defendants by Transocean Deepwater Drilling, Inc. and its affiliates (the “Transocean Entities”) (In re the Complaint and Petition of Triton Asset Leasing GmbH, et al, MDL No. 2179, Civil Action 10-2771). In April and May 2011, the Transocean Entities, Cameron International Corporation, Halliburton Energy Services, Inc., M-I L.L.C., Weatherford U.S., L.P. and Weatherford International, Inc. (collectively, the “Cross Claimants”) filed cross claims in MDL 2179 against the COREXIT Defendants and other unaffiliated cross defendants. The Cross Claimants generally allege, among other things, that if they are found liable for damages resulting from the Deepwater Horizon explosion, oil spill and/or spill response, they are entitled to indemnity or contribution from the cross defendants. In April and June 2011, in support of its defense of the claims against it, the COREXIT Defendants filed counterclaims against the Cross Claimants. In its counterclaims, the COREXIT Defendants generally allege that if they are found liable for damages resulting from the Deepwater Horizon explosion, oil spill and/or spill response, they is entitled to contribution or indemnity from the Cross Claimants. In May 2016, the COREXIT Defendants were named in nine additional complaints filed by individuals alleging, among other things, business and economic loss resulting from the Deepwater Horizon oil spill (“B1” claims). In April 2017, the COREXIT Defendants were named in two additional complaints filed by individuals alleging, among other things, business and economic loss resulting from the Deepwater Horizon oil spill. The plaintiffs in these lawsuits are generally seeking awards of unspecified compensatory and punitive damages, and attorneys’ fees and costs. These actions have been consolidated in MDL 2179. On February 22, 2017, the Court dismissed the B3 Master Complaint and ordered that plaintiffs who had previously filed a claim that fell within the scope of the B3 Master Complaint and who had “opted out” of and not released their claims under the Medical Benefits Class Action Settlement either: (1) complete a sworn statement indicating, among other things, that they opted out of the Medical Benefits Class Action Settlement (to be completed by plaintiffs who previously filed an individual complaint); or (2) file an individual lawsuit attaching the sworn statement as an exhibit, by a deadline date set by the Court. On July 10, 2018, the Court entered an order dismissing the “B1” claims against the COREXIT Defendants. In light of the Court’s orders dismissing various B3 and “B1” claims in their entirety, for most plaintiffs the Court’s November 28, 2012 grant of summary judgment for the COREXIT Defendants is now final and the deadline to appeal has passed. On October 23, 2018, a plaintiff filed a new B3 complaint against the COREXIT Defendants and other unaffiliated defendants generally alleging, among other things, negligence and gross negligence related to the use of COREXIT™ dispersant in connection with the Deepwater Horizon oil spill. The complaint was consolidated in MDL 2179. There currently remain three cases pending against the COREXIT Defendants relating to the Deepwater Horizon oil spill, all of which are expected to ultimately be dismissed pursuant to the Court’s November 28, 2012 order granting the COREXIT Defendants’ motion for summary judgment. ChampionX believes the claims asserted against the COREXIT Defendants are without merit and intends to defend these lawsuits vigorously. ChampionX also believes that it has rights to contribution and/or indemnification (including legal expenses) from third parties. However, ChampionX cannot predict the outcome of these lawsuits, the involvement it might have in these matters in the future, or the potential for future litigation.

87
16. RETIREMENT PLANS Pension and Postretirement Health Care Benefits Plans The Company has a non-contributory, qualified, defined benefit pension plan covering the majority of its U.S. employees. The Company also has non-contributory, non-qualified, defined benefit plans, which provide for benefits to employees in excess of limits permitted under its U.S. pension plans. Various international subsidiaries have defined benefit pension plans. The Company provides postretirement health care benefits to certain U.S. employees and retirees. The non-qualified plans are not funded and the recorded benefit obligation for the non-qualified plans was $127 million and $119 million at December 31, 2019 and 2018, respectively. The measurement date used for determining the U.S. pension plan assets and obligations is December 31. International plans are funded based on local country requirements. The measurement date used for determining the international pension plan assets and obligations is November 30, the fiscal year-end of the Company’s international affiliates. The U.S. postretirement health care plans are contributory based on years of service and choice of coverage (family or single), with retiree contributions adjusted annually. The measurement date used to determine the U.S. postretirement health care plan assets and obligations is December 31. Certain employees outside the U.S. are covered under government-sponsored programs, which are not required to be fully funded. The expense and obligation for providing international postretirement health care benefits are not significant.

88
The following table sets forth financial information related to the Company’s pension and postretirement health care plans:
U.S. International U.S. Postretirement Pension (a) Pension Health Care (millions) 2019 2018 2019 2018 2019 2018 Accumulated benefit obligation, end of year $2,535.9 $2,189.0 $1,585.5 $1,349.9 $165.7 $147.3 Projected benefit obligation
Projected benefit obligation, beginning of year $2,241.0 $2,485.1 $1,436.7 $1,537.9 $147.3 $181.3 Service cost 72.8 74.5 30.2 33.2 1.4 2.7 Interest cost 89.0 83.1 31.2 29.1 5.6 5.6 Participant contributions - - 3.0 3.5 3.4 3.5 Medicare subsidies received - - - - - - Curtailments and settlements 3.4 - (18.6) (22.8) 0.6 - Plan amendments - (40.4) 0.1 - - (13.7) Actuarial (gain) loss 336.4 (181.3) 235.8 (42.7) 22.2 (18.4) Assumed through acquisitions - - - 11.4 - - Other events - - 0.6 - - - Benefits paid (180.1) (180.0) (37.6) (38.7) (14.8) (13.7) Foreign currency translation - - (13.8) (74.2) - -
Projected benefit obligation, end of year $2,562.5 $2,241.0 $1,667.6 $1,436.7 $165.7 $147.3
Plan assets Fair value of plan assets, beginning of year $1,981.4 $2,226.4 $925.6 $981.1 $6.0 $7.6 Actual returns on plan assets 366.9 (70.7) 110.5 2.6 1.1 (0.2) Company contributions 129.0 5.7 43.3 42.0 13.8 12.3 Participant contributions - - 3.0 3.5 - - Acquisitions - - - 6.4 - - Curtailments and settlements (4.3) - (17.6) (22.8) - - Benefits paid (180.1) (180.0) (37.6) (38.7) (14.8) (13.7) Foreign currency translation - - (0.1) (48.5) - -
Fair value of plan assets, end of year $2,292.9 $1,981.4 $1,027.1 $925.6 $6.1 $6.0 Funded Status, end of year $(269.6) $(259.6) $(640.5) $(511.1) $(159.6) $(141.3) Amounts recognized in the Consolidated Balance Sheet:
Other assets $- $- $31.1 $39.0 $- $- Other current liabilities (12.5) (5.9) (23.6) (24.4) (5.2) (5.0) Postretirement healthcare and pension benefits (257.1) (253.7) (647.8) (525.7) (154.4) (136.3)
Net liability $(269.6) $(259.6) $(640.3) $(511.1) $(159.6) $(141.3)
Amounts recognized in accumulated other comprehensive loss (income):
Unrecognized net actuarial loss (gain) $632.4 $539.2 $527.7 $368.0 $(10.5) $(36.0) Unrecognized net prior service costs (benefits) (40.0) (52.3) 0.6 (6.0) (11.0) (34.4) Tax (benefit) expense (149.1) (194.4) (129.6) (92.7) 3.4 27.6
Accumulated other comprehensive loss (income), net of tax $443.3 $292.5 $398.7 $269.3 $(18.1) $(42.8) Change in accumulated other comprehensive loss (income):
Amortization of net actuarial (gain) loss $(23.5) $(38.9) $(17.3) $(16.5) $4.1 $1.9 Amortization of prior service costs 11.5 6.8 1.1 0.9 23.2 19.7 Current period net actuarial loss (gain) 119.0 51.2 185.8 17.9 21.4 (17.8) Current period prior service costs - - 0.1 - - 5.2 Curtailments and settlements (1.5) - 1.8 (2.3) 0.2 - Tax (benefit) expense (25.7) 5.1 (36.9) 5.7 (11.7) 2.4 Pension and postretirement benefits changes - (40.4) - - - (18.9) Foreign currency translation - - (5.2) (19.2) - -
Other comprehensive loss (income) $79.8 $(16.2) $129.4 $(13.5) $37.2 $(7.5) (a) Includes qualified and non-qualified plans

89
Estimated amounts in accumulated other comprehensive loss expected to be reclassified to net period cost during 2020 are as follows:
U.S. Post- U.S. International Retirement (millions) Pension (a) Pension Health Care Net actuarial loss $51.9 $25.5 $0.1 Net prior service benefits (7.4) (0.1) (11.0) Total $44.5 $25.4 $(10.9) (a) Includes qualified and non-qualified plans Service cost is included with employee compensation cost in cost of sales and selling, general and administrative expenses in the Consolidated Statement of Income while all other components are included in other (income) expense in the Consolidated Statement of Income. The aggregate projected benefit obligation, accumulated benefit obligation and fair value of pension plan assets for plans with accumulated benefit obligations in excess of plan assets were as follows:
December 31, (millions) 2019 2018 Aggregate projected benefit obligation $3,970.3 $3,427.1 Accumulated benefit obligation 3,877.4 3,308.4 Fair value of plan assets 3,040.5 2,624.3 These plans include the U.S. non-qualified pension plans which are not funded as well as the U.S. qualified pension plan. These plans also include various international pension plans which are funded consistent with local practices and requirements. Net Periodic Benefit Costs and Plan Assumptions Pension and postretirement health care benefits expense for the Company’s operations are as follows:
U.S. International U.S. Postretirement Pension (a) Pension Health Care (millions) 2019 2018 2017 2019 2018 2017 2019 2018 2017 Service cost $72.8 $74.5 $70.2 $30.2 $33.2 $31.4 $1.4 $2.7 $2.6 Interest cost on benefit obligation 89.0 83.1 83.4 31.2 29.1 28.4 5.6 5.6 5.8 Expected return on plan assets (149.5) (161.9) (149.9) (59.9) (63.2) (56.3) (0.4) (0.4) (0.5) Recognition of net actuarial loss
(gain) 23.6 39.0 28.7 16.3 17.2 18.5 (4.1) (1.9) (2.4) Amortization of prior service benefit (11.5) (6.8) (6.8) (0.9) (0.9) (0.7) (23.2) (19.7) (16.7) Curtailments and settlements 9.1 - 0.3 (1.9) 2.3 0.9 0.3 - -
Total expense (benefit) $33.5 $27.9 $25.9 $15.0 $17.7 $22.2 $(20.4) $(13.7) $(11.2) (a) Includes qualified and non-qualified plans
Plan Assumptions U.S. International U.S. Postretirement Pension (a) Pension Health Care (percent) 2019 2018 2017 2019 2018 2017 2019 2018 2017 Weighted-average actuarial assumptions
used to determine benefit obligations as of year end:
Discount rate 3.20 % 4.34 % 3.70 % 1.52 % 2.49 % 2.17 % 3.16 % 4.29 % 3.66 % Projected salary increase 4.03 4.03 4.03 2.50 2.46 2.46
Weighted-average actuarial assumptions
used to determine net cost: Discount rate 4.34 3.70 4.27 2.66 2.29 2.32 4.29 3.66 4.14 Expected return on plan assets 7.25 7.75 7.75 6.66 6.67 6.67 7.25 7.75 7.75 Projected salary increase 4.03 4.03 4.03 2.70 2.67 2.83
(a) Includes qualified and non-qualified plans The discount rate assumptions for the U.S. plans are developed using a bond yield curve constructed from a population of high-quality, non-callable, corporate bond issues with maturities ranging from six months to thirty years. A discount rate is estimated for the U.S. plans and is based on the durations of the underlying plans.

90
The Company measures service and interest costs by applying the specific spot rates along that yield curve to the plans’ liability cash flows. The Company believes this approach provides a more precise measurement of service and interest costs by aligning the timing of the plans’ liability cash flows to the corresponding spot rates on the yield curve. The expected long-term rate of return used for the U.S. plans is based on the pension plan’s asset mix. The Company considers expected long-term real returns on asset categories, expectations for inflation, and estimates of the impact of active management of the assets in determining the final rate to use. The Company also considers actual historical returns. The expected long-term rate of return used for the Company’s international plans is determined in each local jurisdiction and is based on the assets held in that jurisdiction, the expected rate of returns for the type of assets held and any guaranteed rate of return provided by the investment. The other assumptions used to measure the international pension obligations, including discount rate, vary by country based on specific local requirements and information. As previously noted, the measurement date for these plans is November 30. The Company uses most recently available mortality tables as of the respective U.S. and international measurement dates. For postretirement benefit measurement purposes as of December 31, 2019, the annual rates of increase in the per capita cost of covered health care were assumed to be 8.00% for pre-65 costs and 10.75% for post-65 costs. The rates are assumed to decrease each year until they reach 5% in 2028 and remain at those levels thereafter. Health care costs for certain employees which are eligible for subsidy by the Company are limited by a cap on the subsidy. During the second quarter of 2018, an amendment to eligibility requirements of the U.S. retiree death benefit plan was approved and communicated to all eligible participants. As a result of the approval and communication to the beneficiaries, the plan was remeasured, resulting in an $18.9 million ($14.4 million after tax), reduction of postretirement benefit obligations, with a corresponding impact to accumulated other comprehensive income (AOCI). The re-measurement was completed using a discount rate of 4.36%. As a result of this action, the Company’s U.S. postretirement healthcare costs decreased by $4.5 million in 2018. During the fourth quarter of 2018, the qualified U.S. pension plan was amended to allow unlimited lump sums for participants with the Final Average Pay benefit formula, effective with payments starting on or after June 1, 2019. This amendment allows participants to receive a lump sum benefit based on the present value of the accrued benefit at normal retirement age based on IRC 417(e) interest and mortality rates. As a result of this action, the U.S pension plan benefit obligation was reduced by $40.4 million with a corresponding impact to accumulated other comprehensive income (AOCI). Assumed health care cost trend rates have an effect on the amounts reported for the Company’s U.S. postretirement health care benefits plan. A one-percentage point change in the assumed health care cost trend rates would have an immaterial impact on total service and interest costs as well as total postretirement benefit obligation. Plan Asset Management The Company’s U.S. investment strategy and policies are designed to maximize the possibility of having sufficient funds to meet the long-term liabilities of the pension fund, while achieving a balance between the goals of asset growth of the plan and keeping risk at a reasonable level. Current income is not a key goal of the policy. The asset allocation position reflects the Company’s ability and willingness to accept relatively more short-term variability in the performance of the pension plan portfolio in exchange for the expectation of better long-term returns, lower pension costs and better funded status in the long run. The pension fund is diversified across a number of asset classes and securities. Selected individual portfolios within the asset classes may be undiversified while maintaining the diversified nature of total plan assets. The Company has no significant concentration of risk in its U.S. plan assets. Assets of funded retirement plans outside the U.S. are managed in each local jurisdiction and asset allocation strategy is set in accordance with local rules, regulations and practice. Therefore, no overall target asset allocation is presented. Although non-U.S. equity securities are all considered international for the Company, some equity securities are considered domestic for the local plan. The funds are invested in a variety of equities, bonds and real estate investments and, in some cases, the assets are managed by insurance companies which may offer a guaranteed rate of return. The Company has no significant concentration of risk in its international plan assets. The fair value hierarchy is used to categorize investments measured at fair value in one of three levels in the fair value hierarchy. This categorization is based on the observability of the inputs used in valuing the investments. See Note 7 for definitions of these levels.

91
The fair value of the Company’s U.S. plan assets for its defined benefit pension and postretirement health care benefit plans are as follows:
Fair Value as of Fair Value as of (millions) December 31, 2019 December 31, 2018 Level 1 Level 2 Total Level 1 Level 2 Total Cash $13.2 $- $13.2 $7.1 $- $7.1 Equity securities:
Large cap equity 785.9 - 785.9 683.5 - 683.5 Small cap equity 201.7 - 201.7 168.6 - 168.6 International equity 350.4 - 350.4 285.0 - 285.0
Fixed income: Core fixed income 410.0 - 410.0 358.3 - 358.3 High-yield bonds 107.9 - 107.9 107.6 - 107.6 Emerging markets 41.7 - 41.7 39.4 - 39.4
Insurance company accounts - 0.3 0.3 - 0.3 0.3 Total investments at fair value 1,910.8 0.3 1,911.1 1,649.5 0.3 1,649.8
Investments measured at NAV 387.9 337.6 Total $1,910.8 $0.3 $2,299.0 $1,649.5 $0.3 $1,987.4
The Company had no level 3 assets as part of its U.S. plan assets as of December 31, 2019 or 2018. The allocation of the Company’s U.S. plan assets for its defined benefit pension and postretirement health care benefit plans are as follows:
Target Asset Asset Category Allocation Percentage Percentage of Plan Assets December 31 2019 2018 2019 2018 Cash - % - % 1 % - % Equity securities:
Large cap equity 34 34 34 34 Small cap equity 9 9 8 9 International equity 15 15 15 14
Fixed income: Core fixed income 18 18 18 19 High-yield bonds 5 5 5 5 Emerging markets 2 2 2 2
Other: Real estate 6 6 7 8 Private equity 8 8 7 7 Distressed debt 3 3 3 2
Total 100 % 100 % 100 % 100 % The fair value of the Company’s international plan assets for its defined benefit pension plans are as follows:
Fair Value as of Fair Value as of (millions) December 31, 2019 December 31, 2018 Level 1 Level 2 Total Level 1 Level 2 Total Cash $7.7 $- $7.7 $7.1 $- $7.1 Equity securities:
International equity - 418.1 418.1 - 412.1 412.1 Fixed income:
Corporate bonds 8.2 207.6 215.8 7.9 162.1 170.0 Government bonds 12.6 215.8 228.4 12.3 169.2 181.5
Insurance company accounts - 144.2 144.2 - 140.5 140.5 Total investments at fair value 28.5 985.7 1,014.2 27.3 883.9 911.2
Investments measured at NAV 12.9 14.4 Total $28.5 $985.7 $1,027.1 $27.3 $883.9 $925.6
The Company had no level 3 assets as part of its international plan assets as of December 31, 2019 or 2018.

92
The allocation of plan assets of the Company’s international plan assets for its defined benefit pension plans are as follows:
Percentage Asset Category of Plan Assets December 31 2019 2018 Cash 1 % 1 % Equity securities:
International equity 41 45 Fixed income:
Corporate bonds 21 18 Government bonds 22 20
Total fixed income 43 38 Other:
Insurance contracts 14 15 Real estate 1 1
Total 100 % 100 % Cash Flows As of year-end 2019, the Company’s estimate of benefits expected to be paid in each of the next five fiscal years and in the aggregate for the five fiscal years thereafter for the Company’s pension and postretirement health care benefit plans are as follows:
(millions) All Plans 2020 $ 253 2021 232 2022 263 2023 239 2024 251 2025 - 2029 1,244 Depending on plan funding levels, the U.S. defined benefit qualified pension plan provides certain terminating participants with an option to receive their pension benefits in the form of lump sum payments. The Company is currently in compliance with all funding requirements of its U.S. pension and postretirement health care plans. In September of 2019 and 2017, the Company made voluntary contributions of $120 million and $80 million, respectively, to its non-contributory qualified U.S. pension plan. The Company is required to fund certain international pension benefit plans in accordance with local legal requirements. The Company estimates contributions to be made to its international plans will approximate $46 million in 2020. The Company seeks to maintain an asset balance that meets the long-term funding requirements identified by the projections of the pension plan’s actuaries while simultaneously satisfying the fiduciary responsibilities prescribed in ERISA. The Company also takes into consideration the tax deductibility of contributions to the benefit plans. The Company is not aware of any expected refunds of plan assets within the next twelve months from any of its existing U.S. or international pension or postretirement benefit plans. Savings Plan and ESOP The Company provides a 401(k) savings plan for the majority of its U.S. employees under the Company’s two main 401(k) savings plans, the Ecolab Savings Plan and ESOP for Traditional Benefit Employees (the “Traditional Plan”) and the Ecolab Savings Plan and ESOP (the “Ecolab Plan”). Employees under the Traditional Plan are limited to active employees accruing a final average pay or 5% cash balance benefits in the Ecolab Pension Plan. Employee before-tax contributions made under the Traditional Plan of up to 3% of eligible compensation are matched 100% by the Company and employee before-tax contributions over 3% and up to 5% of eligible compensation are matched 50% by the Company. Employees under the Ecolab Plan are limited to active employees accruing benefits under the 3% cash balance formula of the Ecolab Pension Plan and employees of Nalco eligible for certain legacy final average pay benefits. Employee before-tax contributions made under the Ecolab Plan of up to 4% of eligible compensation are matched 100% by the Company and employee before-tax contributions over 4% and up to 8% of eligible compensation are matched 50% by the Company. The Company’s matching contributions are 100% vested immediately. The Company’s matching contribution expense was $87 million, $83 million and $82 million in 2019, 2018 and 2017, respectively.

93
17. REVENUES Revenue Recognition Product and Sold Equipment Product revenue is generated from cleaning, sanitizing, water, energy and colloidal silica products sold to customers in the Global Industrial, Global Institutional, Global Energy segments and Other. In addition, the Company sells equipment which may be used in combination with its specialized products. Revenue recognized from product and sold equipment is recognized at the point in time when the obligations in the contract with the customer are satisfied, which generally occurs with the transfer of the product or delivery of the equipment. Service and Lease Equipment Service and lease equipment revenue is generated from providing services or leasing equipment to customers. Service offerings include installing or repairing certain types of equipment, activities that supplement or replace headcount at the customer location, or fulfilling deliverables included in the contract. Services provided in Other primary includes services designed to detect, eliminate and prevent pests. Global Energy services include process and water treatment offerings to the global petroleum and petrochemical industries, while services in the Global Industrial segment are associated with water treatment and paper process applications. Global Institutional services include water treatment programs and process applications, and wash process solutions. Revenue recognized from leased equipment primarily relates to warewashing and water treatment equipment. Service revenue is recognized over time utilizing an input method and aligns with when the services are provided. Typically, revenue is recognized over time using costs incurred to date because the effort provided by the field selling and service organization represents services provided, which corresponds with the transfer of control. Revenue for leased equipment is accounted for under Topic 842 Leases and recognized on a straight-line basis over the length of the lease contract. Refer to Note 13 for additional information related to lease equipment. Practical Expedients and Exemptions The revenue standard can be applied to a portfolio of contracts with similar characteristics if it is reasonable that the effects of applying the standard at the portfolio would not be significantly different than applying the standard at the individual contract level. The Company applies the portfolio approach primarily within each operating segment by geographical region. Application of the portfolio approach was focused on those characteristics that have the most significant accounting consequences in terms of their effect on the timing of revenue recognition or the amount of revenue recognized. The Company determined the key criteria to assess with respect to the portfolio approach, including the related deliverables, the characteristics of the customers and the timing and transfer of goods and services, which most closely aligned within the operating segments. In addition, the accountability for the business operations, as well as the operational decisions on how to go to market and the product offerings, are performed at the operating segment level. The following table shows principal activities, separated by reportable segments, from which the Company generates its revenue. For more information about the Company’s reportable segments, refer to Note 18. Net sales at public exchange rates by reportable segment are as follows:
(millions) 2019 2018 2017 Global Industrial
Product and sold equipment $4,819.1 $4,626.2 $4,305.3 Service and lease equipment 681.6 660.3 612.7
Global Institutional Product and sold equipment 4,433.5 4,415.4 4,136.2 Service and lease equipment 753.5 683.1 640.0
Global Energy Product and sold equipment 2,898.7 3,004.4 2,837.5 Service and lease equipment 419.0 416.7 392.5
Other Product and sold equipment 87.6 82.6 152.8 Service and lease equipment 813.3 779.5 758.9
Total Total product and sold equipment $12,238.9 $12,128.6 $11,431.8 Total service and lease equipment 2,667.4 2,539.6 2,404.1
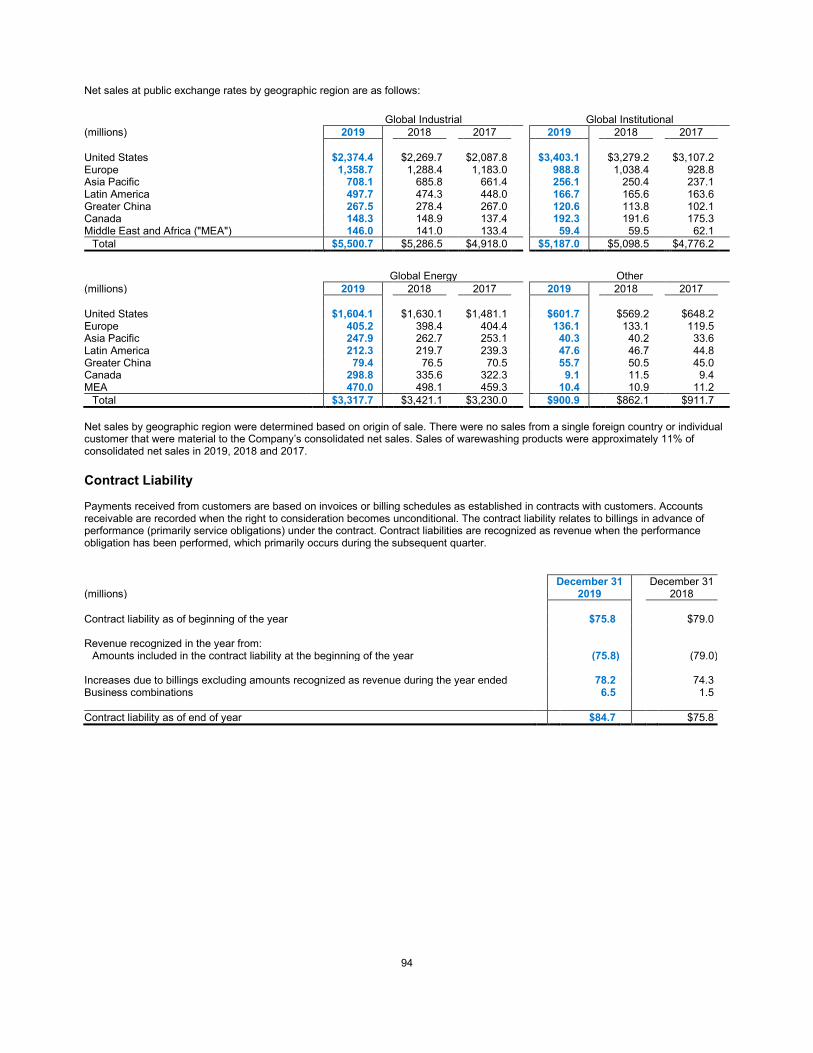
94
Net sales at public exchange rates by geographic region are as follows:
Global Industrial Global Institutional (millions) 2019 2018 2017 2019 2018 2017 United States $2,374.4 $2,269.7 $2,087.8 $3,403.1 $3,279.2 $3,107.2 Europe 1,358.7 1,288.4 1,183.0 988.8 1,038.4 928.8 Asia Pacific 708.1 685.8 661.4 256.1 250.4 237.1 Latin America 497.7 474.3 448.0 166.7 165.6 163.6 Greater China 267.5 278.4 267.0 120.6 113.8 102.1 Canada 148.3 148.9 137.4 192.3 191.6 175.3 Middle East and Africa ("MEA") 146.0 141.0 133.4 59.4 59.5 62.1
Total $5,500.7 $5,286.5 $4,918.0 $5,187.0 $5,098.5 $4,776.2
Global Energy Other (millions) 2019 2018 2017 2019 2018 2017 United States $1,604.1 $1,630.1 $1,481.1 $601.7 $569.2 $648.2 Europe 405.2 398.4 404.4 136.1 133.1 119.5 Asia Pacific 247.9 262.7 253.1 40.3 40.2 33.6 Latin America 212.3 219.7 239.3 47.6 46.7 44.8 Greater China 79.4 76.5 70.5 55.7 50.5 45.0 Canada 298.8 335.6 322.3 9.1 11.5 9.4 MEA 470.0 498.1 459.3 10.4 10.9 11.2
Total $3,317.7 $3,421.1 $3,230.0 $900.9 $862.1 $911.7 Net sales by geographic region were determined based on origin of sale. There were no sales from a single foreign country or individual customer that were material to the Company’s consolidated net sales. Sales of warewashing products were approximately 11% of consolidated net sales in 2019, 2018 and 2017. Contract Liability Payments received from customers are based on invoices or billing schedules as established in contracts with customers. Accounts receivable are recorded when the right to consideration becomes unconditional. The contract liability relates to billings in advance of performance (primarily service obligations) under the contract. Contract liabilities are recognized as revenue when the performance obligation has been performed, which primarily occurs during the subsequent quarter.
December 31 December 31 (millions) 2019 2018 Contract liability as of beginning of the year $75.8 $79.0 Revenue recognized in the year from:
Amounts included in the contract liability at the beginning of the year (75.8) (79.0)
Increases due to billings excluding amounts recognized as revenue during the year ended 78.2 74.3 Business combinations 6.5 1.5
Contract liability as of end of year $84.7 $75.8

95
18. OPERATING SEGMENTS AND GEOGRAPHIC INFORMATION The Company’s organizational structure consists of global business unit and global regional leadership teams. The Company’s eleven operating segments follow its commercial and product-based activities and are based on engagement in business activities, availability of discrete financial information and review of operating results by the Chief Operating Decision Maker at the identified operating segment level. Nine of the Company’s eleven operating segments have been aggregated into three reportable segments based on similar economic characteristics and future prospects, nature of the products and production processes, end-use markets, channels of distribution and regulatory environment. The Company’s reportable segments are Global Industrial, Global Institutional and Global Energy. Operating segments that do not meet the quantitative criteria to be separately reported have been combined into Other. The Company provides similar information for Other as compared to its three reportable segments as the Company considers the information regarding its two underlying operating segments as useful in understanding its consolidated results. The Company’s eleven operating segments are aggregated as follows: Global Industrial Includes the Water, Food & Beverage, Paper, Life Sciences and Textile Care operating segments. It provides water treatment and process applications, and cleaning and sanitizing solutions primarily to large industrial customers within the manufacturing, food and beverage processing, chemical, mining and primary metals, power generation, pulp and paper, and commercial laundry industries. The underlying operating segments exhibit similar manufacturing processes, distribution methods and economic characteristics. Global Institutional Includes the Institutional, Specialty and Healthcare operating segments. It provides specialized cleaning and sanitizing products to the foodservice, hospitality, lodging, healthcare, government and education and retail industries. The underlying operating segments exhibit similar manufacturing processes, distribution methods and economic characteristics. Global Energy Includes the Energy operating segment. It serves the process chemicals and water treatment needs of the global petroleum and petrochemical industries in both upstream and downstream applications. Other Includes the Pest Elimination operating segment which provides services to detect, eliminate and prevent pests, such as rodents and insects and the CTG operating segment which produces and sells colloidal silica, which is comprised of nano-sized particles of silica in water used primarily for binding and polishing applications. Corporate Consistent with the Company’s internal management reporting, Corporate amounts in the table above include intangible asset amortization specifically from the Nalco merger and special (gains) and charges, as discussed in Note 3, that are not allocated to the Company’s reportable segments. Comparability of Reportable Segments The Company evaluates the performance of its non-U.S. dollar functional currency international operations based on fixed currency exchange rates, which eliminate the impact of exchange rate fluctuations on its international operations. Fixed currency amounts are updated annually at the beginning of each year based on translation into U.S. dollars at foreign currency exchange rates established by management, with all periods presented using such rates. The “Fixed Currency Rate Change” column shown in the following table reflects the impact on previously reported values related to fixed currency exchange rates established by management at the beginning of 2019. The “Other” column in the table reflects immaterial changes between segments, primarily cost allocations. Further information related to the Company’s special (gains) and charges is included in Note 3.
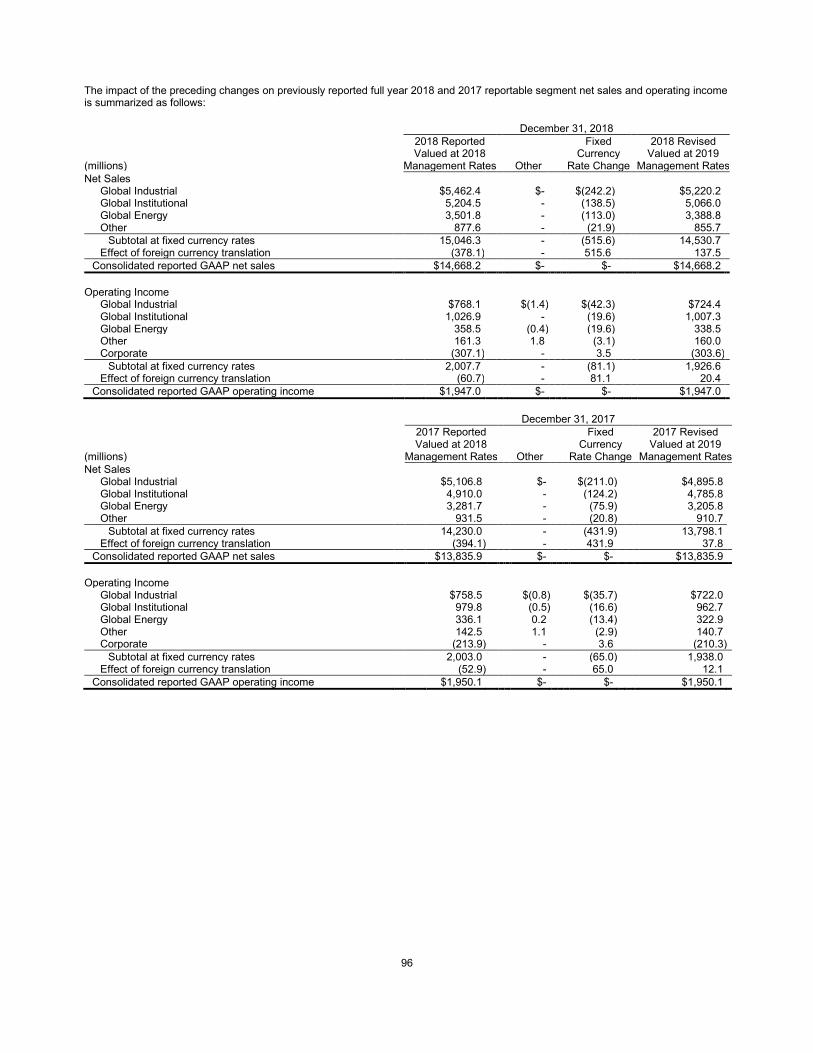
96
The impact of the preceding changes on previously reported full year 2018 and 2017 reportable segment net sales and operating income is summarized as follows:
December 31, 2018 2018 Reported Fixed 2018 Revised Valued at 2018 Currency Valued at 2019 (millions) Management Rates Other Rate Change Management Rates Net Sales
Global Industrial $5,462.4 $- $(242.2) $5,220.2 Global Institutional 5,204.5 - (138.5) 5,066.0 Global Energy 3,501.8 - (113.0) 3,388.8 Other 877.6 - (21.9) 855.7
Subtotal at fixed currency rates 15,046.3 - (515.6) 14,530.7 Effect of foreign currency translation (378.1) - 515.6 137.5
Consolidated reported GAAP net sales $14,668.2 $- $- $14,668.2 Operating Income
Global Industrial $768.1 $(1.4) $(42.3) $724.4 Global Institutional 1,026.9 - (19.6) 1,007.3 Global Energy 358.5 (0.4) (19.6) 338.5 Other 161.3 1.8 (3.1) 160.0 Corporate (307.1) - 3.5 (303.6)
Subtotal at fixed currency rates 2,007.7 - (81.1) 1,926.6 Effect of foreign currency translation (60.7) - 81.1 20.4
Consolidated reported GAAP operating income $1,947.0 $- $- $1,947.0
December 31, 2017 2017 Reported Fixed 2017 Revised Valued at 2018 Currency Valued at 2019 (millions) Management Rates Other Rate Change Management Rates Net Sales
Global Industrial $5,106.8 $- $(211.0) $4,895.8 Global Institutional 4,910.0 - (124.2) 4,785.8 Global Energy 3,281.7 - (75.9) 3,205.8 Other 931.5 - (20.8) 910.7
Subtotal at fixed currency rates 14,230.0 - (431.9) 13,798.1 Effect of foreign currency translation (394.1) - 431.9 37.8
Consolidated reported GAAP net sales $13,835.9 $- $- $13,835.9 Operating Income
Global Industrial $758.5 $(0.8) $(35.7) $722.0 Global Institutional 979.8 (0.5) (16.6) 962.7 Global Energy 336.1 0.2 (13.4) 322.9 Other 142.5 1.1 (2.9) 140.7 Corporate (213.9) - 3.6 (210.3)
Subtotal at fixed currency rates 2,003.0 - (65.0) 1,938.0 Effect of foreign currency translation (52.9) - 65.0 12.1
Consolidated reported GAAP operating income $1,950.1 $- $- $1,950.1

97
Reportable Segment Information Financial information for each of the Company’s reportable segments is as follows:
Net Sales Operating Income (Loss) (millions) 2019 2018 2017 2019 2018 2017 Global Industrial $5,569.9 $5,220.2 $4,895.8 $854.7 $724.4 $722.0 Global Institutional 5,235.5 5,066.0 4,785.8 1,042.2 1,007.3 962.7 Global Energy 3,334.0 3,388.8 3,205.8 379.1 338.5 322.9 Other 907.5 855.7 910.7 167.3 160.0 140.7 Corporate - - - (409.1) (303.6) (210.3)
Subtotal at fixed currency 15,046.9 14,530.7 13,798.1 2,034.2 1,926.6 1,938.0 Effect of foreign currency translation (140.6) 137.5 37.8 (20.4) 20.4 12.1
Consolidated $14,906.3 $14,668.2 $13,835.9 $2,013.8 $1,947.0 $1,950.1
The profitability of the Company’s operating segments is evaluated by management based on operating income. The Company has an integrated supply chain function that serves all of its reportable segments. As such, asset and capital expenditure information by reportable segment has not been provided and is not available, since the Company does not produce or utilize such information internally. In addition, although depreciation and amortization expense is a component of each reportable segment’s operating results, it is not discretely identifiable. Geographic Information Long-lived assets at public exchange rates by geographic region are as follows:
Long-Lived Assets, net (millions) 2019 2018 United States $9,223.6 $9,175.4 Europe 2,641.6 2,538.7 Asia Pacific, excluding Greater China 1,015.1 1,003.4 Latin America 522.4 565.8 MEA 299.2 302.1 Canada 598.1 616.8 Greater China 1,163.1 1,194.6
Total $15,463.1 $15,396.8 Geographic data for long-lived assets is based on physical location of those assets. Refer to Note 17 for net sales by geographic region.

98
19. QUARTERLY FINANCIAL DATA (UNAUDITED)
First Second Third Fourth (millions, except per share) Quarter Quarter Quarter Quarter Year 2019 Net sales $3,505.4 $3,759.4 $3,817.9 $3,823.6 $14,906.3 Operating expenses
Cost of sales (a) 2,089.6 2,208.2 2,207.4 2,218.2 8,723.4 Selling, general and administrative expenses 1,008.3 1,002.7 962.5 984.0 3,957.5 Special (gains) and charges 40.3 49.9 60.4 61.0 211.6
Operating income 367.2 498.6 587.6 560.4 2,013.8 Other (income) expense (a) (21.2) (20.9) (20.8) (13.4) (76.3) Interest expense, net (a) 49.4 49.5 46.1 46.2 191.2 Income before income taxes 339.0 470.0 562.3 527.6 1,898.9 Provision for income taxes 38.6 97.8 93.0 93.3 322.7 Net income including noncontrolling interest 300.4 372.2 469.3 434.3 1,576.2 Net income attributable to noncontrolling interest 3.9 3.6 5.1 4.7 17.3 Net income attributable to Ecolab $296.5 $368.6 $464.2 $429.6 $1,558.9 Earnings attributable to Ecolab per common share
Basic $ 1.03 $ 1.28 $ 1.61 $ 1.49 $ 5.41 Diluted $ 1.01 $ 1.26 $ 1.59 $ 1.47 $ 5.33
Weighted-average common shares outstanding Basic 288.2 287.6 288.1 288.3 288.1 Diluted 292.3 292.1 292.8 292.6 292.5
2018 Net sales $3,470.9 $3,689.6 $3,747.2 $3,760.5 $14,668.2 Operating expenses
Cost of sales (a) 2,072.3 2,146.1 2,190.7 2,216.8 8,625.9 Selling, general and administrative expenses 1,018.3 1,036.8 964.7 948.8 3,968.6 Special (gains) and charges 26.0 12.1 75.6 13.0 126.7
Operating income 354.3 494.6 516.2 581.9 1,947.0 Other (income) expense (19.4) (19.6) (21.0) (19.9) (79.9) Interest expense, net (a) 56.4 56.3 55.7 53.9 222.3 Income before income taxes 317.3 457.9 481.5 547.9 1,804.6 Provision for income taxes 69.1 104.3 43.2 147.7 364.3 Net income including noncontrolling interest 248.2 353.6 438.3 400.2 1,440.3 Net income attributable to noncontrolling interest 0.9 2.3 2.9 5.1 11.2 Net income attributable to Ecolab $247.3 $351.3 $435.4 $395.1 $1,429.1 Earnings attributable to Ecolab per common share
Basic $ 0.86 $ 1.22 $ 1.51 $ 1.37 $ 4.95 Diluted $ 0.84 $ 1.20 $ 1.48 $ 1.35 $ 4.88
Weighted-average common shares outstanding Basic 288.6 288.8 288.8 288.0 288.6 Diluted 292.7 293.3 293.4 292.2 292.8
Per share amounts do not necessarily sum due to changes in the calculation of shares outstanding for each discrete period and rounding. Gross profit is calculated as net sales minus cost of sales. The Company has conformed the first quarter of 2019 with current accounting policies. There was no impact to net sales or operating income.
(a) Cost of sales includes special charges of $3.6, $7.9, $11.3 and $15.7 million in Q1, Q2, Q3 and Q4 of 2019, respectively and $(0.1), $3.6, and $5.8 million in Q2, Q3 and Q4 of 2018, respectively. Other (income) expense includes special charges of $9.5 million in Q4 of 2019. Net interest expense includes special charges of $0.2 million in Q1 of 2019 and $0.3 million in Q4 of 2018.

99
Item 9. Changes in and Disagreements with Accountants on Accounting and Financial Disclosure. None. Item 9A. Controls and Procedures. Disclosure Controls and Procedures As of December 31, 2019, we carried out an evaluation, under the supervision and with the participation of our management, including our Chairman of the Board and Chief Executive Officer and our Chief Financial Officer, of the effectiveness of the design and operation of our disclosure controls and procedures (as such term is defined in Rule 13a-15(e) under the Securities Exchange Act of 1934 as amended). Based upon that evaluation, our Chairman of the Board and Chief Executive Officer and our Chief Financial Officer concluded that our disclosure controls and procedures are effective. Internal Control Over Financial Reporting Our management is responsible for establishing and maintaining adequate internal control over financial reporting. Under the supervision and with the participation of our management, including our Chairman of the Board and Chief Executive Officer and our Chief Financial Officer, we conducted an evaluation of the effectiveness of our internal control over financial reporting based on the 2013 framework in Internal Control – Integrated Framework issued by the Committee of Sponsoring Organizations of the Treadway Commission. Based on our evaluation under this framework, our management concluded that our internal control over financial reporting was effective as of December 31, 2019. The Company’s independent registered public accounting firm, PricewaterhouseCoopers LLP, has audited the effectiveness of the Company’s internal control over financial reporting as of December 31, 2019. Their report, and our management reports, can be found in Item 8 of Part II of this Form 10-K. During the period October 1 - December 31, 2019 there were no changes in our internal control over financial reporting that have materially affected, or are reasonably likely to materially affect, our internal control over financial reporting. We are continuing our implementation of our enterprise resource planning (“ERP”) system upgrades, which are expected to occur in phases over the next several years. These upgrades, which include supply chain and certain finance functions, are expected to improve the efficiency of certain financial and related transactional processes. We are also making changes to our system in order to support our separation of the ChampionX business. These upgrades of the ERP systems will affect the processes that constitute our internal control over financial reporting and will require testing for effectiveness. Item 9B. Other Information. None.

100
PART III Item 10. Directors, Executive Officers and Corporate Governance. Information about our directors is incorporated by reference from the discussion under the heading “Proposal 1: Election of Directors” located in the Proxy Statement. Information about compliance with Section 16(a) of the Securities Exchange Act of 1934, as amended, is incorporated by reference from the discussion under the heading “Delinquent Section 16(a) Reports” located in the Proxy Statement. Information about our Audit Committee, including the members of the Committee, and our Audit Committee financial experts, is incorporated by reference from the discussion under the heading “Corporate Governance,” and sub-headings “Board Committees” and “Audit Committee,” located in the Proxy Statement. Information about our Code of Conduct is incorporated by reference from the discussion under the heading “Corporate Governance Materials and Code of Conduct” located in the Proxy Statement. Information regarding our executive officers is presented under the heading “Information about our Executive Officers” in Part I, Item 1 of this Form 10-K, and is incorporated herein by reference. Item 11. Executive Compensation. Information appearing under the following headings of the Proxy Statement is incorporated herein by reference:
• Director Compensation for 2019 • Compensation Risk Analysis • Compensation Committee Interlocks and Insider Participation • Compensation Committee Report • Compensation Discussion and Analysis • Summary Compensation Table for 2019 • Grants of Plan-Based Awards for 2019 • Outstanding Equity Awards at Fiscal Year-End for 2019 • Option Exercises and Stock Vested for 2019 • Pension Benefits for 2019 • Non-Qualified Deferred Compensation for 2019 • Potential Payments Upon Termination or Change in Control • Pay Ratio Disclosure

101
Item 12. Security Ownership of Certain Beneficial Owners and Management and Related Stockholder Matters. Information appearing under the heading entitled “Security Ownership” located in the Proxy Statement is incorporated herein by reference. A total of 1,345,984 shares of Common Stock held by our directors and executive officers, some of whom may be deemed to be “affiliates” of the Company, have been excluded from the computation of market value of our Common Stock on the cover page of this Form 10-K. This total represents that portion of the shares reported as beneficially owned by our directors and executive officers as of June 30, 2019 which are actually issued and outstanding. Equity Compensation Plan Information
(a) Number of securities to be (b) (c) issued upon exercise of Weighted average exercise Number of securities remaining outstanding options, price of outstanding options, available for future issuance under warrants warrants equity compensation plans (excluding Plan Category and rights and rights securities reflected in column (a)) Equity compensation plans approved
by security holders 10,597,473 (1) $ 122.19 (1) 9,029,645 Equity compensation plans not approved
by security holders 63,187 (2) 55.59 (2) - Total 10,660,660 $ 121.72 9,029,645
(1) Includes 235,929 Common Stock equivalents representing deferred compensation stock units earned by non-employee directors
under our 2001 Non-Employee Director Stock Option and Deferred Compensation Plan, 1,116,898 Common Stock equivalents under our 2010 Stock Incentive Plan representing performance-based restricted stock units payable to employees, and 265,513 Common Stock equivalents under our 2010 Stock Incentive Plan representing restricted stock units payable to employees. All of the Common Stock equivalents described in this footnote (1) are not included in the calculation of weighted average exercise price of outstanding options, warrants and rights in column (b) of this table. The reported amount additionally includes 22,479 shares of Common Stock subject to stock options assumed by us in connection with the Nalco merger. Such options, which have a weighted-average exercise price of $37.34, are included in the calculation of weighted average exercise price of outstanding options, warrants and rights in column (b) of this table.
(2) The reported amount represents shares of our Common Stock which were formerly reserved for future issuance under the
Amended and Restated Nalco Holding Company 2004 Stock Incentive Plan (the “rollover shares”) and granted to legacy Nalco associates on December 1, 2011, under the Ecolab Inc. 2010 Stock Incentive Plan in the form of stock options. These rollover shares are deemed exempt from shareholder approval under Rule 303A.08 of the New York Stock Exchange in accordance with our notice to the New York Stock Exchange dated December 16, 2011. The Nalco plan was amended to prohibit future grants.
Item 13. Certain Relationships and Related Transactions, and Director Independence. Information appearing under the headings entitled “Director Independence Standards and Determinations” and “Related Person Transactions” located in the Proxy Statement is incorporated herein by reference. Item 14. Principal Accounting Fees and Services. Information appearing under the heading entitled “Audit Fees” located in the Proxy Statement is incorporated herein by reference.

102
PART IV
Item 15. Exhibits, Financial Statement Schedules.
The following information required under this item is filed as part of this report:
(a)(1) Financial Statements.
Document: Page:
(i) Report of Independent Registered Public Accounting Firm. 50
(ii) Consolidated Statements of Income for the years ended December 31, 2019, 2018 and 2017.
52
(iii) Consolidated Statements of Comprehensive Income for the years ended December 31, 2019, 2018 and 2017.
53
(iv) Consolidated Balance Sheets at December 31, 2019 and 2018. 54
(v) Consolidated Statements of Cash Flows for the years ended December 31, 2019, 2018 and 2017.
55
(vi) Consolidated Statements of Equity for the years ended December 31, 2019, 2018 and 2017.
56
(vii) Notes to Consolidated Financial Statements. 57
Exhibit No.: Document: Method of Filing:
(a)(2) Financial Statement Schedules. All financial statement schedules are omitted because they are not applicable or the required information is shown in
the consolidated financial statements or the accompanying notes to the consolidated financial statements. The separate financial statements and summarized financial information of subsidiaries not consolidated and of fifty percent or less owned persons have been omitted because they do not satisfy the requirements for inclusion in this Form 10-K.
(a)(3) The documents below are filed as exhibits to this Report. We will, upon request and payment of a fee not exceeding the
rate at which copies are available from the Securities and Exchange Commission, furnish copies of any of the following exhibits to stockholders.
(2.1) Agreement and Plan of Merger and Reorganization, dated
December 18, 2019, by and among Ecolab Inc., ChampionX Holding Inc., Apergy Corporation and Athena Merger Sub, Inc.
Incorporated by reference to Exhibit (2.1) of our Form 8-K, dated December 18, 2019. (File No. 001-9328)
(2.2) Separation and Distribution Agreement, dated December 18,
2019, by and among Ecolab Inc., ChampionX Holding Inc. and Apergy Corporation
Incorporated by reference to Exhibit (2.1) of our Form 8-K, dated December 18, 2019. (File No. 001-9328)
(3.1) Restated Certificate of Incorporation of Ecolab Inc., dated
January 2, 2013. Incorporated by reference to Exhibit (3.2) of our
Form 8-K, dated January 2, 2013. (File No. 001-9328) (3.2) By-Laws, as amended through December 3, 2015. Incorporated by reference to Exhibit (3.1) of our
Form 8-K, dated December 3, 2015. (File No. 001-9328)
(4.1) Common Stock. See Exhibits (3.1) and (3.2) (4.2) Form of Common Stock Certificate effective October 2, 2017 Incorporated by reference to Exhibit (4.1) of our
Form 10-Q Quarterly Report for the quarter ended September 30, 2017. (File No. 001-9328)

103
Exhibit No.: Document: Method of Filing:
(4.3) Amended and Restated Indenture, dated January 9, 2001,
between Ecolab Inc. and The Bank of New York Trust Company, N.A. (as successor in interest to J.P. Morgan Trust Company, N.A. and Bank One, N.A.), as Trustee.
Incorporated by reference to Exhibit (4)(A) of our Form 8-K, dated January 23, 2001. (File No. 001-9328)
(4.4) Second Supplemental Indenture, dated December 8, 2011,
between Ecolab Inc., Wells Fargo Bank, National Association, as Trustee and the Bank of New York Mellon Trust Company, N.A. (formerly known as The Bank of New York Trust Company, N.A., as successor in interest to J.P. Morgan Trust Company, N.A. and Bank One, N.A.), as original trustee.
Incorporated by reference to Exhibit (4.2) of our Form 8-K, dated December 5, 2011. (File No. 001-9328)
(4.5) Forms of 4.350% Notes due 2021 and 5.500% Notes due
2041. Included in Exhibit (4.4) above.
(4.6) Indenture, dated January 12, 2015, between Ecolab Inc. and
Wells Fargo Bank, National Association, as Trustee. Incorporated by reference to Exhibit 4.1 of our
Form 8-K, dated January 15, 2015. (File No. 001-9328)
(4.7) Second Supplemental Indenture, dated July 8, 2015, by and
among Ecolab Inc., Wells Fargo Bank, National Association, as Trustee, Elavon Financial Services Limited, UK Branch, as paying agent, and Elavon Financial Services Limited, as transfer agent and registrar.
Incorporated by reference to Exhibit (4.2) of our Form 8-K, dated July 8, 2015. (File No. 001-9328)
(4.8) Form of 2.625% Euro Notes due 2025. Included in Exhibit (4.7) above. (4.9) Third Supplemental Indenture, dated January 14, 2016,
between Ecolab Inc. and Wells Fargo Bank, National Association, as Trustee.
Incorporated by reference to Exhibit (4.2) of our Form 8-K, dated January 11, 2016. (File No. 001-9328)
(4.10) Form of 3.250% Notes due 2023. Included in Exhibit (4.9) above. (4.11) Fourth Supplemental Indenture, dated October 18, 2016,
between Ecolab Inc. and Wells Fargo Bank, National Association, as Trustee.
Incorporated by reference to Exhibit (4.2) of our Form 8-K, dated October 13, 2016. (File No. 001-9328)
(4.12) Forms of 2.700% Notes due 2026 and 3.700% Notes due
2046. Included in Exhibit (4.11) above.
(4.13) Fifth Supplemental Indenture, dated December 8, 2016, by
and among Ecolab Inc., Wells Fargo Bank, National Association, as Trustee, Elavon Financial Services DAC, UK Branch, as paying agent, and Elavon Financial Services DAC, as transfer agent and registrar.
Incorporated by reference to Exhibit (4.2) of our Form 8-K, dated December 1, 2016. (File No. 001-9328)
(4.14) Form of 1.000% Euro Notes due 2024. Included in Exhibit (4.13) above. (4.15) Sixth Supplemental Indenture, dated August 10, 2017,
between Ecolab Inc. and Wells Fargo Bank, National Association, as Trustee.
Incorporated by reference to Exhibit (4.2) of our Form 8-K, dated August 10, 2017. (File No. 001-9328)
(4.16) Form of 2.375% Notes due 2022. Included in Exhibit (4.15) above. (4.17) Seventh Supplemental Indenture, dated November 27, 2017,
between Ecolab Inc. and Wells Fargo Bank, National Association, as Trustee.
Incorporated by reference to Exhibit (4.2) of our Form 8-K, dated November 30, 2017. (File No. 001-9328)
(4.18) Form of 3.250% Notes due 2027. Included in Exhibit (4.17) above. (4.19) Form of 3.950% Notes due 2047. Included in Exhibit (4.17) above. (4.20) Description of Securities Filed herewith electronically.

104
Exhibit No.: Document: Method of Filing:
Copies of other constituent instruments defining the rights of holders of our long-term debt are not filed herewith,
pursuant to Section (b)(4)(iii) of Item 601 of Regulation S-K, because the aggregate amount of securities authorized under each of such instruments is less than 10% of our total assets on a consolidated basis. We will, upon request by the Securities and Exchange Commission, furnish to the Commission a copy of each such instrument.
(10.1)(i) Second Amended and Restated $2.0 billion 5-Year
Revolving Credit Facility, dated November 28, 2017, among Ecolab Inc., the lenders party thereto, the issuing banks party thereto, Bank of America, N.A., as administrative agent and swing line bank, and Citibank, N.A., JPMorgan Chase Bank, N.A. and The Bank of Tokyo-Mitsubishi UFJ, Ltd., as co-syndication agents.
Incorporated by reference to Exhibit (10.1) of our Form 8-K, dated November 30, 2017. (File No. 001-9328)
(10.2) Note Purchase Agreement, dated October 27, 2011, by and
among Ecolab Inc. and the Purchasers party thereto. Incorporated by reference to Exhibit (10.1) of our
Form 8-K, dated October 27, 2011. (File No. 001-9328)
(10.3) Documents comprising global Commercial Paper Programs. (i) U.S. $2,000,000,000 Euro-Commercial Paper Programme. (a) Amended and Restated Dealer Agreement,
dated 9 June 2017, between Ecolab Inc., Ecolab Lux 1 S.À R.L., Ecolab Lux 2 S.À R.L., Ecolab NL 10 B.V. and Ecolab NL 11 B.V. (as Issuers), Ecolab Inc. (as Guarantor in respect of the notes issued by Ecolab Lux 1 S.À R.L., Ecolab Lux 2 S.À R.L., Ecolab NL 10 B.V. and Ecolab NL 11 B.V.), Credit Suisse Securities (Europe) Limited (as Arranger), and Citibank Europe plc, UK Branch and Credit Suisse Securities (Europe) Limited (as Dealers).
Incorporated by reference to Exhibit (10.1)(a) of our Form 10-Q for the quarter ended June 30, 2017. (File No. 001-9328)
(b) Amended and Restated Note Agency
Agreement, dated 9 June 2017, between Ecolab Inc., Ecolab Lux 1 S.À R.L., Ecolab Lux 2 S.À R.L., Ecolab NL 10 B.V. Ecolab NL 11 B.V. (as Issuers), Ecolab Inc. (as Guarantor in respect of the notes issued by Ecolab Lux 1 S.À R.L., Ecolab Lux 2 S.À R.L., Ecolab NL 10 B.V. and Ecolab NL 11 B.V.), and Citibank, N.A., London Branch (as Issue and Paying Agent).
Incorporated by reference to Exhibit (10.1)(b) of our Form 10-Q for the quarter ended June 30, 2017. (File No. 001-9328)
(c) Deed of Covenant made on 9 June 2017 by
Ecolab Inc., Ecolab Lux 1 S.À R.L., Ecolab Lux 2 S.À R.L., Ecolab NL 10 B.V. and Ecolab NL 11 B.V. (as Issuers)
Incorporated by reference to Exhibit (10.1)(c) of our Form 10-Q for the quarter ended June 30, 2017. (File No. 001-9328)
(d) Deed of Guarantee made on 9 June 2017 by
Ecolab Inc. (in respect of notes issued by Ecolab Lux 1 S.À R.L., Ecolab Lux 2 S.À R.L., Ecolab NL 10 B.V. and Ecolab NL 11 B.V.)
Incorporated by reference to Exhibit (10.1)(d) of our Form 10-Q for the quarter ended June 30, 2017. (File No. 001-9328)
(ii) U.S. $2,000,000,000 U.S. Commercial Paper Program. (a) Form of Commercial Paper Dealer Agreement
for 4(a)(2) Program, dated September 22, 2014. The dealers for the program are Barclays Capital Inc., Citigroup Global Markets Inc., Credit Suisse Securities (USA) LLC, BofA Securities, Inc., Mizuho Securities USA LLC, and Wells Fargo Securities, LLC.
Incorporated by reference to Exhibit (10.1)(a) of our Form 10-Q for the quarter ended September 30, 2014. (File No. 001-9328)

105
Exhibit No.: Document: Method of Filing:
(b) Issuing and Paying Agency Agreement, dated
September 18, 2017, between Ecolab Inc. and MUFG Union Bank, N.A., as Issuing and Paying Agent.
Incorporated by reference to Exhibit (10.1)(a) of our Form 10-Q for the quarter ended September 30, 2017. (File No. 001-9328)
(c) Corporate Commercial Paper – Master Note,
dated September 18, 2017, together with annex thereto.
Incorporated by reference to Exhibit (10.1)(b) of our Form 10-Q for the quarter ended September 30, 2017. (File No. 001-9328)
(10.4) † (i) Ecolab Inc. 2001 Non-Employee Director Stock
Option and Deferred Compensation Plan, as amended and restated, effective as of August 1, 2013.
Incorporated by reference to Exhibit (10.6) of our Form 10-K Annual Report for the year ended December 31, 2013. (File No. 001-9328)
† (ii) Declaration of Amendment, dated May 5, 2016, to
Ecolab Inc. 2001 Non-Employee Director Stock Option and Deferred Compensation Plan, as amended and restated, effective as of August 1, 2013.
Incorporated by reference to Exhibit (10.1) of our Form 10-Q for the quarter ended June 30, 2016. (File No. 001-9328)
† (iii) Master Agreement Relating to Periodic Options, as
amended, effective as of May 1, 2004. Incorporated by reference to Exhibit (10)D(ii) of our
Form 10-Q for the quarter ended June 30, 2004. (File No. 001-9328)
† (iv) Amendment No. 1 to Master Agreement Relating to
Periodic Options, as amended, effective as of May 2, 2008.
Incorporated by reference to Exhibit (10)B of our Form 10-Q for the quarter ended September 30, 2008. (File No. 001-9328)
(10.5) (i) Note Purchase Agreement, dated July 26, 2006, by
and among Ecolab Inc. and the Purchasers party thereto.
Incorporated by reference to Exhibit (10) of our Form 8-K, dated July 26, 2006. (File No. 001-9328)
(ii) First Amendment, dated October 27, 2011, to Note
Purchase Agreement, dated July 26, 2006, by and among Ecolab Inc. and the Noteholders party thereto.
Incorporated by reference to Exhibit (10.2) of our Form 8-K, dated October 27, 2011. (File No. 001-9328)
(10.6) † Form of Director Indemnification Agreement. Substantially
identical agreements are in effect as to each of our directors. Incorporated by reference to Exhibit (10)I of our
Form 10-K Annual Report for the year ended December 31, 2003. (File No. 001-9328)
(10.7) † (i) Ecolab Executive Death Benefits Plan, as
amended and restated, effective as of March 1, 1994.
Incorporated by reference to Exhibit (10)H(i) of our Form 10-K Annual Report for the year ended December 31, 2006. See also Exhibit (10.12) hereof. (File No. 001-9328)
† (ii) Amendment No. 1 to Ecolab Executive Death
Benefits Plan, effective as of July 1, 1997. Incorporated by reference to Exhibit (10)H(ii) of our
Form 10-K Annual Report for the year ended December 31, 1998. (File No. 001-9328)
† (iii) Second Declaration of Amendment to Ecolab
Executive Death Benefits Plan, effective as of March 1, 1998.
Incorporated by reference to Exhibit (10)H(iii) of our Form 10-K Annual Report for the year ended December 31, 1998. (File No. 001-9328)
† (iv) Amendment No. 3 to the Ecolab Executive Death
Benefits Plan, effective as of August 12, 2005. Incorporated by reference to Exhibit (10)B of our
Form 8-K, dated December 13, 2005. (File No. 001-9328)
† (v) Amendment No. 4 to the Ecolab Executive Death
Benefits Plan, effective as of January 1, 2005. Incorporated by reference to Exhibit (10)H(v) of our
Form 10-K Annual Report for the year ended December 31, 2009. (File No. 001-9328)
† (vi) Amendment No. 5 to the Ecolab Executive Death
Benefits Plan, effective as of May 6, 2015. Incorporated by reference to Exhibit 10.2 of our
Form 10-Q for the quarter ended June 30, 2015. (File No. 001-9328)
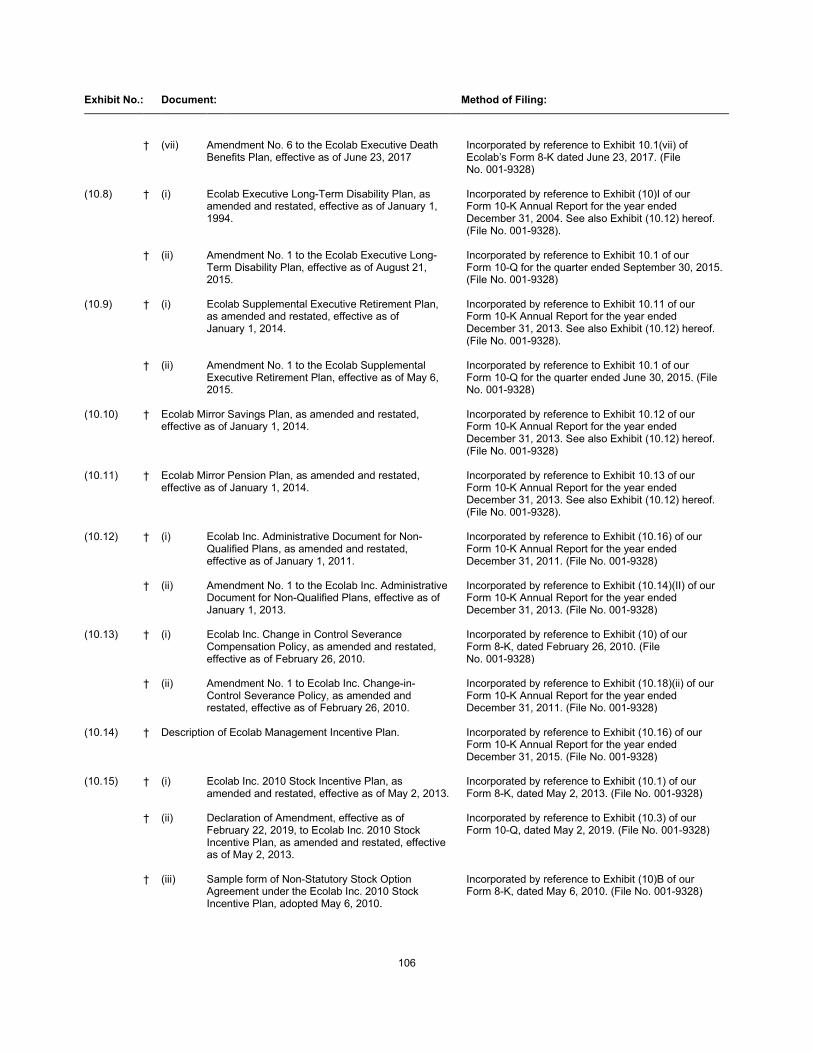
106
Exhibit No.: Document: Method of Filing:
† (vii) Amendment No. 6 to the Ecolab Executive Death
Benefits Plan, effective as of June 23, 2017 Incorporated by reference to Exhibit 10.1(vii) of
Ecolab’s Form 8-K dated June 23, 2017. (File No. 001-9328)
(10.8) † (i) Ecolab Executive Long-Term Disability Plan, as
amended and restated, effective as of January 1, 1994.
Incorporated by reference to Exhibit (10)I of our Form 10-K Annual Report for the year ended December 31, 2004. See also Exhibit (10.12) hereof. (File No. 001-9328).
† (ii) Amendment No. 1 to the Ecolab Executive Long-
Term Disability Plan, effective as of August 21, 2015.
Incorporated by reference to Exhibit 10.1 of our Form 10-Q for the quarter ended September 30, 2015. (File No. 001-9328)
(10.9) † (i) Ecolab Supplemental Executive Retirement Plan,
as amended and restated, effective as of January 1, 2014.
Incorporated by reference to Exhibit 10.11 of our Form 10-K Annual Report for the year ended December 31, 2013. See also Exhibit (10.12) hereof. (File No. 001-9328).
† (ii) Amendment No. 1 to the Ecolab Supplemental
Executive Retirement Plan, effective as of May 6, 2015.
Incorporated by reference to Exhibit 10.1 of our Form 10-Q for the quarter ended June 30, 2015. (File No. 001-9328)
(10.10) † Ecolab Mirror Savings Plan, as amended and restated,
effective as of January 1, 2014. Incorporated by reference to Exhibit 10.12 of our
Form 10-K Annual Report for the year ended December 31, 2013. See also Exhibit (10.12) hereof. (File No. 001-9328)
(10.11) † Ecolab Mirror Pension Plan, as amended and restated,
effective as of January 1, 2014. Incorporated by reference to Exhibit 10.13 of our
Form 10-K Annual Report for the year ended December 31, 2013. See also Exhibit (10.12) hereof. (File No. 001-9328).
(10.12) † (i) Ecolab Inc. Administrative Document for Non-
Qualified Plans, as amended and restated, effective as of January 1, 2011.
Incorporated by reference to Exhibit (10.16) of our Form 10-K Annual Report for the year ended December 31, 2011. (File No. 001-9328)
† (ii) Amendment No. 1 to the Ecolab Inc. Administrative
Document for Non-Qualified Plans, effective as of January 1, 2013.
Incorporated by reference to Exhibit (10.14)(II) of our Form 10-K Annual Report for the year ended December 31, 2013. (File No. 001-9328)
(10.13) † (i) Ecolab Inc. Change in Control Severance
Compensation Policy, as amended and restated, effective as of February 26, 2010.
Incorporated by reference to Exhibit (10) of our Form 8-K, dated February 26, 2010. (File No. 001-9328)
† (ii) Amendment No. 1 to Ecolab Inc. Change-in-
Control Severance Policy, as amended and restated, effective as of February 26, 2010.
Incorporated by reference to Exhibit (10.18)(ii) of our Form 10-K Annual Report for the year ended December 31, 2011. (File No. 001-9328)
(10.14) † Description of Ecolab Management Incentive Plan. Incorporated by reference to Exhibit (10.16) of our
Form 10-K Annual Report for the year ended December 31, 2015. (File No. 001-9328)
(10.15) † (i) Ecolab Inc. 2010 Stock Incentive Plan, as
amended and restated, effective as of May 2, 2013. Incorporated by reference to Exhibit (10.1) of our
Form 8-K, dated May 2, 2013. (File No. 001-9328) † (ii) Declaration of Amendment, effective as of
February 22, 2019, to Ecolab Inc. 2010 Stock Incentive Plan, as amended and restated, effective as of May 2, 2013.
Incorporated by reference to Exhibit (10.3) of our Form 10-Q, dated May 2, 2019. (File No. 001-9328)
† (iii) Sample form of Non-Statutory Stock Option
Agreement under the Ecolab Inc. 2010 Stock Incentive Plan, adopted May 6, 2010.
Incorporated by reference to Exhibit (10)B of our Form 8-K, dated May 6, 2010. (File No. 001-9328)

107
Exhibit No.: Document: Method of Filing:
† (iv) Sample form of Restricted Stock Award Agreement
under the Ecolab Inc. 2010 Stock Incentive Plan, adopted May 6, 2010.
Incorporated by reference to Exhibit (10)C of our Form 8-K, dated May 6, 2010. (File No. 001-9328)
† (v) Sample form of Restricted Stock Unit Award
Agreement under the Ecolab Inc. 2010 Stock Incentive Plan, adopted August 4, 2010.
Incorporated by reference to Exhibit (10)A of our Form 10-Q, for the quarter ended September 30, 2010. (File No. 001-9328)
† (vi) Sample form of Performance-Based Restricted
Stock Unit Award Agreement under the Ecolab Inc. 2010 Stock Incentive Plan, adopted December 7, 2016.
Incorporated by reference to Exhibit (10.16)(vii) of our Form 10-K Annual Report for the year ended December 31, 2016. (File No. 001-9328)
† (vii) Sample form of Performance-Based Restricted
Stock Unit Award Agreement under the Ecolab Inc. 2010 Stock Incentive Plan, adopted December 6, 2017.
Incorporated by reference to Exhibit (10.16)(viii) of our Form 10-K Annual Report for the year ended December 31, 2017. (File No. 001-9328)
† (viii) Sample form of Performance-Based Restricted
Stock Unit Award Agreement under the Ecolab Inc. 2010 Stock Incentive Plan, adopted December 4, 2018.
Incorporated by reference to Exhibit (10.15)(viii) of our Form 10-K Annual Report for the year ended December 31, 2018. (File No. 001-9328)
† (ix) Sample form of Performance-Based Restricted
Stock Unit Award Agreement under the Ecolab Inc. 2010 Stock Incentive Plan, adopted December 3, 2019.
Filed herewith electronically.
† (x) Sample form of Restricted Stock Unit Award
Agreement under the Ecolab Inc. 2010 Stock Incentive Plan, adopted December 3, 2019.
Filed herewith electronically.
(10.16) † Policy on Reimbursement of Incentive Payments, as
amended February 22, 2019. Incorporated by reference to Exhibit (10.16) of our
Form 10-K Annual Report for the year ended December 31, 2018. (File No. 001-9328)
(10.17) † Second Amended and Restated Nalco Holding Company
2004 Stock Incentive Plan, effective as of December 1, 2011. Incorporated by reference to Exhibit (4.3) of our Post-
Effective Amendment No. 1 on Form S-8 to Form S-4 Registration Statement dated December 2, 2011. (File No. 001-9328)
(10.18) † Form of Nalco Company Death Benefit Agreement and
Addendum to Death Benefit Agreement. Incorporated by reference from Exhibit (99.2) on
Form 8-K of Nalco Holding Company filed on May 11, 2005. (File No. 001-32342)
(10.19) † Employee Matters Agreement, dated December 18, 2019, by
and among Ecolab, Inc., ChampionX Holding Inc. and Apergy Corporation.
Incorporated by reference to Exhibit (10.1) of our Form 8-K, dated December 18, 2019. (File No. 001-9328)
(14.1) Ecolab Code of Conduct, as amended November 26, 2012. Incorporated by reference to Exhibit (14.1) of our
Form 10-K Annual Report for the year ended December 31, 2012. (File No. 001-9328)
(21.1) List of Subsidiaries. Filed herewith electronically. (23.1) Consent of Independent Registered Public Accounting Firm. Filed herewith electronically. (24.1) Powers of Attorney. Filed herewith electronically. (31.1) Rule 13a-14(a) CEO Certification. Filed herewith electronically. (31.2) Rule 13a-14(a) CFO Certification. Filed herewith electronically. (32.1) Section 1350 CEO and CFO Certifications. Filed herewith electronically.

108
Exhibit No.: Document: Method of Filing:
(101.INS) Inline XBRL Instance Document – the instance document
does not appear in the Interactive Data File because its XBRL tags are embedded within the Inline XBRL document.
Filed herewith electronically.
(101.SCH) Inline XBRL Taxonomy Extension Schema. Filed herewith electronically. (101.CAL) Inline XBRL Taxonomy Extension Calculation Linkbase. Filed herewith electronically. (101.DEF) Inline XBRL Taxonomy Extension Definition Linkbase. Filed herewith electronically. (101.LAB) Inline XBRL Taxonomy Extension Label Linkbase. Filed herewith electronically. (101.PRE) Inline XBRL Taxonomy Extension Presentation Linkbase. Filed herewith electronically. (104) Cover Page Interactive Data File. Formatted as Inline XBRL and contained in Exhibit 101. † This exhibit is an executive compensation plan or arrangement. Item 16. Form 10-K Summary. None.

109
SIGNATURES
Pursuant to the requirements of Section 13 or 15(d) of the Securities Exchange Act of 1934, Ecolab Inc. has duly caused this report to be signed on its behalf by the undersigned, thereunto duly authorized, on the 28th day of February, 2020. ECOLAB INC. (Registrant) By: /s/ Douglas M. Baker, Jr. Douglas M. Baker, Jr. Chairman of the Board and Chief Executive Officer Pursuant to the requirements of the Securities Exchange Act of 1934, this report has been signed below by the following persons on behalf of Ecolab Inc. and in the capacities indicated, on the 28th day of February, 2020. /s/ Douglas M. Baker, Jr. Chairman of the Board and Chief Executive Officer Douglas M. Baker, Jr. (Principal Executive Officer and Director) /s/ Daniel J. Schmechel Chief Financial Officer Daniel J. Schmechel (Principal Financial Officer) /s/ Scott D. Kirkland Senior Vice President and Corporate Controller Scott D. Kirkland (duly authorized officer and Chief Accounting Officer) /s/ Michael C. McCormick Directors Michael C. McCormick as attorney-in-fact for: Shari L. Ballard, Barbara J. Beck, Les S. Biller, Jeffrey M. Ettinger, Arthur J. Higgins, Michael Larson, David W. MacLennan, Tracy B. McKibben, Lionel L. Nowell, III, Victoria J. Reich, Suzanne M. Vautrinot and John J. Zillmer
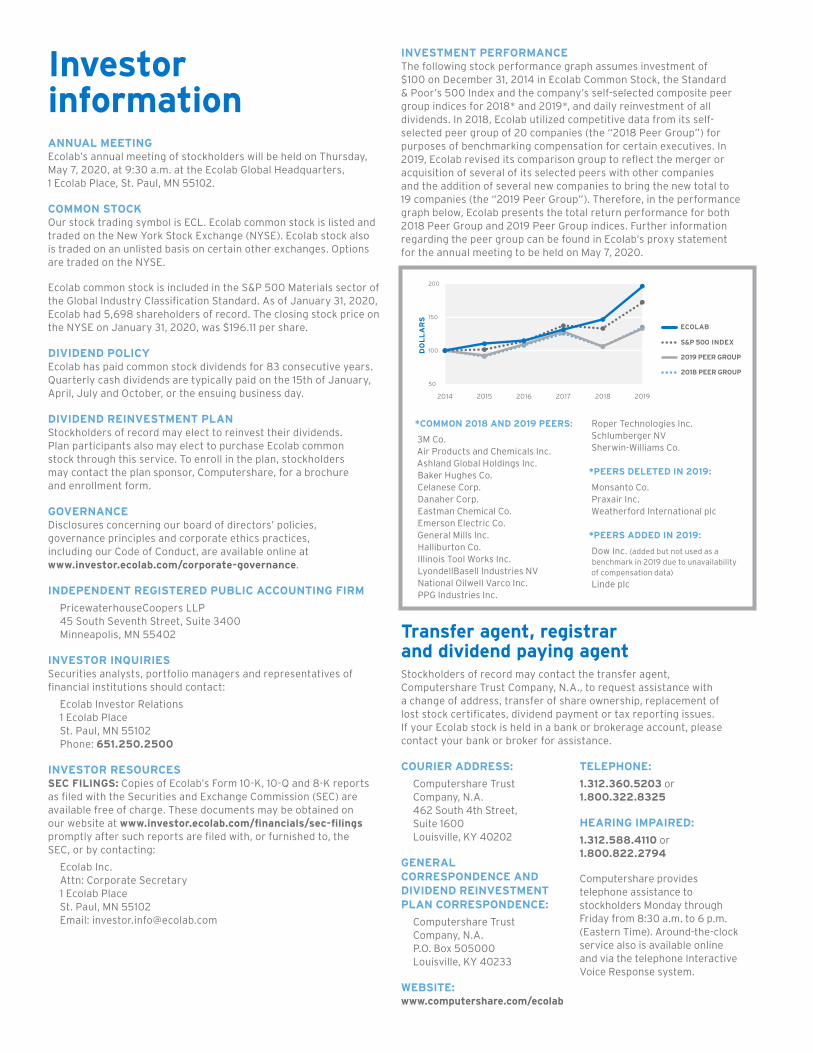
Investor informationANNUAL MEETING Ecolab’s annual meeting of stockholders will be held on Thursday, May 7, 2020, at 9:30 a.m. at the Ecolab Global Headquarters, 1 Ecolab Place, St. Paul, MN 55102.
COMMON STOCK Our stock trading symbol is ECL. Ecolab common stock is listed and traded on the New York Stock Exchange (NYSE). Ecolab stock also is traded on an unlisted basis on certain other exchanges. Options are traded on the NYSE.
Ecolab common stock is included in the S&P 500 Materials sector of the Global Industry Classification Standard. As of January 31, 2020, Ecolab had 5,698 shareholders of record. The closing stock price on the NYSE on January 31, 2020, was $196.11 per share.
DIVIDEND POLICY Ecolab has paid common stock dividends for 83 consecutive years. Quarterly cash dividends are typically paid on the 15th of January, April, July and October, or the ensuing business day.
DIVIDEND REINVESTMENT PLAN Stockholders of record may elect to reinvest their dividends. Plan participants also may elect to purchase Ecolab common stock through this service. To enroll in the plan, stockholders may contact the plan sponsor, Computershare, for a brochure and enrollment form.
GOVERNANCE Disclosures concerning our board of directors’ policies, governance principles and corporate ethics practices, including our Code of Conduct, are available online at www.investor.ecolab.com/corporate-governance.
INDEPENDENT REGISTERED PUBLIC ACCOUNTING FIRM
PricewaterhouseCoopers LLP 45 South Seventh Street, Suite 3400 Minneapolis, MN 55402
INVESTOR INQUIRIES Securities analysts, portfolio managers and representatives of financial institutions should contact:
Ecolab Investor Relations 1 Ecolab Place St. Paul, MN 55102 Phone: 651.250.2500
INVESTOR RESOURCES SEC FILINGS: Copies of Ecolab’s Form 10-K, 10-Q and 8-K reports as filed with the Securities and Exchange Commission (SEC) are available free of charge. These documents may be obtained on our website at www.investor.ecolab.com/financials/sec-filings promptly after such reports are filed with, or furnished to, the SEC, or by contacting:
Ecolab Inc. Attn: Corporate Secretary 1 Ecolab Place St. Paul, MN 55102 Email: [email protected]
INVESTMENT PERFORMANCE The following stock performance graph assumes investment of $100 on December 31, 2014 in Ecolab Common Stock, the Standard & Poor’s 500 Index and the company’s self-selected composite peer group indices for 2018* and 2019*, and daily reinvestment of all dividends. In 2018, Ecolab utilized competitive data from its self-selected peer group of 20 companies (the “2018 Peer Group”) for purposes of benchmarking compensation for certain executives. In 2019, Ecolab revised its comparison group to reflect the merger or acquisition of several of its selected peers with other companies and the addition of several new companies to bring the new total to 19 companies (the “2019 Peer Group”). Therefore, in the performance graph below, Ecolab presents the total return performance for both 2018 Peer Group and 2019 Peer Group indices. Further information regarding the peer group can be found in Ecolab’s proxy statement for the annual meeting to be held on May 7, 2020.
Transfer agent, registrar and dividend paying agentStockholders of record may contact the transfer agent, Computershare Trust Company, N.A., to request assistance with a change of address, transfer of share ownership, replacement of lost stock certificates, dividend payment or tax reporting issues. If your Ecolab stock is held in a bank or brokerage account, please contact your bank or broker for assistance.
COURIER ADDRESS:
Computershare Trust Company, N.A. 462 South 4th Street, Suite 1600 Louisville, KY 40202
GENERAL CORRESPONDENCE AND DIVIDEND REINVESTMENT PLAN CORRESPONDENCE:
Computershare Trust Company, N.A. P.O. Box 505000 Louisville, KY 40233
WEBSITE: www.computershare.com/ecolab
TELEPHONE:
1.312.360.5203 or 1.800.322.8325
HEARING IMPAIRED:
1.312.588.4110 or 1.800.822.2794
Computershare provides telephone assistance to stockholders Monday through Friday from 8:30 a.m. to 6 p.m. (Eastern Time). Around-the-clock service also is available online and via the telephone Interactive Voice Response system.
DO
LL
AR
S
2014 2015 2016 2017 2018 2019
200
150
100
50
ECOLAB
S&P 500 INDEX
2019 PEER GROUP
2018 PEER GROUP
*COMMON 2018 AND 2019 PEERS:
3M Co.Air Products and Chemicals Inc.Ashland Global Holdings Inc.Baker Hughes Co.Celanese Corp.Danaher Corp.Eastman Chemical Co.Emerson Electric Co.General Mills Inc.Halliburton Co.Illinois Tool Works Inc.LyondellBasell Industries NVNational Oilwell Varco Inc.PPG Industries Inc.
Roper Technologies Inc.Schlumberger NVSherwin-Williams Co.
*PEERS DELETED IN 2019:
Monsanto Co.Praxair Inc.Weatherford International plc
*PEERS ADDED IN 2019:
Dow Inc. (added but not used as a benchmark in 2019 due to unavailability of compensation data)
Linde plc

A trusted partner at nearly three million commercial customer locations,
Ecolab Inc. is the global leader in water, hygiene and infection prevention
solutions and services. Ecolab’s more than 50,000 associates deliver
comprehensive solutions, data-driven insights and personalized service to
advance food safety, maintain clean and sanitized environments, optimize
water and energy use, and improve operational efficiencies and sustainability
for customers in the food, healthcare, hospitality, industrial and energy
markets in more than 170 countries.
From restaurants and hotels to refineries and manufacturing facilities,
Ecolab’s more than 27,500 sales-and-service associates, the industry’s largest
and best-trained direct sales-and-service force, help solve the most pressing
operational and sustainability challenges our customers face today. Many
of the world’s most recognizable brands rely on Ecolab to help ensure guest
satisfaction, product quality and brand reputation.
Ecolab is headquartered in St. Paul, Minn., and its common stock is listed
under the ticker symbol ECL on the New York Stock Exchange. For more
company information, visit www.ecolab.com, or call 1.800.2.ECOLAB.
Follow us on Twitter @ecolab, Facebook at facebook.com/ecolab,
Instagram at ecolab_inc. or LinkedIn at linkedin.com/company/ecolab.
FORWARD-LOOKING STATEMENTS AND RISK FACTORS
We refer readers to the company’s disclosure entitled “Forward-Looking
Statements and Risk Factors,” which begins on page 15 of the Form 10-K.
ECOLAB OVERVIEW
One focus: customer success
1.20
1.00
0.90
20182017 2019
1.10
1Q 2Q 3Q 4Q 1Q 2Q 3Q 4Q 1Q 2Q 3Q 4Q
EC
OL
AB
ST
OC
K P
RIC
E
EC
OL
AB
, S&
P 5
00
IN
DIC
ES
1.30
1.40
1.50
1.60
$90
$110
$100
$120
$130
$140
$150
$160
$170
$180
$190
$200
1.70
1.80
1.90
2.00
ECOLAB STOCK PRICE S&P 500 INDEXECOLAB INDEXECOLAB STOCK PERFORMANCE AND COMPARISON
HIGH LOW
2019
Q4 $199.43 $181.43
Q3 209.87 191.56
Q2 200.93 177.17
Q1 182.19 141.30
2018
Q4 $162.91 $135.77
Q3 159.92 138.65
Q2 150.46 132.79
Q1 140.50 125.74
2017
Q4 $137.96 $128.38
Q3 134.28 127.18
Q2 134.89 124.42
Q1 126.17 117.29
Ecolab Stock Performance
Board of directorsDOUGLAS M. BAKER, JR. Chairman of the Board and Chief Executive Officer of Ecolab Inc., Director since 2004, Safety, Health and Environment Committee
SHARI L. BALLARD Former Senior Executive Vice President and President, Multi-Channel Retail of Best Buy Co., Inc. (consumer electronics products and services retailer), Director since 2018, Audit and Safety, Health and Environment Committees
BARBARA J. BECK Executive Advisor to American Securities LLC (private equity firm), Director since 2008, Safety, Health and Environment* and Governance Committees
LESLIE S. BILLER Chief Executive Officer of Harborview Capital (private investment and consultive company), Director since 1997, Finance* and Compensation Committees
JEFFREY M. ETTINGER Retired Chairman of the Board of Hormel Foods Corporation (food products company), Director since 2015, Governance* and Compensation Committees and Lead Director
ARTHUR J. HIGGINS President and Chief Executive Officer of Assertio Therapeutics, Inc. (specialty pharmaceutical company), Director since 2010, Compensation and Safety, Health and Environment Committees
MICHAEL LARSON Chief investment officer to William H. Gates, III and Business Manager of Cascade Investment, L.L.C., Director since 2012, Finance and Safety, Health and Environment Committees
DAVID W. MACLENNAN Chairman and Chief Executive Officer of Cargill, Incorporated (food, agricultural, financial and industrial products and services company), Director since 2015, Audit and Governance Committees
TRACY B. MCKIBBEN Founder and Chief Executive Officer of MAC Energy Advisors LLC (consulting company for alternative energy and clean technology investments), Director since 2015, Audit and Finance Committees
LIONEL L. NOWELL, III Former Senior Vice President and Treasurer of PepsiCo, Inc. (food and beverage company), Director since 2018, Audit and Finance Committees
VICTORIA J. REICH Former Senior Vice President and Chief Financial Officer of Essendant Inc. (wholesale distributor of business products), Director since 2009, Audit* and Governance Committees
SUZANNE M. VAUTRINOT President of Kilovolt Consulting Inc. (consulting company for cyber security strategy and technology) and a retired Major General of the United States Air Force, Director since February 2014, Compensation and Finance Committees
JOHN J. ZILLMER Chief Executive Officer of Aramark (provider of food, facilities management and uniform services), Director since 2006, Compensation* and Governance Committees
*Denotes committee chair
Corporate officers
Communication with directorsStakeholders and other interested parties, including our investors and associates, with substantive matters requiring the attention of our board (e.g., governance issues or potential accounting, control or auditing irregularities) may use the contact information for our board located on our website at www.investor.ecolab.com/corporate-governance/contact-the-board.
Matters not requiring the direct attention of our board — such as employment inquiries, sales solicitations, questions about our products and other such matters — should be submitted to the company’s management at our Global Headquarters in St. Paul, Minn. In addition to online communication, interested parties may direct correspondence to our board at:
Ecolab Inc. Attn: Corporate Secretary 1 Ecolab Place St. Paul, MN 55102
ANIL ARCALGUD Executive Vice President and Chief Information Officer
DOUGLAS M. BAKER, JR. Chairman of the Board and Chief Executive Officer
CHRISTOPHE BECK President and Chief Operating Officer
LARRY L. BERGER Executive Vice President and Chief Technical Officer
DARRELL R. BROWN Executive Vice President and President — Global Industrial
DERIC D. BRYANT Executive Vice President and President — Upstream Energy
ANGELA M. BUSCH Executive Vice President — Corporate & Business Development
MACHIEL DUIJSER Executive Vice President and Chief Supply Chain Officer
ROBERTO INCHAUSTEGUI Executive Vice President — Growth Initiatives
SCOTT D. KIRKLAND Senior Vice President and Corporate Controller
KEVIN S. KRUMM Senior Vice President and Treasurer
LAURIE M. MARSH Executive Vice President — Human Resources
MICHAEL C. MCCORMICK Executive Vice President, General Counsel and Secretary
JUDY M. MCNAMARA Senior Vice President — Tax
TIMOTHY P. MULHERE Executive Vice President and President — Global Institutional & Specialty Services
JOANNE JIRIK MULLEN Chief Compliance Officer and Chief Employment Counsel
GAIL PETERSON Senior Vice President — Marketing & Communications
DANIEL J. SCHMECHEL Chief Financial Officer
ELIZABETH A. SIMERMEYER Executive Vice President and President — Healthcare and Life Sciences
JILL S. WYANT Executive Vice President and President — Global Regions
ECOLAB ANNUAL REPORT 20192

One Focus: Customer Success
ANNUAL REPORT
TM
This report was printed by a WBENC-certified firm using agri-based inks on FSC®-certified paper.
Global Headquarters1 Ecolab Place, St. Paul, MN 55102www.ecolab.com 1 800 2 ECOLAB©2020 Ecolab USA Inc. All rights reserved. 55274/0800/0220
TM
REDUCE, RE-USE, RECYCLEIf you received multiple copies of this report, you may have duplicate investment accounts. Help save resources. Please contact your broker or the transfer agent to request assistance with consolidating any duplicate accounts.
All product names appearing in the text of this Annual Report are the trademarks, brand names, service marks or copyrights of Ecolab USA Inc. or affiliated Ecolab group companies.