Embed Size (px)
Citation preview
1
ONLINE SUPPLEMENT
The Control of Hypertension In Pregnancy Study (CHIPS) randomized controlled trial – is
severe hypertension just an elevated blood pressure?
Laura A Magee (for the CHIPS Study Group, Table S1), MD FRCPC MSc1, 2
Peter von Dadelszen, MBChB, DPhil, FRCSC1, 2
Joel Singer, PhD3
Terry Lee, PhD4
Evelyne Rey, MD, MSc, FRCPC5
Susan Ross, MBA, PhD6
Elizabeth Asztalos, MSc, MD, FRCPC7, 8, 9
Kellie E Murphy, MSc, MD, FRCSC7, 9
Jennifer Menzies, MSc2
Johanna Sanchez, MIPH9
Amiram Gafni, BSc, MSc, DSc10
Michael Helewa, MD, FRCSC11
Eileen Hutton, MSc, PhD12
Gideon Koren, MD, FRCPC13
Shoo K Lee, MD, PhD, FRCPC7
2
Alexander G Logan, MD, FRCPC14
Wessel Ganzevoort, MD, PhD15
Ross Welch, MBBS, DA, MD16
Jim G Thornton, MBChB, MD17
Jean-Marie Moutquin, MSc, MD, FRCSC18
Affiliations
1Institute of Cardiovascular and Cell Sciences, St. George’s University of London, UK
2Dept of Obstetrics and Gynaecology, University of British Columbia, Canada
3School of Population and Public Health, University of British Columbia, Canada
4Centre for Health Evaluation and Outcome Sciences (CHÉOS), Providence Health Care Research
Institute, UBC, Vancouver, Canada
5Medicine and Obstetrics and Gynaecology, University of Montreal, Canada
6Obstetrics and Gynaecology, University of Alberta, Canada
7Pediatrics, University of Toronto, Canada
8Obstetrics and Gynaecology, University of Toronto, Canada
9The Centre for Mother, Infant and Child Research, Sunnybrook Research Institute, University of
Toronto, Canada
3
10Clinical Epidemiology and Biostatistics, McMaster University, Canada
11Obstetrics and Gynaecology, University of Manitoba, Canada
12Obstetrics and Gynaecology, McMaster University, Canada
13Pediatrics, University of Toronto, Canada
14Medicine, University of Toronto, Canada
15 Obstetrics and Gynaecology, University of Amsterdam, Netherlands
16 Obstetrics and Gynaecology, Derriford Hospital, United Kingdom
17 Obstetrics and Gynaecology, University of Nottingham, United Kingdom
18Obstetrics and Gynaecology, Universite de Sherbrooke, Canada
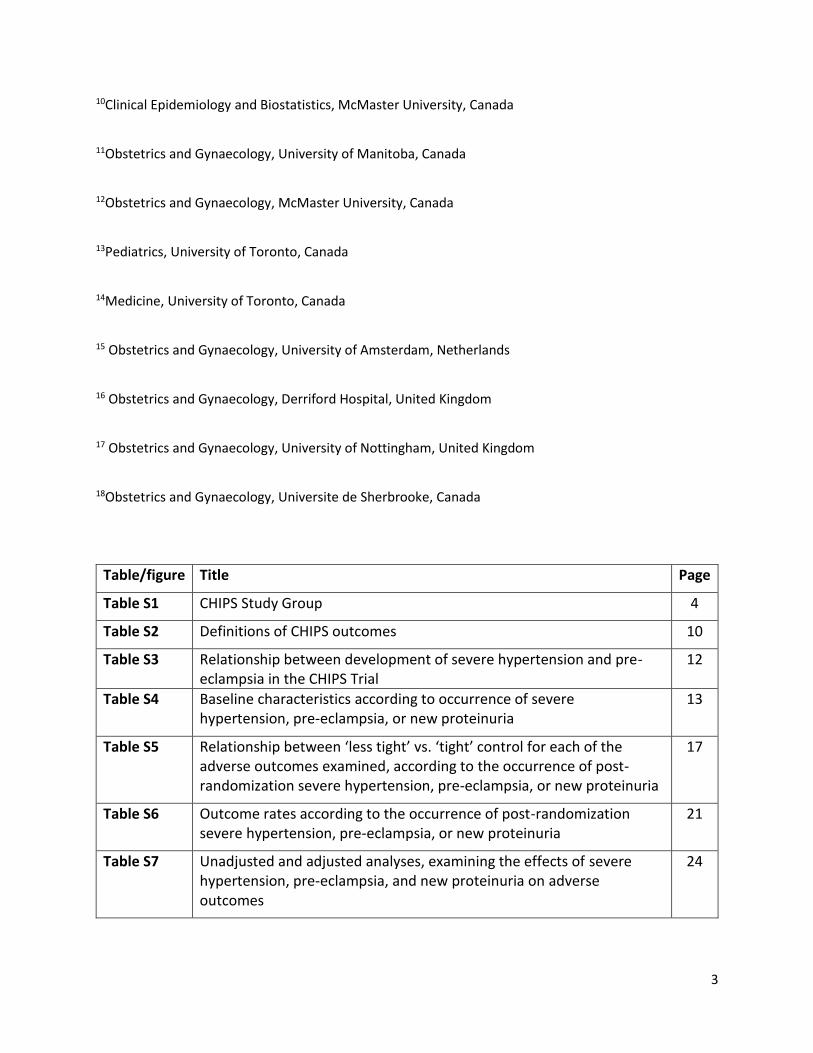
Table/figure Title Page
Table S1 CHIPS Study Group 4
Table S2 Definitions of CHIPS outcomes 10
Table S3 Relationship between development of severe hypertension and pre-eclampsia in the CHIPS Trial
12
Table S4 Baseline characteristics according to occurrence of severe hypertension, pre-eclampsia, or new proteinuria
13
Table S5 Relationship between ‘less tight’ vs. ‘tight’ control for each of the adverse outcomes examined, according to the occurrence of post-randomization severe hypertension, pre-eclampsia, or new proteinuria
17
Table S6 Outcome rates according to the occurrence of post-randomization severe hypertension, pre-eclampsia, or new proteinuria
21
Table S7 Unadjusted and adjusted analyses, examining the effects of severe hypertension, pre-eclampsia, and new proteinuria on adverse outcomes
24
4
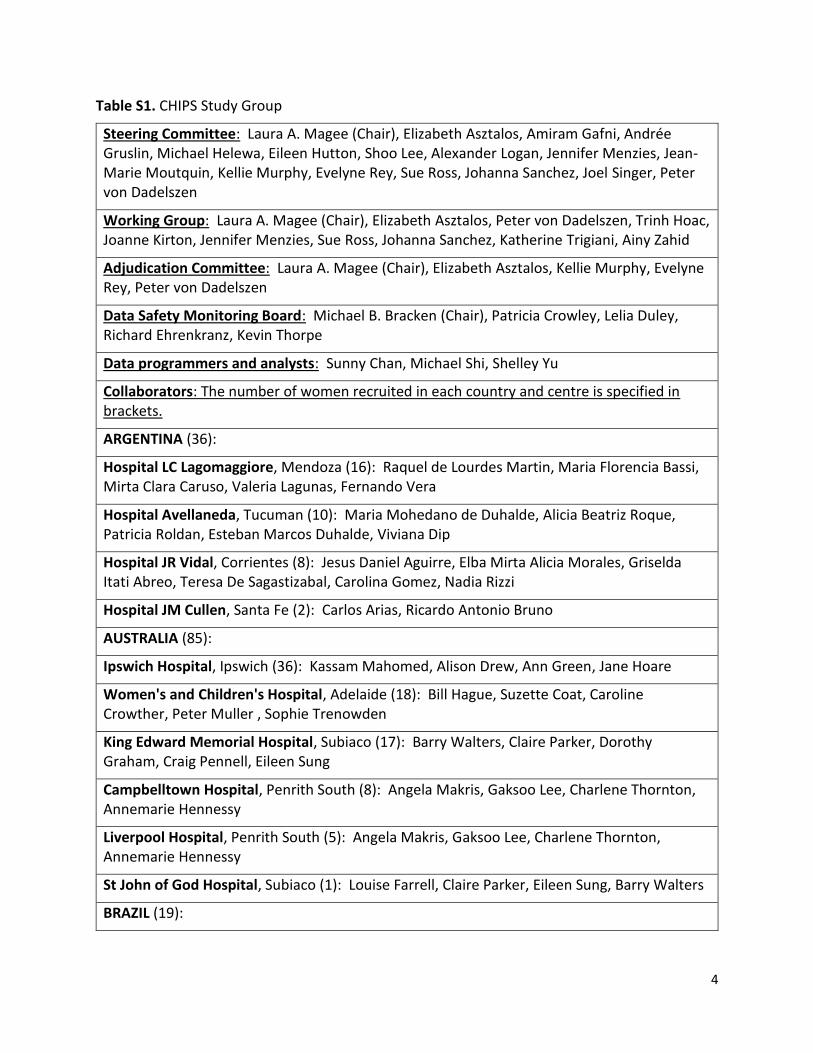
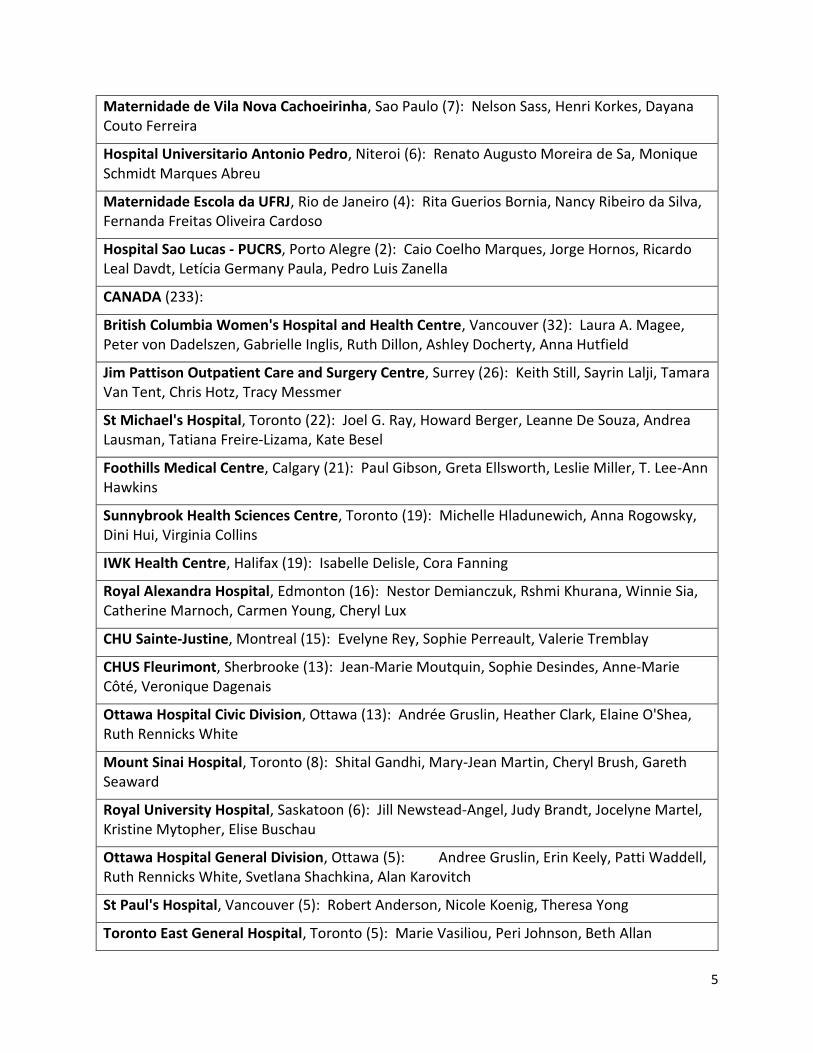
Table S1. CHIPS Study Group
Steering Committee: Laura A. Magee (Chair), Elizabeth Asztalos, Amiram Gafni, Andrée Gruslin, Michael Helewa, Eileen Hutton, Shoo Lee, Alexander Logan, Jennifer Menzies, Jean-Marie Moutquin, Kellie Murphy, Evelyne Rey, Sue Ross, Johanna Sanchez, Joel Singer, Peter von Dadelszen
Working Group: Laura A. Magee (Chair), Elizabeth Asztalos, Peter von Dadelszen, Trinh Hoac, Joanne Kirton, Jennifer Menzies, Sue Ross, Johanna Sanchez, Katherine Trigiani, Ainy Zahid
Adjudication Committee: Laura A. Magee (Chair), Elizabeth Asztalos, Kellie Murphy, Evelyne Rey, Peter von Dadelszen
Data Safety Monitoring Board: Michael B. Bracken (Chair), Patricia Crowley, Lelia Duley, Richard Ehrenkranz, Kevin Thorpe
Data programmers and analysts: Sunny Chan, Michael Shi, Shelley Yu
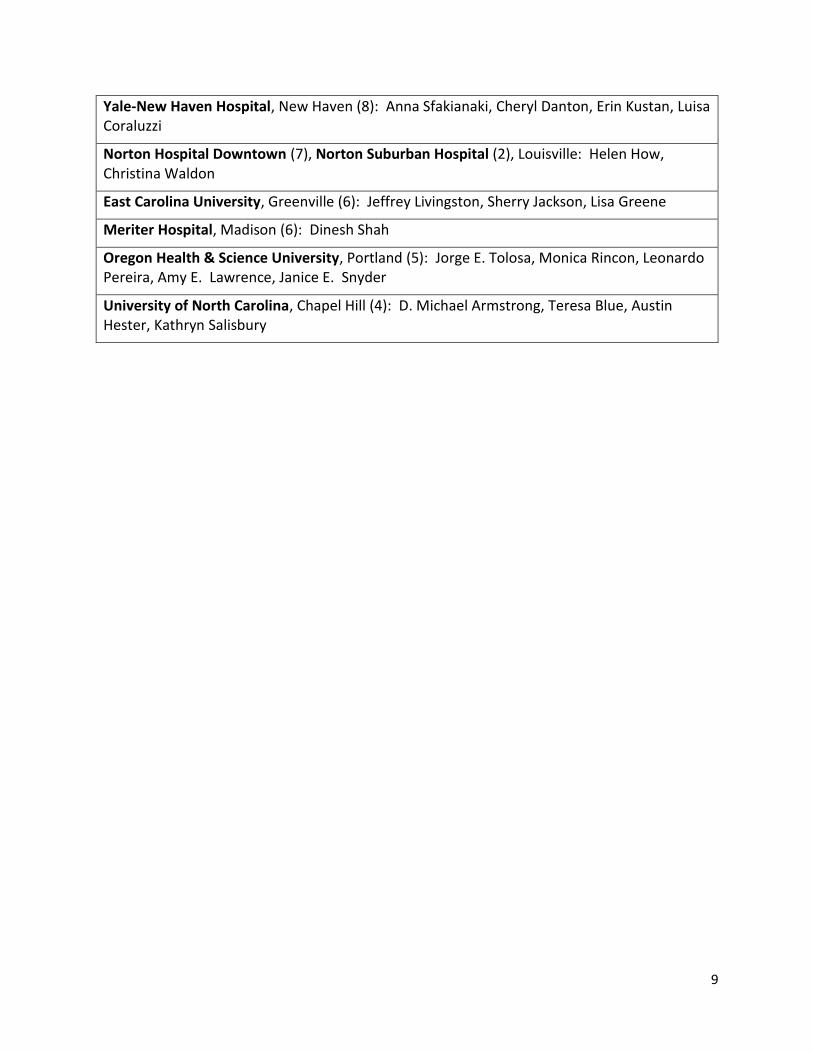
Collaborators: The number of women recruited in each country and centre is specified in brackets.
ARGENTINA (36):
Hospital LC Lagomaggiore, Mendoza (16): Raquel de Lourdes Martin, Maria Florencia Bassi, Mirta Clara Caruso, Valeria Lagunas, Fernando Vera
Hospital Avellaneda, Tucuman (10): Maria Mohedano de Duhalde, Alicia Beatriz Roque, Patricia Roldan, Esteban Marcos Duhalde, Viviana Dip
Hospital JR Vidal, Corrientes (8): Jesus Daniel Aguirre, Elba Mirta Alicia Morales, Griselda Itati Abreo, Teresa De Sagastizabal, Carolina Gomez, Nadia Rizzi
Hospital JM Cullen, Santa Fe (2): Carlos Arias, Ricardo Antonio Bruno
AUSTRALIA (85):
Ipswich Hospital, Ipswich (36): Kassam Mahomed, Alison Drew, Ann Green, Jane Hoare
Women's and Children's Hospital, Adelaide (18): Bill Hague, Suzette Coat, Caroline Crowther, Peter Muller , Sophie Trenowden
King Edward Memorial Hospital, Subiaco (17): Barry Walters, Claire Parker, Dorothy Graham, Craig Pennell, Eileen Sung
Campbelltown Hospital, Penrith South (8): Angela Makris, Gaksoo Lee, Charlene Thornton, Annemarie Hennessy
Liverpool Hospital, Penrith South (5): Angela Makris, Gaksoo Lee, Charlene Thornton, Annemarie Hennessy
St John of God Hospital, Subiaco (1): Louise Farrell, Claire Parker, Eileen Sung, Barry Walters
BRAZIL (19):
5
Maternidade de Vila Nova Cachoeirinha, Sao Paulo (7): Nelson Sass, Henri Korkes, Dayana Couto Ferreira
Hospital Universitario Antonio Pedro, Niteroi (6): Renato Augusto Moreira de Sa, Monique Schmidt Marques Abreu
Maternidade Escola da UFRJ, Rio de Janeiro (4): Rita Guerios Bornia, Nancy Ribeiro da Silva, Fernanda Freitas Oliveira Cardoso
Hospital Sao Lucas - PUCRS, Porto Alegre (2): Caio Coelho Marques, Jorge Hornos, Ricardo Leal Davdt, Letícia Germany Paula, Pedro Luis Zanella
CANADA (233):
British Columbia Women's Hospital and Health Centre, Vancouver (32): Laura A. Magee, Peter von Dadelszen, Gabrielle Inglis, Ruth Dillon, Ashley Docherty, Anna Hutfield
Jim Pattison Outpatient Care and Surgery Centre, Surrey (26): Keith Still, Sayrin Lalji, Tamara Van Tent, Chris Hotz, Tracy Messmer
St Michael's Hospital, Toronto (22): Joel G. Ray, Howard Berger, Leanne De Souza, Andrea Lausman, Tatiana Freire-Lizama, Kate Besel
Foothills Medical Centre, Calgary (21): Paul Gibson, Greta Ellsworth, Leslie Miller, T. Lee-Ann Hawkins
Sunnybrook Health Sciences Centre, Toronto (19): Michelle Hladunewich, Anna Rogowsky, Dini Hui, Virginia Collins
IWK Health Centre, Halifax (19): Isabelle Delisle, Cora Fanning
Royal Alexandra Hospital, Edmonton (16): Nestor Demianczuk, Rshmi Khurana, Winnie Sia, Catherine Marnoch, Carmen Young, Cheryl Lux
CHU Sainte-Justine, Montreal (15): Evelyne Rey, Sophie Perreault, Valerie Tremblay
CHUS Fleurimont, Sherbrooke (13): Jean-Marie Moutquin, Sophie Desindes, Anne-Marie Côté, Veronique Dagenais
Ottawa Hospital Civic Division, Ottawa (13): Andrée Gruslin, Heather Clark, Elaine O'Shea, Ruth Rennicks White
Mount Sinai Hospital, Toronto (8): Shital Gandhi, Mary-Jean Martin, Cheryl Brush, Gareth Seaward
Royal University Hospital, Saskatoon (6): Jill Newstead-Angel, Judy Brandt, Jocelyne Martel, Kristine Mytopher, Elise Buschau
Ottawa Hospital General Division, Ottawa (5): Andree Gruslin, Erin Keely, Patti Waddell, Ruth Rennicks White, Svetlana Shachkina, Alan Karovitch
St Paul's Hospital, Vancouver (5): Robert Anderson, Nicole Koenig, Theresa Yong
Toronto East General Hospital, Toronto (5): Marie Vasiliou, Peri Johnson, Beth Allan
6
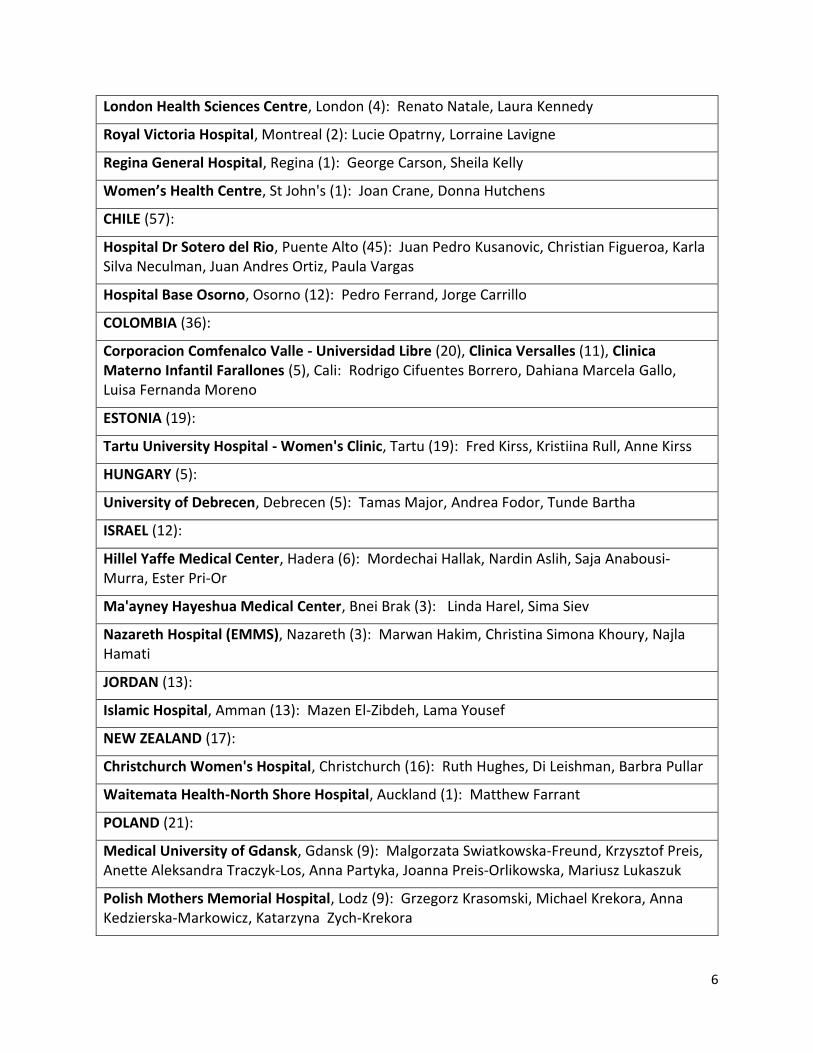
London Health Sciences Centre, London (4): Renato Natale, Laura Kennedy
Royal Victoria Hospital, Montreal (2): Lucie Opatrny, Lorraine Lavigne
Regina General Hospital, Regina (1): George Carson, Sheila Kelly
Women’s Health Centre, St John's (1): Joan Crane, Donna Hutchens
CHILE (57):
Hospital Dr Sotero del Rio, Puente Alto (45): Juan Pedro Kusanovic, Christian Figueroa, Karla Silva Neculman, Juan Andres Ortiz, Paula Vargas
Hospital Base Osorno, Osorno (12): Pedro Ferrand, Jorge Carrillo
COLOMBIA (36):
Corporacion Comfenalco Valle - Universidad Libre (20), Clinica Versalles (11), Clinica Materno Infantil Farallones (5), Cali: Rodrigo Cifuentes Borrero, Dahiana Marcela Gallo, Luisa Fernanda Moreno
ESTONIA (19):
Tartu University Hospital - Women's Clinic, Tartu (19): Fred Kirss, Kristiina Rull, Anne Kirss
HUNGARY (5):
University of Debrecen, Debrecen (5): Tamas Major, Andrea Fodor, Tunde Bartha
ISRAEL (12):
Hillel Yaffe Medical Center, Hadera (6): Mordechai Hallak, Nardin Aslih, Saja Anabousi-Murra, Ester Pri-Or
Ma'ayney Hayeshua Medical Center, Bnei Brak (3): Linda Harel, Sima Siev
Nazareth Hospital (EMMS), Nazareth (3): Marwan Hakim, Christina Simona Khoury, Najla Hamati
JORDAN (13):
Islamic Hospital, Amman (13): Mazen El-Zibdeh, Lama Yousef
NEW ZEALAND (17):
Christchurch Women's Hospital, Christchurch (16): Ruth Hughes, Di Leishman, Barbra Pullar
Waitemata Health-North Shore Hospital, Auckland (1): Matthew Farrant
POLAND (21):
Medical University of Gdansk, Gdansk (9): Malgorzata Swiatkowska-Freund, Krzysztof Preis, Anette Aleksandra Traczyk-Los, Anna Partyka, Joanna Preis-Orlikowska, Mariusz Lukaszuk
Polish Mothers Memorial Hospital, Lodz (9): Grzegorz Krasomski, Michael Krekora, Anna Kedzierska-Markowicz, Katarzyna Zych-Krekora
7
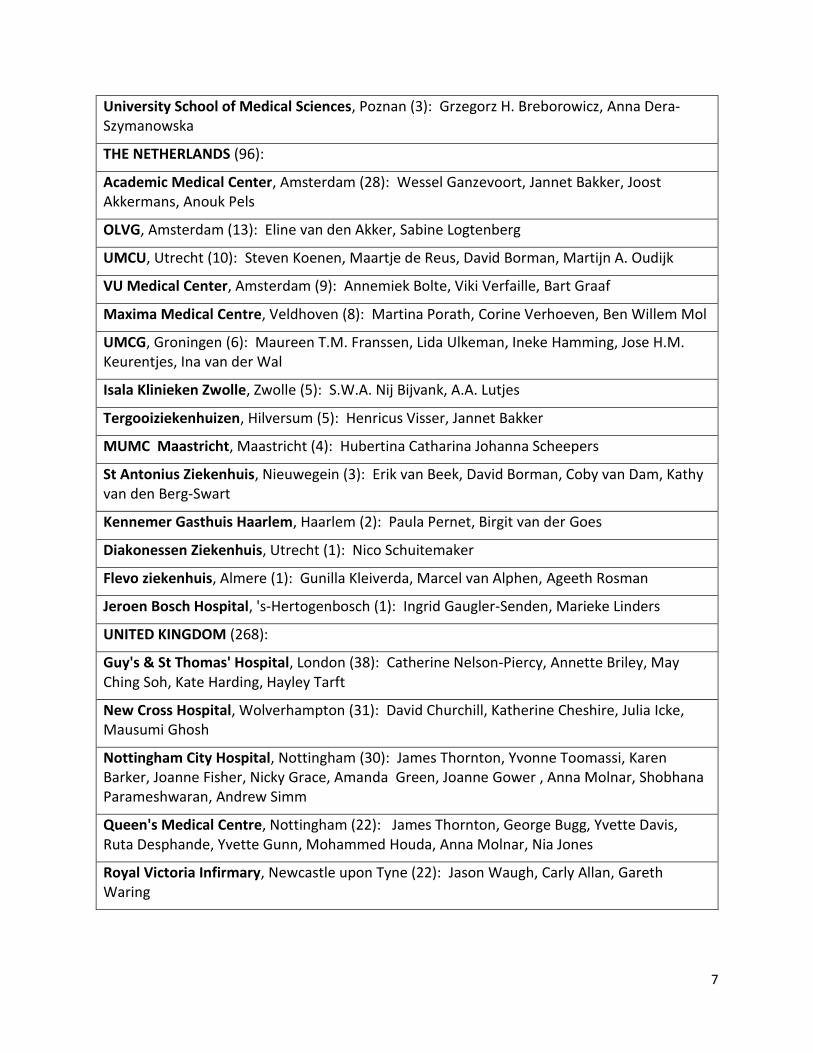
University School of Medical Sciences, Poznan (3): Grzegorz H. Breborowicz, Anna Dera-Szymanowska
THE NETHERLANDS (96):
Academic Medical Center, Amsterdam (28): Wessel Ganzevoort, Jannet Bakker, Joost Akkermans, Anouk Pels
OLVG, Amsterdam (13): Eline van den Akker, Sabine Logtenberg
UMCU, Utrecht (10): Steven Koenen, Maartje de Reus, David Borman, Martijn A. Oudijk
VU Medical Center, Amsterdam (9): Annemiek Bolte, Viki Verfaille, Bart Graaf
Maxima Medical Centre, Veldhoven (8): Martina Porath, Corine Verhoeven, Ben Willem Mol
UMCG, Groningen (6): Maureen T.M. Franssen, Lida Ulkeman, Ineke Hamming, Jose H.M. Keurentjes, Ina van der Wal
Isala Klinieken Zwolle, Zwolle (5): S.W.A. Nij Bijvank, A.A. Lutjes
Tergooiziekenhuizen, Hilversum (5): Henricus Visser, Jannet Bakker
MUMC Maastricht, Maastricht (4): Hubertina Catharina Johanna Scheepers
St Antonius Ziekenhuis, Nieuwegein (3): Erik van Beek, David Borman, Coby van Dam, Kathy van den Berg-Swart
Kennemer Gasthuis Haarlem, Haarlem (2): Paula Pernet, Birgit van der Goes
Diakonessen Ziekenhuis, Utrecht (1): Nico Schuitemaker
Flevo ziekenhuis, Almere (1): Gunilla Kleiverda, Marcel van Alphen, Ageeth Rosman
Jeroen Bosch Hospital, 's-Hertogenbosch (1): Ingrid Gaugler-Senden, Marieke Linders
UNITED KINGDOM (268):
Guy's & St Thomas' Hospital, London (38): Catherine Nelson-Piercy, Annette Briley, May Ching Soh, Kate Harding, Hayley Tarft
New Cross Hospital, Wolverhampton (31): David Churchill, Katherine Cheshire, Julia Icke, Mausumi Ghosh
Nottingham City Hospital, Nottingham (30): James Thornton, Yvonne Toomassi, Karen Barker, Joanne Fisher, Nicky Grace, Amanda Green, Joanne Gower , Anna Molnar, Shobhana Parameshwaran, Andrew Simm
Queen's Medical Centre, Nottingham (22): James Thornton, George Bugg, Yvette Davis, Ruta Desphande, Yvette Gunn, Mohammed Houda, Anna Molnar, Nia Jones
Royal Victoria Infirmary, Newcastle upon Tyne (22): Jason Waugh, Carly Allan, Gareth Waring
8
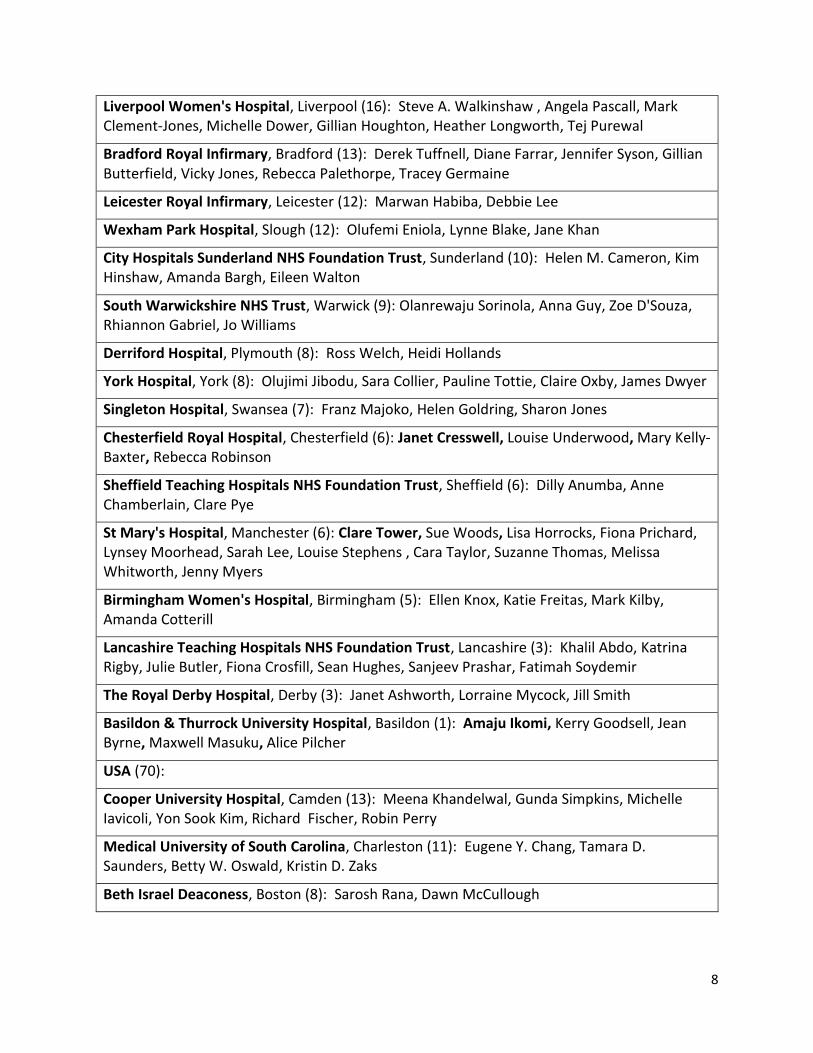
Liverpool Women's Hospital, Liverpool (16): Steve A. Walkinshaw , Angela Pascall, Mark Clement-Jones, Michelle Dower, Gillian Houghton, Heather Longworth, Tej Purewal
Bradford Royal Infirmary, Bradford (13): Derek Tuffnell, Diane Farrar, Jennifer Syson, Gillian Butterfield, Vicky Jones, Rebecca Palethorpe, Tracey Germaine
Leicester Royal Infirmary, Leicester (12): Marwan Habiba, Debbie Lee
Wexham Park Hospital, Slough (12): Olufemi Eniola, Lynne Blake, Jane Khan
City Hospitals Sunderland NHS Foundation Trust, Sunderland (10): Helen M. Cameron, Kim Hinshaw, Amanda Bargh, Eileen Walton
South Warwickshire NHS Trust, Warwick (9): Olanrewaju Sorinola, Anna Guy, Zoe D'Souza, Rhiannon Gabriel, Jo Williams
Derriford Hospital, Plymouth (8): Ross Welch, Heidi Hollands
York Hospital, York (8): Olujimi Jibodu, Sara Collier, Pauline Tottie, Claire Oxby, James Dwyer
Singleton Hospital, Swansea (7): Franz Majoko, Helen Goldring, Sharon Jones
Chesterfield Royal Hospital, Chesterfield (6): Janet Cresswell, Louise Underwood, Mary Kelly-Baxter, Rebecca Robinson
Sheffield Teaching Hospitals NHS Foundation Trust, Sheffield (6): Dilly Anumba, Anne Chamberlain, Clare Pye
St Mary's Hospital, Manchester (6): Clare Tower, Sue Woods, Lisa Horrocks, Fiona Prichard, Lynsey Moorhead, Sarah Lee, Louise Stephens , Cara Taylor, Suzanne Thomas, Melissa Whitworth, Jenny Myers
Birmingham Women's Hospital, Birmingham (5): Ellen Knox, Katie Freitas, Mark Kilby, Amanda Cotterill
Lancashire Teaching Hospitals NHS Foundation Trust, Lancashire (3): Khalil Abdo, Katrina Rigby, Julie Butler, Fiona Crosfill, Sean Hughes, Sanjeev Prashar, Fatimah Soydemir
The Royal Derby Hospital, Derby (3): Janet Ashworth, Lorraine Mycock, Jill Smith
Basildon & Thurrock University Hospital, Basildon (1): Amaju Ikomi, Kerry Goodsell, Jean Byrne, Maxwell Masuku, Alice Pilcher
USA (70):
Cooper University Hospital, Camden (13): Meena Khandelwal, Gunda Simpkins, Michelle Iavicoli, Yon Sook Kim, Richard Fischer, Robin Perry
Medical University of South Carolina, Charleston (11): Eugene Y. Chang, Tamara D. Saunders, Betty W. Oswald, Kristin D. Zaks
Beth Israel Deaconess, Boston (8): Sarosh Rana, Dawn McCullough
9
Yale-New Haven Hospital, New Haven (8): Anna Sfakianaki, Cheryl Danton, Erin Kustan, Luisa Coraluzzi
Norton Hospital Downtown (7), Norton Suburban Hospital (2), Louisville: Helen How, Christina Waldon
East Carolina University, Greenville (6): Jeffrey Livingston, Sherry Jackson, Lisa Greene
Meriter Hospital, Madison (6): Dinesh Shah
Oregon Health & Science University, Portland (5): Jorge E. Tolosa, Monica Rincon, Leonardo Pereira, Amy E. Lawrence, Janice E. Snyder
University of North Carolina, Chapel Hill (4): D. Michael Armstrong, Teresa Blue, Austin Hester, Kathryn Salisbury
10
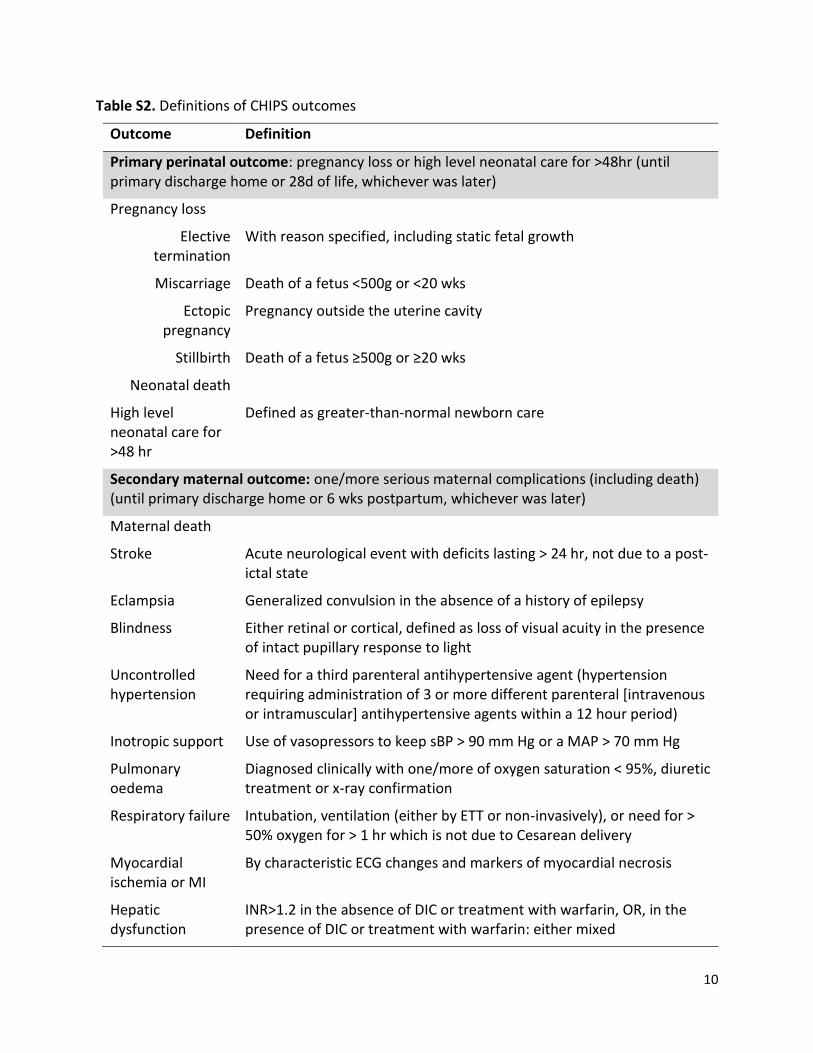
Table S2. Definitions of CHIPS outcomes
Outcome Definition
Primary perinatal outcome: pregnancy loss or high level neonatal care for >48hr (until primary discharge home or 28d of life, whichever was later)
Pregnancy loss
Elective termination
With reason specified, including static fetal growth
Miscarriage Death of a fetus <500g or <20 wks
Ectopic pregnancy
Pregnancy outside the uterine cavity
Stillbirth Death of a fetus ≥500g or ≥20 wks
Neonatal death
High level neonatal care for >48 hr
Defined as greater-than-normal newborn care
Secondary maternal outcome: one/more serious maternal complications (including death) (until primary discharge home or 6 wks postpartum, whichever was later)
Maternal death
Stroke Acute neurological event with deficits lasting > 24 hr, not due to a post-ictal state
Eclampsia Generalized convulsion in the absence of a history of epilepsy
Blindness Either retinal or cortical, defined as loss of visual acuity in the presence of intact pupillary response to light
Uncontrolled hypertension
Need for a third parenteral antihypertensive agent (hypertension requiring administration of 3 or more different parenteral [intravenous or intramuscular] antihypertensive agents within a 12 hour period)
Inotropic support Use of vasopressors to keep sBP > 90 mm Hg or a MAP > 70 mm Hg
Pulmonary oedema
Diagnosed clinically with one/more of oxygen saturation < 95%, diuretic treatment or x-ray confirmation
Respiratory failure Intubation, ventilation (either by ETT or non-invasively), or need for > 50% oxygen for > 1 hr which is not due to Cesarean delivery
Myocardial ischemia or MI
By characteristic ECG changes and markers of myocardial necrosis
Hepatic dysfunction
INR>1.2 in the absence of DIC or treatment with warfarin, OR, in the presence of DIC or treatment with warfarin: either mixed
11
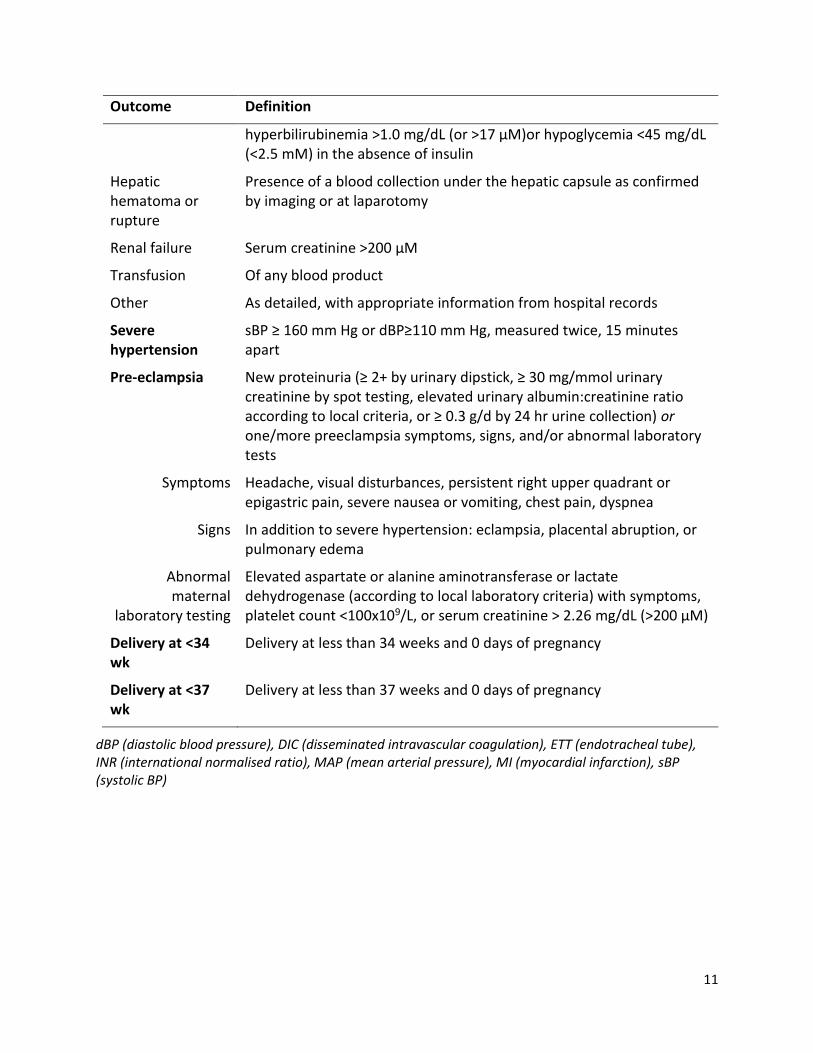
Outcome Definition
hyperbilirubinemia >1.0 mg/dL (or >17 μM)or hypoglycemia <45 mg/dL (<2.5 mM) in the absence of insulin
Hepatic hematoma or rupture
Presence of a blood collection under the hepatic capsule as confirmed by imaging or at laparotomy
Renal failure Serum creatinine >200 µM
Transfusion Of any blood product
Other As detailed, with appropriate information from hospital records
Severe hypertension
sBP ≥ 160 mm Hg or dBP≥110 mm Hg, measured twice, 15 minutes apart
Pre-eclampsia New proteinuria (≥ 2+ by urinary dipstick, ≥ 30 mg/mmol urinary creatinine by spot testing, elevated urinary albumin:creatinine ratio according to local criteria, or ≥ 0.3 g/d by 24 hr urine collection) or one/more preeclampsia symptoms, signs, and/or abnormal laboratory tests
Symptoms Headache, visual disturbances, persistent right upper quadrant or epigastric pain, severe nausea or vomiting, chest pain, dyspnea
Signs In addition to severe hypertension: eclampsia, placental abruption, or pulmonary edema
Abnormal maternal
laboratory testing
Elevated aspartate or alanine aminotransferase or lactate dehydrogenase (according to local laboratory criteria) with symptoms, platelet count <100x109/L, or serum creatinine > 2.26 mg/dL (>200 µM)
Delivery at <34 wk
Delivery at less than 34 weeks and 0 days of pregnancy
Delivery at <37 wk
Delivery at less than 37 weeks and 0 days of pregnancy
dBP (diastolic blood pressure), DIC (disseminated intravascular coagulation), ETT (endotracheal tube), INR (international normalised ratio), MAP (mean arterial pressure), MI (myocardial infarction), sBP (systolic BP)
12
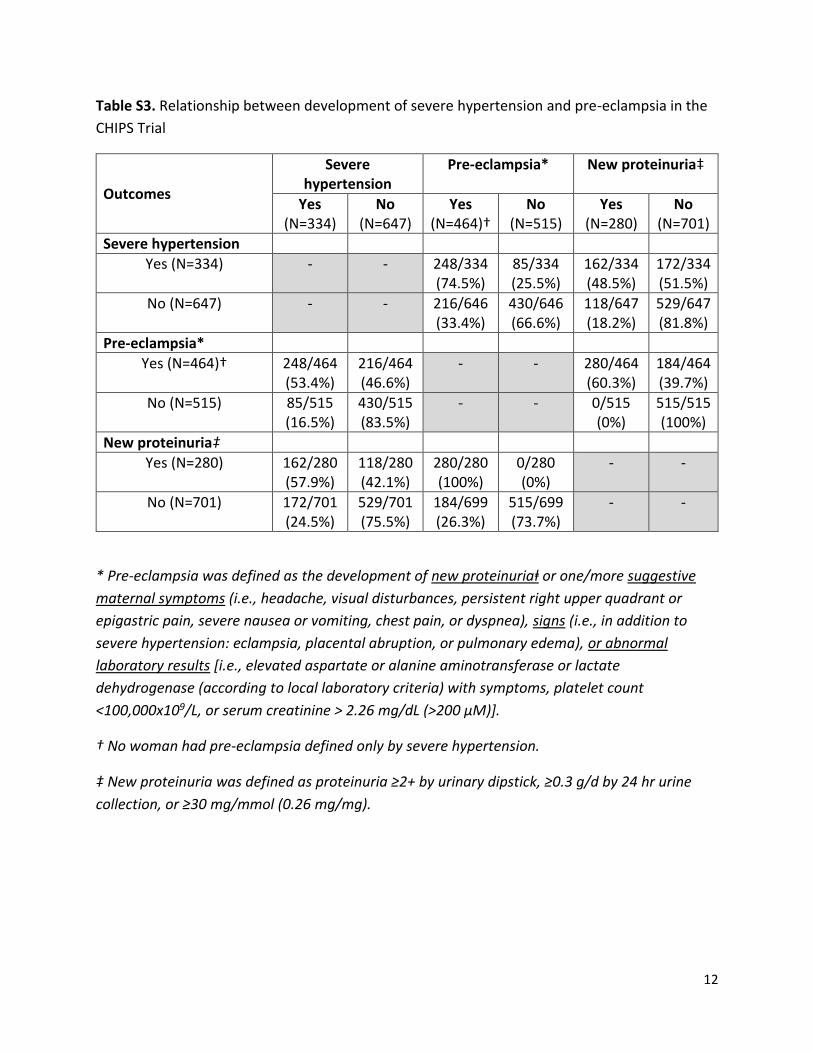
Table S3. Relationship between development of severe hypertension and pre-eclampsia in the
CHIPS Trial
Outcomes
Severe hypertension
Pre-eclampsia* New proteinuria‡
Yes (N=334)
No (N=647)
Yes (N=464)†
No (N=515)
Yes (N=280)
No (N=701)
Severe hypertension
Yes (N=334) - - 248/334 (74.5%)
85/334 (25.5%)
162/334 (48.5%)
172/334 (51.5%)
No (N=647) - - 216/646 (33.4%)
430/646 (66.6%)
118/647 (18.2%)
529/647 (81.8%)
Pre-eclampsia*
Yes (N=464)† 248/464 (53.4%)
216/464 (46.6%)
- - 280/464 (60.3%)
184/464 (39.7%)
No (N=515) 85/515 (16.5%)
430/515 (83.5%)
- - 0/515 (0%)
515/515 (100%)
New proteinuria‡
Yes (N=280) 162/280 (57.9%)
118/280 (42.1%)
280/280 (100%)
0/280 (0%)
- -
No (N=701) 172/701 (24.5%)
529/701 (75.5%)
184/699 (26.3%)
515/699 (73.7%)
- -
* Pre-eclampsia was defined as the development of new proteinuriaⱡ or one/more suggestive
maternal symptoms (i.e., headache, visual disturbances, persistent right upper quadrant or
epigastric pain, severe nausea or vomiting, chest pain, or dyspnea), signs (i.e., in addition to
severe hypertension: eclampsia, placental abruption, or pulmonary edema), or abnormal
laboratory results [i.e., elevated aspartate or alanine aminotransferase or lactate
dehydrogenase (according to local laboratory criteria) with symptoms, platelet count
<100,000x109/L, or serum creatinine > 2.26 mg/dL (>200 µM)].
† No woman had pre-eclampsia defined only by severe hypertension.
‡ New proteinuria was defined as proteinuria ≥2+ by urinary dipstick, ≥0.3 g/d by 24 hr urine
collection, or ≥30 mg/mmol (0.26 mg/mg).
13
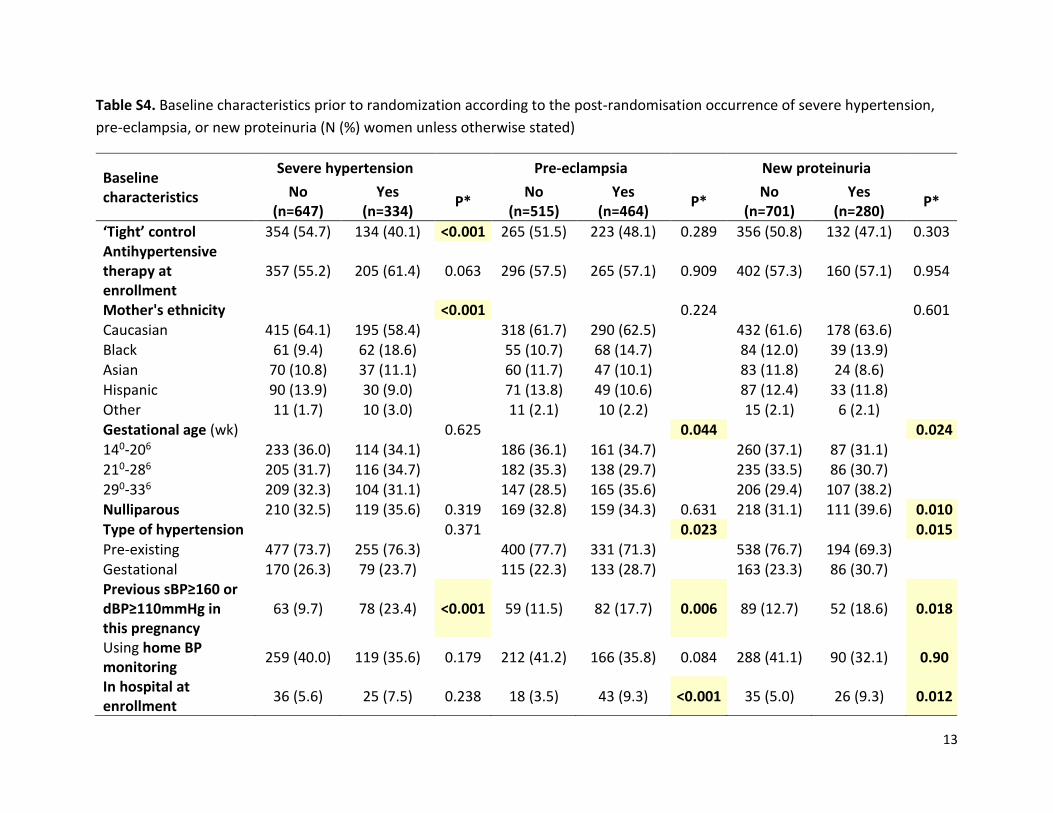
Table S4. Baseline characteristics prior to randomization according to the post-randomisation occurrence of severe hypertension,
pre-eclampsia, or new proteinuria (N (%) women unless otherwise stated)
Baseline characteristics
Severe hypertension Pre-eclampsia New proteinuria
No (n=647)
Yes (n=334)
P* No
(n=515) Yes
(n=464) P*
No (n=701)
Yes (n=280)
P*
‘Tight’ control 354 (54.7) 134 (40.1) <0.001 265 (51.5) 223 (48.1) 0.289 356 (50.8) 132 (47.1) 0.303 Antihypertensive therapy at enrollment
357 (55.2) 205 (61.4) 0.063 296 (57.5) 265 (57.1) 0.909 402 (57.3) 160 (57.1) 0.954
Mother's ethnicity <0.001 0.224 0.601 Caucasian 415 (64.1) 195 (58.4) 318 (61.7) 290 (62.5) 432 (61.6) 178 (63.6) Black 61 (9.4) 62 (18.6) 55 (10.7) 68 (14.7) 84 (12.0) 39 (13.9) Asian 70 (10.8) 37 (11.1) 60 (11.7) 47 (10.1) 83 (11.8) 24 (8.6)
Hispanic 90 (13.9) 30 (9.0) 71 (13.8) 49 (10.6) 87 (12.4) 33 (11.8) Other 11 (1.7) 10 (3.0) 11 (2.1) 10 (2.2) 15 (2.1) 6 (2.1) Gestational age (wk) 0.625 0.044 0.024 140-206 233 (36.0) 114 (34.1) 186 (36.1) 161 (34.7) 260 (37.1) 87 (31.1) 210-286 205 (31.7) 116 (34.7) 182 (35.3) 138 (29.7) 235 (33.5) 86 (30.7) 290-336 209 (32.3) 104 (31.1) 147 (28.5) 165 (35.6) 206 (29.4) 107 (38.2) Nulliparous 210 (32.5) 119 (35.6) 0.319 169 (32.8) 159 (34.3) 0.631 218 (31.1) 111 (39.6) 0.010
Type of hypertension 0.371 0.023 0.015 Pre-existing 477 (73.7) 255 (76.3) 400 (77.7) 331 (71.3) 538 (76.7) 194 (69.3) Gestational 170 (26.3) 79 (23.7) 115 (22.3) 133 (28.7) 163 (23.3) 86 (30.7) Previous sBP≥160 or dBP≥110mmHg in this pregnancy
63 (9.7) 78 (23.4) <0.001 59 (11.5) 82 (17.7) 0.006 89 (12.7) 52 (18.6) 0.018
Using home BP monitoring
259 (40.0) 119 (35.6) 0.179 212 (41.2) 166 (35.8) 0.084 288 (41.1) 90 (32.1) 0.90
In hospital at enrollment
36 (5.6) 25 (7.5) 0.238 18 (3.5) 43 (9.3) <0.001 35 (5.0) 26 (9.3) 0.012
14
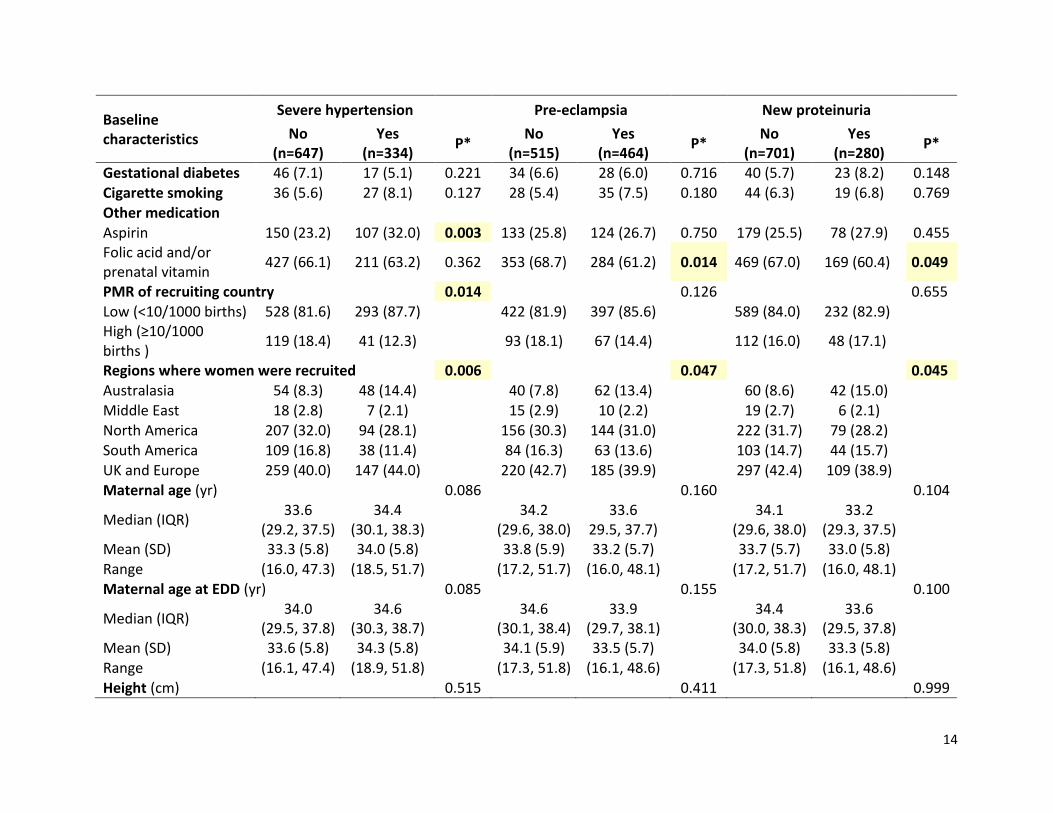
Baseline characteristics
Severe hypertension Pre-eclampsia New proteinuria
No (n=647)
Yes (n=334)
P* No
(n=515) Yes
(n=464) P*
No (n=701)
Yes (n=280)
P*
Gestational diabetes 46 (7.1) 17 (5.1) 0.221 34 (6.6) 28 (6.0) 0.716 40 (5.7) 23 (8.2) 0.148 Cigarette smoking 36 (5.6) 27 (8.1) 0.127 28 (5.4) 35 (7.5) 0.180 44 (6.3) 19 (6.8) 0.769 Other medication
Aspirin 150 (23.2) 107 (32.0) 0.003 133 (25.8) 124 (26.7) 0.750 179 (25.5) 78 (27.9) 0.455 Folic acid and/or prenatal vitamin
427 (66.1) 211 (63.2) 0.362 353 (68.7) 284 (61.2) 0.014 469 (67.0) 169 (60.4) 0.049
PMR of recruiting country 0.014 0.126 0.655 Low (<10/1000 births) 528 (81.6) 293 (87.7) 422 (81.9) 397 (85.6) 589 (84.0) 232 (82.9) High (≥10/1000 births )
119 (18.4) 41 (12.3) 93 (18.1) 67 (14.4) 112 (16.0) 48 (17.1)
Regions where women were recruited 0.006 0.047 0.045
Australasia 54 (8.3) 48 (14.4) 40 (7.8) 62 (13.4) 60 (8.6) 42 (15.0) Middle East 18 (2.8) 7 (2.1) 15 (2.9) 10 (2.2) 19 (2.7) 6 (2.1) North America 207 (32.0) 94 (28.1) 156 (30.3) 144 (31.0) 222 (31.7) 79 (28.2) South America 109 (16.8) 38 (11.4) 84 (16.3) 63 (13.6) 103 (14.7) 44 (15.7) UK and Europe 259 (40.0) 147 (44.0) 220 (42.7) 185 (39.9) 297 (42.4) 109 (38.9) Maternal age (yr) 0.086 0.160 0.104
Median (IQR) 33.6
(29.2, 37.5) 34.4
(30.1, 38.3)
34.2 (29.6, 38.0)
33.6 29.5, 37.7)
34.1
(29.6, 38.0) 33.2
(29.3, 37.5)
Mean (SD) 33.3 (5.8) 34.0 (5.8) 33.8 (5.9) 33.2 (5.7) 33.7 (5.7) 33.0 (5.8) Range (16.0, 47.3) (18.5, 51.7) (17.2, 51.7) (16.0, 48.1) (17.2, 51.7) (16.0, 48.1) Maternal age at EDD (yr) 0.085 0.155 0.100
Median (IQR) 34.0
(29.5, 37.8) 34.6
(30.3, 38.7)
34.6 (30.1, 38.4)
33.9 (29.7, 38.1)
34.4
(30.0, 38.3) 33.6
(29.5, 37.8)
Mean (SD) 33.6 (5.8) 34.3 (5.8) 34.1 (5.9) 33.5 (5.7) 34.0 (5.8) 33.3 (5.8) Range (16.1, 47.4) (18.9, 51.8) (17.3, 51.8) (16.1, 48.6) (17.3, 51.8) (16.1, 48.6)
Height (cm) 0.515 0.411 0.999
15
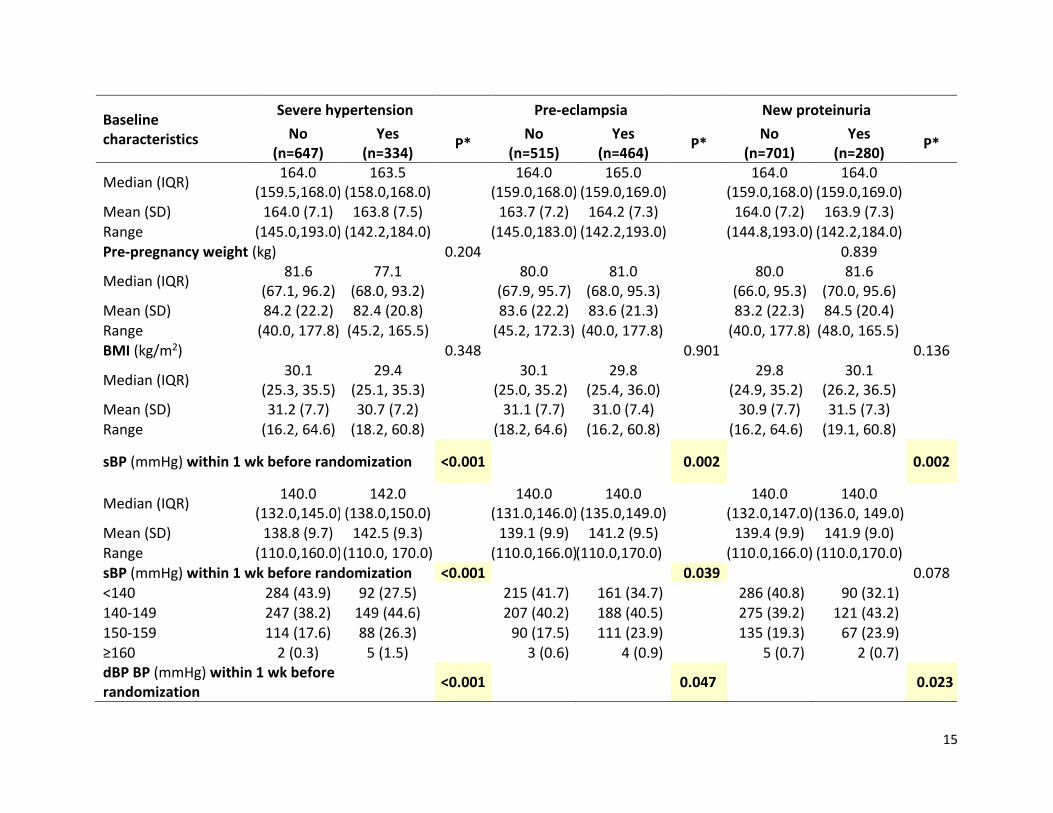
Baseline characteristics
Severe hypertension Pre-eclampsia New proteinuria
No (n=647)
Yes (n=334)
P* No
(n=515) Yes
(n=464) P*
No (n=701)
Yes (n=280)
P*
Median (IQR) 164.0
(159.5,168.0) 163.5
(158.0,168.0)
164.0 (159.0,168.0)
165.0 (159.0,169.0)
164.0
(159.0,168.0) 164.0
(159.0,169.0)
Mean (SD) 164.0 (7.1) 163.8 (7.5) 163.7 (7.2) 164.2 (7.3) 164.0 (7.2) 163.9 (7.3)
Range (145.0,193.0) (142.2,184.0) (145.0,183.0) (142.2,193.0) (144.8,193.0) (142.2,184.0) Pre-pregnancy weight (kg) 0.204 0.839
Median (IQR) 81.6
(67.1, 96.2) 77.1
(68.0, 93.2)
80.0 (67.9, 95.7)
81.0 (68.0, 95.3)
80.0
(66.0, 95.3) 81.6
(70.0, 95.6)
Mean (SD) 84.2 (22.2) 82.4 (20.8) 83.6 (22.2) 83.6 (21.3) 83.2 (22.3) 84.5 (20.4) Range (40.0, 177.8) (45.2, 165.5) (45.2, 172.3) (40.0, 177.8) (40.0, 177.8) (48.0, 165.5) BMI (kg/m2) 0.348 0.901 0.136
Median (IQR) 30.1
(25.3, 35.5) 29.4
(25.1, 35.3)
30.1 (25.0, 35.2)
29.8 (25.4, 36.0)
29.8
(24.9, 35.2) 30.1
(26.2, 36.5)
Mean (SD) 31.2 (7.7) 30.7 (7.2) 31.1 (7.7) 31.0 (7.4) 30.9 (7.7) 31.5 (7.3) Range (16.2, 64.6) (18.2, 60.8) (18.2, 64.6) (16.2, 60.8) (16.2, 64.6) (19.1, 60.8)
sBP (mmHg) within 1 wk before randomization <0.001
0.002 0.002
Median (IQR) 140.0
(132.0,145.0) 142.0
(138.0,150.0)
140.0 (131.0,146.0)
140.0 (135.0,149.0)
140.0
(132.0,147.0) 140.0
(136.0, 149.0)
Mean (SD) 138.8 (9.7) 142.5 (9.3) 139.1 (9.9) 141.2 (9.5) 139.4 (9.9) 141.9 (9.0) Range (110.0,160.0) (110.0, 170.0) (110.0,166.0) (110.0,170.0) (110.0,166.0) (110.0,170.0) sBP (mmHg) within 1 wk before randomization <0.001 0.039 0.078 <140 284 (43.9) 92 (27.5) 215 (41.7) 161 (34.7) 286 (40.8) 90 (32.1) 140-149 247 (38.2) 149 (44.6) 207 (40.2) 188 (40.5) 275 (39.2) 121 (43.2) 150-159 114 (17.6) 88 (26.3) 90 (17.5) 111 (23.9) 135 (19.3) 67 (23.9) ≥160 2 (0.3) 5 (1.5) 3 (0.6) 4 (0.9) 5 (0.7) 2 (0.7) dBP BP (mmHg) within 1 wk before randomization
<0.001
0.047 0.023
16
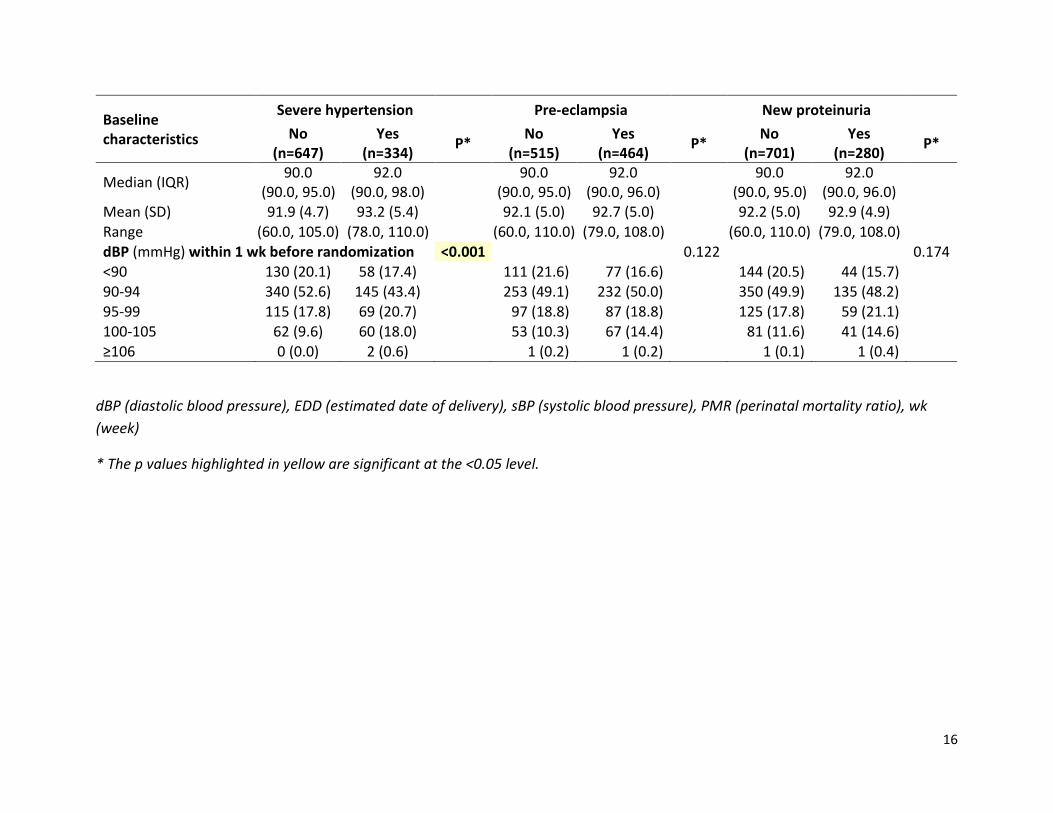
Baseline characteristics
Severe hypertension Pre-eclampsia New proteinuria
No (n=647)
Yes (n=334)
P* No
(n=515) Yes
(n=464) P*
No (n=701)
Yes (n=280)
P*
Median (IQR) 90.0
(90.0, 95.0) 92.0
(90.0, 98.0)
90.0 (90.0, 95.0)
92.0 (90.0, 96.0)
90.0
(90.0, 95.0) 92.0
(90.0, 96.0)
Mean (SD) 91.9 (4.7) 93.2 (5.4) 92.1 (5.0) 92.7 (5.0) 92.2 (5.0) 92.9 (4.9)
Range (60.0, 105.0) (78.0, 110.0) (60.0, 110.0) (79.0, 108.0) (60.0, 110.0) (79.0, 108.0) dBP (mmHg) within 1 wk before randomization <0.001 0.122 0.174 <90 130 (20.1) 58 (17.4) 111 (21.6) 77 (16.6) 144 (20.5) 44 (15.7) 90-94 340 (52.6) 145 (43.4) 253 (49.1) 232 (50.0) 350 (49.9) 135 (48.2) 95-99 115 (17.8) 69 (20.7) 97 (18.8) 87 (18.8) 125 (17.8) 59 (21.1) 100-105 62 (9.6) 60 (18.0) 53 (10.3) 67 (14.4) 81 (11.6) 41 (14.6) ≥106 0 (0.0) 2 (0.6) 1 (0.2) 1 (0.2) 1 (0.1) 1 (0.4)
dBP (diastolic blood pressure), EDD (estimated date of delivery), sBP (systolic blood pressure), PMR (perinatal mortality ratio), wk
(week)
* The p values highlighted in yellow are significant at the <0.05 level.
17
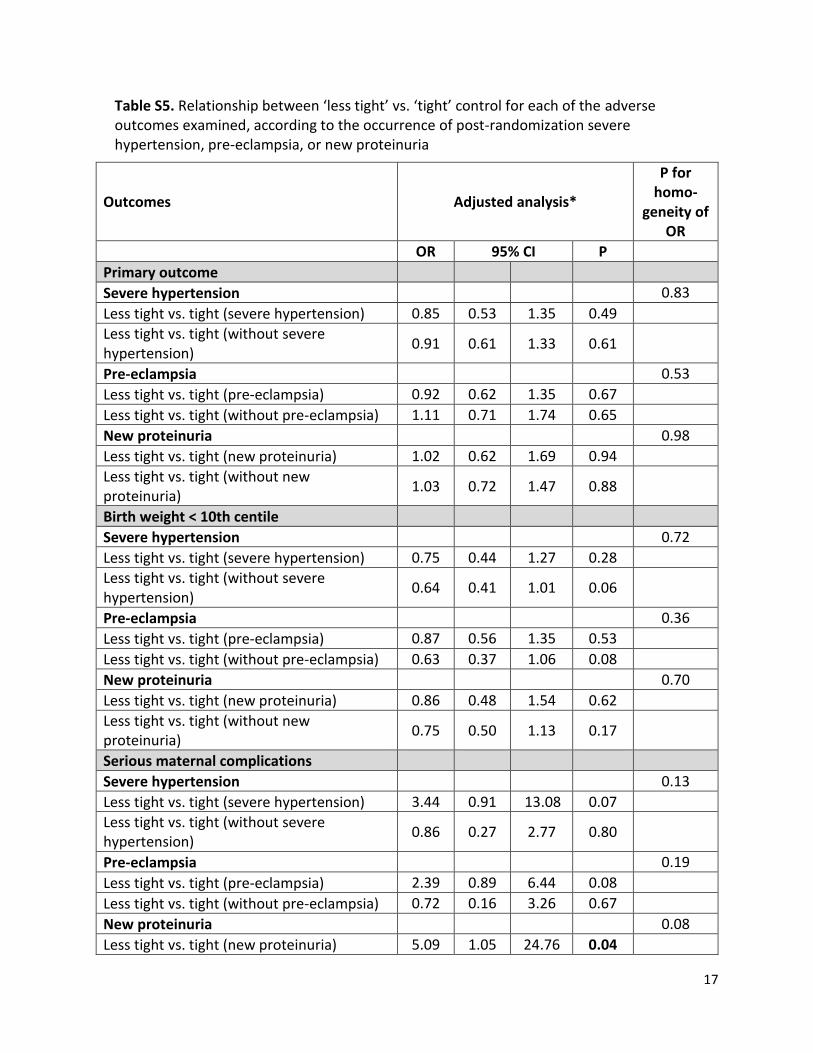
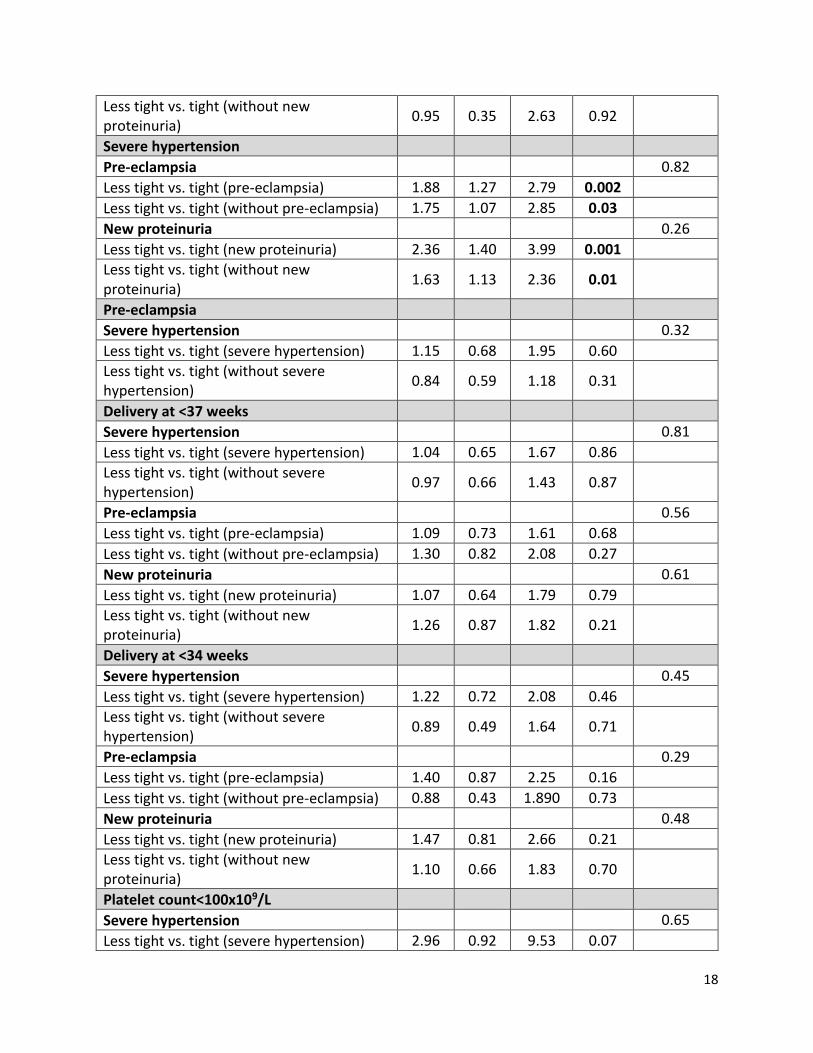
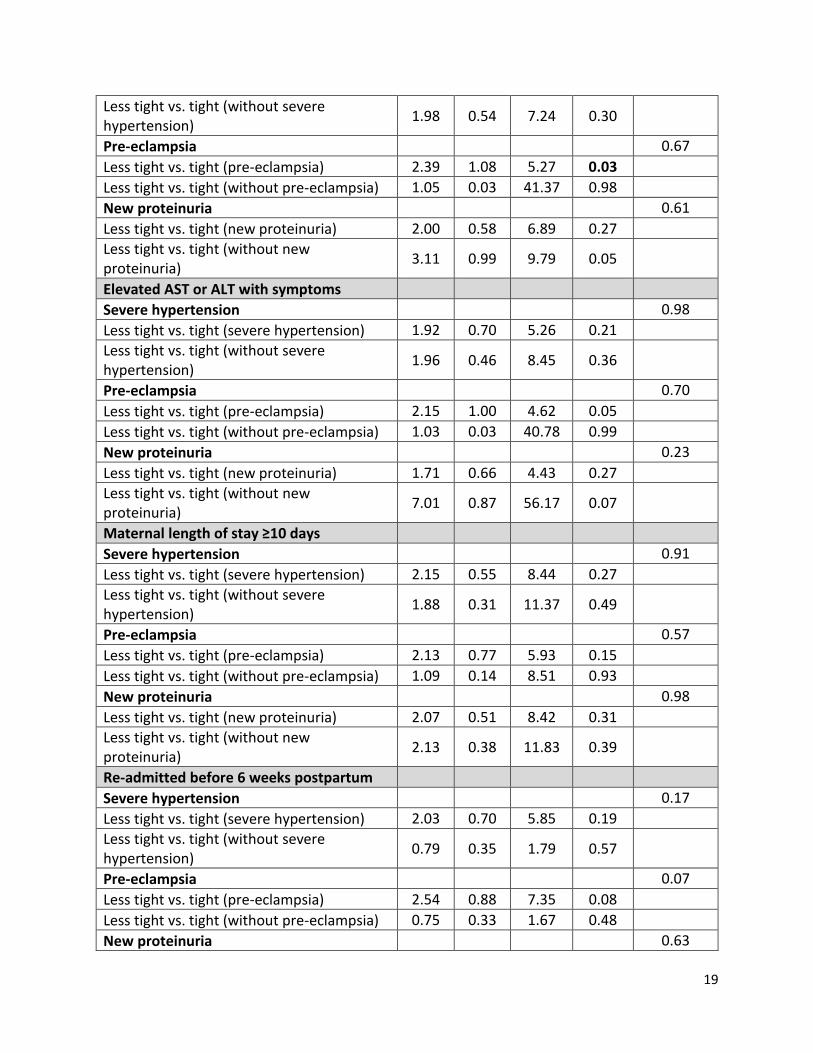
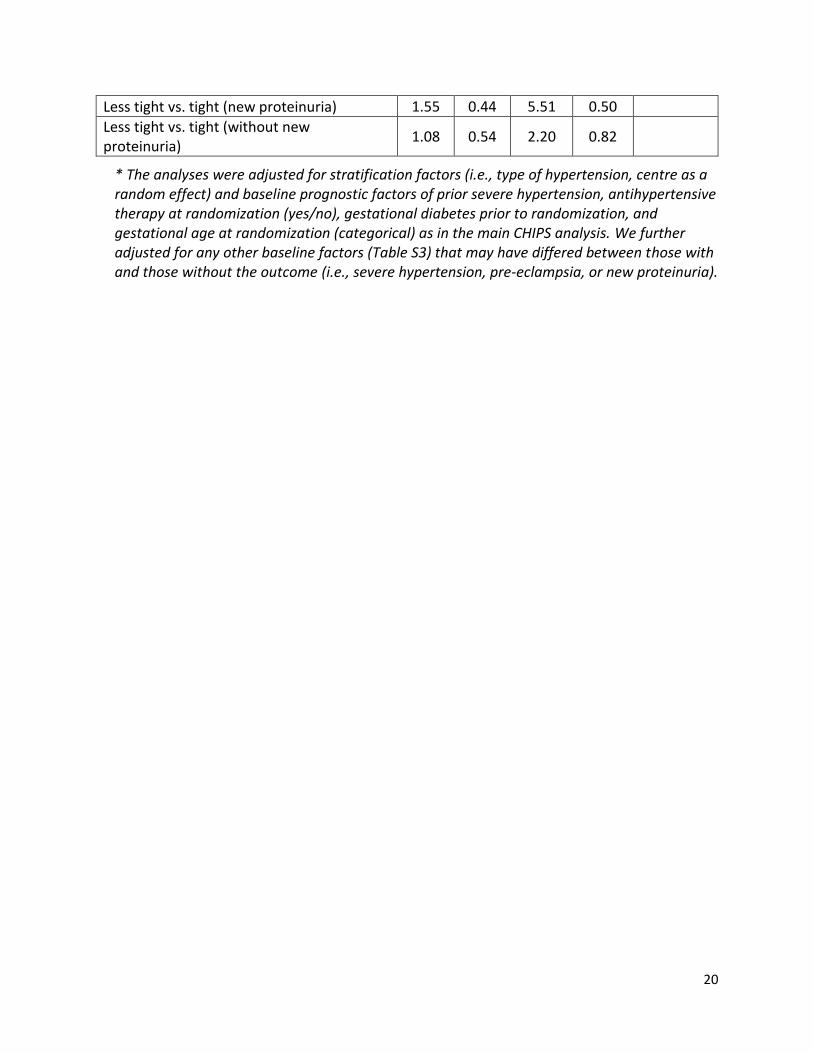
Table S5. Relationship between ‘less tight’ vs. ‘tight’ control for each of the adverse outcomes examined, according to the occurrence of post-randomization severe hypertension, pre-eclampsia, or new proteinuria
Outcomes Adjusted analysis*
P for homo-
geneity of OR
OR 95% CI P
Primary outcome
Severe hypertension 0.83
Less tight vs. tight (severe hypertension) 0.85 0.53 1.35 0.49
Less tight vs. tight (without severe hypertension)
0.91 0.61 1.33 0.61
Pre-eclampsia 0.53
Less tight vs. tight (pre-eclampsia) 0.92 0.62 1.35 0.67
Less tight vs. tight (without pre-eclampsia) 1.11 0.71 1.74 0.65
New proteinuria 0.98
Less tight vs. tight (new proteinuria) 1.02 0.62 1.69 0.94
Less tight vs. tight (without new proteinuria)
1.03 0.72 1.47 0.88
Birth weight < 10th centile
Severe hypertension 0.72
Less tight vs. tight (severe hypertension) 0.75 0.44 1.27 0.28
Less tight vs. tight (without severe hypertension)
0.64 0.41 1.01 0.06
Pre-eclampsia 0.36
Less tight vs. tight (pre-eclampsia) 0.87 0.56 1.35 0.53
Less tight vs. tight (without pre-eclampsia) 0.63 0.37 1.06 0.08
New proteinuria 0.70
Less tight vs. tight (new proteinuria) 0.86 0.48 1.54 0.62
Less tight vs. tight (without new proteinuria)
0.75 0.50 1.13 0.17
Serious maternal complications
Severe hypertension 0.13
Less tight vs. tight (severe hypertension) 3.44 0.91 13.08 0.07
Less tight vs. tight (without severe hypertension)
0.86 0.27 2.77 0.80
Pre-eclampsia 0.19
Less tight vs. tight (pre-eclampsia) 2.39 0.89 6.44 0.08
Less tight vs. tight (without pre-eclampsia) 0.72 0.16 3.26 0.67
New proteinuria 0.08
Less tight vs. tight (new proteinuria) 5.09 1.05 24.76 0.04
18
Less tight vs. tight (without new proteinuria)
0.95 0.35 2.63 0.92
Severe hypertension
Pre-eclampsia 0.82
Less tight vs. tight (pre-eclampsia) 1.88 1.27 2.79 0.002
Less tight vs. tight (without pre-eclampsia) 1.75 1.07 2.85 0.03
New proteinuria 0.26
Less tight vs. tight (new proteinuria) 2.36 1.40 3.99 0.001
Less tight vs. tight (without new proteinuria)
1.63 1.13 2.36 0.01
Pre-eclampsia
Severe hypertension 0.32
Less tight vs. tight (severe hypertension) 1.15 0.68 1.95 0.60
Less tight vs. tight (without severe hypertension)
0.84 0.59 1.18 0.31
Delivery at <37 weeks
Severe hypertension 0.81
Less tight vs. tight (severe hypertension) 1.04 0.65 1.67 0.86
Less tight vs. tight (without severe hypertension)
0.97 0.66 1.43 0.87
Pre-eclampsia 0.56
Less tight vs. tight (pre-eclampsia) 1.09 0.73 1.61 0.68
Less tight vs. tight (without pre-eclampsia) 1.30 0.82 2.08 0.27
New proteinuria 0.61
Less tight vs. tight (new proteinuria) 1.07 0.64 1.79 0.79
Less tight vs. tight (without new proteinuria)
1.26 0.87 1.82 0.21
Delivery at <34 weeks
Severe hypertension 0.45
Less tight vs. tight (severe hypertension) 1.22 0.72 2.08 0.46
Less tight vs. tight (without severe hypertension)
0.89 0.49 1.64 0.71
Pre-eclampsia 0.29
Less tight vs. tight (pre-eclampsia) 1.40 0.87 2.25 0.16
Less tight vs. tight (without pre-eclampsia) 0.88 0.43 1.890 0.73
New proteinuria 0.48
Less tight vs. tight (new proteinuria) 1.47 0.81 2.66 0.21
Less tight vs. tight (without new proteinuria)
1.10 0.66 1.83 0.70
Platelet count<100x109/L
Severe hypertension 0.65
Less tight vs. tight (severe hypertension) 2.96 0.92 9.53 0.07
19
Less tight vs. tight (without severe hypertension)
1.98 0.54 7.24 0.30
Pre-eclampsia 0.67
Less tight vs. tight (pre-eclampsia) 2.39 1.08 5.27 0.03
Less tight vs. tight (without pre-eclampsia) 1.05 0.03 41.37 0.98
New proteinuria 0.61
Less tight vs. tight (new proteinuria) 2.00 0.58 6.89 0.27
Less tight vs. tight (without new proteinuria)
3.11 0.99 9.79 0.05
Elevated AST or ALT with symptoms
Severe hypertension 0.98
Less tight vs. tight (severe hypertension) 1.92 0.70 5.26 0.21
Less tight vs. tight (without severe hypertension)
1.96 0.46 8.45 0.36
Pre-eclampsia 0.70
Less tight vs. tight (pre-eclampsia) 2.15 1.00 4.62 0.05
Less tight vs. tight (without pre-eclampsia) 1.03 0.03 40.78 0.99
New proteinuria 0.23
Less tight vs. tight (new proteinuria) 1.71 0.66 4.43 0.27
Less tight vs. tight (without new proteinuria)
7.01 0.87 56.17 0.07
Maternal length of stay ≥10 days
Severe hypertension 0.91
Less tight vs. tight (severe hypertension) 2.15 0.55 8.44 0.27
Less tight vs. tight (without severe hypertension)
1.88 0.31 11.37 0.49
Pre-eclampsia 0.57
Less tight vs. tight (pre-eclampsia) 2.13 0.77 5.93 0.15
Less tight vs. tight (without pre-eclampsia) 1.09 0.14 8.51 0.93
New proteinuria 0.98
Less tight vs. tight (new proteinuria) 2.07 0.51 8.42 0.31
Less tight vs. tight (without new proteinuria)
2.13 0.38 11.83 0.39
Re-admitted before 6 weeks postpartum
Severe hypertension 0.17
Less tight vs. tight (severe hypertension) 2.03 0.70 5.85 0.19
Less tight vs. tight (without severe hypertension)
0.79 0.35 1.79 0.57
Pre-eclampsia 0.07
Less tight vs. tight (pre-eclampsia) 2.54 0.88 7.35 0.08
Less tight vs. tight (without pre-eclampsia) 0.75 0.33 1.67 0.48
New proteinuria 0.63
20
Less tight vs. tight (new proteinuria) 1.55 0.44 5.51 0.50
Less tight vs. tight (without new proteinuria)
1.08 0.54 2.20 0.82
* The analyses were adjusted for stratification factors (i.e., type of hypertension, centre as a random effect) and baseline prognostic factors of prior severe hypertension, antihypertensive therapy at randomization (yes/no), gestational diabetes prior to randomization, and gestational age at randomization (categorical) as in the main CHIPS analysis. We further adjusted for any other baseline factors (Table S3) that may have differed between those with and those without the outcome (i.e., severe hypertension, pre-eclampsia, or new proteinuria).
21
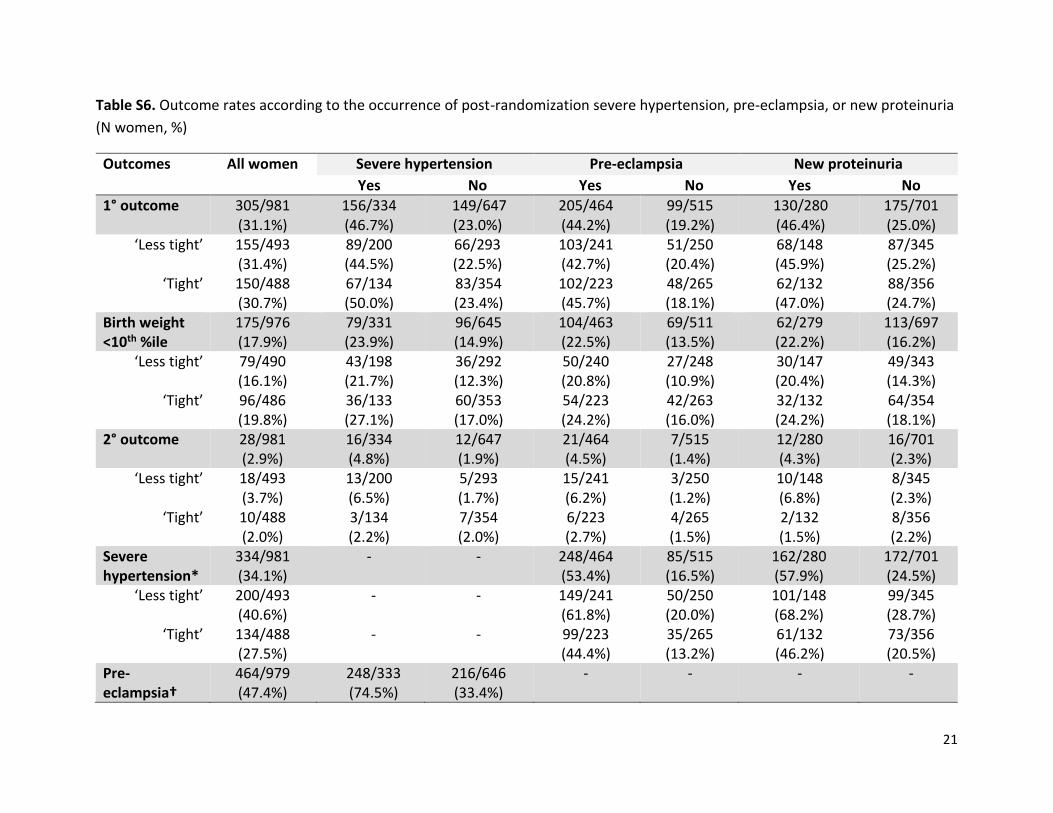
Table S6. Outcome rates according to the occurrence of post-randomization severe hypertension, pre-eclampsia, or new proteinuria
(N women, %)
Outcomes All women Severe hypertension Pre-eclampsia New proteinuria
Yes No Yes No Yes No
1° outcome 305/981 (31.1%)
156/334 (46.7%)
149/647 (23.0%)
205/464 (44.2%)
99/515 (19.2%)
130/280 (46.4%)
175/701 (25.0%)
‘Less tight’ 155/493 (31.4%)
89/200 (44.5%)
66/293 (22.5%)
103/241 (42.7%)
51/250 (20.4%)
68/148 (45.9%)
87/345 (25.2%)
‘Tight’ 150/488 (30.7%)
67/134 (50.0%)
83/354 (23.4%)
102/223 (45.7%)
48/265 (18.1%)
62/132 (47.0%)
88/356 (24.7%)
Birth weight <10th %ile
175/976 (17.9%)
79/331 (23.9%)
96/645 (14.9%)
104/463 (22.5%)
69/511 (13.5%)
62/279 (22.2%)
113/697 (16.2%)
‘Less tight’ 79/490 (16.1%)
43/198 (21.7%)
36/292 (12.3%)
50/240 (20.8%)
27/248 (10.9%)
30/147 (20.4%)
49/343 (14.3%)
‘Tight’ 96/486 (19.8%)
36/133 (27.1%)
60/353 (17.0%)
54/223 (24.2%)
42/263 (16.0%)
32/132 (24.2%)
64/354 (18.1%)
2° outcome 28/981 (2.9%)
16/334 (4.8%)
12/647 (1.9%)
21/464 (4.5%)
7/515 (1.4%)
12/280 (4.3%)
16/701 (2.3%)
‘Less tight’ 18/493 (3.7%)
13/200 (6.5%)
5/293 (1.7%)
15/241 (6.2%)
3/250 (1.2%)
10/148 (6.8%)
8/345 (2.3%)
‘Tight’ 10/488 (2.0%)
3/134 (2.2%)
7/354 (2.0%)
6/223 (2.7%)
4/265 (1.5%)
2/132 (1.5%)
8/356 (2.2%)
Severe hypertension*
334/981 (34.1%)
- - 248/464 (53.4%)
85/515 (16.5%)
162/280 (57.9%)
172/701 (24.5%)
‘Less tight’ 200/493 (40.6%)
- - 149/241 (61.8%)
50/250 (20.0%)
101/148 (68.2%)
99/345 (28.7%)
‘Tight’ 134/488 (27.5%)
- - 99/223 (44.4%)
35/265 (13.2%)
61/132 (46.2%)
73/356 (20.5%)
Pre-eclampsia†
464/979 (47.4%)
248/333 (74.5%)
216/646 (33.4%)
- - - -
22
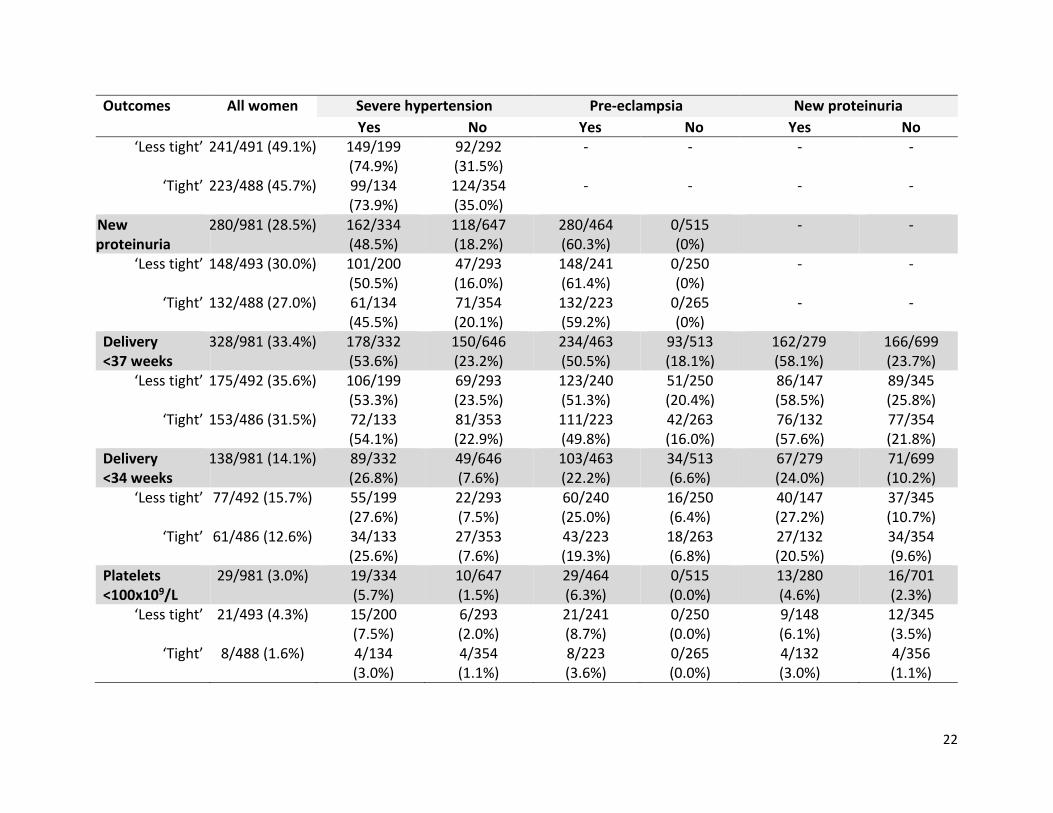
Outcomes All women Severe hypertension Pre-eclampsia New proteinuria
Yes No Yes No Yes No ‘Less tight’ 241/491 (49.1%) 149/199
(74.9%) 92/292 (31.5%)
- - - -
‘Tight’ 223/488 (45.7%) 99/134 (73.9%)
124/354 (35.0%)
- - - -
New proteinuria
280/981 (28.5%) 162/334 (48.5%)
118/647 (18.2%)
280/464 (60.3%)
0/515 (0%)
- -
‘Less tight’ 148/493 (30.0%) 101/200 (50.5%)
47/293 (16.0%)
148/241 (61.4%)
0/250 (0%)
- -
‘Tight’ 132/488 (27.0%) 61/134 (45.5%)
71/354 (20.1%)
132/223 (59.2%)
0/265 (0%)
- -
Delivery <37 weeks
328/981 (33.4%) 178/332 (53.6%)
150/646 (23.2%)
234/463 (50.5%)
93/513 (18.1%)
162/279 (58.1%)
166/699 (23.7%)
‘Less tight’ 175/492 (35.6%) 106/199 (53.3%)
69/293 (23.5%)
123/240 (51.3%)
51/250 (20.4%)
86/147 (58.5%)
89/345 (25.8%)
‘Tight’ 153/486 (31.5%) 72/133 (54.1%)
81/353 (22.9%)
111/223 (49.8%)
42/263 (16.0%)
76/132 (57.6%)
77/354 (21.8%)
Delivery <34 weeks
138/981 (14.1%) 89/332 (26.8%)
49/646 (7.6%)
103/463 (22.2%)
34/513 (6.6%)
67/279 (24.0%)
71/699 (10.2%)
‘Less tight’ 77/492 (15.7%) 55/199 (27.6%)
22/293 (7.5%)
60/240 (25.0%)
16/250 (6.4%)
40/147 (27.2%)
37/345 (10.7%)
‘Tight’ 61/486 (12.6%) 34/133 (25.6%)
27/353 (7.6%)
43/223 (19.3%)
18/263 (6.8%)
27/132 (20.5%)
34/354 (9.6%)
Platelets <100x109/L
29/981 (3.0%) 19/334 (5.7%)
10/647 (1.5%)
29/464 (6.3%)
0/515 (0.0%)
13/280 (4.6%)
16/701 (2.3%)
‘Less tight’ 21/493 (4.3%) 15/200 (7.5%)
6/293 (2.0%)
21/241 (8.7%)
0/250 (0.0%)
9/148 (6.1%)
12/345 (3.5%)
‘Tight’ 8/488 (1.6%) 4/134 (3.0%)
4/354 (1.1%)
8/223 (3.6%)
0/265 (0.0%)
4/132 (3.0%)
4/356 (1.1%)
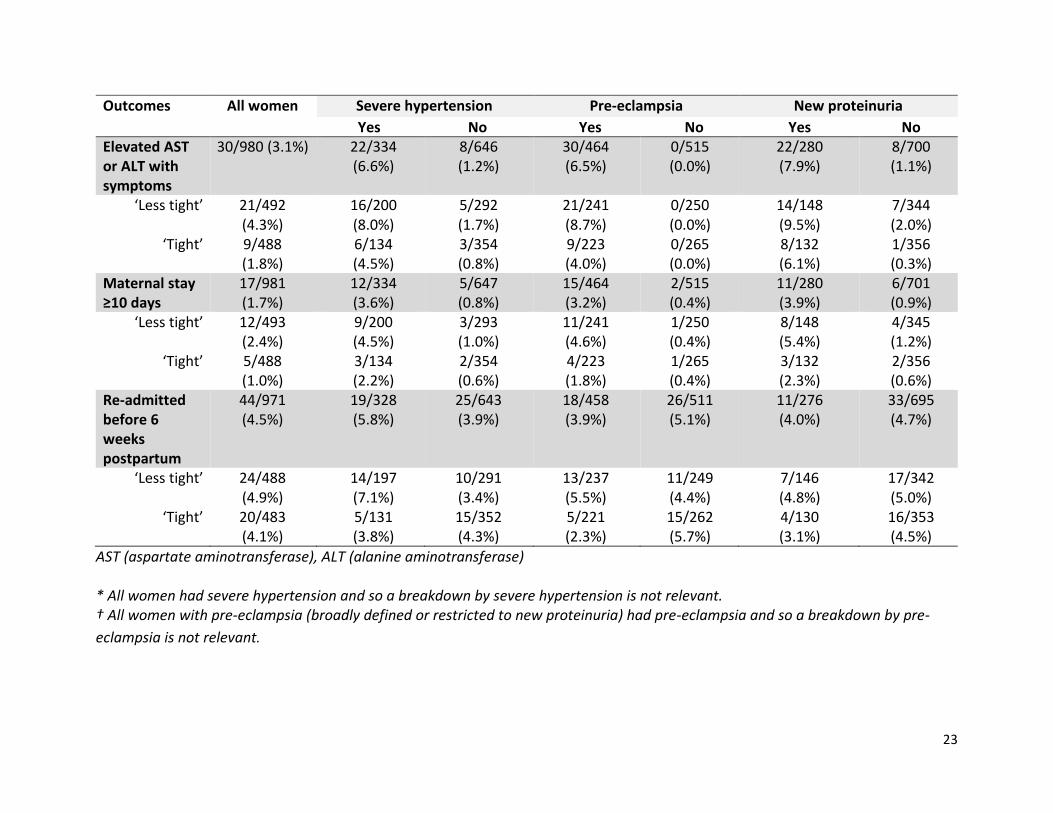
23
Outcomes All women Severe hypertension Pre-eclampsia New proteinuria
Yes No Yes No Yes No Elevated AST or ALT with symptoms
30/980 (3.1%) 22/334 (6.6%)
8/646 (1.2%)
30/464 (6.5%)
0/515 (0.0%)
22/280 (7.9%)
8/700 (1.1%)
‘Less tight’ 21/492 (4.3%)
16/200 (8.0%)
5/292 (1.7%)
21/241 (8.7%)
0/250 (0.0%)
14/148 (9.5%)
7/344 (2.0%)
‘Tight’ 9/488 (1.8%)
6/134 (4.5%)
3/354 (0.8%)
9/223 (4.0%)
0/265 (0.0%)
8/132 (6.1%)
1/356 (0.3%)
Maternal stay ≥10 days
17/981 (1.7%)
12/334 (3.6%)
5/647 (0.8%)
15/464 (3.2%)
2/515 (0.4%)
11/280 (3.9%)
6/701 (0.9%)
‘Less tight’ 12/493 (2.4%)
9/200 (4.5%)
3/293 (1.0%)
11/241 (4.6%)
1/250 (0.4%)
8/148 (5.4%)
4/345 (1.2%)
‘Tight’ 5/488 (1.0%)
3/134 (2.2%)
2/354 (0.6%)
4/223 (1.8%)
1/265 (0.4%)
3/132 (2.3%)
2/356 (0.6%)
Re-admitted before 6 weeks postpartum
44/971 (4.5%)
19/328 (5.8%)
25/643 (3.9%)
18/458 (3.9%)
26/511 (5.1%)
11/276 (4.0%)
33/695 (4.7%)
‘Less tight’ 24/488 (4.9%)
14/197 (7.1%)
10/291 (3.4%)
13/237 (5.5%)
11/249 (4.4%)
7/146 (4.8%)
17/342 (5.0%)
‘Tight’ 20/483 (4.1%)
5/131 (3.8%)
15/352 (4.3%)
5/221 (2.3%)
15/262 (5.7%)
4/130 (3.1%)
16/353 (4.5%)
AST (aspartate aminotransferase), ALT (alanine aminotransferase) * All women had severe hypertension and so a breakdown by severe hypertension is not relevant. † All women with pre-eclampsia (broadly defined or restricted to new proteinuria) had pre-eclampsia and so a breakdown by pre-
eclampsia is not relevant.
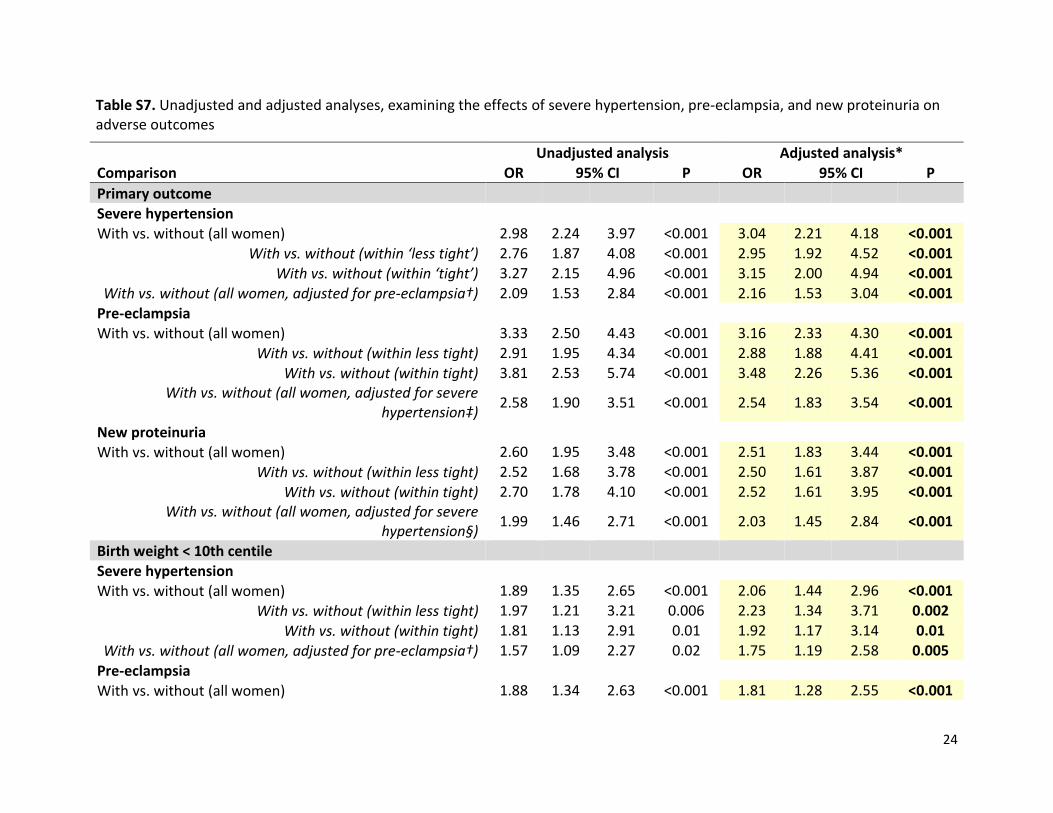
24
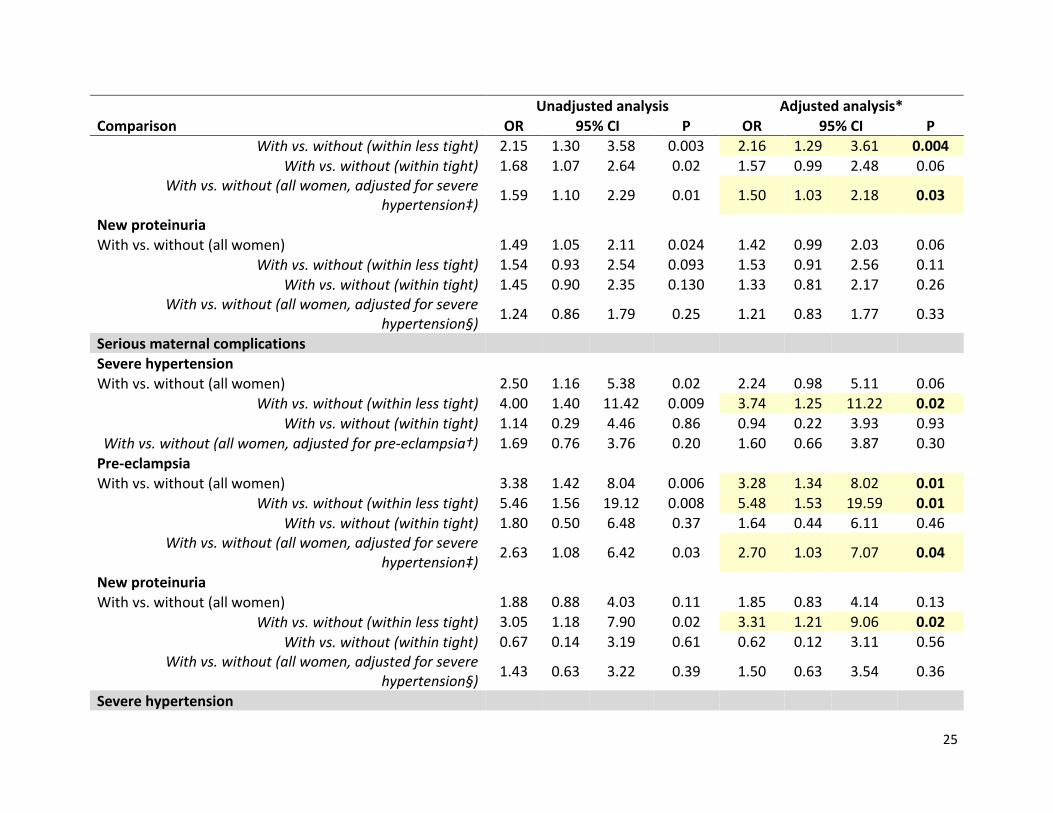
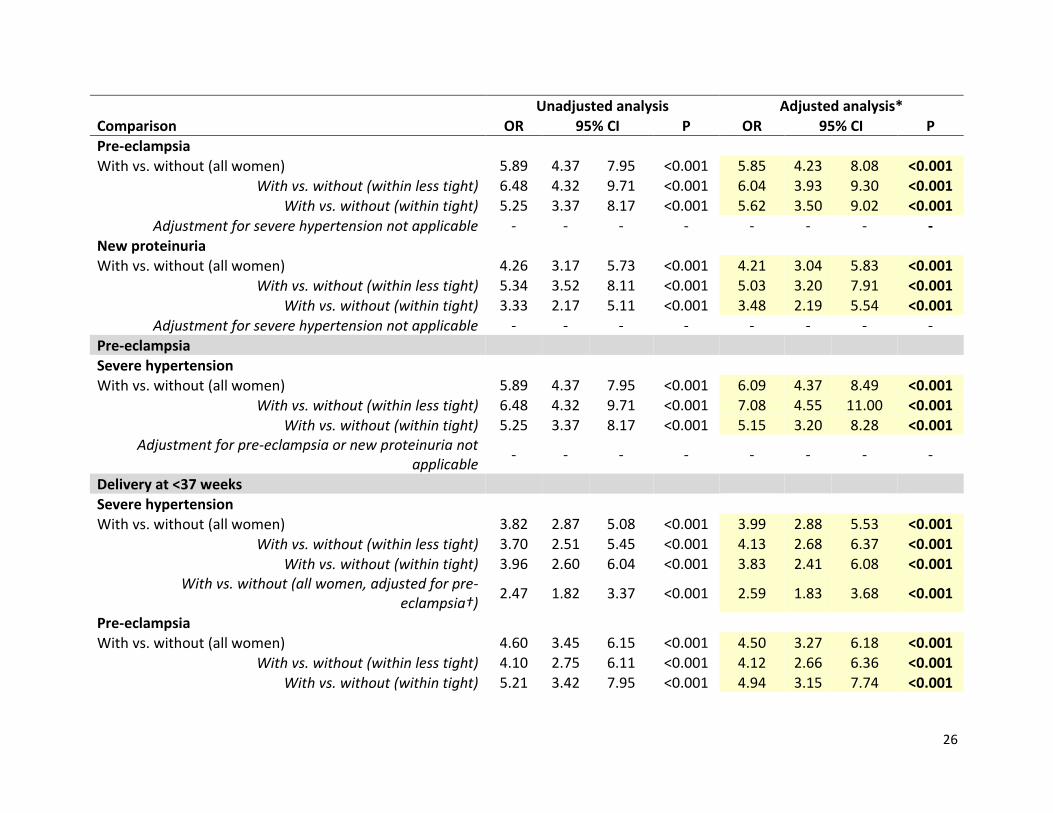
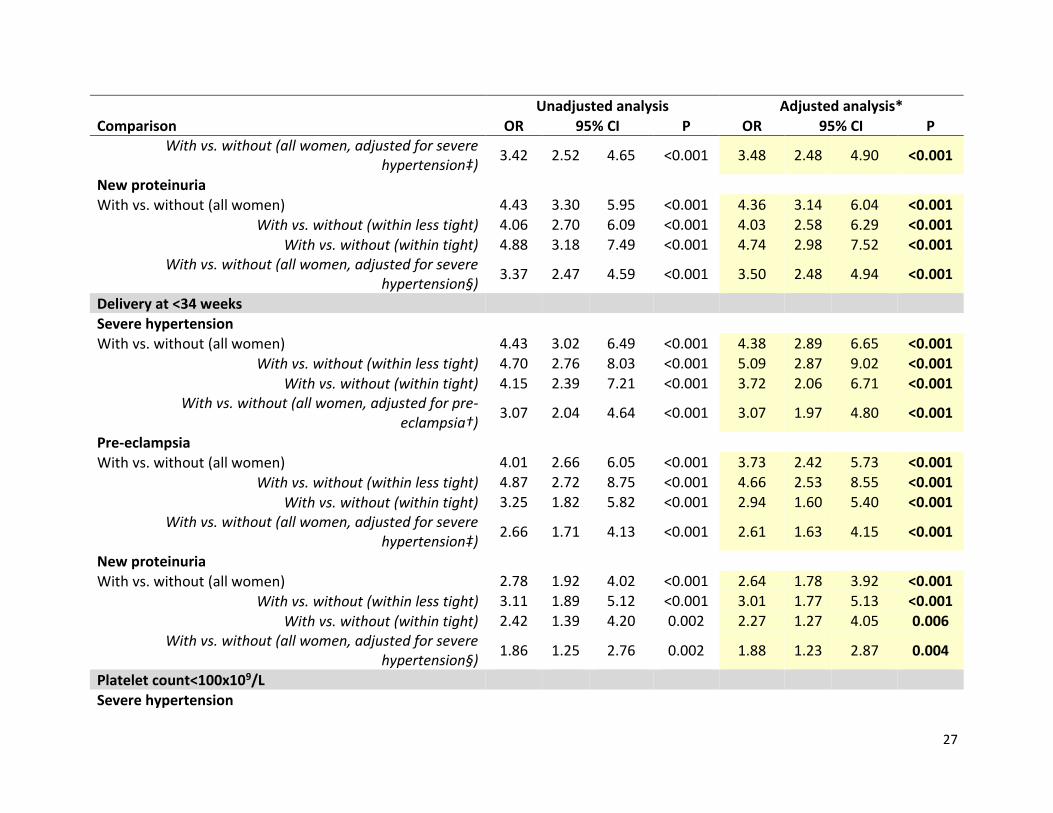
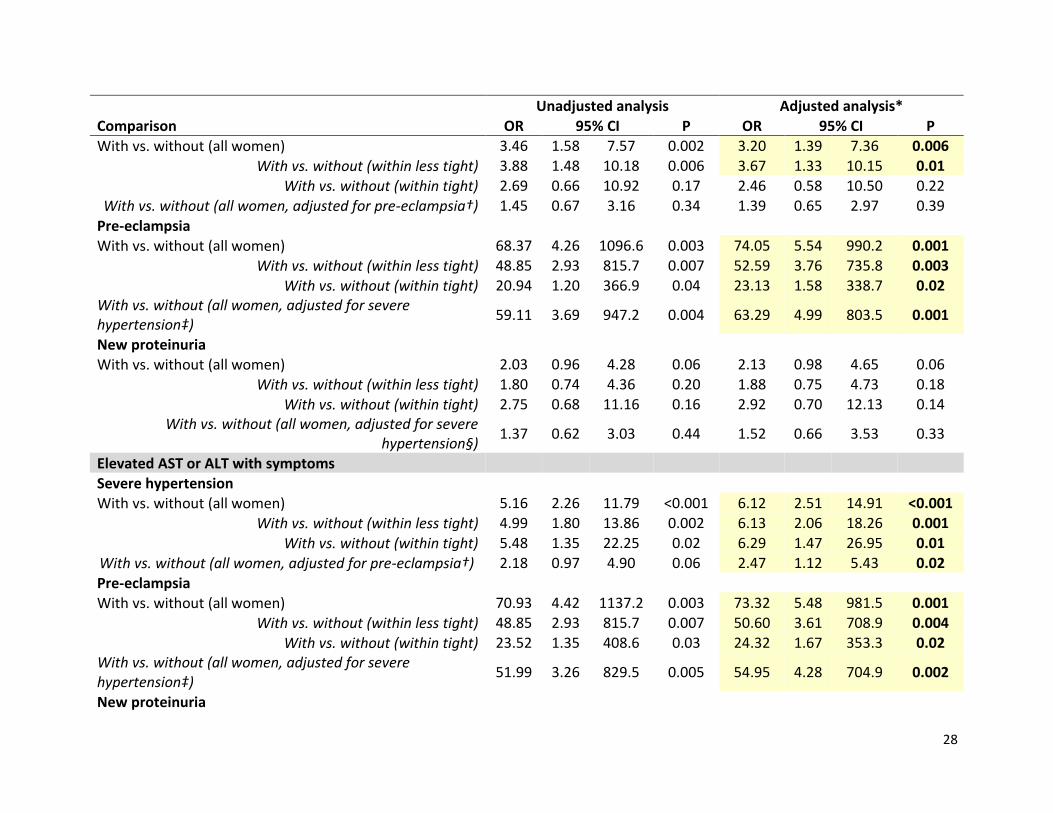
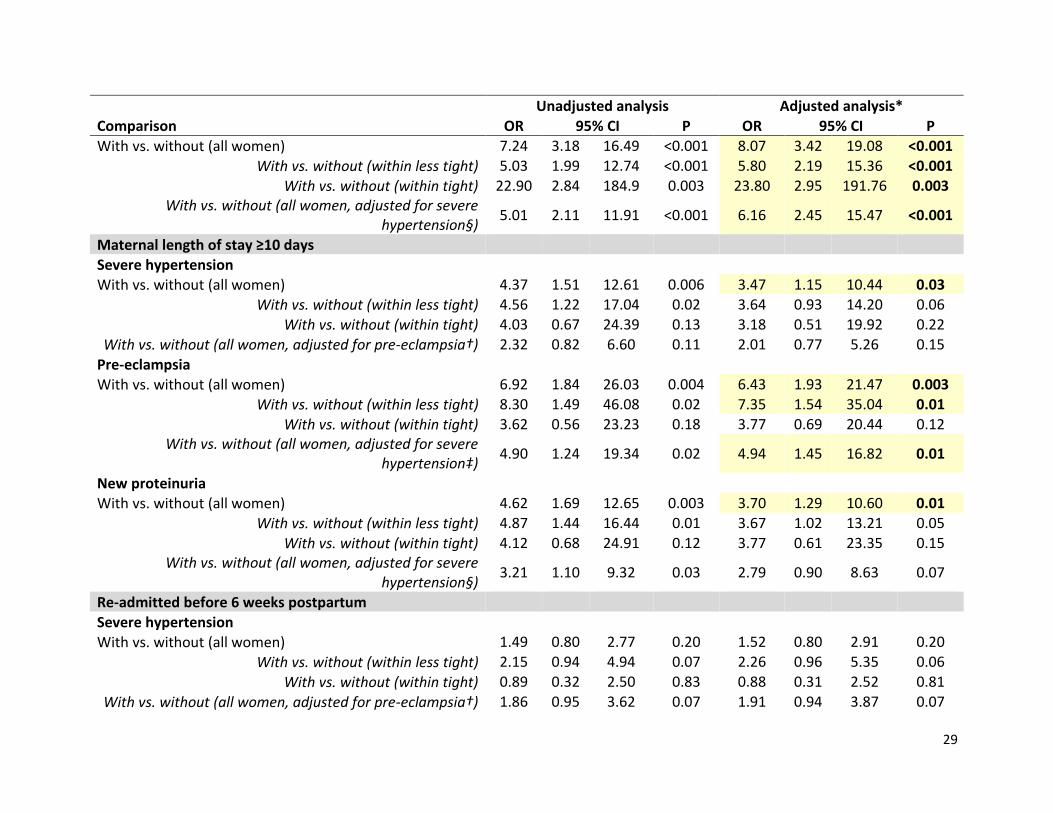
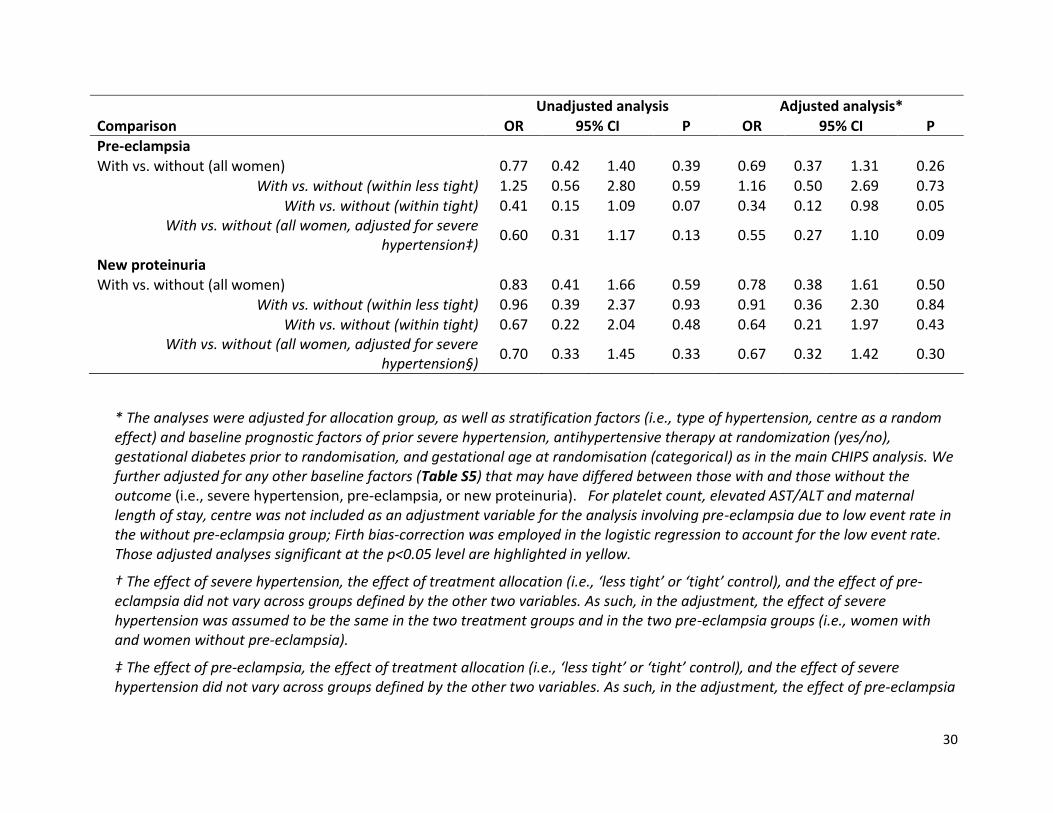
Table S7. Unadjusted and adjusted analyses, examining the effects of severe hypertension, pre-eclampsia, and new proteinuria on adverse outcomes
Unadjusted analysis Adjusted analysis* Comparison OR 95% CI P OR 95% CI P
Primary outcome
Severe hypertension
With vs. without (all women) 2.98 2.24 3.97 <0.001 3.04 2.21 4.18 <0.001
With vs. without (within ‘less tight’) 2.76 1.87 4.08 <0.001 2.95 1.92 4.52 <0.001
With vs. without (within ‘tight’) 3.27 2.15 4.96 <0.001 3.15 2.00 4.94 <0.001
With vs. without (all women, adjusted for pre-eclampsia†) 2.09 1.53 2.84 <0.001 2.16 1.53 3.04 <0.001
Pre-eclampsia
With vs. without (all women) 3.33 2.50 4.43 <0.001 3.16 2.33 4.30 <0.001
With vs. without (within less tight) 2.91 1.95 4.34 <0.001 2.88 1.88 4.41 <0.001
With vs. without (within tight) 3.81 2.53 5.74 <0.001 3.48 2.26 5.36 <0.001 With vs. without (all women, adjusted for severe
hypertension‡) 2.58 1.90 3.51 <0.001 2.54 1.83 3.54 <0.001
New proteinuria
With vs. without (all women) 2.60 1.95 3.48 <0.001 2.51 1.83 3.44 <0.001
With vs. without (within less tight) 2.52 1.68 3.78 <0.001 2.50 1.61 3.87 <0.001
With vs. without (within tight) 2.70 1.78 4.10 <0.001 2.52 1.61 3.95 <0.001 With vs. without (all women, adjusted for severe
hypertension§) 1.99 1.46 2.71 <0.001 2.03 1.45 2.84 <0.001
Birth weight < 10th centile
Severe hypertension
With vs. without (all women) 1.89 1.35 2.65 <0.001 2.06 1.44 2.96 <0.001
With vs. without (within less tight) 1.97 1.21 3.21 0.006 2.23 1.34 3.71 0.002
With vs. without (within tight) 1.81 1.13 2.91 0.01 1.92 1.17 3.14 0.01
With vs. without (all women, adjusted for pre-eclampsia†) 1.57 1.09 2.27 0.02 1.75 1.19 2.58 0.005
Pre-eclampsia
With vs. without (all women) 1.88 1.34 2.63 <0.001 1.81 1.28 2.55 <0.001
25
Unadjusted analysis Adjusted analysis* Comparison OR 95% CI P OR 95% CI P
With vs. without (within less tight) 2.15 1.30 3.58 0.003 2.16 1.29 3.61 0.004
With vs. without (within tight) 1.68 1.07 2.64 0.02 1.57 0.99 2.48 0.06 With vs. without (all women, adjusted for severe
hypertension‡) 1.59 1.10 2.29 0.01 1.50 1.03 2.18 0.03
New proteinuria
With vs. without (all women) 1.49 1.05 2.11 0.024 1.42 0.99 2.03 0.06
With vs. without (within less tight) 1.54 0.93 2.54 0.093 1.53 0.91 2.56 0.11
With vs. without (within tight) 1.45 0.90 2.35 0.130 1.33 0.81 2.17 0.26 With vs. without (all women, adjusted for severe
hypertension§) 1.24 0.86 1.79 0.25 1.21 0.83 1.77 0.33
Serious maternal complications
Severe hypertension
With vs. without (all women) 2.50 1.16 5.38 0.02 2.24 0.98 5.11 0.06
With vs. without (within less tight) 4.00 1.40 11.42 0.009 3.74 1.25 11.22 0.02
With vs. without (within tight) 1.14 0.29 4.46 0.86 0.94 0.22 3.93 0.93
With vs. without (all women, adjusted for pre-eclampsia†) 1.69 0.76 3.76 0.20 1.60 0.66 3.87 0.30
Pre-eclampsia
With vs. without (all women) 3.38 1.42 8.04 0.006 3.28 1.34 8.02 0.01
With vs. without (within less tight) 5.46 1.56 19.12 0.008 5.48 1.53 19.59 0.01
With vs. without (within tight) 1.80 0.50 6.48 0.37 1.64 0.44 6.11 0.46 With vs. without (all women, adjusted for severe
hypertension‡) 2.63 1.08 6.42 0.03 2.70 1.03 7.07 0.04
New proteinuria
With vs. without (all women) 1.88 0.88 4.03 0.11 1.85 0.83 4.14 0.13
With vs. without (within less tight) 3.05 1.18 7.90 0.02 3.31 1.21 9.06 0.02
With vs. without (within tight) 0.67 0.14 3.19 0.61 0.62 0.12 3.11 0.56 With vs. without (all women, adjusted for severe
hypertension§) 1.43 0.63 3.22 0.39 1.50 0.63 3.54 0.36
Severe hypertension
26
Unadjusted analysis Adjusted analysis* Comparison OR 95% CI P OR 95% CI P
Pre-eclampsia
With vs. without (all women) 5.89 4.37 7.95 <0.001 5.85 4.23 8.08 <0.001
With vs. without (within less tight) 6.48 4.32 9.71 <0.001 6.04 3.93 9.30 <0.001
With vs. without (within tight) 5.25 3.37 8.17 <0.001 5.62 3.50 9.02 <0.001
Adjustment for severe hypertension not applicable - - - - - - - -
New proteinuria
With vs. without (all women) 4.26 3.17 5.73 <0.001 4.21 3.04 5.83 <0.001
With vs. without (within less tight) 5.34 3.52 8.11 <0.001 5.03 3.20 7.91 <0.001
With vs. without (within tight) 3.33 2.17 5.11 <0.001 3.48 2.19 5.54 <0.001
Adjustment for severe hypertension not applicable - - - - - - - -
Pre-eclampsia
Severe hypertension
With vs. without (all women) 5.89 4.37 7.95 <0.001 6.09 4.37 8.49 <0.001
With vs. without (within less tight) 6.48 4.32 9.71 <0.001 7.08 4.55 11.00 <0.001
With vs. without (within tight) 5.25 3.37 8.17 <0.001 5.15 3.20 8.28 <0.001 Adjustment for pre-eclampsia or new proteinuria not
applicable - - - - - - - -
Delivery at <37 weeks
Severe hypertension
With vs. without (all women) 3.82 2.87 5.08 <0.001 3.99 2.88 5.53 <0.001
With vs. without (within less tight) 3.70 2.51 5.45 <0.001 4.13 2.68 6.37 <0.001
With vs. without (within tight) 3.96 2.60 6.04 <0.001 3.83 2.41 6.08 <0.001 With vs. without (all women, adjusted for pre-
eclampsia†) 2.47 1.82 3.37 <0.001 2.59 1.83 3.68 <0.001
Pre-eclampsia
With vs. without (all women) 4.60 3.45 6.15 <0.001 4.50 3.27 6.18 <0.001
With vs. without (within less tight) 4.10 2.75 6.11 <0.001 4.12 2.66 6.36 <0.001
With vs. without (within tight) 5.21 3.42 7.95 <0.001 4.94 3.15 7.74 <0.001
27
Unadjusted analysis Adjusted analysis* Comparison OR 95% CI P OR 95% CI P
With vs. without (all women, adjusted for severe hypertension‡)
3.42 2.52 4.65 <0.001 3.48 2.48 4.90 <0.001
New proteinuria
With vs. without (all women) 4.43 3.30 5.95 <0.001 4.36 3.14 6.04 <0.001
With vs. without (within less tight) 4.06 2.70 6.09 <0.001 4.03 2.58 6.29 <0.001
With vs. without (within tight) 4.88 3.18 7.49 <0.001 4.74 2.98 7.52 <0.001 With vs. without (all women, adjusted for severe
hypertension§) 3.37 2.47 4.59 <0.001 3.50 2.48 4.94 <0.001
Delivery at <34 weeks
Severe hypertension
With vs. without (all women) 4.43 3.02 6.49 <0.001 4.38 2.89 6.65 <0.001
With vs. without (within less tight) 4.70 2.76 8.03 <0.001 5.09 2.87 9.02 <0.001
With vs. without (within tight) 4.15 2.39 7.21 <0.001 3.72 2.06 6.71 <0.001 With vs. without (all women, adjusted for pre-
eclampsia†) 3.07 2.04 4.64 <0.001 3.07 1.97 4.80 <0.001
Pre-eclampsia
With vs. without (all women) 4.01 2.66 6.05 <0.001 3.73 2.42 5.73 <0.001
With vs. without (within less tight) 4.87 2.72 8.75 <0.001 4.66 2.53 8.55 <0.001
With vs. without (within tight) 3.25 1.82 5.82 <0.001 2.94 1.60 5.40 <0.001 With vs. without (all women, adjusted for severe
hypertension‡) 2.66 1.71 4.13 <0.001 2.61 1.63 4.15 <0.001
New proteinuria
With vs. without (all women) 2.78 1.92 4.02 <0.001 2.64 1.78 3.92 <0.001
With vs. without (within less tight) 3.11 1.89 5.12 <0.001 3.01 1.77 5.13 <0.001
With vs. without (within tight) 2.42 1.39 4.20 0.002 2.27 1.27 4.05 0.006 With vs. without (all women, adjusted for severe
hypertension§) 1.86 1.25 2.76 0.002 1.88 1.23 2.87 0.004
Platelet count<100x109/L
Severe hypertension
28
Unadjusted analysis Adjusted analysis* Comparison OR 95% CI P OR 95% CI P
With vs. without (all women) 3.46 1.58 7.57 0.002 3.20 1.39 7.36 0.006
With vs. without (within less tight) 3.88 1.48 10.18 0.006 3.67 1.33 10.15 0.01
With vs. without (within tight) 2.69 0.66 10.92 0.17 2.46 0.58 10.50 0.22
With vs. without (all women, adjusted for pre-eclampsia†) 1.45 0.67 3.16 0.34 1.39 0.65 2.97 0.39
Pre-eclampsia
With vs. without (all women) 68.37 4.26 1096.6 0.003 74.05 5.54 990.2 0.001
With vs. without (within less tight) 48.85 2.93 815.7 0.007 52.59 3.76 735.8 0.003
With vs. without (within tight) 20.94 1.20 366.9 0.04 23.13 1.58 338.7 0.02 With vs. without (all women, adjusted for severe hypertension‡)
59.11 3.69 947.2 0.004 63.29 4.99 803.5 0.001
New proteinuria
With vs. without (all women) 2.03 0.96 4.28 0.06 2.13 0.98 4.65 0.06
With vs. without (within less tight) 1.80 0.74 4.36 0.20 1.88 0.75 4.73 0.18
With vs. without (within tight) 2.75 0.68 11.16 0.16 2.92 0.70 12.13 0.14 With vs. without (all women, adjusted for severe
hypertension§) 1.37 0.62 3.03 0.44 1.52 0.66 3.53 0.33
Elevated AST or ALT with symptoms
Severe hypertension
With vs. without (all women) 5.16 2.26 11.79 <0.001 6.12 2.51 14.91 <0.001
With vs. without (within less tight) 4.99 1.80 13.86 0.002 6.13 2.06 18.26 0.001
With vs. without (within tight) 5.48 1.35 22.25 0.02 6.29 1.47 26.95 0.01
With vs. without (all women, adjusted for pre-eclampsia†) 2.18 0.97 4.90 0.06 2.47 1.12 5.43 0.02
Pre-eclampsia
With vs. without (all women) 70.93 4.42 1137.2 0.003 73.32 5.48 981.5 0.001
With vs. without (within less tight) 48.85 2.93 815.7 0.007 50.60 3.61 708.9 0.004
With vs. without (within tight) 23.52 1.35 408.6 0.03 24.32 1.67 353.3 0.02 With vs. without (all women, adjusted for severe hypertension‡)
51.99 3.26 829.5 0.005 54.95 4.28 704.9 0.002
New proteinuria
29
Unadjusted analysis Adjusted analysis* Comparison OR 95% CI P OR 95% CI P
With vs. without (all women) 7.24 3.18 16.49 <0.001 8.07 3.42 19.08 <0.001
With vs. without (within less tight) 5.03 1.99 12.74 <0.001 5.80 2.19 15.36 <0.001
With vs. without (within tight) 22.90 2.84 184.9 0.003 23.80 2.95 191.76 0.003 With vs. without (all women, adjusted for severe
hypertension§) 5.01 2.11 11.91 <0.001 6.16 2.45 15.47 <0.001
Maternal length of stay ≥10 days
Severe hypertension
With vs. without (all women) 4.37 1.51 12.61 0.006 3.47 1.15 10.44 0.03
With vs. without (within less tight) 4.56 1.22 17.04 0.02 3.64 0.93 14.20 0.06
With vs. without (within tight) 4.03 0.67 24.39 0.13 3.18 0.51 19.92 0.22
With vs. without (all women, adjusted for pre-eclampsia†) 2.32 0.82 6.60 0.11 2.01 0.77 5.26 0.15
Pre-eclampsia
With vs. without (all women) 6.92 1.84 26.03 0.004 6.43 1.93 21.47 0.003
With vs. without (within less tight) 8.30 1.49 46.08 0.02 7.35 1.54 35.04 0.01
With vs. without (within tight) 3.62 0.56 23.23 0.18 3.77 0.69 20.44 0.12 With vs. without (all women, adjusted for severe
hypertension‡) 4.90 1.24 19.34 0.02 4.94 1.45 16.82 0.01
New proteinuria
With vs. without (all women) 4.62 1.69 12.65 0.003 3.70 1.29 10.60 0.01
With vs. without (within less tight) 4.87 1.44 16.44 0.01 3.67 1.02 13.21 0.05
With vs. without (within tight) 4.12 0.68 24.91 0.12 3.77 0.61 23.35 0.15 With vs. without (all women, adjusted for severe
hypertension§) 3.21 1.10 9.32 0.03 2.79 0.90 8.63 0.07
Re-admitted before 6 weeks postpartum
Severe hypertension
With vs. without (all women) 1.49 0.80 2.77 0.20 1.52 0.80 2.91 0.20
With vs. without (within less tight) 2.15 0.94 4.94 0.07 2.26 0.96 5.35 0.06
With vs. without (within tight) 0.89 0.32 2.50 0.83 0.88 0.31 2.52 0.81
With vs. without (all women, adjusted for pre-eclampsia†) 1.86 0.95 3.62 0.07 1.91 0.94 3.87 0.07
30
Unadjusted analysis Adjusted analysis* Comparison OR 95% CI P OR 95% CI P
Pre-eclampsia
With vs. without (all women) 0.77 0.42 1.40 0.39 0.69 0.37 1.31 0.26
With vs. without (within less tight) 1.25 0.56 2.80 0.59 1.16 0.50 2.69 0.73
With vs. without (within tight) 0.41 0.15 1.09 0.07 0.34 0.12 0.98 0.05 With vs. without (all women, adjusted for severe
hypertension‡) 0.60 0.31 1.17 0.13 0.55 0.27 1.10 0.09
New proteinuria
With vs. without (all women) 0.83 0.41 1.66 0.59 0.78 0.38 1.61 0.50
With vs. without (within less tight) 0.96 0.39 2.37 0.93 0.91 0.36 2.30 0.84
With vs. without (within tight) 0.67 0.22 2.04 0.48 0.64 0.21 1.97 0.43 With vs. without (all women, adjusted for severe
hypertension§) 0.70 0.33 1.45 0.33 0.67 0.32 1.42 0.30
* The analyses were adjusted for allocation group, as well as stratification factors (i.e., type of hypertension, centre as a random effect) and baseline prognostic factors of prior severe hypertension, antihypertensive therapy at randomization (yes/no), gestational diabetes prior to randomisation, and gestational age at randomisation (categorical) as in the main CHIPS analysis. We further adjusted for any other baseline factors (Table S5) that may have differed between those with and those without the outcome (i.e., severe hypertension, pre-eclampsia, or new proteinuria). For platelet count, elevated AST/ALT and maternal length of stay, centre was not included as an adjustment variable for the analysis involving pre-eclampsia due to low event rate in the without pre-eclampsia group; Firth bias-correction was employed in the logistic regression to account for the low event rate. Those adjusted analyses significant at the p<0.05 level are highlighted in yellow.
† The effect of severe hypertension, the effect of treatment allocation (i.e., ‘less tight’ or ‘tight’ control), and the effect of pre-eclampsia did not vary across groups defined by the other two variables. As such, in the adjustment, the effect of severe hypertension was assumed to be the same in the two treatment groups and in the two pre-eclampsia groups (i.e., women with and women without pre-eclampsia).
‡ The effect of pre-eclampsia, the effect of treatment allocation (i.e., ‘less tight’ or ‘tight’ control), and the effect of severe hypertension did not vary across groups defined by the other two variables. As such, in the adjustment, the effect of pre-eclampsia
31
was assumed to be the same in the two treatment groups and in the two severe hypertension groups (i.e., women with and women without severe hypertension).
§ The effect of new proteinuria, the effect of treatment allocation (i.e., ‘less tight’ or ‘tight’ control), and the effect of severe hypertension did not vary across groups defined by the other two variables. As such, in the adjustment, the effect of new proteinuria was assumed to be the same in the two treatment groups and in the two severe hypertension groups (i.e., women with and women without severe hypertension).