Embed Size (px)
Citation preview
690
The renin–angiotensin system (RAS) is one of the most important and well-studied regulatory hormonal systems
in medicine and plays a role in blood pressure regulation, fluid and electrolyte balance, and development.1 The decapeptide angiotensin (Ang) I, (Ang[1–10]), is cleaved from the N terminus of angiotensinogen by renin, and further cleavage by Ang-converting enzyme (ACE), chymase, neprilysin (NEP), aminopeptidase (AP) A, AP N, ACE2, and other RAS-associated peptidases produce a cocktail of bioactive fragments which act through various cell surface receptors (Ang II type 1 [AT
1], AT
2, AT
4, and AT
7).2–6 Distinct receptor activation
can lead to opposing biological effects (eg, vasoconstriction versus vasodilatation), and our understanding of how these effects associate with the signaling flux across this cocktail of peptides is limited. Pharmacological blockade of the RAS is a therapeutic modality extensively used in clinical practice and specifically aimed to antagonize the generation or actions of Ang II (Ang[1–8]) to treat essential hypertension, heart failure, and chronic kidney disease.7–11 Although the introduction of RAS antagonists, that is ACE inhibitors, Ang AT
1 receptor
blockers, and direct renin inhibitors into clinical practice have significantly improved treatment options, there are certain
scenarios where the lack of a complete understanding of the intricacies of the local RAS may be limiting the potential for designing therapeutically valuable manipulations of the system.12–15 To date, study of the RAS has focused primarily on Ang II. Nonetheless, pharmacological alterations of the RAS result in simultaneous changes in abundance of various Ang peptides, as well as in compensatory changes in expression and activity of the participating RAS enzymes. The final stimulatory signal at a given cell reflects the combined concentrations of a cocktail of Ang peptides and their corresponding receptors present locally. In addition to Ang II, other peptide fragments (Ang[1–7], Ang[1–9], Ang[2–10], Ang III [Ang{2–8}], Ang IV [Ang{3–8}], Ang[2–7], Ang[3–7], and Ang[3–4]) have been identified as potentially bioactive, with actions in concert or in opposition.16–22 Local RAS systems have been identified in the kidney, heart, lung, liver, vasculature, and nervous system, and are, presumably, part of nearly every organ system.23 Of note, the RAS localized in the kidney is characterized by the highest tissue concentration of Ang II.24,25 We are only now beginning to understand the complexity of the network of peptidases that produce this profile and how that network differs across localities.
Abstract—New insights into the intrarenal renin–angiotensin (Ang) system have modified our traditional view of the system. However, many finer details of this network of peptides and associated peptidases remain unclear. We hypothesized that a computational systems biology approach, applied to peptidomic data, could help to unravel the network of enzymatic conversions. We built and refined a Bayesian network model and a dynamic systems model starting from a skeleton created with established elements of the renin–Ang system and further developed it with archived matrix-assisted laser desorption ionization-time of flight mass spectra from experiments conducted in mouse podocytes exposed to exogenous Ang substrates. The model-building process suggested previously unrecognized steps, 3 of which were confirmed in vitro, including the conversion of Ang(2–10) to Ang(2–7) by neprilysin, Ang(1–9) to Ang(2–9), and Ang(1–7) to Ang(2–7) by aminopeptidase A. These data suggest a wider role of neprilysin and aminopeptidase A in glomerular formation of bioactive Ang peptides and shunting their formation. Other steps were also suggested by the model, and supporting evidence for those steps was evaluated using model-comparison methods. Our results demonstrate that systems biology methods applied to peptidomic data are effective in identifying novel steps in the Ang peptide processing network, and these findings improve our understanding of the glomerular renin–Ang system. (Hypertension. 2013;61:690-700.) ● Online Data Supplement
Key Words: mass spectrometry ■ proteomics ■ renin–angiotensin system ■ systems biology
Received October 9, 2012; first decision November 26, 2012; revision accepted November 27, 2012.From the Department of Biochemistry and Molecular Biology (J.H.S., J.C.G.S.) and Division of Nephrology, Department of Medicine (J.L.L., J.M.C.,
J.M.A., M.G.J., J.C.Q.V.), Medical University of South Carolina, Charleston, SC; and Medical and Research Services, Ralph H. Johnson Veterans Affairs Medical Center, Charleston, SC (J.M.A., M.G.J., J.C.Q.V.).
The online-only Data Supplement is available with this article at http://hyper.ahajournals.org/lookup/suppl/doi:10.1161/HYPERTENSIONAHA. 111.00318/-/DC1.
Correspondence to Juan Carlos Q. Velez, Division of Nephrology, Medical University of South Carolina, Clinical Science Bldg, 829 96 Jonathan Lucas St, Charleston, SC 29425. E-mail [email protected]
Network Modeling Reveals Steps in Angiotensin Peptide Processing
John H. Schwacke, John Christian G. Spainhour, Jessalyn L. Ierardi, Jose M. Chaves, John M. Arthur, Michael G. Janech, Juan Carlos Q. Velez
© 2013 American Heart Association, Inc.
Hypertension is available at http://hyper.ahajournals.org DOI:10.1161/HYPERTENSIONAHA.111.00318
98
by guest on July 7, 2018http://hyper.ahajournals.org/
Dow
nloaded from
by guest on July 7, 2018http://hyper.ahajournals.org/
Dow
nloaded from
by guest on July 7, 2018http://hyper.ahajournals.org/
Dow
nloaded from
by guest on July 7, 2018http://hyper.ahajournals.org/
Dow
nloaded from
by guest on July 7, 2018http://hyper.ahajournals.org/
Dow
nloaded from
by guest on July 7, 2018http://hyper.ahajournals.org/
Dow
nloaded from
by guest on July 7, 2018http://hyper.ahajournals.org/
Dow
nloaded from
by guest on July 7, 2018http://hyper.ahajournals.org/
Dow
nloaded from
by guest on July 7, 2018http://hyper.ahajournals.org/
Dow
nloaded from
Schwacke et al Angiotensin Network Modeling 691
Methods from the field of proteomics have significantly improved our ability to identify, classify, characterize, and quantify proteins and peptides in complex mixtures.26 Mass spectrometry (MS), coupled with stable, isotopically labeled peptide references and applied using the Absolute Quantification (AQUA) strategy,27 provides an effective tool for targeted quantification of peptides and proteins. In our applications, a cocktail of labeled Ang peptides of known concentrations is mixed with cell media and spotted on a matrix-assisted laser desorption ionization (MALDI) plate from which a spectrum is collected. Peak areas from iso-topic clusters associated with native and AQUA peptides are calculated and native peptide quantities estimated from the cluster area ratios and known AQUA peptide concentra-tions. This method has proven effective in our laboratory and has resulted in an extensive archive of MALDI spectra from cell culture experiments.28,29 A recent reexamination of the archive indicated that many of the Ang peptides with masses >600 Da were clearly detectable and suggested that the normalized peak areas associated with these peptides might be informative as to the underlying peptide process-ing network. We therefore sought to determine whether a data mining and network modeling effort, applied to these data, might lead to the identification of novel steps in this important pathway.
The field of computational systems biology provides methods for integrating large data sets in support of efforts to identify, model, and understand the networks central to biological systems. One modeling approach, the Bayesian Network, has proven useful in identifying novel signaling paths in cell signaling networks.30–33 The underlying inference methods attempt to build statistical models of conditional dependencies among the constituents of the network (eg, molecules of the signal transduction system) from observa-tions of the network under various conditions of stimulation and inhibition.34 The resulting conditional dependencies give insight into potential interactions among the signaling sys-tem components and lead to novel discoveries in cell signal-ing systems. Another method, dynamic systems modeling, goes further, attempting to develop a mathematical model of the dynamic behavior of the system. Often, dynamic systems models are constructed using sets of ordinary differential or stochastic differential equations and the associated kinetic parameters.35 These models capture temporal relationships not easily represented in Bayesian networks but present a more challenging network identification and parameter esti-mation task.36
Here we report on efforts to identify and confirm novel steps in the Ang peptide processing network using a data-base of spectra from previously conducted experiments. The study was executed in 2 phases. During the first phase, Ang peptide peak areas were extracted from an archive of spectra and used to build a Bayesian network representation of Ang peptide processing. Predictions from that network focused further experimental efforts that confirmed new steps sug-gested by the model. In the second phase, spectra from these additional experiments were added to the archive and the net-work model rebuilt. Steps suggested in the second model were then assessed in the context of a dynamic systems model. The
study considered all Ang peptides identifiable in our archive without consideration for bioactivity, as we attempted to iden-tify paths that bypass bioactive molecules as well as those that lead to bioactive molecules. We used computational methods from systems biology to build and refine the Bayesian net-works and then to build a dynamic systems model from which the strength of evidence for novel edges can be assessed. Finally, we present confirmatory experimental evidence for 3 of the edges predicted through these methods; thus expanding our understanding of the Ang network and demonstrating the potential for mining archives of proteomic data using methods from systems biology.
Materials and Methods
Mouse Podocyte Cell CultureImmortalized mouse podocytes (generously provided by Dr Peter Mundel [Massachusetts General Hospital, Boston, MA] and Dr Jeffrey Kopp [National Institutes of Health, Bethesda, MD]) were grown under standard conditions as previously published.37 Cells were exposed to Ang substrates as previously described.28 See details in online-only Data Supplement.
MALDI-Time of Flight MSSamples obtained at various time points were assayed by MALDI-time of flight (TOF) MS, as previously described, with minor modifi-cations.28,38 See details in online-only Data Supplement.
Recombinant RAS Enzyme ActivityFor an in vitro AP A activity assay, 100 ng of human recombinant AP A (R&D Systems, Minneapolis, MN) in assay buffer (25 mmol/L Tris, 50 mmol/L CaCl
2, 0.2 mol/L NaCl, pH 8.0) were preincubated
in the presence or absence of 100 μmol/L amastatin (AP A inhibitor, Sigma-Aldrich, St. Louis, MO) for 20 minutes at room temperature and subsequently exposed to 1 μmol/L Ang(1–7) for 30 to 120 min-utes. Reactions were quenched with 1% trifluoroacetic acid acidifica-tion. Cleavage of Ang peptide was analyzed by MALDI-TOF MS and isotope-labeled peptide quantification as described above. For an in vitro NEP activity assay, 100 ng of human recombinant NEP (R&D Systems) in assay buffer (50 mmol/L Tris, pH 7.4) were preincubated in the presence or absence of 1 μmol/L SCH39370 (NEP inhibitor) or 50 to 100 nmol/L thiorphan (Sigma-Aldrich) for 20 minutes at room temperature and subsequently exposed to 1 μmol/L Ang(2–10) for 15 to 60 minutes. Reactions were quenched with 1% trifluoroacetic acid acidification. Cleavage of Ang peptide was analyzed by MALDI-TOF MS and isotope-labeled peptide quantification as described above. All experiments were run in triplicate.
Mass Spectra Data ProcessingQuantification in AQUA experiments and other peak area calculations were performed using a custom-developed software package developed in the R statistical computing language, version 2.11.39 Briefly, the elemental composition of each peptide (and its AQUA reference) was determined from the amino acid sequence and isotopic spectra were convolved to compute the relative abundance of each isotopic peak. A search algorithm was used to find the peak width (resolution), mass error, baseline, and isotopic cluster area. The algorithm searches the space of mass errors and peak widths in a −1 Da to +7 Da region about the monoisotopic mass and a linear fit to the observed intensity is computed giving the cluster area. The isotopic cluster area for the mass error and peak width giving the lowest R2 value is taken as the area estimate. To account for overlap in isotopic clusters from nearby native peptides (eg, Ang[1–9], m/z 1183.6 and Ang[2–10], m/z 1181.7) and their associated AQUA peptides, groups of overlapping peptides were fit simultaneously, sharing a common baseline and peak width. Doing so facilitated decomposition of the overlapping isotopic clusters.
by guest on July 7, 2018http://hyper.ahajournals.org/
Dow
nloaded from
692 Hypertension March 2013
Estimated Peak Area Quality AssessmentBecause we are not able to confirm the identity of each peak from the archived MALDI spectra, we must consider the possibility that some non-Ang peptide or source of noise might yield fits comparable to that of the peptides of interest. To assess the quality of the fitted iso-topic clusters, we compared the distribution of R2 for the Ang peptide fits with that obtained by fitting random peptide sequences of similar length. We also found that the R2 distribution for fits to Ang peptides had a bathtub shape, indicative of a mixture of fits to noise (similar to the null case) and fits to peptides of interest. The minima of the bathtub occurred at R2 = 0.65. This value was used as a threshold for accepting a peak area estimate in our modeling effort. The data set was then filtered, replacing peak areas having R2 values below this threshold with a small value.
Bayesian Network InferenceBayesian network inference was performed using the bnlearn pack-age, version 2.4,40 executed within the R statistical computing envi-ronment, version 2.11.39 Network nodes included all Ang peptides with length >5 amino acids (see online-only Data Supplement, Table S1), all added substrates, all inhibitors, and time since substrate addi-tion. We treat the data as continuous and use Gaussian Bayesian Networks where the global distribution is taken to be multivariate normal and local distributions are normal and linked by linear con-straints associated with edges.41 Peptide areas from spectra were nor-malized to total Ang ion current and log transformed. Times were also log transformed. All edges are assumed excluded unless either (1) the edge extends from a peptide to a shorter peptide that can be obtained through a single site cleavage, or (2) the edge extends from a stimulus to its associated peptide, or (3) the edge extends from an inhibitor to any peptide, or (4) the edge extends from the time node to any peptide. An edge inclusion list was constructed and included edges associated with processing steps that are part of the processing path-way established in the literature. The network was constructed using the bnlearn tabu function using the Bayesian Information Criterion as score. Network edge strength assessment was performed using the bnlearn arc.strength function.
Dynamic Systems Model Inference and ComparisonAlthough the Bayesian network model used here proved useful in identifying novel steps in the Ang pathway, its ability to capture the transient response is limited by the available data. Dynamic model parameter inference and time course calculations were per-formed using a custom-developed software package implemented in the R statistical computing language, version 2.11.39 The model is expressed as a system of linear differential equations. In each reac-tion, the rate is assumed proportional to the available substrate. In experimental cases where inhibition is applied, the rate constant is set to 0 for all reactions associated with the inhibited peptidase. The time course for this model can be solved in closed form, eliminating the need for numeric integration. We assume the observed area is related to the underlying concentration through a scale factor. The scale factor is assumed constant across experiments and specific to a peptide. Rate constants and flyability scale factors for a given network structure were inferred using Markov Chain Monte Carlo sampling using the Metropolis Hastings algorithm.42 Previous dis-tributions for kinetic parameters (rate constants) were based on the estimated linear response at low substrate concentrations (k Kmcat ) using kinetic parameters found in the literature for peptidases of this system.43–47 Observed data for a given experimental condition (stim-ulus and inhibition) are assumed normally distributed with mean given by the associated model prediction (μ) and variance given by (δ + sμ)2. Both δ and s are inferred. For each Markov chain, 800 000 samples were collected after a burn-in of 200 000 samples, which were then thinned by a factor of 800 to give 1000 samples used in the analysis. For each structural alternative, 5 chains starting from dif-ferent random seeds were collected. Deviance information criterion was computed for each chain, and deviance information criterion mean and variance were computed from the set for use in model comparisons. Structural alternatives were considered to differ if their
mean deviance information criterion values differed significantly. To visualize uncertainty in the predicted trajectories resulting from uncertainty in the inferred model parameters, time courses were computed for each experimental condition for the samples collected from the 5 chains and the credible intervals for each time point were then computed for plotting (Figure 6).
Statistical AnalysisResults of confirmatory experiments are expressed as means±SD. Peptide abundances were compared using Student t test. Significance was set at P<0.05.
Results
Peptide Peak Area Estimation and IdentificationPeak areas for 21 Ang peptides (length >4 amino acids) and associated AQUA peptides were computed for all spectra from the archive using an isotopic cluster model. Of the 384 spec-tra, 228 were acceptable as they had no significant noise or elevated baselines in the low mass range, were collected from cultured mouse podocyte experiments, and were collected from samples taken <12 hours poststimulation. Peak areas and quality measures for 20 Ang peptides (Ang[3–7], Ang[5–9]/[6–10], Ang[1–5], Ang[4–8], Ang[2–6], Ang[5–10], Ang[3–8], Ang[2–7], Ang[1–6], Ang[4–9], Ang[1–7], Ang[3–9], Ang[4–10], Ang[2–8], Ang[3–10], Ang[1–8], Ang[2–9], Ang[2–10], Ang[1–9], Ang[1–10]) were estimated from each of these spectra, yielding a total of 4560 data points. Ang(5–9) and Ang(6–10) have the same elemental composition and thus appear at the same mass in our MALDI spectra. We found evidence for all Ang fragments of length 5 and above except Ang(1–6) and Ang(4–9) among the isotopic clusters having R2 above the selected threshold for quality. Follow-up experi-ments (see below) found evidence of Ang(4–9). Surprisingly, the isotopic cluster associated with Ang(5–9)/(6–10) appeared in more spectra than any other peptide. The identity of this peak was confirmed by tandem MS in subsequent experiments and found to contain a mixture of Ang(5–9) and Ang(6–10).
Gaussian Bayesian Network InferenceThe set of edges exceeding the strength threshold suggested several processing steps not found in the baseline network. Extending from Ang(1–9), the set included edges from Ang(1–9) to Ang(2–9), Ang(2–9) to Ang(3–9), and Ang(3–9) to Ang(4–9). Also included was a step from Ang(1–7) to Ang(2–7) as well as steps from Ang(1–10) to Ang(5–10), Ang(2–10) to Ang(2–9), and Ang(1–10) to Ang(3–10) (see Table S2).
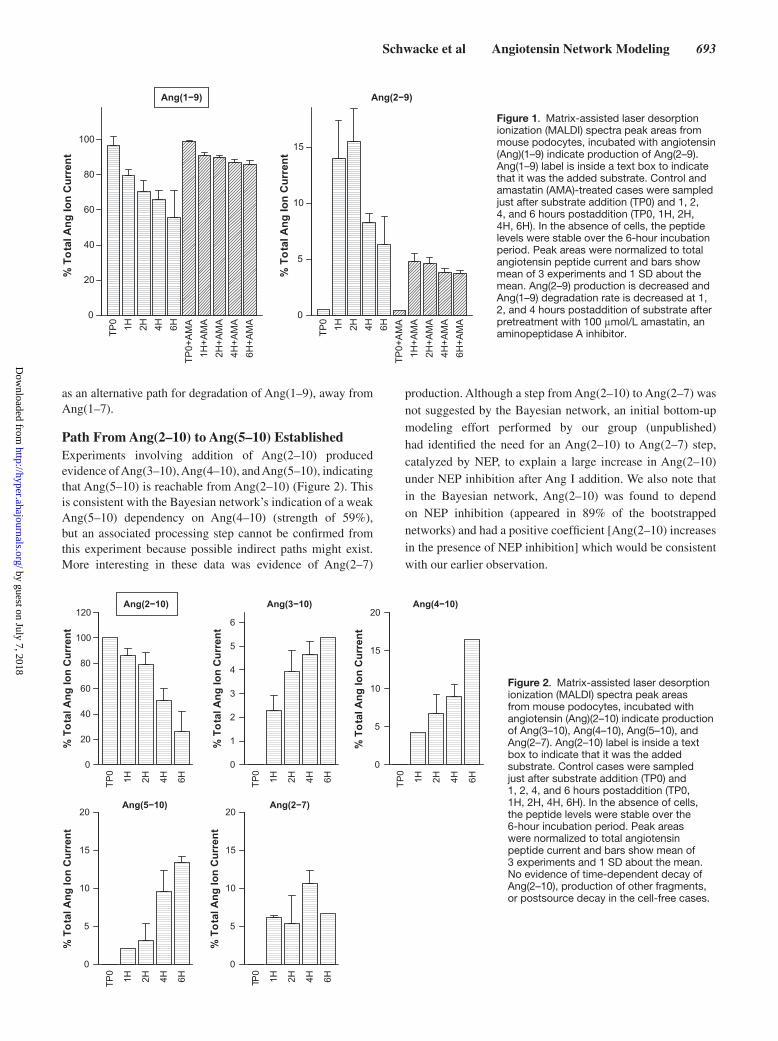
Confirmation of Ang(1–9) to Ang(2–9) via AP AUsing Ang(1–9) as the substrate, we found evidence of Ang(2–9) production and significant inhibition of Ang(2–9) produc-tion in the presence of 100 μmol/L amastatin (AP A inhibition) (Figure 1). These data suggest that Ang(1–9) is cleaved to Ang(2–9) by AP A in mouse podocytes and, therefore, support the existence of the Ang(1–9) to Ang(2–9) step indicated in our network model. This finding is not surprising given the estab-lished Ang(1–10) to Ang(2–10) and Ang(1–8) to Ang(2–8) conversions catalyzed by AP A. This step might be important
by guest on July 7, 2018http://hyper.ahajournals.org/
Dow
nloaded from
Schwacke et al Angiotensin Network Modeling 693
as an alternative path for degradation of Ang(1–9), away from Ang(1–7).
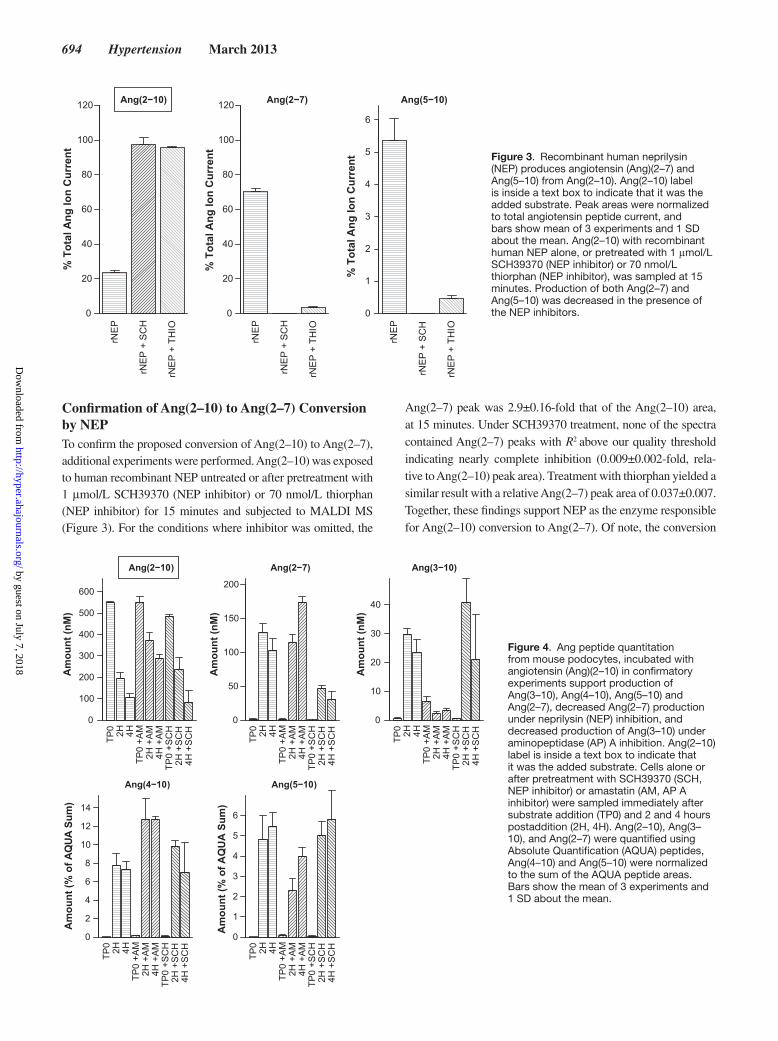
Path From Ang(2–10) to Ang(5–10) EstablishedExperiments involving addition of Ang(2–10) produced evidence of Ang(3–10), Ang(4–10), and Ang(5–10), indicating that Ang(5–10) is reachable from Ang(2–10) (Figure 2). This is consistent with the Bayesian network’s indication of a weak Ang(5–10) dependency on Ang(4–10) (strength of 59%), but an associated processing step cannot be confirmed from this experiment because possible indirect paths might exist. More interesting in these data was evidence of Ang(2–7)
production. Although a step from Ang(2–10) to Ang(2–7) was not suggested by the Bayesian network, an initial bottom-up modeling effort performed by our group (unpublished) had identified the need for an Ang(2–10) to Ang(2–7) step, catalyzed by NEP, to explain a large increase in Ang(2–10) under NEP inhibition after Ang I addition. We also note that in the Bayesian network, Ang(2–10) was found to depend on NEP inhibition (appeared in 89% of the bootstrapped networks) and had a positive coefficient [Ang(2–10) increases in the presence of NEP inhibition] which would be consistent with our earlier observation.
TP0
1H 2H 4H 6HTP
0+A
MA
1H+A
MA
2H+A
MA
4H+A
MA
6H+A
MA
Ang(1−9)
% T
otal
Ang
Ion
Cur
rent
0
20
40
60
80
100
TP0
1H 2H 4H 6HTP
0+A
MA
1H+A
MA
2H+A
MA
4H+A
MA
6H+A
MA
Ang(2−9)
0
5
10
15
% T
otal
Ang
Ion
Cur
rent
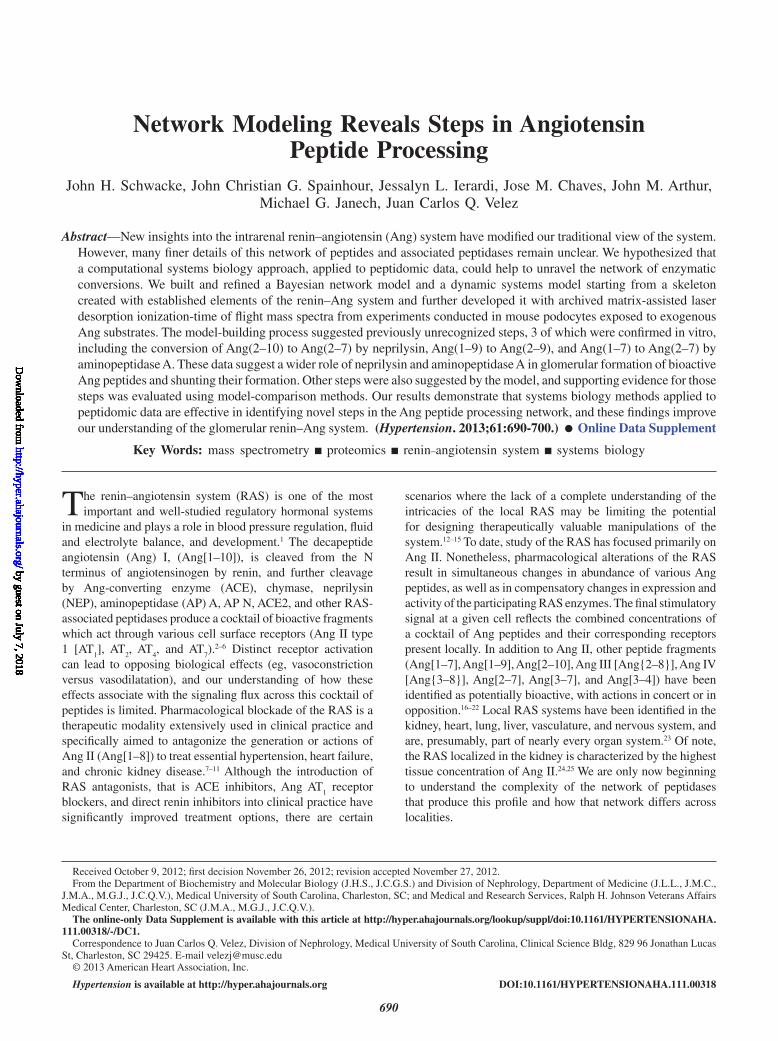
Figure 1. Matrix-assisted laser desorption ionization (MALDI) spectra peak areas from mouse podocytes, incubated with angiotensin (Ang)(1–9) indicate production of Ang(2–9). Ang(1–9) label is inside a text box to indicate that it was the added substrate. Control and amastatin (AMA)-treated cases were sampled just after substrate addition (TP0) and 1, 2, 4, and 6 hours postaddition (TP0, 1H, 2H, 4H, 6H). In the absence of cells, the peptide levels were stable over the 6-hour incubation period. Peak areas were normalized to total angiotensin peptide current and bars show mean of 3 experiments and 1 SD about the mean. Ang(2–9) production is decreased and Ang(1–9) degradation rate is decreased at 1, 2, and 4 hours postaddition of substrate after pretreatment with 100 μmol/L amastatin, an aminopeptidase A inhibitor.
% T
otal
Ang
Ion
Cur
rent
TP0
1H 2H 4H 6H
Ang(2−10)
0
20
40
60
80
100
120
TP0
1H 2H 4H 6H
Ang(3−10)
0
1
2
3
4
5
6
TP0
1H 2H 4H 6H
Ang(4−10)
0
5
10
15
20
TP0
1H 2H 4H 6H
Ang(5−10)
0
5
10
15
20
TP0
1H 2H 4H 6H
Ang(2−7)
0
5
10
15
20
% T
otal
Ang
Ion
Cur
rent
% T
otal
Ang
Ion
Cur
rent
% T
otal
Ang
Ion
Cur
rent
% T
otal
Ang
Ion
Cur
rent
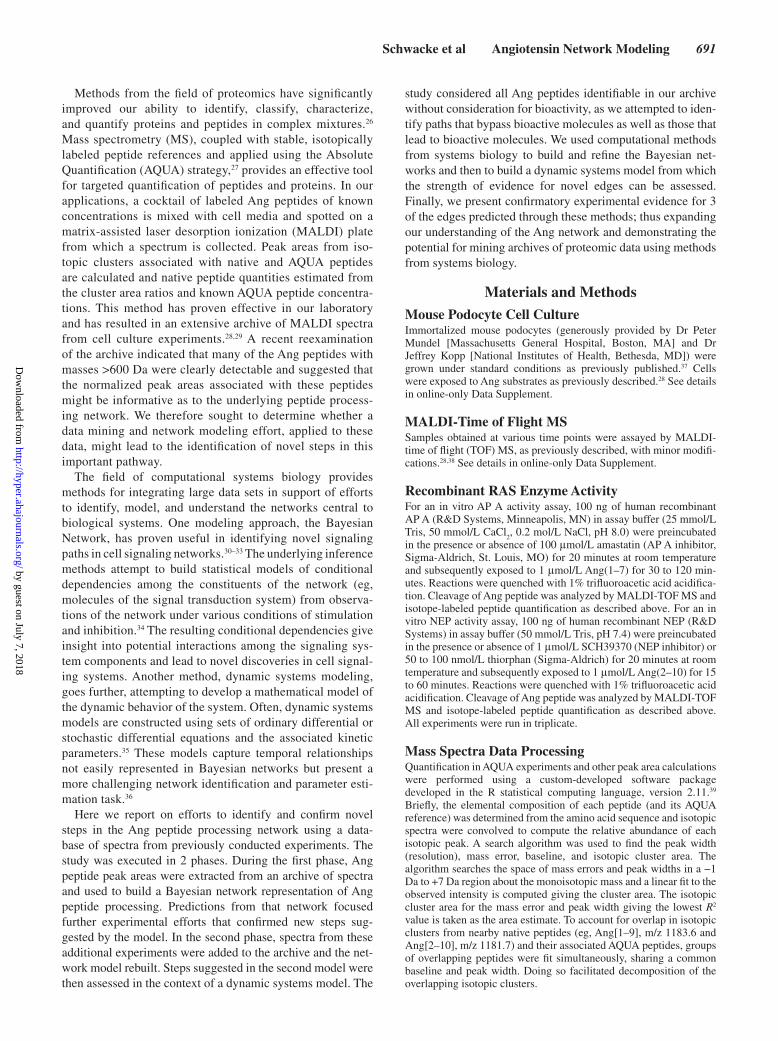
Figure 2. Matrix-assisted laser desorption ionization (MALDI) spectra peak areas from mouse podocytes, incubated with angiotensin (Ang)(2–10) indicate production of Ang(3–10), Ang(4–10), Ang(5–10), and Ang(2–7). Ang(2–10) label is inside a text box to indicate that it was the added substrate. Control cases were sampled just after substrate addition (TP0) and 1, 2, 4, and 6 hours postaddition (TP0, 1H, 2H, 4H, 6H). In the absence of cells, the peptide levels were stable over the 6-hour incubation period. Peak areas were normalized to total angiotensin peptide current and bars show mean of 3 experiments and 1 SD about the mean. No evidence of time-dependent decay of Ang(2–10), production of other fragments, or postsource decay in the cell-free cases.
by guest on July 7, 2018http://hyper.ahajournals.org/
Dow
nloaded from
694 Hypertension March 2013
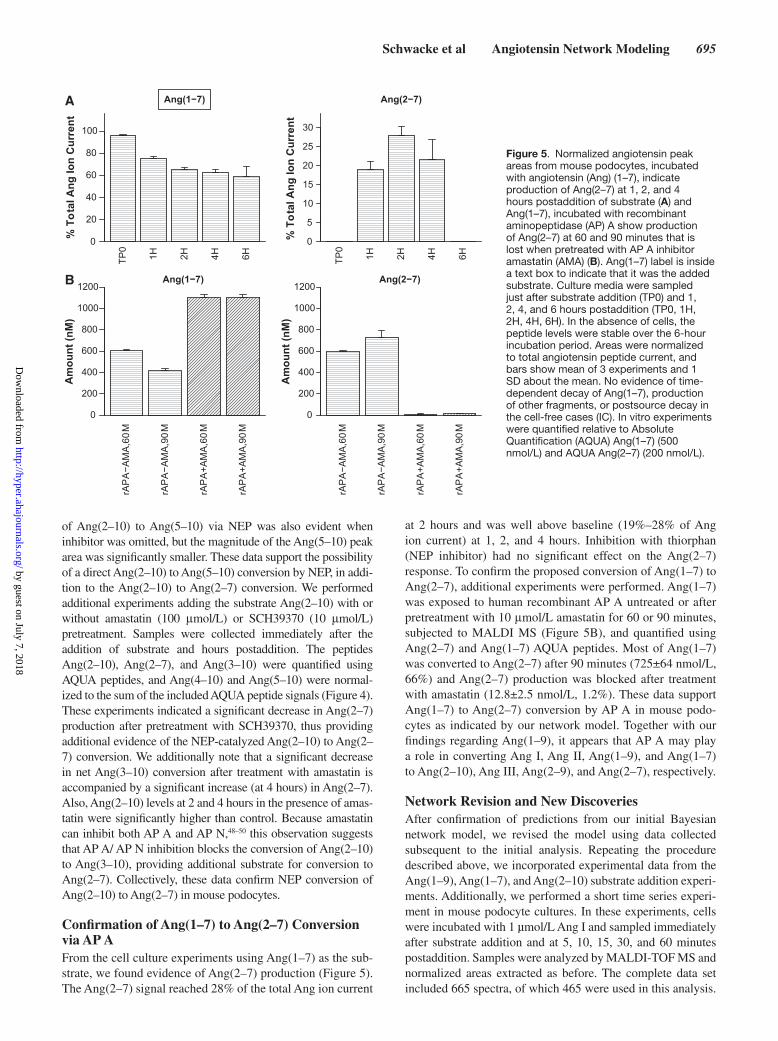
Confirmation of Ang(2–10) to Ang(2–7) Conversion by NEPTo confirm the proposed conversion of Ang(2–10) to Ang(2–7), additional experiments were performed. Ang(2–10) was exposed to human recombinant NEP untreated or after pretreatment with 1 μmol/L SCH39370 (NEP inhibitor) or 70 nmol/L thiorphan (NEP inhibitor) for 15 minutes and subjected to MALDI MS (Figure 3). For the conditions where inhibitor was omitted, the
Ang(2–7) peak was 2.9±0.16-fold that of the Ang(2–10) area, at 15 minutes. Under SCH39370 treatment, none of the spectra contained Ang(2–7) peaks with R2 above our quality threshold indicating nearly complete inhibition (0.009±0.002-fold, rela-tive to Ang(2–10) peak area). Treatment with thiorphan yielded a similar result with a relative Ang(2–7) peak area of 0.037±0.007. Together, these findings support NEP as the enzyme responsible for Ang(2–10) conversion to Ang(2–7). Of note, the conversion
rNE
P
rNE
P +
SC
H
rNE
P +
TH
IO
Ang(2−10)
0
20
40
60
80
100
120
rNE
P
rNE
P +
SC
H
rNE
P +
TH
IO
Ang(2−7)
0
20
40
60
80
100
120
rNE
P
rNE
P +
SC
H
rNE
P +
TH
IO
Ang(5−10)
0
1
2
3
4
5
6
% T
otal
Ang
Ion
Cur
rent
% T
otal
Ang
Ion
Cur
rent
% T
otal
Ang
Ion
Cur
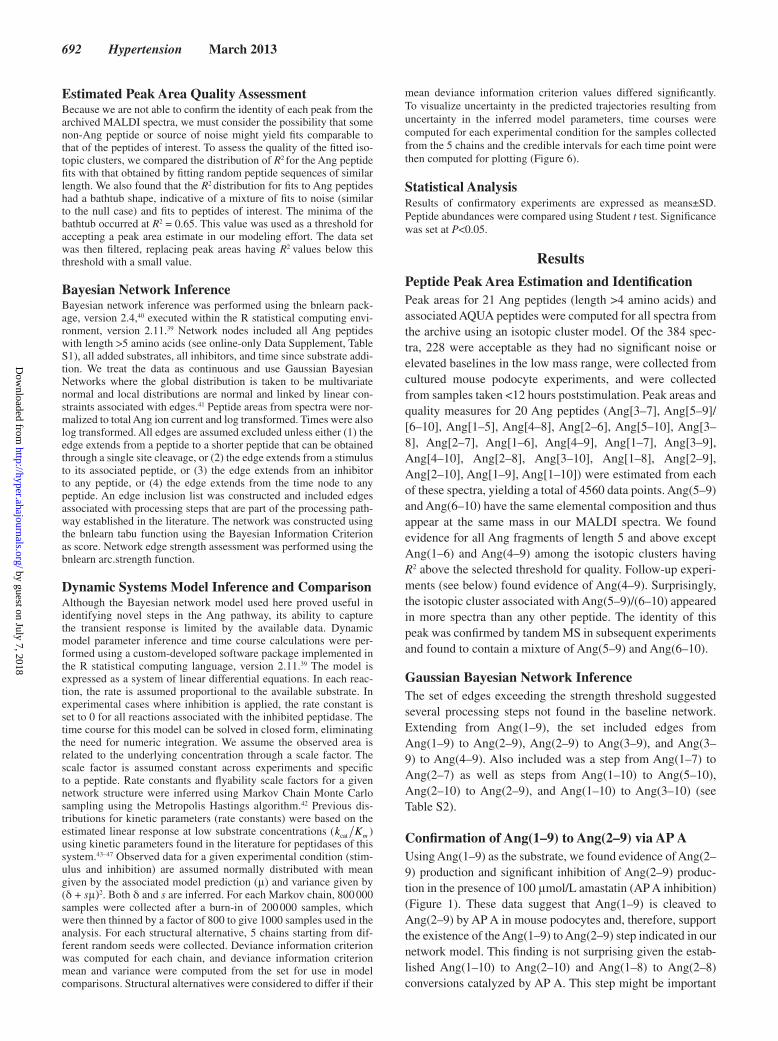
rent Figure 3. Recombinant human neprilysin
(NEP) produces angiotensin (Ang)(2–7) and Ang(5–10) from Ang(2–10). Ang(2–10) label is inside a text box to indicate that it was the added substrate. Peak areas were normalized to total angiotensin peptide current, and bars show mean of 3 experiments and 1 SD about the mean. Ang(2–10) with recombinant human NEP alone, or pretreated with 1 μmol/L SCH39370 (NEP inhibitor) or 70 nmol/L thiorphan (NEP inhibitor), was sampled at 15 minutes. Production of both Ang(2–7) and Ang(5–10) was decreased in the presence of the NEP inhibitors.
TP0 2H 4H
TP0
+AM
2H +
AM
4H +
AM
TP0
+SC
H2H
+S
CH
4H +
SC
H
Ang(2−10)
Am
ount
(nM
)
0
100
200
300
400
500
600
TP0 2H 4H
TP0
+AM
2H +
AM
4H +
AM
TP0
+SC
H2H
+S
CH
4H +
SC
H
Ang(2−7)
Am
ount
(nM
)
0
50
100
150
200
TP0 2H 4H
TP0
+AM
2H +
AM
4H +
AM
TP0
+SC
H2H
+S
CH
4H +
SC
H
Ang(3−10)
Am
ount
(nM
)
0
10
20
30
40
TP0 2H 4H
TP0
+AM
2H +
AM
4H +
AM
TP0
+SC
H2H
+S
CH
4H +
SC
H
Ang(4−10)
Am
ount
(% o
f AQ
UA S
um)
0
2
4
6
8
10
12
14
TP0 2H 4H
TP0
+AM
2H +
AM
4H +
AM
TP0
+SC
H2H
+S
CH
4H +
SC
H
Ang(5−10)
Am
ount
(% o
f AQ
UA
Sum
)
0
1
2
3
4
5
6
Figure 4. Ang peptide quantitation from mouse podocytes, incubated with angiotensin (Ang)(2–10) in confirmatory experiments support production of Ang(3–10), Ang(4–10), Ang(5–10) and Ang(2–7), decreased Ang(2–7) production under neprilysin (NEP) inhibition, and decreased production of Ang(3–10) under aminopeptidase (AP) A inhibition. Ang(2–10) label is inside a text box to indicate that it was the added substrate. Cells alone or after pretreatment with SCH39370 (SCH, NEP inhibitor) or amastatin (AM, AP A inhibitor) were sampled immediately after substrate addition (TP0) and 2 and 4 hours postaddition (2H, 4H). Ang(2–10), Ang(3–10), and Ang(2–7) were quantified using Absolute Quantification (AQUA) peptides, Ang(4–10) and Ang(5–10) were normalized to the sum of the AQUA peptide areas. Bars show the mean of 3 experiments and 1 SD about the mean.
by guest on July 7, 2018http://hyper.ahajournals.org/
Dow
nloaded from
Schwacke et al Angiotensin Network Modeling 695
of Ang(2–10) to Ang(5–10) via NEP was also evident when inhibitor was omitted, but the magnitude of the Ang(5–10) peak area was significantly smaller. These data support the possibility of a direct Ang(2–10) to Ang(5–10) conversion by NEP, in addi-tion to the Ang(2–10) to Ang(2–7) conversion. We performed additional experiments adding the substrate Ang(2–10) with or without amastatin (100 μmol/L) or SCH39370 (10 μmol/L) pretreatment. Samples were collected immediately after the addition of substrate and hours postaddition. The peptides Ang(2–10), Ang(2–7), and Ang(3–10) were quantified using AQUA peptides, and Ang(4–10) and Ang(5–10) were normal-ized to the sum of the included AQUA peptide signals (Figure 4). These experiments indicated a significant decrease in Ang(2–7) production after pretreatment with SCH39370, thus providing additional evidence of the NEP-catalyzed Ang(2–10) to Ang(2–7) conversion. We additionally note that a significant decrease in net Ang(3–10) conversion after treatment with amastatin is accompanied by a significant increase (at 4 hours) in Ang(2–7). Also, Ang(2–10) levels at 2 and 4 hours in the presence of amas-tatin were significantly higher than control. Because amastatin can inhibit both AP A and AP N,48–50 this observation suggests that AP A/ AP N inhibition blocks the conversion of Ang(2–10) to Ang(3–10), providing additional substrate for conversion to Ang(2–7). Collectively, these data confirm NEP conversion of Ang(2–10) to Ang(2–7) in mouse podocytes.
Confirmation of Ang(1–7) to Ang(2–7) Conversion via AP AFrom the cell culture experiments using Ang(1–7) as the sub-strate, we found evidence of Ang(2–7) production (Figure 5). The Ang(2–7) signal reached 28% of the total Ang ion current
at 2 hours and was well above baseline (19%–28% of Ang ion current) at 1, 2, and 4 hours. Inhibition with thiorphan (NEP inhibitor) had no significant effect on the Ang(2–7) response. To confirm the proposed conversion of Ang(1–7) to Ang(2–7), additional experiments were performed. Ang(1–7) was exposed to human recombinant AP A untreated or after pretreatment with 10 μmol/L amastatin for 60 or 90 minutes, subjected to MALDI MS (Figure 5B), and quantified using Ang(2–7) and Ang(1–7) AQUA peptides. Most of Ang(1–7) was converted to Ang(2–7) after 90 minutes (725±64 nmol/L, 66%) and Ang(2–7) production was blocked after treatment with amastatin (12.8±2.5 nmol/L, 1.2%). These data support Ang(1–7) to Ang(2–7) conversion by AP A in mouse podo-cytes as indicated by our network model. Together with our findings regarding Ang(1–9), it appears that AP A may play a role in converting Ang I, Ang II, Ang(1–9), and Ang(1–7) to Ang(2–10), Ang III, Ang(2–9), and Ang(2–7), respectively.
Network Revision and New DiscoveriesAfter confirmation of predictions from our initial Bayesian network model, we revised the model using data collected subsequent to the initial analysis. Repeating the procedure described above, we incorporated experimental data from the Ang(1–9), Ang(1–7), and Ang(2–10) substrate addition experi-ments. Additionally, we performed a short time series experi-ment in mouse podocyte cultures. In these experiments, cells were incubated with 1 µmol/L Ang I and sampled immediately after substrate addition and at 5, 10, 15, 30, and 60 minutes postaddition. Samples were analyzed by MALDI-TOF MS and normalized areas extracted as before. The complete data set included 665 spectra, of which 465 were used in this analysis.
TP0
1H 2H 4H 6H
Ang(1−7)
0
20
40
60
80
100
TP0
1H 2H 4H 6H
Ang(2−7)
0
5
10
15
20
25
30rA
PA
−AM
A,6
0M
rAP
A−A
MA
,90M
rAP
A+A
MA
,60M
rAP
A+A
MA
,90M
Ang(1−7)
Am
ount
(nM
)
0
200
400
600
800
1000
1200
rAP
A−A
MA
,60M
rAP
A−A
MA
,90M
rAP
A+A
MA
,60M
rAP
A+A
MA
,90M
Ang(2−7)A
mou
nt (n
M)
0
200
400
600
800
1000
1200
% T
otal
Ang
Ion
Cur
rent
% T
otal
Ang
Ion
Cur
rent
A
B
Figure 5. Normalized angiotensin peak areas from mouse podocytes, incubated with angiotensin (Ang) (1–7), indicate production of Ang(2–7) at 1, 2, and 4 hours postaddition of substrate (A) and Ang(1–7), incubated with recombinant aminopeptidase (AP) A show production of Ang(2–7) at 60 and 90 minutes that is lost when pretreated with AP A inhibitor amastatin (AMA) (B). Ang(1–7) label is inside a text box to indicate that it was the added substrate. Culture media were sampled just after substrate addition (TP0) and 1, 2, 4, and 6 hours postaddition (TP0, 1H, 2H, 4H, 6H). In the absence of cells, the peptide levels were stable over the 6-hour incubation period. Areas were normalized to total angiotensin peptide current, and bars show mean of 3 experiments and 1 SD about the mean. No evidence of time-dependent decay of Ang(1–7), production of other fragments, or postsource decay in the cell-free cases (IC). In vitro experiments were quantified relative to Absolute Quantification (AQUA) Ang(1–7) (500 nmol/L) and AQUA Ang(2–7) (200 nmol/L).
by guest on July 7, 2018http://hyper.ahajournals.org/
Dow
nloaded from
696 Hypertension March 2013
The Bayesian network inference process was repeated using this subset. In addition to the steps suggested in the initial ver-sion of the Bayesian network, the revised version included Ang(2–10) to Ang(3–10), Ang(4–10) to Ang(5–10), Ang(2–10) to Ang(2–7), and Ang(2–9) to Ang(4–9) (see Table S2).
System Model Inference and Reaction SetOf the combinations of additional steps analyzed using the dynamic systems model, we found that inclusion of Ang(4–10) to Ang(5–10), Ang(1–10) to Ang(5–10), Ang(2–10) to Ang(4–10), and Ang(2–9) to Ang(4–9) as a group provided the lowest deviance information criterion of the networks tested. Surprisingly, the edge from Ang(2–10) to Ang(2–9), which had a strength of 95% in the revised version of the Bayesian network, did not appear to improve the fit in the dynamic systems model. Inclusion of steps from either Ang(1–10) to Ang(3–10) or Ang(2–9) to Ang(3–9) also failed to significantly improve the fit. A final model, built from the baseline and our confirmed steps, augmented with steps from
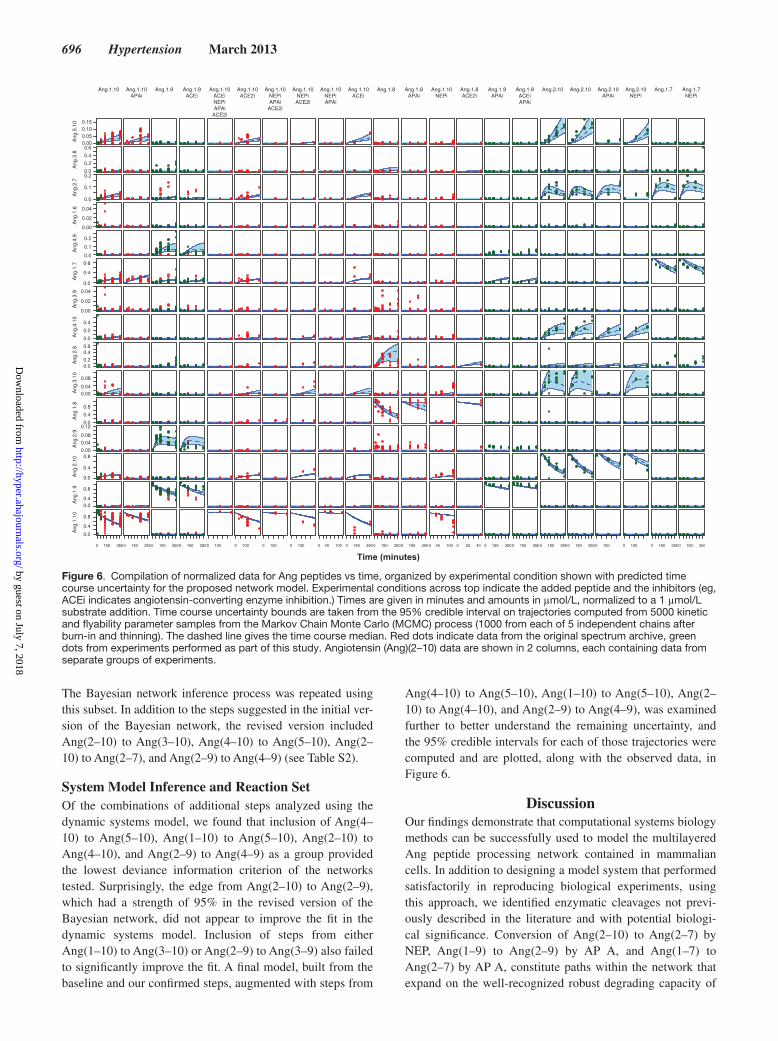
Ang(4–10) to Ang(5–10), Ang(1–10) to Ang(5–10), Ang(2–10) to Ang(4–10), and Ang(2–9) to Ang(4–9), was examined further to better understand the remaining uncertainty, and the 95% credible intervals for each of those trajectories were computed and are plotted, along with the observed data, in Figure 6.
DiscussionOur findings demonstrate that computational systems biology methods can be successfully used to model the multilayered Ang peptide processing network contained in mammalian cells. In addition to designing a model system that performed satisfactorily in reproducing biological experiments, using this approach, we identified enzymatic cleavages not previ-ously described in the literature and with potential biologi-cal significance. Conversion of Ang(2–10) to Ang(2–7) by NEP, Ang(1–9) to Ang(2–9) by AP A, and Ang(1–7) to Ang(2–7) by AP A, constitute paths within the network that expand on the well-recognized robust degrading capacity of
Time (minutes)
0.150.100.050.000.60.40.20.00.2
0.1
0.0
0.04
0.02
0.00
0.2
0.1
0.0
Figure 6. Compilation of normalized data for Ang peptides vs time, organized by experimental condition shown with predicted time course uncertainty for the proposed network model. Experimental conditions across top indicate the added peptide and the inhibitors (eg, ACEi indicates angiotensin-converting enzyme inhibition.) Times are given in minutes and amounts in μmol/L, normalized to a 1 μmol/L substrate addition. Time course uncertainty bounds are taken from the 95% credible interval on trajectories computed from 5000 kinetic and flyability parameter samples from the Markov Chain Monte Carlo (MCMC) process (1000 from each of 5 independent chains after burn-in and thinning). The dashed line gives the time course median. Red dots indicate data from the original spectrum archive, green dots from experiments performed as part of this study. Angiotensin (Ang)(2–10) data are shown in 2 columns, each containing data from separate groups of experiments.
by guest on July 7, 2018http://hyper.ahajournals.org/
Dow
nloaded from
Schwacke et al Angiotensin Network Modeling 697
APs and endopeptidases localized in glomerular podocytes. Two of these unveiled steps involve generation of Ang(2–7). Importantly, there is evidence that indicates that Ang(2–7) may be a bioactive fragment that potentiates the hypotensive effect of bradykinin in a similar fashion to Ang(1–7).21 Another study reported that Ang(2–7) binds to the AT
4 receptor, the
receptor for Ang IV.22 Alternatively, it can be postulated that the conversion of Ang(2–10) into Ang(2–7) by NEP suggests the possibility of a bypass around the bioactive fragments Ang III and Ang IV. Notably, Ang III is known to exert vaso-constrictive effects and promote aldosterone stimulation,51,52 whereas Ang IV has been linked to arterial thrombosis and biphasic pressor responses.53
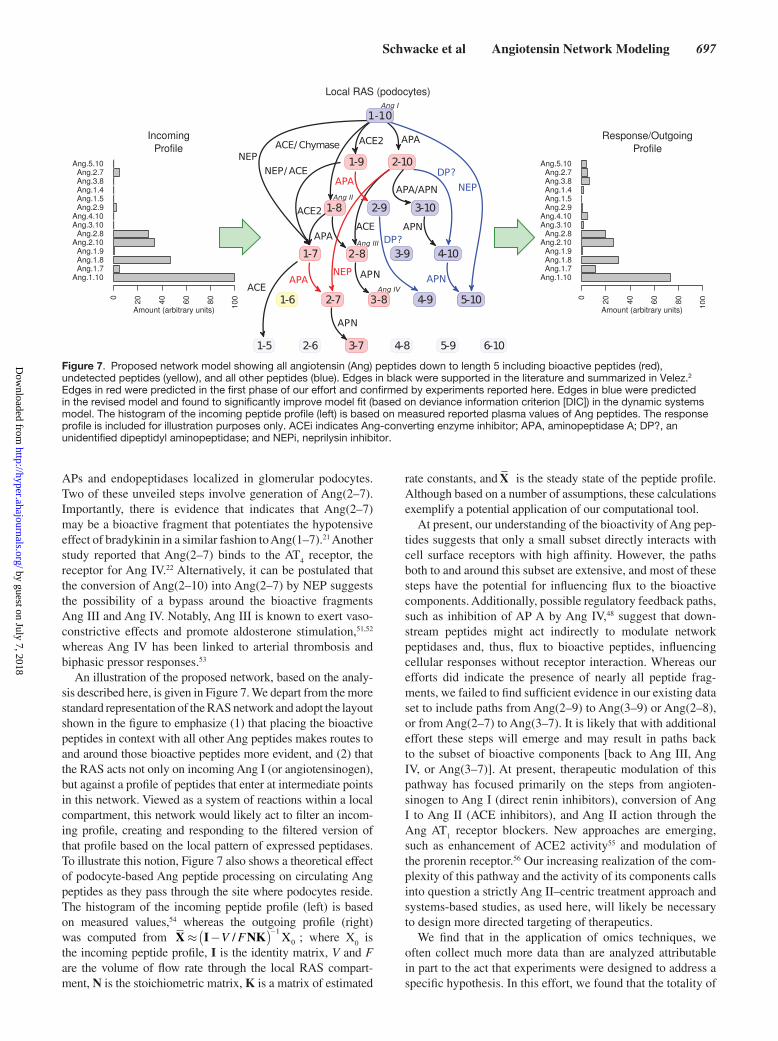
An illustration of the proposed network, based on the analy-sis described here, is given in Figure 7. We depart from the more standard representation of the RAS network and adopt the layout shown in the figure to emphasize (1) that placing the bioactive peptides in context with all other Ang peptides makes routes to and around those bioactive peptides more evident, and (2) that the RAS acts not only on incoming Ang I (or angiotensinogen), but against a profile of peptides that enter at intermediate points in this network. Viewed as a system of reactions within a local compartment, this network would likely act to filter an incom-ing profile, creating and responding to the filtered version of that profile based on the local pattern of expressed peptidases. To illustrate this notion, Figure 7 also shows a theoretical effect of podocyte-based Ang peptide processing on circulating Ang peptides as they pass through the site where podocytes reside. The histogram of the incoming peptide profile (left) is based on measured values,54 whereas the outgoing profile (right) was computed from X I K≈ −( )−V F/ N
1
0X ; where X0 is
the incoming peptide profile, I is the identity matrix, V and F are the volume of flow rate through the local RAS compart-ment, N is the stoichiometric matrix, K is a matrix of estimated
rate constants, and –X is the steady state of the peptide profile.
Although based on a number of assumptions, these calculations exemplify a potential application of our computational tool.
At present, our understanding of the bioactivity of Ang pep-tides suggests that only a small subset directly interacts with cell surface receptors with high affinity. However, the paths both to and around this subset are extensive, and most of these steps have the potential for influencing flux to the bioactive components. Additionally, possible regulatory feedback paths, such as inhibition of AP A by Ang IV,48 suggest that down-stream peptides might act indirectly to modulate network peptidases and, thus, flux to bioactive peptides, influencing cellular responses without receptor interaction. Whereas our efforts did indicate the presence of nearly all peptide frag-ments, we failed to find sufficient evidence in our existing data set to include paths from Ang(2–9) to Ang(3–9) or Ang(2–8), or from Ang(2–7) to Ang(3–7). It is likely that with additional effort these steps will emerge and may result in paths back to the subset of bioactive components [back to Ang III, Ang IV, or Ang(3–7)]. At present, therapeutic modulation of this pathway has focused primarily on the steps from angioten-sinogen to Ang I (direct renin inhibitors), conversion of Ang I to Ang II (ACE inhibitors), and Ang II action through the Ang AT
1 receptor blockers. New approaches are emerging,
such as enhancement of ACE2 activity55 and modulation of the prorenin receptor.56 Our increasing realization of the com-plexity of this pathway and the activity of its components calls into question a strictly Ang II–centric treatment approach and systems-based studies, as used here, will likely be necessary to design more directed targeting of therapeutics.
We find that in the application of omics techniques, we often collect much more data than are analyzed attributable in part to the act that experiments were designed to address a specific hypothesis. In this effort, we found that the totality of
Figure 7. Proposed network model showing all angiotensin (Ang) peptides down to length 5 including bioactive peptides (red), undetected peptides (yellow), and all other peptides (blue). Edges in black were supported in the literature and summarized in Velez.2 Edges in red were predicted in the first phase of our effort and confirmed by experiments reported here. Edges in blue were predicted in the revised model and found to significantly improve model fit (based on deviance information criterion [DIC]) in the dynamic systems model. The histogram of the incoming peptide profile (left) is based on measured reported plasma values of Ang peptides. The response profile is included for illustration purposes only. ACEi indicates Ang-converting enzyme inhibitor; APA, aminopeptidase A; DP?, an unidentified dipeptidyl aminopeptidase; and NEPi, neprilysin inhibitor.
by guest on July 7, 2018http://hyper.ahajournals.org/
Dow
nloaded from
698 Hypertension March 2013
these data, when considered using a systems-based approach has value in network discovery efforts. Although the cur-rent model is insufficient to capture the regulatory feedback mechanisms that must eventually be considered, we see it as an essential first step toward that goal. Key to the discovery process is this unifying model that links observations across time and experimental conditions (stimulus and inhibition), and inference methods that provide a disciplined approach to assess the weight of evidence for structural variations within the model.
In this study, cell culture experiments, inhibitor-based per-turbations of the system response, and use of data collected over 6 years of evolving experimental procedures presents challenges, limitations, and benefits. A key challenge was the development of complete and consistent characterizations of each of the spectra from the archive. Whereas the spectra were readily recovered from data files recorded by the instrument, identifying the covariates from the associated experiment was somewhat more difficult. Generally, spectra used in earlier publications were well documented but many of the spectra from our archive came from experiments that might have been performed as a precursor to the published work. In our model-based approach, a critical underlying assumption is that the selected perturbations to the system are peptidase specific and essentially complete. We recognize that some level of nonspe-cific or incomplete inhibition is likely to occur, thus, contrib-uting additional unexplained variation in our observations. We find that, even with these additional sources of error and varia-tion, enzymatic steps suggested by the approach were readily confirmed in follow-up experiments, thus, suggesting that the approach has utility.
Conversions to tetrapeptides or smaller fragments were not included because matrix ions would often coexist in the same m/z window as the peptide. Because our archived sam-ples mainly reflect ectoenzymatic activity, our analysis does not account for intracellular cleavage of Ang peptides,57,58 although we cannot completely exclude a minor contribution of intracellular peptide processing to the detected spectra. Although other RAS enzymes, such as chymase, prolylendo-peptidase, prolylcarboxypeptidase, thimet oligopeptidase, dipeptidyl AP, etc, were not included in our model because of their low activity in podocytes,28,29 they may be important in other kidney cells or disease states.29,59–62 It is conceivable that the podocyte RAS likely includes peptidases not considered in our analysis. In addition, we did not incorporate the potential enzymatic inhibitory actions of some Ang peptides. Notably, Ang IV has been reported to inhibit AP A,48 whereas ACE can be inhibited by Ang 1–7.63 Moreover, biologically active Ang peptides generated through enzymatic decarboxylation have also been reported to be detectable in human plasma.64 Altogether, these unaccounted aspects of the RAS further emphasize its complexity.
PerspectivesIn summary, the Ang peptide processing network can be suc-cessfully modeled using computational tools and data min-ing. Although our effort was based on an artificial system, we were able to elucidate intermediate pathways within the network that were not previously recognized. Because in vivo
maneuvers to alter the system involve inhibition or inactiva-tion of RAS enzymes, we speculate that our methods may help predicting and better understanding systemic or local effects of those manipulations and guide future research. Further exploration of the Ang peptide processing network by refined computational systems biology methods could improve our understanding of the intricacies of the RAS with potential impact in medical therapies.
AcknowledgmentsJennifer Bethard of the Medical University of South Carolina Mass Spectrometry Core was instrumental in helping us acquire spectra for matrix-assisted laser desorption ionization (MALDI)- time of flight (TOF) analysis. We thank Alison Bland for her assistance in collect-ing MALDI-TOF mass spectra.
Sources of FundingJ.C.G. Spainhour was supported under a training grant from the National Institute of General Medicine (5T32GM74934-8). M.G. Janech was supported by Career Development Awards (CDA) through the Department of Veterans’ Affairs (CDA-2) and the Nephcure Foundation. J.C.Q. Velez is supported by a grant from the National Institute of Diabetes and Digestive and Kidney Diseases (NIDDK) of the National Institutes of Health (NIH) (DK080944-04) and Dialysis Clinics Incorporated. J.H. Schwacke was supported, in part, by a grant from NIDDK of the NIH (1R01DK080234).
DisclosuresNone.
References 1. Skrbic R, Igic R. Seven decades of angiotensin (1939-2009). Peptides.
2009;30:1945–1950. 2. Velez JC. The importance of the intrarenal renin-angiotensin system. Nat
Clin Pract Nephrol. 2009;5:89–100. 3. Ardaillou R. Angiotensin II receptors. J Am Soc Nephrol. 1999;10(suppl
11):S30–S39. 4. Handa RK, Handa SE, Elgemark MK. Autoradiographic analysis and
regulation of angiotensin receptor subtypes AT(4), AT(1), and AT((1-7)) in the kidney. Am J Physiol Renal Physiol. 2001;281:F936–F947.
5. Santos RA, Simoes e Silva AC, Maric C, et al. Angiotensin-(1-7) is an endogenous ligand for the G protein-coupled receptor Mas. Proc Natl Acad Sci USA. 2003;100:8258–8263.
6. Gwathmey TM, Alzayadneh EM, Pendergrass KD, Chappell MC. Novel roles of nuclear angiotensin receptors and signaling mechanisms. Am J Physiol Regul Integr Comp Physiol. 2012;302:R518–R530.
7. Lewis EJ, Hunsicker LG, Clarke WR, Berl T, Pohl MA, Lewis JB, Ritz E, Atkins RC, Rohde R, Raz I; Collaborative Study Group. Renoprotective effect of the angiotensin-receptor antagonist irbesartan in patients with nephropathy due to type 2 diabetes. N Engl J Med. 2001;345: 851–860.
8. Lewis EJ, Hunsicker LG, Bain RP, Rohde RD. The effect of angiotensin-converting-enzyme inhibition on diabetic nephropathy. The Collaborative Study Group. N Engl J Med. 1993;329:1456–1462.
9. Parving HH, Persson F, Lewis JB, Lewis EJ, Hollenberg NK; AVOID Study Investigators. Aliskiren combined with losartan in type 2 diabetes and nephropathy. N Engl J Med. 2008;358:2433–2446.
10. Dahlöf B, Devereux RB, Kjeldsen SE, Julius S, Beevers G, de Faire U, Fyhrquist F, Ibsen H, Kristiansson K, Lederballe-Pedersen O, Lindholm LH, Nieminen MS, Omvik P, Oparil S, Wedel H; LIFE Study Group. Cardiovascular morbidity and mortality in the Losartan Intervention For Endpoint reduction in hypertension study (LIFE): a randomised trial against atenolol. Lancet. 2002;359:995–1003.
11. The SOLVD Investigators. Effect of enalapril on survival in patients with reduced left ventricular ejection fractions and congestive heart failure. N Engl J Med. 1991;325:293–302.
12. van den Meiracker AH, Man in ‘t Veld AJ, Admiraal PJ, Ritsema van Eck HJ, Boomsma F, Derkx FH, Schalekamp MA. Partial escape of angioten-sin converting enzyme (ACE) inhibition during prolonged ACE inhibitor
by guest on July 7, 2018http://hyper.ahajournals.org/
Dow
nloaded from
Schwacke et al Angiotensin Network Modeling 699
treatment: does it exist and does it affect the antihypertensive response? J Hypertens. 1992;10:803–812.
13. Mann JF, Schmieder RE, McQueen M, et al; ONTARGET investigators. Renal outcomes with telmisartan, ramipril, or both, in people at high vas-cular risk (the ONTARGET study): a multicentre, randomised, double-blind, controlled trial. Lancet. 2008;372:547–553.
14. Borghi C, Boschi S, Ambrosioni E, Melandri G, Branzi A, Magnani B. Evidence of a partial escape of renin-angiotensin-aldosterone blockade in patients with acute myocardial infarction treated with ACE inhibitors. J Clin Pharmacol. 1993;33:40–45.
15. Ahmed AK, Kamath NS, El Kossi M, El Nahas AM. The impact of stop-ping inhibitors of the renin-angiotensin system in patients with advanced chronic kidney disease. Nephrol Dial Transplant. 2010;25:3977–3982.
16. Haulica I, Bild W, Mihaila CN, Ionita T, Boisteanu CP, Neagu B. Biphasic effects of angiotensin (1-7) and its interactions with angiotensin II in rat aorta. J Renin Angiotensin Aldosterone Syst. 2003;4:124–128.
17. Dharmani M, Mustafa MR, Achike FI, Sim MK. Effect of des-aspartate-angiotensin I on the actions of angiotensin II in the isolated renal and mes-enteric vasculature of hypertensive and STZ-induced diabetic rats. Regul Pept. 2005;129:213–219.
18. Tallant EA, Ferrario CM, Gallagher PE. Angiotensin-(1-7) inhibits growth of cardiac myocytes through activation of the mas receptor. Am J Physiol Heart Circ Physiol. 2005;289:H1560–H1566.
19. Kemp BA, Bell JF, Rottkamp DM, Howell NL, Shao W, Navar LG, Padia SH, Carey RM. Intrarenal angiotensin III is the predominant ago-nist for proximal tubule angiotensin type 2 receptors. Hypertension. 2012;60:387–395.
20. Axelband F, Dias J, Miranda F, Ferrão FM, Reis RI, Costa-Neto CM, Lara LS, Vieyra A. Angiotensin-(3-4) counteracts the angiotensin II inhibitory action on renal Ca2+-ATPase through a cAMP/PKA pathway. Regul Pept. 2012;177:27–34.
21. Paula RD, Lima CV, Britto RR, Campagnole-Santos MJ, Khosla MC, Santos RA. Potentiation of the hypotensive effect of bradykinin by angio-tensin-(1-7)-related peptides. Peptides. 1999;20:493–500.
22. Handa RK. Angiotensin-(1-7) can interact with the rat proximal tubule AT(4) receptor system. Am J Physiol. 1999;277(1 pt 2):F75–F83.
23. Paul M, Poyan Mehr A, Kreutz R. Physiology of local renin-angiotensin systems. Physiol Rev. 2006;86:747–803.
24. Navar LG, Lewis L, Hymel A, Braam B, Mitchell KD. Tubular fluid con-centrations and kidney contents of angiotensins I and II in anesthetized rats. J Am Soc Nephrol. 1994;5:1153–1158.
25. Seikaly MG, Arant BS Jr, Seney FD Jr. Endogenous angiotensin concen-trations in specific intrarenal fluid compartments of the rat. J Clin Invest. 1990;86:1352–1357.
26. Gstaiger M, Aebersold R. Applying mass spectrometry-based pro-teomics to genetics, genomics and network biology. Nat Rev Genet. 2009;10:617–627.
27. Gerber SA, Rush J, Stemman O, Kirschner MW, Gygi SP. Absolute quan-tification of proteins and phosphoproteins from cell lysates by tandem MS. Proc Natl Acad Sci USA. 2003;100:6940–6945.
28. Velez JC, Bland AM, Arthur JM, Raymond JR, Janech MG. Characterization of renin-angiotensin system enzyme activities in cultured mouse podocytes. Am J Physiol Renal Physiol. 2007;293:F398–F407.
29. Velez JC, Ierardi JL, Bland AM, Morinelli TA, Arthur JM, Raymond JR, Janech MG. Enzymatic processing of angiotensin peptides by human glomerular endothelial cells. Am J Physiol Renal Physiol. 2012;302:F1583–F1594.
30. Lawhon SD, Khare S, Rossetti CA, Everts RE, Galindo CL, Luciano SA, Figueiredo JF, Nunes JE, Gull T, Davidson GS, Drake KL, Garner HR, Lewin HA, Bäumler AJ, Adams LG. Role of SPI-1 secreted effectors in acute bovine response to Salmonella enterica Serovar Typhimurium: a systems biology analysis approach. PLoS ONE. 2011;6:e26869.
31. Parikh A, Huang E, Dinh C, Zupan B, Kuspa A, Subramanian D, Shaulsky G. New components of the Dictyostelium PKA pathway revealed by Bayesian analysis of expression data. BMC Bioinformatics. 2010;11:163.
32. Sachs K, Perez O, Pe’er D, Lauffenburger DA, Nolan GP. Causal protein-signaling networks derived from multiparameter single-cell data. Science. 2005;308:523–529.
33. Woolf PJ, Prudhomme W, Daheron L, Daley GQ, Lauffenburger DA. Bayesian analysis of signaling networks governing embryonic stem cell fate decisions. Bioinformatics. 2005;21:741–753.
34. Pe’er D. Bayesian network analysis of signaling networks: a primer. Sci STKE. 2005;2005:pl4.
35. Voit EO. Computational Analysis of Biochemical Systems: a Practical Guide for Biochemists and Molecular Biologists. New York, NY: Cambridge University Press; 2000.
36. Voit EO. Model Identification: a Key Challenge is Computational Systems Biology. Optimization and Systems Biology. Volume 9. Beijing, China: World Publishing Corp; 2008:1–12.
37. Mundel P, Reiser J, Zúñiga Mejía Borja A, Pavenstädt H, Davidson GR, Kriz W, Zeller R. Rearrangements of the cytoskeleton and cell contacts induce process formation during differentiation of conditionally immor-talized mouse podocyte cell lines. Exp Cell Res. 1997;236:248–258.
38. Velez JC, Ryan KJ, Harbeson CE, Bland AM, Budisavljevic MN, Arthur JM, Fitzgibbon WR, Raymond JR, Janech MG. Angiotensin I is largely converted to angiotensin (1-7) and angiotensin (2-10) by isolated rat glomeruli. Hypertension. 2009;53:790–797.
39. R Development Core Team. A Language and Environment for Statistical Computing [Computer Program]. Viena, Austria: R Foundation for Statistical Computing; 2009.
40. Scutari M. Learning Bayesian Networks with the bnlearn R Package. J Stat Softw. 2010;35:1–22.
41. Grzegorczyk M. An introduction to Gaussian Bayesian networks. Methods Mol Biol. 2010;662:121–147.
42. Hastings WK. Monte Carlo sampling methods using Markov chains and their applications. Biometrika. 1970;57:97–109.
43. Ryan JW, Chung AY, Nearing JA, Valido FA, Shun-Cun C, Berryer P. A radiochemical assay for aminopeptidase N. Anal Biochem. 1993;210:27–33.
44. Rice GI, Thomas DA, Grant PJ, Turner AJ, Hooper NM. Evaluation of angiotensin-converting enzyme (ACE), its homologue ACE2 and neprilysin in angiotensin peptide metabolism. Biochem J. 2004;383(pt 1):45–51.
45. Iturrioz X, Rozenfeld R, Michaud A, Corvol P, Llorens-Cortes C. Study of asparagine 353 in aminopeptidase A: characterization of a novel motif (GXMEN) implicated in exopeptidase specificity of monozinc aminopep-tidases. Biochemistry. 2001;40:14440–14448.
46. Chiu AT, Ryan JW, Stewart JM, Dorer FE. Formation of angiotensin III by angiotensin-converting enzyme. Biochem J. 1976;155:189–192.
47. Bausback HH, Churchill L, Ward PE. Angiotensin metabolism by cere-bral microvascular aminopeptidase A. Biochem Pharmacol. 1988;37: 155–160.
48. Goto Y, Hattori A, Ishii Y, Mizutani S, Tsujimoto M. Enzymatic proper-ties of human aminopeptidase A. Regulation of its enzymatic activity by calcium and angiotensin IV. J Biol Chem. 2006;281:23503–23513.
49. Bauvois B, Dauzonne D. Aminopeptidase-N/CD13 (EC 3.4.11.2) inhibi-tors: chemistry, biological evaluations, and therapeutic prospects. Med Res Rev. 2006;26:88–130.
50. Ahmad S, Ward PE. Role of aminopeptidase activity in the regulation of the pressor activity of circulating angiotensins. J Pharmacol Exp Ther. 1990;252:643–650.
51. Yatabe J, Yoneda M, Yatabe MS, Watanabe T, Felder RA, Jose PA, Sanada H. Angiotensin III stimulates aldosterone secretion from adrenal gland partially via angiotensin II type 2 receptor but not angiotensin II type 1 receptor. Endocrinology. 2011;152:1582–1588.
52. Plovsing RR, Wamberg C, Sandgaard NC, Simonsen JA, Holstein-Rathlou NH, Hoilund-Carlsen PF, Bie P. Effects of truncated angiotensins in humans after double blockade of the renin system. Am J Physiol Regul Integr Comp Physiol. 2003;285:R981–R991.
53. Handa RK. Biphasic actions of angiotensin IV on renal blood flow in the rat. Regul Pept. 2006;136:23–29.
54. Campbell DJ, Lawrence AC, Towrie A, Kladis A, Valentijn AJ. Differential regulation of angiotensin peptide levels in plasma and kidney of the rat. Hypertension. 1991;18:763–773.
55. Nadarajah R, Milagres R, Dilauro M, Gutsol A, Xiao F, Zimpelmann J, Kennedy C, Wysocki J, Batlle D, Burns KD. Podocyte-specific overex-pression of human angiotensin-converting enzyme 2 attenuates diabetic nephropathy in mice. Kidney Int. 2012;82:292–303.
56. Kaneshiro Y, Ichihara A, Sakoda M, Takemitsu T, Nabi AH, Uddin MN, Nakagawa T, Nishiyama A, Suzuki F, Inagami T, Itoh H. Slowly progres-sive, angiotensin II-independent glomerulosclerosis in human (pro)renin receptor-transgenic rats. J Am Soc Nephrol. 2007;18:1789–1795.
57. Singh VP, Le B, Khode R, Baker KM, Kumar R. Intracellular angiotensin II production in diabetic rats is correlated with cardiomyocyte apoptosis, oxidative stress, and cardiac fibrosis. Diabetes. 2008;57:3297–3306.
58. Cristovam PC, Arnoni CP, de Andrade MC, Casarini DE, Pereira LG, Schor N, Boim MA. ACE-dependent and chymase-dependent angiotensin II generation in normal and glucose-stimulated human mesangial cells. Exp Biol Med (Maywood). 2008;233:1035–1043.
59. Ramírez M, Prieto I, Martinez JM, Vargas F, Alba F. Renal aminopepti-dase activities in animal models of hypertension. Regul Pept. 1997;72: 155–159.
by guest on July 7, 2018http://hyper.ahajournals.org/
Dow
nloaded from
700 Hypertension March 2013
60. Oliveira V, Ferro ES, Gomes MD, Oshiro ME, Almeida PC, Juliano MA, Juliano L. Characterization of thiol-, aspartyl-, and thiol-metallo-peptidase activities in Madin-Darby canine kidney cells. J Cell Biochem. 2000;76:478–488.
61. Chappell MC, Gomez MN, Pirro NT, Ferrario CM. Release of angio-tensin-(1-7) from the rat hindlimb: influence of angiotensin-converting enzyme inhibition. Hypertension. 2000;35(1 pt 2):348–352.
62. Park S, Bivona BJ, Kobori H, Seth DM, Chappell MC, Lazartigues E, Harrison-Bernard LM. Major role for ACE-independent intra renal ANG
II formation in type II diabetes. Am J Physiol Renal Physiol. 2010;298: F37–F48.
63. Deddish PA, Marcic B, Jackman HL, Wang HZ, Skidgel RA, Erdös EG. N-domain-specific substrate and C-domain inhibitors of angiotensin-converting enzyme: angiotensin-(1-7) and keto-ACE. Hypertension. 1998;31:912–917.
64. Jankowski V, Vanholder R, van der Giet M, et al. Mass-spectrometric iden-tification of a novel angiotensin peptide in human plasma. Arterioscler Thromb Vasc Biol. 2007;27:297–302.
Novelty and Significance
What Is New?•Our study is the first to apply computational tools to model a cell-based
network of angiotensin (Ang) peptides and peptidases and, through the process, reveal novel steps within that network.
What Is Relevant?•We demonstrated that conversion of Ang(2–10) to Ang(2–7) by neprilysin,
Ang(1–9) to Ang(2–9) by aminopeptidase A, and Ang(1–7) to Ang(2–7) by aminopeptidase A constitutes elements of the cascade of fragmentation of Ang substrates in mouse podocytes.
Summary
The Ang peptide processing network can be successfully modeled using Bayesian network inference and dynamic systems modeling coupled with peptidomic data mining. Our tools proved effective in revealing steps of the network that lead to either transient generation of bioactive peptides or shunting of their formation.
by guest on July 7, 2018http://hyper.ahajournals.org/
Dow
nloaded from
Arthur, Michael G. Janech and Juan Carlos Q. VelezJohn H. Schwacke, John Christian G. Spainhour, Jessalyn L. Ierardi, Jose M. Chaves, John M.
Network Modeling Reveals Steps in Angiotensin Peptide Processing
Print ISSN: 0194-911X. Online ISSN: 1524-4563 Copyright © 2013 American Heart Association, Inc. All rights reserved.
is published by the American Heart Association, 7272 Greenville Avenue, Dallas, TX 75231Hypertension doi: 10.1161/HYPERTENSIONAHA.111.003182013;61:690-700; originally published online January 2, 2013;Hypertension.
http://hyper.ahajournals.org/content/61/3/690World Wide Web at:
The online version of this article, along with updated information and services, is located on the
http://hyper.ahajournals.org/content/suppl/2012/12/31/HYPERTENSIONAHA.111.00318.DC1Data Supplement (unedited) at:
http://hyper.ahajournals.org//subscriptions/
is online at: Hypertension Information about subscribing to Subscriptions:
http://www.lww.com/reprints Information about reprints can be found online at: Reprints:
document. Permissions and Rights Question and Answer this process is available in the
click Request Permissions in the middle column of the Web page under Services. Further information aboutOffice. Once the online version of the published article for which permission is being requested is located,
can be obtained via RightsLink, a service of the Copyright Clearance Center, not the EditorialHypertensionin Requests for permissions to reproduce figures, tables, or portions of articles originally publishedPermissions:
by guest on July 7, 2018http://hyper.ahajournals.org/
Dow
nloaded from
1
ONLINE SUPPLEMENT
Network Modeling Reveals Steps in Angiotensin Peptide Processing
John H. Schwacke1, John Christian G. Spainhour1, Jessalyn L. Ierardi2, Jose M.
Chaves2, John M. Arthur2,3, Michael G. Janech2,3, Juan Carlos Q. Velez2,3
1 Department of Biochemistry and Molecular Biology, Medical University of South Carolina, Charleston, SC, USA, 29425 2 Division of Nephrology, Department of Medicine, Medical University of South Carolina, Charleston, SC, USA, 29425 3 Medical and Research Services, Ralph H. Johnson Veterans Affairs Medical Center, Charleston, SC, USA, 29425
Author Contributions J.H.S., M. G. J. and J.C.Q.V.: conception and design of research; J.H.S., J.C.G.S., J.L.I., J.M.C. and J.C.Q.V.: performed experiments; J.H.S., J.C.G.S., M. G. J. and J.C.Q.V analyzed data; J.H.S., M. G. J., J.M.A. and J.C.Q.V. interpreted results of experiments; J.H.S. prepared figures and drafted manuscript; M. G. J. and J.C.Q.V edited and revised manuscript.
Corresponding Author:
Juan Carlos Q. Velez, MD Division of Nephrology Medical University of South Carolina Clinical Science Building, 829 96 Jonathan Lucas Street Charleston, SC, USA, 29425 Phone: 843-792-4123 Fax: 843-792-8399 e-mail: [email protected]
2
EXPANDED MATERIALS AND METHODS
Mouse Podocyte Cell Culture. Immortalized mouse podocytes [generously provided by Dr. Peter Mundel (Massachusetts General Hospital, Boston, MA) and Dr. Jeffrey Kopp (National Institutes of Health, Bethesda, MD)] were grown under standard conditions as previously published.1 Cells were exposed to angiotensin (Ang) substrates as previously described.2 Following overnight starvation, differentiated cells were incubated in serum-free medium and exposed to 1 µmol/L Ang(1-10) (also called Ang I), Ang(2-10), Ang(1-9), Ang(1-8) (also called Ang II) or Ang(1-7) for 15 minutes - 8 hours, in the presence or absence of RAS enzyme inhibitors added 20 minutes prior to exposure to the Ang substrate, as previously described. The concentrations of the inhibitors were selected based on the manufacturer’s recommendation or IC50/Ki of the compound, and confirmed by dose/concentration response curves: 100 µmol/L captopril (Ang-converting enzyme inhibitor), 100 µmol/L chymostatin (chymase inhibitor), 1 µmol/L thiorphan (neprilysin inhibitor), 10 µmol/L SCH39370 (NEP inhibitor), 100 µmol/L amastatin (aminopeptidase A inhibitor) and 1 µmol/L DX600 (ACE2 inhibitor). All inhibitors were obtained from Sigma-Aldrich (St Louis, MO), except DX600 (Phoenix Pharmaceuticals, Burlingame, CA) and SCH39370 (gift from Dr. Mark Chappell, Wake Forest University, Winston-Salem, NC). Conditioned cell culture media were collected at various time points and stored at -20ºC until assayed.
MALDI-TOF Mass Spectrometry. Samples obtained at various time points were assayed by matrix-assisted laser desorption ionization (MALDI) time of flight (TOF) mass spectrometry (MS), as previously described, with minor modifications.2,3 Briefly, peptides were purified using C18 Zip-Tip columns (Milipore, Billerica, MA). Columns were equilibrated with 100% acetonitrile (ACN), washed with 0.1% -trifluoroacetic acid (TFA), loaded with 20 µl of sample, washed with 10 µl of 0.1%-trifluoroacetic acid, and eluted with a low-pH MALDI matrix compound (10 g/L α-cyano-4-hydroxycinnamic acid in a 1:1 mixture of 50% ACN and 0.1% TFA). Prior to column loading, samples were acidified with 1% TFA. Biological samples were analyzed in triplicate. Eluted matrix (1.5 µl) from each sample was applied to the surface of a target plate in duplicate. The plate was air-dried prior to collecting spectra. Spectra were collected in reflectron mode using a M@LDI MALDI-TOF mass spectrometer (Waters Corp., Milford, MA). Results were analyzed using MassLynx 2.0 software (Waters). Peptide identities were confirmed by MS/MS de novo sequencing from ion series generated by MALDI-TOF-TOF (ABI 4800 Series, AB Sciex, Framingham, MA) and Triple Time of Flight MS (ABSCIEX 5600, Framingham, MA). Quantifications of observed peaks were performed using customized isotopic Absolute Quantification (AQUA) peptides (Sigma-Aldrich), as previously described. AQUA peptides are 6 Da larger than the native peptide as a result of [13C.15N]-valine incorporation into the amino-acid sequence. A cocktail of AQUA peptides was mixed with each sample of conditioned buffer prior to MALDI-TOF MS analysis. The final concentration of each AQUA peptide in the mix was set between 10 and 500 nmol/L (0.25 – 12.5 pmols), depending on the qualitative appearance of the peptide peaks on the mass spectra. In the absence of cells, all Ang peptide levels were found to be stable over up to 8 hours of incubation.
3
Peptide Peak Intensity Normalization. While many of the spectra from our archive contained AQUA reference peptides, this was not universally so, and, when present, quantitative measures were available for only 1 to 4 peptides. To overcome this limitation we sought options for normalizing the data so that peak areas could be compared across spectra. We chose to normalize spectra to their total angiotensin peptide ion current (the sum of the isotopic cluster areas for all angiotensin peptides) following elimination of poor quality fits. To assess the suitability of the selected normalization procedure, we selected a subset of spectra in which an AQUA peptide with known amount was present. The AQUA peptide area was found to correlate well with the total angiotensin peptide current in these data ( 87.0=r ). While the selected normalization method is not ideal, it provides a consistent approach that could be applied to all spectra from the archive. The angiotensin peak area estimates were normalized using this approach.
Gaussian Bayesian Network Inference. In order to learn the network structure, we employed Bayesian network inference. Nodes in this network represent angiotensin peptide abundances as well as factors that influence abundance (stimulation and inhibition) and edges represent conditional dependencies between nodes. Network nodes included all Ang peptides with length greater than 5 amino acids (Table S1), all added substrates, inhibitors, and time since substrate addition. We treat the data as continuous and employ Gaussian Bayesian Networks where the global distribution is taken to be multivariate normal and local distributions are normal and linked by linear constraints associated with edges 4. Peptide areas are log-transformed prior to application of the inference process. In the most general case, network structure identification considers the space of directed acyclic graphs linking the network variables. In our case, however, we can significantly reduce this space and simultaneously constrain allowable networks to directed acyclic graphs by banning edges that do not adhere to the constraints of the peptide cleavage process. We only allow edges for steps that involve cleavage at a single site and thus result in shorter peptides. We therefore constrain the search space by constructing a list of edges that violate these constraints and ban the inference process from considering their inclusion in the network. The decapeptide Ang I, for example, could only be cleaved at 9 different sites, each cleavage yielding 2 peptide fragments. For 8 of the 9 sites, one or the other of the fragments would be below the lower mass limit of our data (smaller than 5 amino acids) and so a maximum of 10 edges from Ang I to each of the larger fragments would be allowed for consideration in the graph. Similar logic is applied to all angiotensin peptide fragments to identify allowable edges. Nodes representing each of the stimuli were also included and edges were allowed between each stimulus and its associated angiotensin peptide. Inhibitors were treated similarly but were allowed to influence all peptides. In these experiments, inhibitors lack specificity and, due to alternative paths to a given node, do not completely determine node states. We therefore include inhibitors as orphaned nodes with state determined by experimental conditions and allow edges from these nodes to nodes representing angiotensin peptide abundances. Known steps in the pathway representing our baseline network were added to a list that forced their inclusion in the network. All spectra taken from the archive were collected from experiments evoking a transient response through substrate addition. The time points at which the samples were collected were coarse (several hours) and collection times
4
varied from experiment to experiment. As such, the data was considered insufficient for model development using a Dynamic Bayesian Network modeling framework. To allow for some temporal effect, the time after substrate addition was included as a node in the model with edges allowed to all peptides. The network model was constructed using the tabu search algorithm 5. This method leads to a point solution. To assess the strength of each network edge, we employed bootstrapping where networks were built from edge sets formed by sampling from the constructed network. The frequency with which each edge remained in the network resulting from the bootstrapped set was taken as a measure of the strength of that edge and we focused further effort on those edges that appeared in more than 80% of the networks associated with the bootstrapped edge sets.
Ang Peptide Flyability. The observed peak areas from the mass spectra vary not only according to the amount of analyte present but also the physical properties of the analyte and its propensity for ionization. In this analysis, we include a scaling parameter for each peptide that relates the normalized isotopic cluster area to the underlying amount of analyte in the sample ppp XFA = . Under this model, relative peptide areas are assumed proportional to relative peptide amounts, related by pF .6,7 These flyability parameters are taken to be unique to each peptide and constant across all experiments and conditions. To test this approach, we constructed known mixtures of Ang I, Ang(1-9), Ang(2-10), Ang II, and Ang(1-7) with individual peptide concentrations at 0.1, 0.25, 0.5, 0.75, or 1 µM, collected MALDI mass spectra from the mixtures, and compared the peptide peak areas, normalized to total angiotensin current, to the known relative concentrations. The normalized area to relative concentration ratios were found to have a strong linear correlation ( 95.0=r ), thus supporting our use of the proposed scaling approach. These flyability parameters were estimated in the Markov Chain Monte Carlo process along with the rate constants, and priors for these parameters were based on the flyability estimates derived from our mixture tests.
System Model Inference and Reaction Set. A series of models were constructed, starting from a baseline, with additional reaction steps included if they provided an improvement in the model's ability to explain the observed data. Steps suggested by the Bayesian network were sorted into groups along a particular branch of the pathway [Ang(2-10), Ang(1-9), etc.] extending down from the stimulation points used in our experiments. The baseline model was established based on a proposed network8, augmented with the three steps confirmed in our experiments, and an initial model was fit using that structure. Model comparison was accomplished using the Deviance Information Criterion (DIC)9 in an approach similar to that proposed elsewhere10 For all models we computed the mean of the deviance, taken from samples of the posterior parameter distribution (following burn-in and thinning), and the deviance of the mean of the posterior to compute the DIC. Repeated executions of the inference process in independent Markov Chains were used to provide an estimate of the variance in the DIC and model comparisons were then based on DIC differences and their variance estimates.
5
Supplemental references
1. Mundel P, Reiser J, Zuniga Mejia Borja A, et al. Rearrangements of the cytoskeleton and cell contacts induce process formation during differentiation of conditionally immortalized mouse podocyte cell lines. Exp Cell Res. 1997;236:248-258.
2. Velez JC, Bland AM, Arthur JM, Raymond JR, Janech MG. Characterization of renin-angiotensin system enzyme activities in cultured mouse podocytes. Am J Physiol Renal Physiol. 2007;293:F398-407.
3. Velez JC, Ryan KJ, Harbeson CE, et al. Angiotensin I is largely converted to angiotensin (1-7) and angiotensin (2-10) by isolated rat glomeruli. Hypertension. 2009;53:790-797.
4. Grzegorczyk M. An introduction to Gaussian Bayesian networks. Methods Mol Biol. 2010;662:121-147.
5. Glover F. Tabu Search - Part I. ORSA Journal on Computing. 1989;1:190-206. 6. Steen H, Jebanathirajah JA, Springer M, Kirschner MW. Stable isotope-free
relative and absolute quantitation of protein phosphorylation stoichiometry by MS. Proc Natl Acad Sci U S A. 2005;102:3948-3953.
7. Sanders WS, Bridges SM, McCarthy FM, Nanduri B, Burgess SC. Prediction of peptides observable by mass spectrometry applied at the experimental set level. BMC Bioinformatics. 2007;8 Suppl 7:S23.
8. Velez JC. The importance of the intrarenal renin-angiotensin system. Nat Clin Pract Nephrol. 2009;5:89-100.
9. Spiegelhalter DJ, Best NG, Carlin BP. Bayesian Deviance, the Effective Number of Parameters, and the Comparison of Arbitrarily Complex Models: Division of Biostatistics, University of Minnesota;1998.
10. Vyshemirsky V, Girolami MA. Bayesian ranking of biochemical system models. Bioinformatics. 2008;24:833-839.
6
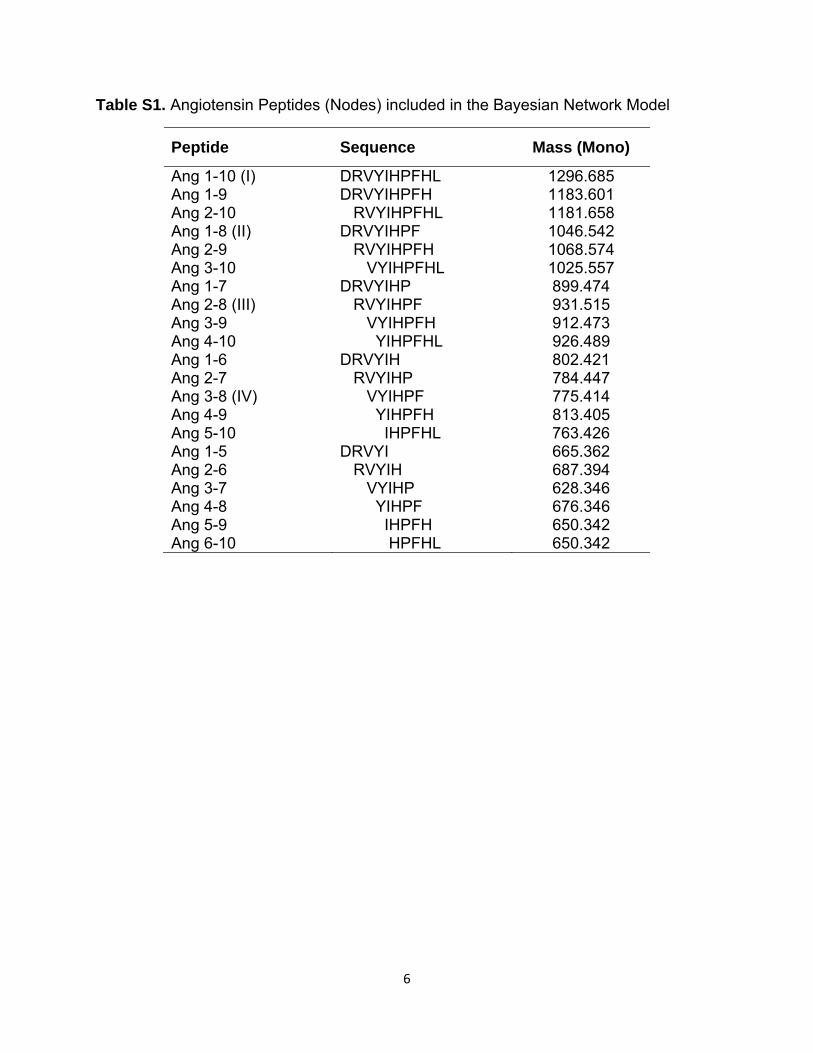
Table S1. Angiotensin Peptides (Nodes) included in the Bayesian Network Model
Peptide Sequence Mass (Mono)
Ang 1-10 (I) DRVYIHPFHL 1296.685 Ang 1-9 DRVYIHPFH 1183.601 Ang 2-10 RVYIHPFHL 1181.658 Ang 1-8 (II) DRVYIHPF 1046.542 Ang 2-9 RVYIHPFH 1068.574 Ang 3-10 VYIHPFHL 1025.557 Ang 1-7 DRVYIHP 899.474 Ang 2-8 (III) RVYIHPF 931.515 Ang 3-9 VYIHPFH 912.473 Ang 4-10 YIHPFHL 926.489 Ang 1-6 DRVYIH 802.421 Ang 2-7 RVYIHP 784.447 Ang 3-8 (IV) VYIHPF 775.414 Ang 4-9 YIHPFH 813.405 Ang 5-10 IHPFHL 763.426 Ang 1-5 DRVYI 665.362 Ang 2-6 RVYIH 687.394 Ang 3-7 VYIHP 628.346 Ang 4-8 YIHPF 676.346 Ang 5-9 IHPFH 650.342 Ang 6-10 HPFHL 650.342
7
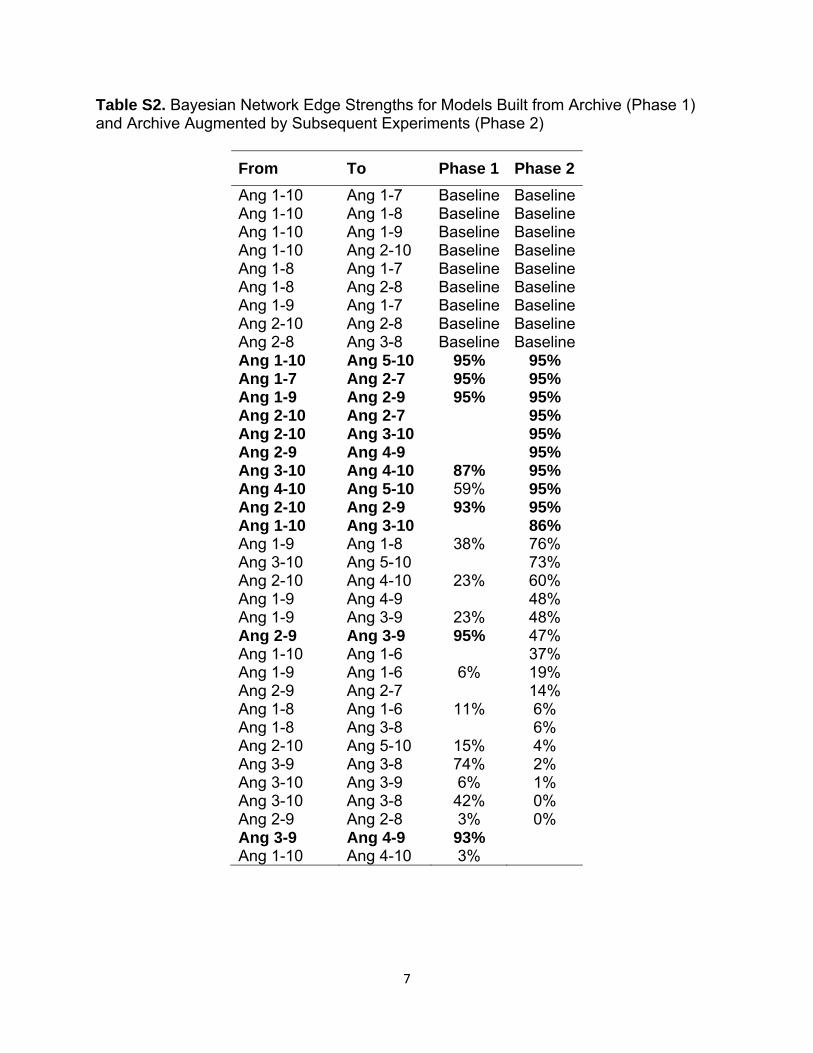
Table S2. Bayesian Network Edge Strengths for Models Built from Archive (Phase 1) and Archive Augmented by Subsequent Experiments (Phase 2)
From To Phase 1 Phase 2 Ang 1-10 Ang 1-7 Baseline Baseline Ang 1-10 Ang 1-8 Baseline Baseline Ang 1-10 Ang 1-9 Baseline Baseline Ang 1-10 Ang 2-10 Baseline Baseline Ang 1-8 Ang 1-7 Baseline Baseline Ang 1-8 Ang 2-8 Baseline Baseline Ang 1-9 Ang 1-7 Baseline Baseline Ang 2-10 Ang 2-8 Baseline Baseline Ang 2-8 Ang 3-8 Baseline Baseline Ang 1-10 Ang 5-10 95% 95% Ang 1-7 Ang 2-7 95% 95% Ang 1-9 Ang 2-9 95% 95% Ang 2-10 Ang 2-7 95% Ang 2-10 Ang 3-10 95% Ang 2-9 Ang 4-9 95% Ang 3-10 Ang 4-10 87% 95% Ang 4-10 Ang 5-10 59% 95% Ang 2-10 Ang 2-9 93% 95% Ang 1-10 Ang 3-10 86% Ang 1-9 Ang 1-8 38% 76% Ang 3-10 Ang 5-10 73% Ang 2-10 Ang 4-10 23% 60% Ang 1-9 Ang 4-9 48% Ang 1-9 Ang 3-9 23% 48% Ang 2-9 Ang 3-9 95% 47% Ang 1-10 Ang 1-6 37% Ang 1-9 Ang 1-6 6% 19% Ang 2-9 Ang 2-7 14% Ang 1-8 Ang 1-6 11% 6% Ang 1-8 Ang 3-8 6% Ang 2-10 Ang 5-10 15% 4% Ang 3-9 Ang 3-8 74% 2% Ang 3-10 Ang 3-9 6% 1% Ang 3-10 Ang 3-8 42% 0% Ang 2-9 Ang 2-8 3% 0% Ang 3-9 Ang 4-9 93% Ang 1-10 Ang 4-10 3%