Embed Size (px)
Citation preview
Journal of Experimental Marine Biology and Ecology 397 (2011) 1–7
Contents lists available at ScienceDirect
Journal of Experimental Marine Biology and Ecology
j ourna l homepage: www.e lsev ie r.com/ locate / jembe
Ontogenetic and environmental effects on otolith shape variability in threeMediterranean European eel (Anguilla anguilla, L.) local stocks
Fabrizio Capoccioni a,⁎, Corrado Costa b, Jacopo Aguzzi c, Paolo Menesatti b,Antoni Lombarte c, Eleonora Ciccotti a
a Dipartimento di Biologia, Università degli Studi di Roma “Tor Vergata”, via della Ricerca Scientifica snc, 00133 Rome, Italyb CRA-ING (Agricultural Engineering Research Unit of the Agriculture Research Council) Via della Pascolare, 16, 00015, Monterotondo Scalo (Rome), Italyc Institut de Ciències del Mar (ICM-CSIC). Passeig Marítim de la Barceloneta 37, 08003 Barcelona, Catalonia, Spain
⁎ Corresponding author. Fax: +39 0672595965.E-mail address: [email protected] (F.
0022-0981/$ – see front matter © 2010 Elsevier B.V. Aldoi:10.1016/j.jembe.2010.11.011
a b s t r a c t
a r t i c l e i n f oArticle history:Received 27 July 2010Received in revised form 11 November 2010Accepted 15 November 2010
Keywords:Anguilla anguillaElliptic Fourier analysisHabitat related changesOtolith shapeSize–shape relationshipe
Otolith morphology is an efficient tool for the discrimination of fish stocks, populations and species whencomparative genetic data are not available. Currently, the relationship betweenenvironmental factors and otolithshape is poorly characterized for the European eel (Anguilla anguilla), a highly migratory catadromous speciesconstituting a single, randomly mating stock. The present study analyses the differences in otolith morphologybetween three Mediterranean eel local stocks from different environmental contexts (i.e. two brackish lagoonsand one river). The relationship between otolith shape and otolith size was studied by means of Elliptic Fourieranalysis and multivariate statistics. Otolith profile was digitally acquired and Cartesian coordinates wereextracted. Partial Least Square (PLS) analysispointed to continuous allometric growth in sizeand shape inotolithsfrom all three sites. In the three environments, shape variations occurred during growth as indicated by thepresence of a significant and positive relationship between otolith size and the first PLS latent vector (i.e. whichbears most of the information regarding otolith outline). Differences between smaller and larger sized otolithswere investigated using PLS Discriminant Analysis (PLSDA) and cluster analysis. Results indicate that otolithshape is highly uniform at smaller than at larger sizes. These shape differences apparently overlap the initialdifferentiation of the small otolith outlines acquired by eels during the growing phase as elvers in the marineenvironment. Data were discussed considering that the physical and chemical habitat variability in brackishlagoons and river could underlie a marked change in otolith shape during the animals' growth.
Capoccioni).
l rights reserved.
© 2010 Elsevier B.V. All rights reserved.
1. Introduction
The otoliths are calcium carbonate concretions in the inner ear offish. The saccular otolith (sagitta) is characterizedbyhighmorphologicalvariability between species (Platt and Popper, 1981). Endogenous andexogenous factors determine both otolith overall shape and growthpatterns (Lombarte et al., 2003). Otoliths can be considered aspermanent recorders of the exposure of animals to combinations ofenvironmental factors (Jones, 1992). Otolith morphology provides anefficient tool for distinguishing between fish stocks, populations andspecies when comparative genetic data are not available (Castonguayet al., 1991; Lombarte and Castellon, 1991; Campana and Casselman,1993; Cardinale et al., 2004; Stransky et al., 2005). They function as goodphenotypicmarkers that can be used to study environmentally-inducedvariations (i.e. the reactionnorm), acting asmoreeffective tools than thegenetic variation itself in thefisherymanagementof endangered species(Begg et al., 1999).
The peculiar chronological and chemical properties of otoliths formthe basis of numerous studies focused on their organic and inorganiccompositionwhich is dependent on the animals' continuous presence incertain water masses, thus allowing the characterization of individuallife history as a function of the use made of the habitat at differentgrowth stages (Elsdon et al., 2008). Otolith chemistry has been studiedfor the purpose of trackingmovements and/or habitat shifts throughoutlife history (Tzeng et al., 1997, 2005; Daverat et al., 2005), henceinferring stock structure and population connectivity (Stransky et al.,2005). This is the case of the catadromous species Anguilla anguilla (L.),(i.e. the European eel). This species presents a highly migratorybehaviour, spawning in the Sargasso Sea and growing in all types ofNorthern and Western European freshwater habitats as well as in theMediterranean Sea. European eel panmixia theory is generally accepted,and, although has been debated for long time (e.g. Wirth andBernatchez, 2001; Bianchini et al., 2009), it asserts that all Europeaneels constitute a single, randomlymating stock (Dannewitz et al., 2005).So far only one study has focused on the relationship betweenenvironmental factors and otolith morphology in the A. anguilla,highlighting that eels infected by Anguillicola crassus, a swimbladder
2 F. Capoccioni et al. / Journal of Experimental Marine Biology and Ecology 397 (2011) 1–7
parasite, presented shape differences between right and left otolithwithrespect to sane specimen (Sahyoun et al., 2008).
The understanding and characterization of the otolith shape inEuropean eel local stocks is of interest since somatic plasticity may notbe related to genetic differentiation, but could be totally dependent onfactors related to habitat characteristics (e.g. latitude, temperature,salinity, food supply) and other demographic features (e.g., populationdensity and population size)(Vøllestad, 1992; Melià et al., 2006;Bevacqua et al., 2006). All these factors seem to influence overall bodygrowth (De Leo and Gatto, 1995).
In this context, for the first time we analyzed the intra- and inter-population phenotypic plasticity of otolith morphology in threeMediterranean eel stocks from different environments (i.e. coastal-marine and inland freshwater areas). We investigated the morphol-ogical change in otolith shape during the growth, thus targeting therelationship between size and shape. Morphological changes wereanalyzed in relation to the juvenile–adult transition (i.e. at therecruitment from the sea to inland water systems up to the subsequentreproductive migration). Elliptic Fourier analysis (Castonguay et al.,1991; Stransky et al., 2005), combined with multivariate statistics(i.e. PLS and PLSDA; Costa et al., 2009, 2010) was used to distinguishotoliths according to their contour.
2. Materials and methods
2.1. Sampling sites
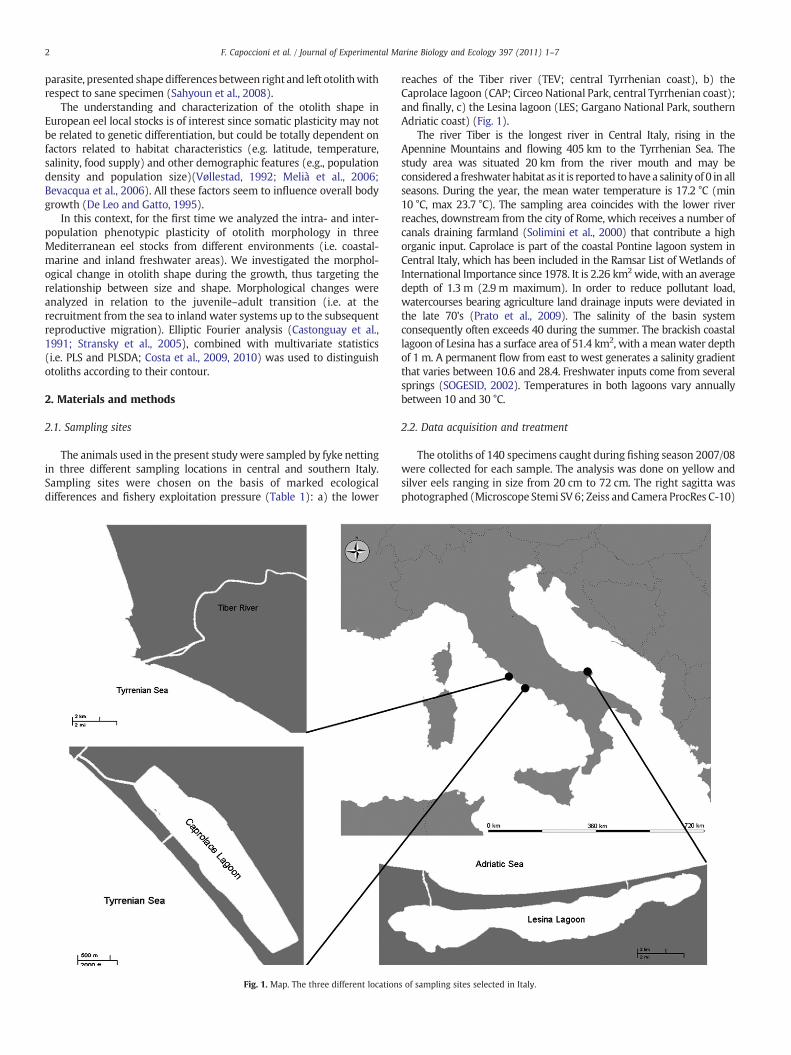
The animals used in the present study were sampled by fyke nettingin three different sampling locations in central and southern Italy.Sampling sites were chosen on the basis of marked ecologicaldifferences and fishery exploitation pressure (Table 1): a) the lower
Fig. 1. Map. The three different location
reaches of the Tiber river (TEV; central Tyrrhenian coast), b) theCaprolace lagoon (CAP; Circeo National Park, central Tyrrhenian coast);and finally, c) the Lesina lagoon (LES; Gargano National Park, southernAdriatic coast) (Fig. 1).
The river Tiber is the longest river in Central Italy, rising in theApennine Mountains and flowing 405 km to the Tyrrhenian Sea. Thestudy area was situated 20 km from the river mouth and may beconsidered a freshwater habitat as it is reported tohavea salinity of 0 in allseasons. During the year, the mean water temperature is 17.2 °C (min10 °C, max 23.7 °C). The sampling area coincides with the lower riverreaches, downstream from the city of Rome, which receives a number ofcanals draining farmland (Solimini et al., 2000) that contribute a highorganic input. Caprolace is part of the coastal Pontine lagoon system inCentral Italy, which has been included in the Ramsar List of Wetlands ofInternational Importance since 1978. It is 2.26 km2wide, with an averagedepth of 1.3 m (2.9 m maximum). In order to reduce pollutant load,watercourses bearing agriculture land drainage inputs were deviated inthe late 70's (Prato et al., 2009). The salinity of the basin systemconsequently often exceeds 40 during the summer. The brackish coastallagoon of Lesina has a surface area of 51.4 km2, with a meanwater depthof 1 m. A permanent flow from east to west generates a salinity gradientthat varies between 10.6 and 28.4. Freshwater inputs come from severalsprings (SOGESID, 2002). Temperatures in both lagoons vary annuallybetween 10 and 30 °C.
2.2. Data acquisition and treatment
The otoliths of 140 specimens caught during fishing season 2007/08were collected for each sample. The analysis was done on yellow andsilver eels ranging in size from 20 cm to 72 cm. The right sagitta wasphotographed (Microscope Stemi SV 6; Zeiss and Camera ProcRes C-10)
s of sampling sites selected in Italy.
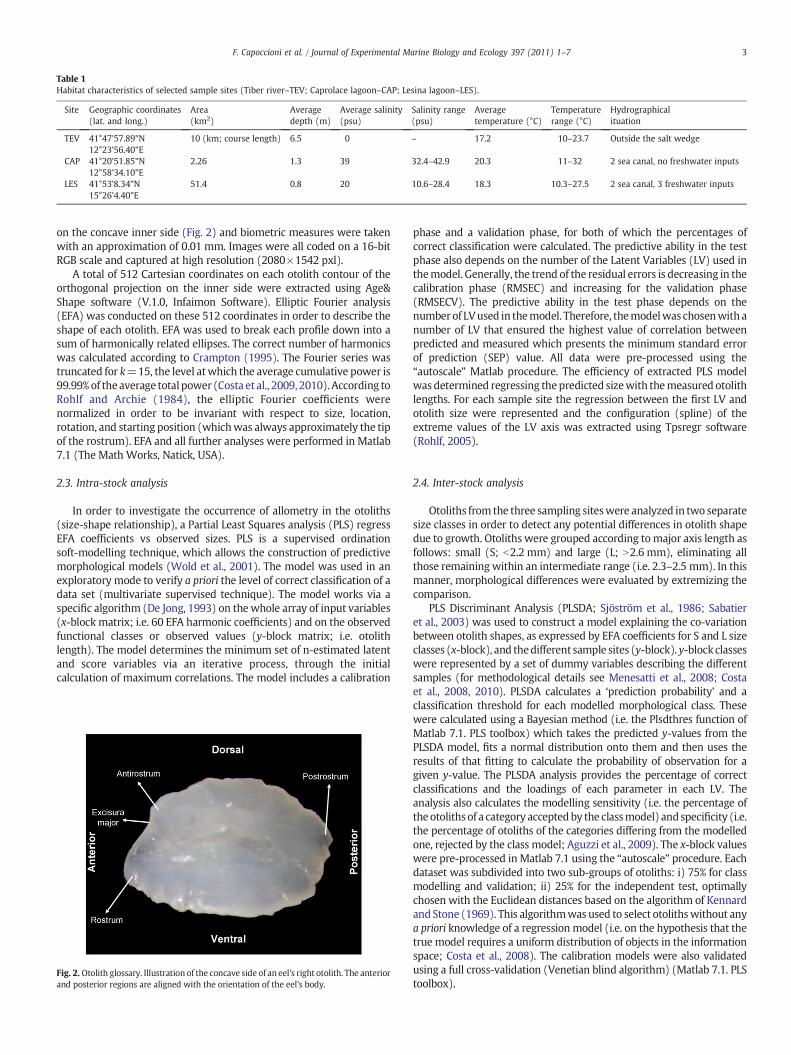
Table 1Habitat characteristics of selected sample sites (Tiber river–TEV; Caprolace lagoon–CAP; Lesina lagoon–LES).
Site Geographic coordinates(lat. and long.)
Area(km2)
Averagedepth (m)
Average salinity(psu)
Salinity range(psu)
Averagetemperature (°C)
Temperaturerange (°C)
Hydrographicalituation
TEV 41°47'57.89"N 10 (km; course length) 6.5 0 – 17.2 10–23.7 Outside the salt wedge12°23'56.40"E
CAP 41°20'51.85"N 2.26 1.3 39 32.4–42.9 20.3 11–32 2 sea canal, no freshwater inputs12°58'34.10"E
LES 41°53'8.34"N 51.4 0.8 20 10.6–28.4 18.3 10.3–27.5 2 sea canal, 3 freshwater inputs15°26'4.40"E
3F. Capoccioni et al. / Journal of Experimental Marine Biology and Ecology 397 (2011) 1–7
on the concave inner side (Fig. 2) and biometric measures were takenwith an approximation of 0.01 mm. Images were all coded on a 16-bitRGB scale and captured at high resolution (2080×1542 pxl).
A total of 512 Cartesian coordinates on each otolith contour of theorthogonal projection on the inner side were extracted using Age&Shape software (V.1.0, Infaimon Software). Elliptic Fourier analysis(EFA) was conducted on these 512 coordinates in order to describe theshape of each otolith. EFA was used to break each profile down into asum of harmonically related ellipses. The correct number of harmonicswas calculated according to Crampton (1995). The Fourier series wastruncated for k=15, the level atwhich the average cumulative power is99.99%of theaverage total power (Costa et al., 2009, 2010).According toRohlf and Archie (1984), the elliptic Fourier coefficients werenormalized in order to be invariant with respect to size, location,rotation, and starting position (whichwas always approximately the tipof the rostrum). EFA and all further analyses were performed in Matlab7.1 (The Math Works, Natick, USA).
2.3. Intra-stock analysis
In order to investigate the occurrence of allometry in the otoliths(size-shape relationship), a Partial Least Squares analysis (PLS) regressEFA coefficients vs observed sizes. PLS is a supervised ordinationsoft-modelling technique, which allows the construction of predictivemorphological models (Wold et al., 2001). The model was used in anexploratory mode to verify a priori the level of correct classification of adata set (multivariate supervised technique). The model works via aspecific algorithm (De Jong, 1993) on thewhole array of input variables(x-block matrix; i.e. 60 EFA harmonic coefficients) and on the observedfunctional classes or observed values (y-block matrix; i.e. otolithlength). The model determines the minimum set of n-estimated latentand score variables via an iterative process, through the initialcalculation of maximum correlations. The model includes a calibration
Fig. 2. Otolith glossary. Illustration of the concave side of an eel's right otolith. The anteriorand posterior regions are aligned with the orientation of the eel's body.
phase and a validation phase, for both of which the percentages ofcorrect classification were calculated. The predictive ability in the testphase also depends on the number of the Latent Variables (LV) used inthemodel. Generally, the trend of the residual errors is decreasing in thecalibration phase (RMSEC) and increasing for the validation phase(RMSECV). The predictive ability in the test phase depends on thenumberof LVused in themodel. Therefore, themodelwas chosenwith anumber of LV that ensured the highest value of correlation betweenpredicted and measured which presents the minimum standard errorof prediction (SEP) value. All data were pre-processed using the“autoscale” Matlab procedure. The efficiency of extracted PLS modelwasdetermined regressing thepredicted sizewith themeasured otolithlengths. For each sample site the regression between the first LV andotolith size were represented and the configuration (spline) of theextreme values of the LV axis was extracted using Tpsregr software(Rohlf, 2005).
2.4. Inter-stock analysis
Otoliths from the three sampling siteswere analyzed in two separatesize classes in order to detect any potential differences in otolith shapedue to growth. Otoliths were grouped according tomajor axis length asfollows: small (S; b2.2 mm) and large (L; N2.6 mm), eliminating allthose remainingwithin an intermediate range (i.e. 2.3–2.5 mm). In thismanner, morphological differences were evaluated by extremizing thecomparison.
PLS Discriminant Analysis (PLSDA; Sjöström et al., 1986; Sabatieret al., 2003) was used to construct a model explaining the co-variationbetween otolith shapes, as expressed by EFA coefficients for S and L sizeclasses (x-block), and thedifferent sample sites (y-block). y-blockclasseswere represented by a set of dummy variables describing the differentsamples (for methodological details see Menesatti et al., 2008; Costaet al., 2008, 2010). PLSDA calculates a ‘prediction probability’ and aclassification threshold for each modelled morphological class. Thesewere calculated using a Bayesian method (i.e. the Plsdthres function ofMatlab 7.1. PLS toolbox) which takes the predicted y-values from thePLSDA model, fits a normal distribution onto them and then uses theresults of that fitting to calculate the probability of observation for agiven y-value. The PLSDA analysis provides the percentage of correctclassifications and the loadings of each parameter in each LV. Theanalysis also calculates the modelling sensitivity (i.e. the percentage ofthe otolithsof a category acceptedby the classmodel) andspecificity (i.e.the percentage of otoliths of the categories differing from the modelledone, rejected by the class model; Aguzzi et al., 2009). The x-block valueswere pre-processed in Matlab 7.1 using the “autoscale” procedure. Eachdataset was subdivided into two sub-groups of otoliths: i) 75% for classmodelling and validation; ii) 25% for the independent test, optimallychosen with the Euclidean distances based on the algorithm of Kennardand Stone (1969). This algorithmwas used to select otolithswithout anya priori knowledge of a regression model (i.e. on the hypothesis that thetrue model requires a uniform distribution of objects in the informationspace; Costa et al., 2008). The calibration models were also validatedusing a full cross-validation (Venetian blind algorithm) (Matlab 7.1. PLStoolbox).
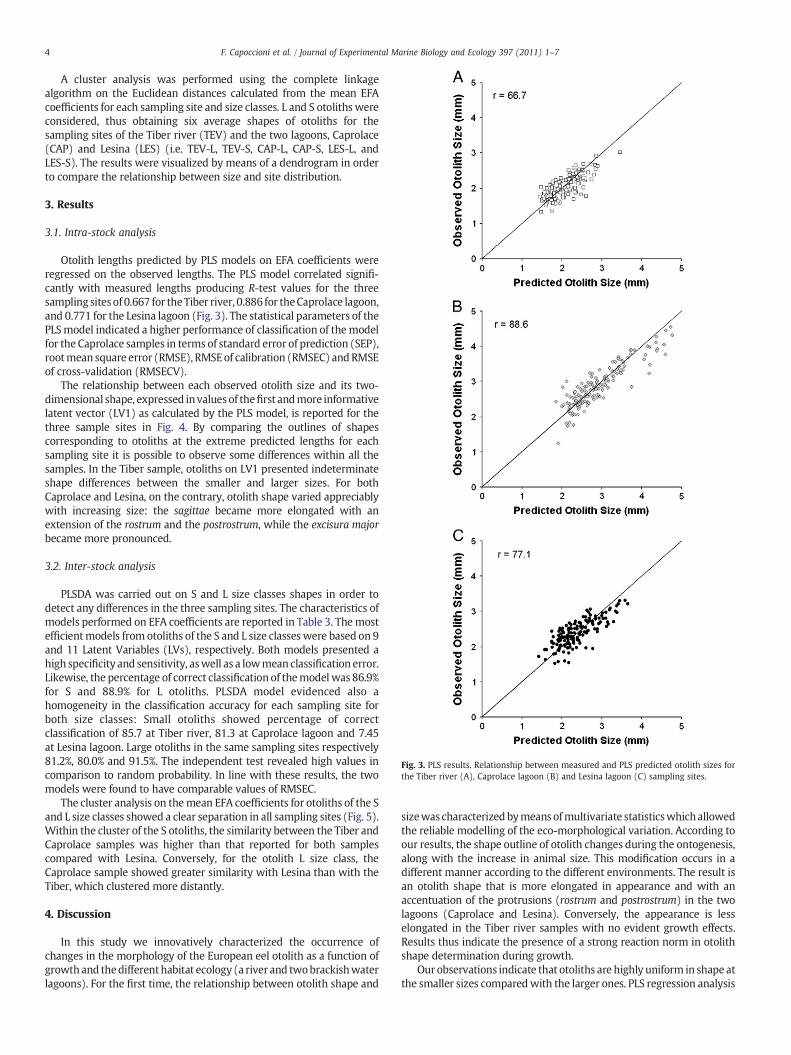
Fig. 3. PLS results. Relationship between measured and PLS predicted otolith sizes forthe Tiber river (A), Caprolace lagoon (B) and Lesina lagoon (C) sampling sites.
4 F. Capoccioni et al. / Journal of Experimental Marine Biology and Ecology 397 (2011) 1–7
A cluster analysis was performed using the complete linkagealgorithm on the Euclidean distances calculated from the mean EFAcoefficients for each sampling site and size classes. L and S otoliths wereconsidered, thus obtaining six average shapes of otoliths for thesampling sites of the Tiber river (TEV) and the two lagoons, Caprolace(CAP) and Lesina (LES) (i.e. TEV-L, TEV-S, CAP-L, CAP-S, LES-L, andLES-S). The results were visualized by means of a dendrogram in orderto compare the relationship between size and site distribution.
3. Results
3.1. Intra-stock analysis
Otolith lengths predicted by PLS models on EFA coefficients wereregressed on the observed lengths. The PLS model correlated signifi-cantly with measured lengths producing R-test values for the threesampling sitesof 0.667 for theTiber river, 0.886 for theCaprolace lagoon,and 0.771 for the Lesina lagoon (Fig. 3). The statistical parameters of thePLSmodel indicated a higher performance of classification of themodelfor the Caprolace samples in terms of standard error of prediction (SEP),rootmean square error (RMSE), RMSEof calibration (RMSEC) andRMSEof cross-validation (RMSECV).
The relationship between each observed otolith size and its two-dimensional shape, expressed invaluesof thefirst andmore informativelatent vector (LV1) as calculated by the PLS model, is reported for thethree sample sites in Fig. 4. By comparing the outlines of shapescorresponding to otoliths at the extreme predicted lengths for eachsampling site it is possible to observe some differences within all thesamples. In the Tiber sample, otoliths on LV1 presented indeterminateshape differences between the smaller and larger sizes. For bothCaprolace and Lesina, on the contrary, otolith shape varied appreciablywith increasing size: the sagittae became more elongated with anextension of the rostrum and the postrostrum, while the excisura majorbecame more pronounced.
3.2. Inter-stock analysis
PLSDA was carried out on S and L size classes shapes in order todetect any differences in the three sampling sites. The characteristics ofmodels performed on EFA coefficients are reported in Table 3. Themostefficientmodels from otoliths of the S and L size classeswere based on 9and 11 Latent Variables (LVs), respectively. Both models presented ahigh specificity and sensitivity, aswell as a lowmean classification error.Likewise, the percentage of correct classification of themodel was 86.9%for S and 88.9% for L otoliths. PLSDA model evidenced also ahomogeneity in the classification accuracy for each sampling site forboth size classes: Small otoliths showed percentage of correctclassification of 85.7 at Tiber river, 81.3 at Caprolace lagoon and 7.45at Lesina lagoon. Large otoliths in the same sampling sites respectively81.2%, 80.0% and 91.5%. The independent test revealed high values incomparison to random probability. In line with these results, the twomodels were found to have comparable values of RMSEC.
The cluster analysis on themean EFA coefficients for otoliths of the Sand L size classes showed a clear separation in all sampling sites (Fig. 5).Within the cluster of the S otoliths, the similarity between the Tiber andCaprolace samples was higher than that reported for both samplescompared with Lesina. Conversely, for the otolith L size class, theCaprolace sample showed greater similarity with Lesina than with theTiber, which clustered more distantly.
4. Discussion
In this study we innovatively characterized the occurrence ofchanges in the morphology of the European eel otolith as a function ofgrowthand thedifferenthabitat ecology (a river and twobrackishwaterlagoons). For the first time, the relationship between otolith shape and
sizewas characterized bymeansofmultivariate statisticswhichallowedthe reliable modelling of the eco-morphological variation. According toour results, the shape outline of otolith changes during the ontogenesis,along with the increase in animal size. This modification occurs in adifferent manner according to the different environments. The result isan otolith shape that is more elongated in appearance and with anaccentuation of the protrusions (rostrum and postrostrum) in the twolagoons (Caprolace and Lesina). Conversely, the appearance is lesselongated in the Tiber river samples with no evident growth effects.Results thus indicate the presence of a strong reaction norm in otolithshape determination during growth.
Our observations indicate that otoliths are highly uniform in shape atthe smaller sizes comparedwith the larger ones. PLS regression analysis
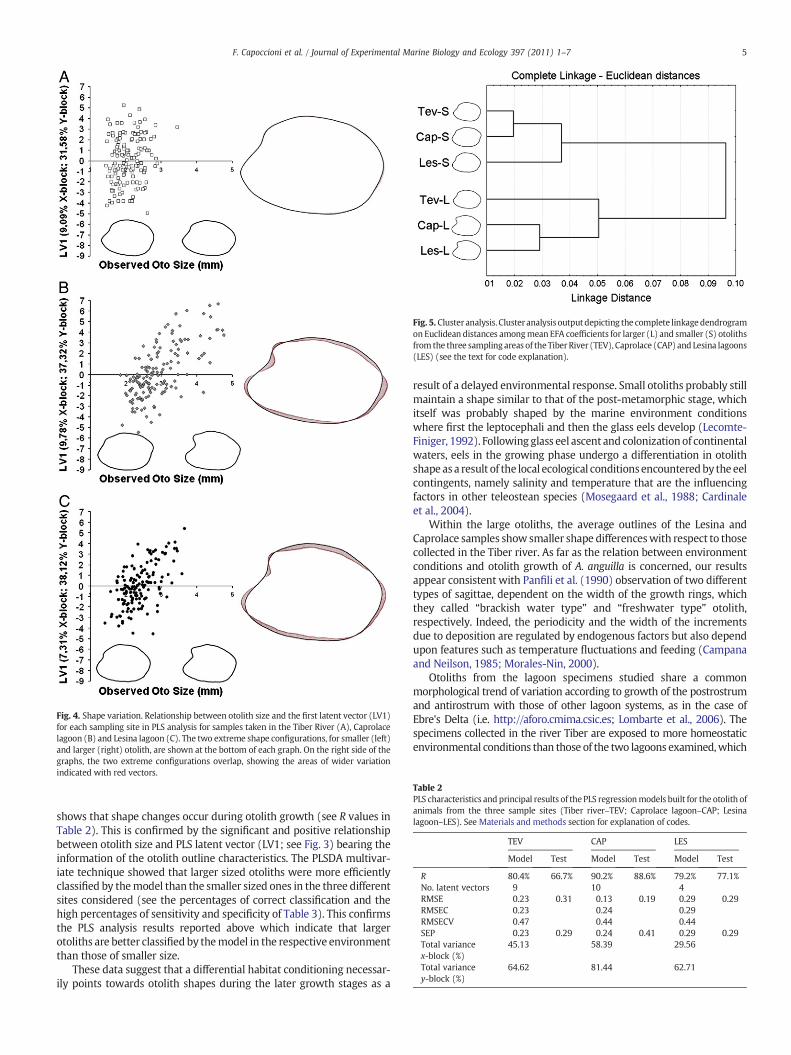
Fig. 4. Shape variation. Relationship between otolith size and the first latent vector (LV1)for each sampling site in PLS analysis for samples taken in the Tiber River (A), Caprolacelagoon (B) and Lesina lagoon (C). The two extreme shape configurations, for smaller (left)and larger (right) otolith, are shown at the bottom of each graph. On the right side of thegraphs, the two extreme configurations overlap, showing the areas of wider variationindicated with red vectors.
Fig. 5. Cluster analysis. Clusteranalysisoutputdepicting the complete linkagedendrogramonEuclidean distances amongmean EFA coefficients for larger (L) and smaller (S) otolithsfrom the three samplingareas of theTiberRiver (TEV), Caprolace (CAP) and Lesina lagoons(LES) (see the text for code explanation).
Table 2PLS characteristics and principal results of the PLS regressionmodels built for the otolith ofanimals from the three sample sites (Tiber river–TEV; Caprolace lagoon–CAP; Lesinalagoon–LES). See Materials and methods section for explanation of codes.
TEV CAP LES
Model Test Model Test Model Test
R 80.4% 66.7% 90.2% 88.6% 79.2% 77.1%No. latent vectors 9 10 4RMSE 0.23 0.31 0.13 0.19 0.29 0.29RMSEC 0.23 0.24 0.29RMSECV 0.47 0.44 0.44SEP 0.23 0.29 0.24 0.41 0.29 0.29Total variance 45.13 58.39 29.56x-block (%)Total variance 64.62 81.44 62.71y-block (%)
5F. Capoccioni et al. / Journal of Experimental Marine Biology and Ecology 397 (2011) 1–7
shows that shape changes occur during otolith growth (see R values inTable 2). This is confirmed by the significant and positive relationshipbetween otolith size and PLS latent vector (LV1; see Fig. 3) bearing theinformation of the otolith outline characteristics. The PLSDA multivar-iate technique showed that larger sized otoliths were more efficientlyclassified by themodel than the smaller sized ones in the three differentsites considered (see the percentages of correct classification and thehigh percentages of sensitivity and specificity of Table 3). This confirmsthe PLS analysis results reported above which indicate that largerotoliths are better classified by themodel in the respective environmentthan those of smaller size.
These data suggest that a differential habitat conditioning necessar-ily points towards otolith shapes during the later growth stages as a
result of a delayed environmental response. Small otoliths probably stillmaintain a shape similar to that of the post-metamorphic stage, whichitself was probably shaped by the marine environment conditionswhere first the leptocephali and then the glass eels develop (Lecomte-Finiger, 1992). Following glass eel ascent and colonization of continentalwaters, eels in the growing phase undergo a differentiation in otolithshape asa result of the local ecological conditionsencounteredby theeelcontingents, namely salinity and temperature that are the influencingfactors in other teleostean species (Mosegaard et al., 1988; Cardinaleet al., 2004).
Within the large otoliths, the average outlines of the Lesina andCaprolace samples show smaller shape differenceswith respect to thosecollected in the Tiber river. As far as the relation between environmentconditions and otolith growth of A. anguilla is concerned, our resultsappear consistent with Panfili et al. (1990) observation of two differenttypes of sagittae, dependent on the width of the growth rings, whichthey called “brackish water type” and “freshwater type” otolith,respectively. Indeed, the periodicity and the width of the incrementsdue to deposition are regulated by endogenous factors but also dependupon features such as temperature fluctuations and feeding (Campanaand Neilson, 1985; Morales-Nin, 2000).
Otoliths from the lagoon specimens studied share a commonmorphological trend of variation according to growth of the postrostrumand antirostrum with those of other lagoon systems, as in the case ofEbre's Delta (i.e. http://aforo.cmima.csic.es; Lombarte et al., 2006). Thespecimens collected in the river Tiber are exposed to more homeostaticenvironmental conditions than those of the two lagoons examined,which
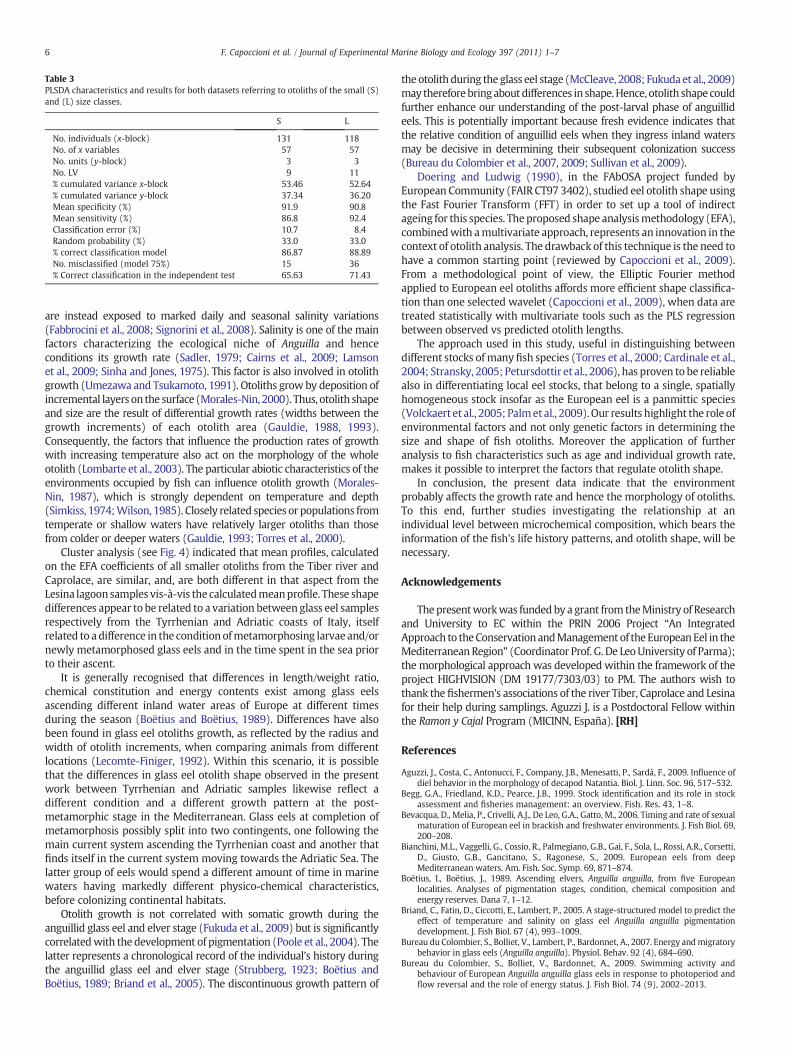
Table 3PLSDA characteristics and results for both datasets referring to otoliths of the small (S)and (L) size classes.
S L
No. individuals (x-block) 131 118No. of x variables 57 57No. units (y-block) 3 3No. LV 9 11% cumulated variance x-block 53.46 52.64% cumulated variance y-block 37.34 36.20Mean specificity (%) 91.9 90.8Mean sensitivity (%) 86.8 92.4Classification error (%) 10.7 8.4Random probability (%) 33.0 33.0% correct classification model 86.87 88.89No. misclassified (model 75%) 15 36% Correct classification in the independent test 65.63 71.43
6 F. Capoccioni et al. / Journal of Experimental Marine Biology and Ecology 397 (2011) 1–7
are instead exposed to marked daily and seasonal salinity variations(Fabbrocini et al., 2008; Signorini et al., 2008). Salinity is one of the mainfactors characterizing the ecological niche of Anguilla and henceconditions its growth rate (Sadler, 1979; Cairns et al., 2009; Lamsonet al., 2009; Sinha and Jones, 1975). This factor is also involved in otolithgrowth (Umezawa and Tsukamoto, 1991). Otoliths grow by deposition ofincremental layers on the surface (Morales-Nin, 2000). Thus, otolith shapeand size are the result of differential growth rates (widths between thegrowth increments) of each otolith area (Gauldie, 1988, 1993).Consequently, the factors that influence the production rates of growthwith increasing temperature also act on the morphology of the wholeotolith (Lombarte et al., 2003). The particular abiotic characteristics of theenvironments occupied by fish can influence otolith growth (Morales-Nin, 1987), which is strongly dependent on temperature and depth(Simkiss, 1974;Wilson, 1985). Closely related species or populations fromtemperate or shallow waters have relatively larger otoliths than thosefrom colder or deeper waters (Gauldie, 1993; Torres et al., 2000).
Cluster analysis (see Fig. 4) indicated that mean profiles, calculatedon the EFA coefficients of all smaller otoliths from the Tiber river andCaprolace, are similar, and, are both different in that aspect from theLesina lagoonsamples vis-à-vis the calculatedmeanprofile. These shapedifferences appear to be related to a variation between glass eel samplesrespectively from the Tyrrhenian and Adriatic coasts of Italy, itselfrelated to a difference in the condition ofmetamorphosing larvae and/ornewly metamorphosed glass eels and in the time spent in the sea priorto their ascent.
It is generally recognised that differences in length/weight ratio,chemical constitution and energy contents exist among glass eelsascending different inland water areas of Europe at different timesduring the season (Boëtius and Boëtius, 1989). Differences have alsobeen found in glass eel otoliths growth, as reflected by the radius andwidth of otolith increments, when comparing animals from differentlocations (Lecomte-Finiger, 1992). Within this scenario, it is possiblethat the differences in glass eel otolith shape observed in the presentwork between Tyrrhenian and Adriatic samples likewise reflect adifferent condition and a different growth pattern at the post-metamorphic stage in the Mediterranean. Glass eels at completion ofmetamorphosis possibly split into two contingents, one following themain current system ascending the Tyrrhenian coast and another thatfinds itself in the current system moving towards the Adriatic Sea. Thelatter group of eels would spend a different amount of time in marinewaters having markedly different physico-chemical characteristics,before colonizing continental habitats.
Otolith growth is not correlated with somatic growth during theanguillid glass eel and elver stage (Fukuda et al., 2009) but is significantlycorrelatedwith the development of pigmentation (Poole et al., 2004). Thelatter represents a chronological record of the individual's history duringthe anguillid glass eel and elver stage (Strubberg, 1923; Boëtius andBoëtius, 1989; Briand et al., 2005). The discontinuous growth pattern of
the otolith during the glass eel stage (McCleave, 2008; Fukudaet al., 2009)may thereforebring about differences in shape.Hence, otolith shape couldfurther enhance our understanding of the post-larval phase of anguillideels. This is potentially important because fresh evidence indicates thatthe relative condition of anguillid eels when they ingress inland watersmay be decisive in determining their subsequent colonization success(Bureau du Colombier et al., 2007, 2009; Sullivan et al., 2009).
Doering and Ludwig (1990), in the FAbOSA project funded byEuropean Community (FAIR CT97 3402), studied eel otolith shape usingthe Fast Fourier Transform (FFT) in order to set up a tool of indirectageing for this species. Theproposed shape analysismethodology (EFA),combinedwith amultivariate approach, represents an innovation in thecontext of otolith analysis. The drawback of this technique is the need tohave a common starting point (reviewed by Capoccioni et al., 2009).From a methodological point of view, the Elliptic Fourier methodapplied to European eel otoliths affords more efficient shape classifica-tion than one selected wavelet (Capoccioni et al., 2009), when data aretreated statistically with multivariate tools such as the PLS regressionbetween observed vs predicted otolith lengths.
The approach used in this study, useful in distinguishing betweendifferent stocks of many fish species (Torres et al., 2000; Cardinale et al.,2004; Stransky, 2005; Petursdottir et al., 2006), has proven to be reliablealso in differentiating local eel stocks, that belong to a single, spatiallyhomogeneous stock insofar as the European eel is a panmittic species(Volckaert et al., 2005; Palmet al., 2009).Our results highlight the role ofenvironmental factors and not only genetic factors in determining thesize and shape of fish otoliths. Moreover the application of furtheranalysis to fish characteristics such as age and individual growth rate,makes it possible to interpret the factors that regulate otolith shape.
In conclusion, the present data indicate that the environmentprobably affects the growth rate and hence the morphology of otoliths.To this end, further studies investigating the relationship at anindividual level between microchemical composition, which bears theinformation of the fish's life history patterns, and otolith shape, will benecessary.
Acknowledgements
Thepresentworkwas fundedby a grant from theMinistry of Researchand University to EC within the PRIN 2006 Project “An IntegratedApproach to theConservation andManagement of theEuropeanEel in theMediterraneanRegion” (Coordinator Prof. G. De LeoUniversity of Parma);the morphological approach was developed within the framework of theproject HIGHVISION (DM 19177/7303/03) to PM. The authors wish tothank the fishermen's associations of the river Tiber, Caprolace and Lesinafor their help during samplings. Aguzzi J. is a Postdoctoral Fellow withinthe Ramon y Cajal Program (MICINN, España). [RH]
References
Aguzzi, J., Costa, C., Antonucci, F., Company, J.B., Menesatti, P., Sardá, F., 2009. Influence ofdiel behavior in the morphology of decapod Natantia. Biol. J. Linn. Soc. 96, 517–532.
Begg, G.A., Friedland, K.D., Pearce, J.B., 1999. Stock identification and its role in stockassessment and fisheries management: an overview. Fish. Res. 43, 1–8.
Bevacqua, D., Melia, P., Crivelli, A.J., De Leo, G.A., Gatto, M., 2006. Timing and rate of sexualmaturation of European eel in brackish and freshwater environments. J. Fish Biol. 69,200–208.
Bianchini, M.L., Vaggelli, G., Cossio, R., Palmegiano, G.B., Gai, F., Sola, L., Rossi, A.R., Corsetti,D., Giusto, G.B., Gancitano, S., Ragonese, S., 2009. European eels from deepMediterranean waters. Am. Fish. Soc. Symp. 69, 871–874.
Boëtius, I., Boëtius, J., 1989. Ascending elvers, Anguilla anguilla, from five Europeanlocalities. Analyses of pigmentation stages, condition, chemical composition andenergy reserves. Dana 7, 1–12.
Briand, C., Fatin, D., Ciccotti, E., Lambert, P., 2005. A stage-structured model to predict theeffect of temperature and salinity on glass eel Anguilla anguilla pigmentationdevelopment. J. Fish Biol. 67 (4), 993–1009.
Bureau du Colombier, S., Bolliet, V., Lambert, P., Bardonnet, A., 2007. Energy andmigratorybehavior in glass eels (Anguilla anguilla). Physiol. Behav. 92 (4), 684–690.
Bureau du Colombier, S., Bolliet, V., Bardonnet, A., 2009. Swimming activity andbehaviour of European Anguilla anguilla glass eels in response to photoperiod andflow reversal and the role of energy status. J. Fish Biol. 74 (9), 2002–2013.
7F. Capoccioni et al. / Journal of Experimental Marine Biology and Ecology 397 (2011) 1–7
Cairns, D.K., Secor, D.A., Morrison, W.E., Hallett, J.A., 2009. Salinity-linked growth in anguillideels and the paradox of temperate-zone catadromy. J. Fish Biol. 74, 2094–2114.
Campana, S.E., Casselman, J.M., 1993. Stock discrimination using otolith shape analysis.Can. J. Fish. Aquat. Sci. 50 (5), 1062–1083.
Campana, S.E., Neilson, J.D., 1985. Microstructure of fish otoliths. Can. J. Fish. Aquat. Sci.42 (5), 1014–1032.
Capoccioni, F., Costa, C., Menesatti, P., Lombarte, A., Aguzzi, J., Ciccotti, E., 2009. Otolithgrowth allometry measurements in the European eel. Instrum. Viewpoint 8, 71–72.
Cardinale, M., Doering-Arjes, P., Kastowsky, M., Mosegaard, H., 2004. Effects of sex,stock, and environment on the shape of known-age Atlantic cod (Gadus morhua)otoliths. Can. J. Fish. Aquat. Sci. 61 (2), 158–167.
Castonguay, M., Simard, P., Gagnon, P., 1991. Usefulness of Fourier analysis of otolithshape for Atlantic mackerel (Scomber scombrus) stock discrimination. Can. J. Fish.Aquat. Sci. 48, 296–302.
Costa, C., Aguzzi, J., Menesatti, P., Antonucci, F., Rimatori, V., Mattoccia, M., 2008. Shapeanalysis of different populations of clams in relation to their geographical structure.J. Zool. 276, 71–80.
Costa, C., Menesatti, P., Paglia, G., Pallottino, F., Aguzzi, J., Rimatori, V., Russo, G., Recupero,S., Reforgiato Recupero,G., 2009.Quantitative evaluation of Tarocco sweet orange fruitshape using opto-electronic elliptic Fourier based analysis. Postharvest Biol. Technol.54, 38–47.
Costa, C., Menesatti, P., Aguzzi, J., D'Andrea, S., Antonucci, F., Rimatori, V., Pallottino, P.,Mattoccia, M., 2010. External shape differences between sympatric populations ofcommercial clams Tapes decussatus and T. philippinarum. Food Bioprocess Technol. 3(1), 43–48.
Crampton, J.S., 1995. Elliptic Fourier shape analysis of fossil bivalves: some practicalconsiderations. Lethaia 28, 179–186.
Dannewitz, J., Maes, G.E., Johansson, L., Wickström, H., Volckaert, F.A.M., Järvi, T., 2005.Panmixia in the European eel: a matter of time. Proc. R. Soc. Lond. B 272, 1129–1137.
Daverat, F., Tomas, J., Lahaye, M., Palmer, M., Elie, P., 2005. Tracking continental habitatshifts of eels using otolith Sr/Ca ratios: validation and application to the coastal,estuarine and riverine eels of the Gironde–Garonne–Dordogne watershed. Mar.Freshwater Res. 56, 619–627.
De Jong, S., 1993. SIMPLS: an alternative approach to partial least squares regression.Chemometr. Intell. Lab. 18 (3), 251–263.
De Leo, G.A., Gatto, M., 1995. A size and age-structured model of the European eel(Anguilla anguilla L). Can. J. Fish. Aquat. Sci. 52, 1351–1367.
Doering, P., Ludwig, J., 1990. Shape analysis of otoliths–a tool for indirect ageing of eel,Anguilla anguilla (L.)? Int. Rev. Gesamten Hydrobiol. Hydrogr. 75 (6), 737–743.
Elsdon, T.S., Wells, B.K., Campana, S.E., Gillanders, B.M., Jones, C.M., Limburg, K.E., Secor, D.H., Thorrold, S.R., Walther, B.D., 2008. Otolith chemistry to describe movements andlife-history parameters offishes: hypotheses, assumptions, limitations and inferences.Oceanogr. Mar. Biol. Ann. Rev. 46, 297–330.
Fabbrocini, A., Di Matteo, O., D'Adamo, R., 2008. Abra segmentum (Mollusca:Pelecypoda) of the Lesina Lagoon (Southern Adriatic coast, Italy): observationson variations in the population in relation to the main environmental parameters.Transit. Waters Bull. 1, 39–44.
Fukuda, N., Kuroki, M., Shinoda, A., Yamada, Y., Okamura, A., Aoyama, J., Tsukamoto, K.,2009. Influence of water temperature and feeding regime on otolith growth inAnguilla japonica glass eels and elvers: does otolith growth cease at lowtemperatures? J. Fish Biol. 74 (9), 1915–1933.
Gauldie, R.W., 1988. Function, form and time-keeping properties of fish otoliths. Comp.Biochem. Phys. 91, 395–402.
Gauldie, R.W., 1993. Continuous and discontinuous growth in the otolith ofMacruronusnovaezelandiae (Merlucciidae: Teleostei). J. Morphol. 216, 271–294.
Jones, C.M., 1992. Development and application of the otolith increment technique. In:Stevenson, D.K., Campana, S.E. (Eds.), Otolith microstructure examination andanalysis: Can. Spec. Publ. Fish. Aquat. Sci., 117, pp. 1–11.
Kennard, R.W., Stone, L.A., 1969. Computer aided design of experiment. Technometrics 11(1), 137–148.
Lamson, H.M., Cairns, D.K., Shiao, J., Iizuka, Y., Tzeng, W., 2009. American eel, Anguillarostrata, growth in fresh and salt water: implications for conservation andaquaculture. Fish. Manage. Ecol. 16 (4), 306–314.
Lecomte-Finiger, R., 1992. Growth history and age at recruitment of European glass eels(Anguilla anguilla) as revealed by otolith microstructure. Mar. Biol. 114, 205–210.
Lombarte, A., Castellon, A., 1991. Interspecific and intraspecific otolith variability in thegenus Merluccius as determined by image analysis. Can. J. Zool. 69 (9), 2442–2449.
Lombarte, A., Torres, G.J., Morales-Nin, B., 2003. SpecificMerluccius otolith growthpatternsrelated to phylogenetics and environmental factors. J. Mar. Biol. Ass. U.K. 83, 277–281.
Lombarte, A., Chic, Ò., Parisi-Baradad, V., Olivella, R., Piera, J., García–Ladona, E., 2006. Aweb-based environment for shape analysis of fish otoliths. The AFORO database.Sci. Mar. 70, 147–152.
McCleave, J.D., 2008. Contrasts between spawning times of Anguilla species estimatedfrom larval sampling at sea and from otolith analysis of recruiting glass eels. Mar. Biol.155 (3), 249–262.
Melià, P., Bevacqua, D., Crivelli, A.J., Panfili, J., De Leo, G.A., Gatto, M., 2006. Sexdifferentiation of the European eel in brackish and freshwater environments: acomparative analysis. J. Fish Biol. 69 (4), 876–890.
Menesatti, P., Costa, C., Paglia, G., Pallottino, F., D'Andrea, S., Rimatori, V., Aguzzi, J., 2008.Shape-based methodology for multivariate discrimination among Italian hazelnutcultivars. Biosystems Eng. 101 (4), 417–424.
Morales-Nin, B., 1987. Influence of environmental factors on microstructure of otoliths ofthreedemersalfish species caught off Namibia. In: Payne, A.I.L., Gulland, J.A., Brinkd, K.H. (Eds.), The Benguela and Comparable Ecosystems: S. Afr. J.Mar. Sci., 5, pp. 255–262.
Morales-Nin, B., 2000. Review of the growth regulation processes of otolith dailyincrement formation. Fish. Res. 46, 53–67.
Mosegaard, H., Svedäng, H., Taberman, K., 1988. Uncoupling of somatic and otolithgrowth rates in arctic char (Salvelinus alpinus) as an effect of differences intemperature response. Can. J. Fish. Aquat. Sci. 45, 1514–1524.
Palm, S., Dannewitz, J., Prestegaard, T., Wickström, H., 2009. Panmixia in European eelrevisited: no genetic difference between maturing adults from southern andnorthern Europe. Heredity 103, 82–89.
Panfili, J., Ximénès, M.C., Do Chi, T., 1990. Age determination of eels in the FrenchMediterranean lagoons using classical methods and an image analysis system. Int.Rev. Gesamten Hydrobiol. Hydrogr. 75 (6), 745–754.
Petursdottir, G., Begg, G.A., Marteinsdottir, G., 2006. Discrimination between Icelandic cod(Gadusmorhua L.) populations fromadjacent spawning areas based on otolith growthand shape. Fish. Res. 80 (2–3), 182–189.
Platt, C., Popper, A.N., 1981. Fine structure and function of the ear. In: Tavolga, W.N.,Popper, A.N., Fay, R.R. (Eds.), Hearing and sound communication in fishes. Springer-Verlag, New York, pp. 3–38.
Poole, W., Reynolds, J., Moriarty, C., 2004. Early post-larval growth and otolith patternsin the eel Anguilla anguilla. Fish. Res. 66 (1), 107–114.
Prato, S., Morgana, J.G., La Valle, P., Finoia, M.G., Lattanti, L., Nicoletti, L., Ardizzone, G.D.,Izzo, G., 2009. Application of biotic and taxonomic distinctness indices in assessingthe Ecological Quality Status of two coastal lakes: Caprolace and Fogliano lakes(Central Italy). Ecol. Ind. 9, 568–583.
Rohlf, F.J., 2005. Freeware at. http://life.bio.sunysb.edu/morph/2005.Rohlf, F.J., Archie, J.W., 1984. A comparison of Fourier methods for description of wing
shape in mosquitoes (Diptera: Culicidae). Syst. Zool. 33 (3), 302–317.Sabatier, R., Vivein, M., Amenta, P., 2003. Two approaches for discriminant partial least
square. In: Schader, M., et al. (Ed.), Between data science and applied data analysis.Springer, Berlin, Germany.
Sadler, K., 1979. Effects of temperature on the growth and survival of the European eel,Anguilla anguilla L. J. Fish Biol. 15, 499–507.
Sahyoun, R., Claudet, J., Fazio, G., Da Silva, C., Lecomte-Finiger, R., 2008. The otolith asstress indicator of parasitism on European eel. Vie et Milieu 57 (4), 193–200.
Signorini, A., Massini, G., Migliore, G., Tosoni, M., Varrone, C., Izzo, G., 2008. Sedimentbiogeochemical differences in two pristine Mediterranean coastal lagoons (in Italy)characterized by different phanerogam dominance–a comparative approach. Mar.Freshw. Ecosyst. 18, 27–44.
Simkiss, K., 1974. Calcium metabolism of fish in relation to ageing. In: Bagenal, T.B.(Ed.), Ageing of fish. Unwin Brothers, Old Woking, pp. 1–12.
Sinha, V.R.P., Jones, J.W., 1975. The European freshwater eel. Liverpool University Press,Liverpool, UK.
Sjöström, M., Wold, S., Söderström, B., 1986. PLS discriminant plots. In: Gelsema, E.S.,Kanal, L.N. (Eds.), Pattern Recognition in Practice II. Elsevier, Amsterdam, p. 486.
SOGESID, 2002. Attività connesse alla redazione del piano di tutela delle acque: relazionegenerale. Regione Puglia - Commissario delegato per l'emergenza ambientalepresidente della regione Puglia - Ordinanza del Ministro dell'Interno n° 3184 del22/3/2002.
Solimini, A.G., Gulia, P., Monfrinotti, M., Carchini, G., 2000. Performance of differentbiotic indices and sampling methods in assessing water quality in the lowlandstretch of the Tiber River. Hydrobiologia 422 (423), 197–208.
Stransky, C., 2005. Geographic variation of golden redfish (Sebastesmarinus) and deep-searedfish (S. mentella) in the North Atlantic based on otolith shape analysis. ICES J. Mar.Sci. 62 (8), 1691–1698.
Stransky, C., Garbe-Schönberg, C.D., Günther, D., 2005. Geographic variation andjuvenile migration in Atlantic redfish inferred from otolith microchemistry. Mar.Freshw. Res. 56, 677–691.
Strubberg, A.C., 1923. Elvers fromNorth and South Europe. Rep. Dan. Oceanog. Esplor. 3,1–29 (1908-1910).
Sullivan, M.C., Wuenschel, M.J., Able, K.W., 2009. Inter and intra-estuary variability iningress, condition and settlement of the American eel, Anguilla rostrata: implica-tions for estimating and understanding recruitment. J. Fish Biol. 74 (9), 1949–1969.
Torres, G.J., Lombarte, A., Morales-Nin, B., 2000. Sagittal otolith size and shapevariability to identify geographical intraspecific differences in three species of thegenus Merluccius. J. Mar. Biol. Ass. U.K. 80, 333–342.
Tzeng, W.N., Severin, K.P., Wickström, H., 1997. Use of otolith microchemistry toinvestigate the environmental history of European eel Anguilla anguilla. Mar. Ecol.Prog. Ser. 149 (1–3), 73–81.
Tzeng, W.N., Severin, K.P., Wang, C.H., Wickström, H., 2005. Elemental composition ofotoliths as a discriminator of life stage and growth habitat of the European eel,Anguilla anguilla. Mar. Freshw. Res. 56, 629–635.
Umezawa, A., Tsukamoto, K., 1991. Factors influencing otolith increment formation inJapanese eel, Anguilla japonica. J. Fish Biol. 39, 211–223.
Volckaert, F.A.M., Dannewitz, J., Maes, G.E., Johansson, L., Wickström, H., Järvi, T., 2005.Panmixia in the European eel: a matter of time. Proc. R. Soc. Lond. B 272,1129–1137.
Vøllestad, L.A., 1992. Geographic variation in age and length at metamorphosis ofmaturing European eel: environmental effects and phenotypic plasticity. J. Anim.Ecol. 61 (1), 41–48.
Wilson Jr., R.R., 1985. Depth-related changes in sagitta morphology in six macrouridfishes of the Pacific and Atlantic Oceans. Copeia 4, 1011–1017.
Wirth, T., Bernatchez, L., 2001. Genetic evidence against panmixia in the European eel.Nature 409, 1037–1040.
Wold, S., Sjostrom, M., Eriksson, L., 2001. PLS-regression: a basic tool of chemometrics.Chemometr. Intell. Lab. 58 (2), 109–130.