Embed Size (px)
Citation preview
OPERATING EXPERIENCE AND ECONOMICS OF A
SIMPLIFIED MSW MATERIALS RECOVERY AND
FUEL ENHANCEMENT FACILITY
GARRY KENNY EDWARD J. SOMMER, JR.
JAMES A. KEARLEY National Recovery Technologies, Inc.
Nashville, Tennessee
ABSTRACT
A municipal solid waste materials recovery and fuel
enhancement facility has been in operation at the Sumner County (Gallatin, Tennessee) mass burn energy
recovery facility for a period of 3 years. During this
time the design and operation of the recovery equipment has been refined, providing system operation with
high availability and high materials recovery efficiency. The development and engineering techniques used in
the refinement process are presented, along with plant
operating costs, availability data and separation effi
ciency test results.
INTRODUCTION
In August 1982 an MSW materials recovery facility began operation in conjunction with an ongoing municipal energy recovery operation. Enhanced fuel from the process is supplied to two mass burn rotary incin
erators. The system was installed to investigate the feasibility of simplifying materials recovery processing, but developed into a commercial operation by Decem
ber, 1983. During a number of months over 95% of
the waste received by the energy recovery facility has been processed. The system uses two new separation processes in addition to a previously available eddy
current aluminum separation unit. The principal reason for development of the system
was to reduce the capital and operating costs of MSW
materials processing. Low cost separation of waste has
a number of applications including: (a) Mass Burn
Facilities-to reduce fuel variability and volume for
299
improved combustion control and efficiency and in
creased capacity; (b) RDF Production-to reduce op
erating costs; (c) Transfer Station Operations-to reduce hauling costs and provide materials recycling;
and (d) Landfill Operations-to reduce volume re
quirements and provide materials recycling.
DESIGN CONSIDERATIONS
The separation equipment was designed specifically for solid waste applications by National Recovery
Technologies (NRT). NRT is the owner and operator
of the Gallatin materials recovery facility. Removal of
the metals, glass and other noncombustibles produces an enhanced Btu fuel which is conveyed to the energy
recovery facility storage pit. The energy recovery facility is owned and operated by the Sumner County Resource Authority.
The design of the system was approached from the
viewpoint that metal, glass and other noncombustible components of waste are readily separable without
shredding. Impact shredding before separation pul
verizes glass, embedding it in the combustibles. Shred
ding also tears the metals, entraining combustibles, and making separation more difficult. For energy recovery
systems requiring shredding, e.g., fluidized bed units (Ref. [ 1]), removal of abrasive and heavy metallic components from the waste prior to shredding reduces
shredder capital and operating costs.
Significant benefits may be derived from separation
of the noncombustible components from municipal waste before energy recovery (Refs. [2-5]), including
increased combustion efficiency and system availability
with reduced flue gas emissions. These benefits are
obtained at the expense of increased capital and operating costs associated with materials recovery. Cur
rently, the energy value of waste is on the order of
$30-$40 per ton. Testing at the Gallatin energy recovery facility shows an increase of approximately
20% in the combined boiler efficiency and availability (Ref. [6]), producing a revenue increase of approximately $7.00/ton of waste. Thus, for materials recov
ery (Gallatin mass bum site) to be economic, net preprocessing costs must be less than this amount. To
meet this requirement the materials recovery system was designed to minimize process steps, energy con
sumption, and combustible loss while maintaining high materials removal efficiency.
The Gallatin system has a processing capacity of 10
TPH (9.1 tph) of raw waste while maintaining 80%
removal of ferrous metal and glass and grit with 75% recovery of aluminum beverage containers. A 25-30
TPH (23-27 tph) system is currently under construction and is scheduled for operation in 1986.
PROCESS DESCRIPTION
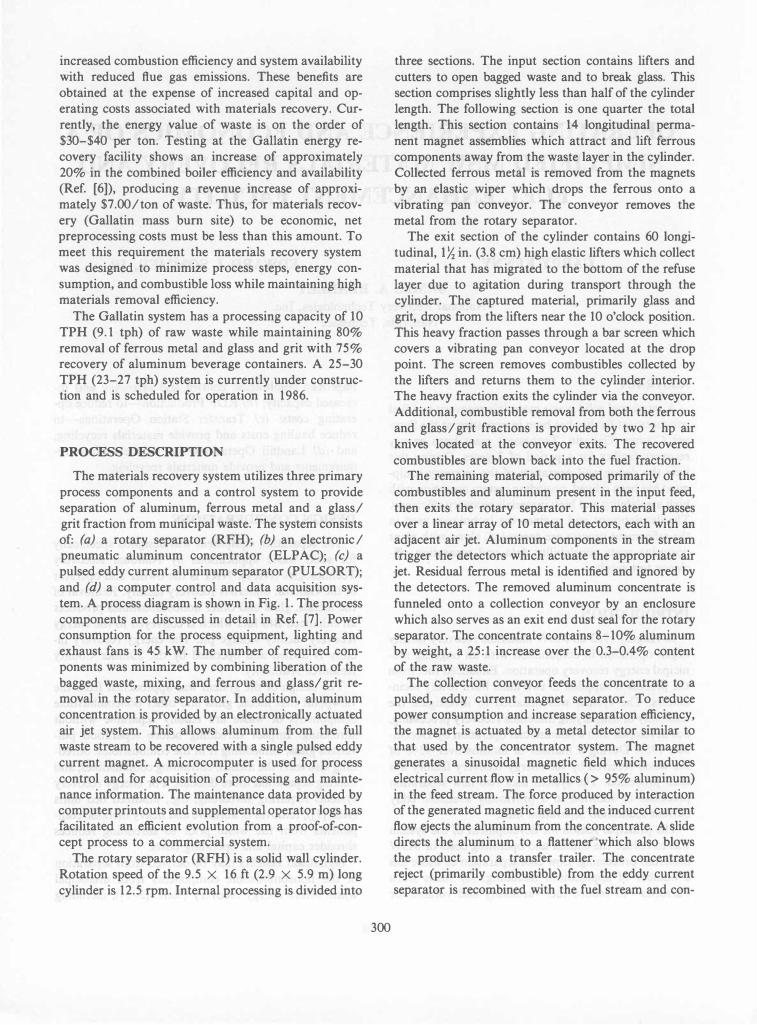
The materials recovery system utilizes three primary
process components and a control system to provide separation of aluminum, ferrous metal and a glass/ grit fraction from municipal waste. The system consists of: (a) a rotary separator (RFH); (b) an electronic/ pneumatic aluminum concentrator (ELPAC); (c) a pulsed eddy current aluminum separator (pULSORT);
and (d) a computer control and data acquisition system. A process diagram is shown in Fig. 1. The process
components are discussed in detail in Ref. [7]. Power consumption for the process equipment, lighting and
exhaust fans is 45 kW. The number of required components was minimized by combining liberation of the bagged waste, mixing, and ferrous and glass/grit removal in the rotary separator. In addition, aluminum
concentration is provided by an electronically actuated
air jet system. This allows aluminum from the full
waste stream to be recovered with a single pulsed eddy
current magnet. A microcomputer is used for process
control and for acquisition of processing and maintenance information. The maintenance data provided by computer printouts and supplemental operator logs has facilitated an efficient evolution from a proof-of-con
cept process to a commercial system.
The rotary separator (RFH) is a solid wall cylinder.
Rotation speed of the 9.5 X 16 ft (2.9 X 5.9 m) long
cylinder is 12.5 rpm. Internal processing is divided into
300
three sections. The input section contains lifters and
cutters to open bagged waste and to break glass. This section comprises slightly less than half of the cylinder
length. The following section is one quarter the total length. This section contains 14 longitudinal perma
nent magnet assemblies which attract and lift ferrous
components away from the waste layer in the cylinder. Collected ferrous metal is removed from the magnets
by an elastic wiper which drops the ferrous onto a
vibrating pan conveyor. The conveyor removes the metal from the rotary separator.
The exit section of the cylinder contains 60 longi
tudinal, IX in. (3.8 cm) high elastic lifters which collect
material that has migrated to the bottom of the refuse layer due to agitation during transport through the cylinder. The captured material, primarily glass and
grit, drops from the lifters near the 10 o'clock position.
This heavy fraction passes through a bar screen which covers a vibrating pan conveyor located at the drop point. The screen removes combustibles collected by
the lifters and returns them to the cylinder interior. The heavy fraction exits the cylinder via the conveyor.
Additional, combustible removal from both the ferrous
and glass/grit fractions is provided by two 2 hp air
knives located at the conveyor exits. The recovered
combustibles are blown back into the fuel fraction. The remaining material, composed primarily of the
combustibles and aluminum present in the input feed, then exits the rotary separator. This material passes
over a linear array of 10 metal detectors, each with an adjacent air jet. Aluminum components in the stream
trigger the detectors which actuate the appropriate air jet. Residual ferrous metal is identified and ignored by the detectors. The removed aluminum concentrate is
funneled onto a collection conveyor by an enclosure
which also serves as an exit end dust seal for the rotary separator. The concentrate contains 8-10% aluminum by weight, a 25:1 increase over the 0.3-0.4% content of the raw waste.
The collection conveyor feeds the concentrate to a
pulsed, eddy current magnet separator. To reduce power consumption and increase separation efficiency, the magnet is actuated by a metal detector similar to
that used by the concentrator system. The magnet
generates a sinusoidal magnetic field which induces
electrical current flow in metallics (> 95% aluminum)
in the feed stream. The force produced by interaction of the generated magnetic field and the induced current flow ejects the aluminum from the concentrate. A slide directs the aluminum to a flattener which also blows the product into a transfer trailer. The concentrate reject (primarily combustible) from the eddy current
separator is recombined with the fuel stream and con-
w
o
�
iOUDWAS
TE
\
�ARY
FU
EL
HOMOGENI
ZER
liberal Ion
�
I �
��
T I �
FUE\.
I�
FIG
. 1
MA
TE
RIA
LS
RE
CO
VE
RY
PR
OC
ES
S D
IAG
RA
M
veyed to the energy facility storage pit. Bulky material is removed from the fuel conveyor by handpicking.
The concentrate and the main fuel stream are conveyed to a segregated portion of the energy facility
storage pit. Bulky objects such as large drums, pallets,
metal banding masses, etc. are removed from the fuel
conveyor by a handpicker. The handpicker also re
moves 5-15% of the aluminum present in the input feed and provides an ongoing indication of aluminum recovery efficiency.
SYSTEM EVOLUTION
The materials recovery facility was first operated in
December of 1981. The following 7 months were used
to finalize transition points, provide equipment access
and to determine the best means of feeding the eddy current separator. Full time operation was begun in August 1982. No fundamental problems were found
in the design of the new separation equipment. The rotary separator had sufficient diameter to break the
glass liberated by the cutters. The multiple passes of the 14 magnetic fiites provided good ferrous separation
and the exit end lifters were of sufficient number and
length to capture glass and dirt. The sliding, tumbling
action imparted to the waste by the cylinder rotation provided the density separation required for proper
operation of the exit lifters. The aluminum concentration unit was found to have sufficient sensitivity for
aluminum detection and more than adequate air jet
force.
The initial success with regard to separation effi
ciency led to continued full time operation of the sys
tem. This revealed problems associated with the proof
of-concept approach to the systems mechanical design. Operating problems were experienced with bearings,
support wheels, conveyor belting and sidewalls. To
identify the problem areas considerable time was spent by the designers observing the system in operation. In addition, equipment downtime records were compiled
and discussions held with the plant personnel. These procedures led to the modifications discussed below.
SYSTEM MODIFICATIONS
December, 1982-Input Slide and Ring Seal
Initially the input conveyor headpulley projected into the rotary separator. It was determined that fail
ures of the conveyor drive were caused by large objects
impacting the drive sprocket. The input conveyor was shortened to retract the exposed components from the
302
falling waste. This also provided more effective use of the bag breaking front section of the RFH, and allowed
inclusion of a metal ring and rubber curtain seal to improve dust containment.
August, 1983-Aluminum Concentrator Detector
Coil Module
Failures of the detector coil electrical connections
and cover were found to be due to impact by large objects in the waste. Initially the coils were bolted to the back of a recessed, micarda covered slide. A new
coil carrier was constructed in which the coils were encapsulated with urethane epoxy in a 2 in. (5 cm)
thick carrier assembly. The coil cover was changed to an epoxy-fiberglass material. With the stronger support
afforded by the carrier, the cover is now replaced due to wear rather than impact failure. The coil resonance
capacitors were also remote mounted to reduce the possibility of electrical connection failures. Coil or cover failures were ocurring every 300-500 hr of op
eration before modification. The current design has
been in operation with no similar failures for over 2
years.
December, 1983-Rotary Separator Support Rings
and Wheels
The rotary separator support rings were initially fabricated of 3 in. (7.6 cm) I beams rolled the "hard
way." Axial load, due to the inclination of the cylinder, was taken up by 3 cam-rolls located at the edges of the entrance and center I beam flanges. Three problems
existed: deformation of the I beam flanges by the cam
rolls, rapid failure of the 5 in. (12.7 cm) wide rubber
wheels and relatively short cam roll life. Discussions with the wheel manufacturer indicated that the failure
was primarily due to excessive heat generated by high localized loading. To reduce these problems the support rings were modified by adding an 8 in. (20 cm)
wide rolled angle to the cam-roll side of each support
ring, resulting in an 11 in. (28 cm) wide wheel contact width with a 6 in. (15 cm) wide cam-roll surface. The
cam-rolls were fitted with press-on rubber tires to take
up the ring circumference difference across the cam
roll width. The wheel lifetime increased from 6 weeks to 14 months and the cam-roll life from 4 months to
over 22 months.
February, 1984-Eddy Current Magnet
After 18 months of operation a decrease in alumi
num ejection distance was observed. Measurements
showed an increase in the magnet electrical resistance.
After disassembly and inspection it was found that the
electrical supply wires to the magnet were degraded, likely due to vibration induced by pulsed operation of
the magnet. To reduce vibration the electrical supply
cables were provided with a rigid support. Additionally, the magnet was assembled with an extra conduc
tor strand. The resulting decrease in magnet electrical resistance increased the magnet power approximately 50% above the original level. An increase in the sep
aration distance of the aluminum from the waste was
quite apparent. No decrease in magnet resistance was measured during a year of operation. In February, 1985 a Resource Authority power failure lead to freezing of
the water in the PULSORT air-to-water heat exchan
ger which is on the magnet side of the water filter.
Replacement of the heat exchanger without proper
flushing resulted in residue entrapment in the magnet. As a result the magnet overheated and required. re
placement. To avoid a reoccurrence of this problem a secondary filter has been installed immediately ahead
of the magnet cooling hose.
August, 1984-RFH Input Section
The original bag cutters were fabricated from triangular steel plates which were fixed to the edge of the lifters in the front section of the RFH. Although
efficient bag openers, they tended to capture long in
dustrial waste material and intertwine it with other
material forming 2-3 ft (0.6-0.9 m) diameter entan
glements up to 50 ft (15 m) long. New triangular
cutters were fabricated and attached directly to the
cylinder wall such that no acute angles were exposed to the waste material. Bag opening efficiency increased
while formation of "stringers" decreased from several per shift to 1 in several shifts.
September, 1984-Aluminum Concentrator Catcher
A number of aluminum concentrator separation efficiency tests were conducted by dropping 100 alu
minum containers down the ELPAC slide without
accompanying waste. The results showed that 10-15%
of the containers ejected by the air nozzles did not drop onto the collection conveyor. It was determined that small irregularities in the catcher walls and ceiling
deflected some of the ejected aluminum back onto the
fuel conveyor. This problem was rectified and collec
tion efficiency for aluminum containers, without sur
rounding waste, increased to over 95%.
303
March, 1985-Glass/Grit Lifters
The original glass/grit lifters were constructed of
steel angles which would occasionally lift large objects
such as wooden pallets and building material into the
glass/ grit removal system. As a result an average of
5% of the shift time was required to clear such jams. The steel lifters also required cleaning every 50-100 tons processed to maintain full effectiveness. To reduce
both problems the steel lifters were replaced with flex
ible glass/grit assemblies. It was found that lifting of large objects was significantly reduced. The flexible
lifters (using three-ply conveyor belt) have a life of
approximately 5000 tons processed and can process approximately 500 tons before requiring cleaning (de
pendent upon moisture content of processed waste).
The average time required to replace a lifter is 8 min.
May, 1985-Magnetic Lifter Assembly
The magnetic lifter assemblies utilize permanent
magnets with austenitic stainless steel covers. The orig
inal assemblies produced a 5 in. (12.7 cm) wide at
traction region with two magnetic field concentration regions. After 20 months of operation the assembly
covers were replaced with thicker gauge material as the original covers had become distorted due to impact.
The magnetic field strength remained constant over this time period. During the ensuing year studies of
the magnetic characteristics of the assemblies led to
an improved magnet configuration which increased the
surface magnetic field intensity from 1.3 to 2.0 kG.
The same volume of magnetic material was used. The
new configuration assemblies were installed in the ro
tary separator with thicker, 12 gauge covers. The new
lifters have a 7.5 in. (19 cm) separation width with three field concentration regions yielding a 50% in
crease in magnet area with the same number of lifters
( 14 spaced around the circumference of the RFH).
June, 1985-Rotary Separator Drive and Support
Wheels
The original RFH wheels were mounted on a shaft extending the length of the cylinder. Three pillow block bearings supported the shaft. As a result there was
considerable overhang loading on the bearings. In ad
dition, changing the wheel tires required disassembly
of the shaft and bearing assembly for the entire side. On the drive side, with all three wheels locked by one
shaft, differences in tire diameter led to "scrubbing"
of the tire surfaces, and was suspected of causing sev
eral shafts to break due to constant torsional flexing.
To remedy these problems individual wheel assemblies were constructed and installed. Each assembly has two
bearings which support a single short shaft and wheel.
The cylinder is driven from one wheel with an extended
shaft and additional bearing mount. Changeout of a
wheel can now be accomplished in approximately 15
min, as compared to several hours with the original system.
July, 1985-Aluminum Concentration Unit
A new electronic detector circuit design was devel
oped for the ELPAC unit during the last quarter of 1984 and the first quarter of 1985. The original circuit
relied on a fixed time delay between detection and actuation of the air valve which supplied air to the
nozzle. As a result only aluminum objects with a ve
locity between 2 ft (0.6 m) and 4 ft (1.2 m) per second were over the air nozzle during discharge. In addition, testing revealed considerable variation in the 'throw'
direction of the aluminum, due to being caught either at the beginning or end of the air discharge interval. The new circuitry employs a microprocessor for each
channel which stores a detection 'signature' from
which the object velocity is calculated. The air valve
delay time and object velocity is then used to determine
the proper air valve actuation time. Testing of a prototype system indicates that object speeds in the range of 1 ft (0.3 m) to 10 ft (3.0 m) per second can be
accommodated with the new system. The inclusion of microprocessors in the system also
allows the number of aluminum and ferrous objects
passing over each channel to be recorded and downloaded to the plant process computer. This will provide
continuous indication of the aluminum content of the
input waste, the ferrous recovery efficiency, and op
eration status of the individual detectors. The new system is scheduled to be installed at the Gallatin facility in 1986. From prototype testing it is expected
that the ELP AC separation efficiency will increase from 70% to 80% for the current system and from 80% to 90% for the new system.
August, 1985-Glass/Grit and Ferrous Removal
System
The original system employed gravity slides to remove the ferrous and glass/grit fraction from the ro
tary separator. Due to the 6 o'clock to 10 o'clock position of the waste in the rotating cylinder the slides were placed near the down rotation wall of the cyl
inder. As a result, a significant portion of the glass/
grit fraction collected by the lifters fell back into the
304
fuel fraction before reaching the slide. To address this
problem, the slide was replaced with a vibrating pan
conveyor located near the up rotation wall at the point where the glass/grit fraction drops from the lifters.
The ferrous slide was replaced with a vibrating pan
conveyor 30% wider than the original slide. The in
crease in width and vertical clearance reduced the oc
curance of jams from 5 to 10 times per shift to less
than 1 per shift. As improved magnet wiper support,
installed with the ferrous conveyor, reduced wiper re
placement time from two hours to one-half hour. The exit position of the vibrating conveyors is higher than
that of the slides facilitating air knife removal of com
bustibles in the two fractions.
PROCESS EQUIPMENT AVAILABILITY
The process availability data are taken from com
puter and shift operator reports kept from the startup of plant operations. The reports record the time for
each halt, reason for the halt, tons of waste processed
per day, weight of each fraction removed, crane loads
fed to the system per day and other information. When conditions require the processing system to be stopped,
restart cannot be initiated until the reason for the halt has been entered into the plant control computer. Data from these reports were compiled into the following categories for each halt condition:
(a) Process Equipment
(b) Resource Authority Crane (c) Other
The Equipment category documents all halts in plant
operation due to recovery plant equipment downtime. The plant is operated by a two man crew (per shift)
who also perform all repairs and maintenance on the
process equipment during shift hours. The Crane category represents time that feed was
not available to the materials recovery plant. Waste is
supplied to the materials recovery input conveyor by
the Resource Authority crane. Due to the location of the input conveyor only one of the two energy recovery
plant cranes can reach the input conveyor hopper. At
times this crane is inoperative. In addition, during some
periods the materials recovery plant had processed all
available raw waste. The Other category includes all other time during
which the system was not processing waste on a production basis. This category includes loss of production due to noncombustible material bins not being avail
able, R&D testing, cleanup, breaks, and power out
ages.
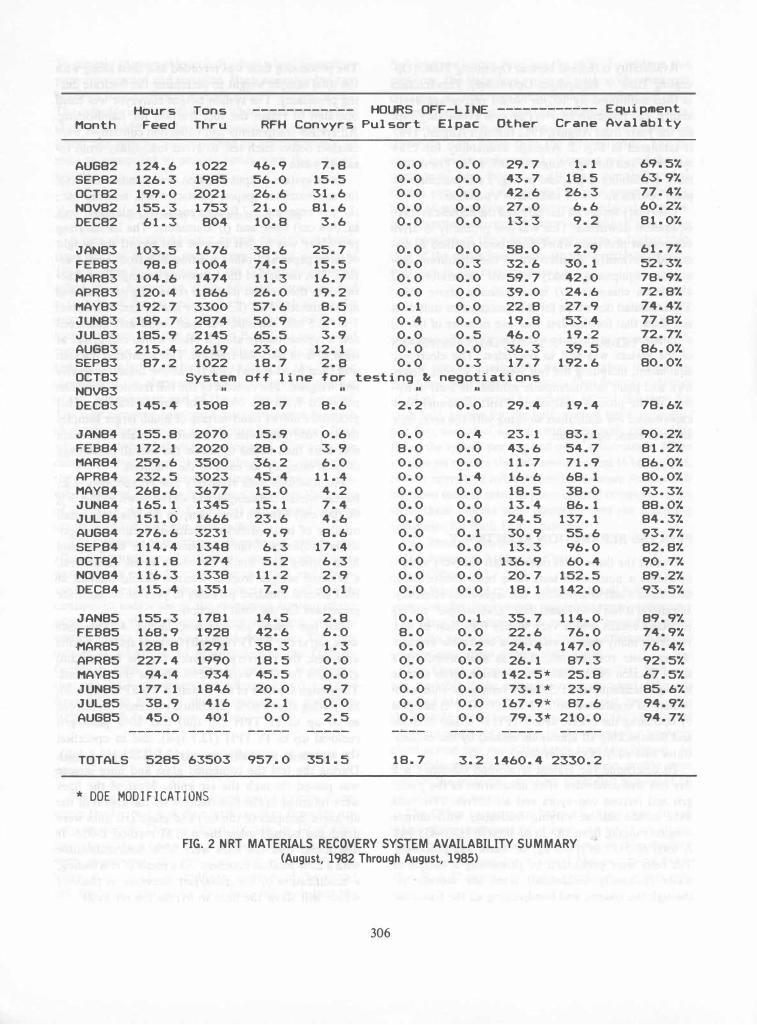
Availability is defined here as Operating Time/(Op
erating Time + Equipment Downtime). This fraction
is then multiplied by 100 to obtain percentage availability. The materials recovery process availability data
for the years from August, 1982 through August, 1985 is tabulated in Fig. 2. Average availability for 1984
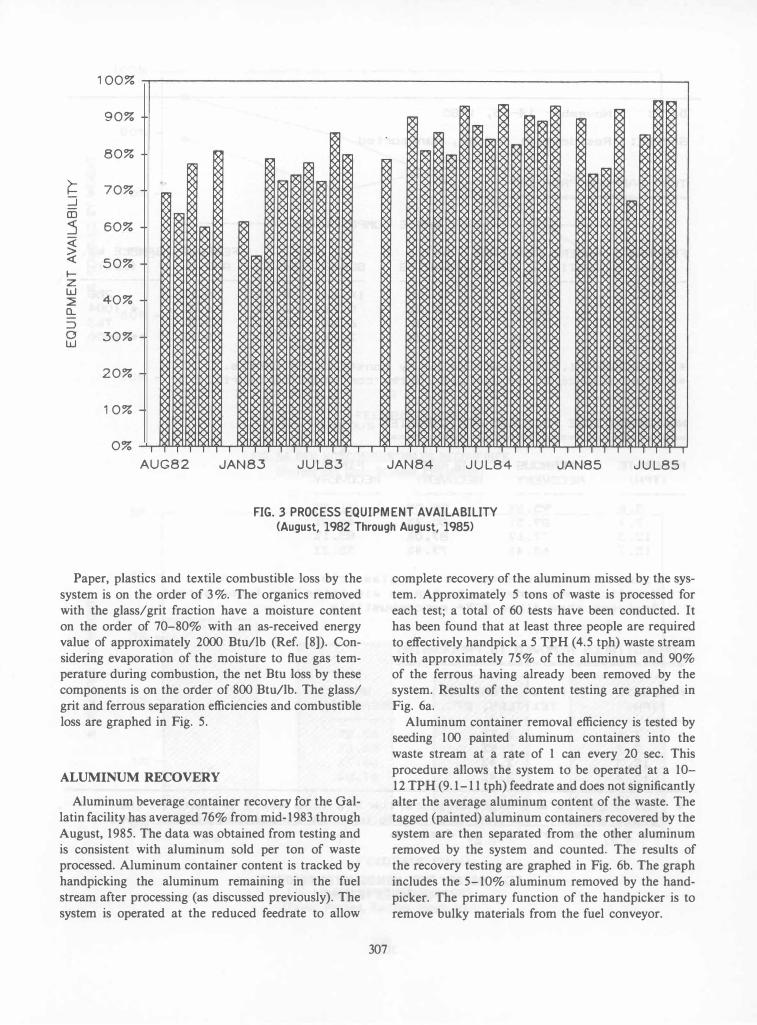
was 88%, and through August, 1985, 81 %. The equip
ment availability is graphed in Fig. 3 and summarizes plant operations for 37 months of operation.
The rotary separator initially had the highest average
equipment downtime. This was due primarily to drive component problems which have been rectified as dis
cussed previously. Availability of the aluminum sep
aration equipment (eddy current separator and aluminum concentrator) is consistently above 95%.
The tabulated downtime for the concentrator unit does not show that for this first year one or more of the 10 channels were at times inoperative while the majority of the system was still in operation. The electronic equipment, including the belt weighing system, detec
tors, and plant microcomputer exhibit the least down
time of the process equipment. Plant personnel have
experienced few difficulties working with the computer and electronic equipment.
PROCESS SEPARATION EFFICIENCY
During the three years of materials recovery system
operation a number of tests have been conducted to determine waste composition and separation efficiency. In general it has been found that "grab sample" testing produces results which vary widely from test to test, requiring many tests to establish a believable average. When waste components, such as aluminum, are a small fraction of the total waste stream, grab sample testing is inadequate. At Gallatin, testing for aluminum
content is conducted on 2-3 ton ( 1.8-2.7 t) samples by operating the system at a 5 TPH (4.6 tph) feedrate and handpicking all aluminum missed by the concen
trator and eddy current system.
To determine the system separation efficiency a 2 day test was conducted after installation of the glass/ grit and ferrous conveyors and air knives. Five tests were conducted, at varying feedrates, with sample weights ranging from 288 lb to 1000 lb ( 130-453 kg).
A total of 3 135 lb ( 1420 kg) of waste was processed. The tests were performed by processing a sample of
waste (primarily residential) from the storage pit through the system, and handpicking all the fractions.
305
The processing time was recorded and used along with
the total sample weight to determine the feedrate during processing. The system output conveyor was hand operated to retain the fuel fraction for handsorting.
All system components and collection containers were
cleaned before each test to avoid inaccuracy from residual waste.
Each system output fraction was hand sorted into: (a) combustibles (paper, plastic, wood, textiles, etc.; (b) wet organics; (c) ferrous metal; (d) glass; (e) - X in. (0.6 cm) fines; and (j) aluminum. The handsorting
procedure was to first remove and record the weight
of large paper and other combustibles from each frac
tion. This facilitated the remaining sorting. Each frac
tion was then sorted until the remaining material was approximately 1 in. (2.5 cm) or less in size. The minus
1 in. (2.5 cm) material was then coned and quartered and a representative sample taken which comprised at least 10% of the total fraction. This separated fraction was then hand-sorted into the above listed categories
and weighed. The content of the full fraction was then projected from the content of sample fraction. This
procedure allows hand-sorting of much larger samples
than would otherwise be possible. Totals from each
sort were then added to obtain the overall percentage of each category for each of the fractions.
For fractions with relatively few components, e.g., ferrous metal, the sample was sorted down to the - X in. (0.6 cm) fines. In these samples the relatively small
number of total particles precluded accurate compo
sition projection from a portion of the sample, and
little sorting time would have been saved. In general,
a selected sample from a fraction should contain at
least several hundred particles to provide an accurate projection for the total fraction.
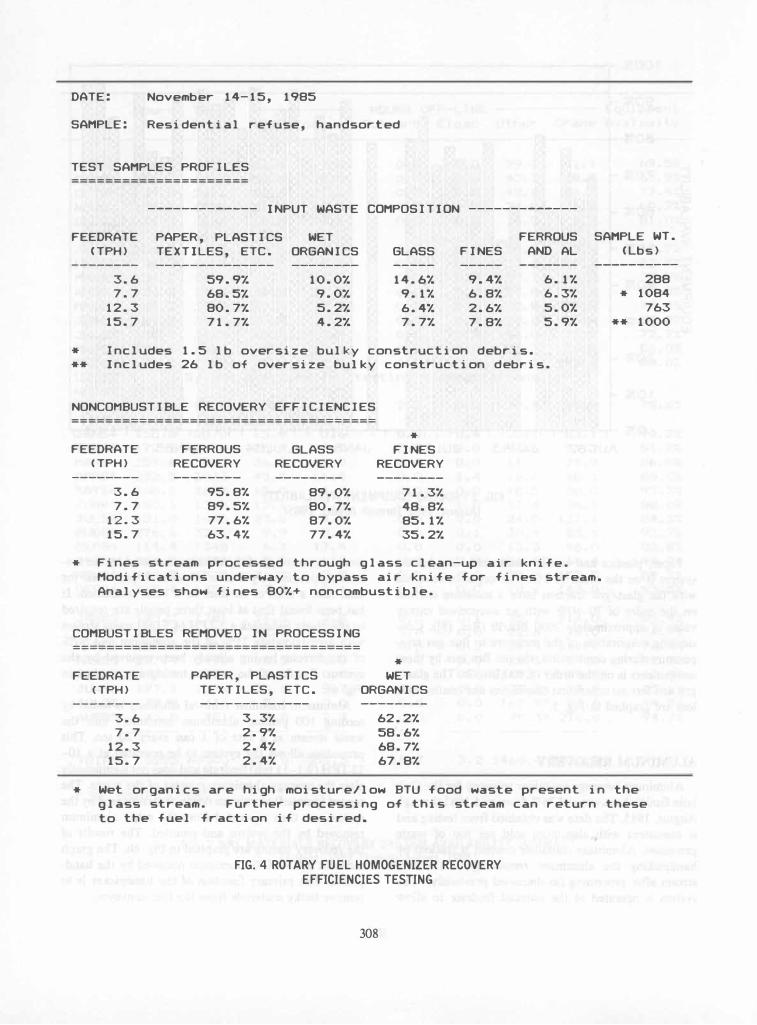
The test results are tabulated in Fig. 4. Two tests
were run at the 7.7 TPH (7 tph) feedrate and the results averaged; the recovery efficiency for the ferrous and glass/grit fraction were within 8% for the two tests.
The design feedrate of the system is 7.5 TPH (6.8 tph),
but testing shows 80% separation efficiency for ferrous metal up to 1 1 TPH (10 tph) and 80% glass/grit
removal up to 14 TPH (12.7 tph), and in operation the system is normally run at 12.5 TPH (11.4 tph).
During the test the combined glass and fines stream was passed through the air knife. Most of the fines
were returned to the fuel fraction by the action of the air knife. Samples of the fuel and glass/grit fines were dried and burned using the ASTM method E-955. It was found that the fines were 80% noncombustible
with a 20% moisture content. As a result of this testing, a modification of the glass/grit conveyor is planned
which will allow the fines to bypass the air knife.
Hours Tons -�---------- HOURS OFF-LINE ------------ Equipment
Month Feed Thru RFH Convyrs Pulsort Elpac Other Crane Avalablty
AU682 124.6 1022 46.9 7.8 0.0 0.0 29.7 1. 1 69.57-
SEP82 126.3 1985 56.0 15.5 0.0 0.0 43.7 18.5 63.9'Y.
OCT82 199.0 2021 26.6 31.6 0.0 0.0 42.6 26.3 77.47-
NOV82 155.3 1753 21.0 81.6 0.0 0.0 27.0 6.6 60.2'Y.
DEC82 61.3 804 10.8 3.6 0.0 0.0 13.3 9.2 81.0'Y.
JAN83 103.5 1676 38.6 25.7 0.0 0.0 58.0 2.9 61. 77-
FEB83 98.8 1004 74.5 15.5 0.0 0.3 32.6 30.1 52.37-MAR83 104.6 1474 11.3 16.7 0.0 0.0 59.7 42.0 78.97-APR83 120.4 1866 26.0 19.2 0.0 0.0 39.0 24.6 72.87-MAY83 192.7 3300 57.6 8.5 0.1 0.0 22.8 27.9 74.47-JUN83 189.7 2874 50.9 2.9 0.4 0.0 19.8 53.4 77.8'Y. JUL83 185.9 2145 65.5 3.9 0.0 0.5 46.0 19.2 72.77-AU683 215.4 2619 23.0 12.1 0.0 0.0 36.3 39.5 86.07-SEP83 87.2 1022 18.7 2.8 0.0 0.3 17.7 192.6 80.0'Y. OCT83 System off line for testing &c negotiations NOV83 II II II
DEC83 145.4 1508 28.7 8.6 2.2 0.0 29.4 19.4 78.67-
JAN84 155.8 2070 15.9 0.6 0.0 0.4 23.1 83.1 90.27-FEB84 172.1 2020 28.0 3.9 8.0 0.0 43.6 54.7 81.27-MAR84 259.6 3500 36.2 6.0 0.0 0.0 11.7 71.9 86.0'Y. APR84 232.5 3023 45.4 11.4 0.0 1.4 16.6 68.1 80.07-MAY84 268.6 3677 15.0 4.2 0.0 0.0 18.5 38.0 93.3'Y. JUN84 165.1 1345 15.1 7.4 0.0 0.0 13.4 86.1 88. OX JUL84 151.0 1666 23.6 4.6 0.0 0.0 24.5 137.1 84.37-AU684 276.6 3231 9.9 8.6 0.0 0.1 30.9 55.6 93.7'Y. SEP84 114.4 1348 6.3 17.4 0.0 0.0 13.3 96.0 82.87-OCT84 111.8 1274 5.2 6.3 0.0 0.0 136.9 60.4 90.7X NOV84 116.3 1338 11.2 2.9 0.0 0.0 20.7 152.5 89.27-DEC84 115.4 1351 7.9 0.1 0.0 0.0 18.1 142.0 93.5'Y.
JAN85 155.3 1781 14.5 2.8 0.0 0.1 35.7 114.0· 89.97-FEB85 168.9 1928 42.6 6.0 8.0 0.0 22.6 76.0 74.9X -MAR85 128.8 1291 38.3 1.3 0.0 0.2 24.4 147.0 76.47-APR85 227.4 1990 18.5 0.0 0.0 0.0 26.1 87.3 92.57-MAY85 94.4 934 45.5 0.0 0.0 0.0 142.5* 25.8 67.57-JUN85 177.1 1846 20.0 9.7 0.0 0.0 73.1* 23.9 85.6'Y. JUL85 38.9 416 2.1 0.0 0.0 0.0 167.9* 87.6 94.9'Y. AU685 45.0 401 0.0 2.5 0.0 0.0 79.3;'- 210.0 94.7X
------ ----- ----- ----- ----- -----
TOTALS 5285 63503 957.0 351.5 18.7 3.2 1460.4 2330.2
* DOE MODIFICATIONS
FIG. 2 NRT MATERIALS RECOVERY SYSTEM AVAILABILITY SUMMARY (August, 1982 Through August, 1985)
306
100% ,-----------------------------------------------------------�
90% -
80% -
70% -
60% -
50% -
40% -
30% -
20% -
10% -
AUG82 JAN83 JUL83 JAN84 JUL84 JAN8S JUL8S
FIG. 3 PROCESS EQUIPMENT AVAILABILITY (August, 1982 Through August, 1985)
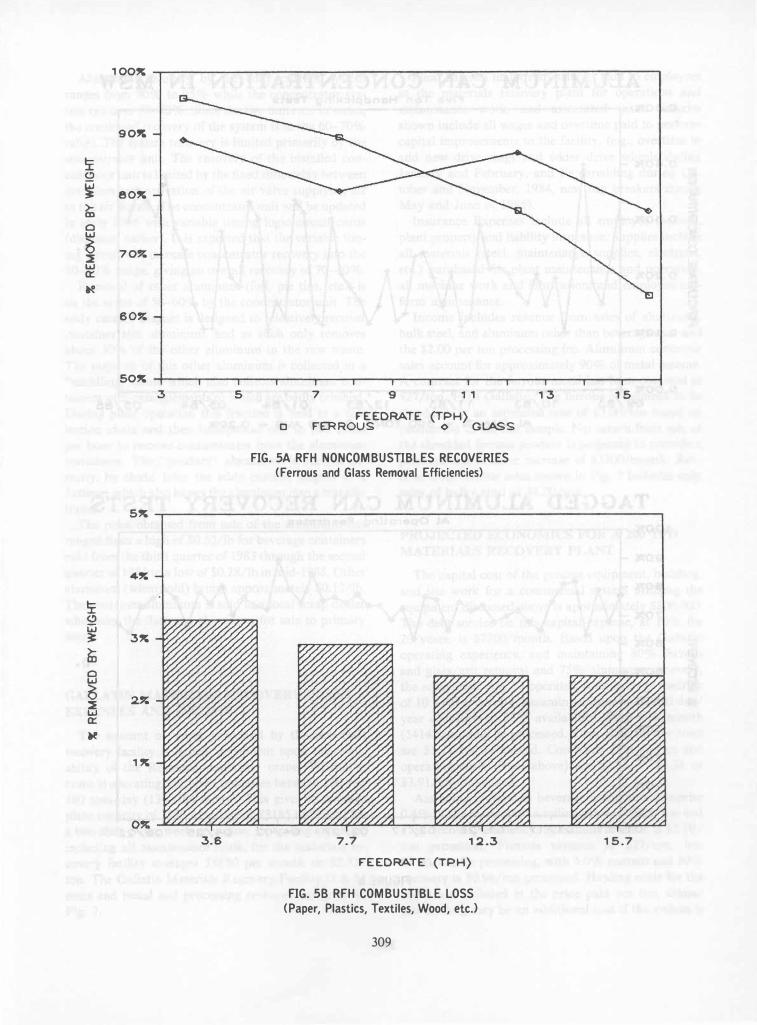
Paper, plastics and textile combustible loss by the
system is on the order of 3 %. The organics removed with the glass/grit fraction have a moisture content
on the order of 70-80% with an as-received energy value of approximately 2000 Btullb (Ref. [8]). Con
sidering evaporation of the moisture to flue gas temperature during combustion, the net Btu loss by these components is on the order of 800 Btullb. The glass/
grit and ferrous separation efficiencies and combustible
loss are graphed in Fig. 5.
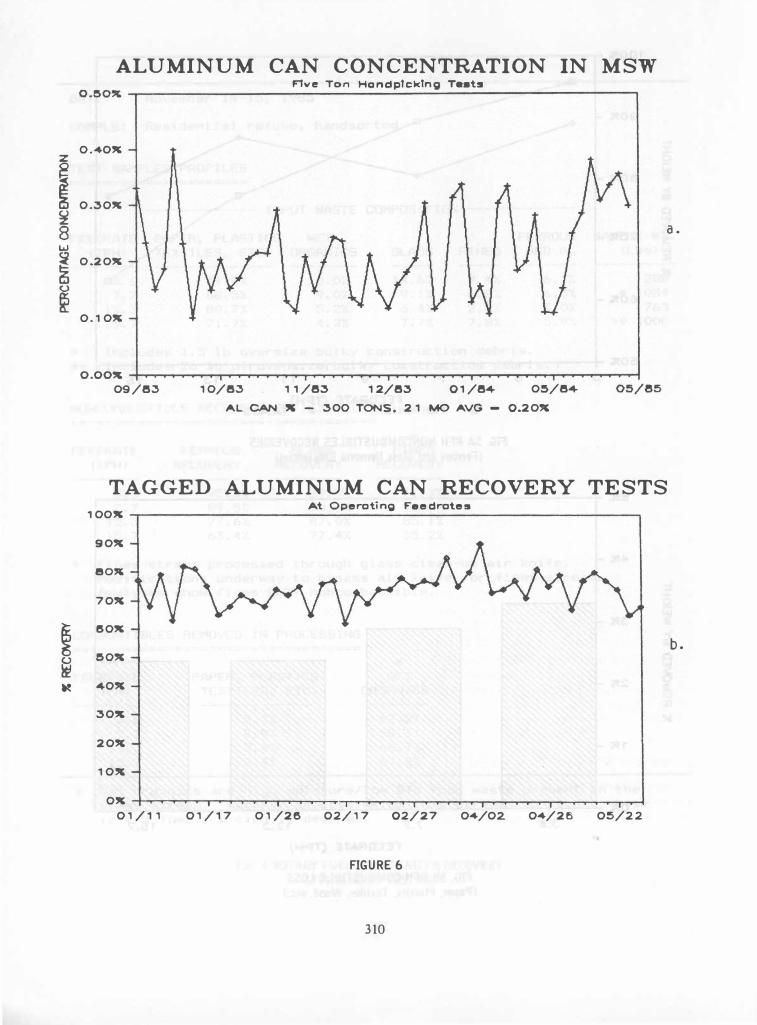
ALUMINUM RECOVERY
Aluminum beverage container recovery for the Gal
latin facility has averaged 76% from mid-1983 through
August, 1985. The data was obtained from testing and is consistent with aluminum sold per ton of waste processed. Aluminum container content is tracked by
handpicking the aluminum remaining in the fuel
stream after processing (as discussed previously). The
system is operated at the reduced feedrate to allow
307
complete recovery of the aluminum missed by the sys
tem. Approximately 5 tons of waste is processed for
each test; a total of 60 tests have been conducted. It has been found that at least three people are required
to effectively handpick a 5 TPH (4.5 tph) waste stream
with approximately 75% of the aluminum and 90% of the ferrous having already been removed by the system. Results of the content testing are graphed in
Fig. 6a.
Aluminum container removal efficiency is tested by seeding 100 painted aluminum containers into the waste stream at a rate of 1 can every 20 sec. This
procedure allows the system to be operated at a 10-
12 TPH (9.1-11 tph) feedrate and does not significantly alter the average aluminum content of the waste. The
tagged (painted) aluminum containers recovered by the
system are then separated from the other aluminum
removed by the system and counted. The results of
the recovery testing are graphed in Fig. 6b. The graph
includes the 5-10% aluminum removed by the hand
picker. The primary function of the handpicker is to
remove bulky materials from the fuel conveyor.
DATE: November 14-15, 1985
SAMPLE: Residential refuse, handsorted
TEST SAMPLES PROFILES =====================
------------- INPUT WASTE COMPOSITION -------------
FEEDRATE PAPER, PLASTICS WET FERROUS <TPH) TEXTILES, ETC. ORGANICS GLASS FINES AND AL
-------- -------------- -------- ----- ----- -------
3.6 59.9% 10.0% 14.6% 9.4% 6.1% 7.7 68.5% 9.0% 9.1% 6.8% 6.3%
12.3 80.7% 5.2% 6.4% 2.6% 5.0% 15.7 71.7% 4.2% 7.7% 7.8% 5.9%
* Includes 1.5 lb oversize bulky construction debris. ** Includes 26 lb of oversize bulky construction debris.
NONCOMBUSTIBLE RECOVERY EFFICIENCIES ====================================
*
FEEDRATE FERROUS GLASS FINES (TPH) RECOVERY RECOVERY RECOVERY
-------- -------- -------- --------
3.6 95.8% 89.0% 71.3% 7.7 89.5% 80.7% 48.8%
12. 3 77.6% 87.0% 85.1% 15.7 63.4% 77.4% 35.2%
* Fines stream processed through g lass clean-up air knife.
SAMPLE WT. (Lbs)
----------
288 * 1084
763 ** 1000
Modifications underway to bypass air knife for fines stream. Analyses show fines 80%+ noncombustible.
COMBUSTIBLES REMOVED IN PROCESSING ==================================
*
FEEDRATE PAPER, PLASTICS WET <TPH) TEXTILES, ETC. ORGANICS
-------- ------------- --------
3.6 3.3% 62.2% 7.7 2.9% 58.6%
12.3 2.4% 68.7% 15.7 2.4% 67.8%
* Wet organics are high moisture/low BTU food waste present in the glass stream. Further processing of this stream can return these to the fuel fraction if desired.
FIG. 4 ROTARY FUEL HOMOGENIZER RECOVERY EFFICIENCIES TESTING
308
!i: Cl
� � 0 w
� � w a:
II-e
!i: Cl w �
� 0 w
� � w a:
�
100� �----------------------------------------------------------,
90"
eo�
70"
60"
50� �---.----r---.----.----r---.----.---.r---�---r---.r---�--� 5 7 9 1 1
F'EEDRATE (TPH) o F'ERROUS � GLASS
FIG. 5A RFH NONCOMBUSTIBLES RECOVERIES (Ferrous and Glass Removal Efficiencies)
13 15
5� �----------------------------------------------------------�
4"
3�
2."
1�
3.6 7.7 12.3
F'EEDRATE (TPH)
FIG. 5B RFH COMBUSTIBLE LOSS (Paper, Plastics, Textiles, Wood, etc.>
309
15.7
ALUMINUM CAN CONCENTRATION IN MSW F1ve Ton HandpIckIng T •• ts
O.�O� �--------------------------�--�--------------------�
0.40" Z
i 0.30" � 8 a.
w
� 0.20"
(,)
� 0. 1 0"
o.oo� ���������������������������� 09/83 10/83 1 1/83 12/83 0 1/84 0�/84
AL CAN " - 300 TONS. 2 1 Me AVG - 0.20"
TAGGED ALUMINUM CAN RECOVERY TESTS
100" At Operating Feedrates
90"
eo"
70"
� 80"
&0" �
b.
� 40"
30�
20"
10�
0" 1-����������'-r���������������� 01/ 11 01/ 17 01/28 02/17 02/27 04/02. 04/215 0:5/22
FIGURE 6
310
Aluminum recovery by the eddy current system ranges from 90% to 95% while the concentrator sys
tem removes 70-80%. Since the two units are in series,
the combined recovery of the system is in the 60-70%
range. The system recovery is limited primarily by the
concentrator unit. The recovery of the installed con
centrator unit is limited by the fixed time delay between detection and activation of the air valve supplying air
to the air nozzle. The concentrator unit will be updated
in early 1986 with variable timing logic circuit cards (discussed earlier). It is expected that the variable tim
ing circuit will increase concentrator recovery into the 80-90% range, giving an overall recovery of 70-80%.
Removal of other aluminum (foil, pie tins, etc.) is
on the order of 50-60% by the concentrator unit. The eddy current magnet is designed to selectively recover
container size aluminum, and as such only removes about 30% of the other aluminum in the raw waste.
The majority of this other aluminum is collected in a "middling" chute which also collects aluminum containers with entanglements or which are badly crushed.
During plant operation this fraction is held in a col
lection chute and then handpicked one to two times per hour to remove contaminates from the aluminum containers. The "product" aluminum is carried di
rectly, by chute, from the eddy current magnet to a flattener which also blows the aluminum into a transfer trailer.
The price obtained from sale of the aluminum has ranged from a high of $0. 52/lb for beverage containers
paid from the third quarter of 1983 through the second
quarter of 1984 to a low of $0.28/lb in mid-1985. Other
aluminum (when sold) brings approximately $0. 13/lb.
The container aluminum is sold to a local scrap dealer who bales the flattened aluminum for sale to primary users.
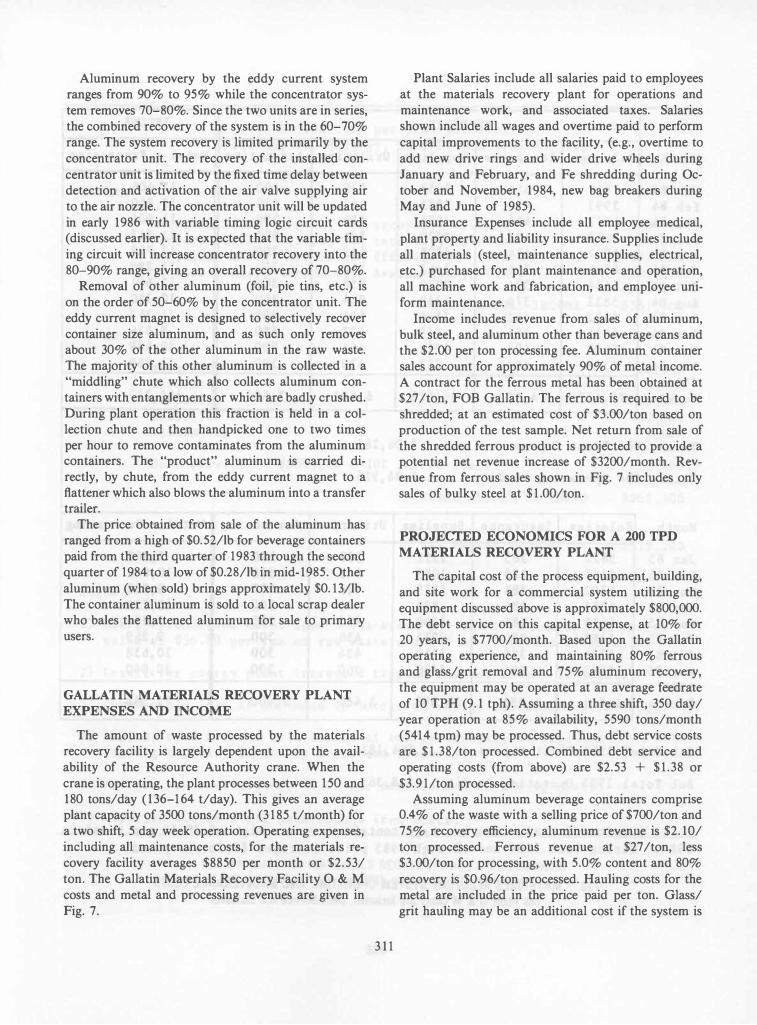
GALLATIN MATERIALS RECOVERY PLANT
EXPENSES AND INCOME
The amount of waste processed by the materials recovery facility is largely dependent upon the avail
ability of the Resource Authority crane. When the
crane is operating, the plant processes between 150 and 180 tons/day (136-164 t/day). This gives an average plant capacity of 3500 tons/month (3 185 t/month) for
a two shift, 5 day week operation. Operating expenses, including all maintenance costs, for the materials re
covery facility averages $8850 per month or $2.53/
ton. The Gallatin Materials Recovery Facility 0 & M
costs and metal and processing revenues are given in
Fig. 7.
311
Plant Salaries include all salaries paid to employees
at the materials recovery plant for operations and
maintenance work, and associated taxes. Salaries shown include all wages and overtime paid to perform
capital improvements to the facility, (e.g., overtime to
add new drive rings and wider drive wheels during
January and February, and Fe shredding during Oc
tober and November, 1984, new bag breakers during
May and June of 1985).
Insurance Expenses include all employee medical,
plant property and liability insurance. Supplies include
all materials (steel, maintenance supplies, electrical,
etc.) purchased for plant maintenance and operation,
all machine work and fabrication, and employee uni
form maintenance.
Income includes revenue from sales of aluminum,
bulk steel, and aluminum other than beverage cans and the $2.00 per ton processing fee. Aluminum container sales account for approximately 90% of metal income.
A contract for the ferrous metal has been obtained at $27/ton, FOB Gallatin. The ferrous is required to be
shredded; at an estimated cost of $3.oo/ton based on
production of the test sample. Net return from sale of
the shredded ferrous product is projected to provide a potential net revenue increase of $ 32oo/month. Rev
enue from ferrous sales shown in Fig. 7 includes only sales of bulky steel at $1.oo/ton.
PROJECTED ECONOMICS FOR A 200 TPD
MATERIALS RECOVERY PLANT
The capital cost of the process equipment, building,
and site work for a commercial system utilizing the
equipment discussed above is approximately $800,000.
The debt service on this capital expense, at 10% for 20 years, is $77oo/month. Based upon the Gallatin operating experience, and maintaining 80% ferrous and glass/grit removal and 75% aluminum recovery,
the equipment may be operated at an average feedrate
of 10 TPH (9.1 tph). Assuming a three shift, 350 day/ year operation at 85% availability, 5590 tons/month
(5414 tpm) may be processed. Thus, debt service costs
are $1.38/ton processed. Combined debt service and operating costs (from above) are $2.53 + $1.38 or
$3.9 1/ton processed. Assuming aluminum beverage containers comprise
0.4% of the waste with a selling price of $7oo/ton and
75% recovery efficiency, aluminum revenue is $2.10/
ton processed. Ferrous revenue at $27/ton, less
$3.oo/ton for processing, with 5.0% content and 80%
recovery is $0.96/ton processed. Hauling costs for the
metal are included in the price paid per ton. Glass/
grit hauling may be an additional cost if the system is
EXPENSES INCOME
Month Salaries Insurance Supplies Utilities Accounting "Metal + Processing
Jan 84 7047 454 3953 530 300 12,406 Feb 84 3991 455 2983 661 300 11 ,850 Mar 84 6377 468 1235 596 300 11,905 Apr 84 6457 424 2270 596 300 13,217 May 84 6007 424 1808 612 300 12,768 Jun 84 6046 341 1461 558 300 13 ,290 Jul 84 6454 374 2089 558 300 12,801 Aug 84 5833 374 1110 564 300 10,180 Sep 84 5432 462 1548 605 300 11 ,362 Oct 84 5815 401 245 427 300 9,556 Nov 84 5620 401 1212 464 300 10,609 Dec 84 5348 401 762 430 300 11,789 1984 Totals 70,427 4,979 20,678 6,601 3,600 141,210
Total 1 984 Plant Expenses • • • • • • • • • • $106,285
Total 1 984 Operating Profit • • • • • • • • $ 34,925
Month Salaries Insurance Supplies Utilities Accounting Metal + Processing
Jan 85 5822 385 1322 350 300 9,862 Feb 85 6102 385 1083 545 300 10,640 Mar 85 5792 385 1279 418 300 8,083 Apr 85 4881 385 832 461 300 13,732 May 85 6088 385 1100 482 300 9,284 Jun 85 5183 385 2233 436 300 9,269 Jul 85 5756 385 1064 434 300 10,638 Aug 85 5187 398 1480 360 300 10,040 1985 Totals 44,811 3,093 10,393 3,486 2,400 72,548
Sub Total 1985 Plant Expenses • • • • • • $64,183
Sub Total 1985 Operating Profit • • • • $ 8,365
Price obtained for aluminum beverage containers vas a high of $0.52 per pound in 1984. During late 1984 and through 1985 price averaged $0.35 per pound.
FIG. 7 MATERIALS RECOVERY SYSTEM OPERATING AND MAINTENANCE COSTS
(All Plant 0 & M Costs are Included, Debt Service not Included>
312
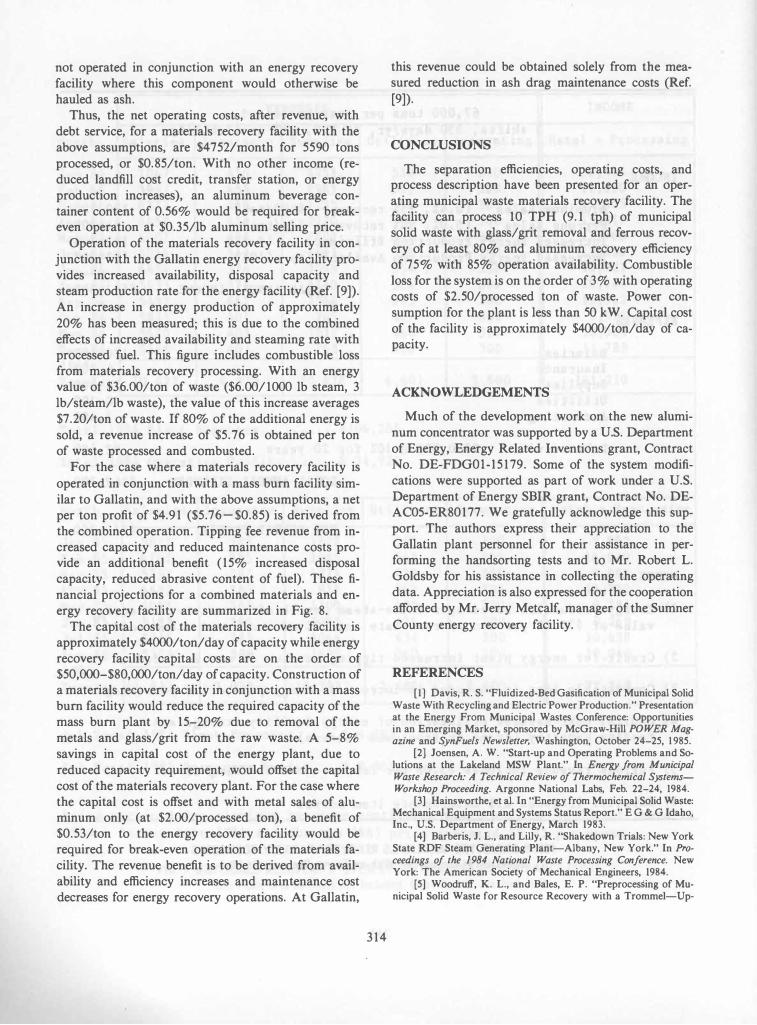
INCOME
EXPENSES
NOTES:
67,000 tons per year processed 3 shifts, 350 days/yr, 10 TPH, 85% availability
Aluminum Sales Ferrous Sales Increased Energy Increased Energy
Salaries Insurance Supplies Utilities Accounting
Debt service
<0.4%, 7S%.recovery, $700/ton) (5.0%, 80% recovery, $24/ton) Production Efficiency (9.5%) Production Availability (10%)
TOTAL ANNUAL INCOME
$800,000 @ 10% for 20 years
TOTAL ANNUAL EXPENSES
NET ANNUAL PROFIT
140,700 64,300
183,300 193,000
$581,300
120,700 6,700
26,800 10,100
5,400
92,400
$262,100
$319,200
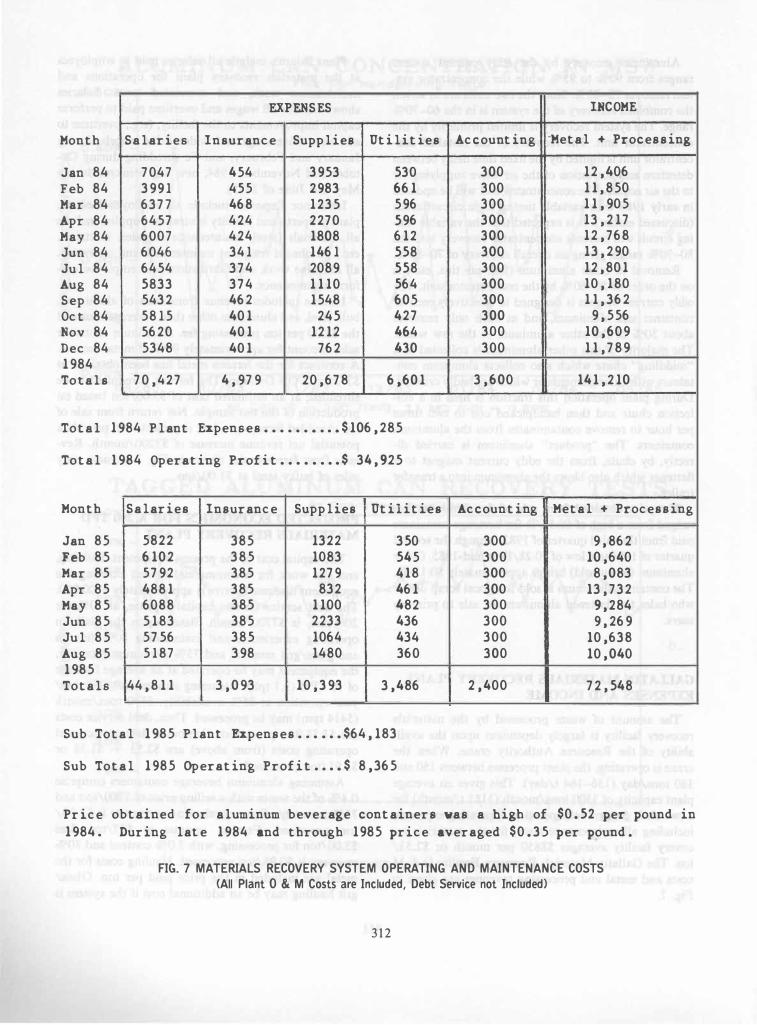
1) Energy production based upon 3 lbs-steam per lb of raw waste, an energy value of $36.00 per ton of raw waste and 80% of increased steam sold.
2) Credit for energy plant increased tipping revenue is not included.
3) Combustible loss is included in increased energy production percentage.
4) Capital cost assumes utilization of energy facility storage and feeding capacity (crane or front-end loaders).
5) Ferrous revenue includes $3.00 per ferrous ton shredding costs.
6) Supplies includes all maintenance item costs.
FIG. 8 PROJECTED MATERIALS RECOVERY FACILITY ECONOMICS (Operation in Conjunction With an Energy Recovery Facility)
313
not operated in conjunction with an energy recovery
facility where this component would otherwise be hauled as ash.
Thus, the net operating costs, after revenue, with
debt service, for a materials recovery facility with the
above assumptions, are $47521month for 5590 tons
processed, or $0.85/ton. With no other income (re
duced landfill cost credit, transfer station, or energy
production increases), an aluminum beverage con
tainer content of 0.56% would be required for breakeven operation at $0.35/lb aluminum selling price.
Operation of the materials recovery facility in con
junction with the Gallatin energy recovery facility pro
vides increased availability, disposal capacity and steam production rate for the energy facility (Ref. [9]).
An increase in energy production of approximately
20% has been measured; this is due to the combined
effects of increased availability and steaming rate with processed fuel. This figure includes combustible loss from materials recovery processing. With an energy value of $36.oo/ton of waste ($6.00/1000 lb steam, 3
lb/steam/lb waste), the value of this increase averages
$7.20/ton of waste. If 80% of the additional energy is
sold, a revenue increase of $5.76 is obtained per ton
of waste processed and combusted.
For the case where a materials recovery facility is
operated in conjunction with a mass burn facility sim
ilar to Gallatin, and with the above assumptions, a net per ton profit of $4.91 ($5.76- $0.85) is derived from
the combined operation. Tipping fee revenue from increased capacity and reduced maintenance costs provide an additional benefit (15% increased disposal capacity, reduced abrasive content of fuel). These fi
nancial projections for a combined materials and energy recovery facility are summarized in Fig. 8.
The capital cost of the materials recovery facility is approximately $4000/ton/day of capacity while energy recovery facility capital costs are on the order of
$50,000-$80,000/ton/day of capacity. Construction of a materials recovery facility in conjunction with a mass
burn facility would reduce the required capacity of the
mass burn plant by 15-20% due to removal of the
metals and glass/grit from the raw waste. A 5-8%
savings in capital cost of the energy plant, due to
reduced capacity requirement, would offset the capital
cost of the materials recovery plant. For the case where the capital cost is offset and with metal sales of aluminum only (at $2.oo/processed ton), a benefit of $0.53/ton to the energy recovery facility would be required for break-even operation of the materials fa
cility. The revenue benefit is to be derived from avail
ability and efficiency increases and maintenance cost
decreases for energy recovery operations. At Gallatin,
314
this revenue could be obtained solely from the measured reduction in ash drag maintenance costs (Ref.
[9]).
CONCLUSIONS
The separation efficiencies, operating costs, and process description have been presented for an oper
ating municipal waste materials recovery facility. The facility can process 10 TPH (9.1 tph) of municipal solid waste with glass/grit removal and ferrous recov
ery of at least 80% and aluminum recovery efficiency
of 75% with 85% operation availability. Combustible
loss for the system is on the order of 3% with operating costs of $2.50/processed ton of waste. Power con
sumption for the plant is less than 50 kW. Capital cost
of the facility is approximately $4000/ton/day of ca
pacity.
ACKNOWLEDGEMENTS
Much of the development work on the new alumi
num concentrator was supported by a U.S. Department
of Energy, Energy Related Inventions grant, Contract
No. DE-FDGOI-15179. Some of the system modifi
cations were supported as part of work under a U.S.
Department of Energy SBIR grant, Contract No. DEAC05-ER80177. We gratefully acknowledge this sup
port. The authors express their appreciation to the
Gallatin plant personnel for their assistance in performing the handsorting tests and to Mr. Robert L.
Goldsby for his assistance in collecting the operating
data. Appreciation is also expressed for the cooperation
afforded by Mr. Jerry Metcalf, manager of the Sumner
County energy recovery facility.
REFERENCES
[ I ] Davis, R. S. "Fluidized-Bed Gasification of Municipal Solid Waste With Recycling and Electric Power Production." Presentation at the Energy From Municipal Wastes Conference: Opportunities in an Emerging Market, sponsored by McGraw-Hill POWER Magazine and SynFuels Newsletter, Washington, October 24-25, 1 985.
[2] Joensen, A. W. "Start-up and Operating Problems and Solutions at the Lakeland MSW Plant." In Energy from Municipal Waste Research: A Technical Review of Thermochemical SystemsWorkshop Proceeding. Argonne National Labs, Feb. 22-24, 1984.
[3] Hainsworthe, et al. In "Energy from Municipal Solid Waste: Mechanical Equipment and Systems Status Report." E G & G Idaho, Inc., U.S. Department of Energy, March 1983.
[4] Barberis, J. L., and Lilly, R. "Shakedown Trials: New York State RDF Steam Generating Plant-Albany, New York." In Proceedings of the 1984 National Waste Processing Conference. New York: The American Society of Mechanical Engineers, 1984.
[5] Woodruff, K. L., and Bales, E. P. "Preprocessing of Municipal Solid Waste for Resource Recovery with a Trommel-Up-
date 1977." In Proceedings of the 1977 National Waste Processing Conference. New York: The American Society of Mechanical Engineers, 1977, 249-257.
[6) Sommer, E. I., and Kenny, G. R. "Effects of Materials Recovery on Waste-To-Energy Conversion at the Gallatin, Tennessee Mass Fired Facility." In Proceedings of the 1984 National Waste Processing Conference. New York: The American Society of Mechanical Engineers, 1984, 590-618.
[7) Kenny, G. R., and Sommer, E. I. "A Simplified Process for Metal and Noncombustible Separation from MSW Prior To Waste-To-Energy Conversion." In Proceedings of the 1984 National Waste Processing Conference, New York: The American Society of Mechanical Engineers, 1984, 574-589.
315
[8) Hollander, H. I., and Sanders, W. A., II. "Biomass-An Unlimited Resource." Consulting Engineer November 1980.
[9) Sommer, E. I., and Kenny, G. R. "Mass Fired Conversion Efficiency, Emissions, and Capacity with a Homogenous Low Ash Fuel." In Proceedings of the 12th National Waste Processing Con
ference. New York: The American Society of Mechanical Engineers, 1986.
Key Words: Aluminum; Concentration; Magnet;
Materials Recovery; Nonferrous; Refuse Derived
Finel; Rotary Drum; Separating