Embed Size (px)
Citation preview
NRB Working Paper No. 39
April 2017
Optimal Inflation Rate for Nepal
Nepal Rastra Bank
Research Department*
ABSTRACT
This paper estimates the optimal inflation rate in Nepal based on the data of the period
1978–2016. The novelty of the analysis is that it probes possible nonlinearity of the
hypothesized impact of inflation on economic growth using alternative specifications. The
results suggest that there exists a threshold effect of inflation. The Ordinary Least Squares
method estimates the turning point of inflation to be 6.25 percent while that of the Hansen
(2000) method shows the threshold level to be 6.40 percent. The maximum impact on growth
associated with the turning point, and at the mean levels of other explanatory variables is
quite high at 4.59 percent.
JEL Classification: E31, E52, E58, O40
Key Words: Optimal inflation, threshold inflation, exchange rate overvaluation
* This study is conducted by a team of staff at Research Department of the bank. The team comprises Director
Neelam Timsina, Deputy Directors Dr. Rajan Karishna Panta and Madhav Dangal, and Assistant Director Dr.
Mahesh Chaulagain. Email: [email protected]
© 2017 Nepal Rastra Bank
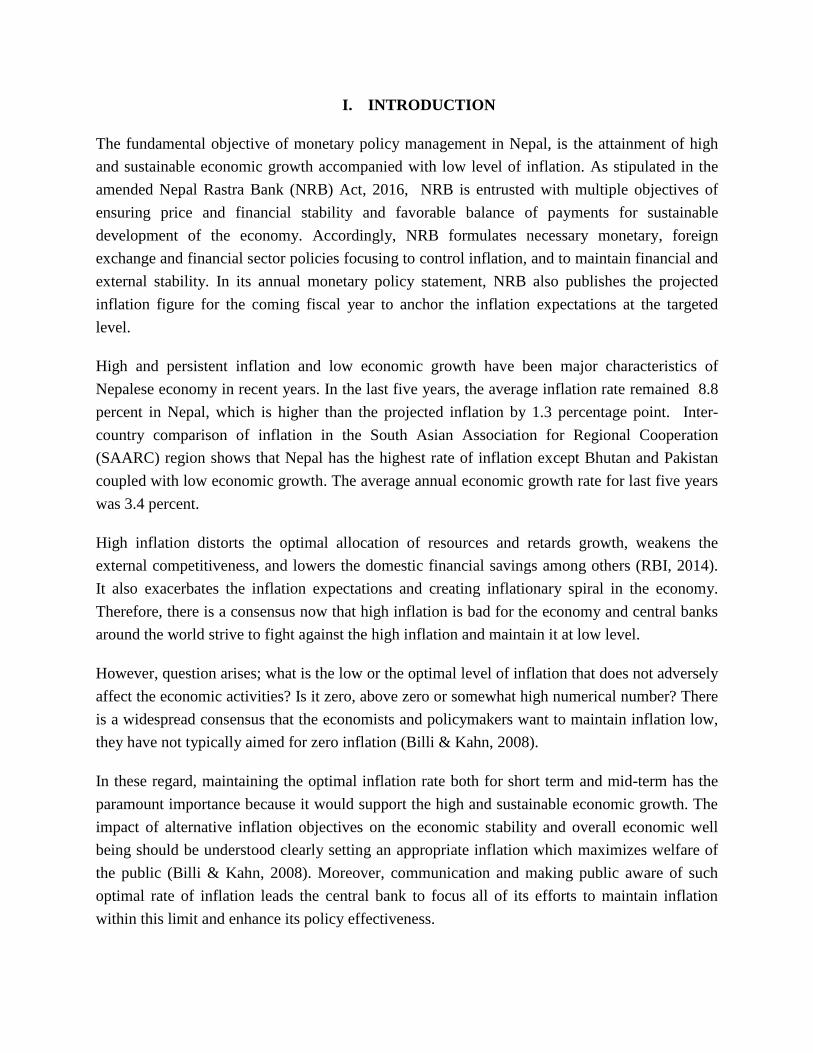
I. INTRODUCTION
The fundamental objective of monetary policy management in Nepal, is the attainment of high
and sustainable economic growth accompanied with low level of inflation. As stipulated in the
amended Nepal Rastra Bank (NRB) Act, 2016, NRB is entrusted with multiple objectives of
ensuring price and financial stability and favorable balance of payments for sustainable
development of the economy. Accordingly, NRB formulates necessary monetary, foreign
exchange and financial sector policies focusing to control inflation, and to maintain financial and
external stability. In its annual monetary policy statement, NRB also publishes the projected
inflation figure for the coming fiscal year to anchor the inflation expectations at the targeted
level.
High and persistent inflation and low economic growth have been major characteristics of
Nepalese economy in recent years. In the last five years, the average inflation rate remained 8.8
percent in Nepal, which is higher than the projected inflation by 1.3 percentage point. Inter-
country comparison of inflation in the South Asian Association for Regional Cooperation
(SAARC) region shows that Nepal has the highest rate of inflation except Bhutan and Pakistan
coupled with low economic growth. The average annual economic growth rate for last five years
was 3.4 percent.
High inflation distorts the optimal allocation of resources and retards growth, weakens the
external competitiveness, and lowers the domestic financial savings among others (RBI, 2014).
It also exacerbates the inflation expectations and creating inflationary spiral in the economy.
Therefore, there is a consensus now that high inflation is bad for the economy and central banks
around the world strive to fight against the high inflation and maintain it at low level.
However, question arises; what is the low or the optimal level of inflation that does not adversely
affect the economic activities? Is it zero, above zero or somewhat high numerical number? There
is a widespread consensus that the economists and policymakers want to maintain inflation low,
they have not typically aimed for zero inflation (Billi & Kahn, 2008).
In these regard, maintaining the optimal inflation rate both for short term and mid-term has the
paramount importance because it would support the high and sustainable economic growth. The
impact of alternative inflation objectives on the economic stability and overall economic well
being should be understood clearly setting an appropriate inflation which maximizes welfare of
the public (Billi & Kahn, 2008). Moreover, communication and making public aware of such
optimal rate of inflation leads the central bank to focus all of its efforts to maintain inflation
within this limit and enhance its policy effectiveness.
Nepal maintains a pegged exchange rate regime with India, and around two-third of its total trade
takes place with India. Thus, Nepal’s inflation is significantly influenced by inflation in India.
Several empirical studies have shown that Nepal’s inflation is largely determined by Indian
inflation (Nepal Rastra Bank, 2007; Ginting, 2007; International Monetary Fund, 2011). In this
context, the sustainability of the peg crucially depends on the keeping the inflation rate close to
that of India. The adoption of the flexible inflation targeting by India has also necessitated to
adopt a more proactive policy by the NRB in keeping inflation at a lower rate in Nepal.
In this regard, very few studies have been carried out in Nepal (Bhatta, 2015; Bhushal &
Silpakar, 2011). Both of these studies use Khan and Shenhadji (2000) methodology which
assumes the threshold level of inflation as exogenous. This study aims to contribute to the
estimation of threshold inflation by adopting a more rigorous and alternative estimation
techniques, where the threshold level is endogenous. Also, alternative estimation methods are
used to assess the robustness of the results. The remainder of the study is organized as follows:
the second section reviews the theoretical and empirical literature on the threshold effects of
inflation and the third section discusses the alternative theoretical models and derives the results
with concluding observations.
II. THEORETICAL UNDERPINNINGS AND EMPIRICAL EVIDENCE
This section provides the theoretical and empirical literature on the inflation and growth nexus.
First, it discusses several theoretical postulates and major channels through which inflation
affects growth. Second, it discusses the empirical literature on the optimal inflation rate focusing
on developing countries.
There exists an extensive literature on the theoretical and empirical studies regarding inflation
and growth nexus. Classical theory views savings as the major ingredient for investment and
growth. The classical dichotomy between the real and nominal variables means that inflation
only affects the price level, and only the real factors influence economic growth.
The Keynesian apply the Aggregate Demand (AD) and Aggregate Supply (AS) to illustrate the
output inflation relationship. According to this model, in the short-run, the AS curve is upward
sloping which implies that stimulating the demand side of the economy affect both prices and
output. Based on this concept, Keynesians advocate a positive relationship between inflation and
output (Fabayo & Ajilore, 2006). The initial short- run trade-off between inflation and output
results from the time inconsistent problem until it lures the producers into more output. However,
in the long-run, the AS curve becomes vertical. The policy implication of vertical AS curve is
that demand side policy is no longer increase the level of output but only the level of price.
The monetarists argued that inflation persists in the economy as the supply of money exceeds the
growth rate of the economy. They challenged the Philips' argument of inflation and output trade-
off and proposed wages adjust accordingly as the workers anticipate the future rate of interest.
The neo-classical economists developed the portfolio management theory and propounded how
individuals manage their wealth substituting current consumption for future consumption. Tobin
(1965) suggested that inflation causes individuals to substitute out of money and into interest
earning assets, which leads to greater capital intensity and promotes economic growth. It predicts
the positive effect of inflation to economic growth.
On the other side, neo-Keynesian economists developed the concept of potential output also
known as natural output and argued that inflation is determined by the actual level of output and
level of unemployment. If the actual level of output is higher than its potential level and
unemployment is below the natural rate, inflation accelerated that causes to shift in Philips curve
to outward indicating higher inflation with higher unemployment (Gordon, 1997).
Endogenous growth theories endogenous factors namely economies of scale, increasing returns
or induced technological change. According to this theory, rate of return of the capital
determines the level of economic growth. Thus, inflation induces the goods to leisure substitutes
which forces down to the return of human capital and then reduces the return on all capital and
the growth rate (Gillman, Harris, & Matyas, 2001).
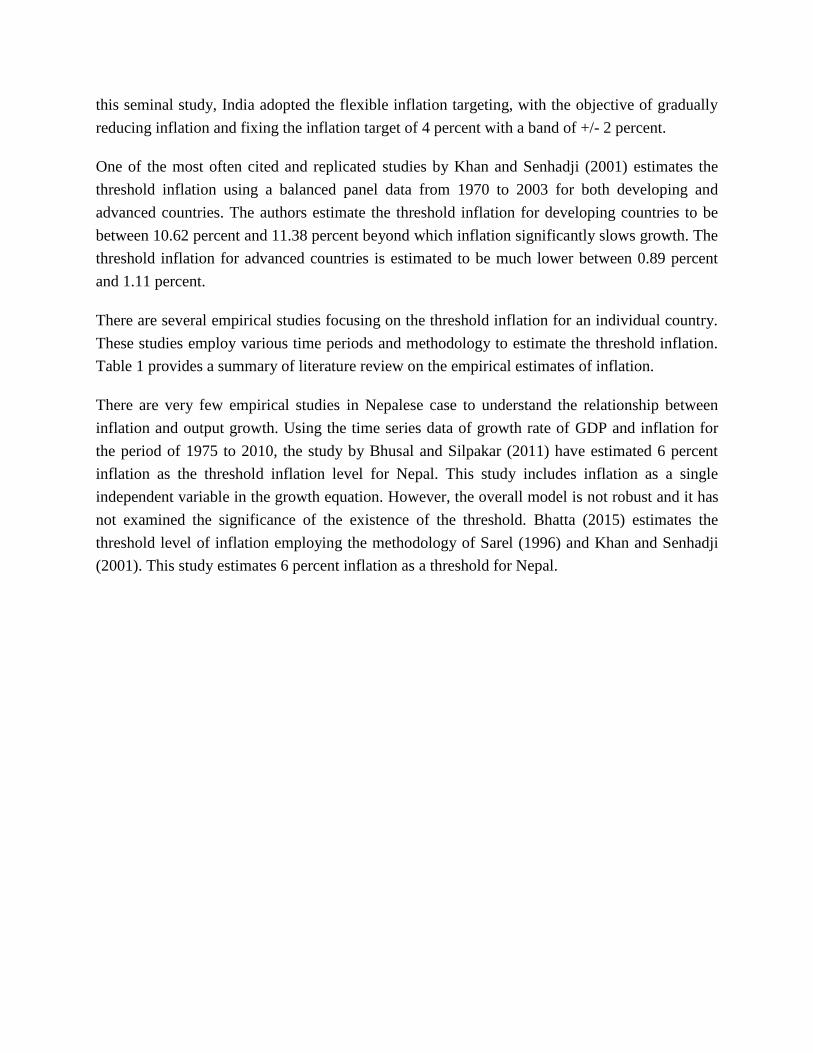
Inflation can affect growth through financial intermediaries and several transmission channels
(Figure 1). First, high inflation can adversely affect the financial market development. Second,
financial market development is associated with higher level and efficiency of investment (Li,
Min, 2006).
Figure 1: Transmission mechanism from inflation to economic growth
Source: Li, 2006
Inflation Financial
Intermediarie
s
Level of Investment
(Capital
Accumulation)
Efficiency of
Investment
(TFP)
Long-run
Economi
c
Growth
Uncertainty about the future
Loss of confidence in the economy
Instability of society
Summarizing the theoretical literature, Drukker et al. (2005) provides the major alternative
predictions regarding the impact of inflation on output and growth. 1) No effect—there is no
effect of inflation on growth as money is super-neutral with money in the utility function
(Sidrauski, 1967), 2) Positive effect—Money is a substitute for capital, hence inflation has a
positive effect on long-term growth (Tobin, 1965), 3) Negative effect—Money is complementary
to capital in the cash in advance model causing inflation to have a negative impact on growth
(Stockman, 1981), 4) Threshold effect—the effect of inflation on growth depends on the
threshold level. Beyond the threshold level, inflation has a negative effect on growth due to its
impact on financial market efficiency arising from informational asymmetries and exacerbating
financial market frictions (Huybens & Smith, 1998).
2.1 Empirical Evidence on Threshold Inflation and Economic Growth
The optimal rate of inflation can be estimated on the basis of the threshold effects in the
relationship between inflation and growth. Inflation below the threshold level supports economic
growth and inflation above the threshold retards the economic growth. While the theoretical
discussions point out the detrimental effects of ‘very’ high inflation, the empirical evidence on
the appropriate or the optimal level of inflation is mixed. The empirical literature on the optimal
inflation rate can be broadly classified into two groups. One group of literature analyses the
cross-country data to estimate the average optimal inflation. The second group focuses on a
specific country to derive the threshold rate of inflation. The literature also tends to distinguish
between the optimal inflation rate in developing countries and advanced economies. For the
advanced economies, there is a consensus that inflation rate between 1 to 3 percent corresponds
to price stability while for the emerging and transition economies inflation in the range of 4 to 5
percent would be desirable (Reserve Bank of India, 2014).
Based on these theoretical underpinnings, a large number of empirical studies have been carried
out. Several cross country and single country studies have demonstrated both the linear and
nonlinear relationship between inflation and economic growth. The non-linear nexus depicts the
threshold effects i.e., structural break point of inflation which has the important policy
implication to the central banks (Fisher, 1993).
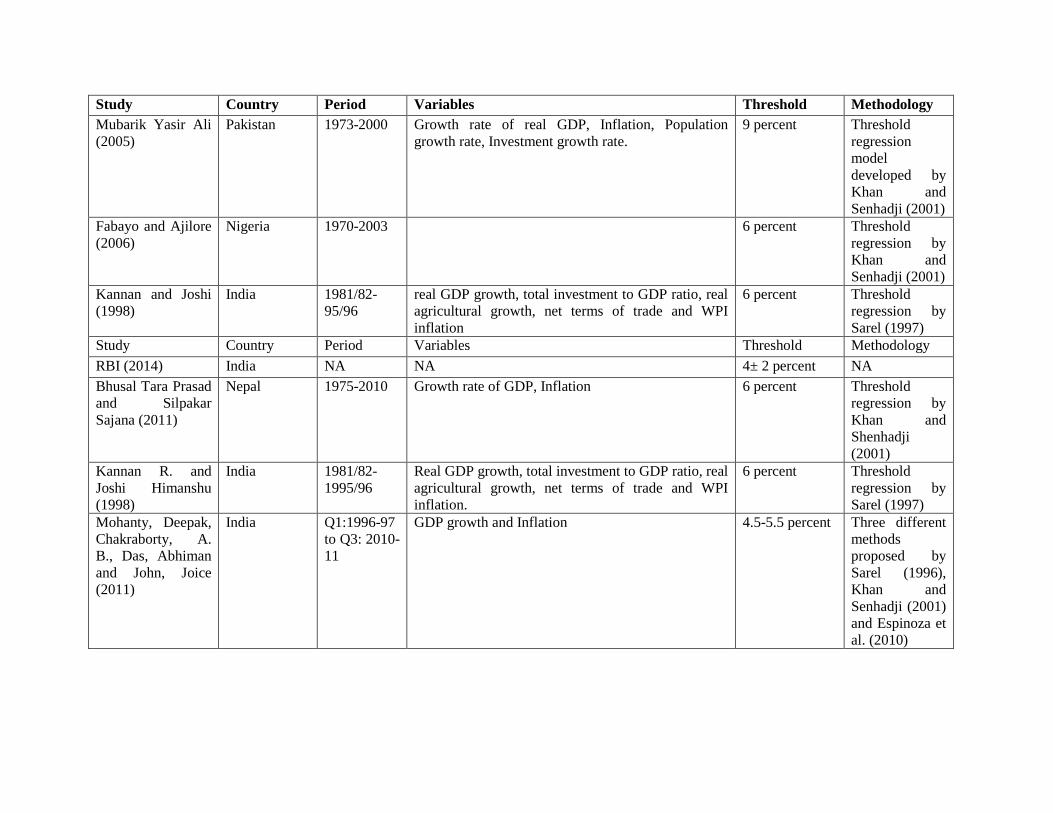
A recent report by the RBI summarizes the various empirical studies estimating the threshold
inflation in India (Reserve Bank of India, 2014). Various studies using different methodologies
and time periods suggest the threshold inflation in India between 4 to 7 percent. The latest
estimation for the threshold effect in India using the logistic smooth transition (LSTR) model
suggests the upper bound for India at around 6 percent (Reserve Bank of India, 2014). Based on
this seminal study, India adopted the flexible inflation targeting, with the objective of gradually
reducing inflation and fixing the inflation target of 4 percent with a band of +/- 2 percent.
One of the most often cited and replicated studies by Khan and Senhadji (2001) estimates the
threshold inflation using a balanced panel data from 1970 to 2003 for both developing and
advanced countries. The authors estimate the threshold inflation for developing countries to be
between 10.62 percent and 11.38 percent beyond which inflation significantly slows growth. The
threshold inflation for advanced countries is estimated to be much lower between 0.89 percent
and 1.11 percent.
There are several empirical studies focusing on the threshold inflation for an individual country.
These studies employ various time periods and methodology to estimate the threshold inflation.
Table 1 provides a summary of literature review on the empirical estimates of inflation.
There are very few empirical studies in Nepalese case to understand the relationship between
inflation and output growth. Using the time series data of growth rate of GDP and inflation for
the period of 1975 to 2010, the study by Bhusal and Silpakar (2011) have estimated 6 percent
inflation as the threshold inflation level for Nepal. This study includes inflation as a single
independent variable in the growth equation. However, the overall model is not robust and it has
not examined the significance of the existence of the threshold. Bhatta (2015) estimates the
threshold level of inflation employing the methodology of Sarel (1996) and Khan and Senhadji
(2001). This study estimates 6 percent inflation as a threshold for Nepal.
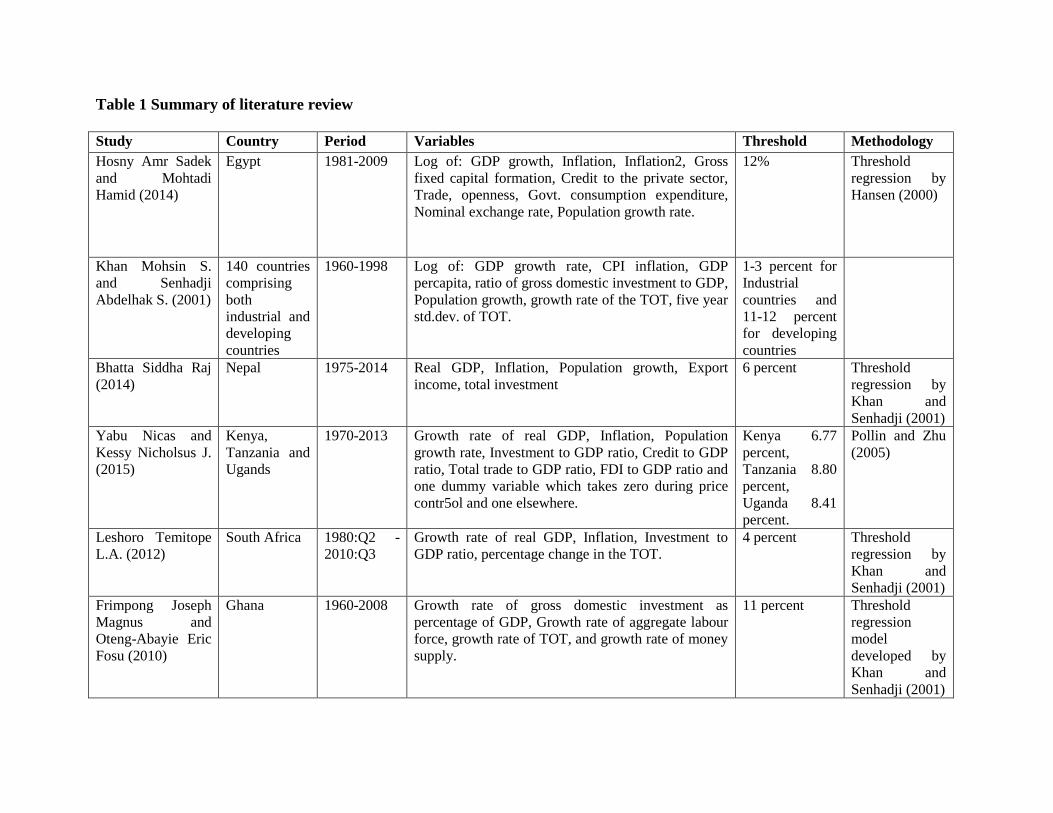
Table 1 Summary of literature review
Study Country Period Variables Threshold Methodology
Hosny Amr Sadek
and Mohtadi
Hamid (2014)
Egypt 1981-2009 Log of: GDP growth, Inflation, Inflation2, Gross
fixed capital formation, Credit to the private sector,
Trade, openness, Govt. consumption expenditure,
Nominal exchange rate, Population growth rate.
12% Threshold
regression by
Hansen (2000)
Khan Mohsin S.
and Senhadji
Abdelhak S. (2001)
140 countries
comprising
both
industrial and
developing
countries
1960-1998 Log of: GDP growth rate, CPI inflation, GDP
percapita, ratio of gross domestic investment to GDP,
Population growth, growth rate of the TOT, five year
std.dev. of TOT.
1-3 percent for
Industrial
countries and
11-12 percent
for developing
countries
Bhatta Siddha Raj
(2014)
Nepal 1975-2014 Real GDP, Inflation, Population growth, Export
income, total investment
6 percent Threshold
regression by
Khan and
Senhadji (2001)
Yabu Nicas and
Kessy Nicholsus J.
(2015)
Kenya,
Tanzania and
Ugands
1970-2013 Growth rate of real GDP, Inflation, Population
growth rate, Investment to GDP ratio, Credit to GDP
ratio, Total trade to GDP ratio, FDI to GDP ratio and
one dummy variable which takes zero during price
contr5ol and one elsewhere.
Kenya 6.77
percent,
Tanzania 8.80
percent,
Uganda 8.41
percent.
Pollin and Zhu
(2005)
Leshoro Temitope
L.A. (2012)
South Africa 1980:Q2 -
2010:Q3
Growth rate of real GDP, Inflation, Investment to
GDP ratio, percentage change in the TOT.
4 percent Threshold
regression by
Khan and
Senhadji (2001)
Frimpong Joseph
Magnus and
Oteng-Abayie Eric
Fosu (2010)
Ghana 1960-2008 Growth rate of gross domestic investment as
percentage of GDP, Growth rate of aggregate labour
force, growth rate of TOT, and growth rate of money
supply.
11 percent Threshold
regression
model
developed by
Khan and
Senhadji (2001)
Study Country Period Variables Threshold Methodology
Mubarik Yasir Ali
(2005)
Pakistan 1973-2000 Growth rate of real GDP, Inflation, Population
growth rate, Investment growth rate.
9 percent Threshold
regression
model
developed by
Khan and
Senhadji (2001)
Fabayo and Ajilore
(2006)
Nigeria 1970-2003 6 percent Threshold
regression by
Khan and
Senhadji (2001)
Kannan and Joshi
(1998)
India 1981/82-
95/96
real GDP growth, total investment to GDP ratio, real
agricultural growth, net terms of trade and WPI
inflation
6 percent Threshold
regression by
Sarel (1997)
Study Country Period Variables Threshold Methodology
RBI (2014) India NA NA 4± 2 percent NA
Bhusal Tara Prasad
and Silpakar
Sajana (2011)
Nepal 1975-2010 Growth rate of GDP, Inflation 6 percent Threshold
regression by
Khan and
Shenhadji
(2001)
Kannan R. and
Joshi Himanshu
(1998)
India 1981/82-
1995/96
Real GDP growth, total investment to GDP ratio, real
agricultural growth, net terms of trade and WPI
inflation.
6 percent Threshold
regression by
Sarel (1997)
Mohanty, Deepak,
Chakraborty, A.
B., Das, Abhiman
and John, Joice
(2011)
India Q1:1996-97
to Q3: 2010-
11
GDP growth and Inflation 4.5-5.5 percent Three different
methods
proposed by
Sarel (1996),
Khan and
Senhadji (2001)
and Espinoza et
al. (2010)
III. EMPIRICAL ESTIMATION OF THRESHOLD INFLATION
This section undertakes the empirical estimation of the threshold inflation in Nepal. First,
based on the theoretical underpinnings of the growth model, an empirical model is postulated.
Second, the model is estimated using the ordinary least squares (OLS) method and recently
developed threshold estimation technique by (Hansen, 2000).
3.1 Model and Estimation Method
The model specification is based on the augmented Solow-Swan growth model (Mankiw et
al. 1992). The model incorporates the human capital, apart from the inputs of labour and
physical capital in the neo-classical growth model (Mankiw, Romer, & Weil, 1992; Spolaore
& Wacziarg, 2013).
In recent times the empirical literature on growth has moved from the ‘proximate’
determinants to ‘deep’ determinants which impact on the resource endowment and
productivity growth (Spolaore & Wacziarg, 2013; Rodrik, 2003). ‘Deep’ determinants of
growth focus on various factors such as : (a) geography; (b) trade integration; and (c)
institutions (Rodrik, 2003). However, due to unavailability of the data on geographic and
institutional variables, I confine the analysis to trade integration only.
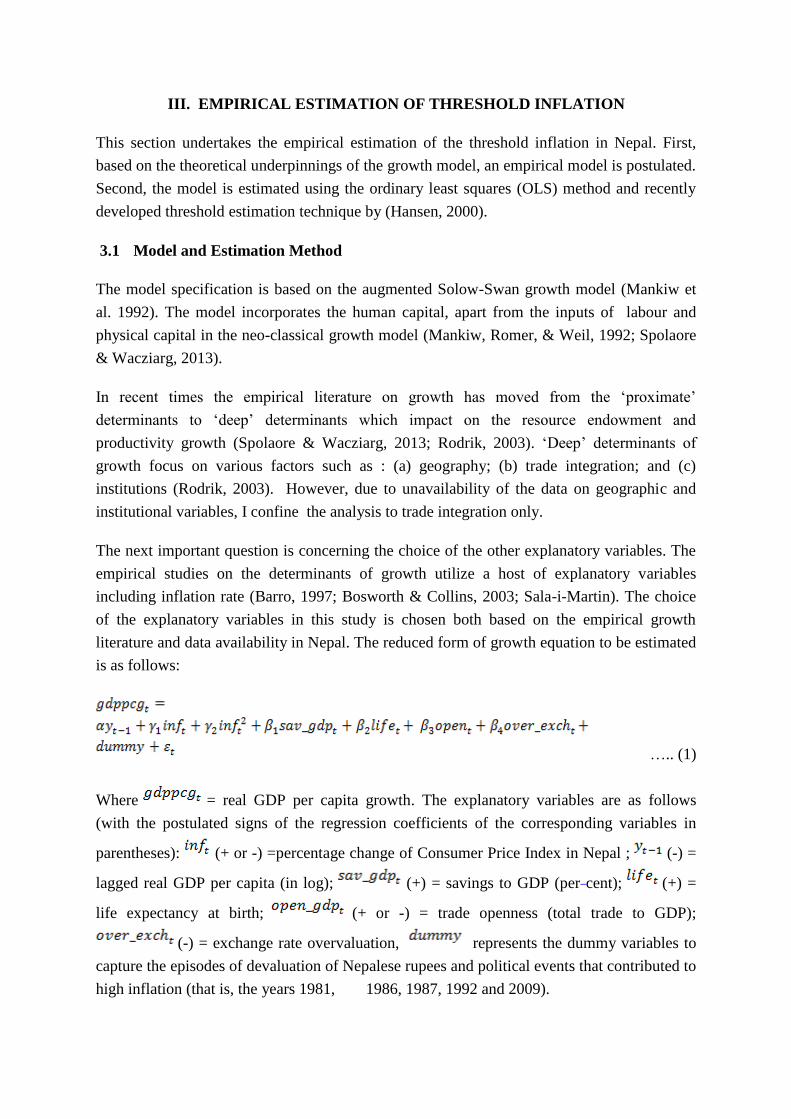
The next important question is concerning the choice of the other explanatory variables. The
empirical studies on the determinants of growth utilize a host of explanatory variables
including inflation rate (Barro, 1997; Bosworth & Collins, 2003; Sala-i-Martin). The choice
of the explanatory variables in this study is chosen both based on the empirical growth
literature and data availability in Nepal. The reduced form of growth equation to be estimated
is as follows:
….. (1)
Where = real GDP per capita growth. The explanatory variables are as follows
(with the postulated signs of the regression coefficients of the corresponding variables in
parentheses): (+ or -) =percentage change of Consumer Price Index in Nepal ; (-) =
lagged real GDP per capita (in log); (+) = savings to GDP (per cent); (+) =
life expectancy at birth; (+ or -) = trade openness (total trade to GDP);
(-) = exchange rate overvaluation, represents the dummy variables to
capture the episodes of devaluation of Nepalese rupees and political events that contributed to
high inflation (that is, the years 1981, 1986, 1987, 1992 and 2009).
Optimal Inflation Rate for Nepal NRBWP39
10
The initial or the lagged level of per capita GDP captures the conditional ‘convergence effect’
or the catch-up effect. The coefficient of initial per capita GDP is expected to be negative
because convergence hypothesis postulates that poorer countries tend to grow faster
compared to richer countries. Another explanatory variable, savings-to-GDP ratio is regarded
as a crucial determinant of growth. According to the seminal Harrod-Domar growth models
increasing the savings rate will increase the growth of output by increasing investment
(Harrod, 1939; Domar, 1946). Moreover, savings attract foreign investors by permitting the
domestic investors for equity participation in the joint venture (Aghion et al. 2009). Trade
openness has also been widely used in the empirical literature as one the determinants growth
as a proxy for trade liberalization. Nepal embarked on a journey to liberalize the economy in
the late 1980s, with major reforms on trade fronts. Consequently, total trade gradually
increased, which helped to spur productivity growth. Similarly, life expectancy captures the
level of human capital.1
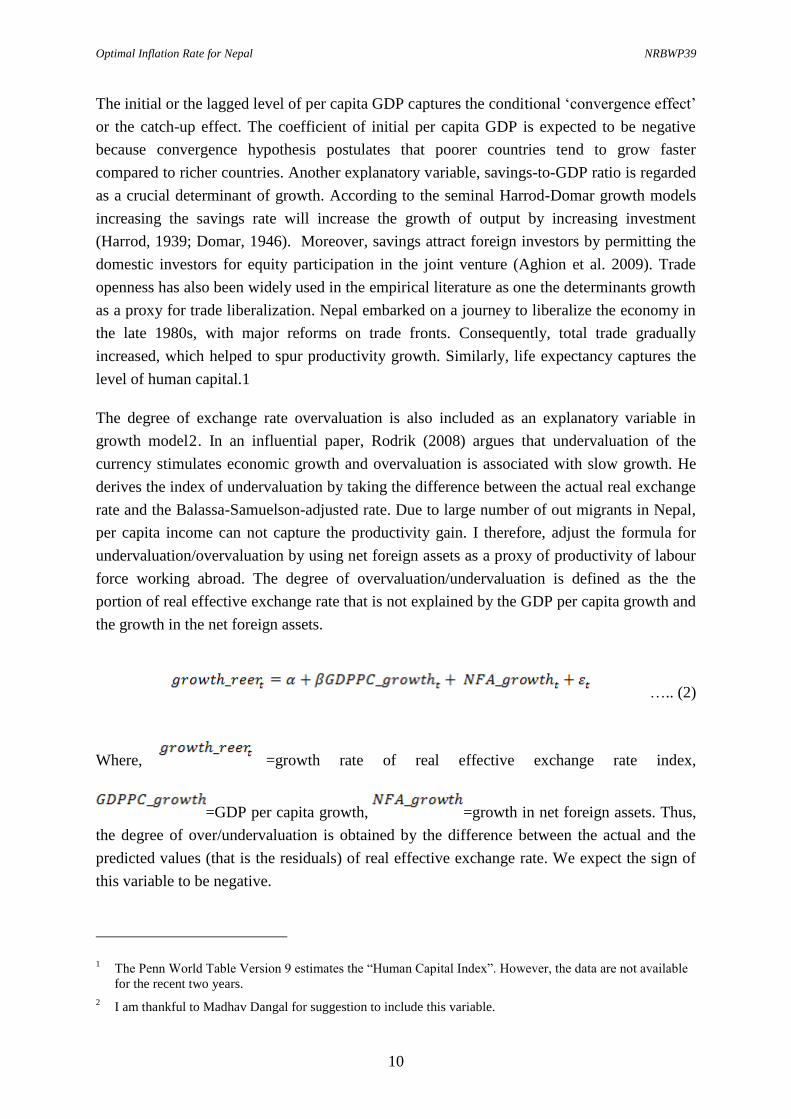
The degree of exchange rate overvaluation is also included as an explanatory variable in
growth model2. In an influential paper, Rodrik (2008) argues that undervaluation of the
currency stimulates economic growth and overvaluation is associated with slow growth. He
derives the index of undervaluation by taking the difference between the actual real exchange
rate and the Balassa-Samuelson-adjusted rate. Due to large number of out migrants in Nepal,
per capita income can not capture the productivity gain. I therefore, adjust the formula for
undervaluation/overvaluation by using net foreign assets as a proxy of productivity of labour
force working abroad. The degree of overvaluation/undervaluation is defined as the the
portion of real effective exchange rate that is not explained by the GDP per capita growth and
the growth in the net foreign assets.
….. (2)
Where, =growth rate of real effective exchange rate index,
=GDP per capita growth, =growth in net foreign assets. Thus,
the degree of over/undervaluation is obtained by the difference between the actual and the
predicted values (that is the residuals) of real effective exchange rate. We expect the sign of
this variable to be negative.
1 The Penn World Table Version 9 estimates the “Human Capital Index”. However, the data are not available
for the recent two years.
2 I am thankful to Madhav Dangal for suggestion to include this variable.
Optimal Inflation Rate for Nepal NRBWP39
11
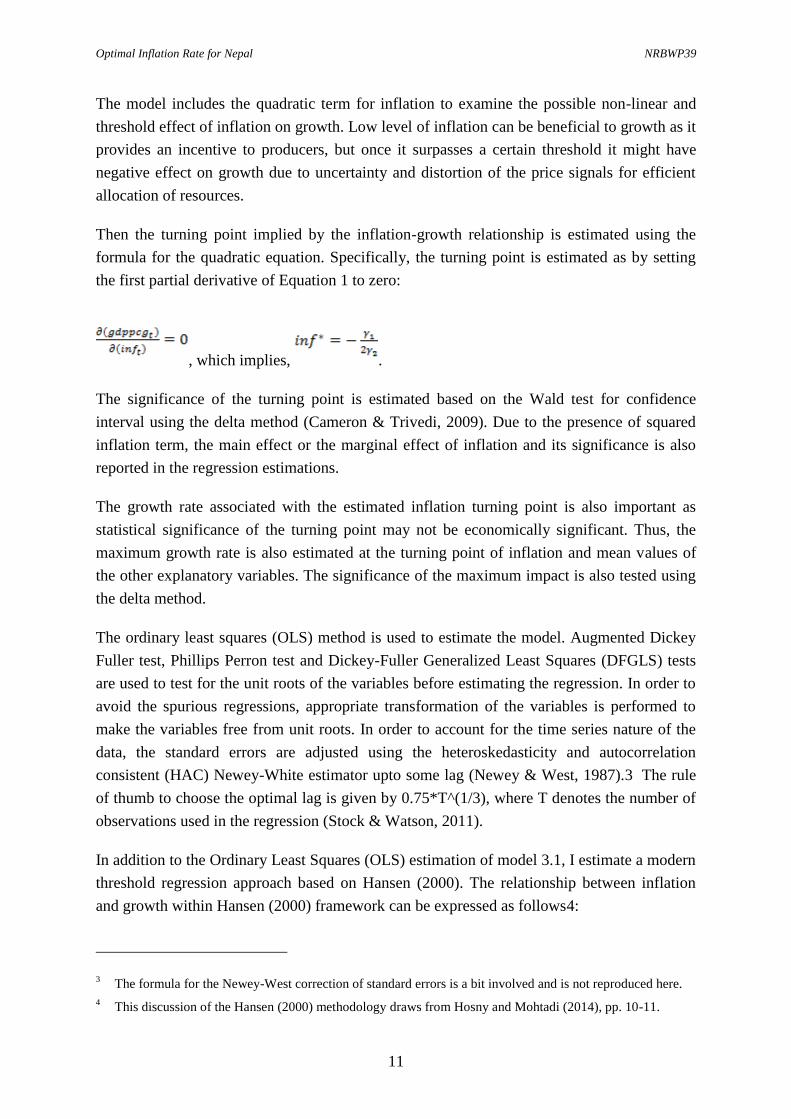
The model includes the quadratic term for inflation to examine the possible non-linear and
threshold effect of inflation on growth. Low level of inflation can be beneficial to growth as it
provides an incentive to producers, but once it surpasses a certain threshold it might have
negative effect on growth due to uncertainty and distortion of the price signals for efficient
allocation of resources.
Then the turning point implied by the inflation-growth relationship is estimated using the
formula for the quadratic equation. Specifically, the turning point is estimated as by setting
the first partial derivative of Equation 1 to zero:
, which implies, .
The significance of the turning point is estimated based on the Wald test for confidence
interval using the delta method (Cameron & Trivedi, 2009). Due to the presence of squared
inflation term, the main effect or the marginal effect of inflation and its significance is also
reported in the regression estimations.
The growth rate associated with the estimated inflation turning point is also important as
statistical significance of the turning point may not be economically significant. Thus, the
maximum growth rate is also estimated at the turning point of inflation and mean values of
the other explanatory variables. The significance of the maximum impact is also tested using
the delta method.
The ordinary least squares (OLS) method is used to estimate the model. Augmented Dickey
Fuller test, Phillips Perron test and Dickey-Fuller Generalized Least Squares (DFGLS) tests
are used to test for the unit roots of the variables before estimating the regression. In order to
avoid the spurious regressions, appropriate transformation of the variables is performed to
make the variables free from unit roots. In order to account for the time series nature of the
data, the standard errors are adjusted using the heteroskedasticity and autocorrelation
consistent (HAC) Newey-White estimator upto some lag (Newey & West, 1987).3 The rule
of thumb to choose the optimal lag is given by 0.75*T^(1/3), where T denotes the number of
observations used in the regression (Stock & Watson, 2011).
In addition to the Ordinary Least Squares (OLS) estimation of model 3.1, I estimate a modern
threshold regression approach based on Hansen (2000). The relationship between inflation
and growth within Hansen (2000) framework can be expressed as follows4:
3 The formula for the Newey-West correction of standard errors is a bit involved and is not reproduced here.
4 This discussion of the Hansen (2000) methodology draws from Hosny and Mohtadi (2014), pp. 10-11.
Optimal Inflation Rate for Nepal NRBWP39
12
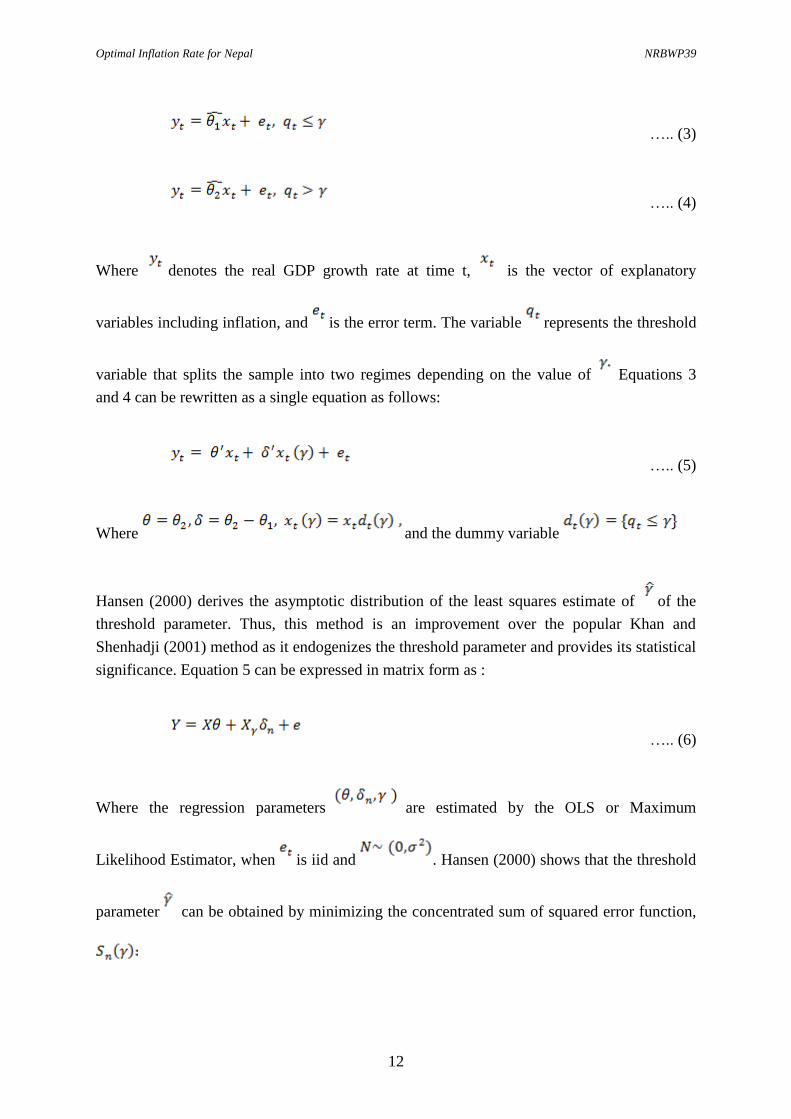
….. (3)
….. (4)
Where denotes the real GDP growth rate at time t, is the vector of explanatory
variables including inflation, and is the error term. The variable represents the threshold
variable that splits the sample into two regimes depending on the value of Equations 3
and 4 can be rewritten as a single equation as follows:
….. (5)
Where and the dummy variable
Hansen (2000) derives the asymptotic distribution of the least squares estimate of of the
threshold parameter. Thus, this method is an improvement over the popular Khan and
Shenhadji (2001) method as it endogenizes the threshold parameter and provides its statistical
significance. Equation 5 can be expressed in matrix form as :
….. (6)
Where the regression parameters are estimated by the OLS or Maximum
Likelihood Estimator, when is iid and . Hansen (2000) shows that the threshold
parameter can be obtained by minimizing the concentrated sum of squared error function,
Optimal Inflation Rate for Nepal NRBWP39
13
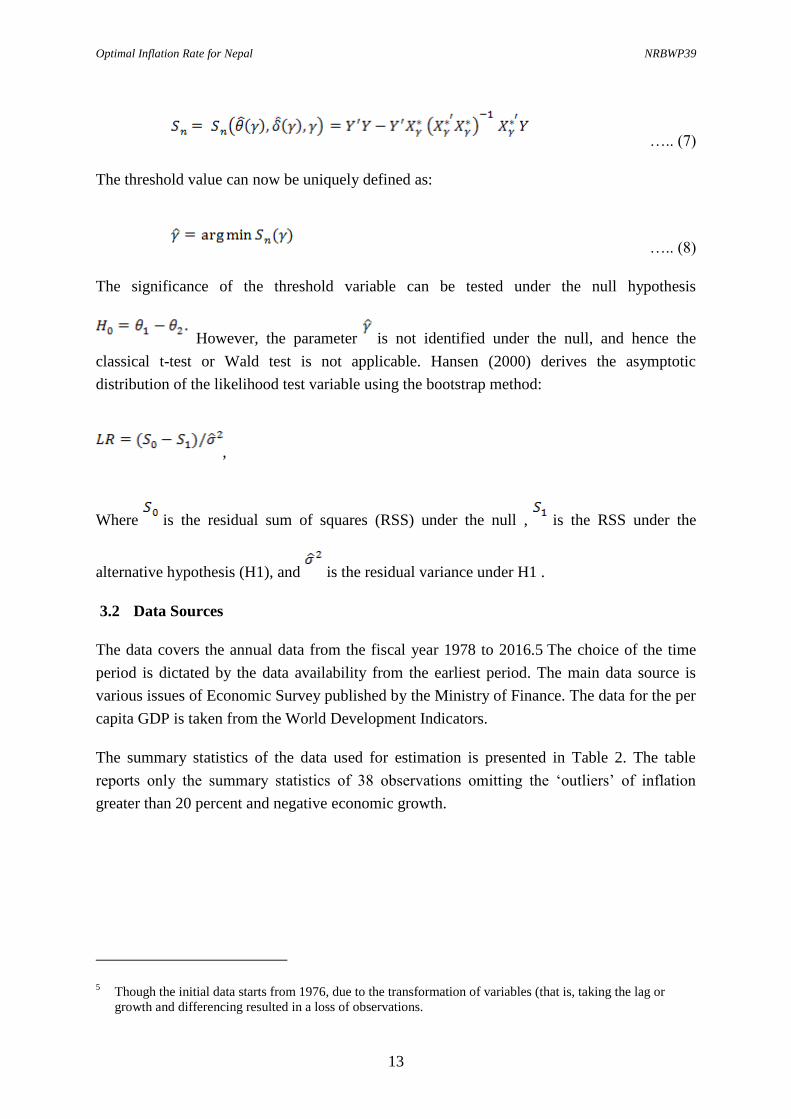
….. (7)
The threshold value can now be uniquely defined as:
….. (8)
The significance of the threshold variable can be tested under the null hypothesis
However, the parameter is not identified under the null, and hence the
classical t-test or Wald test is not applicable. Hansen (2000) derives the asymptotic
distribution of the likelihood test variable using the bootstrap method:
,
Where is the residual sum of squares (RSS) under the null , is the RSS under the
alternative hypothesis (H1), and is the residual variance under H1 .
3.2 Data Sources
The data covers the annual data from the fiscal year 1978 to 2016.5 The choice of the time
period is dictated by the data availability from the earliest period. The main data source is
various issues of Economic Survey published by the Ministry of Finance. The data for the per
capita GDP is taken from the World Development Indicators.
The summary statistics of the data used for estimation is presented in Table 2. The table
reports only the summary statistics of 38 observations omitting the ‘outliers’ of inflation
greater than 20 percent and negative economic growth.
5 Though the initial data starts from 1976, due to the transformation of variables (that is, taking the lag or
growth and differencing resulted in a loss of observations.
Optimal Inflation Rate for Nepal NRBWP39
14
Table 1: Summary statistics
VARIABLES Mean
Standard
Deviation Minimum Maximum
Real GDP growth 4.292 2.398 -1.500 10
Inflation 8.846 3.820 2.400 21.10
Life expectancy 59.09 8.048 45.20 70.70
Trade/GDP growth (in %) 1.784 7.198 -18.50 18.23
Saving/GDP growth(in %) -0.730 20.75 -45.20 53.06
Exchange rate overvaluation 0 10.77 -32.32 23.62
Difference of lagged log per capita
GDP 0.0494 0.0722 -0.169 0.208
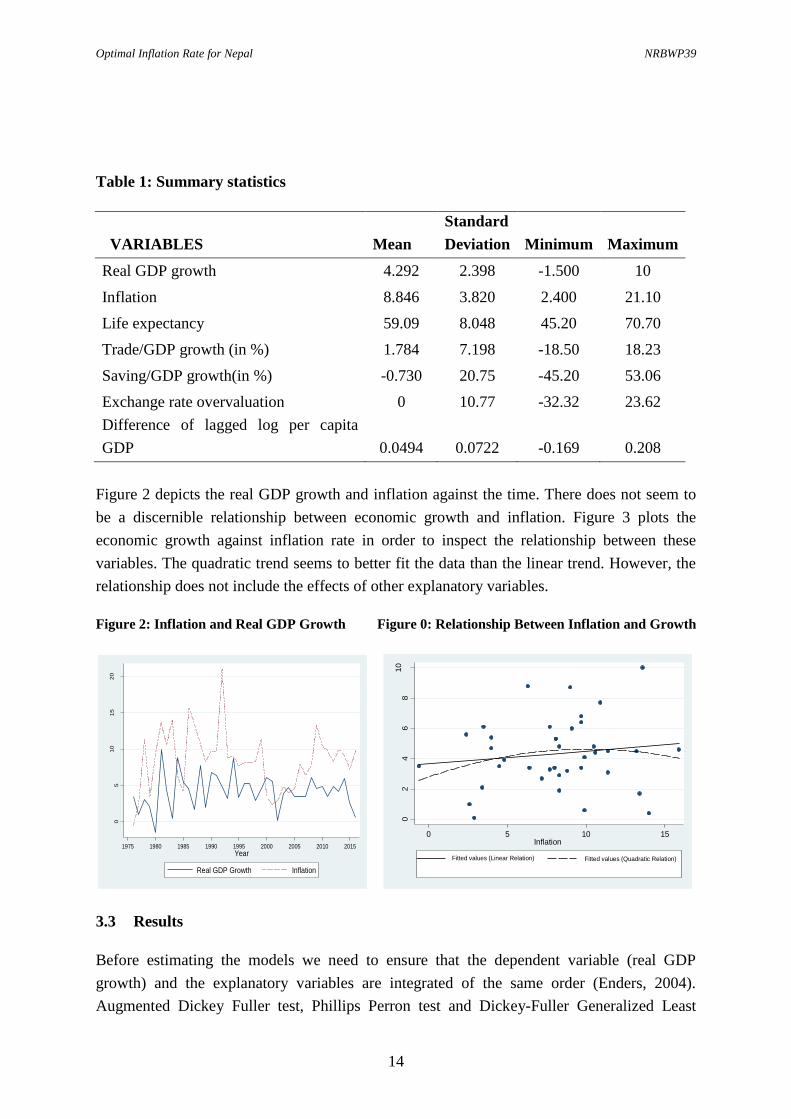
Figure 2 depicts the real GDP growth and inflation against the time. There does not seem to
be a discernible relationship between economic growth and inflation. Figure 3 plots the
economic growth against inflation rate in order to inspect the relationship between these
variables. The quadratic trend seems to better fit the data than the linear trend. However, the
relationship does not include the effects of other explanatory variables.
Figure 2: Inflation and Real GDP Growth Figure 0: Relationship Between Inflation and Growth
05
20
10
15
In p
erc
ent
1975 1980 1985 1990 1995 2000 2005 2010 2015
Year
Real GDP Growth Inflation
02
46
810
Re
al G
DP
Gro
wth
0 5 10 15Inflation
Fitted values (Linear Relation) Fitted values (Quadratic Relation)
3.3 Results
Before estimating the models we need to ensure that the dependent variable (real GDP
growth) and the explanatory variables are integrated of the same order (Enders, 2004).
Augmented Dickey Fuller test, Phillips Perron test and Dickey-Fuller Generalized Least
Optimal Inflation Rate for Nepal NRBWP39
15
Squares (DFGLS) tests are used to test for the unit roots of the variables. The tests reveal that
the inflation variable is stationary while other variables are non-stationary. Since, the
dependent variable is stationary, all the non-stationary variables are converted into growth
form to ensure that all variables are stationary. The latter transformation possibly results into
the loss of information and renders the interpretation of the regression coefficients of those
variables a bit difficult. However, since our main interest is the estimation of quadratic
inflation-growth relationship, this transformation is unlikely to affect our results.
The OLS estimations of the model 3.1 are reported in Table 3. The first column of the Table
3.2 shows that there is no statistically significant relationship between inflation and growth
when we have a basic set of conditioning variables.
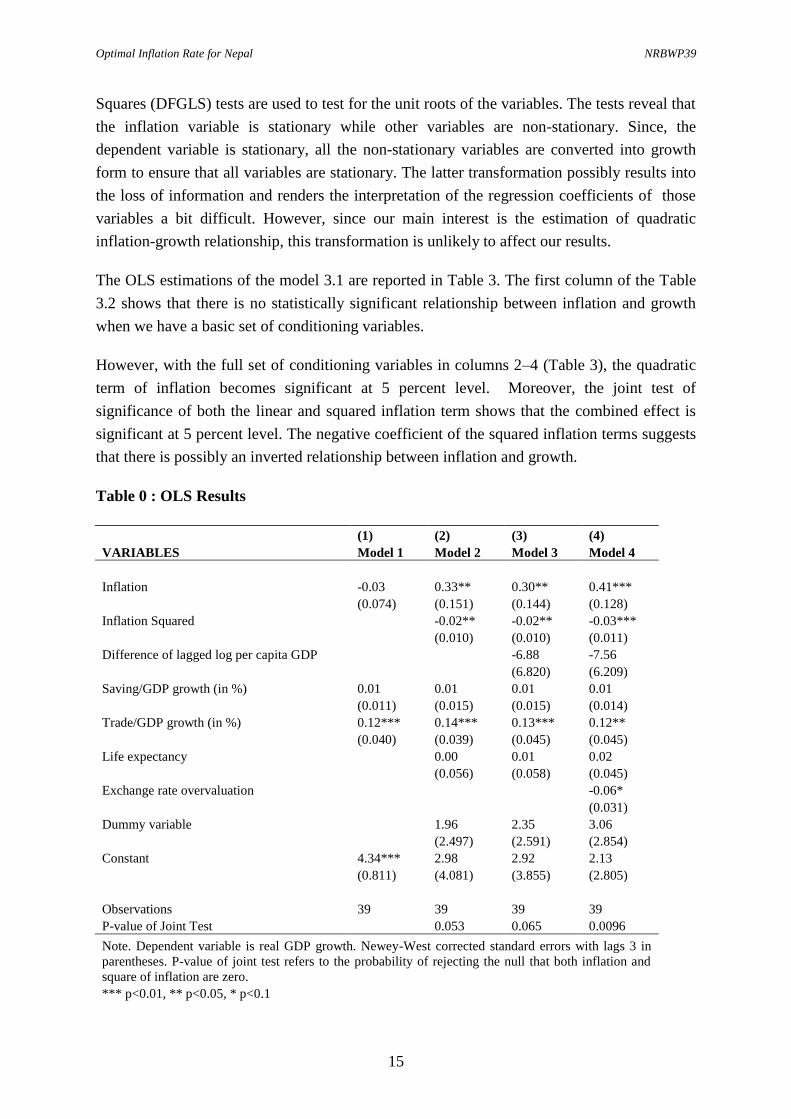
However, with the full set of conditioning variables in columns 2–4 (Table 3), the quadratic
term of inflation becomes significant at 5 percent level. Moreover, the joint test of
significance of both the linear and squared inflation term shows that the combined effect is
significant at 5 percent level. The negative coefficient of the squared inflation terms suggests
that there is possibly an inverted relationship between inflation and growth.
Table 0 : OLS Results
(1) (2) (3) (4)
VARIABLES Model 1 Model 2 Model 3 Model 4
Inflation -0.03 0.33** 0.30** 0.41***
(0.074) (0.151) (0.144) (0.128)
Inflation Squared
-0.02** -0.02** -0.03***
(0.010) (0.010) (0.011)
Difference of lagged log per capita GDP
-6.88 -7.56
(6.820) (6.209)
Saving/GDP growth (in %) 0.01 0.01 0.01 0.01
(0.011) (0.015) (0.015) (0.014)
Trade/GDP growth (in %) 0.12*** 0.14*** 0.13*** 0.12**
(0.040) (0.039) (0.045) (0.045)
Life expectancy
0.00 0.01 0.02
(0.056) (0.058) (0.045)
Exchange rate overvaluation
-0.06*
(0.031)
Dummy variable
1.96 2.35 3.06
(2.497) (2.591) (2.854)
Constant 4.34*** 2.98 2.92 2.13
(0.811) (4.081) (3.855) (2.805)
Observations 39 39 39 39
P-value of Joint Test 0.053 0.065 0.0096
Note. Dependent variable is real GDP growth. Newey-West corrected standard errors with lags 3 in
parentheses. P-value of joint test refers to the probability of rejecting the null that both inflation and
square of inflation are zero.
*** p<0.01, ** p<0.05, * p<0.1
Optimal Inflation Rate for Nepal NRBWP39
16
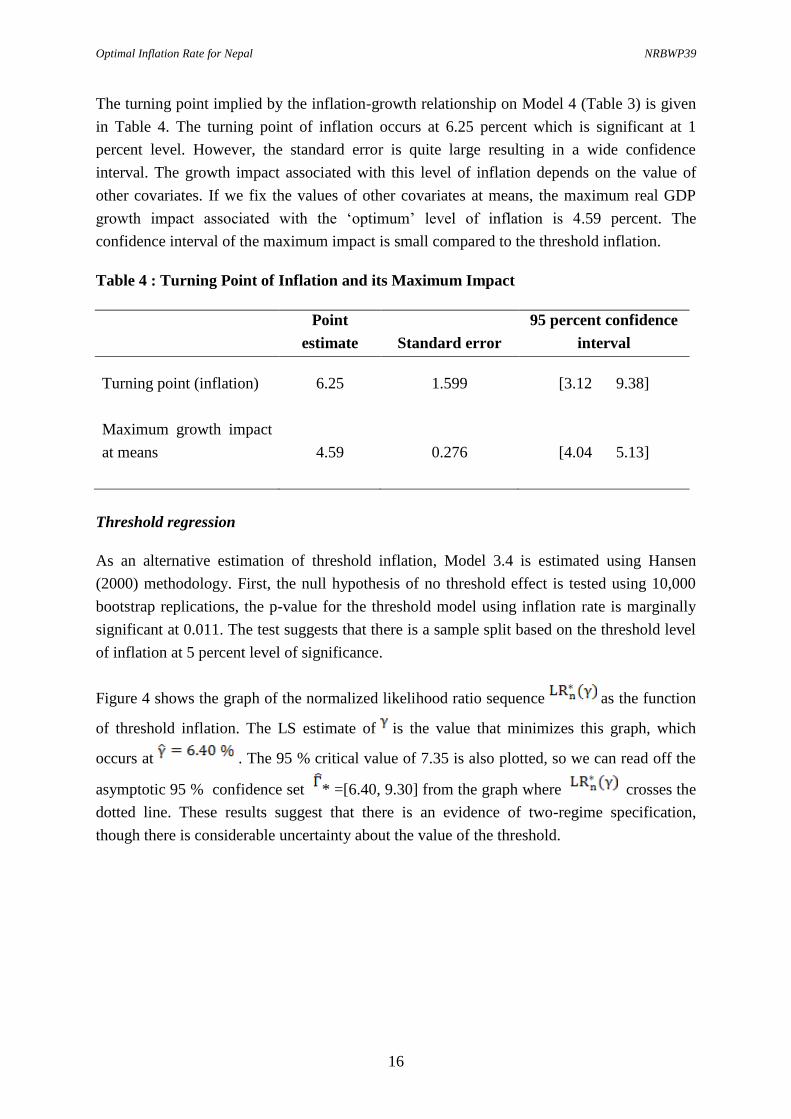
The turning point implied by the inflation-growth relationship on Model 4 (Table 3) is given
in Table 4. The turning point of inflation occurs at 6.25 percent which is significant at 1
percent level. However, the standard error is quite large resulting in a wide confidence
interval. The growth impact associated with this level of inflation depends on the value of
other covariates. If we fix the values of other covariates at means, the maximum real GDP
growth impact associated with the ‘optimum’ level of inflation is 4.59 percent. The
confidence interval of the maximum impact is small compared to the threshold inflation.
Table 4 : Turning Point of Inflation and its Maximum Impact
Point
estimate Standard error
95 percent confidence
interval
Turning point (inflation) 6.25 1.599 [3.12 9.38]
Maximum growth impact
at means 4.59 0.276 [4.04 5.13]
Threshold regression
As an alternative estimation of threshold inflation, Model 3.4 is estimated using Hansen
(2000) methodology. First, the null hypothesis of no threshold effect is tested using 10,000
bootstrap replications, the p-value for the threshold model using inflation rate is marginally
significant at 0.011. The test suggests that there is a sample split based on the threshold level
of inflation at 5 percent level of significance.
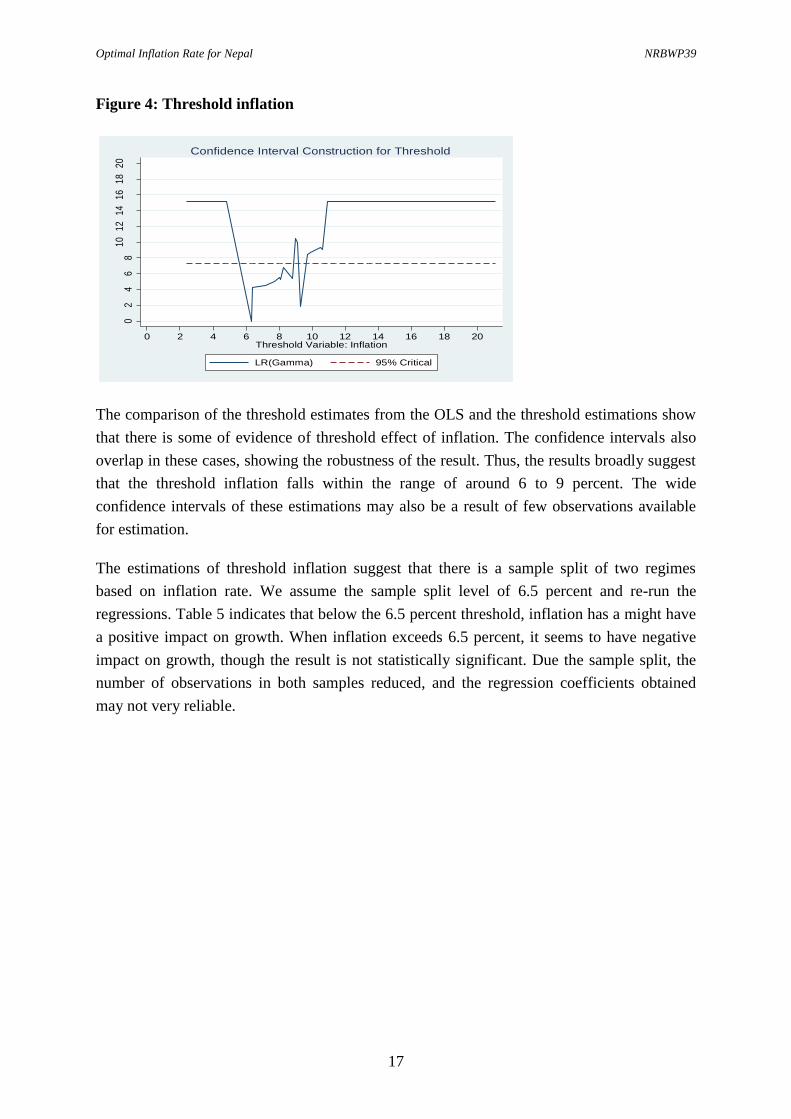
Figure 4 shows the graph of the normalized likelihood ratio sequence as the function
of threshold inflation. The LS estimate of is the value that minimizes this graph, which
occurs at . The 95 % critical value of 7.35 is also plotted, so we can read off the
asymptotic 95 % confidence set * =[6.40, 9.30] from the graph where crosses the
dotted line. These results suggest that there is an evidence of two-regime specification,
though there is considerable uncertainty about the value of the threshold.
Optimal Inflation Rate for Nepal NRBWP39
17
Figure 4: Threshold inflation
02
46
810
1214
1618
20
Like
lihoo
d R
atio
Se
quen
ce in
Gam
ma
0 2 4 6 8 10 12 14 16 18 20Threshold Variable: Inflation
LR(Gamma) 95% Critical
Confidence Interval Construction for Threshold
The comparison of the threshold estimates from the OLS and the threshold estimations show
that there is some of evidence of threshold effect of inflation. The confidence intervals also
overlap in these cases, showing the robustness of the result. Thus, the results broadly suggest
that the threshold inflation falls within the range of around 6 to 9 percent. The wide
confidence intervals of these estimations may also be a result of few observations available
for estimation.
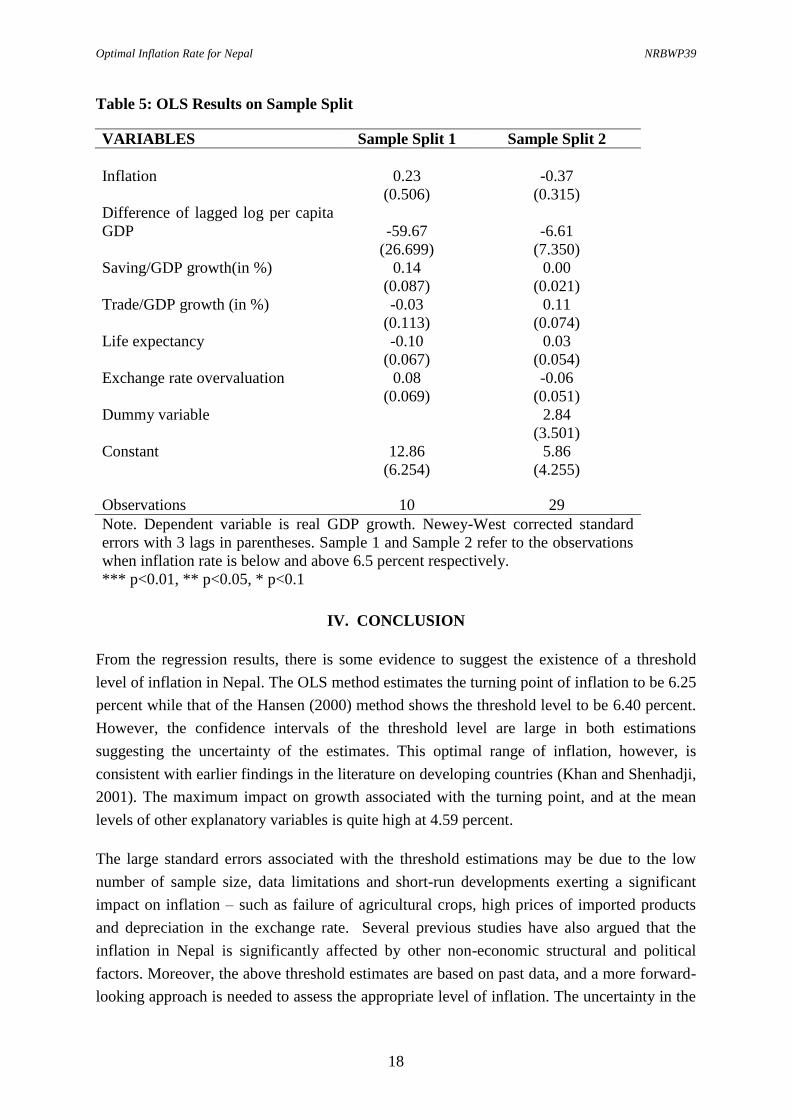
The estimations of threshold inflation suggest that there is a sample split of two regimes
based on inflation rate. We assume the sample split level of 6.5 percent and re-run the
regressions. Table 5 indicates that below the 6.5 percent threshold, inflation has a might have
a positive impact on growth. When inflation exceeds 6.5 percent, it seems to have negative
impact on growth, though the result is not statistically significant. Due the sample split, the
number of observations in both samples reduced, and the regression coefficients obtained
may not very reliable.
Optimal Inflation Rate for Nepal NRBWP39
18
Table 5: OLS Results on Sample Split
VARIABLES Sample Split 1 Sample Split 2
Inflation 0.23 -0.37
(0.506) (0.315)
Difference of lagged log per capita
GDP -59.67 -6.61
(26.699) (7.350)
Saving/GDP growth(in %) 0.14 0.00
(0.087) (0.021)
Trade/GDP growth (in %) -0.03 0.11
(0.113) (0.074)
Life expectancy -0.10 0.03
(0.067) (0.054)
Exchange rate overvaluation 0.08 -0.06
(0.069) (0.051)
Dummy variable
2.84
(3.501)
Constant 12.86 5.86
(6.254) (4.255)
Observations 10 29
Note. Dependent variable is real GDP growth. Newey-West corrected standard
errors with 3 lags in parentheses. Sample 1 and Sample 2 refer to the observations
when inflation rate is below and above 6.5 percent respectively.
*** p<0.01, ** p<0.05, * p<0.1
IV. CONCLUSION
From the regression results, there is some evidence to suggest the existence of a threshold
level of inflation in Nepal. The OLS method estimates the turning point of inflation to be 6.25
percent while that of the Hansen (2000) method shows the threshold level to be 6.40 percent.
However, the confidence intervals of the threshold level are large in both estimations
suggesting the uncertainty of the estimates. This optimal range of inflation, however, is
consistent with earlier findings in the literature on developing countries (Khan and Shenhadji,
2001). The maximum impact on growth associated with the turning point, and at the mean
levels of other explanatory variables is quite high at 4.59 percent.
The large standard errors associated with the threshold estimations may be due to the low
number of sample size, data limitations and short-run developments exerting a significant
impact on inflation – such as failure of agricultural crops, high prices of imported products
and depreciation in the exchange rate. Several previous studies have also argued that the
inflation in Nepal is significantly affected by other non-economic structural and political
factors. Moreover, the above threshold estimates are based on past data, and a more forward-
looking approach is needed to assess the appropriate level of inflation. The uncertainty in the
Optimal Inflation Rate for Nepal NRBWP39
19
level of threshold level of inflation also suggests that it is better to adopt a ‘target’ range or
band of inflation instead of point estimate in Nepal. A range also enhances transparency and
predictability in the monetary policy by signaling the maximum tolerance levels of monetary
policy to accommodate unanticipated shocks (RBI, 2014).
Given the pegged exchange rate regime and about two-third of total trade with India, Nepal’s
inflation is mostly influenced by India. Thus, the sustainability of the peg crucially depends
on maintaining the inflation close to that of India to prevent the misalignment of exchange
rate. The average annual inflation differential of Nepal with India since 1976 has been around
1.5 percent. With the adoption of flexible inflation targeting by Reserve Bank of India,
inflation has come down significantly in India, and the RBI has committed to target the
inflation level to 4 percent with +/- 2 percent band. Thus, Nepal should also adopt an inflation
target range around the computed optimal inflation rate to lower the inflation expectation and
enhance economic growth.
Optimal Inflation Rate for Nepal NRBWP39
20
REFERENCES
Anand, R., Prasad, E., & Zhang, B. (2015). What Measure of Inflation Should a Developing
Country Central Bank Target? IMF Working Paper, WP/15/205, 1-37.
Aghion, P., Comin, D., Howitt, P., & Tecu, I. (2009). When Does Domestic Saving Matter
for Economic Growth. Harvard Business School, Working Paper 09-080.
Barro, R. (1997). Determinants of Economic Growth: A Cross-Country Empirical Study.
Massachusetts Institute of Technology.
Bhatta, S. R. (2015). Optimal Rate of Inflation for Nepal: An Empirical Investigation. 2nd
International Conference on Economics and Finance. Kathmandu.
Bhushal, T. P., & Silpakar, S. (2011). Growth and Inflation: Estimation of Threshold Point
for Nepal. Economic Journal of Development Issues, 13 & 14(1-2).
Billi, R. M., & Kahn, G. A. (2008). What Is the Optimal Inflation Rate? Economic Review,
Federal Reserve of Kansas, 1-28.
Bosworth, B., & Collins, S. (2003). The Empirics of Growth: An Update. Brookings
Institution.
Cameron, A., & Trivedi, P. K. (2009). Microeconometrics Using Stata. Stata Press.
Domar, E. (1946). Capital Expansion, Rate of Growth, and Employment. Econometrica,
14(2), 137-147.
Drukker, D., Gomis-Porqueras, P., & Hernandez-Verme, P. (n.d.). Threshold Effects in the
Relationship Between Inflation and Growth: A New Panel-Data Approach.
Enders, W. (2004). Applied Econometric Time Series. New Delhi: Joh Wiley & Sons.
Fabayo, J. A., & Ajilore, O. T. (2006). Inflation: How Much is Too Much for Economic
Growth in Nigeria. Indian Economic Review, XXXXI(2), 129-147.
Fisher, S. (1993). Inflation and Growth. National Bureau of Economic Research Working
Paper No. 1235.
Gillman, M., Harris, M., & Matyas, L. (2001). Inflation and Growth: Some Theory and
Evidence. Central European University Working Paper N0. 1/2001.
Ginting, E. (2007). Is Inflation in India an Attractor of Inflation in Nepal. IMF Working
Paper, WP/06/279.
Gordon, R. (1997). The Time Varying NAIRU and Its Implications for Economic Policy.
Journal of Economic Perspectives, 11, 11–32.
Hansen, B. E. (2000). Sample Splitting and Threshold Estimation. Econometrica, 68(3), 575-
603.
Harrod, R. (1939). An Essay in Dynamic Theory. The Economic Journal, 49(193), 14-33.
Optimal Inflation Rate for Nepal NRBWP39
21
Huybens, E., & Smith, B. D. (1998). Financial Markets Frictions, Monetary Policy, and
Capital Accumulation in a Small Open Economy. Journal of Economic Theory, 81, 353–
400.
International Monetary Fund. (2011). Nepal: Selected Issues. Washington, D.C.: International
Monetary Fund.
Li, Min. (2006). Inflation and Economic Growth: Threshold Effects and Transmission
Mechanism. Alberta: Department of Economics, University of Alberta.
Mankiw, N., Romer, D., & Weil, D. (1992). A Contribution to the Empirics of Economic
Growth. Quaterly Journal of Economics, 407–437.
Nepal Rastra Bank. (2007). Inflation in Nepal. Kathmandu: Nepal Rastra Bank.
Newey, W., & West, K. (1987). A Simple, Positive Semi-Definite, Heteroskedasticity and
autocorrelation consistent Covariance Matrix. Econometrica, 703-708.
Reserve Bank of India. (2014). Report of the Expert Committee to Revise and Strengthen the
Monetary Policy Framework. Mumbai: Reserve Bank of India.
Rodrik, D. (2003). In Search of Prosperity: Analytical Narratives on Economic Growth.
Princeton, NJ: Princeton University Press.
Rodrik, D. (2008). The Real Exchange Rate and Economic Growth. Brookings Papers on
Economic Activity, 365-412.
Sala-i-Martin, X. (n.d.). I Just Ran Two Million Regressions. The American Economic
Review, 178-83.
Sidrauski, M. (1967). Rational Choice and Patterns of Growth in a Monetary Economy.
American Economic Review, 57, 534–544.
Spolaore, E., & Wacziarg, R. (2013). How deep are the roots of economic development?
Journal of Economic Literature, 51(2), 325–369.
Stock, J., & Watson, M. (2011). Introductory Econometrics. Pearson Education.
Stockman, A. C. (1981). Anticipated Inflation and the Capital Stock in a Cash-in-Advance
Economy. Journal of Monetary Economics, 8, 987–393.
Tobin, J. (1965). Money and Economic Growth. Econometrica, 8, 671–684.
Yabu, N., & Kessy, N. J. (2015). Appropriate Threshold Level of Inflation for Economic
Growth: Evidence from the Three Founding EAC Countries. Applied Economics and
Finance, 2(3), 127-144.