Embed Size (px)
Citation preview
OPTIMIZATION OF RECOVERY AND ANALYSIS OF TOUCH DNA
FROM SPENT CARTRIDGE CASINGS
By
Ashley Marie Mottar
A THESIS
Submitted to
Michigan State University
in partial fulfillment of the requirements
for the degree of
Criminal Justice—Master of Science
2014
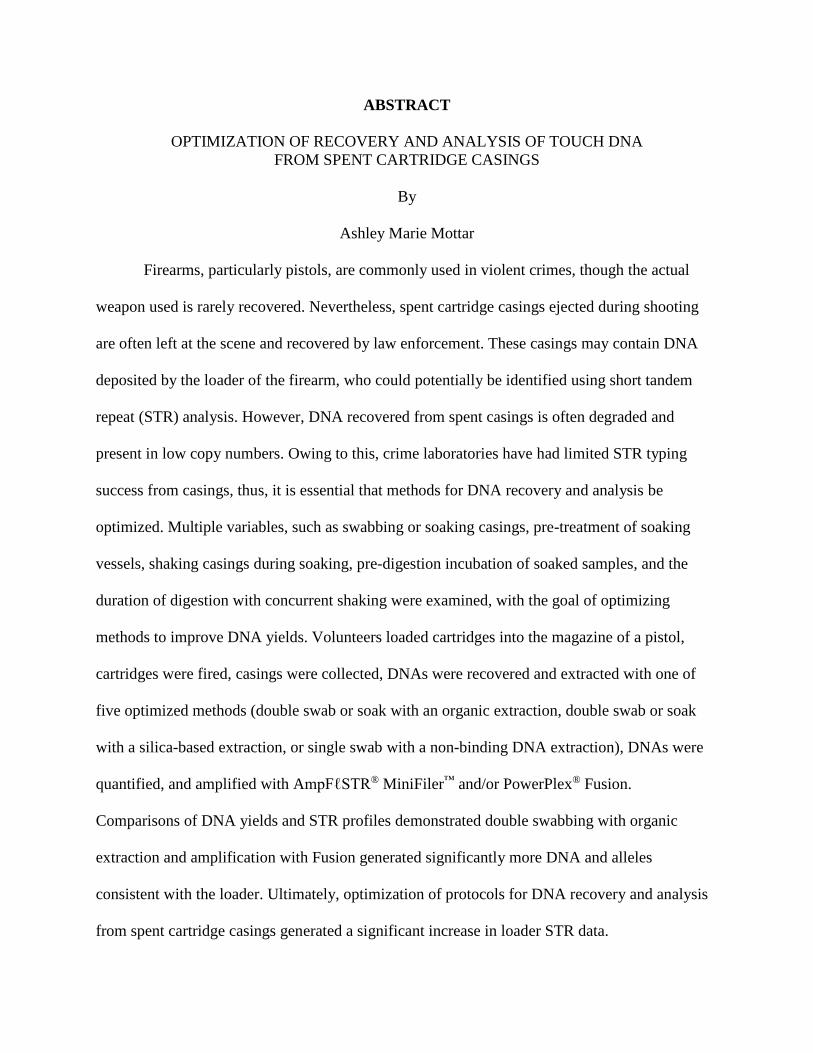
ABSTRACT
OPTIMIZATION OF RECOVERY AND ANALYSIS OF TOUCH DNA
FROM SPENT CARTRIDGE CASINGS
By
Ashley Marie Mottar
Firearms, particularly pistols, are commonly used in violent crimes, though the actual
weapon used is rarely recovered. Nevertheless, spent cartridge casings ejected during shooting
are often left at the scene and recovered by law enforcement. These casings may contain DNA
deposited by the loader of the firearm, who could potentially be identified using short tandem
repeat (STR) analysis. However, DNA recovered from spent casings is often degraded and
present in low copy numbers. Owing to this, crime laboratories have had limited STR typing
success from casings, thus, it is essential that methods for DNA recovery and analysis be
optimized. Multiple variables, such as swabbing or soaking casings, pre-treatment of soaking
vessels, shaking casings during soaking, pre-digestion incubation of soaked samples, and the
duration of digestion with concurrent shaking were examined, with the goal of optimizing
methods to improve DNA yields. Volunteers loaded cartridges into the magazine of a pistol,
cartridges were fired, casings were collected, DNAs were recovered and extracted with one of
five optimized methods (double swab or soak with an organic extraction, double swab or soak
with a silica-based extraction, or single swab with a non-binding DNA extraction), DNAs were
quantified, and amplified with AmpFℓSTR® MiniFiler™ and/or PowerPlex® Fusion.
Comparisons of DNA yields and STR profiles demonstrated double swabbing with organic
extraction and amplification with Fusion generated significantly more DNA and alleles
consistent with the loader. Ultimately, optimization of protocols for DNA recovery and analysis
from spent cartridge casings generated a significant increase in loader STR data.

Copyright by
ASHLEY MARIE MOTTAR
2014

iii
ACKNOWLEDGEMENTS
I would like to start by thanking my advisor, Dr. David Foran, for all of his guidance and
support throughout my graduate career at Michigan State University. I appreciate the
opportunities and experiences he has provided, which have prepared me for a successful
professional career. I would also like to thank Dr. Brian Hunter and Dr. Christopher Smith for
serving on my committee and taking the time to provide insightful suggestions and comments on
my thesis work. A portion of this project was supported by grant number 2013-DN-BX-K039,
awarded by the National Institute of Justice, the Office of Justice Programs, and the U.S.
Department of Justice. Points of view in this document are mine and do not necessarily represent
the official position or policies of the U.S. Department of Justice. Additional funding was
provided by the Michigan State University (MSU) Graduate School and the MSU Forensic
Science Program. A special thanks goes to everyone involved with the Jan S. Bashinski
Criminalistics Graduate Thesis Grant for providing me with the monetary support to perform my
research and present those findings at the American Academy of Forensic Sciences Annual
Meeting. I would also like to thank MSU Deputy Chief Dave Trexler for providing ammunition,
along with F/Lt. Gary Daniels and Marie Bard-Curtis with the Michigan State Police (MSP)
Forensic Laboratory in Lansing, MI, Todd Graf, and Dr. Brian Hunter for providing locations to
shoot and collect casings. Further, this research would not have been possible without the
generosity of several volunteers who loaded cartridges, especially the firearms unit at the MSP
Lansing Forensic Science Laboratory. They took time out of their day to recruit volunteers and
fire several rounds of ammunition. I would like to thank Brianne Kiley and Carrie Jackson for
developing the assay used to quantify the DNAs in this study. In addition, many thanks to Dr.

iv
Renate Snider and my fellow classmates from NSC 840 for their edits and input. I would like to
acknowledge Rebecca Ray and Timothy Antinick for their assistance during casing collections.
Thank you to the current students and graduates of the MSU Forensic Biology Laboratory—Mac
Hopkins, Ashley Doran, Ellen Jesmok, Michelle Metchikian, Lisa Hebda, Sarah Rambadt, and
Amanda Fazi—for their suggestions and assistance with this research and writing. Lastly, I am
extremely grateful for the loving support, patience, and encouragement that my family and
friends have provided throughout my experience at MSU.
v
TABLE OF CONTENTS
LIST OF TABLES ........................................................................................................................ vii
LIST OF FIGURES .................................................................................................................... xvii
INTRODUCTION .......................................................................................................................... 1
Composition of a Cartridge and Ejection of Cartridge Casings ......................................................1
Class Characteristics: Identifying a Type of Firearm ......................................................................3
Individual Characteristics: Identifying a Specific Firearm ..............................................................3
Fingerprints: Identifying the Loader of a Firearm ...........................................................................5
Touch DNA: Identifying the Loader of a Firearm ...........................................................................7
Techniques for DNA Extraction ......................................................................................................8
Real-Time PCR: Targeting Loci for DNA Quantification ............................................................10
STR Analysis: Identifying Individuals ..........................................................................................13
Previous Studies on DNA Recovered from Spent Casings ...........................................................17
Goals of This Study .......................................................................................................................20
MATERIALS AND METHODS .................................................................................................. 22
Methods for Cell Recovery ............................................................................................................22
Swabbing Cartridge Casings ................................................................................................. 22
Soaking Cartridge Casings .................................................................................................... 23
Methods for DNA Extraction.........................................................................................................24
Organic Extraction ................................................................................................................. 24
QIAamp® DNA Investigator Extraction ................................................................................ 25
Fingerprint DNA Finder® Extraction ..................................................................................... 25
DNA Quantification via Real-Time PCR Analysis .......................................................................25
STR Amplification .........................................................................................................................27
Capillary Electrophoresis ...............................................................................................................28
Optimization of Cell Recovery and DNA Extraction ....................................................................29
Decontamination of Transfer Pipette Bulbs .......................................................................... 29
Pre-digestion Treatments Investigated Within the Soaking Method ..................................... 30
Digestion Optimization.......................................................................................................... 31
Comparison of Optimized Cell Recovery and DNA Extraction Methods .....................................31
Obtaining Ammunition and Testing for Foreign DNA on Live Cartridges .......................... 31
Loading Cartridges ................................................................................................................ 32
Collection of Spent Cartridge Casings .................................................................................. 32
Optimized Method for Soaking Cartridge Casings ............................................................... 34
Comparison of DNA Yields .................................................................................................. 34
Comparison of STR Profiles.................................................................................................. 35
RESULTS ..................................................................................................................................... 37
Optimization of Cell Recovery and DNA Extraction Methods .....................................................37
Decontamination of Transfer Pipette Bulbs .......................................................................... 37
Pre-treatment of Transfer Pipette Bulbs with Yeast rRNA ................................................... 38
vi
Shaking Casings During Soak Period .................................................................................... 39
Pre-digestion Incubation at 85°C ........................................................................................... 40
Optimal Digestion Time ........................................................................................................ 41
Shaking Swabs During Digestion .......................................................................................... 42
Comparisons of Optimized Cell Recovery and DNA Extraction Methods ...................................43
Comparisons of DNA Yields ................................................................................................. 43
Comparison of MiniFiler™ and Fusion STR Profiles ............................................................ 45
Comparisons of Individual and Consensus Fusion STR Profiles .......................................... 48
Degradation of DNA Recovered from Spent Cartridge Casings ........................................... 54
DISCUSSION ............................................................................................................................... 56
APPENDICES .............................................................................................................................. 72
APPENDIX A. ASSIGNMENT OF CELL RECOVERY AND DNA EXTRACTION
METHODS TO SPENT CARTRIDGE CASINGS .......................................................................73
APPENDIX B. DNA QUANTITIES FROM SPENT CASINGS ASSAYED WITH
OPTIMIZED CELL RECOVERY AND DNA EXTRACTION METHODS, , , ..........................84
APPENDIX C. COMPARISON OF AMFℓSTR® MINIFILER™ STR PROFILES AND
POWERPLEX® FUSION STR PROFILES ..................................................................................98
APPENDIX D. ANALYSIS OF LOADER AND NON-LOADER ALLELES IN STR
PROFILES AMPLIFIED WITH AMPFℓSTR® MINIFILER™ AND POWERPLEX®
FUSION .......................................................................................................................................121
APPENDIX E. POWERPLEX® FUSION STR PROFILES, ......................................................149
APPENDIX F. CONSENSUS POWERPLEX® FUSION STR PROFILES ...............................208
REFERENCES ........................................................................................................................... 236
vii
LIST OF TABLES
Table 1. Comparison of the AmpFℓSTR® MiniFiler™ and the PowerPlex® Fusion (Life
Technologies, 2014; Promega, 2014). .......................................................................................... 16
Table 2. Primer, probe, and IPC template sequences for rtPCR. HEX and 6FAM fluorescent
dyes were on the 5′ end of the Alu and IPC probes, respectively. BHQ1 and Iowa Black® FQ
(IABkFQ) are quenchers on the 3′ end of the Alu and IPC probes, respectively. ........................ 26
Table 3. PCR Amplification of extracted DNA with AmpFℓSTR® MiniFiler™ and PowerPlex®
Fusion. ........................................................................................................................................... 28
Table 4. Run parameters for capillary electrophoresis on an AB 3500 genetic analyzer with
AmpFℓSTR® MiniFiler™ and PowerPlex® Fusion amplified products. ....................................... 29
Table 5. Examination of foreign DNA on the inner portion of transfer pipette bulbs. ................ 30
Table 6. Spent cartridge casing collection events. Letters (A, B, and C) indicate a different
firearm/magazine. ......................................................................................................................... 33
Table 7. DNA quantities recovered from treated and non-treated bulbs. A higher average DNA
yield (1.18 pg) was recovered from transfer pipette bulbs subjected to various treatments than the
untreated bulb (0.41 pg). DNA yields were calculated based on 28 μL retention. ....................... 37
Table 8. Mann-Whitney pairwise comparisons (2-tailed) of DNA quantities retrieved with the
optimized cell recovery and DNA extraction methods. (Bold = significantly greater DNA yields)
....................................................................................................................................................... 44
Table 9. Descriptive statistics of profiles amplified with MiniFiler™ and Fusion (bold). The cell
recovery and DNA extraction method utilized is denoted by A = double swab + organic
extraction; B = soak + organic extraction; C = double swab + QIAamp® extraction; D = soak +
QIAamp® extraction; E = FDF® extraction .................................................................................. 46
Table 10. Mann-Whitney pairwise comparisons (2-tailed) examining the number of loader and
non-loader alleles present in MiniFiler™ and Fusion profiles generated with the optimized
methods: A = double swab + organic extraction; B = soak + organic extraction; C = double swab
+ QIAamp® extraction; D = soak + QIAamp® extraction; E = FDF® extraction ......................... 47
Table 11. RMP comparison of MiniFiler™ and Fusion profiles of casing 34.4. Single alleles at a
given locus were considered homozygous and frequency calculations for D13 and FGA in the
MiniFiler™ profile were calculated by adding the frequencies of all allele combinations. .......... 48
viii
Table 12. Shapiro Wilk test for normality on the percentages of loaders’ profiles processed with
the optimized cell recovery and DNA extraction methods and amplified using Fusion. ............. 49
Table 13. Mann-Whitney pairwise comparisons (2-tailed) of the percentages of loaders’ profiles
processed with the optimized cell recovery and DNA extraction methods and amplified using
Fusion. (Bold = significantly greater percentages of loaders’ profiles)........................................ 49
Table 14. Descriptive statistics of individual and consensus profiles of DNAs amplified with
Fusion. The cell recovery and DNA extraction method utilized is denoted by A = double swab +
organic extraction; B = soak + organic extraction; C = double swab + QIAamp® extraction; D =
soak + QIAamp® extraction; E = FDF® extraction. Consensus profiles of methods A and B were
generated per volunteer using the three individual profiles from casings (Collections 2 and 3), in
which organic extractions were performed with either double swabbing or soaking. .................. 51
Table 15. The degree of linear correlation between the DNA yields and the amount of loader
alleles amplified in Fusion profiles. The cell recovery and DNA extraction method utilized is
denoted by A = double swab + organic extraction; B = soak + organic extraction; C = double
swab + QIAamp® extraction; D = soak + QIAamp® extraction; E = FDF® extraction. ............... 52
Table 16. Example of a consensus profile where non-loader alleles were rare in individual
profiles and consequently excluded in the consensus, yet some alleles (e.g., 16.3 and 17.3 at D1,
29 at D21, and 13 at D5) present in Profile 33-7A were consistent with the loader but not
included in the consensus profile. Refer to Appendix E for explanation of table symbols. ......... 53
Table 17. Example of a consensus profile where multiple non-loader alleles were represented in
the consensus profile. Refer to Appendix E for explanation of table symbols. ............................ 54
Table A1. Round robin assignment of cell recovery and DNA extraction methods to spent
casings from Collection 1. ............................................................................................................ 73
Table A2. Round robin assignment of cell recovery and DNA extraction methods to spent
casings from Collection 2. ............................................................................................................ 76
Table A3. Round robin assignment of cell recovery and DNA extraction methods to spent
casings from Collection 3. ............................................................................................................ 82
Table B1. DNA quantities recovered from spent cartridge casings using a double swab technique
(Sweet et al., 1997) and organic extraction. ................................................................................. 84
Table B2. DNA quantities recovered from spent cartridge casings using a soaking technique and
organic extraction.......................................................................................................................... 87
ix
Table B3. DNA quantities recovered from spent cartridge casings using a double swab technique
(Sweet et al., 1997) and QIAamp® DNA Investigator extraction. ................................................ 90
Table B4. DNA quantities recovered from spent cartridge casings using a soaking technique and
QIAamp® DNA Investigator extraction. ....................................................................................... 93
Table B5. DNA quantities recovered from spent cartridge casings using a single swab technique
and FDF® extraction. ..................................................................................................................... 96
Table C1. Alleles amplified with AmpFℓSTR® MiniFiler™ and PowerPlex® Fusion from spent
cartridge casings loaded by volunteer CC during Collection 1. ................................................... 98
Table C2. Alleles amplified with AmpFℓSTR® MiniFiler™ and PowerPlex® Fusion from spent
cartridge casings loaded by volunteer Q during Collection 1. ...................................................... 99
Table C3. Alleles amplified with AmpFℓSTR® MiniFiler™ and PowerPlex® Fusion from spent
cartridge casings loaded by volunteer LL during Collection 1. .................................................. 100
Table C4. Alleles amplified with AmpFℓSTR® MiniFiler™ and PowerPlex® Fusion from spent
cartridge casings loaded by volunteer YY during Collection 1. ................................................. 101
Table C5. Alleles amplified with AmpFℓSTR® MiniFiler™ and PowerPlex® Fusion from spent
cartridge casings loaded by volunteer RR during Collection 1. ................................................. 102
Table C6. Alleles amplified with AmpFℓSTR® MiniFiler™ and PowerPlex® Fusion from spent
cartridge casings loaded by volunteer U during Collection 2. .................................................... 103
Table C7. Alleles amplified with AmpFℓSTR® MiniFiler™ and PowerPlex® Fusion from spent
cartridge casings loaded by volunteer MM during Collection 2................................................. 104
Table C8. Alleles amplified with AmpFℓSTR® MiniFiler™ and PowerPlex® Fusion from spent
cartridge casings loaded by volunteer S during Collection 2. .................................................... 105
Table C9. Alleles amplified with AmpFℓSTR® MiniFiler™ and PowerPlex® Fusion from spent
cartridge casings loaded by volunteer V during Collection 2. .................................................... 107
Table C10. Alleles amplified with AmpFℓSTR® MiniFiler™ and PowerPlex® Fusion from spent
cartridge casings loaded by volunteer L during Collection 2. .................................................... 110
Table C11. Alleles amplified with AmpFℓSTR® MiniFiler™ and PowerPlex® Fusion from spent
cartridge casings loaded by volunteer T during Collection 2. .................................................... 114
x
Table C12. Alleles amplified with AmpFℓSTR® MiniFiler™ and PowerPlex® Fusion from spent
cartridge casings loaded by volunteer XX during Collection 2. ................................................. 115
Table C13. Alleles amplified with AmpFℓSTR® MiniFiler™ and PowerPlex® Fusion from spent
cartridge casings loaded by volunteer N during Collection 2. .................................................... 116
Table C14. Alleles amplified with AmpFℓSTR® MiniFiler™ and PowerPlex® Fusion from spent
cartridge casings loaded by volunteer B during Collection 2. .................................................... 117
Table C15. Alleles amplified with AmpFℓSTR® MiniFiler™ and PowerPlex® Fusion from spent
cartridge casings loaded by volunteer WW during Collection 2. ............................................... 118
Table C16. Alleles amplified with AmpFℓSTR® MiniFiler™ and PowerPlex® Fusion from spent
cartridge casings loaded by volunteer Y during Collection 2. .................................................... 119
Table C17. Alleles amplified with AmpFℓSTR® MiniFiler™ and PowerPlex® Fusion from spent
cartridge casings loaded by volunteer II during Collection 2. .................................................... 120
Table D1. Summary of alleles recovered in STR profiles generated from spent cartridge casings
using a double swab technique (Sweet et al., 1997) and organic extraction. ............................. 121
Table D2. Summary of alleles recovered in STR profiles generated from spent cartridge casings
using a soaking technique and organic extraction. DNA extract 3-5A is the only sample extracted
with an organic extraction and amplified with PowerPlex® Fusion that does not have allelic data
due to high levels of contamination. ........................................................................................... 126
Table D3. Summary of alleles recovered in STR profiles generated from spent cartridge casings
using a double swab technique (Sweet et al., 1997) and QIAamp® DNA Investigator extraction.
..................................................................................................................................................... 130
Table D4. Summary of alleles recovered in STR profiles generated from spent cartridge casings
using a soaking technique and QIAamp® DNA Investigator extraction..................................... 134
Table D5. Summary of alleles recovered in STR profiles generated from spent cartridge casings
using a single swab and FDF® extraction. .................................................................................. 138
Table D6. Summary of alleles recovered in consensus and individual STR profiles generated
from DNA extracts retrieved via a double swab technique (Sweet et al., 1997) and organic
extraction. Consensus profiles are presented first (Con. = Consensus) and the next three casing
identifiers are the individual profiles. ......................................................................................... 141
Table D7. Summary of alleles recovered in consensus and individual STR profiles generated
from DNA extracts retrieved via a soaking technique and organic extraction. Consensus profiles
xi
are presented first (Con. = Consensus) and the next three casing identifiers are the individual
profiles. ....................................................................................................................................... 145
Table E1. Alleles obtained with PowerPlex® Fusion from spent cartridge casings loaded by
volunteer CC and collected individually during Collection 1. ................................................... 150
Table E2. Alleles obtained with PowerPlex® Fusion from spent cartridge casings loaded by
volunteer CC and collected in triplicate during Collection 1. .................................................... 151
Table E3. Alleles obtained with PowerPlex® Fusion from spent cartridge casings loaded by
volunteer Q and collected individually during Collection 1. ...................................................... 152
Table E4. Alleles obtained with PowerPlex® Fusion from spent cartridge casings loaded by
volunteer LL and collected individually during Collection 1. .................................................... 153
Table E5. Alleles obtained with PowerPlex® Fusion from spent cartridge casings loaded by
volunteer YY and collected individually during Collection 1. ................................................... 154
Table E6. Alleles obtained with PowerPlex® Fusion from spent cartridge casings loaded by
volunteer RR and collected individually during Collection 1. ................................................... 155
Table E7. Alleles obtained with PowerPlex® Fusion from spent cartridge casings loaded by
volunteer RR and collected in triplicate during Collection 1. .................................................... 156
Table E8. Alleles obtained with PowerPlex® Fusion from spent cartridge casings loaded by
volunteer M and collected individually during Collection 1. ..................................................... 157
Table E9. Alleles obtained with PowerPlex® Fusion from spent cartridge casings loaded by
volunteer GG and collected individually during Collection 1. ................................................... 158
Table E10. Alleles obtained with PowerPlex® Fusion from spent cartridge casings loaded by
volunteer U during Collection 2. ................................................................................................ 159
Table E11. Alleles obtained with PowerPlex® Fusion from spent cartridge casings loaded by
volunteer MM during Collection 2. ............................................................................................ 160
Table E12. Alleles obtained with PowerPlex® Fusion from spent cartridge casings loaded by
volunteer S during Collection 2. ................................................................................................. 161
Table E13. Alleles obtained with PowerPlex® Fusion from spent cartridge casings loaded by
volunteer VV during Collection 2............................................................................................... 163
xii
Table E14. Alleles obtained with PowerPlex® Fusion from spent cartridge casings loaded by
volunteer V during Collection 2. ................................................................................................ 164
Table E15. Alleles obtained with PowerPlex® Fusion from spent cartridge casings loaded by
volunteer HH during Collection 2............................................................................................... 166
Table E16. Alleles obtained with PowerPlex® Fusion from spent cartridge casings loaded by
volunteer L during Collection 2. ................................................................................................. 167
Table E17. Alleles obtained with PowerPlex® Fusion from spent cartridge casings loaded by
volunteer OO during Collection 2............................................................................................... 169
Table E18. Alleles obtained with PowerPlex® Fusion from spent cartridge casings loaded by
volunteer T during Collection 2. ................................................................................................. 170
Table E19. Alleles obtained with PowerPlex® Fusion from spent cartridge casings loaded by
volunteer XX during Collection 2............................................................................................... 171
Table E20. Alleles obtained with PowerPlex® Fusion from spent cartridge casings loaded by
volunteer N during Collection 2. ................................................................................................ 173
Table E21. Alleles obtained with PowerPlex® Fusion from spent cartridge casings loaded by
volunteer B during Collection 2. ................................................................................................. 175
Table E22. Alleles obtained with PowerPlex® Fusion from spent cartridge casings loaded by
volunteer D during Collection 2. ................................................................................................ 177
Table E23. Alleles obtained with PowerPlex® Fusion from spent cartridge casings loaded by
volunteer WW during Collection 2. ............................................................................................ 178
Table E24. Alleles obtained with PowerPlex® Fusion from spent cartridge casings loaded by
volunteer SS during Collection 2. ............................................................................................... 180
Table E25. Alleles obtained with PowerPlex® Fusion from spent cartridge casings loaded by
volunteer Y during Collection 2. ................................................................................................ 181
Table E26. Alleles obtained with PowerPlex® Fusion from spent cartridge casings loaded by
volunteer II during Collection 2. ................................................................................................. 182
Table E27. Alleles obtained with PowerPlex® Fusion from spent cartridge casings loaded by
volunteer W during Collection 3. ................................................................................................ 183
Table E28. Alleles obtained with PowerPlex® Fusion from spent cartridge casings loaded by
volunteer W during Collection 3. ................................................................................................ 184
xiii
Table E29. Alleles obtained with PowerPlex® Fusion from spent cartridge casings loaded by
volunteer QQ during Collection 3............................................................................................... 185
Table E30. Alleles obtained with PowerPlex® Fusion from spent cartridge casings loaded by
volunteer P during Collection 3. ................................................................................................. 186
Table E31. Alleles obtained with PowerPlex® Fusion from spent cartridge casings loaded by
either volunteer P or volunteer Z during Collection 3. Due to miss labeling of bags and minimal
STR data, these results could not confidently be associated with a particular volunteer. .......... 187
Table E32. Alleles obtained with PowerPlex® Fusion from spent cartridge casings loaded by
volunteer P during Collection 3. ................................................................................................. 188
Table E33. Alleles obtained with PowerPlex® Fusion from spent cartridge casings loaded by
either volunteer P or volunteer Z during Collection 3. Due to miss labeling of bags and minimal
STR data, these results could not confidently be associated with a particular volunteer. .......... 189
Table E34. Alleles obtained with PowerPlex® Fusion from spent cartridge casings loaded by
volunteer DD during Collection 3............................................................................................... 190
Table E35. Alleles obtained with PowerPlex® Fusion from spent cartridge casings loaded by
volunteer DD during Collection 3............................................................................................... 191
Table E36. Alleles obtained with PowerPlex® Fusion from spent cartridge casings loaded by
volunteer FF during Collection 3. ............................................................................................... 192
Table E37. Alleles obtained with PowerPlex® Fusion from spent cartridge casings loaded by
volunteer FF during Collection 3. ............................................................................................... 193
Table E38. Alleles obtained with PowerPlex® Fusion from spent cartridge casings loaded by
volunteer KK during Collection 3............................................................................................... 194
Table E39. Alleles obtained with PowerPlex® Fusion from spent cartridge casings loaded by
volunteer Z during Collection 3. ................................................................................................. 196
Table E40. Alleles obtained with PowerPlex® Fusion from spent cartridge casings loaded by
either volunteer P or volunteer Z during Collection 3. Due to miss labeling of bags and minimal
STR data, these results could not confidently be associated with a particular volunteer. .......... 197
Table E41. Alleles obtained with PowerPlex® Fusion from spent cartridge casings loaded by
volunteer Z during Collection 3. ................................................................................................. 198
xiv
Table E42. Alleles obtained with PowerPlex® Fusion from spent cartridge casings loaded by
either volunteer P or volunteer Z during Collection 3. Due to miss labeling of bags and minimal
STR data, these results could not confidently be associated with a particular volunteer. .......... 199
Table E43. Alleles obtained with PowerPlex® Fusion from spent cartridge casings loaded by
volunteer PP during Collection 3. ............................................................................................... 200
Table E44. Alleles obtained with PowerPlex® Fusion from spent cartridge casings loaded by
volunteer PP during Collection 3. ............................................................................................... 201
Table E45. Alleles obtained with PowerPlex® Fusion from spent cartridge casings loaded by
volunteer X during Collection 3. ................................................................................................ 202
Table E46. Alleles obtained with PowerPlex® Fusion from spent cartridge casings loaded by
volunteer X during Collection 3. ................................................................................................ 204
Table E47. Alleles obtained with PowerPlex® Fusion from spent cartridge casings loaded by
volunteer UU during Collection 3............................................................................................... 206
Table E48. Alleles obtained with PowerPlex® Fusion from spent cartridge casings loaded by
volunteer UU during Collection 3............................................................................................... 207
Table F1. Consensus profiles created from alleles amplified with PowerPlex® Fusion from spent
cartridge casings loaded by volunteer U during Collection 2. .................................................... 209
Table F2. Consensus profiles created from alleles amplified with PowerPlex® Fusion from spent
cartridge casings loaded by volunteer MM during Collection 2. Casings 3-5A was excluded from
analysis due to contamination, consequently it was not used in construction of the consensus
STR profile.................................................................................................................................. 210
Table F3. Consensus profiles created from alleles amplified with PowerPlex® Fusion from spent
cartridge casings loaded by volunteer S during Collection 2. .................................................... 211
Table F4. Consensus profiles created from alleles amplified with PowerPlex® Fusion from spent
cartridge casings loaded by volunteer VV during Collection 2. ................................................. 212
Table F5. Consensus profiles created from alleles amplified with PowerPlex® Fusion from spent
cartridge casings loaded by volunteer V during Collection 2. .................................................... 213
Table F6. Consensus profiles created from alleles amplified with PowerPlex® Fusion from spent
cartridge casings loaded by volunteer HH during Collection 2. ................................................. 214
xv
Table F7. Consensus profiles created from alleles amplified with PowerPlex® Fusion from spent
cartridge casings loaded by volunteer L during Collection 2. .................................................... 215
Table F8. Consensus profiles created from alleles amplified with PowerPlex® Fusion from spent
cartridge casings loaded by volunteer OO during Collection 2. ................................................. 216
Table F9. Consensus profiles created from alleles amplified with PowerPlex® Fusion from spent
cartridge casings loaded by volunteer T during Collection 2. .................................................... 217
Table F10. Consensus profiles created from alleles amplified with PowerPlex® Fusion from
spent cartridge casings loaded by volunteer XX during Collection 2. ....................................... 218
Table F11. Consensus profiles created from alleles amplified with PowerPlex® Fusion from
spent cartridge casings loaded by volunteer N during Collection 2. .......................................... 219
Table F12. Consensus profiles created from alleles amplified with PowerPlex® Fusion from
spent cartridge casings loaded by volunteer B during Collection 2............................................ 220
Table F13. Consensus profiles created from alleles amplified with PowerPlex® Fusion from
spent cartridge casings loaded by volunteer D during Collection 2. .......................................... 221
Table F14. Consensus profiles created from alleles amplified with PowerPlex® Fusion from
spent cartridge casings loaded by volunteer WW during Collection 2. ...................................... 222
Table F15. Consensus profiles created from alleles amplified with PowerPlex® Fusion from
spent cartridge casings loaded by volunteer SS during Collection 2. ......................................... 223
Table F16. Consensus profiles created from alleles amplified with PowerPlex® Fusion from
spent cartridge casings loaded by volunteer Y during Collection 2. .......................................... 224
Table F17. Consensus profiles created from alleles amplified with PowerPlex® Fusion from
spent cartridge casings loaded by volunteer II during Collection 2............................................ 225
Table F18. Consensus profiles created from alleles amplified with PowerPlex® Fusion from
spent cartridge casings loaded by volunteer W during Collection 3. ......................................... 226
Table F19. Consensus profiles created from alleles amplified with PowerPlex® Fusion from
spent cartridge casings loaded by volunteer QQ during Collection 3. ....................................... 227
Table F20. Consensus profiles created from alleles amplified with PowerPlex® Fusion from
spent cartridge casings loaded by volunteer P during Collection 3. ........................................... 228
xvi
Table F21. Consensus profiles created from alleles amplified with PowerPlex® Fusion from
spent cartridge casings loaded by volunteer DD during Collection 3. ....................................... 229
Table F22. Consensus profiles created from alleles amplified with PowerPlex® Fusion from
spent cartridge casings loaded by volunteer FF during Collection 3. ......................................... 230
Table F23. Consensus profiles created from alleles amplified with PowerPlex® Fusion from
spent cartridge casings loaded by volunteer KK during Collection 3. ....................................... 231
Table F24. Consensus profiles created from alleles amplified with PowerPlex® Fusion from
spent cartridge casings loaded by volunteer Z during Collection 3. ........................................... 232
Table F25. Consensus profiles created from alleles amplified with PowerPlex® Fusion from
spent cartridge casings loaded by volunteer PP during Collection 3. ......................................... 233
Table F26. Consensus profiles created from alleles amplified with PowerPlex® Fusion from
spent cartridge casings loaded by volunteer X during Collection 3. .......................................... 234
Table F27. Consensus profiles created from alleles amplified with PowerPlex® Fusion from
spent cartridge casings loaded by volunteer UU during Collection 3. ....................................... 235
xvii
LIST OF FIGURES
Figure 1. Anatomy of a live cartridge. Taken from Guns & Ammo Info, 2014.
http://www.gunsandammo.info/ammo/ammo-101. ........................................................................ 2
Figure 2. Extraction and ejection of a spent cartridge casing, followed by the subsequent input of
a new round in the chamber of the pistol. Taken from Ruger Forum, 2014. .................................. 2
Figure 3. The anatomy of a pistol chamber, viewed through the ejection port, identifying various
tools that generate marks on cartridge casings. Taken from Thompson, 2010............................... 5
Figure 4. Diagram of the Polymerase Chain Reaction. Taken from Butler, 2005. ...................... 10
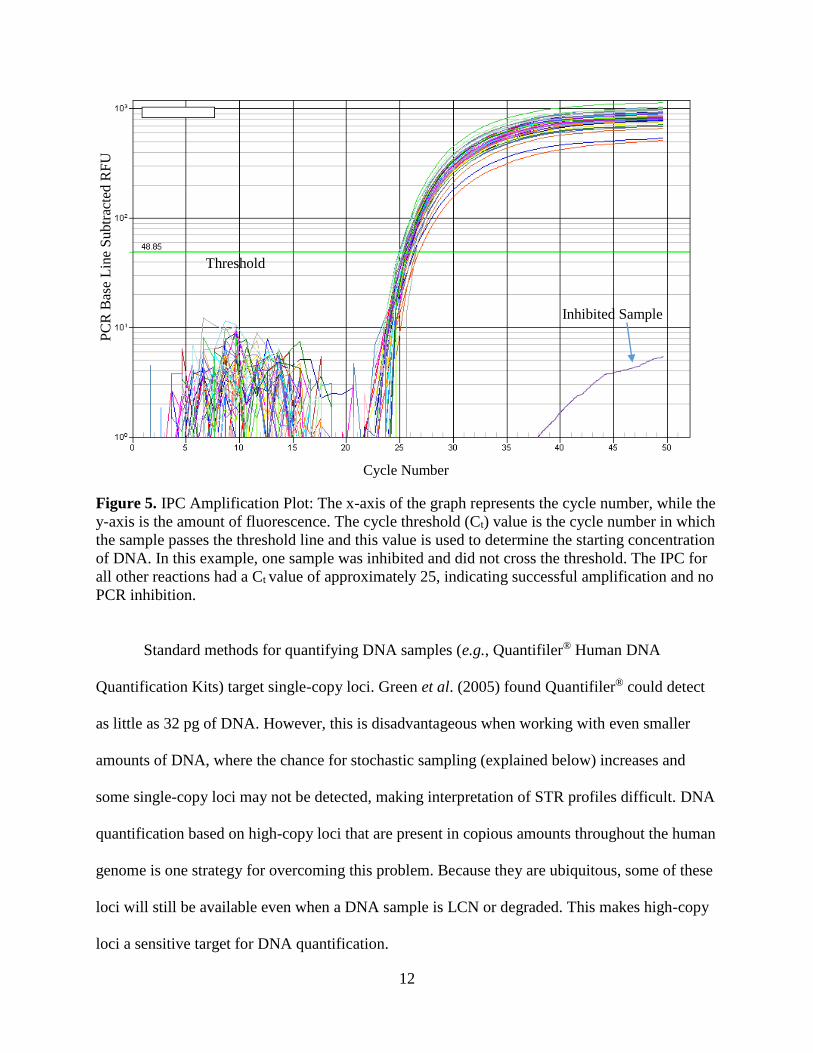
Figure 5. IPC Amplification Plot: The x-axis of the graph represents the cycle number, while the
y-axis is the amount of fluorescence. The cycle threshold (Ct) value is the cycle number in which
the sample passes the threshold line and this value is used to determine the starting concentration
of DNA. In this example, one sample was inhibited and did not cross the threshold. The IPC for
all other reactions had a Ct value of approximately 25, indicating successful amplification and no
PCR inhibition. ............................................................................................................................. 12
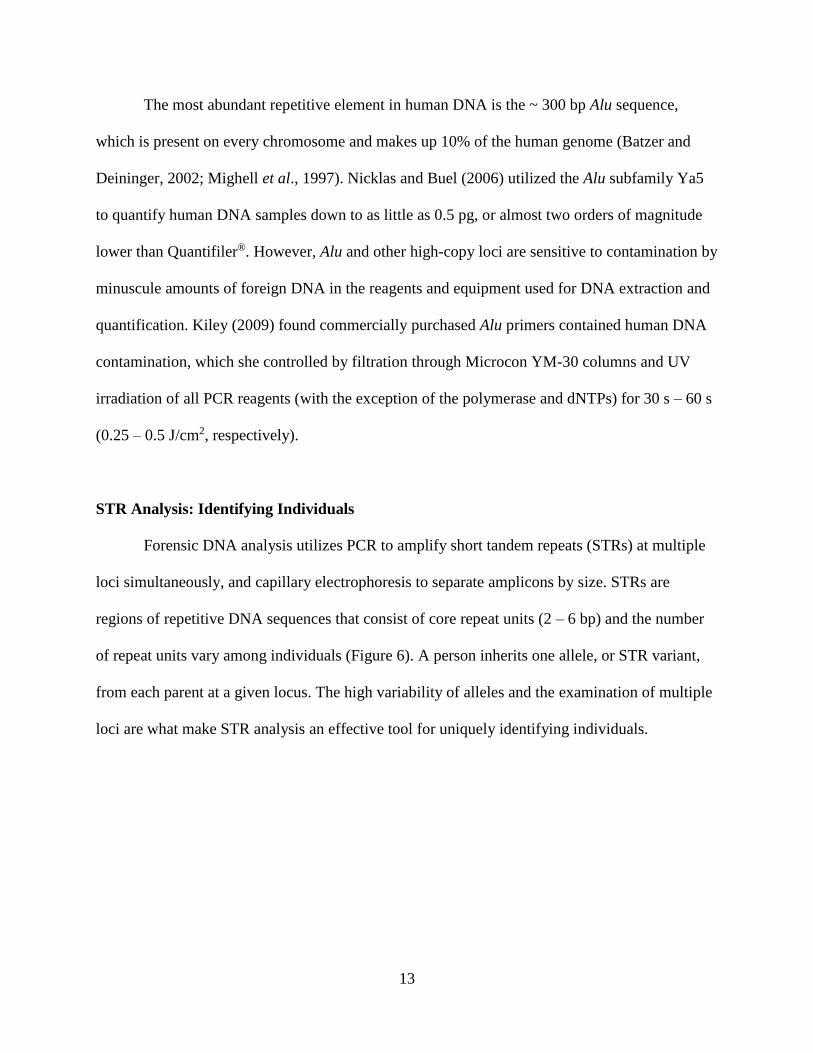
Figure 6. Diagram of a short tandem repeat (STR) allele at the TH01 locus. In this example,
there are nine repeat units (TCAT) between the flanking regions, so the individual has a 9 allele.
The second allele at TH01 comes from their other parent, and may contain the same or a
different number of repeat units. Taken from Butler, 2005. ......................................................... 14
Figure 7. An example of stochastic sampling effects. When a small number of DNA templates
are available from the start, there is a chance that some alleles will be amplified more than the
others, resulting in imbalanced allele peak height. Taken from Krane, 2007. ............................. 15
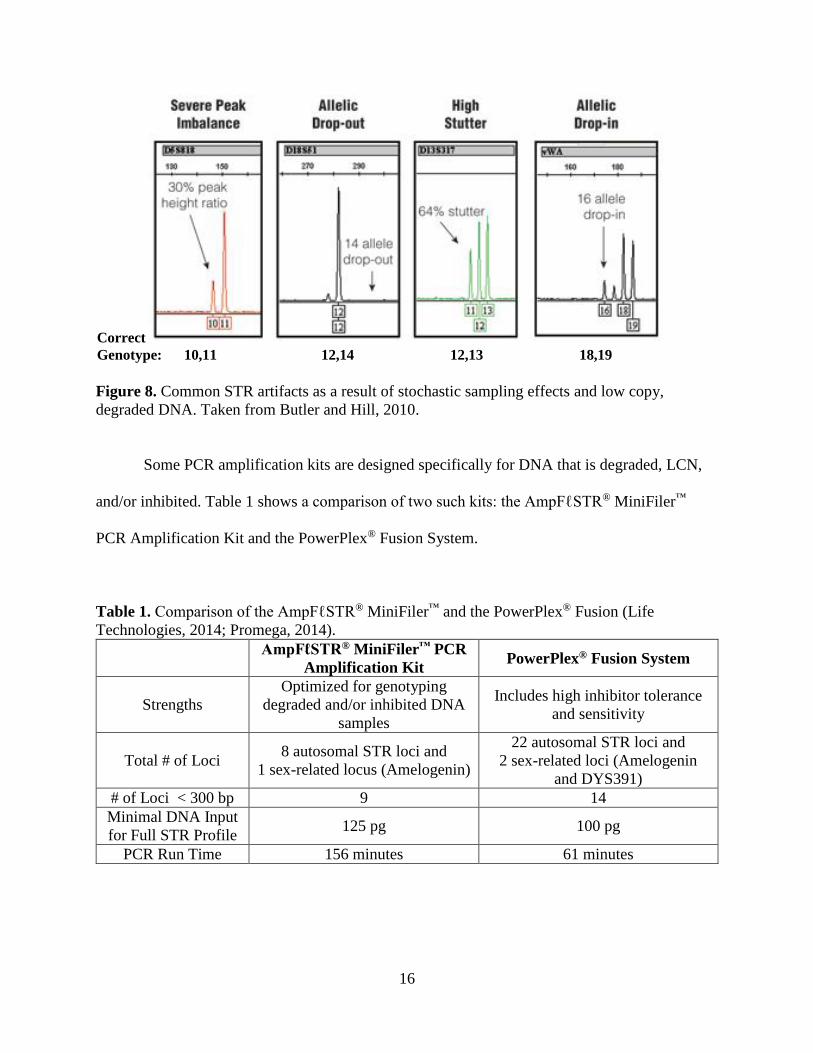
Figure 8. Common STR artifacts as a result of stochastic sampling effects and low copy,
degraded DNA. Taken from Butler and Hill, 2010. ..................................................................... 16
Figure 9. Example of a casing soaking in 700 μL of digestion/tissue lysis buffer. ..................... 24
Figure 10. Average DNA yields from yeast rRNA pre-treated (organic = 108.99 pg and
QIAamp® = 21.54 pg) and not pre-treated transfer pipette bulbs (organic = 108.06 pg and
QIAamp® = 17.75 pg) prior to the soak period (n = 2 per extraction method). Given these results,
bulbs were not pre-treated in subsequent experiments. ................................................................ 38
Figure 11. Average DNA yields from casings that were shaken at 900 rpm (organic = 54.11 pg
and QIAamp® = 13.64 pg) and casings that were stationary (organic = 377.52 pg and QIAamp®
xviii
= 25.51 pg) for the 30 min soak period (n = 4 per extraction method). Given these results,
casings were not shaken in subsequent experiments. ................................................................... 39
Figure 12. Average DNA yields from samples that were subjected to a pre-digestion incubation
(organic = 144.59 pg and QIAamp® = 26.45 pg) and samples that were not (organic = 59.91 pg
and QIAamp® = 18.06 pg) (n = 2 per extraction method). Based on these results, soaked samples
were incubated for 10 min at 85°C in subsequent experiments. ................................................... 40
Figure 13. Average DNA yields recovered from samples digested for 1 h (double swab +
organic = 43.09 pg; soak + organic = 85.38 pg; double swab + QIAamp® = 5.5 pg; soak +
QIAamp® = 0.93 pg; FDF® = 84.9 pg) or digested overnight (double swab + organic = 38.59 pg;
soak + organic = 41.69 pg; double swab + QIAamp® = 1.83 pg; soak + QIAamp® = 3.39 pg;
FDF® = 19.2 pg) or digested for 30 min (FDF® = 34.8 pg). Owing to these results, 1 h digestion
was performed in subsequent experiments. .................................................................................. 42
Figure 14. Average DNA quantities recovered from swabs that were either shaken (organic =
95.37 pg and QIAamp® = 22.68 pg) or stationary (organic = 59.91 pg and QIAamp® = 18.06 pg)
during digestion (n = 2 per extraction method). Given these results, cell/DNA digestions
included shaking in subsequent experiments. ............................................................................... 43
Figure 15. Median DNA quantities recovered using optimized cell recovery and DNA extraction
methods. Median DNA yields from organic extractions (double swab = 25.32 pg and soak =
14.95 pg) were significantly higher than the median DNA yields from QIAamp® extractions
(double swab = 3.81 pg and soak = 1.18 pg) and the median DNA yield from FDF® extractions
(0.20 pg). ....................................................................................................................................... 45
Figure 16. Median percentages of loaders’ profiles recovered using optimized cell recovery and
DNA extraction methods followed by amplification with Fusion. Median percentages of loaders’
profiles from organic extractions (double swab = 25.8% [n = 90] and soak = 18.2% [n = 89])
were higher than loaders’ profiles from QIAamp extractions (double swab = 4.8% [n = 56] and
soak = 6.7% [n = 36]). The median percentage of loaders’ profiles from FDF® extractions was
0.0% (n = 14). ............................................................................................................................... 50
Figure 17. Frequency of consistent loader alleles amplified at each locus, illustrating preferential
amplification of shorter amplicons. The loci are arranged according to their amplicon sizes (short
to long) for each dye channel. With the exception of D13 (9.7%) and D7 (9.9%), the loci
containing smaller amplicons had higher frequencies of amplification. Frequencies of the
smallest locus in each channel: Amel = 47.5%, D16 = 36.3%, THO1 = 44.6%, D8 = 41.5%.
Frequencies of the largest locus in each channel: Penta E = 10.4%, Penta D = 7.5%, DYS391 =
8.6%, D22 = 7.6%. ........................................................................................................................ 55
1
INTRODUCTION
Approximately 1.2 million violent crimes (on average 1 every 26 seconds) occurred in
the U.S. in 2012. Of those, a firearm was used in 69.3% of the murders, 41.0% of the robberies,
and 21.8% of the aggravated assaults (FBI Uniform Crime Report, 2012). Considering the
prevalence of firearms used in violent crimes, it is critical that investigators have access to
reliable forensic tools that can be used to identify the person(s) responsible for firing them.
While recovery of the fired weapon is ideal, this often does not occur. However, fired bullets and
cartridge casings ejected from a firearm are often abandoned by the offender and retrieved by
law enforcement, which have the potential to provide a direct link between the incident, the
weapon, and the perpetrator (Bentsen et al., 1996).
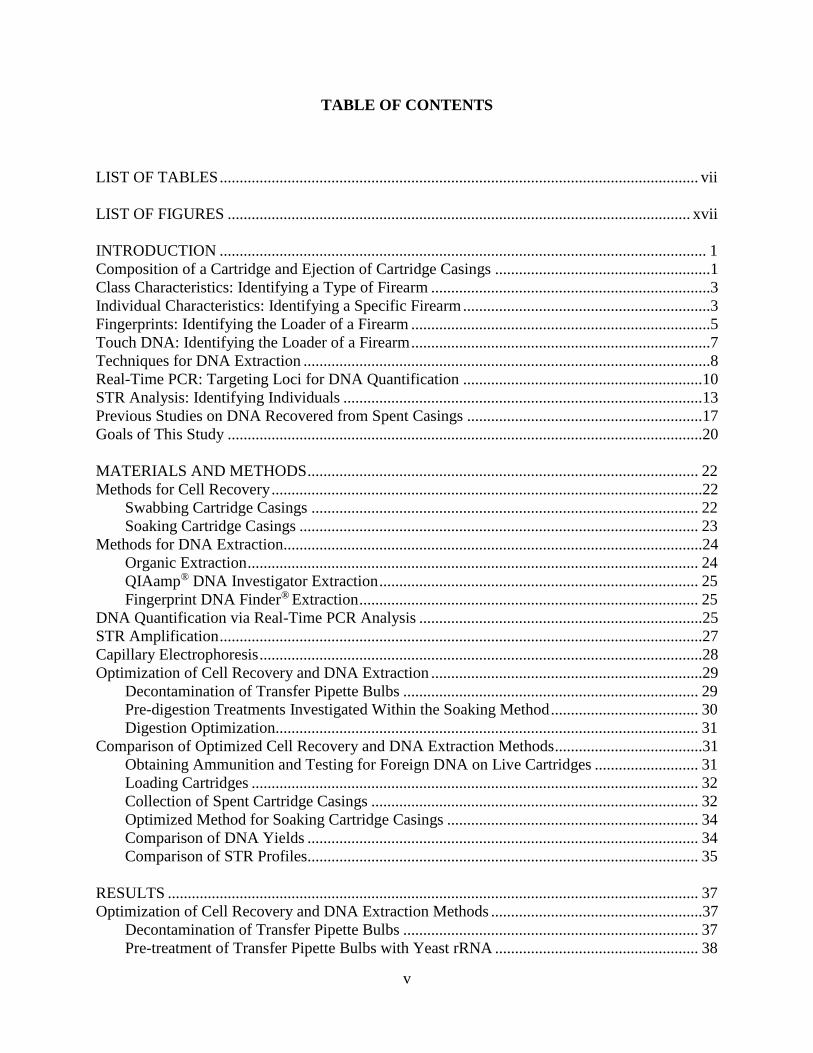
Composition of a Cartridge and Ejection of Cartridge Casings
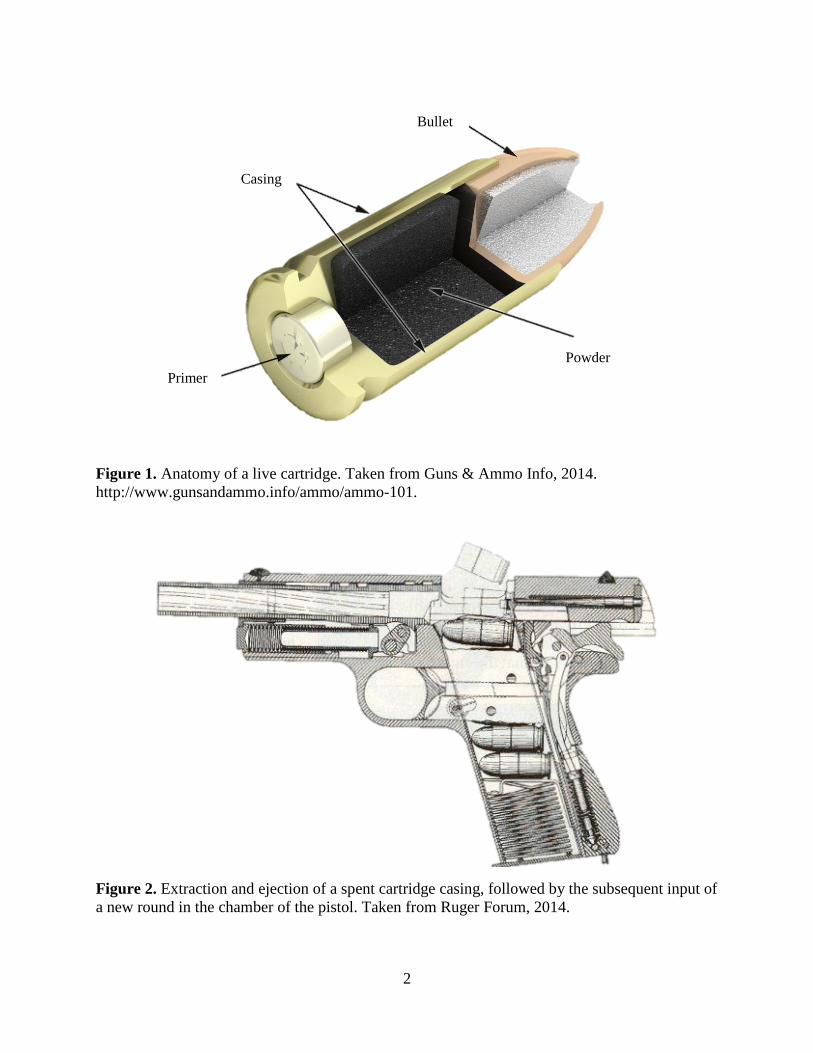
A cartridge consists of a casing, primer, propellant, and one or more projectiles (Figure
1). When the trigger of a loaded gun is pulled, the firing pin makes contact with the primer,
which generally contains an initiating explosive, oxidizer, and fuel (Warlow, 2012). The struck
primer ignites the propellant. Historically, propellants were referred to as black powder, but the
modern and more efficient form is known as smokeless powder (DiMaio, 1999). Deflagration of
the propellant causes buildup of gases, which force the projectile out of the casing and down the
barrel of the firearm. Simultaneously, the casing is forced back against the breech face and the
extractor pulls the casing to the rear until it hits the ejector, which pushes the casing out of the
ejection port of the firearm (Figure 2; Doyle, 2014, Thompson, 2010, National Institute of
Justice, n.d.).
2
Figure 1. Anatomy of a live cartridge. Taken from Guns & Ammo Info, 2014.
http://www.gunsandammo.info/ammo/ammo-101.
Figure 2. Extraction and ejection of a spent cartridge casing, followed by the subsequent input of
a new round in the chamber of the pistol. Taken from Ruger Forum, 2014.
Casing
Primer
Bullet
Powder
3
Class Characteristics: Identifying a Type of Firearm
A main goal of forensic firearms examiners is to determine whether a projectile, cartridge
casing, or other ammunition components originated from a particular weapon. The evidence is
first inspected for class characteristics (Saferstein, 2011). For example, the caliber of
ammunition directly correlates with a firearm’s caliber (the inner diameter of a firearm bore). If a
.40-caliber casing was recovered from a shooting incident, investigators would search for a .40-
caliber firearm. While this information is not individualizing, it is representative of a select group
of weapons. Class characteristics of spent cartridge casings beyond caliber include the shape
(e.g., rimmed or rimless), the composition (e.g., brass, steel, copper, or aluminum), and the
headstamp containing manufacturer information (National Institute of Justice, n.d.). Class
characteristics are useful for eliminating certain firearm brands, however they cannot identify a
specific weapon.
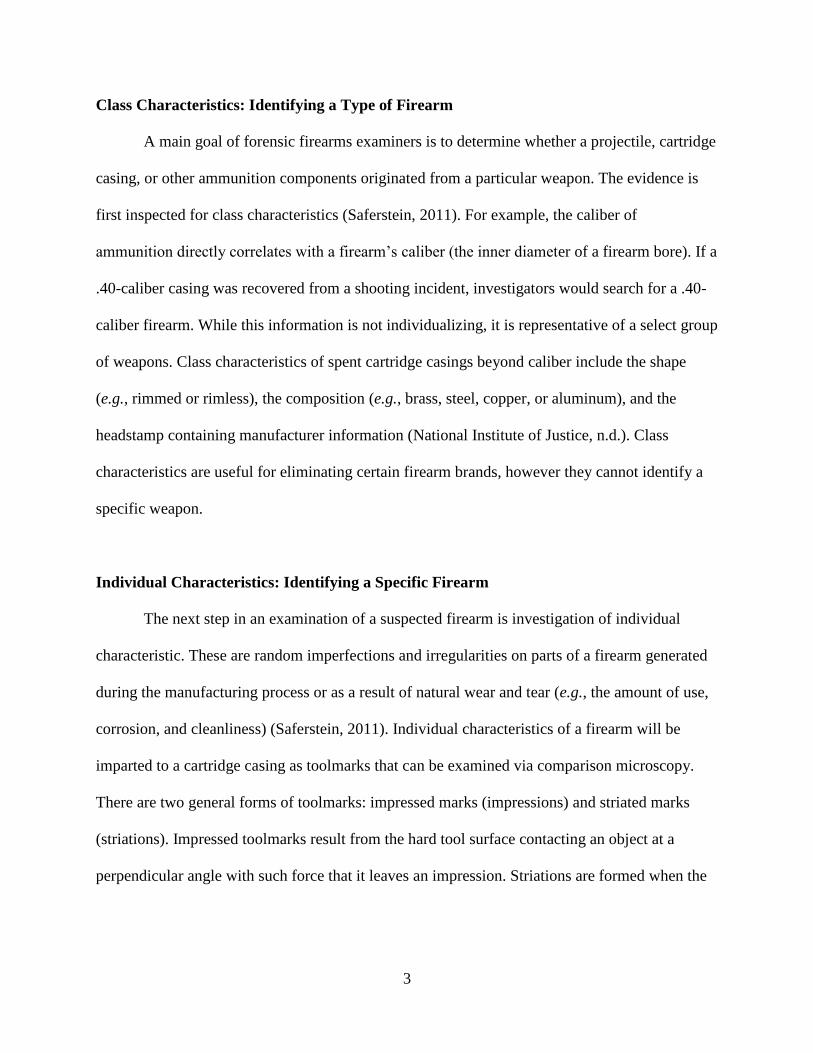
Individual Characteristics: Identifying a Specific Firearm
The next step in an examination of a suspected firearm is investigation of individual
characteristic. These are random imperfections and irregularities on parts of a firearm generated
during the manufacturing process or as a result of natural wear and tear (e.g., the amount of use,
corrosion, and cleanliness) (Saferstein, 2011). Individual characteristics of a firearm will be
imparted to a cartridge casing as toolmarks that can be examined via comparison microscopy.
There are two general forms of toolmarks: impressed marks (impressions) and striated marks
(striations). Impressed toolmarks result from the hard tool surface contacting an object at a
perpendicular angle with such force that it leaves an impression. Striations are formed when the

4
tool surface scrapes across the softer surface of an object with substantial force (Thompson,
2010).
Thompson (2010) noted several events that occur when a firearm interacts with a
cartridge to generate commonly examined toolmarks. First, marks can be generated on the side
of casings by the magazine lips during loading. Additionally, when the firing pin strikes the
primer, an impression of the firing pin and its microscopic imperfections are left on the casing
head. As a projectile is fired, a process known as obturation occurs, in which the casing swells in
the chamber and blocks the gases from traveling anywhere besides down the barrel, and, as a
result of accumulated heat and pressure, chamber marks are left on the sides of the casing. Also,
during discharge, toolmarks can be generated by the breech face, and if present, the extractor and
ejector (Figure 3). All of these markings may include individual striations as a result of
imperfections in the firearm parts. Unfortunately, although the combination of class and
individual characteristics from spent cartridge casings can identify a particular weapon; they
cannot directly connect an individual to a shooting incident, which is the ultimate criminal
justice goal.
5
Figure 3. The anatomy of a pistol chamber, viewed through the ejection port, identifying various
tools that generate marks on cartridge casings. Taken from Thompson, 2010.
Fingerprints: Identifying the Loader of a Firearm
The probative value of evidence is much greater when an examiner is able to identify the
person(s) responsible for loading and/or firing a weapon in a shooting incident. For example,
when a person loads a cartridge into the magazine of a firearm, fingerprints may be deposited on
the ammunition. Spent casings can then be subjected to fingerprint analysis.
The most common type of fingerprint left on spent cartridge casings are latent, which can
be visualized using various powders or chemicals and then “lifted” with tape or photographed.
Bentsen et al. (1996) investigated the recovery of fingerprints deliberately rolled onto cartridges
that were subsequently fired and analyzed. The authors fired the ammunition with a 0.38 Webley
revolver, as they claimed it “was selected because of its lower thermodynamics of detonation and
minimum handling of test rounds during loading compared to magazine or belt-fed
weapons…ridge detail loss during the ejection process should be minimal in comparison to self-
loading systems”. The sensitivity of multiple latent print visualization techniques was
6
investigated based on the amount and quality of ridge detail. The two most sensitive methods
were vacuum cyanoacrylate fuming with Panacryl Brilliant Flavine staining, and selenious acid
surface oxidation. Of the 21 combinations of weapons and ammunition studied post-firing using
these two methods, 23.8% yielded identifiable ridge detail (16 ridge traits) and 57.1% included
some ridge detail. When applied to 104 criminal incidents, two prints (one of which was
associated to a CSI) were recovered using the cyanoacrylate method. The casework results
clearly show fingerprints are rarely recovered from spent casings. The authors noted the loss of
fingerprint ridge detail may be attributed to several variables: physical damage during cartridge
loading or casing ejection, gaseous blowback during firing, or interference of propellant by-
products as a result of gaseous blowback. Lastly, analysis with selenious acid treatment showed
the composition of casings affected ridge detail; aluminum and nickel coated casings did not
show any ridge detail while brass casings did.
Given (1976) conducted a study in which six volunteers handled nine pairs of cartridges,
one of which was fired and the other not. Two variables differed among the nine pairs: the time
between handling and firing cartridges (0 – 20 days), and the time between firing cartridges and
lifting prints (either the same or next day). The author found more fingerprint powder adhered to
the prints on casings that had been handled, fired, and lifted all in the same day. It was proposed
that the decrease in powder adhesion resulted from evaporation of water in the prints.
Additionally, the author found that hot, gaseous blowback normally occurred along the side of
the casing that was not completely sealed against the chamber wall, and a considerable amount
of fingerprint deterioration occurred in areas subjected to blowback.
Spear et al. (2005) examined deliberately placed fingerprints on 48 cartridges of differing
caliber (.22 to .45) and casing metal (brass, nickel-plated brass, and aluminum). Three types of
7
fingerprints: bloody, eccrine, and oily, were impressed on the cartridges. Half of them were fired
and all were stored for several months at room temperature. The bloody prints were developed
with amido black, while eccrine and oily prints were processed via cyanoacrylate fuming and
rhodamine 6G staining. Six fingerprints were identifiable, only one of which (bloody) was
recovered from a spent cartridge casing, while none were recovered from the .22-caliber
cartridges. From this it seems clear that the process of firing a weapon is destructive to
fingerprints, even when they are intentionally placed on a cartridge.
Touch DNA: Identifying the Loader of a Firearm
Objects handled by an individual may contain ‘touch DNA’, or trace amounts of DNA
transferred through shed skin cells and perhaps cell-free nucleic acids (Quinones and Daniel,
2012; Wickenheiser, 2002). Some efforts have been made by crime laboratories to analyze touch
DNA from spent cartridge casings. Both Quinones and Daniel (2012) and Wickenheiser (2002)
proposed that the amount of DNA transferred to an object during handling is dependent upon
behavioral factors (e.g., individuals often touch their face, eyes, nose, and hair), the texture of the
substrate (e.g., DNA adheres to porous substrates more readily than non-porous substrates), the
individual handler (e.g., some people shed cells more than others), and the amount of
perspiration. Full AmpFℓSTR® SGM Plus® profiles have been generated from touch DNA
retrieved from paper (Sewell et al., 2008) and bedding (Petricevic et al., 2006). Additionally,
Richert (2011) compared DNA yields and STR profiles from multiple regions on a firearm that
were either individually swabbed and (1) DNAs were extracted from each swab separately or (2)
swabs were combined then DNAs were extracted. The average DNA yield from combined swabs
was more than double that of individual ones. Full Combined DNA Index System (CODIS) STR
8
profiles were recovered with both analysis methods, however a greater number of profiles were
obtained from the combined swabs. Genetic information foreign to the handler was present in
78% of the profiles from combined swabs and 64% of the profiles from individual swabs,
suggesting DNA contamination.
Techniques for DNA Extraction
Current forensic laboratory protocols used to analyze touch DNA from spent casings
involve swabbing the casings and processing the swabs according to the laboratory’s standard
operating procedure for swabs (Forensic Scientist Sarah Rambadt, personal communication).
However, touch DNA is often degraded and present in low copy number (LCN; generally less
than 100 pg of DNA, Gill et al., 2000) meaning analysis from spent casings has limited success.
Multiple techniques exist for the isolation and purification of DNA, including organic (Comey et
al., 1994; Maniatis et al., 1982), silica-based (Greenspoon et al., 1998; Boom et al., 1990), and
non-binding separation (Kopka et al., 2011) methods. Therefore it is possible that optimization
of one or more of these may improve the amount of touch DNA recovered for subsequent
analyses.
Standard phenol-chloroform DNA extractions involve digestion of the cell membrane and
proteins with a lysis buffer containing a detergent (e.g., SDS), proteinase K, a buffering agent
(e.g., Tris), and a chelating agent [e.g., Ethylenedinitrilotetraacetic acid (EDTA)]. Digestion at
~56˚C inactivates nucleases and breaks down cellular membranes, releasing DNA. Following the
addition of phenol, the solution is vortexed and centrifuged resulting in an organic portion
(containing degraded proteins and cellular debris) and an aqueous portion (containing nucleic
9
acids). The aqueous layer is added to chloroform to remove residual phenol. This process may be
followed by additional purification and concentration methods using a centrifugal filter unit.
Silica-based extraction methods consist of silica beads or a column that selectively bind
DNA under high salt conditions. Cation bridges are formed via chaotropic agents (e.g., sodium
iodide) between the negatively charged silica and the negatively charged DNA backbone
(Melzak et al., 1996). Residual proteins and impurities are washed away and a low salt solution
elutes the DNAs from the silica.
Kopka et al. (2011) developed and validated the Fingerprint DNA Finder® (FDF®) Kit,
which utilizes a non-binding DNA separation method. They stated “the DNA extraction system
is based on a reversal of the silica principle”. The same set of authors (Cardozo et al., 2012)
described this method as using “porous matrices associated with polyanilines nano-layers, which
are able to retain selectively biopolymers and potential PCR inhibiting substances, while nucleic
acids are never bound and remain in solution”, based on earlier technology developed by
Kapustin et al. (2003). The validation study of the FDF® Kit, performed by Kopka et al. (2011),
included analysis of DNA samples from multiple components (trigger, magazine, slide barrel,
and hammer) of four different pistols and a revolver along with cartridge casings fired from
them. Only results for three partial electropherograms (samples from a trigger, magazine, and
slide barrel of a single firearm) were presented, which were consistent with the handler. The
authors stated “the profile was altered in the fired cartridge case (not shown). Similar results
were obtained with all guns tested and with all replicate samples from the same gun”. Data
presented by Kopka et al. (2011) are scarce, consequently it is unclear the success in DNA
recovery FDF® Kits may have on spent cartridge casings.
10
Real-Time PCR: Targeting Loci for DNA Quantification
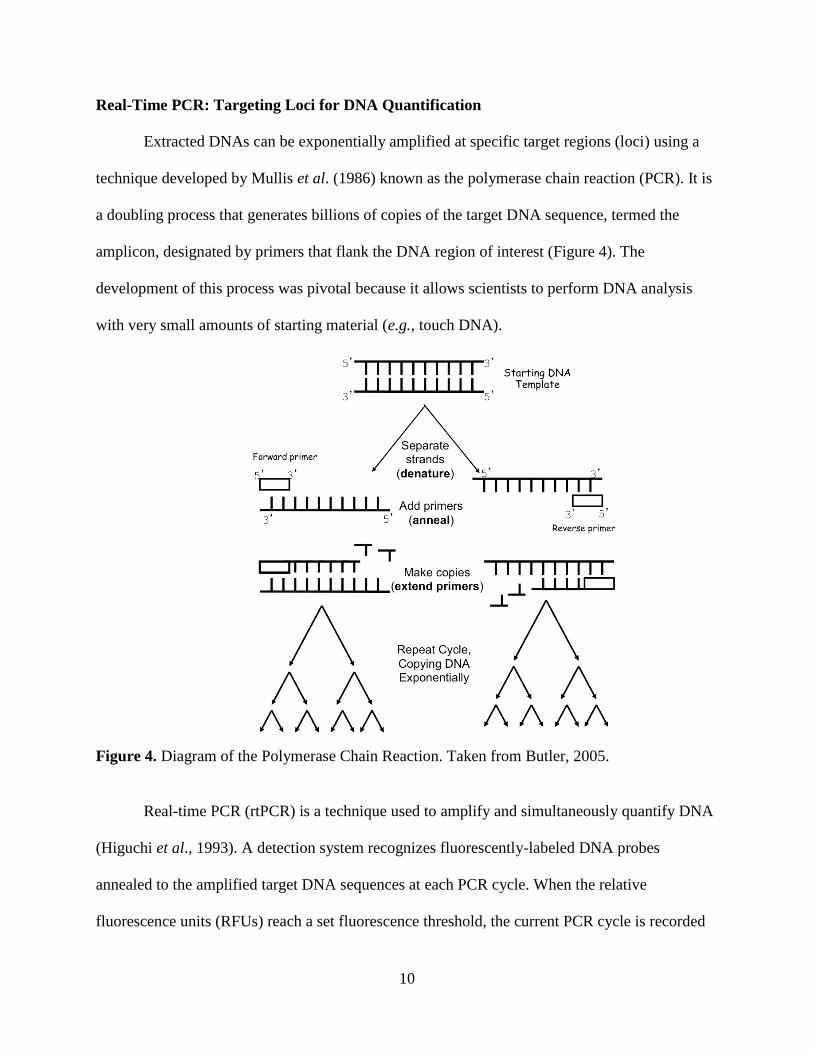
Extracted DNAs can be exponentially amplified at specific target regions (loci) using a
technique developed by Mullis et al. (1986) known as the polymerase chain reaction (PCR). It is
a doubling process that generates billions of copies of the target DNA sequence, termed the
amplicon, designated by primers that flank the DNA region of interest (Figure 4). The
development of this process was pivotal because it allows scientists to perform DNA analysis
with very small amounts of starting material (e.g., touch DNA).
Figure 4. Diagram of the Polymerase Chain Reaction. Taken from Butler, 2005.
Real-time PCR (rtPCR) is a technique used to amplify and simultaneously quantify DNA
(Higuchi et al., 1993). A detection system recognizes fluorescently-labeled DNA probes
annealed to the amplified target DNA sequences at each PCR cycle. When the relative
fluorescence units (RFUs) reach a set fluorescence threshold, the current PCR cycle is recorded
11
as the cycle threshold (Ct) value for each sample. Ct values are directly proportional to the initial
amount of DNA in a rtPCR reaction, so samples with more starting DNA will reach the threshold
at earlier cycles than those with less starting DNA. DNA standards of known concentration are
simultaneously amplified and a standard curve is generated with the DNA concentrations and Ct
values associated. The concentrations of unknown samples are calculated based on their Ct
values plotted on the standard curve.
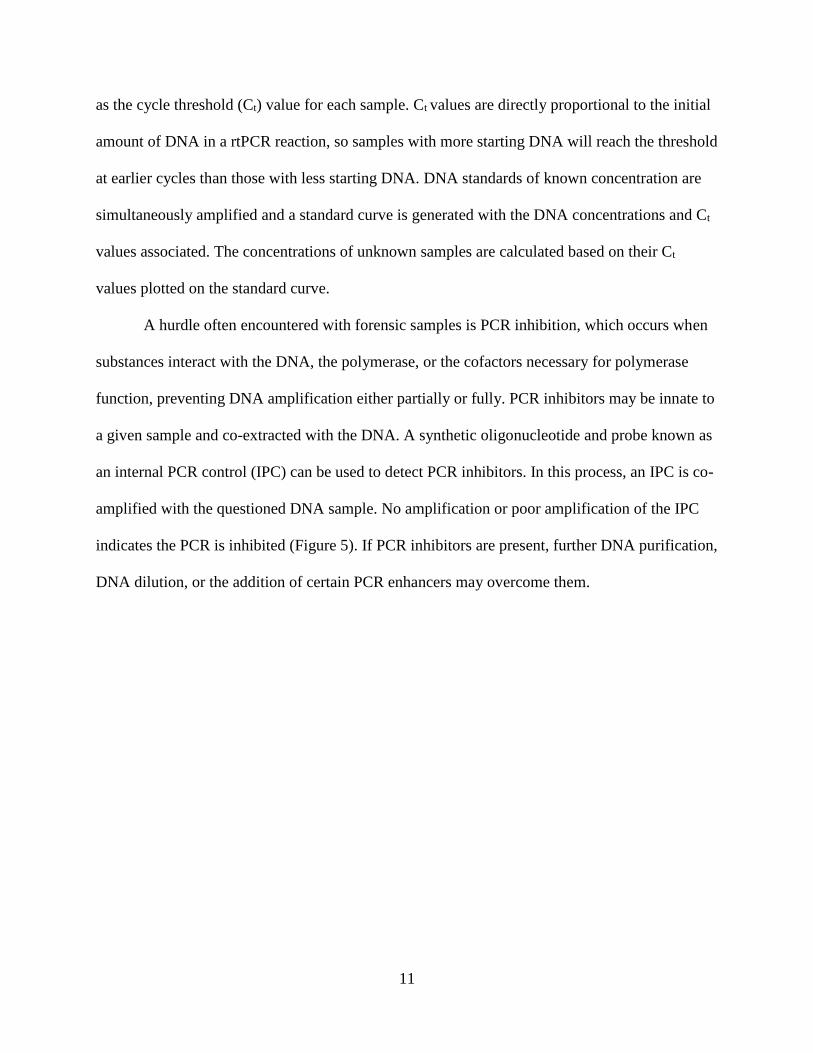
A hurdle often encountered with forensic samples is PCR inhibition, which occurs when
substances interact with the DNA, the polymerase, or the cofactors necessary for polymerase
function, preventing DNA amplification either partially or fully. PCR inhibitors may be innate to
a given sample and co-extracted with the DNA. A synthetic oligonucleotide and probe known as
an internal PCR control (IPC) can be used to detect PCR inhibitors. In this process, an IPC is co-
amplified with the questioned DNA sample. No amplification or poor amplification of the IPC
indicates the PCR is inhibited (Figure 5). If PCR inhibitors are present, further DNA purification,
DNA dilution, or the addition of certain PCR enhancers may overcome them.
12
Figure 5. IPC Amplification Plot: The x-axis of the graph represents the cycle number, while the
y-axis is the amount of fluorescence. The cycle threshold (Ct) value is the cycle number in which
the sample passes the threshold line and this value is used to determine the starting concentration
of DNA. In this example, one sample was inhibited and did not cross the threshold. The IPC for
all other reactions had a Ct value of approximately 25, indicating successful amplification and no
PCR inhibition.
Standard methods for quantifying DNA samples (e.g., Quantifiler® Human DNA
Quantification Kits) target single-copy loci. Green et al. (2005) found Quantifiler® could detect
as little as 32 pg of DNA. However, this is disadvantageous when working with even smaller
amounts of DNA, where the chance for stochastic sampling (explained below) increases and
some single-copy loci may not be detected, making interpretation of STR profiles difficult. DNA
quantification based on high-copy loci that are present in copious amounts throughout the human
genome is one strategy for overcoming this problem. Because they are ubiquitous, some of these
loci will still be available even when a DNA sample is LCN or degraded. This makes high-copy
loci a sensitive target for DNA quantification.
PC
R B
ase
Lin
e S
ubtr
acte
d R
FU
Cycle Number
Threshold
Inhibited Sample
13
The most abundant repetitive element in human DNA is the ~ 300 bp Alu sequence,
which is present on every chromosome and makes up 10% of the human genome (Batzer and
Deininger, 2002; Mighell et al., 1997). Nicklas and Buel (2006) utilized the Alu subfamily Ya5
to quantify human DNA samples down to as little as 0.5 pg, or almost two orders of magnitude
lower than Quantifiler®. However, Alu and other high-copy loci are sensitive to contamination by
minuscule amounts of foreign DNA in the reagents and equipment used for DNA extraction and
quantification. Kiley (2009) found commercially purchased Alu primers contained human DNA
contamination, which she controlled by filtration through Microcon YM-30 columns and UV
irradiation of all PCR reagents (with the exception of the polymerase and dNTPs) for 30 s – 60 s
(0.25 – 0.5 J/cm2, respectively).
STR Analysis: Identifying Individuals
Forensic DNA analysis utilizes PCR to amplify short tandem repeats (STRs) at multiple
loci simultaneously, and capillary electrophoresis to separate amplicons by size. STRs are
regions of repetitive DNA sequences that consist of core repeat units (2 – 6 bp) and the number
of repeat units vary among individuals (Figure 6). A person inherits one allele, or STR variant,
from each parent at a given locus. The high variability of alleles and the examination of multiple
loci are what make STR analysis an effective tool for uniquely identifying individuals.
14
Figure 6. Diagram of a short tandem repeat (STR) allele at the TH01 locus. In this example,
there are nine repeat units (TCAT) between the flanking regions, so the individual has a 9 allele.
The second allele at TH01 comes from their other parent, and may contain the same or a
different number of repeat units. Taken from Butler, 2005.
An STR profile is a compilation of the genetic information at multiple loci from a DNA
sample. For example, if a perpetrator’s blood stain is left at a scene, then the STR profile
produced from it can be compared to the STR profile of a suspect. If the alleles are the same in
both profiles, a random match probability (RMP) is then calculated. This value corresponds to
the likelihood that a random, unrelated individual of the same ancestry (e.g., Caucasian, African-
American, Hispanic) as the suspect has the same STR profile as the suspect/blood stain. Even
using the most common U.S. Caucasian alleles at the 13 CODIS loci generates a RMP value of 1
in 160 billion, far more than the number of people on Earth.
More often than not, the low copy, degraded state of touch DNA causes STR profiles to
be partial, making analysis and interpretation challenging. DNA degradation may result from an
array of mechanisms (e.g., enzymatic and chemical processes) or environmental factors (e.g.,
temperature, humidity, and pH) (Poinar, 2003; Lee and Ladd, 2001; Lindahl, 1993).
Consequently, alleles that should be present may be missing from an STR profile (known as
allelic drop-out). Additionally, degraded or LCN DNA is susceptible to preferential
amplification and stochastic effects that lead to unequal amplification of template DNA.
15
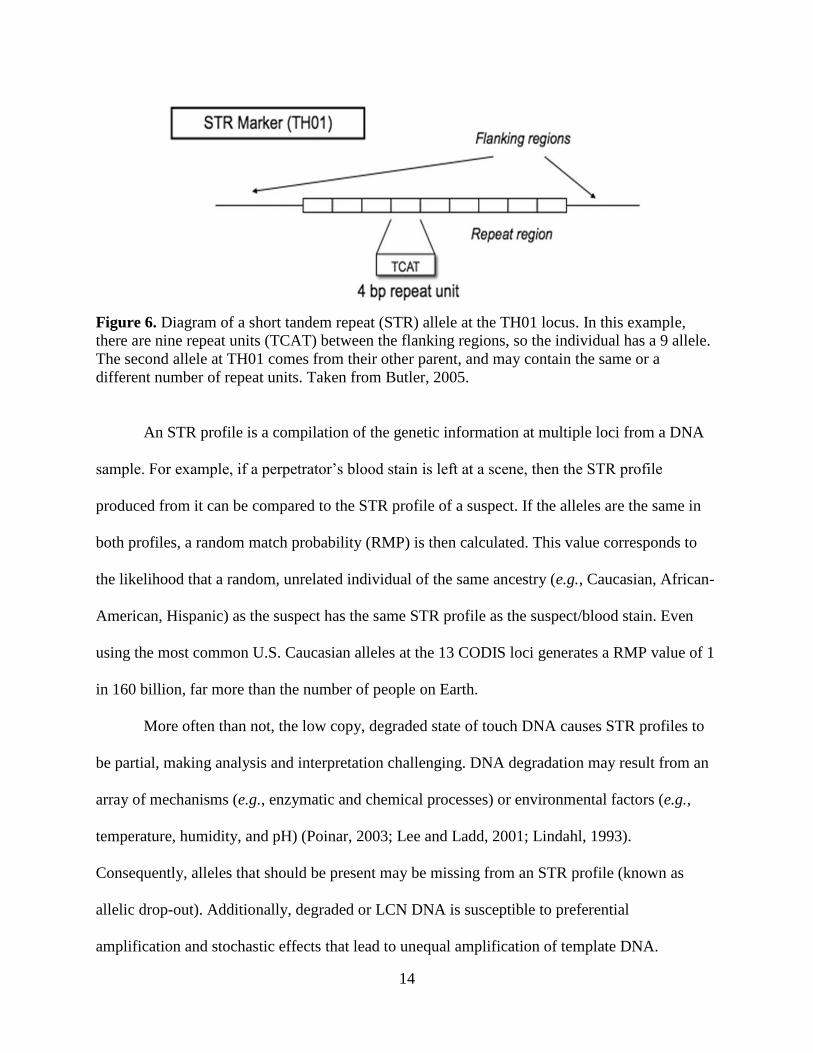
Preferential amplification occurs when one allele amplifies more efficiently than the other
because of differences in their length or sequence. Stochastic (random) sampling effects occur in
the initial cycles of PCR amplification when due to chance, the low abundance or absence of
template DNA may result in minimal to no DNA amplification (Figure 7; Butler and Hill, 2010;
Gill et al., 2000; Walsh et al., 1992). Both of these scenarios may lead to peak height imbalance
of heterozygous alleles at a given locus, which can result in drop-out—when a peak becomes
indistinguishable from the background noise. Two other artifacts common to profiles generated
from LCN DNA and stochastic sampling are allelic drop-in and stutter. Drop-in is the presence
of STR alleles in a DNA profile that are generally not repeatable. A stutter peak is caused by the
DNA strand slipping during replication, resulting in an amplicon one repeat unit smaller, or on
rare occasions larger, than the true allele. In pristine DNA samples, stutter is easily identifiable,
however, stutter peaks from LCN DNA can potentially have equal or greater peak heights in
comparison to the true allele (Butler and Hill, 2010; Budowle et al., 2009; Murray et al., 1993).
All four of these STR artifacts are illustrated in Figure 8.
Figure 7. An example of stochastic sampling effects. When a small number of DNA templates
are available from the start, there is a chance that some alleles will be amplified more than the
others, resulting in imbalanced allele peak height. Taken from Krane, 2007.
16
Figure 8. Common STR artifacts as a result of stochastic sampling effects and low copy,
degraded DNA. Taken from Butler and Hill, 2010.
Some PCR amplification kits are designed specifically for DNA that is degraded, LCN,
and/or inhibited. Table 1 shows a comparison of two such kits: the AmpFℓSTR® MiniFiler™
PCR Amplification Kit and the PowerPlex® Fusion System.
Table 1. Comparison of the AmpFℓSTR® MiniFiler™ and the PowerPlex® Fusion (Life
Technologies, 2014; Promega, 2014).
AmpFℓSTR® MiniFiler™ PCR
Amplification Kit PowerPlex® Fusion System
Strengths
Optimized for genotyping
degraded and/or inhibited DNA
samples
Includes high inhibitor tolerance
and sensitivity
Total # of Loci 8 autosomal STR loci and
1 sex-related locus (Amelogenin)
22 autosomal STR loci and
2 sex-related loci (Amelogenin
and DYS391)
# of Loci < 300 bp 9 14
Minimal DNA Input
for Full STR Profile 125 pg 100 pg
PCR Run Time 156 minutes 61 minutes
Correct
Genotype: 10,11 12,14 12,13 18,19
17
Previous Studies on DNA Recovered from Spent Casings
The feasibility of generating STR profiles from spent cartridge casings has been
examined previously. Horsman-Hall et al. (2009) investigated several aspects of analyzing DNA
from spent casings in order to better understand the effect of extraction methods, firing, and PCR
inhibition. DNA was isolated from spent casings via four common DNA extraction methods and
the yields were compared. Organic extraction followed by Microcon purification recovered a
significantly lower amount of DNA than a commercial DNA extraction method (DNA IQ™
System) with varying additions (lysis buffer without proteinase K, proteinase K with 20%
sarkosyl, or proteinase K with SDS) and subsequent DNA IQ™ manual purification. Pairwise t-
tests showed that the DNA yields from the three DNA IQ™ extraction methods did not differ
significantly. Furthermore, there was no significant difference in the total amount of DNA
recovered from the casings after the weapons were fired, though full genetic profiles were only
generated from the unfired casings. AmpFℓSTR® MiniFiler™, PowerPlex®16, and AmpFℓSTR®
Identifiler® PCR Amplification Kits were compared for their success in allele recovery.
Identifiler® did not amplify any STR alleles, and a significantly greater number of alleles were
recovered with MiniFiler™ than with PowerPlex®16. At least half of the expected alleles, those
consistent with the cartridge handlers, were present in over 30 percent of the MiniFiler™ profiles.
PCR inhibition, most likely from the metals of the cartridge casings or residual primer
components, was encountered in a portion of the samples, and MiniFiler™ was more successful
in dealing with it than PowerPlex®16. Treatment with bovine serum albumin (BSA) and
additional Taq polymerase did not greatly improve the PowerPlex®16 results. The results of this
study demonstrated that organic extraction may not be the best method for DNA isolation from
18
fired cartridge casings. Furthermore, MiniFiler™ recovered the most STR alleles, which is
consistent with expectations since this kit was designed for degraded and inhibited DNA.
Spear et al. (2005) attempted to recover DNA from planted fingerprints. After the casings
were processed for fingerprints, they were swabbed and DNA was organically extracted and
amplified with an AmpFℓSTR® Profiler Plus® Kit. Only three of the 48 casings generated a DNA
profile, all of which came from bloody fingerprints. One of the three resulted from a fired casing
and nine of the ten loci in that profile contained allelic information. It was not specified whether
the alleles were consistent with the blood donor. Additionally, it is not known if fingerprint
processing prior to DNA analysis had an effect on the STR results. This study accentuated the
need for an optimized method for obtaining a DNA profile from spent cartridge casings.
Orlando (2012) studied different methods for DNA recovery and analysis from spent
cartridge casings. Thirty-three volunteers loaded 10 cartridges directly from a box of ammunition
into the magazine of a pistol. Two swabbing procedures were compared in an attempt to
determine which generated higher DNA yields while minimizing contamination and PCR
inhibition. An individual swabbing method used a double swab technique (first a swab wetted
with 100 μL of 5% sodium dodecyl sulfate (SDS) followed by a dry swab) for each casing. A
cumulative swabbing method involved multiple casings swabbed consecutively using a single
wetted swab, followed by a dry swab. There was no significant difference in DNA yield between
swabbing methods. An AmpFℓSTR® Identifiler® Plus Kit was used for STR analysis and
consensus STR profiles were created using the five profiles from individual swabs. Among
cumulative, single, and consensus profiling, 22% to 31% of the alleles recovered were consistent
with the loader. The majority of the STR profiles contained only a few alleles; weak partial
profiles (7 or fewer loci with alleles) were developed in 67.7% of the cumulatively swabbed
19
samples, 74.2% of the individually swabbed samples, and 64.5% of the consensus profiles. Only
one full consensus profile was generated, which was achieved with five individually swabbed
casings, three of which produced full profiles. Orlando (2012) found higher DNA yields were
recovered from cumulatively swabbing casings rather than individual swabbing, although this
did not necessarily mean the alleles amplified were consistent with the loader. Furthermore,
while the quantity of DNA recovered from the casings was often very low and at times
quantified as zero, STR alleles were still sometimes called. These results support the need and
utility of high-copy loci for accurately quantifying degraded, LCN samples.
In a retrospective study at the Forensic Laboratory for DNA Research in the Netherlands,
Dieltjes et al. (2011) developed a method to recover and extract DNA. The authors used a
Qiagen QIAamp® DNA Mini Kit on 4,085 items (cartridges, bullets, and casings) collected
among 616 cases and performed a modified version of the manufacturer’s protocol for
bloodstains. Casings were soaked in sterile 10-mL round bottom tubes with 400 μL of buffer and
rotated at a non-specified angle for 30 minutes. Following soaking, casings were swabbed with a
dry sterile cotton swab and the samples underwent a pre-digestion incubation for 10 minutes at
85°C. DNAs were amplified with PowerPlex® 16. The author’s noted “since the success rates for
cartridges and casings were rather similar, we combined their results”. The success rate per
criminal case was defined as “the number of criminal cases in which at least one DNA profile
could be reported”. The average success rate of obtaining a reproducible STR profile (defined as
multiple amplifications of a locus two or more times from a single DNA extract) from
cartridges/casings was 26.5%. Examining all three types of evidence, the authors obtained 283
reproducible STR profiles (98.9% contained STR data at four or more loci), 84.1% of which
were consistent with a single individual (i.e., 2 or fewer peaks per locus). Additionally, 51 STR
20
profiles were full—containing alleles from all 15 loci. However, the authors did not clarify
which items yielded which results, thus it is unknown how much of the STR data was from spent
casings. Furthermore, it is not clear if known STR profiles were available to make comparisons
with the 4,085 cartridges, bullets, and casings analyzed.
Goals of This Study
To date, developing full STR profiles using DNA recovered from spent casings has been
minimally successful. The research presented here was designed to test the hypothesis that spent
cartridge casings can be a useful source of DNA if the methods for its recovery and extraction
are optimized. Therefore, the first goal of this research was to optimize and compare methods for
the recovery, isolation, and purification of touch DNA present on cartridge casings. Multiple
variables were examined, including swabbing versus soaking casings, shaking casings during
soaking, pre-digestion incubation of soaked samples at 85°C, shaking swabs during digestion,
and the duration of digestion. Following optimization, DNA yields and STR results were
compared among five cell recovery and DNA extraction methods: double swabbing with an
organic extraction, soaking with an organic extraction, double swabbing with a silica-based
extraction, soaking with a silica-based extraction, and single swabbing followed by a non-
binding DNA extraction (FDF® Kit). The second goal was to compare the performance
characteristics of two STR analysis kits—AmpFℓSTR® MiniFiler™ and PowerPlex® Fusion—
with the intent to identify the system with maximal allele recovery and the highest degree of STR
allele consistency between the loader and the DNA from the casings. Overall, the research
presented here was an evaluation of five optimized methods for cell recovery and DNA

21
extraction and two STR amplification kits, to determine an enhanced process for touch DNA
analysis from spent casings.
22
MATERIALS AND METHODS
Cotton swabs (860-PPC, Puritan Medical Products, Guilford, ME), tubes, and pipette tips
were autoclaved at 135°C for 45 min, followed by a 1 h dry cycle. All supplies (e.g., tubes,
racks, scissors, hemostats, cotton swabs, pipettes, tips) and reagents used in pre-amplification
procedures were ultraviolet (UV) irradiated for at least 5 min (approximately 2.5 J/cm2), per side
if applicable, in a Spectrolinker XL-1500 UV Crosslinker (Spectronics Corporation, Westbury,
NY) and a laboratory coat, face mask, sleeves, and two pairs of gloves were worn. Reagent
blanks were created with each DNA extraction and they, along with positive and negative
controls, were quantified with every rtPCR assay.
Methods for Cell Recovery
Swabbing Cartridge Casings
A double swab technique (Sweet et al., 1997) was used in conjunction with organic or
QIAamp® DNA Investigator Kit (Qiagen, Hilden, Germany) extractions (detailed below) on live
and spent cartridge casings. The first cotton swab was wetted with 150 μL of digestion buffer
(0.1% SDS, 20 mM Tris [pH 7.5], 50 mM EDTA) for organic extraction or 150 μL of Buffer
ATL (tissue lysis buffer) for QIAamp® DNA Investigator Kit extraction. Casings were double-
swabbed individually, and swab heads were clipped and added to 1.5 mL microcentrifuge tubes
containing 400 μL of digestion/tissue lysis buffer and either 5 μL of proteinase K (20 mg/mL)
for an organic extraction or 20 μL of proteinase K (Qiagen). Tubes were vortexed for 10 s and
incubated overnight at 55°C. A single swab was used in combination with Fingerprint DNA
Finder® Kit (FDF® Kit; NEXTTEC™ Biotechnologie GmbH, Hilgertshausen, Germany)
extraction following the manufacturer’s protocol. Individual swabs wetted with 30 μL of Lysis
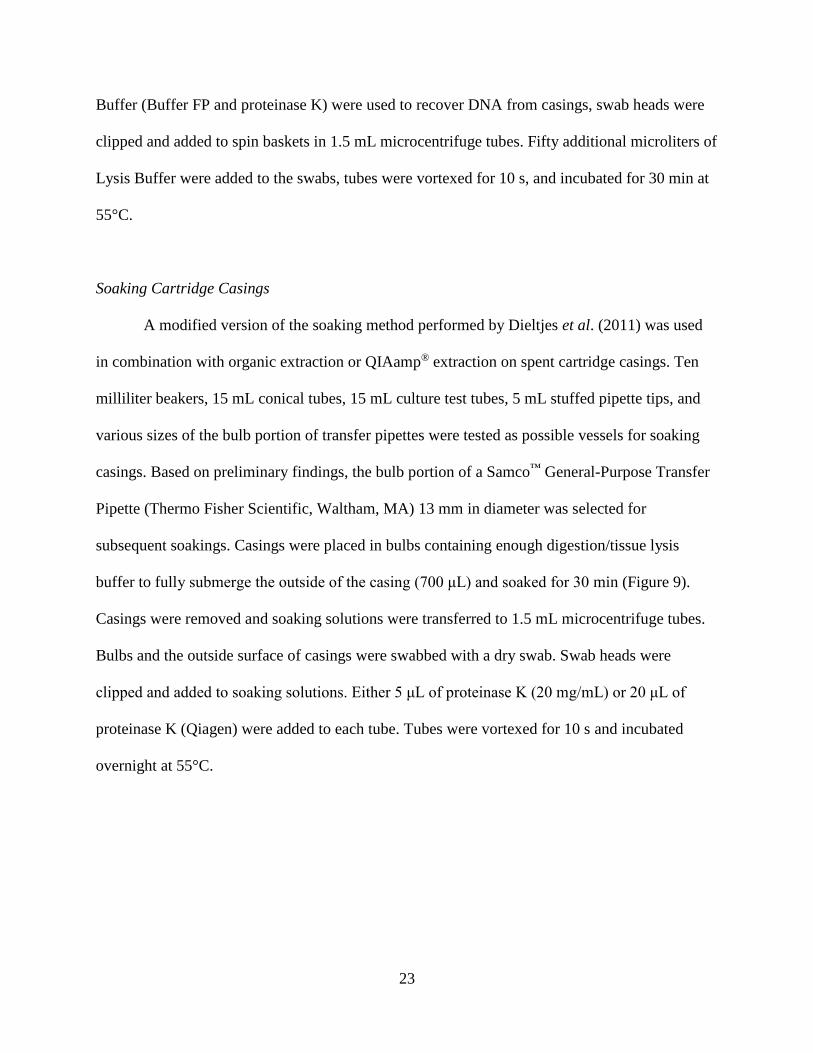
23
Buffer (Buffer FP and proteinase K) were used to recover DNA from casings, swab heads were
clipped and added to spin baskets in 1.5 mL microcentrifuge tubes. Fifty additional microliters of
Lysis Buffer were added to the swabs, tubes were vortexed for 10 s, and incubated for 30 min at
55°C.
Soaking Cartridge Casings
A modified version of the soaking method performed by Dieltjes et al. (2011) was used
in combination with organic extraction or QIAamp® extraction on spent cartridge casings. Ten
milliliter beakers, 15 mL conical tubes, 15 mL culture test tubes, 5 mL stuffed pipette tips, and
various sizes of the bulb portion of transfer pipettes were tested as possible vessels for soaking
casings. Based on preliminary findings, the bulb portion of a Samco™ General-Purpose Transfer
Pipette (Thermo Fisher Scientific, Waltham, MA) 13 mm in diameter was selected for
subsequent soakings. Casings were placed in bulbs containing enough digestion/tissue lysis
buffer to fully submerge the outside of the casing (700 μL) and soaked for 30 min (Figure 9).
Casings were removed and soaking solutions were transferred to 1.5 mL microcentrifuge tubes.
Bulbs and the outside surface of casings were swabbed with a dry swab. Swab heads were
clipped and added to soaking solutions. Either 5 μL of proteinase K (20 mg/mL) or 20 μL of
proteinase K (Qiagen) were added to each tube. Tubes were vortexed for 10 s and incubated
overnight at 55°C.
24
Figure 9. Example of a casing soaking in 700 μL of digestion/tissue lysis buffer.
Methods for DNA Extraction
Organic Extraction
Swab heads from swabbings were transferred to spin baskets (Fitzco, Spring Park, MN)
using hemostats and centrifuged at 20,000 relative centrifugal force (rcf) for 4 min. Heads were
discarded and flow-throughs were transferred to the original tubes. Equal volumes of phenol
were added to the tubes, which were vortexed for 10 s and centrifuged at maximum speed for 5
min. Aqueous layers were transferred to new 1.5 mL microcentrifuge tubes containing equal
volumes of chloroform. Tubes were vortexed for 10 s and centrifuged at maximum speed for 5
min. Amicon® Ultra-0.5 mL, 30 kDa filtration columns (Millipore Corporation, Billerica, MA)
were pre-treated with 1 μL of 10 μg/μL yeast (Saccharomyces cerevisiae) rRNA (Alfa Aesar,
Ward Hill, MA) and 499 μL of low TE (10 mM Tris [pH 7.5], 0.1 mM EDTA), centrifuged at
14,000 rcf for 10 min, and flow-throughs were discarded. Aqueous layers were transferred to the
pre-treated spin columns, centrifuged at 14,000 rcf for 10 min, and flow-throughs discarded.
DNAs were washed with 300 μL of TE (10 mM Tris [pH 7.5], 1 mM EDTA), centrifuged at
14,000 rcf for 10 min, and flow-throughs discarded. Two additional washes were performed with
300 μL of low TE. Filtration columns were inverted into new Amicon® collection tubes and
centrifuged at 1,000 rcf for 3 min to collect retentates. Organic extractions were performed on
25
DNAs from buccal swabs in the same manner, except two washes with TE and one with low TE
were performed. DNAs were stored at -20°C.
QIAamp® DNA Investigator Extraction
Swab heads were transferred to spin baskets using hemostats and centrifuged at 20,000
rcf for 4 min. Heads were discarded and flow-throughs were collected in the original tubes. DNA
isolations and purifications were performed per the manufacturer’s protocol for surface and
buccal swabs, including the addition of carrier RNA to Buffer AL, with the following
modification: three elutions were collected for each DNA extraction by adding 20 μL of Buffer
ATE to column membranes, incubating at room temperature for 5 min, and centrifuging at
maximum speed for 3 min (Hebda et al., in press).
Fingerprint DNA Finder® Extraction
Prior to performing FDF® extractions on DNA recovered from spent casings, known
genomic male DNA (145 ng/µL, Promega) was extracted with solutions from an FDF® Kit
(Buffer FP and Prep Solution) that were either UV irradiated for 10 min or not treated. Based on
lower DNA yields, none of the reagents in the FDF® extractions were UV irradiated for
subsequent experiments. DNAs were extracted and purified according to the manufacturer’s
protocol for isolation of genomic DNA from fingerprints and low template DNA samples.
DNA Quantification via Real-Time PCR Analysis
Volumes of the DNA extracts were measured prior to DNA quantification. PCR
amplification was performed on an iCycler™ Thermal Cycler (Bio-Rad Laboratories, Hercules,
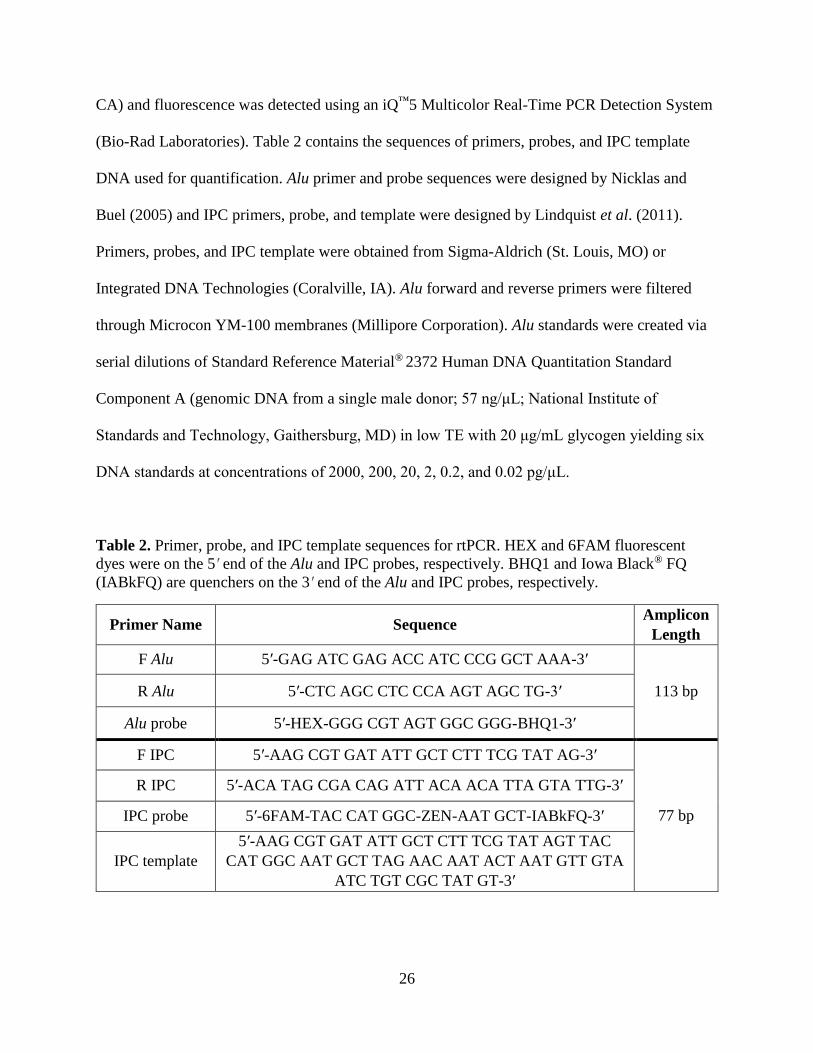
26
CA) and fluorescence was detected using an iQ™5 Multicolor Real-Time PCR Detection System
(Bio-Rad Laboratories). Table 2 contains the sequences of primers, probes, and IPC template
DNA used for quantification. Alu primer and probe sequences were designed by Nicklas and
Buel (2005) and IPC primers, probe, and template were designed by Lindquist et al. (2011).
Primers, probes, and IPC template were obtained from Sigma-Aldrich (St. Louis, MO) or
Integrated DNA Technologies (Coralville, IA). Alu forward and reverse primers were filtered
through Microcon YM-100 membranes (Millipore Corporation). Alu standards were created via
serial dilutions of Standard Reference Material® 2372 Human DNA Quantitation Standard
Component A (genomic DNA from a single male donor; 57 ng/μL; National Institute of
Standards and Technology, Gaithersburg, MD) in low TE with 20 μg/mL glycogen yielding six
DNA standards at concentrations of 2000, 200, 20, 2, 0.2, and 0.02 pg/μL.
Table 2. Primer, probe, and IPC template sequences for rtPCR. HEX and 6FAM fluorescent
dyes were on the 5′ end of the Alu and IPC probes, respectively. BHQ1 and Iowa Black® FQ
(IABkFQ) are quenchers on the 3′ end of the Alu and IPC probes, respectively.
Primer Name Sequence Amplicon
Length
F Alu 5′-GAG ATC GAG ACC ATC CCG GCT AAA-3′
113 bp R Alu 5′-CTC AGC CTC CCA AGT AGC TG-3′
Alu probe 5′-HEX-GGG CGT AGT GGC GGG-BHQ1-3′
F IPC 5′-AAG CGT GAT ATT GCT CTT TCG TAT AG-3′
77 bp
R IPC 5′-ACA TAG CGA CAG ATT ACA ACA TTA GTA TTG-3′
IPC probe 5′-6FAM-TAC CAT GGC-ZEN-AAT GCT-IABkFQ-3′
IPC template
5′-AAG CGT GAT ATT GCT CTT TCG TAT AGT TAC
CAT GGC AAT GCT TAG AAC AAT ACT AAT GTT GTA
ATC TGT CGC TAT GT-3′
27
Real-time PCR reactions were set up in 0.2 mL optically clear flat-capped PCR strips
(USA Scientific®, Ocala, FL) with final volumes of 15 μL. rtPCR reactions consisted of 7.5 μL
of iQ™ Supermix (Bio-Rad Laboratories), 500 nM Alu forward primer, 900 nM Alu reverse
primer, 250 nM Alu probe, 1 µM IPC forward and reverse primer, 250 nM IPC probe, 1 µL of
the working concentration of IPC template DNA (1:1 billion dilution of 100 µM stock), 0.625
units of Taq DNA polymerase (5 U/µL; Empirical Bioscience, Grand Rapids, MI), 0.625 µL of
deionized water (diH2O), and 1 µL of DNA. DNA standards were run in duplicate. rtPCR
cycling parameters included: 3 min at 95˚C, followed by 50 cycles of 15 s at 95˚C and 1 min at
60˚C.
Data were analyzed with iQ™5 Optical System Software. A standard curve was generated
based on the Ct values of the DNA standards, and DNA concentrations of the samples were
extrapolated. DNA yields (pg) were calculated by multiplying rtPCR concentrations (pg/µL) by
DNA extract volumes (µL).
STR Amplification
The highest quantifying DNAs from Collections 1 and 2 (described below) were
amplified on an Applied Biosystems 2720 Thermal Cycler (Life Technologies, Carlsbad, CA)
using an AmpFℓSTR® MiniFiler™ PCR Amplification Kit (Life Technologies) and a PowerPlex®
Fusion System (Promega, Madison, WI), to determine which resulted in the most allele calls.
Based on greater recovery of allelic data, all DNAs organically extracted were amplified with
Fusion, as were subsets of the DNA extracts from the other optimized methods, beginning at the
highest concentrations. Once samples yielded no STR results, further amplification at lower
concentrations was stopped. Reagent volumes and cycling parameters are listed in Table 3. In
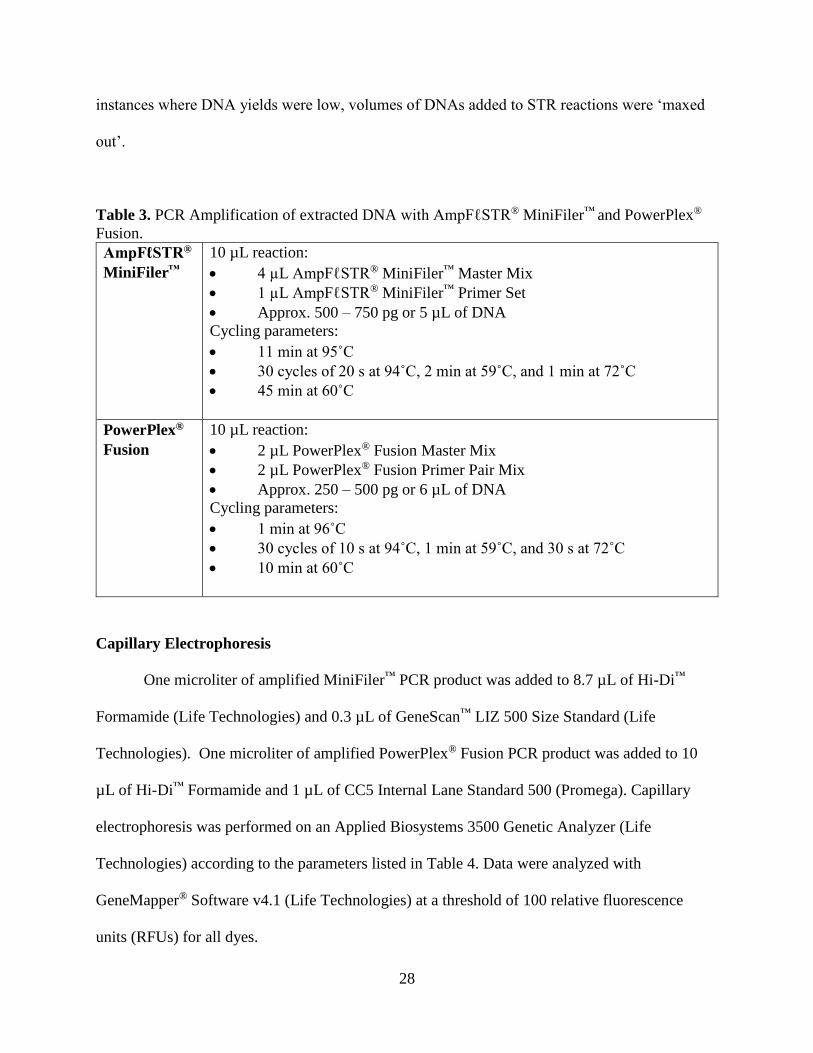
28
instances where DNA yields were low, volumes of DNAs added to STR reactions were ‘maxed
out’.
Table 3. PCR Amplification of extracted DNA with AmpFℓSTR® MiniFiler™ and PowerPlex®
Fusion.
AmpFℓSTR®
MiniFiler™
10 µL reaction:
4 µL AmpFℓSTR® MiniFiler™ Master Mix
1 µL AmpFℓSTR® MiniFiler™ Primer Set
Approx. 500 – 750 pg or 5 µL of DNA
Cycling parameters:
11 min at 95˚C
30 cycles of 20 s at 94˚C, 2 min at 59˚C, and 1 min at 72˚C
45 min at 60˚C
PowerPlex®
Fusion
10 µL reaction:
2 µL PowerPlex® Fusion Master Mix
2 µL PowerPlex® Fusion Primer Pair Mix
Approx. 250 – 500 pg or 6 µL of DNA
Cycling parameters:
1 min at 96˚C
30 cycles of 10 s at 94˚C, 1 min at 59˚C, and 30 s at 72˚C
10 min at 60˚C
Capillary Electrophoresis
One microliter of amplified MiniFiler™ PCR product was added to 8.7 µL of Hi-Di™
Formamide (Life Technologies) and 0.3 µL of GeneScan™ LIZ 500 Size Standard (Life
Technologies). One microliter of amplified PowerPlex® Fusion PCR product was added to 10
µL of Hi-Di™ Formamide and 1 µL of CC5 Internal Lane Standard 500 (Promega). Capillary
electrophoresis was performed on an Applied Biosystems 3500 Genetic Analyzer (Life
Technologies) according to the parameters listed in Table 4. Data were analyzed with
GeneMapper® Software v4.1 (Life Technologies) at a threshold of 100 relative fluorescence
units (RFUs) for all dyes.
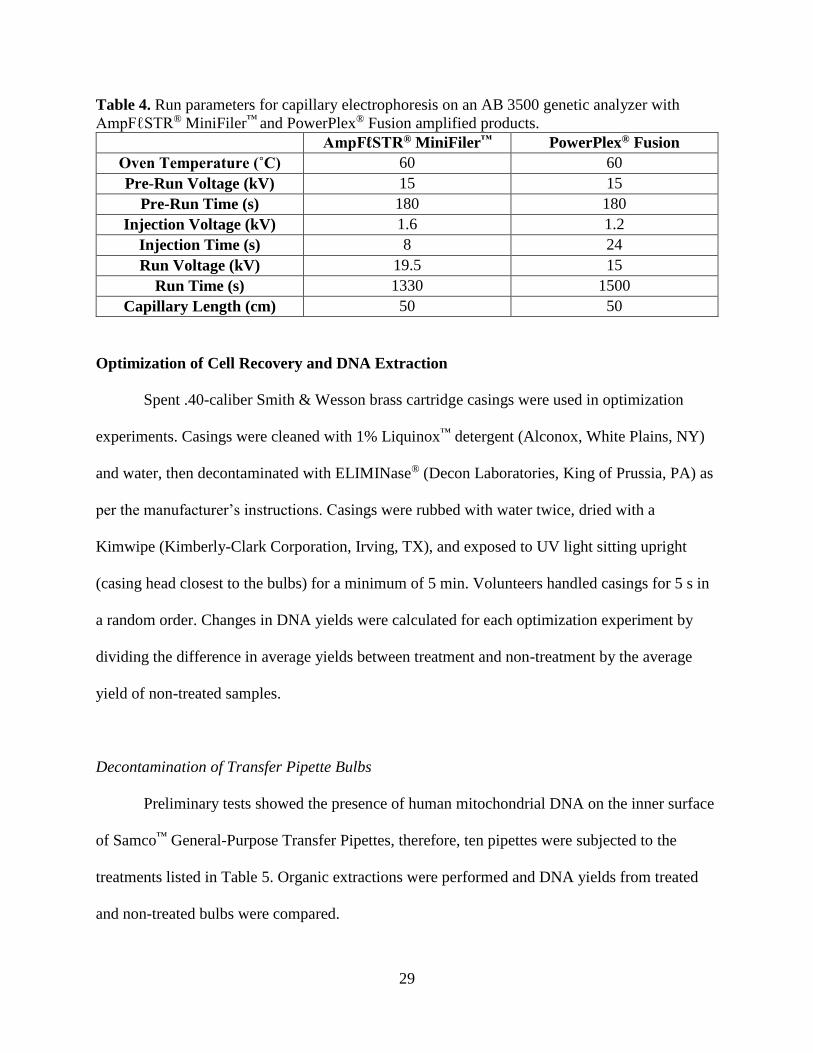
29
Table 4. Run parameters for capillary electrophoresis on an AB 3500 genetic analyzer with
AmpFℓSTR® MiniFiler™ and PowerPlex® Fusion amplified products.
AmpFℓSTR® MiniFiler™ PowerPlex® Fusion
Oven Temperature (˚C) 60 60
Pre-Run Voltage (kV) 15 15
Pre-Run Time (s) 180 180
Injection Voltage (kV) 1.6 1.2
Injection Time (s) 8 24
Run Voltage (kV) 19.5 15
Run Time (s) 1330 1500
Capillary Length (cm) 50 50
Optimization of Cell Recovery and DNA Extraction
Spent .40-caliber Smith & Wesson brass cartridge casings were used in optimization
experiments. Casings were cleaned with 1% Liquinox™ detergent (Alconox, White Plains, NY)
and water, then decontaminated with ELIMINase® (Decon Laboratories, King of Prussia, PA) as
per the manufacturer’s instructions. Casings were rubbed with water twice, dried with a
Kimwipe (Kimberly-Clark Corporation, Irving, TX), and exposed to UV light sitting upright
(casing head closest to the bulbs) for a minimum of 5 min. Volunteers handled casings for 5 s in
a random order. Changes in DNA yields were calculated for each optimization experiment by
dividing the difference in average yields between treatment and non-treatment by the average
yield of non-treated samples.
Decontamination of Transfer Pipette Bulbs
Preliminary tests showed the presence of human mitochondrial DNA on the inner surface
of Samco™ General-Purpose Transfer Pipettes, therefore, ten pipettes were subjected to the
treatments listed in Table 5. Organic extractions were performed and DNA yields from treated
and non-treated bulbs were compared.
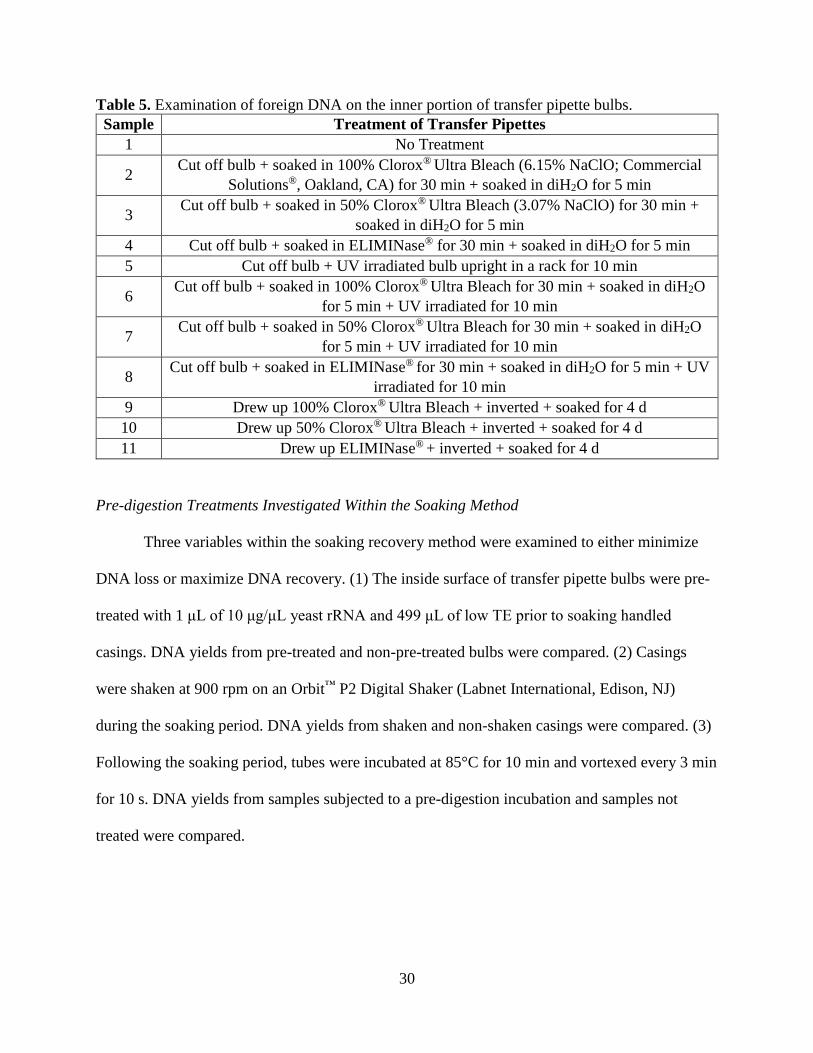
30
Table 5. Examination of foreign DNA on the inner portion of transfer pipette bulbs.
Sample Treatment of Transfer Pipettes
1 No Treatment
2 Cut off bulb + soaked in 100% Clorox® Ultra Bleach (6.15% NaClO; Commercial
Solutions®, Oakland, CA) for 30 min + soaked in diH2O for 5 min
3 Cut off bulb + soaked in 50% Clorox® Ultra Bleach (3.07% NaClO) for 30 min +
soaked in diH2O for 5 min
4 Cut off bulb + soaked in ELIMINase® for 30 min + soaked in diH2O for 5 min
5 Cut off bulb + UV irradiated bulb upright in a rack for 10 min
6 Cut off bulb + soaked in 100% Clorox® Ultra Bleach for 30 min + soaked in diH2O
for 5 min + UV irradiated for 10 min
7 Cut off bulb + soaked in 50% Clorox® Ultra Bleach for 30 min + soaked in diH2O
for 5 min + UV irradiated for 10 min
8 Cut off bulb + soaked in ELIMINase® for 30 min + soaked in diH2O for 5 min + UV
irradiated for 10 min
9 Drew up 100% Clorox® Ultra Bleach + inverted + soaked for 4 d
10 Drew up 50% Clorox® Ultra Bleach + inverted + soaked for 4 d
11 Drew up ELIMINase® + inverted + soaked for 4 d
Pre-digestion Treatments Investigated Within the Soaking Method
Three variables within the soaking recovery method were examined to either minimize
DNA loss or maximize DNA recovery. (1) The inside surface of transfer pipette bulbs were pre-
treated with 1 μL of 10 μg/μL yeast rRNA and 499 μL of low TE prior to soaking handled
casings. DNA yields from pre-treated and non-pre-treated bulbs were compared. (2) Casings
were shaken at 900 rpm on an Orbit™ P2 Digital Shaker (Labnet International, Edison, NJ)
during the soaking period. DNA yields from shaken and non-shaken casings were compared. (3)
Following the soaking period, tubes were incubated at 85°C for 10 min and vortexed every 3 min
for 10 s. DNA yields from samples subjected to a pre-digestion incubation and samples not
treated were compared.
31
Digestion Optimization
Overnight digestions at 55°C were compared to 1 h digestions at 55°C with standard
organic extractions and QIAamp® extractions. FDF® extractions were also analyzed after a 30
min digestion, which is the time recommended by the manufacturer. Further, the FDF®
manufacture’s protocol recommends shaking the swabs during digestion at 600 rotations per
minute (rpm) and this step was followed as it is a newer isolation method. Standard protocols for
organic and QIAamp® extractions at the Michigan State University (MSU) Forensic Biology
Laboratory do not include shaking during digestion, although the QIAamp® protocol
recommends it. Following Qiagen’s recommendations, organic and QIAamp® extractions were
tested with shaking at 900 rpm during the digestion. DNA yields of shaken samples were
compared to those that were stationary during digestion. Based on increased DNA yields, all
subsequent experiments included shaking during 1 h digestions.
Comparison of Optimized Cell Recovery and DNA Extraction Methods
Obtaining Ammunition and Testing for Foreign DNA on Live Cartridges
Live rounds of .40-caliber Smith & Wesson brass cartridges (ATK Sporting Group—
Anoka, MN; Remington® Arms Company, LLC—Madison, NC; Winchester—Morgan, UT)
were either donated by MSU Deputy Police Chief Dave Trexler or purchased at local retail
stores. Two cartridges per box of ammunition were randomly selected and tested for the presence
of background DNA. Based on low DNA yields from the non-handled ammunition (avg. DNA =
3.15 pg), live cartridges were not decontaminated prior to loading into magazines.
32
Loading Cartridges
The use of human subjects was approved by the Michigan State University Committee on
Research Involving Human Subjects (IRB 12-770). Volunteers signed a consent form and
provided two buccal swabs as DNA reference samples. Each volunteer randomly selected a letter
and a number, associated with the volunteer’s buccal swabs and the ammunition they handled
respectively. Only the letter and number were recorded for each volunteer, which deidentified all
samples. Volunteers were provided live rounds of ammunition and loaded the magazine(s)
(Table 6). Volunteers loaded the same magazine(s) in Collections 1 and 2, while two magazines
were alternated among loaders in Collection 3.
Collection of Spent Cartridge Casings
Handled cartridges were fired and spent casings were collected as describe in Table 6.
During Collection 1, six casings were collected individually (one casing per plastic bag) and the
ejection order was recorded. All six plastic bags were put into a paper bag labeled with the
volunteer’s number. During Collections 2 and 3, casings were collected in sets of three (Set 1 =
1st, 2nd, and 3rd ejected casings; Set 2 = 4th, 5th, and 6th ejected casings; etc.) and transferred using
hemostats to a brown paper bag labeled with the volunteer’s number and the set number. For
example, if a volunteer randomly selected H and 7, then a bag labeled 7-4 would contain the 10th,
11th, and 12th ejected casings handled by the volunteer associated with buccal H. Hemostats were
wiped with 50% Clorox® Ultra Bleach between volunteers during Collection 2. Casing sets were
assigned to a treatment on an alternating (round robin) basis (Appendix A), allowing results to be
attributed to the cell recovery and DNA extraction method and not firing order. Spent cartridge
casings and buccal swabs were stored at -20°C.
33
Table 6. Spent cartridge casing collection events. Letters (A, B, and C) indicate a different firearm/magazine.
Collection Location of
Collection Firearm Magazine Ammunition
Format Rounds
Were Provided to
Volunteers
Rounds
Loaded Per
Volunteer
Collection
Apparatus
1 Private property
(Garden Prairie, IL) A A
Remington
UMC®
.40 S&W
Full Metal
Jacket
Volunteers randomly
selected from a box
of ammunition
6
Plastic bags held by
a metal wire near the
ejection port
2
MSP Forensic
Science Laboratory
(Lansing, MI)
B B & C
American
Eagle® Federal
Premium
Ammunition
and Blazer®
Brass
.40 S&W
Full Metal
Jacket
Bag of
pre-divided rounds
of ammunition
21
Denim microscope
cover with a hole cut
out, the firearm shot
through the hole
while the cover
surrounded the
firearm
3 Private property
(Bath, MI) A A & D
Winchester®
.40 S&W
Full Metal
Jacket
Bag of
pre-divided rounds
of ammunition
12
New cotton
pillowcase with a
hole cut out, the
firearm shot through
the hole while the
pillowcase
surrounded the
firearm
34
Optimized Method for Soaking Cartridge Casings
Samco™ General-Purpose Transfer Pipettes were UV irradiated for 10 min, bulbs were
cut off, set upright in a rack, and irradiated for an additional 10 min. Casings were placed in
bulbs containing 700 μL of digestion buffer (organic extraction) or Buffer ATL (QIAamp®) and
soaked for 30 min. Casings were removed and buffer solutions were transferred to 1.5 mL
microcentrifuge tubes. Bulbs and the outside surface of casings were swabbed with a dry swab.
Swab heads were clipped and added to soaking solutions. Tubes were incubated at 85°C for 10
min, vortexing every 3 min for 10 s. Either 5 μL of proteinase K (20 mg/mL) or 20 μL of
proteinase K (Qiagen) were added to tubes, which were vortexed for 10 s and incubated with
shaking at 900 rpm for 1 h at 55°C. Based on minimal DNA loss and lower DNA yields, bulbs
were not pre-treated and casings were not shaken during the soak period, respectively.
Comparison of DNA Yields
All statistical tests were performed using XLSTAT 2014.2.01 (Addinsoft, Paris, France)
with 95% confidence. DNA yields were tested for normality using the Shapiro-Wilk test; if p <
0.05 then non-parametric analyses were performed. A Kruskal-Wallis test was performed on
non-parametric data to examine whether samples from the five cell recovery and DNA extraction
methods shared a similar distribution. Individual pairwise comparisons were performed using the
Mann-Whitney test to determine whether DNA yields significantly differed between cell
recovery and DNA extraction methods.
35
Comparison of STR Profiles
Casing STR profiles were compared to volunteers’ reference profiles and alleles were
designated as loader or non-loader. Descriptive statistics (average # loader alleles, # possible
loader alleles, % loader profile, and # non-loader alleles) were calculated for each optimized
method. The percentage of a cartridge loader’s profile was determined based on the number of
alleles consistent with the loader divided by the number of possible alleles that each volunteer
could have provided. Homozygous alleles in the reference profiles were counted as one possible
allele. Mann-Whitney pairwise comparisons were performed on the number of loader and non-
loader alleles amplified with MiniFiler™ and Fusion. RMP values of MiniFiler™ and Fusion
profiles generated from sample 34.4 were calculated as both contained alleles at all loci tested.
Further, all Fusion profiles were evaluated for the frequency of loader alleles at each locus to
assess if the DNA recovered from spent casings was degraded.
Consensus profiles were generated by combining the Fusion profiles of the organically
extracted DNAs recovered via double swabbing or soaking. If an allele was present at least twice
among the three individual profiles, then that allele was included in the consensus profile.
Additionally, descriptive statistics were calculated for Fusion consensus profiles. The
percentages of loaders’ profiles present in Fusion profiles were tested for normality using the
Shapiro-Wilk test; if p < 0.05 for any of the cell recovery and DNA extraction methods then non-
parametric analyses were performed. A Kruskal-Wallis test was performed on the non-
parametric data to determine if a significant difference existed among the optimized methods.
Individual pairwise comparisons were performed with the Mann-Whitney test to determine if
certain cell recovery and DNA extraction methods generated significantly greater percentages of

36
loaders’ profiles. DNA quantities recovered with each optimized method were linearly correlated
to the amount of loader alleles amplified in Fusion profiles.
37
RESULTS
Optimization of Cell Recovery and DNA Extraction Methods
Decontamination of Transfer Pipette Bulbs
Nuclear DNA yields from treated and untreated transfer pipette bulbs (avg. yield = 1.18
pg and 0.41 pg, respectively) were similar and extremely low—less than a cell’s worth of DNA
(Table 7). The transfer pipette bulb filled with ELIMINase® for 4 d contained the least amount of
DNA (0.25 pg), however the treatment seemed impractical considering the DNA yield was only
slightly different from that of the non-treated bulb. Given these results, bulbs were UV irradiated
with the other pre-amplification supplies.
Table 7. DNA quantities recovered from treated and non-treated bulbs. A higher average DNA
yield (1.18 pg) was recovered from transfer pipette bulbs subjected to various treatments than the
untreated bulb (0.41 pg). DNA yields were calculated based on 28 μL retention.
Sample Treatment of Transfer Pipettes DNA Yield
(pg)
1 No Treatment 0.41
2 Cut off bulb + soaked in 100% Bleach for 30 min + soaked in diH2O
for 5 min 4.06
3 Cut off bulb + soaked in 50% Bleach for 30 min + soaked in diH2O
for 5 min 0.77
4 Cut off bulb + soaked in ELIMINase® for 30 min + soaked in diH2O
for 5 min 2.20
5 Cut off bulb + UV irradiated the bulb upright in a rack for 10 min 1.11
6 Cut off bulb + soaked in 100% Bleach for 30 min + soaked in diH2O
for 5 min + UV irradiated for 10 min 0.54
7 Cut off bulb + soaked in 50% Bleach for 30 min + soaked in diH2O
for 5 min + UV irradiated for 10 min 0.44
8 Cut off bulb + soaked in ELIMINase® for 30 min + soaked in diH2O
for 5 min + UV irradiated for 10 min 0.65
9 Drew up 100% Bleach + inverted + soaked for 4 d 0.94
10 Drew up 50% Bleach + inverted + soaked for 4 d 0.86
11 Drew up ELIMINase® + inverted + soaked for 4 d 0.25
12 Reagent Blank 0.50
13 Negative Control 0.01
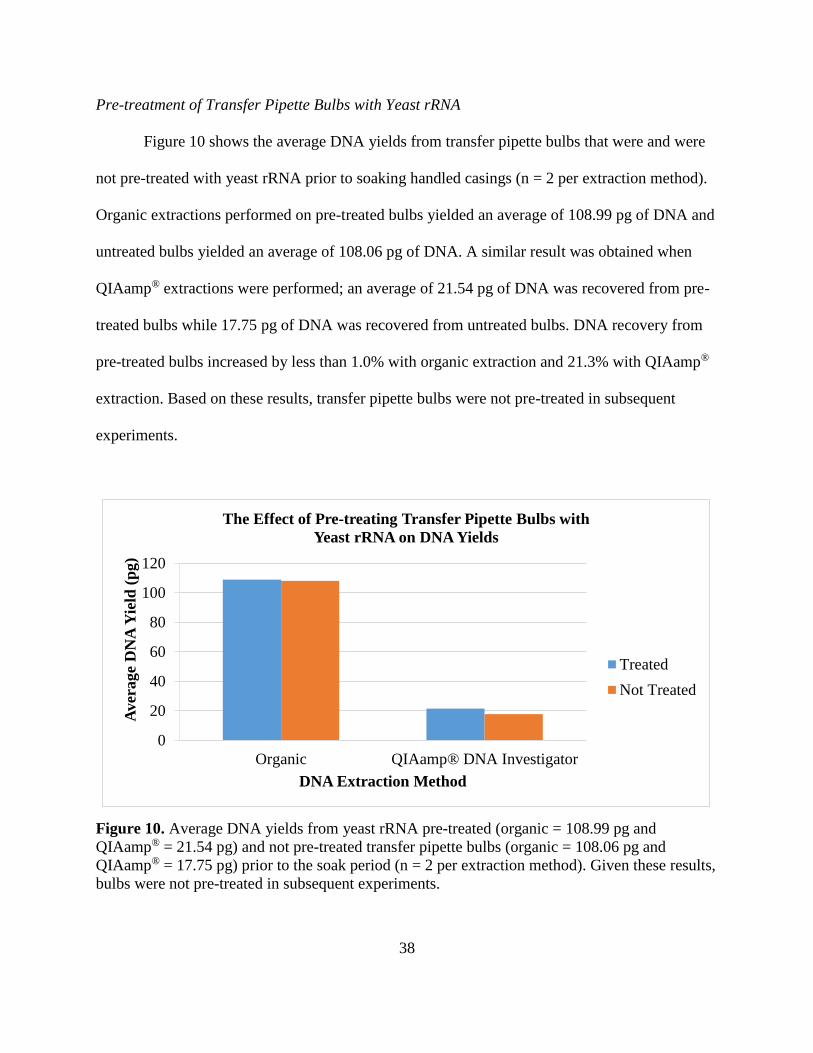
38
Pre-treatment of Transfer Pipette Bulbs with Yeast rRNA
Figure 10 shows the average DNA yields from transfer pipette bulbs that were and were
not pre-treated with yeast rRNA prior to soaking handled casings (n = 2 per extraction method).
Organic extractions performed on pre-treated bulbs yielded an average of 108.99 pg of DNA and
untreated bulbs yielded an average of 108.06 pg of DNA. A similar result was obtained when
QIAamp® extractions were performed; an average of 21.54 pg of DNA was recovered from pre-
treated bulbs while 17.75 pg of DNA was recovered from untreated bulbs. DNA recovery from
pre-treated bulbs increased by less than 1.0% with organic extraction and 21.3% with QIAamp®
extraction. Based on these results, transfer pipette bulbs were not pre-treated in subsequent
experiments.
Figure 10. Average DNA yields from yeast rRNA pre-treated (organic = 108.99 pg and
QIAamp® = 21.54 pg) and not pre-treated transfer pipette bulbs (organic = 108.06 pg and
QIAamp® = 17.75 pg) prior to the soak period (n = 2 per extraction method). Given these results,
bulbs were not pre-treated in subsequent experiments.
0
20
40
60
80
100
120
Organic QIAamp® DNA Investigator
Aver
age
DN
A Y
ield
(p
g)
DNA Extraction Method
The Effect of Pre-treating Transfer Pipette Bulbs with
Yeast rRNA on DNA Yields
Treated
Not Treated
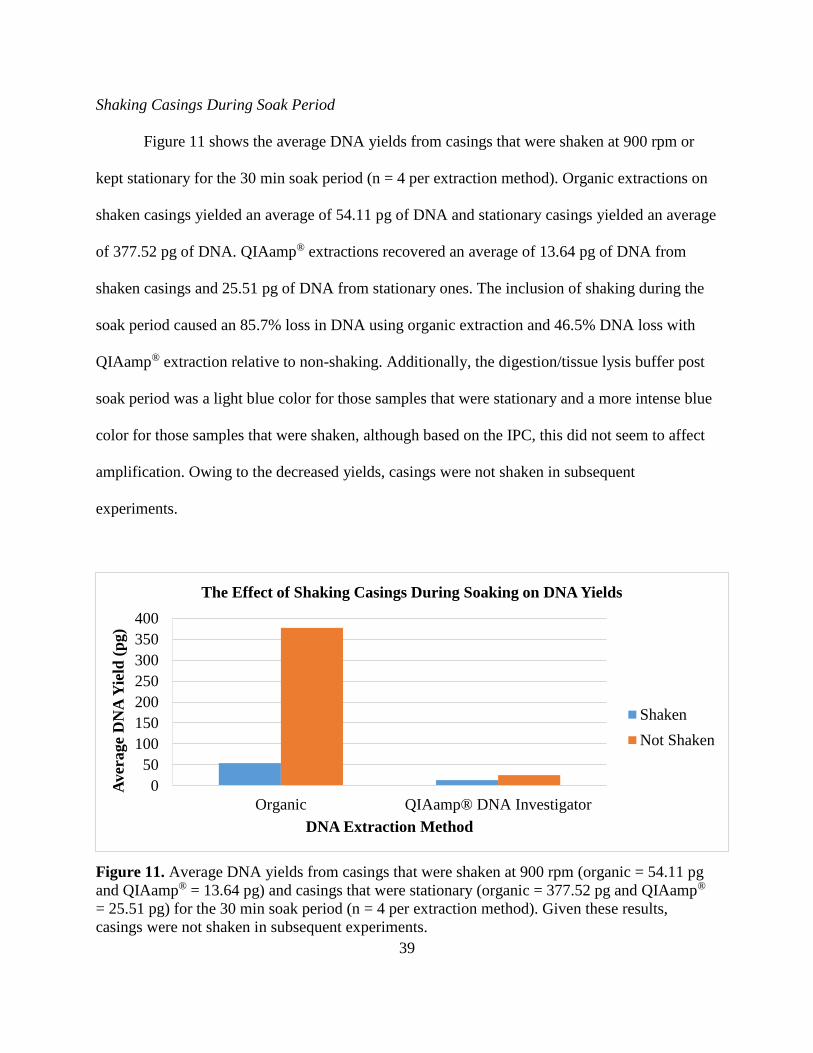
39
Shaking Casings During Soak Period
Figure 11 shows the average DNA yields from casings that were shaken at 900 rpm or
kept stationary for the 30 min soak period (n = 4 per extraction method). Organic extractions on
shaken casings yielded an average of 54.11 pg of DNA and stationary casings yielded an average
of 377.52 pg of DNA. QIAamp® extractions recovered an average of 13.64 pg of DNA from
shaken casings and 25.51 pg of DNA from stationary ones. The inclusion of shaking during the
soak period caused an 85.7% loss in DNA using organic extraction and 46.5% DNA loss with
QIAamp® extraction relative to non-shaking. Additionally, the digestion/tissue lysis buffer post
soak period was a light blue color for those samples that were stationary and a more intense blue
color for those samples that were shaken, although based on the IPC, this did not seem to affect
amplification. Owing to the decreased yields, casings were not shaken in subsequent
experiments.
Figure 11. Average DNA yields from casings that were shaken at 900 rpm (organic = 54.11 pg
and QIAamp® = 13.64 pg) and casings that were stationary (organic = 377.52 pg and QIAamp®
= 25.51 pg) for the 30 min soak period (n = 4 per extraction method). Given these results,
casings were not shaken in subsequent experiments.
0
50
100
150
200
250
300
350
400
Organic QIAamp® DNA Investigator
Aver
age
DN
A Y
ield
(p
g)
DNA Extraction Method
The Effect of Shaking Casings During Soaking on DNA Yields
Shaken
Not Shaken
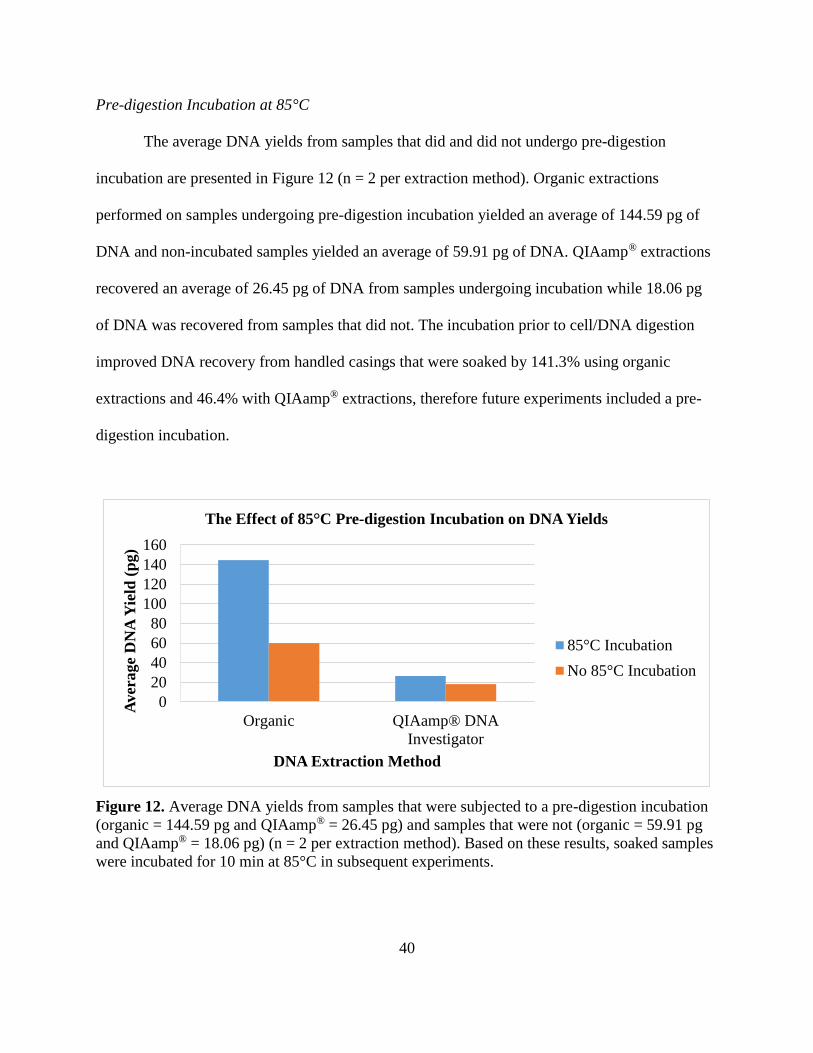
40
Pre-digestion Incubation at 85°C
The average DNA yields from samples that did and did not undergo pre-digestion
incubation are presented in Figure 12 (n = 2 per extraction method). Organic extractions
performed on samples undergoing pre-digestion incubation yielded an average of 144.59 pg of
DNA and non-incubated samples yielded an average of 59.91 pg of DNA. QIAamp® extractions
recovered an average of 26.45 pg of DNA from samples undergoing incubation while 18.06 pg
of DNA was recovered from samples that did not. The incubation prior to cell/DNA digestion
improved DNA recovery from handled casings that were soaked by 141.3% using organic
extractions and 46.4% with QIAamp® extractions, therefore future experiments included a pre-
digestion incubation.
Figure 12. Average DNA yields from samples that were subjected to a pre-digestion incubation
(organic = 144.59 pg and QIAamp® = 26.45 pg) and samples that were not (organic = 59.91 pg
and QIAamp® = 18.06 pg) (n = 2 per extraction method). Based on these results, soaked samples
were incubated for 10 min at 85°C in subsequent experiments.
0
20
40
60
80
100
120
140
160
Organic QIAamp® DNA
Investigator
Aver
age
DN
A Y
ield
(p
g)
DNA Extraction Method
The Effect of 85°C Pre-digestion Incubation on DNA Yields
85°C Incubation
No 85°C Incubation
41
Optimal Digestion Time
Figure 13 shows the average DNA yields from swabs digested for 1 h or overnight
followed by organic or QIAamp® extraction, along with results from swabs digested for 30 min,
1 h, or overnight followed by FDF® extraction. Organic extraction with 1 h digestion yielded an
average of 43.09 pg of DNA by double swabbing (11.7 % increase) and 85.38 pg by soaking
(104.8% increase), compared to overnight digestion with double swabbing (38.59 pg) or with
soaking (41.69 pg), respectively. Similar results were achieved via double swabbing and
QIAamp® extraction: 1 h digestion yielded an average 5.5 pg (200.5% increase) while overnight
yielded an average of 1.83 pg of DNA. The exception was QIAamp® extraction, where soaking
recovered 264.5% more DNA with overnight digestion (avg. DNA = 3.39 pg) compared to 1 h
digestion (avg. DNA = 0.93 pg). Finally, FDF® extraction recovered 144.0% more DNA with 1 h
digestion (avg. DNA = 84.9 pg) than 30 min digestion (avg. DNA = 34.8 pg) and 342.2% more
DNA than overnight digestion (avg. DNA = 19.2 pg). Given these results, 1 h digestion was
performed in subsequent experiments.
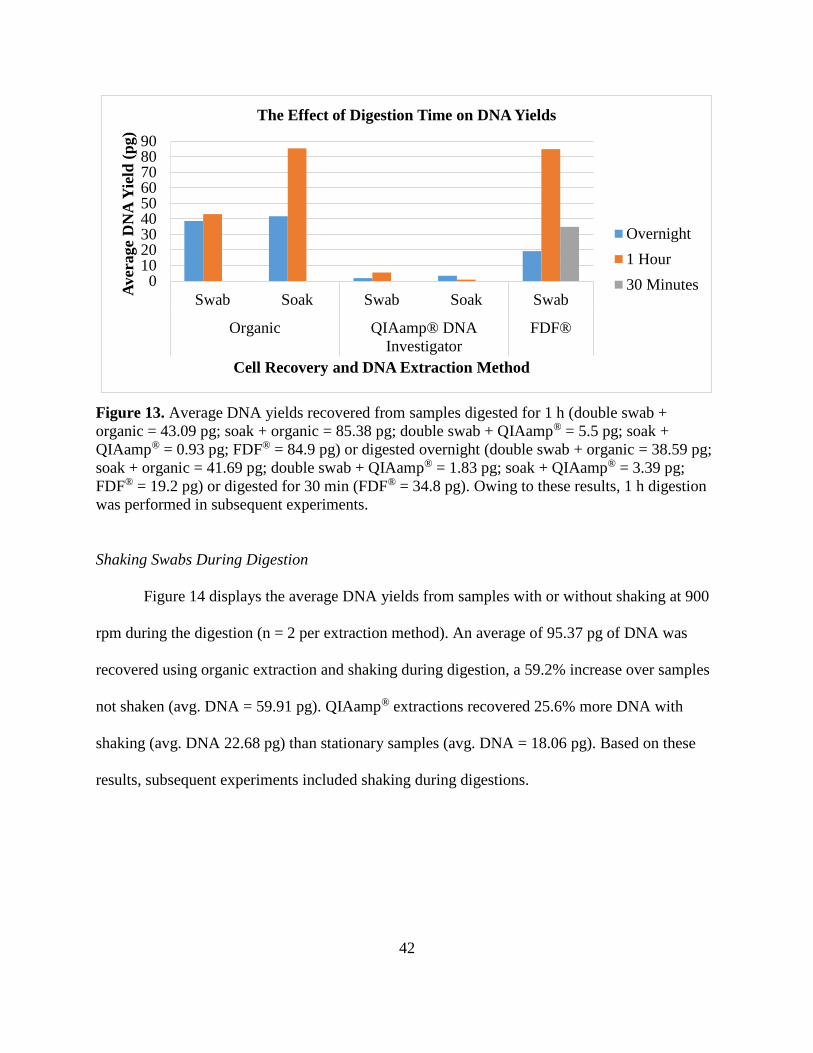
42
Figure 13. Average DNA yields recovered from samples digested for 1 h (double swab +
organic = 43.09 pg; soak + organic = 85.38 pg; double swab + QIAamp® = 5.5 pg; soak +
QIAamp® = 0.93 pg; FDF® = 84.9 pg) or digested overnight (double swab + organic = 38.59 pg;
soak + organic = 41.69 pg; double swab + QIAamp® = 1.83 pg; soak + QIAamp® = 3.39 pg;
FDF® = 19.2 pg) or digested for 30 min (FDF® = 34.8 pg). Owing to these results, 1 h digestion
was performed in subsequent experiments.
Shaking Swabs During Digestion
Figure 14 displays the average DNA yields from samples with or without shaking at 900
rpm during the digestion (n = 2 per extraction method). An average of 95.37 pg of DNA was
recovered using organic extraction and shaking during digestion, a 59.2% increase over samples
not shaken (avg. DNA = 59.91 pg). QIAamp® extractions recovered 25.6% more DNA with
shaking (avg. DNA 22.68 pg) than stationary samples (avg. DNA = 18.06 pg). Based on these
results, subsequent experiments included shaking during digestions.
0102030405060708090
Swab Soak Swab Soak Swab
Organic QIAamp® DNA
Investigator
FDF®
Aver
age
DN
A Y
ield
(p
g)
Cell Recovery and DNA Extraction Method
The Effect of Digestion Time on DNA Yields
Overnight
1 Hour
30 Minutes
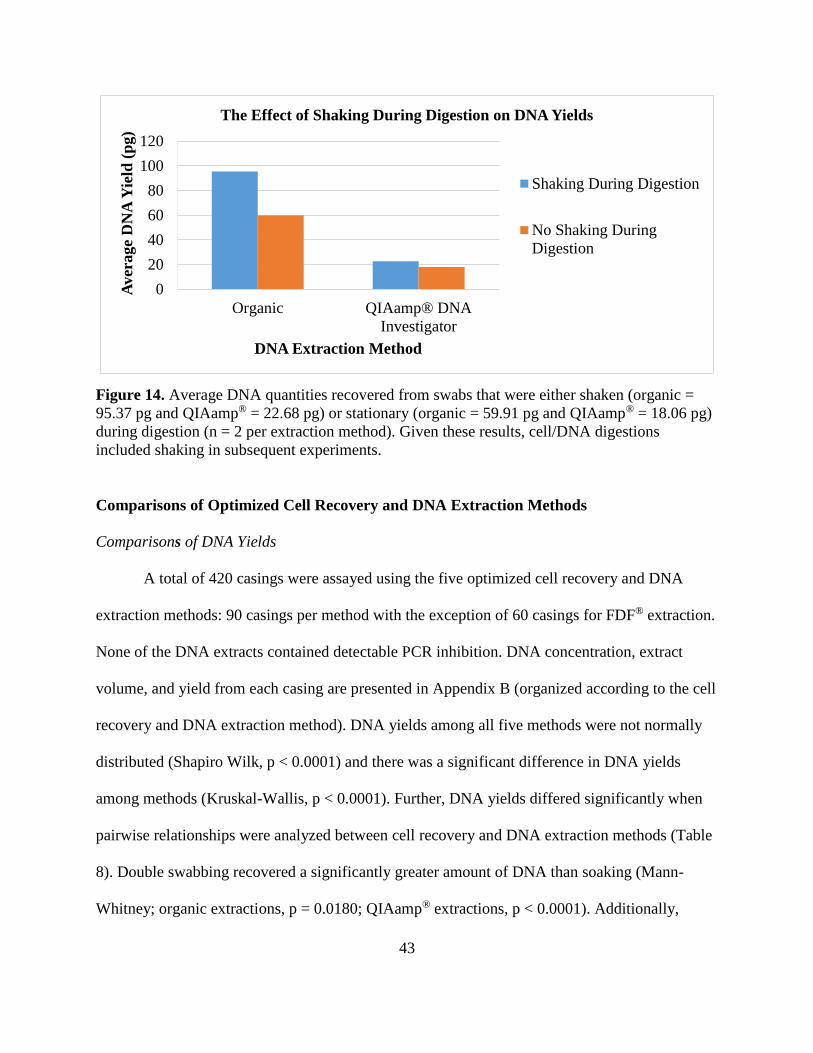
43
Figure 14. Average DNA quantities recovered from swabs that were either shaken (organic =
95.37 pg and QIAamp® = 22.68 pg) or stationary (organic = 59.91 pg and QIAamp® = 18.06 pg)
during digestion (n = 2 per extraction method). Given these results, cell/DNA digestions
included shaking in subsequent experiments.
Comparisons of Optimized Cell Recovery and DNA Extraction Methods
Comparisons of DNA Yields
A total of 420 casings were assayed using the five optimized cell recovery and DNA
extraction methods: 90 casings per method with the exception of 60 casings for FDF® extraction.
None of the DNA extracts contained detectable PCR inhibition. DNA concentration, extract
volume, and yield from each casing are presented in Appendix B (organized according to the cell
recovery and DNA extraction method). DNA yields among all five methods were not normally
distributed (Shapiro Wilk, p < 0.0001) and there was a significant difference in DNA yields
among methods (Kruskal-Wallis, p < 0.0001). Further, DNA yields differed significantly when
pairwise relationships were analyzed between cell recovery and DNA extraction methods (Table
8). Double swabbing recovered a significantly greater amount of DNA than soaking (Mann-
Whitney; organic extractions, p = 0.0180; QIAamp® extractions, p < 0.0001). Additionally,
0
20
40
60
80
100
120
Organic QIAamp® DNA
Investigator
Aver
age
DN
A Y
ield
(p
g)
DNA Extraction Method
The Effect of Shaking During Digestion on DNA Yields
Shaking During Digestion
No Shaking During
Digestion
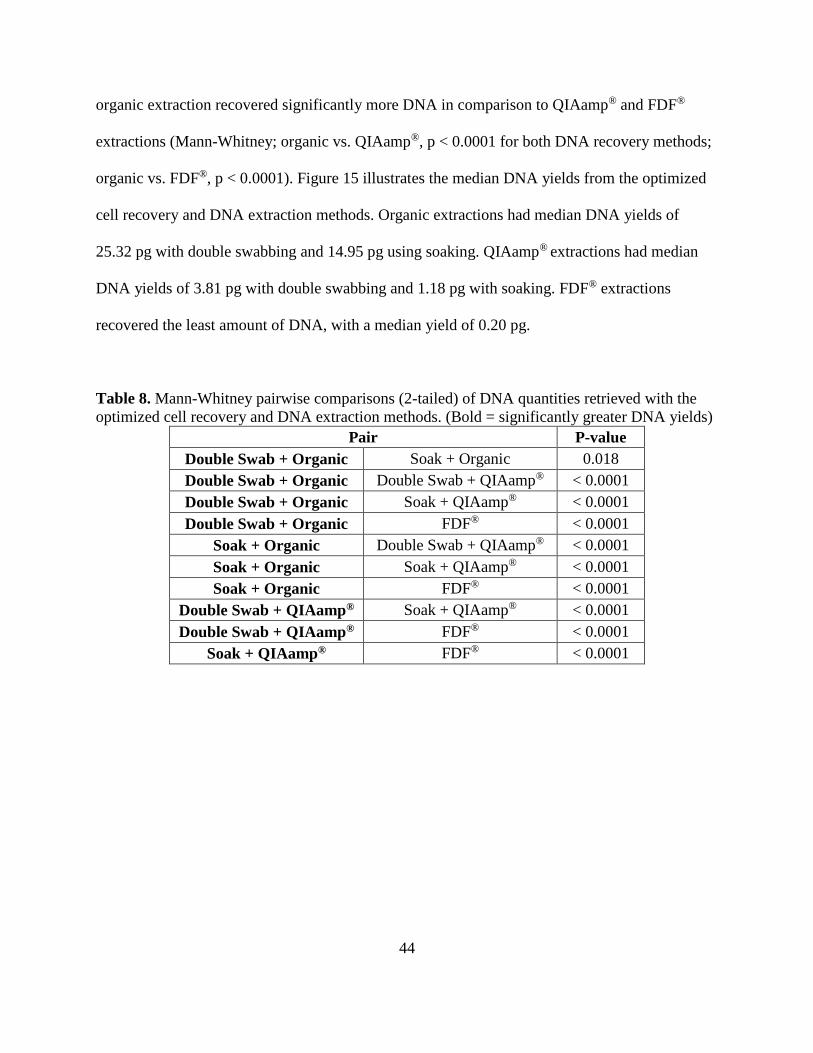
44
organic extraction recovered significantly more DNA in comparison to QIAamp® and FDF®
extractions (Mann-Whitney; organic vs. QIAamp®, p < 0.0001 for both DNA recovery methods;
organic vs. FDF®, p < 0.0001). Figure 15 illustrates the median DNA yields from the optimized
cell recovery and DNA extraction methods. Organic extractions had median DNA yields of
25.32 pg with double swabbing and 14.95 pg using soaking. QIAamp® extractions had median
DNA yields of 3.81 pg with double swabbing and 1.18 pg with soaking. FDF® extractions
recovered the least amount of DNA, with a median yield of 0.20 pg.
Table 8. Mann-Whitney pairwise comparisons (2-tailed) of DNA quantities retrieved with the
optimized cell recovery and DNA extraction methods. (Bold = significantly greater DNA yields)
Pair P-value
Double Swab + Organic Soak + Organic 0.018
Double Swab + Organic Double Swab + QIAamp® < 0.0001
Double Swab + Organic Soak + QIAamp® < 0.0001
Double Swab + Organic FDF® < 0.0001
Soak + Organic Double Swab + QIAamp® < 0.0001
Soak + Organic Soak + QIAamp® < 0.0001
Soak + Organic FDF® < 0.0001
Double Swab + QIAamp® Soak + QIAamp® < 0.0001
Double Swab + QIAamp® FDF® < 0.0001
Soak + QIAamp® FDF® < 0.0001
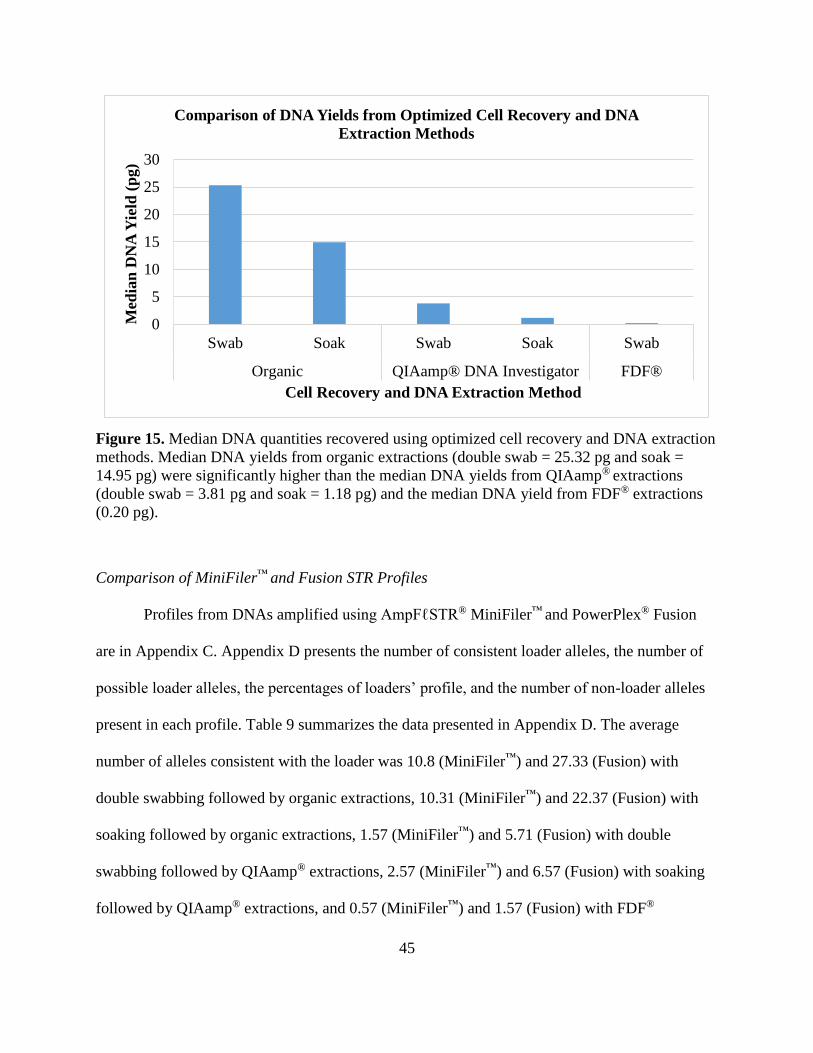
45
Figure 15. Median DNA quantities recovered using optimized cell recovery and DNA extraction
methods. Median DNA yields from organic extractions (double swab = 25.32 pg and soak =
14.95 pg) were significantly higher than the median DNA yields from QIAamp® extractions
(double swab = 3.81 pg and soak = 1.18 pg) and the median DNA yield from FDF® extractions
(0.20 pg).
Comparison of MiniFiler™ and Fusion STR Profiles
Profiles from DNAs amplified using AmpFℓSTR® MiniFiler™ and PowerPlex® Fusion
are in Appendix C. Appendix D presents the number of consistent loader alleles, the number of
possible loader alleles, the percentages of loaders’ profile, and the number of non-loader alleles
present in each profile. Table 9 summarizes the data presented in Appendix D. The average
number of alleles consistent with the loader was 10.8 (MiniFiler™) and 27.33 (Fusion) with
double swabbing followed by organic extractions, 10.31 (MiniFiler™) and 22.37 (Fusion) with
soaking followed by organic extractions, 1.57 (MiniFiler™) and 5.71 (Fusion) with double
swabbing followed by QIAamp® extractions, 2.57 (MiniFiler™) and 6.57 (Fusion) with soaking
followed by QIAamp® extractions, and 0.57 (MiniFiler™) and 1.57 (Fusion) with FDF®
0
5
10
15
20
25
30
Swab Soak Swab Soak Swab
Organic QIAamp® DNA Investigator FDF®
Med
ian
DN
A Y
ield
(p
g)
Cell Recovery and DNA Extraction Method
Comparison of DNA Yields from Optimized Cell Recovery and DNA
Extraction Methods
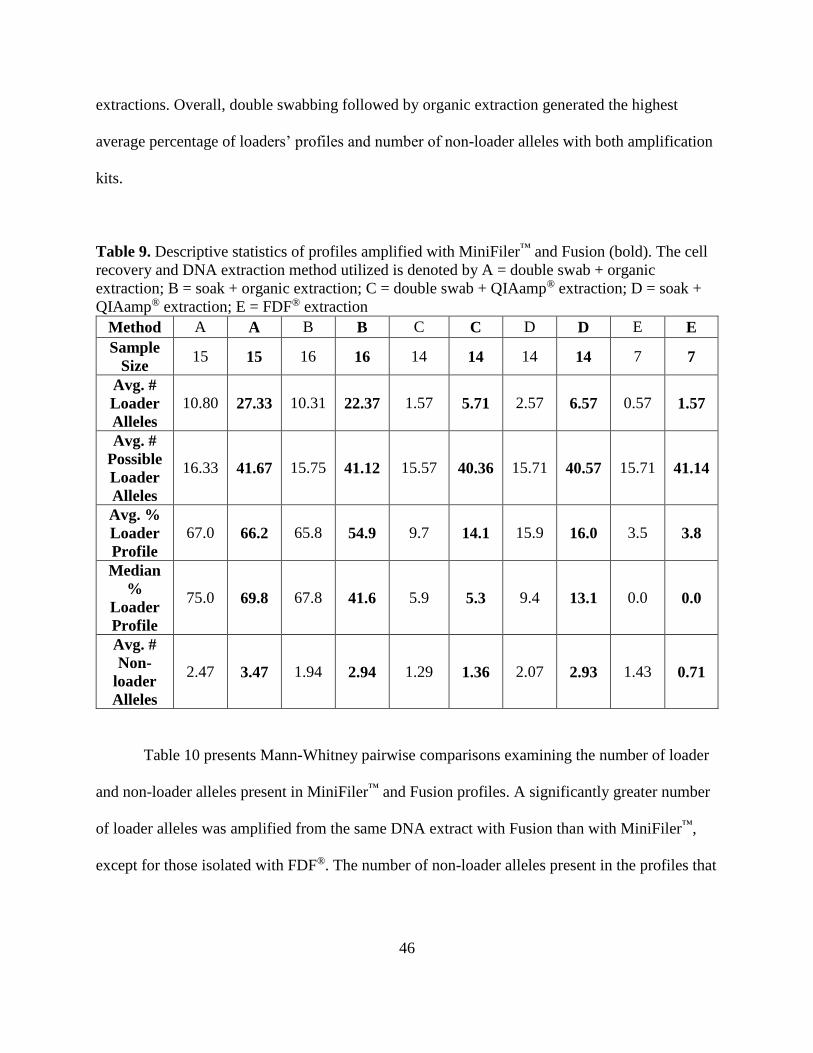
46
extractions. Overall, double swabbing followed by organic extraction generated the highest
average percentage of loaders’ profiles and number of non-loader alleles with both amplification
kits.
Table 9. Descriptive statistics of profiles amplified with MiniFiler™ and Fusion (bold). The cell
recovery and DNA extraction method utilized is denoted by A = double swab + organic
extraction; B = soak + organic extraction; C = double swab + QIAamp® extraction; D = soak +
QIAamp® extraction; E = FDF® extraction
Method A A B B C C D D E E
Sample
Size 15 15 16 16 14 14 14 14 7 7
Avg. #
Loader
Alleles
10.80 27.33 10.31 22.37 1.57 5.71 2.57 6.57 0.57 1.57
Avg. #
Possible
Loader
Alleles
16.33 41.67 15.75 41.12 15.57 40.36 15.71 40.57 15.71 41.14
Avg. %
Loader
Profile
67.0 66.2 65.8 54.9 9.7 14.1 15.9 16.0 3.5 3.8
Median
%
Loader
Profile
75.0 69.8 67.8 41.6 5.9 5.3 9.4 13.1 0.0 0.0
Avg. #
Non-
loader
Alleles
2.47 3.47 1.94 2.94 1.29 1.36 2.07 2.93 1.43 0.71
Table 10 presents Mann-Whitney pairwise comparisons examining the number of loader
and non-loader alleles present in MiniFiler™ and Fusion profiles. A significantly greater number
of loader alleles was amplified from the same DNA extract with Fusion than with MiniFiler™,
except for those isolated with FDF®. The number of non-loader alleles present in the profiles that
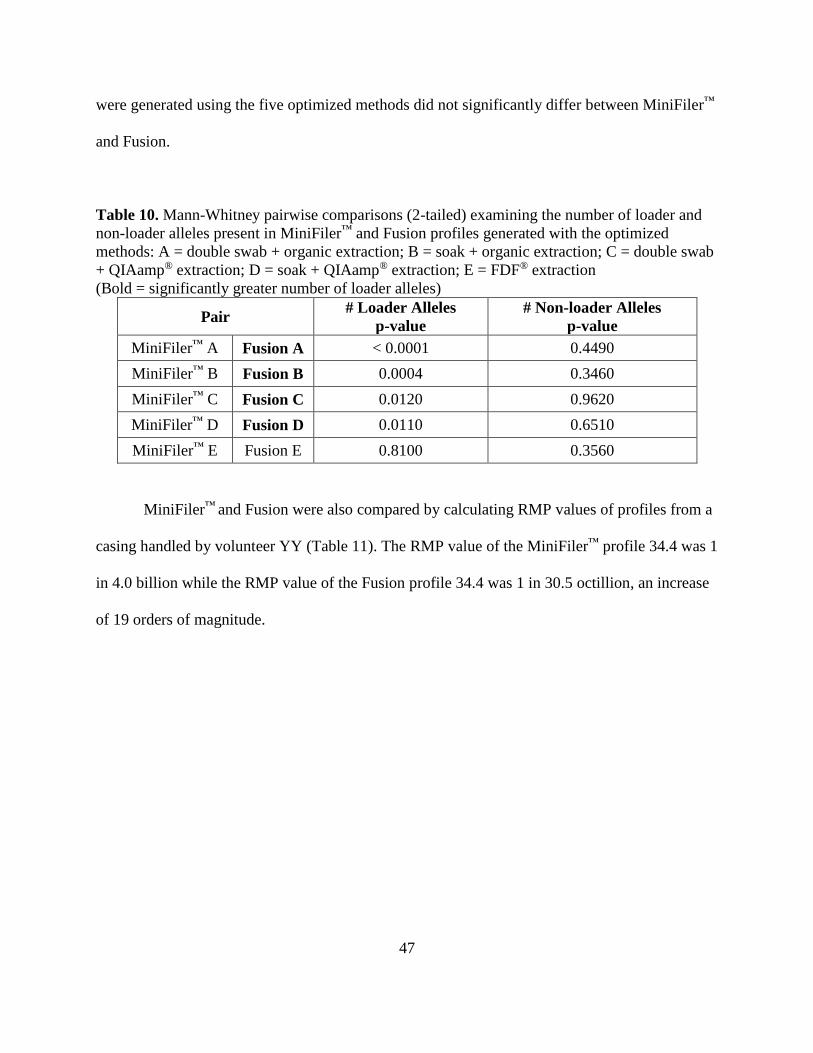
47
were generated using the five optimized methods did not significantly differ between MiniFiler™
and Fusion.
Table 10. Mann-Whitney pairwise comparisons (2-tailed) examining the number of loader and
non-loader alleles present in MiniFiler™ and Fusion profiles generated with the optimized
methods: A = double swab + organic extraction; B = soak + organic extraction; C = double swab
+ QIAamp® extraction; D = soak + QIAamp® extraction; E = FDF® extraction
(Bold = significantly greater number of loader alleles)
Pair # Loader Alleles
p-value
# Non-loader Alleles
p-value
MiniFiler™ A Fusion A < 0.0001 0.4490
MiniFiler™ B Fusion B 0.0004 0.3460
MiniFiler™ C Fusion C 0.0120 0.9620
MiniFiler™ D Fusion D 0.0110 0.6510
MiniFiler™ E Fusion E 0.8100 0.3560
MiniFiler™ and Fusion were also compared by calculating RMP values of profiles from a
casing handled by volunteer YY (Table 11). The RMP value of the MiniFiler™ profile 34.4 was 1
in 4.0 billion while the RMP value of the Fusion profile 34.4 was 1 in 30.5 octillion, an increase
of 19 orders of magnitude.
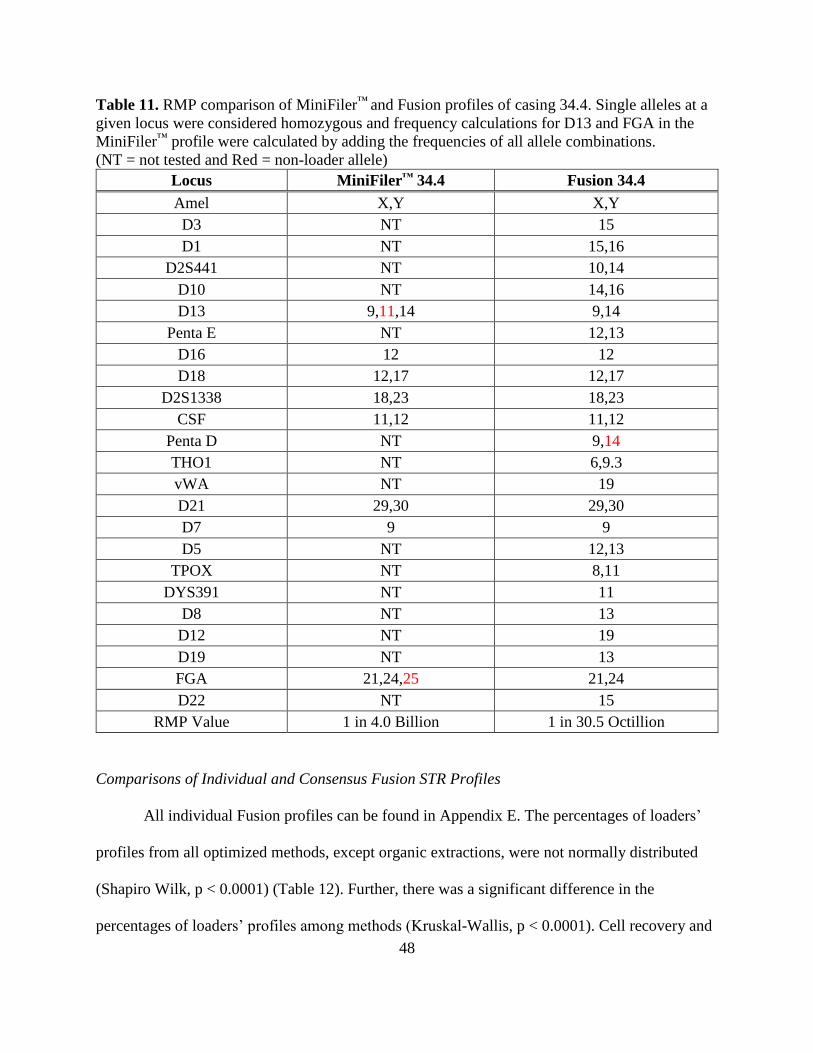
48
Table 11. RMP comparison of MiniFiler™ and Fusion profiles of casing 34.4. Single alleles at a
given locus were considered homozygous and frequency calculations for D13 and FGA in the
MiniFiler™ profile were calculated by adding the frequencies of all allele combinations.
(NT = not tested and Red = non-loader allele)
Locus MiniFiler™ 34.4 Fusion 34.4
Amel X,Y X,Y
D3 NT 15
D1 NT 15,16
D2S441 NT 10,14
D10 NT 14,16
D13 9,11,14 9,14
Penta E NT 12,13
D16 12 12
D18 12,17 12,17
D2S1338 18,23 18,23
CSF 11,12 11,12
Penta D NT 9,14
THO1 NT 6,9.3
vWA NT 19
D21 29,30 29,30
D7 9 9
D5 NT 12,13
TPOX NT 8,11
DYS391 NT 11
D8 NT 13
D12 NT 19
D19 NT 13
FGA 21,24,25 21,24
D22 NT 15
RMP Value 1 in 4.0 Billion 1 in 30.5 Octillion
Comparisons of Individual and Consensus Fusion STR Profiles
All individual Fusion profiles can be found in Appendix E. The percentages of loaders’
profiles from all optimized methods, except organic extractions, were not normally distributed
(Shapiro Wilk, p < 0.0001) (Table 12). Further, there was a significant difference in the
percentages of loaders’ profiles among methods (Kruskal-Wallis, p < 0.0001). Cell recovery and
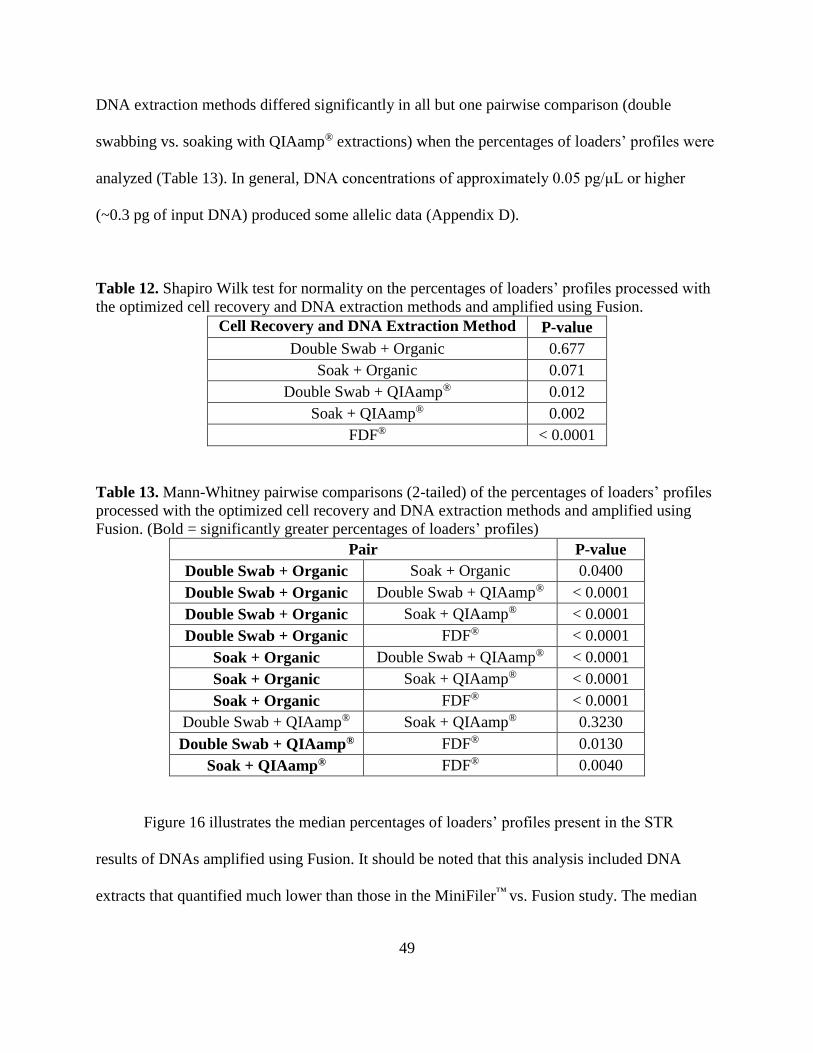
49
DNA extraction methods differed significantly in all but one pairwise comparison (double
swabbing vs. soaking with QIAamp® extractions) when the percentages of loaders’ profiles were
analyzed (Table 13). In general, DNA concentrations of approximately 0.05 pg/μL or higher
(~0.3 pg of input DNA) produced some allelic data (Appendix D).
Table 12. Shapiro Wilk test for normality on the percentages of loaders’ profiles processed with
the optimized cell recovery and DNA extraction methods and amplified using Fusion.
Cell Recovery and DNA Extraction Method P-value
Double Swab + Organic 0.677
Soak + Organic 0.071
Double Swab + QIAamp® 0.012
Soak + QIAamp® 0.002
FDF® < 0.0001
Table 13. Mann-Whitney pairwise comparisons (2-tailed) of the percentages of loaders’ profiles
processed with the optimized cell recovery and DNA extraction methods and amplified using
Fusion. (Bold = significantly greater percentages of loaders’ profiles)
Pair P-value
Double Swab + Organic Soak + Organic 0.0400
Double Swab + Organic Double Swab + QIAamp® < 0.0001
Double Swab + Organic Soak + QIAamp® < 0.0001
Double Swab + Organic FDF® < 0.0001
Soak + Organic Double Swab + QIAamp® < 0.0001
Soak + Organic Soak + QIAamp® < 0.0001
Soak + Organic FDF® < 0.0001
Double Swab + QIAamp® Soak + QIAamp® 0.3230
Double Swab + QIAamp® FDF® 0.0130
Soak + QIAamp® FDF® 0.0040
Figure 16 illustrates the median percentages of loaders’ profiles present in the STR
results of DNAs amplified using Fusion. It should be noted that this analysis included DNA
extracts that quantified much lower than those in the MiniFiler™ vs. Fusion study. The median
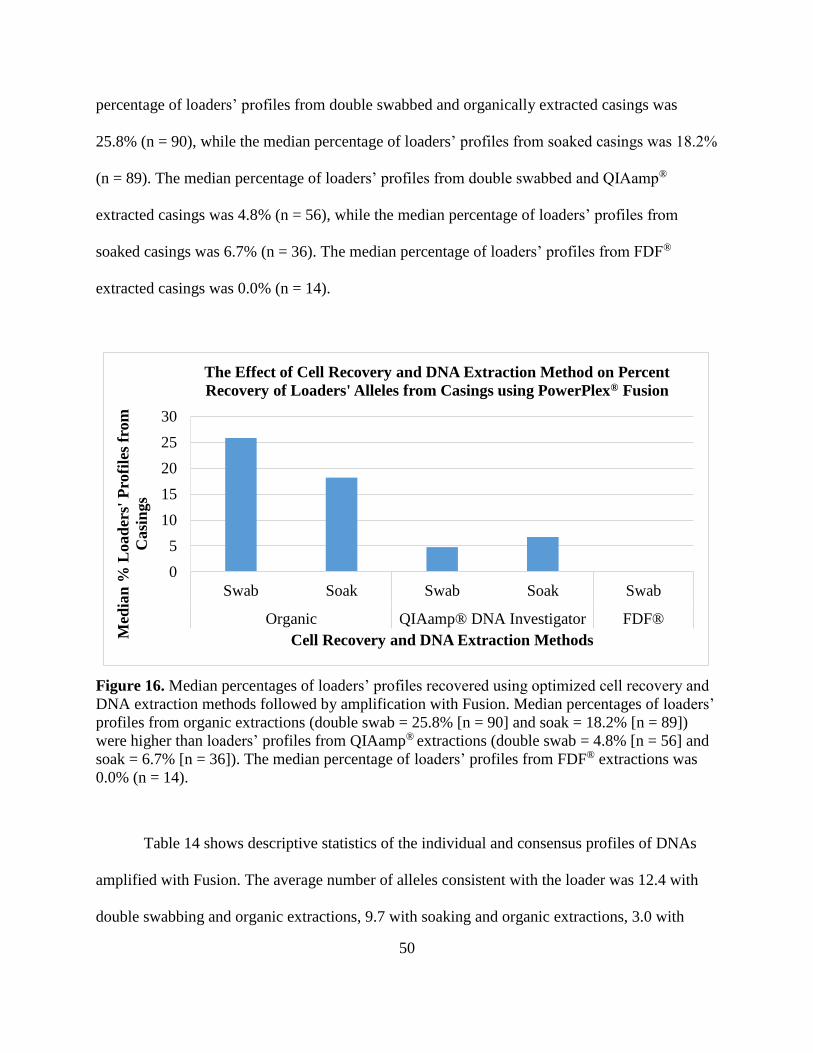
50
percentage of loaders’ profiles from double swabbed and organically extracted casings was
25.8% (n = 90), while the median percentage of loaders’ profiles from soaked casings was 18.2%
(n = 89). The median percentage of loaders’ profiles from double swabbed and QIAamp®
extracted casings was 4.8% (n = 56), while the median percentage of loaders’ profiles from
soaked casings was 6.7% (n = 36). The median percentage of loaders’ profiles from FDF®
extracted casings was 0.0% (n = 14).
Figure 16. Median percentages of loaders’ profiles recovered using optimized cell recovery and
DNA extraction methods followed by amplification with Fusion. Median percentages of loaders’
profiles from organic extractions (double swab = 25.8% [n = 90] and soak = 18.2% [n = 89])
were higher than loaders’ profiles from QIAamp® extractions (double swab = 4.8% [n = 56] and
soak = 6.7% [n = 36]). The median percentage of loaders’ profiles from FDF® extractions was
0.0% (n = 14).
Table 14 shows descriptive statistics of the individual and consensus profiles of DNAs
amplified with Fusion. The average number of alleles consistent with the loader was 12.4 with
double swabbing and organic extractions, 9.7 with soaking and organic extractions, 3.0 with
0
5
10
15
20
25
30
Swab Soak Swab Soak Swab
Organic QIAamp® DNA Investigator FDF®
Med
ian
% L
oad
ers'
Pro
file
s fr
om
Casi
ngs
Cell Recovery and DNA Extraction Methods
The Effect of Cell Recovery and DNA Extraction Method on Percent
Recovery of Loaders' Alleles from Casings using PowerPlex® Fusion
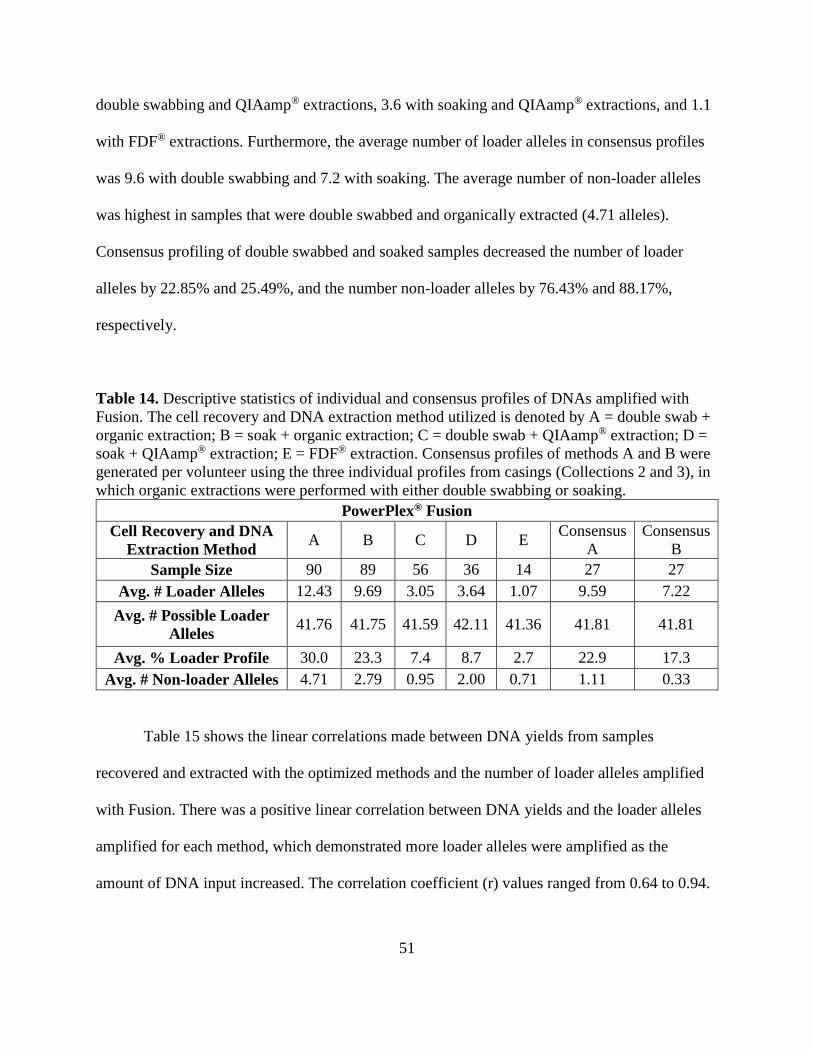
51
double swabbing and QIAamp® extractions, 3.6 with soaking and QIAamp® extractions, and 1.1
with FDF® extractions. Furthermore, the average number of loader alleles in consensus profiles
was 9.6 with double swabbing and 7.2 with soaking. The average number of non-loader alleles
was highest in samples that were double swabbed and organically extracted (4.71 alleles).
Consensus profiling of double swabbed and soaked samples decreased the number of loader
alleles by 22.85% and 25.49%, and the number non-loader alleles by 76.43% and 88.17%,
respectively.
Table 14. Descriptive statistics of individual and consensus profiles of DNAs amplified with
Fusion. The cell recovery and DNA extraction method utilized is denoted by A = double swab +
organic extraction; B = soak + organic extraction; C = double swab + QIAamp® extraction; D =
soak + QIAamp® extraction; E = FDF® extraction. Consensus profiles of methods A and B were
generated per volunteer using the three individual profiles from casings (Collections 2 and 3), in
which organic extractions were performed with either double swabbing or soaking.
PowerPlex® Fusion
Cell Recovery and DNA
Extraction Method A B C D E
Consensus
A
Consensus
B
Sample Size 90 89 56 36 14 27 27
Avg. # Loader Alleles 12.43 9.69 3.05 3.64 1.07 9.59 7.22
Avg. # Possible Loader
Alleles 41.76 41.75 41.59 42.11 41.36 41.81 41.81
Avg. % Loader Profile 30.0 23.3 7.4 8.7 2.7 22.9 17.3
Avg. # Non-loader Alleles 4.71 2.79 0.95 2.00 0.71 1.11 0.33
Table 15 shows the linear correlations made between DNA yields from samples
recovered and extracted with the optimized methods and the number of loader alleles amplified
with Fusion. There was a positive linear correlation between DNA yields and the loader alleles
amplified for each method, which demonstrated more loader alleles were amplified as the
amount of DNA input increased. The correlation coefficient (r) values ranged from 0.64 to 0.94.
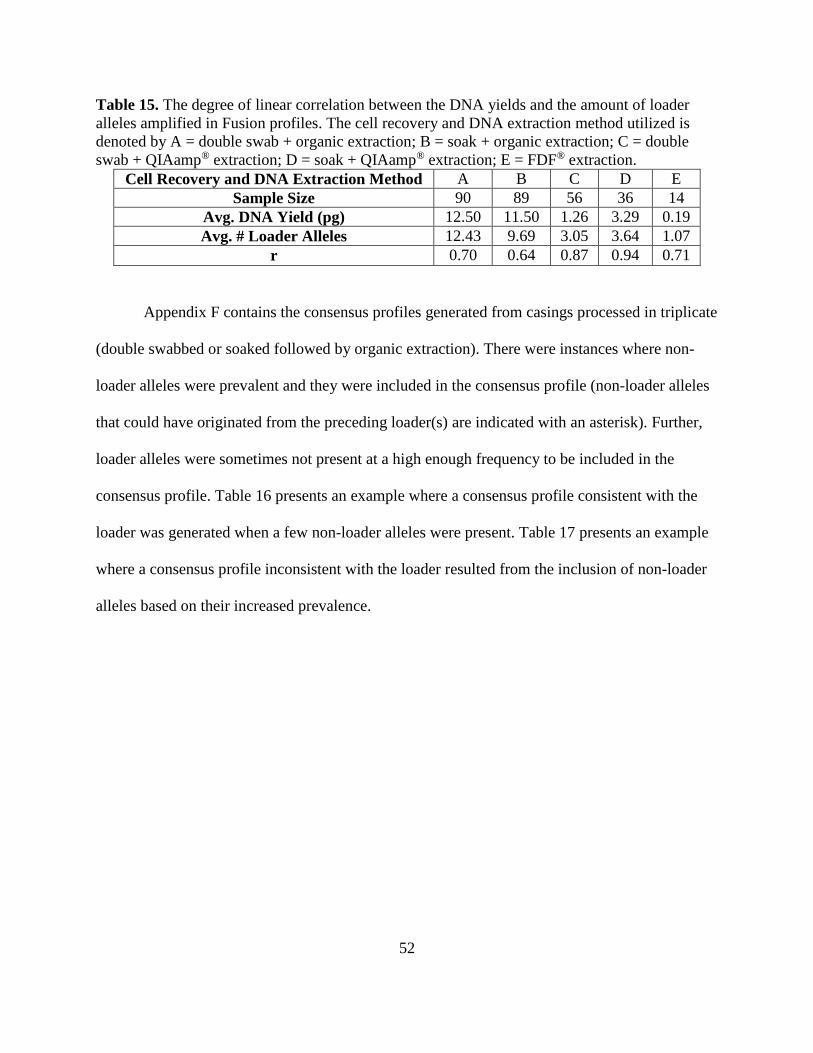
52
Table 15. The degree of linear correlation between the DNA yields and the amount of loader
alleles amplified in Fusion profiles. The cell recovery and DNA extraction method utilized is
denoted by A = double swab + organic extraction; B = soak + organic extraction; C = double
swab + QIAamp® extraction; D = soak + QIAamp® extraction; E = FDF® extraction.
Cell Recovery and DNA Extraction Method A B C D E
Sample Size 90 89 56 36 14
Avg. DNA Yield (pg) 12.50 11.50 1.26 3.29 0.19
Avg. # Loader Alleles 12.43 9.69 3.05 3.64 1.07
r 0.70 0.64 0.87 0.94 0.71
Appendix F contains the consensus profiles generated from casings processed in triplicate
(double swabbed or soaked followed by organic extraction). There were instances where non-
loader alleles were prevalent and they were included in the consensus profile (non-loader alleles
that could have originated from the preceding loader(s) are indicated with an asterisk). Further,
loader alleles were sometimes not present at a high enough frequency to be included in the
consensus profile. Table 16 presents an example where a consensus profile consistent with the
loader was generated when a few non-loader alleles were present. Table 17 presents an example
where a consensus profile inconsistent with the loader resulted from the inclusion of non-loader
alleles based on their increased prevalence.
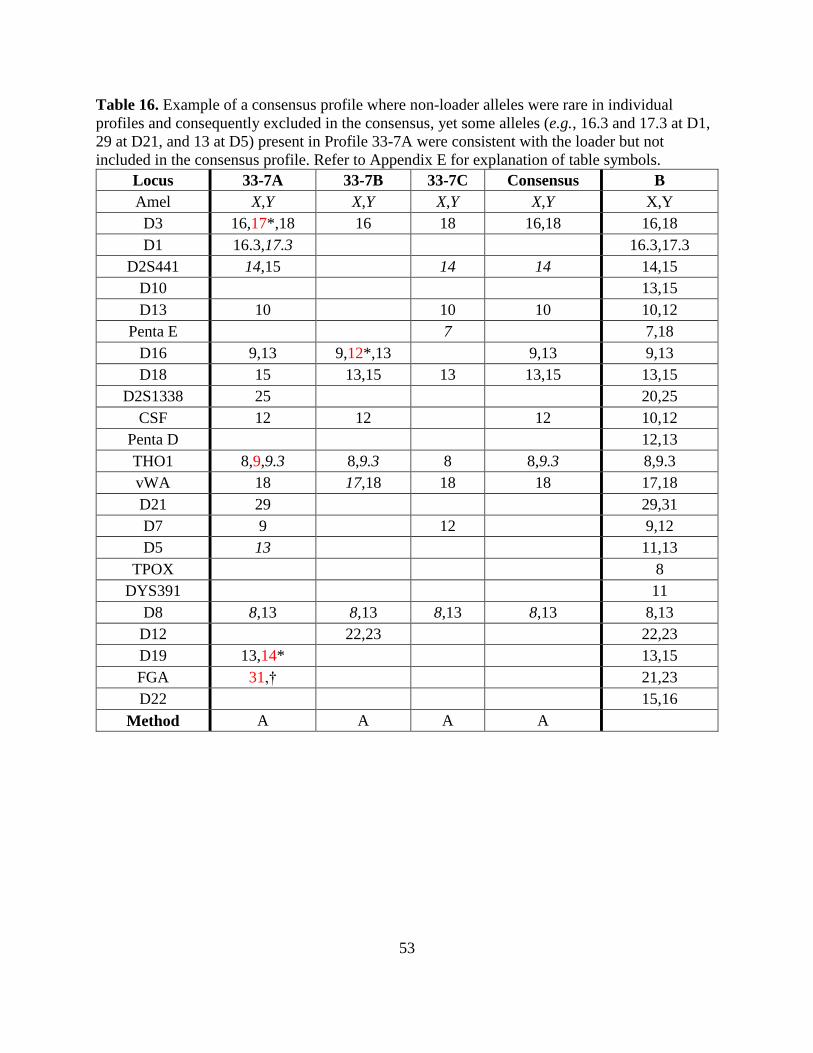
53
Table 16. Example of a consensus profile where non-loader alleles were rare in individual
profiles and consequently excluded in the consensus, yet some alleles (e.g., 16.3 and 17.3 at D1,
29 at D21, and 13 at D5) present in Profile 33-7A were consistent with the loader but not
included in the consensus profile. Refer to Appendix E for explanation of table symbols.
Locus 33-7A 33-7B 33-7C Consensus B
Amel X,Y X,Y X,Y X,Y X,Y
D3 16,17*,18 16 18 16,18 16,18
D1 16.3,17.3 16.3,17.3
D2S441 14,15 14 14 14,15
D10 13,15
D13 10 10 10 10,12
Penta E 7 7,18
D16 9,13 9,12*,13 9,13 9,13
D18 15 13,15 13 13,15 13,15
D2S1338 25 20,25
CSF 12 12 12 10,12
Penta D 12,13
THO1 8,9,9.3 8,9.3 8 8,9.3 8,9.3
vWA 18 17,18 18 18 17,18
D21 29 29,31
D7 9 12 9,12
D5 13 11,13
TPOX 8
DYS391 11
D8 8,13 8,13 8,13 8,13 8,13
D12 22,23 22,23
D19 13,14* 13,15
FGA 31,† 21,23
D22 15,16
Method A A A A
54
Table 17. Example of a consensus profile where multiple non-loader alleles were represented in
the consensus profile. Refer to Appendix E for explanation of table symbols.
Locus 27-6A 27-6B 27-6C Consensus N
Amel X X,Y X X X
D3 17 15*,16,17 16 16,17 16,17
D1 15 12 15.3,17.3
D2S441 11 16 11
D10 13
D13 12,14
Penta E 12* 12* 12* 13,15
D16 11*,12,13 11* 11* 12,13
D18 12,13,17* 12 12,17* 12,17* 13,14
D2S1338 20,23
CSF 11,12
Penta D 12 10,12
THO1 6,9*,9.3 6 9*,9.3 6,9*,9.3 6,9.3
vWA 14,16 17,18 17,18 17,18 17,18
D21 28 30,32.2
D7 11 11,12
D5 12 12 12 12
TPOX 8 8
DYS391 N/A
D8 10*,13 13,15 13 13 13
D12 19 20 19,20
D19 13 13,14
FGA 22,23* 21,25
D22 16* 11,15
Method B B B B
Degradation of DNA Recovered from Spent Cartridge Casings
The frequencies of alleles consistent with the loader at each locus are presented in Figure
17. Amplification of Amelogenin, D16, TH01, and D8 generated the smallest DNA products (72
– 132 bp) and had the highest frequencies of alleles consistent with the loader, which decreased
as the amplicon sizes increased. The only exceptions to this trend were in the blue channel (D13
and Penta E) and the yellow channel (D7 and D5).
55
Figure 17. Frequency of consistent loader alleles amplified at each locus, illustrating preferential
amplification of shorter amplicons. The loci are arranged according to their amplicon sizes (short
to long) for each dye channel. With the exception of D13 (9.7%) and D7 (9.9%), the loci
containing smaller amplicons had higher frequencies of amplification. Frequencies of the
smallest locus in each channel: Amel = 47.5%, D16 = 36.3%, THO1 = 44.6%, D8 = 41.5%.
Frequencies of the largest locus in each channel: Penta E = 10.4%, Penta D = 7.5%, DYS391 =
8.6%, D22 = 7.6%.
0%5%
10%15%20%25%30%35%40%45%50%
Am
el
D3
D1
D2S
441
D1
0
D13
Pen
ta E
D16
D18
D2
S1338
CS
F
Pen
ta D
TH
01
vW
A
D21
D7
D5
TP
OX
DY
S391
D8
D12
D19
FG
A
D22
Blue Channel Green Channel Yellow Channel Red Channel
Fre
qu
ency
of
Con
sist
ent
All
eles
per
Locu
s
Loci
The Effect of DNA Degradation on Allelic Frequences at Multiple Loci
56
DISCUSSION
Spent cartridge casings, often recovered from shooting incidents, have the potential to be
a valuable source of evidence used to link a perpetrator to a crime. Current forensic tools for
analyzing spent casings—class characteristics, individual (toolmark) characteristics, and
fingerprints—either lack specific information necessary to associate an individual to a crime, are
rarely recovered, or both (Spear et al., 2005; Bentsen et al., 1996; Given, 1976). In contrast,
DNA analysis has the potential to differentiate individuals and identify the person(s) responsible
for shooting. Though DNA is a powerful tool, when recovered from spent casings it is often
degraded and present in low copy numbers, causing STR analysis to be challenging. Currently,
crime laboratories process spent cartridge casings for DNA as a last resort due to low DNA
yields and minimal allele recovery (Forensic Scientist Sarah Rambadt, personal communication).
Therefore, it is necessary to improve existing techniques for STR analysis of touch DNA from
spent cartridge casings.
The overarching goal of this research was to improve the probative value of spent
cartridge casings. The first step towards achieving it was to optimize and compare cell recovery
and DNA extraction methods utilized on spent casings, while the second was to compare two
STR analysis kits designed to target smaller amplicons (< 300 bp) in an effort to evaluate which
amplified more loader alleles while simultaneously minimizing artifacts. Multiple studies have
been conducted that involved different techniques to recover and isolate DNA from spent
cartridge casings, including soaking evidence with rotation (Dieltjes et al., 2011), pre-digestion
incubation of soaked samples (Dieltjes et al., 2011), organic extraction (Orlando, 2012;
Horsman-Hall et al., 2009), silica-based extraction (Dieltjes et al., 2011; Horsman-Hall et al.,
2009), and a non-binding DNA extraction (Kopka et al., 2011). Additionally, studies have been
57
performed to increase DNA yields by enhancing cell recovery and DNA extraction, including
double swabbing of evidence (Sweet et al., 1997), pre-treatment of purification columns (Doran
and Foran, in press), and altering the duration of digestion with concurrent shaking (QIAamp®
and FDF® manufactures’ protocols). In the current study, these variables were tested
independently to examine their influences on DNA recovery.
Multiple vessels were investigated for performing soaking as a cell/DNA recovery
method. The diameters of beakers and test tubes were large, requiring a sizeable buffer volume
to fully soak the outside surface of casings. Five milliliter stuffed pipette tips were smaller,
which helped reduce soak solution volumes, but after a short time they started to leak. The bulb
portion of transfer pipettes proved to be a useful vessel for soaking. They were close-fitting
around the casings, which minimized buffer volumes and maximized the submerged surface
area. Transfer pipettes are sterile, inexpensive, disposable, and offered in a variety of sizes to
accommodate different ammunition calibers. The possibility of DNA loss because of binding to
the plastic of the bulb led to the investigation of pre-treatment to avoid this. Recent research at
the MSU Forensic Biology Laboratory found pre-treatment application of DNA purification
columns with yeast rRNA substantially reduced DNA loss (Doran and Foran, in press). Yeast
rRNA was applied to the bulbs to determine if it would help improve DNA recovery. Yields
from pre-treated bulbs increased minimally, indicating negligible improvements in DNA
recovery and little, if any, DNA adhesion onto the soaking vessel.
The inclusion of agitation during the soaking period has the potential to help loosen cells
and DNA from casings, aiding in the amount of DNA recovered. Dieltjes et al. (2011) soaked
items (cartridges, bullets, and casings) for 30 minutes with simultaneous rotation and reported
the production of a blue colored lysis solution, and further reported that the soaked item itself
58
turned blue at longer soaking times. They attributed this to oxidation of the soaked items, and
claimed to “solve the oxidation problem” by limiting the soak period to 30 minutes with
subsequent swabbing. Blue soak solutions were generated with their adjusted protocol when
performed in this study, and adding agitation during this step resulted in even more discoloration,
indicating casings oxidized quicker. Shaken samples routinely had decreased DNA yields with
both extraction methods (85.7% and 46.5% reductions for organic and QIAamp®, respectively).
It is possible that copper ions (most likely Cu+2) swamped out the EDTA in the soaking solution,
leading to DNA degradation when other divalent cations acted as cofactors for nucleases.
Furthermore, other casing metals (e.g., zinc) along with primer components of the gunshot
residue (GSR) could have inhibited PCR. Horsman-Hall et al. (2009) and Orlando (2011) noted
PCR inhibition from the metals of the cartridge casings or primer components of the GSR; the
former in 11% of the DNAs recovered from shotgun shells and the latter in DNA extracts from
cumulative and single swabbed casings. However, PCR inhibition was not observed in the
current study, thus it seems likely that the DNA loss from shaking was real.
Incubation at 85°C prior to DNA isolation is included in Qiagen’s protocol for eluting
dried bloodstains off FTA® paper (Smith and Burgoyne, 2004). Dieltjes et al. (2011) followed
this protocol and successfully obtained DNA, despite recovering it from ammunition and not
bloodstains. In the current study, pre-digestion incubation of soaking solution and swabs
increased DNA recovery by 141.3% using organic extractions and 46.4% with QIAamp®
extractions. The increased yields may be attributable to cells being loosened from the swabs,
making them more accessible for lysis. Additionally, common nucleases such as DNase I and II
are inactivated at temperatures well below this (68°C and 30°C, respectively; Sigma-Aldrich
59
Nucleases, 2014). Thus, subjecting samples to this high temperature could have limited nuclease
activity and prevented DNA degradation (further discussed below).
QIAamp® and FDF® manufacturers recommend incubating swabs in lysis buffer for at
least one hour or 30 min, respectively. In this study there was no obvious correlation between
digestion time and DNA yields, although only two time points (one hour and overnight) were
examined. It was clear however, that yields were reduced overnight. It is conceivable that
nucleases were again not inactivated by EDTA during this step due to the presence of metal ions
and/or primer components. Both organic and QIAamp® extracted samples that were soaked and
digested overnight recovered slightly more DNA than those double swabbed and digested
overnight, which could have resulted from the former undergoing the 85°C incubation. On the
other hand, the one hour incubation may not have been long enough for complete digestion of
cells, and an incubation time between one hour and overnight may be advantageous. The one
very odd result from digestions came from a single FDF® sample incubated for one hour, which
yielded substantially more DNA (153 pg) than the others. This was most likely due to the
variability of touch DNA (detailed below), and not the protocol itself. This result explains the
higher average FDF® DNA yield with one hour digestion compared to the other times—as FDF®
did not routinely recover more DNA than the other methods.
The standard protocols for organic and QIAamp® extractions at the MSU Forensic
Biology Laboratory do not include shaking during digestion, although the QIAamp® instructions
incorporate it. Since the FDF® protocol has agitation at 600 rpm during digestion, this step was
incorporated into the extraction methods to determine its effect on DNA recovery. Shaking at
900 rpm was selected for organic and QIAamp® extractions, as this was the speed recommended
by Qiagen. Shaking did increase DNA yields when compared to non-shaken samples, by 59.2%
60
and 25.6% for organic and QIAamp®, respectively. This may have resulted from increased
detachment of cells from swabs, which rendered them more accessible for lysis and DNA
isolation. Further, it is possible agitation could have physically lysed the cells or aided in the
process by increasing the number of cells exposed to the SDS and proteinase K.
The final optimized methods, which aimed to maximize yields associated with touch
DNA on casings, include: (1) soak in transfer pipette bulbs or double swab casings, (2) pre-
digest soaked samples at 85°C, (3) digest samples for one hour with concurrent shaking, (4)
extract DNAs with one of the three isolation methods.
Touch DNA yields from spent casings are dependent upon two main factors: (1) the
amount of DNA deposited on cartridges during loading of a magazine and (2) the effectiveness
of techniques used for DNA recovery and isolation. Several authors have noted the variability
between and within individuals transferring DNA on handled items (Thomasma and Foran,
2013; Phipps and Petricevic, 2007; Bright and Petricevic, 2004; Alessandrini et al., 2003; Lowe
et al., 2002). Lowe et al. (2002) were the first to investigate the amount of DNA individuals
deposit on handled objects. They attempted to categorize people according to ‘shedder type’
based on how much DNA they deposited or ‘shed’ 15 minutes after hand washing. The authors
deemed 18 of 30 volunteers ‘good shedders’, defined as 80 – 100% of an individuals’ SGM
Plus® profile when assessing STR results generated from handled tubes. Phipps and Petricevic
(2007) attempted to replicate the study by Lowe et al. (2002), however, among 60 volunteers
none were classified as ‘good shedders’. The authors noted differences in the protocols, where
Lowe et al. (2002) undertook QIAamp® extractions and wiped tubes with a wet swab prior to
handling, while they performed organic extractions and did not swab prior to handling. Phipps
and Petricevic (2007) suggested discrepancies between the studies may have resulted from the
61
extraction performed or the damp surface created during swabbing that possibly assisted with
DNA transfer. Additionally, they found the amount of DNA ‘shed’ by a single person varied
day-to-day and even depended on the hand used. Beyond ‘shedder type’, it has been
hypothesized that skin condition (dry or oily), substrate surfaces (porous or non-porous), and the
amount of physical contact with one’s self and others impact transferred DNA quantities
(Alessandrini et al., 2003; Wickenheiser, 2002). Although the research presented here aimed to
improve DNA yields by focusing on cell/DNA recovery and extraction techniques, the
inconsistency of cells/DNA deposited on handled objects was considered during data
interpretation as a possible source of variation influencing DNA yields.
The order in which casings are handled could also potentially influence the amount of
DNA transferred to spent casings. The cell recovery and DNA extraction methods were assigned
to casings in a round-robin manner designed to alleviate any impact that loading order had on the
amount of cells deposited. However, a rigorous evaluation of the influence loading order may
have on DNA transfer was not possible due to confounding variables, such as the differing
number of casings loaded, the DNA recovery and extraction method used, etc. It is possible most
of the cells/DNA on a loader’s fingers were transferred to the first cartridge loaded (i.e., the last
fired), resulting in less cells available for deposition onto subsequent cartridges. However,
chamber temperature increases as more rounds of ammunition are fired, which would most
drastically affect the last cartridge fired. In contrast, more force is required to load the last
cartridge into a magazine, which could result in more DNA transfer (Goray et al., 2010). The
round robin assignments was designed to circumvent these variables, however further study will
be required to determine if loading order plays a substantial role in DNA deposition.
62
Maximizing DNA yields is critical for touch DNA analyses, which is influenced by
multiple factors. A double swab method, developed by Sweet et al. (1997), was designed to do
just that. The method is thought to rehydrate, loosen, and collect shed cells from surfaces using a
wetted swab, while a second dry swab retrieves additional cells that may not have adhered to the
first one. Pang and Cheung (2007) double swabbed 20 touched items, individually extracted the
swabs, and amplified the DNAs with Identifiler®. The authors found 80% of the first swabs and
60% of the second swabs recovered enough DNA to generate allelic data, demonstrating the
importance of both swabs. Additionally, Van Oorschot et al. (2010) recommend swabbing
objects with multiple swabs and consider it common practice to enhance DNA yields. However,
double swabbing has never been compared to soaking when recovering DNA from spent
cartridge casings. In this study, double swabbing recovered a significantly greater amount of
DNA (69.4 % and 222.9% increase with organic and QIAamp® extractions, respectively) than
soaking. These results were supported by Bright and Petricevic (2004) who found double
swabbing yielded more DNA than soaking (avg. = 0.16 and 0.08 ng, respectively) when
analyzing trace DNA from shoe insoles. In theory, similar yields from casings would have been
expected using either recovery techniques, since for both the entire outer surface of a casing was
exposed to digestion buffer and thoroughly swabbed. However, soaked casings were in contact
with digestion buffer for a much longer period of time, which appeared to lead to oxidation, and
possibly DNA degradation or loss on silica columns (explained below).
DNA recoveries were also significantly influenced by the extraction methods, with
organic extractions producing the highest yields. In contrast, Horsman-Hall et al. (2009) reported
significantly higher DNA yields from spent cartridge casings using a silica-based extraction
compared to organic extraction and Microcon purification. The primary difference between these
63
studies was that Horsman-Hall et al. (2009) did not pre-treat the purification columns, as was
done in the current study, which has been shown to improve DNA yields substantially (Doran
and Foran, in press). It would be interesting to discover if the results of Horsman-Hall et al.
(2009) would differ had they undertaken this step.
Lower DNA yields generated with QIAamp® extractions in the current study could have
resulted from DNA loss on the column or problems associated with silica binding. Hebda et al.
(in press), examined multiple elution steps with QIAamp® extractions and found a measurable
amount of DNA was still eluting off the columns beyond three elutions. Therefore, it is feasible
that yields could have increased with more elutions, but that also would have further diluted the
DNA. Additionally, silica has previously been used to remove heavy metals (e.g., copper,
cadmium, and zinc) from aqueous solutions (Bowe, 2003). Thus, it is possible copper ions or
metals from GSR (e.g., lead and barium) bound to the negatively-charged DNA or silica, which
could have interfered with DNA binding, causing substantial loss.
FDF® extractions demonstrated lower DNA yields than the other extraction methods
throughout the study. Early experiments showed UV irradiation of FDF® reagents reduced DNA
yields, with more DNA being lost using irradiated reagents. It is possible the UV irradiation
modified or destroyed components within the solutions that were necessary for proper function.
These experiments were performed with a known amount of input DNA, which resulted in an
average loss of 50.3% and 33.6% with reagents that were and were not irradiated, respectively.
The manufacturer claims that “proteins, detergents and low molecular weight compounds are
retained by the nexttec™ sorbent”. However, if the DNA was highly degraded it is possible those
fragments were retained on the column, especially since the manufacturer does not provide a
molecular weight cutoff for retention. It also seems likely that lower DNA yields resulted from
64
the single swab recovery method. The technique required 30 μL of Lysis Buffer to be applied to
swabs (compared to 150 μL used with organic and QIAamp® extractions), and so cells may not
have been rehydrated, hindering their removal. Kopka et al. (2011) provided limited data in their
validation of the FDF® Kit, consequently it is difficult to make a direct comparison to the result
presented here. In reference to spent casing data, they stated “these [STR profiles] are not
reliable. The allele peaks are near or below the amplitude threshold of 50 rfu and should
therefore be interpreted very carefully”. If the allele peaks were that weak, it is quite possible
they also obtained extremely low DNA yields, similar to those obtained using FDF® throughout
this work.
It is worth noting that all samples extracted and quantified in the optimization
experiments, which were conducted on previously spent casings, yielded considerably more
DNA than casings tested post loading and firing. A clear example of this was seen with organic
extracts from samples shaken during digestion: an average of 95.4 pg of DNA was recovered,
while an average of 50.9 pg was recovered from spent casings. The decrease in DNA yields
could have been caused by DNA degradation during deflagration. Horsman-Hall et al. (2009)
claimed average chamber temperatures can reach 1800°C for 0.5 to 5.0 ms during firing, but this
is largely dependent upon the type of firearm, ammunition, and the amount of firing (i.e., the
chamber is cooler prior to shooting several rounds). Additionally, Bentsen et al. (1996)
suggested that fingerprint ridge details are lost because of friction from loading and ejection,
which may also affect touch DNA on the casings. Based on these findings, it is hypothesized that
the heat in the chamber, coupled with friction generated during deflagration, could result in
lower DNA yields from handled and fired cartridge casings compared to handled casings.
65
The improved cell recovery and DNA extraction method can be incorporated into
research that aims to answer further questions regarding DNA yields from spent cartridge
casings. Current studies in the MSU Forensic Biology Laboratory include understanding the
effects of cyanoacrylate fuming on DNA recovery, the influence of ammunition caliber, and the
feasibility of cumulatively swabbing multiple casings to improve DNA yields while maintaining
minimal contamination. Additionally, based on the results of the optimization experiments, it
would be advantageous to further investigate some variables that may clarify results of the work
presented here. The first includes testing shorter soak periods, which may decrease the amount of
casing oxidation and possibly increase DNA yields. If recovery is improved then quantities could
be compared to those from double swabbed casings to ascertain which is the better recovery
method. It would also be valuable to test soaking casings directly in an 85°C water bath, since it
seems possible from the current experiments that this incubation inactivates nucleases thus
reducing DNA degradation. However, soaking casings at this high temperature could also
increase oxidation. Additionally, swabbed casings were never subjected to an 85°C pre-digestion
incubation, so it would be worthwhile to examine if this step improves DNA yields, again
presumably by inactivating nucleases. Next, since only two digestion times (one hour and
overnight) were considered (plus 30 min for FDF®), it is difficult to say if yields would have
increased or decreased if intermediate time points were tested. Therefore, it would be
advantageous to test additional incubation times to determine if one hour is optimal or if longer
incubation periods yield more DNA. When performing QIAamp® extractions it would be useful
to determine if the DNAs recovered from oxidized casings are present in the final elutions or the
flow-throughs of the DNA binding and wash steps. If DNAs are present in the flow-throughs
then copper ions or other contaminates might be preventing binding to the column. Lastly, based
66
on the poor DNA recovery with FDF® extractions, it would be beneficial to further investigate
this isolation method however given that no information is provided on the makeup or chemistry
of the FDF® columns, optimization of this procedure may be difficult. (Preliminary experiments
showed that DNA was recovered from FDF® columns using a second elution, however this
increased volumes substantially and thus was not advantageous; data not shown.)
Low DNA yields can have a strong, negative impact on the number of alleles amplified
with standard STR kits, however, recently, new kits have been developed that assay more loci
and are more sensitive to low copy samples. A CODIS Core Loci Working Group recently
recommended expanding the 13 CODIS loci for multiple reasons: (1) increase discrimination
power, (2) decrease the chance of adventitious matches, and (3) increase international
compatibility (Hares, 2012A). In 2009, the European Union added five autosomal STR loci to
their European Standard Set (ESS). Inclusion of those loci in the new CODIS requirements
would aid international crime investigations (Hill, 2012). The proposed expansion consists of 20
required and three recommended markers, which include 12 of the 13 previous core loci
(excluding TPOX), four of the ESS loci (D12S391, D1S1656, D2S441, and D10S1248), two
commonly typed loci (D2S1338 and D19S433), and two sex-related loci (Amelogenin and
DYS391). Further, recommended loci (in order of preference for kit inclusion) include TPOX,
D22S1045, and SE33 (Hares, 2012B). Two new STR kits—PowerPlex® Fusion and GlobalFiler®
(Life Technologies)—have been manufactured to meet the expanded CODIS loci requirements.
Both kits assay 24 loci and were designed with heightened sensitivity for degraded, LCN, and/or
inhibited samples. Increasing the number of required CODIS loci from 13 to 20 can benefit
analysis of touch DNA samples because there is a greater chance of amplifying more alleles.
67
The second part of this study began with a comparison of AmpFℓSTR® MiniFiler™ and
PowerPlex® Fusion, both targeting loci below 300 bp, to evaluate which recovered the most
alleles consistent with the loader without increasing artifactual data (e.g., drop-in and drop-out).
When comparing the percentage of a profile produced, MiniFiler™ outperformed Fusion for
organic extractions, however this resulted from the higher number of Fusion alleles that each
loader could have provided due to the increased number of loci assayed. For example, sample
23-2A amplified with MiniFiler™ generated 12 alleles consistent with the loader (85.7% of the
loader’s profile), while the same DNA extract amplified with Fusion yielded 22 loader alleles
(57.9% of the loader’s profile). When the large difference in alleles amplified is taken into
account, Fusion outperformed MiniFiler™ in all respects. It amplified significantly more loader
alleles from organic and QIAamp® extracts while the number of non-loader alleles did not differ
significantly between the kits. These results demonstrate the improved quality and quantity of
genetic information obtained with Fusion. Oostdik et al. (2014) validated the Fusion System and
found strong amplification with minimal artifacts when analyzing less than pristine samples,
confirming the findings of this study. There was no statistical difference between MiniFiler™ and
Fusion when comparing the number of amplified loader alleles from FDF® extracts, however,
only 2 of the 7 samples produced any allelic data and in both cases Fusion amplified more loader
alleles. All in all, Fusion generated more than twice the number of alleles than did MiniFiler™.
Comparing these STR results to other studies, it is clear optimization improved
genotyping success from spent casings. Orlando (2012) recovered mostly (~70%) partial
Identifiler® Plus profiles (7 or less loci with alleles) and of those, most were not consistent with
the loader. Horsman-Hall et al. (2009) utilized MiniFiler™ with a 20 s injection time (compared
to 8 s in this study). The authors noted 11% of the profiles contained loaders’ alleles at all 9
68
possible loci and 20% had loader alleles at over half of the loci. MiniFiler™ profiles (double
swab + organic) in this study were more complete than those generated by Horsman-Hall et al.
(2009), wherein 20% were full profiles and 53% contained over half of the possible loader
alleles. Amplifying the same DNA extracts as were analyzed with MiniFiler™, Fusion generated
13% full profiles and 67% containing over half of the possible loader alleles. The final
comparison of MiniFiler™ and Fusion in this study evaluated RMP values from profiles of DNA
extract 34.4. The value generated from MiniFiler™ was 1 in 4 billion, whereas the Fusion profile
had an RMP value 19 magnitudes higher (1 in 30.5 octillion). This improved discrimination
developed confidence that the DNA used to generate the profile originated from the loader. It
would be interesting to investigate how GlobalFiler®, which also assays 24 loci, compares to
Fusion. Additionally, it may be beneficial to perform post-PCR purification techniques that can
increase RFU values in samples with peaks near or slightly below the RFU threshold.
It would also be advantageous to be able to make a reasonable prediction of the number
of alleles likely to amplify based on the amount of DNA in a sample. Partial Fusion profiles
(containing 1 or 2 alleles) were amplified from as little as 0.3 pg of input DNA, while full Fusion
profiles were produced from all reactions with 100 pg or more of DNA. A correlation between
DNA yields and the number of loader alleles present was clear, with r values ranging from 0.64
to 0.94. These findings are valuable because they could allow for an approximate DNA cutoff at
which (for instance) concentrations lower than 0.05 pg/μL would not be worth typing since the
chance of obtaining allelic data is so low. Additionally, the ability to quantify DNA samples at
such low concentrations is most likely due to the high-copy locus, Alu, targeted in this study.
Although standard quantification methods were not compared to Alu, it is possible that only the
highest quantified samples (28.8 and 50.5 pg/μL) would have been detected using Quantifiler®;
69
considering Green et al. (2005) found that it could only detect down to 32 pg of DNA. Overall,
heightened sensitivity of Alu quantification provided more informative DNA quantities that
could be correlated to amplified loader alleles.
Non-loader alleles were present in approximately 75% of Fusion profiles, ranging from 1
to 27 alleles. As with alleles consistent with loaders, smaller amplicons showed higher instances
of non-loader alleles. Investigation into the average number of non-loader alleles amplified at
Fusion loci demonstrated an average of one allele difference between the largest and smallest
loci. Additionally, more non-loader alleles were present in the red channel than all other dye
channels; an increase in the average number of non-loader alleles between the red channel and
other three channels ranged from 0.5 to 0.7 (data not shown). One of the more intriguing
instances of non-loader prevalence involved two volunteers (M and Q) in the first collection,
where a Fusion profile from M contained 20 non-loader alleles, 16 of which were consistent with
Q who loaded the magazine immediately prior. This was strong evidence that DNA can be left
on parts of the pistol following firing. The seven loaders that produced Fusion profiles with the
most non-loader alleles had an average of 21 that were inconsistent, approximately one-third of
which (on average) could have originated either from the loader immediately prior or the loader
that previously used the same magazine (two volunteers prior). While the association of non-
loader alleles was not examined beyond two preceding loaders, it is possible those alleles could
have originated from other volunteers or individuals that may have had physical contact with the
loaders (e.g., a partner) (Meakin and Jamieson, 2013). Profiles from Collection 3 were analyzed
for contamination from the magazine or firearm, since every other volunteer loaded the same
magazine. Of the 92 Fusion profiles generated, on average there were 2.8 non-loader alleles per
profile and of those, an average of 39.3% could potentially be attributed to contamination from
70
the firearm, while an average of 32.1% could have originated from the magazine. Overall the
difference in possible contamination from the pistol compared to the magazine was small.
However, given these results, it is possible more DNA transfer resulted from the interaction
between the cartridge and parts of the chamber. DNA transfer may have also occurred via the
collection apparatuses (microscope cover and pillow case) or on the hemostats used in Collection
3 because they were not wiped between loaders, as was done in Collection 2.
Consensus profiling is a technique that can be used to filter out non-loader alleles and
subsequently reduce the possibility of misidentification, as an increase in allele presence builds
confidence that the alleles originated from the loader. It has previously been utilized with LCN
DNA analysis (Taberlet et al., 1996) where replicate PCR amplifications were used to develop a
profile following set guidelines (Butler and Hill, 2010). In this study, alleles that were present in
at least two of three individual profiles from the same loader were included in consensus profiles.
Development of consensus profiles decreased the average number of non-loader alleles by 76.4%
(double swab) and 88.2% (soak). However, it also decreased the average number of loader
alleles from ~12 to ~10 (double swab) and ~10 to ~7 (soak). This tradeoff may generate less
discriminating RMP values, however, it is more conservative and likely helps minimize the
chance of incorrect identification.
Overall, the results of this study demonstrate that significantly higher DNA yields are
recovered from spent cartridge casings using a double swab method and organic extraction than
using a soak method or extracting DNAs with QIAamp® or FDF® Kits. Additionally,
significantly more loader alleles were amplified using PowerPlex® Fusion than MiniFiler™,
without substantially increasing the number of non-loader alleles. Although the DNAs recovered
from spent casings were degraded and present in low copy number (over 95% had yields under

71
100 pg), these cell recovery and DNA extraction methods, along with Fusion amplification and
consensus profiling, generated reliable and accurate data. This research has the potential to
provide a strong investigative lead by associating an individual to a shooting incident; however,
it should be noted that it does not necessarily identify the shooter of the weapon. Regardless, it
provides a foundation for crime laboratories who wish to utilize DNA analysis as a reliable tool
for investigating spent cartridge casings, increasing their probative value by aiding in
identification of the loader of a firearm.

72
APPENDICES
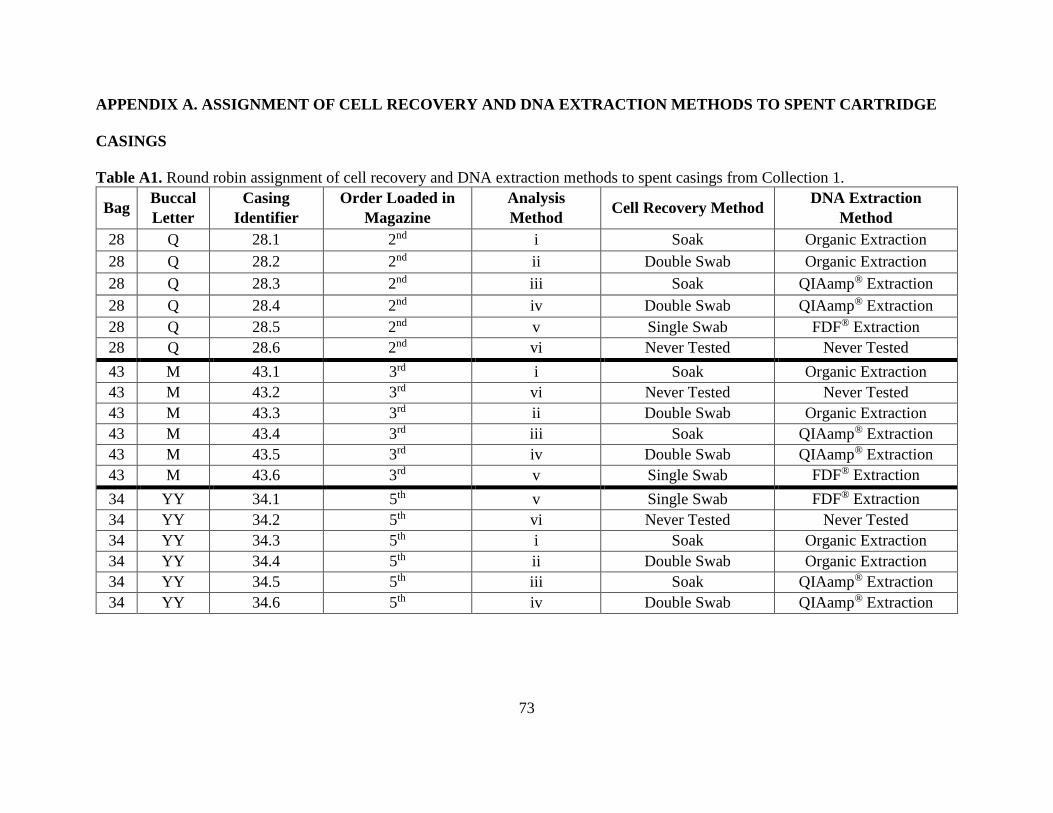
73
APPENDIX A. ASSIGNMENT OF CELL RECOVERY AND DNA EXTRACTION METHODS TO SPENT CARTRIDGE
CASINGS
Table A1. Round robin assignment of cell recovery and DNA extraction methods to spent casings from Collection 1.
Bag Buccal
Letter
Casing
Identifier
Order Loaded in
Magazine
Analysis
Method Cell Recovery Method
DNA Extraction
Method
28 Q 28.1 2nd i Soak Organic Extraction
28 Q 28.2 2nd ii Double Swab Organic Extraction
28 Q 28.3 2nd iii Soak QIAamp® Extraction
28 Q 28.4 2nd iv Double Swab QIAamp® Extraction
28 Q 28.5 2nd v Single Swab FDF® Extraction
28 Q 28.6 2nd vi Never Tested Never Tested
43 M 43.1 3rd i Soak Organic Extraction
43 M 43.2 3rd vi Never Tested Never Tested
43 M 43.3 3rd ii Double Swab Organic Extraction
43 M 43.4 3rd iii Soak QIAamp® Extraction
43 M 43.5 3rd iv Double Swab QIAamp® Extraction
43 M 43.6 3rd v Single Swab FDF® Extraction
34 YY 34.1 5th v Single Swab FDF® Extraction
34 YY 34.2 5th vi Never Tested Never Tested
34 YY 34.3 5th i Soak Organic Extraction
34 YY 34.4 5th ii Double Swab Organic Extraction
34 YY 34.5 5th iii Soak QIAamp® Extraction
34 YY 34.6 5th iv Double Swab QIAamp® Extraction
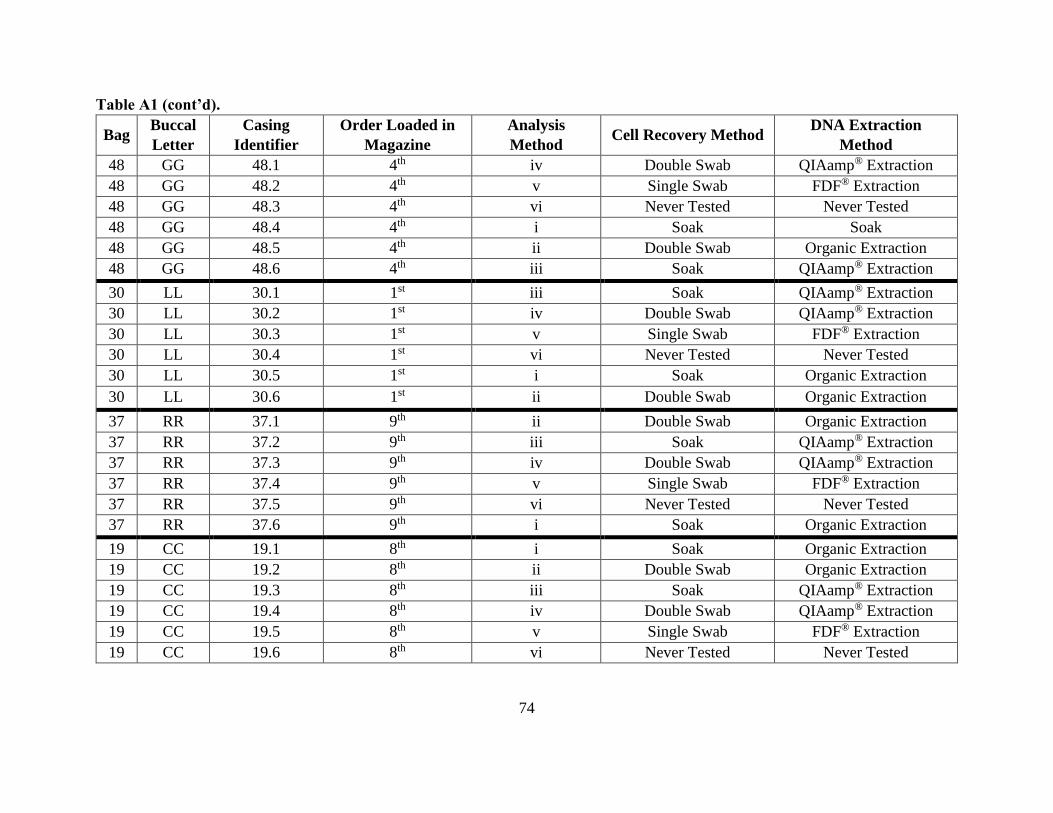
74
Table A1 (cont’d).
Bag Buccal
Letter
Casing
Identifier
Order Loaded in
Magazine
Analysis
Method Cell Recovery Method
DNA Extraction
Method
48 GG 48.1 4th iv Double Swab QIAamp® Extraction
48 GG 48.2 4th v Single Swab FDF® Extraction
48 GG 48.3 4th vi Never Tested Never Tested
48 GG 48.4 4th i Soak Soak
48 GG 48.5 4th ii Double Swab Organic Extraction
48 GG 48.6 4th iii Soak QIAamp® Extraction
30 LL 30.1 1st iii Soak QIAamp® Extraction
30 LL 30.2 1st iv Double Swab QIAamp® Extraction
30 LL 30.3 1st v Single Swab FDF® Extraction
30 LL 30.4 1st vi Never Tested Never Tested
30 LL 30.5 1st i Soak Organic Extraction
30 LL 30.6 1st ii Double Swab Organic Extraction
37 RR 37.1 9th ii Double Swab Organic Extraction
37 RR 37.2 9th iii Soak QIAamp® Extraction
37 RR 37.3 9th iv Double Swab QIAamp® Extraction
37 RR 37.4 9th v Single Swab FDF® Extraction
37 RR 37.5 9th vi Never Tested Never Tested
37 RR 37.6 9th i Soak Organic Extraction
19 CC 19.1 8th i Soak Organic Extraction
19 CC 19.2 8th ii Double Swab Organic Extraction
19 CC 19.3 8th iii Soak QIAamp® Extraction
19 CC 19.4 8th iv Double Swab QIAamp® Extraction
19 CC 19.5 8th v Single Swab FDF® Extraction
19 CC 19.6 8th vi Never Tested Never Tested
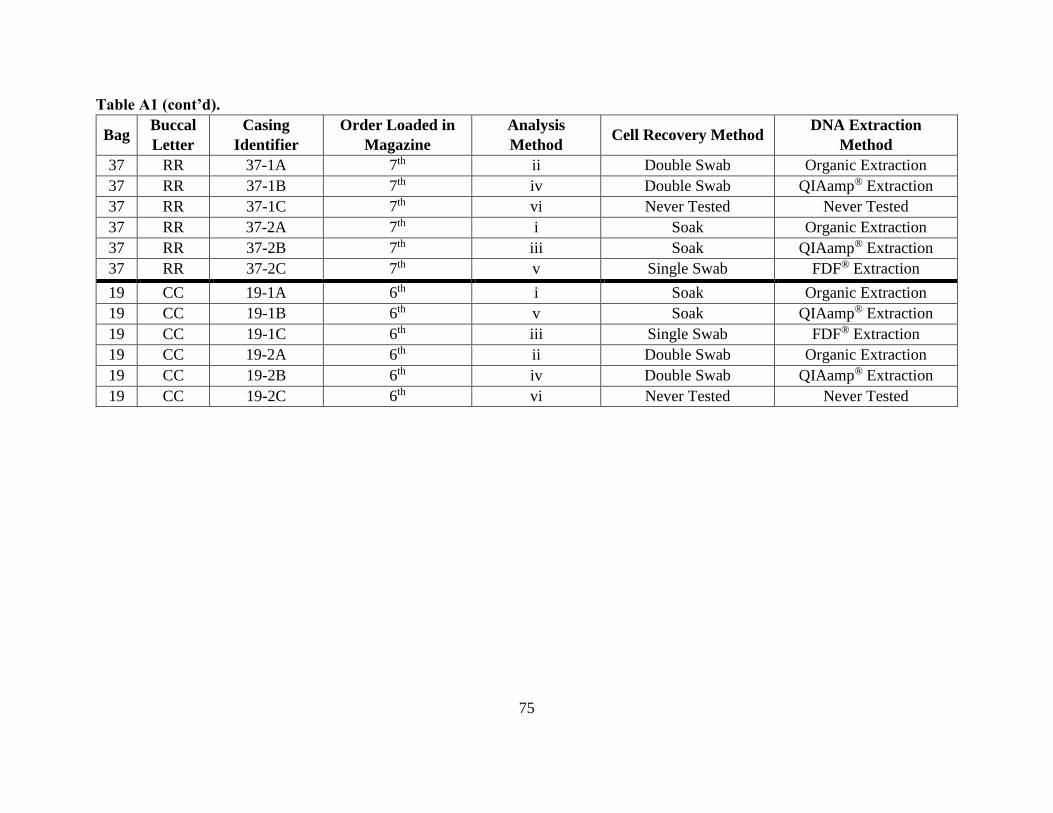
75
Table A1 (cont’d).
Bag Buccal
Letter
Casing
Identifier
Order Loaded in
Magazine
Analysis
Method Cell Recovery Method
DNA Extraction
Method
37 RR 37-1A 7th ii Double Swab Organic Extraction
37 RR 37-1B 7th iv Double Swab QIAamp® Extraction
37 RR 37-1C 7th vi Never Tested Never Tested
37 RR 37-2A 7th i Soak Organic Extraction
37 RR 37-2B 7th iii Soak QIAamp® Extraction
37 RR 37-2C 7th v Single Swab FDF® Extraction
19 CC 19-1A 6th i Soak Organic Extraction
19 CC 19-1B 6th v Soak QIAamp® Extraction
19 CC 19-1C 6th iii Single Swab FDF® Extraction
19 CC 19-2A 6th ii Double Swab Organic Extraction
19 CC 19-2B 6th iv Double Swab QIAamp® Extraction
19 CC 19-2C 6th vi Never Tested Never Tested
76
Table A2. Round robin assignment of cell recovery and DNA extraction methods to spent casings from Collection 2.
Set Buccal
Letter
Casings
Ejected
Order
Loaded in
Magazine(s)
Analysis Method Cell Recovery
Method
DNA Extraction
Method
2-1 U 1 – 3 17th Used for a different study Double Swab Organic Extraction
2-2 U 4 – 6 17th Used for a different study Double Swab Organic Extraction
2-3 U 7 – 9 17th i Double Swab Organic Extraction
2-4 U 10 – 12 17th ii Soak Organic Extraction
2-5 U 13 – 15 17th iii Double Swab QIAamp® Extraction
2-6 U 16 – 18 17th iv Soak QIAamp® Extraction
2-7 U 19 – 21 17th v Single Swab FDF® Extraction
3-1 MM 1 – 3 4th v Single Swab FDF® Extraction
3-2 MM 4 – 6 4th Used for a different study Double Swab Organic Extraction
3-3 MM 7 – 9 4th Used for a different study Double Swab Organic Extraction
3-4 MM 10 – 12 4th i Double Swab Organic Extraction
3-5 MM 13 – 15 4th ii Soak Organic Extraction
3-6 MM 16 – 18 4th iii Double Swab QIAamp® Extraction
3-7 MM 19 – 21 4th iv Soak QIAamp® Extraction
8-1 S 1 – 3 5th iv Soak QIAamp® Extraction
8-2 S 4 – 6 5th v Single Swab FDF® Extraction
8-3 S 7 – 9 5th Used for a different study Double Swab Organic Extraction
8-4 S 10 – 12 5th Used for a different study Double Swab Organic Extraction
8-5 S 13 – 15 5th i Double Swab Organic Extraction
8-6 S 16 – 18 5th ii Soak Organic Extraction
8-7 S 19 – 21 5th iii Double Swab QIAamp® Extraction
77
Table A2 (cont’d).
Set Buccal
Letter
Casings
Ejected
Order
Loaded in
Magazine(s)
Analysis Method Cell Recovery
Method
DNA Extraction
Method
10-1 VV 1 – 3 2nd iii Double Swab QIAamp® Extraction
10-2 VV 4 – 6 2nd iv Soak QIAamp® Extraction
10-3 VV 7 – 9 2nd v Single Swab FDF® Extraction
10-4 VV 10 – 12 2nd Used for a different study Double Swab Organic Extraction
10-5 VV 13 – 15 2nd Used for a different study Double Swab Organic Extraction
10-6 VV 16 – 18 2nd i Double Swab Organic Extraction
10-7 VV 19 – 21 2nd ii Soak Organic Extraction
13-1 V 1 – 3 6th ii Soak Organic Extraction
13-2 V 4 – 6 6th iii Double Swab QIAamp® Extraction
13-3 V 7 – 9 6th iv Soak QIAamp® Extraction
13-4 V 10 – 12 6th v Single Swab FDF® Extraction
13-5 V 13 – 15 6th Used for a different study Double Swab Organic Extraction
13-6 V 16 – 18 6th Used for a different study Double Swab Organic Extraction
13-7 V 19 – 21 6th i Double Swab Organic Extraction
15-1 HH 1 – 3 11th i Double Swab Organic Extraction
15-2 HH 4 – 6 11th ii Soak Organic Extraction
15-3 HH 7 – 9 11th iii Double Swab QIAamp® Extraction
15-4 HH 10 – 12 11th iv Soak QIAamp® Extraction
15-5 HH 13 – 15 11th v Single Swab FDF® Extraction
15-6 HH 16 – 18 11th Used for a different study Double Swab Organic Extraction
15-7 HH 19 – 21 11th Used for a different study Double Swab Organic Extraction
78
Table A2 (cont’d).
Set Buccal
Letter
Casings
Ejected
Order
Loaded in
Magazine(s)
Analysis Method Cell Recovery
Method
DNA Extraction
Method
23-1 L 1 – 3 9th Used for a different study Double Swab Organic Extraction
23-2 L 4 – 6 9th i Double Swab Organic Extraction
23-3 L 7 – 9 9th ii Soak Organic Extraction
23-4 L 10 – 12 9th iii Double Swab QIAamp® Extraction
23-5 L 13 – 15 9th iv Soak QIAamp® Extraction
23-6 L 16 – 18 9th v Single Swab FDF® Extraction
23-7 L 19 – 21 9th Used for a different study Double Swab Organic Extraction
25-1 T 1 – 3 16th Used for a different study Double Swab Organic Extraction
25-2 T 4 – 6 16th Used for a different study Double Swab Organic Extraction
25-3 T 7 – 9 16th i Double Swab Organic Extraction
25-4 T 10 – 12 16th ii Soak Organic Extraction
25-5 T 13 – 15 16th iii Double Swab QIAamp® Extraction
25-6 T 16 – 18 16th iv Soak QIAamp® Extraction
25-7 T 19 – 21 16th v Single Swab FDF® Extraction
26-1 XX 1 – 3 12th v Single Swab FDF® Extraction
26-2 XX 4 – 6 12th Used for a different study Double Swab Organic Extraction
26-3 XX 7 – 9 12th Used for a different study Double Swab Organic Extraction
26-4 XX 10 – 12 12th i Double Swab Organic Extraction
26-5 XX 13 – 15 12th ii Soak Organic Extraction
26-6 XX 16 – 18 12th iii Double Swab QIAamp® Extraction
26-7 XX 19 – 21 12th iv Soak QIAamp® Extraction
79
Table A2 (cont’d).
Set Buccal
Letter
Casings
Ejected
Order
Loaded in
Magazine(s)
Analysis Method Cell Recovery
Method
DNA Extraction
Method
27-1 N 1 – 3 13th iv Soak QIAamp® Extraction
27-2 N 4 – 6 13th v Single Swab FDF® Extraction
27-3 N 7 – 9 13th Used for a different study Double Swab Organic Extraction
27-4 N 10 – 12 13th Used for a different study Double Swab Organic Extraction
27-5 N 13 – 15 13th i Double Swab Organic Extraction
27-6 N 16 – 18 13th ii Soak Organic Extraction
27-7 N 19 – 21 13th iii Double Swab QIAamp® Extraction
24-1 OO 1 – 3 15th iii Double Swab QIAamp® Extraction
24-2 OO 4 – 6 15th iv Soak QIAamp® Extraction
24-3 OO 7 – 9 15th v Single Swab FDF® Extraction
24-4 OO 10 – 12 15th Used for a different study Double Swab Organic Extraction
24-5 OO 13 – 15 15th Used for a different study Double Swab Organic Extraction
24-6 OO 16 – 18 15th i Double Swab Organic Extraction
24-7 OO 19 – 21 15th ii Soak Organic Extraction
33-1 B 1 – 3 3rd ii Soak Organic Extraction
33-2 B 4 – 6 3rd iii Double Swab QIAamp® Extraction
33-3 B 7 – 9 3rd iv Soak QIAamp® Extraction
33-4 B 10 – 12 3rd v Single Swab FDF® Extraction
33-5 B 13 – 15 3rd Used for a different study Double Swab Organic Extraction
33-6 B 16 – 18 3rd Used for a different study Double Swab Organic Extraction
33-7 B 19 – 21 3rd i Double Swab Organic Extraction
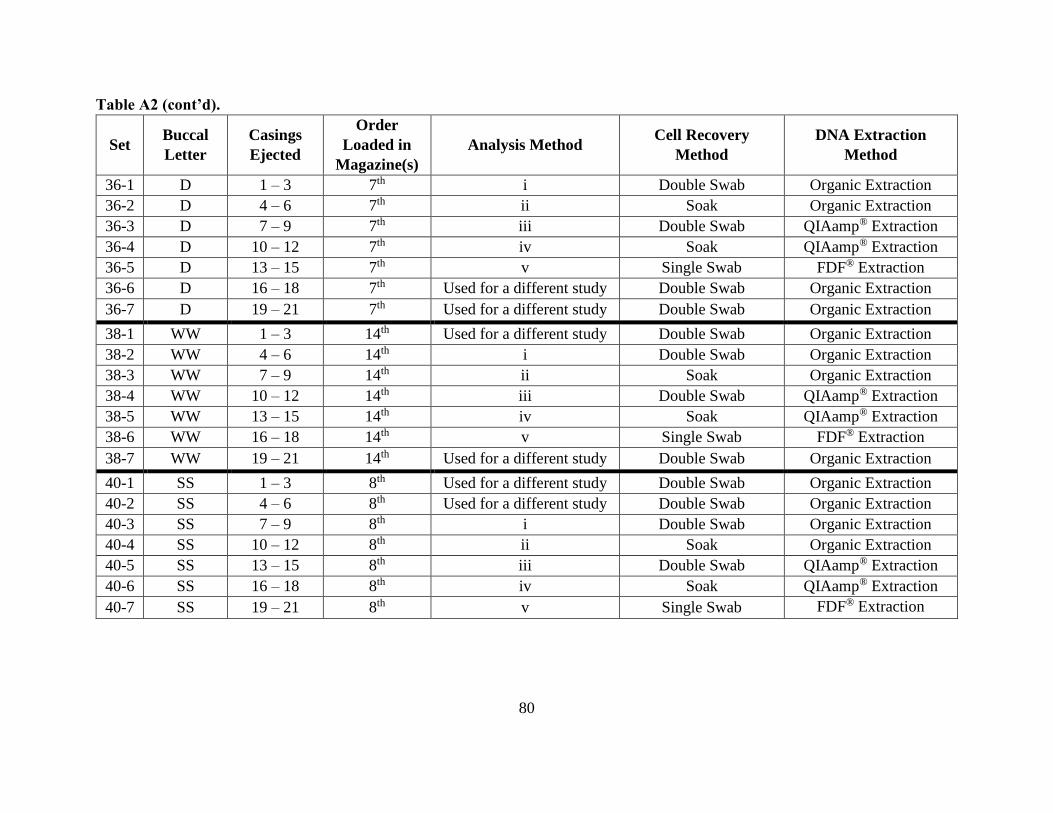
80
Table A2 (cont’d).
Set Buccal
Letter
Casings
Ejected
Order
Loaded in
Magazine(s)
Analysis Method Cell Recovery
Method
DNA Extraction
Method
36-1 D 1 – 3 7th i Double Swab Organic Extraction
36-2 D 4 – 6 7th ii Soak Organic Extraction
36-3 D 7 – 9 7th iii Double Swab QIAamp® Extraction
36-4 D 10 – 12 7th iv Soak QIAamp® Extraction
36-5 D 13 – 15 7th v Single Swab FDF® Extraction
36-6 D 16 – 18 7th Used for a different study Double Swab Organic Extraction
36-7 D 19 – 21 7th Used for a different study Double Swab Organic Extraction
38-1 WW 1 – 3 14th Used for a different study Double Swab Organic Extraction
38-2 WW 4 – 6 14th i Double Swab Organic Extraction
38-3 WW 7 – 9 14th ii Soak Organic Extraction
38-4 WW 10 – 12 14th iii Double Swab QIAamp® Extraction
38-5 WW 13 – 15 14th iv Soak QIAamp® Extraction
38-6 WW 16 – 18 14th v Single Swab FDF® Extraction
38-7 WW 19 – 21 14th Used for a different study Double Swab Organic Extraction
40-1 SS 1 – 3 8th Used for a different study Double Swab Organic Extraction
40-2 SS 4 – 6 8th Used for a different study Double Swab Organic Extraction
40-3 SS 7 – 9 8th i Double Swab Organic Extraction
40-4 SS 10 – 12 8th ii Soak Organic Extraction
40-5 SS 13 – 15 8th iii Double Swab QIAamp® Extraction
40-6 SS 16 – 18 8th iv Soak QIAamp® Extraction
40-7 SS 19 – 21 8th v Single Swab FDF® Extraction
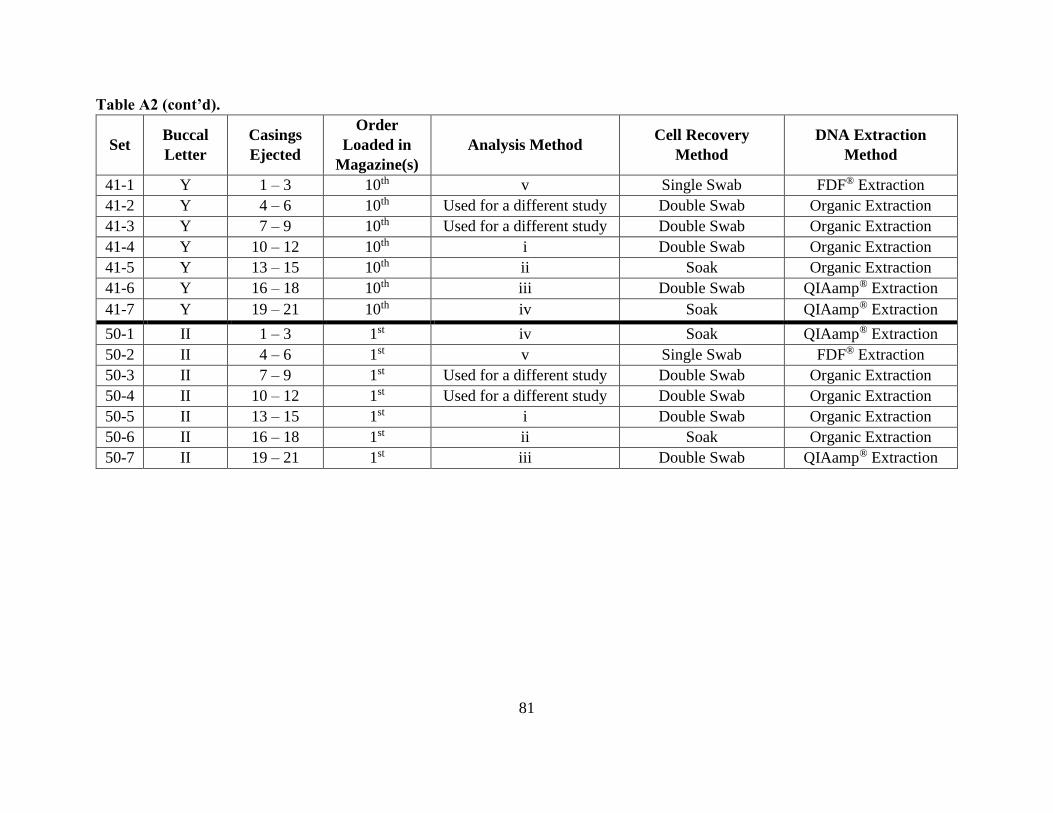
81
Table A2 (cont’d).
Set Buccal
Letter
Casings
Ejected
Order
Loaded in
Magazine(s)
Analysis Method Cell Recovery
Method
DNA Extraction
Method
41-1 Y 1 – 3 10th v Single Swab FDF® Extraction
41-2 Y 4 – 6 10th Used for a different study Double Swab Organic Extraction
41-3 Y 7 – 9 10th Used for a different study Double Swab Organic Extraction
41-4 Y 10 – 12 10th i Double Swab Organic Extraction
41-5 Y 13 – 15 10th ii Soak Organic Extraction
41-6 Y 16 – 18 10th iii Double Swab QIAamp® Extraction
41-7 Y 19 – 21 10th iv Soak QIAamp® Extraction
50-1 II 1 – 3 1st iv Soak QIAamp® Extraction
50-2 II 4 – 6 1st v Single Swab FDF® Extraction
50-3 II 7 – 9 1st Used for a different study Double Swab Organic Extraction
50-4 II 10 – 12 1st Used for a different study Double Swab Organic Extraction
50-5 II 13 – 15 1st i Double Swab Organic Extraction
50-6 II 16 – 18 1st ii Soak Organic Extraction
50-7 II 19 – 21 1st iii Double Swab QIAamp® Extraction
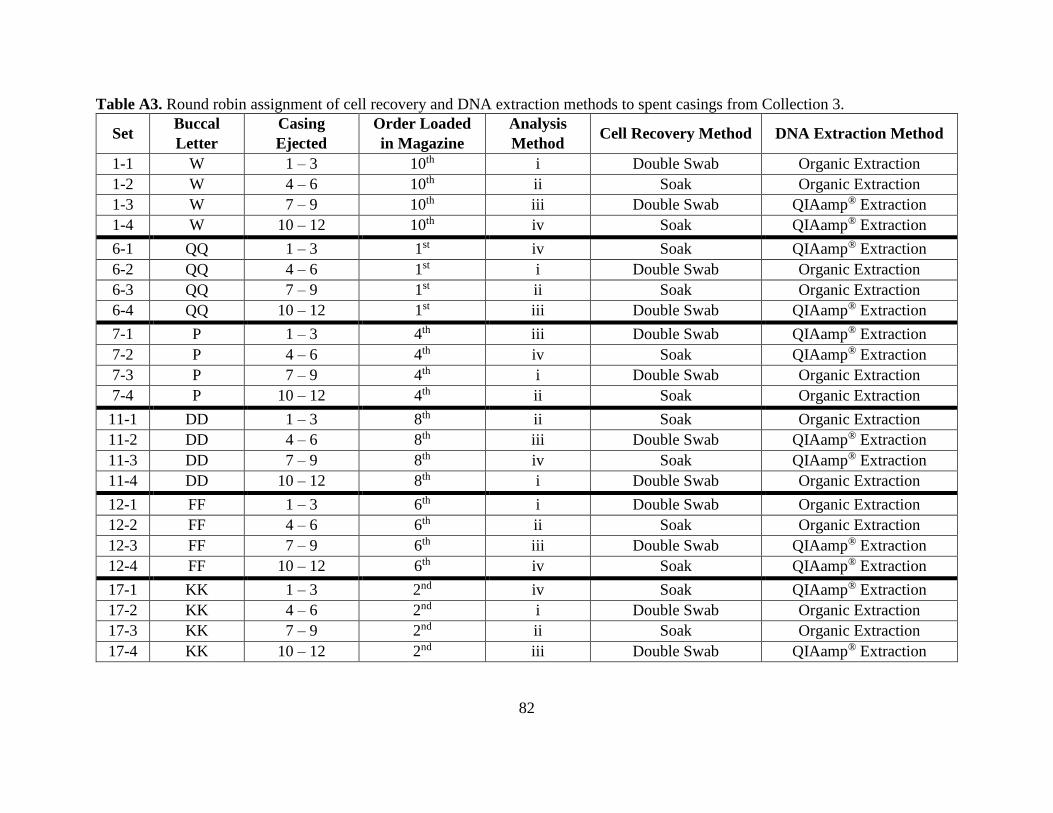
82
Table A3. Round robin assignment of cell recovery and DNA extraction methods to spent casings from Collection 3.
Set Buccal
Letter
Casing
Ejected
Order Loaded
in Magazine
Analysis
Method Cell Recovery Method DNA Extraction Method
1-1 W 1 – 3 10th i Double Swab Organic Extraction
1-2 W 4 – 6 10th ii Soak Organic Extraction
1-3 W 7 – 9 10th iii Double Swab QIAamp® Extraction
1-4 W 10 – 12 10th iv Soak QIAamp® Extraction
6-1 QQ 1 – 3 1st iv Soak QIAamp® Extraction
6-2 QQ 4 – 6 1st i Double Swab Organic Extraction
6-3 QQ 7 – 9 1st ii Soak Organic Extraction
6-4 QQ 10 – 12 1st iii Double Swab QIAamp® Extraction
7-1 P 1 – 3 4th iii Double Swab QIAamp® Extraction
7-2 P 4 – 6 4th iv Soak QIAamp® Extraction
7-3 P 7 – 9 4th i Double Swab Organic Extraction
7-4 P 10 – 12 4th ii Soak Organic Extraction
11-1 DD 1 – 3 8th ii Soak Organic Extraction
11-2 DD 4 – 6 8th iii Double Swab QIAamp® Extraction
11-3 DD 7 – 9 8th iv Soak QIAamp® Extraction
11-4 DD 10 – 12 8th i Double Swab Organic Extraction
12-1 FF 1 – 3 6th i Double Swab Organic Extraction
12-2 FF 4 – 6 6th ii Soak Organic Extraction
12-3 FF 7 – 9 6th iii Double Swab QIAamp® Extraction
12-4 FF 10 – 12 6th iv Soak QIAamp® Extraction
17-1 KK 1 – 3 2nd iv Soak QIAamp® Extraction
17-2 KK 4 – 6 2nd i Double Swab Organic Extraction
17-3 KK 7 – 9 2nd ii Soak Organic Extraction
17-4 KK 10 – 12 2nd iii Double Swab QIAamp® Extraction
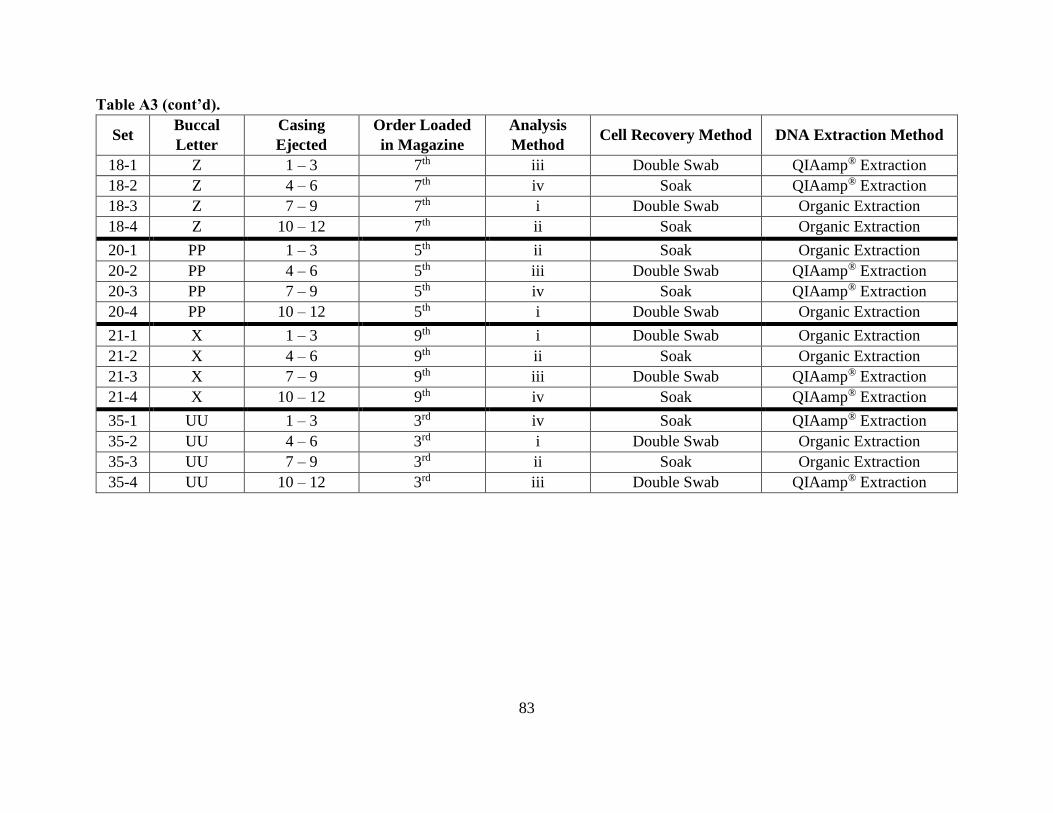
83
Table A3 (cont’d).
Set Buccal
Letter
Casing
Ejected
Order Loaded
in Magazine
Analysis
Method Cell Recovery Method DNA Extraction Method
18-1 Z 1 – 3 7th iii Double Swab QIAamp® Extraction
18-2 Z 4 – 6 7th iv Soak QIAamp® Extraction
18-3 Z 7 – 9 7th i Double Swab Organic Extraction
18-4 Z 10 – 12 7th ii Soak Organic Extraction
20-1 PP 1 – 3 5th ii Soak Organic Extraction
20-2 PP 4 – 6 5th iii Double Swab QIAamp® Extraction
20-3 PP 7 – 9 5th iv Soak QIAamp® Extraction
20-4 PP 10 – 12 5th i Double Swab Organic Extraction
21-1 X 1 – 3 9th i Double Swab Organic Extraction
21-2 X 4 – 6 9th ii Soak Organic Extraction
21-3 X 7 – 9 9th iii Double Swab QIAamp® Extraction
21-4 X 10 – 12 9th iv Soak QIAamp® Extraction
35-1 UU 1 – 3 3rd iv Soak QIAamp® Extraction
35-2 UU 4 – 6 3rd i Double Swab Organic Extraction
35-3 UU 7 – 9 3rd ii Soak Organic Extraction
35-4 UU 10 – 12 3rd iii Double Swab QIAamp® Extraction
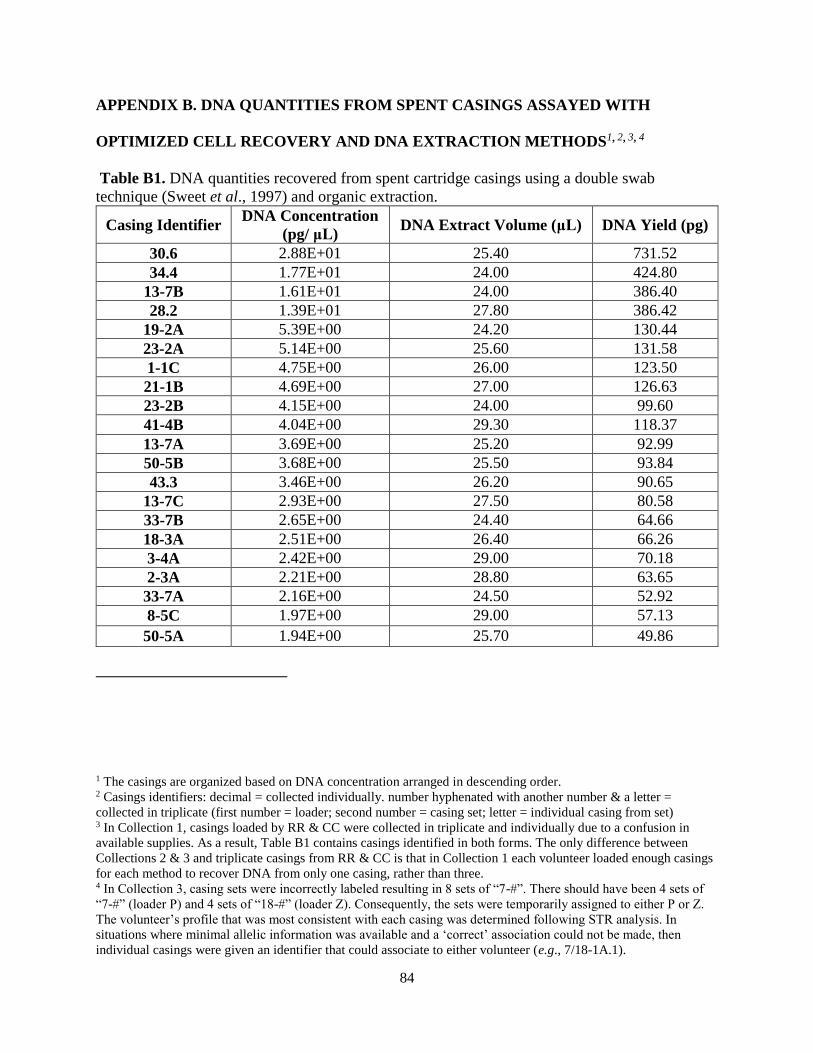
84
APPENDIX B. DNA QUANTITIES FROM SPENT CASINGS ASSAYED WITH
OPTIMIZED CELL RECOVERY AND DNA EXTRACTION METHODS1, 2, 3, 4
Table B1. DNA quantities recovered from spent cartridge casings using a double swab
technique (Sweet et al., 1997) and organic extraction.
Casing Identifier DNA Concentration
(pg/ μL) DNA Extract Volume (μL) DNA Yield (pg)
30.6 2.88E+01 25.40 731.52
34.4 1.77E+01 24.00 424.80
13-7B 1.61E+01 24.00 386.40
28.2 1.39E+01 27.80 386.42
19-2A 5.39E+00 24.20 130.44
23-2A 5.14E+00 25.60 131.58
1-1C 4.75E+00 26.00 123.50
21-1B 4.69E+00 27.00 126.63
23-2B 4.15E+00 24.00 99.60
41-4B 4.04E+00 29.30 118.37
13-7A 3.69E+00 25.20 92.99
50-5B 3.68E+00 25.50 93.84
43.3 3.46E+00 26.20 90.65
13-7C 2.93E+00 27.50 80.58
33-7B 2.65E+00 24.40 64.66
18-3A 2.51E+00 26.40 66.26
3-4A 2.42E+00 29.00 70.18
2-3A 2.21E+00 28.80 63.65
33-7A 2.16E+00 24.50 52.92
8-5C 1.97E+00 29.00 57.13
50-5A 1.94E+00 25.70 49.86
1 The casings are organized based on DNA concentration arranged in descending order. 2 Casings identifiers: decimal = collected individually. number hyphenated with another number & a letter =
collected in triplicate (first number = loader; second number = casing set; letter = individual casing from set) 3 In Collection 1, casings loaded by RR & CC were collected in triplicate and individually due to a confusion in
available supplies. As a result, Table B1 contains casings identified in both forms. The only difference between
Collections 2 & 3 and triplicate casings from RR & CC is that in Collection 1 each volunteer loaded enough casings
for each method to recover DNA from only one casing, rather than three. 4 In Collection 3, casing sets were incorrectly labeled resulting in 8 sets of “7-#”. There should have been 4 sets of
“7-#” (loader P) and 4 sets of “18-#” (loader Z). Consequently, the sets were temporarily assigned to either P or Z.
The volunteer’s profile that was most consistent with each casing was determined following STR analysis. In
situations where minimal allelic information was available and a ‘correct’ association could not be made, then
individual casings were given an identifier that could associate to either volunteer (e.g., 7/18-1A.1).
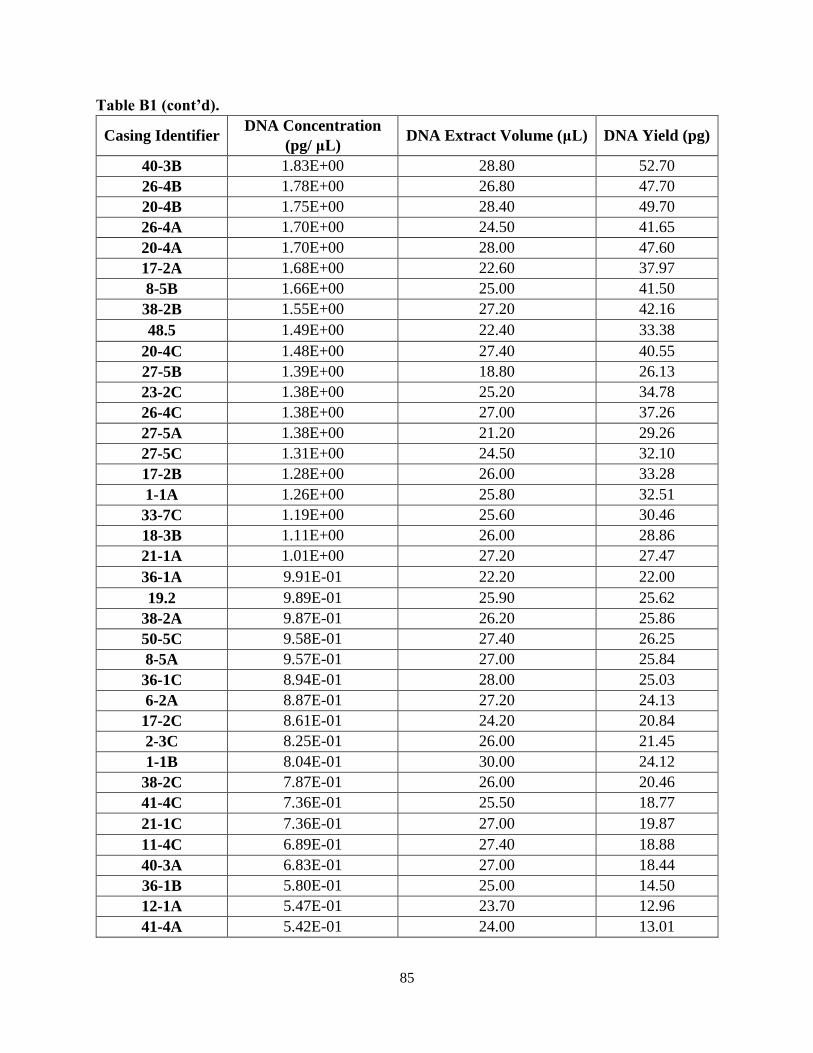
85
Table B1 (cont’d).
Casing Identifier DNA Concentration
(pg/ μL) DNA Extract Volume (μL) DNA Yield (pg)
40-3B 1.83E+00 28.80 52.70
26-4B 1.78E+00 26.80 47.70
20-4B 1.75E+00 28.40 49.70
26-4A 1.70E+00 24.50 41.65
20-4A 1.70E+00 28.00 47.60
17-2A 1.68E+00 22.60 37.97
8-5B 1.66E+00 25.00 41.50
38-2B 1.55E+00 27.20 42.16
48.5 1.49E+00 22.40 33.38
20-4C 1.48E+00 27.40 40.55
27-5B 1.39E+00 18.80 26.13
23-2C 1.38E+00 25.20 34.78
26-4C 1.38E+00 27.00 37.26
27-5A 1.38E+00 21.20 29.26
27-5C 1.31E+00 24.50 32.10
17-2B 1.28E+00 26.00 33.28
1-1A 1.26E+00 25.80 32.51
33-7C 1.19E+00 25.60 30.46
18-3B 1.11E+00 26.00 28.86
21-1A 1.01E+00 27.20 27.47
36-1A 9.91E-01 22.20 22.00
19.2 9.89E-01 25.90 25.62
38-2A 9.87E-01 26.20 25.86
50-5C 9.58E-01 27.40 26.25
8-5A 9.57E-01 27.00 25.84
36-1C 8.94E-01 28.00 25.03
6-2A 8.87E-01 27.20 24.13
17-2C 8.61E-01 24.20 20.84
2-3C 8.25E-01 26.00 21.45
1-1B 8.04E-01 30.00 24.12
38-2C 7.87E-01 26.00 20.46
41-4C 7.36E-01 25.50 18.77
21-1C 7.36E-01 27.00 19.87
11-4C 6.89E-01 27.40 18.88
40-3A 6.83E-01 27.00 18.44
36-1B 5.80E-01 25.00 14.50
12-1A 5.47E-01 23.70 12.96
41-4A 5.42E-01 24.00 13.01
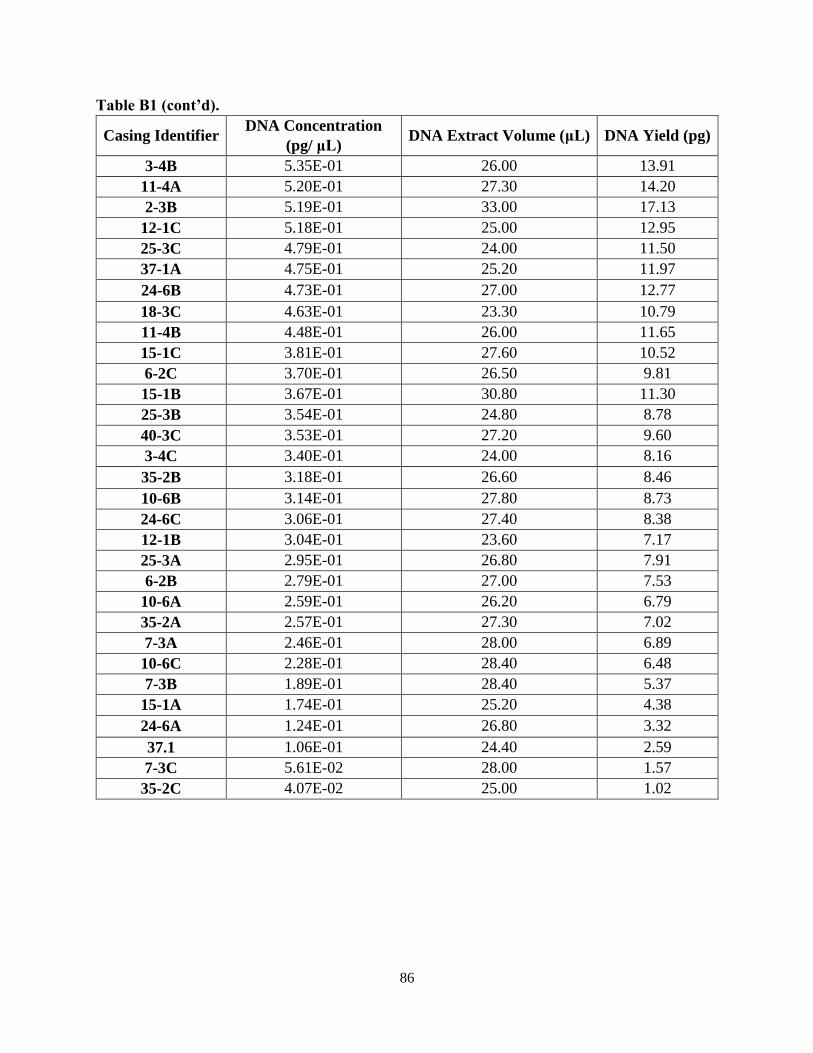
86
Table B1 (cont’d).
Casing Identifier DNA Concentration
(pg/ μL) DNA Extract Volume (μL) DNA Yield (pg)
3-4B 5.35E-01 26.00 13.91
11-4A 5.20E-01 27.30 14.20
2-3B 5.19E-01 33.00 17.13
12-1C 5.18E-01 25.00 12.95
25-3C 4.79E-01 24.00 11.50
37-1A 4.75E-01 25.20 11.97
24-6B 4.73E-01 27.00 12.77
18-3C 4.63E-01 23.30 10.79
11-4B 4.48E-01 26.00 11.65
15-1C 3.81E-01 27.60 10.52
6-2C 3.70E-01 26.50 9.81
15-1B 3.67E-01 30.80 11.30
25-3B 3.54E-01 24.80 8.78
40-3C 3.53E-01 27.20 9.60
3-4C 3.40E-01 24.00 8.16
35-2B 3.18E-01 26.60 8.46
10-6B 3.14E-01 27.80 8.73
24-6C 3.06E-01 27.40 8.38
12-1B 3.04E-01 23.60 7.17
25-3A 2.95E-01 26.80 7.91
6-2B 2.79E-01 27.00 7.53
10-6A 2.59E-01 26.20 6.79
35-2A 2.57E-01 27.30 7.02
7-3A 2.46E-01 28.00 6.89
10-6C 2.28E-01 28.40 6.48
7-3B 1.89E-01 28.40 5.37
15-1A 1.74E-01 25.20 4.38
24-6A 1.24E-01 26.80 3.32
37.1 1.06E-01 24.40 2.59
7-3C 5.61E-02 28.00 1.57
35-2C 4.07E-02 25.00 1.02
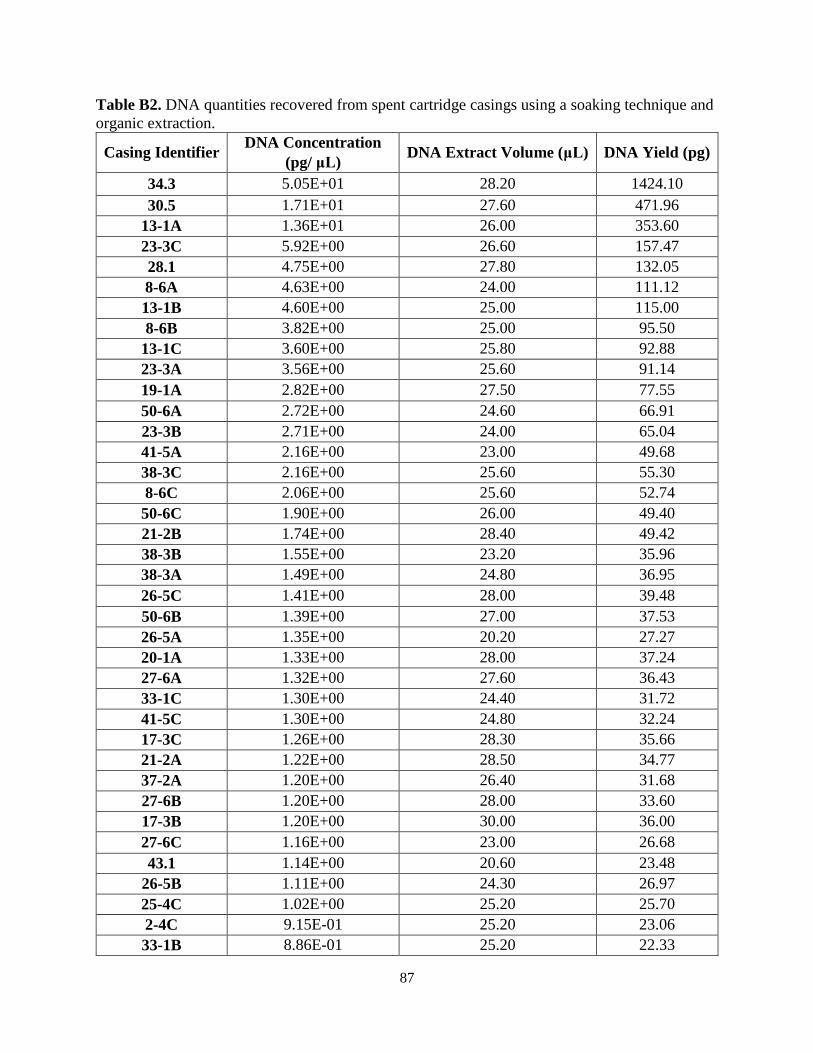
87
Table B2. DNA quantities recovered from spent cartridge casings using a soaking technique and
organic extraction.
Casing Identifier DNA Concentration
(pg/ μL) DNA Extract Volume (μL) DNA Yield (pg)
34.3 5.05E+01 28.20 1424.10
30.5 1.71E+01 27.60 471.96
13-1A 1.36E+01 26.00 353.60
23-3C 5.92E+00 26.60 157.47
28.1 4.75E+00 27.80 132.05
8-6A 4.63E+00 24.00 111.12
13-1B 4.60E+00 25.00 115.00
8-6B 3.82E+00 25.00 95.50
13-1C 3.60E+00 25.80 92.88
23-3A 3.56E+00 25.60 91.14
19-1A 2.82E+00 27.50 77.55
50-6A 2.72E+00 24.60 66.91
23-3B 2.71E+00 24.00 65.04
41-5A 2.16E+00 23.00 49.68
38-3C 2.16E+00 25.60 55.30
8-6C 2.06E+00 25.60 52.74
50-6C 1.90E+00 26.00 49.40
21-2B 1.74E+00 28.40 49.42
38-3B 1.55E+00 23.20 35.96
38-3A 1.49E+00 24.80 36.95
26-5C 1.41E+00 28.00 39.48
50-6B 1.39E+00 27.00 37.53
26-5A 1.35E+00 20.20 27.27
20-1A 1.33E+00 28.00 37.24
27-6A 1.32E+00 27.60 36.43
33-1C 1.30E+00 24.40 31.72
41-5C 1.30E+00 24.80 32.24
17-3C 1.26E+00 28.30 35.66
21-2A 1.22E+00 28.50 34.77
37-2A 1.20E+00 26.40 31.68
27-6B 1.20E+00 28.00 33.60
17-3B 1.20E+00 30.00 36.00
27-6C 1.16E+00 23.00 26.68
43.1 1.14E+00 20.60 23.48
26-5B 1.11E+00 24.30 26.97
25-4C 1.02E+00 25.20 25.70
2-4C 9.15E-01 25.20 23.06
33-1B 8.86E-01 25.20 22.33
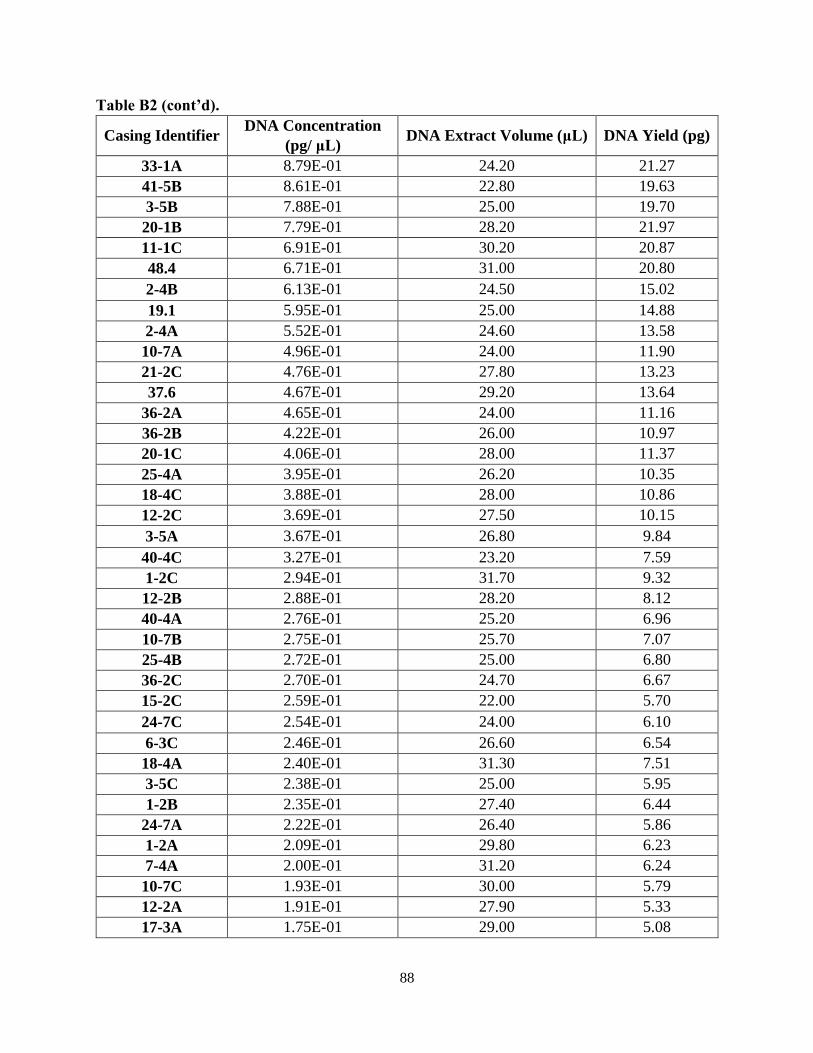
88
Table B2 (cont’d).
Casing Identifier DNA Concentration
(pg/ μL) DNA Extract Volume (μL) DNA Yield (pg)
33-1A 8.79E-01 24.20 21.27
41-5B 8.61E-01 22.80 19.63
3-5B 7.88E-01 25.00 19.70
20-1B 7.79E-01 28.20 21.97
11-1C 6.91E-01 30.20 20.87
48.4 6.71E-01 31.00 20.80
2-4B 6.13E-01 24.50 15.02
19.1 5.95E-01 25.00 14.88
2-4A 5.52E-01 24.60 13.58
10-7A 4.96E-01 24.00 11.90
21-2C 4.76E-01 27.80 13.23
37.6 4.67E-01 29.20 13.64
36-2A 4.65E-01 24.00 11.16
36-2B 4.22E-01 26.00 10.97
20-1C 4.06E-01 28.00 11.37
25-4A 3.95E-01 26.20 10.35
18-4C 3.88E-01 28.00 10.86
12-2C 3.69E-01 27.50 10.15
3-5A 3.67E-01 26.80 9.84
40-4C 3.27E-01 23.20 7.59
1-2C 2.94E-01 31.70 9.32
12-2B 2.88E-01 28.20 8.12
40-4A 2.76E-01 25.20 6.96
10-7B 2.75E-01 25.70 7.07
25-4B 2.72E-01 25.00 6.80
36-2C 2.70E-01 24.70 6.67
15-2C 2.59E-01 22.00 5.70
24-7C 2.54E-01 24.00 6.10
6-3C 2.46E-01 26.60 6.54
18-4A 2.40E-01 31.30 7.51
3-5C 2.38E-01 25.00 5.95
1-2B 2.35E-01 27.40 6.44
24-7A 2.22E-01 26.40 5.86
1-2A 2.09E-01 29.80 6.23
7-4A 2.00E-01 31.20 6.24
10-7C 1.93E-01 30.00 5.79
12-2A 1.91E-01 27.90 5.33
17-3A 1.75E-01 29.00 5.08
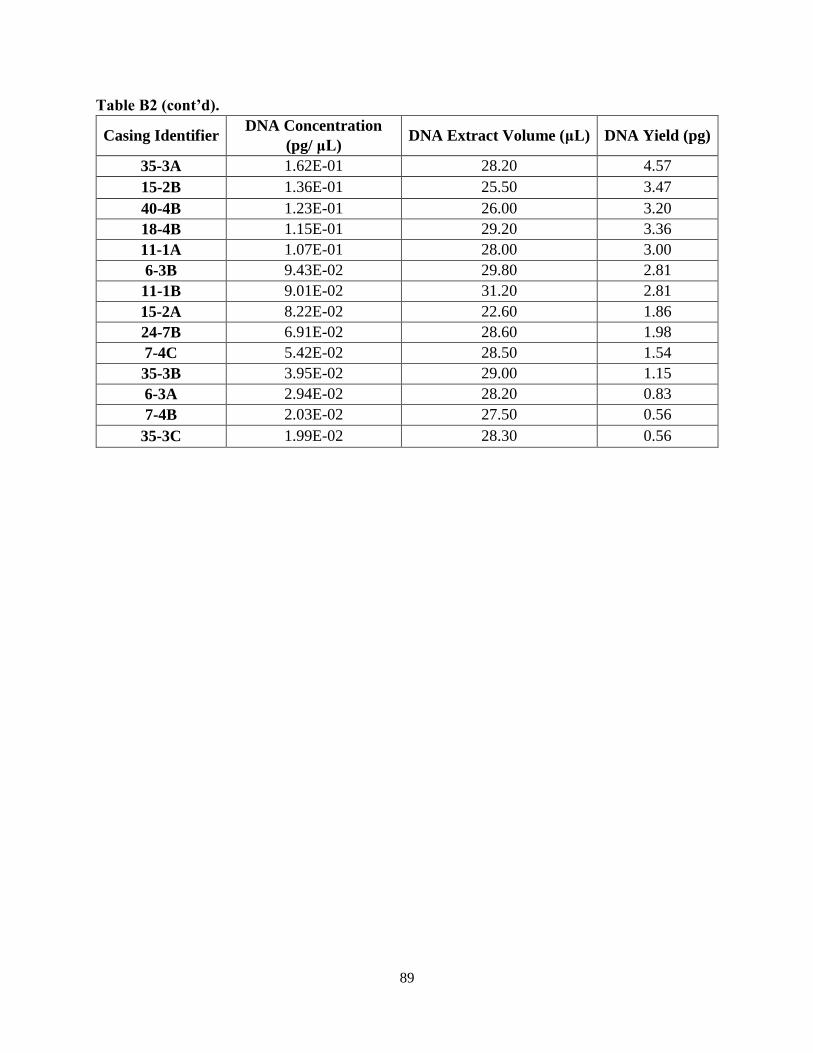
89
Table B2 (cont’d).
Casing Identifier DNA Concentration
(pg/ μL) DNA Extract Volume (μL) DNA Yield (pg)
35-3A 1.62E-01 28.20 4.57
15-2B 1.36E-01 25.50 3.47
40-4B 1.23E-01 26.00 3.20
18-4B 1.15E-01 29.20 3.36
11-1A 1.07E-01 28.00 3.00
6-3B 9.43E-02 29.80 2.81
11-1B 9.01E-02 31.20 2.81
15-2A 8.22E-02 22.60 1.86
24-7B 6.91E-02 28.60 1.98
7-4C 5.42E-02 28.50 1.54
35-3B 3.95E-02 29.00 1.15
6-3A 2.94E-02 28.20 0.83
7-4B 2.03E-02 27.50 0.56
35-3C 1.99E-02 28.30 0.56
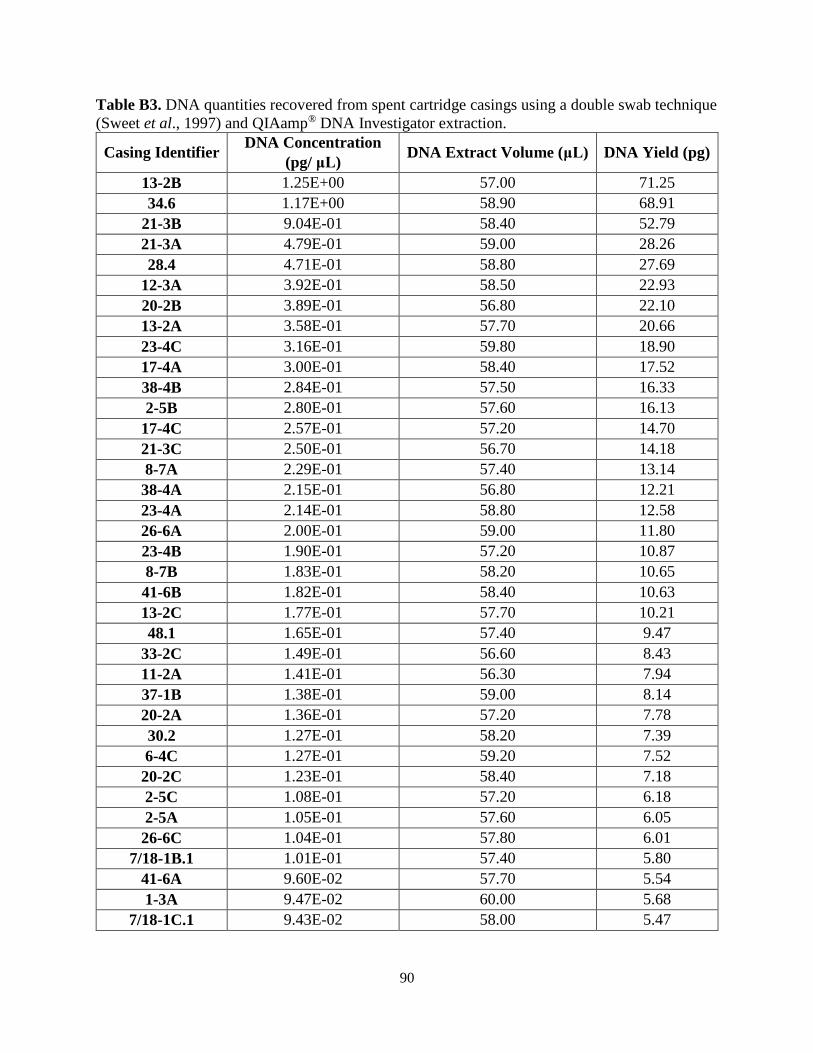
90
Table B3. DNA quantities recovered from spent cartridge casings using a double swab technique
(Sweet et al., 1997) and QIAamp® DNA Investigator extraction.
Casing Identifier DNA Concentration
(pg/ μL) DNA Extract Volume (μL) DNA Yield (pg)
13-2B 1.25E+00 57.00 71.25
34.6 1.17E+00 58.90 68.91
21-3B 9.04E-01 58.40 52.79
21-3A 4.79E-01 59.00 28.26
28.4 4.71E-01 58.80 27.69
12-3A 3.92E-01 58.50 22.93
20-2B 3.89E-01 56.80 22.10
13-2A 3.58E-01 57.70 20.66
23-4C 3.16E-01 59.80 18.90
17-4A 3.00E-01 58.40 17.52
38-4B 2.84E-01 57.50 16.33
2-5B 2.80E-01 57.60 16.13
17-4C 2.57E-01 57.20 14.70
21-3C 2.50E-01 56.70 14.18
8-7A 2.29E-01 57.40 13.14
38-4A 2.15E-01 56.80 12.21
23-4A 2.14E-01 58.80 12.58
26-6A 2.00E-01 59.00 11.80
23-4B 1.90E-01 57.20 10.87
8-7B 1.83E-01 58.20 10.65
41-6B 1.82E-01 58.40 10.63
13-2C 1.77E-01 57.70 10.21
48.1 1.65E-01 57.40 9.47
33-2C 1.49E-01 56.60 8.43
11-2A 1.41E-01 56.30 7.94
37-1B 1.38E-01 59.00 8.14
20-2A 1.36E-01 57.20 7.78
30.2 1.27E-01 58.20 7.39
6-4C 1.27E-01 59.20 7.52
20-2C 1.23E-01 58.40 7.18
2-5C 1.08E-01 57.20 6.18
2-5A 1.05E-01 57.60 6.05
26-6C 1.04E-01 57.80 6.01
7/18-1B.1 1.01E-01 57.40 5.80
41-6A 9.60E-02 57.70 5.54
1-3A 9.47E-02 60.00 5.68
7/18-1C.1 9.43E-02 58.00 5.47
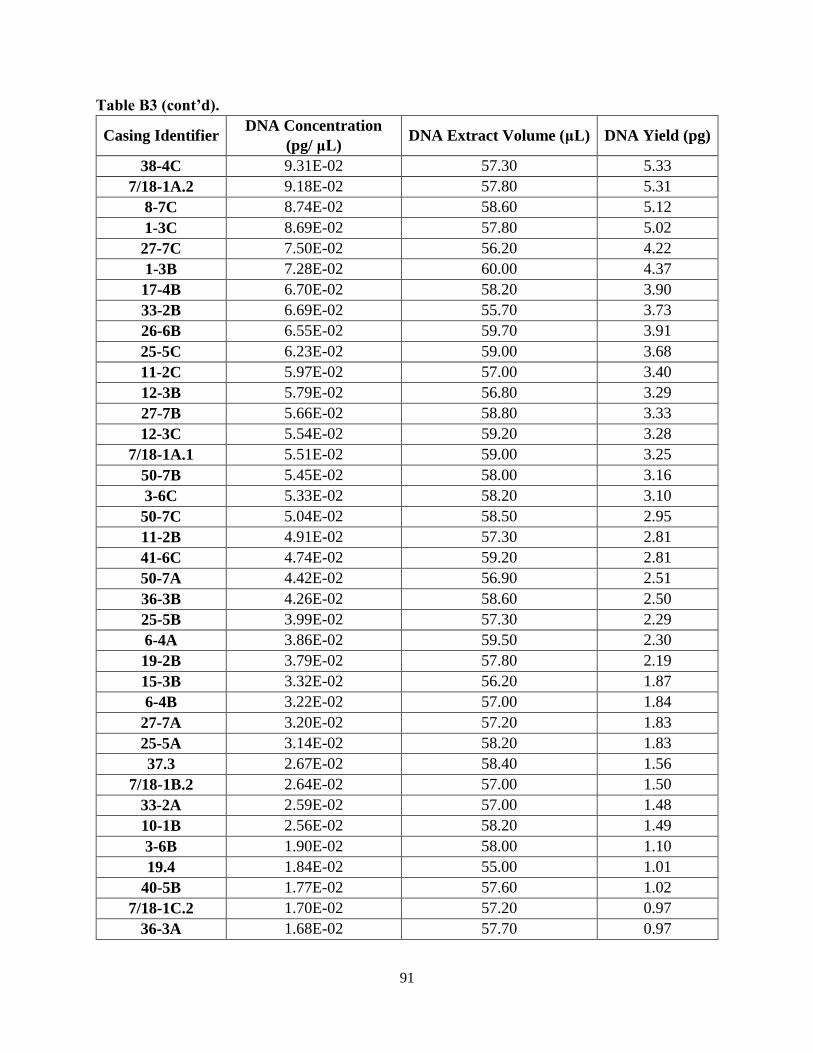
91
Table B3 (cont’d).
Casing Identifier DNA Concentration
(pg/ μL) DNA Extract Volume (μL) DNA Yield (pg)
38-4C 9.31E-02 57.30 5.33
7/18-1A.2 9.18E-02 57.80 5.31
8-7C 8.74E-02 58.60 5.12
1-3C 8.69E-02 57.80 5.02
27-7C 7.50E-02 56.20 4.22
1-3B 7.28E-02 60.00 4.37
17-4B 6.70E-02 58.20 3.90
33-2B 6.69E-02 55.70 3.73
26-6B 6.55E-02 59.70 3.91
25-5C 6.23E-02 59.00 3.68
11-2C 5.97E-02 57.00 3.40
12-3B 5.79E-02 56.80 3.29
27-7B 5.66E-02 58.80 3.33
12-3C 5.54E-02 59.20 3.28
7/18-1A.1 5.51E-02 59.00 3.25
50-7B 5.45E-02 58.00 3.16
3-6C 5.33E-02 58.20 3.10
50-7C 5.04E-02 58.50 2.95
11-2B 4.91E-02 57.30 2.81
41-6C 4.74E-02 59.20 2.81
50-7A 4.42E-02 56.90 2.51
36-3B 4.26E-02 58.60 2.50
25-5B 3.99E-02 57.30 2.29
6-4A 3.86E-02 59.50 2.30
19-2B 3.79E-02 57.80 2.19
15-3B 3.32E-02 56.20 1.87
6-4B 3.22E-02 57.00 1.84
27-7A 3.20E-02 57.20 1.83
25-5A 3.14E-02 58.20 1.83
37.3 2.67E-02 58.40 1.56
7/18-1B.2 2.64E-02 57.00 1.50
33-2A 2.59E-02 57.00 1.48
10-1B 2.56E-02 58.20 1.49
3-6B 1.90E-02 58.00 1.10
19.4 1.84E-02 55.00 1.01
40-5B 1.77E-02 57.60 1.02
7/18-1C.2 1.70E-02 57.20 0.97
36-3A 1.68E-02 57.70 0.97
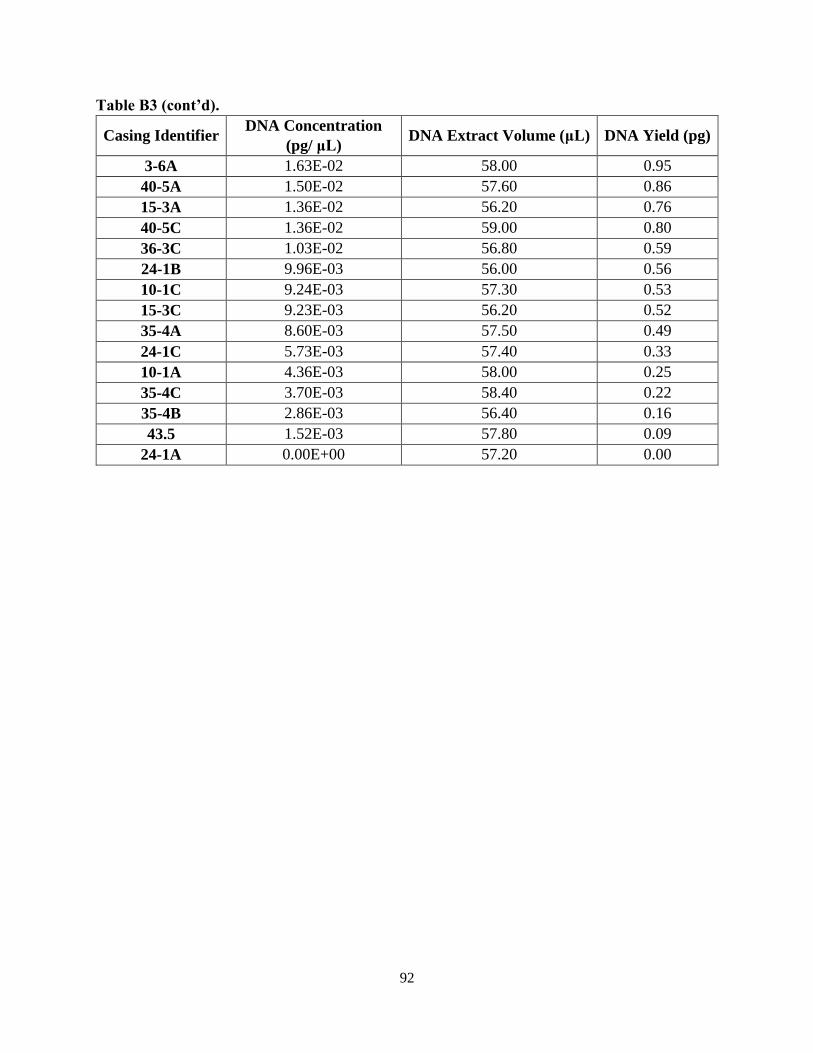
92
Table B3 (cont’d).
Casing Identifier DNA Concentration
(pg/ μL) DNA Extract Volume (μL) DNA Yield (pg)
3-6A 1.63E-02 58.00 0.95
40-5A 1.50E-02 57.60 0.86
15-3A 1.36E-02 56.20 0.76
40-5C 1.36E-02 59.00 0.80
36-3C 1.03E-02 56.80 0.59
24-1B 9.96E-03 56.00 0.56
10-1C 9.24E-03 57.30 0.53
15-3C 9.23E-03 56.20 0.52
35-4A 8.60E-03 57.50 0.49
24-1C 5.73E-03 57.40 0.33
10-1A 4.36E-03 58.00 0.25
35-4C 3.70E-03 58.40 0.22
35-4B 2.86E-03 56.40 0.16
43.5 1.52E-03 57.80 0.09
24-1A 0.00E+00 57.20 0.00
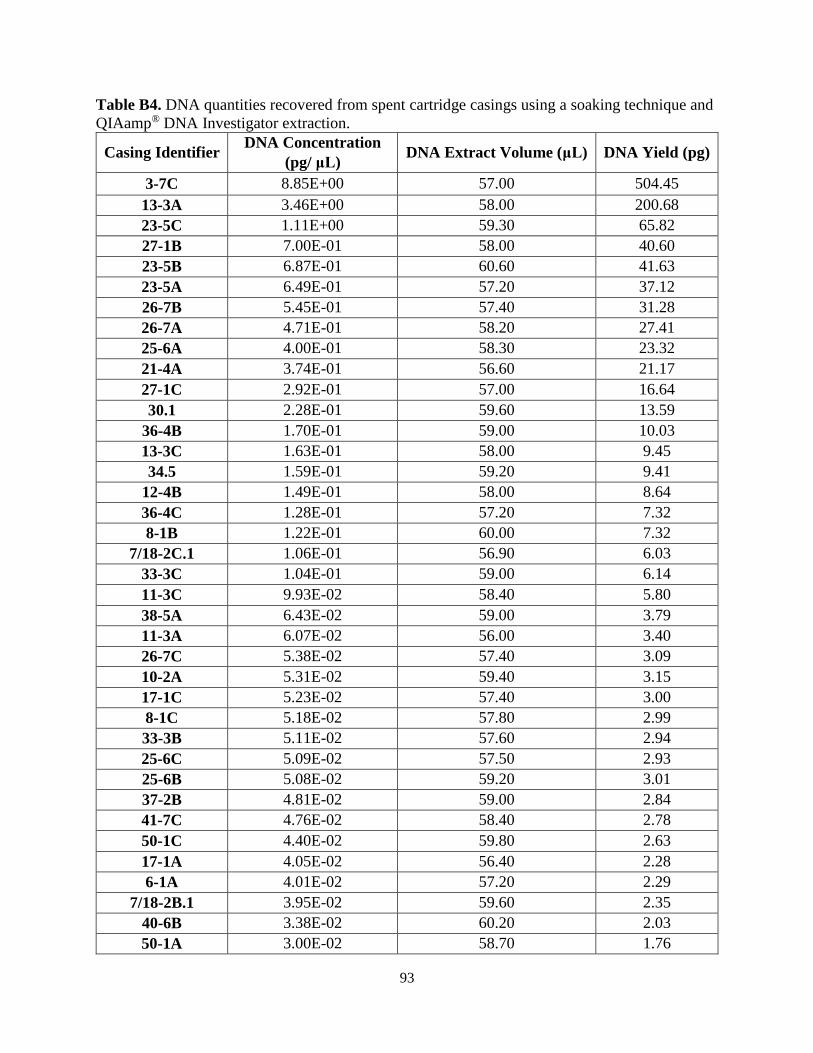
93
Table B4. DNA quantities recovered from spent cartridge casings using a soaking technique and
QIAamp® DNA Investigator extraction.
Casing Identifier DNA Concentration
(pg/ μL) DNA Extract Volume (μL) DNA Yield (pg)
3-7C 8.85E+00 57.00 504.45
13-3A 3.46E+00 58.00 200.68
23-5C 1.11E+00 59.30 65.82
27-1B 7.00E-01 58.00 40.60
23-5B 6.87E-01 60.60 41.63
23-5A 6.49E-01 57.20 37.12
26-7B 5.45E-01 57.40 31.28
26-7A 4.71E-01 58.20 27.41
25-6A 4.00E-01 58.30 23.32
21-4A 3.74E-01 56.60 21.17
27-1C 2.92E-01 57.00 16.64
30.1 2.28E-01 59.60 13.59
36-4B 1.70E-01 59.00 10.03
13-3C 1.63E-01 58.00 9.45
34.5 1.59E-01 59.20 9.41
12-4B 1.49E-01 58.00 8.64
36-4C 1.28E-01 57.20 7.32
8-1B 1.22E-01 60.00 7.32
7/18-2C.1 1.06E-01 56.90 6.03
33-3C 1.04E-01 59.00 6.14
11-3C 9.93E-02 58.40 5.80
38-5A 6.43E-02 59.00 3.79
11-3A 6.07E-02 56.00 3.40
26-7C 5.38E-02 57.40 3.09
10-2A 5.31E-02 59.40 3.15
17-1C 5.23E-02 57.40 3.00
8-1C 5.18E-02 57.80 2.99
33-3B 5.11E-02 57.60 2.94
25-6C 5.09E-02 57.50 2.93
25-6B 5.08E-02 59.20 3.01
37-2B 4.81E-02 59.00 2.84
41-7C 4.76E-02 58.40 2.78
50-1C 4.40E-02 59.80 2.63
17-1A 4.05E-02 56.40 2.28
6-1A 4.01E-02 57.20 2.29
7/18-2B.1 3.95E-02 59.60 2.35
40-6B 3.38E-02 60.20 2.03
50-1A 3.00E-02 58.70 1.76
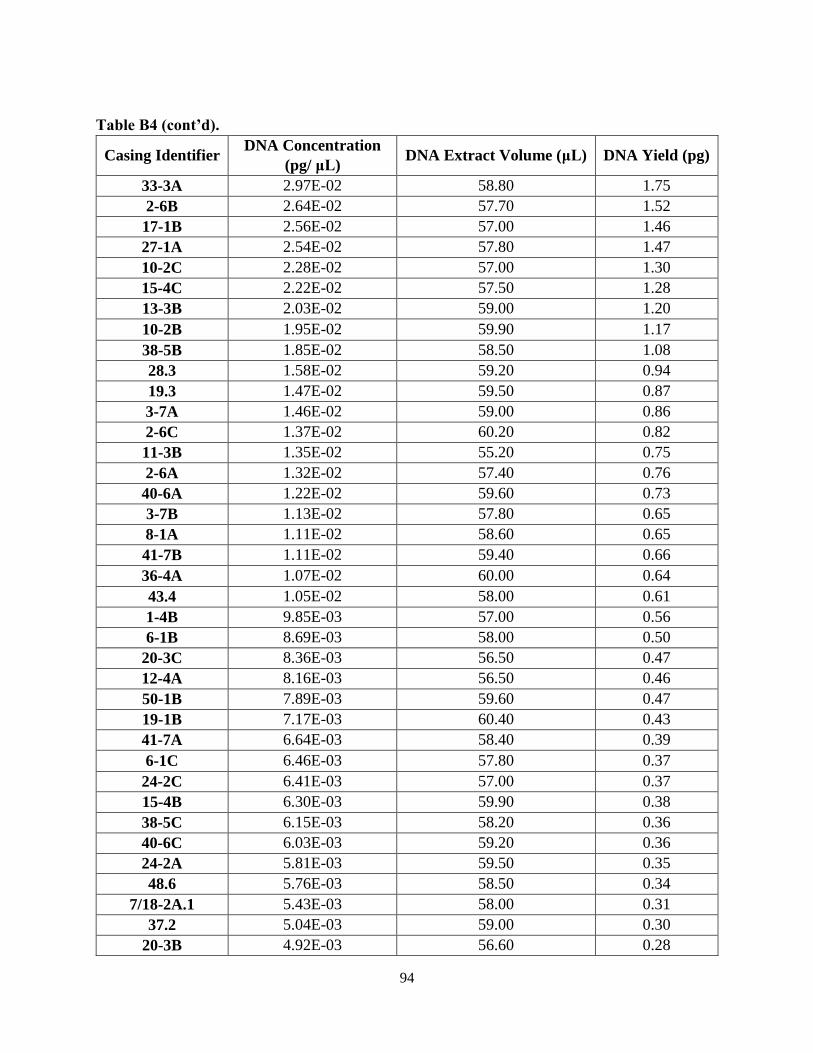
94
Table B4 (cont’d).
Casing Identifier DNA Concentration
(pg/ μL) DNA Extract Volume (μL) DNA Yield (pg)
33-3A 2.97E-02 58.80 1.75
2-6B 2.64E-02 57.70 1.52
17-1B 2.56E-02 57.00 1.46
27-1A 2.54E-02 57.80 1.47
10-2C 2.28E-02 57.00 1.30
15-4C 2.22E-02 57.50 1.28
13-3B 2.03E-02 59.00 1.20
10-2B 1.95E-02 59.90 1.17
38-5B 1.85E-02 58.50 1.08
28.3 1.58E-02 59.20 0.94
19.3 1.47E-02 59.50 0.87
3-7A 1.46E-02 59.00 0.86
2-6C 1.37E-02 60.20 0.82
11-3B 1.35E-02 55.20 0.75
2-6A 1.32E-02 57.40 0.76
40-6A 1.22E-02 59.60 0.73
3-7B 1.13E-02 57.80 0.65
8-1A 1.11E-02 58.60 0.65
41-7B 1.11E-02 59.40 0.66
36-4A 1.07E-02 60.00 0.64
43.4 1.05E-02 58.00 0.61
1-4B 9.85E-03 57.00 0.56
6-1B 8.69E-03 58.00 0.50
20-3C 8.36E-03 56.50 0.47
12-4A 8.16E-03 56.50 0.46
50-1B 7.89E-03 59.60 0.47
19-1B 7.17E-03 60.40 0.43
41-7A 6.64E-03 58.40 0.39
6-1C 6.46E-03 57.80 0.37
24-2C 6.41E-03 57.00 0.37
15-4B 6.30E-03 59.90 0.38
38-5C 6.15E-03 58.20 0.36
40-6C 6.03E-03 59.20 0.36
24-2A 5.81E-03 59.50 0.35
48.6 5.76E-03 58.50 0.34
7/18-2A.1 5.43E-03 58.00 0.31
37.2 5.04E-03 59.00 0.30
20-3B 4.92E-03 56.60 0.28
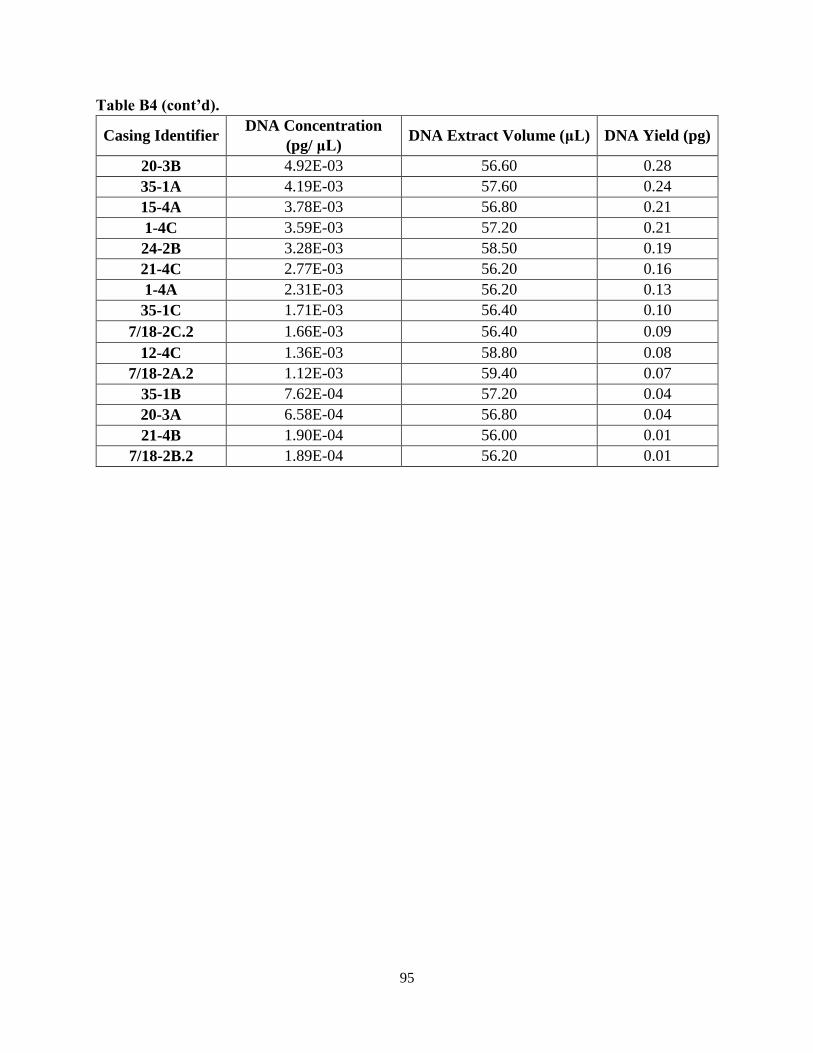
95
Table B4 (cont’d).
Casing Identifier DNA Concentration
(pg/ μL) DNA Extract Volume (μL) DNA Yield (pg)
20-3B 4.92E-03 56.60 0.28
35-1A 4.19E-03 57.60 0.24
15-4A 3.78E-03 56.80 0.21
1-4C 3.59E-03 57.20 0.21
24-2B 3.28E-03 58.50 0.19
21-4C 2.77E-03 56.20 0.16
1-4A 2.31E-03 56.20 0.13
35-1C 1.71E-03 56.40 0.10
7/18-2C.2 1.66E-03 56.40 0.09
12-4C 1.36E-03 58.80 0.08
7/18-2A.2 1.12E-03 59.40 0.07
35-1B 7.62E-04 57.20 0.04
20-3A 6.58E-04 56.80 0.04
21-4B 1.90E-04 56.00 0.01
7/18-2B.2 1.89E-04 56.20 0.01
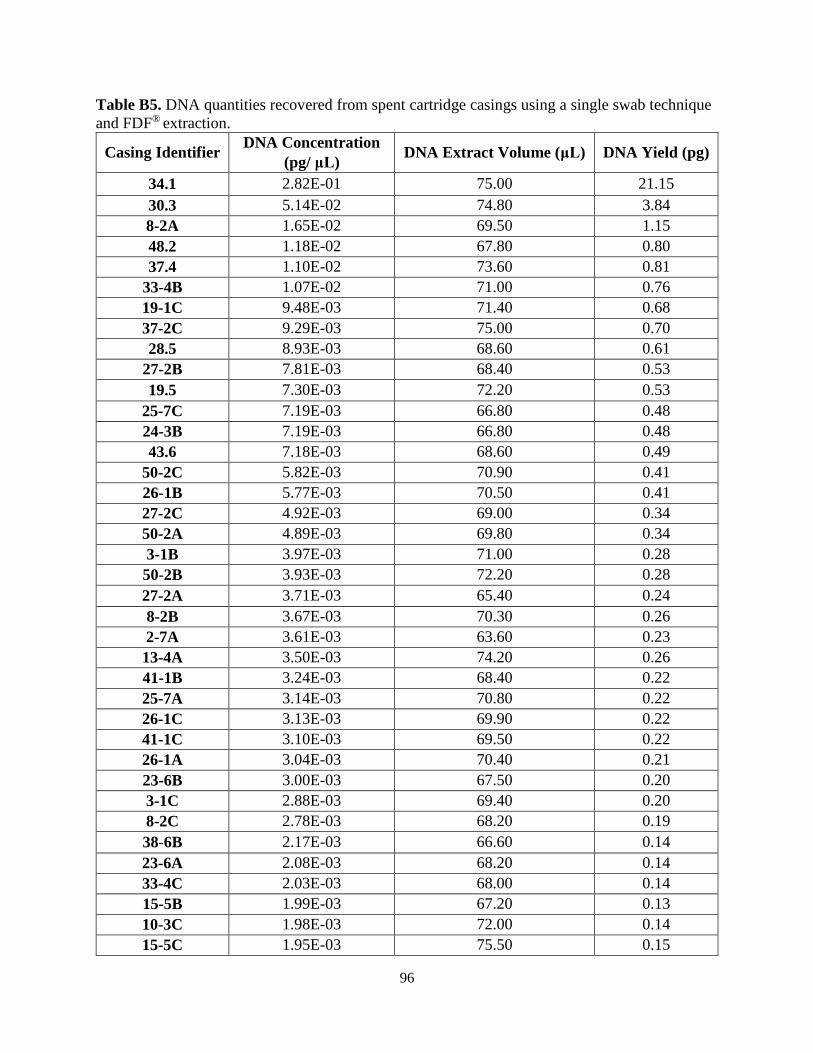
96
Table B5. DNA quantities recovered from spent cartridge casings using a single swab technique
and FDF® extraction.
Casing Identifier DNA Concentration
(pg/ μL) DNA Extract Volume (μL) DNA Yield (pg)
34.1 2.82E-01 75.00 21.15
30.3 5.14E-02 74.80 3.84
8-2A 1.65E-02 69.50 1.15
48.2 1.18E-02 67.80 0.80
37.4 1.10E-02 73.60 0.81
33-4B 1.07E-02 71.00 0.76
19-1C 9.48E-03 71.40 0.68
37-2C 9.29E-03 75.00 0.70
28.5 8.93E-03 68.60 0.61
27-2B 7.81E-03 68.40 0.53
19.5 7.30E-03 72.20 0.53
25-7C 7.19E-03 66.80 0.48
24-3B 7.19E-03 66.80 0.48
43.6 7.18E-03 68.60 0.49
50-2C 5.82E-03 70.90 0.41
26-1B 5.77E-03 70.50 0.41
27-2C 4.92E-03 69.00 0.34
50-2A 4.89E-03 69.80 0.34
3-1B 3.97E-03 71.00 0.28
50-2B 3.93E-03 72.20 0.28
27-2A 3.71E-03 65.40 0.24
8-2B 3.67E-03 70.30 0.26
2-7A 3.61E-03 63.60 0.23
13-4A 3.50E-03 74.20 0.26
41-1B 3.24E-03 68.40 0.22
25-7A 3.14E-03 70.80 0.22
26-1C 3.13E-03 69.90 0.22
41-1C 3.10E-03 69.50 0.22
26-1A 3.04E-03 70.40 0.21
23-6B 3.00E-03 67.50 0.20
3-1C 2.88E-03 69.40 0.20
8-2C 2.78E-03 68.20 0.19
38-6B 2.17E-03 66.60 0.14
23-6A 2.08E-03 68.20 0.14
33-4C 2.03E-03 68.00 0.14
15-5B 1.99E-03 67.20 0.13
10-3C 1.98E-03 72.00 0.14
15-5C 1.95E-03 75.50 0.15
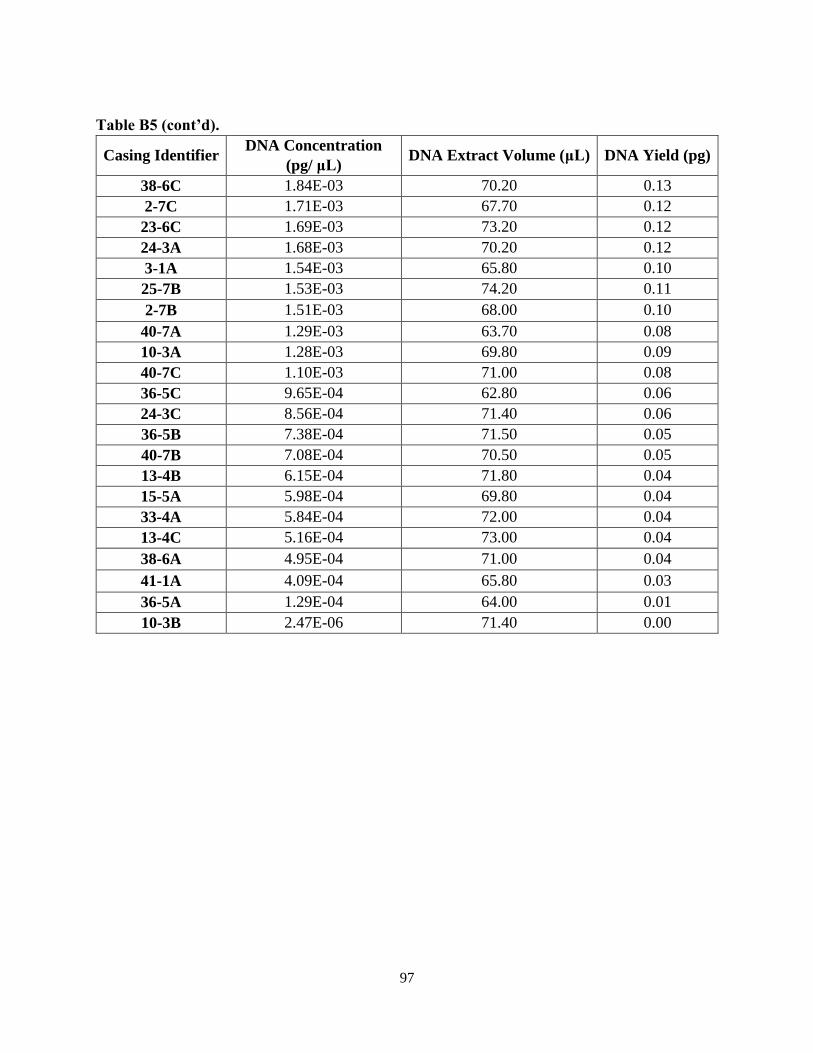
97
Table B5 (cont’d).
Casing Identifier DNA Concentration
(pg/ μL) DNA Extract Volume (μL) DNA Yield (pg)
38-6C 1.84E-03 70.20 0.13
2-7C 1.71E-03 67.70 0.12
23-6C 1.69E-03 73.20 0.12
24-3A 1.68E-03 70.20 0.12
3-1A 1.54E-03 65.80 0.10
25-7B 1.53E-03 74.20 0.11
2-7B 1.51E-03 68.00 0.10
40-7A 1.29E-03 63.70 0.08
10-3A 1.28E-03 69.80 0.09
40-7C 1.10E-03 71.00 0.08
36-5C 9.65E-04 62.80 0.06
24-3C 8.56E-04 71.40 0.06
36-5B 7.38E-04 71.50 0.05
40-7B 7.08E-04 70.50 0.05
13-4B 6.15E-04 71.80 0.04
15-5A 5.98E-04 69.80 0.04
33-4A 5.84E-04 72.00 0.04
13-4C 5.16E-04 73.00 0.04
38-6A 4.95E-04 71.00 0.04
41-1A 4.09E-04 65.80 0.03
36-5A 1.29E-04 64.00 0.01
10-3B 2.47E-06 71.40 0.00
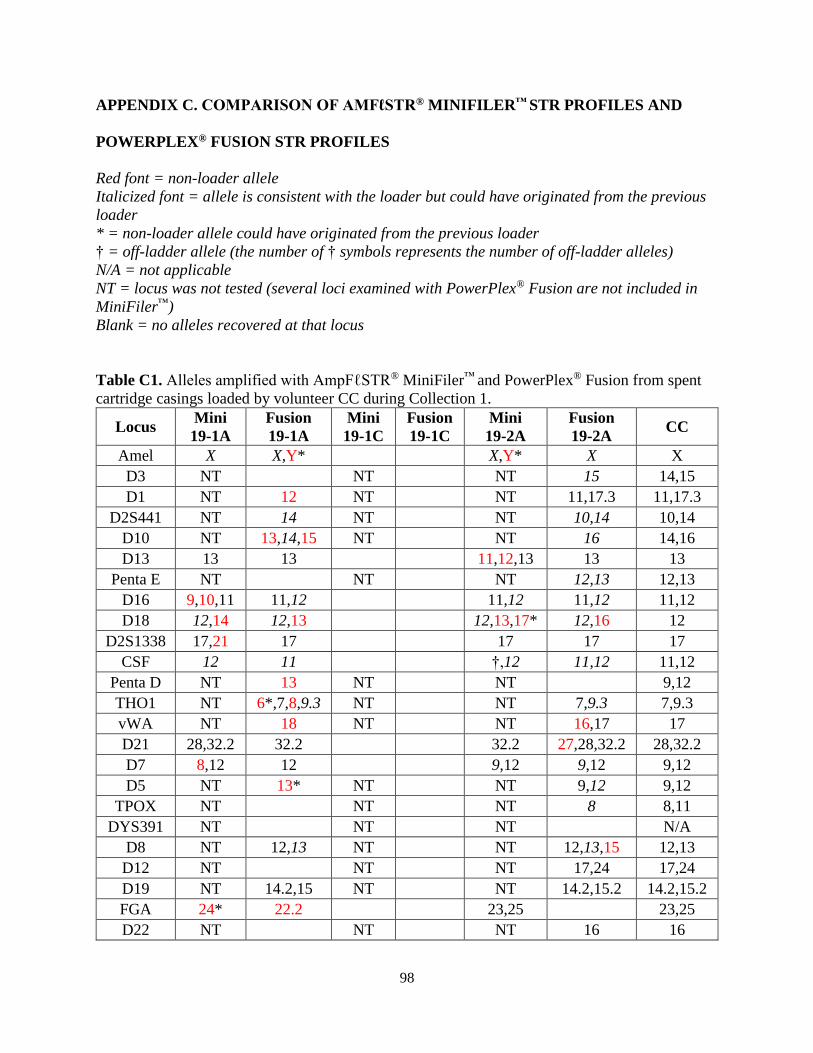
98
APPENDIX C. COMPARISON OF AMFℓSTR® MINIFILER™ STR PROFILES AND
POWERPLEX® FUSION STR PROFILES
Red font = non-loader allele
Italicized font = allele is consistent with the loader but could have originated from the previous
loader
* = non-loader allele could have originated from the previous loader
† = off-ladder allele (the number of † symbols represents the number of off-ladder alleles)
N/A = not applicable
NT = locus was not tested (several loci examined with PowerPlex® Fusion are not included in
MiniFiler™)
Blank = no alleles recovered at that locus
Table C1. Alleles amplified with AmpFℓSTR® MiniFiler™ and PowerPlex® Fusion from spent
cartridge casings loaded by volunteer CC during Collection 1.
Locus Mini
19-1A
Fusion
19-1A
Mini
19-1C
Fusion
19-1C
Mini
19-2A
Fusion
19-2A CC
Amel X X,Y* X,Y* X X
D3 NT NT NT 15 14,15
D1 NT 12 NT NT 11,17.3 11,17.3
D2S441 NT 14 NT NT 10,14 10,14
D10 NT 13,14,15 NT NT 16 14,16
D13 13 13 11,12,13 13 13
Penta E NT NT NT 12,13 12,13
D16 9,10,11 11,12 11,12 11,12 11,12
D18 12,14 12,13 12,13,17* 12,16 12
D2S1338 17,21 17 17 17 17
CSF 12 11 †,12 11,12 11,12
Penta D NT 13 NT NT 9,12
THO1 NT 6*,7,8,9.3 NT NT 7,9.3 7,9.3
vWA NT 18 NT NT 16,17 17
D21 28,32.2 32.2 32.2 27,28,32.2 28,32.2
D7 8,12 12 9,12 9,12 9,12
D5 NT 13* NT NT 9,12 9,12
TPOX NT NT NT 8 8,11
DYS391 NT NT NT N/A
D8 NT 12,13 NT NT 12,13,15 12,13
D12 NT NT NT 17,24 17,24
D19 NT 14.2,15 NT NT 14.2,15.2 14.2,15.2
FGA 24* 22.2 23,25 23,25
D22 NT NT NT 16 16
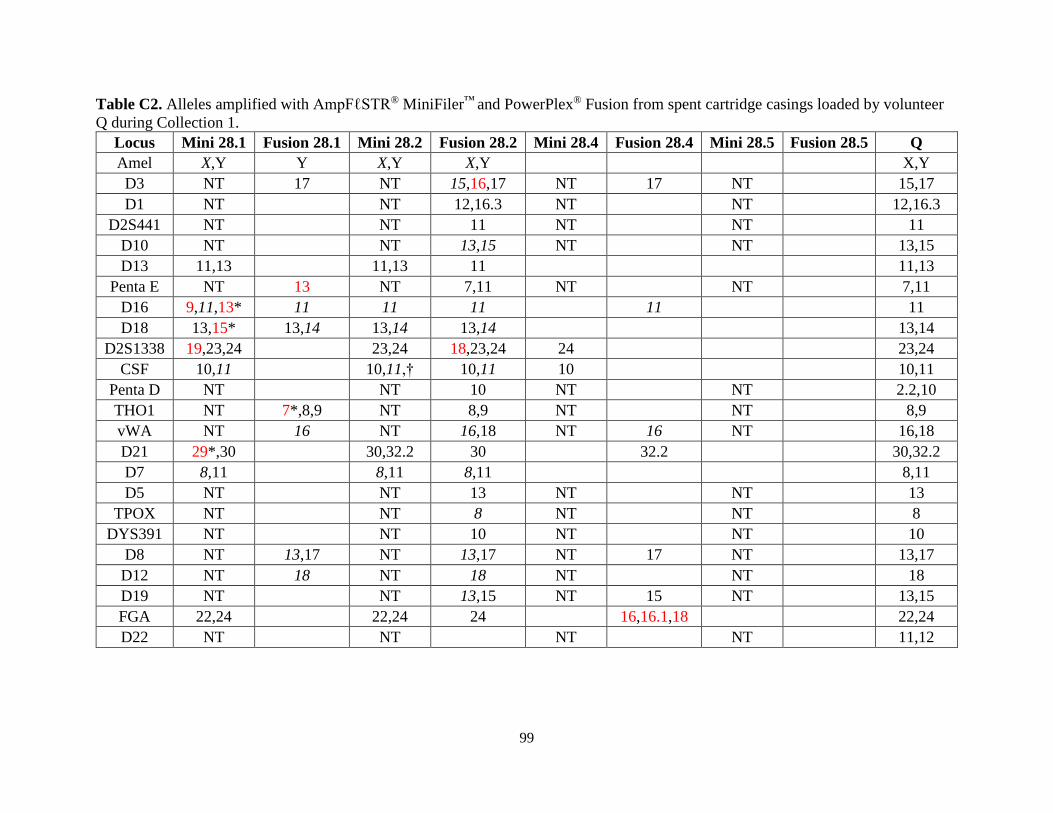
99
Table C2. Alleles amplified with AmpFℓSTR® MiniFiler™ and PowerPlex® Fusion from spent cartridge casings loaded by volunteer
Q during Collection 1.
Locus Mini 28.1 Fusion 28.1 Mini 28.2 Fusion 28.2 Mini 28.4 Fusion 28.4 Mini 28.5 Fusion 28.5 Q
Amel X,Y Y X,Y X,Y X,Y
D3 NT 17 NT 15,16,17 NT 17 NT 15,17
D1 NT NT 12,16.3 NT NT 12,16.3
D2S441 NT NT 11 NT NT 11
D10 NT NT 13,15 NT NT 13,15
D13 11,13 11,13 11 11,13
Penta E NT 13 NT 7,11 NT NT 7,11
D16 9,11,13* 11 11 11 11 11
D18 13,15* 13,14 13,14 13,14 13,14
D2S1338 19,23,24 23,24 18,23,24 24 23,24
CSF 10,11 10,11,† 10,11 10 10,11
Penta D NT NT 10 NT NT 2.2,10
THO1 NT 7*,8,9 NT 8,9 NT NT 8,9
vWA NT 16 NT 16,18 NT 16 NT 16,18
D21 29*,30 30,32.2 30 32.2 30,32.2
D7 8,11 8,11 8,11 8,11
D5 NT NT 13 NT NT 13
TPOX NT NT 8 NT NT 8
DYS391 NT NT 10 NT NT 10
D8 NT 13,17 NT 13,17 NT 17 NT 13,17
D12 NT 18 NT 18 NT NT 18
D19 NT NT 13,15 NT 15 NT 13,15
FGA 22,24 22,24 24 16,16.1,18 22,24
D22 NT NT NT NT 11,12
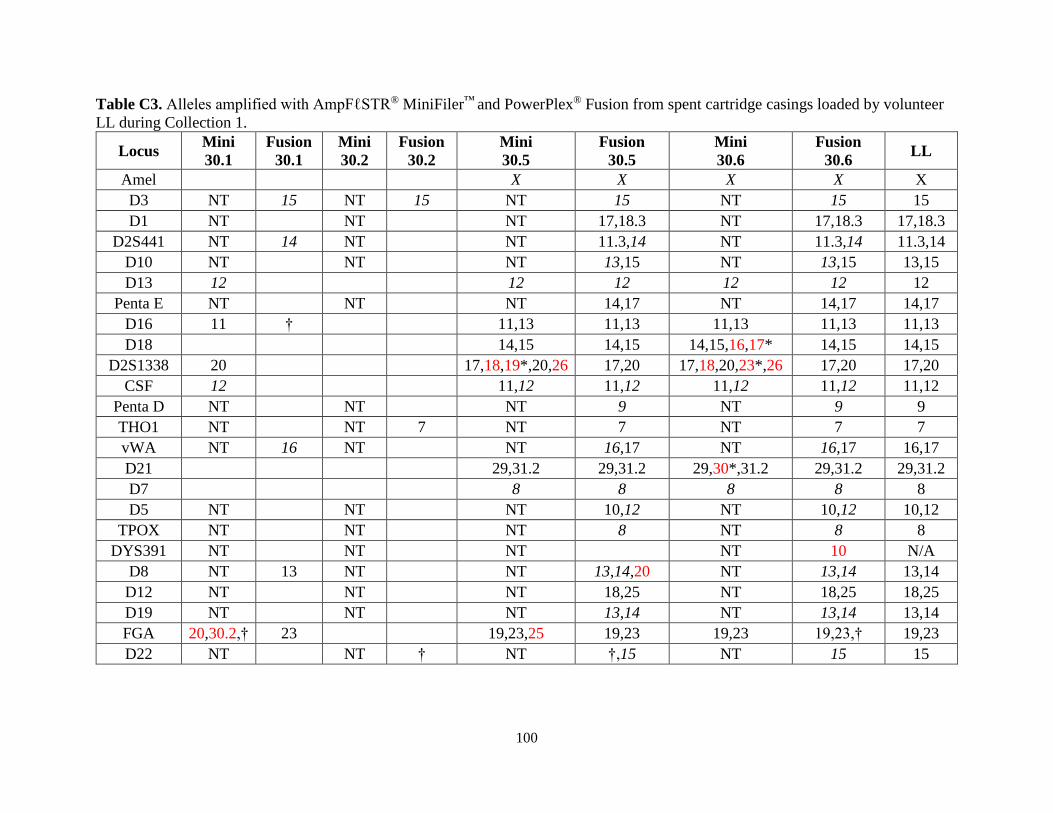
100
Table C3. Alleles amplified with AmpFℓSTR® MiniFiler™ and PowerPlex® Fusion from spent cartridge casings loaded by volunteer
LL during Collection 1.
Locus Mini
30.1
Fusion
30.1
Mini
30.2
Fusion
30.2
Mini
30.5
Fusion
30.5
Mini
30.6
Fusion
30.6 LL
Amel X X X X X
D3 NT 15 NT 15 NT 15 NT 15 15
D1 NT NT NT 17,18.3 NT 17,18.3 17,18.3
D2S441 NT 14 NT NT 11.3,14 NT 11.3,14 11.3,14
D10 NT NT NT 13,15 NT 13,15 13,15
D13 12 12 12 12 12 12
Penta E NT NT NT 14,17 NT 14,17 14,17
D16 11 † 11,13 11,13 11,13 11,13 11,13
D18 14,15 14,15 14,15,16,17* 14,15 14,15
D2S1338 20 17,18,19*,20,26 17,20 17,18,20,23*,26 17,20 17,20
CSF 12 11,12 11,12 11,12 11,12 11,12
Penta D NT NT NT 9 NT 9 9
THO1 NT NT 7 NT 7 NT 7 7
vWA NT 16 NT NT 16,17 NT 16,17 16,17
D21 29,31.2 29,31.2 29,30*,31.2 29,31.2 29,31.2
D7 8 8 8 8 8
D5 NT NT NT 10,12 NT 10,12 10,12
TPOX NT NT NT 8 NT 8 8
DYS391 NT NT NT NT 10 N/A
D8 NT 13 NT NT 13,14,20 NT 13,14 13,14
D12 NT NT NT 18,25 NT 18,25 18,25
D19 NT NT NT 13,14 NT 13,14 13,14
FGA 20,30.2,† 23 19,23,25 19,23 19,23 19,23,† 19,23
D22 NT NT † NT †,15 NT 15 15
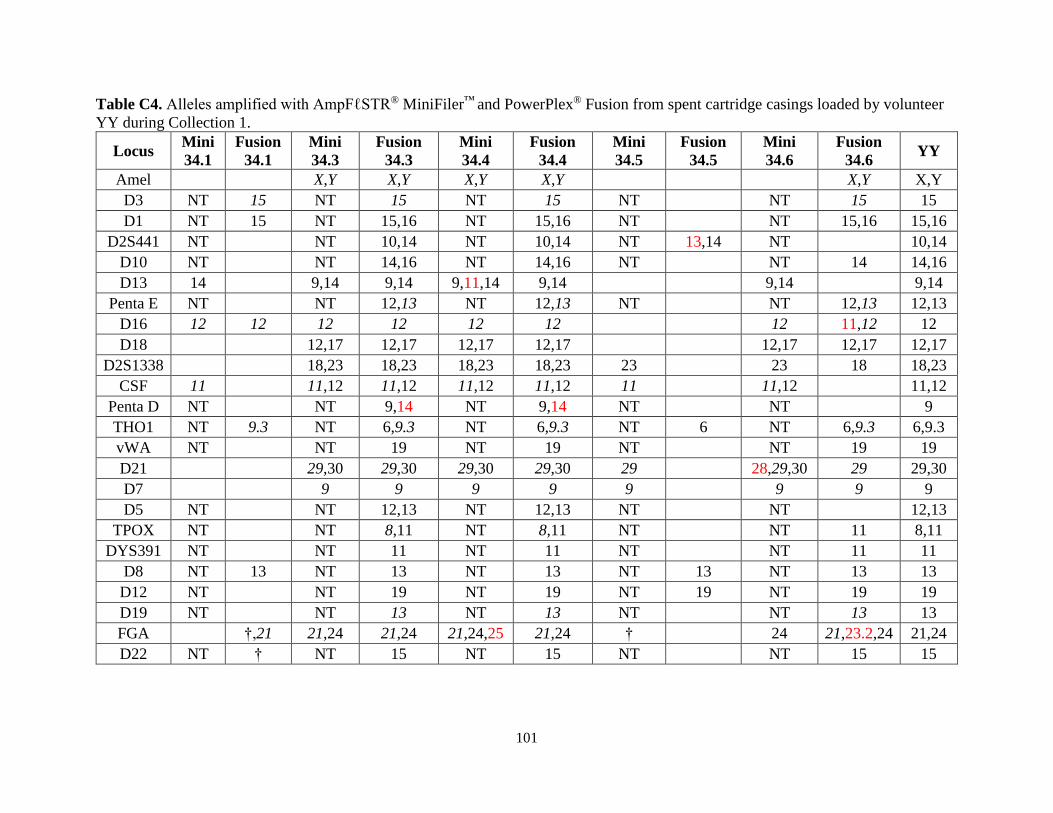
101
Table C4. Alleles amplified with AmpFℓSTR® MiniFiler™ and PowerPlex® Fusion from spent cartridge casings loaded by volunteer
YY during Collection 1.
Locus Mini
34.1
Fusion
34.1
Mini
34.3
Fusion
34.3
Mini
34.4
Fusion
34.4
Mini
34.5
Fusion
34.5
Mini
34.6
Fusion
34.6 YY
Amel X,Y X,Y X,Y X,Y X,Y X,Y
D3 NT 15 NT 15 NT 15 NT NT 15 15
D1 NT 15 NT 15,16 NT 15,16 NT NT 15,16 15,16
D2S441 NT NT 10,14 NT 10,14 NT 13,14 NT 10,14
D10 NT NT 14,16 NT 14,16 NT NT 14 14,16
D13 14 9,14 9,14 9,11,14 9,14 9,14 9,14
Penta E NT NT 12,13 NT 12,13 NT NT 12,13 12,13
D16 12 12 12 12 12 12 12 11,12 12
D18 12,17 12,17 12,17 12,17 12,17 12,17 12,17
D2S1338 18,23 18,23 18,23 18,23 23 23 18 18,23
CSF 11 11,12 11,12 11,12 11,12 11 11,12 11,12
Penta D NT NT 9,14 NT 9,14 NT NT 9
THO1 NT 9.3 NT 6,9.3 NT 6,9.3 NT 6 NT 6,9.3 6,9.3
vWA NT NT 19 NT 19 NT NT 19 19
D21 29,30 29,30 29,30 29,30 29 28,29,30 29 29,30
D7 9 9 9 9 9 9 9 9
D5 NT NT 12,13 NT 12,13 NT NT 12,13
TPOX NT NT 8,11 NT 8,11 NT NT 11 8,11
DYS391 NT NT 11 NT 11 NT NT 11 11
D8 NT 13 NT 13 NT 13 NT 13 NT 13 13
D12 NT NT 19 NT 19 NT 19 NT 19 19
D19 NT NT 13 NT 13 NT NT 13 13
FGA †,21 21,24 21,24 21,24,25 21,24 † 24 21,23.2,24 21,24
D22 NT † NT 15 NT 15 NT NT 15 15
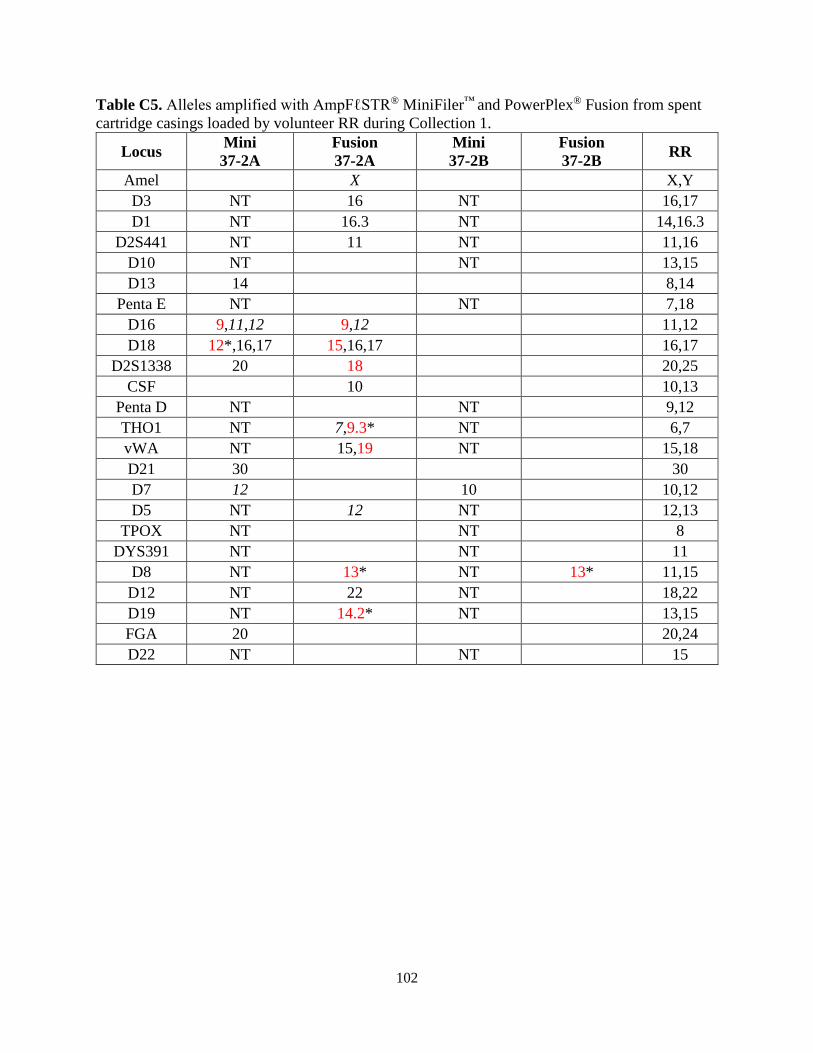
102
Table C5. Alleles amplified with AmpFℓSTR® MiniFiler™ and PowerPlex® Fusion from spent
cartridge casings loaded by volunteer RR during Collection 1.
Locus Mini
37-2A
Fusion
37-2A
Mini
37-2B
Fusion
37-2B RR
Amel X X,Y
D3 NT 16 NT 16,17
D1 NT 16.3 NT 14,16.3
D2S441 NT 11 NT 11,16
D10 NT NT 13,15
D13 14 8,14
Penta E NT NT 7,18
D16 9,11,12 9,12 11,12
D18 12*,16,17 15,16,17 16,17
D2S1338 20 18 20,25
CSF 10 10,13
Penta D NT NT 9,12
THO1 NT 7,9.3* NT 6,7
vWA NT 15,19 NT 15,18
D21 30 30
D7 12 10 10,12
D5 NT 12 NT 12,13
TPOX NT NT 8
DYS391 NT NT 11
D8 NT 13* NT 13* 11,15
D12 NT 22 NT 18,22
D19 NT 14.2* NT 13,15
FGA 20 20,24
D22 NT NT 15
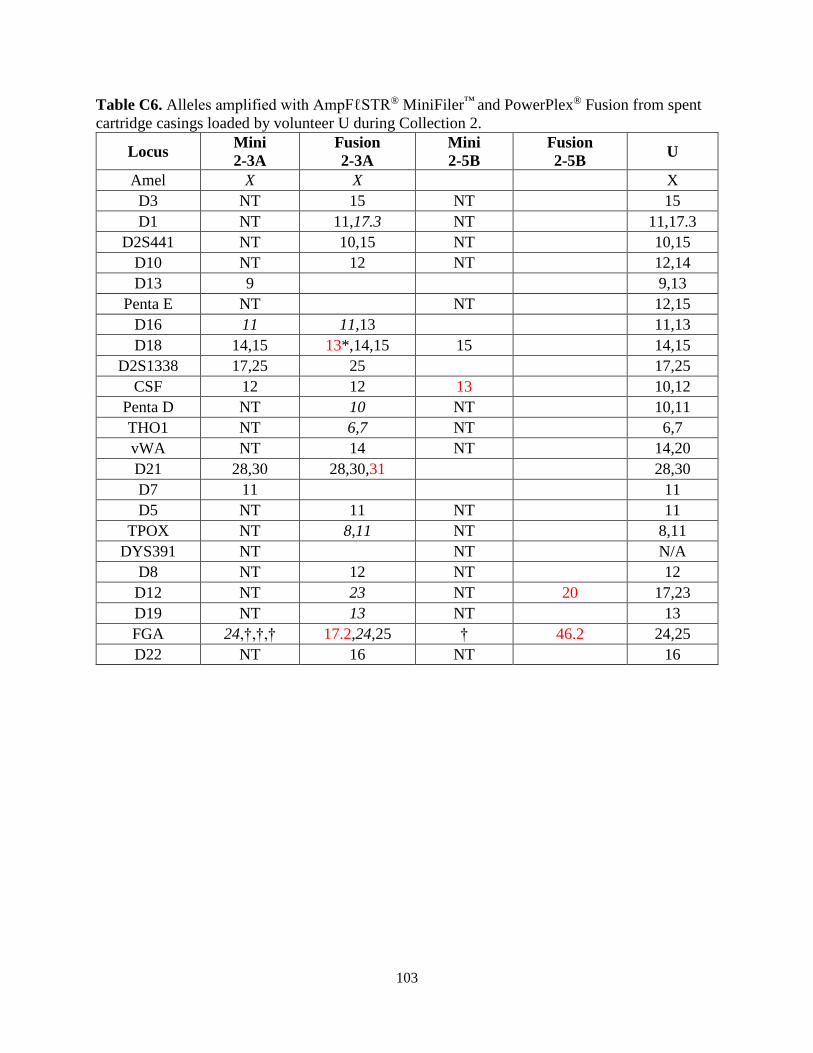
103
Table C6. Alleles amplified with AmpFℓSTR® MiniFiler™ and PowerPlex® Fusion from spent
cartridge casings loaded by volunteer U during Collection 2.
Locus Mini
2-3A
Fusion
2-3A
Mini
2-5B
Fusion
2-5B U
Amel X X X
D3 NT 15 NT 15
D1 NT 11,17.3 NT 11,17.3
D2S441 NT 10,15 NT 10,15
D10 NT 12 NT 12,14
D13 9 9,13
Penta E NT NT 12,15
D16 11 11,13 11,13
D18 14,15 13*,14,15 15 14,15
D2S1338 17,25 25 17,25
CSF 12 12 13 10,12
Penta D NT 10 NT 10,11
THO1 NT 6,7 NT 6,7
vWA NT 14 NT 14,20
D21 28,30 28,30,31 28,30
D7 11 11
D5 NT 11 NT 11
TPOX NT 8,11 NT 8,11
DYS391 NT NT N/A
D8 NT 12 NT 12
D12 NT 23 NT 20 17,23
D19 NT 13 NT 13
FGA 24,†,†,† 17.2,24,25 † 46.2 24,25
D22 NT 16 NT 16
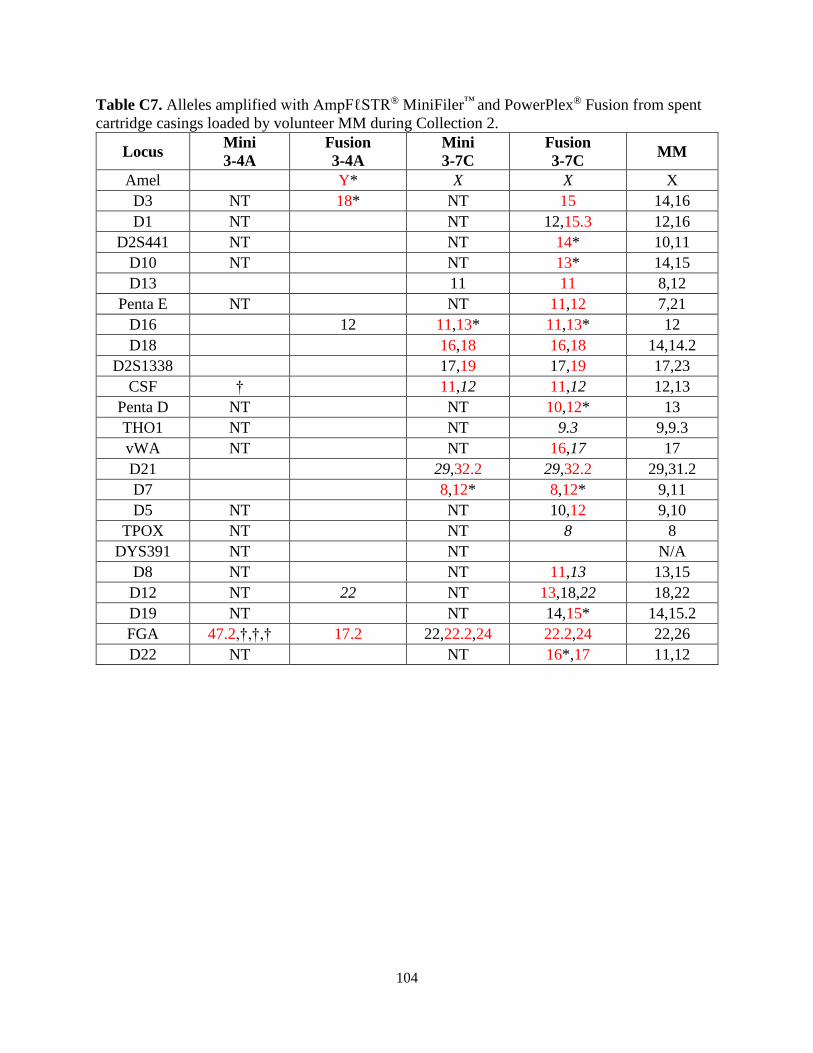
104
Table C7. Alleles amplified with AmpFℓSTR® MiniFiler™ and PowerPlex® Fusion from spent
cartridge casings loaded by volunteer MM during Collection 2.
Locus Mini
3-4A
Fusion
3-4A
Mini
3-7C
Fusion
3-7C MM
Amel Y* X X X
D3 NT 18* NT 15 14,16
D1 NT NT 12,15.3 12,16
D2S441 NT NT 14* 10,11
D10 NT NT 13* 14,15
D13 11 11 8,12
Penta E NT NT 11,12 7,21
D16 12 11,13* 11,13* 12
D18 16,18 16,18 14,14.2
D2S1338 17,19 17,19 17,23
CSF † 11,12 11,12 12,13
Penta D NT NT 10,12* 13
THO1 NT NT 9.3 9,9.3
vWA NT NT 16,17 17
D21 29,32.2 29,32.2 29,31.2
D7 8,12* 8,12* 9,11
D5 NT NT 10,12 9,10
TPOX NT NT 8 8
DYS391 NT NT N/A
D8 NT NT 11,13 13,15
D12 NT 22 NT 13,18,22 18,22
D19 NT NT 14,15* 14,15.2
FGA 47.2,†,†,† 17.2 22,22.2,24 22.2,24 22,26
D22 NT NT 16*,17 11,12
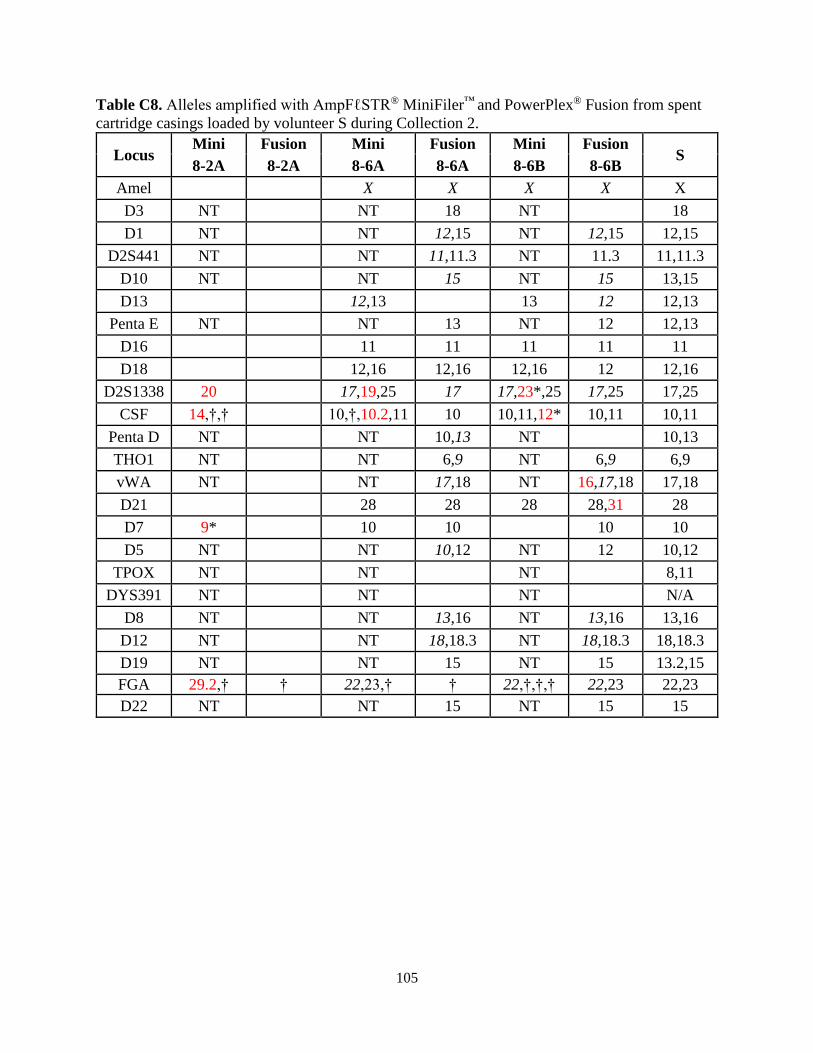
105
Table C8. Alleles amplified with AmpFℓSTR® MiniFiler™ and PowerPlex® Fusion from spent
cartridge casings loaded by volunteer S during Collection 2.
Locus Mini Fusion Mini Fusion Mini Fusion
S 8-2A 8-2A 8-6A 8-6A 8-6B 8-6B
Amel X X X X X
D3 NT NT 18 NT 18
D1 NT NT 12,15 NT 12,15 12,15
D2S441 NT NT 11,11.3 NT 11.3 11,11.3
D10 NT NT 15 NT 15 13,15
D13 12,13 13 12 12,13
Penta E NT NT 13 NT 12 12,13
D16 11 11 11 11 11
D18 12,16 12,16 12,16 12 12,16
D2S1338 20 17,19,25 17 17,23*,25 17,25 17,25
CSF 14,†,† 10,†,10.2,11 10 10,11,12* 10,11 10,11
Penta D NT NT 10,13 NT 10,13
THO1 NT NT 6,9 NT 6,9 6,9
vWA NT NT 17,18 NT 16,17,18 17,18
D21 28 28 28 28,31 28
D7 9* 10 10 10 10
D5 NT NT 10,12 NT 12 10,12
TPOX NT NT NT 8,11
DYS391 NT NT NT N/A
D8 NT NT 13,16 NT 13,16 13,16
D12 NT NT 18,18.3 NT 18,18.3 18,18.3
D19 NT NT 15 NT 15 13.2,15
FGA 29.2,† † 22,23,† † 22,†,†,† 22,23 22,23
D22 NT NT 15 NT 15 15
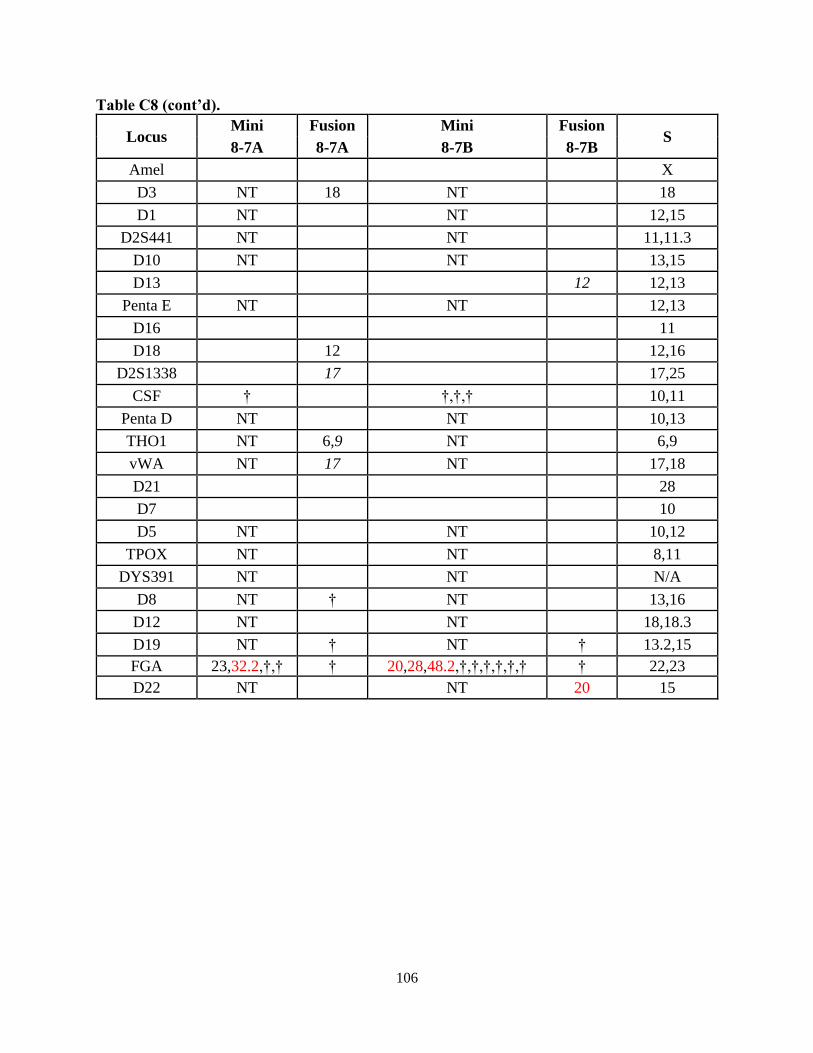
106
Table C8 (cont’d).
Locus Mini Fusion Mini Fusion
S 8-7A 8-7A 8-7B 8-7B
Amel X
D3 NT 18 NT 18
D1 NT NT 12,15
D2S441 NT NT 11,11.3
D10 NT NT 13,15
D13 12 12,13
Penta E NT NT 12,13
D16 11
D18 12 12,16
D2S1338 17 17,25
CSF † †,†,† 10,11
Penta D NT NT 10,13
THO1 NT 6,9 NT 6,9
vWA NT 17 NT 17,18
D21 28
D7 10
D5 NT NT 10,12
TPOX NT NT 8,11
DYS391 NT NT N/A
D8 NT † NT 13,16
D12 NT NT 18,18.3
D19 NT † NT † 13.2,15
FGA 23,32.2,†,† † 20,28,48.2,†,†,†,†,†,† † 22,23
D22 NT NT 20 15
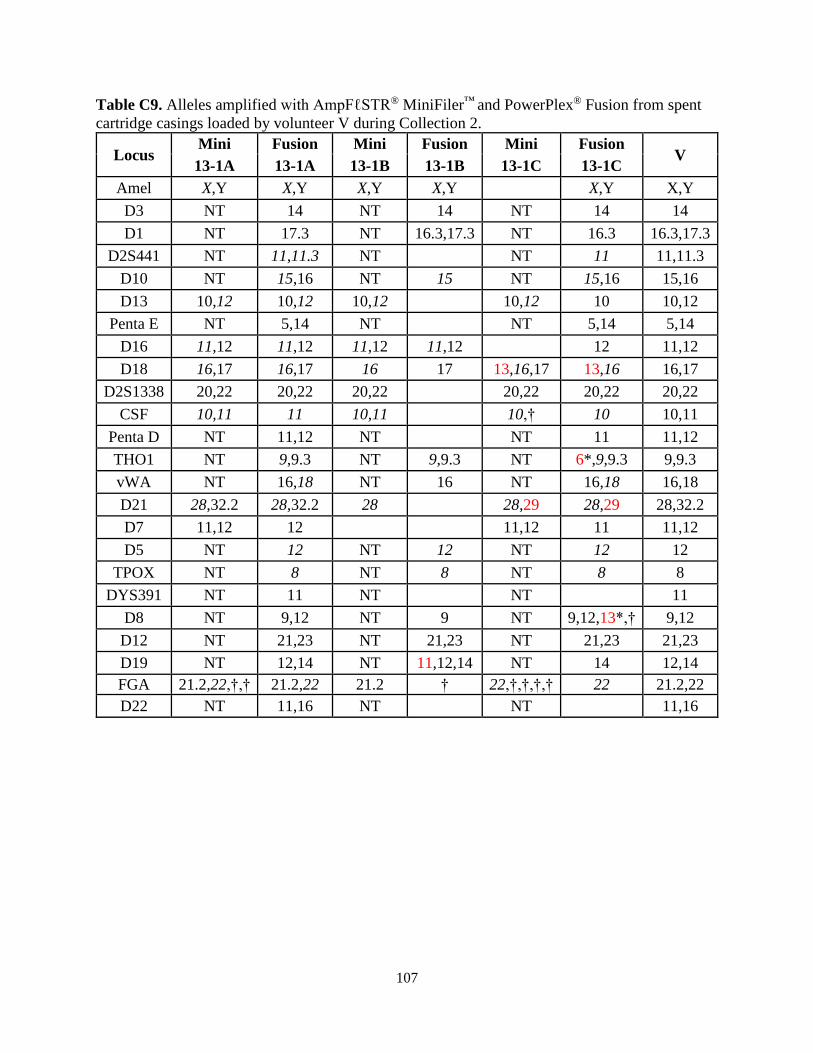
107
Table C9. Alleles amplified with AmpFℓSTR® MiniFiler™ and PowerPlex® Fusion from spent
cartridge casings loaded by volunteer V during Collection 2.
Locus Mini Fusion Mini Fusion Mini Fusion
V 13-1A 13-1A 13-1B 13-1B 13-1C 13-1C
Amel X,Y X,Y X,Y X,Y X,Y X,Y
D3 NT 14 NT 14 NT 14 14
D1 NT 17.3 NT 16.3,17.3 NT 16.3 16.3,17.3
D2S441 NT 11,11.3 NT NT 11 11,11.3
D10 NT 15,16 NT 15 NT 15,16 15,16
D13 10,12 10,12 10,12 10,12 10 10,12
Penta E NT 5,14 NT NT 5,14 5,14
D16 11,12 11,12 11,12 11,12 12 11,12
D18 16,17 16,17 16 17 13,16,17 13,16 16,17
D2S1338 20,22 20,22 20,22 20,22 20,22 20,22
CSF 10,11 11 10,11 10,† 10 10,11
Penta D NT 11,12 NT NT 11 11,12
THO1 NT 9,9.3 NT 9,9.3 NT 6*,9,9.3 9,9.3
vWA NT 16,18 NT 16 NT 16,18 16,18
D21 28,32.2 28,32.2 28 28,29 28,29 28,32.2
D7 11,12 12 11,12 11 11,12
D5 NT 12 NT 12 NT 12 12
TPOX NT 8 NT 8 NT 8 8
DYS391 NT 11 NT NT 11
D8 NT 9,12 NT 9 NT 9,12,13*,† 9,12
D12 NT 21,23 NT 21,23 NT 21,23 21,23
D19 NT 12,14 NT 11,12,14 NT 14 12,14
FGA 21.2,22,†,† 21.2,22 21.2 † 22,†,†,†,† 22 21.2,22
D22 NT 11,16 NT NT 11,16
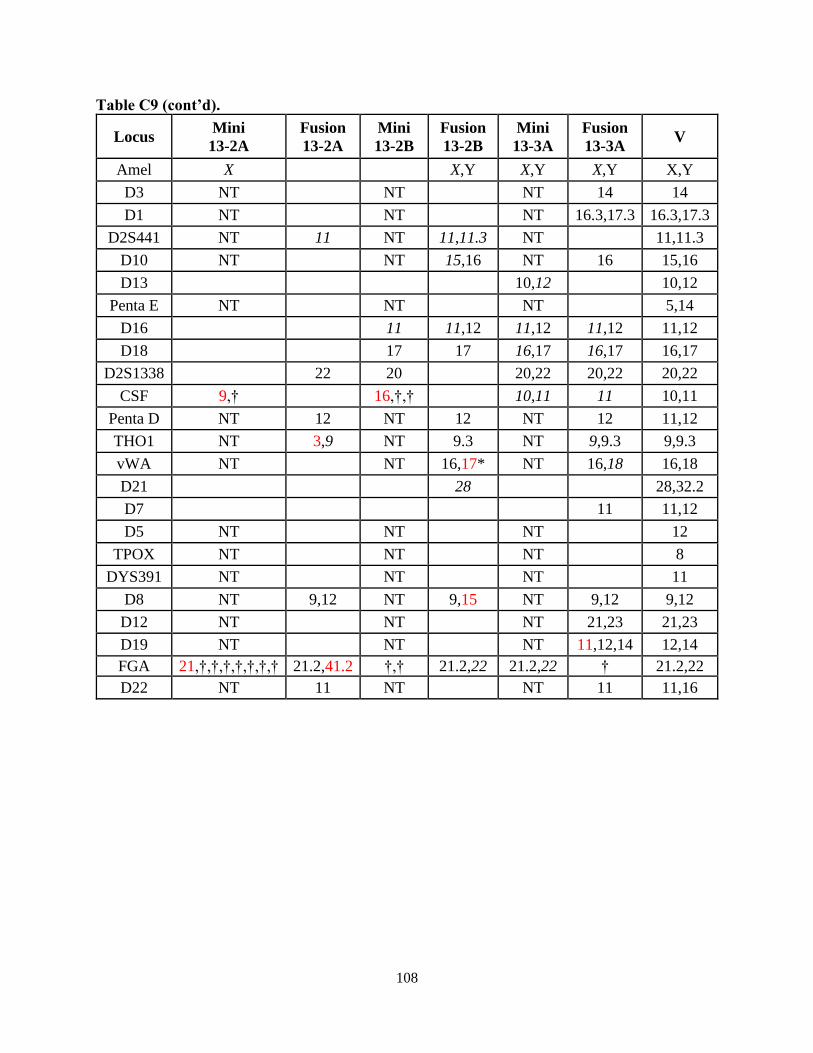
108
Table C9 (cont’d).
Locus Mini
13-2A
Fusion
13-2A
Mini
13-2B
Fusion
13-2B
Mini
13-3A
Fusion
13-3A V
Amel X X,Y X,Y X,Y X,Y
D3 NT NT NT 14 14
D1 NT NT NT 16.3,17.3 16.3,17.3
D2S441 NT 11 NT 11,11.3 NT 11,11.3
D10 NT NT 15,16 NT 16 15,16
D13 10,12 10,12
Penta E NT NT NT 5,14
D16 11 11,12 11,12 11,12 11,12
D18 17 17 16,17 16,17 16,17
D2S1338 22 20 20,22 20,22 20,22
CSF 9,† 16,†,† 10,11 11 10,11
Penta D NT 12 NT 12 NT 12 11,12
THO1 NT 3,9 NT 9.3 NT 9,9.3 9,9.3
vWA NT NT 16,17* NT 16,18 16,18
D21 28 28,32.2
D7 11 11,12
D5 NT NT NT 12
TPOX NT NT NT 8
DYS391 NT NT NT 11
D8 NT 9,12 NT 9,15 NT 9,12 9,12
D12 NT NT NT 21,23 21,23
D19 NT NT NT 11,12,14 12,14
FGA 21,†,†,†,†,†,†,† 21.2,41.2 †,† 21.2,22 21.2,22 † 21.2,22
D22 NT 11 NT NT 11 11,16
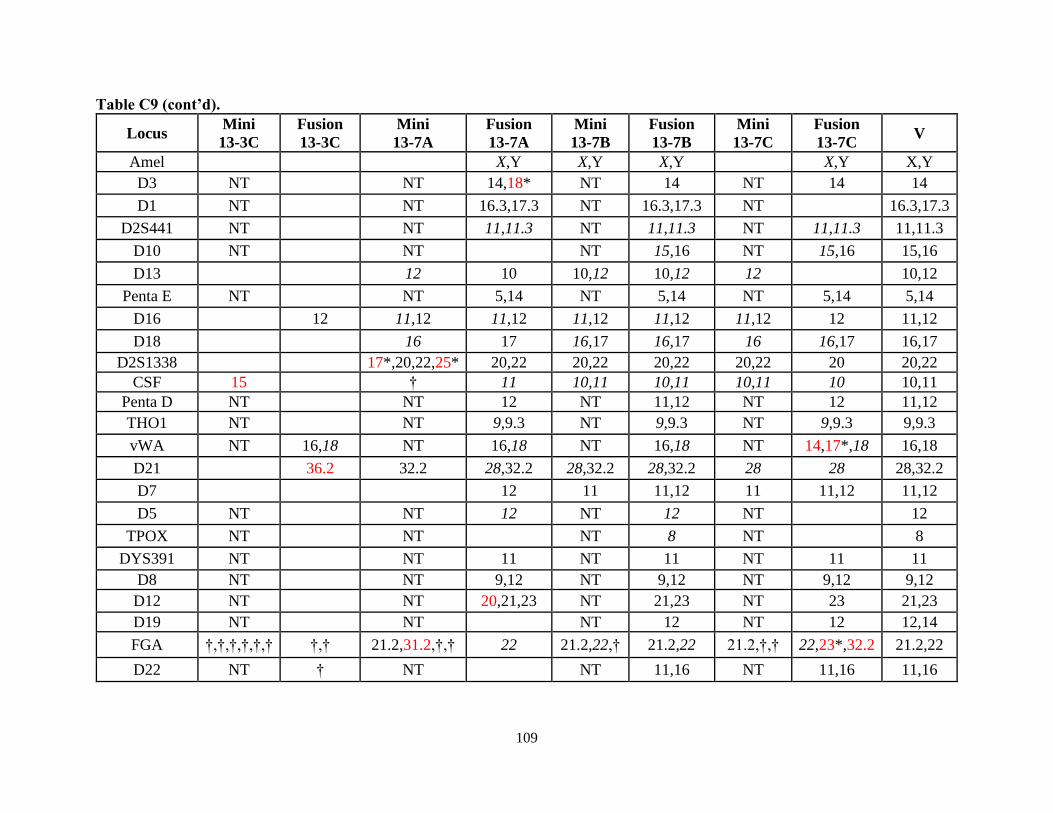
109
Table C9 (cont’d).
Locus Mini
13-3C
Fusion
13-3C
Mini
13-7A
Fusion
13-7A
Mini
13-7B
Fusion
13-7B
Mini
13-7C
Fusion
13-7C V
Amel X,Y X,Y X,Y X,Y X,Y
D3 NT NT 14,18* NT 14 NT 14 14
D1 NT NT 16.3,17.3 NT 16.3,17.3 NT 16.3,17.3
D2S441 NT NT 11,11.3 NT 11,11.3 NT 11,11.3 11,11.3
D10 NT NT NT 15,16 NT 15,16 15,16
D13 12 10 10,12 10,12 12 10,12
Penta E NT NT 5,14 NT 5,14 NT 5,14 5,14
D16 12 11,12 11,12 11,12 11,12 11,12 12 11,12
D18 16 17 16,17 16,17 16 16,17 16,17
D2S1338 17*,20,22,25* 20,22 20,22 20,22 20,22 20 20,22
CSF 15 † 11 10,11 10,11 10,11 10 10,11
Penta D NT NT 12 NT 11,12 NT 12 11,12
THO1 NT NT 9,9.3 NT 9,9.3 NT 9,9.3 9,9.3
vWA NT 16,18 NT 16,18 NT 16,18 NT 14,17*,18 16,18
D21 36.2 32.2 28,32.2 28,32.2 28,32.2 28 28 28,32.2
D7 12 11 11,12 11 11,12 11,12
D5 NT NT 12 NT 12 NT 12
TPOX NT NT NT 8 NT 8
DYS391 NT NT 11 NT 11 NT 11 11
D8 NT NT 9,12 NT 9,12 NT 9,12 9,12
D12 NT NT 20,21,23 NT 21,23 NT 23 21,23
D19 NT NT NT 12 NT 12 12,14
FGA †,†,†,†,†,† †,† 21.2,31.2,†,† 22 21.2,22,† 21.2,22 21.2,†,† 22,23*,32.2 21.2,22
D22 NT † NT NT 11,16 NT 11,16 11,16
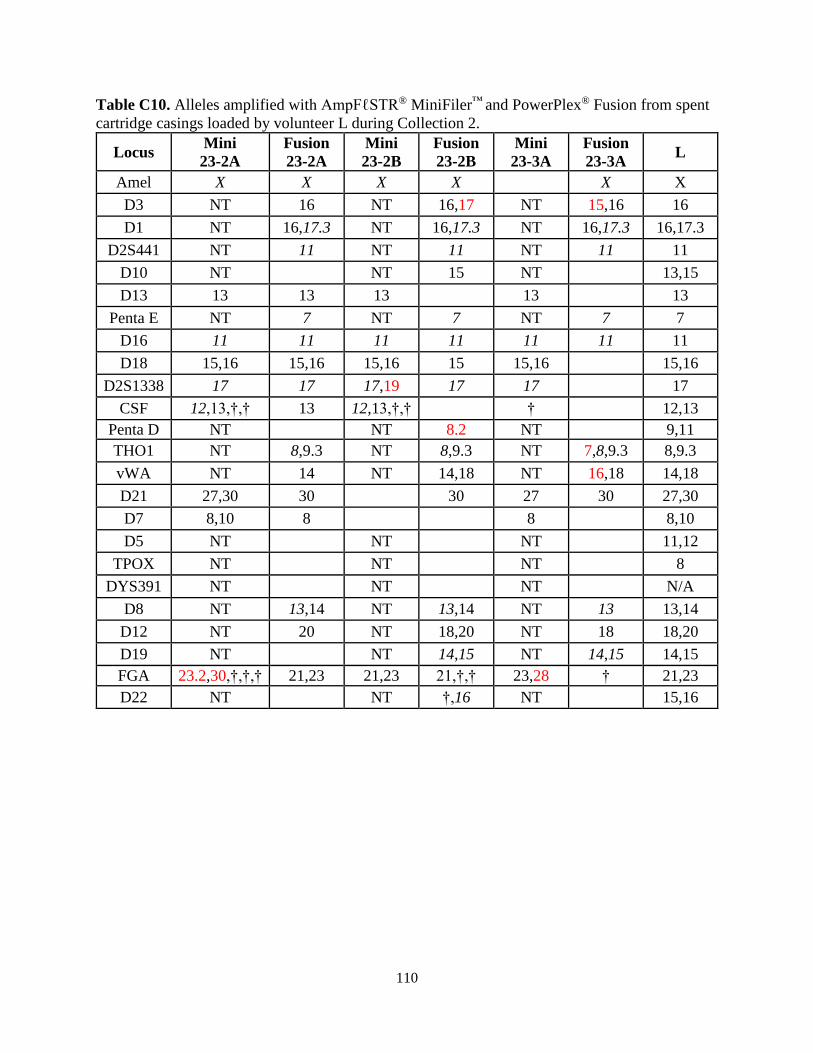
110
Table C10. Alleles amplified with AmpFℓSTR® MiniFiler™ and PowerPlex® Fusion from spent
cartridge casings loaded by volunteer L during Collection 2.
Locus Mini
23-2A
Fusion
23-2A
Mini
23-2B
Fusion
23-2B
Mini
23-3A
Fusion
23-3A L
Amel X X X X X X
D3 NT 16 NT 16,17 NT 15,16 16
D1 NT 16,17.3 NT 16,17.3 NT 16,17.3 16,17.3
D2S441 NT 11 NT 11 NT 11 11
D10 NT NT 15 NT 13,15
D13 13 13 13 13 13
Penta E NT 7 NT 7 NT 7 7
D16 11 11 11 11 11 11 11
D18 15,16 15,16 15,16 15 15,16 15,16
D2S1338 17 17 17,19 17 17 17
CSF 12,13,†,† 13 12,13,†,† † 12,13
Penta D NT NT 8.2 NT 9,11
THO1 NT 8,9.3 NT 8,9.3 NT 7,8,9.3 8,9.3
vWA NT 14 NT 14,18 NT 16,18 14,18
D21 27,30 30 30 27 30 27,30
D7 8,10 8 8 8,10
D5 NT NT NT 11,12
TPOX NT NT NT 8
DYS391 NT NT NT N/A
D8 NT 13,14 NT 13,14 NT 13 13,14
D12 NT 20 NT 18,20 NT 18 18,20
D19 NT NT 14,15 NT 14,15 14,15
FGA 23.2,30,†,†,† 21,23 21,23 21,†,† 23,28 † 21,23
D22 NT NT †,16 NT 15,16
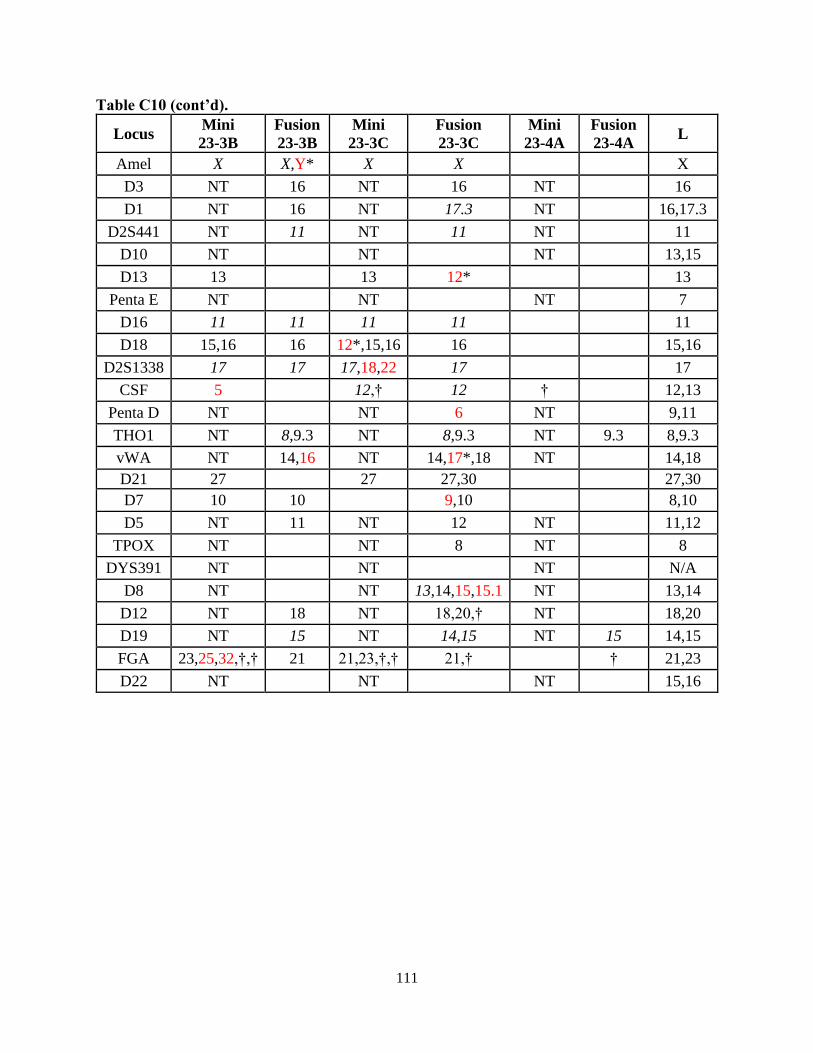
111
Table C10 (cont’d).
Locus Mini
23-3B
Fusion
23-3B
Mini
23-3C
Fusion
23-3C
Mini
23-4A
Fusion
23-4A L
Amel X X,Y* X X X
D3 NT 16 NT 16 NT 16
D1 NT 16 NT 17.3 NT 16,17.3
D2S441 NT 11 NT 11 NT 11
D10 NT NT NT 13,15
D13 13 13 12* 13
Penta E NT NT NT 7
D16 11 11 11 11 11
D18 15,16 16 12*,15,16 16 15,16
D2S1338 17 17 17,18,22 17 17
CSF 5 12,† 12 † 12,13
Penta D NT NT 6 NT 9,11
THO1 NT 8,9.3 NT 8,9.3 NT 9.3 8,9.3
vWA NT 14,16 NT 14,17*,18 NT 14,18
D21 27 27 27,30 27,30
D7 10 10 9,10 8,10
D5 NT 11 NT 12 NT 11,12
TPOX NT NT 8 NT 8
DYS391 NT NT NT N/A
D8 NT NT 13,14,15,15.1 NT 13,14
D12 NT 18 NT 18,20,† NT 18,20
D19 NT 15 NT 14,15 NT 15 14,15
FGA 23,25,32,†,† 21 21,23,†,† 21,† † 21,23
D22 NT NT NT 15,16
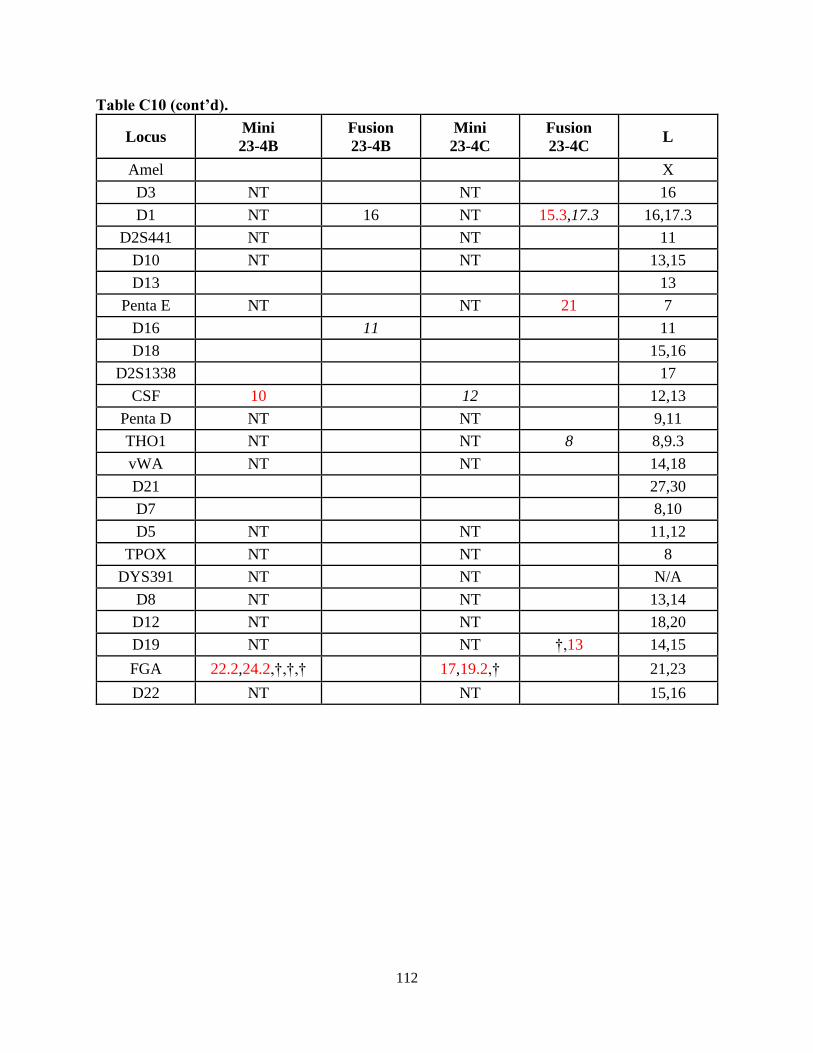
112
Table C10 (cont’d).
Locus Mini
23-4B
Fusion
23-4B
Mini
23-4C
Fusion
23-4C L
Amel X
D3 NT NT 16
D1 NT 16 NT 15.3,17.3 16,17.3
D2S441 NT NT 11
D10 NT NT 13,15
D13 13
Penta E NT NT 21 7
D16 11 11
D18 15,16
D2S1338 17
CSF 10 12 12,13
Penta D NT NT 9,11
THO1 NT NT 8 8,9.3
vWA NT NT 14,18
D21 27,30
D7 8,10
D5 NT NT 11,12
TPOX NT NT 8
DYS391 NT NT N/A
D8 NT NT 13,14
D12 NT NT 18,20
D19 NT NT †,13 14,15
FGA 22.2,24.2,†,†,† 17,19.2,† 21,23
D22 NT NT 15,16
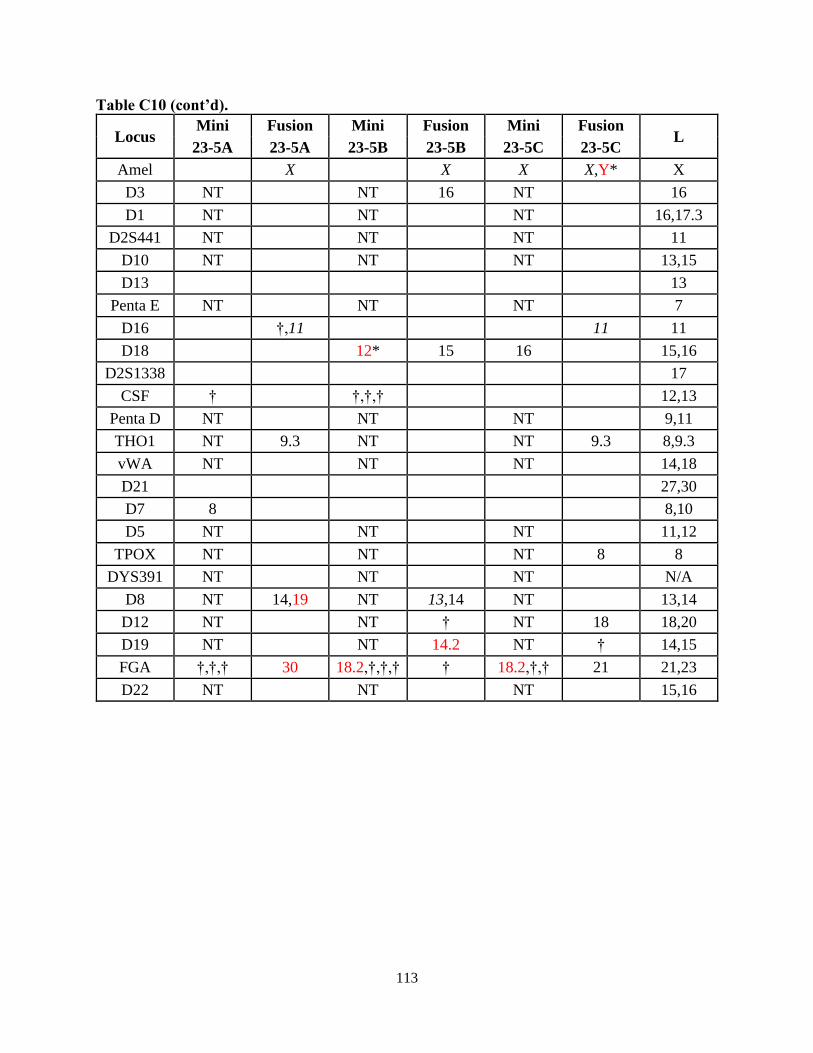
113
Table C10 (cont’d).
Locus Mini Fusion Mini Fusion Mini Fusion
L 23-5A 23-5A 23-5B 23-5B 23-5C 23-5C
Amel X X X X,Y* X
D3 NT NT 16 NT 16
D1 NT NT NT 16,17.3
D2S441 NT NT NT 11
D10 NT NT NT 13,15
D13 13
Penta E NT NT NT 7
D16 †,11 11 11
D18 12* 15 16 15,16
D2S1338 17
CSF † †,†,† 12,13
Penta D NT NT NT 9,11
THO1 NT 9.3 NT NT 9.3 8,9.3
vWA NT NT NT 14,18
D21 27,30
D7 8 8,10
D5 NT NT NT 11,12
TPOX NT NT NT 8 8
DYS391 NT NT NT N/A
D8 NT 14,19 NT 13,14 NT 13,14
D12 NT NT † NT 18 18,20
D19 NT NT 14.2 NT † 14,15
FGA †,†,† 30 18.2,†,†,† † 18.2,†,† 21 21,23
D22 NT NT NT 15,16
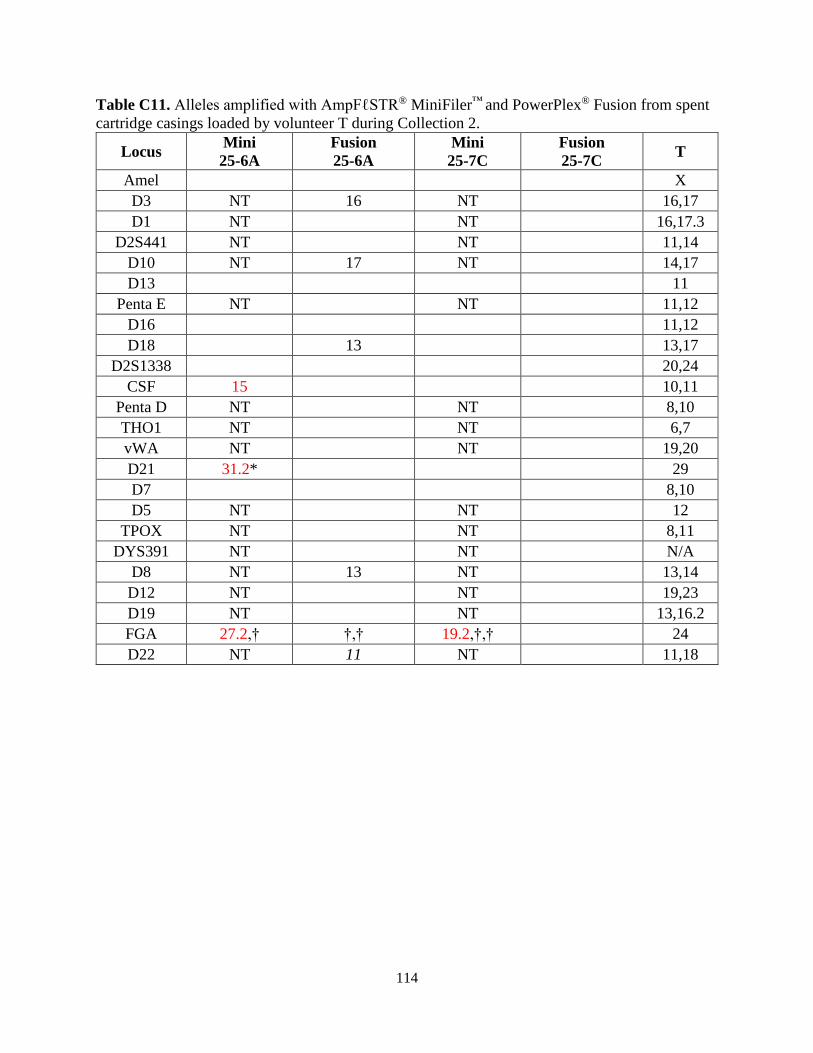
114
Table C11. Alleles amplified with AmpFℓSTR® MiniFiler™ and PowerPlex® Fusion from spent
cartridge casings loaded by volunteer T during Collection 2.
Locus Mini
25-6A
Fusion
25-6A
Mini
25-7C
Fusion
25-7C T
Amel X
D3 NT 16 NT 16,17
D1 NT NT 16,17.3
D2S441 NT NT 11,14
D10 NT 17 NT 14,17
D13 11
Penta E NT NT 11,12
D16 11,12
D18 13 13,17
D2S1338 20,24
CSF 15 10,11
Penta D NT NT 8,10
THO1 NT NT 6,7
vWA NT NT 19,20
D21 31.2* 29
D7 8,10
D5 NT NT 12
TPOX NT NT 8,11
DYS391 NT NT N/A
D8 NT 13 NT 13,14
D12 NT NT 19,23
D19 NT NT 13,16.2
FGA 27.2,† †,† 19.2,†,† 24
D22 NT 11 NT 11,18
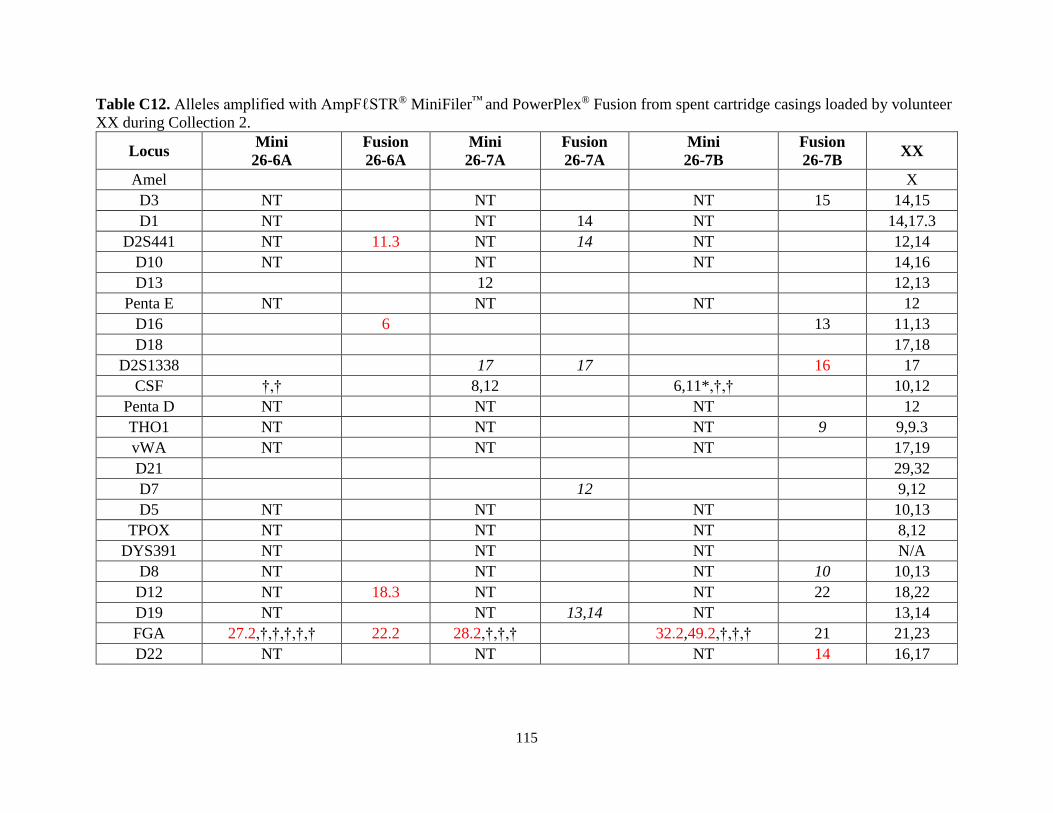
115
Table C12. Alleles amplified with AmpFℓSTR® MiniFiler™ and PowerPlex® Fusion from spent cartridge casings loaded by volunteer
XX during Collection 2.
Locus Mini
26-6A
Fusion
26-6A
Mini
26-7A
Fusion
26-7A
Mini
26-7B
Fusion
26-7B XX
Amel X
D3 NT NT NT 15 14,15
D1 NT NT 14 NT 14,17.3
D2S441 NT 11.3 NT 14 NT 12,14
D10 NT NT NT 14,16
D13 12 12,13
Penta E NT NT NT 12
D16 6 13 11,13
D18 17,18
D2S1338 17 17 16 17
CSF †,† 8,12 6,11*,†,† 10,12
Penta D NT NT NT 12
THO1 NT NT NT 9 9,9.3
vWA NT NT NT 17,19
D21 29,32
D7 12 9,12
D5 NT NT NT 10,13
TPOX NT NT NT 8,12
DYS391 NT NT NT N/A
D8 NT NT NT 10 10,13
D12 NT 18.3 NT NT 22 18,22
D19 NT NT 13,14 NT 13,14
FGA 27.2,†,†,†,†,† 22.2 28.2,†,†,† 32.2,49.2,†,†,† 21 21,23
D22 NT NT NT 14 16,17
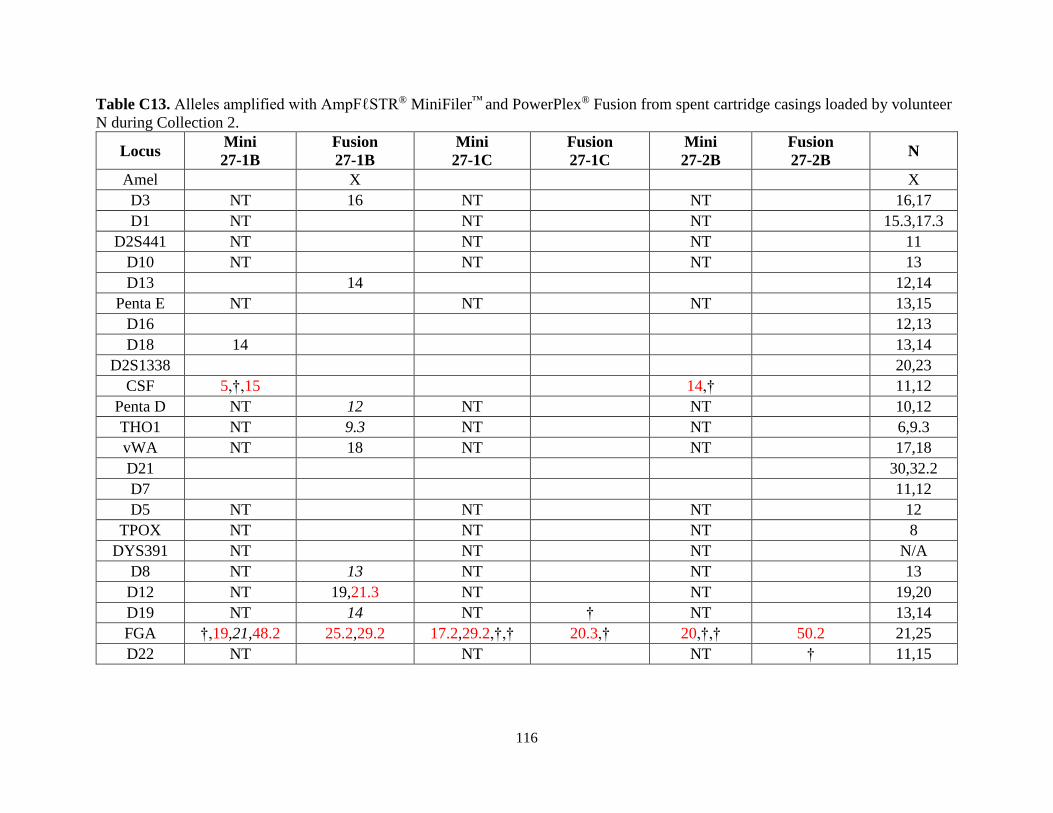
116
Table C13. Alleles amplified with AmpFℓSTR® MiniFiler™ and PowerPlex® Fusion from spent cartridge casings loaded by volunteer
N during Collection 2.
Locus Mini
27-1B
Fusion
27-1B
Mini
27-1C
Fusion
27-1C
Mini
27-2B
Fusion
27-2B N
Amel X X
D3 NT 16 NT NT 16,17
D1 NT NT NT 15.3,17.3
D2S441 NT NT NT 11
D10 NT NT NT 13
D13 14 12,14
Penta E NT NT NT 13,15
D16 12,13
D18 14 13,14
D2S1338 20,23
CSF 5,†,15 14,† 11,12
Penta D NT 12 NT NT 10,12
THO1 NT 9.3 NT NT 6,9.3
vWA NT 18 NT NT 17,18
D21 30,32.2
D7 11,12
D5 NT NT NT 12
TPOX NT NT NT 8
DYS391 NT NT NT N/A
D8 NT 13 NT NT 13
D12 NT 19,21.3 NT NT 19,20
D19 NT 14 NT † NT 13,14
FGA †,19,21,48.2 25.2,29.2 17.2,29.2,†,† 20.3,† 20,†,† 50.2 21,25
D22 NT NT NT † 11,15
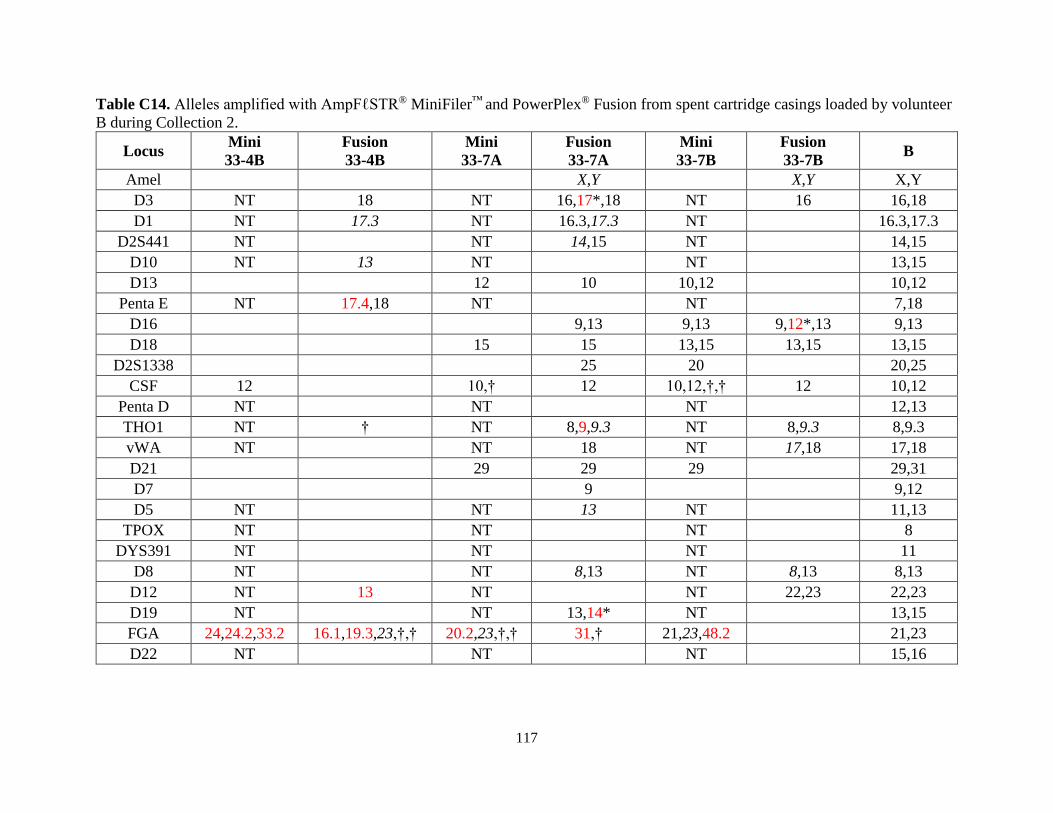
117
Table C14. Alleles amplified with AmpFℓSTR® MiniFiler™ and PowerPlex® Fusion from spent cartridge casings loaded by volunteer
B during Collection 2.
Locus Mini
33-4B
Fusion
33-4B
Mini
33-7A
Fusion
33-7A
Mini
33-7B
Fusion
33-7B B
Amel X,Y X,Y X,Y
D3 NT 18 NT 16,17*,18 NT 16 16,18
D1 NT 17.3 NT 16.3,17.3 NT 16.3,17.3
D2S441 NT NT 14,15 NT 14,15
D10 NT 13 NT NT 13,15
D13 12 10 10,12 10,12
Penta E NT 17.4,18 NT NT 7,18
D16 9,13 9,13 9,12*,13 9,13
D18 15 15 13,15 13,15 13,15
D2S1338 25 20 20,25
CSF 12 10,† 12 10,12,†,† 12 10,12
Penta D NT NT NT 12,13
THO1 NT † NT 8,9,9.3 NT 8,9.3 8,9.3
vWA NT NT 18 NT 17,18 17,18
D21 29 29 29 29,31
D7 9 9,12
D5 NT NT 13 NT 11,13
TPOX NT NT NT 8
DYS391 NT NT NT 11
D8 NT NT 8,13 NT 8,13 8,13
D12 NT 13 NT NT 22,23 22,23
D19 NT NT 13,14* NT 13,15
FGA 24,24.2,33.2 16.1,19.3,23,†,† 20.2,23,†,† 31,† 21,23,48.2 21,23
D22 NT NT NT 15,16
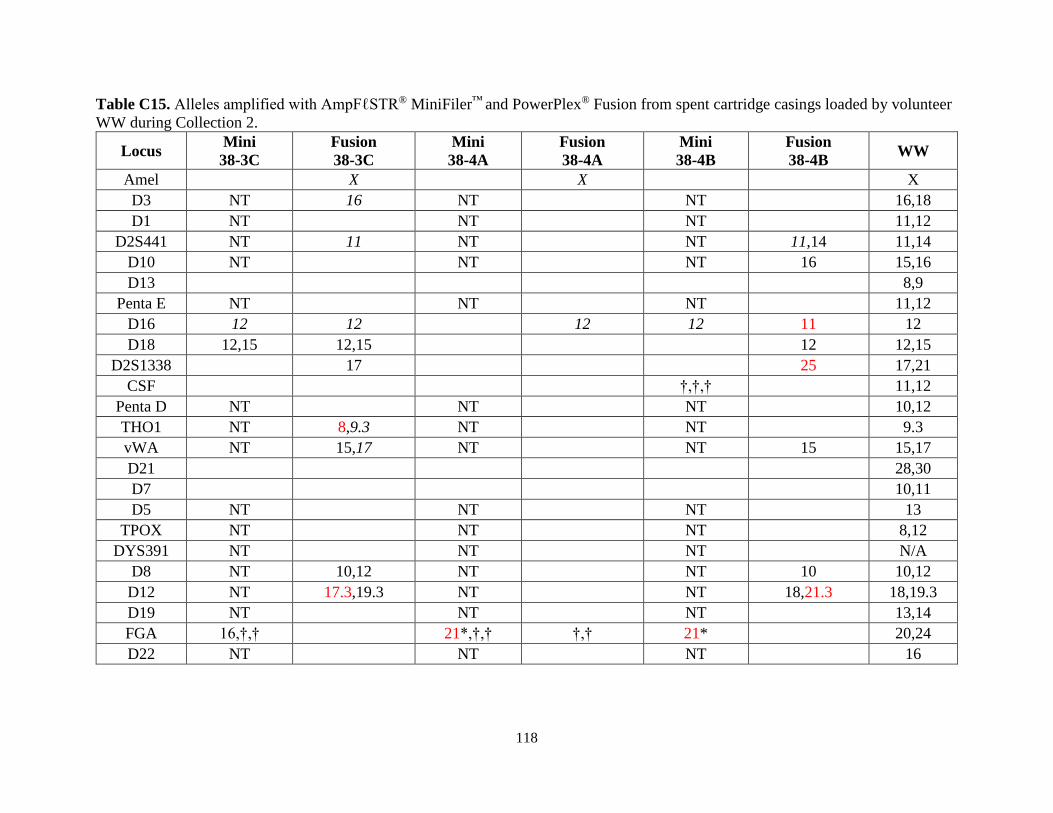
118
Table C15. Alleles amplified with AmpFℓSTR® MiniFiler™ and PowerPlex® Fusion from spent cartridge casings loaded by volunteer
WW during Collection 2.
Locus Mini
38-3C
Fusion
38-3C
Mini
38-4A
Fusion
38-4A
Mini
38-4B
Fusion
38-4B WW
Amel X X X
D3 NT 16 NT NT 16,18
D1 NT NT NT 11,12
D2S441 NT 11 NT NT 11,14 11,14
D10 NT NT NT 16 15,16
D13 8,9
Penta E NT NT NT 11,12
D16 12 12 12 12 11 12
D18 12,15 12,15 12 12,15
D2S1338 17 25 17,21
CSF †,†,† 11,12
Penta D NT NT NT 10,12
THO1 NT 8,9.3 NT NT 9.3
vWA NT 15,17 NT NT 15 15,17
D21 28,30
D7 10,11
D5 NT NT NT 13
TPOX NT NT NT 8,12
DYS391 NT NT NT N/A
D8 NT 10,12 NT NT 10 10,12
D12 NT 17.3,19.3 NT NT 18,21.3 18,19.3
D19 NT NT NT 13,14
FGA 16,†,† 21*,†,† †,† 21* 20,24
D22 NT NT NT 16
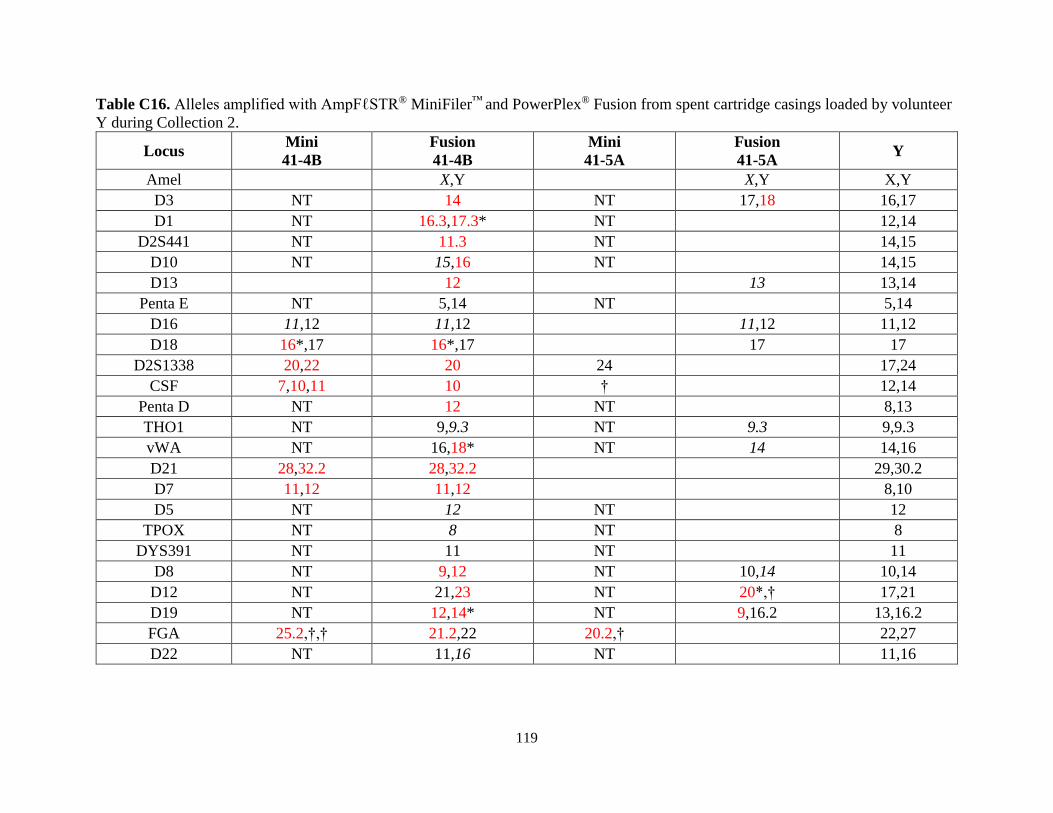
119
Table C16. Alleles amplified with AmpFℓSTR® MiniFiler™ and PowerPlex® Fusion from spent cartridge casings loaded by volunteer
Y during Collection 2.
Locus Mini
41-4B
Fusion
41-4B
Mini
41-5A
Fusion
41-5A Y
Amel X,Y X,Y X,Y
D3 NT 14 NT 17,18 16,17
D1 NT 16.3,17.3* NT 12,14
D2S441 NT 11.3 NT 14,15
D10 NT 15,16 NT 14,15
D13 12 13 13,14
Penta E NT 5,14 NT 5,14
D16 11,12 11,12 11,12 11,12
D18 16*,17 16*,17 17 17
D2S1338 20,22 20 24 17,24
CSF 7,10,11 10 † 12,14
Penta D NT 12 NT 8,13
THO1 NT 9,9.3 NT 9.3 9,9.3
vWA NT 16,18* NT 14 14,16
D21 28,32.2 28,32.2 29,30.2
D7 11,12 11,12 8,10
D5 NT 12 NT 12
TPOX NT 8 NT 8
DYS391 NT 11 NT 11
D8 NT 9,12 NT 10,14 10,14
D12 NT 21,23 NT 20*,† 17,21
D19 NT 12,14* NT 9,16.2 13,16.2
FGA 25.2,†,† 21.2,22 20.2,† 22,27
D22 NT 11,16 NT 11,16
120
Table C17. Alleles amplified with AmpFℓSTR® MiniFiler™ and PowerPlex® Fusion from spent cartridge casings loaded by volunteer
II during Collection 2.
Locus Mini
50-5B
Fusion
50-5B
Mini
50-6A
Fusion
50-6A II
Amel Y Y X,Y X,Y
D3 NT 17 NT 17 17
D1 NT 15,18.3 NT 15 15,18.3
D2S441 NT 10,11 NT 10,11
D10 NT 13 NT 13,15
D13 12 11,12 11,12
Penta E NT 13,14 NT 13,14
D16 12 11,12 10,12 12
D18 16,17 16 17 16,17
D2S1338 19,21 21 21 19,21
CSF 12 12 12,† 12
Penta D NT NT 9,13
THO1 NT 6,8,9,9.3 NT 8,9.3 8,9.3
vWA NT 15,17 NT 15,17 15,17
D21 29 31 29 31 29,31
D7 10 12 10,12
D5 NT 12 NT 11,12
TPOX NT 8 NT 8
DYS391 NT NT 11
D8 NT 11,13 NT 11,13 11,13
D12 NT 18,20,† NT 18 18,20
D19 NT 14 NT 13.2,15.2 14,15.2
FGA 20,21,23,25.2,†,†,†,†,† 23,† †,† 21,† 21,23
D22 NT 15,16 NT 15,16
121
APPENDIX D. ANALYSIS OF LOADER AND NON-LOADER ALLELES IN STR PROFILES AMPLIFIED WITH
AMPFℓSTR® MINIFILER™ AND POWERPLEX® FUSION5
Table D1. Summary of alleles recovered in STR profiles generated from spent cartridge casings using a double swab technique
(Sweet et al., 1997) and organic extraction.
AmpFℓSTR® MiniFiler™ PowerPlex® Fusion
Casing
Identifier
DNA Conc.
(pg/μL)
#
Loader
Alleles
#
Possible
Loader
Alleles
%
Loader
Profile
#
Non-loader
Alleles
#
Loader
Alleles
#
Possible
Loader
Alleles
%
Loader
Profile
#
Non-loader
Alleles
30.6 2.88E+01 15 15 100.0 6 38 38 100.0 1
34.4 1.77E+01 16 16 100.0 2 38 38 100.0 1
13-7B 1.61E+01 17 18 94.4 0 43 44 97.7 0
28.2 1.39E+01 17 17 100 0 36 42 85.7 2
19-2A 5.39E+00 12 14 85.7 5 33 40 82.5 4
23-2A 5.14E+00 12 14 85.7 2 22 38 57.9 0
1-1C 4.75E+00 N/A N/A N/A N/A 22 42 52.4 4
21-1B 4.69E+00 N/A N/A N/A N/A 21 42 50.0 4
23-2B 4.15E+00 10 14 71.4 3 23 38 60.5 2
41-4B 4.04E+00 3 17 17.6 11 18 44 40.9 21
13-7A 3.69E+00 8 18 44.4 3 31 44 70.4 2
50-5B 3.68E+00 12 16 75.0 2 30 43 69.8 4
43.3 3.46E+00 N/A N/A N/A N/A 8 41 19.5 20
5 The casings are organized based on DNA concentration arranged in descending order.
122
Table D1 (cont’d).
AmpFℓSTR® MiniFiler™ PowerPlex® Fusion
Casing
Identifier
DNA Conc.
(pg/μL)
#
Loader
Alleles
#
Possible
Loader
Alleles
%
Loader
Profile
#
Non-loader
Alleles
#
Loader
Alleles
#
Possible
Loader
Alleles
%
Loader
Profile
#
Non-loader
Alleles
13-7C 2.93E+00 11 18 61.1 0 29 44 65.9 4
33-7B 2.65E+00 12 18 66.7 1 16 46 34.8 1
18-3A 2.51E+00 N/A N/A N/A N/A 19 40 47.5 7
3-4A 2.42E+00 0 16 0.0 1 2 41 4.9 3
2-3A 2.21E+00 12 16 75.0 0 28 39 71.8 3
33-7A 2.16E+00 5 18 27.8 1 23 46 50.0 4
8-5C 1.97E+00 N/A N/A N/A N/A 14 41 34.1 5
50-5A 1.94E+00 N/A N/A N/A N/A 17 43 39.5 11
40-3B 1.83E+00 N/A N/A N/A N/A 12 39 30.8 18
26-4B 1.78E+00 N/A N/A N/A N/A 22 42 52.4 7
20-4B 1.75E+00 N/A N/A N/A N/A 9 39 23.1 10
26-4A 1.70E+00 N/A N/A N/A N/A 22 42 52.4 1
20-4A 1.70E+00 N/A N/A N/A N/A 11 39 28.2 3
17-2A 1.68E+00 N/A N/A N/A N/A 13 46 28.3 1
8-5B 1.66E+00 N/A N/A N/A N/A 20 41 48.8 1
38-2B 1.55E+00 N/A N/A N/A N/A 17 41 41.5 18
48.5 1.49E+00 N/A N/A N/A N/A 9 43 20.9 2
20-4C 1.48E+00 N/A N/A N/A N/A 10 39 25.6 18
27-5B 1.39E+00 N/A N/A N/A N/A 12 40 30.0 6
23-2C 1.38E+00 N/A N/A N/A N/A 12 38 31.6 4
26-4C 1.38E+00 N/A N/A N/A N/A 24 42 57.1 3
27-5A 1.38E+00 N/A N/A N/A N/A 9 40 22.5 7
27-5C 1.31E+00 N/A N/A N/A N/A 15 40 37.5 9
17-2B 1.28E+00 N/A N/A N/A N/A 9 46 19.6 2
123
Table D1 (cont’d).
AmpFℓSTR® MiniFiler™ PowerPlex® Fusion
Casing
Identifier
DNA Conc.
(pg/μL)
#
Loader
Alleles
#
Possible
Loader
Alleles
%
Loader
Profile
#
Non-loader
Alleles
#
Loader
Alleles
#
Possible
Loader
Alleles
%
Loader
Profile
#
Non-loader
Alleles
1-1A 1.26E+00 N/A N/A N/A N/A 9 41 21.9 9
33-7C 1.19E+00 N/A N/A N/A N/A 12 46 26.1 0
18-3B 1.11E+00 N/A N/A N/A N/A 14 40 35.0 6
21-1A 1.01E+00 N/A N/A N/A N/A 12 42 28.6 2
36-1A 9.91E-01 N/A N/A N/A N/A 12 44 27.3 1
19.2 9.89E-01 N/A N/A N/A N/A 23 40 57.5 5
38-2A 9.87E-01 N/A N/A N/A N/A 17 41 41.5 0
50-5C 9.58E-01 N/A N/A N/A N/A 20 43 46.5 4
8-5A 9.57E-01 N/A N/A N/A N/A 13 41 31.7 7
36-1C 8.94E-01 N/A N/A N/A N/A 5 44 11.4 5
6-2A 8.87E-01 N/A N/A N/A N/A 10 46 21.7 13
17-2C 8.61E-01 N/A N/A N/A N/A 9 46 19.6 6
2-3C 8.25E-01 N/A N/A N/A N/A 11 39 28.2 3
1-1B 8.04E-01 N/A N/A N/A N/A 11 41 26.8 9
38-2C 7.87E-01 N/A N/A N/A N/A 9 41 21.9 4
41-4C 7.36E-01 N/A N/A N/A N/A 18 44 40.9 8
21-1C 7.36E-01 N/A N/A N/A N/A 7 42 16.7 2
11-4C 6.89E-01 N/A N/A N/A N/A 6 41 14.6 0
40-3A 6.83E-01 N/A N/A N/A N/A 13 39 33.3 10
36-1B 5.80E-01 N/A N/A N/A N/A 3 44 6.8 1
12-1A 5.47E-01 N/A N/A N/A N/A 6 41 14.6 1
41-4A 5.42E-01 N/A N/A N/A N/A 4 44 9.1 3
3-4B 5.35E-01 N/A N/A N/A N/A 1 41 2.4 3
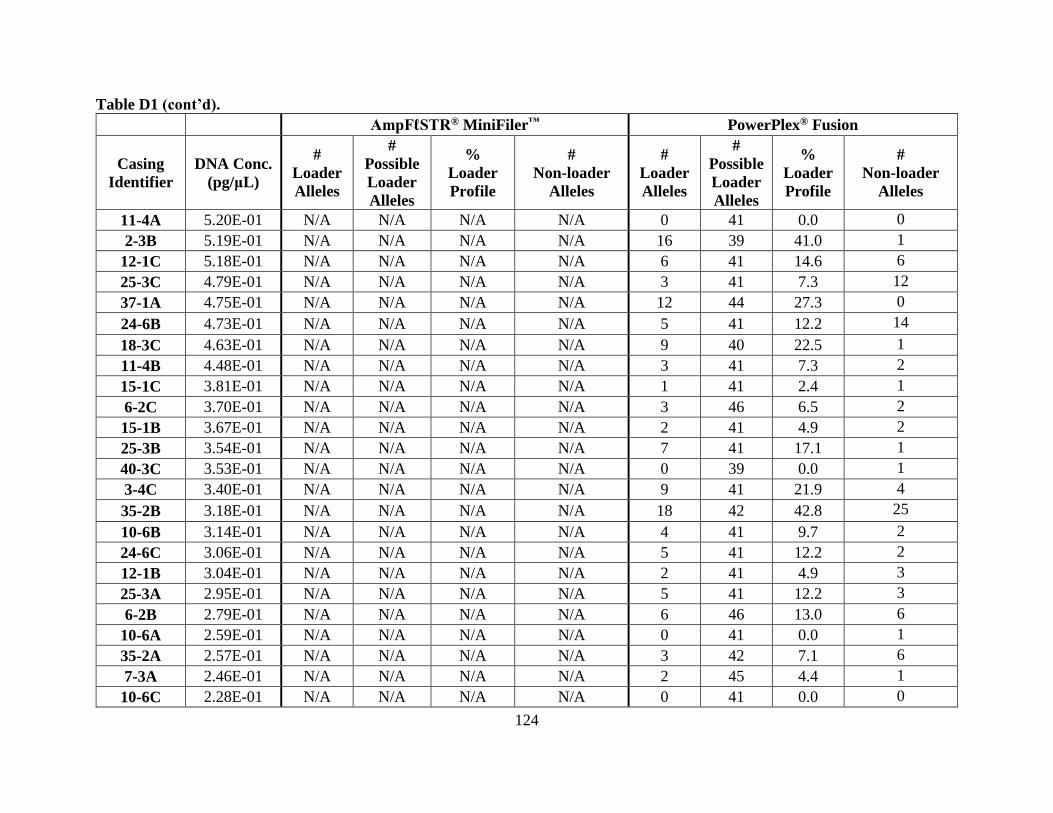
124
Table D1 (cont’d).
AmpFℓSTR® MiniFiler™ PowerPlex® Fusion
Casing
Identifier
DNA Conc.
(pg/μL)
#
Loader
Alleles
#
Possible
Loader
Alleles
%
Loader
Profile
#
Non-loader
Alleles
#
Loader
Alleles
#
Possible
Loader
Alleles
%
Loader
Profile
#
Non-loader
Alleles
11-4A 5.20E-01 N/A N/A N/A N/A 0 41 0.0 0
2-3B 5.19E-01 N/A N/A N/A N/A 16 39 41.0 1
12-1C 5.18E-01 N/A N/A N/A N/A 6 41 14.6 6
25-3C 4.79E-01 N/A N/A N/A N/A 3 41 7.3 12
37-1A 4.75E-01 N/A N/A N/A N/A 12 44 27.3 0
24-6B 4.73E-01 N/A N/A N/A N/A 5 41 12.2 14
18-3C 4.63E-01 N/A N/A N/A N/A 9 40 22.5 1
11-4B 4.48E-01 N/A N/A N/A N/A 3 41 7.3 2
15-1C 3.81E-01 N/A N/A N/A N/A 1 41 2.4 1
6-2C 3.70E-01 N/A N/A N/A N/A 3 46 6.5 2
15-1B 3.67E-01 N/A N/A N/A N/A 2 41 4.9 2
25-3B 3.54E-01 N/A N/A N/A N/A 7 41 17.1 1
40-3C 3.53E-01 N/A N/A N/A N/A 0 39 0.0 1
3-4C 3.40E-01 N/A N/A N/A N/A 9 41 21.9 4
35-2B 3.18E-01 N/A N/A N/A N/A 18 42 42.8 25
10-6B 3.14E-01 N/A N/A N/A N/A 4 41 9.7 2
24-6C 3.06E-01 N/A N/A N/A N/A 5 41 12.2 2
12-1B 3.04E-01 N/A N/A N/A N/A 2 41 4.9 3
25-3A 2.95E-01 N/A N/A N/A N/A 5 41 12.2 3
6-2B 2.79E-01 N/A N/A N/A N/A 6 46 13.0 6
10-6A 2.59E-01 N/A N/A N/A N/A 0 41 0.0 1
35-2A 2.57E-01 N/A N/A N/A N/A 3 42 7.1 6
7-3A 2.46E-01 N/A N/A N/A N/A 2 45 4.4 1
10-6C 2.28E-01 N/A N/A N/A N/A 0 41 0.0 0
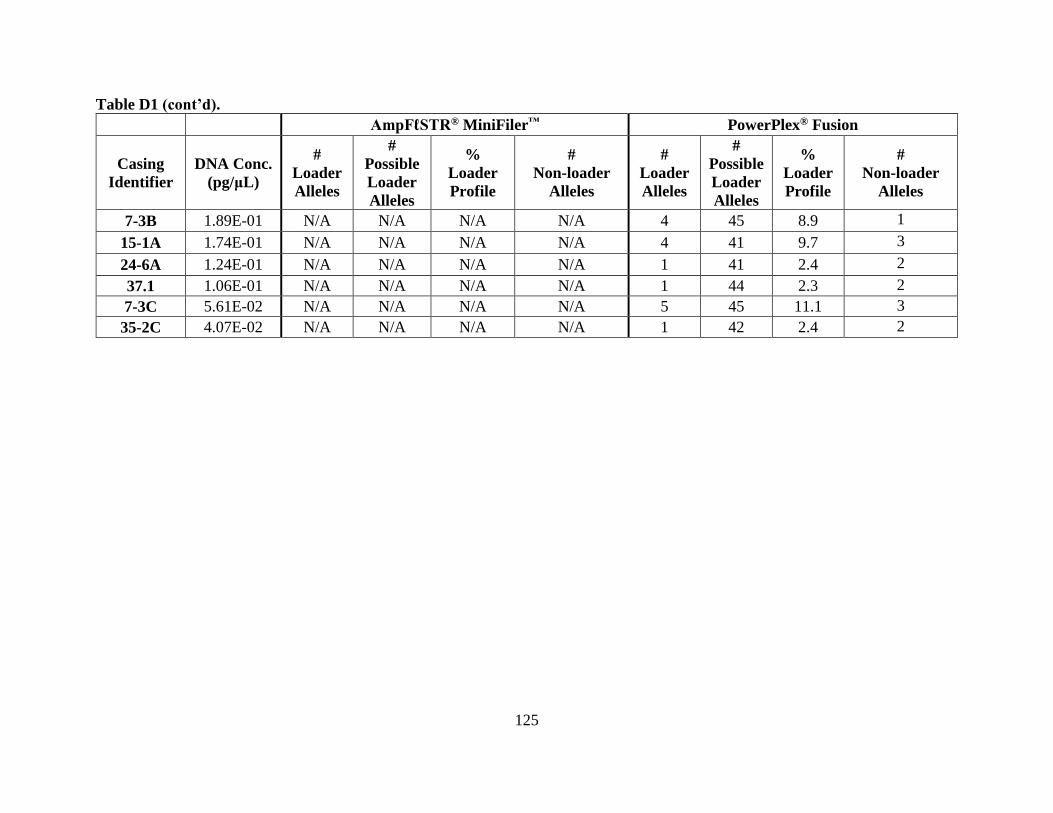
125
Table D1 (cont’d).
AmpFℓSTR® MiniFiler™ PowerPlex® Fusion
Casing
Identifier
DNA Conc.
(pg/μL)
#
Loader
Alleles
#
Possible
Loader
Alleles
%
Loader
Profile
#
Non-loader
Alleles
#
Loader
Alleles
#
Possible
Loader
Alleles
%
Loader
Profile
#
Non-loader
Alleles
7-3B 1.89E-01 N/A N/A N/A N/A 4 45 8.9 1
15-1A 1.74E-01 N/A N/A N/A N/A 4 41 9.7 3
24-6A 1.24E-01 N/A N/A N/A N/A 1 41 2.4 2
37.1 1.06E-01 N/A N/A N/A N/A 1 44 2.3 2
7-3C 5.61E-02 N/A N/A N/A N/A 5 45 11.1 3
35-2C 4.07E-02 N/A N/A N/A N/A 1 42 2.4 2
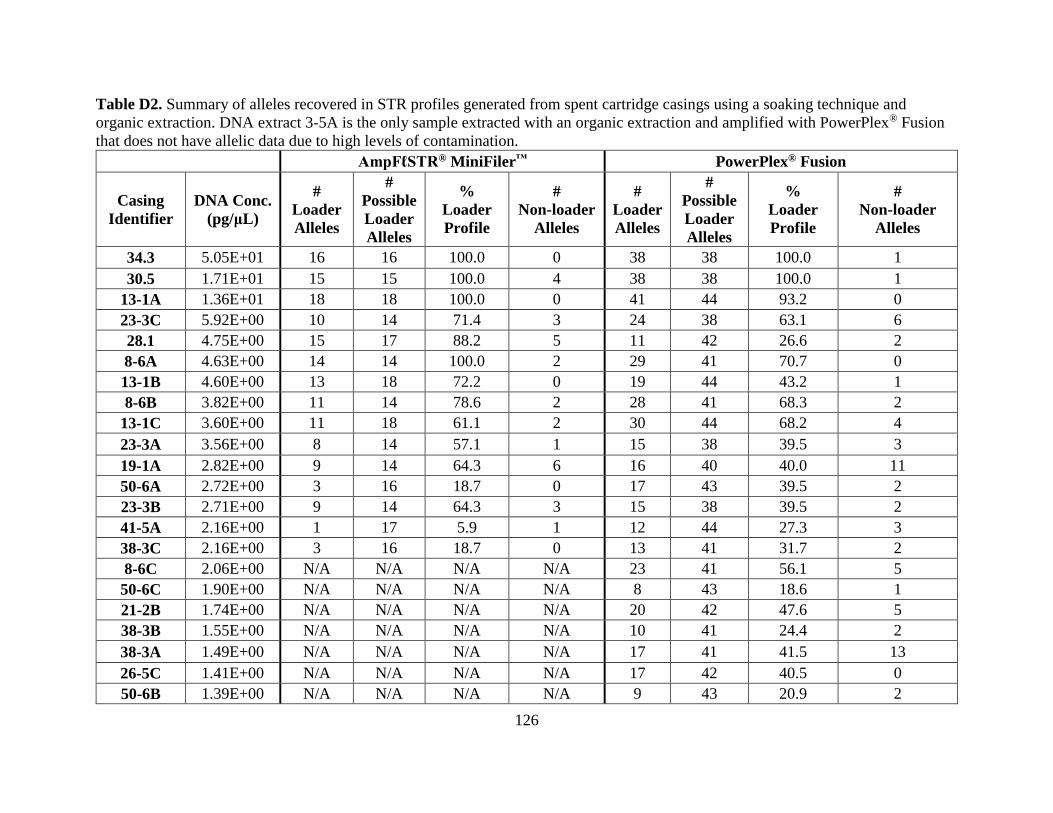
126
Table D2. Summary of alleles recovered in STR profiles generated from spent cartridge casings using a soaking technique and
organic extraction. DNA extract 3-5A is the only sample extracted with an organic extraction and amplified with PowerPlex® Fusion
that does not have allelic data due to high levels of contamination.
AmpFℓSTR® MiniFiler™ PowerPlex® Fusion
Casing
Identifier
DNA Conc.
(pg/μL)
#
Loader
Alleles
#
Possible
Loader
Alleles
%
Loader
Profile
#
Non-loader
Alleles
#
Loader
Alleles
#
Possible
Loader
Alleles
%
Loader
Profile
#
Non-loader
Alleles
34.3 5.05E+01 16 16 100.0 0 38 38 100.0 1
30.5 1.71E+01 15 15 100.0 4 38 38 100.0 1
13-1A 1.36E+01 18 18 100.0 0 41 44 93.2 0
23-3C 5.92E+00 10 14 71.4 3 24 38 63.1 6
28.1 4.75E+00 15 17 88.2 5 11 42 26.6 2
8-6A 4.63E+00 14 14 100.0 2 29 41 70.7 0
13-1B 4.60E+00 13 18 72.2 0 19 44 43.2 1
8-6B 3.82E+00 11 14 78.6 2 28 41 68.3 2
13-1C 3.60E+00 11 18 61.1 2 30 44 68.2 4
23-3A 3.56E+00 8 14 57.1 1 15 38 39.5 3
19-1A 2.82E+00 9 14 64.3 6 16 40 40.0 11
50-6A 2.72E+00 3 16 18.7 0 17 43 39.5 2
23-3B 2.71E+00 9 14 64.3 3 15 38 39.5 2
41-5A 2.16E+00 1 17 5.9 1 12 44 27.3 3
38-3C 2.16E+00 3 16 18.7 0 13 41 31.7 2
8-6C 2.06E+00 N/A N/A N/A N/A 23 41 56.1 5
50-6C 1.90E+00 N/A N/A N/A N/A 8 43 18.6 1
21-2B 1.74E+00 N/A N/A N/A N/A 20 42 47.6 5
38-3B 1.55E+00 N/A N/A N/A N/A 10 41 24.4 2
38-3A 1.49E+00 N/A N/A N/A N/A 17 41 41.5 13
26-5C 1.41E+00 N/A N/A N/A N/A 17 42 40.5 0
50-6B 1.39E+00 N/A N/A N/A N/A 9 43 20.9 2
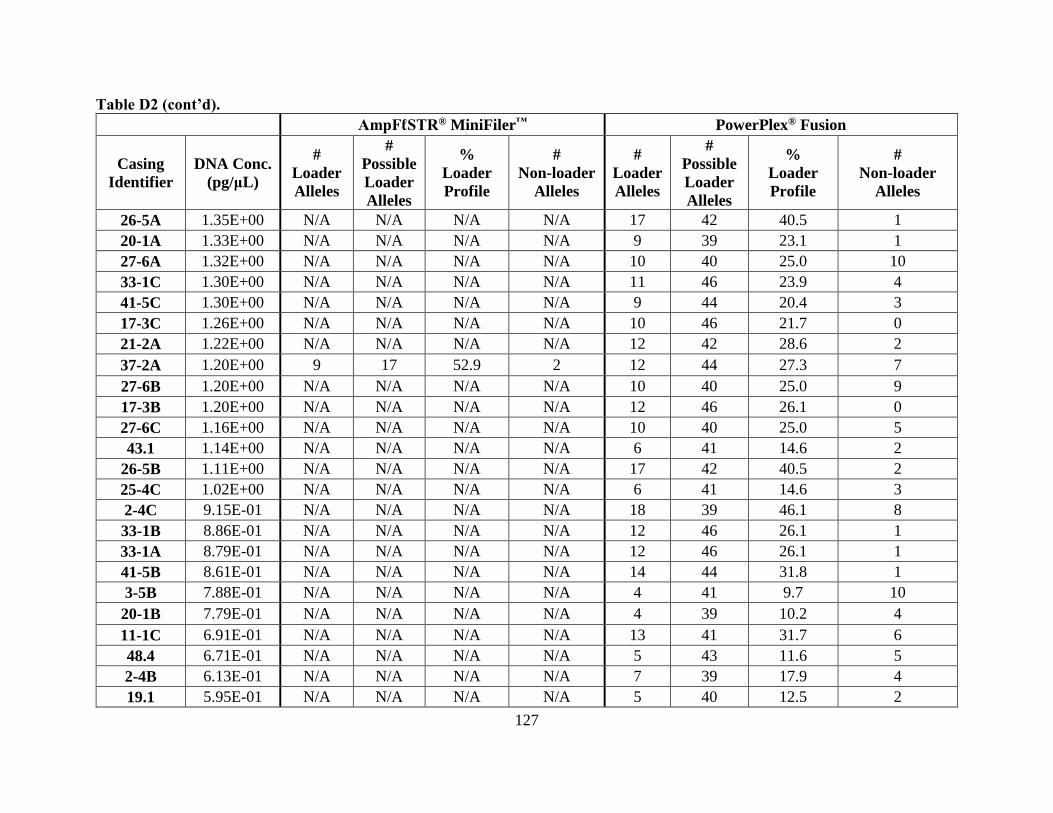
127
Table D2 (cont’d).
AmpFℓSTR® MiniFiler™ PowerPlex® Fusion
Casing
Identifier
DNA Conc.
(pg/μL)
#
Loader
Alleles
#
Possible
Loader
Alleles
%
Loader
Profile
#
Non-loader
Alleles
#
Loader
Alleles
#
Possible
Loader
Alleles
%
Loader
Profile
#
Non-loader
Alleles
26-5A 1.35E+00 N/A N/A N/A N/A 17 42 40.5 1
20-1A 1.33E+00 N/A N/A N/A N/A 9 39 23.1 1
27-6A 1.32E+00 N/A N/A N/A N/A 10 40 25.0 10
33-1C 1.30E+00 N/A N/A N/A N/A 11 46 23.9 4
41-5C 1.30E+00 N/A N/A N/A N/A 9 44 20.4 3
17-3C 1.26E+00 N/A N/A N/A N/A 10 46 21.7 0
21-2A 1.22E+00 N/A N/A N/A N/A 12 42 28.6 2
37-2A 1.20E+00 9 17 52.9 2 12 44 27.3 7
27-6B 1.20E+00 N/A N/A N/A N/A 10 40 25.0 9
17-3B 1.20E+00 N/A N/A N/A N/A 12 46 26.1 0
27-6C 1.16E+00 N/A N/A N/A N/A 10 40 25.0 5
43.1 1.14E+00 N/A N/A N/A N/A 6 41 14.6 2
26-5B 1.11E+00 N/A N/A N/A N/A 17 42 40.5 2
25-4C 1.02E+00 N/A N/A N/A N/A 6 41 14.6 3
2-4C 9.15E-01 N/A N/A N/A N/A 18 39 46.1 8
33-1B 8.86E-01 N/A N/A N/A N/A 12 46 26.1 1
33-1A 8.79E-01 N/A N/A N/A N/A 12 46 26.1 1
41-5B 8.61E-01 N/A N/A N/A N/A 14 44 31.8 1
3-5B 7.88E-01 N/A N/A N/A N/A 4 41 9.7 10
20-1B 7.79E-01 N/A N/A N/A N/A 4 39 10.2 4
11-1C 6.91E-01 N/A N/A N/A N/A 13 41 31.7 6
48.4 6.71E-01 N/A N/A N/A N/A 5 43 11.6 5
2-4B 6.13E-01 N/A N/A N/A N/A 7 39 17.9 4
19.1 5.95E-01 N/A N/A N/A N/A 5 40 12.5 2
128
Table D2 (cont’d).
AmpFℓSTR® MiniFiler™ PowerPlex® Fusion
Casing
Identifier
DNA Conc.
(pg/μL)
#
Loader
Alleles
#
Possible
Loader
Alleles
%
Loader
Profile
#
Non-loader
Alleles
#
Loader
Alleles
#
Possible
Loader
Alleles
%
Loader
Profile
#
Non-loader
Alleles
2-4A 5.52E-01 N/A N/A N/A N/A 8 39 20.5 3
10-7A 4.96E-01 N/A N/A N/A N/A 5 41 12.2 5
21-2C 4.76E-01 N/A N/A N/A N/A 5 42 11.9 2
37.6 4.67E-01 N/A N/A N/A N/A 8 44 18.2 3
36-2A 4.65E-01 N/A N/A N/A N/A 8 44 18.2 4
36-2B 4.22E-01 N/A N/A N/A N/A 3 44 6.8 2
20-1C 4.06E-01 N/A N/A N/A N/A 9 39 23.1 1
25-4A 3.95E-01 N/A N/A N/A N/A 4 41 9.7 3
18-4C 3.88E-01 N/A N/A N/A N/A 5 40 12.5 0
12-2C 3.69E-01 N/A N/A N/A N/A 3 41 7.3 4
3-5A 3.67E-01 N/A N/A N/A N/A N/A N/A N/A N/A
40-4C 3.27E-01 N/A N/A N/A N/A 8 39 20.5 3
1-2C 2.94E-01 N/A N/A N/A N/A 3 41 7.3 2
12-2B 2.88E-01 N/A N/A N/A N/A 4 41 9.7 1
40-4A 2.76E-01 N/A N/A N/A N/A 3 39 5.1 4
10-7B 2.75E-01 N/A N/A N/A N/A 3 41 7.3 2
25-4B 2.72E-01 N/A N/A N/A N/A 4 41 9.7 5
36-2C 2.70E-01 N/A N/A N/A N/A 3 44 6.8 0
15-2C 2.59E-01 N/A N/A N/A N/A 3 41 7.3 7
24-7C 2.54E-01 N/A N/A N/A N/A 5 41 12.2 3
6-3C 2.46E-01 N/A N/A N/A N/A 12 46 26.1 5
18-4A 2.40E-01 N/A N/A N/A N/A 4 40 10.0 1
3-5C 2.38E-01 N/A N/A N/A N/A 4 41 9.7 1
129
Table D2 (cont’d).
AmpFℓSTR® MiniFiler™ PowerPlex® Fusion
Casing
Identifier
DNA Conc.
(pg/μL)
#
Loader
Alleles
#
Possible
Loader
Alleles
%
Loader
Profile
#
Non-loader
Alleles
#
Loader
Alleles
#
Possible
Loader
Alleles
%
Loader
Profile
#
Non-loader
Alleles
1-2B 2.35E-01 N/A N/A N/A N/A 5 41 12.2 0
24-7A 2.22E-01 N/A N/A N/A N/A 3 41 7.3 3
1-2A 2.09E-01 N/A N/A N/A N/A 1 41 2.4 1
7-4A 2.00E-01 N/A N/A N/A N/A 2 45 4.4 8
10-7C 1.93E-01 N/A N/A N/A N/A 2 41 4.9 2
12-2A 1.91E-01 N/A N/A N/A N/A 7 41 17.7 0
17-3A 1.75E-01 N/A N/A N/A N/A 10 46 21.7 1
35-3A 1.62E-01 N/A N/A N/A N/A 0 42 0.0 0
15-2B 1.36E-01 N/A N/A N/A N/A 1 41 2.4 3
40-4B 1.23E-01 N/A N/A N/A N/A 2 39 5.1 1
18-4B 1.15E-01 N/A N/A N/A N/A 5 40 12.5 1
11-1A 1.07E-01 N/A N/A N/A N/A 2 41 4.9 3
6-3B 9.43E-02 N/A N/A N/A N/A 1 46 2.2 1
11-1B 9.01E-02 N/A N/A N/A N/A 0 41 0.0 0
15-2A 8.22E-02 N/A N/A N/A N/A 0 41 0.0 0
24-7B 6.91E-02 N/A N/A N/A N/A 1 41 2.4 1
7-4C 5.42E-02 N/A N/A N/A N/A 4 45 8.9 1
35-3B 3.95E-02 N/A N/A N/A N/A 3 42 7.1 0
6-3A 2.94E-02 N/A N/A N/A N/A 1 46 2.2 2
7-4B 2.03E-02 N/A N/A N/A N/A 1 45 2.2 0
35-3C 1.99E-02 N/A N/A N/A N/A 2 42 4.8 0
130
Table D3. Summary of alleles recovered in STR profiles generated from spent cartridge casings using a double swab technique
(Sweet et al., 1997) and QIAamp® DNA Investigator extraction.
AmpFℓSTR® MiniFiler™ PowerPlex® Fusion
Casing
Identifier
DNA Conc.
(pg/μL)
#
Loader
Alleles
#
Possible
Loader
Alleles
%
Loader
Profile
#
Non-loader
Alleles
#
Loader
Alleles
#
Possible
Loader
Alleles
%
Loader
Profile
#
Non-loader
Alleles
13-2B 1.25E+00 3 18 16.7 1 17 44 38.6 2
34.6 1.17E+00 12 16 75.0 1 25 38 65.8 2
21-3B 9.04E-01 N/A N/A N/A N/A 11 42 26.2 1
21-3A 4.79E-01 N/A N/A N/A N/A 6 42 14.3 3
28.4 4.71E-01 2 17 11.8 0 6 42 14.3 3
12-3A 3.92E-01 N/A N/A N/A N/A 5 41 12.2 0
20-2B 3.89E-01 N/A N/A N/A N/A 5 39 12.8 1
13-2A 3.58E-01 1 18 5.6 2 8 44 18.2 2
23-4C 3.16E-01 1 14 7.1 3 2 38 5.3 0
17-4A 3.00E-01 N/A N/A N/A N/A 2 46 4.3 0
38-4B 2.84E-01 1 16 6.2 1 7 41 17.1 3
2-5B 2.80E-01 1 16 6.2 1 0 39 0.0 2
17-4C 2.57E-01 N/A N/A N/A N/A 0 46 0.0 3
21-3C 2.50E-01 N/A N/A N/A N/A 9 42 21.4 1
8-7A 2.29E-01 1 14 7.1 1 6 41 14.6 0
38-4A 2.15E-01 0 16 0.0 1 2 41 4.9 0
23-4A 2.14E-01 0 14 0.0 0 2 38 5.3 0
26-6A 2.00E-01 0 16 0.0 1 0 42 0.0 4
23-4B 1.90E-01 0 14 0.0 3 2 38 5.3 0
8-7B 1.83E-01 0 14 0.0 3 1 41 2.4 1
41-6B 1.82E-01 N/A N/A N/A N/A 7 44 15.9 2
13-2C 1.77E-01 N/A N/A N/A N/A 0 44 0.0 3
48.1 1.65E-01 N/A N/A N/A N/A 2 43 4.6 1
131
Table D3 (cont’d).
AmpFℓSTR® MiniFiler™ PowerPlex® Fusion
Casing
Identifier
DNA Conc.
(pg/μL)
#
Loader
Alleles
#
Possible
Loader
Alleles
%
Loader
Profile
#
Non-loader
Alleles
#
Loader
Alleles
#
Possible
Loader
Alleles
%
Loader
Profile
#
Non-loader
Alleles
33-2C 1.49E-01 N/A N/A N/A N/A 5 46 10.9 0
11-2A 1.41E-01 N/A N/A N/A N/A 2 41 4.9 0
37-1B 1.38E-01 N/A N/A N/A N/A 3 44 6.8 1
20-2A 1.36E-01 N/A N/A N/A N/A 2 39 5.1 0
30.2 1.27E-01 0 15 0.0 0 2 38 5.3 0
6-4C 1.27E-01 N/A N/A N/A N/A 3 46 6.5 2
20-2C 1.23E-01 N/A N/A N/A N/A 3 39 7.7 1
2-5C 1.08E-01 N/A N/A N/A N/A 3 39 7.7 0
2-5A 1.05E-01 N/A N/A N/A N/A 1 39 2.6 2
26-6C 1.04E-01 N/A N/A N/A N/A 0 42 0.0 0
7/18-1B.1 1.01E-01 N/A N/A N/A N/A 4 40 10.0 3
41-6A 9.60E-02 N/A N/A N/A N/A 1 44 2.3 0
1-3A 9.47E-02 N/A N/A N/A N/A 0 41 0.0 2
7/18-1C.1 9.43E-02 N/A N/A N/A N/A 0 40 0.0 0
38-4C 9.31E-02 N/A N/A N/A N/A 1 41 2.4 1
7/18-1A.2 9.18E-02 N/A N/A N/A N/A 1 45 2.2 0
8-7C 8.74E-02 N/A N/A N/A N/A 6 41 14.6 1
1-3C 8.69E-02 N/A N/A N/A N/A 0 41 0.0 1
27-7C 7.50E-02 N/A N/A N/A N/A 0 40 0.0 0
1-3B 7.28E-02 N/A N/A N/A N/A 0 41 0.0 1
17-4B 6.70E-02 N/A N/A N/A N/A 0 46 0.0 0
33-2B 6.69E-02 N/A N/A N/A N/A 0 46 0.0 1
26-6B 6.55E-02 N/A N/A N/A N/A 2 42 4.7 0
25-5C 6.23E-02 N/A N/A N/A N/A 0 41 0.0 0
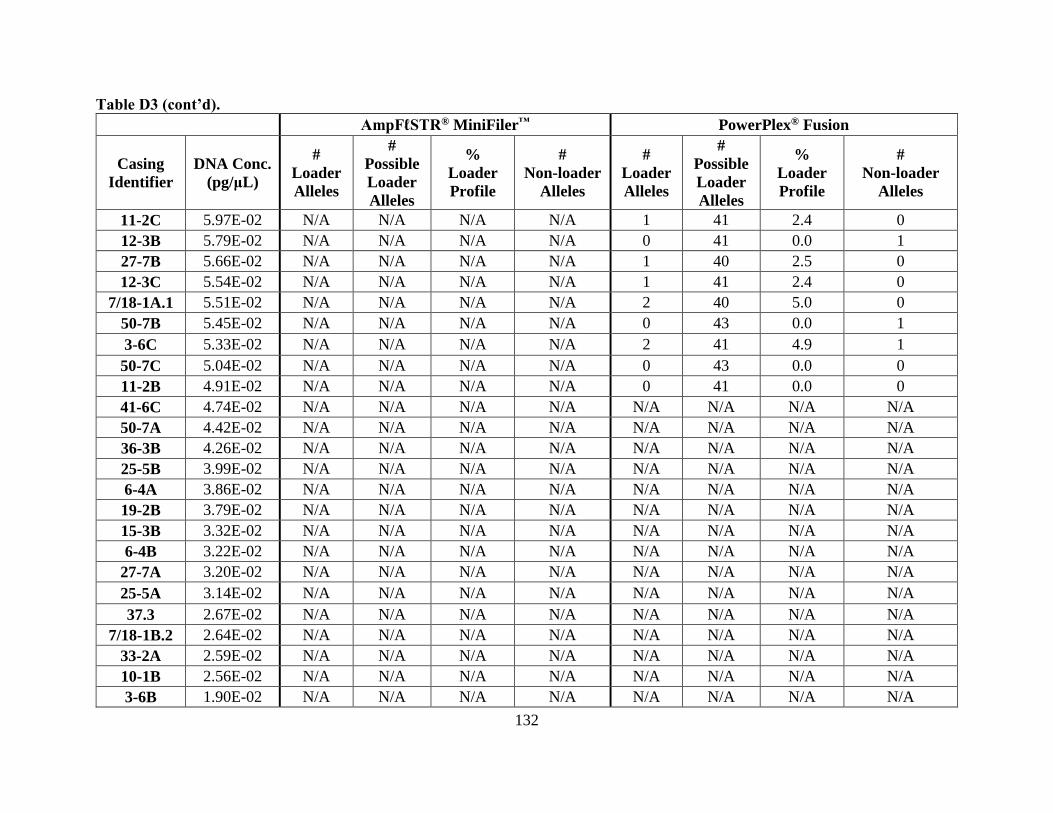
132
Table D3 (cont’d).
AmpFℓSTR® MiniFiler™ PowerPlex® Fusion
Casing
Identifier
DNA Conc.
(pg/μL)
#
Loader
Alleles
#
Possible
Loader
Alleles
%
Loader
Profile
#
Non-loader
Alleles
#
Loader
Alleles
#
Possible
Loader
Alleles
%
Loader
Profile
#
Non-loader
Alleles
11-2C 5.97E-02 N/A N/A N/A N/A 1 41 2.4 0
12-3B 5.79E-02 N/A N/A N/A N/A 0 41 0.0 1
27-7B 5.66E-02 N/A N/A N/A N/A 1 40 2.5 0
12-3C 5.54E-02 N/A N/A N/A N/A 1 41 2.4 0
7/18-1A.1 5.51E-02 N/A N/A N/A N/A 2 40 5.0 0
50-7B 5.45E-02 N/A N/A N/A N/A 0 43 0.0 1
3-6C 5.33E-02 N/A N/A N/A N/A 2 41 4.9 1
50-7C 5.04E-02 N/A N/A N/A N/A 0 43 0.0 0
11-2B 4.91E-02 N/A N/A N/A N/A 0 41 0.0 0
41-6C 4.74E-02 N/A N/A N/A N/A N/A N/A N/A N/A
50-7A 4.42E-02 N/A N/A N/A N/A N/A N/A N/A N/A
36-3B 4.26E-02 N/A N/A N/A N/A N/A N/A N/A N/A
25-5B 3.99E-02 N/A N/A N/A N/A N/A N/A N/A N/A
6-4A 3.86E-02 N/A N/A N/A N/A N/A N/A N/A N/A
19-2B 3.79E-02 N/A N/A N/A N/A N/A N/A N/A N/A
15-3B 3.32E-02 N/A N/A N/A N/A N/A N/A N/A N/A
6-4B 3.22E-02 N/A N/A N/A N/A N/A N/A N/A N/A
27-7A 3.20E-02 N/A N/A N/A N/A N/A N/A N/A N/A
25-5A 3.14E-02 N/A N/A N/A N/A N/A N/A N/A N/A
37.3 2.67E-02 N/A N/A N/A N/A N/A N/A N/A N/A
7/18-1B.2 2.64E-02 N/A N/A N/A N/A N/A N/A N/A N/A
33-2A 2.59E-02 N/A N/A N/A N/A N/A N/A N/A N/A
10-1B 2.56E-02 N/A N/A N/A N/A N/A N/A N/A N/A
3-6B 1.90E-02 N/A N/A N/A N/A N/A N/A N/A N/A
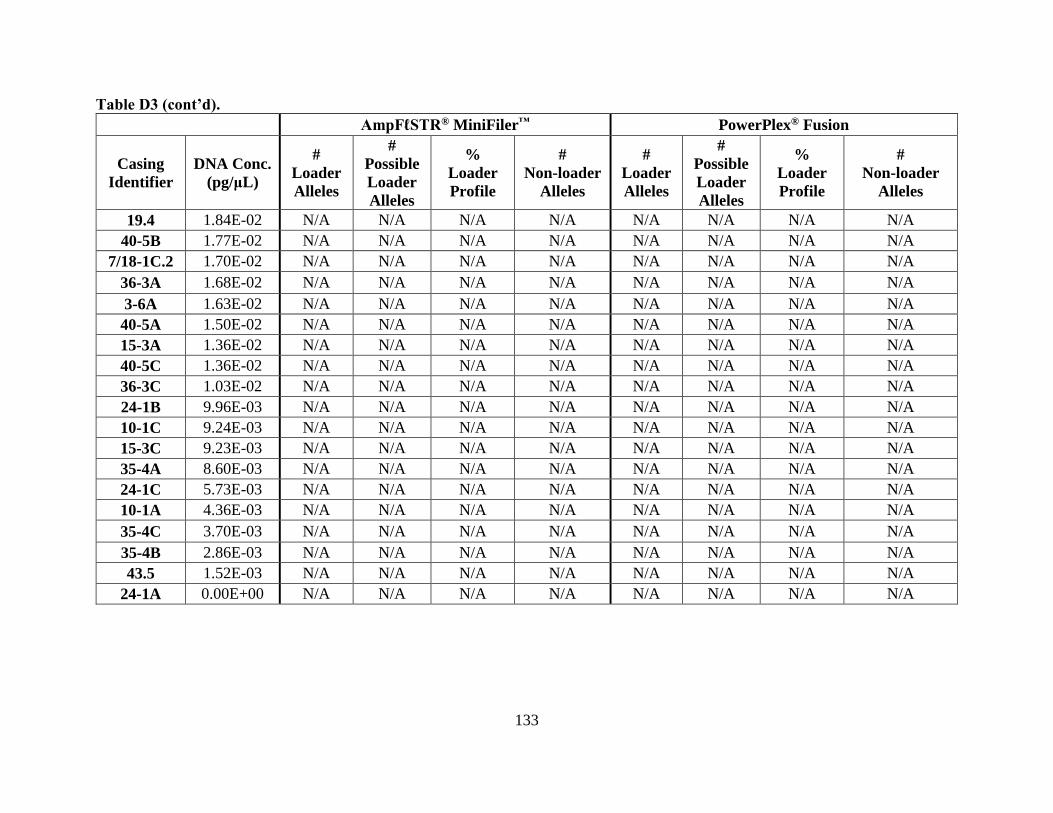
133
Table D3 (cont’d).
AmpFℓSTR® MiniFiler™ PowerPlex® Fusion
Casing
Identifier
DNA Conc.
(pg/μL)
#
Loader
Alleles
#
Possible
Loader
Alleles
%
Loader
Profile
#
Non-loader
Alleles
#
Loader
Alleles
#
Possible
Loader
Alleles
%
Loader
Profile
#
Non-loader
Alleles
19.4 1.84E-02 N/A N/A N/A N/A N/A N/A N/A N/A
40-5B 1.77E-02 N/A N/A N/A N/A N/A N/A N/A N/A
7/18-1C.2 1.70E-02 N/A N/A N/A N/A N/A N/A N/A N/A
36-3A 1.68E-02 N/A N/A N/A N/A N/A N/A N/A N/A
3-6A 1.63E-02 N/A N/A N/A N/A N/A N/A N/A N/A
40-5A 1.50E-02 N/A N/A N/A N/A N/A N/A N/A N/A
15-3A 1.36E-02 N/A N/A N/A N/A N/A N/A N/A N/A
40-5C 1.36E-02 N/A N/A N/A N/A N/A N/A N/A N/A
36-3C 1.03E-02 N/A N/A N/A N/A N/A N/A N/A N/A
24-1B 9.96E-03 N/A N/A N/A N/A N/A N/A N/A N/A
10-1C 9.24E-03 N/A N/A N/A N/A N/A N/A N/A N/A
15-3C 9.23E-03 N/A N/A N/A N/A N/A N/A N/A N/A
35-4A 8.60E-03 N/A N/A N/A N/A N/A N/A N/A N/A
24-1C 5.73E-03 N/A N/A N/A N/A N/A N/A N/A N/A
10-1A 4.36E-03 N/A N/A N/A N/A N/A N/A N/A N/A
35-4C 3.70E-03 N/A N/A N/A N/A N/A N/A N/A N/A
35-4B 2.86E-03 N/A N/A N/A N/A N/A N/A N/A N/A
43.5 1.52E-03 N/A N/A N/A N/A N/A N/A N/A N/A
24-1A 0.00E+00 N/A N/A N/A N/A N/A N/A N/A N/A
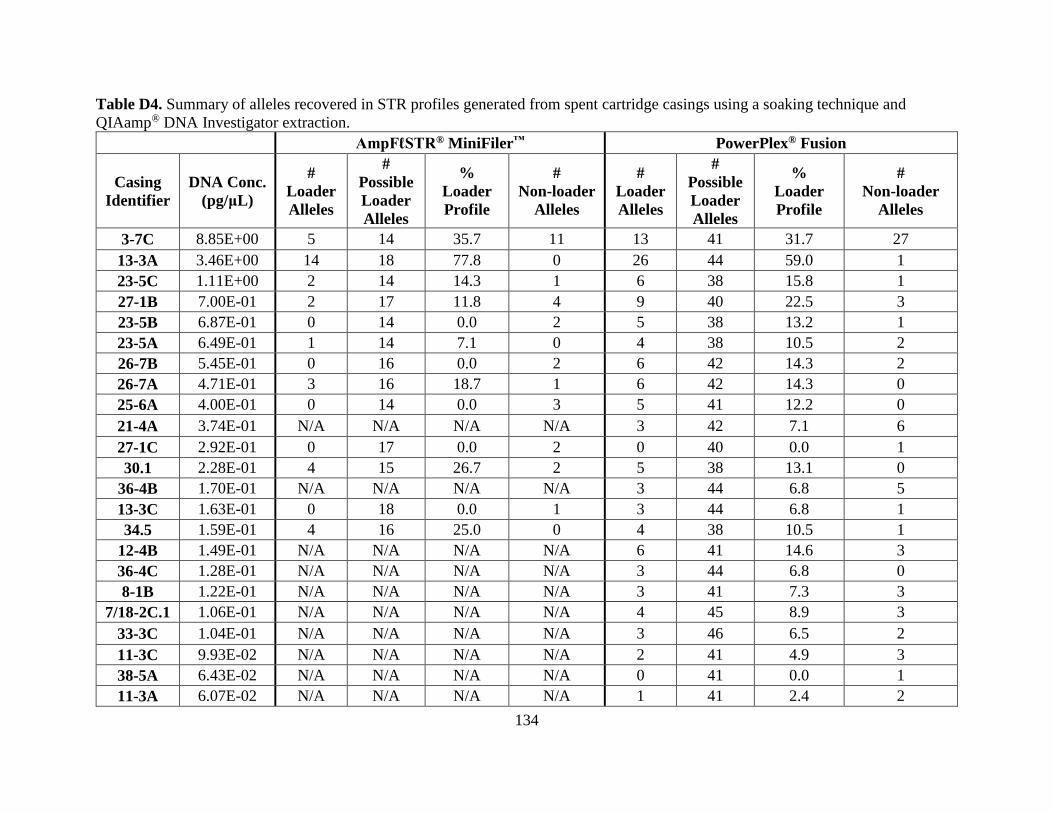
134
Table D4. Summary of alleles recovered in STR profiles generated from spent cartridge casings using a soaking technique and
QIAamp® DNA Investigator extraction.
AmpFℓSTR® MiniFiler™ PowerPlex® Fusion
Casing
Identifier
DNA Conc.
(pg/μL)
#
Loader
Alleles
#
Possible
Loader
Alleles
%
Loader
Profile
#
Non-loader
Alleles
#
Loader
Alleles
#
Possible
Loader
Alleles
%
Loader
Profile
#
Non-loader
Alleles
3-7C 8.85E+00 5 14 35.7 11 13 41 31.7 27
13-3A 3.46E+00 14 18 77.8 0 26 44 59.0 1
23-5C 1.11E+00 2 14 14.3 1 6 38 15.8 1
27-1B 7.00E-01 2 17 11.8 4 9 40 22.5 3
23-5B 6.87E-01 0 14 0.0 2 5 38 13.2 1
23-5A 6.49E-01 1 14 7.1 0 4 38 10.5 2
26-7B 5.45E-01 0 16 0.0 2 6 42 14.3 2
26-7A 4.71E-01 3 16 18.7 1 6 42 14.3 0
25-6A 4.00E-01 0 14 0.0 3 5 41 12.2 0
21-4A 3.74E-01 N/A N/A N/A N/A 3 42 7.1 6
27-1C 2.92E-01 0 17 0.0 2 0 40 0.0 1
30.1 2.28E-01 4 15 26.7 2 5 38 13.1 0
36-4B 1.70E-01 N/A N/A N/A N/A 3 44 6.8 5
13-3C 1.63E-01 0 18 0.0 1 3 44 6.8 1
34.5 1.59E-01 4 16 25.0 0 4 38 10.5 1
12-4B 1.49E-01 N/A N/A N/A N/A 6 41 14.6 3
36-4C 1.28E-01 N/A N/A N/A N/A 3 44 6.8 0
8-1B 1.22E-01 N/A N/A N/A N/A 3 41 7.3 3
7/18-2C.1 1.06E-01 N/A N/A N/A N/A 4 45 8.9 3
33-3C 1.04E-01 N/A N/A N/A N/A 3 46 6.5 2
11-3C 9.93E-02 N/A N/A N/A N/A 2 41 4.9 3
38-5A 6.43E-02 N/A N/A N/A N/A 0 41 0.0 1
11-3A 6.07E-02 N/A N/A N/A N/A 1 41 2.4 2
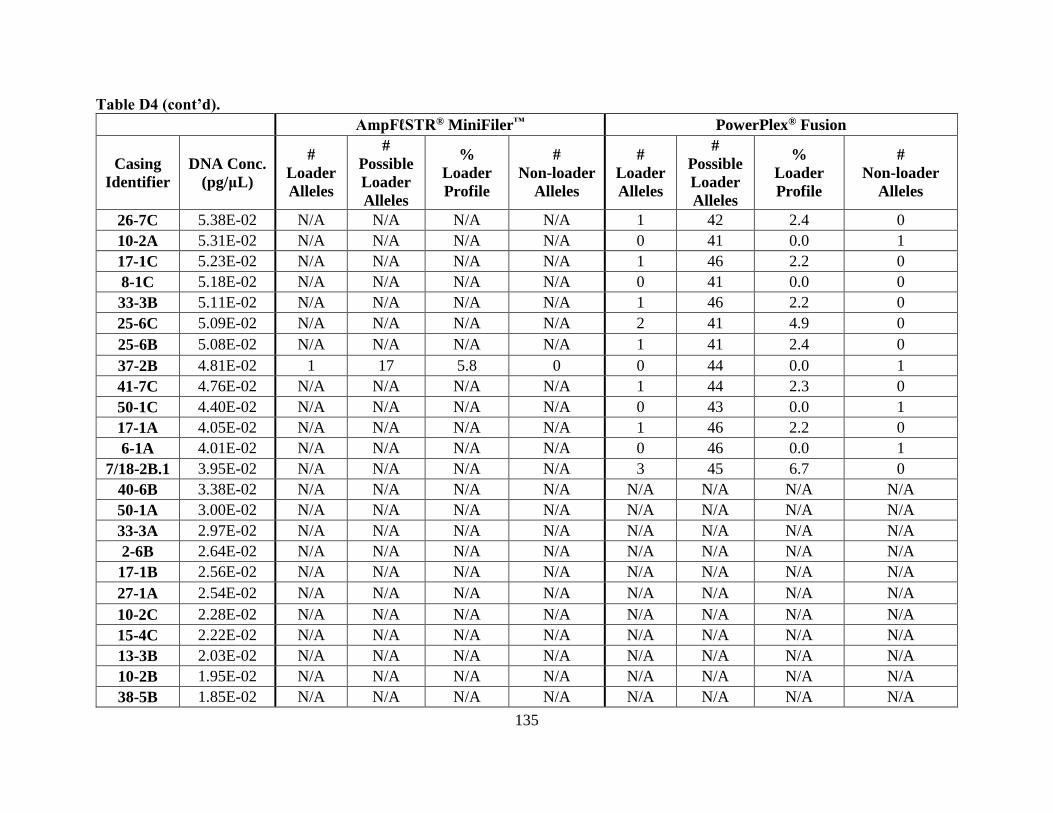
135
Table D4 (cont’d).
AmpFℓSTR® MiniFiler™ PowerPlex® Fusion
Casing
Identifier
DNA Conc.
(pg/μL)
#
Loader
Alleles
#
Possible
Loader
Alleles
%
Loader
Profile
#
Non-loader
Alleles
#
Loader
Alleles
#
Possible
Loader
Alleles
%
Loader
Profile
#
Non-loader
Alleles
26-7C 5.38E-02 N/A N/A N/A N/A 1 42 2.4 0
10-2A 5.31E-02 N/A N/A N/A N/A 0 41 0.0 1
17-1C 5.23E-02 N/A N/A N/A N/A 1 46 2.2 0
8-1C 5.18E-02 N/A N/A N/A N/A 0 41 0.0 0
33-3B 5.11E-02 N/A N/A N/A N/A 1 46 2.2 0
25-6C 5.09E-02 N/A N/A N/A N/A 2 41 4.9 0
25-6B 5.08E-02 N/A N/A N/A N/A 1 41 2.4 0
37-2B 4.81E-02 1 17 5.8 0 0 44 0.0 1
41-7C 4.76E-02 N/A N/A N/A N/A 1 44 2.3 0
50-1C 4.40E-02 N/A N/A N/A N/A 0 43 0.0 1
17-1A 4.05E-02 N/A N/A N/A N/A 1 46 2.2 0
6-1A 4.01E-02 N/A N/A N/A N/A 0 46 0.0 1
7/18-2B.1 3.95E-02 N/A N/A N/A N/A 3 45 6.7 0
40-6B 3.38E-02 N/A N/A N/A N/A N/A N/A N/A N/A
50-1A 3.00E-02 N/A N/A N/A N/A N/A N/A N/A N/A
33-3A 2.97E-02 N/A N/A N/A N/A N/A N/A N/A N/A
2-6B 2.64E-02 N/A N/A N/A N/A N/A N/A N/A N/A
17-1B 2.56E-02 N/A N/A N/A N/A N/A N/A N/A N/A
27-1A 2.54E-02 N/A N/A N/A N/A N/A N/A N/A N/A
10-2C 2.28E-02 N/A N/A N/A N/A N/A N/A N/A N/A
15-4C 2.22E-02 N/A N/A N/A N/A N/A N/A N/A N/A
13-3B 2.03E-02 N/A N/A N/A N/A N/A N/A N/A N/A
10-2B 1.95E-02 N/A N/A N/A N/A N/A N/A N/A N/A
38-5B 1.85E-02 N/A N/A N/A N/A N/A N/A N/A N/A
136
Table D4 (cont’d).
AmpFℓSTR® MiniFiler™ PowerPlex® Fusion
Casing
Identifier
DNA Conc.
(pg/μL)
#
Loader
Alleles
#
Possible
Loader
Alleles
%
Loader
Profile
#
Non-loader
Alleles
#
Loader
Alleles
#
Possible
Loader
Alleles
%
Loader
Profile
#
Non-loader
Alleles
28.3 1.58E-02 N/A N/A N/A N/A N/A N/A N/A N/A
19.3 1.47E-02 N/A N/A N/A N/A N/A N/A N/A N/A
3-7A 1.46E-02 N/A N/A N/A N/A N/A N/A N/A N/A
2-6C 1.37E-02 N/A N/A N/A N/A N/A N/A N/A N/A
11-3B 1.35E-02 N/A N/A N/A N/A N/A N/A N/A N/A
2-6A 1.32E-02 N/A N/A N/A N/A N/A N/A N/A N/A
40-6A 1.22E-02 N/A N/A N/A N/A N/A N/A N/A N/A
3-7B 1.13E-02 N/A N/A N/A N/A N/A N/A N/A N/A
8-1A 1.11E-02 N/A N/A N/A N/A N/A N/A N/A N/A
41-7B 1.11E-02 N/A N/A N/A N/A N/A N/A N/A N/A
36-4A 1.07E-02 N/A N/A N/A N/A N/A N/A N/A N/A
43.4 1.05E-02 N/A N/A N/A N/A N/A N/A N/A N/A
1-4B 9.85E-03 N/A N/A N/A N/A N/A N/A N/A N/A
6-1B 8.69E-03 N/A N/A N/A N/A N/A N/A N/A N/A
20-3C 8.36E-03 N/A N/A N/A N/A N/A N/A N/A N/A
12-4A 8.16E-03 N/A N/A N/A N/A N/A N/A N/A N/A
50-1B 7.89E-03 N/A N/A N/A N/A N/A N/A N/A N/A
19-1B 7.17E-03 N/A N/A N/A N/A N/A N/A N/A N/A
41-7A 6.64E-03 N/A N/A N/A N/A N/A N/A N/A N/A
6-1C 6.46E-03 N/A N/A N/A N/A N/A N/A N/A N/A
24-2C 6.41E-03 N/A N/A N/A N/A N/A N/A N/A N/A
15-4B 6.30E-03 N/A N/A N/A N/A N/A N/A N/A N/A
38-5C 6.15E-03 N/A N/A N/A N/A N/A N/A N/A N/A
40-6C 6.03E-03 N/A N/A N/A N/A N/A N/A N/A N/A
137
Table D4 (cont’d).
AmpFℓSTR® MiniFiler™ PowerPlex® Fusion
Casing
Identifier
DNA Conc.
(pg/μL)
#
Loader
Alleles
#
Possible
Loader
Alleles
%
Loader
Profile
#
Non-loader
Alleles
#
Loader
Alleles
#
Possible
Loader
Alleles
%
Loader
Profile
#
Non-loader
Alleles
24-2A 5.81E-03 N/A N/A N/A N/A N/A N/A N/A N/A
48.6 5.76E-03 N/A N/A N/A N/A N/A N/A N/A N/A
7/18-2A.1 5.43E-03 N/A N/A N/A N/A N/A N/A N/A N/A
37.2 5.04E-03 N/A N/A N/A N/A N/A N/A N/A N/A
20-3B 4.92E-03 N/A N/A N/A N/A N/A N/A N/A N/A
35-1A 4.19E-03 N/A N/A N/A N/A N/A N/A N/A N/A
15-4A 3.78E-03 N/A N/A N/A N/A N/A N/A N/A N/A
1-4C 3.59E-03 N/A N/A N/A N/A N/A N/A N/A N/A
24-2B 3.28E-03 N/A N/A N/A N/A N/A N/A N/A N/A
21-4C 2.77E-03 N/A N/A N/A N/A N/A N/A N/A N/A
1-4A 2.31E-03 N/A N/A N/A N/A N/A N/A N/A N/A
35-1C 1.71E-03 N/A N/A N/A N/A N/A N/A N/A N/A
7/18-2C.2 1.66E-03 N/A N/A N/A N/A N/A N/A N/A N/A
12-4C 1.36E-03 N/A N/A N/A N/A N/A N/A N/A N/A
7/18-2A.2 1.12E-03 N/A N/A N/A N/A N/A N/A N/A N/A
35-1B 7.62E-04 N/A N/A N/A N/A N/A N/A N/A N/A
20-3A 6.58E-04 N/A N/A N/A N/A N/A N/A N/A N/A
21-4B 1.90E-04 N/A N/A N/A N/A N/A N/A N/A N/A
7/18-2B.2 1.89E-04 N/A N/A N/A N/A N/A N/A N/A N/A
138
Table D5. Summary of alleles recovered in STR profiles generated from spent cartridge casings using a single swab and FDF®
extraction.
AmpFℓSTR® MiniFiler™ PowerPlex® Fusion
Casing
Identifier
DNA Conc.
(pg/μL)
#
Loader
Alleles
#
Possible
Loader
Alleles
%
Loader
Profile
#
Non-loader
Alleles
#
Loader
Alleles
#
Possible
Loader
Alleles
%
Loader
Profile
#
Non-loader
Alleles
34.1 2.82E-01 3 16 18.7 0 6 38 15.8 0
30.3 5.14E-02 N/A N/A N/A N/A 4 38 10.5 1
8-2A 1.65E-02 0 14 0.0 4 0 41 0.0 0
48.2 1.18E-02 N/A N/A N/A N/A 0 43 0.0 1
37.4 1.10E-02 N/A N/A N/A N/A 0 44 0.0 1
33-4B 1.07E-02 1 18 5.6 3 5 46 10.9 4
19-1C 9.48E-03 0 14 0.0 0 0 40 0.0 0
37-2C 9.29E-03 N/A N/A N/A N/A 0 44 0.0 0
28.5 8.93E-03 0 17 0.0 0 0 42 0.0 0
27-2B 7.81E-03 0 17 0.0 2 0 40 0.0 1
19.5 7.30E-03 N/A N/A N/A N/A 0 40 0.0 1
25-7C 7.19E-03 0 14 0.0 1 0 41 0.0 0
24-3B 7.19E-03 N/A N/A N/A N/A 0 41 0.0 1
43.6 7.18E-03 N/A N/A N/A N/A 0 41 0.0 0
50-2C 5.82E-03 N/A N/A N/A N/A N/A N/A N/A N/A
26-1B 5.77E-03 N/A N/A N/A N/A N/A N/A N/A N/A
27-2C 4.92E-03 N/A N/A N/A N/A N/A N/A N/A N/A
50-2A 4.89E-03 N/A N/A N/A N/A N/A N/A N/A N/A
3-1B 3.97E-03 N/A N/A N/A N/A N/A N/A N/A N/A
50-2B 3.93E-03 N/A N/A N/A N/A N/A N/A N/A N/A
27-2A 3.71E-03 N/A N/A N/A N/A N/A N/A N/A N/A
8-2B 3.67E-03 N/A N/A N/A N/A N/A N/A N/A N/A
2-7A 3.61E-03 N/A N/A N/A N/A N/A N/A N/A N/A
139
Table D5 (cont’d).
AmpFℓSTR® MiniFiler™ PowerPlex® Fusion
Casing
Identifier
DNA Conc.
(pg/μL)
#
Loader
Alleles
#
Possible
Loader
Alleles
%
Loader
Profile
#
Non-loader
Alleles
#
Loader
Alleles
#
Possible
Loader
Alleles
%
Loader
Profile
#
Non-loader
Alleles
13-4A 3.50E-03 N/A N/A N/A N/A N/A N/A N/A N/A
41-1B 3.24E-03 N/A N/A N/A N/A N/A N/A N/A N/A
25-7A 3.14E-03 N/A N/A N/A N/A N/A N/A N/A N/A
26-1C 3.13E-03 N/A N/A N/A N/A N/A N/A N/A N/A
41-1C 3.10E-03 N/A N/A N/A N/A N/A N/A N/A N/A
26-1A 3.04E-03 N/A N/A N/A N/A N/A N/A N/A N/A
23-6B 3.00E-03 N/A N/A N/A N/A N/A N/A N/A N/A
3-1C 2.88E-03 N/A N/A N/A N/A N/A N/A N/A N/A
8-2C 2.78E-03 N/A N/A N/A N/A N/A N/A N/A N/A
38-6B 2.17E-03 N/A N/A N/A N/A N/A N/A N/A N/A
23-6A 2.08E-03 N/A N/A N/A N/A N/A N/A N/A N/A
33-4C 2.03E-03 N/A N/A N/A N/A N/A N/A N/A N/A
15-5B 1.99E-03 N/A N/A N/A N/A N/A N/A N/A N/A
10-3C 1.98E-03 N/A N/A N/A N/A N/A N/A N/A N/A
15-5C 1.95E-03 N/A N/A N/A N/A N/A N/A N/A N/A
38-6C 1.84E-03 N/A N/A N/A N/A N/A N/A N/A N/A
2-7C 1.71E-03 N/A N/A N/A N/A N/A N/A N/A N/A
23-6C 1.69E-03 N/A N/A N/A N/A N/A N/A N/A N/A
24-3A 1.68E-03 N/A N/A N/A N/A N/A N/A N/A N/A
3-1A 1.54E-03 N/A N/A N/A N/A N/A N/A N/A N/A
25-7B 1.53E-03 N/A N/A N/A N/A N/A N/A N/A N/A
2-7B 1.51E-03 N/A N/A N/A N/A N/A N/A N/A N/A
40-7A 1.29E-03 N/A N/A N/A N/A N/A N/A N/A N/A
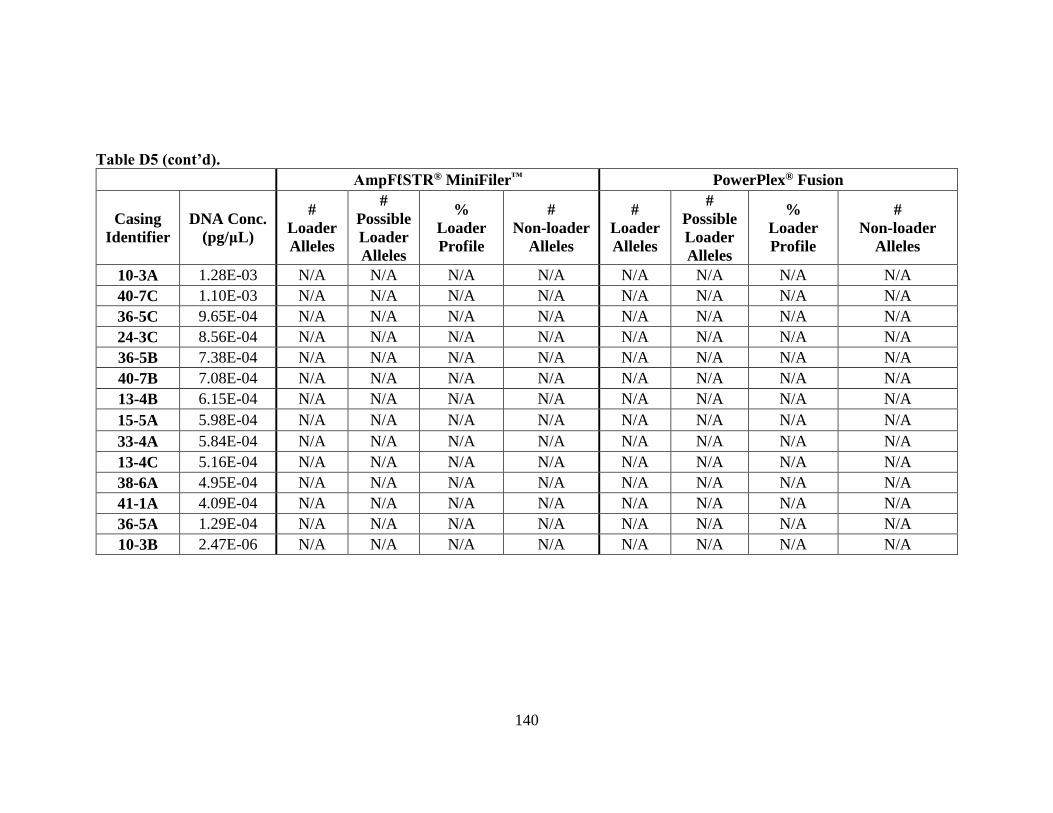
140
Table D5 (cont’d).
AmpFℓSTR® MiniFiler™ PowerPlex® Fusion
Casing
Identifier
DNA Conc.
(pg/μL)
#
Loader
Alleles
#
Possible
Loader
Alleles
%
Loader
Profile
#
Non-loader
Alleles
#
Loader
Alleles
#
Possible
Loader
Alleles
%
Loader
Profile
#
Non-loader
Alleles
10-3A 1.28E-03 N/A N/A N/A N/A N/A N/A N/A N/A
40-7C 1.10E-03 N/A N/A N/A N/A N/A N/A N/A N/A
36-5C 9.65E-04 N/A N/A N/A N/A N/A N/A N/A N/A
24-3C 8.56E-04 N/A N/A N/A N/A N/A N/A N/A N/A
36-5B 7.38E-04 N/A N/A N/A N/A N/A N/A N/A N/A
40-7B 7.08E-04 N/A N/A N/A N/A N/A N/A N/A N/A
13-4B 6.15E-04 N/A N/A N/A N/A N/A N/A N/A N/A
15-5A 5.98E-04 N/A N/A N/A N/A N/A N/A N/A N/A
33-4A 5.84E-04 N/A N/A N/A N/A N/A N/A N/A N/A
13-4C 5.16E-04 N/A N/A N/A N/A N/A N/A N/A N/A
38-6A 4.95E-04 N/A N/A N/A N/A N/A N/A N/A N/A
41-1A 4.09E-04 N/A N/A N/A N/A N/A N/A N/A N/A
36-5A 1.29E-04 N/A N/A N/A N/A N/A N/A N/A N/A
10-3B 2.47E-06 N/A N/A N/A N/A N/A N/A N/A N/A
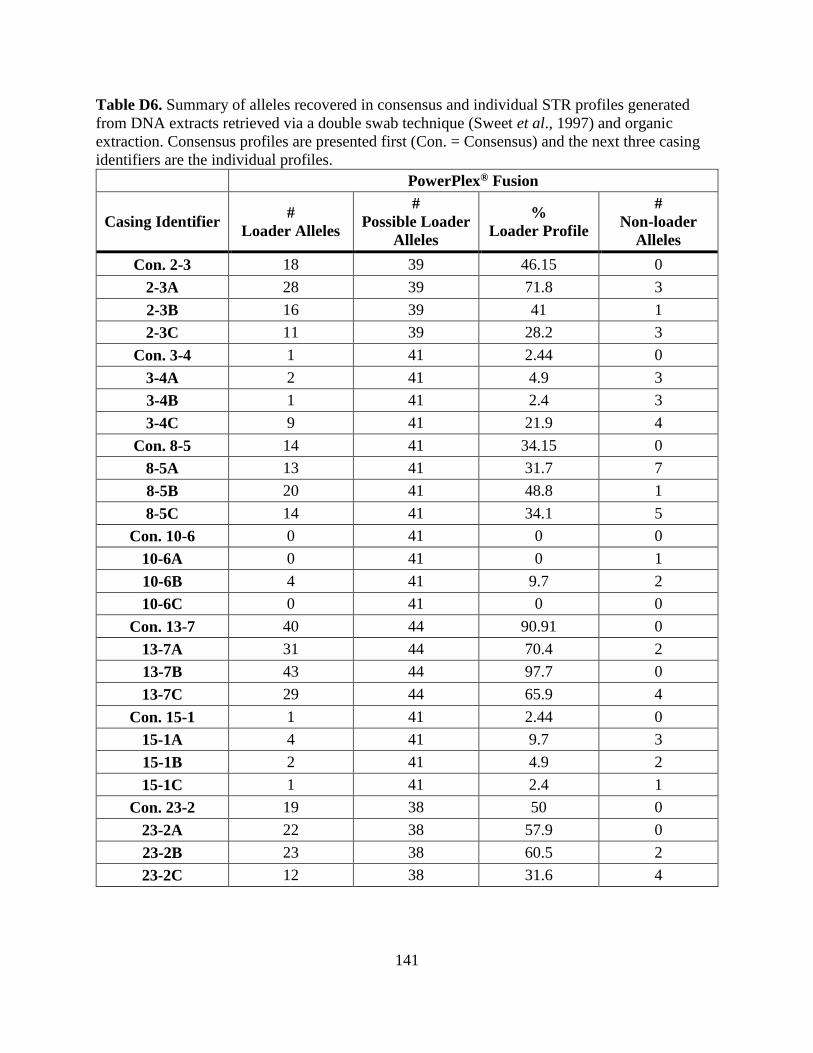
141
Table D6. Summary of alleles recovered in consensus and individual STR profiles generated
from DNA extracts retrieved via a double swab technique (Sweet et al., 1997) and organic
extraction. Consensus profiles are presented first (Con. = Consensus) and the next three casing
identifiers are the individual profiles.
PowerPlex® Fusion
Casing Identifier #
Loader Alleles
#
Possible Loader
Alleles
%
Loader Profile
#
Non-loader
Alleles
Con. 2-3 18 39 46.15 0
2-3A 28 39 71.8 3
2-3B 16 39 41 1
2-3C 11 39 28.2 3
Con. 3-4 1 41 2.44 0
3-4A 2 41 4.9 3
3-4B 1 41 2.4 3
3-4C 9 41 21.9 4
Con. 8-5 14 41 34.15 0
8-5A 13 41 31.7 7
8-5B 20 41 48.8 1
8-5C 14 41 34.1 5
Con. 10-6 0 41 0 0
10-6A 0 41 0 1
10-6B 4 41 9.7 2
10-6C 0 41 0 0
Con. 13-7 40 44 90.91 0
13-7A 31 44 70.4 2
13-7B 43 44 97.7 0
13-7C 29 44 65.9 4
Con. 15-1 1 41 2.44 0
15-1A 4 41 9.7 3
15-1B 2 41 4.9 2
15-1C 1 41 2.4 1
Con. 23-2 19 38 50 0
23-2A 22 38 57.9 0
23-2B 23 38 60.5 2
23-2C 12 38 31.6 4
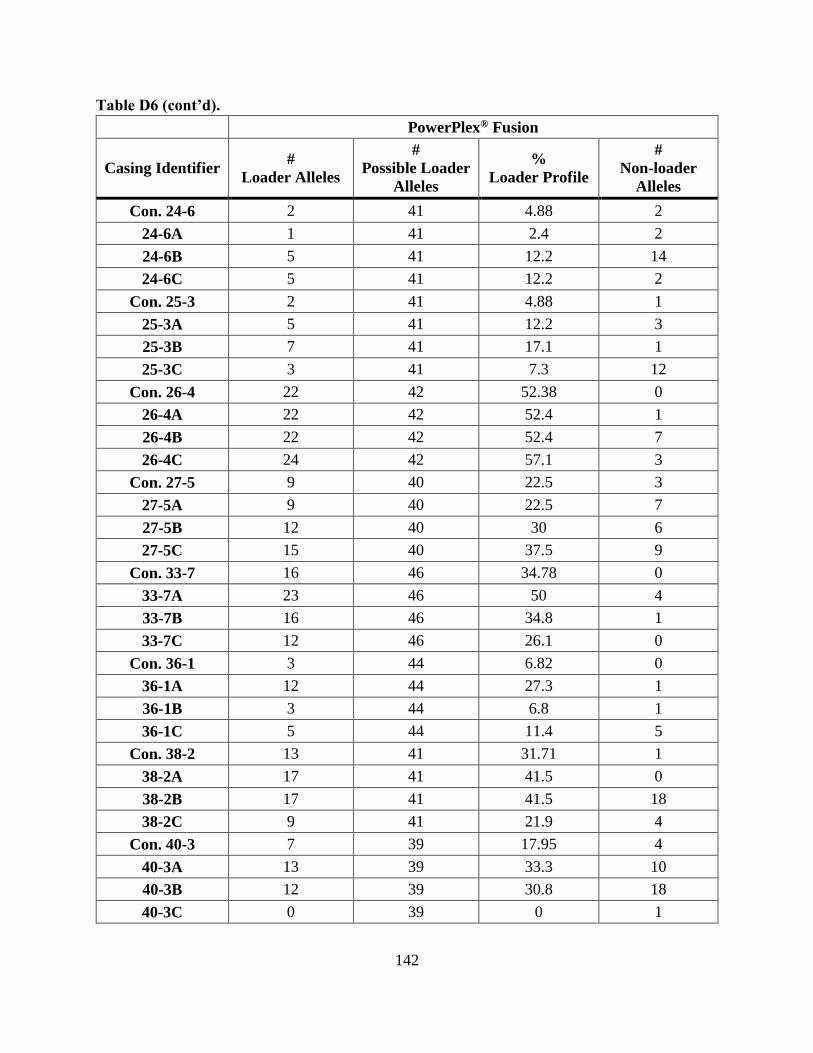
142
Table D6 (cont’d).
PowerPlex® Fusion
Casing Identifier #
Loader Alleles
#
Possible Loader
Alleles
%
Loader Profile
#
Non-loader
Alleles
Con. 24-6 2 41 4.88 2
24-6A 1 41 2.4 2
24-6B 5 41 12.2 14
24-6C 5 41 12.2 2
Con. 25-3 2 41 4.88 1
25-3A 5 41 12.2 3
25-3B 7 41 17.1 1
25-3C 3 41 7.3 12
Con. 26-4 22 42 52.38 0
26-4A 22 42 52.4 1
26-4B 22 42 52.4 7
26-4C 24 42 57.1 3
Con. 27-5 9 40 22.5 3
27-5A 9 40 22.5 7
27-5B 12 40 30 6
27-5C 15 40 37.5 9
Con. 33-7 16 46 34.78 0
33-7A 23 46 50 4
33-7B 16 46 34.8 1
33-7C 12 46 26.1 0
Con. 36-1 3 44 6.82 0
36-1A 12 44 27.3 1
36-1B 3 44 6.8 1
36-1C 5 44 11.4 5
Con. 38-2 13 41 31.71 1
38-2A 17 41 41.5 0
38-2B 17 41 41.5 18
38-2C 9 41 21.9 4
Con. 40-3 7 39 17.95 4
40-3A 13 39 33.3 10
40-3B 12 39 30.8 18
40-3C 0 39 0 1
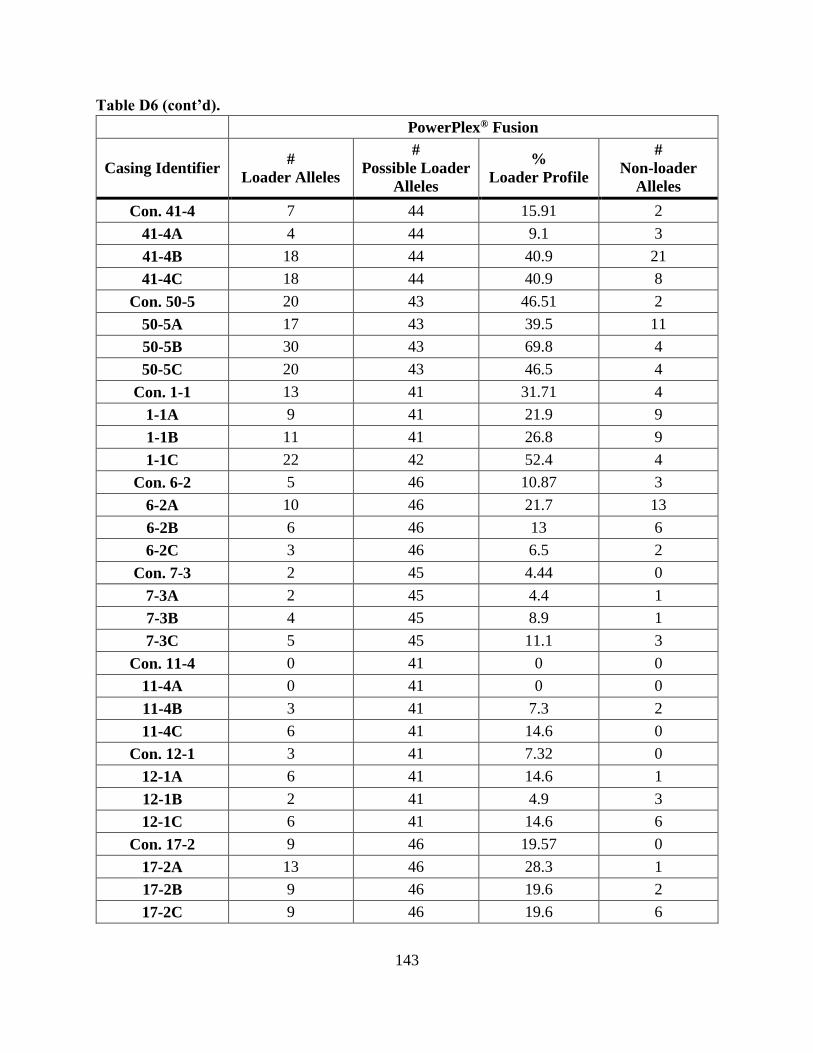
143
Table D6 (cont’d).
PowerPlex® Fusion
Casing Identifier #
Loader Alleles
#
Possible Loader
Alleles
%
Loader Profile
#
Non-loader
Alleles
Con. 41-4 7 44 15.91 2
41-4A 4 44 9.1 3
41-4B 18 44 40.9 21
41-4C 18 44 40.9 8
Con. 50-5 20 43 46.51 2
50-5A 17 43 39.5 11
50-5B 30 43 69.8 4
50-5C 20 43 46.5 4
Con. 1-1 13 41 31.71 4
1-1A 9 41 21.9 9
1-1B 11 41 26.8 9
1-1C 22 42 52.4 4
Con. 6-2 5 46 10.87 3
6-2A 10 46 21.7 13
6-2B 6 46 13 6
6-2C 3 46 6.5 2
Con. 7-3 2 45 4.44 0
7-3A 2 45 4.4 1
7-3B 4 45 8.9 1
7-3C 5 45 11.1 3
Con. 11-4 0 41 0 0
11-4A 0 41 0 0
11-4B 3 41 7.3 2
11-4C 6 41 14.6 0
Con. 12-1 3 41 7.32 0
12-1A 6 41 14.6 1
12-1B 2 41 4.9 3
12-1C 6 41 14.6 6
Con. 17-2 9 46 19.57 0
17-2A 13 46 28.3 1
17-2B 9 46 19.6 2
17-2C 9 46 19.6 6
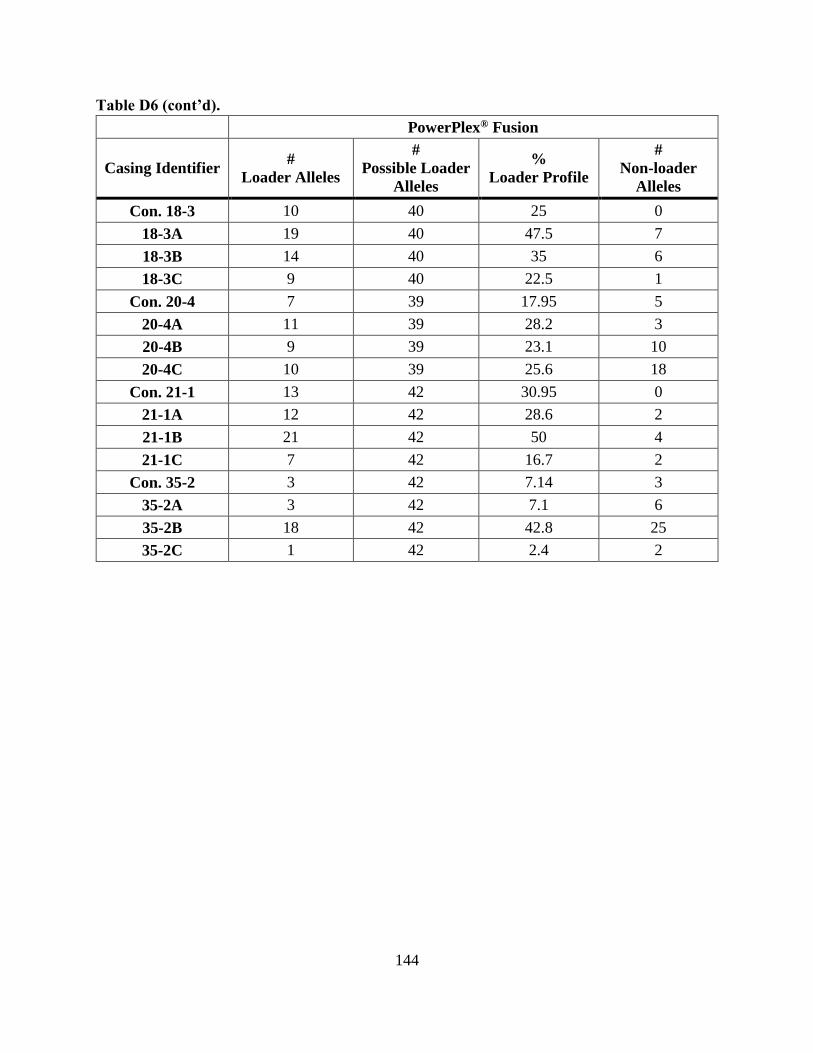
144
Table D6 (cont’d).
PowerPlex® Fusion
Casing Identifier #
Loader Alleles
#
Possible Loader
Alleles
%
Loader Profile
#
Non-loader
Alleles
Con. 18-3 10 40 25 0
18-3A 19 40 47.5 7
18-3B 14 40 35 6
18-3C 9 40 22.5 1
Con. 20-4 7 39 17.95 5
20-4A 11 39 28.2 3
20-4B 9 39 23.1 10
20-4C 10 39 25.6 18
Con. 21-1 13 42 30.95 0
21-1A 12 42 28.6 2
21-1B 21 42 50 4
21-1C 7 42 16.7 2
Con. 35-2 3 42 7.14 3
35-2A 3 42 7.1 6
35-2B 18 42 42.8 25
35-2C 1 42 2.4 2
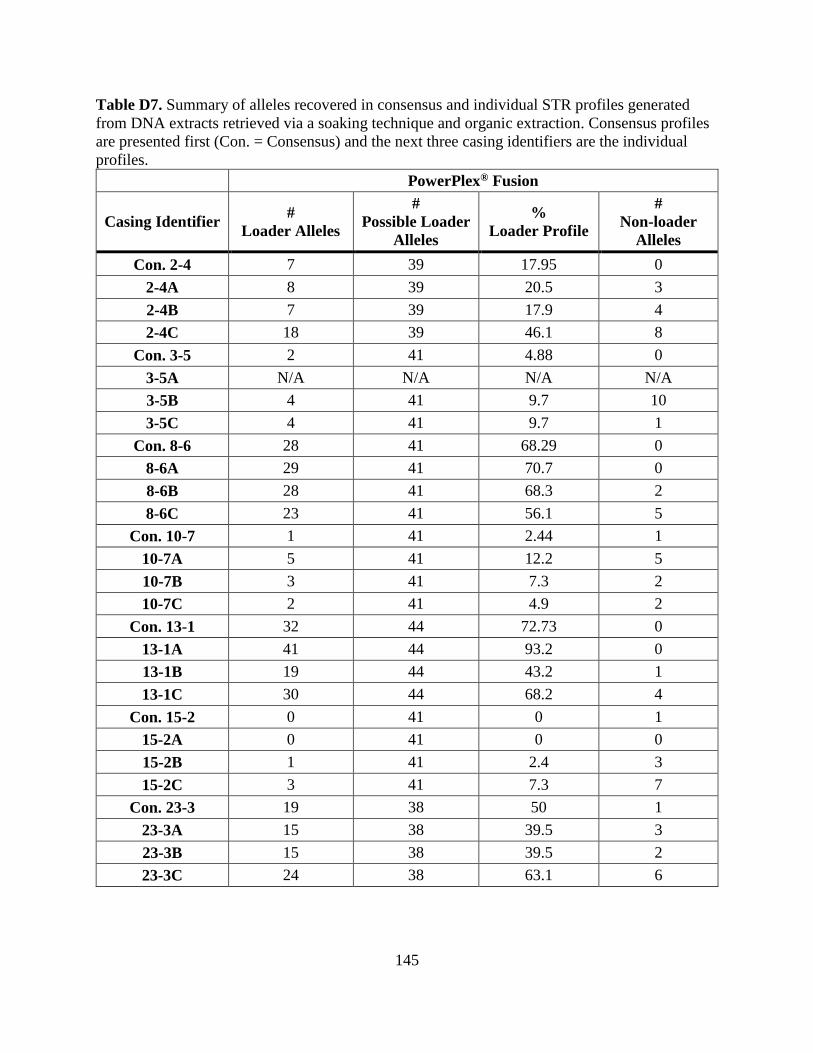
145
Table D7. Summary of alleles recovered in consensus and individual STR profiles generated
from DNA extracts retrieved via a soaking technique and organic extraction. Consensus profiles
are presented first (Con. = Consensus) and the next three casing identifiers are the individual
profiles.
PowerPlex® Fusion
Casing Identifier #
Loader Alleles
#
Possible Loader
Alleles
%
Loader Profile
#
Non-loader
Alleles
Con. 2-4 7 39 17.95 0
2-4A 8 39 20.5 3
2-4B 7 39 17.9 4
2-4C 18 39 46.1 8
Con. 3-5 2 41 4.88 0
3-5A N/A N/A N/A N/A
3-5B 4 41 9.7 10
3-5C 4 41 9.7 1
Con. 8-6 28 41 68.29 0
8-6A 29 41 70.7 0
8-6B 28 41 68.3 2
8-6C 23 41 56.1 5
Con. 10-7 1 41 2.44 1
10-7A 5 41 12.2 5
10-7B 3 41 7.3 2
10-7C 2 41 4.9 2
Con. 13-1 32 44 72.73 0
13-1A 41 44 93.2 0
13-1B 19 44 43.2 1
13-1C 30 44 68.2 4
Con. 15-2 0 41 0 1
15-2A 0 41 0 0
15-2B 1 41 2.4 3
15-2C 3 41 7.3 7
Con. 23-3 19 38 50 1
23-3A 15 38 39.5 3
23-3B 15 38 39.5 2
23-3C 24 38 63.1 6
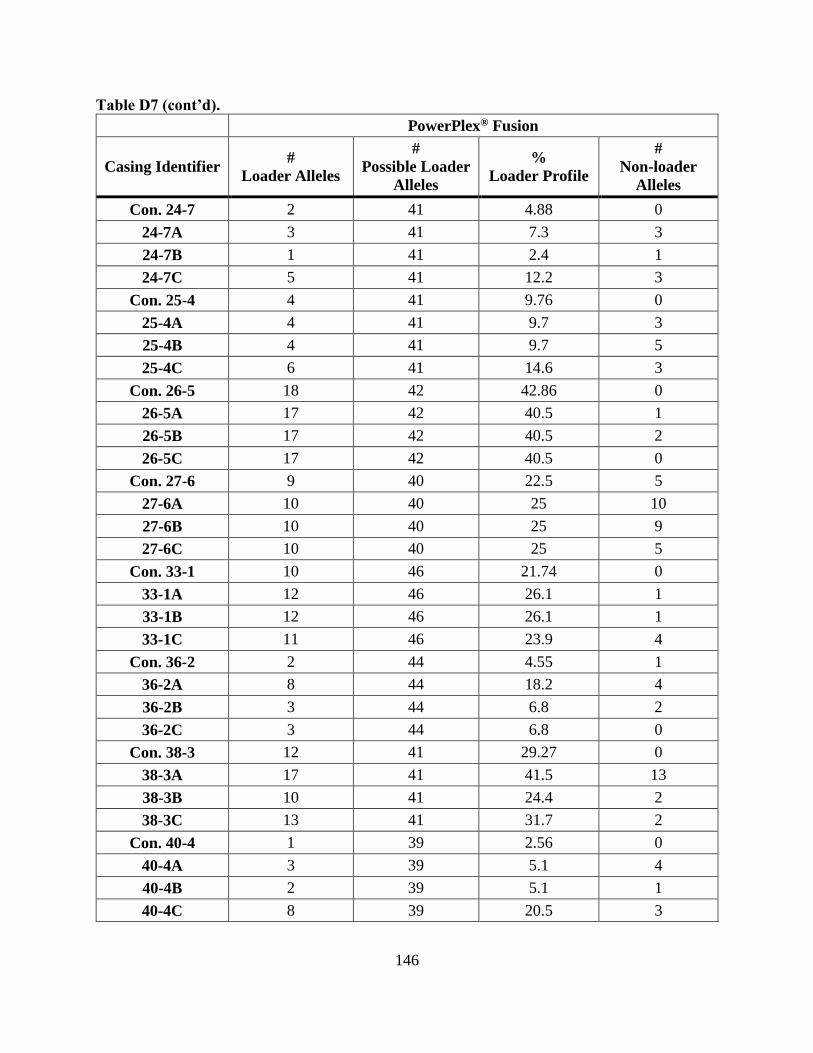
146
Table D7 (cont’d).
PowerPlex® Fusion
Casing Identifier #
Loader Alleles
#
Possible Loader
Alleles
%
Loader Profile
#
Non-loader
Alleles
Con. 24-7 2 41 4.88 0
24-7A 3 41 7.3 3
24-7B 1 41 2.4 1
24-7C 5 41 12.2 3
Con. 25-4 4 41 9.76 0
25-4A 4 41 9.7 3
25-4B 4 41 9.7 5
25-4C 6 41 14.6 3
Con. 26-5 18 42 42.86 0
26-5A 17 42 40.5 1
26-5B 17 42 40.5 2
26-5C 17 42 40.5 0
Con. 27-6 9 40 22.5 5
27-6A 10 40 25 10
27-6B 10 40 25 9
27-6C 10 40 25 5
Con. 33-1 10 46 21.74 0
33-1A 12 46 26.1 1
33-1B 12 46 26.1 1
33-1C 11 46 23.9 4
Con. 36-2 2 44 4.55 1
36-2A 8 44 18.2 4
36-2B 3 44 6.8 2
36-2C 3 44 6.8 0
Con. 38-3 12 41 29.27 0
38-3A 17 41 41.5 13
38-3B 10 41 24.4 2
38-3C 13 41 31.7 2
Con. 40-4 1 39 2.56 0
40-4A 3 39 5.1 4
40-4B 2 39 5.1 1
40-4C 8 39 20.5 3
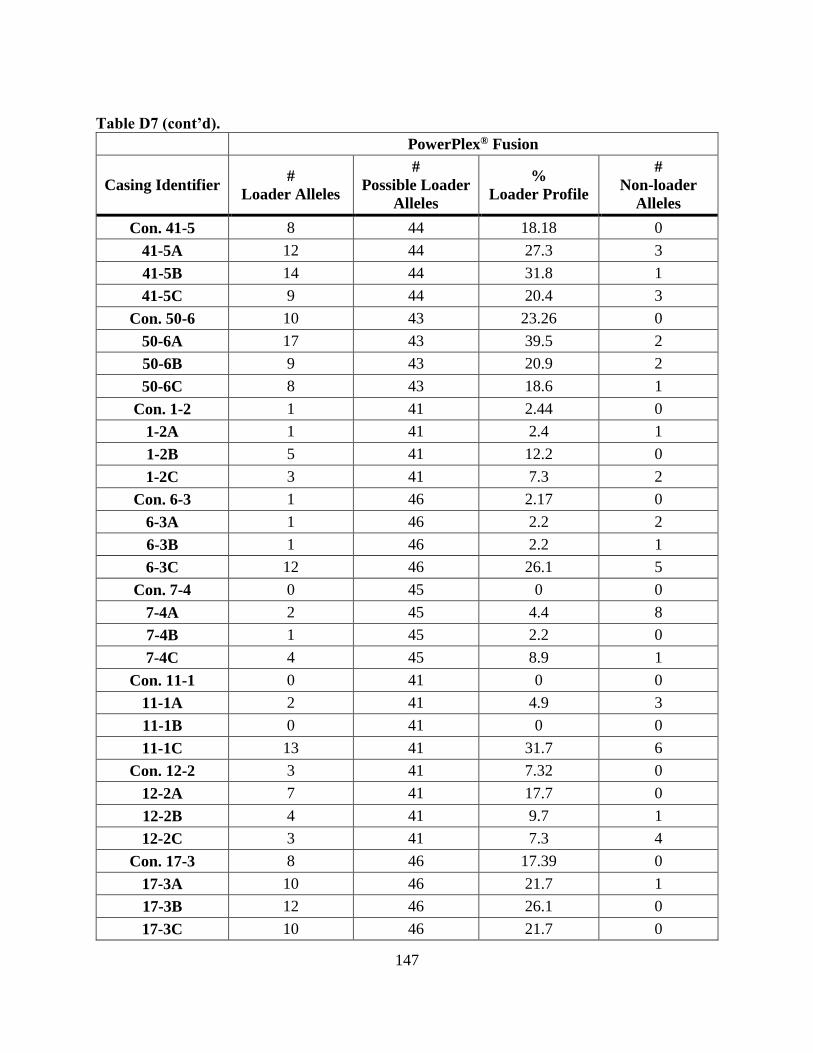
147
Table D7 (cont’d).
PowerPlex® Fusion
Casing Identifier #
Loader Alleles
#
Possible Loader
Alleles
%
Loader Profile
#
Non-loader
Alleles
Con. 41-5 8 44 18.18 0
41-5A 12 44 27.3 3
41-5B 14 44 31.8 1
41-5C 9 44 20.4 3
Con. 50-6 10 43 23.26 0
50-6A 17 43 39.5 2
50-6B 9 43 20.9 2
50-6C 8 43 18.6 1
Con. 1-2 1 41 2.44 0
1-2A 1 41 2.4 1
1-2B 5 41 12.2 0
1-2C 3 41 7.3 2
Con. 6-3 1 46 2.17 0
6-3A 1 46 2.2 2
6-3B 1 46 2.2 1
6-3C 12 46 26.1 5
Con. 7-4 0 45 0 0
7-4A 2 45 4.4 8
7-4B 1 45 2.2 0
7-4C 4 45 8.9 1
Con. 11-1 0 41 0 0
11-1A 2 41 4.9 3
11-1B 0 41 0 0
11-1C 13 41 31.7 6
Con. 12-2 3 41 7.32 0
12-2A 7 41 17.7 0
12-2B 4 41 9.7 1
12-2C 3 41 7.3 4
Con. 17-3 8 46 17.39 0
17-3A 10 46 21.7 1
17-3B 12 46 26.1 0
17-3C 10 46 21.7 0
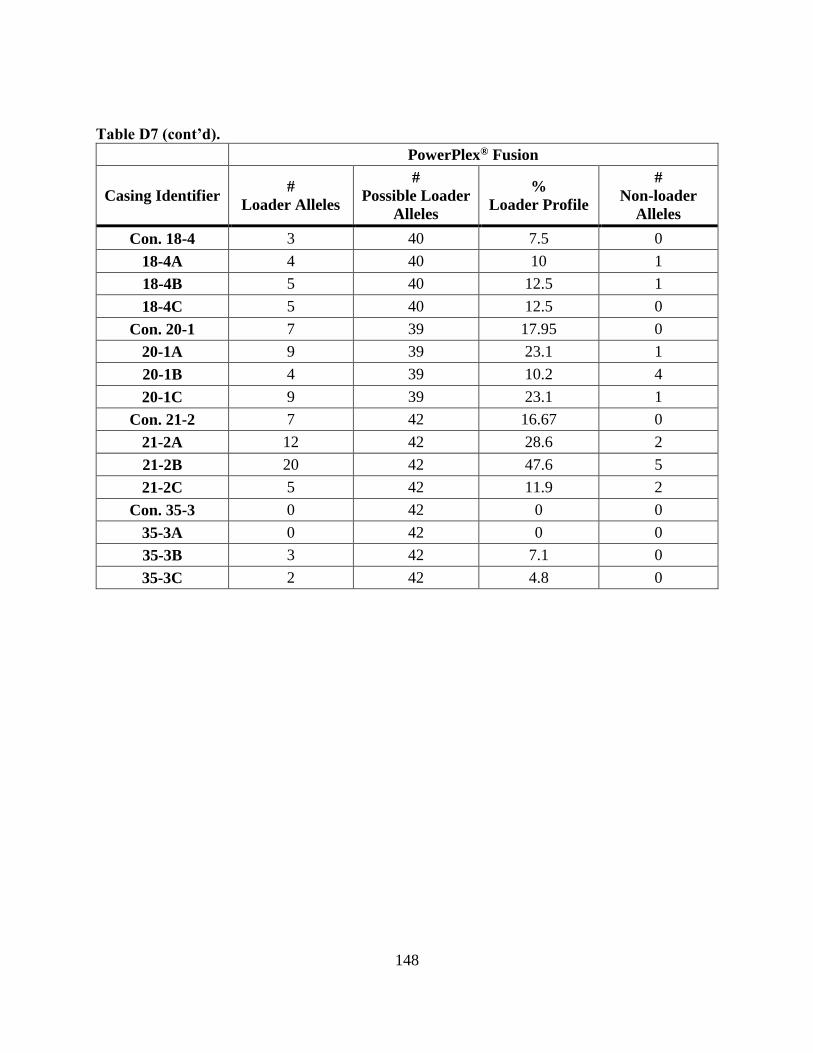
148
Table D7 (cont’d).
PowerPlex® Fusion
Casing Identifier #
Loader Alleles
#
Possible Loader
Alleles
%
Loader Profile
#
Non-loader
Alleles
Con. 18-4 3 40 7.5 0
18-4A 4 40 10 1
18-4B 5 40 12.5 1
18-4C 5 40 12.5 0
Con. 20-1 7 39 17.95 0
20-1A 9 39 23.1 1
20-1B 4 39 10.2 4
20-1C 9 39 23.1 1
Con. 21-2 7 42 16.67 0
21-2A 12 42 28.6 2
21-2B 20 42 47.6 5
21-2C 5 42 11.9 2
Con. 35-3 0 42 0 0
35-3A 0 42 0 0
35-3B 3 42 7.1 0
35-3C 2 42 4.8 0
149
APPENDIX E. POWERPLEX® FUSION STR PROFILES6,7
Red = non-loader allele
Italicized = allele is consistent with the loader but could have originated from the previous
loader
* = non-loader allele could have originated from the previous loader
† = off-ladder allele (each † symbol represents a different off-ladder allele)
N/A = not applicable
Blank = no alleles recovered at that locus
The cell recovery and DNA extraction method utilized to recover and extract DNAs from spent
cartridge casings is denoted with one of the following letters:
A = double swab + organic extraction
B = soak + organic extraction
C = double swab + QIAamp® extraction
D = soak + QIAamp® extraction
E = single swab + FDF® extractions
6 Two magazines were alternated among loaders in Collection 3, therefore two sets of STR profiles are presented for
each volunteer from that collection. first set (blue) = alleles italicized/asterisk based on the loader immediately prior
(contamination from firearm); second set (green) = alleles italicized/asterisk based on the preceding magazine loader
(contamination from magazine) 7Volunteer P = 1st to load & fire the pistol; Thus, profiles from P were compared to vol. DD (owner of the firearm).
Volunteer KK = 1st to load the 2nd magazine; Thus, profiles from KK were only compared to the immediately prior
loader.
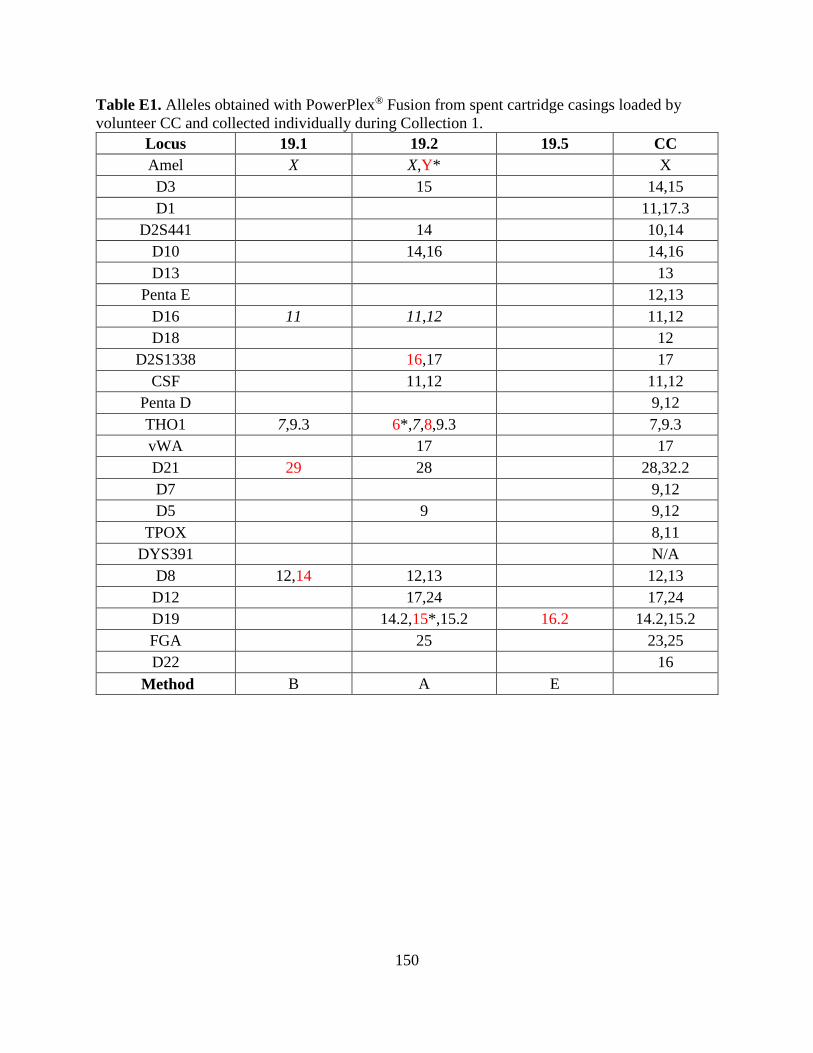
150
Table E1. Alleles obtained with PowerPlex® Fusion from spent cartridge casings loaded by
volunteer CC and collected individually during Collection 1.
Locus 19.1 19.2 19.5 CC
Amel X X,Y* X
D3 15 14,15
D1 11,17.3
D2S441 14 10,14
D10 14,16 14,16
D13 13
Penta E 12,13
D16 11 11,12 11,12
D18 12
D2S1338 16,17 17
CSF 11,12 11,12
Penta D 9,12
THO1 7,9.3 6*,7,8,9.3 7,9.3
vWA 17 17
D21 29 28 28,32.2
D7 9,12
D5 9 9,12
TPOX 8,11
DYS391 N/A
D8 12,14 12,13 12,13
D12 17,24 17,24
D19 14.2,15*,15.2 16.2 14.2,15.2
FGA 25 23,25
D22 16
Method B A E
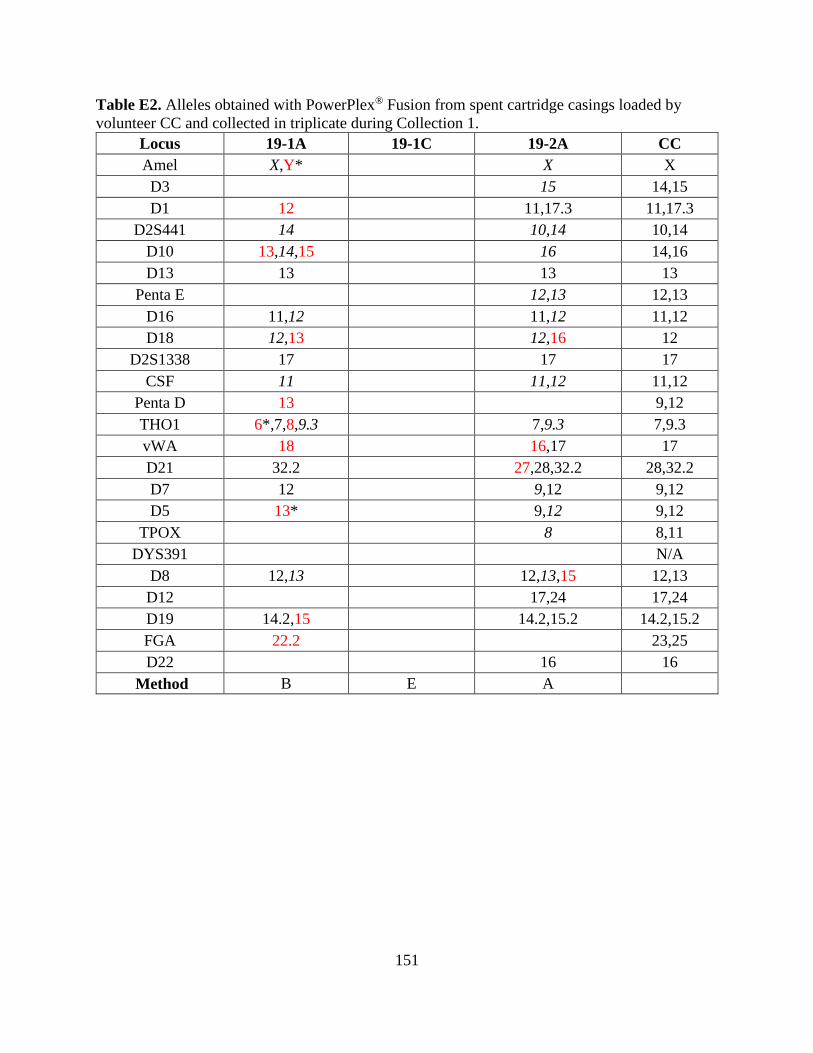
151
Table E2. Alleles obtained with PowerPlex® Fusion from spent cartridge casings loaded by
volunteer CC and collected in triplicate during Collection 1.
Locus 19-1A 19-1C 19-2A CC
Amel X,Y* X X
D3 15 14,15
D1 12 11,17.3 11,17.3
D2S441 14 10,14 10,14
D10 13,14,15 16 14,16
D13 13 13 13
Penta E 12,13 12,13
D16 11,12 11,12 11,12
D18 12,13 12,16 12
D2S1338 17 17 17
CSF 11 11,12 11,12
Penta D 13 9,12
THO1 6*,7,8,9.3 7,9.3 7,9.3
vWA 18 16,17 17
D21 32.2 27,28,32.2 28,32.2
D7 12 9,12 9,12
D5 13* 9,12 9,12
TPOX 8 8,11
DYS391 N/A
D8 12,13 12,13,15 12,13
D12 17,24 17,24
D19 14.2,15 14.2,15.2 14.2,15.2
FGA 22.2 23,25
D22 16 16
Method B E A
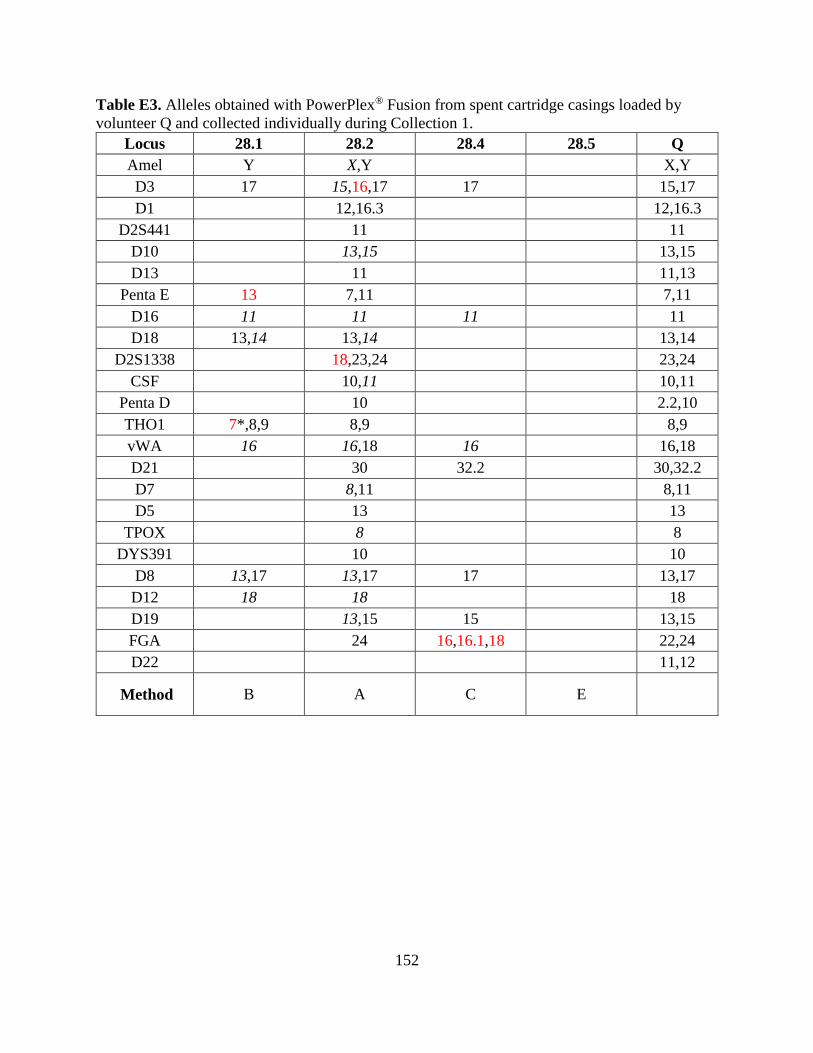
152
Table E3. Alleles obtained with PowerPlex® Fusion from spent cartridge casings loaded by
volunteer Q and collected individually during Collection 1.
Locus 28.1 28.2 28.4 28.5 Q
Amel Y X,Y X,Y
D3 17 15,16,17 17 15,17
D1 12,16.3 12,16.3
D2S441 11 11
D10 13,15 13,15
D13 11 11,13
Penta E 13 7,11 7,11
D16 11 11 11 11
D18 13,14 13,14 13,14
D2S1338 18,23,24 23,24
CSF 10,11 10,11
Penta D 10 2.2,10
THO1 7*,8,9 8,9 8,9
vWA 16 16,18 16 16,18
D21 30 32.2 30,32.2
D7 8,11 8,11
D5 13 13
TPOX 8 8
DYS391 10 10
D8 13,17 13,17 17 13,17
D12 18 18 18
D19 13,15 15 13,15
FGA 24 16,16.1,18 22,24
D22 11,12
Method B A C E
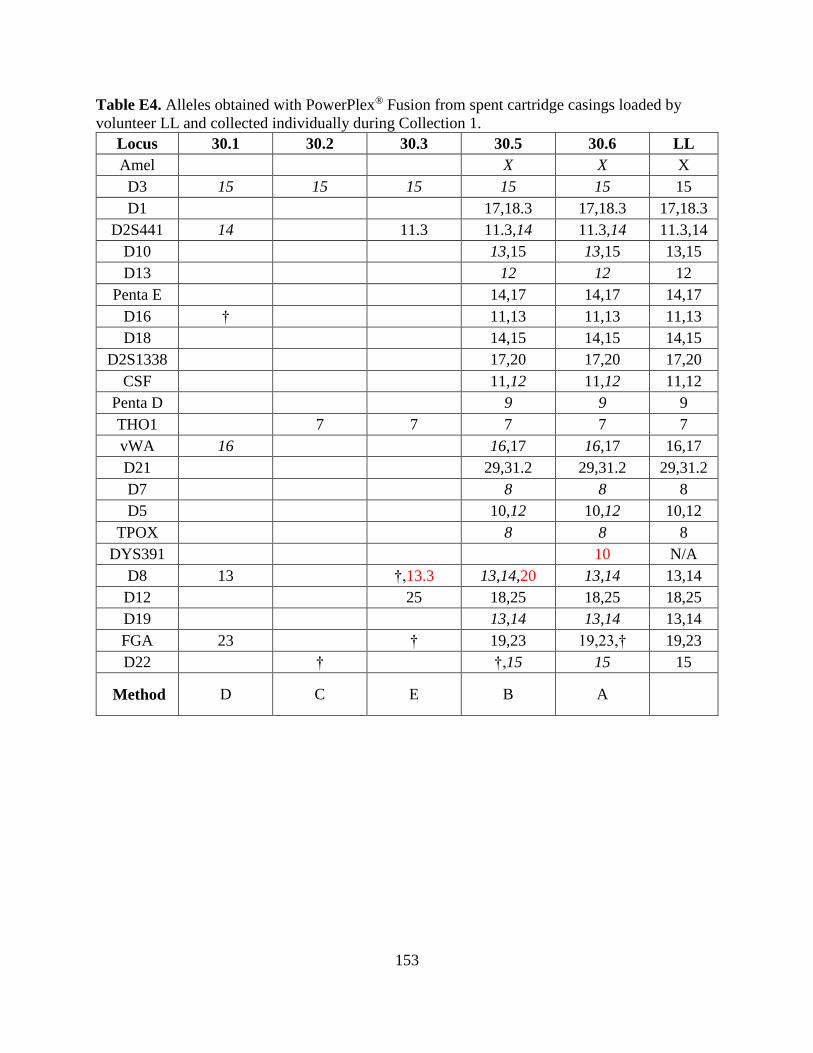
153
Table E4. Alleles obtained with PowerPlex® Fusion from spent cartridge casings loaded by
volunteer LL and collected individually during Collection 1.
Locus 30.1 30.2 30.3 30.5 30.6 LL
Amel X X X
D3 15 15 15 15 15 15
D1 17,18.3 17,18.3 17,18.3
D2S441 14 11.3 11.3,14 11.3,14 11.3,14
D10 13,15 13,15 13,15
D13 12 12 12
Penta E 14,17 14,17 14,17
D16 † 11,13 11,13 11,13
D18 14,15 14,15 14,15
D2S1338 17,20 17,20 17,20
CSF 11,12 11,12 11,12
Penta D 9 9 9
THO1 7 7 7 7 7
vWA 16 16,17 16,17 16,17
D21 29,31.2 29,31.2 29,31.2
D7 8 8 8
D5 10,12 10,12 10,12
TPOX 8 8 8
DYS391 10 N/A
D8 13 †,13.3 13,14,20 13,14 13,14
D12 25 18,25 18,25 18,25
D19 13,14 13,14 13,14
FGA 23 † 19,23 19,23,† 19,23
D22 † †,15 15 15
Method D C E B A
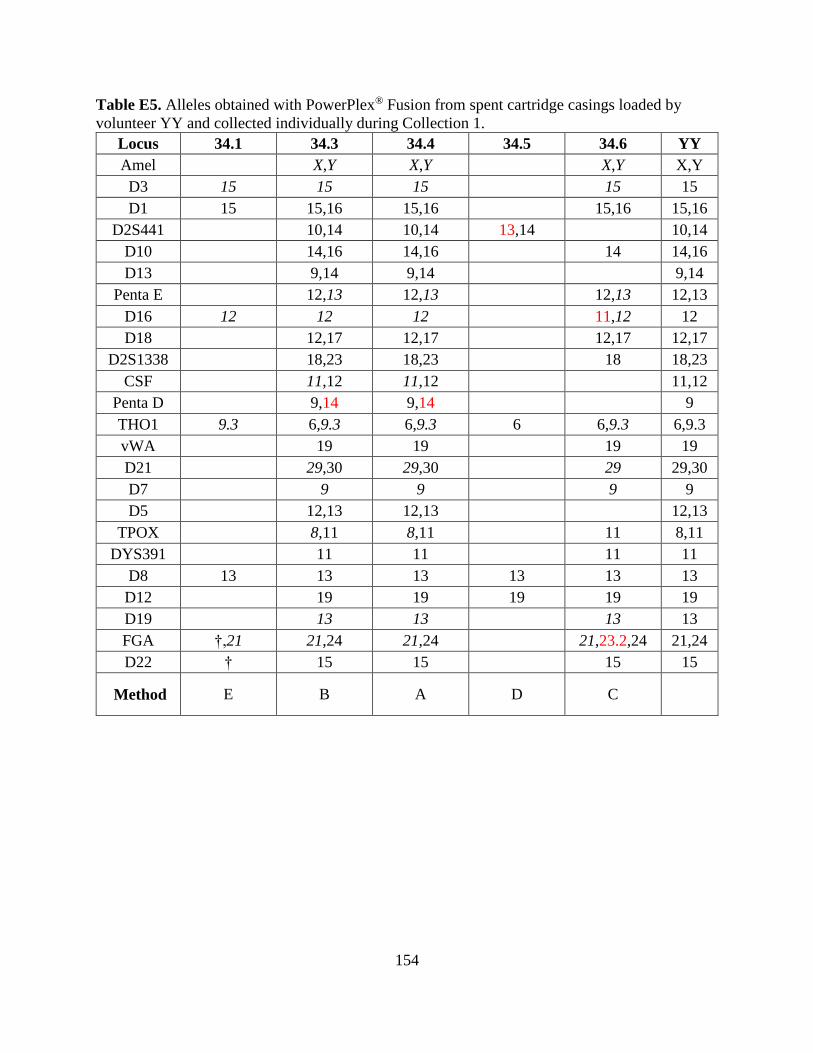
154
Table E5. Alleles obtained with PowerPlex® Fusion from spent cartridge casings loaded by
volunteer YY and collected individually during Collection 1.
Locus 34.1 34.3 34.4 34.5 34.6 YY
Amel X,Y X,Y X,Y X,Y
D3 15 15 15 15 15
D1 15 15,16 15,16 15,16 15,16
D2S441 10,14 10,14 13,14 10,14
D10 14,16 14,16 14 14,16
D13 9,14 9,14 9,14
Penta E 12,13 12,13 12,13 12,13
D16 12 12 12 11,12 12
D18 12,17 12,17 12,17 12,17
D2S1338 18,23 18,23 18 18,23
CSF 11,12 11,12 11,12
Penta D 9,14 9,14 9
THO1 9.3 6,9.3 6,9.3 6 6,9.3 6,9.3
vWA 19 19 19 19
D21 29,30 29,30 29 29,30
D7 9 9 9 9
D5 12,13 12,13 12,13
TPOX 8,11 8,11 11 8,11
DYS391 11 11 11 11
D8 13 13 13 13 13 13
D12 19 19 19 19 19
D19 13 13 13 13
FGA †,21 21,24 21,24 21,23.2,24 21,24
D22 † 15 15 15 15
Method E B A D C
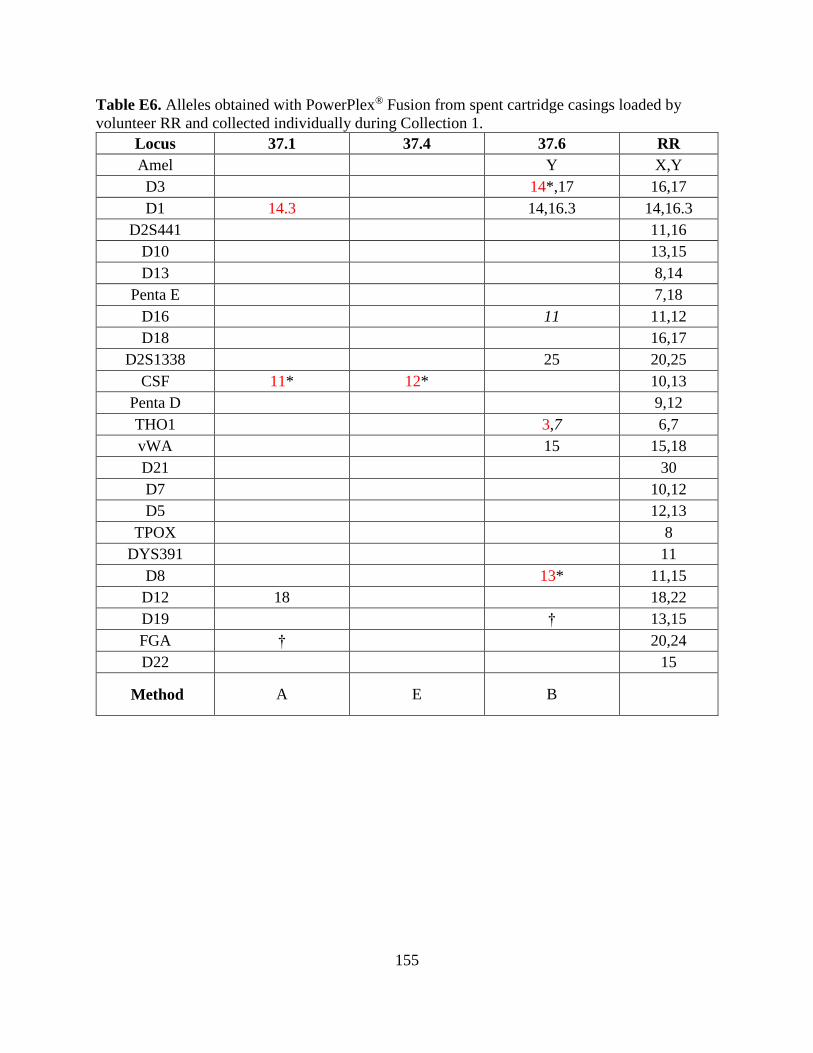
155
Table E6. Alleles obtained with PowerPlex® Fusion from spent cartridge casings loaded by
volunteer RR and collected individually during Collection 1.
Locus 37.1 37.4 37.6 RR
Amel Y X,Y
D3 14*,17 16,17
D1 14.3 14,16.3 14,16.3
D2S441 11,16
D10 13,15
D13 8,14
Penta E 7,18
D16 11 11,12
D18 16,17
D2S1338 25 20,25
CSF 11* 12* 10,13
Penta D 9,12
THO1 3,7 6,7
vWA 15 15,18
D21 30
D7 10,12
D5 12,13
TPOX 8
DYS391 11
D8 13* 11,15
D12 18 18,22
D19 † 13,15
FGA † 20,24
D22 15
Method A E B
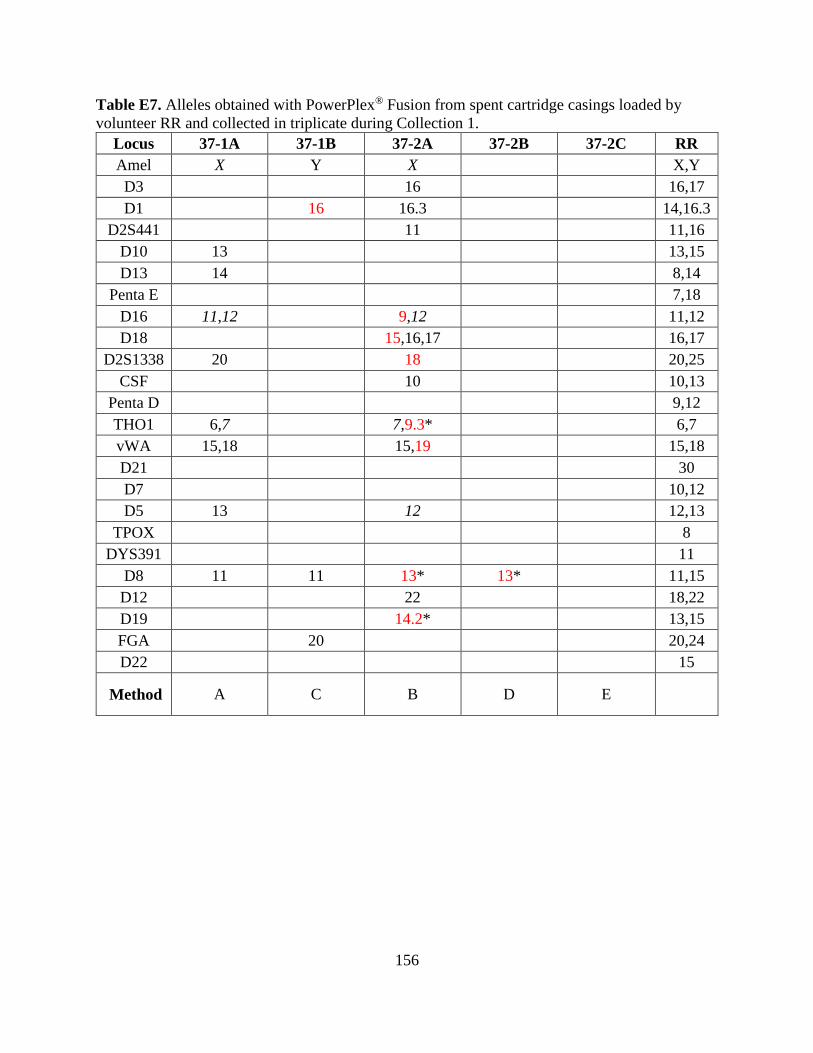
156
Table E7. Alleles obtained with PowerPlex® Fusion from spent cartridge casings loaded by
volunteer RR and collected in triplicate during Collection 1.
Locus 37-1A 37-1B 37-2A 37-2B 37-2C RR
Amel X Y X X,Y
D3 16 16,17
D1 16 16.3 14,16.3
D2S441 11 11,16
D10 13 13,15
D13 14 8,14
Penta E 7,18
D16 11,12 9,12 11,12
D18 15,16,17 16,17
D2S1338 20 18 20,25
CSF 10 10,13
Penta D 9,12
THO1 6,7 7,9.3* 6,7
vWA 15,18 15,19 15,18
D21 30
D7 10,12
D5 13 12 12,13
TPOX 8
DYS391 11
D8 11 11 13* 13* 11,15
D12 22 18,22
D19 14.2* 13,15
FGA 20 20,24
D22 15
Method A C B D E
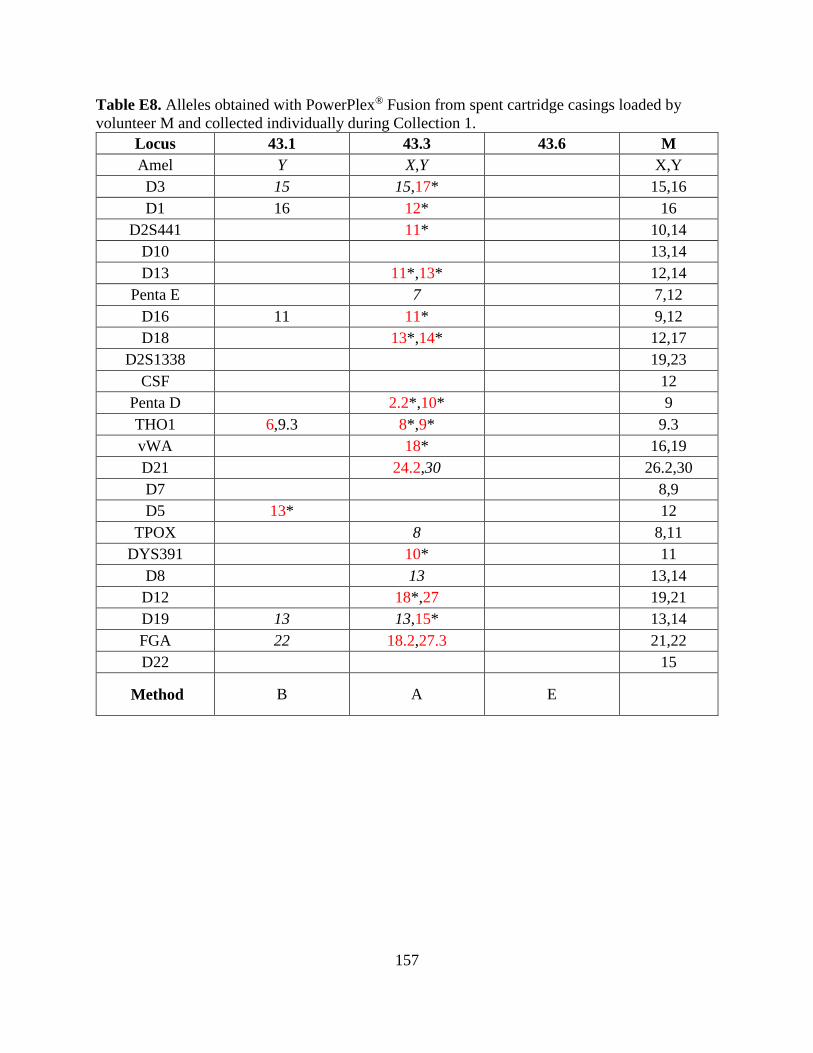
157
Table E8. Alleles obtained with PowerPlex® Fusion from spent cartridge casings loaded by
volunteer M and collected individually during Collection 1.
Locus 43.1 43.3 43.6 M
Amel Y X,Y X,Y
D3 15 15,17* 15,16
D1 16 12* 16
D2S441 11* 10,14
D10 13,14
D13 11*,13* 12,14
Penta E 7 7,12
D16 11 11* 9,12
D18 13*,14* 12,17
D2S1338 19,23
CSF 12
Penta D 2.2*,10* 9
THO1 6,9.3 8*,9* 9.3
vWA 18* 16,19
D21 24.2,30 26.2,30
D7 8,9
D5 13* 12
TPOX 8 8,11
DYS391 10* 11
D8 13 13,14
D12 18*,27 19,21
D19 13 13,15* 13,14
FGA 22 18.2,27.3 21,22
D22 15
Method B A E
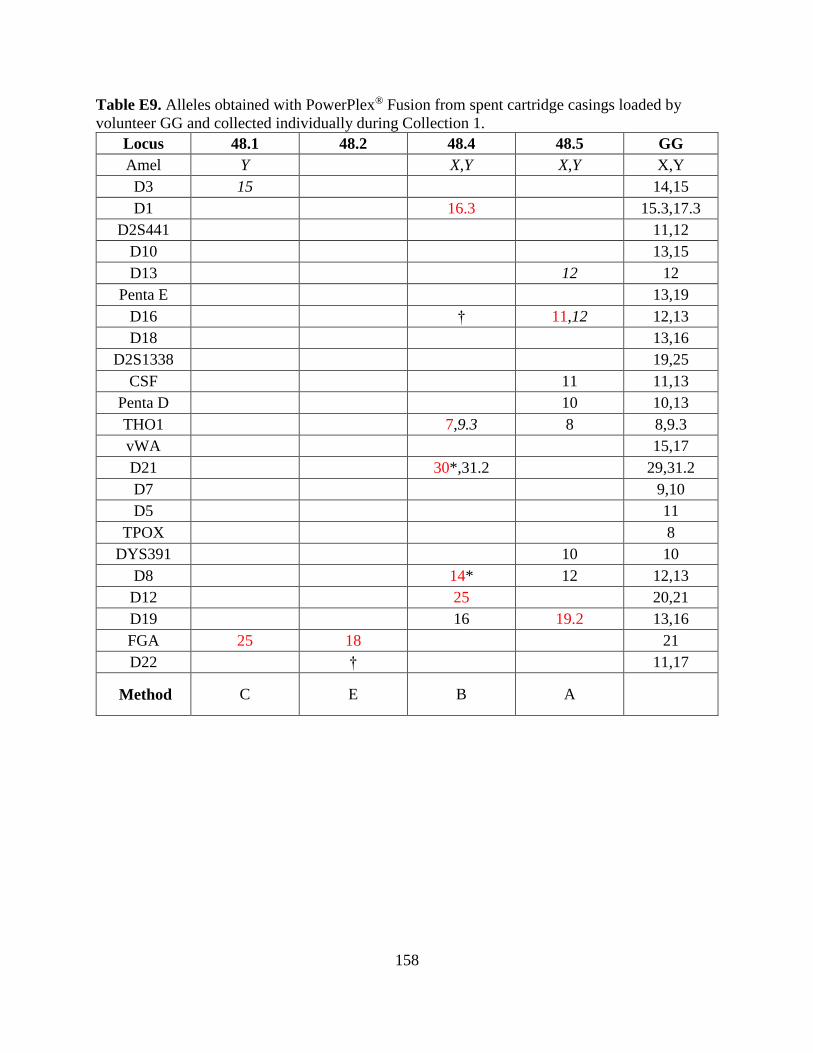
158
Table E9. Alleles obtained with PowerPlex® Fusion from spent cartridge casings loaded by
volunteer GG and collected individually during Collection 1.
Locus 48.1 48.2 48.4 48.5 GG
Amel Y X,Y X,Y X,Y
D3 15 14,15
D1 16.3 15.3,17.3
D2S441 11,12
D10 13,15
D13 12 12
Penta E 13,19
D16 † 11,12 12,13
D18 13,16
D2S1338 19,25
CSF 11 11,13
Penta D 10 10,13
THO1 7,9.3 8 8,9.3
vWA 15,17
D21 30*,31.2 29,31.2
D7 9,10
D5 11
TPOX 8
DYS391 10 10
D8 14* 12 12,13
D12 25 20,21
D19 16 19.2 13,16
FGA 25 18 21
D22 † 11,17
Method C E B A
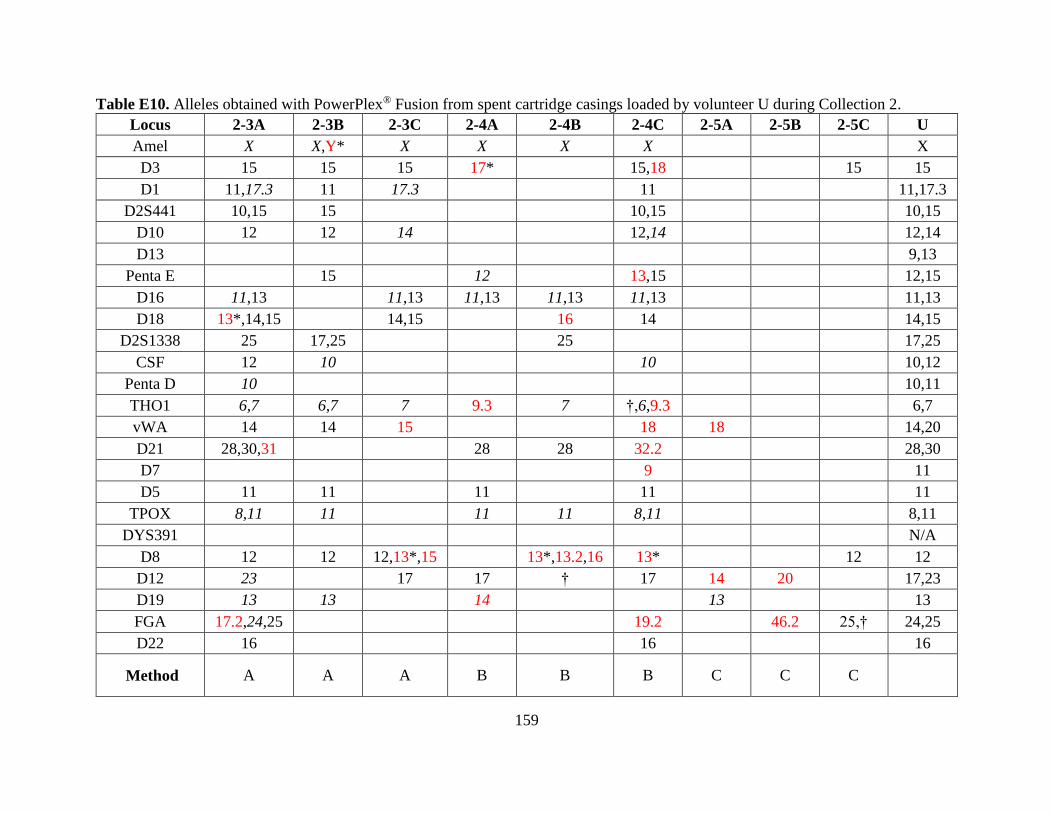
159
Table E10. Alleles obtained with PowerPlex® Fusion from spent cartridge casings loaded by volunteer U during Collection 2.
Locus 2-3A 2-3B 2-3C 2-4A 2-4B 2-4C 2-5A 2-5B 2-5C U
Amel X X,Y* X X X X X
D3 15 15 15 17* 15,18 15 15
D1 11,17.3 11 17.3 11 11,17.3
D2S441 10,15 15 10,15 10,15
D10 12 12 14 12,14 12,14
D13 9,13
Penta E 15 12 13,15 12,15
D16 11,13 11,13 11,13 11,13 11,13 11,13
D18 13*,14,15 14,15 16 14 14,15
D2S1338 25 17,25 25 17,25
CSF 12 10 10 10,12
Penta D 10 10,11
THO1 6,7 6,7 7 9.3 7 †,6,9.3 6,7
vWA 14 14 15 18 18 14,20
D21 28,30,31 28 28 32.2 28,30
D7 9 11
D5 11 11 11 11 11
TPOX 8,11 11 11 11 8,11 8,11
DYS391 N/A
D8 12 12 12,13*,15 13*,13.2,16 13* 12 12
D12 23 17 17 † 17 14 20 17,23
D19 13 13 14 13 13
FGA 17.2,24,25 19.2 46.2 25,† 24,25
D22 16 16 16
Method A A A B B B C C C
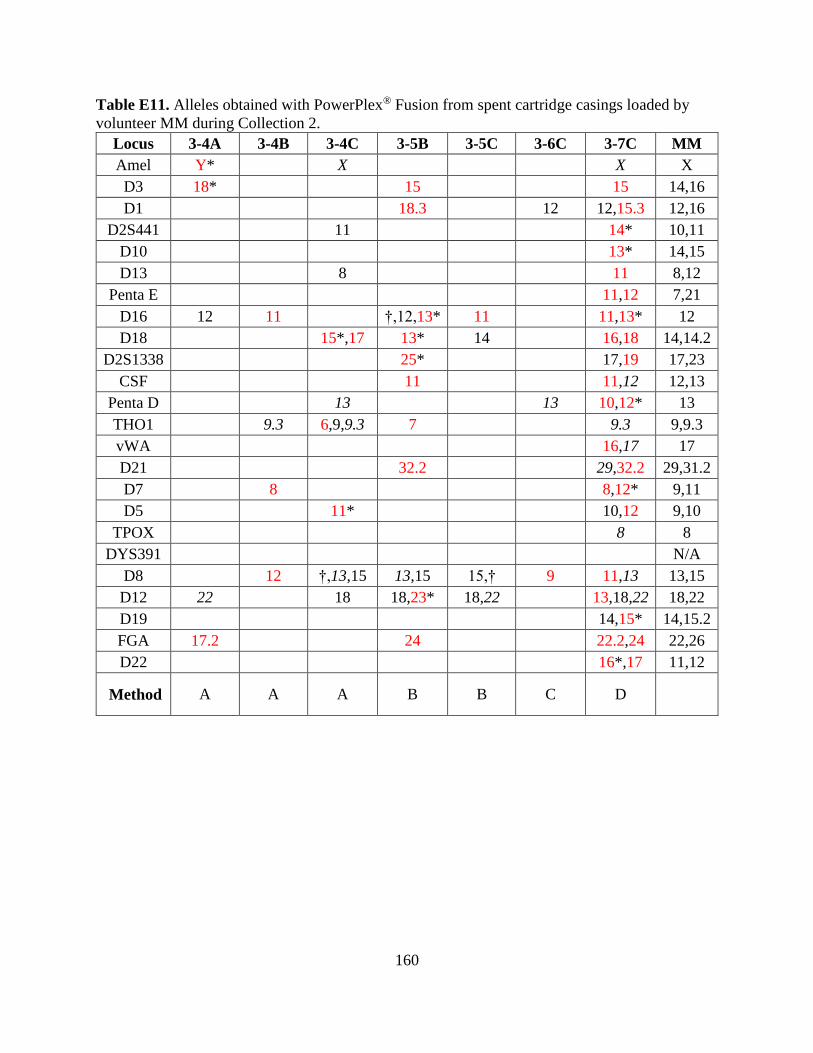
160
Table E11. Alleles obtained with PowerPlex® Fusion from spent cartridge casings loaded by
volunteer MM during Collection 2.
Locus 3-4A 3-4B 3-4C 3-5B 3-5C 3-6C 3-7C MM
Amel Y* X X X
D3 18* 15 15 14,16
D1 18.3 12 12,15.3 12,16
D2S441 11 14* 10,11
D10 13* 14,15
D13 8 11 8,12
Penta E 11,12 7,21
D16 12 11 †,12,13* 11 11,13* 12
D18 15*,17 13* 14 16,18 14,14.2
D2S1338 25* 17,19 17,23
CSF 11 11,12 12,13
Penta D 13 13 10,12* 13
THO1 9.3 6,9,9.3 7 9.3 9,9.3
vWA 16,17 17
D21 32.2 29,32.2 29,31.2
D7 8 8,12* 9,11
D5 11* 10,12 9,10
TPOX 8 8
DYS391 N/A
D8 12 †,13,15 13,15 15,† 9 11,13 13,15
D12 22 18 18,23* 18,22 13,18,22 18,22
D19 14,15* 14,15.2
FGA 17.2 24 22.2,24 22,26
D22 16*,17 11,12
Method A A A B B C D
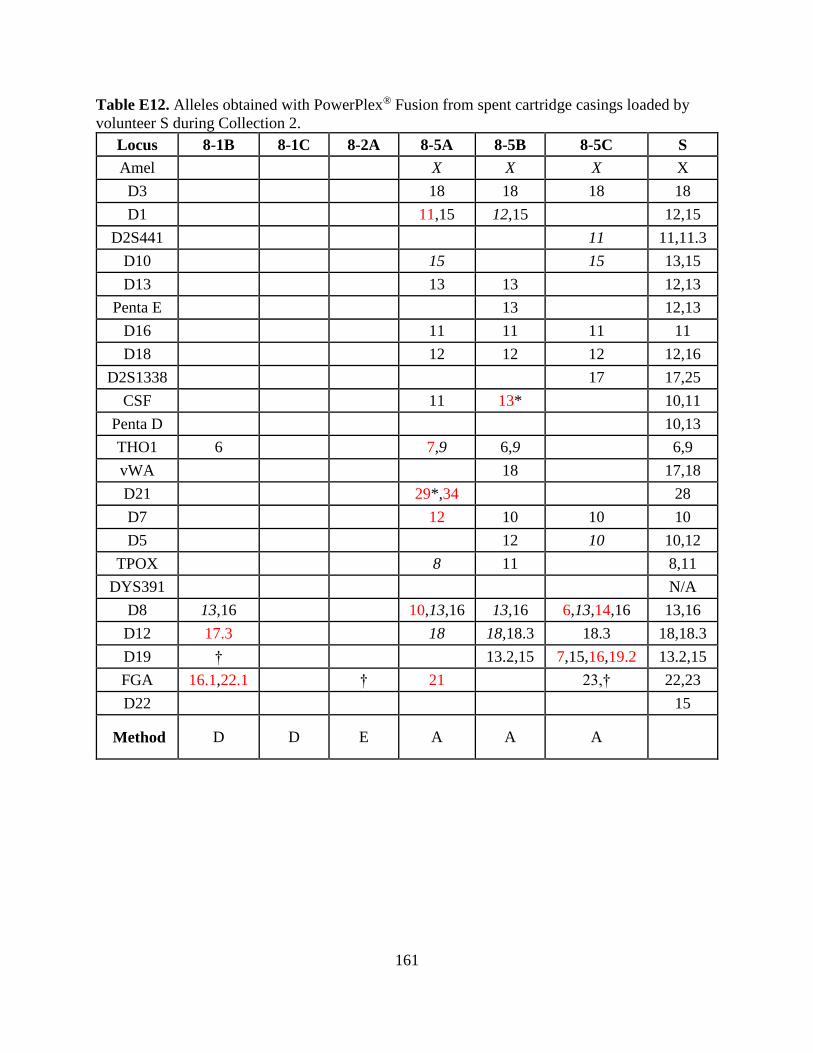
161
Table E12. Alleles obtained with PowerPlex® Fusion from spent cartridge casings loaded by
volunteer S during Collection 2.
Locus 8-1B 8-1C 8-2A 8-5A 8-5B 8-5C S
Amel X X X X
D3 18 18 18 18
D1 11,15 12,15 12,15
D2S441 11 11,11.3
D10 15 15 13,15
D13 13 13 12,13
Penta E 13 12,13
D16 11 11 11 11
D18 12 12 12 12,16
D2S1338 17 17,25
CSF 11 13* 10,11
Penta D 10,13
THO1 6 7,9 6,9 6,9
vWA 18 17,18
D21 29*,34 28
D7 12 10 10 10
D5 12 10 10,12
TPOX 8 11 8,11
DYS391 N/A
D8 13,16 10,13,16 13,16 6,13,14,16 13,16
D12 17.3 18 18,18.3 18.3 18,18.3
D19 † 13.2,15 7,15,16,19.2 13.2,15
FGA 16.1,22.1 † 21 23,† 22,23
D22 15
Method D D E A A A
162
Table E12 (cont’d).
Locus 8-6A 8-6B 8-6C 8-7A 8-7B 8-7C S
Amel X X X X
D3 18 18 18 18
D1 12,15 12,15 12,15 15 12,15
D2S441 11,11.3 11.3 11.3,14 11,11.3
D10 15 15 15 13,15
D13 12 13 12 12 12,13
Penta E 13 12 12,13 12,13
D16 11 11 11 11
D18 12,16 12 12,16 12 16 12,16
D2S1338 17 17,25 17 17,25
CSF 10 10,11 10,11
Penta D 10,13 10 10,13
THO1 6,9 6,9 6 6,9 6,9
vWA 17,18 16,17,18 17,18 17 17,18
D21 28 28,31 28,29* 28
D7 10 10 10 10
D5 10,12 12 10,12
TPOX 8 8,11
DYS391 N/A
D8 13,16 13,16 †,13,16,19 † 13,16
D12 18,18.3 18,18.3 18.3 †,18.3 18,18.3
D19 15 15 13.2,14 † † 13.2,18.2 13.2,15
FGA † 22,23 23,† † † † 22,23
D22 15 15 16 20 15
Method B B B C C C
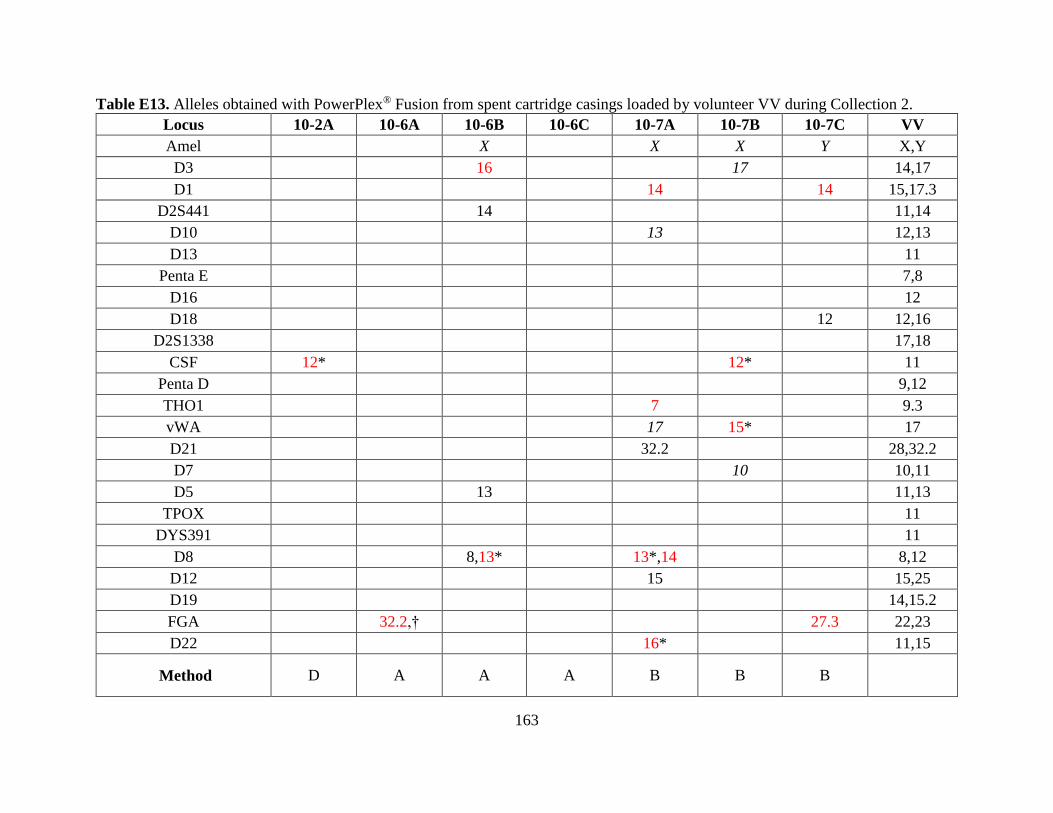
163
Table E13. Alleles obtained with PowerPlex® Fusion from spent cartridge casings loaded by volunteer VV during Collection 2.
Locus 10-2A 10-6A 10-6B 10-6C 10-7A 10-7B 10-7C VV
Amel X X X Y X,Y
D3 16 17 14,17
D1 14 14 15,17.3
D2S441 14 11,14
D10 13 12,13
D13 11
Penta E 7,8
D16 12
D18 12 12,16
D2S1338 17,18
CSF 12* 12* 11
Penta D 9,12
THO1 7 9.3
vWA 17 15* 17
D21 32.2 28,32.2
D7 10 10,11
D5 13 11,13
TPOX 11
DYS391 11
D8 8,13* 13*,14 8,12
D12 15 15,25
D19 14,15.2
FGA 32.2,† 27.3 22,23
D22 16* 11,15
Method D A A A B B B
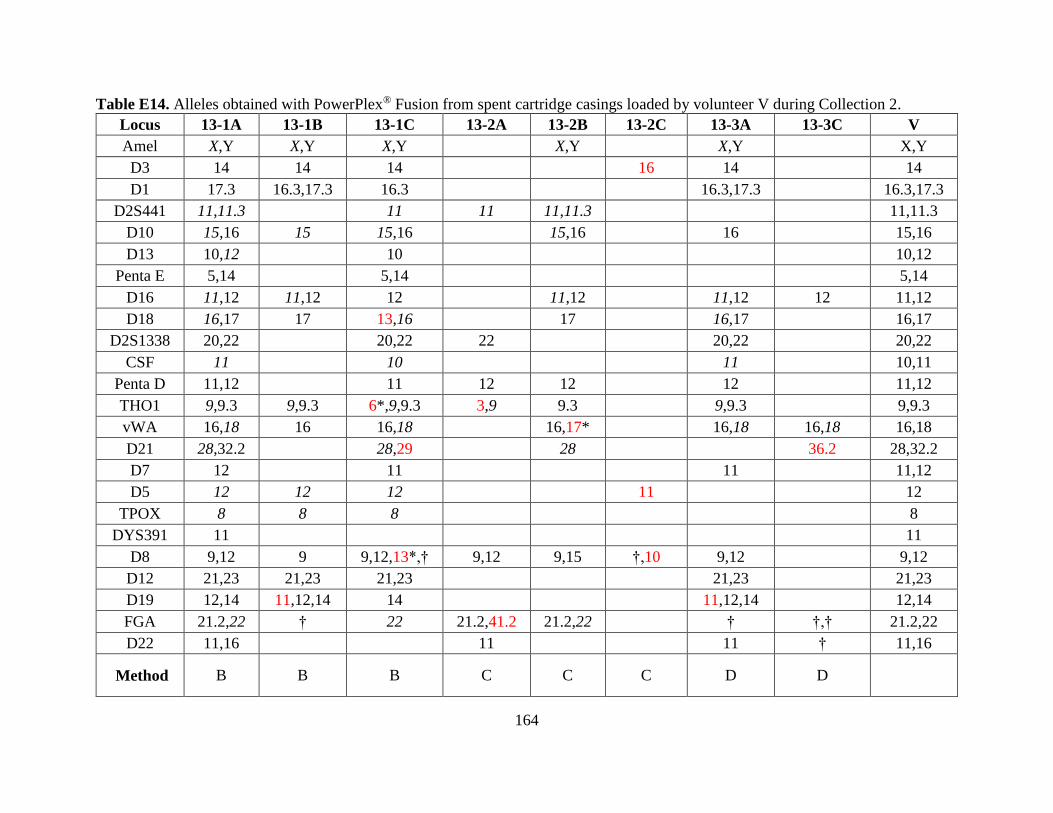
164
Table E14. Alleles obtained with PowerPlex® Fusion from spent cartridge casings loaded by volunteer V during Collection 2.
Locus 13-1A 13-1B 13-1C 13-2A 13-2B 13-2C 13-3A 13-3C V
Amel X,Y X,Y X,Y X,Y X,Y X,Y
D3 14 14 14 16 14 14
D1 17.3 16.3,17.3 16.3 16.3,17.3 16.3,17.3
D2S441 11,11.3 11 11 11,11.3 11,11.3
D10 15,16 15 15,16 15,16 16 15,16
D13 10,12 10 10,12
Penta E 5,14 5,14 5,14
D16 11,12 11,12 12 11,12 11,12 12 11,12
D18 16,17 17 13,16 17 16,17 16,17
D2S1338 20,22 20,22 22 20,22 20,22
CSF 11 10 11 10,11
Penta D 11,12 11 12 12 12 11,12
THO1 9,9.3 9,9.3 6*,9,9.3 3,9 9.3 9,9.3 9,9.3
vWA 16,18 16 16,18 16,17* 16,18 16,18 16,18
D21 28,32.2 28,29 28 36.2 28,32.2
D7 12 11 11 11,12
D5 12 12 12 11 12
TPOX 8 8 8 8
DYS391 11 11
D8 9,12 9 9,12,13*,† 9,12 9,15 †,10 9,12 9,12
D12 21,23 21,23 21,23 21,23 21,23
D19 12,14 11,12,14 14 11,12,14 12,14
FGA 21.2,22 † 22 21.2,41.2 21.2,22 † †,† 21.2,22
D22 11,16 11 11 † 11,16
Method B B B C C C D D
165
Table E14 (cont’d).
Locus 13-7A 13-7B 13-7C V
Amel X,Y X,Y X,Y X,Y
D3 14,18* 14 14 14
D1 16.3,17.3 16.3,17.3 16.3,17.3
D2S441 11,11.3 11,11.3 11,11.3 11,11.3
D10 15,16 15,16 15,16
D13 10 10,12 10,12
Penta E 5,14 5,14 5,14 5,14
D16 11,12 11,12 12 11,12
D18 17 16,17 16,17 16,17
D2S1338 20,22 20,22 20 20,22
CSF 11 10,11 10 10,11
Penta D 12 11,12 12 11,12
THO1 9,9.3 9,9.3 9,9.3 9,9.3
vWA 16,18 16,18 14,17*,18 16,18
D21 28,32.2 28,32.2 28 28,32.2
D7 12 11,12 11,12 11,12
D5 12 12 12
TPOX 8 8
DYS391 11 11 11 11
D8 9,12 9,12 9,12 9,12
D12 20,21,23 21,23 23 21,23
D19 12 12 12,14
FGA 22 21.2,22 22,23*,32.2 21.2,22
D22 11,16 11,16 11,16
Method A A A
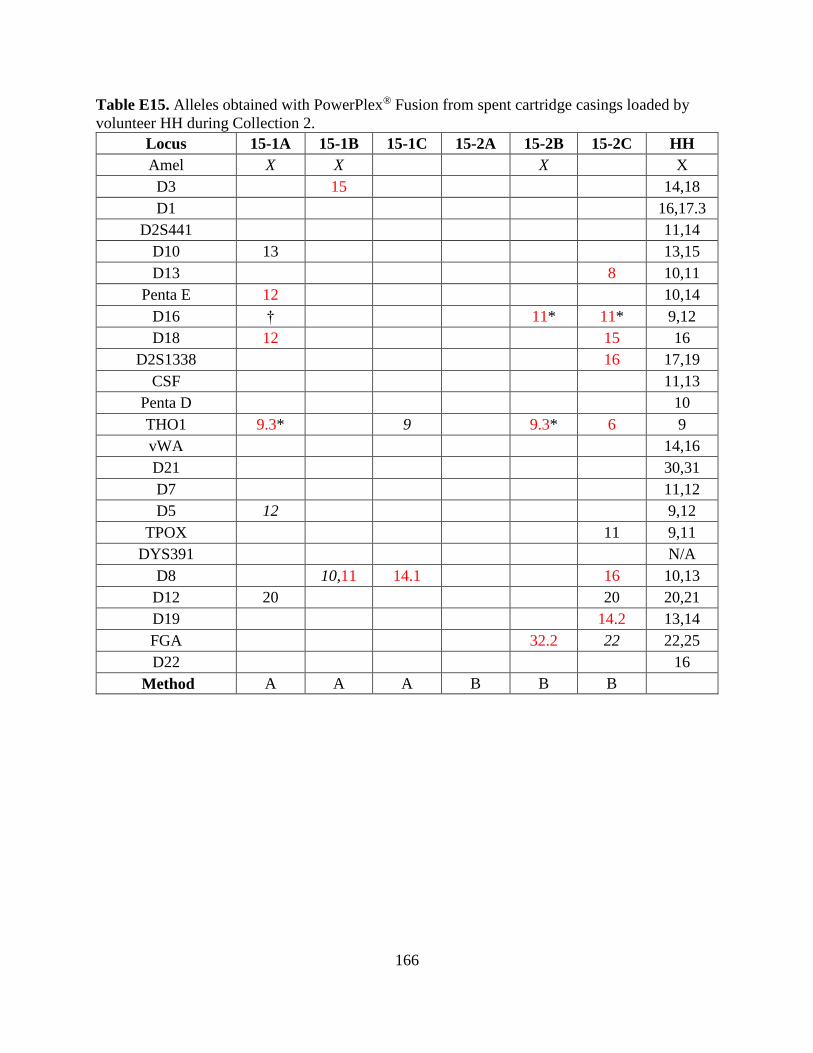
166
Table E15. Alleles obtained with PowerPlex® Fusion from spent cartridge casings loaded by
volunteer HH during Collection 2.
Locus 15-1A 15-1B 15-1C 15-2A 15-2B 15-2C HH
Amel X X X X
D3 15 14,18
D1 16,17.3
D2S441 11,14
D10 13 13,15
D13 8 10,11
Penta E 12 10,14
D16 † 11* 11* 9,12
D18 12 15 16
D2S1338 16 17,19
CSF 11,13
Penta D 10
THO1 9.3* 9 9.3* 6 9
vWA 14,16
D21 30,31
D7 11,12
D5 12 9,12
TPOX 11 9,11
DYS391 N/A
D8 10,11 14.1 16 10,13
D12 20 20 20,21
D19 14.2 13,14
FGA 32.2 22 22,25
D22 16
Method A A A B B B
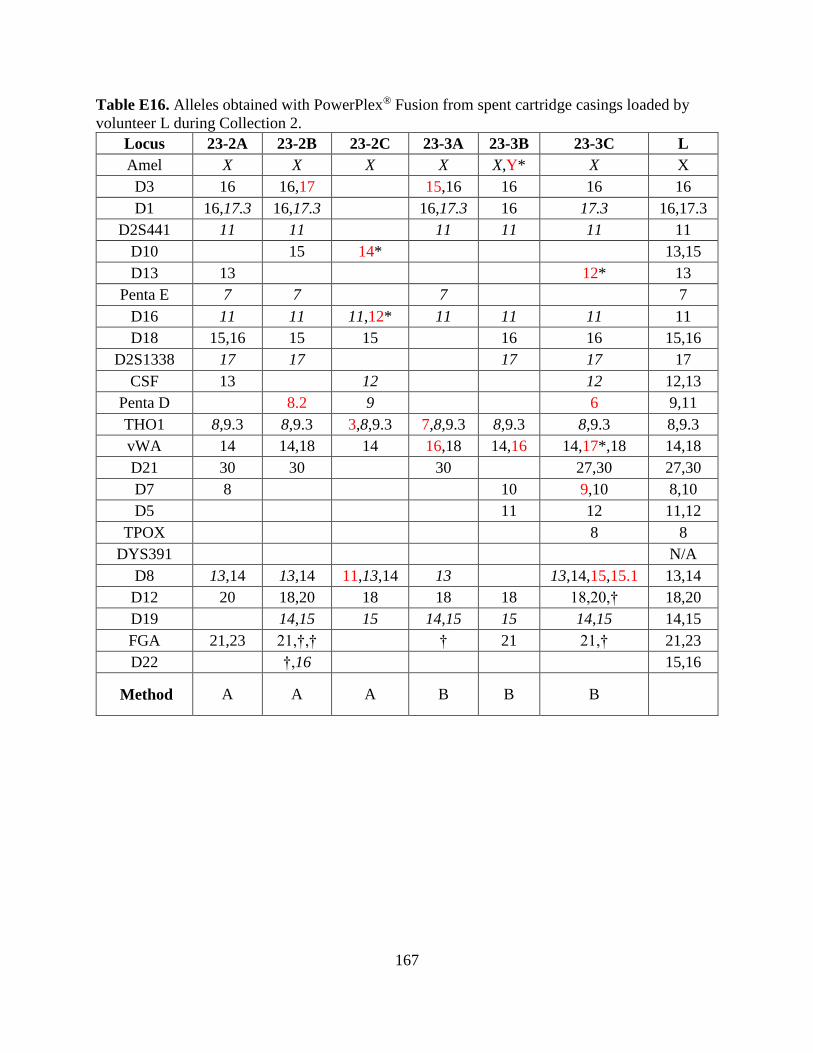
167
Table E16. Alleles obtained with PowerPlex® Fusion from spent cartridge casings loaded by
volunteer L during Collection 2.
Locus 23-2A 23-2B 23-2C 23-3A 23-3B 23-3C L
Amel X X X X X,Y* X X
D3 16 16,17 15,16 16 16 16
D1 16,17.3 16,17.3 16,17.3 16 17.3 16,17.3
D2S441 11 11 11 11 11 11
D10 15 14* 13,15
D13 13 12* 13
Penta E 7 7 7 7
D16 11 11 11,12* 11 11 11 11
D18 15,16 15 15 16 16 15,16
D2S1338 17 17 17 17 17
CSF 13 12 12 12,13
Penta D 8.2 9 6 9,11
THO1 8,9.3 8,9.3 3,8,9.3 7,8,9.3 8,9.3 8,9.3 8,9.3
vWA 14 14,18 14 16,18 14,16 14,17*,18 14,18
D21 30 30 30 27,30 27,30
D7 8 10 9,10 8,10
D5 11 12 11,12
TPOX 8 8
DYS391 N/A
D8 13,14 13,14 11,13,14 13 13,14,15,15.1 13,14
D12 20 18,20 18 18 18 18,20,† 18,20
D19 14,15 15 14,15 15 14,15 14,15
FGA 21,23 21,†,† † 21 21,† 21,23
D22 †,16 15,16
Method A A A B B B
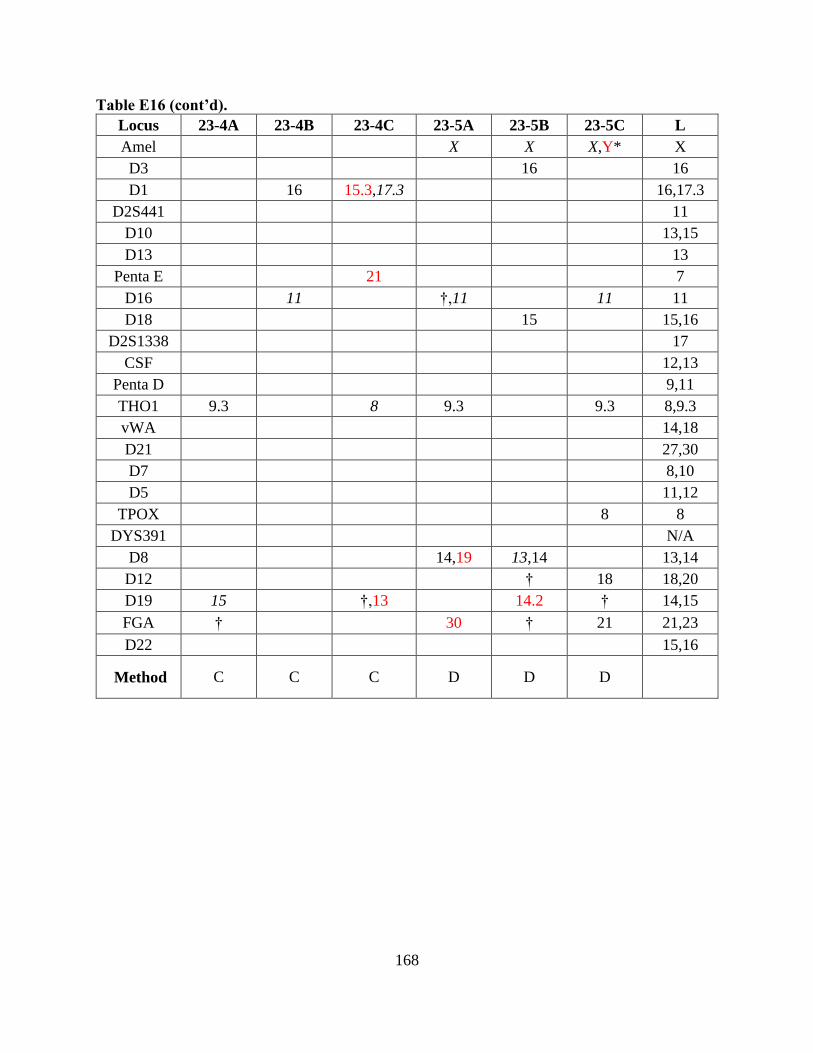
168
Table E16 (cont’d).
Locus 23-4A 23-4B 23-4C 23-5A 23-5B 23-5C L
Amel X X X,Y* X
D3 16 16
D1 16 15.3,17.3 16,17.3
D2S441 11
D10 13,15
D13 13
Penta E 21 7
D16 11 †,11 11 11
D18 15 15,16
D2S1338 17
CSF 12,13
Penta D 9,11
THO1 9.3 8 9.3 9.3 8,9.3
vWA 14,18
D21 27,30
D7 8,10
D5 11,12
TPOX 8 8
DYS391 N/A
D8 14,19 13,14 13,14
D12 † 18 18,20
D19 15 †,13 14.2 † 14,15
FGA † 30 † 21 21,23
D22 15,16
Method C C C D D D
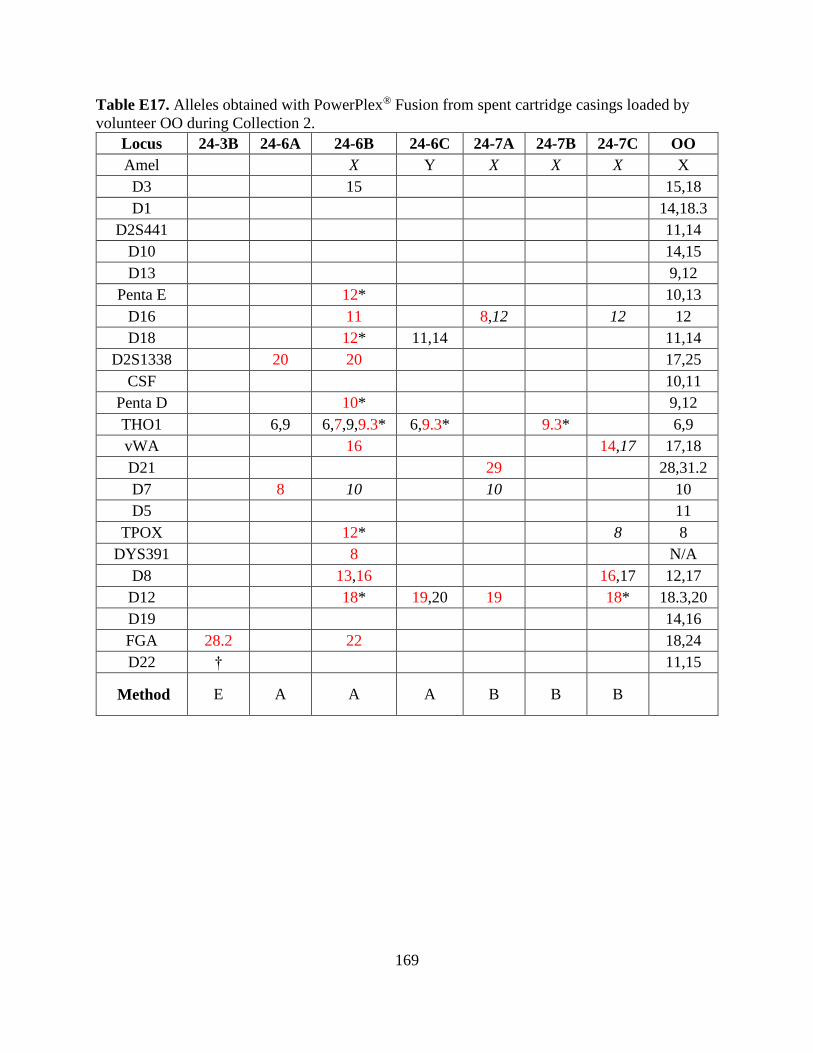
169
Table E17. Alleles obtained with PowerPlex® Fusion from spent cartridge casings loaded by
volunteer OO during Collection 2.
Locus 24-3B 24-6A 24-6B 24-6C 24-7A 24-7B 24-7C OO
Amel X Y X X X X
D3 15 15,18
D1 14,18.3
D2S441 11,14
D10 14,15
D13 9,12
Penta E 12* 10,13
D16 11 8,12 12 12
D18 12* 11,14 11,14
D2S1338 20 20 17,25
CSF 10,11
Penta D 10* 9,12
THO1 6,9 6,7,9,9.3* 6,9.3* 9.3* 6,9
vWA 16 14,17 17,18
D21 29 28,31.2
D7 8 10 10 10
D5 11
TPOX 12* 8 8
DYS391 8 N/A
D8 13,16 16,17 12,17
D12 18* 19,20 19 18* 18.3,20
D19 14,16
FGA 28.2 22 18,24
D22 † 11,15
Method E A A A B B B
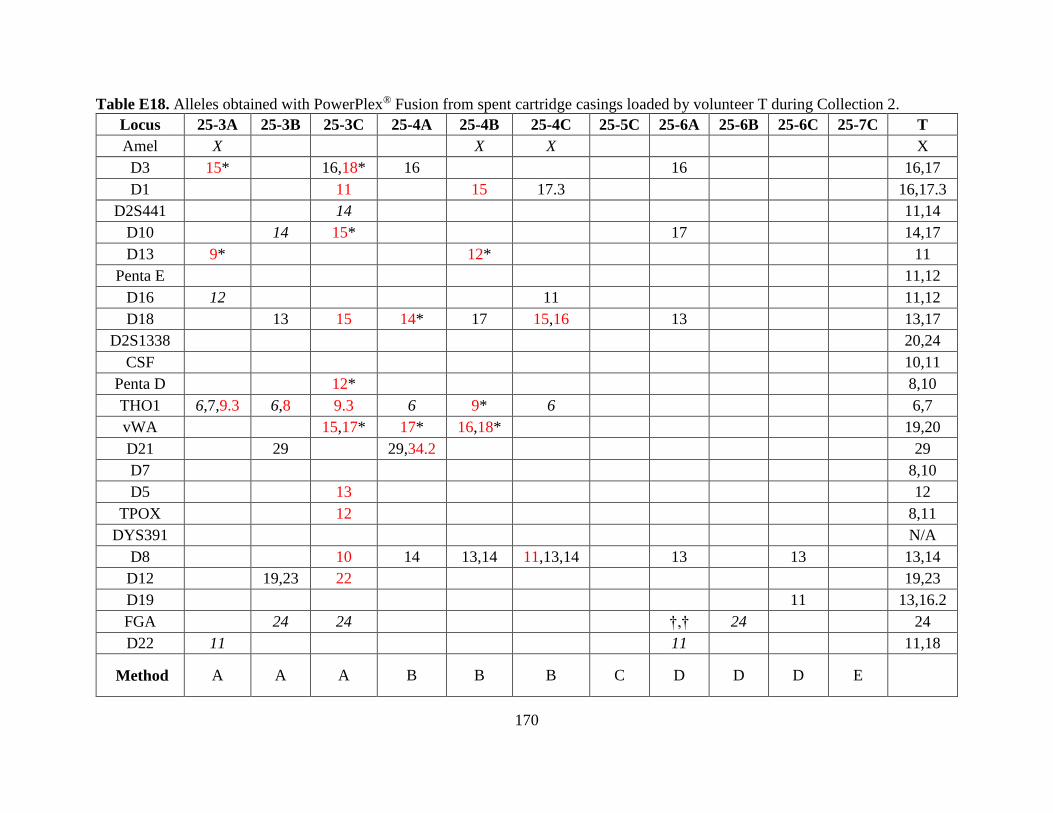
170
Table E18. Alleles obtained with PowerPlex® Fusion from spent cartridge casings loaded by volunteer T during Collection 2.
Locus 25-3A 25-3B 25-3C 25-4A 25-4B 25-4C 25-5C 25-6A 25-6B 25-6C 25-7C T
Amel X X X X
D3 15* 16,18* 16 16 16,17
D1 11 15 17.3 16,17.3
D2S441 14 11,14
D10 14 15* 17 14,17
D13 9* 12* 11
Penta E 11,12
D16 12 11 11,12
D18 13 15 14* 17 15,16 13 13,17
D2S1338 20,24
CSF 10,11
Penta D 12* 8,10
THO1 6,7,9.3 6,8 9.3 6 9* 6 6,7
vWA 15,17* 17* 16,18* 19,20
D21 29 29,34.2 29
D7 8,10
D5 13 12
TPOX 12 8,11
DYS391 N/A
D8 10 14 13,14 11,13,14 13 13 13,14
D12 19,23 22 19,23
D19 11 13,16.2
FGA 24 24 †,† 24 24
D22 11 11 11,18
Method A A A B B B C D D D E
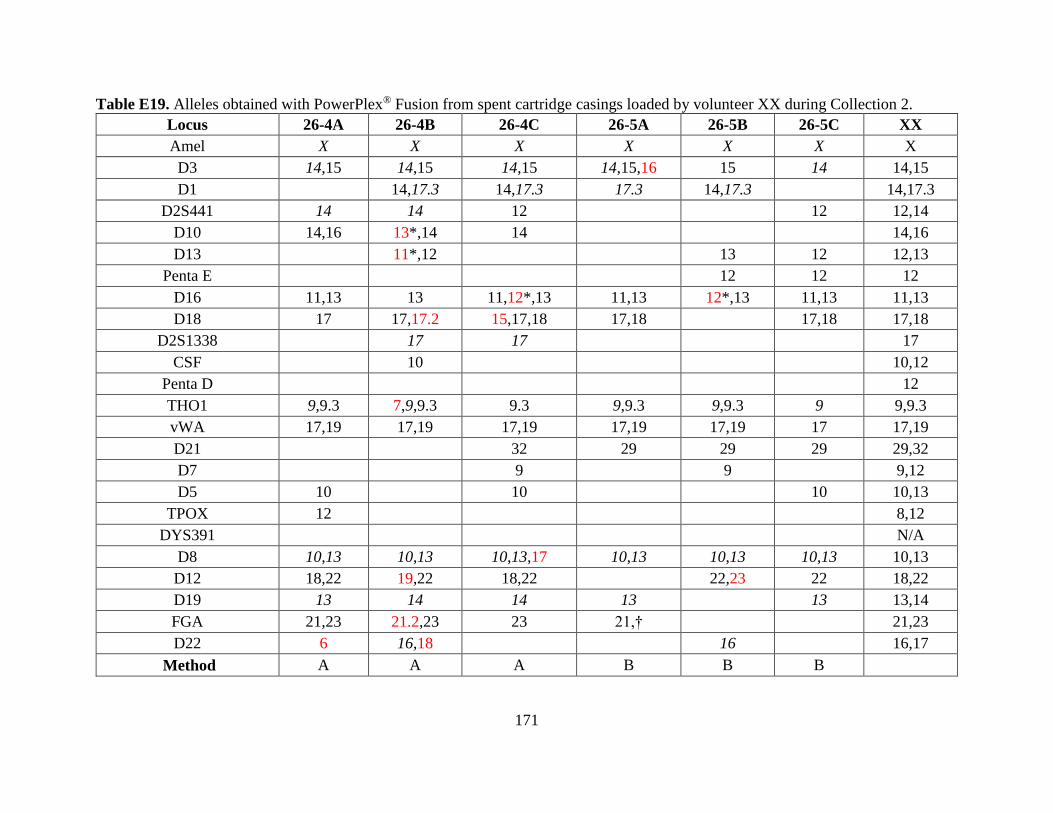
171
Table E19. Alleles obtained with PowerPlex® Fusion from spent cartridge casings loaded by volunteer XX during Collection 2.
Locus 26-4A 26-4B 26-4C 26-5A 26-5B 26-5C XX
Amel X X X X X X X
D3 14,15 14,15 14,15 14,15,16 15 14 14,15
D1 14,17.3 14,17.3 17.3 14,17.3 14,17.3
D2S441 14 14 12 12 12,14
D10 14,16 13*,14 14 14,16
D13 11*,12 13 12 12,13
Penta E 12 12 12
D16 11,13 13 11,12*,13 11,13 12*,13 11,13 11,13
D18 17 17,17.2 15,17,18 17,18 17,18 17,18
D2S1338 17 17 17
CSF 10 10,12
Penta D 12
THO1 9,9.3 7,9,9.3 9.3 9,9.3 9,9.3 9 9,9.3
vWA 17,19 17,19 17,19 17,19 17,19 17 17,19
D21 32 29 29 29 29,32
D7 9 9 9,12
D5 10 10 10 10,13
TPOX 12 8,12
DYS391 N/A
D8 10,13 10,13 10,13,17 10,13 10,13 10,13 10,13
D12 18,22 19,22 18,22 22,23 22 18,22
D19 13 14 14 13 13 13,14
FGA 21,23 21.2,23 23 21,† 21,23
D22 6 16,18 16 16,17
Method A A A B B B
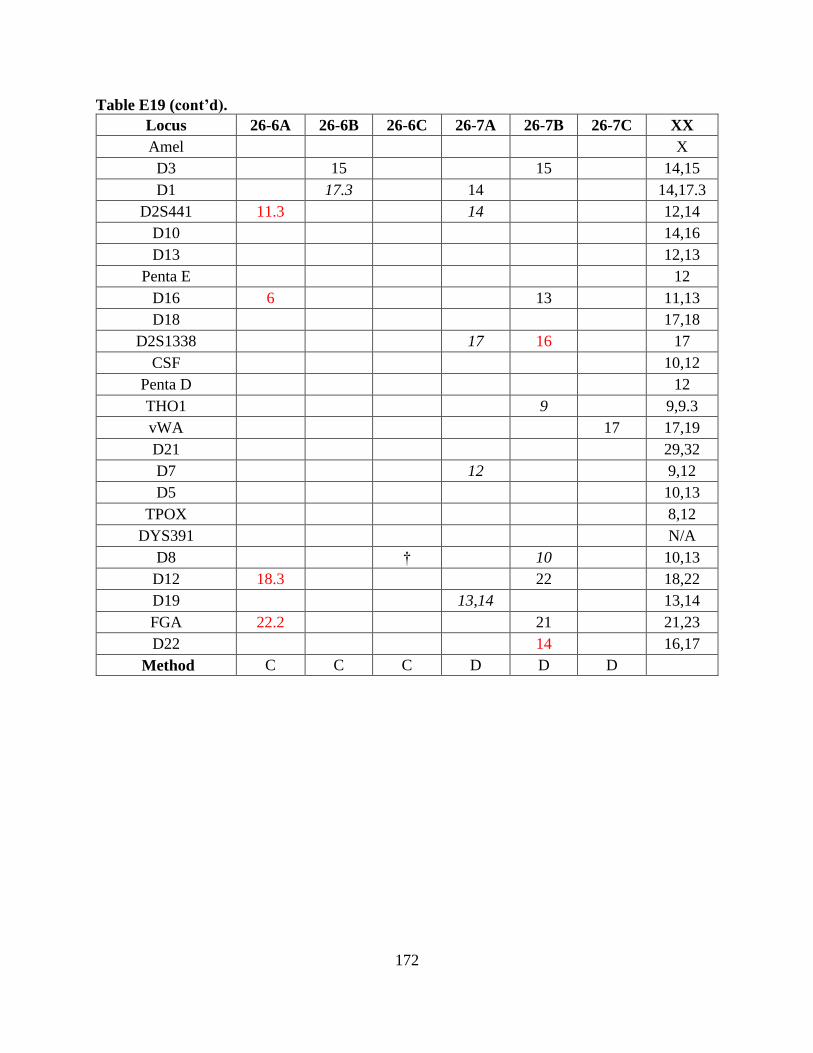
172
Table E19 (cont’d).
Locus 26-6A 26-6B 26-6C 26-7A 26-7B 26-7C XX
Amel X
D3 15 15 14,15
D1 17.3 14 14,17.3
D2S441 11.3 14 12,14
D10 14,16
D13 12,13
Penta E 12
D16 6 13 11,13
D18 17,18
D2S1338 17 16 17
CSF 10,12
Penta D 12
THO1 9 9,9.3
vWA 17 17,19
D21 29,32
D7 12 9,12
D5 10,13
TPOX 8,12
DYS391 N/A
D8 † 10 10,13
D12 18.3 22 18,22
D19 13,14 13,14
FGA 22.2 21 21,23
D22 14 16,17
Method C C C D D D
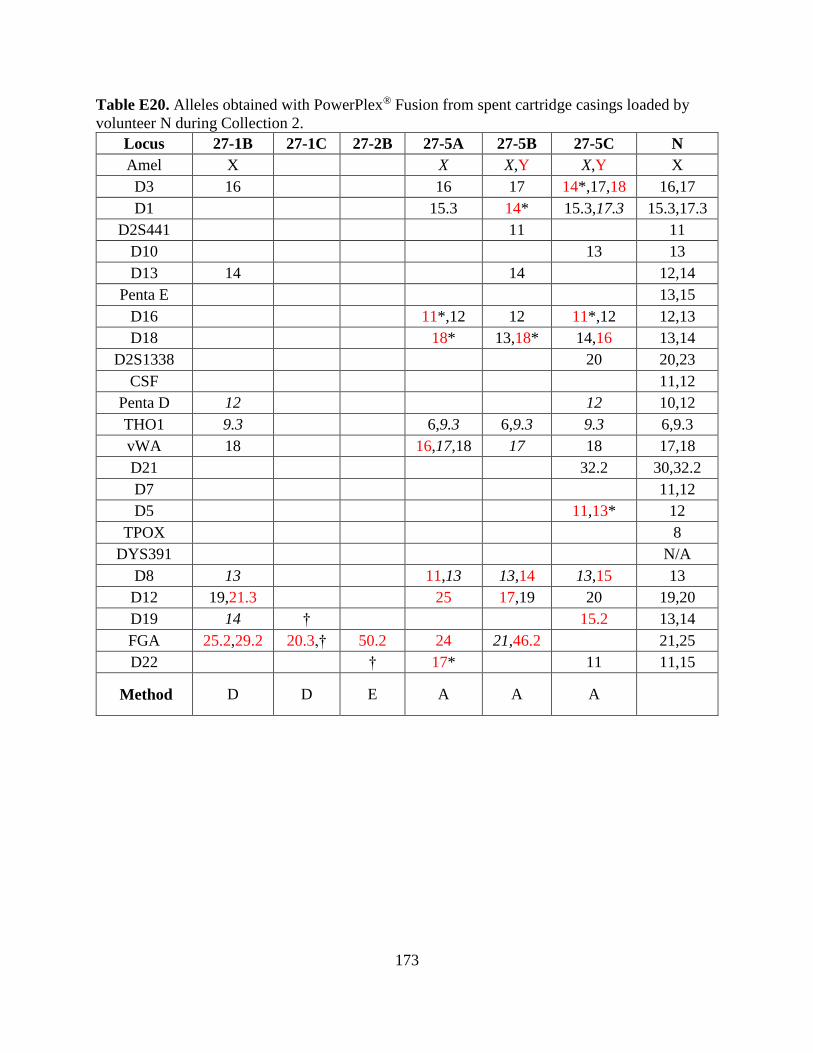
173
Table E20. Alleles obtained with PowerPlex® Fusion from spent cartridge casings loaded by
volunteer N during Collection 2.
Locus 27-1B 27-1C 27-2B 27-5A 27-5B 27-5C N
Amel X X X,Y X,Y X
D3 16 16 17 14*,17,18 16,17
D1 15.3 14* 15.3,17.3 15.3,17.3
D2S441 11 11
D10 13 13
D13 14 14 12,14
Penta E 13,15
D16 11*,12 12 11*,12 12,13
D18 18* 13,18* 14,16 13,14
D2S1338 20 20,23
CSF 11,12
Penta D 12 12 10,12
THO1 9.3 6,9.3 6,9.3 9.3 6,9.3
vWA 18 16,17,18 17 18 17,18
D21 32.2 30,32.2
D7 11,12
D5 11,13* 12
TPOX 8
DYS391 N/A
D8 13 11,13 13,14 13,15 13
D12 19,21.3 25 17,19 20 19,20
D19 14 † 15.2 13,14
FGA 25.2,29.2 20.3,† 50.2 24 21,46.2 21,25
D22 † 17* 11 11,15
Method D D E A A A
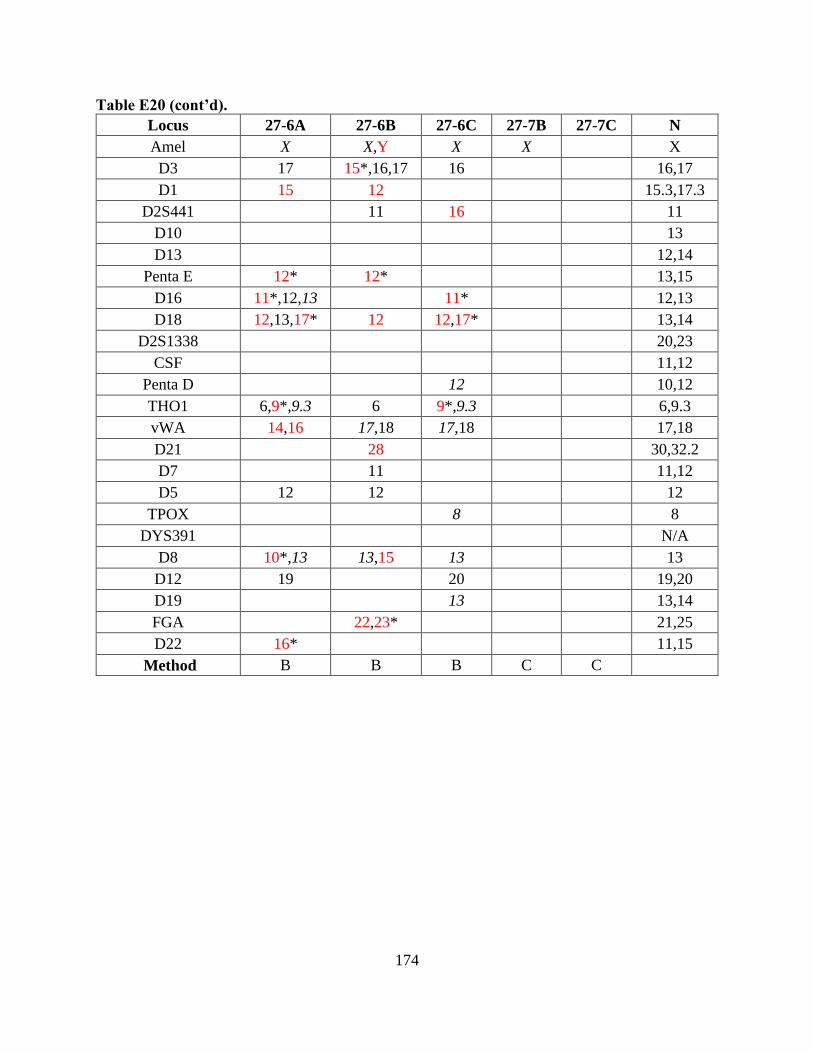
174
Table E20 (cont’d).
Locus 27-6A 27-6B 27-6C 27-7B 27-7C N
Amel X X,Y X X X
D3 17 15*,16,17 16 16,17
D1 15 12 15.3,17.3
D2S441 11 16 11
D10 13
D13 12,14
Penta E 12* 12* 13,15
D16 11*,12,13 11* 12,13
D18 12,13,17* 12 12,17* 13,14
D2S1338 20,23
CSF 11,12
Penta D 12 10,12
THO1 6,9*,9.3 6 9*,9.3 6,9.3
vWA 14,16 17,18 17,18 17,18
D21 28 30,32.2
D7 11 11,12
D5 12 12 12
TPOX 8 8
DYS391 N/A
D8 10*,13 13,15 13 13
D12 19 20 19,20
D19 13 13,14
FGA 22,23* 21,25
D22 16* 11,15
Method B B B C C
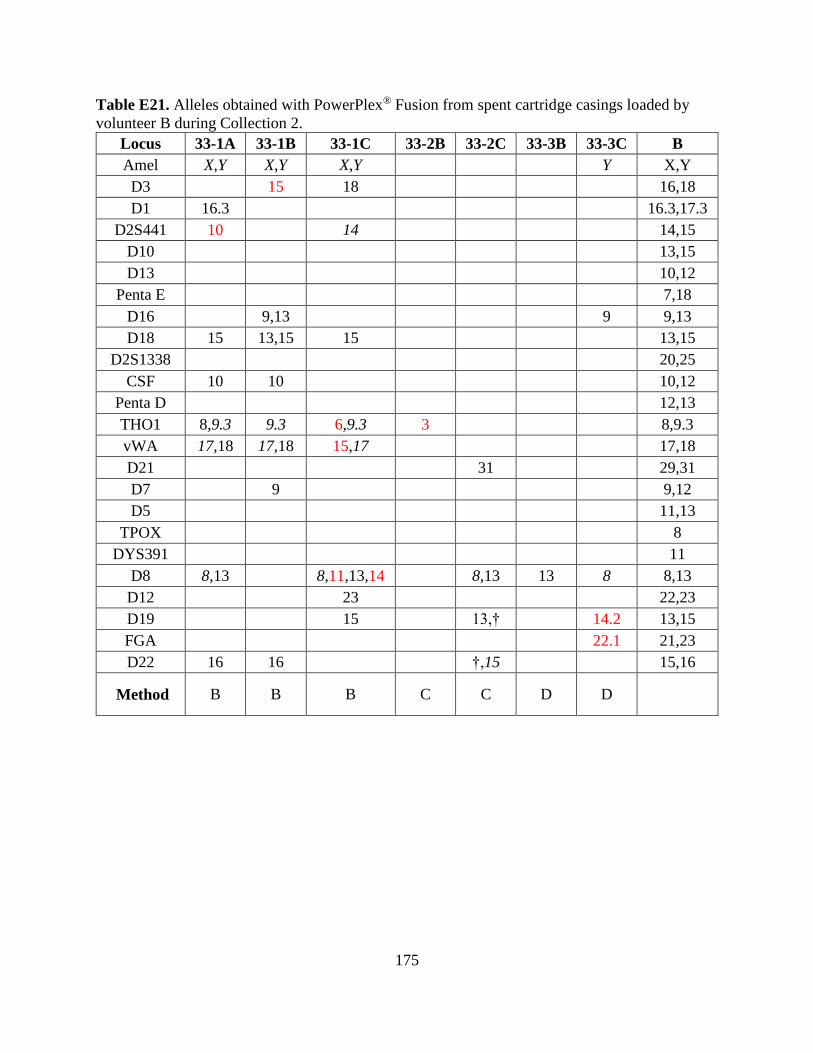
175
Table E21. Alleles obtained with PowerPlex® Fusion from spent cartridge casings loaded by
volunteer B during Collection 2.
Locus 33-1A 33-1B 33-1C 33-2B 33-2C 33-3B 33-3C B
Amel X,Y X,Y X,Y Y X,Y
D3 15 18 16,18
D1 16.3 16.3,17.3
D2S441 10 14 14,15
D10 13,15
D13 10,12
Penta E 7,18
D16 9,13 9 9,13
D18 15 13,15 15 13,15
D2S1338 20,25
CSF 10 10 10,12
Penta D 12,13
THO1 8,9.3 9.3 6,9.3 3 8,9.3
vWA 17,18 17,18 15,17 17,18
D21 31 29,31
D7 9 9,12
D5 11,13
TPOX 8
DYS391 11
D8 8,13 8,11,13,14 8,13 13 8 8,13
D12 23 22,23
D19 15 13,† 14.2 13,15
FGA 22.1 21,23
D22 16 16 †,15 15,16
Method B B B C C D D
176
Table E21 (cont’d).
Locus 33-4B 33-7A 33-7B 33-7C B
Amel X,Y X,Y X,Y X,Y
D3 18 16,17*,18 16 18 16,18
D1 17.3 16.3,17.3 16.3,17.3
D2S441 14,15 14 14,15
D10 13 13,15
D13 10 10 10,12
Penta E 17.4,18 7 7,18
D16 9,13 9,12*,13 9,13
D18 15 13,15 13 13,15
D2S1338 25 20,25
CSF 12 12 10,12
Penta D 12,13
THO1 † 8,9,9.3 8,9.3 8 8,9.3
vWA 18 17,18 18 17,18
D21 29 29,31
D7 9 12 9,12
D5 13 11,13
TPOX 8
DYS391 11
D8 8,13 8,13 8,13 8,13
D12 13 22,23 22,23
D19 13,14* 13,15
FGA 16.1,19.3,23,†,† 31,† 21,23
D22 15,16
Method E A A A
177
Table E22. Alleles obtained with PowerPlex® Fusion from spent cartridge casings loaded by volunteer D during Collection 2.
Locus 36-1A 36-1B 36-1C 36-2A 36-2B 36-2C 36-4B 36-4C D
Amel X,Y Y Y Y X Y Y X,Y
D3 17 15 18,18.3,19 17,18
D1 15 14 15
D2S441 11.3* †,† 11,14
D10 13,14
D13 11 11
Penta E 7,13
D16 12*,13 13 13 13
D18 14 14 †,† 12,14
D2S1338 20 20 17,20
CSF 12 12 11,12
Penta D 9,11
THO1 8,9.3 9*,9.3 9.3 6,9.3 9.3 8,9.3
vWA 15 15 17 15,17
D21 28 28,30
D7 9,12
D5 9 11,12
TPOX 9,11
DYS391 10
D8 8,13 13 9*,13 8,9*,13 9*,12* 8,13
D12 19 18 19,20 15,19
D19 15 14,15
FGA 22.1,† † 13 21,26
D22 † 18 12,17
Method A A A B B B D D
178
Table E23. Alleles obtained with PowerPlex® Fusion from spent cartridge casings loaded by volunteer WW during Collection 2.
Locus 38-2A 38-2B 38-2C 38-3A 38-3B 38-3C WW
Amel X X,Y X X,Y X X X
D3 16,18 16,17* 15,17* 16,17* 16 16,18
D1 11 15 11,15 11,12
D2S441 11,14 11 11 11,14
D10 13*,16 15 15,16
D13 8 11 9 13,14* 8,9
Penta E 7,8 11 11,12
D16 12 12 12 10,11,12 12 12 12
D18 12 12,16,17 14*,15 17 12,15 12,15 12,15
D2S1338 18 18 21 17 17,21
CSF 11 11,12
Penta D 9,12 12 10,12
THO1 9.3 9.3 8,9.3 7,9.3 9.3 8,9.3 9.3
vWA 15,17 15,17 17,18* 17 15,17 15,17
D21 28 28,32.2* 30 28,30
D7 10 10 10,11
D5 13 11 13
TPOX 8 11 8,12
DYS391 11 N/A
D8 10 10,12 10,12 10,12,13* 10,12 10,12
D12 18,19.3 19.3,25 19* 26 17.3,19.3 18,19.3
D19 14 14,15.2 13 13,14 13,14 13,14
FGA 23 20,21*,25* 20,24
D22 16
Method A A A B B B
179
Table E23 (cont’d).
Locus 38-4A 38-4B 38-4C 38-5A WW
Amel X X
D3 17* 16,18
D1 11,12
D2S441 11,14 11 11,14
D10 16 15,16
D13 8,9
Penta E 11,12
D16 12 11 12
D18 12 12,15
D2S1338 25 † 17,21
CSF 11,12
Penta D 10,12
THO1 9.3
vWA 15 15,17
D21 28,30
D7 10,11
D5 13
TPOX 8,12
DYS391 N/A
D8 10 10,12
D12 18,21.3 18,19.3
D19 13,14
FGA †,† 49.2 20,24
D22 16
Method C C C D
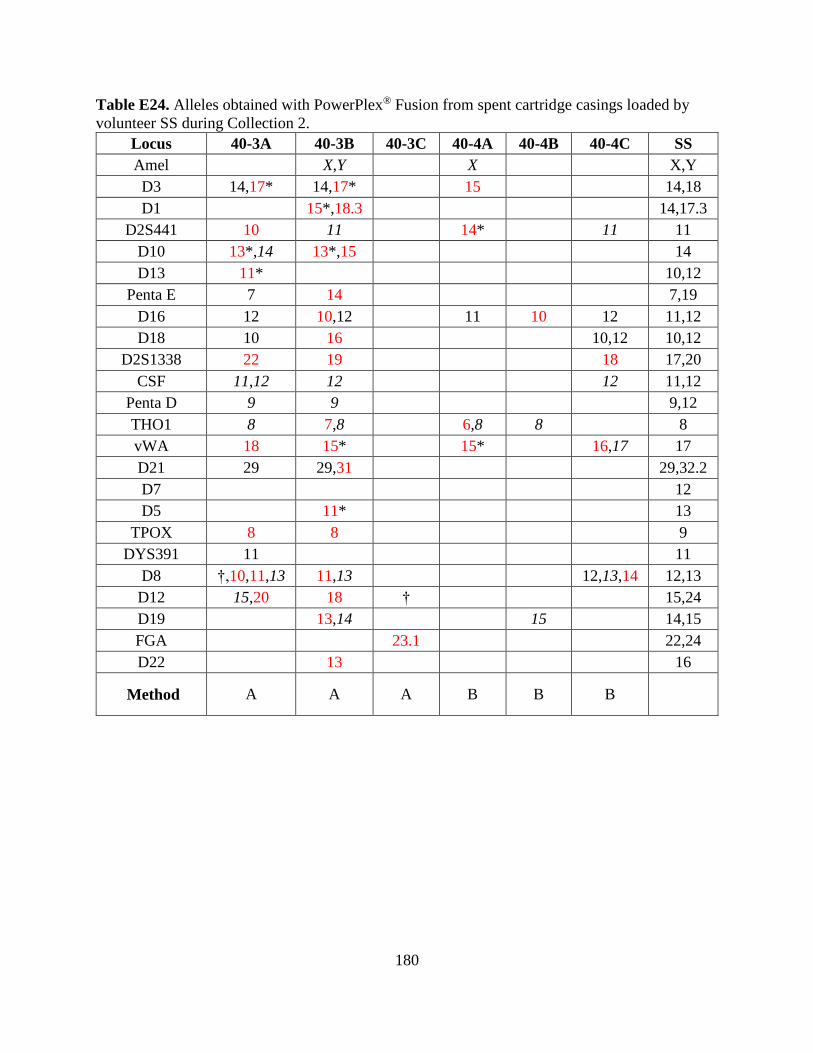
180
Table E24. Alleles obtained with PowerPlex® Fusion from spent cartridge casings loaded by
volunteer SS during Collection 2.
Locus 40-3A 40-3B 40-3C 40-4A 40-4B 40-4C SS
Amel X,Y X X,Y
D3 14,17* 14,17* 15 14,18
D1 15*,18.3 14,17.3
D2S441 10 11 14* 11 11
D10 13*,14 13*,15 14
D13 11* 10,12
Penta E 7 14 7,19
D16 12 10,12 11 10 12 11,12
D18 10 16 10,12 10,12
D2S1338 22 19 18 17,20
CSF 11,12 12 12 11,12
Penta D 9 9 9,12
THO1 8 7,8 6,8 8 8
vWA 18 15* 15* 16,17 17
D21 29 29,31 29,32.2
D7 12
D5 11* 13
TPOX 8 8 9
DYS391 11 11
D8 †,10,11,13 11,13 12,13,14 12,13
D12 15,20 18 † 15,24
D19 13,14 15 14,15
FGA 23.1 22,24
D22 13 16
Method A A A B B B
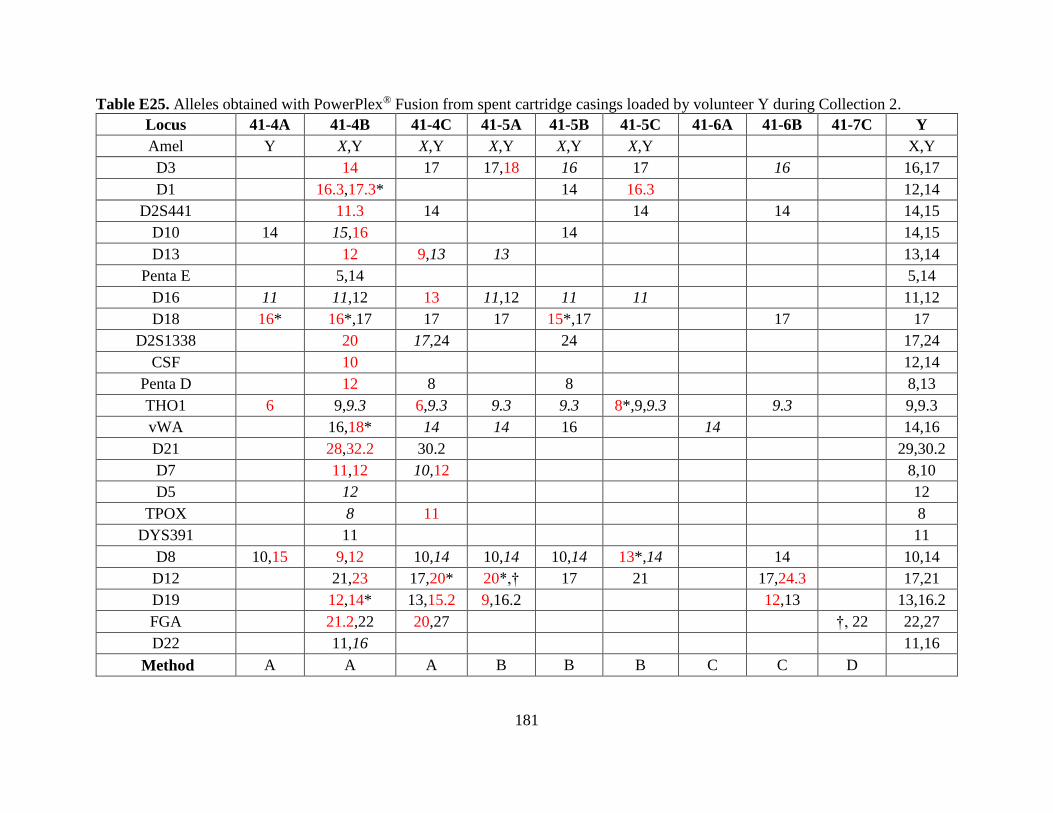
181
Table E25. Alleles obtained with PowerPlex® Fusion from spent cartridge casings loaded by volunteer Y during Collection 2.
Locus 41-4A 41-4B 41-4C 41-5A 41-5B 41-5C 41-6A 41-6B 41-7C Y
Amel Y X,Y X,Y X,Y X,Y X,Y X,Y
D3 14 17 17,18 16 17 16 16,17
D1 16.3,17.3* 14 16.3 12,14
D2S441 11.3 14 14 14 14,15
D10 14 15,16 14 14,15
D13 12 9,13 13 13,14
Penta E 5,14 5,14
D16 11 11,12 13 11,12 11 11 11,12
D18 16* 16*,17 17 17 15*,17 17 17
D2S1338 20 17,24 24 17,24
CSF 10 12,14
Penta D 12 8 8 8,13
THO1 6 9,9.3 6,9.3 9.3 9.3 8*,9,9.3 9.3 9,9.3
vWA 16,18* 14 14 16 14 14,16
D21 28,32.2 30.2 29,30.2
D7 11,12 10,12 8,10
D5 12 12
TPOX 8 11 8
DYS391 11 11
D8 10,15 9,12 10,14 10,14 10,14 13*,14 14 10,14
D12 21,23 17,20* 20*,† 17 21 17,24.3 17,21
D19 12,14* 13,15.2 9,16.2 12,13 13,16.2
FGA 21.2,22 20,27 †, 22 22,27
D22 11,16 11,16
Method A A A B B B C C D
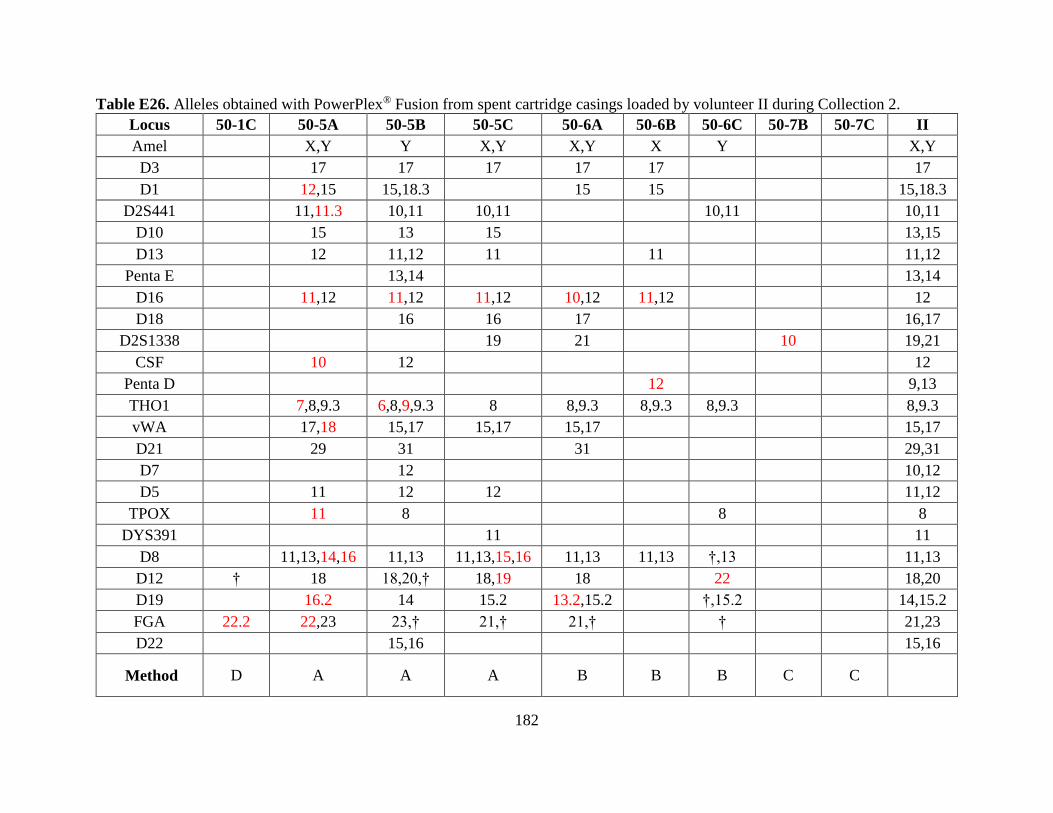
182
Table E26. Alleles obtained with PowerPlex® Fusion from spent cartridge casings loaded by volunteer II during Collection 2.
Locus 50-1C 50-5A 50-5B 50-5C 50-6A 50-6B 50-6C 50-7B 50-7C II
Amel X,Y Y X,Y X,Y X Y X,Y
D3 17 17 17 17 17 17
D1 12,15 15,18.3 15 15 15,18.3
D2S441 11,11.3 10,11 10,11 10,11 10,11
D10 15 13 15 13,15
D13 12 11,12 11 11 11,12
Penta E 13,14 13,14
D16 11,12 11,12 11,12 10,12 11,12 12
D18 16 16 17 16,17
D2S1338 19 21 10 19,21
CSF 10 12 12
Penta D 12 9,13
THO1 7,8,9.3 6,8,9,9.3 8 8,9.3 8,9.3 8,9.3 8,9.3
vWA 17,18 15,17 15,17 15,17 15,17
D21 29 31 31 29,31
D7 12 10,12
D5 11 12 12 11,12
TPOX 11 8 8 8
DYS391 11 11
D8 11,13,14,16 11,13 11,13,15,16 11,13 11,13 †,13 11,13
D12 † 18 18,20,† 18,19 18 22 18,20
D19 16.2 14 15.2 13.2,15.2 †,15.2 14,15.2
FGA 22.2 22,23 23,† 21,† 21,† † 21,23
D22 15,16 15,16
Method D A A A B B B C C
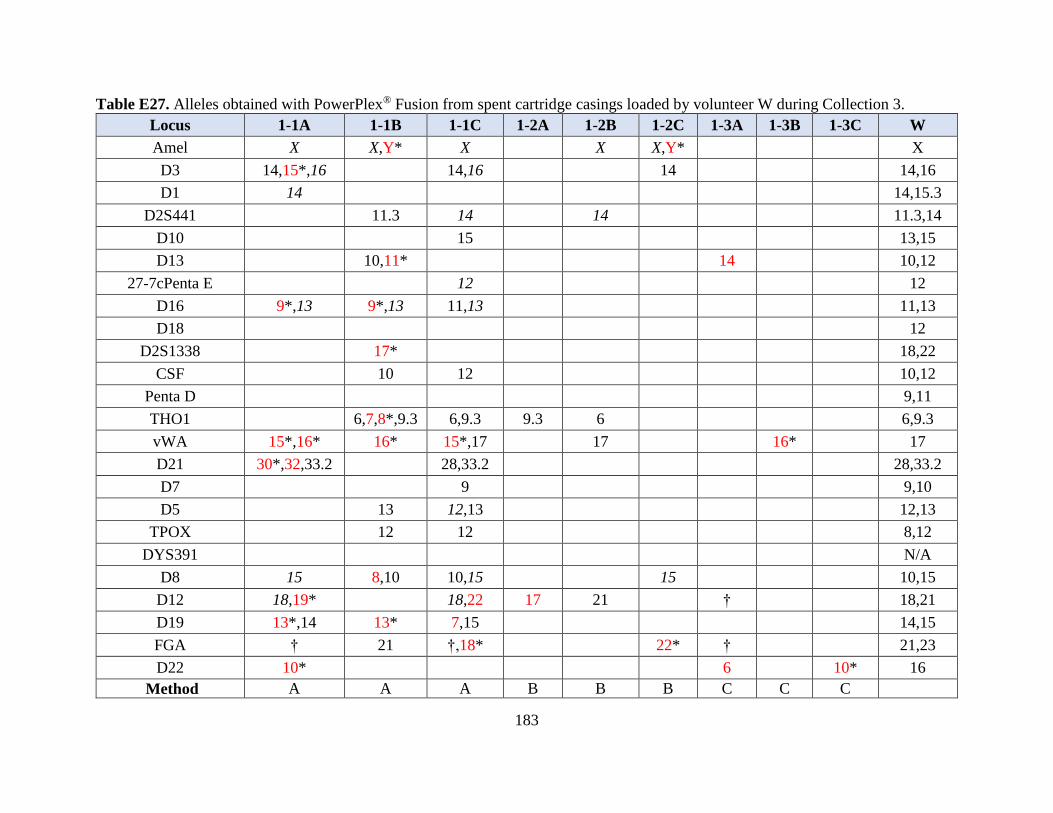
183
Table E27. Alleles obtained with PowerPlex® Fusion from spent cartridge casings loaded by volunteer W during Collection 3.
Locus 1-1A 1-1B 1-1C 1-2A 1-2B 1-2C 1-3A 1-3B 1-3C W
Amel X X,Y* X X X,Y* X
D3 14,15*,16 14,16 14 14,16
D1 14 14,15.3
D2S441 11.3 14 14 11.3,14
D10 15 13,15
D13 10,11* 14 10,12
27-7cPenta E 12 12
D16 9*,13 9*,13 11,13 11,13
D18 12
D2S1338 17* 18,22
CSF 10 12 10,12
Penta D 9,11
THO1 6,7,8*,9.3 6,9.3 9.3 6 6,9.3
vWA 15*,16* 16* 15*,17 17 16* 17
D21 30*,32,33.2 28,33.2 28,33.2
D7 9 9,10
D5 13 12,13 12,13
TPOX 12 12 8,12
DYS391 N/A
D8 15 8,10 10,15 15 10,15
D12 18,19* 18,22 17 21 † 18,21
D19 13*,14 13* 7,15 14,15
FGA † 21 †,18* 22* † 21,23
D22 10* 6 10* 16
Method A A A B B B C C C
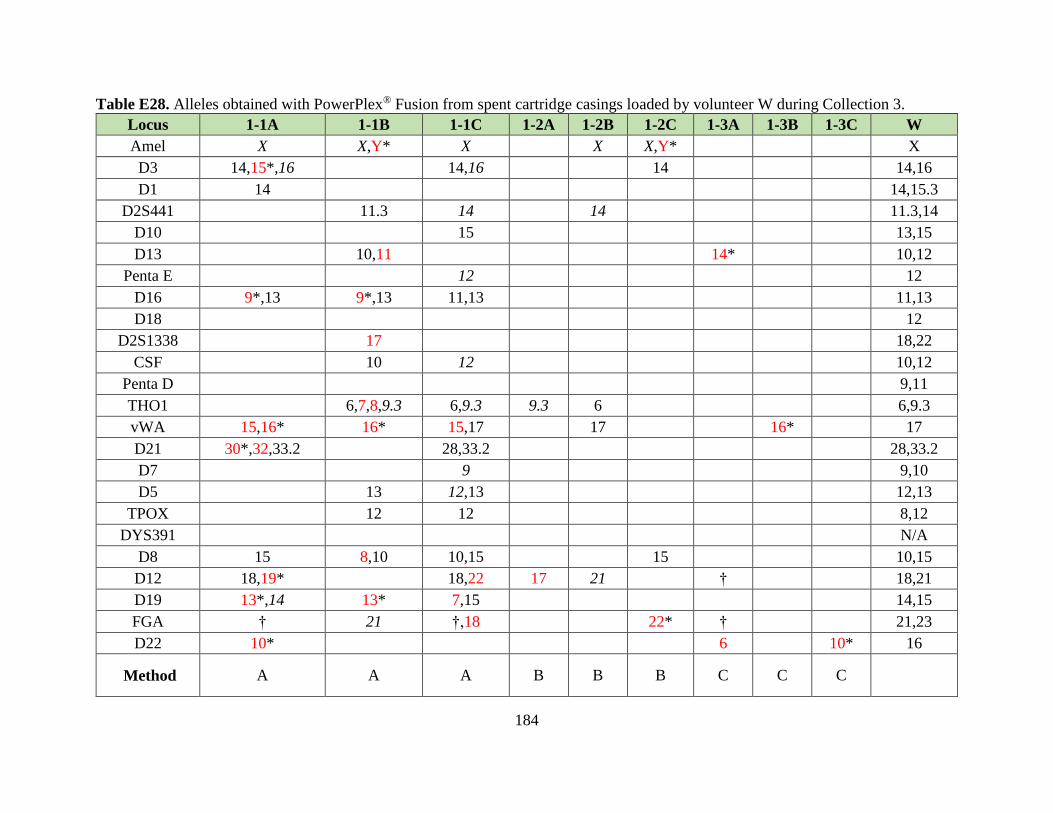
184
Table E28. Alleles obtained with PowerPlex® Fusion from spent cartridge casings loaded by volunteer W during Collection 3.
Locus 1-1A 1-1B 1-1C 1-2A 1-2B 1-2C 1-3A 1-3B 1-3C W
Amel X X,Y* X X X,Y* X
D3 14,15*,16 14,16 14 14,16
D1 14 14,15.3
D2S441 11.3 14 14 11.3,14
D10 15 13,15
D13 10,11 14* 10,12
Penta E 12 12
D16 9*,13 9*,13 11,13 11,13
D18 12
D2S1338 17 18,22
CSF 10 12 10,12
Penta D 9,11
THO1 6,7,8,9.3 6,9.3 9.3 6 6,9.3
vWA 15,16* 16* 15,17 17 16* 17
D21 30*,32,33.2 28,33.2 28,33.2
D7 9 9,10
D5 13 12,13 12,13
TPOX 12 12 8,12
DYS391 N/A
D8 15 8,10 10,15 15 10,15
D12 18,19* 18,22 17 21 † 18,21
D19 13*,14 13* 7,15 14,15
FGA † 21 †,18 22* † 21,23
D22 10* 6 10* 16
Method A A A B B B C C C
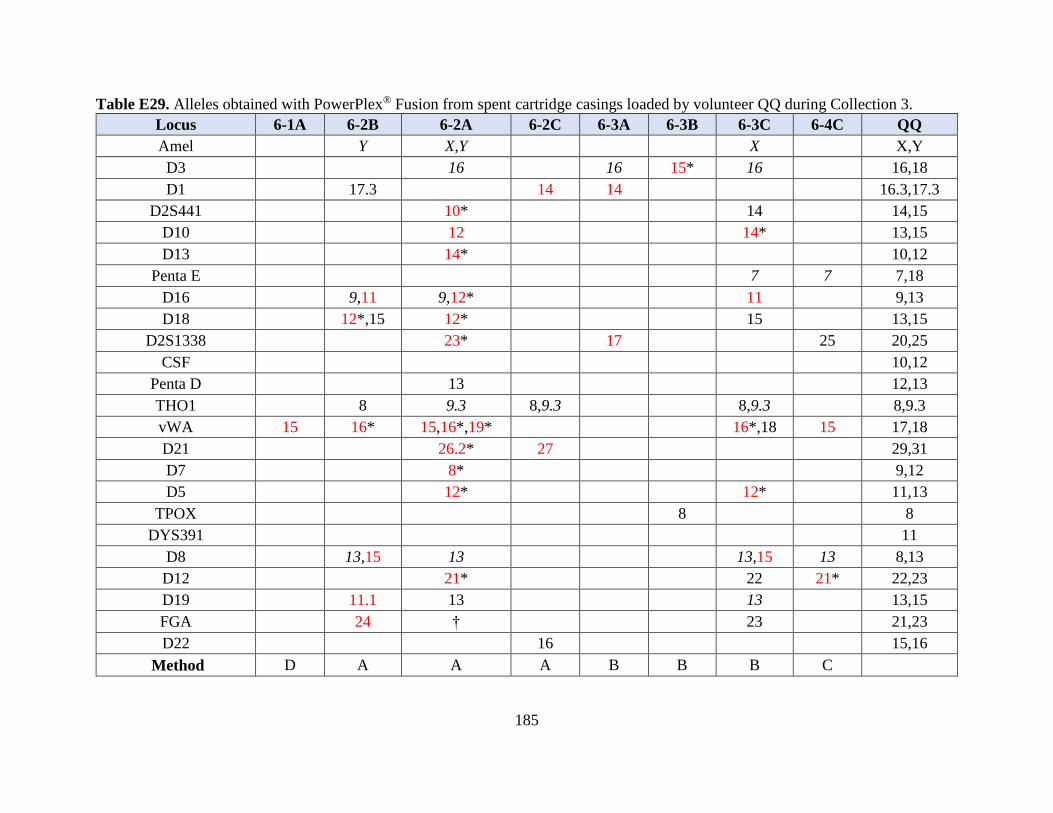
185
Table E29. Alleles obtained with PowerPlex® Fusion from spent cartridge casings loaded by volunteer QQ during Collection 3.
Locus 6-1A 6-2B 6-2A 6-2C 6-3A 6-3B 6-3C 6-4C QQ
Amel Y X,Y X X,Y
D3 16 16 15* 16 16,18
D1 17.3 14 14 16.3,17.3
D2S441 10* 14 14,15
D10 12 14* 13,15
D13 14* 10,12
Penta E 7 7 7,18
D16 9,11 9,12* 11 9,13
D18 12*,15 12* 15 13,15
D2S1338 23* 17 25 20,25
CSF 10,12
Penta D 13 12,13
THO1 8 9.3 8,9.3 8,9.3 8,9.3
vWA 15 16* 15,16*,19* 16*,18 15 17,18
D21 26.2* 27 29,31
D7 8* 9,12
D5 12* 12* 11,13
TPOX 8 8
DYS391 11
D8 13,15 13 13,15 13 8,13
D12 21* 22 21* 22,23
D19 11.1 13 13 13,15
FGA 24 † 23 21,23
D22 16 15,16
Method D A A A B B B C
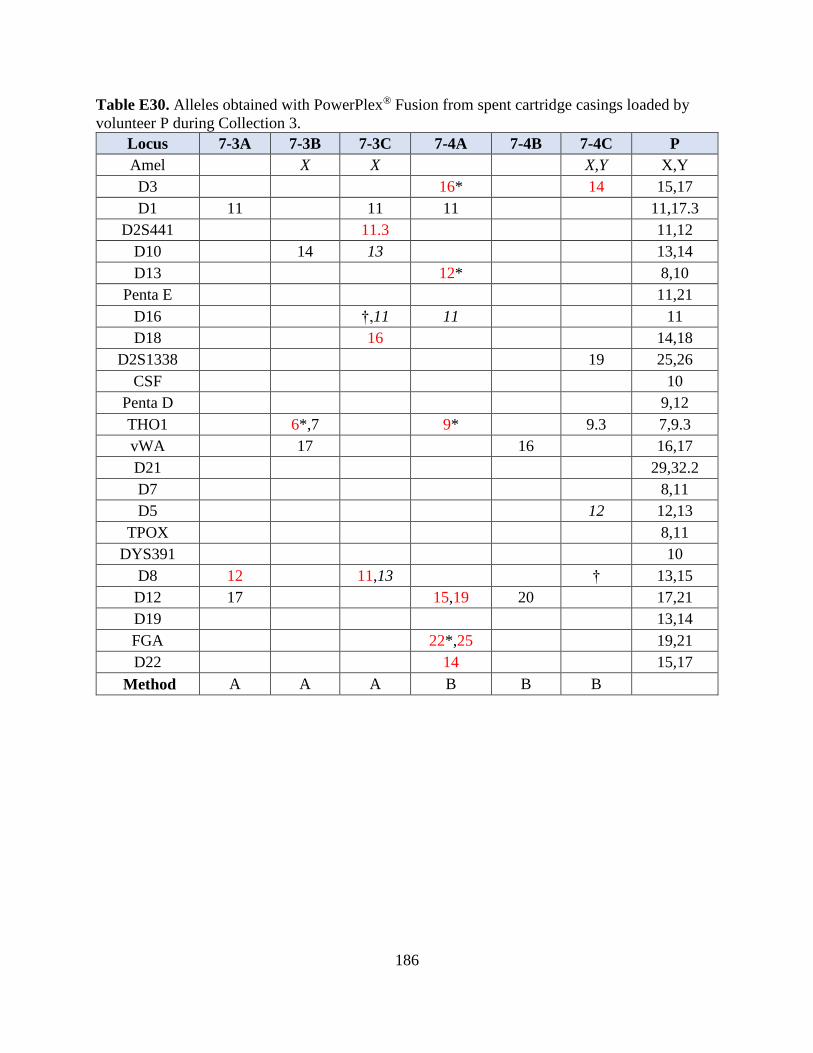
186
Table E30. Alleles obtained with PowerPlex® Fusion from spent cartridge casings loaded by
volunteer P during Collection 3.
Locus 7-3A 7-3B 7-3C 7-4A 7-4B 7-4C P
Amel X X X,Y X,Y
D3 16* 14 15,17
D1 11 11 11 11,17.3
D2S441 11.3 11,12
D10 14 13 13,14
D13 12* 8,10
Penta E 11,21
D16 †,11 11 11
D18 16 14,18
D2S1338 19 25,26
CSF 10
Penta D 9,12
THO1 6*,7 9* 9.3 7,9.3
vWA 17 16 16,17
D21 29,32.2
D7 8,11
D5 12 12,13
TPOX 8,11
DYS391 10
D8 12 11,13 † 13,15
D12 17 15,19 20 17,21
D19 13,14
FGA 22*,25 19,21
D22 14 15,17
Method A A A B B B
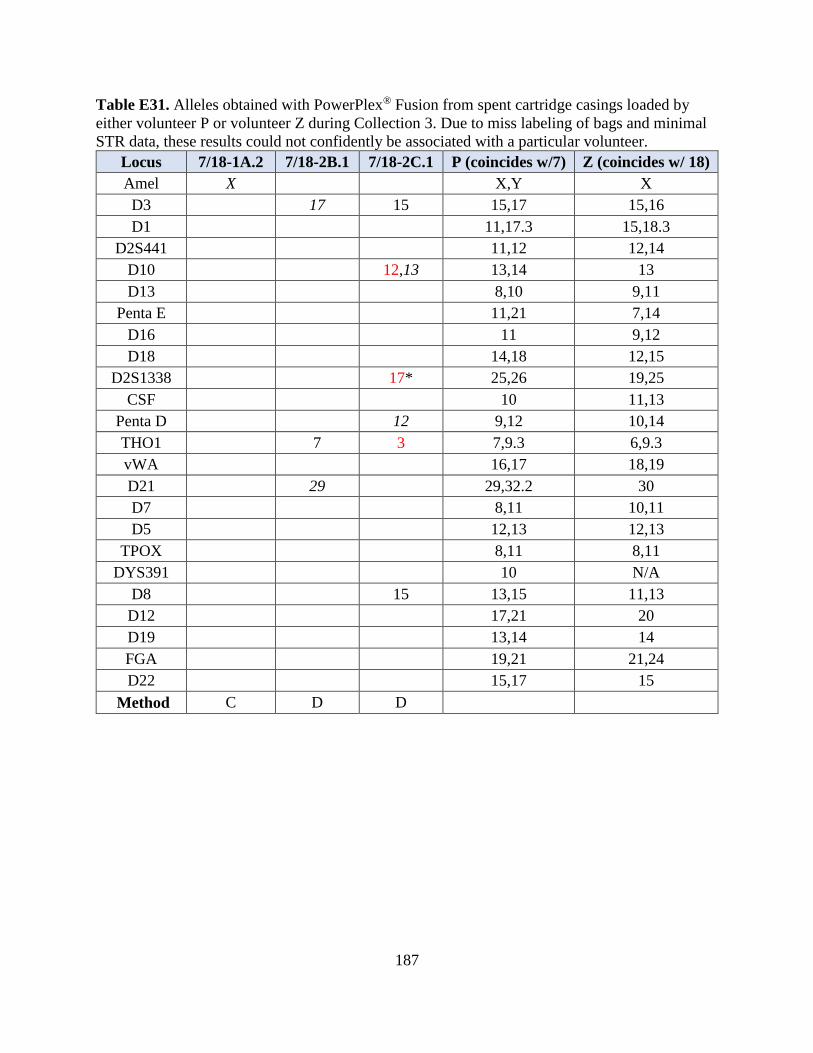
187
Table E31. Alleles obtained with PowerPlex® Fusion from spent cartridge casings loaded by
either volunteer P or volunteer Z during Collection 3. Due to miss labeling of bags and minimal
STR data, these results could not confidently be associated with a particular volunteer.
Locus 7/18-1A.2 7/18-2B.1 7/18-2C.1 P (coincides w/7) Z (coincides w/ 18)
Amel X X,Y X
D3 17 15 15,17 15,16
D1 11,17.3 15,18.3
D2S441 11,12 12,14
D10 12,13 13,14 13
D13 8,10 9,11
Penta E 11,21 7,14
D16 11 9,12
D18 14,18 12,15
D2S1338 17* 25,26 19,25
CSF 10 11,13
Penta D 12 9,12 10,14
THO1 7 3 7,9.3 6,9.3
vWA 16,17 18,19
D21 29 29,32.2 30
D7 8,11 10,11
D5 12,13 12,13
TPOX 8,11 8,11
DYS391 10 N/A
D8 15 13,15 11,13
D12 17,21 20
D19 13,14 14
FGA 19,21 21,24
D22 15,17 15
Method C D D
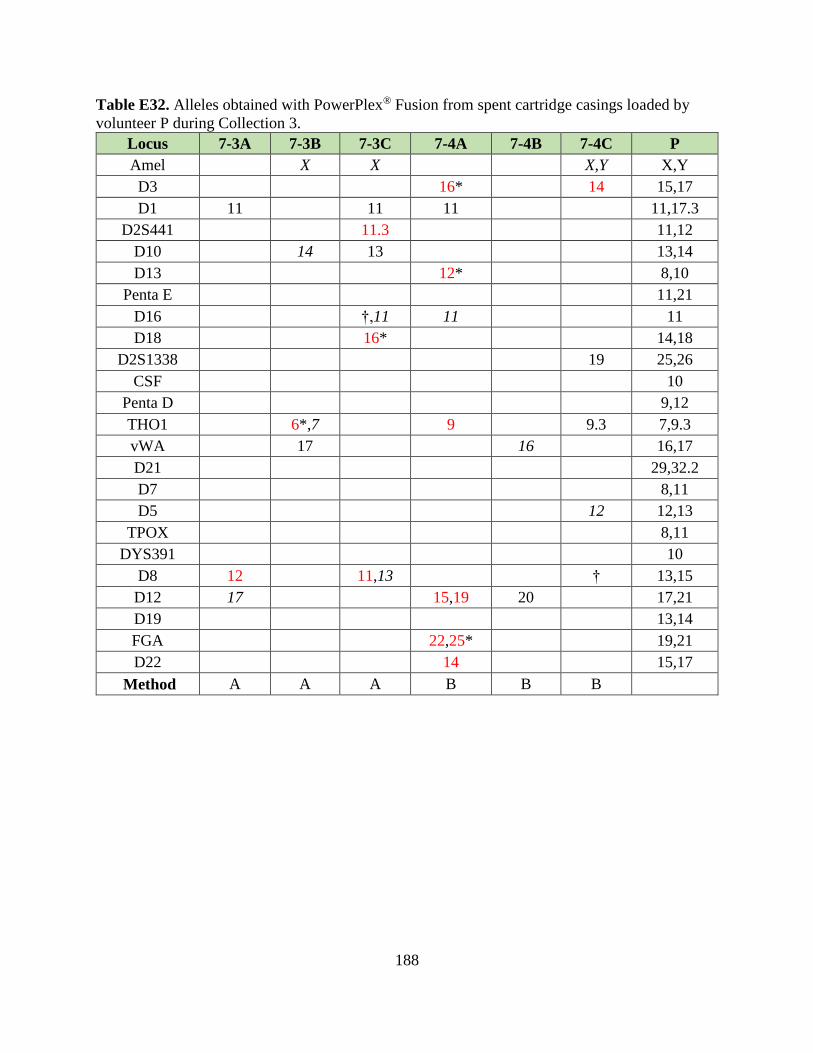
188
Table E32. Alleles obtained with PowerPlex® Fusion from spent cartridge casings loaded by
volunteer P during Collection 3.
Locus 7-3A 7-3B 7-3C 7-4A 7-4B 7-4C P
Amel X X X,Y X,Y
D3 16* 14 15,17
D1 11 11 11 11,17.3
D2S441 11.3 11,12
D10 14 13 13,14
D13 12* 8,10
Penta E 11,21
D16 †,11 11 11
D18 16* 14,18
D2S1338 19 25,26
CSF 10
Penta D 9,12
THO1 6*,7 9 9.3 7,9.3
vWA 17 16 16,17
D21 29,32.2
D7 8,11
D5 12 12,13
TPOX 8,11
DYS391 10
D8 12 11,13 † 13,15
D12 17 15,19 20 17,21
D19 13,14
FGA 22,25* 19,21
D22 14 15,17
Method A A A B B B
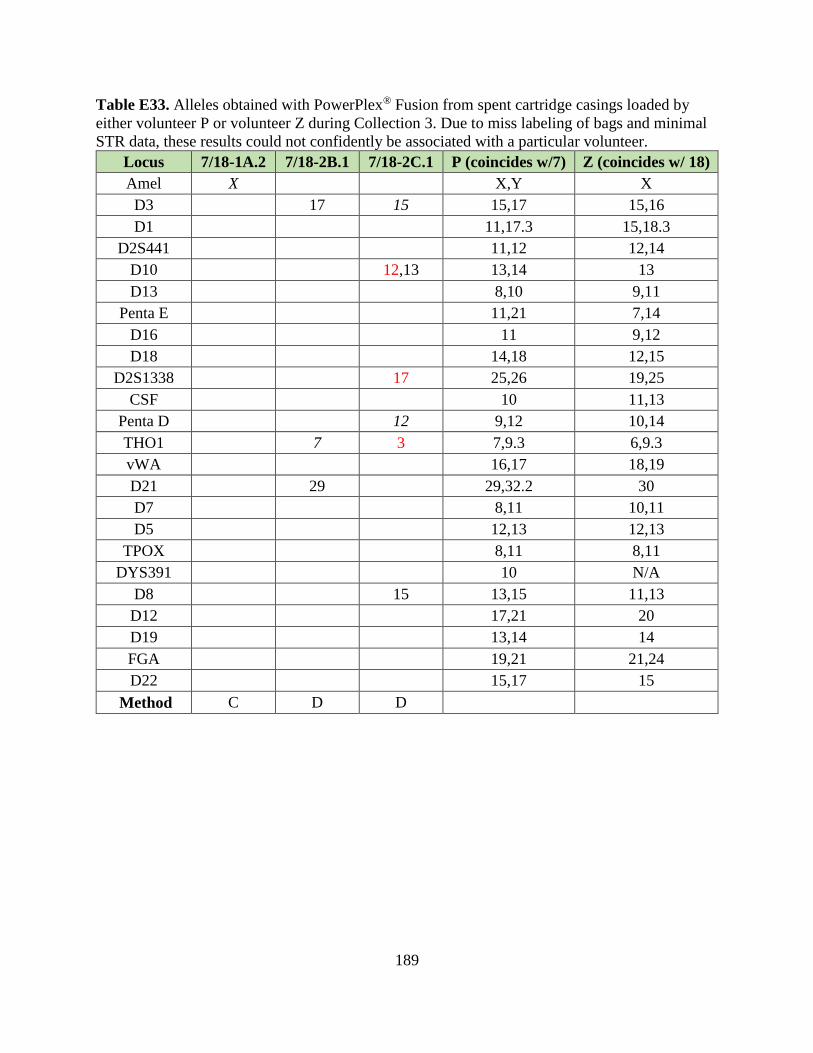
189
Table E33. Alleles obtained with PowerPlex® Fusion from spent cartridge casings loaded by
either volunteer P or volunteer Z during Collection 3. Due to miss labeling of bags and minimal
STR data, these results could not confidently be associated with a particular volunteer.
Locus 7/18-1A.2 7/18-2B.1 7/18-2C.1 P (coincides w/7) Z (coincides w/ 18)
Amel X X,Y X
D3 17 15 15,17 15,16
D1 11,17.3 15,18.3
D2S441 11,12 12,14
D10 12,13 13,14 13
D13 8,10 9,11
Penta E 11,21 7,14
D16 11 9,12
D18 14,18 12,15
D2S1338 17 25,26 19,25
CSF 10 11,13
Penta D 12 9,12 10,14
THO1 7 3 7,9.3 6,9.3
vWA 16,17 18,19
D21 29 29,32.2 30
D7 8,11 10,11
D5 12,13 12,13
TPOX 8,11 8,11
DYS391 10 N/A
D8 15 13,15 11,13
D12 17,21 20
D19 13,14 14
FGA 19,21 21,24
D22 15,17 15
Method C D D
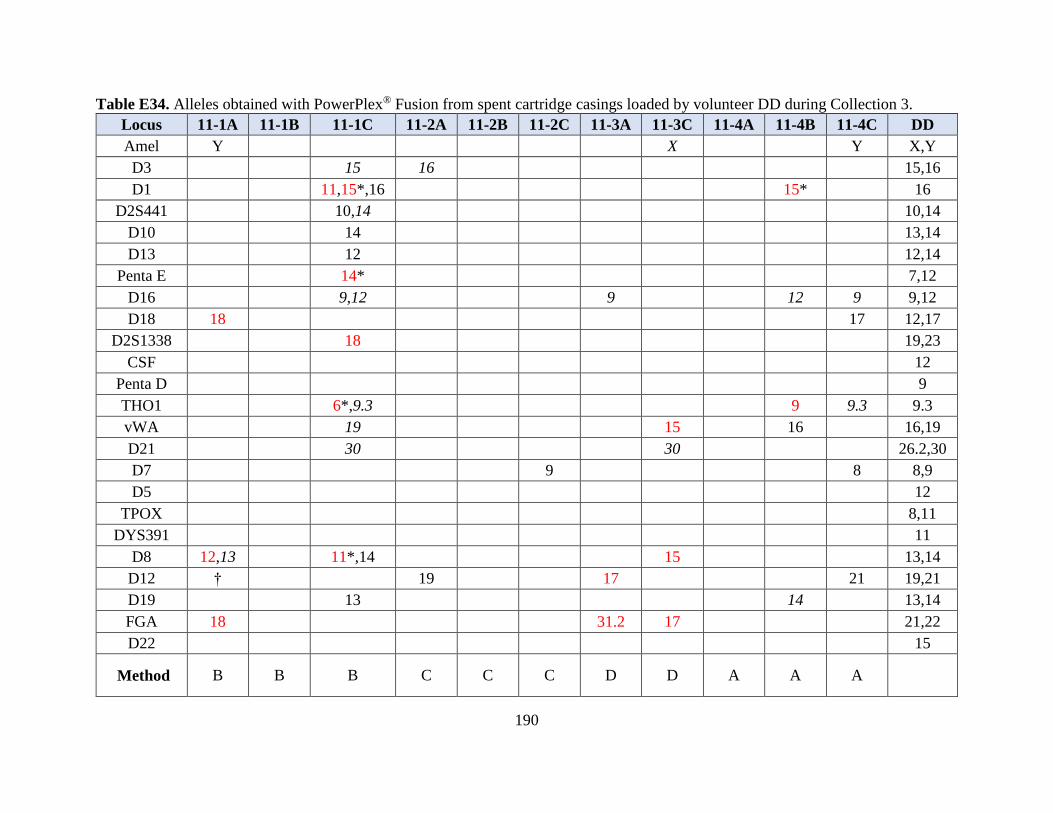
190
Table E34. Alleles obtained with PowerPlex® Fusion from spent cartridge casings loaded by volunteer DD during Collection 3.
Locus 11-1A 11-1B 11-1C 11-2A 11-2B 11-2C 11-3A 11-3C 11-4A 11-4B 11-4C DD
Amel Y X Y X,Y
D3 15 16 15,16
D1 11,15*,16 15* 16
D2S441 10,14 10,14
D10 14 13,14
D13 12 12,14
Penta E 14* 7,12
D16 9,12 9 12 9 9,12
D18 18 17 12,17
D2S1338 18 19,23
CSF 12
Penta D 9
THO1 6*,9.3 9 9.3 9.3
vWA 19 15 16 16,19
D21 30 30 26.2,30
D7 9 8 8,9
D5 12
TPOX 8,11
DYS391 11
D8 12,13 11*,14 15 13,14
D12 † 19 17 21 19,21
D19 13 14 13,14
FGA 18 31.2 17 21,22
D22 15
Method B B B C C C D D A A A
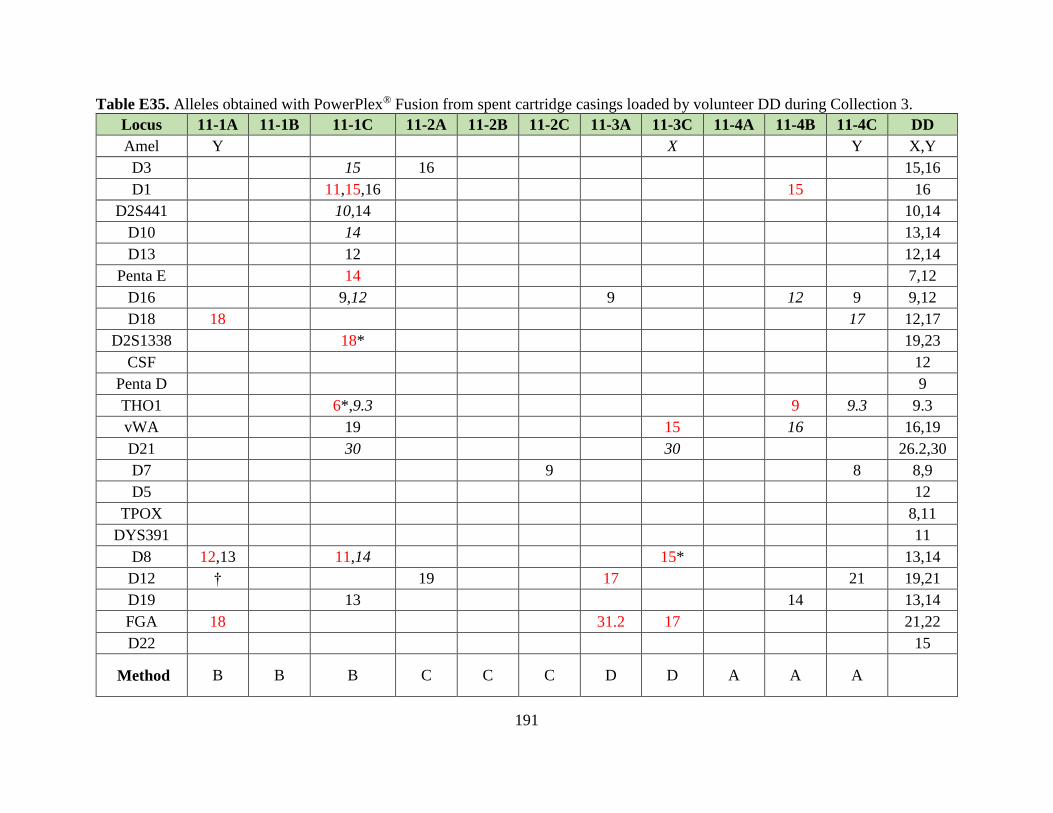
191
Table E35. Alleles obtained with PowerPlex® Fusion from spent cartridge casings loaded by volunteer DD during Collection 3.
Locus 11-1A 11-1B 11-1C 11-2A 11-2B 11-2C 11-3A 11-3C 11-4A 11-4B 11-4C DD
Amel Y X Y X,Y
D3 15 16 15,16
D1 11,15,16 15 16
D2S441 10,14 10,14
D10 14 13,14
D13 12 12,14
Penta E 14 7,12
D16 9,12 9 12 9 9,12
D18 18 17 12,17
D2S1338 18* 19,23
CSF 12
Penta D 9
THO1 6*,9.3 9 9.3 9.3
vWA 19 15 16 16,19
D21 30 30 26.2,30
D7 9 8 8,9
D5 12
TPOX 8,11
DYS391 11
D8 12,13 11,14 15* 13,14
D12 † 19 17 21 19,21
D19 13 14 13,14
FGA 18 31.2 17 21,22
D22 15
Method B B B C C C D D A A A
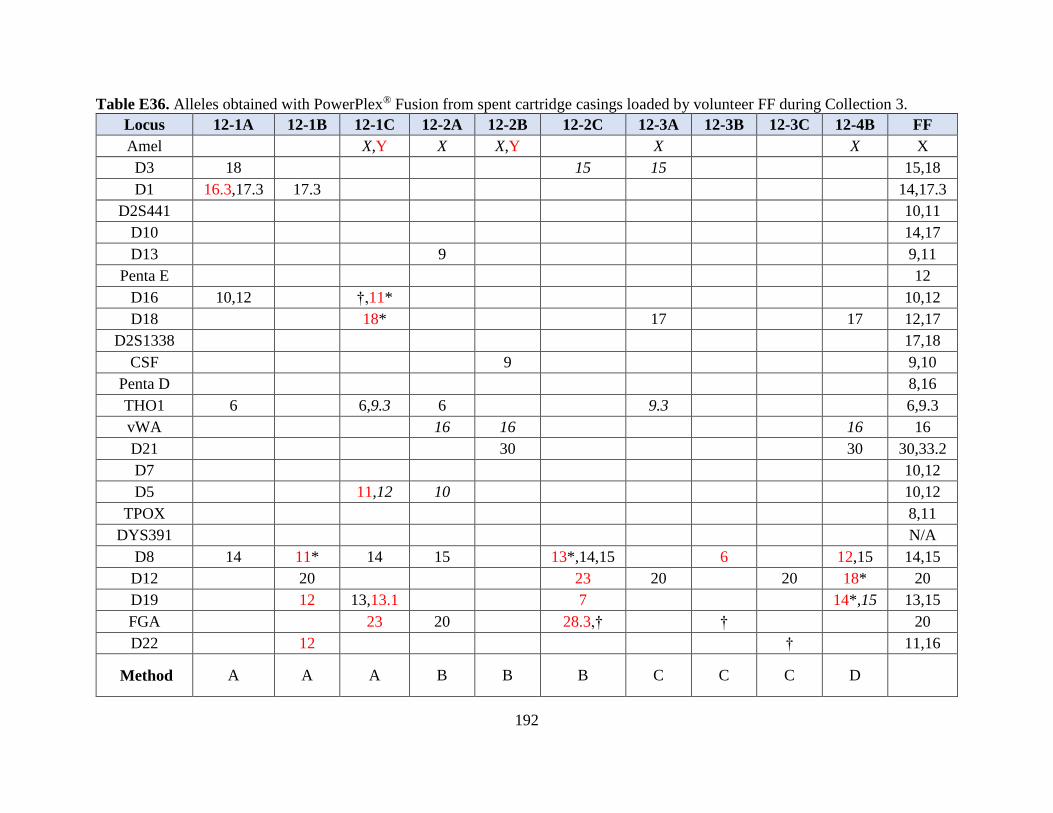
192
Table E36. Alleles obtained with PowerPlex® Fusion from spent cartridge casings loaded by volunteer FF during Collection 3.
Locus 12-1A 12-1B 12-1C 12-2A 12-2B 12-2C 12-3A 12-3B 12-3C 12-4B FF
Amel X,Y X X,Y X X X
D3 18 15 15 15,18
D1 16.3,17.3 17.3 14,17.3
D2S441 10,11
D10 14,17
D13 9 9,11
Penta E 12
D16 10,12 †,11* 10,12
D18 18* 17 17 12,17
D2S1338 17,18
CSF 9 9,10
Penta D 8,16
THO1 6 6,9.3 6 9.3 6,9.3
vWA 16 16 16 16
D21 30 30 30,33.2
D7 10,12
D5 11,12 10 10,12
TPOX 8,11
DYS391 N/A
D8 14 11* 14 15 13*,14,15 6 12,15 14,15
D12 20 23 20 20 18* 20
D19 12 13,13.1 7 14*,15 13,15
FGA 23 20 28.3,† † 20
D22 12 † 11,16
Method A A A B B B C C C D
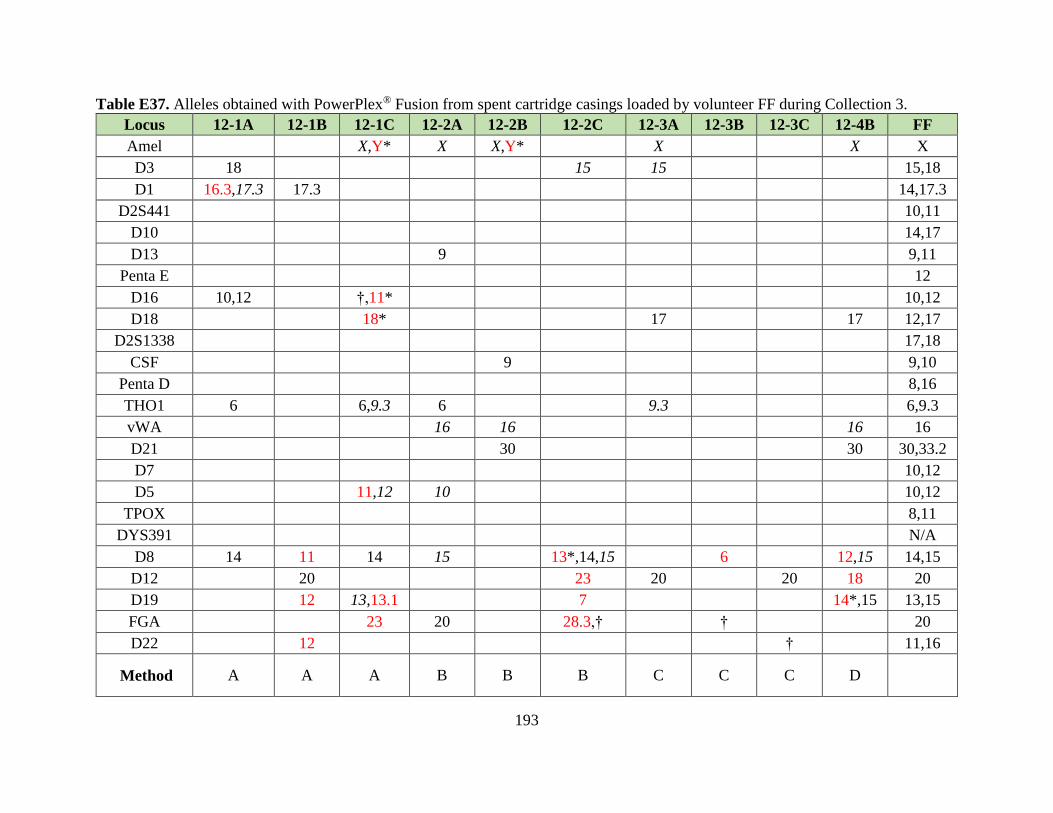
193
Table E37. Alleles obtained with PowerPlex® Fusion from spent cartridge casings loaded by volunteer FF during Collection 3.
Locus 12-1A 12-1B 12-1C 12-2A 12-2B 12-2C 12-3A 12-3B 12-3C 12-4B FF
Amel X,Y* X X,Y* X X X
D3 18 15 15 15,18
D1 16.3,17.3 17.3 14,17.3
D2S441 10,11
D10 14,17
D13 9 9,11
Penta E 12
D16 10,12 †,11* 10,12
D18 18* 17 17 12,17
D2S1338 17,18
CSF 9 9,10
Penta D 8,16
THO1 6 6,9.3 6 9.3 6,9.3
vWA 16 16 16 16
D21 30 30 30,33.2
D7 10,12
D5 11,12 10 10,12
TPOX 8,11
DYS391 N/A
D8 14 11 14 15 13*,14,15 6 12,15 14,15
D12 20 23 20 20 18 20
D19 12 13,13.1 7 14*,15 13,15
FGA 23 20 28.3,† † 20
D22 12 † 11,16
Method A A A B B B C C C D
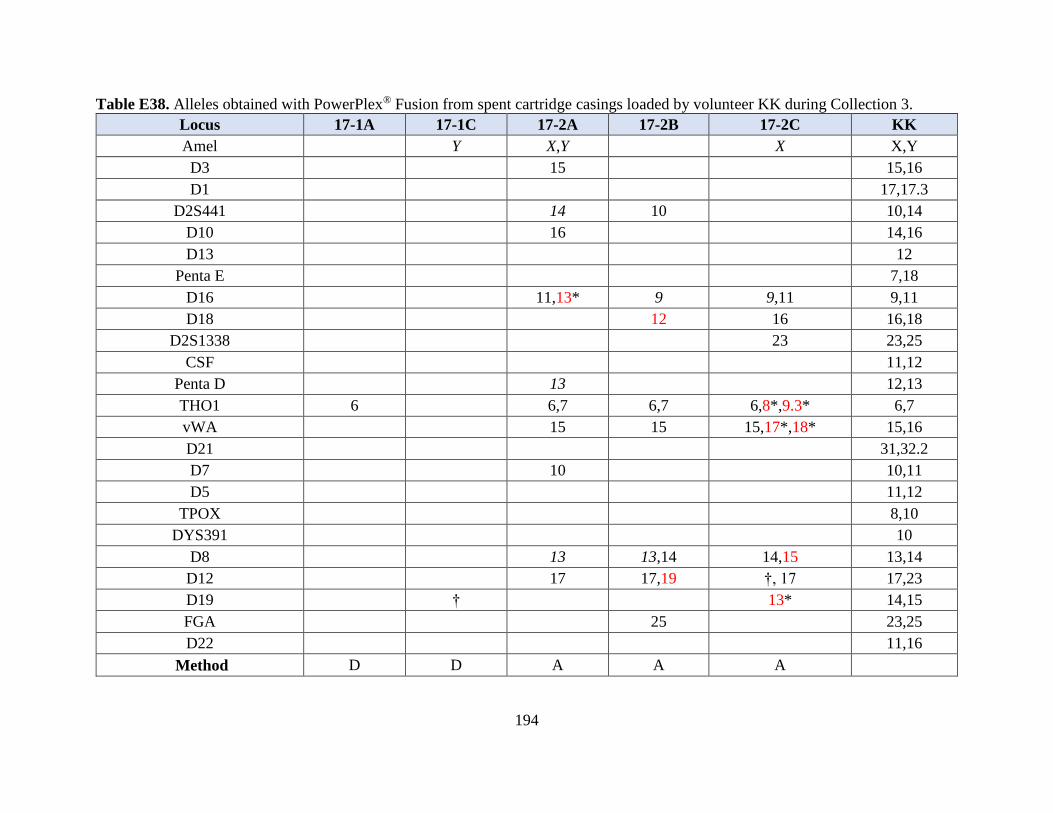
194
Table E38. Alleles obtained with PowerPlex® Fusion from spent cartridge casings loaded by volunteer KK during Collection 3.
Locus 17-1A 17-1C 17-2A 17-2B 17-2C KK
Amel Y X,Y X X,Y
D3 15 15,16
D1 17,17.3
D2S441 14 10 10,14
D10 16 14,16
D13 12
Penta E 7,18
D16 11,13* 9 9,11 9,11
D18 12 16 16,18
D2S1338 23 23,25
CSF 11,12
Penta D 13 12,13
THO1 6 6,7 6,7 6,8*,9.3* 6,7
vWA 15 15 15,17*,18* 15,16
D21 31,32.2
D7 10 10,11
D5 11,12
TPOX 8,10
DYS391 10
D8 13 13,14 14,15 13,14
D12 17 17,19 †, 17 17,23
D19 † 13* 14,15
FGA 25 23,25
D22 11,16
Method D D A A A
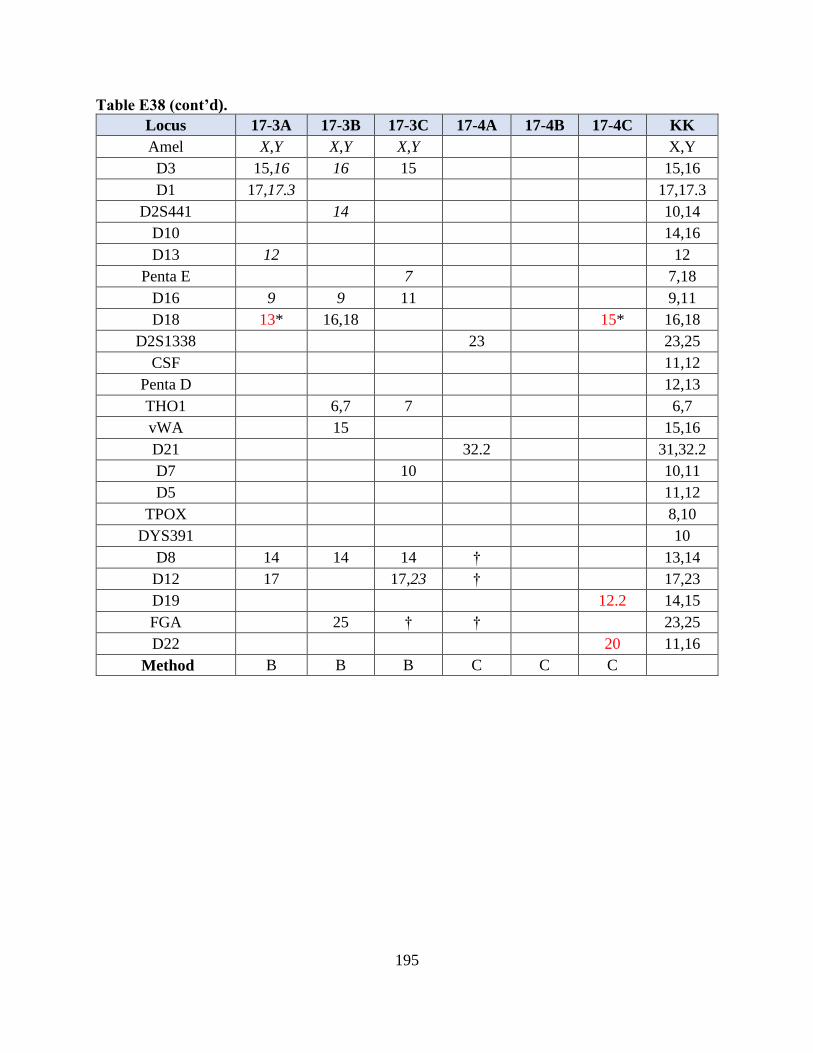
195
Table E38 (cont’d).
Locus 17-3A 17-3B 17-3C 17-4A 17-4B 17-4C KK
Amel X,Y X,Y X,Y X,Y
D3 15,16 16 15 15,16
D1 17,17.3 17,17.3
D2S441 14 10,14
D10 14,16
D13 12 12
Penta E 7 7,18
D16 9 9 11 9,11
D18 13* 16,18 15* 16,18
D2S1338 23 23,25
CSF 11,12
Penta D 12,13
THO1 6,7 7 6,7
vWA 15 15,16
D21 32.2 31,32.2
D7 10 10,11
D5 11,12
TPOX 8,10
DYS391 10
D8 14 14 14 † 13,14
D12 17 17,23 † 17,23
D19 12.2 14,15
FGA 25 † † 23,25
D22 20 11,16
Method B B B C C C
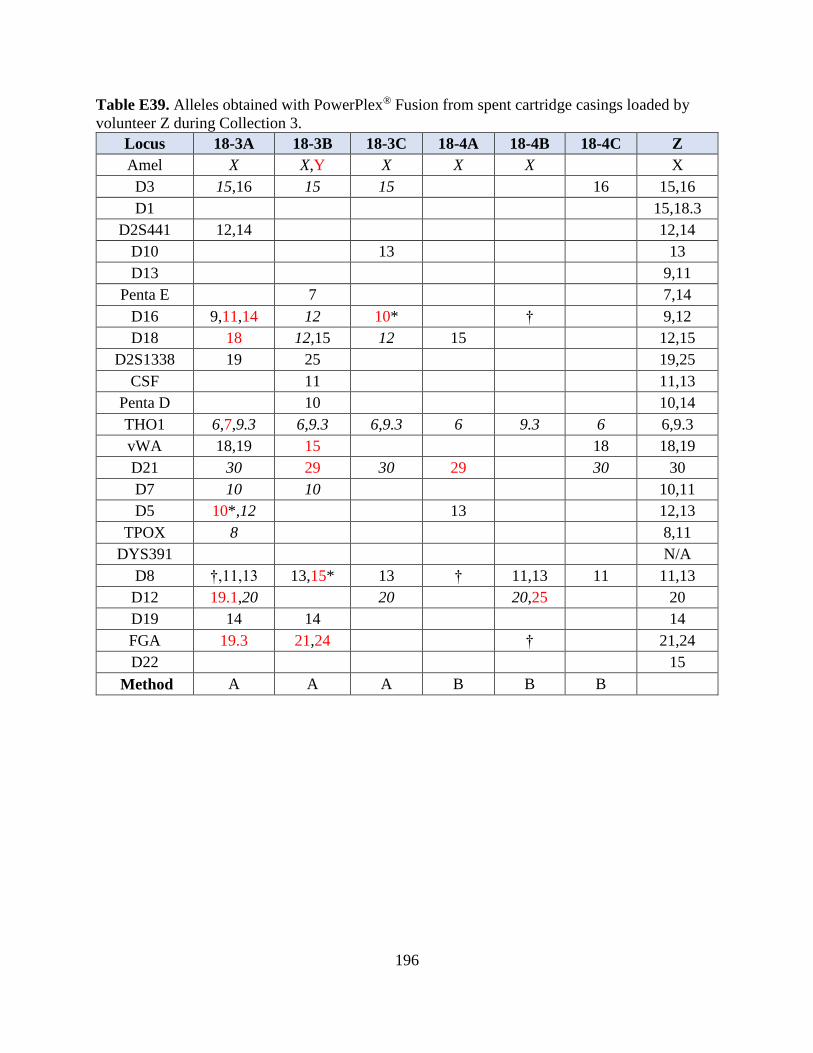
196
Table E39. Alleles obtained with PowerPlex® Fusion from spent cartridge casings loaded by
volunteer Z during Collection 3.
Locus 18-3A 18-3B 18-3C 18-4A 18-4B 18-4C Z
Amel X X,Y X X X X
D3 15,16 15 15 16 15,16
D1 15,18.3
D2S441 12,14 12,14
D10 13 13
D13 9,11
Penta E 7 7,14
D16 9,11,14 12 10* † 9,12
D18 18 12,15 12 15 12,15
D2S1338 19 25 19,25
CSF 11 11,13
Penta D 10 10,14
THO1 6,7,9.3 6,9.3 6,9.3 6 9.3 6 6,9.3
vWA 18,19 15 18 18,19
D21 30 29 30 29 30 30
D7 10 10 10,11
D5 10*,12 13 12,13
TPOX 8 8,11
DYS391 N/A
D8 †,11,13 13,15* 13 † 11,13 11 11,13
D12 19.1,20 20 20,25 20
D19 14 14 14
FGA 19.3 21,24 † 21,24
D22 15
Method A A A B B B
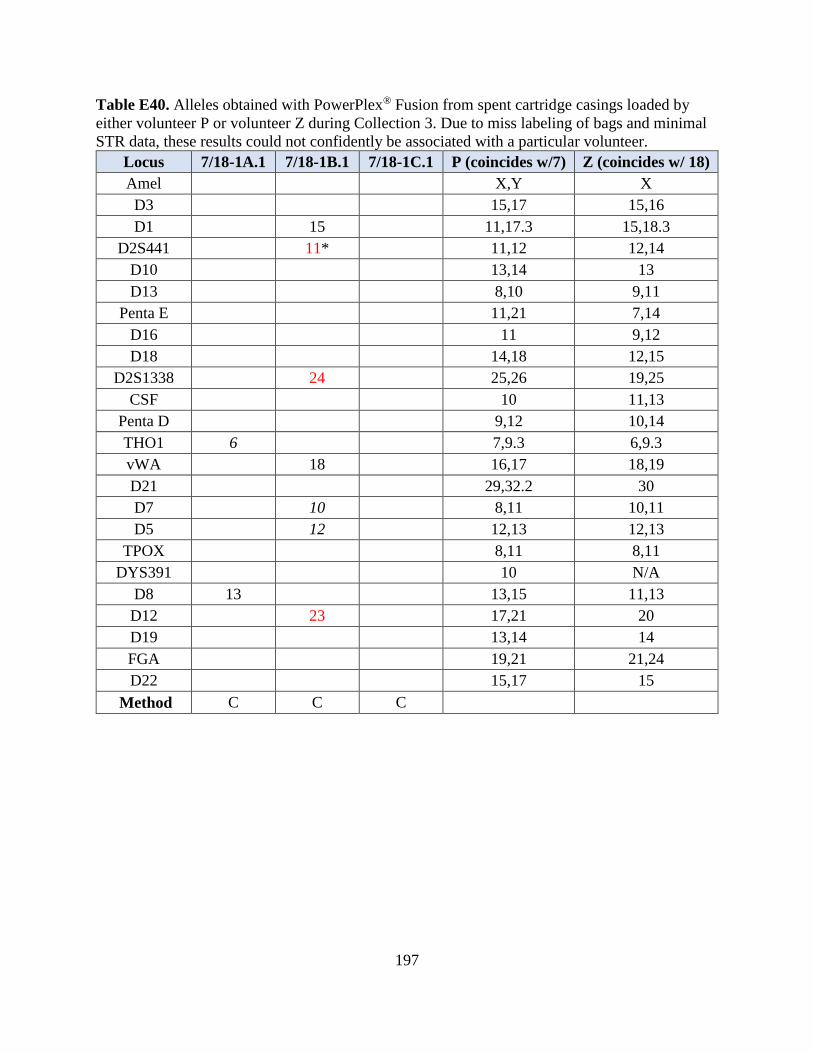
197
Table E40. Alleles obtained with PowerPlex® Fusion from spent cartridge casings loaded by
either volunteer P or volunteer Z during Collection 3. Due to miss labeling of bags and minimal
STR data, these results could not confidently be associated with a particular volunteer.
Locus 7/18-1A.1 7/18-1B.1 7/18-1C.1 P (coincides w/7) Z (coincides w/ 18)
Amel X,Y X
D3 15,17 15,16
D1 15 11,17.3 15,18.3
D2S441 11* 11,12 12,14
D10 13,14 13
D13 8,10 9,11
Penta E 11,21 7,14
D16 11 9,12
D18 14,18 12,15
D2S1338 24 25,26 19,25
CSF 10 11,13
Penta D 9,12 10,14
THO1 6 7,9.3 6,9.3
vWA 18 16,17 18,19
D21 29,32.2 30
D7 10 8,11 10,11
D5 12 12,13 12,13
TPOX 8,11 8,11
DYS391 10 N/A
D8 13 13,15 11,13
D12 23 17,21 20
D19 13,14 14
FGA 19,21 21,24
D22 15,17 15
Method C C C
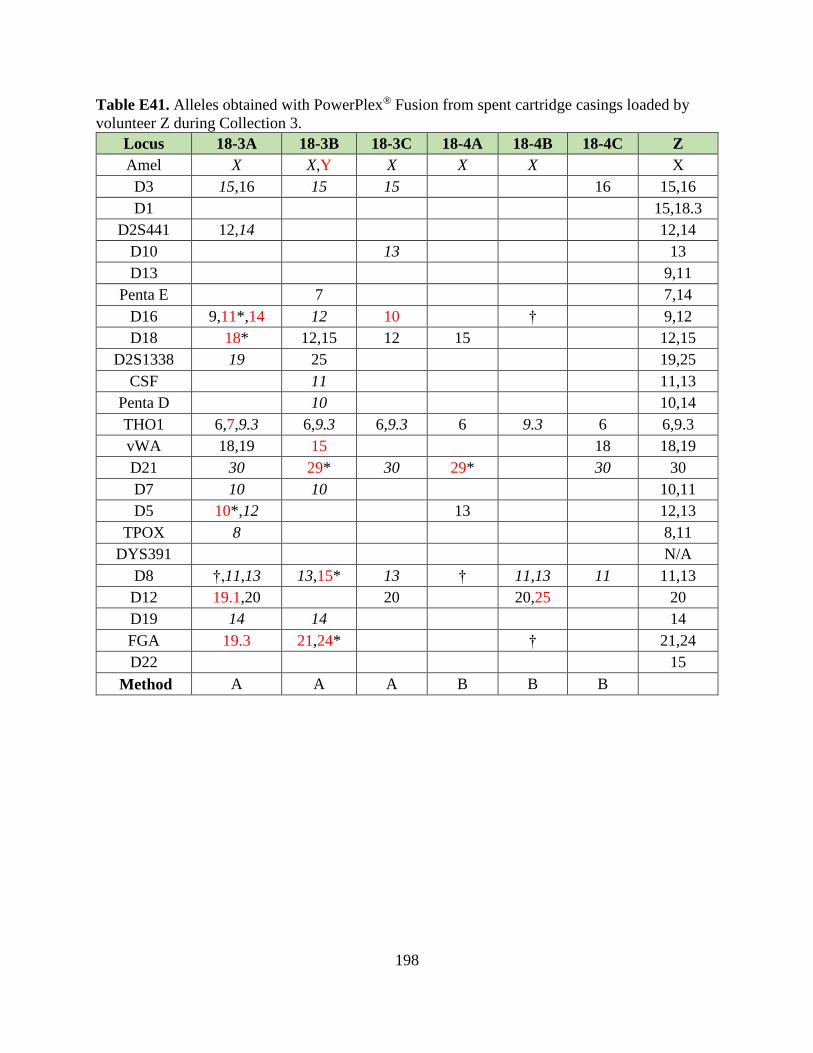
198
Table E41. Alleles obtained with PowerPlex® Fusion from spent cartridge casings loaded by
volunteer Z during Collection 3.
Locus 18-3A 18-3B 18-3C 18-4A 18-4B 18-4C Z
Amel X X,Y X X X X
D3 15,16 15 15 16 15,16
D1 15,18.3
D2S441 12,14 12,14
D10 13 13
D13 9,11
Penta E 7 7,14
D16 9,11*,14 12 10 † 9,12
D18 18* 12,15 12 15 12,15
D2S1338 19 25 19,25
CSF 11 11,13
Penta D 10 10,14
THO1 6,7,9.3 6,9.3 6,9.3 6 9.3 6 6,9.3
vWA 18,19 15 18 18,19
D21 30 29* 30 29* 30 30
D7 10 10 10,11
D5 10*,12 13 12,13
TPOX 8 8,11
DYS391 N/A
D8 †,11,13 13,15* 13 † 11,13 11 11,13
D12 19.1,20 20 20,25 20
D19 14 14 14
FGA 19.3 21,24* † 21,24
D22 15
Method A A A B B B
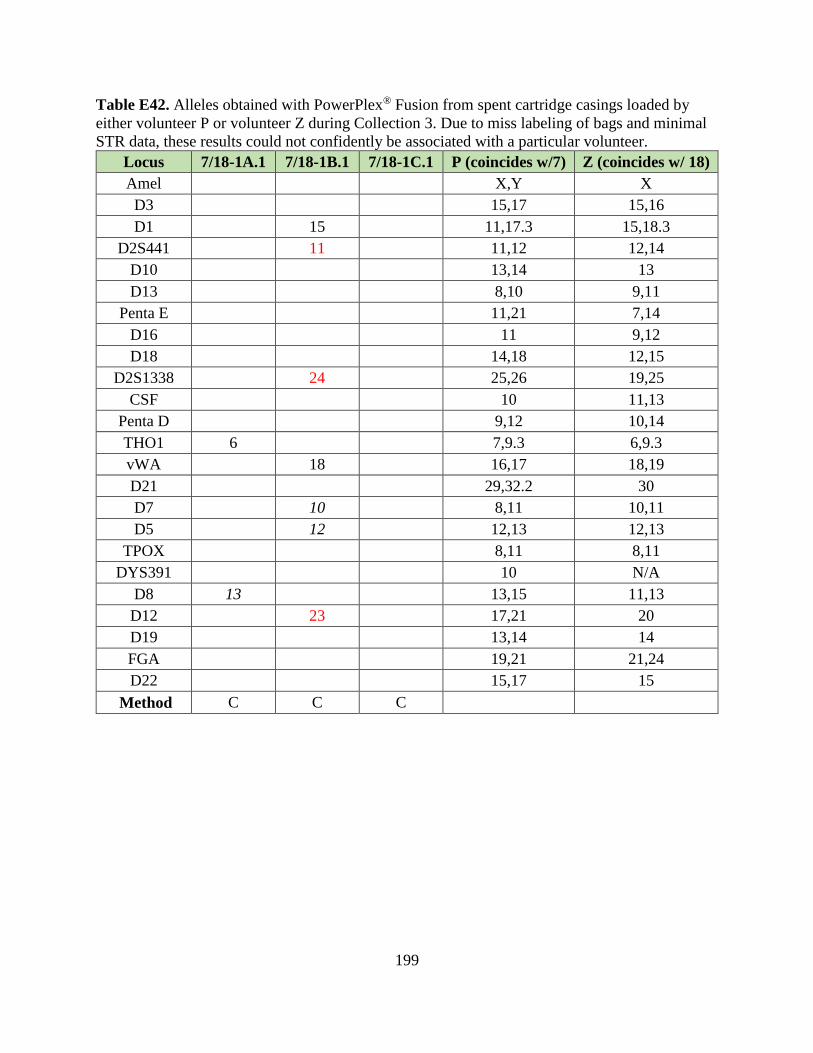
199
Table E42. Alleles obtained with PowerPlex® Fusion from spent cartridge casings loaded by
either volunteer P or volunteer Z during Collection 3. Due to miss labeling of bags and minimal
STR data, these results could not confidently be associated with a particular volunteer.
Locus 7/18-1A.1 7/18-1B.1 7/18-1C.1 P (coincides w/7) Z (coincides w/ 18)
Amel X,Y X
D3 15,17 15,16
D1 15 11,17.3 15,18.3
D2S441 11 11,12 12,14
D10 13,14 13
D13 8,10 9,11
Penta E 11,21 7,14
D16 11 9,12
D18 14,18 12,15
D2S1338 24 25,26 19,25
CSF 10 11,13
Penta D 9,12 10,14
THO1 6 7,9.3 6,9.3
vWA 18 16,17 18,19
D21 29,32.2 30
D7 10 8,11 10,11
D5 12 12,13 12,13
TPOX 8,11 8,11
DYS391 10 N/A
D8 13 13,15 11,13
D12 23 17,21 20
D19 13,14 14
FGA 19,21 21,24
D22 15,17 15
Method C C C
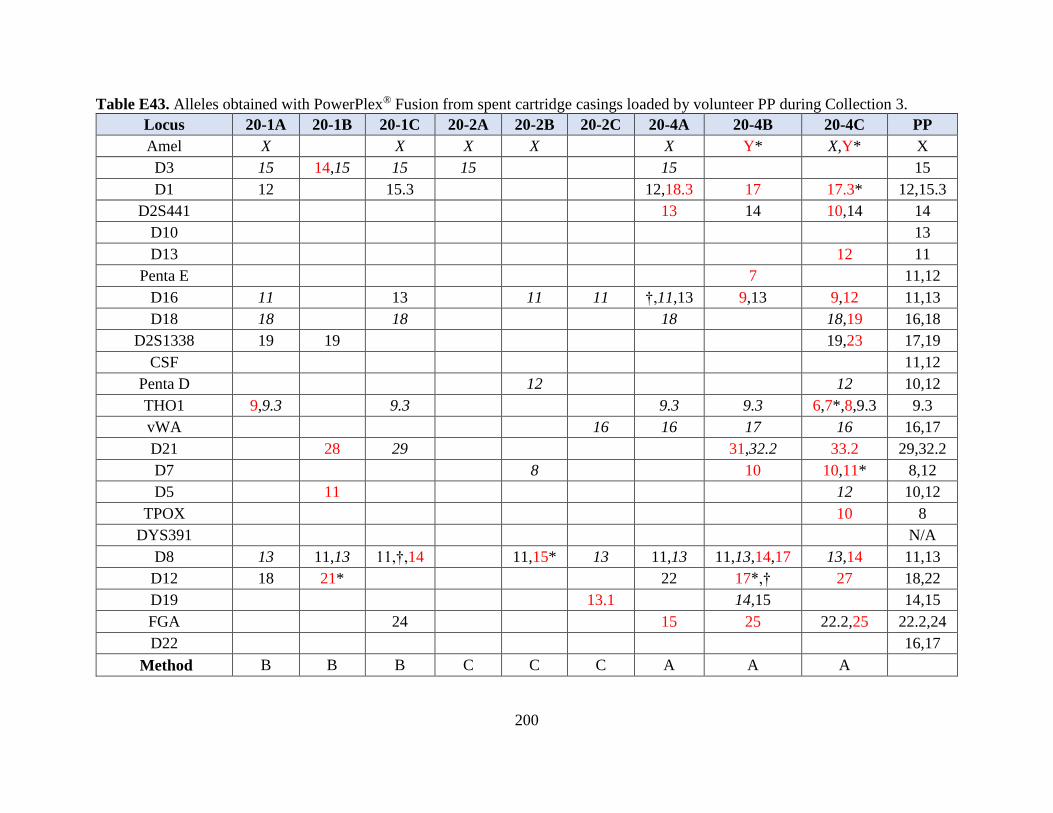
200
Table E43. Alleles obtained with PowerPlex® Fusion from spent cartridge casings loaded by volunteer PP during Collection 3.
Locus 20-1A 20-1B 20-1C 20-2A 20-2B 20-2C 20-4A 20-4B 20-4C PP
Amel X X X X X Y* X,Y* X
D3 15 14,15 15 15 15 15
D1 12 15.3 12,18.3 17 17.3* 12,15.3
D2S441 13 14 10,14 14
D10 13
D13 12 11
Penta E 7 11,12
D16 11 13 11 11 †,11,13 9,13 9,12 11,13
D18 18 18 18 18,19 16,18
D2S1338 19 19 19,23 17,19
CSF 11,12
Penta D 12 12 10,12
THO1 9,9.3 9.3 9.3 9.3 6,7*,8,9.3 9.3
vWA 16 16 17 16 16,17
D21 28 29 31,32.2 33.2 29,32.2
D7 8 10 10,11* 8,12
D5 11 12 10,12
TPOX 10 8
DYS391 N/A
D8 13 11,13 11,†,14 11,15* 13 11,13 11,13,14,17 13,14 11,13
D12 18 21* 22 17*,† 27 18,22
D19 13.1 14,15 14,15
FGA 24 15 25 22.2,25 22.2,24
D22 16,17
Method B B B C C C A A A
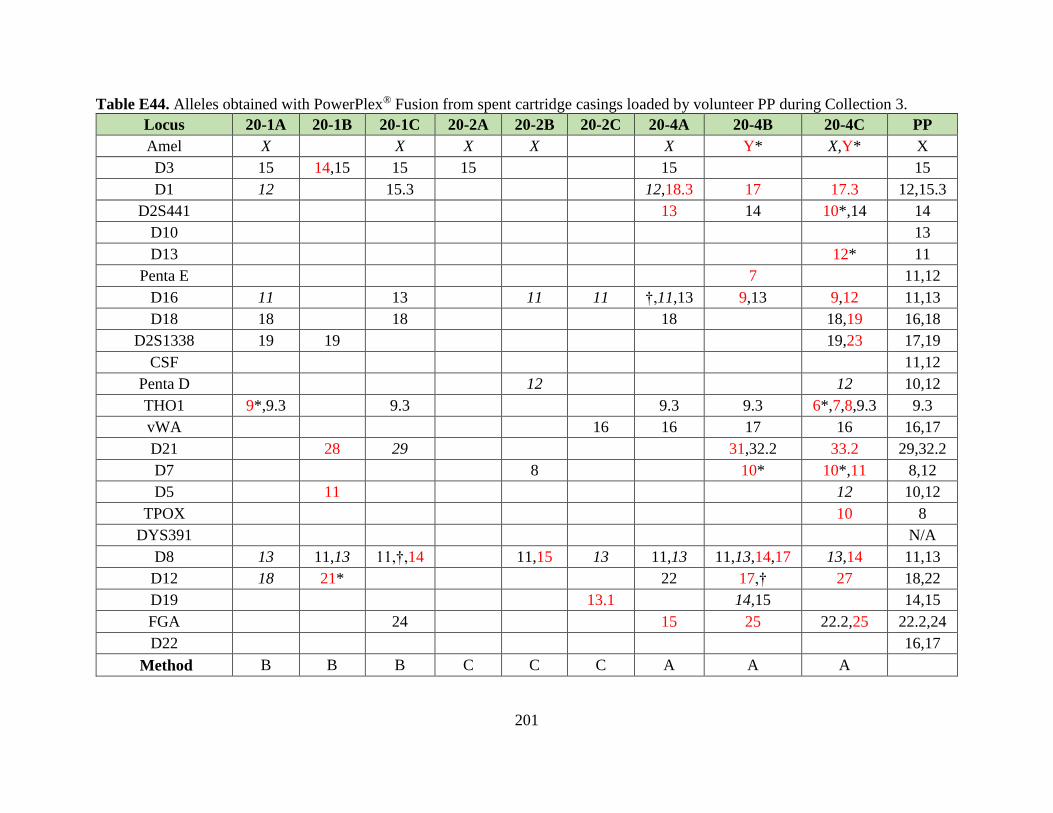
201
Table E44. Alleles obtained with PowerPlex® Fusion from spent cartridge casings loaded by volunteer PP during Collection 3.
Locus 20-1A 20-1B 20-1C 20-2A 20-2B 20-2C 20-4A 20-4B 20-4C PP
Amel X X X X X Y* X,Y* X
D3 15 14,15 15 15 15 15
D1 12 15.3 12,18.3 17 17.3 12,15.3
D2S441 13 14 10*,14 14
D10 13
D13 12* 11
Penta E 7 11,12
D16 11 13 11 11 †,11,13 9,13 9,12 11,13
D18 18 18 18 18,19 16,18
D2S1338 19 19 19,23 17,19
CSF 11,12
Penta D 12 12 10,12
THO1 9*,9.3 9.3 9.3 9.3 6*,7,8,9.3 9.3
vWA 16 16 17 16 16,17
D21 28 29 31,32.2 33.2 29,32.2
D7 8 10* 10*,11 8,12
D5 11 12 10,12
TPOX 10 8
DYS391 N/A
D8 13 11,13 11,†,14 11,15 13 11,13 11,13,14,17 13,14 11,13
D12 18 21* 22 17,† 27 18,22
D19 13.1 14,15 14,15
FGA 24 15 25 22.2,25 22.2,24
D22 16,17
Method B B B C C C A A A
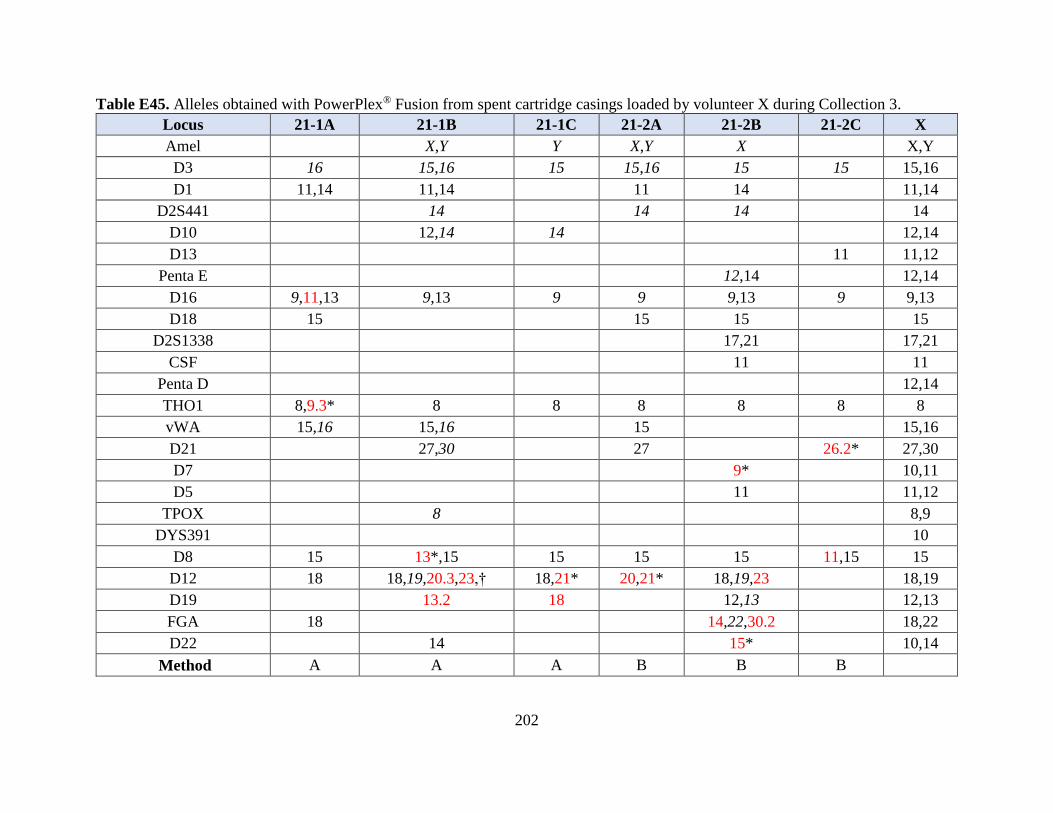
202
Table E45. Alleles obtained with PowerPlex® Fusion from spent cartridge casings loaded by volunteer X during Collection 3.
Locus 21-1A 21-1B 21-1C 21-2A 21-2B 21-2C X
Amel X,Y Y X,Y X X,Y
D3 16 15,16 15 15,16 15 15 15,16
D1 11,14 11,14 11 14 11,14
D2S441 14 14 14 14
D10 12,14 14 12,14
D13 11 11,12
Penta E 12,14 12,14
D16 9,11,13 9,13 9 9 9,13 9 9,13
D18 15 15 15 15
D2S1338 17,21 17,21
CSF 11 11
Penta D 12,14
THO1 8,9.3* 8 8 8 8 8 8
vWA 15,16 15,16 15 15,16
D21 27,30 27 26.2* 27,30
D7 9* 10,11
D5 11 11,12
TPOX 8 8,9
DYS391 10
D8 15 13*,15 15 15 15 11,15 15
D12 18 18,19,20.3,23,† 18,21* 20,21* 18,19,23 18,19
D19 13.2 18 12,13 12,13
FGA 18 14,22,30.2 18,22
D22 14 15* 10,14
Method A A A B B B
203
Table E45 (cont’d).
Locus 21-3A 21-3B 21-3C 21-4A X
Amel Y X,Y
D3 15,16 15 15,16
D1 11 11,14 17.3 11,14
D2S441 14 11 14
D10 12 12,14
D13 11,12
Penta E 12,14
D16 9,13 13 9,13 11 9,13
D18 15 15 15
D2S1338 17 17,21
CSF 11
Penta D 12,14
THO1 8 8 9 8
vWA 16 15,16
D21 27 30 27,30
D7 11 10,11
D5 11,12
TPOX 8,9
DYS391 10
D8 10,13.2,15 9,15 15 15
D12 †,19 19 18,18.3,† 18,19
D19 16.2 12,13
FGA † 19 18,22
D22 12 † 10,14
Method C C C D
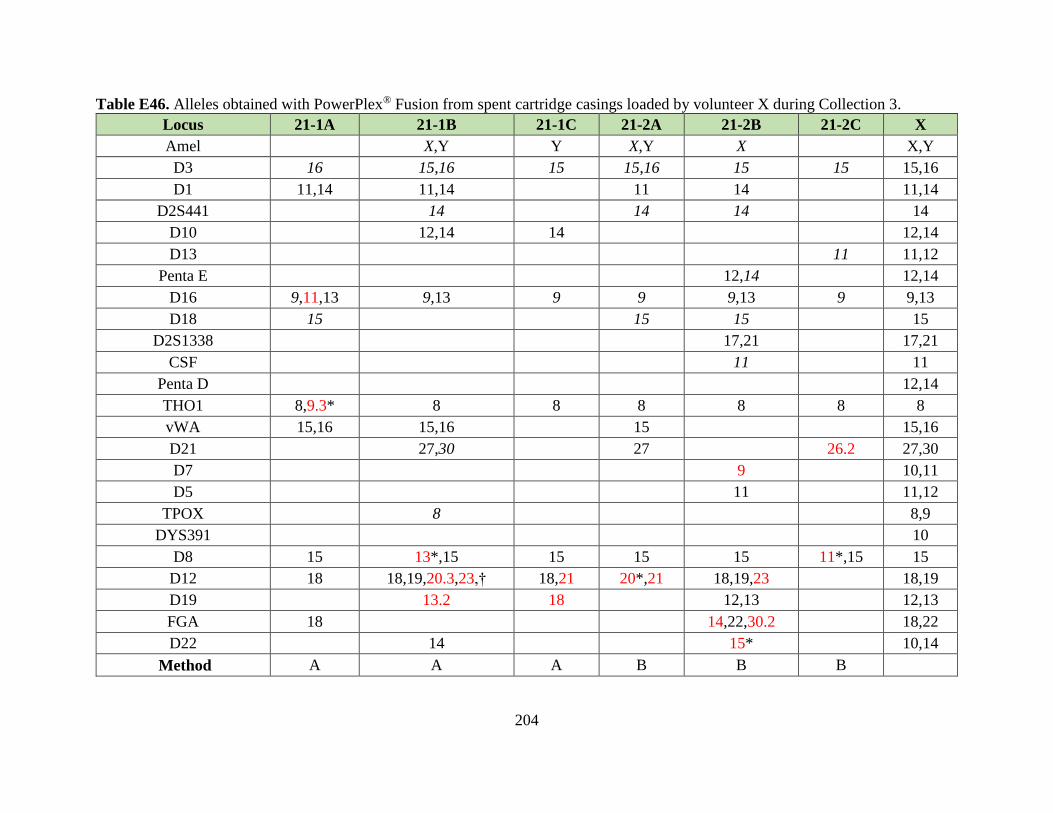
204
Table E46. Alleles obtained with PowerPlex® Fusion from spent cartridge casings loaded by volunteer X during Collection 3.
Locus 21-1A 21-1B 21-1C 21-2A 21-2B 21-2C X
Amel X,Y Y X,Y X X,Y
D3 16 15,16 15 15,16 15 15 15,16
D1 11,14 11,14 11 14 11,14
D2S441 14 14 14 14
D10 12,14 14 12,14
D13 11 11,12
Penta E 12,14 12,14
D16 9,11,13 9,13 9 9 9,13 9 9,13
D18 15 15 15 15
D2S1338 17,21 17,21
CSF 11 11
Penta D 12,14
THO1 8,9.3* 8 8 8 8 8 8
vWA 15,16 15,16 15 15,16
D21 27,30 27 26.2 27,30
D7 9 10,11
D5 11 11,12
TPOX 8 8,9
DYS391 10
D8 15 13*,15 15 15 15 11*,15 15
D12 18 18,19,20.3,23,† 18,21 20*,21 18,19,23 18,19
D19 13.2 18 12,13 12,13
FGA 18 14,22,30.2 18,22
D22 14 15* 10,14
Method A A A B B B
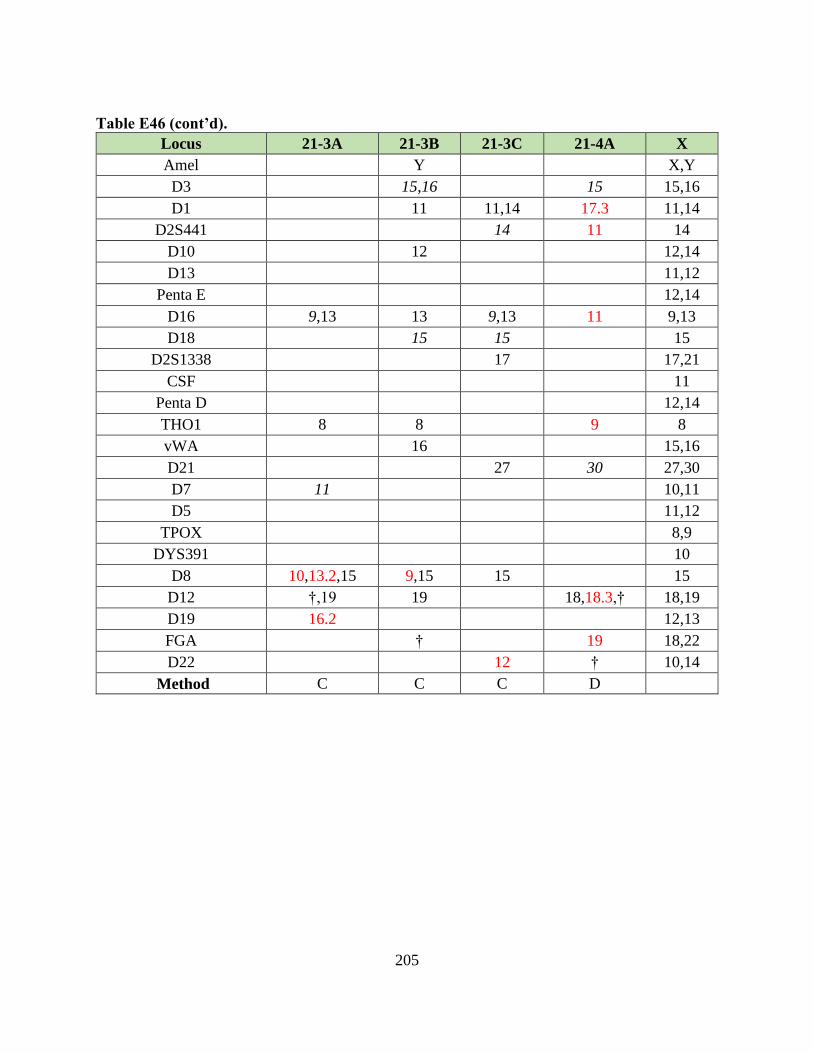
205
Table E46 (cont’d).
Locus 21-3A 21-3B 21-3C 21-4A X
Amel Y X,Y
D3 15,16 15 15,16
D1 11 11,14 17.3 11,14
D2S441 14 11 14
D10 12 12,14
D13 11,12
Penta E 12,14
D16 9,13 13 9,13 11 9,13
D18 15 15 15
D2S1338 17 17,21
CSF 11
Penta D 12,14
THO1 8 8 9 8
vWA 16 15,16
D21 27 30 27,30
D7 11 10,11
D5 11,12
TPOX 8,9
DYS391 10
D8 10,13.2,15 9,15 15 15
D12 †,19 19 18,18.3,† 18,19
D19 16.2 12,13
FGA † 19 18,22
D22 12 † 10,14
Method C C C D
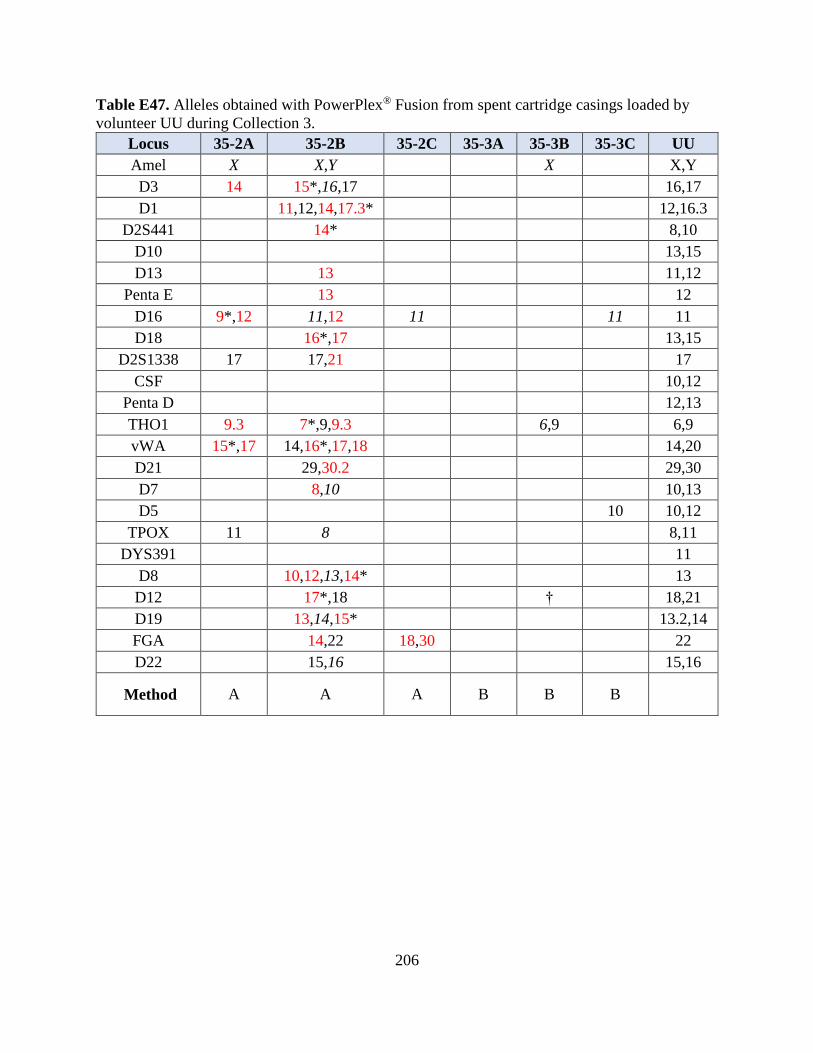
206
Table E47. Alleles obtained with PowerPlex® Fusion from spent cartridge casings loaded by
volunteer UU during Collection 3.
Locus 35-2A 35-2B 35-2C 35-3A 35-3B 35-3C UU
Amel X X,Y X X,Y
D3 14 15*,16,17 16,17
D1 11,12,14,17.3* 12,16.3
D2S441 14* 8,10
D10 13,15
D13 13 11,12
Penta E 13 12
D16 9*,12 11,12 11 11 11
D18 16*,17 13,15
D2S1338 17 17,21 17
CSF 10,12
Penta D 12,13
THO1 9.3 7*,9,9.3 6,9 6,9
vWA 15*,17 14,16*,17,18 14,20
D21 29,30.2 29,30
D7 8,10 10,13
D5 10 10,12
TPOX 11 8 8,11
DYS391 11
D8 10,12,13,14* 13
D12 17*,18 † 18,21
D19 13,14,15* 13.2,14
FGA 14,22 18,30 22
D22 15,16 15,16
Method A A A B B B
207
Table E48. Alleles obtained with PowerPlex® Fusion from spent cartridge casings loaded by
volunteer UU during Collection 3.
Locus 35-2A 35-2B 35-2C 35-3A 35-3B 35-3C UU
Amel X X,Y X X,Y
D3 14 15,16,17 16,17
D1 11,12,14,17.3* 12,16.3
D2S441 14* 8,10
D10 13,15
D13 13 11,12
Penta E 13 12
D16 9*,12 11,12 11 11 11
D18 16,17 13,15
D2S1338 17 17,21 17
CSF 10,12
Penta D 12,13
THO1 9.3* 7,9,9.3* 6,9 6,9
vWA 15,17* 14,16,17*,18* 14,20
D21 29,30.2 29,30
D7 8,10 10,13
D5 10 10,12
TPOX 11 8 8,11
DYS391 11
D8 10,12,13,14 13
D12 17,18 † 18,21
D19 13*,14,15* 13.2,14
FGA 14,22 18,30 22
D22 15,16 15,16
Method A A A B B B
208
APPENDIX F. CONSENSUS POWERPLEX® FUSION STR PROFILES
Red = non-loader allele
Italicized = allele is consistent with the loader but could have originated from the previous
loader
* = non-loader allele could have originated from the previous loader
† = off-ladder allele (each † symbol represents a different off-ladder allele)
N/A = not applicable
Blank = no alleles recovered at that locus
Con. = consensus profile
The cell recovery and DNA extraction method utilized to recover and extract DNAs from spent
cartridge casings is denoted with one of the following letters:
A = double swab + organic extraction
B = soak + organic extraction
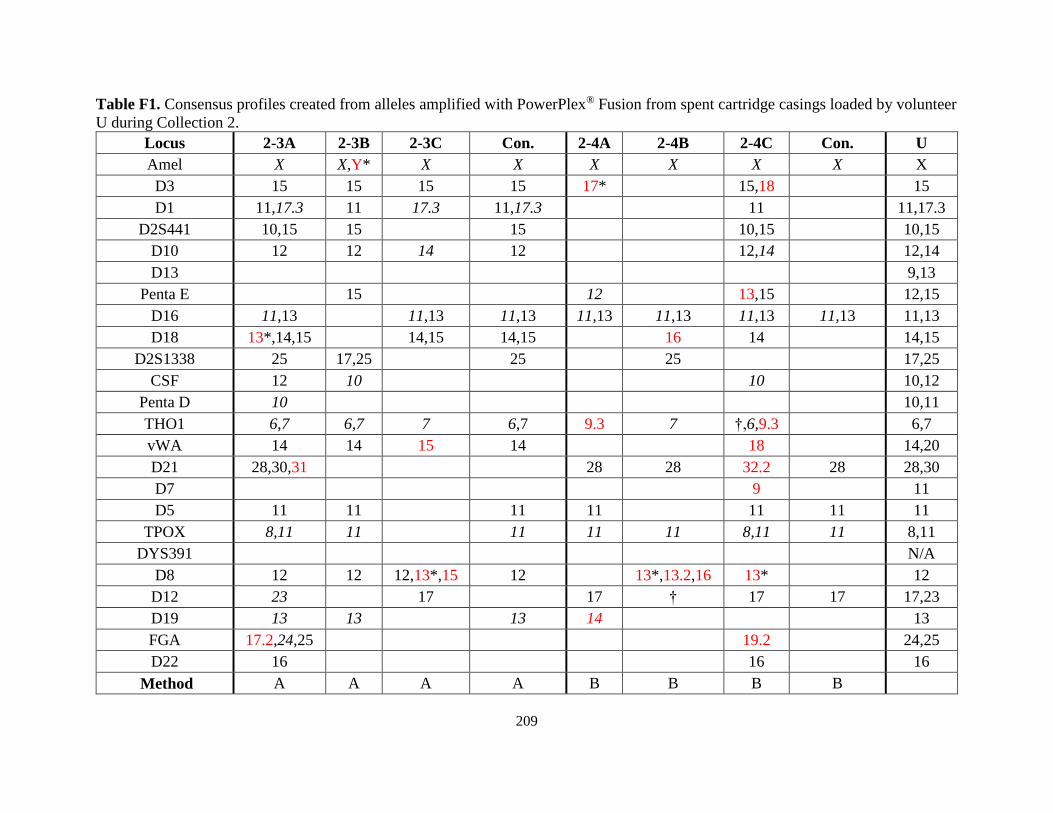
209
Table F1. Consensus profiles created from alleles amplified with PowerPlex® Fusion from spent cartridge casings loaded by volunteer
U during Collection 2.
Locus 2-3A 2-3B 2-3C Con. 2-4A 2-4B 2-4C Con. U
Amel X X,Y* X X X X X X X
D3 15 15 15 15 17* 15,18 15
D1 11,17.3 11 17.3 11,17.3 11 11,17.3
D2S441 10,15 15 15 10,15 10,15
D10 12 12 14 12 12,14 12,14
D13 9,13
Penta E 15 12 13,15 12,15
D16 11,13 11,13 11,13 11,13 11,13 11,13 11,13 11,13
D18 13*,14,15 14,15 14,15 16 14 14,15
D2S1338 25 17,25 25 25 17,25
CSF 12 10 10 10,12
Penta D 10 10,11
THO1 6,7 6,7 7 6,7 9.3 7 †,6,9.3 6,7
vWA 14 14 15 14 18 14,20
D21 28,30,31 28 28 32.2 28 28,30
D7 9 11
D5 11 11 11 11 11 11 11
TPOX 8,11 11 11 11 11 8,11 11 8,11
DYS391 N/A
D8 12 12 12,13*,15 12 13*,13.2,16 13* 12
D12 23 17 17 † 17 17 17,23
D19 13 13 13 14 13
FGA 17.2,24,25 19.2 24,25
D22 16 16 16
Method A A A A B B B B
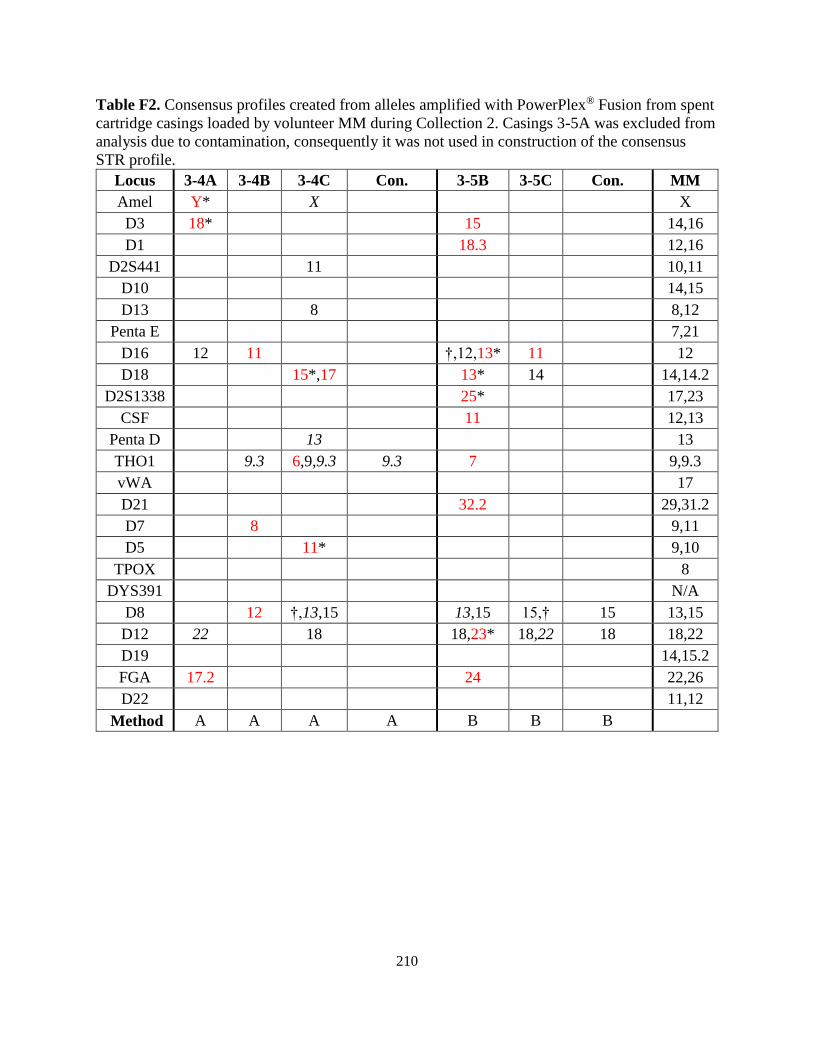
210
Table F2. Consensus profiles created from alleles amplified with PowerPlex® Fusion from spent
cartridge casings loaded by volunteer MM during Collection 2. Casings 3-5A was excluded from
analysis due to contamination, consequently it was not used in construction of the consensus
STR profile.
Locus 3-4A 3-4B 3-4C Con. 3-5B 3-5C Con. MM
Amel Y* X X
D3 18* 15 14,16
D1 18.3 12,16
D2S441 11 10,11
D10 14,15
D13 8 8,12
Penta E 7,21
D16 12 11 †,12,13* 11 12
D18 15*,17 13* 14 14,14.2
D2S1338 25* 17,23
CSF 11 12,13
Penta D 13 13
THO1 9.3 6,9,9.3 9.3 7 9,9.3
vWA 17
D21 32.2 29,31.2
D7 8 9,11
D5 11* 9,10
TPOX 8
DYS391 N/A
D8 12 †,13,15 13,15 15,† 15 13,15
D12 22 18 18,23* 18,22 18 18,22
D19 14,15.2
FGA 17.2 24 22,26
D22 11,12
Method A A A A B B B
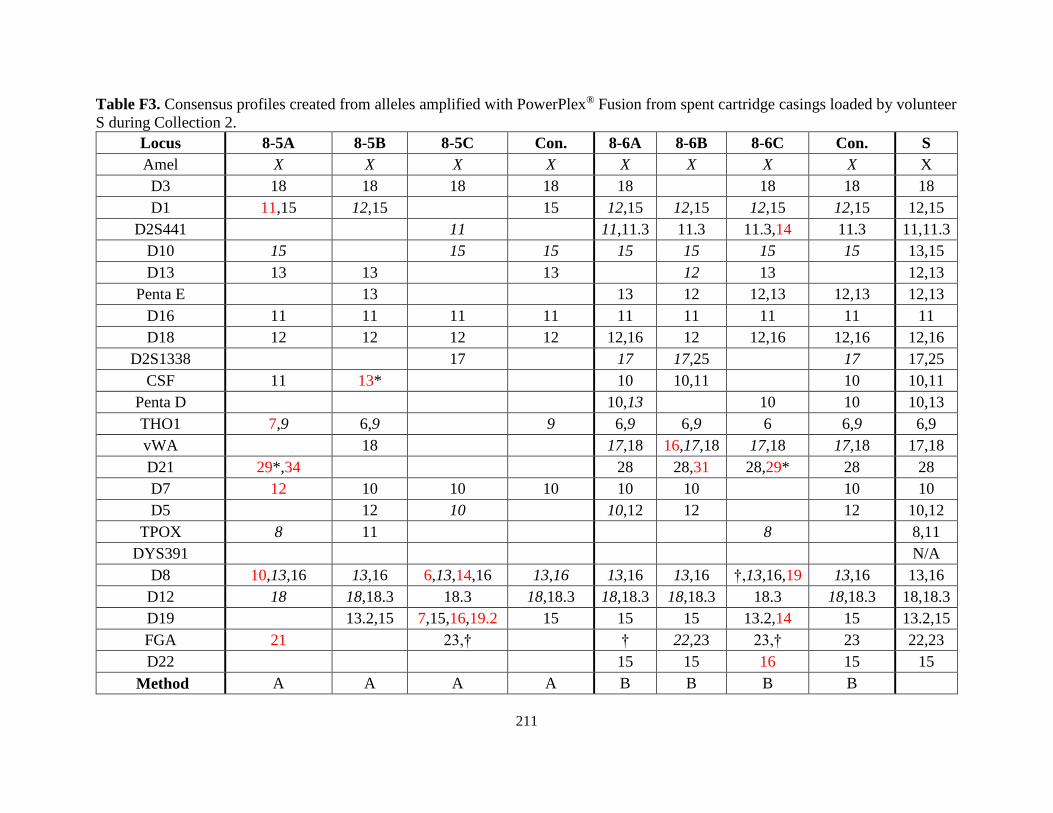
211
Table F3. Consensus profiles created from alleles amplified with PowerPlex® Fusion from spent cartridge casings loaded by volunteer
S during Collection 2.
Locus 8-5A 8-5B 8-5C Con. 8-6A 8-6B 8-6C Con. S
Amel X X X X X X X X X
D3 18 18 18 18 18 18 18 18
D1 11,15 12,15 15 12,15 12,15 12,15 12,15 12,15
D2S441 11 11,11.3 11.3 11.3,14 11.3 11,11.3
D10 15 15 15 15 15 15 15 13,15
D13 13 13 13 12 13 12,13
Penta E 13 13 12 12,13 12,13 12,13
D16 11 11 11 11 11 11 11 11 11
D18 12 12 12 12 12,16 12 12,16 12,16 12,16
D2S1338 17 17 17,25 17 17,25
CSF 11 13* 10 10,11 10 10,11
Penta D 10,13 10 10 10,13
THO1 7,9 6,9 9 6,9 6,9 6 6,9 6,9
vWA 18 17,18 16,17,18 17,18 17,18 17,18
D21 29*,34 28 28,31 28,29* 28 28
D7 12 10 10 10 10 10 10 10
D5 12 10 10,12 12 12 10,12
TPOX 8 11 8 8,11
DYS391 N/A
D8 10,13,16 13,16 6,13,14,16 13,16 13,16 13,16 †,13,16,19 13,16 13,16
D12 18 18,18.3 18.3 18,18.3 18,18.3 18,18.3 18.3 18,18.3 18,18.3
D19 13.2,15 7,15,16,19.2 15 15 15 13.2,14 15 13.2,15
FGA 21 23,† † 22,23 23,† 23 22,23
D22 15 15 16 15 15
Method A A A A B B B B
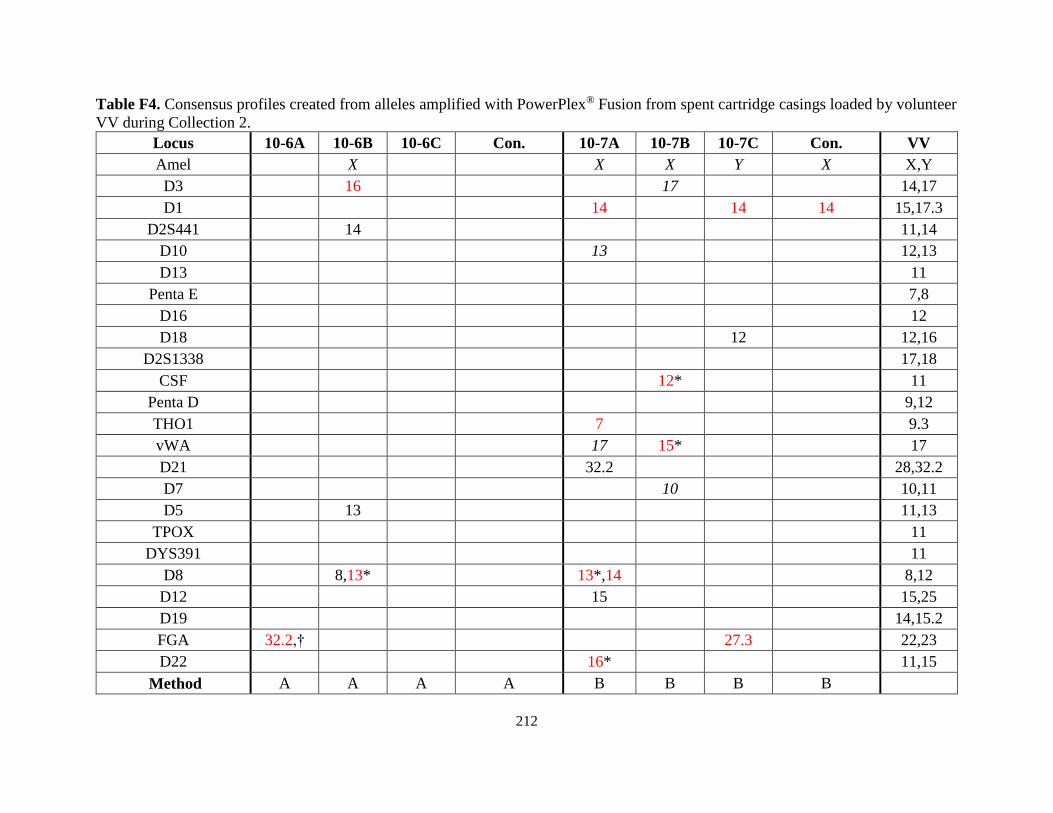
212
Table F4. Consensus profiles created from alleles amplified with PowerPlex® Fusion from spent cartridge casings loaded by volunteer
VV during Collection 2.
Locus 10-6A 10-6B 10-6C Con. 10-7A 10-7B 10-7C Con. VV
Amel X X X Y X X,Y
D3 16 17 14,17
D1 14 14 14 15,17.3
D2S441 14 11,14
D10 13 12,13
D13 11
Penta E 7,8
D16 12
D18 12 12,16
D2S1338 17,18
CSF 12* 11
Penta D 9,12
THO1 7 9.3
vWA 17 15* 17
D21 32.2 28,32.2
D7 10 10,11
D5 13 11,13
TPOX 11
DYS391 11
D8 8,13* 13*,14 8,12
D12 15 15,25
D19 14,15.2
FGA 32.2,† 27.3 22,23
D22 16* 11,15
Method A A A A B B B B
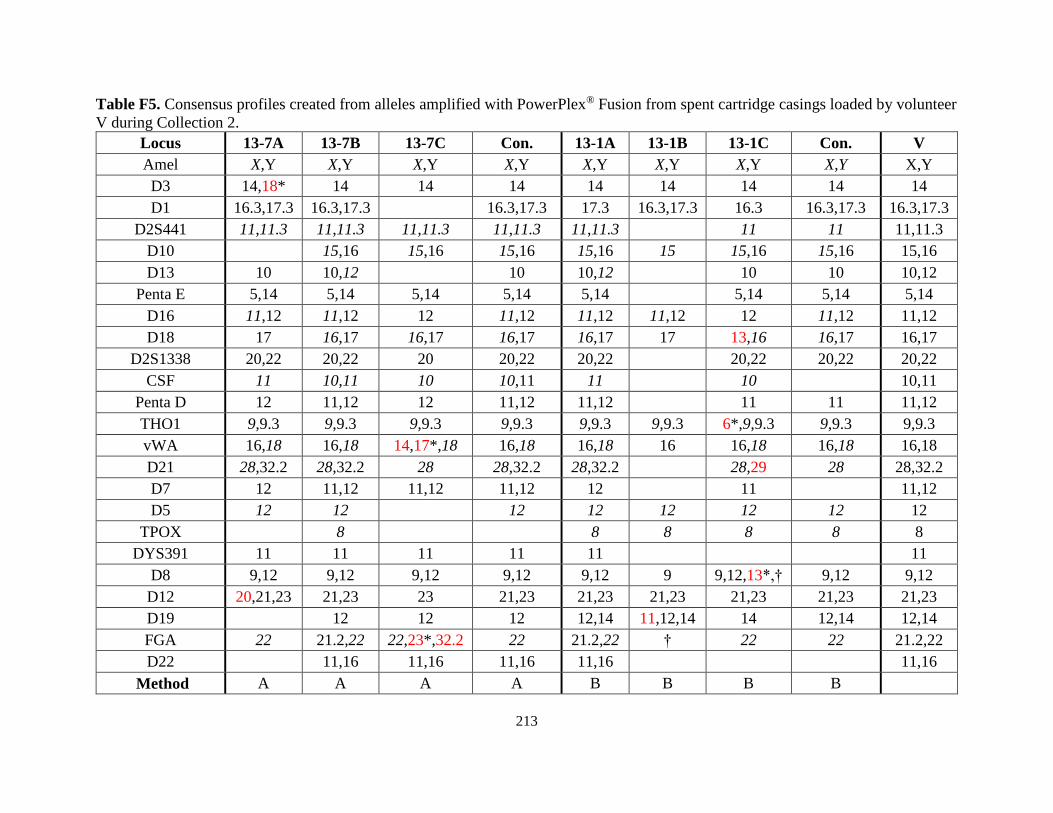
213
Table F5. Consensus profiles created from alleles amplified with PowerPlex® Fusion from spent cartridge casings loaded by volunteer
V during Collection 2.
Locus 13-7A 13-7B 13-7C Con. 13-1A 13-1B 13-1C Con. V
Amel X,Y X,Y X,Y X,Y X,Y X,Y X,Y X,Y X,Y
D3 14,18* 14 14 14 14 14 14 14 14
D1 16.3,17.3 16.3,17.3 16.3,17.3 17.3 16.3,17.3 16.3 16.3,17.3 16.3,17.3
D2S441 11,11.3 11,11.3 11,11.3 11,11.3 11,11.3 11 11 11,11.3
D10 15,16 15,16 15,16 15,16 15 15,16 15,16 15,16
D13 10 10,12 10 10,12 10 10 10,12
Penta E 5,14 5,14 5,14 5,14 5,14 5,14 5,14 5,14
D16 11,12 11,12 12 11,12 11,12 11,12 12 11,12 11,12
D18 17 16,17 16,17 16,17 16,17 17 13,16 16,17 16,17
D2S1338 20,22 20,22 20 20,22 20,22 20,22 20,22 20,22
CSF 11 10,11 10 10,11 11 10 10,11
Penta D 12 11,12 12 11,12 11,12 11 11 11,12
THO1 9,9.3 9,9.3 9,9.3 9,9.3 9,9.3 9,9.3 6*,9,9.3 9,9.3 9,9.3
vWA 16,18 16,18 14,17*,18 16,18 16,18 16 16,18 16,18 16,18
D21 28,32.2 28,32.2 28 28,32.2 28,32.2 28,29 28 28,32.2
D7 12 11,12 11,12 11,12 12 11 11,12
D5 12 12 12 12 12 12 12 12
TPOX 8 8 8 8 8 8
DYS391 11 11 11 11 11 11
D8 9,12 9,12 9,12 9,12 9,12 9 9,12,13*,† 9,12 9,12
D12 20,21,23 21,23 23 21,23 21,23 21,23 21,23 21,23 21,23
D19 12 12 12 12,14 11,12,14 14 12,14 12,14
FGA 22 21.2,22 22,23*,32.2 22 21.2,22 † 22 22 21.2,22
D22 11,16 11,16 11,16 11,16 11,16
Method A A A A B B B B
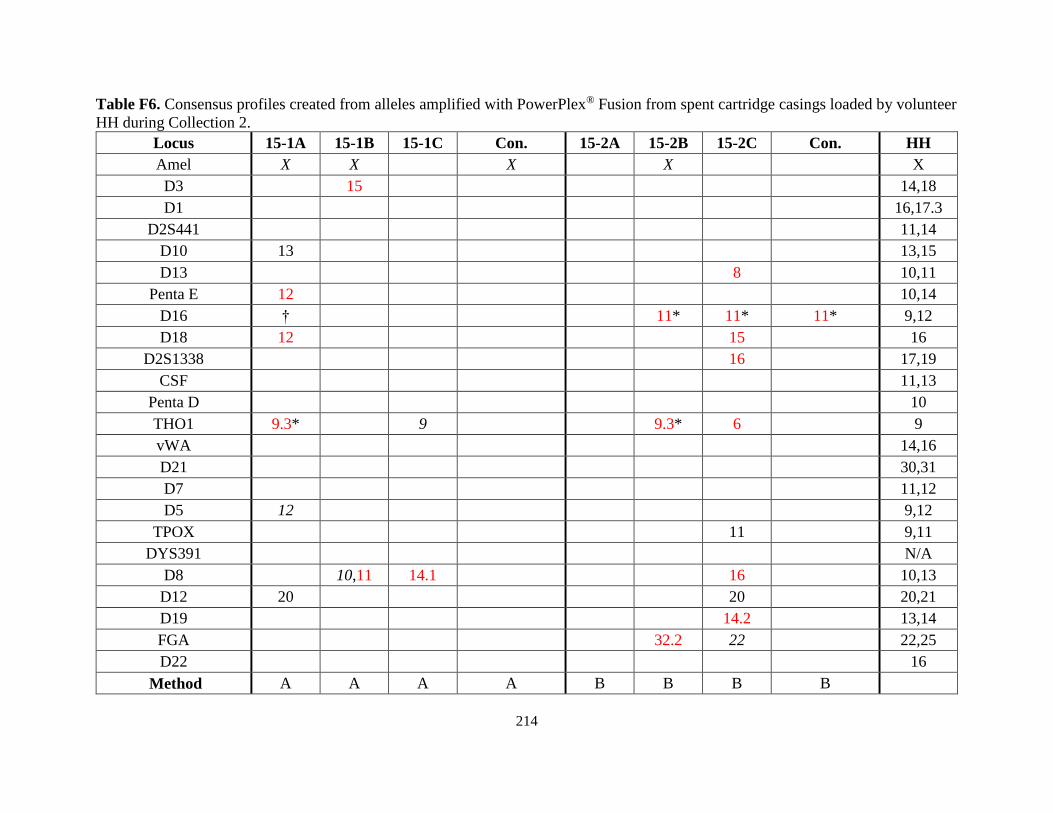
214
Table F6. Consensus profiles created from alleles amplified with PowerPlex® Fusion from spent cartridge casings loaded by volunteer
HH during Collection 2.
Locus 15-1A 15-1B 15-1C Con. 15-2A 15-2B 15-2C Con. HH
Amel X X X X X
D3 15 14,18
D1 16,17.3
D2S441 11,14
D10 13 13,15
D13 8 10,11
Penta E 12 10,14
D16 † 11* 11* 11* 9,12
D18 12 15 16
D2S1338 16 17,19
CSF 11,13
Penta D 10
THO1 9.3* 9 9.3* 6 9
vWA 14,16
D21 30,31
D7 11,12
D5 12 9,12
TPOX 11 9,11
DYS391 N/A
D8 10,11 14.1 16 10,13
D12 20 20 20,21
D19 14.2 13,14
FGA 32.2 22 22,25
D22 16
Method A A A A B B B B
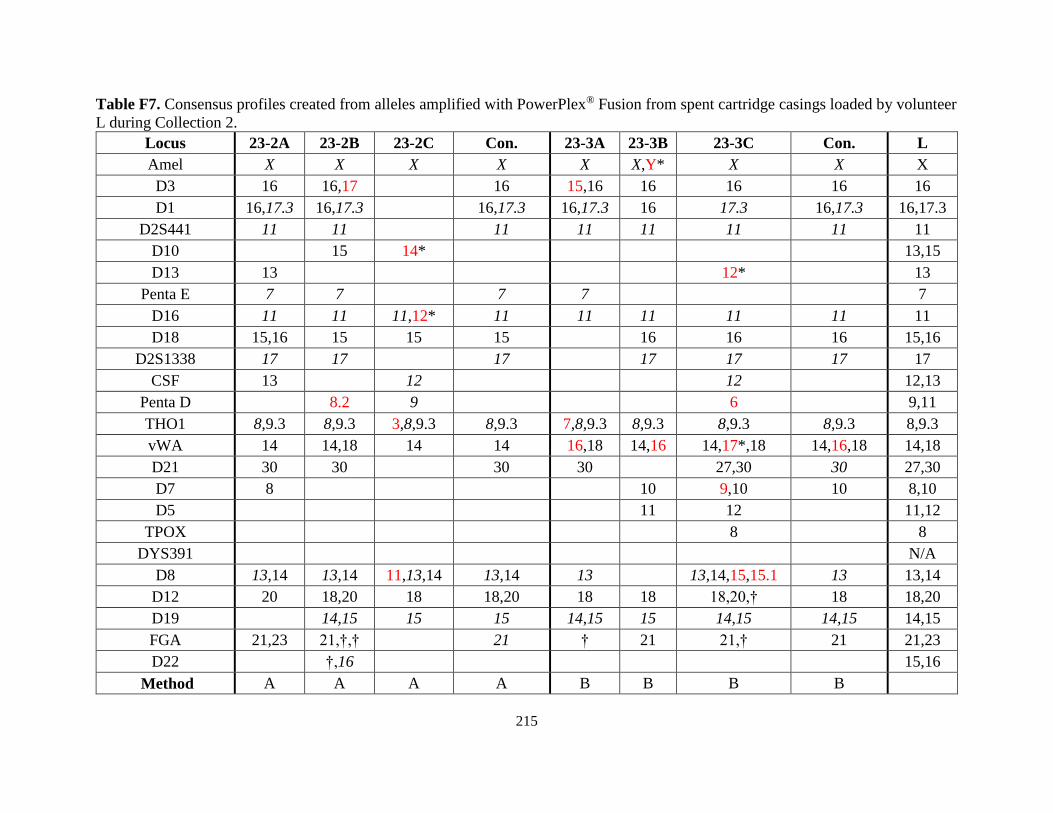
215
Table F7. Consensus profiles created from alleles amplified with PowerPlex® Fusion from spent cartridge casings loaded by volunteer
L during Collection 2.
Locus 23-2A 23-2B 23-2C Con. 23-3A 23-3B 23-3C Con. L
Amel X X X X X X,Y* X X X
D3 16 16,17 16 15,16 16 16 16 16
D1 16,17.3 16,17.3 16,17.3 16,17.3 16 17.3 16,17.3 16,17.3
D2S441 11 11 11 11 11 11 11 11
D10 15 14* 13,15
D13 13 12* 13
Penta E 7 7 7 7 7
D16 11 11 11,12* 11 11 11 11 11 11
D18 15,16 15 15 15 16 16 16 15,16
D2S1338 17 17 17 17 17 17 17
CSF 13 12 12 12,13
Penta D 8.2 9 6 9,11
THO1 8,9.3 8,9.3 3,8,9.3 8,9.3 7,8,9.3 8,9.3 8,9.3 8,9.3 8,9.3
vWA 14 14,18 14 14 16,18 14,16 14,17*,18 14,16,18 14,18
D21 30 30 30 30 27,30 30 27,30
D7 8 10 9,10 10 8,10
D5 11 12 11,12
TPOX 8 8
DYS391 N/A
D8 13,14 13,14 11,13,14 13,14 13 13,14,15,15.1 13 13,14
D12 20 18,20 18 18,20 18 18 18,20,† 18 18,20
D19 14,15 15 15 14,15 15 14,15 14,15 14,15
FGA 21,23 21,†,† 21 † 21 21,† 21 21,23
D22 †,16 15,16
Method A A A A B B B B
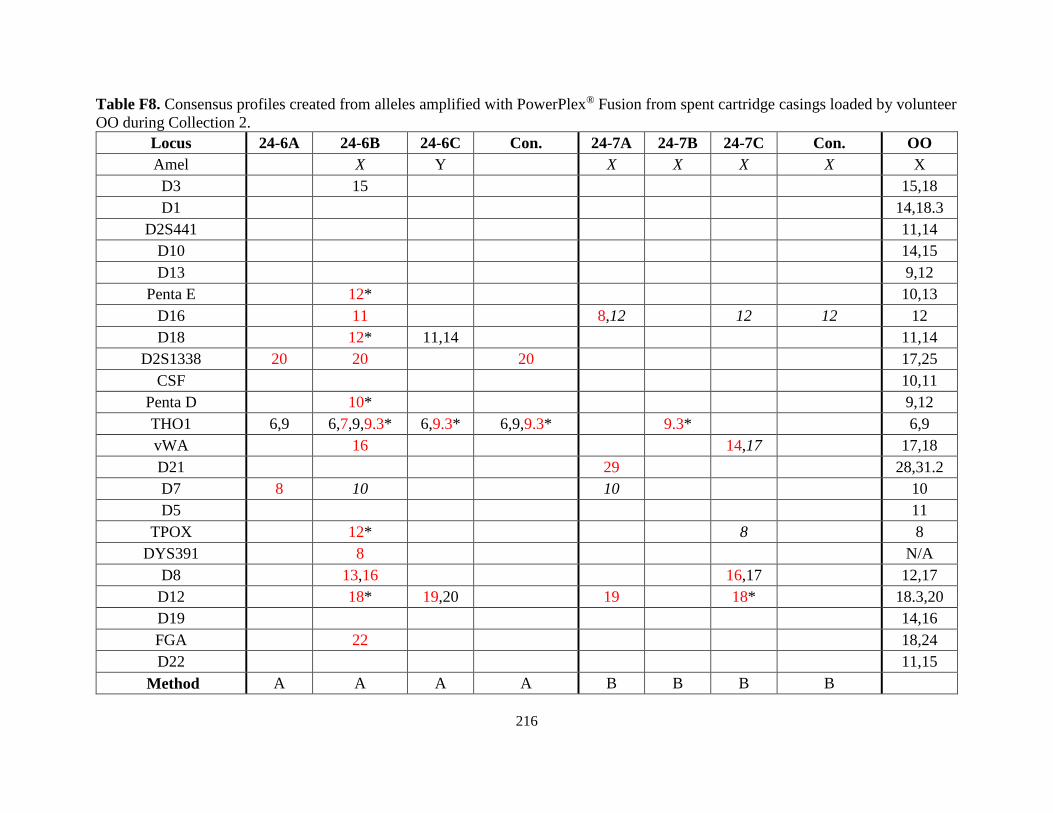
216
Table F8. Consensus profiles created from alleles amplified with PowerPlex® Fusion from spent cartridge casings loaded by volunteer
OO during Collection 2.
Locus 24-6A 24-6B 24-6C Con. 24-7A 24-7B 24-7C Con. OO
Amel X Y X X X X X
D3 15 15,18
D1 14,18.3
D2S441 11,14
D10 14,15
D13 9,12
Penta E 12* 10,13
D16 11 8,12 12 12 12
D18 12* 11,14 11,14
D2S1338 20 20 20 17,25
CSF 10,11
Penta D 10* 9,12
THO1 6,9 6,7,9,9.3* 6,9.3* 6,9,9.3* 9.3* 6,9
vWA 16 14,17 17,18
D21 29 28,31.2
D7 8 10 10 10
D5 11
TPOX 12* 8 8
DYS391 8 N/A
D8 13,16 16,17 12,17
D12 18* 19,20 19 18* 18.3,20
D19 14,16
FGA 22 18,24
D22 11,15
Method A A A A B B B B
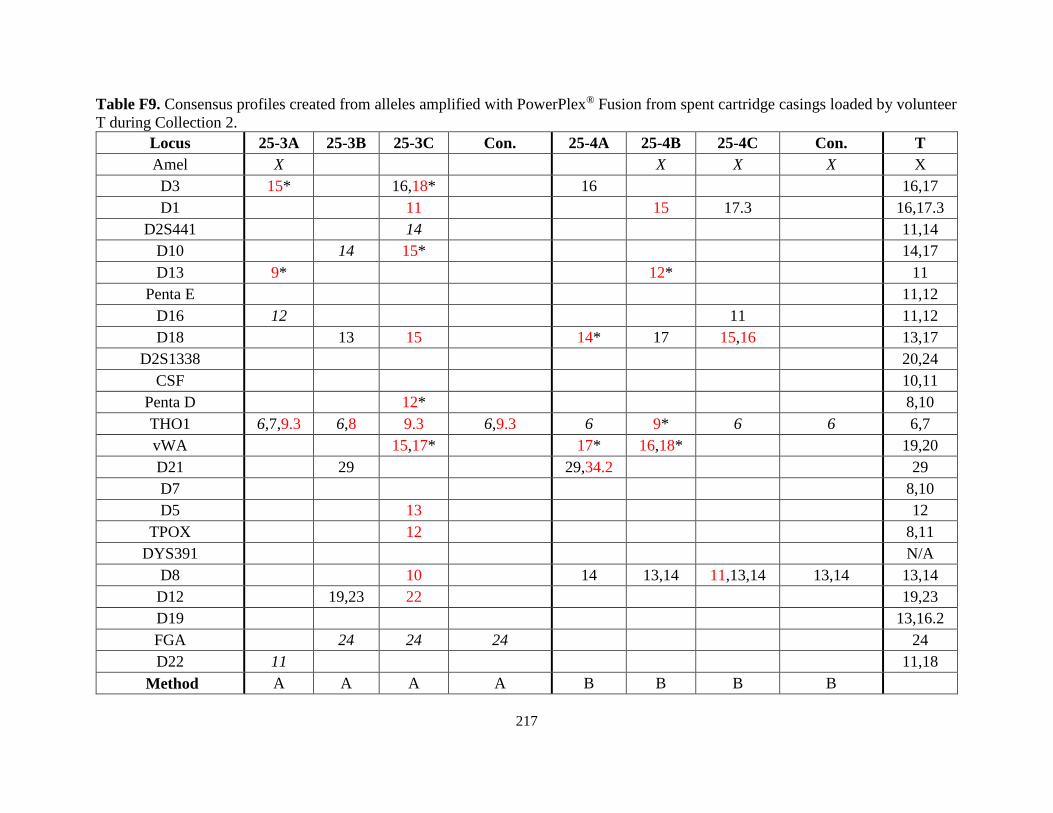
217
Table F9. Consensus profiles created from alleles amplified with PowerPlex® Fusion from spent cartridge casings loaded by volunteer
T during Collection 2.
Locus 25-3A 25-3B 25-3C Con. 25-4A 25-4B 25-4C Con. T
Amel X X X X X
D3 15* 16,18* 16 16,17
D1 11 15 17.3 16,17.3
D2S441 14 11,14
D10 14 15* 14,17
D13 9* 12* 11
Penta E 11,12
D16 12 11 11,12
D18 13 15 14* 17 15,16 13,17
D2S1338 20,24
CSF 10,11
Penta D 12* 8,10
THO1 6,7,9.3 6,8 9.3 6,9.3 6 9* 6 6 6,7
vWA 15,17* 17* 16,18* 19,20
D21 29 29,34.2 29
D7 8,10
D5 13 12
TPOX 12 8,11
DYS391 N/A
D8 10 14 13,14 11,13,14 13,14 13,14
D12 19,23 22 19,23
D19 13,16.2
FGA 24 24 24 24
D22 11 11,18
Method A A A A B B B B
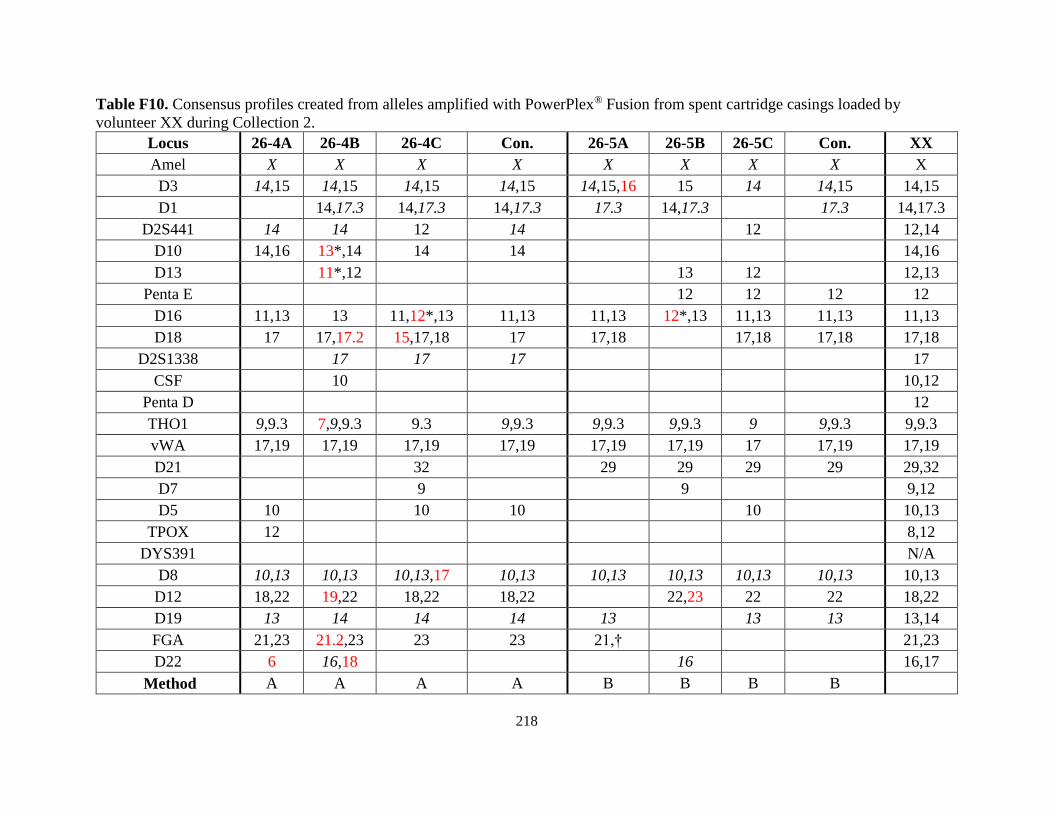
218
Table F10. Consensus profiles created from alleles amplified with PowerPlex® Fusion from spent cartridge casings loaded by
volunteer XX during Collection 2.
Locus 26-4A 26-4B 26-4C Con. 26-5A 26-5B 26-5C Con. XX
Amel X X X X X X X X X
D3 14,15 14,15 14,15 14,15 14,15,16 15 14 14,15 14,15
D1 14,17.3 14,17.3 14,17.3 17.3 14,17.3 17.3 14,17.3
D2S441 14 14 12 14 12 12,14
D10 14,16 13*,14 14 14 14,16
D13 11*,12 13 12 12,13
Penta E 12 12 12 12
D16 11,13 13 11,12*,13 11,13 11,13 12*,13 11,13 11,13 11,13
D18 17 17,17.2 15,17,18 17 17,18 17,18 17,18 17,18
D2S1338 17 17 17 17
CSF 10 10,12
Penta D 12
THO1 9,9.3 7,9,9.3 9.3 9,9.3 9,9.3 9,9.3 9 9,9.3 9,9.3
vWA 17,19 17,19 17,19 17,19 17,19 17,19 17 17,19 17,19
D21 32 29 29 29 29 29,32
D7 9 9 9,12
D5 10 10 10 10 10,13
TPOX 12 8,12
DYS391 N/A
D8 10,13 10,13 10,13,17 10,13 10,13 10,13 10,13 10,13 10,13
D12 18,22 19,22 18,22 18,22 22,23 22 22 18,22
D19 13 14 14 14 13 13 13 13,14
FGA 21,23 21.2,23 23 23 21,† 21,23
D22 6 16,18 16 16,17
Method A A A A B B B B
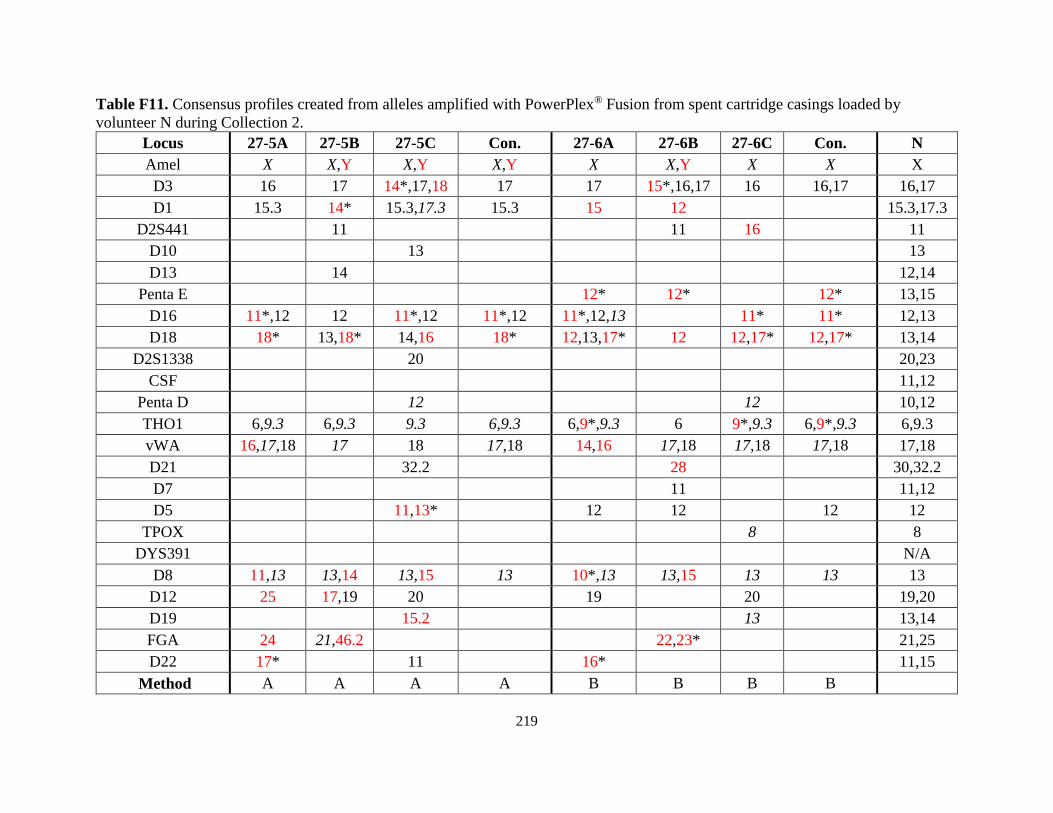
219
Table F11. Consensus profiles created from alleles amplified with PowerPlex® Fusion from spent cartridge casings loaded by
volunteer N during Collection 2.
Locus 27-5A 27-5B 27-5C Con. 27-6A 27-6B 27-6C Con. N
Amel X X,Y X,Y X,Y X X,Y X X X
D3 16 17 14*,17,18 17 17 15*,16,17 16 16,17 16,17
D1 15.3 14* 15.3,17.3 15.3 15 12 15.3,17.3
D2S441 11 11 16 11
D10 13 13
D13 14 12,14
Penta E 12* 12* 12* 13,15
D16 11*,12 12 11*,12 11*,12 11*,12,13 11* 11* 12,13
D18 18* 13,18* 14,16 18* 12,13,17* 12 12,17* 12,17* 13,14
D2S1338 20 20,23
CSF 11,12
Penta D 12 12 10,12
THO1 6,9.3 6,9.3 9.3 6,9.3 6,9*,9.3 6 9*,9.3 6,9*,9.3 6,9.3
vWA 16,17,18 17 18 17,18 14,16 17,18 17,18 17,18 17,18
D21 32.2 28 30,32.2
D7 11 11,12
D5 11,13* 12 12 12 12
TPOX 8 8
DYS391 N/A
D8 11,13 13,14 13,15 13 10*,13 13,15 13 13 13
D12 25 17,19 20 19 20 19,20
D19 15.2 13 13,14
FGA 24 21,46.2 22,23* 21,25
D22 17* 11 16* 11,15
Method A A A A B B B B
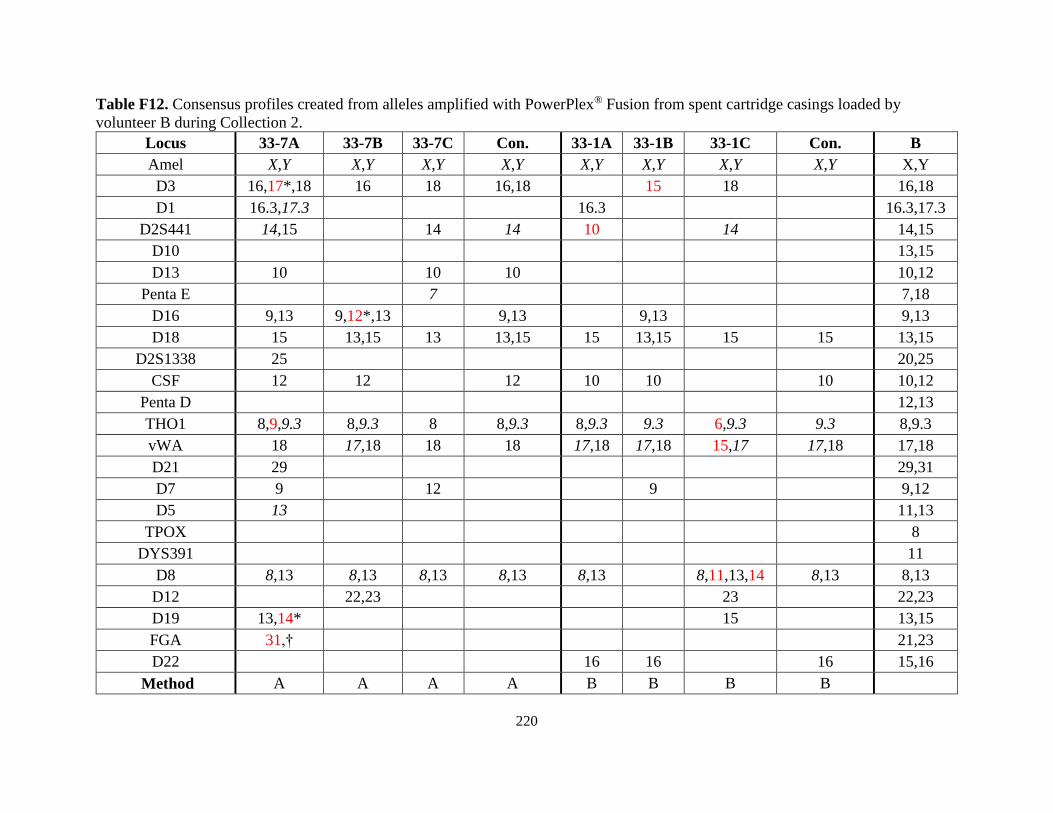
220
Table F12. Consensus profiles created from alleles amplified with PowerPlex® Fusion from spent cartridge casings loaded by
volunteer B during Collection 2.
Locus 33-7A 33-7B 33-7C Con. 33-1A 33-1B 33-1C Con. B
Amel X,Y X,Y X,Y X,Y X,Y X,Y X,Y X,Y X,Y
D3 16,17*,18 16 18 16,18 15 18 16,18
D1 16.3,17.3 16.3 16.3,17.3
D2S441 14,15 14 14 10 14 14,15
D10 13,15
D13 10 10 10 10,12
Penta E 7 7,18
D16 9,13 9,12*,13 9,13 9,13 9,13
D18 15 13,15 13 13,15 15 13,15 15 15 13,15
D2S1338 25 20,25
CSF 12 12 12 10 10 10 10,12
Penta D 12,13
THO1 8,9,9.3 8,9.3 8 8,9.3 8,9.3 9.3 6,9.3 9.3 8,9.3
vWA 18 17,18 18 18 17,18 17,18 15,17 17,18 17,18
D21 29 29,31
D7 9 12 9 9,12
D5 13 11,13
TPOX 8
DYS391 11
D8 8,13 8,13 8,13 8,13 8,13 8,11,13,14 8,13 8,13
D12 22,23 23 22,23
D19 13,14* 15 13,15
FGA 31,† 21,23
D22 16 16 16 15,16
Method A A A A B B B B
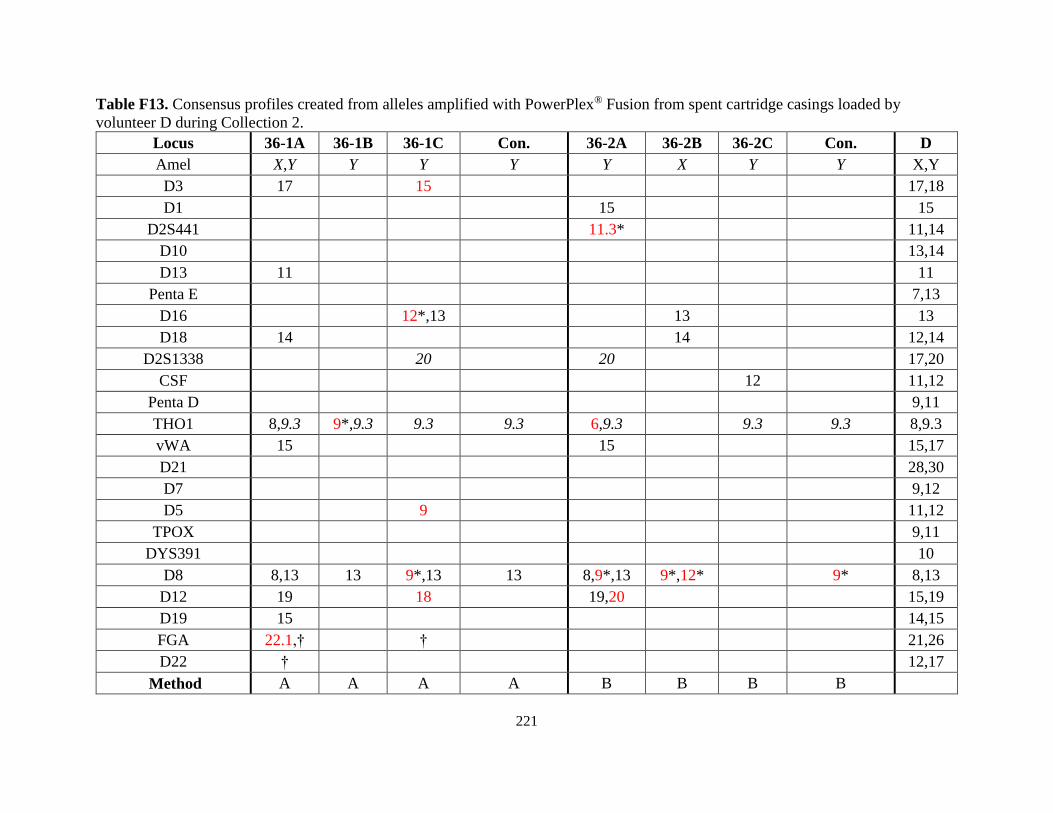
221
Table F13. Consensus profiles created from alleles amplified with PowerPlex® Fusion from spent cartridge casings loaded by
volunteer D during Collection 2.
Locus 36-1A 36-1B 36-1C Con. 36-2A 36-2B 36-2C Con. D
Amel X,Y Y Y Y Y X Y Y X,Y
D3 17 15 17,18
D1 15 15
D2S441 11.3* 11,14
D10 13,14
D13 11 11
Penta E 7,13
D16 12*,13 13 13
D18 14 14 12,14
D2S1338 20 20 17,20
CSF 12 11,12
Penta D 9,11
THO1 8,9.3 9*,9.3 9.3 9.3 6,9.3 9.3 9.3 8,9.3
vWA 15 15 15,17
D21 28,30
D7 9,12
D5 9 11,12
TPOX 9,11
DYS391 10
D8 8,13 13 9*,13 13 8,9*,13 9*,12* 9* 8,13
D12 19 18 19,20 15,19
D19 15 14,15
FGA 22.1,† † 21,26
D22 † 12,17
Method A A A A B B B B
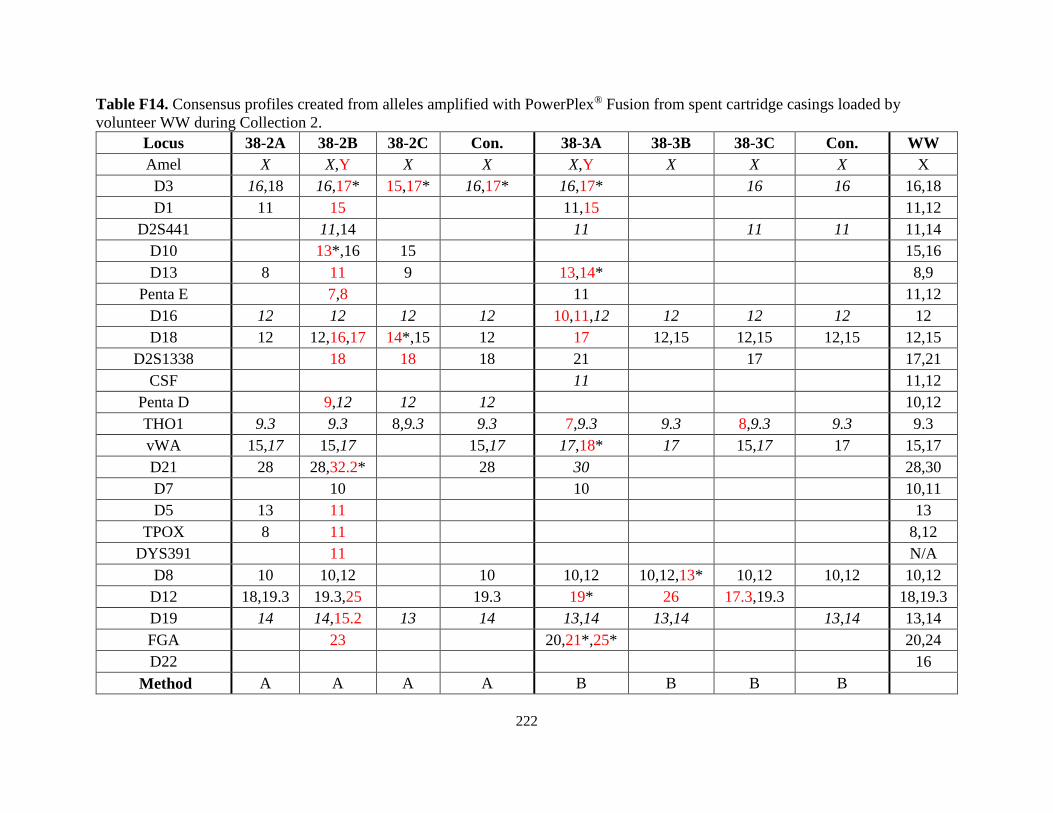
222
Table F14. Consensus profiles created from alleles amplified with PowerPlex® Fusion from spent cartridge casings loaded by
volunteer WW during Collection 2.
Locus 38-2A 38-2B 38-2C Con. 38-3A 38-3B 38-3C Con. WW
Amel X X,Y X X X,Y X X X X
D3 16,18 16,17* 15,17* 16,17* 16,17* 16 16 16,18
D1 11 15 11,15 11,12
D2S441 11,14 11 11 11 11,14
D10 13*,16 15 15,16
D13 8 11 9 13,14* 8,9
Penta E 7,8 11 11,12
D16 12 12 12 12 10,11,12 12 12 12 12
D18 12 12,16,17 14*,15 12 17 12,15 12,15 12,15 12,15
D2S1338 18 18 18 21 17 17,21
CSF 11 11,12
Penta D 9,12 12 12 10,12
THO1 9.3 9.3 8,9.3 9.3 7,9.3 9.3 8,9.3 9.3 9.3
vWA 15,17 15,17 15,17 17,18* 17 15,17 17 15,17
D21 28 28,32.2* 28 30 28,30
D7 10 10 10,11
D5 13 11 13
TPOX 8 11 8,12
DYS391 11 N/A
D8 10 10,12 10 10,12 10,12,13* 10,12 10,12 10,12
D12 18,19.3 19.3,25 19.3 19* 26 17.3,19.3 18,19.3
D19 14 14,15.2 13 14 13,14 13,14 13,14 13,14
FGA 23 20,21*,25* 20,24
D22 16
Method A A A A B B B B
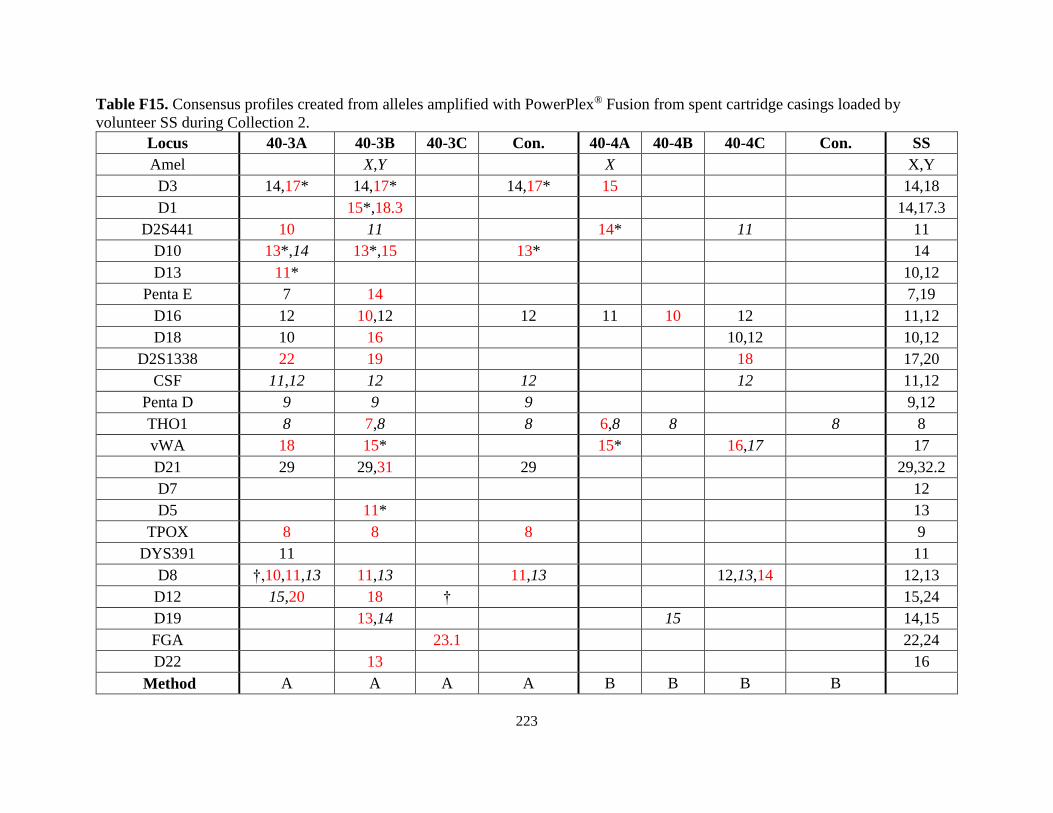
223
Table F15. Consensus profiles created from alleles amplified with PowerPlex® Fusion from spent cartridge casings loaded by
volunteer SS during Collection 2.
Locus 40-3A 40-3B 40-3C Con. 40-4A 40-4B 40-4C Con. SS
Amel X,Y X X,Y
D3 14,17* 14,17* 14,17* 15 14,18
D1 15*,18.3 14,17.3
D2S441 10 11 14* 11 11
D10 13*,14 13*,15 13* 14
D13 11* 10,12
Penta E 7 14 7,19
D16 12 10,12 12 11 10 12 11,12
D18 10 16 10,12 10,12
D2S1338 22 19 18 17,20
CSF 11,12 12 12 12 11,12
Penta D 9 9 9 9,12
THO1 8 7,8 8 6,8 8 8 8
vWA 18 15* 15* 16,17 17
D21 29 29,31 29 29,32.2
D7 12
D5 11* 13
TPOX 8 8 8 9
DYS391 11 11
D8 †,10,11,13 11,13 11,13 12,13,14 12,13
D12 15,20 18 † 15,24
D19 13,14 15 14,15
FGA 23.1 22,24
D22 13 16
Method A A A A B B B B
224
Table F16. Consensus profiles created from alleles amplified with PowerPlex® Fusion from spent cartridge casings loaded by
volunteer Y during Collection 2.
Locus 41-4A 41-4B 41-4C Con. 41-5A 41-5B 41-5C Con. Y
Amel Y X,Y X,Y X,Y X,Y X,Y X,Y X,Y X,Y
D3 14 17 17,18 16 17 17 16,17
D1 16.3,17.3* 14 16.3 12,14
D2S441 11.3 14 14 14,15
D10 14 15,16 14 14,15
D13 12 9,13 13 13,14
Penta E 5,14 5,14
D16 11 11,12 13 11 11,12 11 11 11 11,12
D18 16* 16*,17 17 16*,17 17 15*,17 17 17
D2S1338 20 17,24 24 17,24
CSF 10 12,14
Penta D 12 8 8 8,13
THO1 6 9,9.3 6,9.3 6,9.3 9.3 9.3 8*,9,9.3 9.3 9,9.3
vWA 16,18* 14 14 16 14,16
D21 28,32.2 30.2 29,30.2
D7 11,12 10,12 12 8,10
D5 12 12
TPOX 8 11 8
DYS391 11 11
D8 10,15 9,12 10,14 10 10,14 10,14 13*,14 10,14 10,14
D12 21,23 17,20* 20*,† 17 21 17,21
D19 12,14* 13,15.2 9,16.2 13,16.2
FGA 21.2,22 20,27 22,27
D22 11,16 11,16
Method A A A A B B B B
225
Table F17. Consensus profiles created from alleles amplified with PowerPlex® Fusion from spent cartridge casings loaded by
volunteer II during Collection 2.
Locus 50-5A 50-5B 50-5C Con. 50-6A 50-6B 50-6C Con. II
Amel X,Y Y X,Y X,Y X,Y X Y X,Y X,Y
D3 17 17 17 17 17 17 17 17
D1 12,15 15,18.3 15 15 15 15 15,18.3
D2S441 11,11.3 10,11 10,11 10,11 10,11 10,11
D10 15 13 15 15 13,15
D13 12 11,12 11 11,12 11 11,12
Penta E 13,14 13,14
D16 11,12 11,12 11,12 11,12 10,12 11,12 12 12
D18 16 16 16 17 16,17
D2S1338 19 21 19,21
CSF 10 12 12
Penta D 12 9,13
THO1 7,8,9.3 6,8,9,9.3 8 8,9.3 8,9.3 8,9.3 8,9.3 8,9.3 8,9.3
vWA 17,18 15,17 15,17 15,17 15,17 15,17
D21 29 31 31 29,31
D7 12 10,12
D5 11 12 12 12 11,12
TPOX 11 8 8 8
DYS391 11 11
D8 11,13,14,16 11,13 11,13,15,16 11,13,16 11,13 11,13 †,13 11,13 11,13
D12 18 18,20,† 18,19 18 18 22 18,20
D19 16.2 14 15.2 13.2,15.2 †,15.2 15.2 14,15.2
FGA 22,23 23,† 21,† 23 21,† † 21,23
D22 15,16 15,16
Method A A A A B B B B
226
Table F18. Consensus profiles created from alleles amplified with PowerPlex® Fusion from spent cartridge casings loaded by
volunteer W during Collection 3.
Locus 1-1A 1-1B 1-1C Con. 1-2A 1-2B 1-2C Con. W
Amel X X,Y* X X X X,Y* X X
D3 14,15*,16 14,16 14,16 14 14,16
D1 14 14,15.3
D2S441 11.3 14 14 11.3,14
D10 15 13,15
D13 10,11* 10,12
Penta E 12 12
D16 9*,13 9*,13 11,13 9*,13 11,13
D18 12
D2S1338 17* 18,22
CSF 10 12 10,12
Penta D 9,11
THO1 6,7,8*,9.3 6,9.3 6,9.3 9.3 6 6,9.3
vWA 15*,16* 16* 15*,17 15*,16*,17 17 17
D21 30*,32,33.2 28,33.2 33.2 28,33.2
D7 9 9,10
D5 13 12,13 13 12,13
TPOX 12 12 12 8,12
DYS391 N/A
D8 15 8,10 10,15 10,15 15 10,15
D12 18,19* 18,22 18 17 21 18,21
D19 13*,14 13* 7,15 13* 14,15
FGA † 21 †,18* 22* 21,23
D22 10* 16
Method A A A A B B B B
227
Table F19. Consensus profiles created from alleles amplified with PowerPlex® Fusion from spent cartridge casings loaded by
volunteer QQ during Collection 3.
Locus 6-2B 6-2A 6-2C Con. 6-3A 6-3B 6-3C Con. QQ
Amel Y X,Y Y X X,Y
D3 16 16 15* 16 16 16,18
D1 17.3 14 14 16.3,17.3
D2S441 10* 14 14,15
D10 12 14* 13,15
D13 14* 10,12
Penta E 7 7,18
D16 9,11 9,12* 9,12* 11 9,13
D18 12*,15 12* 12* 15 13,15
D2S1338 23* 17 20,25
CSF 10,12
Penta D 13 12,13
THO1 8 9.3 8,9.3 8,9.3 8,9.3 8,9.3
vWA 16* 15,16*,19* 16* 16*,18 17,18
D21 26.2* 27 29,31
D7 8* 9,12
D5 12* 12* 11,13
TPOX 8 8
DYS391 11
D8 13,15 13 13 13,15 8,13
D12 21* 22 22,23
D19 11.1 13 13 13,15
FGA 24 † 23 21,23
D22 16 15,16
Method A A A A B B B B
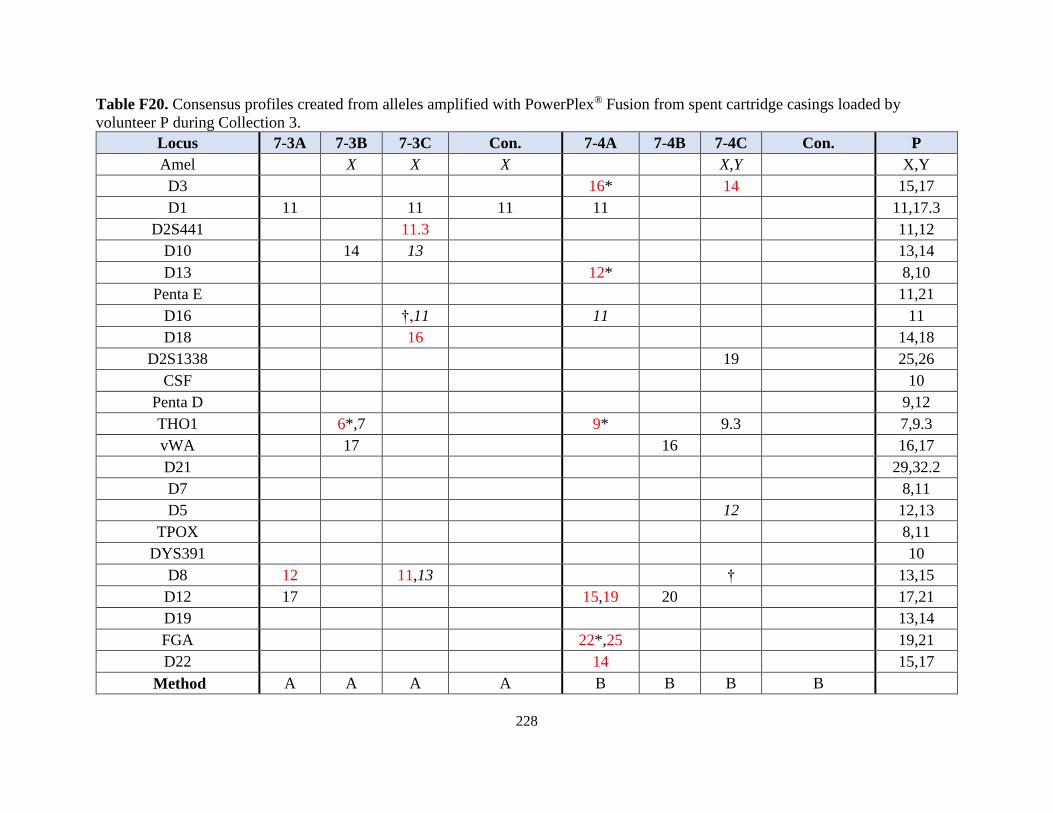
228
Table F20. Consensus profiles created from alleles amplified with PowerPlex® Fusion from spent cartridge casings loaded by
volunteer P during Collection 3.
Locus 7-3A 7-3B 7-3C Con. 7-4A 7-4B 7-4C Con. P
Amel X X X X,Y X,Y
D3 16* 14 15,17
D1 11 11 11 11 11,17.3
D2S441 11.3 11,12
D10 14 13 13,14
D13 12* 8,10
Penta E 11,21
D16 †,11 11 11
D18 16 14,18
D2S1338 19 25,26
CSF 10
Penta D 9,12
THO1 6*,7 9* 9.3 7,9.3
vWA 17 16 16,17
D21 29,32.2
D7 8,11
D5 12 12,13
TPOX 8,11
DYS391 10
D8 12 11,13 † 13,15
D12 17 15,19 20 17,21
D19 13,14
FGA 22*,25 19,21
D22 14 15,17
Method A A A A B B B B
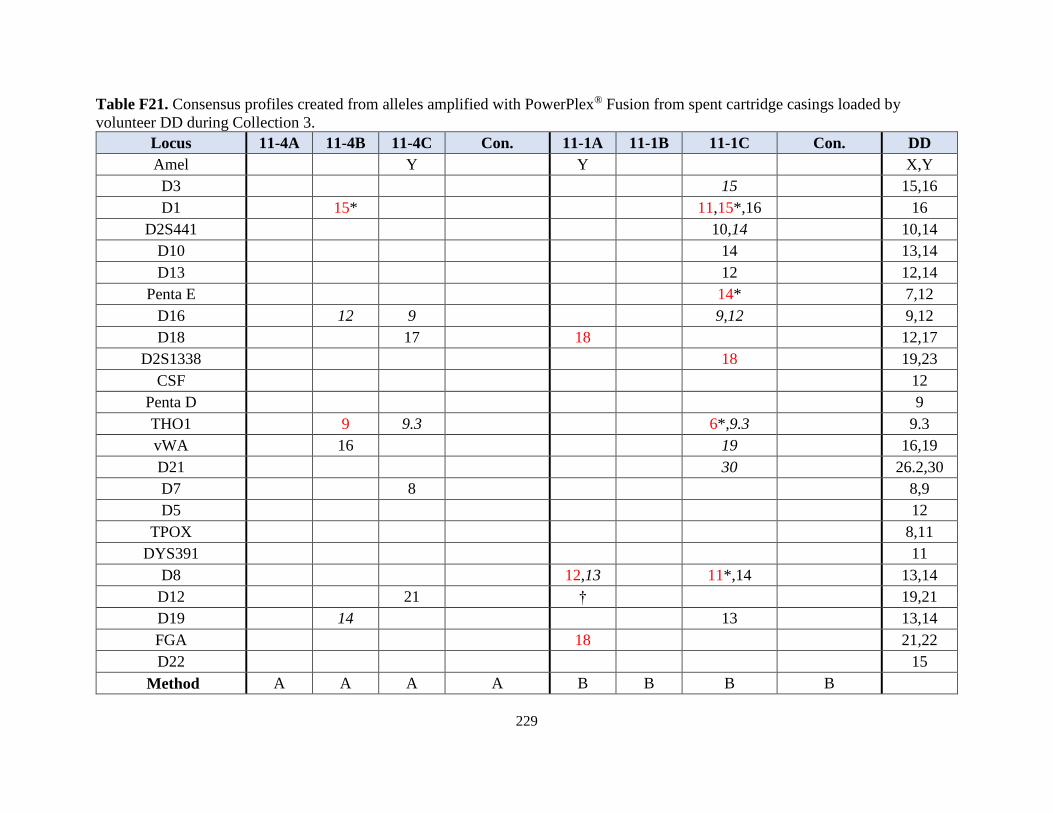
229
Table F21. Consensus profiles created from alleles amplified with PowerPlex® Fusion from spent cartridge casings loaded by
volunteer DD during Collection 3.
Locus 11-4A 11-4B 11-4C Con. 11-1A 11-1B 11-1C Con. DD
Amel Y Y X,Y
D3 15 15,16
D1 15* 11,15*,16 16
D2S441 10,14 10,14
D10 14 13,14
D13 12 12,14
Penta E 14* 7,12
D16 12 9 9,12 9,12
D18 17 18 12,17
D2S1338 18 19,23
CSF 12
Penta D 9
THO1 9 9.3 6*,9.3 9.3
vWA 16 19 16,19
D21 30 26.2,30
D7 8 8,9
D5 12
TPOX 8,11
DYS391 11
D8 12,13 11*,14 13,14
D12 21 † 19,21
D19 14 13 13,14
FGA 18 21,22
D22 15
Method A A A A B B B B
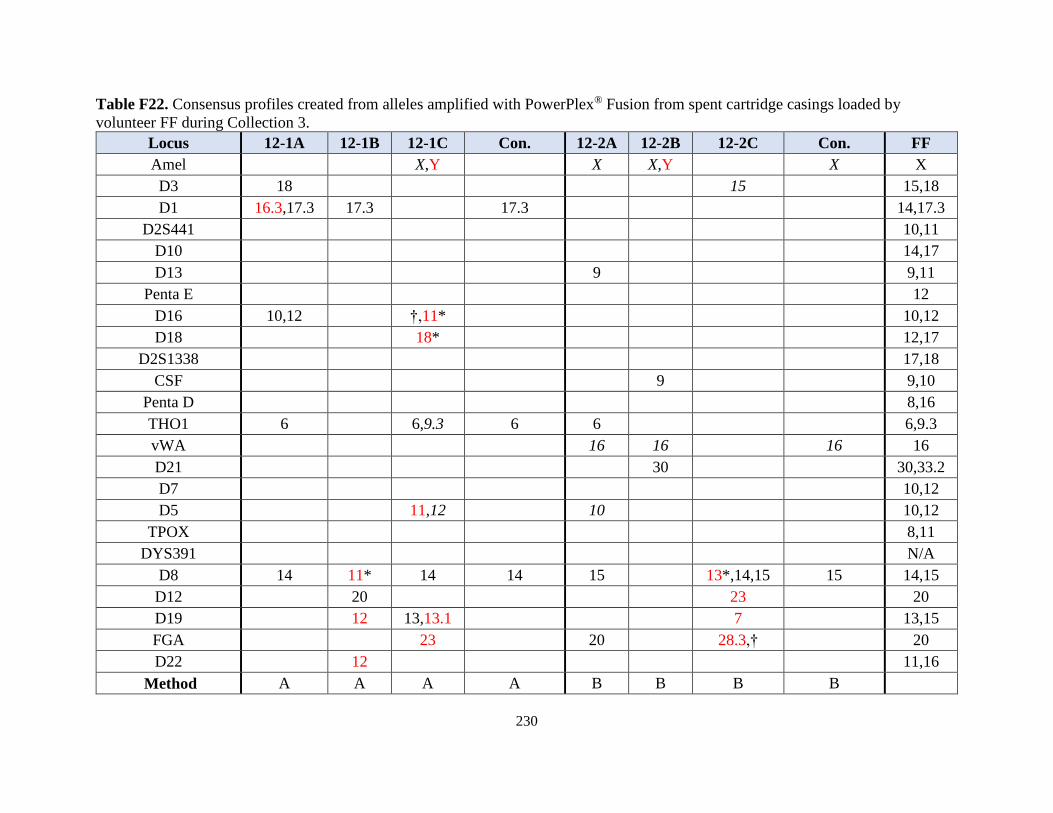
230
Table F22. Consensus profiles created from alleles amplified with PowerPlex® Fusion from spent cartridge casings loaded by
volunteer FF during Collection 3.
Locus 12-1A 12-1B 12-1C Con. 12-2A 12-2B 12-2C Con. FF
Amel X,Y X X,Y X X
D3 18 15 15,18
D1 16.3,17.3 17.3 17.3 14,17.3
D2S441 10,11
D10 14,17
D13 9 9,11
Penta E 12
D16 10,12 †,11* 10,12
D18 18* 12,17
D2S1338 17,18
CSF 9 9,10
Penta D 8,16
THO1 6 6,9.3 6 6 6,9.3
vWA 16 16 16 16
D21 30 30,33.2
D7 10,12
D5 11,12 10 10,12
TPOX 8,11
DYS391 N/A
D8 14 11* 14 14 15 13*,14,15 15 14,15
D12 20 23 20
D19 12 13,13.1 7 13,15
FGA 23 20 28.3,† 20
D22 12 11,16
Method A A A A B B B B
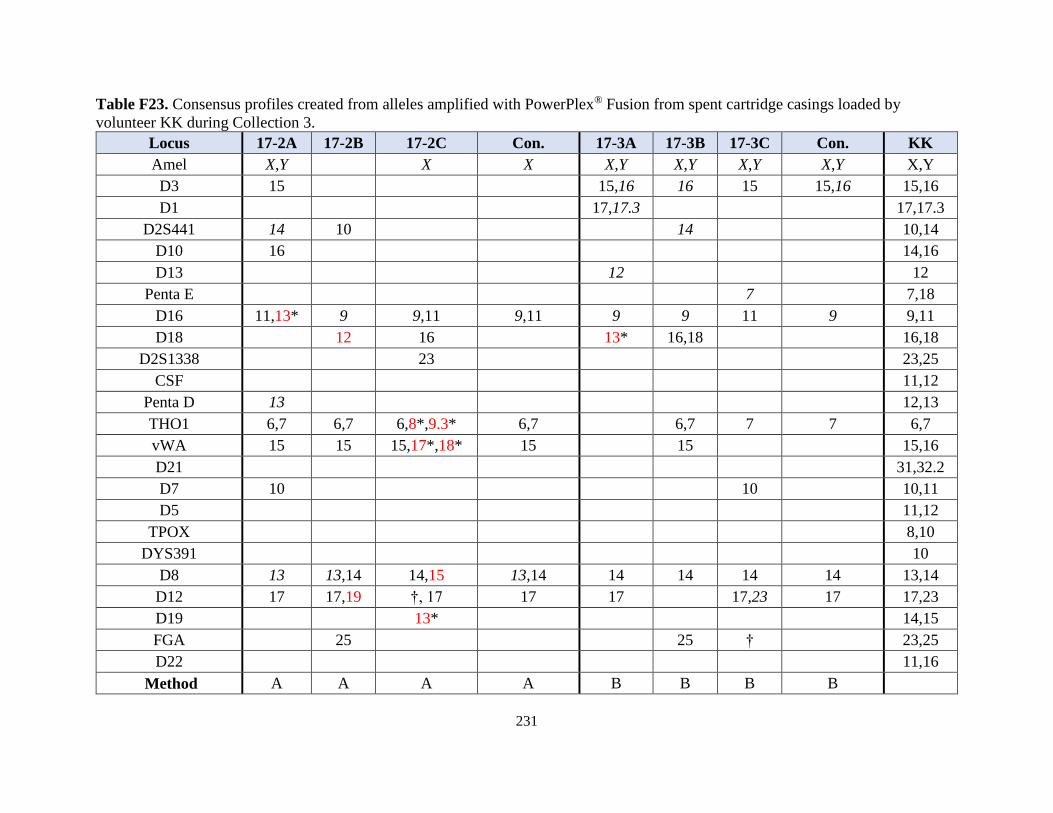
231
Table F23. Consensus profiles created from alleles amplified with PowerPlex® Fusion from spent cartridge casings loaded by
volunteer KK during Collection 3.
Locus 17-2A 17-2B 17-2C Con. 17-3A 17-3B 17-3C Con. KK
Amel X,Y X X X,Y X,Y X,Y X,Y X,Y
D3 15 15,16 16 15 15,16 15,16
D1 17,17.3 17,17.3
D2S441 14 10 14 10,14
D10 16 14,16
D13 12 12
Penta E 7 7,18
D16 11,13* 9 9,11 9,11 9 9 11 9 9,11
D18 12 16 13* 16,18 16,18
D2S1338 23 23,25
CSF 11,12
Penta D 13 12,13
THO1 6,7 6,7 6,8*,9.3* 6,7 6,7 7 7 6,7
vWA 15 15 15,17*,18* 15 15 15,16
D21 31,32.2
D7 10 10 10,11
D5 11,12
TPOX 8,10
DYS391 10
D8 13 13,14 14,15 13,14 14 14 14 14 13,14
D12 17 17,19 †, 17 17 17 17,23 17 17,23
D19 13* 14,15
FGA 25 25 † 23,25
D22 11,16
Method A A A A B B B B
232
Table F24. Consensus profiles created from alleles amplified with PowerPlex® Fusion from spent cartridge casings loaded by
volunteer Z during Collection 3.
Locus 18-3A 18-3B 18-3C Con. 18-4A 18-4B 18-4C Con. Z
Amel X X,Y X X X X X X
D3 15,16 15 15 15 16 15,16
D1 15,18.3
D2S441 12,14 12,14
D10 13 13
D13 9,11
Penta E 7 7,14
D16 9,11,14 12 10* † 9,12
D18 18 12,15 12 12 15 12,15
D2S1338 19 25 19,25
CSF 11 11,13
Penta D 10 10,14
THO1 6,7,9.3 6,9.3 6,9.3 6,9.3 6 9.3 6 6 6,9.3
vWA 18,19 15 18 18,19
D21 30 29 30 30 29 30 30
D7 10 10 10 10,11
D5 10*,12 13 12,13
TPOX 8 8,11
DYS391 N/A
D8 †,11,13 13,15* 13 13 † 11,13 11 11 11,13
D12 19.1,20 20 20 20,25 20
D19 14 14 14 14
FGA 19.3 21,24 † 21,24
D22 15
Method A A A A B B B B
233
Table F25. Consensus profiles created from alleles amplified with PowerPlex® Fusion from spent cartridge casings loaded by
volunteer PP during Collection 3.
Locus 20-4A 20-4B 20-4C Con. 20-1A 20-1B 20-1C Con. PP
Amel X Y* X,Y* X,Y* X X X X
D3 15 15 14,15 15 15 15
D1 12,18.3 17 17.3* 12 15.3 12,15.3
D2S441 13 14 10,14 14 14
D10 13
D13 12 11
Penta E 7 11,12
D16 †,11,13 9,13 9,12 9 11 13 11,13
D18 18 18,19 18 18 18 18 16,18
D2S1338 19,23 19 19 19 17,19
CSF 11,12
Penta D 12 10,12
THO1 9.3 9.3 6,7*,8,9.3 9.3 9,9.3 9.3 9.3 9.3
vWA 16 17 16 16 16,17
D21 31,32.2 33.2 28 29 29,32.2
D7 10 10,11* 10 8,12
D5 12 11 10,12
TPOX 10 8
DYS391 N/A
D8 11,13 11,13,14,17 13,14 11,13,14 13 11,13 11,†,14 11,13 11,13
D12 22 17*,† 27 18 21* 18,22
D19 14,15 14,15
FGA 15 25 22.2,25 25 24 22.2,24
D22 16,17
Method A A A A B B B B
234
Table F26. Consensus profiles created from alleles amplified with PowerPlex® Fusion from spent cartridge casings loaded by
volunteer X during Collection 3.
Locus 21-1A 21-1B 21-1C Con. 21-2A 21-2B 21-2C Con. X
Amel X,Y Y Y X,Y X X X,Y
D3 16 15,16 15 15,16 15,16 15 15 15 15,16
D1 11,14 11,14 11,14 11 14 11,14
D2S441 14 14 14 14 14
D10 12,14 14 14 12,14
D13 11 11,12
Penta E 12,14 12,14
D16 9,11,13 9,13 9 9,13 9 9,13 9 9 9,13
D18 15 15 15 15 15
D2S1338 17,21 17,21
CSF 11 11
Penta D 12,14
THO1 8,9.3* 8 8 8 8 8 8 8 8
vWA 15,16 15,16 15,16 15 15,16
D21 27,30 27 26.2* 27,30
D7 9* 10,11
D5 11 11,12
TPOX 8 8,9
DYS391 10
D8 15 13*,15 15 15 15 15 11,15 15 15
D12 18 18,19,20.3,23,† 18,21* 18 20,21* 18,19,23 18,19
D19 13.2 18 12,13 12,13
FGA 18 14,22,30.2 18,22
D22 14 15* 10,14
Method A A A A B B B B
235
Table F27. Consensus profiles created from alleles amplified with PowerPlex® Fusion from
spent cartridge casings loaded by volunteer UU during Collection 3.
Locus 35-2A 35-2B 35-2C Con. 35-3A 35-3B 35-3C Con. UU
Amel X X,Y X X X,Y
D3 14 15*,16,
17 16,17
D1 11,12,
14,17.3* 12,16.3
D2S441 14* 8,10
D10 13,15
D13 13 11,12
Penta E 13 12
D16 9*,12 11,12 11 11,12 11 11
D18 16*,17 13,15
D2S1338 17 17,21 17 17
CSF 10,12
Penta D 12,13
THO1 9.3 7*,9,9.3 9.3 6,9 6,9
vWA 15*,17 14,16*,
17,18 17 14,20
D21 29,30.2 29,30
D7 8,10 10,13
D5 10 10,12
TPOX 11 8 8,11
DYS391 11
D8 10,12,13
,14* 13
D12 17*,18 † 18,21
D19 13,14,
15* 13.2,14
FGA 14,22 18,30 22
D22 15,16 15,16
Method A A A A B B B B

236
REFERENCES
237
REFERENCES
Alessandrini F, Cecati M, Pesaresi M, Turchi C, Carle F, Tagliabracci A. Fingerprints as
evidence for a genetic profile: morphological study on fingerprints and analysis of
exogenous and individual factors affecting DNA typing. J Forensic Sci 2003;48(3):1–7.
Batzer MA and Deininger PL. Alu repeats and human genomic diversity. Nat Rev Genet
2002;3(5):370–9.
Bentsen RK, Brown JK, Dinsmore A, Harvey KK, Kee TG. Post firing visualization fingerprints
on spent cartridge cases. Sci Justice 1996;36(1):3–8.
Boom R, Sol CJ, Salimans MM, Jansen CL, Wertheim-van Dillen PM, van der Noordaa J. Rapid
and simple method for purification of nucleic acids. J Clin Microbiol 1990;28(3):495–
503.
Bowe CAI. Use of silica-supported adsorbents, modified silica gel, modified montmorillonite
KSF of magnetite in the remediation of selected heavy metals from aqueous media
[dissertation]. Tampa (FL):Univ. of South Florida., 2003.
Bright J and Petricevic SF. Recovery of trace DNA and its application to DNA profiling of shoe
insoles. Forensic Sci Int 2004;145:7–12.
Budowle B, Eisenberg AJ, van Daal A. Validity of low copy number typing and applications to
forensic science. Croat Med J 2009;50(3):207–17.
Butler JM. Forensic DNA Typing. 2nd ed. Burlington: Elsevier Academic Press, 2005.
Butler JM and Hill CR. Scientific issues with analysis of low amounts of DNA. Promega
Corporation web site. 2010. http://www.promega.com/resources/profiles-in-
dna/2010/scientific-issues-with-analysis-of-low-amounts-of-dna/
Cardozo BR, Jaureguiberry SM, Boselli GO. Touch DNA-the forensic use of solid and porous
matrices coated with polyanilines in the selective separation of biopolymers from nucleic
acids. Proceedings of the 23rd International Symposium on Human Identification; 2012
Oct 15–18; Nashville (TN) Madison (WI): Promega, 2012.
Comey CT, Koons BW, Presley KW, Smerick JB, Sobieralski CA, Stanley DM et al. DNA
extraction strategies for amplified fragment length polymorphism analysis. J Forensic Sci
1994;39(5):1254–69.
Dieltjes P, Mieremet R, Zuniga S, Kraaijenbrink T, Pijpe J, De Knijff P. A sensitive method to
extract DNA from biological traces present on ammunition for the purpose of genetic
profiling. Int J Legal Med 2011;125:597–602.
238
DiMaio VJM. Gunshot wounds: practical aspects of firearms, ballistics, and forensic techniques.
2nd ed. Boca Raton: CRC Press, 1999.
Doran AE and Foran DR. Assessment and Mitigation of DNA Loss Utilizing Centrifugal
Filtration Devices. Forensic Sci Int: Genet In press.
Doyle JS. FirearmsID. An Introduction to Forensic Firearm Identification. 2014.
www.firearmsid.com
FBI. Uniform Crime Reports. Violent Crime. 2012. http://www.fbi.gov/about-us/cjis/ucr/crime-
in-the-u.s/2012/crime-in-the-u.s.-2012
Gill P, Whitaker J, Flaxman C, Brown N, Buckleton J. An investigation of the rigor of
interpretation rules for STRs derived from less than 100 pg of DNA. Forensic Sci Int
2000;112:17–40.
Given BW. Latent fingerprints on cartridges and expended cartridge casings. J Forensic Sci
1976;21(3):587–94.
Goray M, Eken E, Mitchell RJ, van Oorschot RAH. Secondary DNA transfer of biological
substances under varying test conditions. Forensic Sci Int: Genet 2010;(4):62–7.
Green RL, Roinestad IC, Boland C, Hennessy LK. Developmental Validation of the Quantifiler™
real-time PCR kits for the quantification of human nuclear DNA samples. J Forensic Sci
2005;50(4):1–17.
Greenspoon SA, Scarpetta MA, Drayton ML, Turek SA. QIAamp spin columns as a method of
DNA isolation for forensic casework. J Forensic Sci 1998;43(5):1024–30.
Guns & Ammo Info. The Bullet Cartridge. 2014. http://www.gunsandammo.info/ammo/ammo-
101
Hares DR. Expanding the CODIS core loci in the United States. Forensic Sci Int: Genet
2012A;(6):e52–4.
Hares DR. Addendum to expanding the CODIS core loci in the United States. Forensic Sci Int:
Genet 2012B;(6):e135.
Hebda LM, Doran AE, Foran DR. Collecting and analyzing DNA evidence from fingernails: a
comparative study. J Forensic Sci. In press.
Higuchi R, Fockler C, Dollinger G, Watson R. Kinetic PCR analysis: real-time monitoring of
DNA amplification reactions. Nat Biotechnol 1993;11(9):1026–30.
239
Hill CR, Kline MC, Duewer DL, Coble MD, Butler JM. Population statistics on the proposed
expanded U.S. core loci. Proceedings of the 23rd International Symposium on Human
Identification; 2012 Oct 15–18; Nashville (TN) Madison (WI): Promega, 2012.
Horsman-Hall KM, Orihuela Y, Karczynski SL, Davis AL, Ban JD, and Greenspoon SA.
Development of STR profiles from firearms and fired cartridge cases. Forensic Sci Int:
Genet 2009;3:242–50.
Kapustin DV, Yagudaeva EY, Zavada LL, Zhigis LS, Zubov VP, Yaroshevskaya EM et al. A
composite polyaniline-containing silica sorbent for DNA isolation. Russian Journal of
Bioorganic Chemistry 2003;29(3):281–5.
Kiley BM. A highly sensitive sex determination assay for low quality DNA [thesis]. East
Lansing (MI): Michigan State Univ., 2009.
Kopka J, Leder M, Jaureguiberry SM, Brem G, Boselli GO. New optimized DNA extraction
protocol for fingerprints deposited on a special self-adhesive security seal and other latent
samples used for human identification. J Forensic Sci 2011;56(5):1235–40.
Krane DE. Some of the problems associated with LCN (low copy number) testing. The Forensic
Institute 2007 Forensic e-Symposium on Human Identification: Profiling of degraded and
low amounts of DNA. http://www.bioforensics.com/downloads/index.html
Lee HC and Ladd C. Preservation and collection of biological evidence. Croat Med J
2001;42(3):225–8.
Life Technologies. AmpFℓSTR® MiniFiler™ PCR Amplification Kit. 2014.
http://www.lifetechnologies.com/us/en/home/industrial/human-identification/ampflstr-
minifiler-pcr-amplification-kit.html
Lindahl T. Instability and decay of the primary structure of DNA. Nature 1993;362:709–15.
Lindquist CD, Evans JJ. Wictum EJ. Developmental validation of feline, bovine, equine, and
cervid quantitative PCR assays. J For Sci 2011;56(S1):S29–S35.
Lowe A, Murray C, Whitaker J, Tully G, Gill P. The propensity of individuals to deposit DNA
and secondary transfer of low level DNA from individuals to inert surfaces. For Sci Int
2002;129:25–34.
Maniatis T, Fritsch EF, Sambrook J. Molecular cloning: a laboratory manual. New York: Cold
Spring Harbor Laboratory, 1982;458–9.
Meakin G and Jamieson A. DNA transfer: review and implications for casework. For Sci Int:
Genet 2013;7:434–43.
240
Melzak KA, Sherwood CS, Turner RFB, Haynes CA. Driving forces for DNA adsorption to
silica in perchlorate solutions. J Colloid Interface Sci 1996;181:635–44.
Mighell AJ, Markham AF, Robinson PA. Alu sequences. Federation of European Biochemical
Societies 1997;417:1–5.
Mullis KF, Faloona F, Scharf S, Saiki R, Horn G, Erlich H. Specific enzymatic amplification of
DNA in vitro: the polymerase chain reaction. Cold Spring Harb Symp Quant Biol
1986;51:263–73.
Murray V, Monchawin C, England PR. The determination of the sequences present in the
shadow bands of a dinucleotide repeat PCR. Nucleic Acids Res 1993;21(10):2395–98.
National Institute of Justice. Firearms Examiner Training. https://firearms-examiner.dna.gov
NEXTTEC™ Biotechnologie GmbH. FDF® Kit User Manual Version 2.1. Hilgertshausen,
Germany.
Nicklas JA and Buel E. An Alu-based, MGB Eclipse real-time PCR method for quantitation of
human DNA in forensic samples. J Forensic Sci 2005 Sep;50(5):1081–90.
Nicklas JA and Buel E. Simultaneous determination of total human and male DNA using a
duplex real-time PCR assay. J Forensic Sci 2006;51(5):1005–15.
Oostdik K, Lenz K, Nye J, Schelling K, Yet D, Bruski S et al. Developmental validation of the
PowerPlex® Fusion System for analysis of casework and reference samples: a 24-locus
multiplex for new database standards. Forensic Sci Int: Genet 2014;(12):69–76.
Orlando A. The recovery and analysis of DNA from fired cartridge casings [thesis]. East Lansing
(MI): Michigan State Univ., 2012.
Pang BCM and Cheung BKK. Double swab technique for collecting touched evidence. Leg Med
2007;9:181–4.
Petricevic SF, Bright J, Crockerton SL. DNA profiling of trace DNA recovered from bedding.
Forensic Sci Int 2006;159:21–6.
Phipps M and Petricevic S. The tendency of individuals to transfer DNA to handled items.
Forensic Sci Int 2007;168:162–8.
Poinar HN. The top 10 list: criteria of authenticity for DNA from ancient and forensic samples.
Int Congress Series 2003;1239:575–9.
Promega. PowerPlex® Fusion System. 2014. http://www.promega.com/products/genetic-
identity/str-analysis-for-forensic-and-paternity-testing/powerplex-fusion-system/
241
Qiagen. 2012. QIAamp® DNA Investigator Handbook. User’s manual. Hilden, Germany.
Quinones I and Daniel B. Cell free DNA as a component of forensic evidence recovered from
touched surfaces. Forensic Sci Int: Genet 2012;6:26–30.
Richert NJ. Swabbing firearms for handler’s DNA. J Forensic Sci 2011;56(4):972–5.
Ruger Forum. SR1911 Commander barrel lockup. 2014. http://rugerforum.net/ruger-
pistols/98275-sr1911-commander-barrel-lockup.html
Saferstein R. Criminalistics: an introduction to forensic science. 10th ed. Upper Saddle River:
Prentice Hall, 2011.
Sewell J, Quinones I, Ames C, Multaney B, Curtis S, Seeboruth H et al. Recovery of DNA and
fingerprints from touched documents. Forensic Sci Int: Genet 2008;2:281–5.
Sigma-Aldrich. Nucleases. 2014. http://www.sigmaaldrich.com/life-
science/metabolomics/enzyme-explorer/learning-center/nucleases.html
Smith LM and Burgoyne LA. Collecting, archiving and processing DNA from wildlife samples
using FTA® databasing paper. BMC Ecology 2004;4:1–11.
Spear T, Clark J, Giusto M, Khoshkebari N, Murphy M, and Rush J. Fingerprints and cartridge
cases: how often are fingerprints found on handled cartridge cases and can these
fingerprints be successfully typed for DNA? Proceedings of the California Association of
Criminalistics; 2005 May 9–15; Oakland, CA. Sacramento: California Criminalistics
Institute, 2005.
Sweet D, Lorente M, Lorente JA, Valenzuela A, Villanueva E. An improved method to recover
saliva from human skin: the double swab technique. J Forensic Sci 1997;42(2):320–2.
Taberlet P, Griffin S, Goossens B, Questiau S, Manceau V, Escaravage N et al. Reliable
genotyping of samples with very low DNA quantities using PCR. Nucleic Acids Res
1996;24(16):3189–94.
Thomasma SM and Foran DR. The influence of swabbing solutions on DNA recovery from
touch samples. J Forensic Sci 2013;58(2):465–9.
Thompson RM. Firearm Identification in the Forensic Science Laboratory. Gun Violence
Prosecution Program: The National District Attorney Association, 2010.
van Oorschot RAH, Ballantyne KN, Mitchell RJ. Forensic trace DNA: a review. Investig Genet
2010;1:14–31.
Walsh PS, Erlich HA, Higuchi R. Preferential PCR amplification of alleles: mechanisms and
solutions. Genome Research 1992;1:241–50.

242
Warlow T. Firearms, the Law, and Forensic Ballistics. 3rd ed. Boca Raton: CRC Press, 2012.
Wickenheiser RA. Trace DNA: a review, discussion of theory, and application of the transfer of
trace quantities of DNA through skin contact. J Forensic Sci 2002;47(3)442–50.