Embed Size (px)
Citation preview
China’s outward-oriented industrialization, spearheaded by the coastalprovinces, led to a quickening of urbanization from the start of reforms inthe early 1980s. In 1980 China, with an urbanization rate of 19.6 percent,was less urbanized than Indonesia (22.1 percent), India (23.1 percent), orPakistan (28.1 percent) (table 1.1). By 2005, 42.9 percent of China’spopulation lived in urban areas, still somewhat below the global averageof 50 percent but close to the average for East Asia (41 percent) and wellin excess of India’s 28.7 percent rate.1
Between 1980 and 2000, 268 million Chinese entered into the urbandomain, mainly through migration from rural areas. This figure wasalmost twice as large as the increase of the urban population in the restof East Asia (table 1.2). By 2020, urbanization could pass the 60 percentmark, with 200 million or more rural dwellers joining the ranks of theurban population. The scale of urbanization in China will dwarf thatoccurring elsewhere in East Asia.
This shift in the demographic center of gravity has seismic implicationsfor China and major spillover effects for the rest of the world. It will bea driver of economic growth. The urban economy should generateenough jobs to absorb the additions to the urban workforce at steadily
C H A P T E R 1
Optimizing Urban Development
1
Shahid Yusuf and Kaoru Nabeshima
1 The classification of the urban population has changed overtime (see Fang 1990; Zhouand Ma 2003).
rising wages if the economy continues to grow at least 8 percent a year(feasible given the elastic labor supply); capital accumulation is sustained;and the scope for enhancing technological capabilities increases.2,3
Meeting these conditions is crucial for urban residents, because urbanemployment opportunities and the median urban wage will determine liv-ing standards in cities (see chapter 8). These conditions will have a bearingon whether the influx of people leads to the formation of slums, as it has inmany Latin American cities. They will also affect income distribution,4
2 China Urbanizes: Consequences, Strategies, and Policies
2 Bosworth and Collins (2007) estimate that total factor productivity rose by 4 percent ayear between 1993 and 2004 and that its contribution to overall growth was only a littleless than that of capital. He and Kuijs (2007) estimate that TFP grew by 2.8 percent perannum during 1993–2005.
3 New York’s real manufacturing wages kept rising in the second half of the 19th century,even though a significant number of immigrants came to New York. In the early partof the 20th century, when immigration to the United States increased dramatically,real wages in New York (the entry point of many immigrants) started to fall(Glaeser 2005b).
4 Because of the widening gap between rural and urban incomes and interprovincial dispari-ties, China’s income distribution, as reflected by the Gini coefficient, has risen rapidly, from0.33 in 1980 to 0.49 in 2005 (“China’s Income Gap” 2006). Other estimates of theGini coefficient in 2005 are slightly lower. The distribution of net wealth in urbanareas, which is strongly influenced by property ownership, is also becoming moreskewed, although it remains relatively equal (Wu 2004; Gustafsson, Shi, and Zhong2006; Saich 2006).
Table 1.2. Urban Population in China and East Asia, 1960–2005
(millions)
Year China East Asia
1960 130.7 86.2
1970 144.2 125.2
1980 191.4 177.6
1990 302.0 241.1
2000 459.1 314.2
2005 562.1 352.4
Source: Data for East Asia are from World Bank 2006. Data for China are from Fang 1990, Pannell 2003, and NBS 2006.
Note: East Asia includes Hong Kong (China), Indonesia, Japan, the Republic of Korea, Malaysia, the Philippines,
Singapore, Thailand, and Vietnam.
Table 1.1. Percentage of Population Living in Urban Areas in Selected Asian
Countries, 1980–2005
Country 1980 1985 1990 1995 2000 2005
China 19.6 23.0 27.4 31.4 35.8 42.9
India 23.1 24.3 25.5 26.6 27.7 28.7
Indonesia 22.1 26.1 30.6 35.6 42 48.1
Pakistan 28.1 29.3 30.6 31.8 33.1 34.9
Source: NBS 2006; World Bank 2006.
overall energy and water consumption, and the quality of life in cities. Arising median wage rate and a relatively egalitarian income distributionwould be broadly advantageous, but they would also push up per capitaresource consumption. Chinese cities would become larger users of localand global resources, including global public goods. At the same time,prosperity and technological capability would provide the means to containthe resource costs and externalities associated with growth.A slow-growthscenario or a scenario in which average income rises but incomes becomemore unequal might lead to somewhat lower resource consumption, per-haps more than counterbalanced by sociopolitical tensions, which couldjeopardize economic performance.
A host of policies will collectively determine growth, income distri-bution, resource use, and the quality of life. From an urban perspective,five sets of policies are especially noteworthy:
• Policies affecting rural-to-urban migration and intersectoral differencesin average household incomes
• Policies affecting the size distribution of cities and the relative concen-tration of people in major metropolitan centers
• Policies affecting the development of urban infrastructure• Policies that impinge on the availability of and access to public services
and social safety nets• Policies and institutions that regulate energy and water use in cities
and help control urban pollution.5
These policies are the primary focus of this volume.The rest of this chapter is divided into five sections. The first section
briefly reviews the history of urbanization since ancient times. Thesecond section describes some of the positive and negative conse-quences of migration to cities. The third section explores factors thatwill define China’s urban development strategy. The fourth sectionexamines the policies that will guide urban change. The fifth sectionprovides some concluding observations.
Urbanization in China since Ancient Times
Urbanization in China began almost 4,000 years ago, although Neolithicvillages had begun sprouting in river valleys as early as 5000 BC
Optimizing Urban Development 3
5 China’s plans with regard to energy-use pricing, efficiency, technology, and regulationare presented in NDRC (2007). Rosen and Houser (2007) assess the demand and sup-ply situation and the implications of China’s consumption on global markets. Shalizi(2007) provides an assessment based on a comprehensive modeling framework.
(Ebrey 1996). Ho Ping–ti writes of the “large urban centers” that arosein Shang times (circa 1700–1100 BC) and of the high walls of packedearth that surrounded many settlements, including most notably, thecities near Cheng-chou and An-yang in Hunan (Ho 1975; Friedman2005). The number of cities proliferated during the Zhou dynasty(1122—221 BC). Created primarily to fulfill military and administrativeroles, these cities also took on other functions (Zhao 1994).
The curve tilts ever so gently upward as urban populations began togrow during the Qin (221–206 BC) and Han dynasties (202 BC–AD 220).By the time of the Southern Song dynasty (12th century), 10–13 percentof the Chinese population lived in cities, with Kaifeng, the capital of theSong, having a population of almost 1 million people (Bairoch 1991).6
Mote (1999) surmises that the number of urban dwellers in China duringthe middle years of the Song dynasty equaled those in the rest of theworld at that time.
For a few hundred years thereafter, the curve remains fairly flat.However, the scale of cities such as Hangzhou on the West Lake impressedMarco Polo, who had seen no comparable center in Europe (“the mostsplendid city in the world . . . [with] 13,000 bridges mostly of stone”)(Polo 1958: 213). By the time the Ming dynasty was entering its twilightyears in the 16th century, the curve of urbanization had inched up anotch to 11–14 percent (Bairoch 1991). Major centers such as Beijingand Nanjing housed almost 1 million people, a handful of cities hadpopulations of half a million or more, and “scores of urban places” hadpopulations of 100,000. “Urban life was rich, comfortable, and elegant . . .varied and lively [in the larger cities]” (Mote 1999: 763).
By the late 19th century, the urban share of China’s population hadfallen to 6.0–7.5 percent, although the absolute number of urbandwellers rose, because population growth accelerated in the 18th andearly 19th centuries (Bairoch 1991; Zhao 1994). By this time, the indus-trializing countries of Europe had pulled ahead, with urbanization ratesof 61 percent in Britain and 29 percent in Europe as a whole. This gapbetween China and Western Europe had widened further by 1949, whenthe communist regime took hold of the reins of government.
Initially, the new government allowed cities to grow. Since the 1960s,however, China has sought to tightly manage the course of urbanization(see Kwok 1981; Fang 1990). The intersectoral movement of peopleand, from the 1970s, fertility rates were controlled with considerable
4 China Urbanizes: Consequences, Strategies, and Policies
6 Zhao (1994) cites a much higher figure of 22 percent for the urban population underthe Song dynasty.
success through the combined efforts of the Communist Party andthe government bureaucracy.7
The main instrument used to regulate movement is the hukou system,which assigns every person in China a residence in a specific locality.8 Thissystem distinguishes urban from rural residents, with urban householdsenjoying far more benefits and privileges than rural ones (see Friedman2005). The one-child policy—which is still enforced, albeit more flexiblythan it once was—meanwhile checked population growth, pushingfertility down from 5.9 in 1970 and 2.9 in 1979 to 1.7 in 2004 (Hesketh,Lu, and Xing 2005). Urban fertility was 1.3 in 2005, while the rate in ruralareas was a little less than 2 (Hesketh, Lu, and Xing 2005). By 2005China’s population was growing at 0.59 percent a year (NBS 2006).
Together these two policies slowed the increase in the urban share ofChina’s population to a crawl until well into the 1980s (Fang 1990).Migration between sectors was not brought to a complete halt, but thehukou system reduced it to a trickle, by making it difficult to find hous-ing or gain access to essential services outside of one’s official place ofresidence. Changing one’s residence and, most important, obtaining anurban hukou required and still requires hard-to-obtain official approval,especially in larger cities.
Once industrial and trade reforms gathered momentum in the 1980s,demand for workers from urban enterprises began drawing more migrantsto the cities, increasing the pressure on municipal authorities to relaxhukou rules. Initially, many cities resisted these pressures, preferring avery gradual easing of the restrictions for fear that anything more wouldattract an unmanageable flood of migrants. This change in policy stimu-lated the multiplication of industry in small towns and villages in ruralareas, which by 1990 employed 93 million workers (see chapter 2) andwas responsible for 17 percent of China’s exports of manufactures.9 By
Optimizing Urban Development 5
7 China’s efforts to regulate population growth gathered momentum after the CulturalRevolution in the late 1960s. Fertility was already declining in the 1970s before theannouncement and subsequent implementation of the one-child policy in 1979(Baochang and others 2007). See Hesketh, Lu, and Xing (2005) regarding the impactof the policy over a quarter century.
8 During the second half of the 1960s and in the 1970s, the government also “sentdown” urban youth to rural areas and redeployed millions of urban workers to interi-or southwestern provinces in order to disperse industrial capabilities and reduceChina’s vulnerability to attacks from abroad. On these rustication and Third Frontinland industry development programs, see Gardner (1971), Bernstein (1977),Naughton (1988), Fang (1990), and Demurger and others (2002).
9 The government encouraged these former “commune and brigade” enterprises,because they raised rural incomes and stemmed migration (Zhu 2000; Wu 2005).
1996 township and village enterprises (TVEs) employed 135 million andaccounted for 46 percent of exports (Li 2006).10 Rural industrializationdrew on an unforeseen reservoir of entrepreneurship and was aided byfiscal decentralization that encouraged lower-level cadres to take thelead in developing industry (Oi 1992; Qian 1999).
By the mid-1980s, attitudes toward urbanization began to shift, withcities coming to be viewed as “growth poles” and the “city as leading thecountry.” Some Chinese researchers argued that “growth poles should bescattered through the country, each sending waves of economic growthin its hinterland” (Fan 1997: 630). In order to accelerate industrializationand meet the needs of construction and other services, cities had toabsorb more migrants. Moreover, the small towns that had becomeimportant foci for industrial development grew to become substantialurban centers with concentrations of industry and were reclassified ascities, a process known as in situ urbanization.11
China retained the hukou system, but by the mid-1990s theinevitability of rising urbanization was widely accepted, only its speedremained an issue. Differing views came to determine the enforcementof hukou requirements. Viewing migration as a means of expanding theirindustrial bases and using the fiscal revenue generated to build urbaninfrastructure, small- and medium-size cities began to welcome the flowof labor from the rural sector. In contrast, many larger cities, especially incoastal areas, remained wary. They absorbed large numbers of temporarymigrants to satisfy their for industrial and construction workers needs12
but continued to use hukou to limit permanent migration.13
Benefits and Challenges of Urban Migration
Urbanization is now perceived as intrinsic to the process of growthand modernization, and the role of rural migration in diversifyingsources of rural incomes and narrowing intersectoral disparities inhousehold incomes is better understood (Knight and Song 2003). But
6 China Urbanizes: Consequences, Strategies, and Policies
10 Employment in TVEs declined thereafter but has since recovered, reaching 143 millionin 2005 (NBS 2006).
11 Zhu (2000) describes this process in Jinjiang county, Fujian Province. See also chapter 2.12 Pannell (2003) describes the regional pattern of urbanization in China and the demo-
graphic structure of the urban population.13 In some cities, particularly in Guangdong and Fujian (for example, Dongguan), non-
residents account for up to half of the population.
the desire to manage migration and contain the costs of urban housingand social benefits provided to residents means that there is anunwillingness to dismantle the hukou system, although Beijing hasallowed local governments much greater discretion regarding how itis applied and enforced.
Per capita annual income disparities of 1:2.4 between rural andurban areas and vastly greater job opportunities in cities make it highlyattractive for rural people to migrate.14 The result is that migration isadding to the numbers of registered urban residents and swelling theranks of the so-called “floating population,” made up of people with ruralhukou who are temporarily living and working in cities (see chapter 3).The size of this transient (inter- and intracounty) population was almost148 million in 2005 (see chapter 3); they are most numerous in easternmetropolitan centers, such as Beijing, Guangzhou, Shanghai, and Shenzhen,which have plentiful jobs and the “bright lights” that draw migrants.15
The influx of migrants, permanent or floating, has had a number ofpositive and negative effects. The migration of mainly young people tocities drawn from the better-educated rural cohorts has promotedgrowth by enhancing the labor supply and by injecting an additionaldose of entrepreneurship and dynamism into the urban labor market(Bloom and Williamson 1997).16 The remittances migrants send to theirvillages have significantly bolstered rural household consumption, insome cases contributing as much as 40 percent of annual householdincomes (the average is closer to 20 percent). Migrants have helped bringliving standards in some of the poorest rural areas closer to urban levels.These and other positive outcomes outweigh some of the problemsassociated with migration.
Optimizing Urban Development 7
14 The unadjusted differential in rural and urban incomes is 1:3.5. See chapter 2 and tables10.8 and 10.18 in the China Statistical Yearbook (NBS 2006). The rural and urbanincome divide is the main cause of income inequality in China (Sicular and others2007). Tsui (2007) shows that inequality among provinces has arisen from the alloca-tion over time of capital and FDI and the influence that allocation has had on totalfactory productivity across provinces.
15 The provinces and cities that have attracted the largest number of migrants areGuangdong, Zhejiang, Jiangsu, Shandong, Beijing, Shanghai, and Guangzhou. About15–20 million migrants work in Guangdong (“Delta Dreams” 2006), the destination ofmigrants from Hunan, Jiangxi, Sichuan, Guangxi, and Hainan. Shandong has attractedmigrants from Heilongjiang and Liaoning (see chapter 3; Fan 2005).
16 Bloom and Williamson (1997) find that demographic shift, which affected labor forcegrowth, age structure, domestic savings, and domestic investment, was responsible for1.4–1.9 percent of the annual growth in GDP in East Asia between 1965 and 1990.
Perhaps the most serious concern centers on the risk migrants run ofbecoming part of the urban poor.17 Temporary migrants have limitedaccess to health and education services. Their age makes them healthierthan older people but leaves them more vulnerable to accidents andchildbirth. Migrants are less likely to visit a doctor when sick and morelikely to self-medicate. The cost of sending their children to school canbe a major burden. Some live in crowded conditions, although the evidenceon this problem is equivocal.18
While migrants’ income net of remittances can be meager, migrantsare less likely than elderly or disabled urban residents to fall below thepoverty line. The evidence reported in chapters 2, 3, and 4 suggeststhat only a small percentage of urban migrants can, strictly speaking, beclassified as poor.19
There are worries that the departure of many young educated workerswill denude the countryside of skills, know-how, and entrepreneurship.Thisis unlikely for some time to come, if ever. China’s farm population exceedsthe numbers needed; many workers return to their villages after a stint inthe cities and invest their earnings in farming or other rural activities.Moreover, the most educated are less likely to migrate (see chapter 3;Murphy 2002).20
The increase in China’s urban population from 191 million in 1980to 562 million in 2005 has called for massive investment in urbanhousing and infrastructure. Amazingly, China has been able to absorbmore than 370 million people in its cities without the proliferation ofurban slums, although sewerage and waste disposal services have struggledto keep up with demand. Between 1990 and 2000, 130 million newurban dwellers were provided access to improved sanitation facilities;
8 China Urbanizes: Consequences, Strategies, and Policies
17 Townspeople have traditionally displayed antipathy toward rural migrants, finding itdifficult to comprehend their dialects, complaining about their lack of culture, andblaming them for bringing crime and disease to urban areas. Some of this antipathypersists and is responsible for the continuing resistance to migration (Zhang 2001).According to Ravallion, Chen, and Sangraula (2007), urban poverty is just 4 percent ofthe rural rate, and it has remained low since the mid-1990s, even in the face of heavymigration to the cities.
18 Wu (2002) finds that about a third of all migrants in Shanghai live in dormitories pro-vided by employers and about half rent their accommodations. Overall, migrants insome of the larger coastal cities appear to be living in housing equivalent to that ofurban residents at similar levels of income (Jiang 2006).
19 The exclusion of dependants could introduce some bias.20 Murphy’s (2002) study of counties in Jiangxi describes the proactive approach taken
by officials to entice back migrants who have accumulated capital and skills while incities. Returning migrants are responsible for establishing numerous businesses in theirhome towns and villages.
nearly a third of the urban population still lacks these services, however(Mohan 2006).
Old workplaces, their housing compounds, and concentrations of smallbusinesses contribute to urban dilapidation in inner-city areas. On thefringes of major cities such as Beijing, migrants have created small enclaves,where housing quality can be variable. In Beijing’s Zhejiang village, forexample, living standards are relatively high, because migrants work insmall businesses that produce clothing and footwear. Migrants from Henanwho collect rubbish are much poorer (Wu 2004).
The relative smoothness of the urban transition has been made possi-ble by the availability of investment funds intermediated by the bankingsystem, the remarkable strides made by the construction sector, andacceptable growth in regulatory capacity in urban centers. But the roleof capital generated through high domestic savings has been paramount.
Urban investment started from a modest base in the mid-1980s andaccelerated throughout 1990s, although growth slowed in 1999 and2000. Beginning in 2001, urban investment picked up the pace again,registering double-digit growth, especially in 2003, when it rose 20 per-cent, and 2004, when it rose 31 percent. For 2004 the share of housingexpenditure is estimated to have been 10 percent of GDP, with totalinfrastructure spending estimated at almost 20 percent of GDP (Yusufand Nabeshima 2006b).
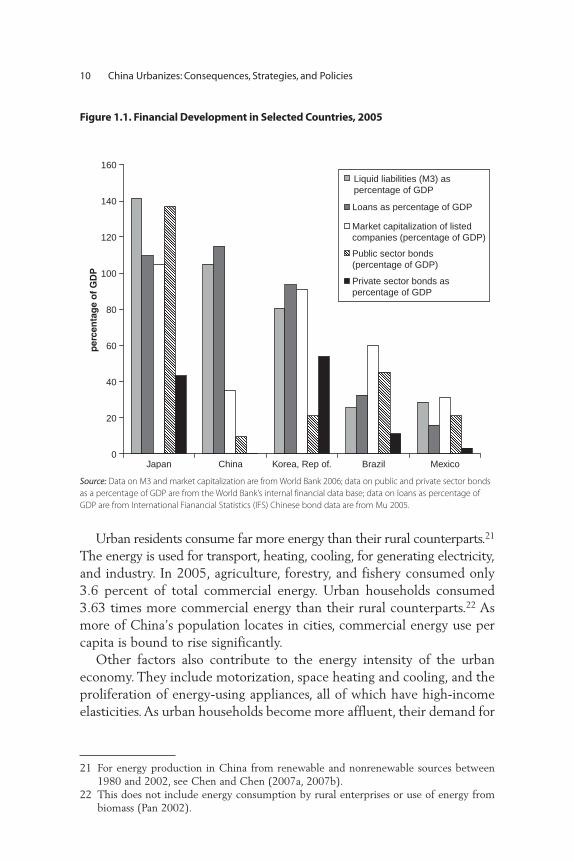
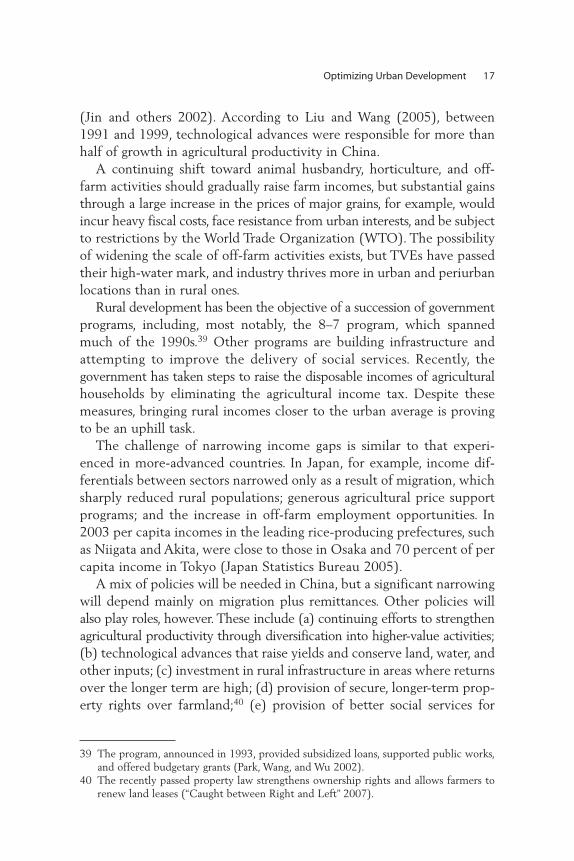
This investment has made an enormous difference, visible to any visitor.More important, it has enabled China to accommodate a far-reachinggeographic and intersectoral distribution of the population. Might theresources have been allocated more efficiently and through more-variedfinancial channels? Chapter 5 indicates how the allocative process hasbeen distorted by the need to sustain state-owned enterprises and bythe actions of local authorities, who are able to influence banks’ lendingdecisions. But the fact remains that no country has matched the scale ofChina’s achievement in mobilizing financial resources using the bank-ing system to funnel capital to urban development. This financialwidening is signified by the high rates of M3—a definition of the moneysupply that includes currency, demand deposits, savings and timedeposits, ODs, money market accounts, eurodollar deposits, and REPOSand the ratio of loans to GDP, which compare favorably with those ofJapan and exceed those of Brazil, the Republic of Korea, and Mexico.However, the low ratios of bonds and market capitalization of listedcompanies to GDP indicate a good deal of room for enhancing financialdepth (figure 1.1).
Optimizing Urban Development 9
Urban residents consume far more energy than their rural counterparts.21
The energy is used for transport, heating, cooling, for generating electricity,and industry. In 2005, agriculture, forestry, and fishery consumed only3.6 percent of total commercial energy. Urban households consumed3.63 times more commercial energy than their rural counterparts.22 Asmore of China’s population locates in cities, commercial energy use percapita is bound to rise significantly.
Other factors also contribute to the energy intensity of the urbaneconomy. They include motorization, space heating and cooling, and theproliferation of energy-using appliances, all of which have high-incomeelasticities.As urban households become more affluent, their demand for
10 China Urbanizes: Consequences, Strategies, and Policies
0
20
40
60
80
100
120
140
160
Japan
per
cen
tag
e o
f G
DP
Liquid liabilities (M3) aspercentage of GDP
Loans as percentage of GDP
Market capitalization of listedcompanies (percentage of GDP)
Public sector bonds(percentage of GDP)
Private sector bonds aspercentage of GDP
China Korea, Rep of. Brazil Mexico
Source: Data on M3 and market capitalization are from World Bank 2006; data on public and private sector bonds
as a percentage of GDP are from the World Bank’s internal financial data base; data on loans as percentage of
GDP are from International Fianancial Statistics (IFS) Chinese bond data are from Mu 2005.
Figure 1.1. Financial Development in Selected Countries, 2005
21 For energy production in China from renewable and nonrenewable sources between1980 and 2002, see Chen and Chen (2007a, 2007b).
22 This does not include energy consumption by rural enterprises or use of energy frombiomass (Pan 2002).
all three will continue to push up energy consumption.23 In 2005, industryaccounted for 70 percent, transport for 7 percent, and households for10 percent of energy consumed (NBS 2006).24 The share of transport issure to rise substantially, propelled by the trend toward private vehicleuse.25 Household consumption of electricity will also rise (see chapter 6).
Energy consumption creates negative externalities, in the form of carbondioxide pollutants, and acid rain. In 2006, China became the leadingemitter of carbon dioxide into the atmosphere (6.2 billion tons as against5.8 billion tons by the United States). Release of sulfur dioxide and particu-lates, particularly in the northern parts of the country, is exacerbated by theshortage of water.As a result, only a very small fraction of the coal used canbe washed to rid it of sulfur, ash, and impurities (Roumasset, Wang, andBurnett 2006).26 As energy use climbs, air pollution in Chinese cities fromnitrogen oxide, sulfur dioxide, and particulates—already among the mostsevere in the world—could become even more intense.27 Of the 20 citieswith the worst air pollution in the world, 16 are in China (Wu 2006; Hoand Nielsen 2007).28
China’s energy demand mirrors the unusually dynamic growth of itsurban economy. The increasing use of energy is a sign of economic vigorand rising incomes. Between 2000 and 2005, the elasticity of consumptionaveraged 0.93; in 2005, 69 percent of energy derived from coal and 21 percentfrom oil. Of the energy derived from petroleum, net imports accounted for
Optimizing Urban Development 11
23 Although shifts in consumption that increase the share of services will reduce energyconsumption, the Economist Intelligence Unit estimates that China’s energy consump-tion relative to that of the United States will rise from 39 percent in 2000 to 86 per-cent in 2011 (“The Health of a Nation” 2007).
24 Industry and transport absorb 80 percent of petroleum consumed, mostly in the formof middle distillates (CBO 2006).
25 Ownership of passenger vehicles increased from 9.9 million vehicles in 2001 to 21 mil-lion in 2005, propelled by an easing of consumer credit (Roumasset, Wang, and Burnett2006; China Statistical Yearbook 2006). Some cities, such as Suzhou, are taking a leadin improving air quality by encouraging the use of motorbikes that use battery power.But even in this “beautifully preserved” and “well-tended city,” the air is “almostunbreathable” and the “canals are filled with black bubbling water” (Cheng 2006: 1859).
26 The impurities present in the coal being shipped increases the burden on China’s rail-way system, which devotes 40 percent of its capacity to the transport of coal (“FreeFlow” 2005). Washing coal is not without complication, because the sludge and waste-water must be treated to avoid localized pollution.
27 The severity of air and water population was already evident in the early 1970s. Inresponse, a national conference was held in 1973 and a basic environmental law passedin 1979 (Kojima 1987). Acid rain falls on one-third of China; emissions from Chineseindustry and power plants also contribute to acid rain in Japan and the Republic ofKorea (Roumasset, Wang, and Burnett 2006).
28 The world’s most polluted city is Linzen, in Shanxi, which produces coke. Lanzhou,the capital of Gansu, is also among the top 10 (“Lanzhou to Walk” 2007).
44 percent, and the share is rising (CBO 2006; NBS 2006). Given thedepletion of petroleum resources and the threat of climate change inducedby greenhouse gases (which could also contribute to a significant reductionin national crop fields by mid-century) the implications of China’s urban-ization are disconcerting in the medium term and troubling over the longerrun. Limiting the energy intensity of urban development will be a struggle,but it is one that policy makers will find impossible to sidestep.
While fossil fuels can be imported, water in the quantities requiredcannot. Desalinating seawater consumes energy; pumping the waterinland adds to the energy costs. Looking ahead, urban development inthe drier regions of China is likely to be circumscribed by the availabilityof usable water. Currently, two-thirds of China’s cities are faced withwater scarcity, caused by the uneven geographical distribution of watersupplies, the diversion of water for agricultural purposes, and pollutionfrom industrial sources (especially organic material), which renders upto 70 percent of the water from five of China’s seven largest rivers unfitfor consumption. Research on the Pearl River delta area shows that urbanriver water is far more polluted than water in rural counties (Ouyang,Zhu, and Kuang 2006). At great cost, China is diverting water from theYangtze to the northeastern part of the country to meet the needs of theincreasingly water-stressed 3-H region (the basins of the Huai, Hai, andHuang [Yellow] Rivers). Once completed, this effort will provide somerelief, though for how long is uncertain, as are the ecological consequencesfor the Yangtze basin and the receiving region.
Per capita water availability in 2005 was just 2,152 cubic meters, only12 percent of which was used for household purposes. Urban per capitawater consumption in China is relatively modest compared with Japanand the United States (see chapter 7). But water is inefficiently utilized,because it remains underpriced. China uses 6 times more water per unitof GDP than the Republic of Korea and 10 times more than Japan. For thisreason, underground water is also being pumped at unsustainable rates,causing the water table to fall, increasing the mineral content of water, andresulting in the subsidence of the land in cities and the infiltration ofbrackish water into subterranean aquifers.29
12 China Urbanizes: Consequences, Strategies, and Policies
29 The North China Plain derives close to 60 percent of its water supplies from ground-water, and according to some projects, the aquifers could be largely depleted in 30 years(“Beneath Booming Cities 2007; Evans and Merz 2007). Groundwater tables havedropped by as much as 90 meters in the Hai plains and by 100–300 meters in Beijing;they are also dropping in Shanghai and Shijiazhuang, where many wells must be dugto a depth of 200 meters to find clean water (see chapter 7). See Pielou (1998) on theproblems caused by the unsustainable extraction of groundwater.
More than 680 million Chinese live in the drier northern region (whichhas just one-sixth of the per capita water supply available in the southand one-tenth of the world’s average), more than half of them are urbandwellers. As this ratio climbs to 60 percent in the next 15 years and percapita urban consumption rises, as is likely, the intersectoral allocation ofwater and the management of water use will require strategic thinking onthe cultivation of water-intensive cereals such as corn and wheat, the courseand shape of urban development and the effective coordination of basin-wide water management both surface and subterranean (see chapter 7).The policies described below will have to be applied with considerableforce, as there are no substitutes for water.
Urban development is a complex, multifaceted process; farsightedand entrepreneurial management is a key to success. The sheer pace atwhich Chinese cities are expanding and the decentralized structure ofgovernment puts a particularly high premium on the planning andmanagerial skills of local authorities. Cities in China have coped moreeffectively with rapid urbanization, the mobilization of resources, thebuilding of infrastructure, and the wooing of industry than cities in othermiddle- and lower-middle-income countries. Moreover, the country’slarger cities are better governed than its smaller ones (see chapter 8). Sofar, most cities have been able to arrest the spread of slums (Flavin andGardner 2006; Jiang 2006) and contain the spread of crime. Chinesecities are cleaner than average, and in the majority of cases, the combinedefforts of Street Offices and higher-level municipal departments ensure thatpolicies are competently executed. This is a considerable achievement, andthe fact that citizen satisfaction levels rose between 2003 and 2005 is agood sign (see chapter 8). On average, other large countries, such asBrazil, India, and Indonesia, lag well behind China in terms of effectivemunicipal functioning.
However, according to the World Values survey conducted in 2006,Chinese have much more confidence in their government than Americans,with 97 percent of Chinese and just 37 percent of Americans expressingconfidence. Moreover, 84 percent of Chinese but just 37 percent ofAmericans believe that the government is not in the grip of specialinterest groups (Shiller 2006).30 The findings reported in chapter 8indicate that urban Chinese place less trust in their local governments(67 percent) than in the central government (84 percent).
Optimizing Urban Development 13
30 A Lichtman/Zogby poll conducted in late 2006 found that only 3 percent of Americanssurveyed had trust in the U.S. Congress (“The Way We Were” 2006).
The dissatisfaction of China’s urban dwellers with local governmentsderives from four sources. First, corruption is a major concern. As inother countries, it is associated with land deals, construction projects,bank lending, social security funds, and other activities.31 TransparencyInternational ranked China 70th of 163 countries in 2006, but this typeof index provides only a partial perspective (Transparency Internationalhttp://www.transparency.org/).
Second, there is dissatisfaction with the provision of health services,more so than with education.32 Even for privileged urban residents, healthservices are becoming less accessible and costlier. More and more peoplehave to pay out of pocket for health care and medications, and the shift tocurative care is shortchanging more cost-effective preventive medicine.33
Third, as cities expand into periurban areas, the confiscation and saleof farm land to developers is being strongly condemned, especially bydisplaced farmers, who receive limited compensation and face difficultyfinding employment in the urban labor market. Others view these salesas evidence of corrupt dealings and inept fiscal management, becausecurrent expenditures are being offset by the proceeds from these salesrather than being aligned with revenues appropriately augmented byintergovernmental transfers.
Fourth, the urban safety net for the poor—a mix of the widowed eld-erly, the disabled, laid-off state enterprise workers lacking marketableskills, people working in the informal sector, and migrants—is inadequate(Wu 2004). Di Bao—a means-tested transfer that offers minimal assistanceto urban residents who satisfy the poverty criteria—is a bare-bones schemethat deserves to be augmented or supplemented by additional assistance.Beyond this, there is growing concern regarding unemployment compensa-tion for laid-off workers and the adequacy of pension benefits.34
These are not minor complaints, and they are rising in volume, despitethe efforts of the central government to root out corruption with fre-quent inspection tours by the Communist Party’s Central Commission for
14 China Urbanizes: Consequences, Strategies, and Policies
31 In September 2006 a number of officials from the Shanghai administration, includingthe mayor, were implicated in the misappropriation of US$400 million from themunicipal pension fund (“Anti-Graft Campaign” 2006; “Shanghaied” 2006).
32 Gan and Gong (2007) show how periods of morbidity before the age of 21 significantlyreduce an individual’s education status.
33 Medical expenses account for 11.8 percent of household consumption, more than edu-cation or transport (“China’s Income Gap” 2006).
34 Wu (2005) provides a detailed account of how China has developed the elements of asocial security system (pensions, medical insurance, and unemployment compensation)and reviews current reform options. Other proposale for reforming the pension systemare presented by Dunaway and Arora (2007).
Discipline Inspection, which meted out harsh punishments.Wu (2006) citesan official report indicating that 42,000 public officials were investigatedfor corrupt practices each year between 2002 and 2005 and that action wastaken against 30,000 every year.35 He notes that corruption was largelyresponsible for losses by the banking system equal to 6.25 percent of GDPbetween 1999 and 2001 and fraudulent public expenditures amounting to2.4 percent of GDP. Reforms of the bureaucratic structure and incentives,the health system, local taxation, revenue sharing with the central govern-ment, transfers from the central government to cover the costs of unfundedexpenditure assignments, and social security are all ongoing, but theybarely keep up with the problems. As a result, the clamor about urbangovernance is not subsiding; as China’s urban middle class grows andbecomes more aware, protests could become more widespread.36
Governance issues may be easier to resolve, if partially, in China thanelsewhere, because unlike many other countries, it has a vibrant urban econ-omy that is generating jobs and constantly adding to the pool of resources.China does not face entrenched problems of slums, urban decay, an impov-erished underclass, or low fiscal buoyancy, and so far it has been able toabsorb migrant flows (Flavin and Gardner 2006). China’s cities have per-formed relatively well, and many are governed by able and energetic lead-ers who are eager to improve economic circumstances and living conditions.
Crafting an Urban Development Strategy
Like many other countries, China is seeking a development path that tendsto equalize rural and urban per capita incomes over time.37 This objective,emphasized in the 11th Plan, calls for comparable growth rates acrosssectors (see Yusuf and Nabeshima 2006a). Barring that, rough paritybetween sectors can be maintained only by a decline in the population of
Optimizing Urban Development 15
35 By redoubling its efforts in 2006 and firing four high-level officials, the government hasmade some headway (“China’s Crackdown” 2006).
36 The number of protests rose tenfold between 1993 and 2005, to 87,000 (“In Face ofRural Unrest” 2006; Wu 2006). The spike in protests appeared after 1996, when thereform of state-owned enterprises began to add to the ranks of the urban unemployed.Many of those complaining are former state enterprise employees and displaced farm-ers. Some of these and other protests fall into the category of “rightful resistance,” inwhich protestors frame “their claims with reference to protections implied in ideologiesor conferred by policymakers” (O’Brien and Li 2006: 3).
37 Per capita rural incomes were below the national average in 21 of 31 provincial-levelunits in 2005. Rural per capita incomes were 20 percent below the national average inSichuan and Chongaing and 40 percent below in Gansu and Guizhou (“China: Doesthe Countryside?” 2007).
the slower-growing sector or income transfers from the higher-income sec-tor to the lower-income sector.
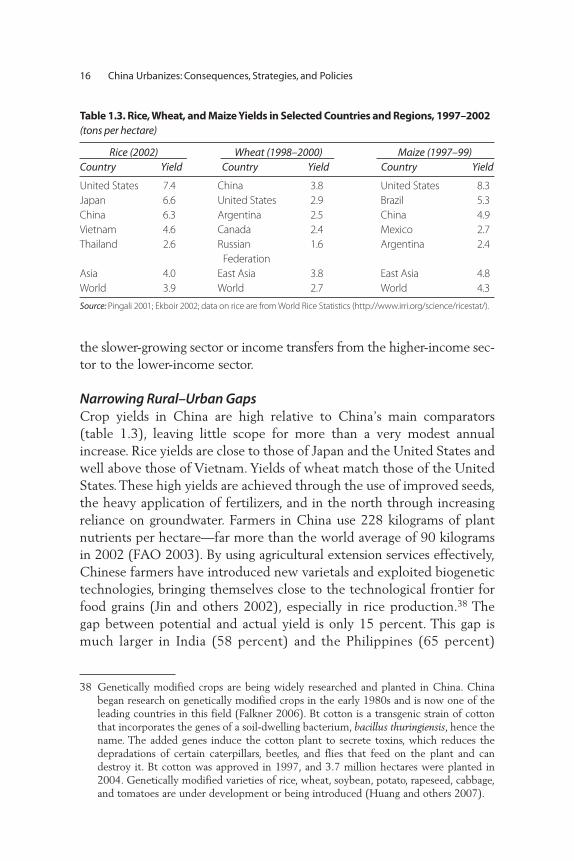
Narrowing Rural–Urban GapsCrop yields in China are high relative to China’s main comparators(table 1.3), leaving little scope for more than a very modest annualincrease. Rice yields are close to those of Japan and the United States andwell above those of Vietnam. Yields of wheat match those of the UnitedStates.These high yields are achieved through the use of improved seeds,the heavy application of fertilizers, and in the north through increasingreliance on groundwater. Farmers in China use 228 kilograms of plantnutrients per hectare—far more than the world average of 90 kilogramsin 2002 (FAO 2003). By using agricultural extension services effectively,Chinese farmers have introduced new varietals and exploited biogenetictechnologies, bringing themselves close to the technological frontier forfood grains (Jin and others 2002), especially in rice production.38 Thegap between potential and actual yield is only 15 percent. This gap ismuch larger in India (58 percent) and the Philippines (65 percent)
16 China Urbanizes: Consequences, Strategies, and Policies
Table 1.3. Rice, Wheat, and Maize Yields in Selected Countries and Regions, 1997–2002
(tons per hectare)
Rice (2002) Wheat (1998–2000) Maize (1997–99)
Country Yield Country Yield Country Yield
United States 7.4 China 3.8 United States 8.3
Japan 6.6 United States 2.9 Brazil 5.3
China 6.3 Argentina 2.5 China 4.9
Vietnam 4.6 Canada 2.4 Mexico 2.7
Thailand 2.6 Russian 1.6 Argentina 2.4
Federation
Asia 4.0 East Asia 3.8 East Asia 4.8
World 3.9 World 2.7 World 4.3
Source: Pingali 2001; Ekboir 2002; data on rice are from World Rice Statistics (http://www.irri.org/science/ricestat/).
38 Genetically modified crops are being widely researched and planted in China. Chinabegan research on genetically modified crops in the early 1980s and is now one of theleading countries in this field (Falkner 2006). Bt cotton is a transgenic strain of cottonthat incorporates the genes of a soil-dwelling bacterium, bacillus thuringiensis, hence thename. The added genes induce the cotton plant to secrete toxins, which reduces thedepradations of certain caterpillars, beetles, and flies that feed on the plant and candestroy it. Bt cotton was approved in 1997, and 3.7 million hectares were planted in2004. Genetically modified varieties of rice, wheat, soybean, potato, rapeseed, cabbage,and tomatoes are under development or being introduced (Huang and others 2007).
(Jin and others 2002). According to Liu and Wang (2005), between1991 and 1999, technological advances were responsible for more thanhalf of growth in agricultural productivity in China.
A continuing shift toward animal husbandry, horticulture, and off-farm activities should gradually raise farm incomes, but substantial gainsthrough a large increase in the prices of major grains, for example, wouldincur heavy fiscal costs, face resistance from urban interests, and be subjectto restrictions by the World Trade Organization (WTO). The possibilityof widening the scale of off-farm activities exists, but TVEs have passedtheir high-water mark, and industry thrives more in urban and periurbanlocations than in rural ones.
Rural development has been the objective of a succession of governmentprograms, including, most notably, the 8–7 program, which spannedmuch of the 1990s.39 Other programs are building infrastructure andattempting to improve the delivery of social services. Recently, thegovernment has taken steps to raise the disposable incomes of agriculturalhouseholds by eliminating the agricultural income tax. Despite thesemeasures, bringing rural incomes closer to the urban average is provingto be an uphill task.
The challenge of narrowing income gaps is similar to that experi-enced in more-advanced countries. In Japan, for example, income dif-ferentials between sectors narrowed only as a result of migration, whichsharply reduced rural populations; generous agricultural price supportprograms; and the increase in off-farm employment opportunities. In2003 per capita incomes in the leading rice-producing prefectures, suchas Niigata and Akita, were close to those in Osaka and 70 percent of percapita income in Tokyo (Japan Statistics Bureau 2005).
A mix of policies will be needed in China, but a significant narrowingwill depend mainly on migration plus remittances. Other policies willalso play roles, however. These include (a) continuing efforts to strengthenagricultural productivity through diversification into higher-value activities;(b) technological advances that raise yields and conserve land, water, andother inputs; (c) investment in rural infrastructure in areas where returnsover the longer term are high; (d) provision of secure, longer-term prop-erty rights over farmland;40 (e) provision of better social services for
Optimizing Urban Development 17
39 The program, announced in 1993, provided subsidized loans, supported public works,and offered budgetary grants (Park, Wang, and Wu 2002).
40 The recently passed property law strengthens ownership rights and allows farmers torenew land leases (“Caught between Right and Left” 2007).
rural households; (f) rural credit schemes; and (g) to the extent feasible,resource transfers via the price mechanism or fiscal channels.
From the perspective of a development strategy that seeks to maintainhigh aggregate growth and bring rural incomes closer to urban levels, amultistranded approach is warranted. In conjunction with pricing poli-cies, efforts to raise agricultural yields, conserve water, promote diversifi-cation, and strengthen the transport and marketing infrastructure canincrease rural incomes and temper the incentives to migrate to cities.Creation of infrastructure should focus on areas with long-term potential,however; other kinds of transfer and income support are better suited forrural communities in which the land is infertile and water scarce.Encouraging people to move out of fragile areas is the most-sensibleapproach from both economic and ecological perspectives.41 Attemptingto improve their livelihoods through costly investments is likely to havea modest payoff and only delay by a few years an exodus from these areas.Regional policies—in Brazil, Italy, and other parts of the EuropeanUnion—have a poor record (Sinn and Westermann 2001).
Directing Migrant Flows and Managing Urban Growth Migration should be to where jobs are going to be; it should supportgrowth in urban regions with the greatest longer-term promise.Directing migrants to high-growth areas would ensure that they areabsorbed by urban labor markets and increase their chances of beingassimilated into urban society. It is when migrants enter slow-growingor stagnating urban economies that problems of unemployment lead tosocial problems and the flaring of tensions between newcomers andlongtime residents.
Geographical location and city size have the greatest effect on whetherurban migration can contribute to a virtuous urban growth spiral. Migratingto a coastal location or a location on a major transport artery was favored inthe past and remains advantageous, even though great advances in surfaceand air transport should have diminished the relative attraction of suchlocations.42 Coastal cities in particular exert an unusually strong pull, whichis linked to the quality of their physical environment and their milder cli-mate. With sea levels set to rise, some coastal cities might be endangered
18 China Urbanizes: Consequences, Strategies, and Policies
41 Current policies are helping shape such a trend: by the end of 2005, 23 million hectaresof low-quality farmland had been converted to woodland or grassland (“Saying ‘No’”2006).
42 See Liu (1993) on the location of Chinese cities.
three and four decades from now, but for the moment, the pull they exertis undiminished.43
The availability of fresh water is emerging as an additional determinantof urban growth and livability, as cities grow very large and becomevoracious consumers of water.44 A location along a waterway can helplessen water-supply constraints, and waterfront development can enhancethe quality of urban life.
The size of cities is also important.45 Economies of scale and agglom-eration increase growth rates as cities expand (see, for example, Yusuf andothers 2003; Rosenthal and Strange 2004). Agglomeration contributes bydeepening labor markets, inducing technological spillovers, and encouraginga wide mix of activities. It enables firms and consumers to more easily accessinputs and services and allows networked clusters of firms to emerge.Agglomeration also supports innovation—sometimes at the intersectionof two or more activities or scientific disciplines—and the diversificationof goods and services (Bettencour, Lobo, and Strumsky 2007; Carlino,Chatterjee, and Hunt 2007). Such diversification is often the principalavenue for increasing sales in national or world markets. In a globalizingeconomy, agglomeration economies are a safety valve permitting urbanindustry to expand in new directions and to maintain both a diversifiedportfolio of outputs and the potential for adding new activities as someexisting ones die out.46
A large urban center also provides an environment in which firmshave an easier time achieving scale economies, because local markets arelarge and enable firms to move down the cost curve before venturing
Optimizing Urban Development 19
43 The likelihood that some coastal areas will be submerged as seawaters rise might call forplanning with regard to the development of coastal cities (“Cities Should Plan” 2005).The experience of the Dutch will become more and more relevant. Among China’smegacities, Shanghai confronts the greatest challenge, because of its limited elevationabove the current sea level and low-lying terrain; subsidence caused by groundwaterdepletion; scouring of coastline by strong currents; the presence of wetlands and flood-prone areas; and susceptibility to typhoons (Sherbinin, Schiller, and Pulsipher 2007).
44 China is home to 22 percent of the world’s population but just 8 percent of globalfresh water supplies (Flavin and Gardner 2006).
45 China has three megacities with populations of more than 10 million: Beijing,Shanghai, and Chongqing. A fourth, Shenzhen, probably falls into this category if thenonresident population is included.
46 Although China’s exports to the United States increasingly overlap with those fromOECD countries, these exports sell at a discount, because their quality and technologicalsophistication are lower (Schott 2006). Hummels and Klenow (2005) and Hausmannand Klinger (2006) suggest that the growth of export revenues depends on diversifica-tion into new products (many in product categories that are close to those of currentexports) and or improvements in quality as incomes rise.
into overseas markets.47 Large cities are more likely to offer environmentsthat are contestable, if not competitive, with low barriers to the entryand exit of firms and greater incentives for firms to be innovative.
Little in the empirical literature suggests that cities are subject todiminishing returns to scale, but poorly planned and managed cities canconfront serious issues of congestion, pollution, and high living expenses,particularly as a result of increasing rents. These problems can alsoaffect medium-size cities. Cross-country experience shows that goodland planning, regulation, and coordination by bureaucracies as well asadministrative subdivisions can enable cities to reap the benefits of sizeand avoid most of the pitfalls. In fact, as survey evidence presented inchapter 8 suggests, that larger Chinese cities tend to be better managedthan smaller cities.
Polycentric spatial development (which prevents the congestion arisingfrom a single downtown focus with the help of zoning regulations andthe use of floor area ratios to vary population densities and create mul-tiple foci) and a well-designed transport system are key to making largecities livable. Also important are land-use policies that conserve landthrough densification and mixed use without sacrificing essential greenspaces and recreational amenities conducive to livability. Legislating rulesis one key step; enforcing them firmly, but when needed, flexibly, isanother. Cities often fail to follow through with policies governing theuse of automobiles. As a result, they end up with severe congestion;urban sprawl, which increases energy consumption; and air and noisepollution.48 The capacity to implement policy is thus a hallmark of thesuccessful metropolitan area.
Large cities can encounter difficulties if they do not mobilize sufficientrevenues to defray current expenditures or fail the test of creditworthiness,which makes it hard for them to raise capital from capital markets forlong-lived investments.This problem is not limited to large cities, althoughthe bigger centers are more likely to be burdened with fiscal expenditures.
In summary, size is a plus. In a more-open and competitive global econ-omy, a large city gains an edge from agglomeration and urbanization
20 China Urbanizes: Consequences, Strategies, and Policies
47 Pannell (1992) reviews the history of Chinese cities through the early postreform period.He finds that large cities were more efficient than smaller ones.
48 Sprawl is a particular problem for secondary cities in China. Because of the lack ofinfrastructure financing, new urban development tends to take place along existinghighways or trunk roads, without much planning. This contributes to sprawl andincreases commute time, congestion, the cost of providing energy, water, and sanita-tion infrastructure, and pollution.
economies that impart industrial flexibility. Major urban centers also enjoythe advantages of global transport connections and are more likely to behooked into the international business networks for manufacturing, pro-ducer services, and research. These international links are sources of trade,capital, and ideas, the oxygen that gives life to urban dynamism.
Financing Urban Development Urban development is not possible on the cheap. Huge volumes of fundshave to be raised and committed to projects that can take many years tocome to fruition and the effective life of which can span decades oreven centuries.
Cities faced with the prospects of substantial in-migration canbecome caught in low-level traps if they fail to pour capital into suchinvestments in a fairly short period of time. A “big-push” investmentstrategy has obvious merits for putting in place axial transport, housing,commercial, energy and water, and sewerage infrastructures.
Building ahead of demand makes sense, so that industry is not hamstrungby capacity constraints and urban physical plant can accommodate theinflux of people without congestion and the creation of slums. An exampleis New York City, which was designed for 1 million residents when thepopulation was barely 100,000. Central Park was created 150 years ago, andthe subway system was built 100 years ago, well ahead of demand (“TheNew New York” 2006).49 Planning for long-term growth smoothed theexpansion of Tokyo in the postwar period.50
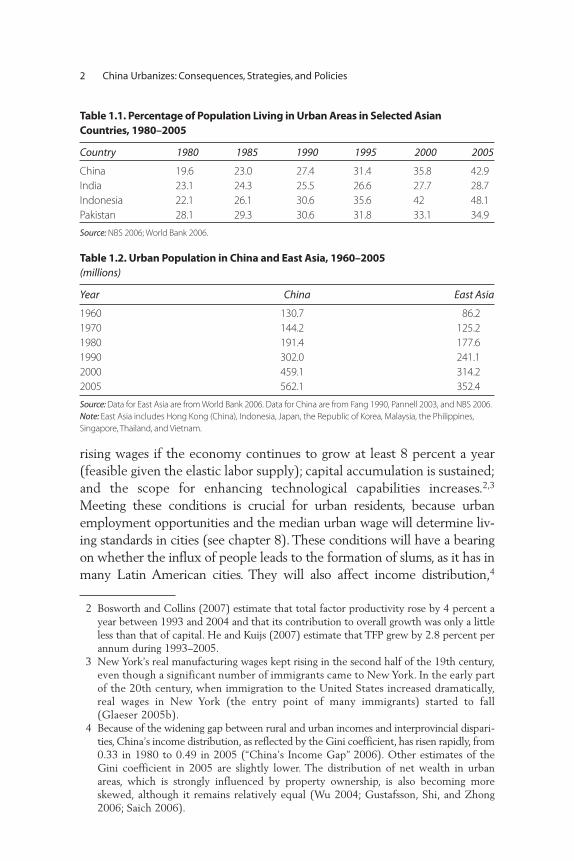
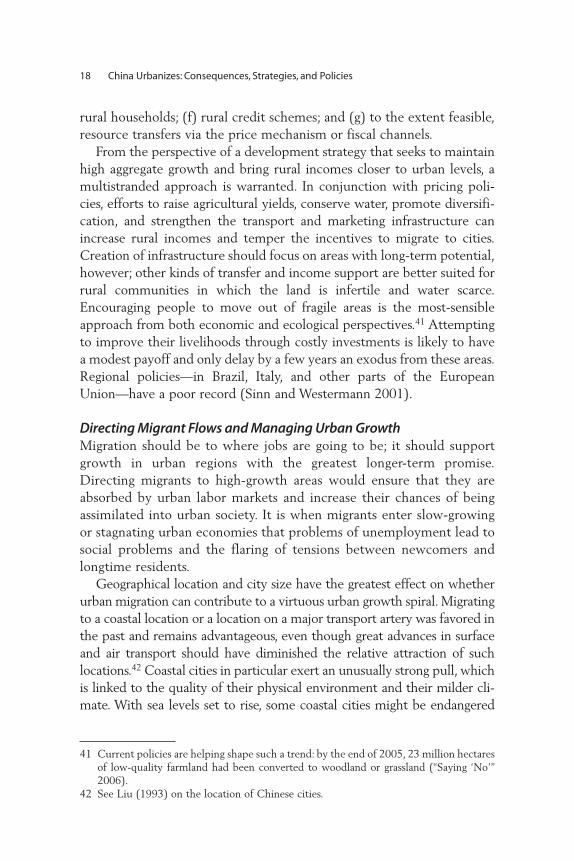
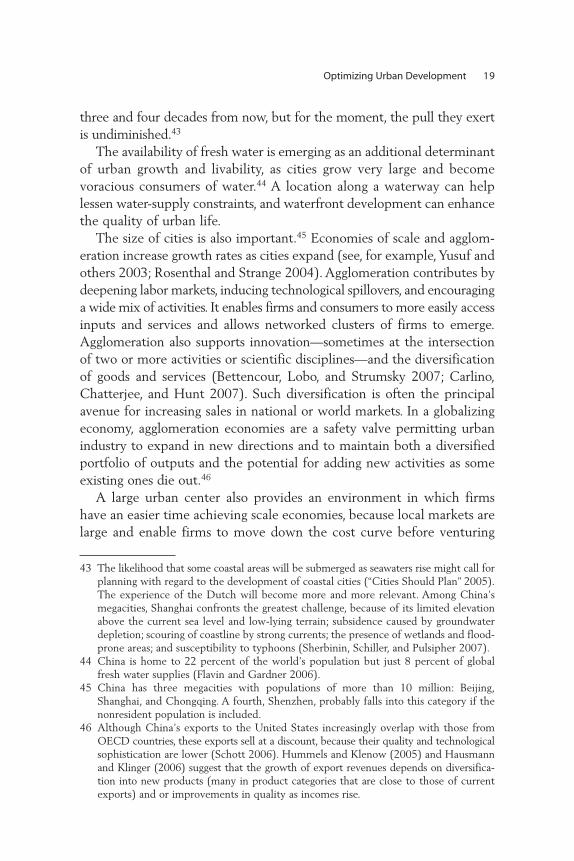
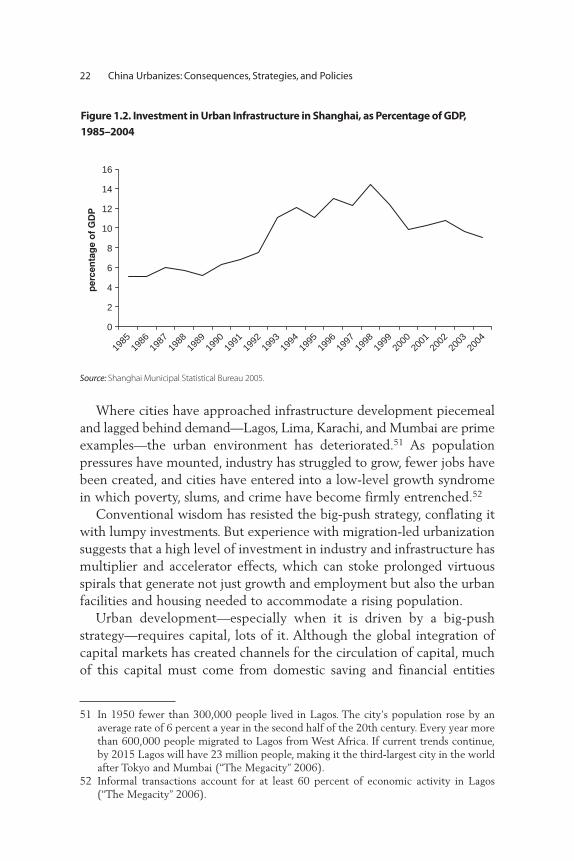
Several Chinese cities have followed this route. Throughout the1980s, Shanghai spent 5–8 percent of its GDP on urban infrastructureinvestment. In the 1990s it spent 11–14 percent of GDP, in a big pushto redevelop the city, including developing Pudong (figure 1.2); thiseffort is now winding down. Both Beijing and Tianjin spend more than10 percent of their GDP on urban infrastructure (Yusuf andNabeshima 2006b). To cope with the rising demand for electricity andto eliminate brownouts, China commissioned 80 gigawatts of generat-ing capacity in 2006 and will put an estimated 75 gigawatts on line in2007 (“What Shortage?” 2006).
Optimizing Urban Development 21
49 Omnibus services began in the 1820s (Glaeser 2005b).50 Until the 1960s, fewer than 100,000 housing units were constructed in Tokyo.
Beginning in the 1970s, in line with the rapid increase of population in Tokyo, the con-struction of new housing units accelerated dramatically, reaching more than 900,000units by 1990.
Where cities have approached infrastructure development piecemealand lagged behind demand—Lagos, Lima, Karachi, and Mumbai are primeexamples—the urban environment has deteriorated.51 As populationpressures have mounted, industry has struggled to grow, fewer jobs havebeen created, and cities have entered into a low-level growth syndromein which poverty, slums, and crime have become firmly entrenched.52
Conventional wisdom has resisted the big-push strategy, conflating itwith lumpy investments. But experience with migration-led urbanizationsuggests that a high level of investment in industry and infrastructure hasmultiplier and accelerator effects, which can stoke prolonged virtuousspirals that generate not just growth and employment but also the urbanfacilities and housing needed to accommodate a rising population.
Urban development—especially when it is driven by a big-pushstrategy—requires capital, lots of it. Although the global integration ofcapital markets has created channels for the circulation of capital, muchof this capital must come from domestic saving and financial entities
22 China Urbanizes: Consequences, Strategies, and Policies
0
2
4
6
8
10
12
14
16
1985
1986
1987
1988
1989
1990
1991
1992
1993
1994
1995
1996
1997
1998
1999
2000
2001
2002
2003
2004
per
cen
tag
e o
f G
DP
Source: Shanghai Municipal Statistical Bureau 2005.
Figure 1.2. Investment in Urban Infrastructure in Shanghai, as Percentage of GDP,
1985–2004
51 In 1950 fewer than 300,000 people lived in Lagos. The city’s population rose by anaverage rate of 6 percent a year in the second half of the 20th century. Every year morethan 600,000 people migrated to Lagos from West Africa. If current trends continue,by 2015 Lagos will have 23 million people, making it the third-largest city in the worldafter Tokyo and Mumbai (“The Megacity” 2006).
52 Informal transactions account for at least 60 percent of economic activity in Lagos(“The Megacity” 2006).
(Feldstein and Horioka 1980; Feldstein 2005). Rapid urban developmentthat can keep pace with large intersectoral transfers of workers demandsrising domestic savings and mechanisms for investing the resources. To becreditworthy enough to gain access to these resources, cities must be wellmanaged financially. Financial deepening can facilitate the process, but ittakes time to build institutions; train people; and create sophisticatedinstruments, risk-assessment skills, rating and monitoring agencies, andregulatory capabilities (Yusuf 2007). Late-starting countries that mustcope with urbanization rates of 3–5 percent a year or more have to relyon banks initially, but they need to move quickly to establish mortgage andbond markets; institutions for both securitizing instruments such as mort-gages and regulating the intermediates involved; and avenues for the sec-ondary trading of securities.53
Local-currency bond markets make it possible to diversify lendingaway from banks and to match long-term assets with debt of equivalentmaturity. They generate yields for a range of maturities and permit thehedging of exposures. Well-functioning bond markets not only lowerborrowing costs, they also impart greater stability to financial markets.54
If urbanization is to avoid the many pitfalls that lie in wait, it needs tobe supported by resource mobilization and fiscal transfers commensuratewith the desired rate of development. When cities are not “bankable”—that is, when resource mobilization is weak or insufficient capital findsits way into urban projects because public and private channels are inad-equate or transaction costs are too high—urbanization cannot bematched by the requisite urban development.The lack of financial depthand sophistication has not initially proven to be the binding constraint.It is the feeble supply of domestic capital for the urban sector (becausethe instruments, skills, and channels have not been created) and ineptmunicipal financial management that are frequently associated withweak economic growth.
Optimizing Urban Development 23
53 By the end of 2005, China’s mortgage market, which started in 1998, had grown toUS$227 billion (Y 1,777 billion), larger than the market in the Republic of Korea(US$200 billon). China’s market represents just 10 percent of GDP, however, whilethe market in the Republic of Korea represents 27 percent of that country’s GDP(“Mortgage Industry” 2006).
54 By abolishing a quota that limited the annual issuance of corporate bonds to Y 100 billion(US$13.2 billion), the Chinese authorities have encouraged listed companies to raisefunds by issuing bonds and to use the funds to pay off higher-interest bank debts. Doingso is particularly appealing to companies engaged in urban real estate, infrastructure,and urban development (“Chinese Companies” 2007).
Providing Urban Social ServicesIn addition to physical infrastructure, people require social services.Vulnerable people need a safety net to avoid sliding into poverty as theyage, become unemployed, or are affected by accidents or loss of property.55
From social as well as private perspectives, the most needed services andthe ones with the highest returns are health care and education. Theseservices build human capital, contribute to individual well-being, providea measure of insurance against poverty, and produce positive externalities(see chapters 2 and 3; Yusuf, Nabeshima, and Ha 2007a, 2007b).
Adequate access to health and education services for the entireurban population should be a central objective of urban development.It is an objective that is often not given the priority it deserves. Theshortfall is most serious during the critical stage when urban popula-tions are exploding. By making inadequate provisions for services, citiesfail to augment a resource that over the longer term is vital for growth,industrial diversification, and the quality of the business climate. Byfocusing on physical infrastructure, governments at both the nationaland subnational levels defer essential and complementary investmentsin human capital, which builds manufacturing and technological capa-bilities. Investing in human capital is also the best insurance againstunemployment and urban crime. Rather than waiting until shortagesbecome glaringly apparent—by which time it is often too late to mobi-lize sufficient resources—cities should view services as intrinsic to theirbig-push urban development strategies.
Health and education services also permit the gradual phasing in of anold-age safety net and unemployment insurance schemes. These schemesare expensive. They need to be backstopped by supporting institutionsand to evolve together with the financial sector.
Limiting Increases in Urban Energy ConsumptionThe lifeblood of the urban economy is energy (see chapter 6). Urbantransport, industry, and households dominate energy consumption inall middle- and high-income countries. Energy use fuels growth andenhances livability, but it is also the principal source of air pollutionand carbon emissions. For the foreseeable future, urban developmentwill remain dependent on ample supplies of energy, with transportdepending on petroleum and households relying mainly on electricity
24 China Urbanizes: Consequences, Strategies, and Policies
55 On the problems posed by shocks for individual households and the options for insuringagainst them, see Baeza and Packard (2006).
and gas. Barring an incident that leads to an interruption of supplies,there is no imminent shortage of petroleum in the near term.
The warning signs of tightening petroleum supplies are everywhere,however. The more-accessible major sources of petroleum are beingrapidly exploited, and even if new reserves are found offshore, productioncosts will be much higher, because the extraction must be from greatdepths. Thus, if economic growth rates worldwide remain healthy, therelative prices of energy could increase significantly.
Given the likely increase in energy prices and the deleterious effect ofthe consumption of fossil fuels on the environment, reducing the energycoefficient of urban development is essential. Especially for countries at arelatively early stage of urbanization, with a great deal of long-lived invest-ment in urban infrastructure and buildings ahead, measures that can cutenergy use and energy losses have a high payback. Among the measureswith the greatest consequences, the design of urban transport is the mostsignificant, because it determines the physical characteristics of the city56—how much it sprawls and encroaches into the surrounding agriculturalland—and the reliance on automobiles for intra- and intercity travel.Appropriate incentives can lead to the efficient utilization of public transitin large cities, which are much more energy efficient than other locales.57
Enforcing strict standards and codes are two additional measures thatcan limit the increase in electricity consumption for air conditioning andappliances, even as urban populations and urban incomes continue theirupward march. Another approach would be to install “smart” meters,which can assess variable charges based on the time of day to encourageenergy conservation, especially at peak load times (“Going Metric” 2006).Encouraging the adoption of “green” technologies and eco-friendly designscan also reduce energy use (see Yusuf and Nabeshima 2006a and thenumerous practical suggestions in Steffen 2006).58
An efficient energy-conserving big-push strategy that is also eco-friendly needs to incorporate the construction industry. The quality
Optimizing Urban Development 25
56 The spatial characteristics of a city, the occupational activities there, and the degree towhich people depend on cars for mobility profoundly influence the incidence of chronicdiseases associated with obesity, such as diabetes and cardiovascular disease, accordingto Frumkin, Frank, and Jackson (2004) and Monda and others (2006).
57 Phang (2000) describes Singapore’s techniques for controlling the ownership and useof cars.
58 In projecting the energy intensity of China’s economy, Wei and others (2006) find thatincomes are the principal source of rising utilization and technological change the mainmitigating factor.
and design of construction and the incorporation of new energy- andmaterials-conserving technologies will determine how much energy issaved, directly and indirectly (Fernandez 2007). The design, construc-tion, and maintenance of infrastructure also influence energy use bythe transport, water, and sanitation sectors. Among all of the industriescontributing to urban development and local multiplier effects, construc-tion is far and away the most important. Enhancing the productivity andtechnological capabilities of this industry should be a critical part of anyurban development strategy.
Dealing with the Scarcity of Water Full recognition of the trend in water scarcity is long overdue. For somecities, a crisis looms not too far in the future. Many others are likely toconfront severe shortages within a few decades. For late urbanizers, thereis a clear opportunity to design the water supply, wastewater collection,and sanitation systems so that they maximize the potential for recyclingwater, supplying water of different grades for different purposes, andminimizing the loss of water from leaking pipes.
As with energy, standards for appliances and sanitary systems can alsoreduce the amount of water and restrict the use of drinking-qualitywater for some purposes only. Standards for the purity of water releasedby commercial and industrial establishments can increase recycling andminimize pollution of water courses and aquifers.
Regulation, physical design, and technology are three strands of anurban water strategy. Pricing is a fourth. It complements the others andis critical to the success of any longer-term strategy to ensure that anurbanizing world will not run short of water.
Managing UrbanizationUrbanization, development, and a rising quality of life are difficult tocombine without sound planning and regulation and the implementationof a host of policies. Small cities and large ones must be well managed forbenefits to be fully realized and diseconomies kept in check. Achievinggood management—and governance—is subject to many factors. Theseinclude the autonomy to conduct policy and raise revenue; the quality oflocal leadership; and planning and administrative capacities. They alsoinclude the availability of policy instruments; the existence of institutionsfor mediating and implementing policies (such as private–public part-nerships and the legal system); and the efficacy of interjurisdictionalcoordination, where this counts. But urban development is arguablymost affected by the design and efficiency of regulations that incentivize
26 China Urbanizes: Consequences, Strategies, and Policies
industry; by land-use and transport policies; by fiscal management andhow it is reflected in credit ratings, as well as the provision of publicservices; and by environmental policies that intersect with and reinforcethose impinging on land use and urban transport (see chapter 8 on thedynamics of decision making at the local level).
From Strategy to Policy
Given the pace of urbanization and the numbers of people involved,the decision makers responsible for guiding China’s urban developmenthave their hands full. Fortunately, they are better placed than theircounterparts in other countries to achieve successful urban develop-ment, for several reasons:
• China is generating the resources to finance an urban big-push andto date has been able to channel these resources into urban indus-try and infrastructure, through the fiscal system, the banks, and newfinancial instruments.
• Because China is a relatively late starter and much building and renewalof urban physical capital lies in the future, there is unparalleled scopefor designing efficient and livable cities.
• Chinese municipalities have the autonomy and the authority to introduceand implement regulations governing land use, the transport system,and the urban environment.
• The hukou system enables municipalities to exercise some controlover the flow of permanent migrants. Industrial growth virtuallythroughout China is such that manufacturing, construction, and serv-ices are largely able to absorb inflows of migrants.
• Although many Chinese cities must cope with a backlog of air andwater pollution, the slums and endemic poverty that have taken rootin other countries are largely absent from Chinese cities thus far.
• As a late starter, China can draw on the experience of other countrieswith respect to urban design, the effects of private vehicle use, andpollution.At the same time, it can exploit advances in a host of technolo-gies that will conserve energy and water and curtail harmful emissions.
This is not to say that urban development will be trouble free. ForChina, however, the enormous intersectoral transfer of people can be aless-daunting process than it was and is for other countries.
The chapters in this volume delineate a number of policies that canpromote rapid urban development within a framework of a national
Optimizing Urban Development 27
strategy that seeks to achieve a balanced increase in incomes. From therange of policies presented, seven stand out.
Increase Human CapitalIn both urban and rural sectors, education and health care policies thatincrease human capital can stimulate growth of agricultural and industrialactivities and reduce the risks of unemployment (Glaeser and Saiz 2003;Berry and Glaeser 2005; Glaeser 2005a; Glaeser and Berry 2006). Greateraccess to these services can raise the incomes of rural households, whichfacilitates migration. Making these services available to urban migrantsdeepens the resource base in cities, promotes equity, and helps combatpoverty. From the standpoint of both growth and welfare, health policiesshould focus on preventive and primary care, and education policiesshould seek to enhance the quality and raise the level of education.
Manage the Flow of MigrationAlthough the hukou system should be dismantled over the longer run, itremains a useful tool for directing and managing the flow of migrants. Itshould be used to achieve two objectives. One is to try to contain thenumber of migrants individual cities absorb as permanent residents. Tothe extent that the hukou system can achieve this, migration can matchthe supply of affordable housing, infrastructure, social services and jobsin cities. A second is to try to direct migrant flows from areas with decliningagricultural potential and water shortages to urban areas with bettergrowth possibilities, in order to realize economies of agglomeration andscale.59 This matching needs to be combined with the planning anddesign of megacities in a way that achieves compactness and polycen-tricity. The coastal cities in the Yangtze delta and the south are likely tocontinue to attract migrants. These cities may need to extend urbanhukou privileges to some of these migrants and to invest in infrastructureand services to accommodate them.
Deepen Financial MarketsTo finance urban development, China needs financial markets that allocateresources more efficiently. It also needs a wider range of instruments, inorder to meet the needs of different kinds of borrowers and offer the spreadof maturities required by investors. The reliance on banks for financing and
28 China Urbanizes: Consequences, Strategies, and Policies
59 China’s WTO membership is likely to negatively affect wheat- and corn-growing farmersin the northeast, as noted in chapter 2.
the use of urban development investment corporations (UDICs) (createdby municipal authorities as semiautonomous vehicles that borrow fromthe banks) have advantages but also some risks (Su and Zhao 2007).Municipalities can limit their fiscal commitments to urban developmentand instead tap the banks. But the UDIC–banking nexus increases banks’exposure on long-lived investments through organizational channels thatmight create problems in the future.60 Changing the legal, tax, and account-ing rules to permit the emergence of secondary bond and mortgage marketswould be a step forward. Other measures include adoption of rules thatencourage securitization of mortgages; strengthening of mortgage insur-ance; issuance of general financial bonds; and trading, including forwardtransactions, in the interbank bond market. Financial innovations and insti-tutional developments, including refinancing arrangements and loanguarantees, would also facilitate urbanization.
Improve Cities’ Fiscal EffortsMany Chinese cities have been balancing their books by selling or leasingland or charging off-budget fees. The income from such transactionsaccounts for almost 25 percent of municipal revenues. Sooner or later,this process will come to an end. Urban governments need to create adurable fiscal system that can meet future and current capital needs,taking account of the anticipated growth rates of urban economies andpopulations. Doing so entails revenue-sharing and transfer agreementswith the central authorities and an elastic base for local revenues witha few robust tax instruments to satisfy local needs. It also calls for a firmagreement with the central government on expenditure assignmentsthat are equitable and sustainable given the anticipated flows of revenuefrom all sources.61
Contain Energy CostsEnsuring that urban development is not constrained by rising energycosts will depend on four factors. Arguably the most important are pricingpolicies (especially of power) that accurately communicate informationon relative scarcities and induce efficient utilization (see chapter 6).
Optimizing Urban Development 29
60 Chinese banks have a history of loan portfolio problems. Although reforms havereduced the scale of the problem, weak risk-assessment skills and poor governanceremain sources of vulnerability (Podpiera 2006).
61 See, for instance, World Bank (2003a, 2003b); Dabla-Norris (2005); and Su and Zhao(2007).
A second factor is how China proceeds with its motorization strategywithin the context of urbanization.62 One part of this strategy relates to theincentives for the automobile industry to produce fuel-efficient cars and toredouble efforts to innovate. Another part has to do with demand for cars,which will be a function of policies on taxes on cars, gasoline, licensing andregistration fees, and road user charges; car financing; research and develop-ment; urban land use; investment in road building; and public transport.Currently, many Chinese cities are subject to so-called “ribbon develop-ment” alongside major highways and floor area ratios are still quite low.Thistype of development saves developers and local governments from invest-ing in secondary feeder and access roads, but it leads to much greater sprawland raises the energy- and infrastructure-related costs of urbanization.
A third factor is advances in home-grown technology and technologytransfer from abroad. The degree to which policy accelerates theseadvances will influence the efficiency with which fossil fuels are utilizedas well as the diversification into renewable sources.63
A fourth factor is the raft of regulatory policies, including environ-mental and land use policies and policies defining building codes andstandards for consumer appliances. In conjunction with the perfecting ofmechanisms for enforcement, these policies will play a significant part indetermining energy demand.
Manage Water ResourcesPricing, regulatory, technology, sewage treatment, and wastewater recy-cling policies will also be decisive with respect to the utilization ofwater.64 Given the distribution of water, its low per capita availability,
30 China Urbanizes: Consequences, Strategies, and Policies
62 Between 1991 and 2005, the number of cars per 1,000 people in China rose from lessthan 2 to 10.
63 Considerable progress is being made in developing clean-coal technologies that Chinacould tap. These include supercritical boilers (which heat steam to 600ºC beyond the critical boiling point and therefore need 17 percent less coal than conventional coal-firedplants); integrated gasification combined cycles (which convert coal to gas); and techniquesfor capturing carbon (“Big Effort” 2006).An earmarked tax on electricity consumption nowfinances the development of renewable energy. The government is also investing innuclear power and ethanol. China has 9 operating nuclear reactors supplying electricity,2 more under construction, and another 20 planned (Flavin and Gardner 2006; Hunt andSawin 2006; “Saying ‘No’” 2006). Currently, among renewable sources of energy, onlyonshore wind turbines in certain locations are generally profitable. Solar energy, offshorewind turbines, and tidal power are still relatively costly (“On the Verge” 2006).
64 A little more than half of urban sewage is currently treated before being discharged intowater bodies, which party accounts for the low quality of the lake and river water(“Saying ‘No’” 2006).
and its deteriorating quality, the problem of water availability needs tobe tackled immediately. As noted in this chapter and in chapter 7, thegeography of future urbanization and the degree to which it is concen-trated in the relatively water-abundant parts of the country could playan important role in providing a solution to the problem.
A massive transfer of water could be a costly solution, on a number ofcounts. The distribution of water resources, the implications of impendingclimate change on future supplies, and policies affecting the productionof grain in the northeast should all be factored into the urbanizationstrategy. Ongoing climate change makes it desirable to take account ofwater availability across the country when making long-term plans forurban development.
Reduce PollutionPolicies on the conservation and consumption of water and energyresources will affect environmental pollution, which is a drag on GDPgrowth and degrades the quality of life. There are various estimates ofthe costs of indoor and outdoor pollution to the economy, ranging from3 to 6 percent of GDP. A redoubling of efforts by the government andindustry would appear to be desirable (“Green GDP” 2007; Ho andNielsen 2007; “China’s Green Accounting” 2007).
Concluding Observations
This chapter raises but a few of the issues and policies that will guideurbanization and urban development in China, but they are likely to beamong the most crucial. More than half of China’s population lives inrural areas; decades of urbanization lie ahead. Almost three-quarters ofBrazil’s population live in urban areas, and an even higher percentage ofthe population of the United States is urban (World Bank 2006).Possibly by the middle of this century, China could be approaching theselevels of urbanization. Between now and then, decisions will be madethat will affect the geographical distribution of the population and thebuilding of the urban, transport, and water supply infrastructure tohouse and support urban inhabitants. Enormous amounts of capital willbe committed if the big-push approach is continued.
With so much at stake, it is essential that decisions be closer to the opti-mal in the long-term sense. Markets alone cannot achieve the outcomesdesired, but efficient financial, energy, and water markets, for example,can help achieve good outcomes. Taking the institutional and policy
Optimizing Urban Development 31
steps to make markets work more efficiently should be a priority.Successful markets will need to be backed by good government planningand policies based on careful analysis, using the best information avail-able. Factoring in the systems of urban design and construction, as wellas innovation, could increase the likelihood that urban developmentachieves multiple objectives. The approaches to urbanization, urban/design and urban innovation systems will play major roles, especiallywhen it comes to making longer-term decisions about the distribution ofpeople geographically and across cities of different sizes.
The Chinese authorities have some instruments with which to influ-ence both of these outcomes, namely, the hukou system and the govern-ment’s role in allocating investment. These instruments are two among anumber of factors that determine the flows of people and capital. Thedesign of policies and the application of these instruments depend oncomplex negotiations by several levels of government as well as otherplayers, such as the banks. Such interactions among the various stakehold-ers are useful, because many points of view and a broad range of informa-tion can be factored in; the process also diminishes the risk of egregiousmistakes. By the same token, the negotiated approach increases thedegree of policy slippage and delays in implementation. Policy slippagesand the likelihood of delays are unavoidable, but urbanization will notwait. China must move forward with policies to contain the costs of rapidgrowth, narrow the gap between rural and urban incomes, raise the qual-ity life, and minimize negative externalities. To do so, urbanization andurban development should remain at the top of policy makers’ agendasuntil the pressing issues are resolved.
The potential gains to China from urbanization are substantial. So,too, are the costs. Striking the right balance between the two will bethe greatest challenge for Chinese policy makers over the next quartercentury and more.
References
“Anti-Graft Campaign Intensifies.” 2006. Business Asia, October 30.
Baeza, Cristian C., and Truman G. Packard. 2006. Beyond Survival. Stanford, CA:Stanford University Press.
Bairoch, Paul. 1991. Cities and Economic Development: from the Dawn of History tothe Present. Chicago: University of Chicago Press.
32 China Urbanizes: Consequences, Strategies, and Policies
Baochang, Gu, Wang Feng, Guo Zhigang, and Zhang Erli. 2007. “China’s Localand National Fertility Policies at the End of the Twentieth Century.”Population and Development Review 33 (1): 129–47.
“Beneath Booming Cities, China’s Future Is Drying Up.” 2007. New York Times,September 28.
Bernstein,Thomas P. 1977. Up to the Mountains and down to the Villages: The Transferof Youth from Urban to Rural China. New Haven, CT: Yale University Press.
Berry, Christopher, and Edward Glaeser. 2005. “The Divergence of HumanCapital Levels Across Cities.” NBER Working Paper 11617, National Bureauof Economic Research, Cambridge, MA.
Bettencourt, Luis, M. A., Jose Lobo, and Deborah Strumsky. 2007. “Interventionin the City: Increasing Returns to Patenting as a Scaling Function ofMetropolitan Size.” Research Policy 36: 107–120.
“Big Effort to Scrub Up a Dirty Image.” 2006. Financial Times, October 20.
Bloom, David E., and Jeffrey G. Williamson. 1997. “Demographic Transitions andEconomic Miracles in Emerging Asia.” NBER Working Paper 6268, NationalBureau of Economic Research, Cambridge, MA.
Bosworth, Barry P., and Susan M. Collins. 2007. “Accounting for Growth:Comparing China and India.” NBER Working Paper 12943, National Bureauof Economic Research, Cambridge, MA.
Carlino, Gerald A., Satyajit Chatterjee, and Robert M. Hunt. 2007. “UrbanDensity and the Rate of Innovation.” Journal of Urban Economics 61:389–419.
“Caught between Right and Left, Town and Country.” 2007. Economist, March 8.
CBO (Congressional Budget Office). 2006. China’s Growing Demand for Oil andIts Impact on U.S. Petroleum Markets. Washington, DC.
Chen, B., and G. Q. Chen. 2007a. “Resource Analysis of the Chinese Society1980–2002 Based on Energy. Part 2: Renewable Energy Sources and Forest.”Energy Policy 35 (4): 2051–64.
Chen, G. Q., and B. Chen. 2007b. “Resource Analysis of the Chinese Society1980–2002 Based on Energy. Part 1: Fossil Fuels and Energy Minerals.” EnergyPolicy 35 (4): 2038–50.
Cheng, Margaret Harris. 2006. “China’s Cities Get a Little Healthier.” Lancet368 (9550): 1859–60.
“China: Does the Countryside Hold the Seeds of Crisis?” 2007. Oxford Analytica,Global Strategic Analysis, May 30.
“China’s Crackdown on Corruption Still Largely Secret.” 2006. Washington Post,December 31.
Optimizing Urban Development 33
“China’s Green Accounting System on Shaky Ground.” 2007. Nature 448:518–19. August 2.
“China’s Income Gap Grows despite Pledges.” 2006. Financial Times, December 27.
“Chinese Companies Rush to Issue Bonds under Relaxed Regulations.” 2007.Financial Times, August 18.
“Cities Should Plan Now for Effects of Global Warming on Infrastructure.”February 25, 2005. http://www.newsdesk.umd.edu.
Dabla-Norris, Era. 2005. “Issues in Intergovernmental Fiscal Relations inChina.” IMF Working Paper WP/05/30, International Monetary Fund,Washington, DC.
“Delta Dreams.” 2006. Business China, April 24.
Demurger, Sylvie, Jeffrey D. Sachs, Wing Thye Woo, Shuming Bao, Gene Chang,and Andrew Mellinger. 2002. “Geography, Economic Policy, and RegionalDevelopment in China.” Asian Economic Papers 1 (1): 146–97.
Dunaway, Steven, and Vivek Arora. 2007. “Pension Reform in China:The Need fora New Approach.” IMF Working Paper WP/07/109. IMF, Washington, DC.
Ebrey, Patricia. 1996. China. Cambridge, U.K.: Cambridge University Press.
Ekboir, J. ed. 2002. CIMMYT 2000–2001 World Wheat Overview and Outlook:Developing No-Till Packages for Small-Scale Farmers. International Maize andWheat Improvement Center (CIMMYT), Mexico City.
Evans, Richard, and Sinclair K. Knight. 2007. “Groundwater Resource ManagementChallenges in North China.” National Academy of Sciences. Arthur M. SacklerColloquia, Washington, DC.
Falkner, Robert. 2006. “International Sources of Environmental Policy Change inChina: The Case of Genetically Modified Food.” Pacific Review 19 (4): 473–94.
Fan, C. Cindy. 1997. “Uneven Development and Beyond: Regional Developmenttheory in Post-Mao China.” International Journal of Urban and RegionalResearch 21 (4): 620–39.
–––––. 2005. “Modeling Interprovincial Migration in China.” Eurasian Geographyand Economics 46 (3): 165–84.
Fang, Shan. 1990.“Urbanization in Mainland China.” Issues & Studies 26 (2): 118–33.
FAO (Food and Agricultural Organization). 2003. Selected Indicators of Food andAgriculture Development in Asia-Pacific Region: 1992–2002. Regional Officefor Asia and the Pacific, Bangkok.
Feldstein, Martin. 2005.“Monetary Policy in a Changing International Environment:The Role of Global Capital Flows.” NBER Working Paper 11856, NationalBureau of Economic Research, Cambridge, MA.
Feldstein, Martin, and Charles Horioka. 1980. “Domestic Saving and InternationalCapital Flows.” Economic Journal 90 (358): 314–29.
34 China Urbanizes: Consequences, Strategies, and Policies
Fernandez, John E. 2007. “Materials for Aesthetic, Energy-Efficient, and Self-Diagnostic Buildings.” Science 315 (5820): 1807–10.
Flavin, Christopher, and Gary Gardner. 2006. “China, India, and the New WorldOrder.” In State of the World 2006, ed. Worldwatch Institute. New York:W. W. Norton.
“Free Flow: Big Challenge for Beijing: Moving Coal.” 2005. International HeraldTribune, August 18.
Friedman, John. 2005. China’s Urban Transition. Minneapolis: University ofMinnesota Press.
Frumkin, Howard, Lawrence Frank, and Richard Joseph Jackson, 2004. UrbanSprawl and Public Health: Designing, Planning, and Building for HealthyCommunities. Washington, DC: Island Press.
Gan, Li, and Guan Gong. 2007. “Estimating Interdependence between Healthand Education in a Dynamic Model.” NBER Working Paper 12830, NationalBureau of Economic Research, Cambridge, MA.
Gardner, John. 1971. “Educated Youth and Urban-Rural Inequalities, 1958–66.” InThe City in Communist China, ed. John W. Lewis. Stanford, CA: StanfordUniversity Press.
Glaeser, Edward L. 2005a. “Reinventing Boston: 1640–2003.” Journal of EconomicGeography 5 (2): 119–153.
———. 2005b. “Urban Colossus: Why Is New York America’s Largest City?”NBER Working Paper 11398, National Bureau of Economic Research,Cambridge, MA.
Glaeser, Edward L., and Christopher Berry. 2006. “Why Are Smarter PlacesGetting Smarter?” Policy Briefs PB-2006-2, Department of Economics,Harvard University, Cambridge, MA.
Glaeser, Edward L., and Albert Saiz. 2003. “The Rise of the Skilled City.”NBER Working Paper 10191, National Bureau of Economic Research,Cambridge, MA.
“Going Metric” 2006. Economist, December 13.
“Green GDP Will Be Expanded to Entire Mainland.” 2007. China Daily,January 18.
Gustafsson, Bjorn, Li Shi, and Wei Zhong. 2006. “The Distribution of Wealth inUrban China and in China as a Whole in 1995.” Review of Income and Wealth52 (2): 173–88.
Hausmann, Ricardo, and Bailey Klinger. 2006. “Structural Transformation andPatterns of Comparative Advantage in the Product Space.” Center forInternational Development, Harvard University, Cambridge, MA.
“The Health of a Nation.” 2007. Economist, February 26.
Optimizing Urban Development 35
He, Jianwu, and Louis Kuijs. 2007. “Rebalancing China’s Economy—Modeling aPolicy Package.” Beijing PRC. World Bank China Research Paper No. 7.
Hesketh, Therese, Li Lu, and Zhu Wei Xing. 2005. “The Effect of China’sOne-Child Family Policy after 25 Years.” New England Journal of Medicine353 (11): 1171–76.
Ho, Mun S., and Chris Nielsen. 2007. Clearing the Air: the Health and EconomicDamages of Air Pollution in China. Cambridge, Mass.: MIT Press.
Ho, Ping-ti. 1975. The Cradle of the East. Hong Kong (China): Chinese Universityof Hong Kong Press.
Huang, Jikun, Ruifa Hu, Scott Rozelle, and Carl Pray. 2007. “China: EmergingPublic Sector Model for GM Crop Development.” In Gene Revolution: GMCrops and Unequal Development, ed. Sakiko Fukuda-Parr. London: Earthscan,130–55.
Hummels, David, and Peter J. Klenow. 2005. “The Variety and Quality of aNation’s Exports.” American Economic Review 95 (3): 704–23.
Hunt, Suzanne C., and Janet L. Sawin, with Peter Stair. 2006. “CultivatingRenewable Alternative to Oil.” In State of the World 2006, ed. WorldwatchInstitute. New York: W. W. Norton.
“In Face of Rural Unrest, China Rolls Out Reforms” 2006. Washington Post,January 28.
Japan Statistics Bureau. 2005. Japan Statistical Yearbook 2005. Ministry of InternalAffairs and Communications, Tokyo.
Jiang, Leiwen. 2006. “Living Conditions of the Floating Population in UrbanChina.” Housing Studies 21 (5): 719–44.
Jin, Songqing, Jikun Huang, Ruifa Hu, and Scott Rozelle. 2002. “The Creation andSpread of Technology and Total Factor Productivity in China’s Agriculture.”American Journal of Agricultural Economics 84 (4): 916–30.
Knight, John, and Lina Song. 2003. “Chinese Peasant Choices: Migration, RuralIndustry or Farming.” Oxford Development Studies 31 (2): 123–47.
Kojima, Reeitsu. 1987. “Urbanization and Urban Problems in China.” IDEOccasional Paper 22, Institute for Developing Economies, Tokyo.
Kwok, Yin-Wang. 1981. “Trends of Urban Planning and Development in China.”In Urban Development in Modern China, ed. Laurence J. C. Ma and Edward W.Hanten. Boulder, CO: Westview Press.
“Lanzhou to Walk Off Pollution.” 2007. China Daily, January 17.
Li, Peter Ping. 2006. “The Puzzle of China’s Township-Village Enterprises: TheParadox of Local Corporatism in a Dual-Track Economic Transition.”Management and Organization Review 1 (2): 197–224.
Liu, Haiyan. 1993. “The Past and Future of Urban Histories Examining China’sModern Period (1840–1949).” Social Sciences in China 14 (Winter): 115–27.
36 China Urbanizes: Consequences, Strategies, and Policies
Liu, Yunhua, and Xiaobing Wang. 2005. “Technological Progress and ChineseAgricultural Growth in the 1990s.” China Economic Review 16 (4): 419–40.
“The Megacity.” 2006. The New Yorker, November 13.
Mohan, Rakesh. 2006. “Asia’s Urban Century: Emerging Trends.” Paper presentedat the conference “Land Policies for Urban Development,” Cambridge, MA,June 5.
Monda, Keri L., Penny Gordon-Larsen, June Stevens, and Barry M. Popkin. 2006.“China’s Transition: The Effect of Rapid Urbanization on Adult OccupationalPhysical Activity.” Social Science & Medicine 64 (4): 858–70.
“Mortgage Industry Untapped, Says BIS.” 2006. Shanghai Daily, December 11.
Mote, Frederick W. 1999. Imperial China: 900–1800. Cambridge, MA: HarvardUniversity Press.
Mu, Huaipeng. 2005. “China’s Bond Market: Innovation and Development.”Paper presented at the Second Annual Asia Pacific Bond Congress, Hong Kong(China), June 16.
Murphy, Rachel 2002. How Migrant Labor Is Changing Rural China. Cambridge,U.K.: Cambridge University Press.
NBS (National Bureau of Statistics). 2002. China Statistical Yearbook 2001.Beijing: China Statistics Press.
———. 2006. China Statistical Yearbook 2001. Beijing: China Statistics Press.
Naughton, Barry. 1988. “The Third Front: Defense Industrialization in the ChineseInterior.” China Quarterly 115: 351–86.
NDRC (National Development and Reform Commission). 2007. “11th Five-YearPlan on Energy Development.” Beijing.
“The New New York.” 2006. Economist, December 13.
O’Brien, Kevin J., and Lianjiang Li. 2006. Rightful Resistance in Rural China.Cambridge: Cambridge University Press.
Oi, J. C. 1992. “Fiscal Reform and the Economic Foundations of Local StateCorporatism in China.” World Politics 45 (1): 99–126.
“On the Verge of Viability.” 2006. Financial Times, October 20.
Ouyang, Tingping, Zhaoyu Zhu, and Yaoqiu Kuang. 2006. “Assessing Impactof Urbanization on River Water Quality in the Pearl River DeltaEconomic Zone, China.” Environmental Monitoring and Assessment 120(1–3): 313–25.
Pan, Jiahua. 2002. “Rural Energy Patterns in China:A Preliminary Assessment fromAvailable Data Sources.” Program on Energy and Sustainable DevelopmentWorking Paper 12, Stanford University, Stanford, CA.
Pannell, Clifton W. 1992. “The Role of Great Cities in China.” In Urbanizing China,ed. Gregory Eliyu Guldin. New York: Greenwood Press.
Optimizing Urban Development 37
–––––. 2003. “China’s Demographic and Urban Trends for the 21st Century.”Eurasian Geography and Economics 44 (7): 479–96.
Park, Albert, Sangui Wang, and Guobao Wu. 2002. “Regional Poverty Targeting inChina.” Journal of Public Economics 86 (1): 123–53.
Phang, Sock-Yong. 2000. “How Singapore Regulates Urban Transportationand Land Use.” In Local Dynamics in An Era of Globalization, ed. ShahidYusuf, Weiping Wu, and Simon Evenett, 159–63. New York: OxfordUniversity Press.
Pielou, E. C. 1998. Fresh Water. Chicago: University of Chicago Press.
Pingali, P. L., ed. 2001. CIMMYT 1999–2000 World Maize Facts and Trends:Meeting World Maize Needs: Technological Opportunities and Priorities for thePublic Sector. International Maize and Wheat Improvement Center (CIMMYT),Mexico City.
Podpiera, Richard. 2006. “Progress in China’s Banking Sector Reform: Has BankBehavior Changed?” IMF Working Paper WP/06/71, International MonetaryFund, Washington, DC.
Polo, Marco. 1958. The Travels of Marco Polo. Translated by Ronald E. Latham.New York: Penguin Classics.
Qian, Yingyi. 1999. “The Institutional Foundations of China’s Market Transition.”Paper presented at the Annual World Bank Conference on DevelopmentEconomics, Washington, DC, April 29.
Ravallion, Martin, Shaohua Chen, and Prem Sangraula. 2007. “The Urbanizationof Global Poverty.” World Bank Background Paper 2008, Washington, DC.
Rosen, Daniel H., and Trevor Houser. 2007. “China Energy: A Guide for thePerplexed.” Peterson Institute for International Economics, Washington, DC.
Rosenthal, Stuart S., and William C. Strange. 2004. “Evidence on the Nature andSources of Agglomeration Economics.” In Handbook of Regional and UrbanEconomics, ed. J. Vernon Henderson and Jacques-François Thisse, 2119–71.North Holland.
Roumasset, James, Hua Wang, and Kimberly Burnett. 2006. “EnvironmentalResources and Economic Growth.” World Bank, Washington, DC.
Saich, Tony. 2006. “Hu’s in Charge.” Asian Survey 46 (1): 37–48.
“Saying ‘No’ to Growing Filthy Rich.” 2006. Business China, November 20.
Schott, Peter K. 2006. “The Relative Sophistication of Chinese Exports.”NBER Working Paper 12173, National Bureau of Economic Research,Cambridge, MA.
Shalizi, Zmarak. 2007. “Energy and Emissions: Local and Global Effects of theGiants’ Rise.” In Dancing with Giants, ed. L. Alan Winters and Shahid Yusuf.Washington, DC: World Bank.
38 China Urbanizes: Consequences, Strategies, and Policies
Shanghai Municipal Statistical Bureau. 2005. Shanghai Statistical Yearbook 2005.Beijing.
“Shanghaied.” 2006. Economist, September 30.
Sherbinin, Alex de, Andrew Schiller, and Alex Pulsipher. 2007. “The Vulnerabilityof Global Cities to Climate Hazards.” Environment & Urbanization 19 (1):39–64.
Shiller, Robert J. 2006. “Thrifty China, Spendthrift America.” Project Syndicate.http://www.project-syndicate.org/commentary/shiller40.
Sicular, Terry, Yue Ximing, Bjorn Gustafsson, and Li Shi. 2007. “The Urban–RuralIncome Gap and Inequality in China.” Review of Income and Wealth 53 (1):93–126.
Sinn, Hans-Werner, and Frank Westermann. 2001. “Two Mezzogiornos.” NBERWorking Paper 8125, National Bureau of Economic Research, Cambridge, MA.
Steffen, Alex, ed. 2006. Worldchanging: A User’s Guide for the 21st Century. NewYork: Harry N. Abrams, Inc.
Su, Ming, and Quanhou Zhao. 2007. “China: Fiscal Framework and UrbanInfrastructure Finance.” In Financing Cities: Fiscal Responsibility and UrbanInfrastructure in Brazil, China, India, Poland and South Africa, ed. George E.Peterson and Patricia Clarke Annez. London: Sage Publications.
Tsui, Kai-yuen. 2007. “Forces Shaping China’s Interprovincial Inequality.” Reviewof Income and Wealth 53 (1): 60–92.
“The Way We Were in 2006.” 2006. The Week, December 29.
Wei, Yi-Ming, Qiao-Mei Linag, Ying Fan, Norio Okada, and Hsien-Tang Tsai.2006. “A Scenario Analysis of Energy Requirements and Energy Intensity forChina’s Rapidly Developing Society in the Year 2020.” TechnologicalForecasting & Social Change 73 (4): 405–21.
“What Shortage?” 2006. Business Asia, November 13.
World Bank. 2003a. China: Promoting Growth with Equity. Report 24169–CHA,Washington, DC.
———. 2003b. “Public Finance Reform and Macroeconomic Management.”World Bank Policy Note, Washington, DC.
———. 2006. World Development Indicators. Washington, DC: World Bank.
Wu, Friedrich. 2006. “What Could Brake China’s Rapid Ascent in the WorldEconomy?” World Economics 7 (3): 63–87.
Wu, Fulong. 2004. “Urban Poverty and Marginalization under Market Transition:The Case of Chinese Cities.” International Journal of Urban and RegionalResearch 28 (2): 401–23.
Wu, Jinglian. 2005. Understanding and Interpreting Chinese Economic Reform.Mason, OH: South-Western College Publishing.
Optimizing Urban Development 39
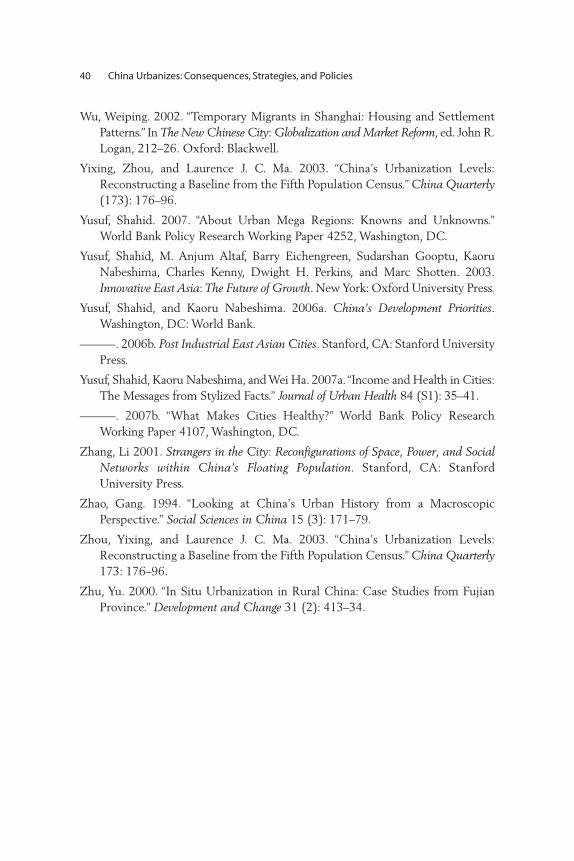
Wu, Weiping. 2002. “Temporary Migrants in Shanghai: Housing and SettlementPatterns.” In The New Chinese City: Globalization and Market Reform, ed. John R.Logan, 212–26. Oxford: Blackwell.
Yixing, Zhou, and Laurence J. C. Ma. 2003. “China’s Urbanization Levels:Reconstructing a Baseline from the Fifth Population Census.” China Quarterly(173): 176–96.
Yusuf, Shahid. 2007. “About Urban Mega Regions: Knowns and Unknowns.”World Bank Policy Research Working Paper 4252, Washington, DC.
Yusuf, Shahid, M. Anjum Altaf, Barry Eichengreen, Sudarshan Gooptu, KaoruNabeshima, Charles Kenny, Dwight H. Perkins, and Marc Shotten. 2003.Innovative East Asia: The Future of Growth. New York: Oxford University Press.
Yusuf, Shahid, and Kaoru Nabeshima. 2006a. China’s Development Priorities.Washington, DC: World Bank.
———. 2006b. Post Industrial East Asian Cities. Stanford, CA: Stanford UniversityPress.
Yusuf, Shahid, Kaoru Nabeshima, and Wei Ha. 2007a.“Income and Health in Cities:The Messages from Stylized Facts.” Journal of Urban Health 84 (S1): 35–41.
———. 2007b. “What Makes Cities Healthy?” World Bank Policy ResearchWorking Paper 4107, Washington, DC.
Zhang, Li 2001. Strangers in the City: Reconfigurations of Space, Power, and SocialNetworks within China’s Floating Population. Stanford, CA: StanfordUniversity Press.
Zhao, Gang. 1994. “Looking at China’s Urban History from a MacroscopicPerspective.” Social Sciences in China 15 (3): 171–79.
Zhou, Yixing, and Laurence J. C. Ma. 2003. “China’s Urbanization Levels:Reconstructing a Baseline from the Fifth Population Census.” China Quarterly173: 176–96.
Zhu, Yu. 2000. “In Situ Urbanization in Rural China: Case Studies from FujianProvince.” Development and Change 31 (2): 413–34.
40 China Urbanizes: Consequences, Strategies, and Policies