Embed Size (px)
Citation preview
0
The Development Impact of a Best Practice Seasonal Worker Policy*
John Gibson, University of Waikato
David McKenzie, World Bank, BREAD, CEPR, CReAM and IZA
Abstract
Seasonal migration programs are widely used around the world, yet there is little evidence as to
their development impacts. A multi-year prospective evaluation of New Zealand‟s Recognised
Seasonal Employer (RSE) seasonal worker program allows us to measure the impact of
participating in this program on households in Tonga and Vanuatu. Using a propensity-score pre-
screened difference-in-differences analysis based on surveys fielded before, during, and after
participation, we find that the RSE has indeed had positive development impacts, which dwarf
those of other popular development interventions. It has increased income, consumption, and
savings of households, durable goods ownership, and subjective standard of living; the results
also suggest that child schooling improved in Tonga.
Keywords: Seasonal migration; Matched Difference-in-Differences.
JEL codes: O12, J61, F22.
* We thank the editor and three anonymous referees for useful comments which helped sharpen the initial version of
this paper; AusAID and the World Bank for funding for this project; Manjula Luthria for the catalyzing role she has
played in the development of this policy and in supporting its evaluation; Pilar García-Martinez, Halahingano
Rohorua, Alan Winters for their collaboration in earlier phases of this project; the New Zealand Department of
Labour, Tonga Department of Labour, Vanuatu Department of Labour, MFAT, and other members of the RSE
Interagency Governance Committee for their collaboration in this research; Kim Robertson and Simil Johnson for
work as field supervisor in Vanuatu; Emily Beam and Melanie Morten for research assistance; seminar audiences
and discussants at the Center for Global Development, Dublin, Georgetown, Paris, Venice and Waikato for helpful
comments; and most of all, the interviewers and survey respondents in Tonga and Vanuatu. All views expressed are
those of the authors alone, and do not necessarily represent those of their employers. E-mail:
[email protected] with any comments.
1
1. Introduction
“First and foremost it will help alleviate poverty directly by providing jobs for rural and outer island workers who
often lack income-generating work. The earnings they send home will support families, help pay for education and
health, and sometimes provide capital for those wanting to start a small business”.
Winston Peters, New Zealand Minister of Foreign Affairs, at the approval of the RSE program, October 2006.1
“A guest worker program is the most effective contribution we can make to improving the lives of the world‟s
working poor”
Dani Rodrik in a New York Times op-Ed, June 1, 2007.
International migration is probably the most effective mechanism we know to rapidly
increase the incomes of poor people (Clemens et al., 2008), and to help narrow global income
gaps (Hanson, 2009). It is also one of the most controversial, with migrant-receiving countries
worried about the costs of assimilating workers and their families. Temporary or circular
migration programs are seen as a way of overcoming such concerns and enabling poorer, less-
skilled workers to benefit from the higher incomes to be earned abroad as part of a “triple-win”,
whereby migrants, the sending country, and the receiving country all benefit. Such programs
have been recommended as one of the most promising ways to enhance the development benefits
of migration by a wide range of international organizations (UN, 2004; GCIM, 2005; World
Bank 2006), national Governments (House of Commons International Development Committee,
2004) and academics (Winters et al., 2003; Pritchett, 2006, Rodrik, 2007).
Almost all OECD countries have temporary worker migration programs, with seasonal
workers the largest category, totaling 576,000 workers in 2006 (OECD, 2008). Such programs
remain controversial, especially when geared to low-skilled migrants. Some critics of such
programs raise concerns that workers will over-stay and concerns they will compete down the
wages of native poorer workers (e.g. Borjas, 2007), while others raise concerns about the
possible exploitation of migrants and whether they can earn enough to make it worthwhile if the
duration of work is short.2
Lacking from this debate is credible evidence on the development impact of international
seasonal worker programs. The few existing studies are based on ex-post surveys of migrants,
1 Quoted in “Seasonal work policy benefits Pacific says Peters”, Islands Business, October 26, 2006.
http://www.islandsbusiness.com/news/index_dynamic/containerNameToReplace=MiddleMiddle/focusModuleID=1
30/focusContentID=6691/tableName=mediaRelease/overideSkinName=newsArticle-full.tpl (accessed August 11,
2010). 2 These concerns are discussed in Ruhs (2006), Pritchett (2006) and OECD (2008) among others.
2
and lack credible counterfactuals for what would have happened to households in the absence of
migration.3 This paper seeks to provide credible evidence on the development impacts of
seasonal migration by means of a prospective multi-year evaluation of New Zealand‟s
Recognised Seasonal Employer (RSE) scheme. The RSE began in 2007 and aims to ease labor
shortages in New Zealand‟s horticulture and viticulture industries, while also promoting
economic development in the Pacific Islands. The policy was developed taking account of
lessons from previous seasonal worker programs elsewhere and is viewed as a possible model for
other countries. For example, the ILO good practices database states “The comprehensive
approach of the RSE scheme towards filling labour shortages in the horticulture and viticulture
industries in New Zealand and the system of checks to ensure that the migration process is
orderly, fair, and circular could service as a model for other destination countries.”4
Our evaluation was designed prospectively, alongside the program launch. We conducted
baseline surveys of households and communities in Tonga and Vanuatu before workers left to
work in New Zealand, and then re-interviewed these same households 6, 12 and 24 months later.
These rich baseline data and institutional knowledge of how recruitment occurred let us use
propensity-score matching to identify an appropriate set of households to act as a comparison
group for the households in the RSE. Following Crump et al. (2009), we use this propensity-
score to pre-screen the sample used for panel difference-in-differences and fixed effects
estimation. With these methods we assess the impacts of the RSE on household incomes,
consumption, savings, durable assets and subjective well-being, and also measure broader
community-level impacts.
The results show large positive effects on sending households in Tonga and Vanuatu; per
capita income of participating households rises by over 30 percent relative to the comparison
groups in both countries while per-capita expenditure and savings also rise. Subjective economic
welfare increases by almost half a standard deviation for participants in both countries, who are
also seen to have purchased more durable assets. In Tonga RSE households also doubled the rate
of home improvement, and in both countries, households became more likely to have a bank
3 For example, Basok (2000) conducted a snowball sample of Mexican workers in Canada‟s seasonal worker
program in one area of Canada and in one village in Mexico. Macours and Vakis (2010) use a cross-sectional survey
of Nicaraguan households near the border with Honduras, where workers migrate seasonally. 4 http://www.ilo.org/dyn/migpractice/migmain.showPractice?p_lang=en&p_practice_id=48 [accessed August 11,
2010]
3
account, likely reflecting more formal savings. In addition, there is some evidence that school
attendance rates for 16 to 18 year olds increased in Tonga. An additional innovative feature of
our analysis was to survey community leaders who reported positive broader impacts on the
community.
Overall these results show that the seasonal worker program has been a powerful
development intervention for the participating households, with aggregate effects that are
important relative to aid flows and export earnings. Thus, the RSE policy appears to have
succeeded in its development objectives in the short run. There are very few rigorous impact
evaluations that show large gains in income from development interventions, and the
development impacts of this seasonal worker program on participating households dwarf those
found in recent evaluations of other popular development interventions like conditional cash
transfers, microfinance, business training, and grants to microenterprises.
A common issue for any in-depth evaluation of a single intervention is the extent to which
the results may generalize to other settings. We note first that seasonal worker programs are an
important policy lacking rigorous evidence from any setting. Second, we examine impacts in two
countries that differ in many dimensions – Tonga and Vanuatu have different ethnic populations
(one Polynesian, one Melanesian), different Government structures, and different prior histories
of migration. Finding similar results in both countries therefore suggests the results aren‟t
particular to a single context. Third, small countries are indeed one of the most relevant contexts
to look at such programs – emigration rates are highest for small, island countries, where the lack
of market size and remoteness makes other development projects less attractive. Our results are
most directly applicable to small countries, such as the 45 developing countries with populations
below 1.5 million. But the findings may have even broader relevance since New Zealand‟s
program is sizeable by international standards (greatly exceeding Australia‟s fledging seasonal
worker scheme and about one-third the size of Canada‟s SWAP program for example) and is
touted as a model for many destination countries.
The remainder of the paper is structured as follows. Section 2 describes the RSE policy and
worker recruitment. Section 3 defines how we see development impact and Section 4 describes
our surveys and estimation methodology. Household-level impacts are estimated in Section 5,
and impacts at the community and macro level are discussed in Section 6. Section 7 concludes.
4
2. The RSE program
The RSE was launched on 30 April 2007 and initially let up to 5,000 seasonal workers come
to New Zealand for a maximum of seven months per 11 month period to work in horticulture and
viticulture. Preference is given to workers from Pacific countries (except Fiji), with Kiribati,
Samoa, Tonga, Tuvalu, and Vanuatu given special “kick-start” status that entailed deliberate and
expedited efforts to launch the scheme and recruit in these countries. Vanuatu and Tonga, the
focus of our impact analysis, supplied the most workers under the RSE in the first two seasons:
3590 workers in the case of Vanuatu and 1971 from Tonga (including return workers).5
Ramasamy et al. (2008) detail the origins of the RSE as a solution to long-standing problems
the horticulture and viticulture industries had in meeting seasonal labor needs, while contributing
to New Zealand‟s broad development goals in the Pacific region. Design of the RSE paid careful
attention to previous experience with seasonal worker programs around the world to reduce risks
of overstaying, displacement of New Zealand workers, and worker exploitation. The risk of
overstaying is mitigated in a number of ways: workers may be re-employed in subsequent years,
either with the same or a new employer, which can be contrasted with single-entry schemes
which provide high incentives for workers to overstay; employers are required to pay the costs
associated with worker removal from New Zealand if workers become illegal, giving employers
incentives to not be complicit in their overstaying; and competition for places among
communities and countries leads to social pressures to not jeopardize future possibilities for
others by overstaying and thereby creating a negative reputation for one‟s community.
The risk of displacement of New Zealand workers is mitigated through a “New Zealanders
first” principle that requires employers to first lodge their vacancies with the Ministry of Social
Development (who provide welfare benefits and job search services) before attempting to recruit
offshore. The risk of exploitation is mitigated through regulations stating that workers must not
be charged recruitment fees and that employers must pay market wages and offer workers at
least a minimum remuneration which depends on the length of the contract. Employers also must
arrange suitable accommodation, internal transportation, access to personal banking services,
provision of protective equipment and opportunities for recreation and religious observance.
5 A “return worker” is an individual who participates in the RSE in one season, and then returns again in a second
season, and is counted as two workers in the administrative data.
5
Recruitment options were fit to the needs of each country. In Tonga employers could recruit
workers directly or from a “work-ready” pool of Tongans pre-screened and selected by the labor
ministry. In the first year recruitment was mainly from the work-ready pool. Pre-selection and
screening was by district and town officers, and church and community leaders. There was
tremendous interest in the scheme, evident from the fact that more than 5,000 Tongans registered
for the work-ready pool within 3 months of the launch of the scheme. In Gibson et al. (2008) we
describe this selection process, and show the main attributes used by village committees in pre-
selection, which favored low-income applicants. The Tongan Labour Ministry ensured that all
villages in the country had workers in the scheme.
In Vanuatu employers could either hire directly or through an agent. Direct recruitment is
facilitated by the Vanuatu Department of Labour, which in the first year also used a work-ready
pool of workers from walk-ins who registered directly with the department. These workers were
typically from the more urban areas. In rural areas, direct recruitment and agents relied heavily
on community contacts through village councils, again using villages to pre-screen workers. In
McKenzie et al. (2008) we study this process, and find that agents and villages looked for similar
characteristics to those selected on in Tonga except that it was not the poorest households who
applied and had workers selected. This perhaps reflected the newness of international migration
in Vanuatu, with communities more concerned with sending workers who would represent the
village, and the poorest households lacked information about the program in the first year, and
lacked the resources to finance the costs of the travel process.
Typical work under the RSE includes working on vineyards to prune vines and pick grapes,
harvesting apples and kiwifruit and other fruitpicking, and working in the packhouse to sort,
grade, and pack the fruit. The work was typically physically demanding, and included work in
both cold and hot conditions. In part due to the nature of the work, the majority of RSE workers
recruited were male: in the first year in our sample, 82 percent of the ni-Vanuatu RSE workers
and 87 percent of the Tongan RSE workers were male.6
The RSE has been viewed as a success from the New Zealand point of view. An evaluation
of the first two years conducted by the New Zealand Department of Labour (2010, p.xvii)
concluded that “Overall, the RSE Policy has achieved what it set out to do”. The policy is found
6 Ni-Vanuatu is the term used to refer to citizens of Vanuatu.
6
to have provided employers in the horticulture and viticulture industries with access to a reliable
and stable workforce, with productivity gains starting to emerge as workers return for repeat
seasons. The main concerns raised about temporary labor programs have been mitigated: the
evaluation finds little displacement of New Zealand workers; overstay rates were only 1 percent
in the first season and less than 1 percent in the second; and concerns about worker exploitation
have at most arisen in a couple of isolated cases. The question this paper addresses is then
whether the RSE has also lived up to the policy goal of improving development in the Pacific.
3. What do we mean by development impact?
In order to measure whether the RSE has improved development outcomes in the Pacific
Islands, we must first define what we mean by development impact for such a program. We see
three related definitions of development impact and will attempt to provide evidence on each.
The first, and most narrow, views development as anything that raises the income of people from
poor countries. The large wage differences between a developed and a developing country would
strongly suggest we should expect to see an impact on household income from participating, and
so the main question is then measuring how large this impact is. However, there is a view that
guestworker programs in agriculture are “close to slavery”, with workers being exploited and not
paid the promised wages, so that after meeting expenses they are no better off (Southern Poverty
Law Center, 2007). Our analysis will help rule out this possibility.
A second, broader view sees development as increasing the utility of households in
developing countries. The key issue in this view is whether the gain in income is more than
offset by any negative issues to the household which arise from physical separation of household
members. A related literature on the impacts of separation in military families has applied two
approaches to addressing this issue. The first is a revealed preference approach, which examines
the trade-offs soldiers make between time and money (e.g. Dunn, 2003), noting that to the extent
the decision is a choice, households must have decided the expected disutility is more than offset
by the additional income. This approach may be less useful for a new program in which
information may be incomplete. A second approach attempts to measure impacts on specific
7
outcomes without trying to aggregate up to an overall impact.7 In our context we will look at a
number of specific outcomes, as well as subjective well-being as a measure of overall utility.
A final view of development is more concerned about whether interventions have long-
term impacts on households. The concern here is that either income earned abroad does not make
it back to the household in the first place because it is consumed by the migrant, or that the
money that is received is spent on things which increase short-term household utility but leave
the household no better off in the long-term. The question is then whether money received by the
family is spent on durable asset accumulation, saved, or invested in children‟s education and in
businesses, as well as whether there are spillover benefits for the broader community. We will
examine these outcomes, although we also note that this view is based on the presumption that
participating in seasonal migration for many years is not a possibility, whereas in practice
households could increase long-term well-being also by participating in this program for many
years.
4. Our surveys and estimation methodology
4.1 The surveys
There was keen interest from national Governments on both sides of the migration
relationship and from the World Bank in learning whether the new RSE program would have the
development impacts envisioned as one of its core rationales. It was therefore decided ex ante to
have a rigorous evaluation of development impacts, focusing on Tonga and Vanuatu. These were
expected to be the two countries participating most, and they offer an interesting contrast in prior
migration history. Tonga (population 100,000) has traditionally had high emigration rates to New
Zealand, Australia and the United States, with most recent migration through family-sponsored
categories and a special annual permanent migration quota to New Zealand called the Pacific
Access Category. The 2006 New Zealand Census enumerated 20,520 Tongan-born in New
Zealand. In contrast, Vanuatu (population 215,000) has had relatively little international
emigration, with only 1.5 percent of its population abroad prior to the RSE (World Bank, 2008),
and fewer than 1,000 Vanuatu-born in the 2006 New Zealand Census.
7 For example, Angrist and Johnson (2000) find that deployment in the first Gulf War led to no changes in divorce
rates or child disability when men were deployed, but increases in divorce when women were deployed, while Lyle
(2006) finds military deployments to Iraq and Afghanistan have a negative impact on children‟s test scores, with the
impact greater when women leave.
8
Given that recruiting occurred at the employer level, the interests of some employers in
screening workers themselves, and the large number of employers involved, it was never going
to be feasible to attempt to get employers to randomly select workers. Therefore we decided the
most credible impact evaluation strategy would be a matched difference-in-differences approach.
This would entail a baseline survey of households that would participate in the RSE before the
workers left, along with surveys of non-participating households, and then following these
households over time. Non-participating households would be separated into whether or not they
had a member of the work-ready pool who had applied for the program, but not been selected.
Ex ante it was not known how many individuals from each country would participate in the
scheme. But the numbers likely to be involved were certainly too small for a simple random
sample of households to pick up enough RSE households in a cost-effective way. Hence, we
needed to know RSE status before surveying. Survey design was then complicated by the fact
that approvals to recruit workers and recruitment took place on a rolling basis. Once workers
were selected for recruitment, there was often only two or three weeks before they left for New
Zealand, leaving a very short window of time to interview them and their household
Therefore we used a rolling sampling methodology, adding sample as we received updates
of when, where, and who employers were recruiting, with the baseline survey conducted between
October 2007 and April 2008. In Tonga our survey has near national coverage, covering the
islands of Tongatapu, Vava‟u and „Eua (containing 90 percent of the population and 92 percent
of Year 1 RSE workers). Officials helped us identify households with RSE workers and
households with members of the RSE work-ready pool who had not been selected yet. We
additionally surveyed randomly selected households in the same villages who had no one yet
apply for the program. In each village we aimed for approximately five households with an RSE
worker, three households with a member of the work-ready pool who was not selected, and four
households with non-applicants. The choice of a control sample from the same villages as the
treated was informed by our previous experience matching for a different migration program in
Tonga (McKenzie et al, 2010) and work on evaluation of labor training programs which stresses
9
the importance of matching on the same or similar labor markets (Dehejia, 2005). Our resulting
baseline survey covered 448 households containing 2,335 individuals in 46 villages.8
Vanuatu‟s rugged geography and high transportation costs made it infeasible to survey in all
islands, so we limited the evaluation to three islands from which we believed there was a high
chance of workers coming. These were Efate (population 50,000), containing the capital city,
Port Vila, Ambrym (population 10,000) and Tanna (population 20,000). In contrast to Tonga, not
all villages in Vanuatu initially participated in the RSE, so as well as sampling non-applicant
households in villages with participating RSE workers, we also sampled households from nearby
villages which had not participated in the RSE. Ultimately our baseline survey covered 456
households containing 2,173 individuals in 48 villages or communities.
Three rounds of follow-up surveys were then conducted. The first took place between April
and July 2008, approximately six months after the baseline survey. This was intended to be a
time when RSE workers were still in the midst of their 7 month stint abroad. However, as in
practice many contracts were for shorter than 7 months, approximately two-thirds of Tongan
RSE workers and one-fifth of ni-Vanuatu RSE workers in our sample had returned by the time of
this survey. The second follow-up survey took place between October 2008 and February 2009,
approximately one year after the baseline, while the third and final follow-up survey took place
between October 2009 and March 2010, two years after baseline.
Attrition was remarkably low in the Tongan sample. Of the 448 households in the baseline,
we were able to re-interview 442 households in the second round survey, 444 in the third round,
and 440 in the fourth round. In contrast, attrition was higher in Vanuatu. Of the 456 households
in the baseline survey, 382, 388, and 348 households were re-interviewed in rounds 2, 3 and 4
respectively, whilst 33 households were only interviewed in round 1. In an online appendix we
show our main results are robust to this attrition.
4.2 Estimation methodology
Online Appendix Table 1 has the number of households participating in the RSE by survey
round. Most new entry into the RSE in our sample came between the first and second rounds,
8 Further details of the baseline sampling methodology for Tonga are contained in Gibson et al. (2008), while
McKenzie et al. (2008) provides more details on the Vanuatu sampling methodology.
10
with few additional households from our sample joining the RSE in the later rounds.9 Most RSE
households (58% Tonga and 54% Vanuatu) had only one seasonal worker spell during the two
years of our study, while the rest had multiple spells. Since the number of times a household
participates in the RSE conditional on participating is potentially the result of household choices,
we focus on a binary measure of RSE participation: RSEi,t , which takes value one if household i
has at least one member who has worked in the RSE by time t, where t=1,2,3 and 4 corresponds
to our four survey waves. Estimating the impact of RSEi,t then involves estimating the average
impact of ever participating in the RSE over the first two years of the program.
We then begin with panel data regressions of the impact of the RSE, using the full sample of
households separately for each country. Letting Yi,t be an outcome of interest for household i in
survey round t, we begin with the following difference-in-differences specification:
(1)
Where EverRSEi indicates whether household i ever participates in the RSE over the four
waves of our sample, and δt are survey round dummies. The coefficient of interest is then γ,
which gives the average treatment effect of participating in the RSE. We do not include
additional time-varying controls in this regression, since we have few time-varying variables that
are not potentially themselves affected by the RSE. Standard errors are clustered at the
household level to account for autocorrelation in the error term εi,t across survey waves.
Difference-in-differences controls for any baseline level differences in the outcome Yi,t at the
group-level. An alternative approach is to control for baseline differences at the household-level
with household-level fixed effects. We estimate this via the following specification:
(2)
where μi is the fixed effect for household i.
In both specifications, γ measures the average impact of participating in the RSE over the
two year period of our study. Pooling multiple rounds of post-treatment data provides more
power to identify the effect of interest, especially for outcomes like income and consumption that
are not highly autocorrelated (McKenzie, 2012).10
9 Of course other additional households from the general population also joined the RSE during the time of
subsequent survey rounds, but these households were outside our initial sample. 10
An alternative approach would be to use each of the subsequent survey rounds separately with the baseline, and
attempt to estimate the trajectory of treatment effects. But our power to do this is very low and hence we focus on
the average impact over the two years.
11
The difference-in-differences and fixed effects specifications let us estimate differential
effects on RSE households, but cannot capture macro effects benefiting the non-RSE households.
The RSE has broader effects at the community level, as shown in Section 6 below, but mainly
through remittances earmarked for community projects rather than through the absence of
migrants leading to more job opportunities or higher wages for those remaining. Similarly, there
appears to be little effect on prices; many of these villages lack markets, with imported durable
goods and even food markets often only in the main large towns.
A second underlying assumption of difference-in-differences and fixed effects is that after
controlling for level differences, households would have exhibited similar trends in the outcome
variables in the absence of the RSE. This is less credible if the households we are comparing
have very different characteristics. We therefore follow the recommendations of Crump et al.
(2009), of estimating a propensity score, and dropping observations with estimated propensity
scores outside the range [0.1,0.9].11
This systematic approach to pre-screening the sample
ensures the regression is estimated only for the sample where the covariate distribution overlaps
for the RSE and non-RSE households. Angrist and Pischke (2009) show that this approach works
well in approximating the experimental results obtained in a U.S. work experience program. An
alternative approach would be to use the propensity scores directly in estimation. The online
appendix shows our results are robust to this alternative, although we prefer the pre-screened
regression approach given that we have multiple rounds of post-treatment data to use.
Our study includes many of the features identified as desirable for propensity-score
matching (Dehejia, 2005). Our surveys of RSE and non-RSE households were fielded at the
same time in the same villages (and hence local labor markets) using the same questionnaire. We
know the characteristics villages and employers used in selecting workers and can include these
in the matching specification. As a new program, employers relied largely on the pre-screening
and observable characteristics like English literacy to choose workers. Also, we have more than
one period of pre-RSE wage earning data (though not many earned wage income). Furthermore
we know whether households tried to participate in the RSE (by having a member register for the
work-ready pool, or apply directly to an employer). Finally, we have a plausible reason why
11
In both Tonga and Vanuatu the common support of our propensity score distributions are wider than the [0.1, 0.9]
range. Crump et al. (2009) show that the [0.1, 0.9] cut-offs have good optimality properties and closely approach
data-dependent optimal thresholds in most contexts.
12
some households participated in the RSE and other households with similar characteristics did
not – there was excess demand for RSE employment, and so not all households who wanted to
participate were able to.
We estimate two versions of the propensity score – PS-1 and PS-2 – which differ only in
that PS-2 restricts the sample to RSE-applicant households, removing non-applicant households.
This lets us explicitly screen on demand for the RSE, although given that the reason many non-
applicant households said they didn‟t apply was lack of information about the program (Gibson
et al, 2008; McKenzie et al, 2008), failure to apply need not imply lack of demand and the
exclusion of non-applicants reduces our sample size, which has costs in terms of power.
We use six main categories of variables we believe may influence participation in the RSE
to estimate the propensity score: demographic variables (household size, numbers of adults,
school aged children, and males aged 18 to 50); characteristics of the 18-50 year old males in the
household, who are the individuals most likely to participate (share literate in English, share with
schooling beyond grade 10, share with self-reported health rated as very good, share who drank
alcohol in the past month, and the mean number of days of hard labor carried out in the past
month); the household‟s previous experience and network in New Zealand (share of adults who
had previously been to New Zealand, number of relatives in New Zealand); household baseline
assets and housing infrastructure (an asset index from the first principal component of durable
goods, pigs, cattle and chickens, and whether the dwelling was traditional style); geography (on
Tongatapu or Efate as opposed to one of the other islands) and past household wage and salary
history (household wage income for the first half of 2006 and 2007, and whether the household
had any male aged 18 to 50 who worked for pay in 2006 and in 2007). For each variable we
include both the variable and its square in estimating the propensity score.
For Tonga estimating the propensity score and restricting to the range [0.1, 0.9] reduces our
sample of 448 households (197 RSE, 251 non-RSE) to 379 households using PS-1 (183 RSE and
196 non-RSE) and 283 households using PS-2 (153 RSE, 121 non-RSE). In Vanuatu the sample
of 456 households (147 RSE, 309 non-RSE) reduces to 360 households using PS-1 (129 RSE,
231 non-RSE) and to 269 households using PS-2 (123 RSE, 146 non-RSE). Trimming mainly
removes non-RSE households too dissimilar to RSE households to be appropriate comparators,
plus a few RSE households that differ too much from any non-RSE household. We re-estimate
13
(1) and (2) for households with propensity scores in the range [0.1, 0.9]. Again the differencing
or fixed effects will eliminate both observed and unobserved time-invariant differences amongst
households, and the assumption of a common underlying trend in the absence of the RSE is
likely to be more credible for households with propensity scores within this range.
We use equations (1) and (2) to look at the impact of the RSE on flow variables of interest,
like income and consumption. For impacts on stock variables like assets owned, we instead
estimate, for households within the propensity score range [0.1, 0.9], the following equation:
(3)
For example, estimating equation (3) for whether the household owns a TV, is equivalent to
asking whether, conditional on their TV ownership status in the baseline, households in the RSE
are more likely to own a TV two years later than non-RSE households with similar covariates.
Finally, for the variables subjective well-being, making a dwelling improvement over the
two years of our study, and making a major asset purchase (200 pa‟anga or more in Tonga,
10,000 vatu or more in Vanuatu) over the two years of our study we estimate equation (3)
without including the baseline lag since these variables were not asked at baseline.
4.3 Summary Statistics
The main outcomes of interest are household income and expenditure, savings, asset
ownership, and schooling. The online appendix details how we measure income and expenditure.
Following Paxson (1992) we measure savings as a flow measure, defined as the difference
between income and expenditure in a period.
Table 1 reports baseline means of household characteristics in Tonga for RSE and non-RSE
households for the full sample, and for the PS-1 and PS-2 screened subsamples. Table 2 presents
the same comparisons for Vanuatu. Asterisks show the results of tests for difference in means.
Consider first the Tongan sample. The average RSE household has 5.7 members. The rural
subsistence farming nature of these households is seen in only 21 percent of these households
having any male wage or salary worker in the six months prior to the launch of the RSE, as well
as in their ownership of pigs and chickens. Semi-annual per capita income and consumption,
including the value of goods produced for own consumption, averaged 830 pa‟anga (around
US$430).12
This is less than a RSE worker could earn in a good week in New Zealand.
12
In April 2008, NZ$1 = 1.52 pa‟anga and US$1 = 1.92 pa‟anga; NZ$1 = 73.08 vatu, and US$1 = 92.50 vatu.
14
Tongan RSE households tend to be larger and poorer than the average non-RSE household
in our sample and their males worked more days of hard labor on average than in non-RSE
households, reflecting selection of workers more able or inclined to do physical work (Table 1).
The RSE households are also more connected to New Zealand, with adults in the household
more likely to have previously visited New Zealand, and the household having more relatives in
New Zealand. We believe that in both countries RSE households in some cases reported the
current RSE episode, so the actual difference in pre-RSE experience in New Zealand is likely
less than the gap shown here.13
The third through sixth columns of Table 1 show that matching
and restricting to households with propensity-scores between 0.1 and 0.9 makes the RSE and
non-RSE households more similar. The PS-2 subsample in particular does not differ significantly
in baseline demographics, income, or consumption from the subsample of RSE households with
propensity scores in the [0.1, 0.9] range, and only differs in previous experience in New Zealand,
which as noted, may be overstated for RSE households.
A natural concern is then whether our estimation is also perhaps picking up the value of
being more connected to New Zealand, and not just the impact of the RSE. We note that after
matching there is not a significant difference between groups in whether they have relatives in
New Zealand, or in whether other members of the household have been to New Zealand. Second,
to the extent a difference remains and which is not due to the measurement issue noted above,
our difference-in-differences and fixed effects estimation will still eliminate any time invariant
impact of this on household outcomes. There then does not seem to be a strong reason to think
there should be a large time-varying impact of being more connected to New Zealand during our
study period.
In contrast to Tonga, Table 2 shows RSE households in Vanuatu are richer than the average
non-RSE household, with higher baseline asset ownership, income and consumption. But many
participants are still poor by international standards; 37 percent of the RSE households have per
capita income below US$2 per day. Restricting to propensity-scores between 0.1 and 0.9 makes
the RSE and non-RSE households more similar but in contrast to Tonga using just applicant
households in PS-2 does not seem to improve on PS-1. This may reflect the less widespread
nature of the work-ready pool in Vanuatu and the fact that many people who would like to have
13
Consistent with this view, the rate of previous experience in New Zealand is not significantly higher for other
members of the RSE worker‟s household than it is for the average member in a non-RSE household.
15
applied did not do so because they lacked information, meaning that some non-applicants may be
better matches for RSE workers in Vanuatu than we can find amongst our sample of applicants.
Comparing the Tongan and ni-Vanuatu samples shows the much greater prior exposure of
Tongans to international migration; the average Tongan RSE worker surveyed has 5.4 relatives
in New Zealand, compared to 0.1 relatives for the average ni-Vanuatu RSE worker. With higher
levels of schooling in Tonga, a larger share of adult males in Tonga are literate in English, and
46 percent of 18-50 year old males in RSE households exceed 10 years of schooling versus only
6 percent in Vanuatu. But the Vanuatu sample is more likely to have previously worked for pay,
and in the end, the poverty rates are similar for our evaluation samples in both countries. These
differences in contexts offer the possibility to examine how different the effects are in quite
different starting circumstances, offering some degree of external validity for the results.
After pre-screening with the propensity-score, both the Tongan and ni-Vanuatu samples are
balanced on initial incomes, consumption, and poverty, which are our key outcomes of interest.
The income generating processes in these countries were fairly stable over the period examined;
households mainly semi-subsistence farming as they had been doing for years. Hence, assuming
parallel trends in the absence of the RSE seems reasonable. Ideally one would have several
rounds of pre-intervention outcome data to check this but the difficulty of recalling consumption
and agricultural income from previous years makes this infeasible in our case, as it likely is in
any similar evaluation. Wage income is more readily recalled, so as a further check, the bottom
of Tables 1 and 2 shows no difference in the growth in wage income between RSE and non-RSE
households over 2006-2007, a full year before the program began.
5. Household-level Impacts
5.1 Impact on Incomes, Expenditure, and Savings
Table 3 presents the results of estimating equation (1) in columns 1-5 and equation (2) in
columns 6-10 for Tonga in panel A and for Vanuatu in panel B. Full sample results are shown
first and then those for the propensity-score screened samples. To check if results are driven by a
few observations at the upper tail, columns 4 and 9 trim the top 1 percent of observations from
the sample. Finally, columns 5 and 10 use nearest-neighbor matching with replacement based on
PS-2, and only include the observations which are used in at least one match. This further
reduces the sample size and power, but serves as an additional robustness check.
16
Participating in the RSE has a large and statistically significant positive impact on household
income per capita in both countries. In Tonga, semi-annual income is 233-249 pa‟anga higher as
a result of the RSE, relative to a baseline income of 979 pa‟anga. Trimming for potential outliers
increases the gain to 300-325 pa‟anga. Log income is less sensitive to outliers, and also shows
large and statistically significant increases. Using the estimates which screen on PS-2 and are
thus restricted to RSE applicants, log income rises by 0.29-0.32, corresponding to a 34 to 38
percent increase in per capita income as a result of the RSE. Semi-annual income in Vanuatu is
approximately 44,000 vatu higher, relative to a baseline of 85,000 vatu. In log terms, per capita
income is 0.30 to 0.36 log points higher, which is equivalent to a 35 to 43 percentage increase.
These gains are large and significant regardless of the estimation method and sample used.
Household expenditure per capita is also found to increase with participation in the RSE in
Tonga. The increase is less than the increase in per capita income, and if we restrict ourselves to
the PS-2 screened sample, is only significant after trimming outliers. The log per capita
consumption results suggest increases of approximately 9-10 percent; just one-third the increase
in per capita income. This is consistent with some of the additional income being saved, and we
see the flow savings per capita has an increase approximately equal to the baseline mean – that
is, households double their savings. In Vanuatu, semi-annual per capita expenditure is
approximately 12,000-13,000 vatu higher, relative to a baseline of 65,000 vatu, and the effect on
log expenditure is equivalent to approximately a 28 percent increase. The increase in savings of
15,000-30,000 vatu is equal to a doubling or tripling of baseline savings rates. Of particular note
is that the point estimates for expenditures are smaller with fixed effects than with difference-in-
differences in Vanuatu, which may reflect attenuation bias due to measurement error.14
Finally, Table 3 also shows little change in household size as a result of participating in the
RSE – the only marginally significant changes come from the fixed effects specification in
Vanuatu. This is consistent with our direct questions, in which few households reported changing
household composition as an adjustment mechanism to cope with absent RSE workers.
14
The Vanuatu data are considerably noisier than the Tongan data; the baseline coefficient of variation of per capita
income for the RSE households is 0.90 in Tonga compared to 1.40 in Vanuatu, while the correlation in per capita
income from one wave to the next for the non-RSE households varies from 0.43 to 0.77 in Tonga, compared to
between 0.19 and 0.27 in Vanuatu. There is thus more signal relative to noise in the Tongan data than in the Vanuatu
data.
17
The median after-tax income earned in New Zealand reported by the seasonal migrants is
approximately NZ$12,000.15
This is several multiples of mean annual household income per
capita of RSE households at baseline; of about NZ$1400 in Tonga and NZ$2500 in Vanuatu.
Despite the large increase in income from the RSE, one might then ask why the increase in per
capita incomes is “only” 35 percent. First, workers face costs in New Zealand, both from living
expenses (including rent and health insurance) and from repaying their share of the airfare. From
the NZ$12,000 in income, the average worker remitted or brought back with them an average of
NZ$5,500; half remitted and half repatriated for Tongans but just 10 percent in the form of
remittances and 90 percent as repatriated savings for Vanuatu. Second, when we consider per
capita income, this amount is divided by 5.7 in Tonga and 4.7 in Vanuatu. Third, we are looking
at average impacts over 2 years, so since just over half the households sent a worker in one year
only, the per capita per year effect for these households has to be divided by two. Finally,
households also lose both the wage income and contribution to agricultural production the
household member would have contributed while in New Zealand. Working through the above
calculations, NZ$5,500 in remittances and repatriated savings for 1.5 years of participation
equates to a 550 pa‟anga semi-annual per capita income increase in Tonga, compared to the 250-
350 pa‟anga increase in semi-annual per-capita income seen in Table 3; and to 32,000 vatu semi-
annual per capita increase in Vanuatu, compared to the 18,000-48,000 vatu increase measured in
Table 3. They are thus of the same order of magnitude, with differences between the estimated
impact and the impact calculated from wages and remittances reflecting the opportunity cost of
labor that the migrant would have provided (as well as approximation error).
Nevertheless, the gain in income (equivalent to US$260 per-capita per annum in Tonga and
US$860 per capita per annum in Vanuatu) still dwarfs other popular development interventions
which have struggled to generate large gains in income. For example, Banerjee et al. (2010) find
no increase in average per capita income or expenditure from a microfinance expansion;
conditional cash transfer programs in Nicaragua and Mexico (involving the government giving
transfers rather than providing a means to generate income) have increased per capita incomes by
only US$20-40 (Fiszbein and Schady, 2009); grants to microenterprise owners in Sri Lanka (de
Mel et al, 2008) and Ghana (Fafchamps et al, 2011) increased microenterprise incomes for male
15
This number accords well with what migrants should have been earning given prevailing wage rates in the sector.
18
owners at least, but per capita income gains are in the order of approximately US$20 per year;
and recent business training programs for microenterprises have some effects on revenues in bad
months, but no significant impacts on average incomes (Karlan and Valdivia, 2011; Drexler et al,
2011). Bryan et al. (2011) examine the impact of grants and loans to induce seasonal internal
migration during the hungry season in Bangladesh, and find large percentage increases in per-
capita consumption from a small base, so monthly per-capita consumption increases US$5 in the
hungry season. Compared with all these other interventions, the gains from international seasonal
emigration are enormous, especially considering this intervention involves removing a policy
distortion and so apart from set-up costs, is free, whereas the others require taxes or aid to fund.
5.2 Impact on Subjective Well-being
In addition to measuring household welfare through income and expenditure, our final round
survey measured subjective well-being. This addresses the second view of development impact
discussed above, that we should look at broader measures than income. One adult per household
(the one with the next birthday) was asked to imagine a 10-step ladder, where on the bottom step
were the poorest people and the top step the richest people, and to state which step they thought
their household was on today, and on which step they were on two years ago. Ravallion and
Lokshin (2001) refer to this as an economic ladder question, and note that it leaves it up to the
individual to define what constitutes “poor” or not, and captures subjective economic welfare.
We estimate equation (3) without including baseline subjective wellbeing as a control since
it is only measured ex post. The results are shown in the first row of Table 4.16
In Tonga,
participating in the RSE is estimated to increase subjective welfare by 0.43 steps on the ladder,
about 45 percent of a standard deviation. This effect is strongly significant. Adding the
household‟s recalled subjective well-being from two years earlier only slightly reduces this
coefficient, to 0.36 for the PS-2 screened group, and is still strongly significant (p<0.001).
Participating in the RSE is estimated to increase subjective welfare by 0.71-0.83 steps on the
ladder in Vanuatu, which is 43-50 percent of a standard deviation and strongly significant.
Adding the household‟s recalled subjective well-being from two years earlier does not change
these results, with coefficients in the 0.74-0.85 range and again strong significance (p<0.001).
Subjective economic welfare has therefore risen in both countries for households participating in
16
Table 4 just shows the PS-1 and PS-2 screened results for reasons of space. The results using the full sample are
similar both in terms of magnitudes and statistical significance.
19
the RSE. Moreover, the increase in subjective welfare is of similar magnitude in terms of
standard deviations as the increases in income: the estimated impacts on per capita income in
tables 2 and 3 translate to a 0.24-0.43 standard deviation increase in per capita income in Tonga,
and 0.31-0.47 standard deviation increase in per capita income in Vanuatu.
A potential concern here would be if the increased income of migrant households lowered
subjective wellbeing of non-migrant households due to relative consumption comparisons.
However, subjective well-being did not fall in either country for the control group: in Tonga the
PS-1 control group had essentially stable subjective well-being (4.30 in wave 4, with a recall of
4.26 for two years earlier); in Vanuatu subjective well-being has risen slightly for the PS-1
control group (4.62 in wave 4, with a recall of 3.62 to two years earlier). As a result we do not
believe our results to be the result of negative spillover impacts on the control group.
5.3 Impact on Dwelling Improvements and Durable Assets
The second row of Table 4 shows Tongan households participating in the RSE were 10 to 11
percentage points more likely to make a dwelling improvement over the period of our surveys;
almost double the rate for non-RSE households. Home improvements were the most commonly
mentioned main use of money from the RSE in Vanuatu but the point estimates suggest that RSE
households were just 7-8 percentage points more likely to make dwelling improvements, which
is only marginally significant. Renovations are reported to be much more commonplace in
Vanuatu than in our Tongan survey, with 79 percent of non-RSE households making a dwelling
improvement over the two years of our surveys.17
The impact of the RSE may also then be for
households to make more substantive changes, such as the transition from traditional to modern
dwellings, which our surveys don‟t capture since dwelling type was only recorded at baseline.
In the baseline survey, 65 percent of Tongan RSE households reported having a bank
account. By the fourth round this had increased to 83 percent. This represents a statistically
significant 10-14 percentage point increase relative to non-RSE households over the two year
period (Table 4, row 3). This increase in bank account usage likely reflects bank accounts being
set up for the purpose of household savings, rather than bank accounts directly being used to
receive remittances. For the Tongan sample, over 90 percent of remittances were made via
money transfer operators that did not require a bank account. In Vanuatu we find the share of
17
This reflects the much higher proportion of households living in traditional (bush material) dwellings in Vanuatu,
which have short life expectancy compared with modern dwellings.
20
RSE households with a bank account increasing from 55 percent in the baseline to 74 percent
two years later. This is estimated to be a statistically significant 17-18 percentage point increase
relative to the non-RSE households over the same period. As in Tonga, it is likely that this
increase in household bank account usage reflects the use of banks for savings, rather than just to
receive remittances.
Each follow-up round asked if the household had made any major purchase (200 pa‟anga or
more in Tonga or 10,000 vatu or more in Vanuatu) of assets since the last survey. Row 4 of
Table 4 shows that Tongan RSE households were 12-15 percentage points more likely to have
made such a purchase; double the rate of non-RSE households. Ni-Vanuatu RSE households
were 27-30 percent more likely to have made such a purchase, which more than doubles the 20
percent of non-RSE households making such a purchase. In both countries the impact is
statistically significant.
In addition to households purchasing assets, RSE workers sometimes returned with durable
goods acquired abroad. DVD players were the most common such asset. Each round of the
survey also directly asked about ownership of certain durable goods, enabling us to capture the
net effect of purchases, sales, and durable goods that migrants bought back with them. The
Tongan RSE households are significantly more likely to have acquired a cellphone, television,
DVD player, and bicycle over the two-year period than similar non-RSE households (online
Appendix Table 3). The ni-Vanuatu RSE households are significantly more likely to have
acquired a radio or stereo, a DVD player, a computer, a gas or electric oven and a boat over the
two-year period than similar non-RSE households. We do not see any significant impact on
livestock ownership in either country.
If non-migrant households are benefiting from having other households in their village
participate in the RSE, we should expect them to accumulate more assets. The online appendix
examines durable asset changes in the control group, and concludes that there does not appear to
be large spillovers, with asset ownership largely stable over two years.
5.4 Impact on Children’s Education and Business Ownership
In addition to raising household incomes and assets, an important motive for many RSE
participants was the chance to raise money to pay for school fees. In our baseline survey 85
percent of Tongan RSE households and 98 percent of ni-Vanuatu RSE households said that
21
earning money to pay for school fees was a very important or somewhat important motive for
participating in the RSE. In addition, school fees are one of the most common earmarked
purposes for RSE remittance income reported in our surveys, and when asked in the final round
survey what the most important use of the money earned in the RSE has been, 40% of Tongans
and 28% of ni-Vanuatu said school expenses. The question is then whether this translates into
higher schooling attainment for children. Schooling attainment is also useful to examine as a
measure of whether parental absence is causing negative consequences on children.
Table 5 shows the impact of being in an RSE household on school attendance in the final
round survey, conditional on baseline school attendance status and age (equation 3). This is
carried out for children that were in the household at both baseline and follow-up – as we have
seen, household size and composition did not significantly change with RSE participation.
In Tonga, schooling is compulsory from age 6 to 15, and there is near universal school
enrolment for children of these ages. It is therefore no surprise that we see no impact of the RSE
on children aged 6 to 14 at baseline since over 97 percent of them are attending school whether
or not their household is in the RSE. In contrast, the last three columns of panel A show large
positive effects of the RSE on school attendance of youth (15 to 18 years). These effects are
statistically significant for the full sample and PS-1 samples, and of similar magnitude but not
significant in the smaller PS-2 sample (which has less power).18
The magnitude of the effect is
sizeable – a 10 to 14 percentage point increase in the proportion attending school, relative to 60
percent of youth in non-RSE households attending school on average over this two year period.
In contrast, panel B shows no significant effect of the RSE on school attendance in Vanuatu.
One reason may be that starting in 2010, when the final round survey was in the field, primary
schooling became fully subsidized whereas previous fees were 7000 vatu per year (10 percent of
per capita average income). Moreover, many schools had allowed students to remain enrolled
even with unpaid fees from previous years; the main incentive to clearing these debts was to
allow students to sit the leaving examinations at the end of Grade 6 and 8. Hence, RSE workers
reporting the payment of school fees as a motivation may have repaying school fee debts, which
would not show up in current enrolment except for a possibly higher transition rate to high
school (which also depends on examination performance).
18
Moreover, pooling attendance rates over all survey waves, the average impact of the RSE on attendance over the
two years is positive and significant even in the PS-2 sample in Tonga (coefficient of 0.19, standard error of 0.10).
22
The apparently divergent impacts of RSE participation on school enrolment also may reflect
the nature of the selection into the RSE in the two countries. In Vanuatu, the households in the
RSE are relatively better off, and their children have higher baseline school attendance rates than
non-RSE households. It is therefore possible that credit constraints were not limiting schooling
for this group. In contrast, Tongan RSE households were relatively poorer at baseline than non-
RSE households, with lower school attendance rates. The extra income earned through the RSE
allows them to then catch-up to (and surpass) the school attendance rates of the non-RSE group.
Our data do not show any evidence that the RSE has fostered the development of non-
agricultural businesses among the households in our sample in Tonga. None of the households
surveyed mentioned investment in a business as a main use of the money earned in the RSE, and
we do not observe any individuals in RSE households starting a new business over the two year
period of our surveys. In Vanuatu we only had 5 households in the round 4 survey say the most
important use of the money earned through the RSE was starting a business or supporting an
existing business. Given the low population densities and small local markets, it is not clear what
the scope for such business start-ups actually is, but over the first two years of the RSE policy,
there does not appear to be much evidence of it fostering self-employment. Indeed the recent
Pacific Futures report (World Bank, 2011) cites small market sizes and long distances to other
markets as reasons Pacific Island economies are unlikely to have much firm growth.
Our surveys do not directly measure agricultural production techniques or other work skills.
However, there are reasons to believe that to date the RSE is unlikely to have had a major impact
on the productivity of workers on their own farms. The crops tended to in New Zealand (apples,
grapes, kiwifruit) are different from those grown in the Pacific Islands (e.g. bananas, yams,
cassava, squash), and the climate and soil conditions are also vastly different. Our surveys asked
return workers directly if they had learnt any new skills, with the main one workers mentioned
being how to prune plants – something important in the New Zealand fruit industries, but not for
the crops they produce. Absent any short-run evidence on purchases of live-stock or farm
machinery, it therefore seems unlikely home production skills or technology have improved
dramatically from participation in this program.
6. Community-level and Country-level Impacts
23
Finally we consider the broader impacts of the RSE on the sending communities. The most
direct impact is through the monetary contribution that migrants make to their communities,
either through remitting to a community group while abroad or contributing some of their
repatriated earnings to this group upon return. We asked return migrants how much they had
contributed in this way to the community. The mean response aggregated over the two years was
157 pa‟anga in Tonga and 11733 vatu in Vanuatu – or approximately US$80-130 per migrant.
Our expenditure module also collected expenditure on community obligations, but only for a
recall period of one month, thereby likely missing one-off contributions made by migrants upon
return. The difference-in-differences regression then gives a positive, but insignificant impact on
this item.
To further gauge the impacts at the community level, we conducted surveys of community
leaders. This was done at baseline and at the time of the second round survey in Vanuatu, and at
baseline and at the times of the third and fourth round surveys in Tonga. These data are thus less
useful for Vanuatu, since they only measure immediate effects while most workers were still
away. The Tongan surveys reveal the mean (median) community saying it received 633 (500)
pa‟anga from RSE workers, which is consistent with the household surveys, given a median of
five workers per village participating coupled with the amounts reported by workers. The main
use of this fund in 83% of cases in Tonga was funding the village water supply in the first year.
In the second year, villages were also using this for street lighting, a school scholarship fund,
community halls, and in one case, adding internet to a community hall.
Village leaders were directly asked the main benefit and main disadvantages of the RSE for
their community. In Vanuatu this was only asked in wave 2, 6 months into the RSE. The main
benefits reported at this stage were job opportunities for people in the village, money to support
the village church, and improvements in housing. Disadvantages were less people to do the
community work, cases where a worker is not contributing to church or family, and concerns
about the potential bad influence of alcohol abroad. In Tonga these questions were asked in
waves 3 and 4, approximately one year and two years into the RSE. The main benefit reported at
one year is income for families, along with some saying income for the community and church
donations. After two years, there are also a few mentions of improved skills and improved
English in the workers, and positive impacts on school enrolments. When asked the main
24
disadvantage, at one year, more than half say none, the main other answer being family
separation. At two years, one-third say family separation, 30 percent say less labor for village,
church, and community projects, about 15 percent say fewer members for church activities.
Online Appendix Table 5 summarizes the results of questions in both the household and
community leader surveys intended to measure qualitatively the impressions of the broader
community-level impacts of the RSE. The RSE workers themselves believe that participation in
the RSE either improved or left unchanged their family and community life. Non-RSE
households in Tonga also see benefits in terms of community life, availability of paid jobs19
, and
schooling opportunities. To the extent that such benefits are really accruing to non-RSE
households, our estimates comparing RSE to non-RSE households will be a lower bound on the
positive development impact of the RSE program. Non-RSE households in Vanuatu are more
likely than those in Tonga to say there has been no change in community life or in job or
schooling opportunities. Finally, community leaders were asked their assessment of the overall
impact of the RSE on their communities. In Tonga 92 percent of leaders say that it has had
positive effects after two years, and in Vanuatu, even at 6 months, 72 percent of leaders say the
overall impact is positive.
Finally, Table 6 shows that the overall development impact of the RSE program is important
for Tonga and Vanuatu. We take the per worker estimates of the average impact of the program
on household income over the first two years and scale up by the total number of workers hired
from each country to get total positive development impacts of $NZ5.3 million in Tonga and
$NZ9.7 million in Vanuatu. This amount is equivalent to 42-47 percent of total annual bilateral
aid from New Zealand to these countries, and is still non-trivial when compared to bilateral aid
from Australia, the other main donor. Moreover, this aggregate development impact of the RSE
program is equivalent to almost 50% of annual export earnings for Tonga and 25% of annual
export earnings for Vanuatu.
7. Conclusions
New Zealand‟s Recognised Seasonal Employer program was designed with promoting
development in the Pacific Islands as an explicit goal. The results of our multi-year prospective
19
Although our impression is that this response refers largely to the availability of paid jobs in New Zealand for
members of the community, rather than more jobs in the village.
25
impact evaluation show that it has largely achieved this goal. We consider three views of
development impact and find evidence to support impacts under each view. Under a narrow view
of impact as increasing household incomes, we find the RSE led to sizeable increases in income
in both Tonga and Vanuatu. Under a broader utility-based view of development, we find
subjective standards of living have improved, households are spending more, and community
leaders view the policy as having an overall positive impact. Finally, under a view that what
matters is whether the income gained from this program is spent or invested in ways that will
continue to benefit the household in the longer-term, we find increases in household durable
asset accumulation, increases in savings, and in Tonga, some evidence that it improved child
school attendance for older children. However, we do not find evidence for increased self-
employment, nor that there has been substantial accumulation of skills that can increase home
productivity. This reflects the limited market sizes in the participating countries, and is consistent
with the viewpoint that migration is likely to be a long-term part of the economic organization of
Pacific Island economies (World Bank, 2011).
These results make this seasonal migration program one of the most effective development
interventions for which rigorous evaluations are available. In addition, although there has been
non-trivial investment by both the New Zealand and Pacific Governments in the set-up phase, it
does not involve grants, and appears to be benefiting both the private employers and the workers.
The design features of the program and the low rate of overstaying have already led to this policy
being heralded as international best practice. The large development impacts seen here should
further foster the case for other countries to consider similar policies.
Nevertheless, there are several caveats to these conclusions. The first is that development is
a long-term process, and some of the effects of the RSE may only materialize over many years of
community involvement. These could include positive effects such as greater asset-building,
investments and skill development if workers return for many seasons, as well as potential
longer-term negative effects of continual absence of family members on family and community
relations. Secondly, while the gains to households from this seasonal migration are large, they
still pale in comparison to the gains from permanent international migration (Clemens et al,
2008; McKenzie et al, 2010). A key policy issue is therefore the extent to which seasonal
migration can or cannot eventually open up avenues for permanent migration.
26
References
Angrist, Joshua and John Johnson (2000) “Effects of work-related absences on families:
Evidence from the Gulf War”, Industrial and Labor Relations Review 54(1): 41-58.
Angrist, Joshua and Jörn-Steffen Pischke (2009) Mostly Harmless Econometrics: An
Empiricist’s Companion. Princeton University Press, Princeton, NJ.
Banerjee, Abhijit, Esther Duflo, Rachel Glennerster and Cynthia Kinnan (2010) “The miracle of
microfinance? Evidence from a randomized evaluation”, Mimeo. MIT.
Basok, Tanya (2000) “Migration of Mexican seasonal farm workers to Canada and development:
Obstacles to productive investment”, International Migration Review 34(1): 79-97.
Borjas, George (2007) “A Lemon in the Senate: The immigration deal is a travesty of a mockery
of a sham”, National Review Online May 17.
http://www.hks.harvard.edu/fs/gborjas/Papers/A%20Lemon%20in%20the%20Senate,%20NR
O.pdf (accessed August 11, 2010).
Bryan, Gharad, Shyamal Chowdhury, and Mushfiq Mobarak (2011) “Seasonal migration and
risk aversion”, Mimeo. Yale School of Management.
Clemens, Michael, Claudio Montenegro and Lant Pritchett (2008) “The Place Premium: Wage
Differences for Identical Workers across the U.S. Border”, Center for Global Development
Working Paper no. 148.
Crump, Richard, V. Joseph Hotz, Guido Imbens and Oscar Mitnik (2009) “Dealing with limited
overlap in estimation of average treatment effects”, Biometrika 96(1): 187-99.
Dehejia, Rajeev (2005) “Practical propensity score matching: A reply to Smith and Todd”,
Journal of Econometrics 125: 355-64.
De Mel, Suresh, David McKenzie, and Christopher Woodruff (2008) “Returns to capital in
microenterprises: Evidence from a field experiment”, Quarterly Journal of Economics 123(4):
1329-72.
Drexler, Alejandro, Greg Fischer and Antoinette Schoar (2011) “Keeping it simple: Financial
Literacy and Rule of Thumbs”, mimeo. LSE.
Dunn, Lucia F. (2003) “Is combat pay effective? Evidence from operation desert storm”, Social
Science Quarterly 84(2): 344-58.
Fafchamps, Marcel, David McKenzie, Simon Quinn and Christopher Woodruff (2011) “Female
microenterprises and the fly-paper effect: Evidence from a randomized experiment in Ghana”,
Mimeo. World Bank
Fiszbein, Ariel and Norbert Schady (2009) “Conditional Cash Transfers: Reducing Present and
Future Poverty”, World Bank Policy Research Report. World Bank: Washington D.C.
Gibson, John, David McKenzie and Halahingano Rohorua (2008) “How pro-poor is the selection
of seasonal migrant workers from Tonga under New Zealand‟s Recognised Seasonal
Employer (RSE) program?”, Pacific Economic Bulletin 23(3): 187-204.
Global Commission on International Migration (GCIM) (2005) Migration in an interconnected
world: New directions for action. The Global Commission on International Migration.
www.gcim.org.
Hanson, Gordan (2009) “The Economic Consequences of the International Migration of Labor”,
Annual Review of Economics 1: 179-207.
House of Commons International Development Committee (2004) Migration and Development:
How to make migration work for poverty reduction. House of Commons,
27
http://www.publications.parliament.uk/pa/cm200304/cmselect/cmintdev/79/79.pdf (accessed
August 11, 2010).
Karlan, Dean, and Martin Valdivia (2011) “Teaching Entrepreneurship: Impact of Business
Training on Microfinance Institutions and Clients” Review of Economics and Statistics, 93(2):
510-27.
Lee, David (2009) “Training, Wages, and Sample Selection: Estimating Sharp Bounds on
Treatment Effects”, Review of Economic Studies 76(3): 1071-1102.
Lyle, David (2006) “Using Military Deployments and Job Assignments to Estimate the Effect of
Parental Absences and Household Relocations on Children‟s Academic Achievement”,
Journal of Labor Economics 24(2): 319-50.
Macours, Karen and Renos Vakis (2010) “Seasonal Migration and Early Childhood
Development”, World Development 38(6): 857-69.
McKenzie, David (2012) “Beyond Baseline and Follow-up: The Case for more T in
Experiments”, Journal of Development Economics 99(2): 210-221.
McKenzie, David, John Gibson and Steven Stillman (2010) “How Important is Selection?
Experimental Vs. Non-Experimental Measures of the Income Gains from Migration”, Journal
of the European Economic Association 8(4): 913-45.
McKenzie, David, Pilar García Martinez and L. Alan Winters (2008) “Who is coming from
Vanuatu to New Zealand under the new Recognised Seasonal Employer (RSE) program?”,
Pacific Economic Bulletin 23(3): 205-28.
New Zealand Department of Labour (2010) Final Evaluation Report of the Recognised Seasonal
Employer Policy (2007-2009). Department of Labour, Wellington.
http://dol.govt.nz/publications/research/rse-evaluation-final-report/rse-final-evaluation.pdf
(accessed August 12, 2010).
OECD (2008) International Migration Outlook – SOPEMI -2008. OECD: Paris.
Paxson, Christina (1992) “Using Weather Variability to Estimate the Response of Savings to
Transitory Income in Thailand”, American Economic Review 82(1): 15-33.
Pritchett, Lant (2006) Let Their People Come: Breaking the Gridlock on Global Labor Mobility.
Center for Global Development: Washington, D.C.
Ramasamy, Sankar, Vasantha Krishnan, Richard Bedford and Charlotte Bedford (2008) “The
Recognised Seasonal Employer policy: seeking the elusive triple wins for development
through international migration”, Pacific Economic Bulletin 23(3): 171-186.
Ravallion, Martin and Michael Lokshin (2001) “Identifying Welfare Effects from Subjective
Questions”, Economica 68(271): 335-57.
Rodrik, Dani (2007) “Be our guest”, New York Times Op-ed, June 1, 2007.
http://www.nytimes.com/2007/06/01/opinion/01rodrik.html (accessed August 11, 2010).
Ruhs, Martin (2006) “The potential of temporary migration programmes in future international
migration policy”, International Labour Review, 145(1-2): 7-35.
Southern Poverty Law Center (2007) Close to Slavery: Guestworker Programs in the United
States. Montgomery, AL: Southern Poverty Law Center.
United Nations (UN) (2004) World Economic and Social Survey. United Nations: New York.
Winters, L. Alan, Terrie Walmsley, Wang Zhen Kun and Roman Grynberg (2003) Liberalizing
Temporary Movement of Natural Persons; An Agenda for the Development Round, World
Economy 26 (8): 1137-1161.
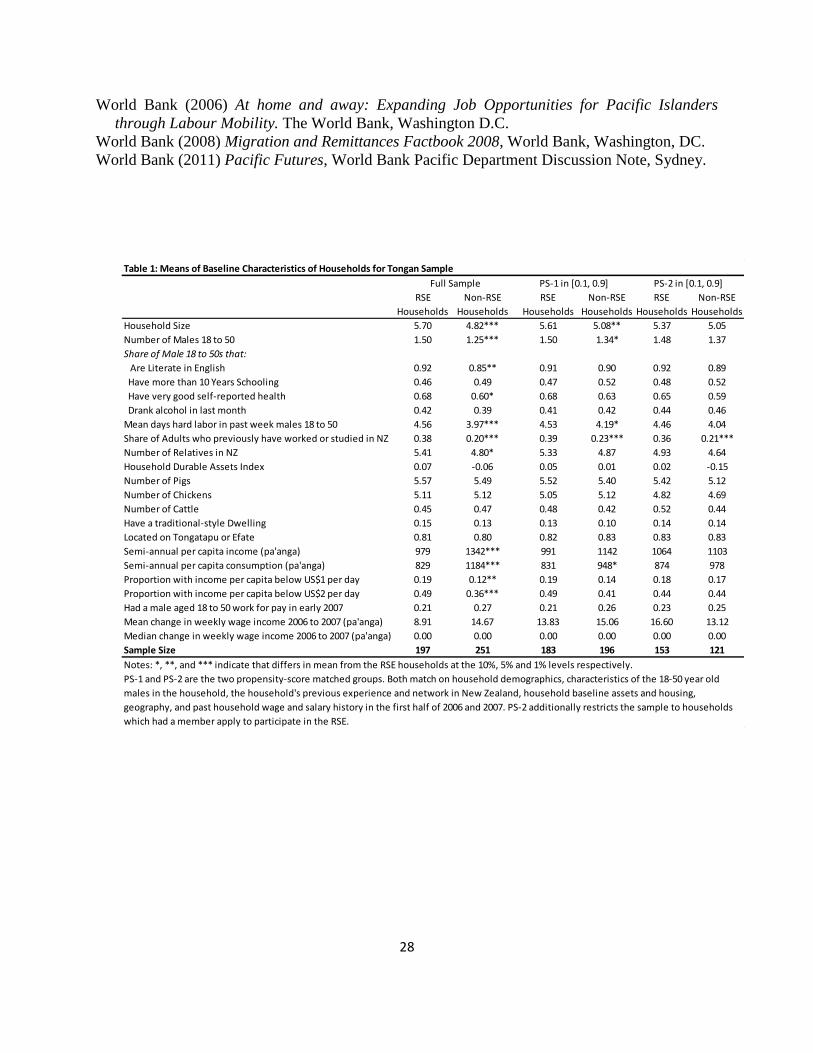
28
World Bank (2006) At home and away: Expanding Job Opportunities for Pacific Islanders
through Labour Mobility. The World Bank, Washington D.C.
World Bank (2008) Migration and Remittances Factbook 2008, World Bank, Washington, DC.
World Bank (2011) Pacific Futures, World Bank Pacific Department Discussion Note, Sydney.
Table 1: Means of Baseline Characteristics of Households for Tongan Sample
RSE Non-RSE RSE Non-RSE RSE Non-RSE
Households Households Households Households Households Households
Household Size 5.70 4.82*** 5.61 5.08** 5.37 5.05
Number of Males 18 to 50 1.50 1.25*** 1.50 1.34* 1.48 1.37
Share of Male 18 to 50s that:
Are Literate in English 0.92 0.85** 0.91 0.90 0.92 0.89
Have more than 10 Years Schooling 0.46 0.49 0.47 0.52 0.48 0.52
Have very good self-reported health 0.68 0.60* 0.68 0.63 0.65 0.59
Drank alcohol in last month 0.42 0.39 0.41 0.42 0.44 0.46
Mean days hard labor in past week males 18 to 50 4.56 3.97*** 4.53 4.19* 4.46 4.04
Share of Adults who previously have worked or studied in NZ 0.38 0.20*** 0.39 0.23*** 0.36 0.21***
Number of Relatives in NZ 5.41 4.80* 5.33 4.87 4.93 4.64
Household Durable Assets Index 0.07 -0.06 0.05 0.01 0.02 -0.15
Number of Pigs 5.57 5.49 5.52 5.40 5.42 5.12
Number of Chickens 5.11 5.12 5.05 5.12 4.82 4.69
Number of Cattle 0.45 0.47 0.48 0.42 0.52 0.44
Have a traditional-style Dwelling 0.15 0.13 0.13 0.10 0.14 0.14
Located on Tongatapu or Efate 0.81 0.80 0.82 0.83 0.83 0.83
Semi-annual per capita income (pa'anga) 979 1342*** 991 1142 1064 1103
Semi-annual per capita consumption (pa'anga) 829 1184*** 831 948* 874 978
Proportion with income per capita below US$1 per day 0.19 0.12** 0.19 0.14 0.18 0.17
Proportion with income per capita below US$2 per day 0.49 0.36*** 0.49 0.41 0.44 0.44
Had a male aged 18 to 50 work for pay in early 2007 0.21 0.27 0.21 0.26 0.23 0.25
Mean change in weekly wage income 2006 to 2007 (pa'anga) 8.91 14.67 13.83 15.06 16.60 13.12
Median change in weekly wage income 2006 to 2007 (pa'anga) 0.00 0.00 0.00 0.00 0.00 0.00
Sample Size 197 251 183 196 153 121
Notes: *, **, and *** indicate that differs in mean from the RSE households at the 10%, 5% and 1% levels respectively.
PS-1 and PS-2 are the two propensity-score matched groups. Both match on household demographics, characteristics of the 18-50 year old
males in the household, the household's previous experience and network in New Zealand, household baseline assets and housing,
geography, and past household wage and salary history in the first half of 2006 and 2007. PS-2 additionally restricts the sample to households
which had a member apply to participate in the RSE.
Full Sample PS-1 in [0.1, 0.9] PS-2 in [0.1, 0.9]
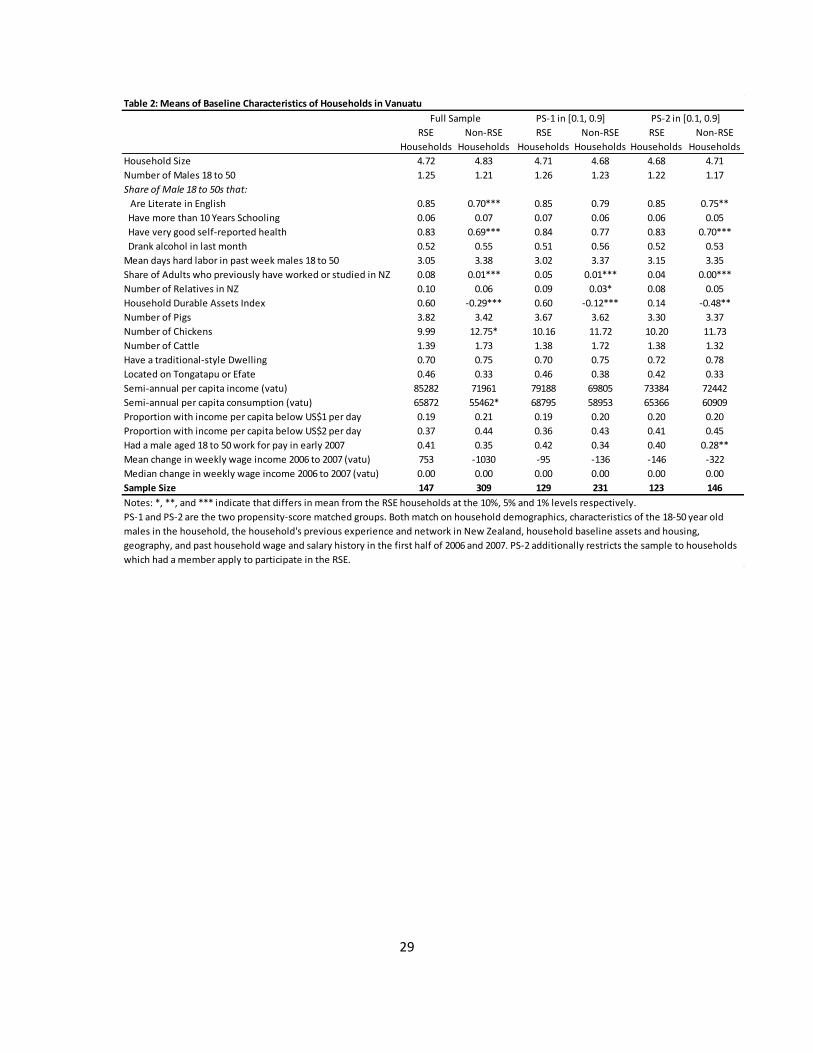
29
Table 2: Means of Baseline Characteristics of Households in Vanuatu
RSE Non-RSE RSE Non-RSE RSE Non-RSE
Households Households Households Households Households Households
Household Size 4.72 4.83 4.71 4.68 4.68 4.71
Number of Males 18 to 50 1.25 1.21 1.26 1.23 1.22 1.17
Share of Male 18 to 50s that:
Are Literate in English 0.85 0.70*** 0.85 0.79 0.85 0.75**
Have more than 10 Years Schooling 0.06 0.07 0.07 0.06 0.06 0.05
Have very good self-reported health 0.83 0.69*** 0.84 0.77 0.83 0.70***
Drank alcohol in last month 0.52 0.55 0.51 0.56 0.52 0.53
Mean days hard labor in past week males 18 to 50 3.05 3.38 3.02 3.37 3.15 3.35
Share of Adults who previously have worked or studied in NZ 0.08 0.01*** 0.05 0.01*** 0.04 0.00***
Number of Relatives in NZ 0.10 0.06 0.09 0.03* 0.08 0.05
Household Durable Assets Index 0.60 -0.29*** 0.60 -0.12*** 0.14 -0.48**
Number of Pigs 3.82 3.42 3.67 3.62 3.30 3.37
Number of Chickens 9.99 12.75* 10.16 11.72 10.20 11.73
Number of Cattle 1.39 1.73 1.38 1.72 1.38 1.32
Have a traditional-style Dwelling 0.70 0.75 0.70 0.75 0.72 0.78
Located on Tongatapu or Efate 0.46 0.33 0.46 0.38 0.42 0.33
Semi-annual per capita income (vatu) 85282 71961 79188 69805 73384 72442
Semi-annual per capita consumption (vatu) 65872 55462* 68795 58953 65366 60909
Proportion with income per capita below US$1 per day 0.19 0.21 0.19 0.20 0.20 0.20
Proportion with income per capita below US$2 per day 0.37 0.44 0.36 0.43 0.41 0.45
Had a male aged 18 to 50 work for pay in early 2007 0.41 0.35 0.42 0.34 0.40 0.28**
Mean change in weekly wage income 2006 to 2007 (vatu) 753 -1030 -95 -136 -146 -322
Median change in weekly wage income 2006 to 2007 (vatu) 0.00 0.00 0.00 0.00 0.00 0.00
Sample Size 147 309 129 231 123 146
Notes: *, **, and *** indicate that differs in mean from the RSE households at the 10%, 5% and 1% levels respectively.
PS-1 and PS-2 are the two propensity-score matched groups. Both match on household demographics, characteristics of the 18-50 year old
males in the household, the household's previous experience and network in New Zealand, household baseline assets and housing,
geography, and past household wage and salary history in the first half of 2006 and 2007. PS-2 additionally restricts the sample to households
which had a member apply to participate in the RSE.
Full Sample PS-1 in [0.1, 0.9] PS-2 in [0.1, 0.9]
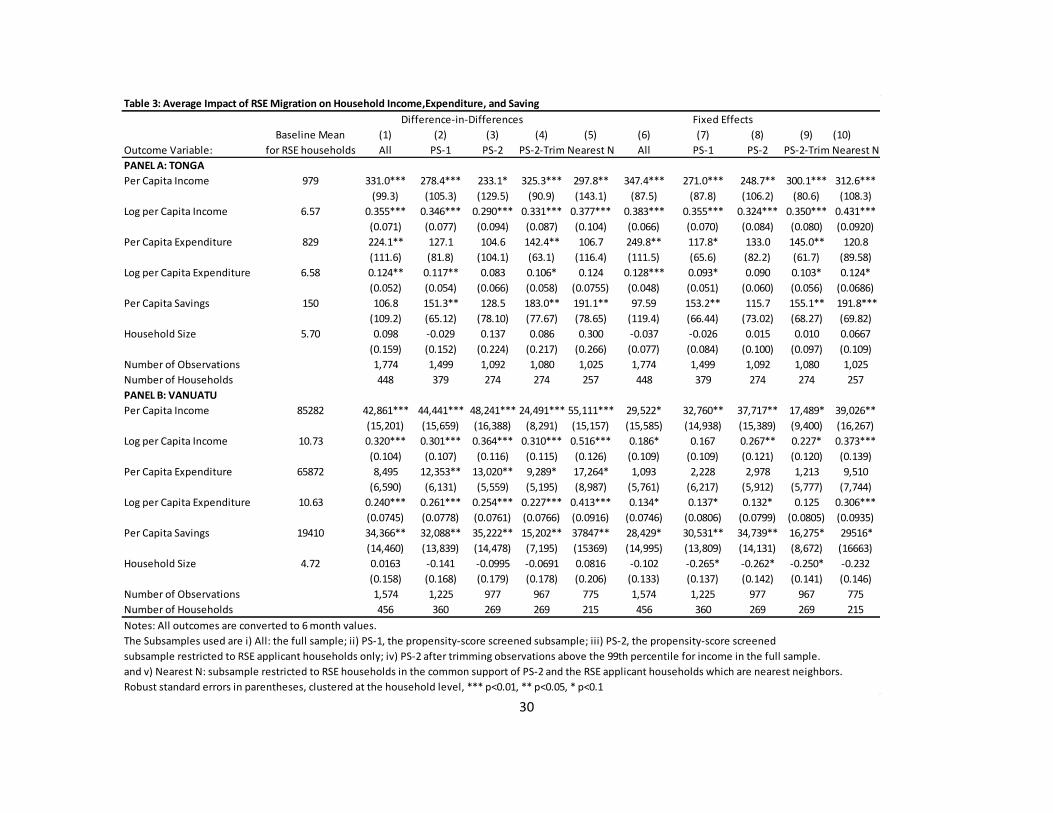
30
Table 3: Average Impact of RSE Migration on Household Income,Expenditure, and Saving
Baseline Mean (1) (2) (3) (4) (5) (6) (7) (8) (9) (10)
Outcome Variable: for RSE households All PS-1 PS-2 PS-2-Trim Nearest N All PS-1 PS-2 PS-2-Trim Nearest N
PANEL A: TONGA
Per Capita Income 979 331.0*** 278.4*** 233.1* 325.3*** 297.8** 347.4*** 271.0*** 248.7** 300.1*** 312.6***
(99.3) (105.3) (129.5) (90.9) (143.1) (87.5) (87.8) (106.2) (80.6) (108.3)
Log per Capita Income 6.57 0.355*** 0.346*** 0.290*** 0.331*** 0.377*** 0.383*** 0.355*** 0.324*** 0.350*** 0.431***
(0.071) (0.077) (0.094) (0.087) (0.104) (0.066) (0.070) (0.084) (0.080) (0.0920)
Per Capita Expenditure 829 224.1** 127.1 104.6 142.4** 106.7 249.8** 117.8* 133.0 145.0** 120.8
(111.6) (81.8) (104.1) (63.1) (116.4) (111.5) (65.6) (82.2) (61.7) (89.58)
Log per Capita Expenditure 6.58 0.124** 0.117** 0.083 0.106* 0.124 0.128*** 0.093* 0.090 0.103* 0.124*
(0.052) (0.054) (0.066) (0.058) (0.0755) (0.048) (0.051) (0.060) (0.056) (0.0686)
Per Capita Savings 150 106.8 151.3** 128.5 183.0** 191.1** 97.59 153.2** 115.7 155.1** 191.8***
(109.2) (65.12) (78.10) (77.67) (78.65) (119.4) (66.44) (73.02) (68.27) (69.82)
Household Size 5.70 0.098 -0.029 0.137 0.086 0.300 -0.037 -0.026 0.015 0.010 0.0667
(0.159) (0.152) (0.224) (0.217) (0.266) (0.077) (0.084) (0.100) (0.097) (0.109)
Number of Observations 1,774 1,499 1,092 1,080 1,025 1,774 1,499 1,092 1,080 1,025
Number of Households 448 379 274 274 257 448 379 274 274 257
PANEL B: VANUATU
Per Capita Income 85282 42,861*** 44,441*** 48,241*** 24,491*** 55,111*** 29,522* 32,760** 37,717** 17,489* 39,026**
(15,201) (15,659) (16,388) (8,291) (15,157) (15,585) (14,938) (15,389) (9,400) (16,267)
Log per Capita Income 10.73 0.320*** 0.301*** 0.364*** 0.310*** 0.516*** 0.186* 0.167 0.267** 0.227* 0.373***
(0.104) (0.107) (0.116) (0.115) (0.126) (0.109) (0.109) (0.121) (0.120) (0.139)
Per Capita Expenditure 65872 8,495 12,353** 13,020** 9,289* 17,264* 1,093 2,228 2,978 1,213 9,510
(6,590) (6,131) (5,559) (5,195) (8,987) (5,761) (6,217) (5,912) (5,777) (7,744)
Log per Capita Expenditure 10.63 0.240*** 0.261*** 0.254*** 0.227*** 0.413*** 0.134* 0.137* 0.132* 0.125 0.306***
(0.0745) (0.0778) (0.0761) (0.0766) (0.0916) (0.0746) (0.0806) (0.0799) (0.0805) (0.0935)
Per Capita Savings 19410 34,366** 32,088** 35,222** 15,202** 37847** 28,429* 30,531** 34,739** 16,275* 29516*
(14,460) (13,839) (14,478) (7,195) (15369) (14,995) (13,809) (14,131) (8,672) (16663)
Household Size 4.72 0.0163 -0.141 -0.0995 -0.0691 0.0816 -0.102 -0.265* -0.262* -0.250* -0.232
(0.158) (0.168) (0.179) (0.178) (0.206) (0.133) (0.137) (0.142) (0.141) (0.146)
Number of Observations 1,574 1,225 977 967 775 1,574 1,225 977 967 775
Number of Households 456 360 269 269 215 456 360 269 269 215
Notes: All outcomes are converted to 6 month values.
The Subsamples used are i) All: the full sample; ii) PS-1, the propensity-score screened subsample; iii) PS-2, the propensity-score screened
subsample restricted to RSE applicant households only; iv) PS-2 after trimming observations above the 99th percentile for income in the full sample.
and v) Nearest N: subsample restricted to RSE households in the common support of PS-2 and the RSE applicant households which are nearest neighbors.
Robust standard errors in parentheses, clustered at the household level, *** p<0.01, ** p<0.05, * p<0.1
Difference-in-Differences Fixed Effects
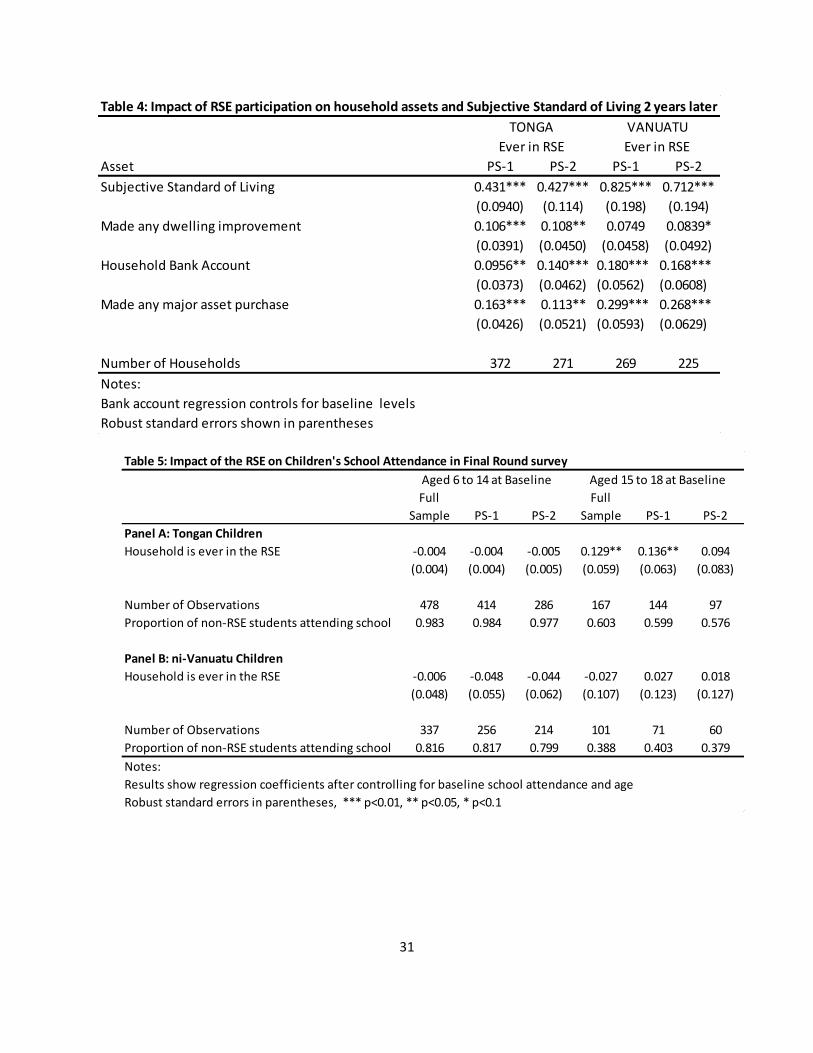
31
Table 4: Impact of RSE participation on household assets and Subjective Standard of Living 2 years later
Asset PS-1 PS-2 PS-1 PS-2
Subjective Standard of Living 0.431*** 0.427*** 0.825*** 0.712***
(0.0940) (0.114) (0.198) (0.194)
Made any dwelling improvement 0.106*** 0.108** 0.0749 0.0839*
(0.0391) (0.0450) (0.0458) (0.0492)
Household Bank Account 0.0956** 0.140*** 0.180*** 0.168***
(0.0373) (0.0462) (0.0562) (0.0608)
Made any major asset purchase 0.163*** 0.113** 0.299*** 0.268***
(0.0426) (0.0521) (0.0593) (0.0629)
Number of Households 372 271 269 225
Notes:
Bank account regression controls for baseline levels
Robust standard errors shown in parentheses
Ever in RSE
TONGA VANUATU
Ever in RSE
Table 5: Impact of the RSE on Children's School Attendance in Final Round survey
Full Full
Sample PS-1 PS-2 Sample PS-1 PS-2
Panel A: Tongan Children
Household is ever in the RSE -0.004 -0.004 -0.005 0.129** 0.136** 0.094
(0.004) (0.004) (0.005) (0.059) (0.063) (0.083)
Number of Observations 478 414 286 167 144 97
Proportion of non-RSE students attending school 0.983 0.984 0.977 0.603 0.599 0.576
Panel B: ni-Vanuatu Children
Household is ever in the RSE -0.006 -0.048 -0.044 -0.027 0.027 0.018
(0.048) (0.055) (0.062) (0.107) (0.123) (0.127)
Number of Observations 337 256 214 101 71 60
Proportion of non-RSE students attending school 0.816 0.817 0.799 0.388 0.403 0.379
Notes:
Results show regression coefficients after controlling for baseline school attendance and age
Robust standard errors in parentheses, *** p<0.01, ** p<0.05, * p<0.1
Aged 6 to 14 at Baseline Aged 15 to 18 at Baseline
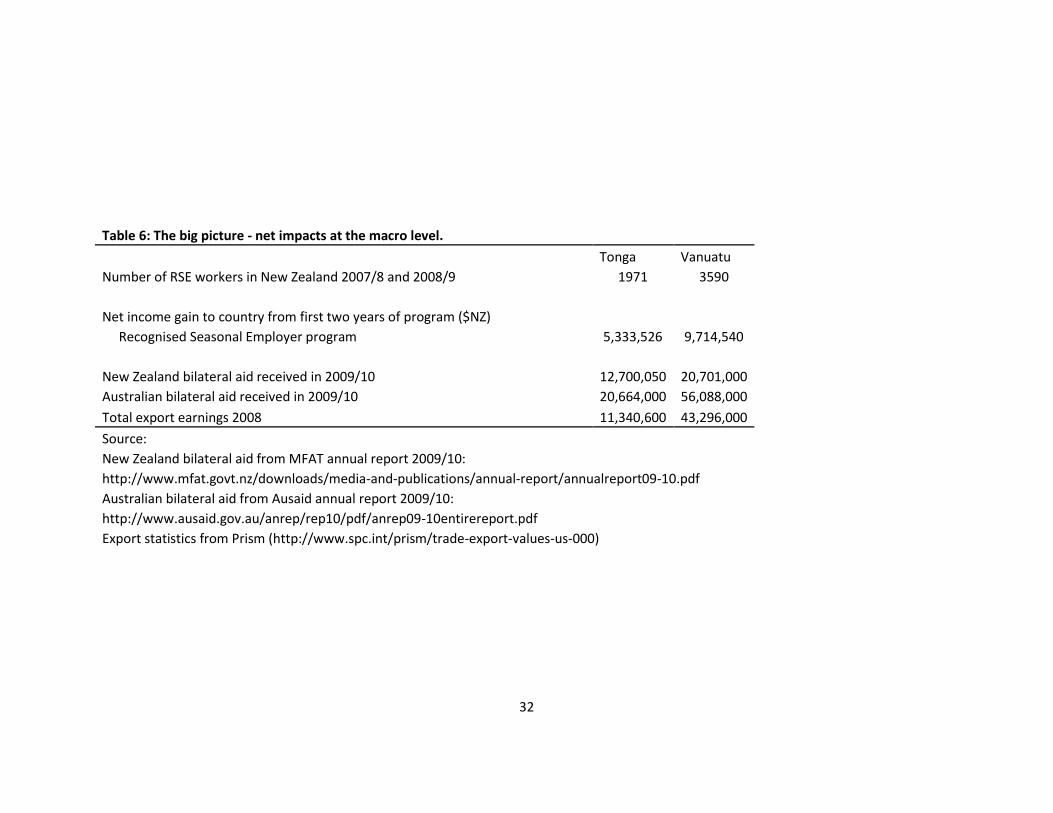
32
Table 6: The big picture - net impacts at the macro level.
Tonga Vanuatu
Number of RSE workers in New Zealand 2007/8 and 2008/9 1971 3590
Net income gain to country from first two years of program ($NZ)
Recognised Seasonal Employer program 5,333,526 9,714,540
New Zealand bilateral aid received in 2009/10 12,700,050 20,701,000
Australian bilateral aid received in 2009/10 20,664,000 56,088,000
Total export earnings 2008 11,340,600 43,296,000
Source:
New Zealand bilateral aid from MFAT annual report 2009/10:
http://www.mfat.govt.nz/downloads/media-and-publications/annual-report/annualreport09-10.pdf
Australian bilateral aid from Ausaid annual report 2009/10:
http://www.ausaid.gov.au/anrep/rep10/pdf/anrep09-10entirereport.pdf
Export statistics from Prism (http://www.spc.int/prism/trade-export-values-us-000)