Embed Size (px)
Citation preview

Online Help
Option SST Serial ATA and Serial Attached SCSI Analysis Module
077-0020-01 Adapted from Opt. SST Online Help
www.tektronix.com
Copyright © Tektronix. All rights reserved. Licensed software products are owned by Tektronix or its suppliers and are protected by United States copyright laws and international treaty provisions.
Tektronix products are covered by U.S. and foreign patents, issued and pending. Information in this publication supercedes that in all previously published material. Specifications and price change privileges reserved.
TEKTRONIX and TEK are registered trademarks of Tektronix, Inc. Option SST Serial ATA and Serial Attached SCSI Analysis Module Online Help.
Contacting Tektronix
Tektronix, Inc. 14200 SW Karl Braun Drive or P.O. Box 500 Beaverton, OR 97077 USA
For product information, sales, service, and technical support:
In North America, call 1-800-833-9200.
Worldwide, visit www.tektronix.com to find contacts in your area.

Warranty 9(b)
Tektronix warrants that the media on which this software product is furnished and the encoding of the programs on the media will be free from defects in materials and workmanship for a period of three (3) months from the date of shipment. If any such medium or encoding proves defective during the warranty period, Tektronix will provide a replacement in exchange for the defective medium. Except as to the media on which this software product is furnished, this software product is provided “as is” without warranty of any kind, either express or implied. Tektronix does not warrant that the functions contained in this software product will meet Customer’s requirements or that the operation of the programs will be uninterrupted or error-free.
In order to obtain service under this warranty, Customer must notify Tektronix of the defect before the expiration of the warranty period. If Tektronix is unable to provide a replacement that is free from defects in materials and workmanship within a reasonable time thereafter, Customer may terminate the license for this software product and return this software product and any associated materials for credit or refund.
THIS WARRANTY IS GIVEN BY TEKTRONIX IN LIEU OF ANY OTHER WARRANTIES, EXPRESS OR IMPLIED. TEKTRONIX AND ITS VENDORS DISCLAIM ANY IMPLIED WARRANTIES OF MERCHANTABILITY OR FITNESS FOR A PARTICULAR PURPOSE. TEKTRONIX’ RESPONSIBILITY TO REPLACE DEFECTIVE MEDIA OR REFUND CUSTOMER’S PAYMENT IS THE SOLE AND EXCLUSIVE REMEDY PROVIDED TO THE CUSTOMER FOR BREACH OF THIS WARRANTY. TEKTRONIX AND ITS VENDORS WILL NOT BE LIABLE FOR ANY INDIRECT, SPECIAL, INCIDENTAL, OR CONSEQUENTIAL DAMAGES IRRESPECTIVE OF WHETHER TEKTRONIX OR THE VENDOR HAS ADVANCE NOTICE OF THE POSSIBILITY OF SUCH DAMAGES.

Option SST Serial ATA and Serial Attached SCSI Analysis Module i
Table of Contents Introduction ............................................................................................. 1
Using Online Help..........................................................................................1
Related Documentation .................................................................................2
Conventions ....................................................................................................3
Updates through the Web Site ......................................................................5
Feedback.........................................................................................................5
Getting Started.........................................................................................8
About the Option SST Analysis Modules ....................................................8
Compatibility..................................................................................................8
Recommended Accessories............................................................................9
Recommended Accessories............................................................................9
Requirements and Restrictions.....................................................................9
Starting the Application ..............................................................................10
Maximizing and Minimizing the Application............................................10
Returning to the Application ......................................................................10
Exiting the Application................................................................................10
Application Directories and Usage .............................................................11
File Name Extensions...................................................................................12
Operating Basics ................................................................................... 14
Opt. SST Application View .........................................................................14
Application User Interface Items ...............................................................15
Serial ATA and SAS Measurements ..........................................................16
Menus............................................................................................................17
Menus .....................................................................................................17
File Menu ...............................................................................................18
Measurements Menu.............................................................................19
Results Menu .........................................................................................20
Utilities Menu.........................................................................................20
Help Menu..............................................................................................20
Saving and Recalling Files ....................................................................21
Table of Contents
Option SST Serial ATA and Serial Attached SCSI Analysis Module ii
Taking Measurements ................................................................................ 22
Setting Preferences ............................................................................... 22
Using a Limit File ................................................................................. 25
Control Panel ........................................................................................ 26
Sequence Mode ..................................................................................... 26
Acquiring Data...................................................................................... 27
Editing a Serial ATA Mask File .......................................................... 27
How To... .......................................................................................... 32
Set up the DUT ............................................................................................ 32
Methods to Test a DUT ........................................................................ 32
Test the Transmitter Host DUT using AWG Method....................... 33
Test the Transmitter Drive DUT using AWG Method ..................... 35
Test the Transmitter Host DUT using BIST FIS/User Method ....... 37
Test the Transmitter Drive DUT using BIST FIS/User Method...... 39
Test the Receiver Host DUT using AWG Method............................. 41
Test the Receiver Drive DUT using AWG Method ........................... 43
Test the Receiver Host DUT using BIST FIS/User Method ............. 45
Test the Receiver Drive DUT using BIST FIS/User Method............ 47
Select and Configure SATA Measurements ............................................. 49
Select SATA Measurements ................................................................ 49
Configure SATA Measurements ......................................................... 50
Enter Device Details ............................................................................. 54
Virtual Keyboard.................................................................................. 54
Virtual Keyboard - Text ...................................................................... 55
Set up the AWG .......................................................................................... 56
Perform SATA Tests for Transmitter....................................................... 57
Transmitter Measurements ................................................................. 57
Perform Transmitter Eye, Unit Interval, and Bit Rate Tests ................. 58
Perform Transmitter Differential Skew Test ........................................... 61
Perform Transmitter Rise and Fall Time Test......................................... 63
Perform Transmitter Differential Voltage Test ....................................... 66
Perform Transmitter AC CM Voltage Test.............................................. 71

Table of Contents
Option SST Serial ATA and Serial Attached SCSI Analysis Module
iii
Perform Transmitter COMINIT, COMWAKE, and COMRESET Tests73
Perform SATA Tests for Receiver..............................................................75
Receiver Measurements ........................................................................75
Perform Receiver Eye, Unit Interval, and Bit Rate Tests ........................75
Perform Receiver Differential Skew Test ..................................................78
Perform Receiver Rise Time and Fall Time Test......................................80
Perform Receiver Differential Voltage Test ..............................................82
Perform Receiver AC CM Voltage Test ....................................................87
View SATA Test Results .............................................................................89
Summary Results...................................................................................89
Detailed Results .....................................................................................90
Eye Results .............................................................................................92
Results Plot.............................................................................................96
Bit Rate Results for a SATA Device ....................................................98
Differential Skew Results for a SATA Device.....................................99
Rise and Fall Time Results for a SATA Device ..................................99
Unit Interval Results for a SATA Device ..........................................100
Differential Voltage Results for a SATA Device...............................101
AC CM Voltage Results for a SATA Device .....................................103
COMINIT Results for a SATA Device ..............................................104
COMWAKE Results for a SATA Device ..........................................105
COMRESET Results for a SATA Device..........................................106
Select and Configure SAS Measurements ...............................................107
Select SAS Measurements...................................................................107
Configure SAS Measurements ...........................................................108
Perform SAS Tests for Transmitter.........................................................112
Transmitter Measurements ................................................................112
Perform Transmitter Rise Time and Fall Time Test..............................112
Perform Transmitter Differential Skew Test ..........................................114
Perform Transmitter COMINIT, COMWAKE, and COMRESET Tests116
Perform SAS Tests for Receiver...............................................................118
Receiver Measurements ......................................................................118
Perform Receiver Eye and Bit Rate Tests ...............................................118
Table of Contents
Option SST Serial ATA and Serial Attached SCSI Analysis Module iv
Perform Receiver Differential Skew Test ............................................... 121
Perform Receiver Rise Time and Fall Time Test ................................... 123
View SAS Tests Results ............................................................................ 125
Summary Results................................................................................ 125
Detailed Results .................................................................................. 126
Eye Results .......................................................................................... 127
Results Plot.......................................................................................... 129
Bit Rate Results for a SAS Device..................................................... 131
Rise and Fall Time Results for a SAS Device................................... 132
Differential Skew Results for a SAS Device ..................................... 133
COMINIT for a SAS Device .............................................................. 134
COMWAKE Results for a SAS Device............................................. 135
COMRESET Results for a SAS Device ............................................ 136
Generating a Report............................................................................ 138
About Generating a Report...................................................................... 138
Report Generator File Directories........................................................... 138
Starting the Report Generator and Accessing the Online Help............ 138
Setting Up a Test Template and Layout for a Report ........................... 139
Generating and Printing a Report........................................................... 139
Creating a PDF File of the Compliance Report ..................................... 140
Test Template Menu ................................................................................. 141
Report Layout Menu ................................................................................ 142
Report Generator Menu Options ............................................................ 143
Report Generate Menu............................................................................. 143
Report Generator Fields........................................................................... 143
Application Fields General Information List ......................................... 144
Application Fields Configuration List and an Example ........................ 145
Application Fields Results List and Specific Measurements Example. 146
Oscilloscope Fields and Native Fields Lists ............................................ 147
Reference ........................................................................................ 148
Shortcut Keys ............................................................................................ 148
Error Messages.......................................................................................... 149
Table of Contents
Option SST Serial ATA and Serial Attached SCSI Analysis Module
v
Default Settings ..........................................................................................150
Default Settings for SATA Measurements (Part 1)..........................150
Default Settings for SATA Measurements (Part 2)..........................151
Default Settings for SATA Measurements (Part 3)..........................153
Default Settings for SATA Measurements (Part 4)..........................154
Default Settings for SAS Measurements (Part 1) .............................155
Default Settings for SAS Measurements (Part 2) .............................156
GPIB Commands .......................................................................................158
GPIB Information ...............................................................................158
Remote GPIB Support ........................................................................158
Introduction to GPIB Command Syntax ..........................................158
GPIB Reference Materials..................................................................159
Starting and Setting Up the Application Using GPIB......................159
Variable:Value RT-Eye Command ...................................................160
Variable:Value Command Arguments and Queries (Part 1)..........161
Variable:Value Command Arguments and Queries (Part 2)..........162
Measurements Results Queries ..........................................................163
Worst Case Eye Measurement Names for the resultForWorstEye Variable ................................................................................................164
SATA Measurement Names for the resultFor Variable ..................164
SAS Measurement Names for the resultFor Variable .....................165
Measurement Algorithms..........................................................................165
Eye Diagram for Serial ATA..............................................................165
Eye Diagram for SAS..........................................................................167
Rise Time..............................................................................................169
Fall Time ..............................................................................................170
Bit Rate.................................................................................................171
Unit Interval.........................................................................................172
Differential Skew.................................................................................172
Differential Voltage .............................................................................172
AC Common Mode Voltage ...............................................................175
Jitter Measurements using TDSJIT3 v2 ..................................................176
Serial ATA Transmitter Jitter Measurements using TDSJIT3 v2 .176

Table of Contents
Option SST Serial ATA and Serial Attached SCSI Analysis Module vi
Serial ATA SSC time domain profile extraction using TDSJIT3 v2177
TDSJIT3 v2 Setup to measure Tj/Dj, 5 UI for a Gen1i device ....... 179
TDSJIT3 v2 Setup to measure Tj/Dj, 250 UI for a Gen1i device ... 180
TDSJIT3 v2 Setup to measure Tj/Dj for a Gen1x device................ 182
TDSJIT3 v2 Setup to measure Tj/Dj, Clk-Data, fBaud/500 for a Gen2i device ........................................................................................ 182
TDSJIT3 v2 Setup to measure Tj/Dj for a Gen2x device................ 183
TDSJIT3 v2 Setup to measure Tj/Dj, Clk-Data for a Gen2i device183
SAS Receiver Jitter Measurements using TDSJIT3 v2................... 184
TDSJIT3 v2 Setup for a SAS 1.5 Gbps device ................................. 184
TDSJIT3 v2 Setup for a SAS 3.0 Gbps device ................................. 185
Option SST Serial ATA and Serial Attached SCSI Analysis Module
vii
General Safety Summary
Review the following safety precautions to avoid injury and prevent damage to this product or any products connected to it. To avoid potential hazards, use this product only as specified.
Only qualified personnel should perform service procedures.
While using this product, you may need to access other parts of the system. Read the General Safety Summary in other system manuals for warnings and cautions related to operating the system.
To Avoid Fire or Personal Injury:
Connect and Disconnect Properly: Do not connect or disconnect probes or test leads while they are connected to a voltage source.
Observe All Terminal Ratings: To avoid fire or shock hazard, observe all ratings and markings on the product. Consult the product manual for further ratings information before making connections to the product.
Do Not Operate With Suspected Failures: If you suspect there is damage to this product, have it inspected by qualified service personnel.
Symbols and Terms: The following terms and symbols may appear in the online help.
Terms on the Product: The following terms may appear on the product:
DANGER indicates an injury hazard immediately accessible as you read the marking.
WARNING indicates an injury hazard not immediately accessible as you read the marking.
CAUTION indicates a hazard to property including the product.
WARNING. Warning statements identify conditions or practices that could result injury or loss of life.
CAUTION. Caution statements identify conditions or practices that could result in damage to this product or other property.

General Safety Summary
Option SST Serial ATA and Serial Attached SCSI Analysis Module viii
Symbols on the Product: The following symbol(s) may appear in the product:
CAUTION Refer to Help
Option SST Serial ATA and Serial Attached SCSI Analysis Module
1
Introduction
Using Online Help Online help has many advantages over a printed manual because of advanced search capabilities. You can select Help> Topics on the right side of the application menu bar to display the Help file.
The main (opening) Help screen shows three tabs across the top, each of which offers a unique mode of assistance:
Contents (TOC) tab - organizes the help into book-like sections. Select a book icon to open a section; select any of the topics listed under the book.
Index tab - enables you to scroll a list of alphabetical keywords. Select the topic of interest to display the corresponding help page.
Find tab - allows a text-based search. Follow these steps:
1. Type the word or phrase you want to find in the search box.
2. If the word or phrase is not found, try the Index tab.
3. Select some matching words in the next box to narrow your search.
4. Choose a topic in the lower box, and then select the Display button.
Note: The Find tab function does not include words found in graphics
To print a topic, select the Print button from the help topics menu bar.
Select the Back button to return to the previous help window. Sometimes you can jump from one topic to another through a hyperlink. If the Back button is grayed out, or a jump is not available, choose the Help Topics button to return to the originating help folder.
Introduction
Option SST Serial ATA and Serial Attached SCSI Analysis Module 2
Browse buttons (Next >> and << Previous) allow you to move forward and backward through topics in the order of the Table of Contents (TOC).
A Note: in the topic text indicates important information.
Note: Green-underlined text indicates a jump (hyperlink) to another topic. Select the green text to jump to the related topic. For example, select the green text to jump to the topic on Feedback to contact Tektronix.
You can tell when the cursor is over an active hyperlink (button, jump, or popup), because the arrow cursor changes to a small pointing hand cursor.
The light bulb icon and word Tip in the graphic above indicates additional information to help you operate the application more efficiently.
Related Documentation In addition to the online help, the Serial ATA and SAS test modules, Optional Applications Software on a Windows-Based Oscilloscope CD-ROM includes a Quick Reference guide in PDF format. Refer to the Option SST Serial ATA and Serial Attached SCSI Test Module Application Reference for the following information:
A short tutorial to help you quickly take measurements
An overall menu map of the entire application
In addition to the online help for the SATA and SAS test modules, you can refer to the RT-Eye Serial Data Compliance and Analysis Application online help for information about how to use the RT-Eye application.
Refer to the Optional Applications Software on Windows-Based Oscilloscope Installation Manual for the following information:
Software warranty
List of all available applications, compatible oscilloscopes, and relevant software and firmware version numbers
Introduction
Option SST Serial ATA and Serial Attached SCSI Analysis Module
3
Applying a new label
Installing an application
Enabling an application
Downloading updates from the Tektronix Web site
Note: You can view PDF file of the installation manual from the CD Installation Browser and from the Documents directory on the Optional Applications Software on a Windows-Based Oscilloscope CD-ROM.
For complete information on Tektronix Methods of Implementation (MOI) for SATA Interoperability tests, refer to the document titled Serial ATA Interoperability Program - Tektronix MOI for Device PHY, TSG and OOB Tests located at http://www.tek.com/Measurement/applications/serial_data/sata.html
Reference to Standards
Serial ATA-II specifications PHYii Spec Rev 1_0 052604.pdf.
SAS specifications ANSI INCITS 376-2003 dated 30th October 2003
Conventions Online help topics use the following conventions:
The term "module", "SATA or SAS test module" or "application" refers to the Serial ATA or SAS plug-in software modules.
The term "RT-Eye application" refers to the Tektronix RT-Eye Serial Data Compliance and Analysis Application with which the Serial ATA and SAS modules can be run.
The term "oscilloscope" refers to any product on which this application runs.
The term "select" is a generic term that applies to the two mechanical methods of choosing an option: with a mouse or with the touch screen.
The term "channel" is context dependent. It can refer to the transmit channel of the device under test or to an oscilloscope channel.
The term "DUT" is an abbreviation for Device Under Test.
Introduction
Option SST Serial ATA and Serial Attached SCSI Analysis Module 4
When steps require a sequence of selections using the application interface, the ">" delimiter marks each transition between a menu and an option. For example, one of the steps to recall a setup file would appear as File> Recall.
Introduction
Option SST Serial ATA and Serial Attached SCSI Analysis Module
5
Updates through the Web Site You can find information about this and other applications at the Tektronix Inc. Web site, www.tektronix.com. Check this site for firmware updates and other information about our application.
Feedback Tektronix values your feedback on our products. To help us serve you better, please send us your suggestions, ideas, or comments on the application.
Direct your feedback via email to [email protected] or [email protected] or FAX at (503) 627-5695 and include the following information. Please be as specific as possible.
General information:
Instrument model number and hardware options if any, with serial number
Probes used
Your name, company, mailing address, phone number, FAX number, email address
Please indicate if you would like to be contacted by Tektronix about your suggestion or comments
Application specific information:
Software version number
Description of the problem such that technical support can duplicate the problem
The setup file of the oscilloscope and the application is also required to identify the problem
If possible, save the waveform on which you are performing the measurement as a .wfm file
Note: To find the Software version number, click Help> About in the application.
Introduction
Option SST Serial ATA and Serial Attached SCSI Analysis Module 6
Once you have gathered this information, you can contact technical support by fax or through email. If using email, be sure to enter "Option SST Software Problem" in the subject line, and attach the .wfm files.
You can then attach the file to your email (depending on the capabilities of your email editor).

Introduction
Option SST Serial ATA and Serial Attached SCSI Analysis Module Online Help
7

Getting Started
Option SST Serial ATA and Serial Attached SCSI Analysis Module 8
Getting Started
About the Option SST Analysis Modules The Option SST Analysis Modules consist of two modules−Serial ATA and SAS− that are plug-in software modules to the Tektronix RT-EYE Serial Compliance and Analysis application that runs on some Tektronix Windows-based oscilloscopes.
You can use these modules to test storage devices as per the Serial Advanced Technology Attachment or SATA (Gen I and Gen II) and Serial Attached SCSI (SAS) standards. After the measurements are taken, the results are displayed to show whether the device has passed or failed the test.
Other features include:
Performs Eye, Timing, and Amplitude measurements, and OOB tests according to industry standard methods
Selects and configures multiple measurements using differential or single-ended probe inputs for receiver and transmitter devices
Creates, formats, and generates reports
The measurements that are available in the Serial ATA module are: Eye, Bit Rate, Differential Skew, Rise and Fall Time, Unit Interval, Differential Voltage, AC CM Voltage, COMINIT, COMWAKE, and COMRESET.
The measurements that are available in the SAS module are: Eye, Bit Rate, Rise and Fall Time, Differential Skew, COMINIT, COMWAKE, and COMRESET.
Compatibility For information on oscilloscope compatibility, refer to the Optional Applications Software on Windows-Based Oscilloscopes Installation Manual, Tektronix part number 071-1888-XX. The manual is available as a PDF file.

Getting Started
Option SST Serial ATA and Serial Attached SCSI Analysis Module
9
Recommended Accessories The Option SST Test Modules support the following probes:
P7380SMA
P7380
SMA Cables
14dB Attenuator: Tektronix 5X Attenuator (SMA male-to-female) - (Order 015-1002-01.)
Test fixtures: Crescent Heart Software (www.c-h-s.com)
Requirements and Restrictions The RT-EYE Serial Compliance and Analysis application must be installed
for the Option SST Test Modules to run.
The Sun Java Run-Time Environment (JRE) V1.4.0 and The Mathworks MATLAB Run-Time Server are components of the Option SST test modules. When you install the application, the InstallShield Wizard automatically installs the proper software components.
MATLAB Server. The MATLAB server is dedicated to the RT-Eye application and cannot be used for other purposes. Do not close the MATLAB Server icon in the oscilloscope task bar because this will disrupt the operation of the Option SST Test Modules. The application will close the MATLAB sever when you exit the application.

Getting Started
Option SST Serial ATA and Serial Attached SCSI Analysis Module
10
Starting the Application For supported non-B series oscilloscopes, on the oscilloscope menu bar, select File> Run Application> RT-Eye Serial Compliance and Analysis. For supported B-series oscilloscopes, on the oscilloscope menu bar, click App> RT-Eye Serial Compliance and Analysis. For DPO oscilloscopes, select Analyze> RT-Eye Serial Compliance and Analysis.
To start the Serial ATA module, from the RT-EYE Serial Compliance and Analysis application, select Module> Serial ATA.
To start the SAS module, from the RT-EYE Serial Compliance and Analysis application, select Module> SAS.
The application starts and displays the Measurements Select menu.
You can move between modules by selecting the module name from the Modules menu in the application menu bar.
Maximizing and Minimizing the Application To minimize the application and selected module, select File> Minimize in the application menu bar.
To maximize the application and selected module, select in the task bar.
To hide the application and the selected module, select the Hide button.
Returning to the Application For supported non-B series oscilloscopes, to return to the application, click the APP button on the top right of the oscilloscope display. For supported B-series oscilloscopes, click App> Restore Application from the menu bar.
Exiting the Application To exit the RT-Eye application and the selected module, select File> Exit or the (Exit) command button in the application menu bar. When you exit the
Getting Started
Option SST Serial ATA and Serial Attached SCSI Analysis Module
11
application, you can elect to keep the oscilloscope setup currently in use with the application or to restore the oscilloscope setup that was present before you started the application.
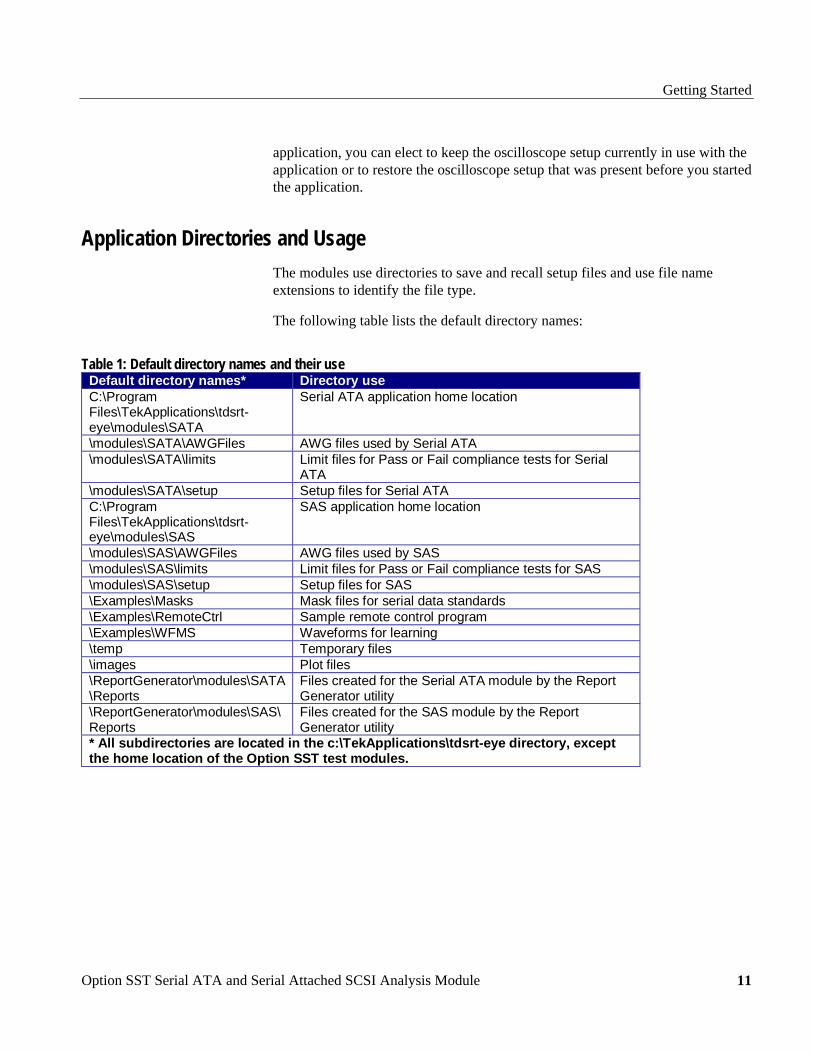
Application Directories and Usage The modules use directories to save and recall setup files and use file name extensions to identify the file type.
The following table lists the default directory names:
Table 1: Default directory names and their use Default directory names* Directory useC:\ProgramFiles\TekApplications\tdsrt-eye\modules\SATA
Serial ATA application home location
\modules\SATA\AWGFiles AWG files used by Serial ATA\modules\SATA\limits Limit files for Pass or Fail compliance tests for Serial
ATA\modules\SATA\setup Setup files for Serial ATAC:\ProgramFiles\TekApplications\tdsrt-eye\modules\SAS
SAS application home location
\modules\SAS\AWGFiles AWG files used by SAS\modules\SAS\limits Limit files for Pass or Fail compliance tests for SAS\modules\SAS\setup Setup files for SAS\Examples\Masks Mask files for serial data standards\Examples\RemoteCtrl Sample remote control program\Examples\WFMS Waveforms for learning\temp Temporary files\images Plot files\ReportGenerator\modules\SATA\Reports
Files created for the Serial ATA module by the ReportGenerator utility
\ReportGenerator\modules\SAS\Reports
Files created for the SAS module by the ReportGenerator utility
* All subdirectories are located in the c:\TekApplications\tdsrt-eye directory, exceptthe home location of the Option SST test modules.

Getting Started
Option SST Serial ATA and Serial Attached SCSI Analysis Module 12
File Name Extensions The following table lists the file name extensions and their descriptions:
Table 2: File name extensions and their descriptions Extension Description.bmp File that uses a "bitmap" format.csv File that uses a "comma separated variable" format.dat File with binary format.fig Plot file with binary data.gif File that uses a "graphic interchange format".ini Application setup file.jpg File that uses the a "joint photographic experts group"
format; also known as JPEG.lim Limits file used with Pass/Fail compliance.mat MATLAB waveform vector header saved to the hard disk.msk Waveform mask file used with plots.pdf File that uses a "portable data format".png File that uses a "portable network graphics" format.rgt File that defines the report template.rpl File that defines the report layout.rpt File created by the Report Generator utility.rtf File that uses a "rich text format".set Oscilloscope setup file saved that is recalled with an
application .ini file; both files will have the same name.wfm Waveform file; can be recalled into Reference memory
Getting Started
Option SST Serial ATA and Serial Attached SCSI Analysis Module
13

Option SST Serial ATA and Serial Attached SCSI Analysis Module
14
Operating Basics
Opt. SST Application View
Figure 1: Application view
Operating Basics
Option SST Serial ATA and Serial Attached SCSI Analysis Module
15
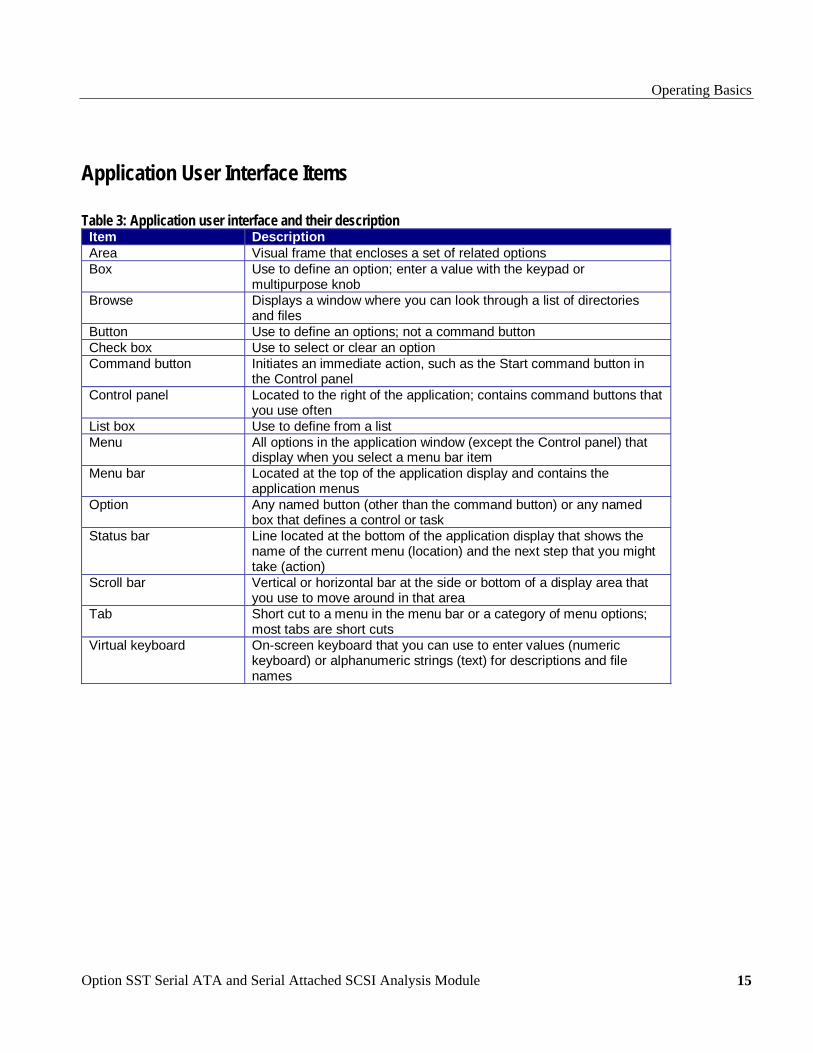
Application User Interface Items
Table 3: Application user interface and their description Item DescriptionArea Visual frame that encloses a set of related optionsBox Use to define an option; enter a value with the keypad or
multipurpose knobBrowse Displays a window where you can look through a list of directories
and filesButton Use to define an options; not a command buttonCheck box Use to select or clear an optionCommand button Initiates an immediate action, such as the Start command button in
the Control panelControl panel Located to the right of the application; contains command buttons that
you use oftenList box Use to define from a listMenu All options in the application window (except the Control panel) that
display when you select a menu bar itemMenu bar Located at the top of the application display and contains the
application menusOption Any named button (other than the command button) or any named
box that defines a control or taskStatus bar Line located at the bottom of the application display that shows the
name of the current menu (location) and the next step that you mighttake (action)
Scroll bar Vertical or horizontal bar at the side or bottom of a display area thatyou use to move around in that area
Tab Short cut to a menu in the menu bar or a category of menu options;most tabs are short cuts
Virtual keyboard On-screen keyboard that you can use to enter values (numerickeyboard) or alphanumeric strings (text) for descriptions and filenames

Operating Basics
Option SST Serial ATA and Serial Attached SCSI Analysis Module 16
Serial ATA and SAS Measurements The following tables list the Serial ATA and SAS measurements that the modules support.
Table 4: Default directory names and their use Measurement DescriptionEye Measures, analyzes, and characterizes the differential
output voltage, jitter, rise and fall time for transition andnon-transition bits
Bit Rate Measures the inverse of the average bit time for theclock recovery window
Differential Skew Measures the time difference between the single-endedmid-point of the TX+/RX+ signal rising/falling edge andthe single-ended mid-point of the TX−/RX− signalfalling/rising edge
Rise and Fall Time Measures the rise and fall times of the waveform. Therise and fall times are defined over a 20%-80% outputlevel change from the High and Low reference levels
Unit Interval Measures the time required to transmit one bitDifferential Voltage Measures the minimum and maximum differential
voltage amplitude for a given data patternAC Common Mode Voltage Measures the maximum sinusoidal amplitude
Operating Basics
Option SST Serial ATA and Serial Attached SCSI Analysis Module
17
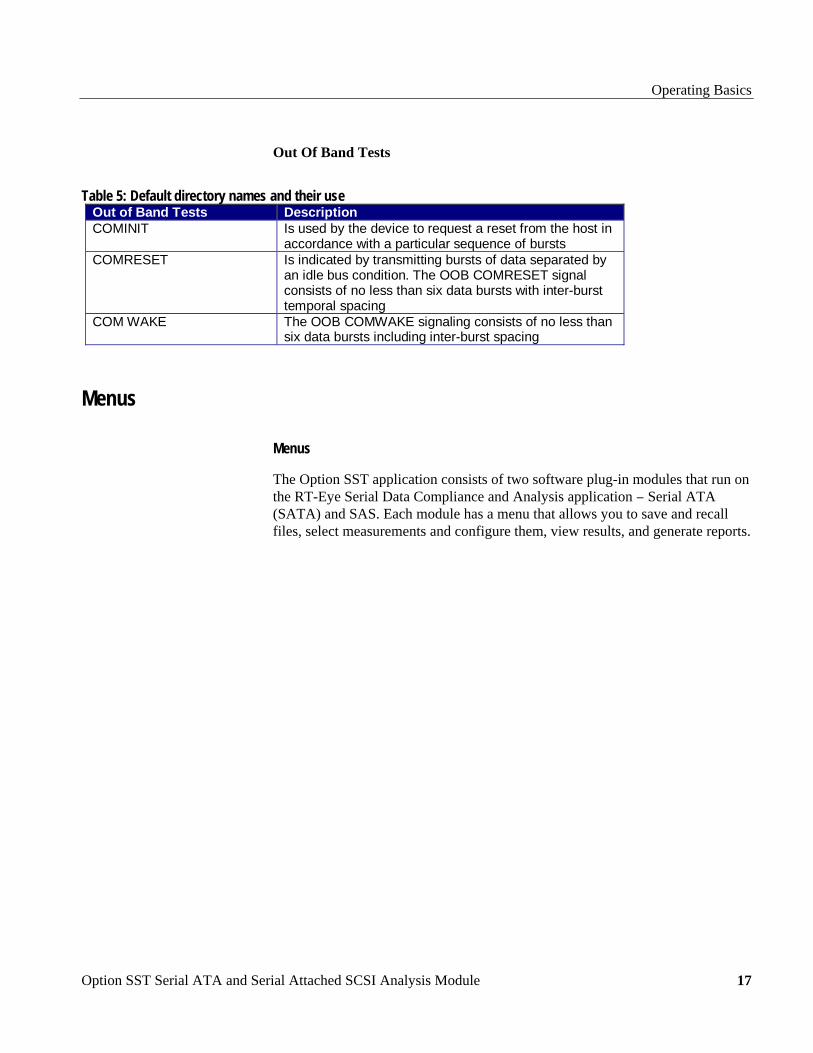
Out Of Band Tests
Table 5: Default directory names and their use Out of Band Tests DescriptionCOMINIT Is used by the device to request a reset from the host in
accordance with a particular sequence of burstsCOMRESET Is indicated by transmitting bursts of data separated by
an idle bus condition. The OOB COMRESET signalconsists of no less than six data bursts with inter-bursttemporal spacing
COM WAKE The OOB COMWAKE signaling consists of no less thansix data bursts including inter-burst spacing
Menus
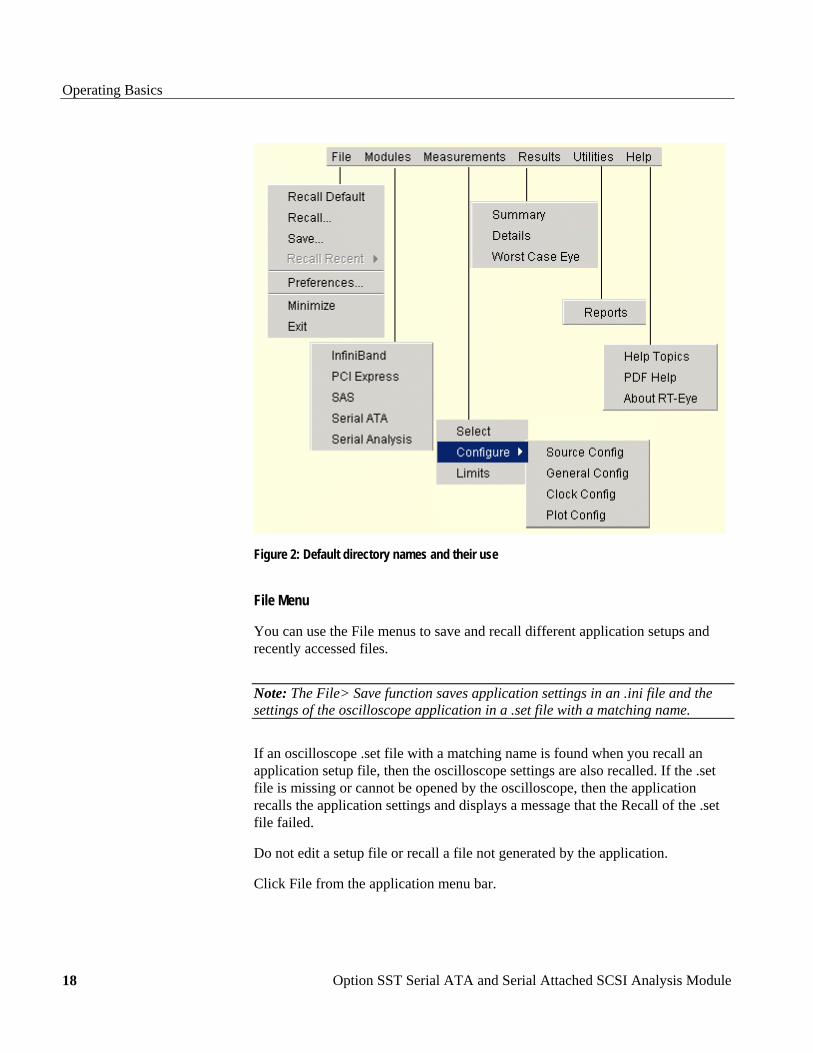
Menus
The Option SST application consists of two software plug-in modules that run on the RT-Eye Serial Data Compliance and Analysis application − Serial ATA (SATA) and SAS. Each module has a menu that allows you to save and recall files, select measurements and configure them, view results, and generate reports.
Operating Basics
Option SST Serial ATA and Serial Attached SCSI Analysis Module 18
Figure 2: Default directory names and their use
File Menu
You can use the File menus to save and recall different application setups and recently accessed files.
Note: The File> Save function saves application settings in an .ini file and the settings of the oscilloscope application in a .set file with a matching name.
If an oscilloscope .set file with a matching name is found when you recall an application setup file, then the oscilloscope settings are also recalled. If the .set file is missing or cannot be opened by the oscilloscope, then the application recalls the application settings and displays a message that the Recall of the .set file failed.
Do not edit a setup file or recall a file not generated by the application.
Click File from the application menu bar.

Operating Basics
Option SST Serial ATA and Serial Attached SCSI Analysis Module
19
The File menu has the following selections:
Table 6: File menu and their descriptions Menu/function Description or functionRecall Default Recalls most default parameters for the active
module (Serial ATA or SAS)Recall* Browse to select an application setup (.ini) file to
recall the setup file. Recall restores the applicationto the values saved in the setup
Save* Saves the current application settings in a .ini fileRecall Recent Select from the list of four most recently accessed
setup files (saved or recalled) and recall that setupPreferences Displays the Preferences menu, settings apply until
you exit the application; saved setup files includethe settings
Minimize Minimizes the applicationExit Exits the application; you can choose to retain the
current oscilloscope settings or restore theoscilloscope to the settings prior to starting theapplication
* Save or Recall functions also save or recall the associated oscilloscopesetup file (.ini); an oscilloscope file is recalled if the application finds a .setwith a matching name
Measurements Menu
You can use the Measurements Menu to select and configure the measurement that you want to make.
Click Measurement from the application menu bar. The Measurement menu has the following selections:
Table 7: Measurement menu and their descriptions Menu/function Description or functionSelect Displays the Measurements for the selected moduleConfigure Displays the configuration tabs for the selected
measurementsLimits Displays the Limits file
Click Measurement > Configure from the application menu bar. You can use the Configure menu item to select and configure the measurements that you have selected.
Operating Basics
Option SST Serial ATA and Serial Attached SCSI Analysis Module 20
The Configure menu item has the following selections:
Table 8: Configure menu and their descriptions Menu item DescriptionSource Displays the source parameters to configure for
the selected testsGeneral Config Displays the general parameters to configure for
the selected testsClock Config* Displays the clock parameters to configure for
the selected testsPlot Config** Displays the plot parameters to plot an eye
diagram* This tab is not available for SAS measurements** This tab is enabled only for Eye measurement
Results Menu
You can view the results of the measurements using the Results Menu.
Click Results from the application menu bar. The Results Menu has the following selections:
Table 9: Results menu and their descriptions Menu item DescriptionSummary Displays a summary of the results of the
measurement or testDetails Displays the details of the results of the
measurement or testWorst Case Eye* Displays the plot of the Eye Diagram* This selection is not available for the SAS module
Utilities Menu
You can use the Utility Menu to open the report generator pane. You can create custom layouts and templates to generate custom reports. Click Utilities from the application menu bar.
Help Menu
You can use the Help Menu to open the common help file for the plug-in SATA and SAS modules, and version information about the modules.
Click Help from the application menu bar.
The Help menu has the following selections:
Operating Basics
Option SST Serial ATA and Serial Attached SCSI Analysis Module
21
Table 10: Help menu and their descriptions Menu item DescriptionHelp Topics Displays the help file for the modulesPDF Help Displays the PDF file adapted from the online helpAbout RT-EYE Displays the About box with version information
Saving and Recalling Files
To save the application and oscilloscope settings to a setup file, follow these steps:
1. Select File> Save. View the Save browser.
2. The Save dialog box appears. To view details about the file, such as size, type, and date modified, select the Details tool.
3. In the file browser, select the directory in which to save the setup file or use the current directory.
4. Select or use the keyboard to enter a new file name. The application appends an ".ini" extension to the name of the application setup file.
5. Select the command button.
Note: The application also saves the oscilloscope setup to a ".set" file when you save an application setup. Both the application .ini file and oscilloscope .set file have the same file name.
To recall the application and oscilloscope settings from saved setup files, follow these steps:
1. Select File> Recall. View the Recall browser.
2. The Recall dialog box appears. To view details about the file, such as size, type, and date modified, select the Details tool.
3. In the Recall dialog box, select the directory from which to recall the setup file.
4. Select a setup file name, and then select Open.
Note: The application recalls the .ini setup file and the associated oscilloscope setup if the application can find a .set file with a matching name.
Operating Basics
Option SST Serial ATA and Serial Attached SCSI Analysis Module 22
To recall the default application settings, select File> Recall Default.
Note: Most of the settings for the active module are recalled to the default state.
To recall a recently saved or accessed setup file, select File> Recall Recent… and then select the file from the drop down list of setup file names.
Note: The application also recalls the associated oscilloscope setup if the application can find a .set file with a matching name.
Taking Measurements
Setting Preferences
You can set preferences for the selected module. To set preferences, select File> Preferences from the application menu.
The following diagram and table list the preferences that you can set for the Serial ATA module and their descriptions:
CAUTION. Do not edit setup files. If you try to recall a setup file that has been edited, the recall operation fails.
CAUTION. If a matching .set file is not found or if the .set file does not recall correctly to the oscilloscope, then you are notified that the oscilloscope recall failed while the application recall succeeded.
Operating Basics
Option SST Serial ATA and Serial Attached SCSI Analysis Module
23
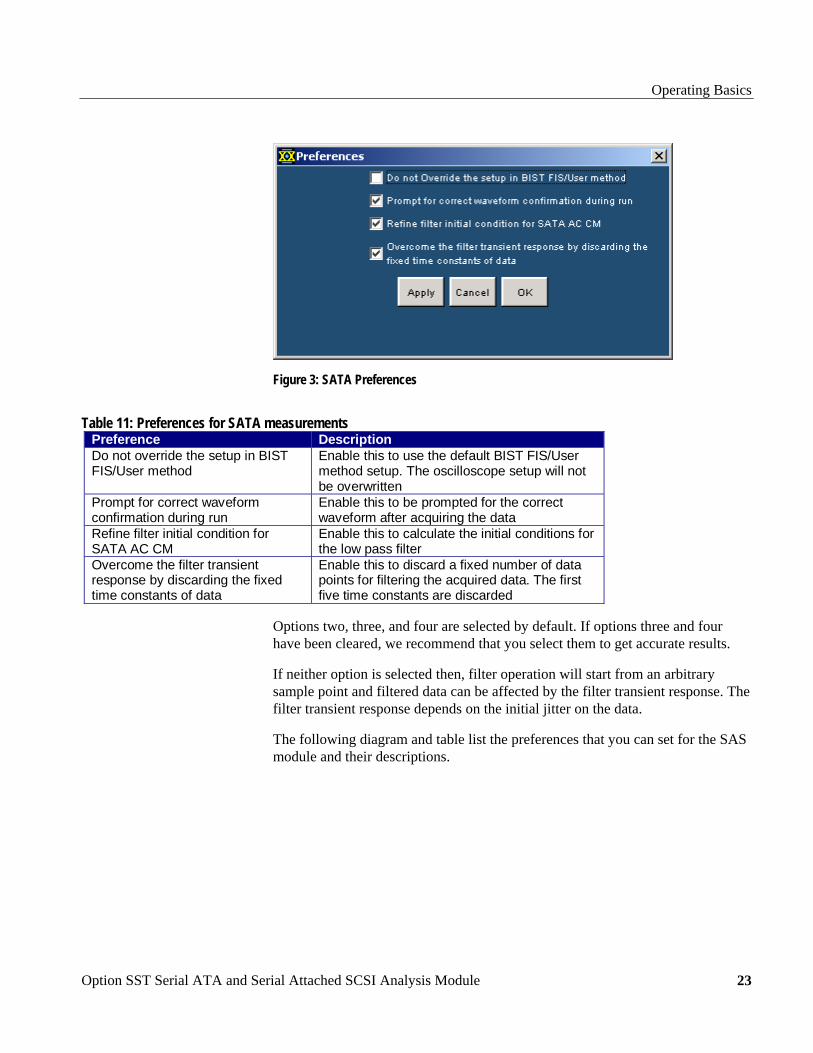
Figure 3: SATA Preferences
Table 11: Preferences for SATA measurements Preference DescriptionDo not override the setup in BISTFIS/User method
Enable this to use the default BIST FIS/Usermethod setup. The oscilloscope setup will notbe overwritten
Prompt for correct waveformconfirmation during run
Enable this to be prompted for the correctwaveform after acquiring the data
Refine filter initial condition forSATA AC CM
Enable this to calculate the initial conditions forthe low pass filter
Overcome the filter transientresponse by discarding the fixedtime constants of data
Enable this to discard a fixed number of datapoints for filtering the acquired data. The firstfive time constants are discarded
Options two, three, and four are selected by default. If options three and four have been cleared, we recommend that you select them to get accurate results.
If neither option is selected then, filter operation will start from an arbitrary sample point and filtered data can be affected by the filter transient response. The filter transient response depends on the initial jitter on the data.
The following diagram and table list the preferences that you can set for the SAS module and their descriptions.
Operating Basics
Option SST Serial ATA and Serial Attached SCSI Analysis Module 24
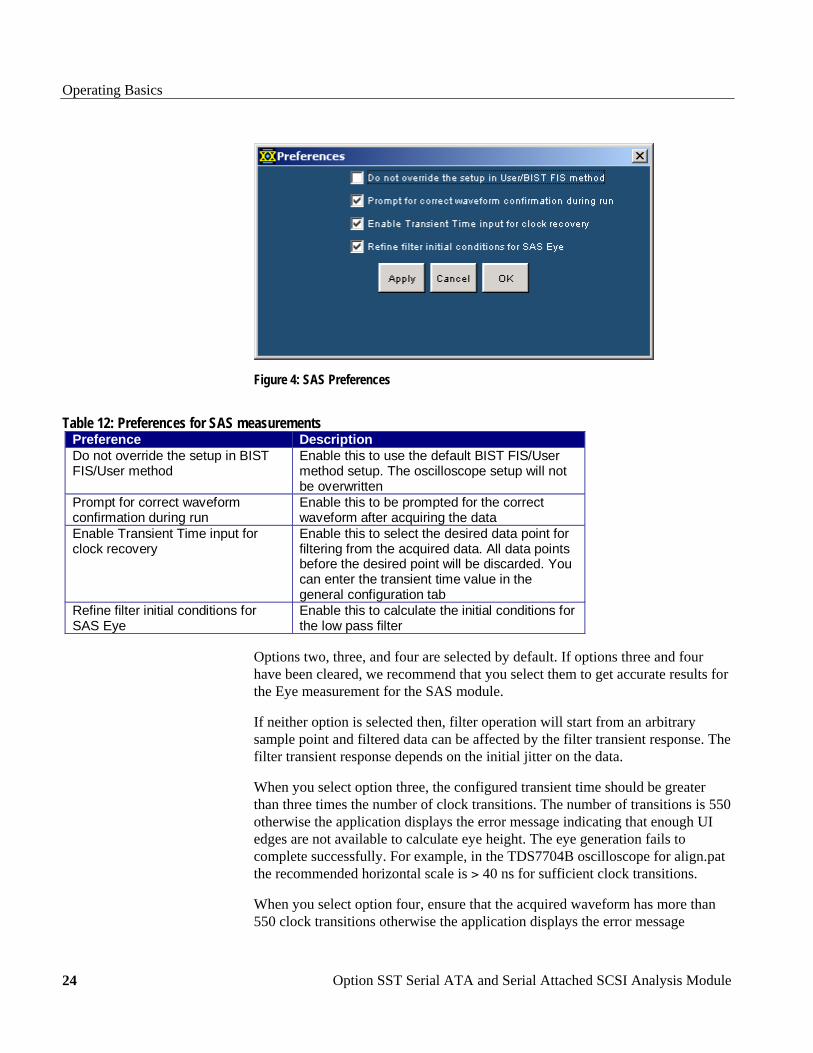
Figure 4: SAS Preferences
Table 12: Preferences for SAS measurements Preference DescriptionDo not override the setup in BISTFIS/User method
Enable this to use the default BIST FIS/Usermethod setup. The oscilloscope setup will notbe overwritten
Prompt for correct waveformconfirmation during run
Enable this to be prompted for the correctwaveform after acquiring the data
Enable Transient Time input forclock recovery
Enable this to select the desired data point forfiltering from the acquired data. All data pointsbefore the desired point will be discarded. Youcan enter the transient time value in thegeneral configuration tab
Refine filter initial conditions forSAS Eye
Enable this to calculate the initial conditions forthe low pass filter
Options two, three, and four are selected by default. If options three and four have been cleared, we recommend that you select them to get accurate results for the Eye measurement for the SAS module.
If neither option is selected then, filter operation will start from an arbitrary sample point and filtered data can be affected by the filter transient response. The filter transient response depends on the initial jitter on the data.
When you select option three, the configured transient time should be greater than three times the number of clock transitions. The number of transitions is 550 otherwise the application displays the error message indicating that enough UI edges are not available to calculate eye height. The eye generation fails to complete successfully. For example, in the TDS7704B oscilloscope for align.pat the recommended horizontal scale is > 40 ns for sufficient clock transitions.
When you select option four, ensure that the acquired waveform has more than 550 clock transitions otherwise the application displays the error message
Operating Basics
Option SST Serial ATA and Serial Attached SCSI Analysis Module
25
indicating that enough UI edges are not available to calculate eye height. The eye generation fails to complete successfully.
The SAS Eye measurement requires at least three data packets that has ≥ 550 clock transitions in the acquired data to calculate clock recovery correctly. If the acquired pattern has insufficient clock transitions (550) then you need to acquire more packets for sufficient clock transitions.
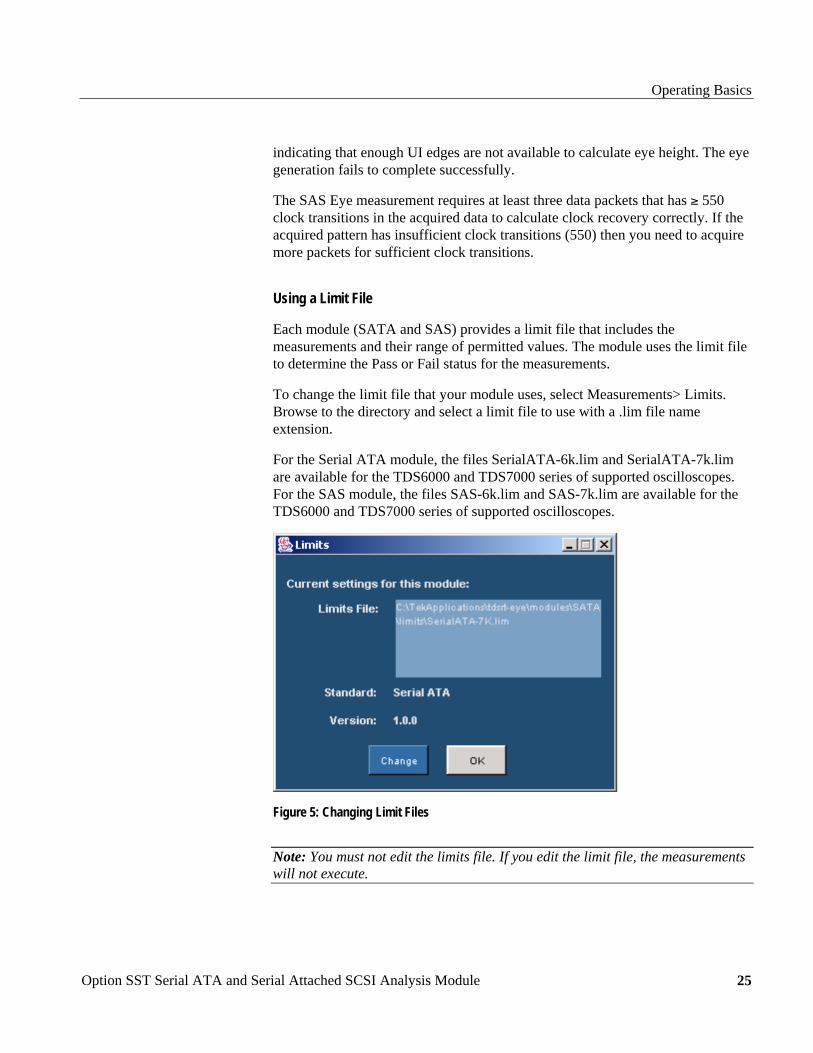
Using a Limit File
Each module (SATA and SAS) provides a limit file that includes the measurements and their range of permitted values. The module uses the limit file to determine the Pass or Fail status for the measurements.
To change the limit file that your module uses, select Measurements> Limits. Browse to the directory and select a limit file to use with a .lim file name extension.
For the Serial ATA module, the files SerialATA-6k.lim and SerialATA-7k.lim are available for the TDS6000 and TDS7000 series of supported oscilloscopes. For the SAS module, the files SAS-6k.lim and SAS-7k.lim are available for the TDS6000 and TDS7000 series of supported oscilloscopes.
Figure 5: Changing Limit Files
Note: You must not edit the limits file. If you edit the limit file, the measurements will not execute.
Operating Basics
Option SST Serial ATA and Serial Attached SCSI Analysis Module 26
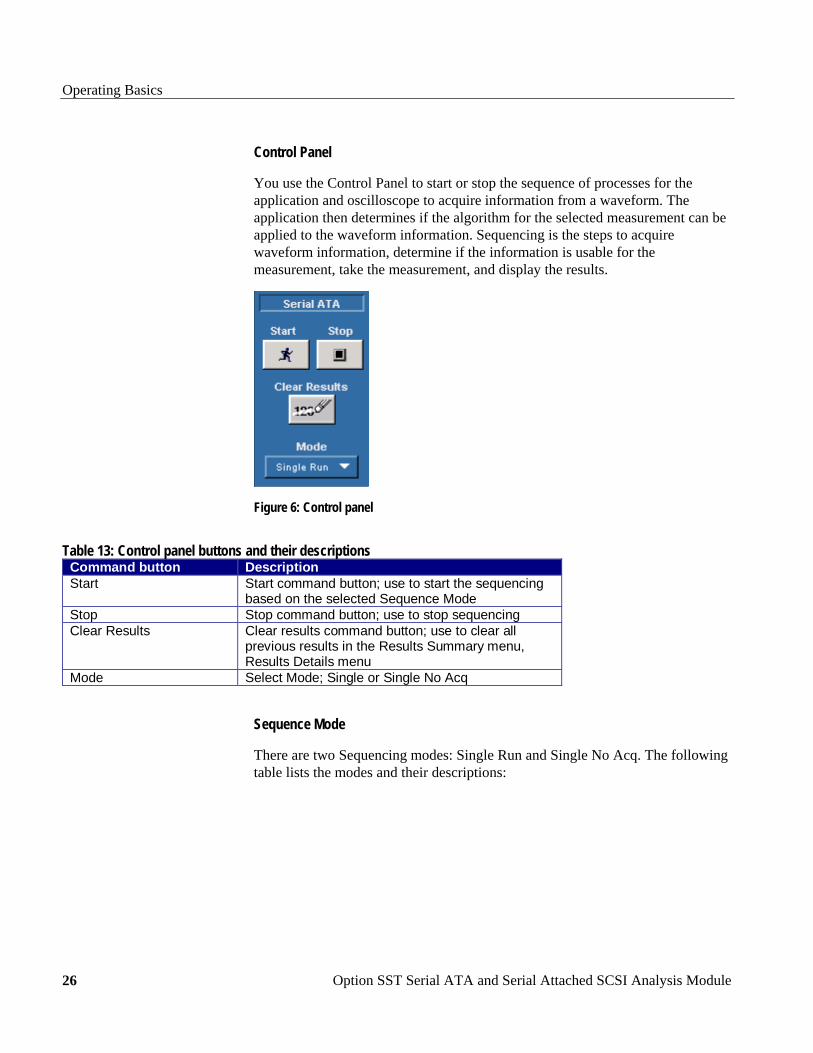
Control Panel
You use the Control Panel to start or stop the sequence of processes for the application and oscilloscope to acquire information from a waveform. The application then determines if the algorithm for the selected measurement can be applied to the waveform information. Sequencing is the steps to acquire waveform information, determine if the information is usable for the measurement, take the measurement, and display the results.
Figure 6: Control panel
Table 13: Control panel buttons and their descriptions Command button DescriptionStart Start command button; use to start the sequencing
based on the selected Sequence ModeStop Stop command button; use to stop sequencingClear Results Clear results command button; use to clear all
previous results in the Results Summary menu,Results Details menu
Mode Select Mode; Single or Single No Acq
Sequence Mode
There are two Sequencing modes: Single Run and Single No Acq. The following table lists the modes and their descriptions:
Operating Basics
Option SST Serial ATA and Serial Attached SCSI Analysis Module
27
Table 14: Sequence modes and their descriptions Mode DescriptionSingle Run Acquires a new waveform if the source is Ch1, Ch2,
Ch3, or Ch4, Ref waveforms, or from file; for allsources the application sequences until complete
Single No Acq Recalculates the selected measurements withoutacquiring new data
Acquiring Data
To acquire data from waveforms and take measurements, follow these steps:
1. In the Control Panel (on the right side of the application display), select a Sequence mode.
2. The application uses the Sequence mode to acquire waveforms and take measurements when you select the Start command button. The choices are: Single Run and Single No Acq.
3. Select the button for continuous acquisitions or for measurements on a new or existing acquisition.
4. If you select the Single Run or the Single No Acq mode, the application displays the results when the sequencing is complete.
5. Select the Stop button to stop the sequencing.
Note: Use the command button to delete all measurement results.
Editing a Serial ATA Mask File
The mask files for Serial ATA are located in C:\Program Files\TekApplications\tdsRT-Eye\lib\RTEye. The mask file name indicates the technology, test point, number of unit intervals, and the device usage model. For example, for the file SataTX250G1i.msk, "Sata" indicates the technology, "TX" indicates transmitter, "250" indicates the number of unit intervals, and "G1i"indicates the device usage model.

Operating Basics
Option SST Serial ATA and Serial Attached SCSI Analysis Module 28
Figure 7: Example of a mask file
Operating Basics
Option SST Serial ATA and Serial Attached SCSI Analysis Module
29
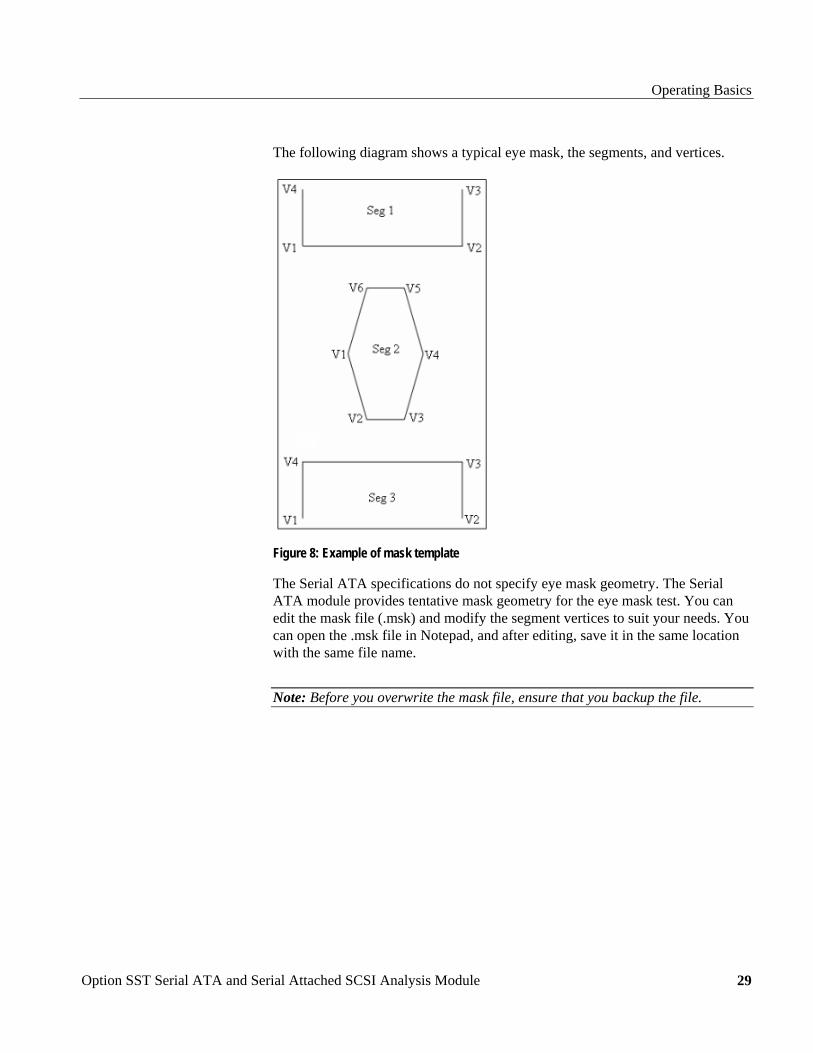
The following diagram shows a typical eye mask, the segments, and vertices.
Figure 8: Example of mask template
The Serial ATA specifications do not specify eye mask geometry. The Serial ATA module provides tentative mask geometry for the eye mask test. You can edit the mask file (.msk) and modify the segment vertices to suit your needs. You can open the .msk file in Notepad, and after editing, save it in the same location with the same file name.
Note: Before you overwrite the mask file, ensure that you backup the file.

Operating Basics
Option SST Serial ATA and Serial Attached SCSI Analysis Module 30
The following Serial ATA mask files are available for a transmitter and receiver:
Transmitter mask files Receiver mask files
SataTX250G1i SataRX250G1i
SataTX250G1m SataRX250G1m
SataTX250G1x SataRX250G1x
SataTX250G2i SataRX250G2i
SataTX250G2m SataRX250G2m
SataTX250G2x SataRX250G2x
SataTX5G1i SataRX5G1i
SataTX5G1m SataRX5G1m
SataTX5G1x SataRX5G1x
SataTX5G2i SataRX5G2i
SataTX5G2m SataRX5G2m
SataTX5G2x SataRX5G2x
Operating Basics
Option SST Serial ATA and Serial Attached SCSI Analysis Module
31

Option SST Serial ATA and Serial Attached SCSI Analysis Module
32
How To...
Set up the DUT
Methods to Test a DUT
You can set up the Device Under Test (DUT) and test it in two ways: using the Arbitrary Waveform Generator (AWG), or the BIST FIS/User-defined method.
In the AWG method, the AWG provides an external stimulus to the DUT. The DUT, in turn, responds with the OOB signals and Align Patterns on which the Serial ATA and SAS test modules can make measurements.
In the BIST FIS/User method, you can program the DUT to emit or transmit various patterns on which the Serial ATA and SAS test modules can make measurements.
The following table lists the test fixture connectors and the signals that are connected to the test fixture:
Table 15: Test fixture, host, and drive connections Test fixtureconnectors
Host connections Drive connections
J2 Tx+ Rx+J3 Tx− Rx−J4 Rx− Tx−J5 Rx+ Tx+
How To…
Option SST Serial ATA and Serial Attached SCSI Analysis Module
33
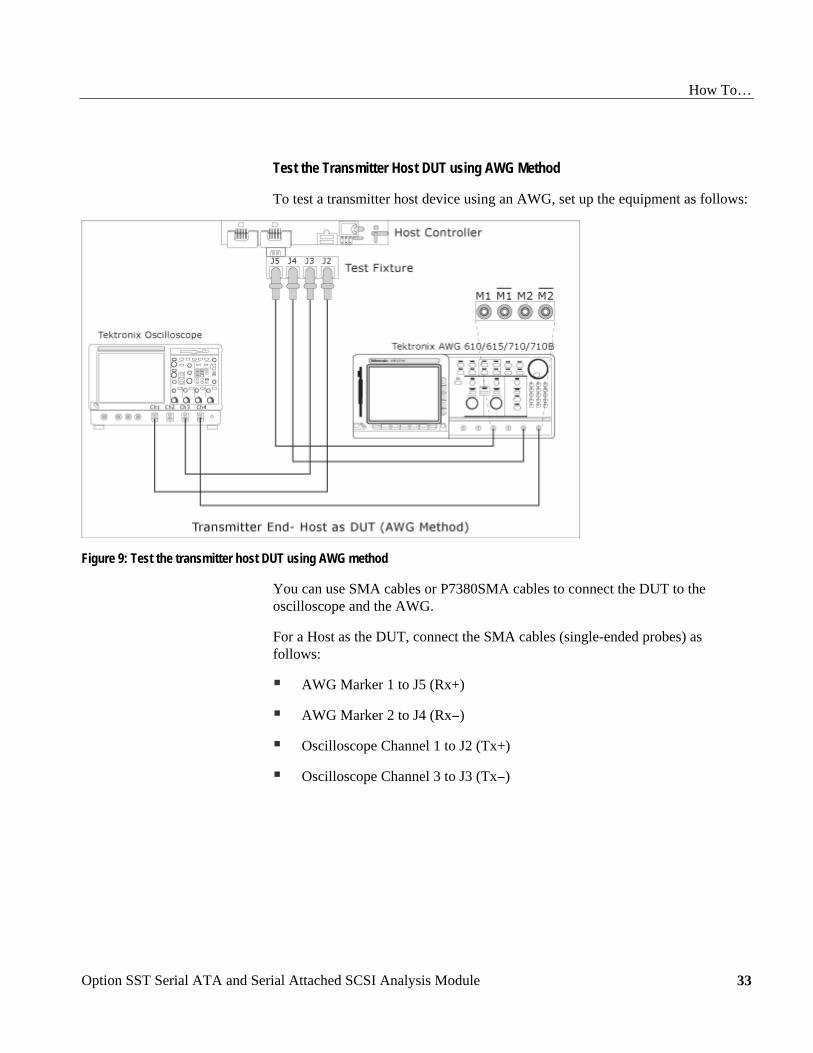
Test the Transmitter Host DUT using AWG Method
To test a transmitter host device using an AWG, set up the equipment as follows:
Figure 9: Test the transmitter host DUT using AWG method
You can use SMA cables or P7380SMA cables to connect the DUT to the oscilloscope and the AWG.
For a Host as the DUT, connect the SMA cables (single-ended probes) as follows:
AWG Marker 1 to J5 (Rx+)
AWG Marker 2 to J4 (Rx−)
Oscilloscope Channel 1 to J2 (Tx+)
Oscilloscope Channel 3 to J3 (Tx−)
How To…
Option SST Serial ATA and Serial Attached SCSI Analysis Module 34
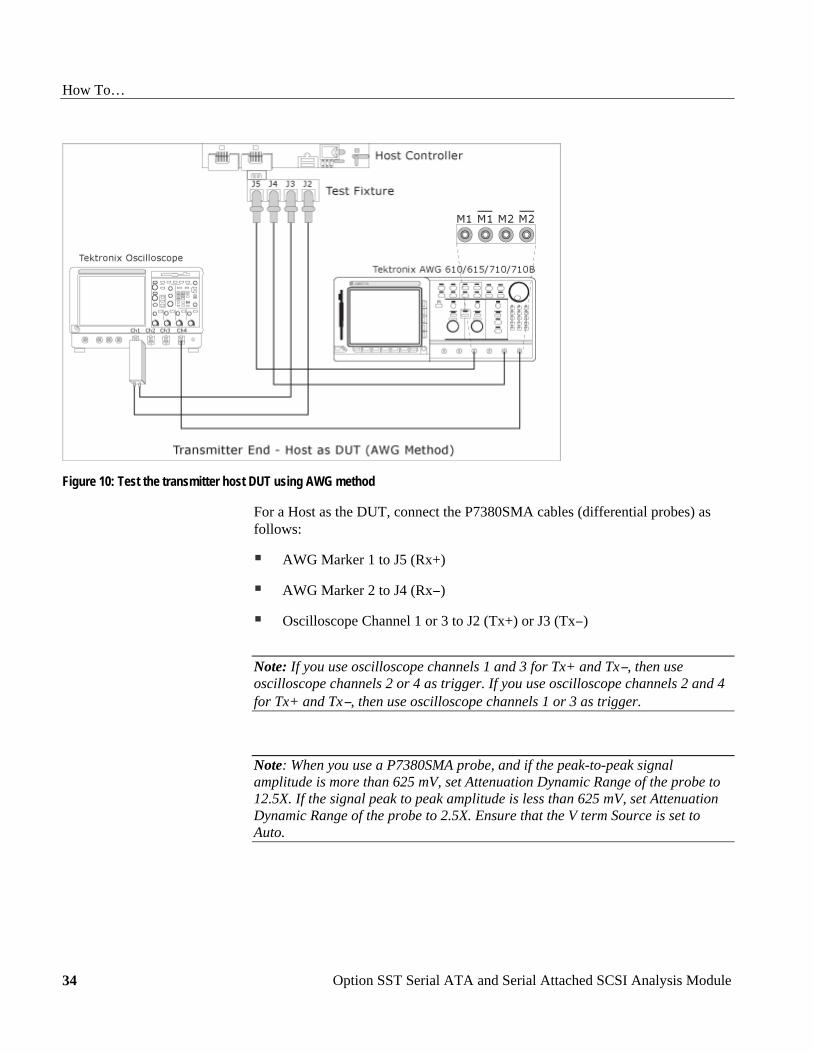
Figure 10: Test the transmitter host DUT using AWG method
For a Host as the DUT, connect the P7380SMA cables (differential probes) as follows:
AWG Marker 1 to J5 (Rx+)
AWG Marker 2 to J4 (Rx−)
Oscilloscope Channel 1 or 3 to J2 (Tx+) or J3 (Tx−)
Note: If you use oscilloscope channels 1 and 3 for Tx+ and Tx−, then use oscilloscope channels 2 or 4 as trigger. If you use oscilloscope channels 2 and 4 for Tx+ and Tx−, then use oscilloscope channels 1 or 3 as trigger.
Note: When you use a P7380SMA probe, and if the peak-to-peak signal amplitude is more than 625 mV, set Attenuation Dynamic Range of the probe to 12.5X. If the signal peak to peak amplitude is less than 625 mV, set Attenuation Dynamic Range of the probe to 2.5X. Ensure that the V term Source is set to Auto.
How To…
Option SST Serial ATA and Serial Attached SCSI Analysis Module
35
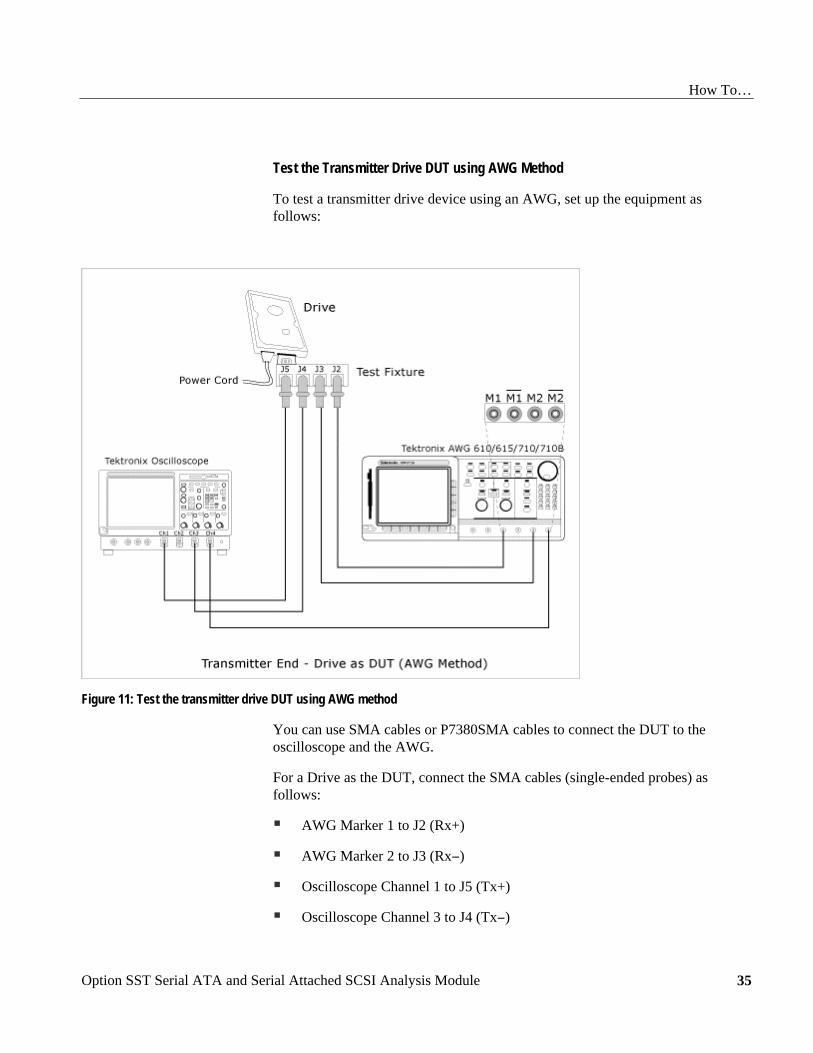
Test the Transmitter Drive DUT using AWG Method
To test a transmitter drive device using an AWG, set up the equipment as follows:
Figure 11: Test the transmitter drive DUT using AWG method
You can use SMA cables or P7380SMA cables to connect the DUT to the oscilloscope and the AWG.
For a Drive as the DUT, connect the SMA cables (single-ended probes) as follows:
AWG Marker 1 to J2 (Rx+)
AWG Marker 2 to J3 (Rx−)
Oscilloscope Channel 1 to J5 (Tx+)
Oscilloscope Channel 3 to J4 (Tx−)

How To…
Option SST Serial ATA and Serial Attached SCSI Analysis Module 36
Figure 12: Test the transmitter drive DUT using AWG method
For a Drive as the DUT, connect the P7380SMA cables (differential single-ended probes) as follows:
AWG Marker 1 to J2 (Rx+)
AWG Marker 2 to J3 (Rx−)
Oscilloscope Channel 1 or 3 to J5 (Tx+) and J4 (Tx−)
Note: If you use oscilloscope channels 1 and 3 for Tx+ and Tx−, then use oscilloscope channels 2 or 4 as trigger. If you use oscilloscope channels 2 and 4 for Tx+ and Tx−, then use oscilloscope channels 1 or 3 as trigger.
Note: When you use a P7380SMA probe, and if the peak-to-peak signal amplitude is more than 625 mV, set Attenuation Dynamic Range of the probe to 12.5X. If the signal peak to peak amplitude is less than 625 mV, set Attenuation Dynamic Range of the probe to 2.5X. Ensure that the V term Source is set to Auto.

How To…
Option SST Serial ATA and Serial Attached SCSI Analysis Module
37
Test the Transmitter Host DUT using BIST FIS/User Method
To test a transmitter host device using a vendor-specific method (or BIST FIS), set up the equipment as follows:
Figure 13: Test the transmitter host DUT using BIST FIS/User method
For a Host as the DUT, connect the SMA cables (single-ended probes) as follows:
Oscilloscope Channel 1 to J2 (Tx+)
Oscilloscope Channel 3 to J3 (Tx−)
How To…
Option SST Serial ATA and Serial Attached SCSI Analysis Module 38
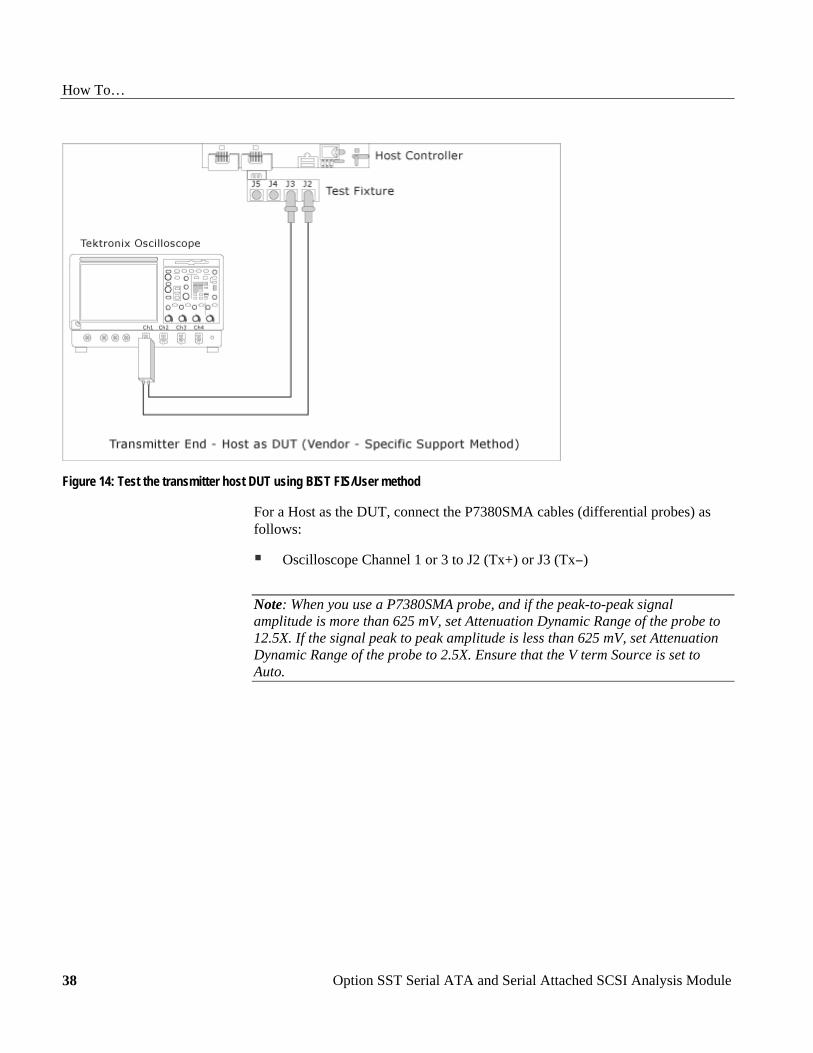
Figure 14: Test the transmitter host DUT using BIST FIS/User method
For a Host as the DUT, connect the P7380SMA cables (differential probes) as follows:
Oscilloscope Channel 1 or 3 to J2 (Tx+) or J3 (Tx−)
Note: When you use a P7380SMA probe, and if the peak-to-peak signal amplitude is more than 625 mV, set Attenuation Dynamic Range of the probe to 12.5X. If the signal peak to peak amplitude is less than 625 mV, set Attenuation Dynamic Range of the probe to 2.5X. Ensure that the V term Source is set to Auto.
How To…
Option SST Serial ATA and Serial Attached SCSI Analysis Module
39
Test the Transmitter Drive DUT using BIST FIS/User Method
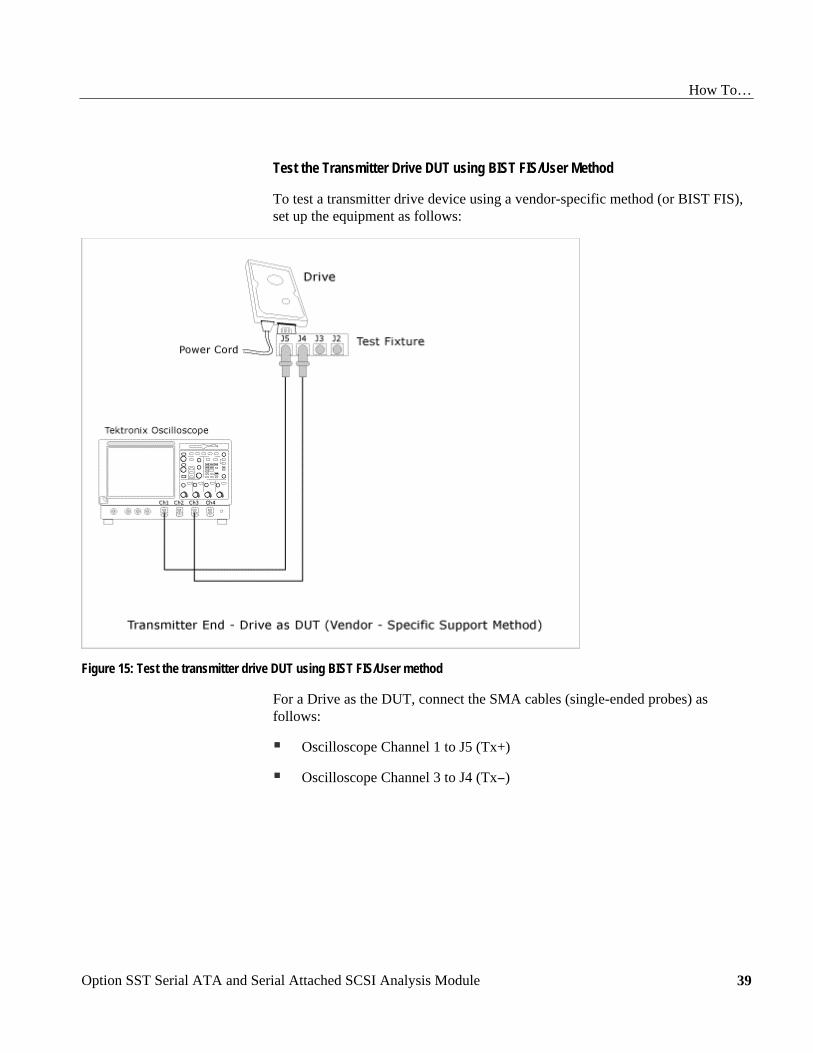
To test a transmitter drive device using a vendor-specific method (or BIST FIS), set up the equipment as follows:
Figure 15: Test the transmitter drive DUT using BIST FIS/User method
For a Drive as the DUT, connect the SMA cables (single-ended probes) as follows:
Oscilloscope Channel 1 to J5 (Tx+)
Oscilloscope Channel 3 to J4 (Tx−)

How To…
Option SST Serial ATA and Serial Attached SCSI Analysis Module 40
Figure 16: Test the transmitter drive DUT using BIST FIS/User method
For a Drive as the DUT, connect the P7380SMA cables (differential probes) as follows:
Oscilloscope Channel 1 or 3 to J5 (Tx+) and J4 (Tx−)
Note: When you use a P7380SMA probe, and if the peak-to-peak signal amplitude is more than 625 mV, set Attenuation Dynamic Range of the probe to 12.5X. If the signal peak to peak amplitude is less than 625 mV, set Attenuation Dynamic Range of the probe to 2.5X. Ensure that the V term Source is set to Auto.
How To…
Option SST Serial ATA and Serial Attached SCSI Analysis Module
41
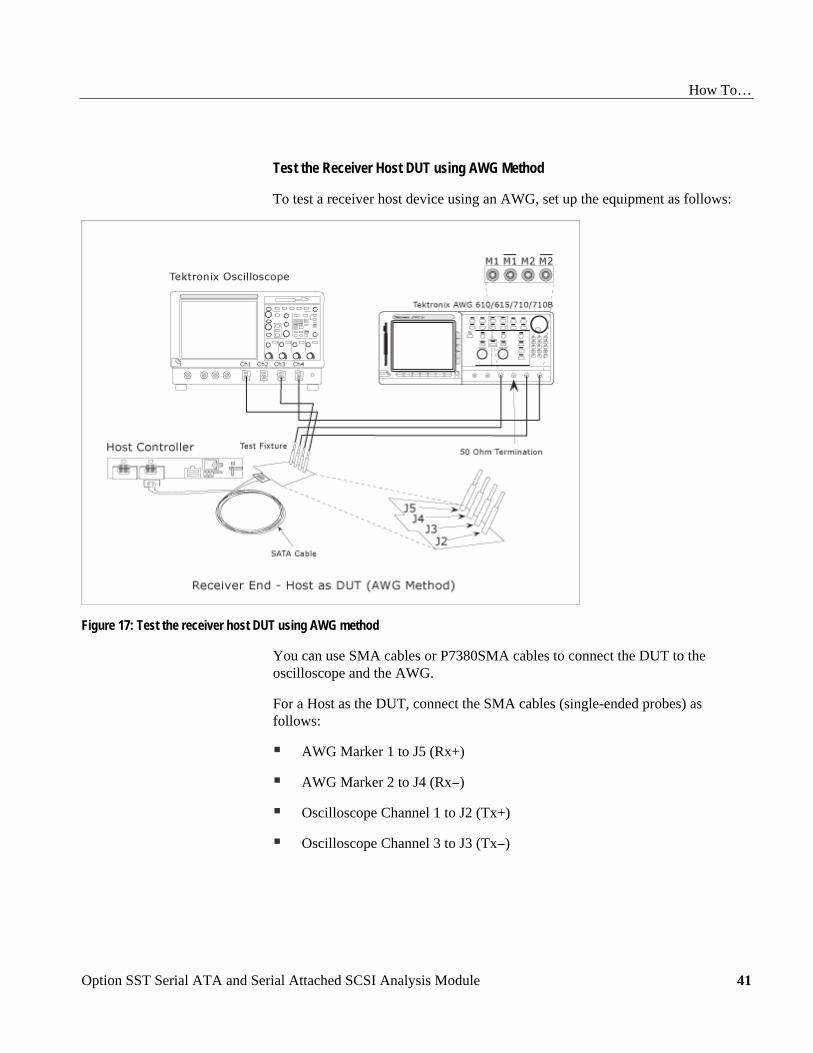
Test the Receiver Host DUT using AWG Method
To test a receiver host device using an AWG, set up the equipment as follows:
Figure 17: Test the receiver host DUT using AWG method
You can use SMA cables or P7380SMA cables to connect the DUT to the oscilloscope and the AWG.
For a Host as the DUT, connect the SMA cables (single-ended probes) as follows:
AWG Marker 1 to J5 (Rx+)
AWG Marker 2 to J4 (Rx−)
Oscilloscope Channel 1 to J2 (Tx+)
Oscilloscope Channel 3 to J3 (Tx−)
How To…
Option SST Serial ATA and Serial Attached SCSI Analysis Module 42
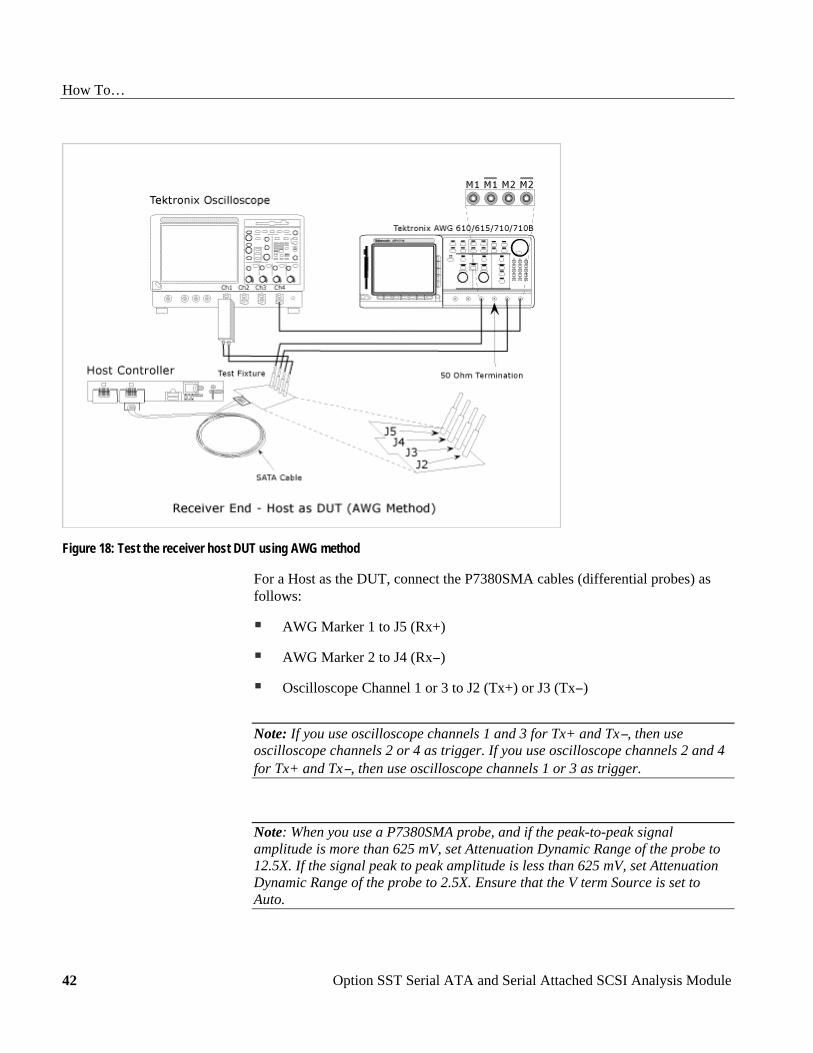
Figure 18: Test the receiver host DUT using AWG method
For a Host as the DUT, connect the P7380SMA cables (differential probes) as follows:
AWG Marker 1 to J5 (Rx+)
AWG Marker 2 to J4 (Rx−)
Oscilloscope Channel 1 or 3 to J2 (Tx+) or J3 (Tx−)
Note: If you use oscilloscope channels 1 and 3 for Tx+ and Tx−, then use oscilloscope channels 2 or 4 as trigger. If you use oscilloscope channels 2 and 4 for Tx+ and Tx−, then use oscilloscope channels 1 or 3 as trigger.
Note: When you use a P7380SMA probe, and if the peak-to-peak signal amplitude is more than 625 mV, set Attenuation Dynamic Range of the probe to 12.5X. If the signal peak to peak amplitude is less than 625 mV, set Attenuation Dynamic Range of the probe to 2.5X. Ensure that the V term Source is set to Auto.
How To…
Option SST Serial ATA and Serial Attached SCSI Analysis Module
43
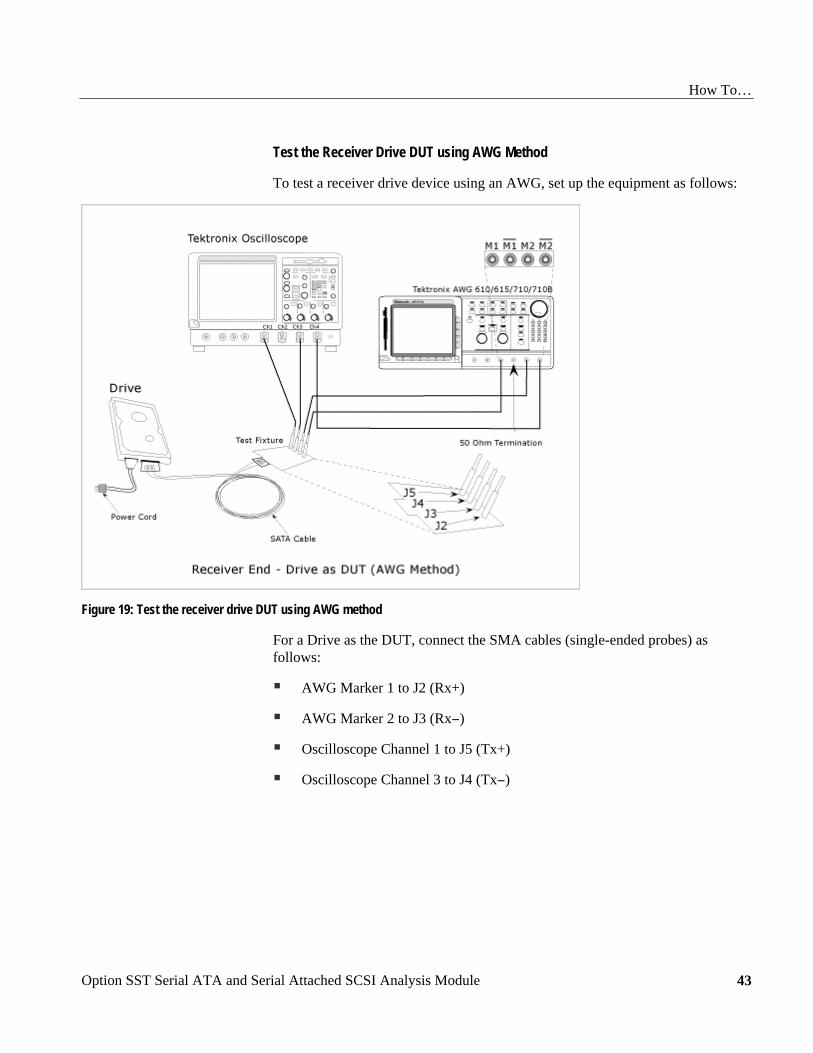
Test the Receiver Drive DUT using AWG Method
To test a receiver drive device using an AWG, set up the equipment as follows:
Figure 19: Test the receiver drive DUT using AWG method
For a Drive as the DUT, connect the SMA cables (single-ended probes) as follows:
AWG Marker 1 to J2 (Rx+)
AWG Marker 2 to J3 (Rx−)
Oscilloscope Channel 1 to J5 (Tx+)
Oscilloscope Channel 3 to J4 (Tx−)
How To…
Option SST Serial ATA and Serial Attached SCSI Analysis Module 44
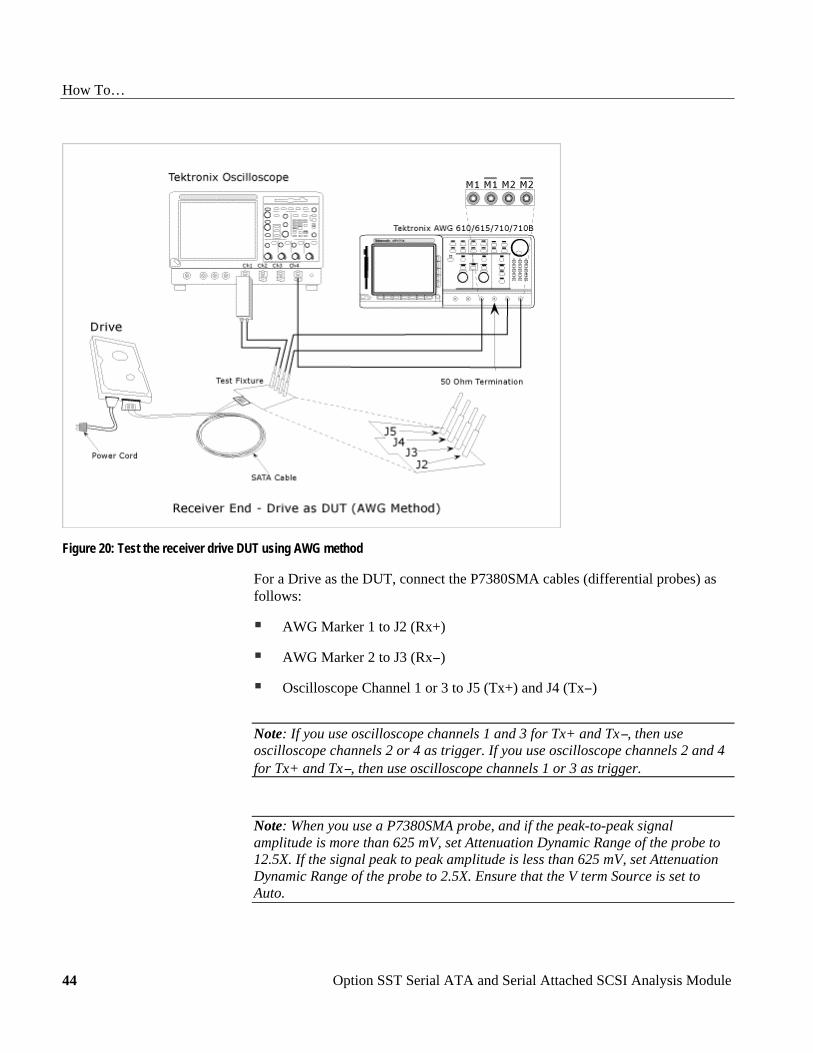
Figure 20: Test the receiver drive DUT using AWG method
For a Drive as the DUT, connect the P7380SMA cables (differential probes) as follows:
AWG Marker 1 to J2 (Rx+)
AWG Marker 2 to J3 (Rx−)
Oscilloscope Channel 1 or 3 to J5 (Tx+) and J4 (Tx−)
Note: If you use oscilloscope channels 1 and 3 for Tx+ and Tx−, then use oscilloscope channels 2 or 4 as trigger. If you use oscilloscope channels 2 and 4 for Tx+ and Tx−, then use oscilloscope channels 1 or 3 as trigger.
Note: When you use a P7380SMA probe, and if the peak-to-peak signal amplitude is more than 625 mV, set Attenuation Dynamic Range of the probe to 12.5X. If the signal peak to peak amplitude is less than 625 mV, set Attenuation Dynamic Range of the probe to 2.5X. Ensure that the V term Source is set to Auto.
How To…
Option SST Serial ATA and Serial Attached SCSI Analysis Module
45
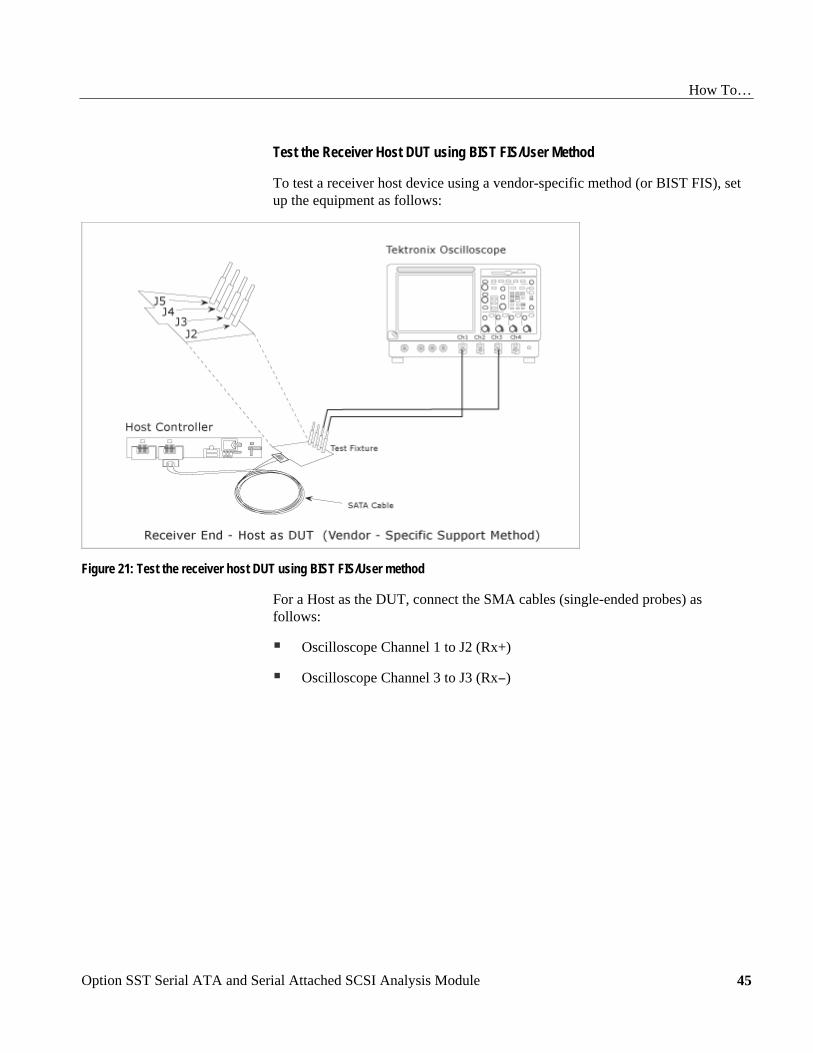
Test the Receiver Host DUT using BIST FIS/User Method
To test a receiver host device using a vendor-specific method (or BIST FIS), set up the equipment as follows:
Figure 21: Test the receiver host DUT using BIST FIS/User method
For a Host as the DUT, connect the SMA cables (single-ended probes) as follows:
Oscilloscope Channel 1 to J2 (Rx+)
Oscilloscope Channel 3 to J3 (Rx−)
How To…
Option SST Serial ATA and Serial Attached SCSI Analysis Module 46
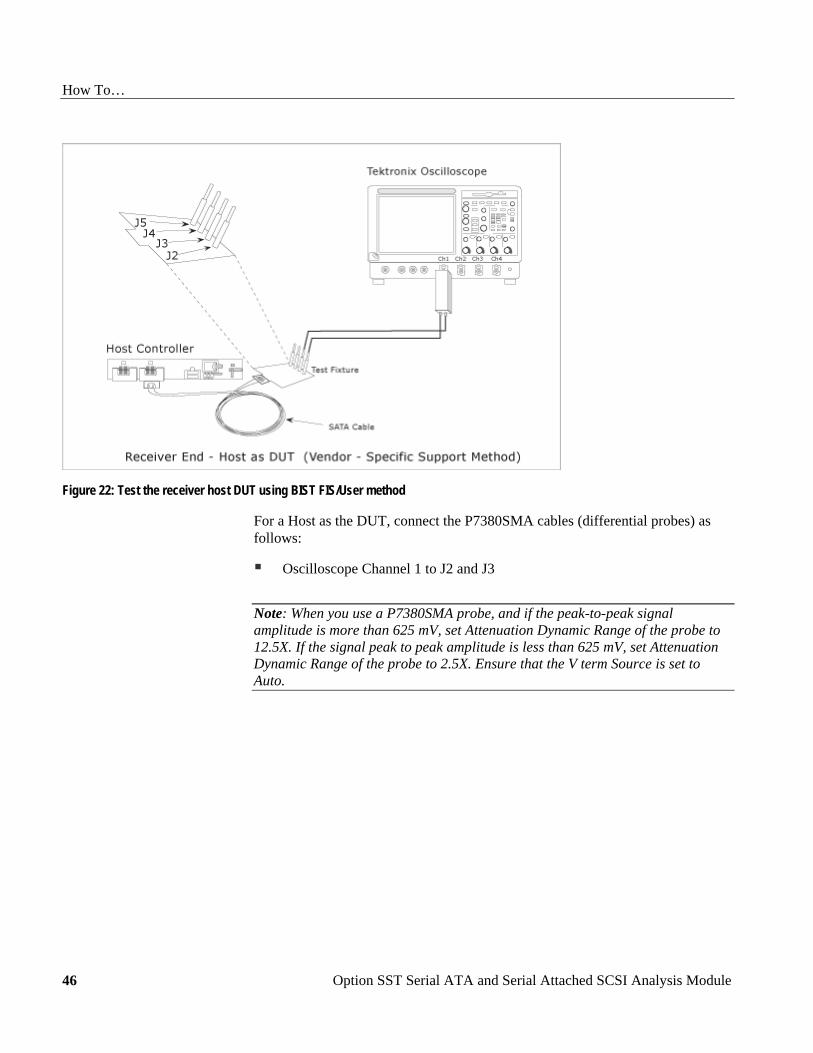
Figure 22: Test the receiver host DUT using BIST FIS/User method
For a Host as the DUT, connect the P7380SMA cables (differential probes) as follows:
Oscilloscope Channel 1 to J2 and J3
Note: When you use a P7380SMA probe, and if the peak-to-peak signal amplitude is more than 625 mV, set Attenuation Dynamic Range of the probe to 12.5X. If the signal peak to peak amplitude is less than 625 mV, set Attenuation Dynamic Range of the probe to 2.5X. Ensure that the V term Source is set to Auto.
How To…
Option SST Serial ATA and Serial Attached SCSI Analysis Module
47
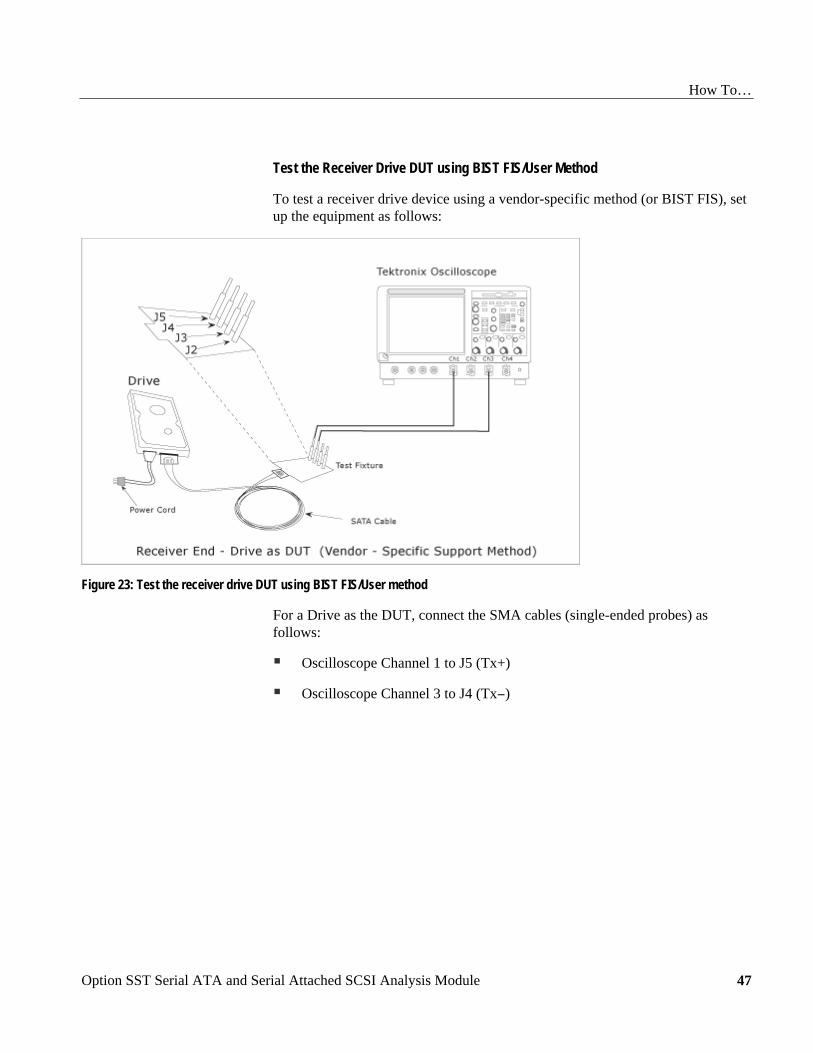
Test the Receiver Drive DUT using BIST FIS/User Method
To test a receiver drive device using a vendor-specific method (or BIST FIS), set up the equipment as follows:
Figure 23: Test the receiver drive DUT using BIST FIS/User method
For a Drive as the DUT, connect the SMA cables (single-ended probes) as follows:
Oscilloscope Channel 1 to J5 (Tx+)
Oscilloscope Channel 3 to J4 (Tx−)
How To…
Option SST Serial ATA and Serial Attached SCSI Analysis Module 48
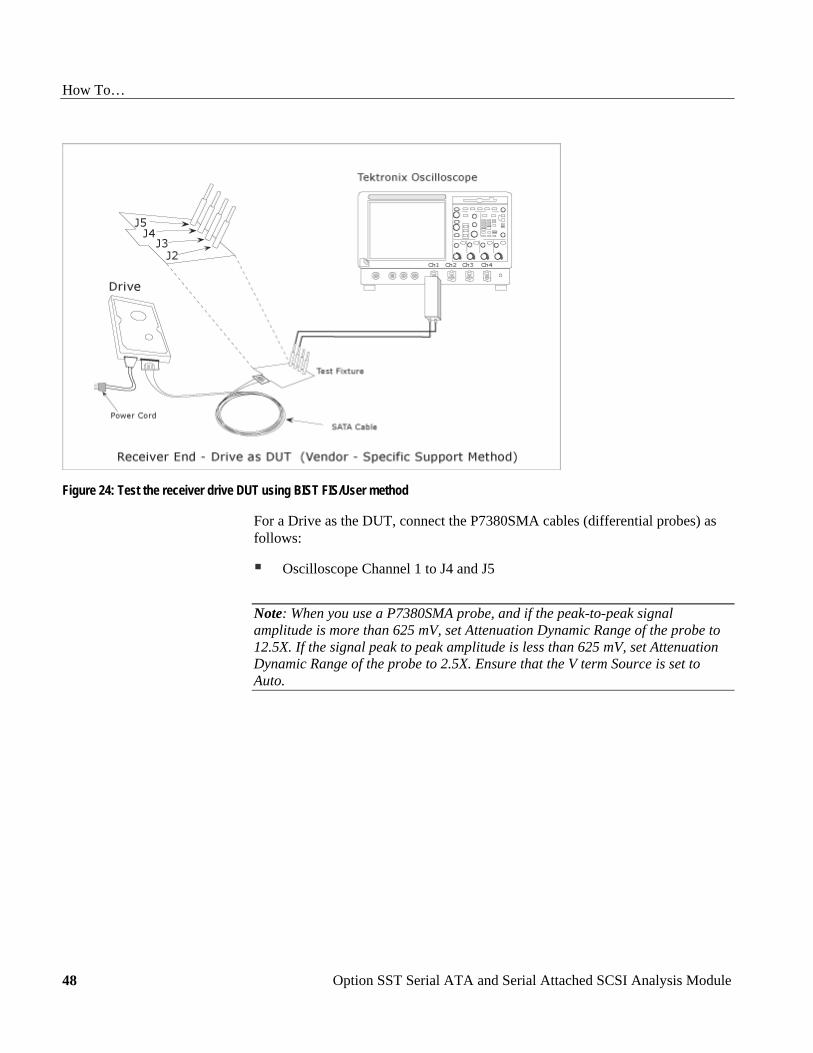
Figure 24: Test the receiver drive DUT using BIST FIS/User method
For a Drive as the DUT, connect the P7380SMA cables (differential probes) as follows:
Oscilloscope Channel 1 to J4 and J5
Note: When you use a P7380SMA probe, and if the peak-to-peak signal amplitude is more than 625 mV, set Attenuation Dynamic Range of the probe to 12.5X. If the signal peak to peak amplitude is less than 625 mV, set Attenuation Dynamic Range of the probe to 2.5X. Ensure that the V term Source is set to Auto.
How To…
Option SST Serial ATA and Serial Attached SCSI Analysis Module
49
Select and Configure SATA Measurements
Select SATA Measurements
To select a measurement, select Measurements> Select from the menu bar. The following screen appears:
Figure 25: Measurements screen
The Serial ATA measurements that are available for transmitter and receiver devices are as follows:
Table 16: SATA measurements for transmitter and receiver MeasurementsDevice
Timing Amplitude Out Of BandTransmitter Eye, Bit Rate,
Differential Skew*, Riseand Fall Time, UnitInterval
DifferentialVoltage, AC CMVoltage*
COMINIT,COMWAKE,COMRESET
Receiver Eye, Bit Rate,Differential Skew*, Riseand Fall Time, UnitInterval
DifferentialVoltage, AC CMVoltage*
−
* These measurements are available only when you use a single-ended probe(SMA cable).
You can select one or more Timing measurements at a time by clicking the buttons. You can select all Timing measurements by clicking the Select All button.

How To…
Option SST Serial ATA and Serial Attached SCSI Analysis Module 50
Configure SATA Measurements
To configure one or more measurements, select Measurements> Configure from the application menu bar, or click the Configure button in the Measurement screen.
The Configure screen has the following tabs: Source, General Config, Clock Config, and Plot Config. The Plot Config tab, with parameters to generate an eye diagram, is available only for the Eye Measurement.
Figure 26: Configure Source panel for a single-ended probe
Figure 27: Configure Source panel for a differential probe
How To…
Option SST Serial ATA and Serial Attached SCSI Analysis Module
51
Figure 28: Configure General Config panel
Figure 29: Configure Clock Config panel
How To…
Option SST Serial ATA and Serial Attached SCSI Analysis Module 52
Figure 30: Configure Plot Config panel
The following table lists the configuration parameters for the Serial ATA measurements:

How To…
Option SST Serial ATA and Serial Attached SCSI Analysis Module
53

How To…
Option SST Serial ATA and Serial Attached SCSI Analysis Module 54
Enter Device Details
You can enter the details of the device that you are testing.
Figure 31: Enter device details
To do this, follow these steps:
1. Select Measurements> Select from the application menu.
2. Under Device, type the device ID that you want to use. You can also use the virtual keyboard to enter the text.
3. Click Edit Description to type in a description of the device or edit an existing description. You can also use the virtual keyboard to enter the text.
Virtual Keyboard
Virtual Keyboard - Numeric
1. Click any number box to display the icon for the numeric keyboard.
2. Click the icon to display the numeric keyboard.
How To…
Option SST Serial ATA and Serial Attached SCSI Analysis Module
55
Figure 32: Virtual keyboard - Numeric
3. Click the number keys to enter the desired value.
4. Select a unit of measure.
5. Click Enter to confirm your entry. Selections are not effective until you click Enter.
Virtual Keyboard - Text
1. Click any text box to display the icon for the text keyboard.
2. Click the icon to display the text keyboard.
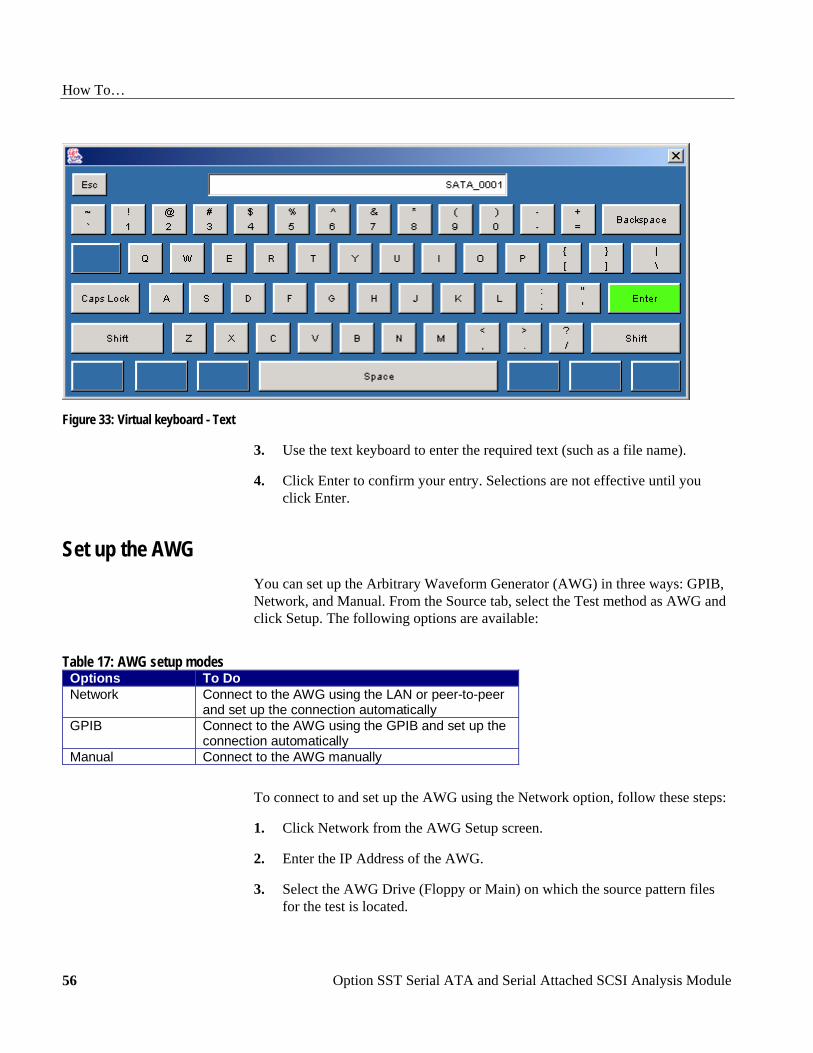
How To…
Option SST Serial ATA and Serial Attached SCSI Analysis Module 56
Figure 33: Virtual keyboard - Text
3. Use the text keyboard to enter the required text (such as a file name).
4. Click Enter to confirm your entry. Selections are not effective until you click Enter.
Set up the AWG You can set up the Arbitrary Waveform Generator (AWG) in three ways: GPIB, Network, and Manual. From the Source tab, select the Test method as AWG and click Setup. The following options are available:
Table 17: AWG setup modes Options To DoNetwork Connect to the AWG using the LAN or peer-to-peer
and set up the connection automaticallyGPIB Connect to the AWG using the GPIB and set up the
connection automaticallyManual Connect to the AWG manually
To connect to and set up the AWG using the Network option, follow these steps:
1. Click Network from the AWG Setup screen.
2. Enter the IP Address of the AWG.
3. Select the AWG Drive (Floppy or Main) on which the source pattern files for the test is located.
How To…
Option SST Serial ATA and Serial Attached SCSI Analysis Module
57
4. Click Test Connection to verify whether the oscilloscope is connected correctly to the AWG. When you click Test Connection, the application:
Detects the AWG model
Sets the AWG marker values
Sets the AWG clock speed
To connect to and set up the AWG using the GPIB option, follow these steps:
1. Click GPIB from the AWG Setup screen.
2. Select the Board Type, GPIB Address (Primary and Secondary), and the Time Out value.
3. Select the AWG Drive (Floppy or Main) on which the source pattern files for the test is located.
4. Click Test Connection to verify whether the oscilloscope is connected correctly to the AWG. When you click Test Connection, the application:
Detects the AWG model
Sets the AWG marker values
Sets the AWG clock speed
To connect to and set up the AWG using the Manual option, follow these steps:
1. Click Manual from the AWG Setup screen.
2. Select the AWG Type from the AWG Setup screen.
3. Follow the on-screen prompts to connect the AWG and the oscilloscope.
Perform SATA Tests for Transmitter
Transmitter Measurements
Timing measurements that are available for a Serial ATA Transmitter are Eye, Bit Rate, Differential Skew, Rise and Fall Time, and Unit Interval. You can select one or more measurements at a time. You can select all measurements by clicking the Select All button. The Differential Skew measurement is available only when you use a single-ended probe (SMA cable).
Amplitude measurements that are available for a Serial ATA Transmitter are Differential Voltage and AC CM Voltage. The AC CM Voltage measurement is available only when you use a single-ended probe (SMA cable).

How To…
Option SST Serial ATA and Serial Attached SCSI Analysis Module 58
Out Of Band (OOB) Signaling Tests are available for a Serial ATA Transmitter. The OOB tests that are supported by the Serial ATA module are COMINIT, COMWAKE, and COMRESET.
Perform Transmitter Eye, Unit Interval, and Bit Rate Tests Follow these steps to measure the Eye, Unit Interval, and Bit Rate for a transmitter.
1. Set up the DUT (Host or Drive) as shown in the How To Set up the DUT section.
2. Select Measurements> Select from the menu bar.
3. Select Test Point as Transmitter and Probe Type as Single-ended or Differential.
4. Click Eye, Unit Interval, and Bit Rate. You can select any one or all of them.
5. To change the configuration settings, select Measurements> Configure from the menu bar or click the Configure button.
In the Source tab, click Live, Ref, or File. If you are using a single-ended probe, select the channels for D+ and D−, and the Trigger channel. The trigger channels available exclude those channels that you have selected as D+ D−. Select the Test Method. For the BIST FIS/User test method, Trigger option is not available.
How To…
Option SST Serial ATA and Serial Attached SCSI Analysis Module
59
Table 18: Source parameters for a single-ended probe Select Parameter Options To DoTest Method AWG, BIST FIS/User Select the test method to
use. The module uses thesource pattern fileslocated on the AWG, oruses a vendor-specificmethod to test the DUT
Live Select D+ D− Ch1 Ch3, Ch1 Ch4,Ch2 Ch3, Ch2 Ch4
Set the channel pair fromwhich to acquire data
Trigger Ch1, Ch2, Ch3, Ch4 Set the channel fromwhich to acquire triggerdata
Ref Select D+ D− Ref1 Ref2, Ref1 Ref3,Ref1 Ref4, Ref2 Ref1,Ref2 Ref3, Ref2 Ref4,Ref3 Ref1, Ref3 Ref2,Ref3 Ref4, Ref4 Ref1,Ref4 Ref2, Ref4 Ref3
Set the Ref channel pairfrom which to acquiredata
File Select File(s)D+ D−
Browse Load the data from .csvfiles
For a differential probe, the source parameters are:
Table 19: Source parameters for a differential probe Select Parameter Options To DoTest Method AWG, BIST FIS/User Select the test method to
use. The module uses thesource pattern fileslocated on the AWG, oruses a vendor-specificmethod to test the DUT
Live/Ref Select Ch1, Ch2, Ch3, Ch4,Ref1, Ref2, Ref3, Ref4
Set the channel fromwhich to acquire data
Trigger Ch1, Ch2, Ch3, Ch4 Set the channel fromwhich to acquire triggerdata
File Select File Browse Load the data from a .csvfile
If you choose Live/Ref and select a Ref channel from which to acquire data, then the Trigger selection is not available.
In the General Config tab, set the Device Type, Usage model, Number of UI, and Cable Attenuation.
How To…
Option SST Serial ATA and Serial Attached SCSI Analysis Module 60
Table 20: General configuration parameters Parameter Options To doUsage Model Gen1i, Gen1x, Gen1m,
Gen2i, Gen2x, Gen2mSelect the generation towhich the device belongs
Device Type Host, Drive Select the type of device totest
Num of UI 6k, 12k, 30k, 60k, 120k Select the number of unitintervals for which to acquiredata
Cable Attn Range: 100 p-10 G Type the cable attenuationor enter the value within therange from the numerickeypad
In the Clock Config tab, set the Clock Recovery parameters, and Analysis Window size.
Table 21: Clock configuration parameters Parameter Options To doWindow Size Range: 1000-5000 UI Type the clock recovery
window size or enter the valuefrom the numeric keypad
Scan Incr Range: 1-250 UI Type the scan increment valueor enter it from the numerickeypad
Method Const Clk: MeanConst Clk: Median
Select the clock recoverymethod to use to recover thesignal clock
Analysis Window 250 UI, 5 UI Set the analysis window to oneof the two
Note: If the Analysis Window is set to 5 UI, sufficient number of unit intervals may not be available to calculate the transition and non-transition eye heights. While scanning, these two calculations may fail to complete. You can expect the message "Unable to calculate transition eye height/non-transition eye height". It is recommended that you select All Bits option in the plot configuration when the Analysis Window is 5 UI.
6. From the Control panel, select the mode (Single Run or Single No Acq).
7. Click the Start button to start taking the measurement. When the measurement is complete, the summary of the results and plots are displayed.

How To…
Option SST Serial ATA and Serial Attached SCSI Analysis Module
61
8. If the results are not automatically displayed, select Results> Summary to view the results. To view detailed results, select Results> Details.
Perform Transmitter Differential Skew Test Follow these steps to measure the Differential Skew for a transmitter.
1. Set up the DUT (Host or Drive) as shown in the How To Set up the DUT section. Refer to the setup that uses single-ended probes (SMA cable).
2. Select Measurements> Select from the menu bar.
3. Select Test Point as Transmitter and Probe Type as Single-ended. This measurement is not available for a Differential probe.
4. Click Differential Skew.
5. To change the configuration settings, select Measurements> Configure from the menu bar or click the Configure button.
In the Source tab, click Live, Ref, or File. Select the channels for D+ and D−, and the Trigger channel. The trigger channels available exclude those channels that you have selected as D+ D−. Select the Test Method. For the BIST FIS/User test method, Trigger option is not available.

How To…
Option SST Serial ATA and Serial Attached SCSI Analysis Module 62
Table 22: Source configuration parameters Select Parameter Options To DoTest Method AWG, BIST FIS/User Select the test method to
use. The module uses thesource pattern fileslocated on the AWG, oruses a vendor-specificmethod to test the DUT
Live Select D+ D− Ch1 Ch3, Ch1 Ch4,Ch2 Ch3, Ch2 Ch4
Set the channel pair fromwhich to acquire data
Trigger Ch1, Ch2, Ch3, Ch4 Set the channel fromwhich to acquire triggerdata
Ref Select D+ D− Ref1 Ref2, Ref1Ref3,Ref1 Ref4, Ref2 Ref1,Ref2 Ref3, Ref2 Ref4,Ref3 Ref1, Ref3 Ref2,Ref3 Ref4, Ref4 Ref1,Ref4 Ref2, Ref4 Ref3
Set the Ref channel pairfrom which to acquiredata
File Select File(s)D+ D−
Browse Load the data from .csvfiles
In the General Config tab, set the Device Type, Cable Attenuation, and Usage model.
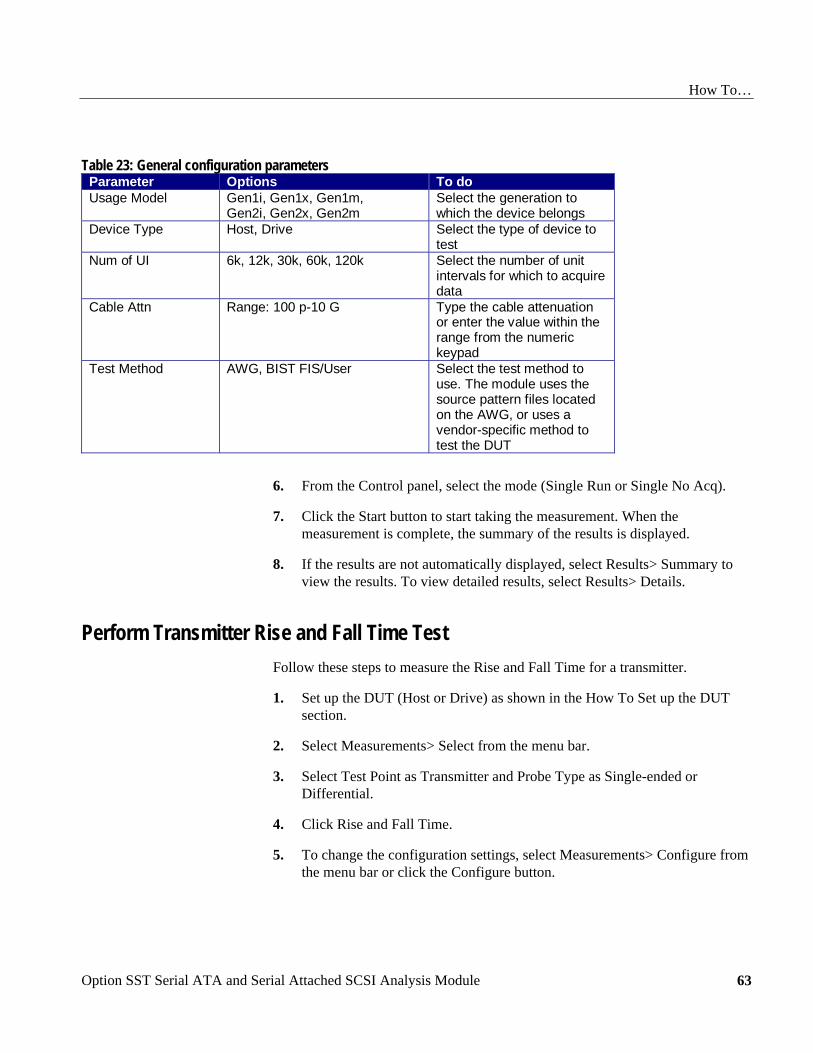
How To…
Option SST Serial ATA and Serial Attached SCSI Analysis Module
63
Table 23: General configuration parameters Parameter Options To doUsage Model Gen1i, Gen1x, Gen1m,
Gen2i, Gen2x, Gen2mSelect the generation towhich the device belongs
Device Type Host, Drive Select the type of device totest
Num of UI 6k, 12k, 30k, 60k, 120k Select the number of unitintervals for which to acquiredata
Cable Attn Range: 100 p-10 G Type the cable attenuationor enter the value within therange from the numerickeypad
Test Method AWG, BIST FIS/User Select the test method touse. The module uses thesource pattern files locatedon the AWG, or uses avendor-specific method totest the DUT
6. From the Control panel, select the mode (Single Run or Single No Acq).
7. Click the Start button to start taking the measurement. When the measurement is complete, the summary of the results is displayed.
8. If the results are not automatically displayed, select Results> Summary to view the results. To view detailed results, select Results> Details.
Perform Transmitter Rise and Fall Time Test Follow these steps to measure the Rise and Fall Time for a transmitter.
1. Set up the DUT (Host or Drive) as shown in the How To Set up the DUT section.
2. Select Measurements> Select from the menu bar.
3. Select Test Point as Transmitter and Probe Type as Single-ended or Differential.
4. Click Rise and Fall Time.
5. To change the configuration settings, select Measurements> Configure from the menu bar or click the Configure button.

How To…
Option SST Serial ATA and Serial Attached SCSI Analysis Module 64
In the Source tab, click Live, Ref, or File. If you are using a single-ended probe, select the channels for D+ and D−, and the Trigger channel. The trigger channels available exclude those channels that you have selected as D+ D−. Select the Test Method. For the BIST FIS/User test method, Trigger option is not available.
Table 24: Source configuration parameters for a single-ended probe Select Parameter Options To DoTest Method AWG, BIST FIS/User Select the test method to
use. The module uses thesource pattern fileslocated on the AWG, oruses a vendor-specificmethod to test the DUT
Live Select D+ D− Ch1 Ch3, Ch1 Ch4,Ch2 Ch3, Ch2 Ch4
Set the channel pair fromwhich to acquire data
Trigger Ch1, Ch2, Ch3, Ch4 Set the channel fromwhich to acquire triggerdata
Ref Select D+ D− Ref1 Ref2, Ref1 Ref3,Ref1 Ref4, Ref2 Ref1,Ref2 Ref3, Ref2 Ref4,Ref3 Ref1, Ref3 Ref2,Ref3 Ref4, Ref4 Ref1,Ref4 Ref2, Ref4 Ref3
Set the Ref channel pairfrom which to acquiredata
File Select File(s)D+ D−
Browse Load the data from .csvfiles

How To…
Option SST Serial ATA and Serial Attached SCSI Analysis Module
65
For a differential probe, the parameters are:
Table 25: Source configuration parameters for a differential probe Select Parameter Options To DoTest Method AWG, BIST FIS/User Select the test method to
use. The module uses thesource pattern fileslocated on the AWG, oruses a vendor-specificmethod to test the DUT
Live/Ref Select Ch1, Ch2, Ch3, Ch4,Ref1, Ref2, Ref3, Ref4
Set the channel toacquire data from
Trigger Ch1, Ch2, Ch3, Ch4 Set the channel toacquire trigger data from
File Select File Browse Load the data from a .csvfile
If you choose Live/Ref and select a Ref channel from which to acquire data, then the Trigger selection is not available.
In the General Config tab, set the Device Type, Cable Attenuation, Number of UI, and Usage model.
Table 26: General configuration Parameter Options To DoUsage Model Gen1i, Gen1x, Gen1m,
Gen2i, Gen2x, Gen2mSelect the generation towhich the device belongs
Device Type Host, Drive Select the type of device totest
Num of UI 6k,12k, 30k, 60k, 120k Select the number of unitintervals for which to acquiredata
Cable Attn Range: 100 p-10 G Type the cable attenuationor enter the value within therange from the numerickeypad
6. From the Control panel, select the mode (Single Run or Single No Acq).
7. Click the Start button to start taking the measurement. When the measurement is complete, the summary of the results is displayed.
8. If the results are not automatically displayed, select Results> Summary to view the results. To view detailed results, select Results> Details.
How To…
Option SST Serial ATA and Serial Attached SCSI Analysis Module 66
Perform Transmitter Differential Voltage Test Follow these steps to measure the Differential Voltage for a transmitter.
1. Set up the DUT (Host or Drive) as shown in the How To Set up the DUT section.
2. Select Measurements> Select from the menu bar.
3. Select Test Point as Transmitter and Probe Type as Single-ended or Differential.
4. Click Differential Voltage.
5. To change the configuration settings, select Measurements> Configure from the menu bar or click the Configure button.
In the Source tab, click Live, Ref, or File. If you are using a single-ended probe, select the channels for D+ and D−. Select the Test Method.
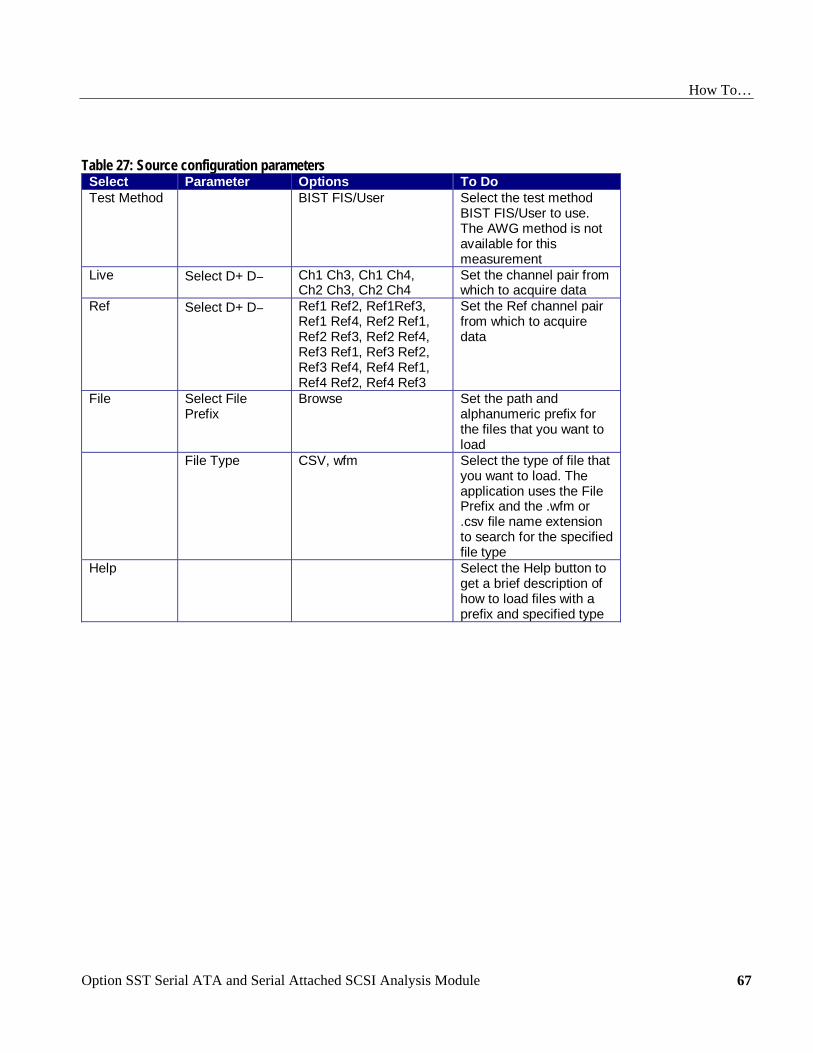
How To…
Option SST Serial ATA and Serial Attached SCSI Analysis Module
67
Table 27: Source configuration parameters Select Parameter Options To DoTest Method BIST FIS/User Select the test method
BIST FIS/User to use.The AWG method is notavailable for thismeasurement
Live Select D+ D− Ch1 Ch3, Ch1 Ch4,Ch2 Ch3, Ch2 Ch4
Set the channel pair fromwhich to acquire data
Ref Select D+ D− Ref1 Ref2, Ref1Ref3,Ref1 Ref4, Ref2 Ref1,Ref2 Ref3, Ref2 Ref4,Ref3 Ref1, Ref3 Ref2,Ref3 Ref4, Ref4 Ref1,Ref4 Ref2, Ref4 Ref3
Set the Ref channel pairfrom which to acquiredata
File Select FilePrefix
Browse Set the path andalphanumeric prefix forthe files that you want toload
File Type CSV, wfm Select the type of file thatyou want to load. Theapplication uses the FilePrefix and the .wfm or.csv file name extensionto search for the specifiedfile type
Help Select the Help button toget a brief description ofhow to load files with aprefix and specified type

How To…
Option SST Serial ATA and Serial Attached SCSI Analysis Module 68
For a differential probe, the source parameters are:
Table 28: Source configuration parameters Select Parameter Options To DoTest Method BIST FIS/User Select the test method
BIST FIS/User to use.The AWG method is notavailable for thismeasurement
Live/Ref Select Ch1, Ch2, Ch3, Ch4,Ref1, Ref2, Ref3, Ref4
Set the channel fromwhich to acquire data
File Select FilePrefix
Browse Set the path andalphanumeric prefix forthe files that you want toload
File Type CSV, wfm Select the type of file thatyou want to load. Theapplication uses the FilePrefix and the .wfm or.csv file name extensionto search for the specifiedfile type
Help Select the Help button toget a brief description ofhow to load files with aprefix and specified type
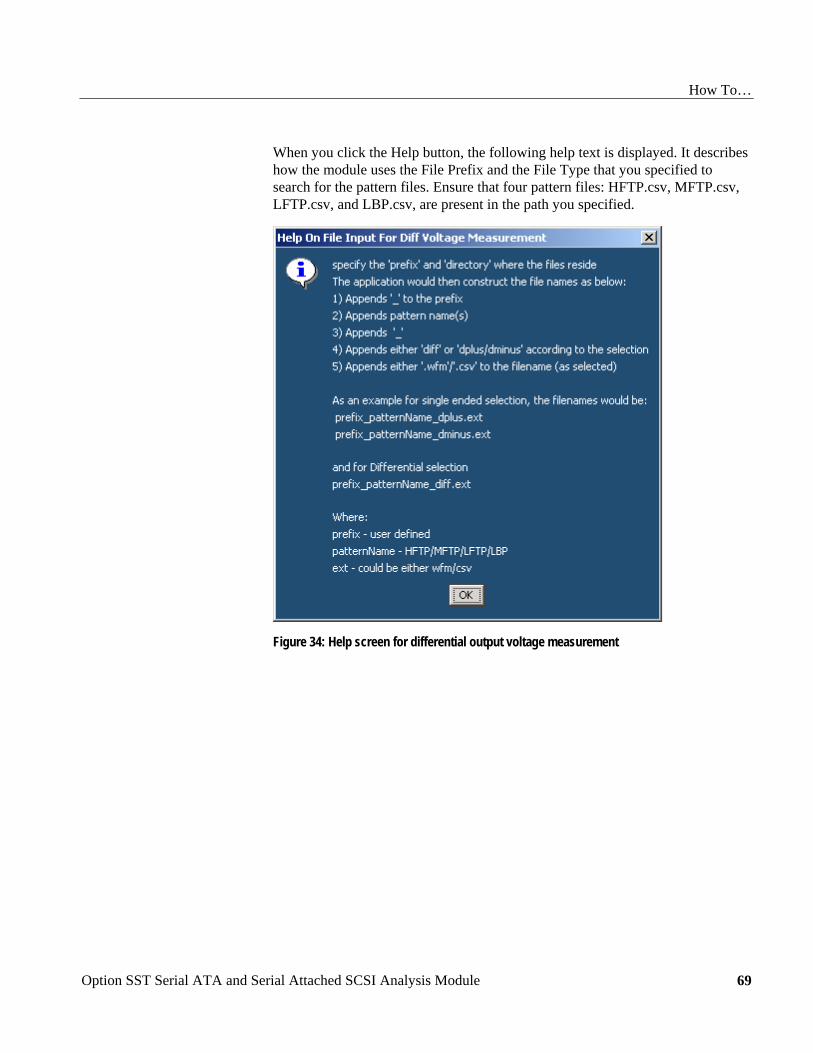
How To…
Option SST Serial ATA and Serial Attached SCSI Analysis Module
69
When you click the Help button, the following help text is displayed. It describes how the module uses the File Prefix and the File Type that you specified to search for the pattern files. Ensure that four pattern files: HFTP.csv, MFTP.csv, LFTP.csv, and LBP.csv, are present in the path you specified.
Figure 34: Help screen for differential output voltage measurement

How To…
Option SST Serial ATA and Serial Attached SCSI Analysis Module 70
In the General Config tab, set the Device Type, Cable Attenuation, Usage model, Number of UI, and Differential Volt Option.
Table 29: General configuration parameters Parameter Options To doUsage Model Gen1i, Gen1x, Gen1m,
Gen2i, Gen2x, Gen2mSelect the generation towhich the device belongs
Device Type Host, Drive Select the type of device totest
Num of UI 6k, 12k, 30k, 60k, 120k Select the number of unitintervals for which to acquiredata
Cable Attn Range: 100 p-10 G Type the cable attenuationor enter the value within therange from the numerickeypad
Diff Volt Option Option1, Option2 Select Option1 to use thelone bit pattern, and Option2to if no lone bit pattern isavailable
6. From the Control panel, select the mode (Single Run or Single No Acq).
7. Click the Start button to start taking the measurement. When the measurement is complete, the summary of the results is displayed.
8. If the results are not automatically displayed, select Results> Summary to view the results. The Time Units option is the results summary is not available for this test. To view detailed results, select Results> Details.
The following warnings might appear while performing this test. The possible solutions and explanations are also given.
Min. Voltage sample criteria failed. For details refer OLH. Solution: Increase the number of unit intervals and try again.
Max. Voltage sample criteria failed. For details refer OLH. Solution: Increase the number of unit intervals and try again.
LBP pattern mismatch. Performing Minimum voltage measurement using Option 2. Explanation: If LBP pattern is not available or not compliant, the application performs the measurement using differential voltage Option2.
The input pattern is not spec-compliant. The software selected compliant bit transitions in order to approximate the differential voltage measurement. Explanation: When the input pattern does not match with the standard
How To…
Option SST Serial ATA and Serial Attached SCSI Analysis Module
71
definition, the application approximates the pattern definition and displays the results.
Perform Transmitter AC CM Voltage Test Follow these steps to measure the AC Common Mode Voltage for a transmitter.
1. Set up the DUT (Host or Drive) as shown in the How To Set up the DUT section. Refer to the setup that uses single-ended probes.
2. Select Measurements> Select from the menu bar.
3. Select Test Point as Transmitter and Probe Type as Single-ended.
4. Click AC CM Voltage.
5. To change the configuration settings, select Measurements> Configure from the menu bar or click the Configure button.
In the Source tab, click Live, Ref, or File. Select the channels for D+ and D−, and the Trigger channel. The trigger channels available exclude those channels that you have selected as D+ D−. Select the Test Method.
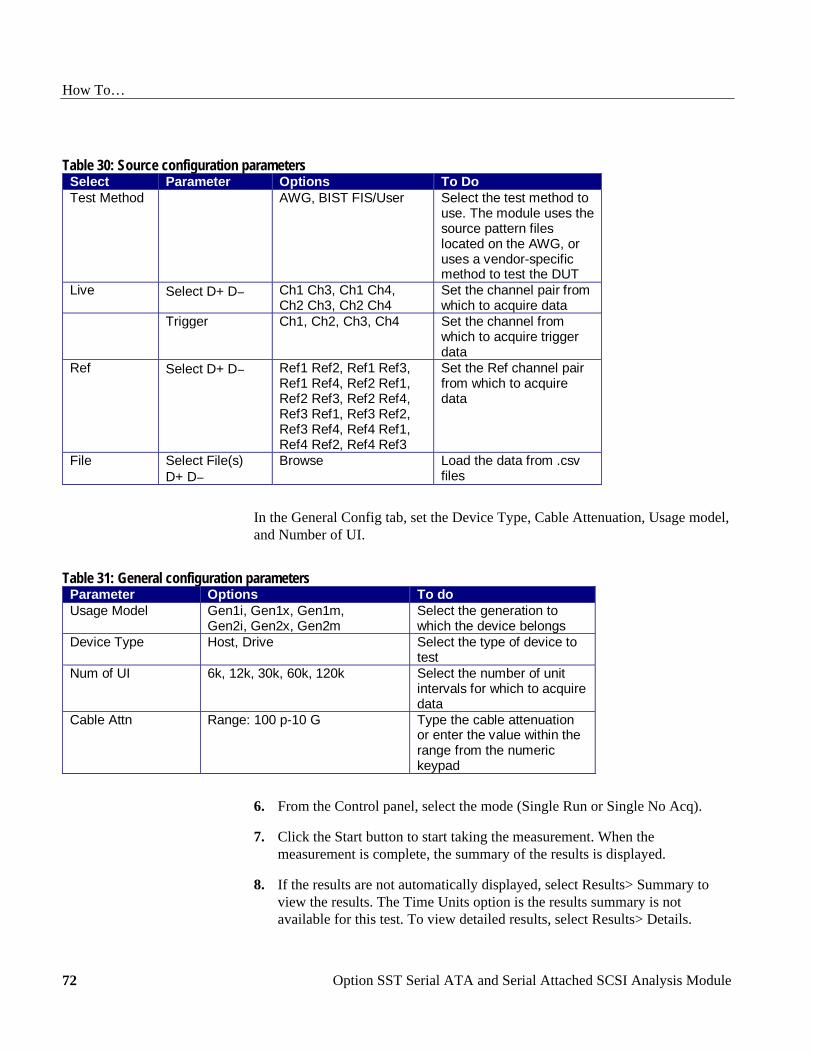
How To…
Option SST Serial ATA and Serial Attached SCSI Analysis Module 72
Table 30: Source configuration parameters Select Parameter Options To DoTest Method AWG, BIST FIS/User Select the test method to
use. The module uses thesource pattern fileslocated on the AWG, oruses a vendor-specificmethod to test the DUT
Live Select D+ D− Ch1 Ch3, Ch1 Ch4,Ch2 Ch3, Ch2 Ch4
Set the channel pair fromwhich to acquire data
Trigger Ch1, Ch2, Ch3, Ch4 Set the channel fromwhich to acquire triggerdata
Ref Select D+ D− Ref1 Ref2, Ref1 Ref3,Ref1 Ref4, Ref2 Ref1,Ref2 Ref3, Ref2 Ref4,Ref3 Ref1, Ref3 Ref2,Ref3 Ref4, Ref4 Ref1,Ref4 Ref2, Ref4 Ref3
Set the Ref channel pairfrom which to acquiredata
File Select File(s)D+ D−
Browse Load the data from .csvfiles
In the General Config tab, set the Device Type, Cable Attenuation, Usage model, and Number of UI.
Table 31: General configuration parameters Parameter Options To doUsage Model Gen1i, Gen1x, Gen1m,
Gen2i, Gen2x, Gen2mSelect the generation towhich the device belongs
Device Type Host, Drive Select the type of device totest
Num of UI 6k, 12k, 30k, 60k, 120k Select the number of unitintervals for which to acquiredata
Cable Attn Range: 100 p-10 G Type the cable attenuationor enter the value within therange from the numerickeypad
6. From the Control panel, select the mode (Single Run or Single No Acq).
7. Click the Start button to start taking the measurement. When the measurement is complete, the summary of the results is displayed.
8. If the results are not automatically displayed, select Results> Summary to view the results. The Time Units option is the results summary is not available for this test. To view detailed results, select Results> Details.
How To…
Option SST Serial ATA and Serial Attached SCSI Analysis Module
73
Perform Transmitter COMINIT, COMWAKE, and COMRESET Tests Follow these steps to perform the COMINIT, COMWAKE, and COMRESET Tests for a transmitter.
1. Set up the DUT (Host or Drive) as shown in the How To Set up the DUT section. Refer to the test setup for transmitter device that uses the AWG test method.
2. Select Measurements> Select from the menu bar.
3. Select Test Point as Transmitter and Probe Type as Single-ended or Differential.
4. Click any one of the OOB tests: COMINIT, COMWAKE, or COMRESET.
5. To change the configuration settings, select Measurements> Configure from the menu bar or click the Configure button.
In the Source tab, click Live. If you are using a single-ended probe, select the channels for D+ and D−, and the Trigger channel. The trigger channels available exclude those channels that you have selected as D+ D−. Select the Test Method.
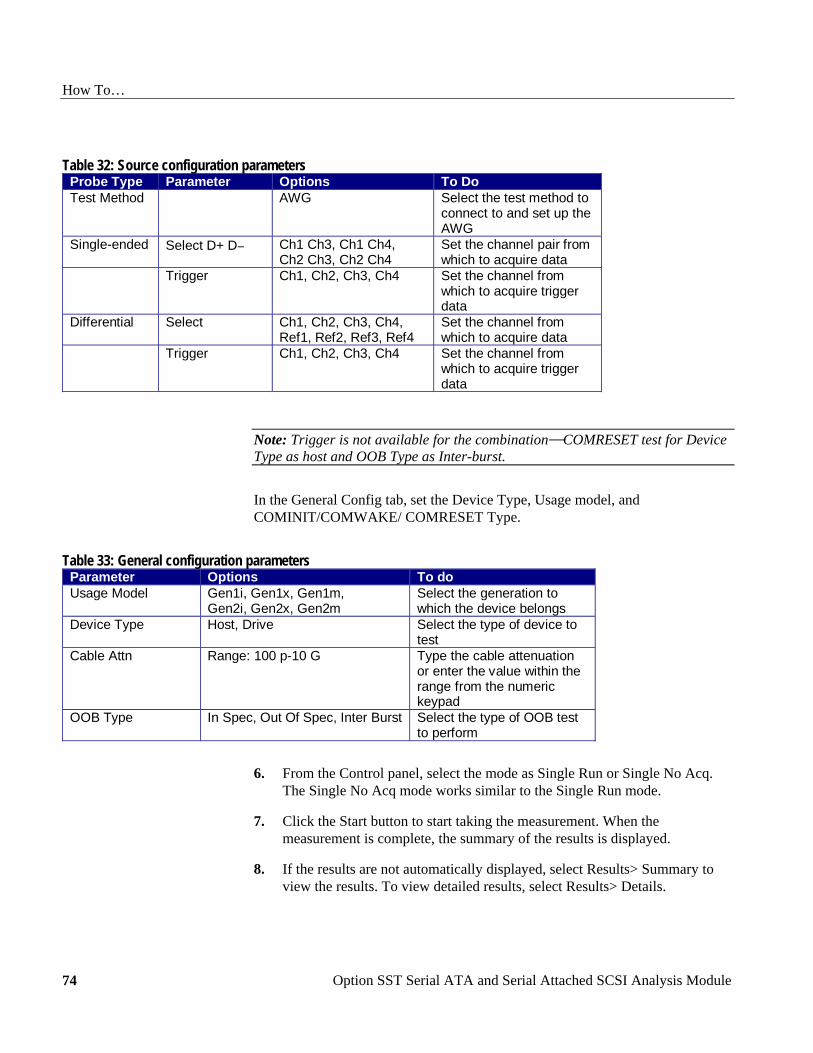
How To…
Option SST Serial ATA and Serial Attached SCSI Analysis Module 74
Table 32: Source configuration parameters Probe Type Parameter Options To DoTest Method AWG Select the test method to
connect to and set up theAWG
Single-ended Select D+ D− Ch1 Ch3, Ch1 Ch4,Ch2 Ch3, Ch2 Ch4
Set the channel pair fromwhich to acquire data
Trigger Ch1, Ch2, Ch3, Ch4 Set the channel fromwhich to acquire triggerdata
Differential Select Ch1, Ch2, Ch3, Ch4,Ref1, Ref2, Ref3, Ref4
Set the channel fromwhich to acquire data
Trigger Ch1, Ch2, Ch3, Ch4 Set the channel fromwhich to acquire triggerdata
Note: Trigger is not available for the combination⎯COMRESET test for Device Type as host and OOB Type as Inter-burst.
In the General Config tab, set the Device Type, Usage model, and COMINIT/COMWAKE/ COMRESET Type.
Table 33: General configuration parameters Parameter Options To doUsage Model Gen1i, Gen1x, Gen1m,
Gen2i, Gen2x, Gen2mSelect the generation towhich the device belongs
Device Type Host, Drive Select the type of device totest
Cable Attn Range: 100 p-10 G Type the cable attenuationor enter the value within therange from the numerickeypad
OOB Type In Spec, Out Of Spec, Inter Burst Select the type of OOB testto perform
6. From the Control panel, select the mode as Single Run or Single No Acq.
The Single No Acq mode works similar to the Single Run mode.
7. Click the Start button to start taking the measurement. When the measurement is complete, the summary of the results is displayed.
8. If the results are not automatically displayed, select Results> Summary to view the results. To view detailed results, select Results> Details.

How To…
Option SST Serial ATA and Serial Attached SCSI Analysis Module
75
Perform SATA Tests for Receiver
Receiver Measurements
Timing measurements that are available for a Serial ATA Receiver are Eye, Bit Rate, Differential Skew, Rise and Fall Time, and Unit Interval. You can select one or more measurements at a time. You can select all measurements by clicking the Select All button. The Differential Skew measurement is available only when you use a single-ended probe.
Amplitude measurements that are available for a Serial ATA Receiver are Differential Voltage and AC CM Voltage. The AC CM Voltage measurement is available only when you use a single-ended probe.
Perform Receiver Eye, Unit Interval, and Bit Rate Tests Follow these steps to measure the Eye, Unit Interval, and Bit Rate for a receiver.
1. Set up the DUT (Host or Drive) as shown in the How To Set up the DUT section.
2. Select Measurements> Select from the menu bar.
3. Select Test Point as Receiver and Probe Type as Single-ended or Differential.
4. Click Eye, Unit Interval, and Bit Rate.
5. To change the configuration settings, select Measurements> Configure from the menu bar or click the Configure button.
In the Source tab, click Live, Ref, or File. If you are using a single-ended probe, select the channels for D+ and D−, and the Trigger channel. The trigger channels available exclude those channels that you have selected as D+ D−.
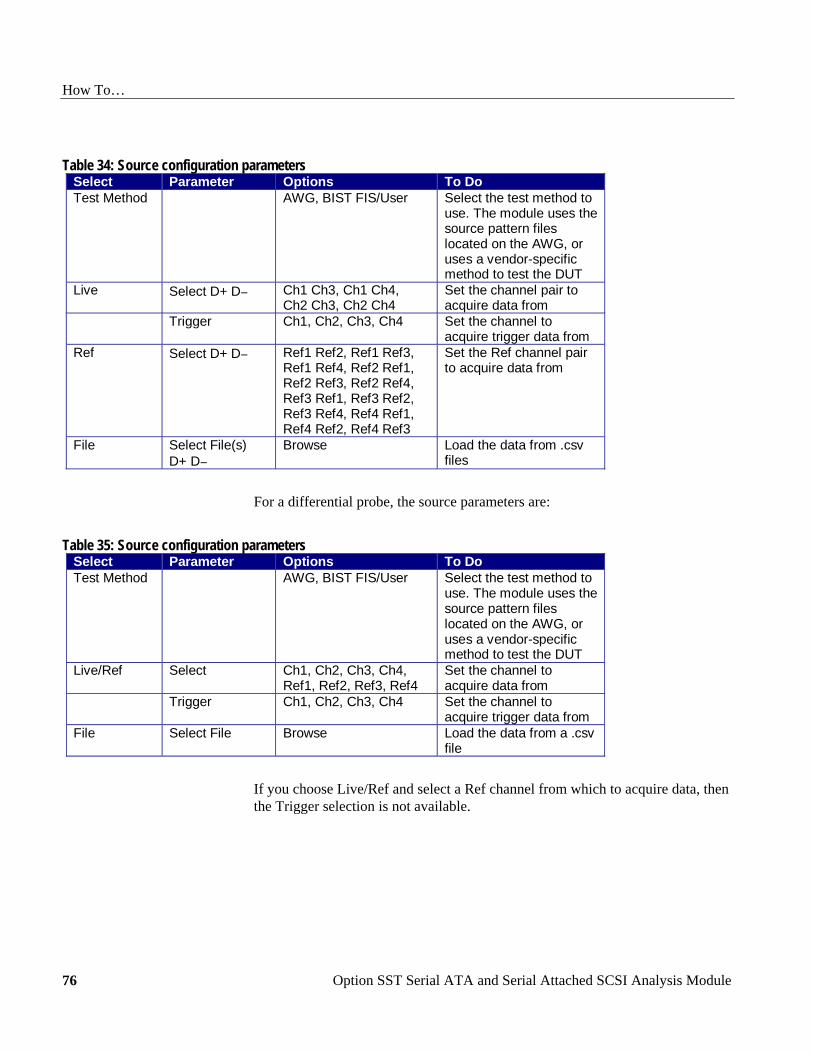
How To…
Option SST Serial ATA and Serial Attached SCSI Analysis Module 76
Table 34: Source configuration parameters Select Parameter Options To DoTest Method AWG, BIST FIS/User Select the test method to
use. The module uses thesource pattern fileslocated on the AWG, oruses a vendor-specificmethod to test the DUT
Live Select D+ D− Ch1 Ch3, Ch1 Ch4,Ch2 Ch3, Ch2 Ch4
Set the channel pair toacquire data from
Trigger Ch1, Ch2, Ch3, Ch4 Set the channel toacquire trigger data from
Ref Select D+ D− Ref1 Ref2, Ref1 Ref3,Ref1 Ref4, Ref2 Ref1,Ref2 Ref3, Ref2 Ref4,Ref3 Ref1, Ref3 Ref2,Ref3 Ref4, Ref4 Ref1,Ref4 Ref2, Ref4 Ref3
Set the Ref channel pairto acquire data from
File Select File(s)D+ D−
Browse Load the data from .csvfiles
For a differential probe, the source parameters are:
Table 35: Source configuration parameters Select Parameter Options To DoTest Method AWG, BIST FIS/User Select the test method to
use. The module uses thesource pattern fileslocated on the AWG, oruses a vendor-specificmethod to test the DUT
Live/Ref Select Ch1, Ch2, Ch3, Ch4,Ref1, Ref2, Ref3, Ref4
Set the channel toacquire data from
Trigger Ch1, Ch2, Ch3, Ch4 Set the channel toacquire trigger data from
File Select File Browse Load the data from a .csvfile
If you choose Live/Ref and select a Ref channel from which to acquire data, then the Trigger selection is not available.
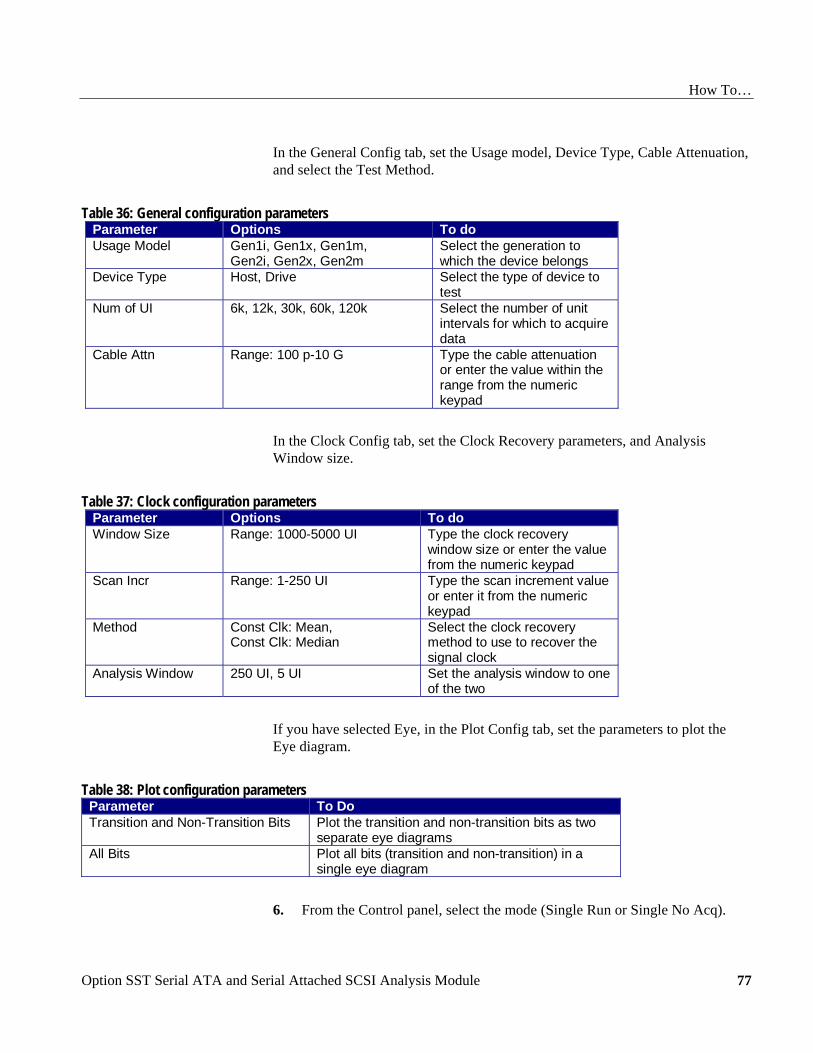
How To…
Option SST Serial ATA and Serial Attached SCSI Analysis Module
77
In the General Config tab, set the Usage model, Device Type, Cable Attenuation, and select the Test Method.
Table 36: General configuration parameters Parameter Options To doUsage Model Gen1i, Gen1x, Gen1m,
Gen2i, Gen2x, Gen2mSelect the generation towhich the device belongs
Device Type Host, Drive Select the type of device totest
Num of UI 6k, 12k, 30k, 60k, 120k Select the number of unitintervals for which to acquiredata
Cable Attn Range: 100 p-10 G Type the cable attenuationor enter the value within therange from the numerickeypad
In the Clock Config tab, set the Clock Recovery parameters, and Analysis Window size.
Table 37: Clock configuration parameters Parameter Options To doWindow Size Range: 1000-5000 UI Type the clock recovery
window size or enter the valuefrom the numeric keypad
Scan Incr Range: 1-250 UI Type the scan increment valueor enter it from the numerickeypad
Method Const Clk: Mean,Const Clk: Median
Select the clock recoverymethod to use to recover thesignal clock
Analysis Window 250 UI, 5 UI Set the analysis window to oneof the two
If you have selected Eye, in the Plot Config tab, set the parameters to plot the Eye diagram.
Table 38: Plot configuration parameters Parameter To DoTransition and Non-Transition Bits Plot the transition and non-transition bits as two
separate eye diagramsAll Bits Plot all bits (transition and non-transition) in a
single eye diagram
6. From the Control panel, select the mode (Single Run or Single No Acq).

How To…
Option SST Serial ATA and Serial Attached SCSI Analysis Module 78
7. Click the Start button to start taking the measurement. When the measurement is complete, the summary of the results is displayed.
8. If the results are not automatically displayed, select Results> Summary to view the results. To view detailed results, select Results> Details. For an Eye measurement, you can view a plot of the transition and non-transition bits as separate plots or all bits as a single plot.
Perform Receiver Differential Skew Test Follow these steps to measure the Differential Skew for a receiver.
1. Set up the DUT (Host or Drive) as shown in the How To Set up the DUT section.
2. Select Measurements> Select from the menu bar.
3. Select Test Point as Receiver and Probe Type as Single-ended.
4. Click Differential Skew.
5. To change the configuration settings, select Measurements> Configure from the menu bar or click the Configure button.
In the Source tab, click Live, Ref, or File. Select the channels for D+ and D−, and the Trigger channel. The trigger channels available exclude those channels that you have selected as D+ D−. Select the Test Method.
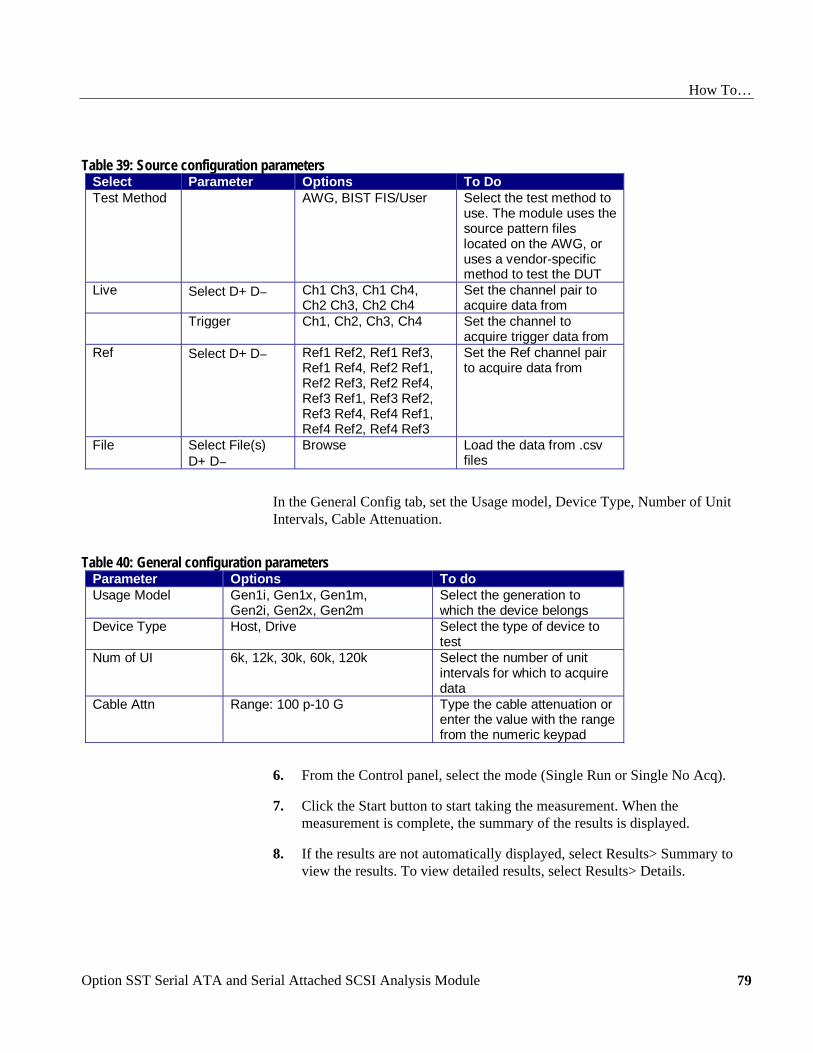
How To…
Option SST Serial ATA and Serial Attached SCSI Analysis Module
79
Table 39: Source configuration parameters Select Parameter Options To DoTest Method AWG, BIST FIS/User Select the test method to
use. The module uses thesource pattern fileslocated on the AWG, oruses a vendor-specificmethod to test the DUT
Live Select D+ D− Ch1 Ch3, Ch1 Ch4,Ch2 Ch3, Ch2 Ch4
Set the channel pair toacquire data from
Trigger Ch1, Ch2, Ch3, Ch4 Set the channel toacquire trigger data from
Ref Select D+ D− Ref1 Ref2, Ref1 Ref3,Ref1 Ref4, Ref2 Ref1,Ref2 Ref3, Ref2 Ref4,Ref3 Ref1, Ref3 Ref2,Ref3 Ref4, Ref4 Ref1,Ref4 Ref2, Ref4 Ref3
Set the Ref channel pairto acquire data from
File Select File(s)D+ D−
Browse Load the data from .csvfiles
In the General Config tab, set the Usage model, Device Type, Number of Unit Intervals, Cable Attenuation.
Table 40: General configuration parameters Parameter Options To doUsage Model Gen1i, Gen1x, Gen1m,
Gen2i, Gen2x, Gen2mSelect the generation towhich the device belongs
Device Type Host, Drive Select the type of device totest
Num of UI 6k, 12k, 30k, 60k, 120k Select the number of unitintervals for which to acquiredata
Cable Attn Range: 100 p-10 G Type the cable attenuation orenter the value with the rangefrom the numeric keypad
6. From the Control panel, select the mode (Single Run or Single No Acq).
7. Click the Start button to start taking the measurement. When the measurement is complete, the summary of the results is displayed.
8. If the results are not automatically displayed, select Results> Summary to view the results. To view detailed results, select Results> Details.

How To…
Option SST Serial ATA and Serial Attached SCSI Analysis Module 80
Perform Receiver Rise Time and Fall Time Test Follow these steps to measure the Rise and Fall Time for a receiver.
1. Set up the DUT (Host or Drive) as shown in the How To Set up the DUT section.
2. Select Measurements> Select from the menu bar.
3. Select Test Point as Receiver and Probe Type as Single-ended or Differential.
4. Click Rise and Fall Time.
5. To change the configuration settings, select Measurements> Configure from the menu bar or click the Configure button.
In the Source tab, click Live, Ref, or File. If you are using a single-ended probe, select the channels for D+ and D−, and the Trigger channel. The trigger channels available exclude those channels that you have selected as D+ D−. Select the Test Method.
Table 41: Source configuration parameters Select Parameter Options To DoTest Method AWG, BIST FIS/User Select the test method to
use. The module uses thesource pattern fileslocated on the AWG, oruses a vendor-specificmethod to test the DUT
Live Select D+ D− Ch1 Ch3, Ch1 Ch4,Ch2 Ch3, Ch2 Ch4
Set the channel pair fromwhich to acquire data
Trigger Ch1, Ch2, Ch3, Ch4 Set the channel fromwhich to acquire triggerdata
Ref Select D+ D− Ref1 Ref2, Ref1 Ref3,Ref1 Ref4, Ref2 Ref1,Ref2 Ref3, Ref2 Ref4,Ref3 Ref1, Ref3 Ref2,Ref3 Ref4, Ref4 Ref1,Ref4 Ref2, Ref4 Ref3
Set the Ref channel pairfrom which to acquiredata
File Select File(s)D+ D−
Browse Load the data from .csvfiles

How To…
Option SST Serial ATA and Serial Attached SCSI Analysis Module
81
For a differential probe, the source parameters are:
Table 42: Source configuration parameters Select Parameter Options To DoTest Method AWG, BIST FIS/User Select the test method to
use. The module uses thesource pattern fileslocated on the AWG, oruses a vendor-specificmethod to test the DUT
Live/Ref Select Ch1, Ch2, Ch3, Ch4,Ref1, Ref2, Ref3, Ref4
Set the channel toacquire data from
Trigger Ch1, Ch2, Ch3, Ch4 Set the channel toacquire trigger data from
File Select File Browse Load the data from a .csvfile
If you choose Live/Ref and select a Ref channel from which to acquire data, then the Trigger selection is not available.
In the General Config tab, set the Device Type, Usage model, and Number of UI.
Table 43: General configuration parameters Parameter Options To doUsage Model Gen1i, Gen1x, Gen1m,
Gen2i, Gen2x, Gen2mSelect the generation towhich the device belongs
Device Type Host, Drive Select the type of device totest
Num of UI 6k, 12k, 30k, 60k, 120k Select the number of unitintervals for which to acquiredata
Cable Attn Range: 100 p-10 G Type the cable attenuationor enter the value within therange from the numerickeypad
6. From the Control panel, select the mode (Single Run or Single No Acq)
7. Click the Start button to start taking the measurement. When the measurement is complete, the summary of the results is displayed.
8. If the results are not automatically displayed, select Results> Summary to view the results. To view detailed results, select Results> Details.

How To…
Option SST Serial ATA and Serial Attached SCSI Analysis Module 82
Perform Receiver Differential Voltage Test Follow these steps to measure the Differential Voltage for a receiver.
1. Set up the DUT (Host or Drive) as shown in the How To Set up the DUT section.
2. Select Measurements> Select from the menu bar.
3. Select Test Point as Receiver and Probe Type as Single-ended or Differential.
4. Click Differential Voltage.
5. To change the configuration settings, select Measurements> Configure from the menu bar or click the Configure button.
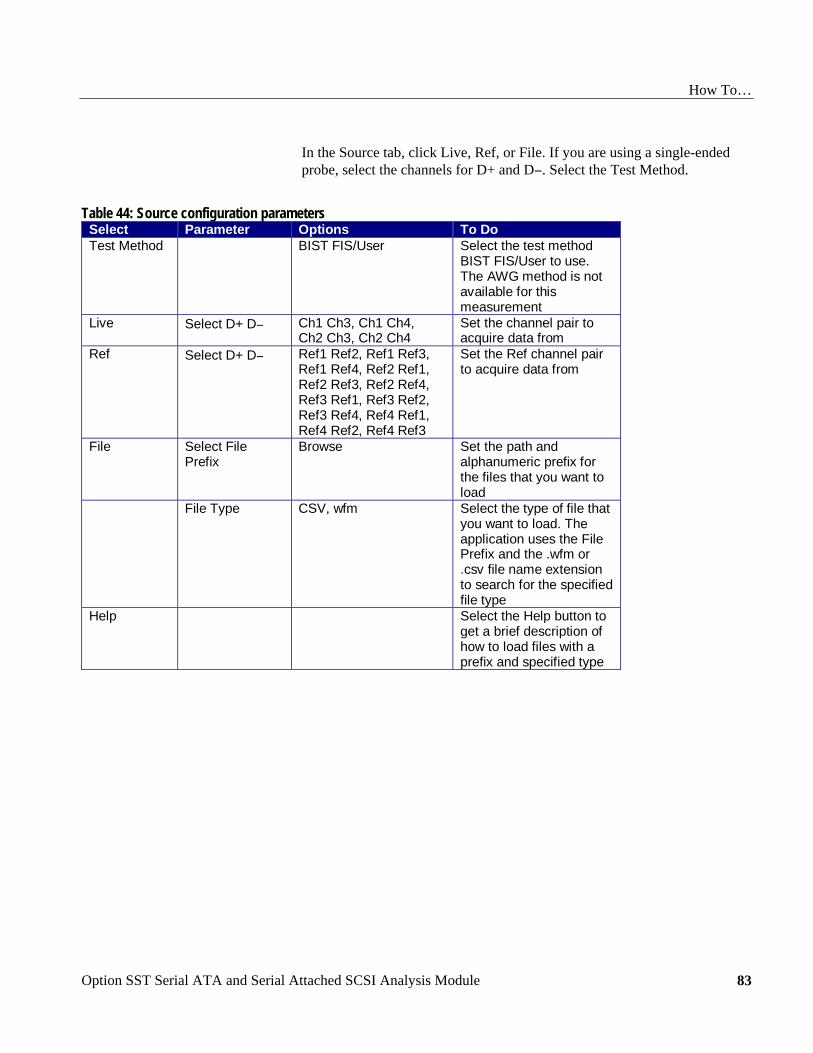
How To…
Option SST Serial ATA and Serial Attached SCSI Analysis Module
83
In the Source tab, click Live, Ref, or File. If you are using a single-ended probe, select the channels for D+ and D−. Select the Test Method.
Table 44: Source configuration parameters Select Parameter Options To DoTest Method BIST FIS/User Select the test method
BIST FIS/User to use.The AWG method is notavailable for thismeasurement
Live Select D+ D− Ch1 Ch3, Ch1 Ch4,Ch2 Ch3, Ch2 Ch4
Set the channel pair toacquire data from
Ref Select D+ D− Ref1 Ref2, Ref1 Ref3,Ref1 Ref4, Ref2 Ref1,Ref2 Ref3, Ref2 Ref4,Ref3 Ref1, Ref3 Ref2,Ref3 Ref4, Ref4 Ref1,Ref4 Ref2, Ref4 Ref3
Set the Ref channel pairto acquire data from
File Select FilePrefix
Browse Set the path andalphanumeric prefix forthe files that you want toload
File Type CSV, wfm Select the type of file thatyou want to load. Theapplication uses the FilePrefix and the .wfm or.csv file name extensionto search for the specifiedfile type
Help Select the Help button toget a brief description ofhow to load files with aprefix and specified type
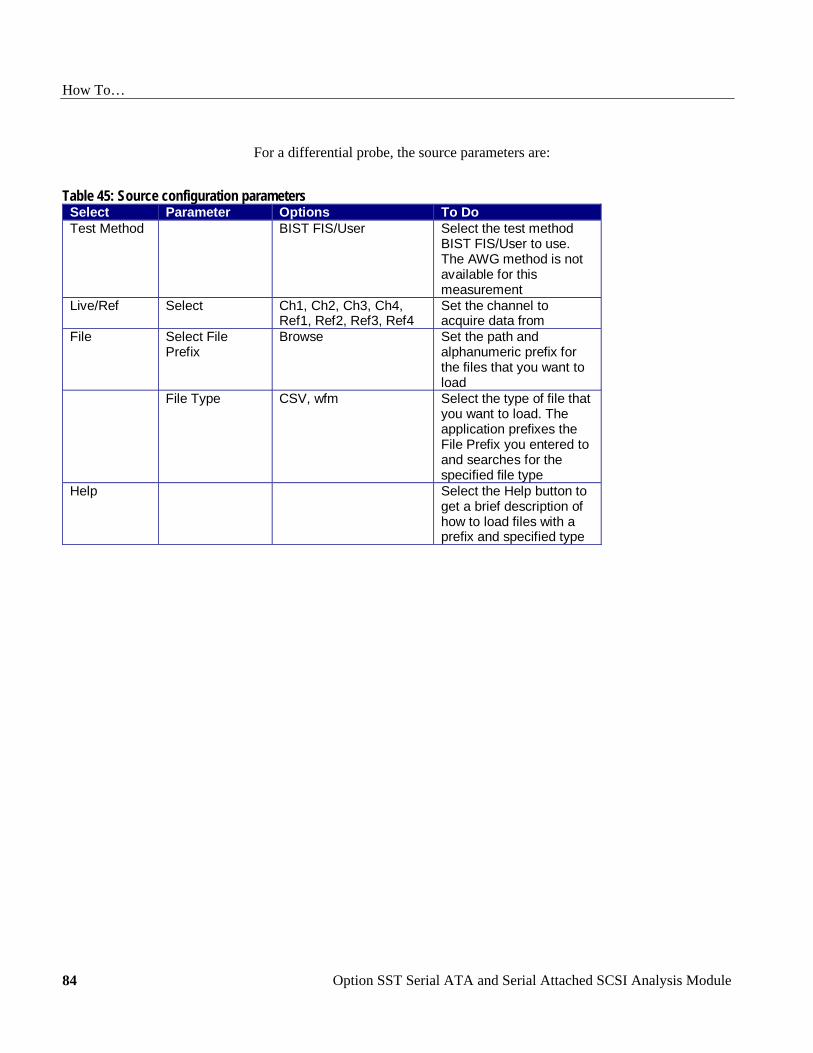
How To…
Option SST Serial ATA and Serial Attached SCSI Analysis Module 84
For a differential probe, the source parameters are:
Table 45: Source configuration parameters Select Parameter Options To DoTest Method BIST FIS/User Select the test method
BIST FIS/User to use.The AWG method is notavailable for thismeasurement
Live/Ref Select Ch1, Ch2, Ch3, Ch4,Ref1, Ref2, Ref3, Ref4
Set the channel toacquire data from
File Select FilePrefix
Browse Set the path andalphanumeric prefix forthe files that you want toload
File Type CSV, wfm Select the type of file thatyou want to load. Theapplication prefixes theFile Prefix you entered toand searches for thespecified file type
Help Select the Help button toget a brief description ofhow to load files with aprefix and specified type
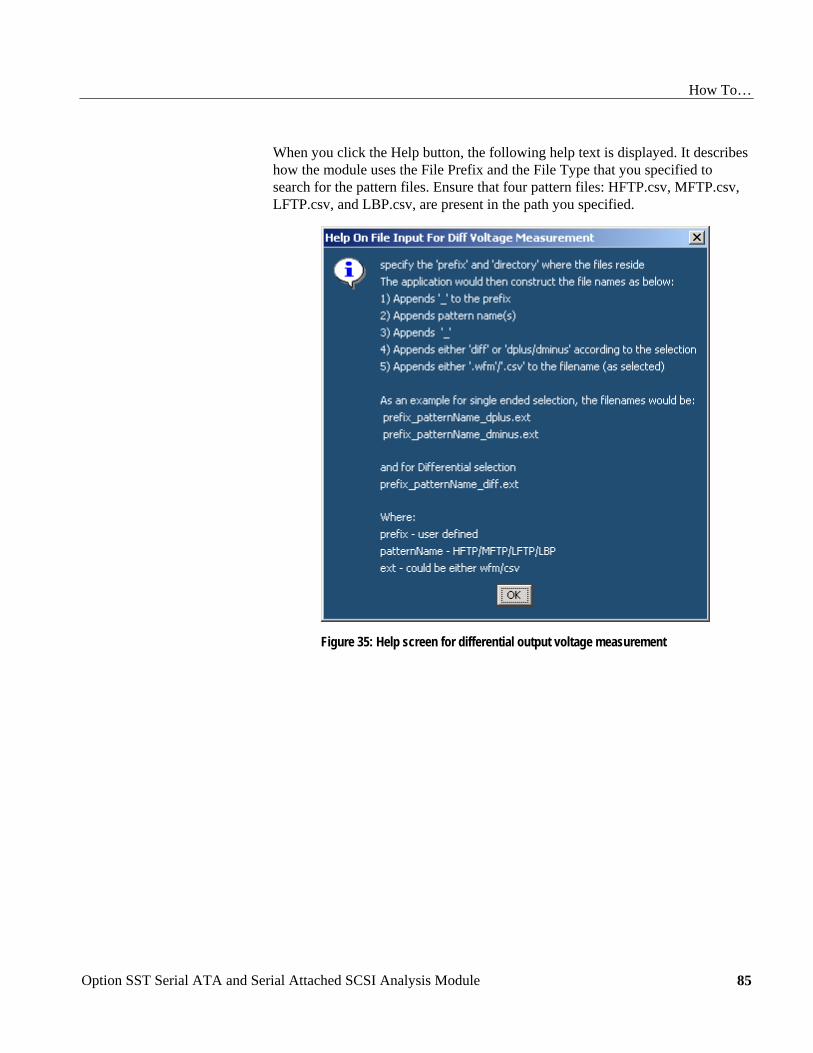
How To…
Option SST Serial ATA and Serial Attached SCSI Analysis Module
85
When you click the Help button, the following help text is displayed. It describes how the module uses the File Prefix and the File Type that you specified to search for the pattern files. Ensure that four pattern files: HFTP.csv, MFTP.csv, LFTP.csv, and LBP.csv, are present in the path you specified.
Figure 35: Help screen for differential output voltage measurement
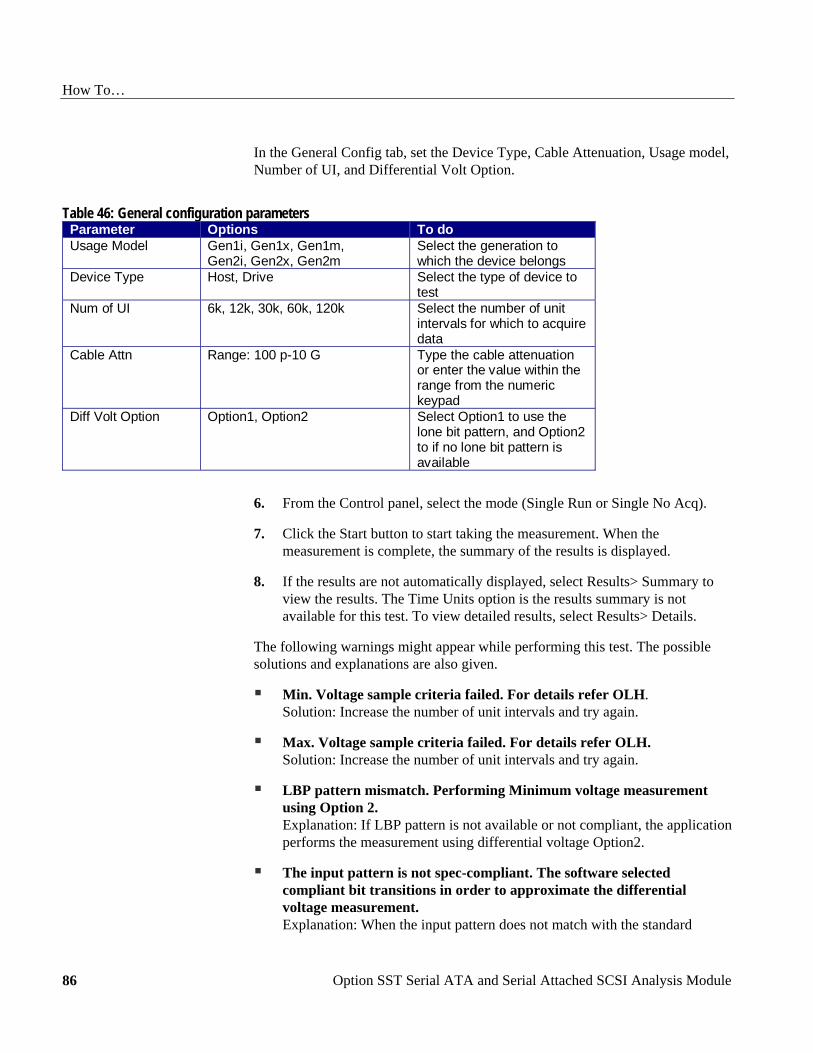
How To…
Option SST Serial ATA and Serial Attached SCSI Analysis Module 86
In the General Config tab, set the Device Type, Cable Attenuation, Usage model, Number of UI, and Differential Volt Option.
Table 46: General configuration parameters Parameter Options To doUsage Model Gen1i, Gen1x, Gen1m,
Gen2i, Gen2x, Gen2mSelect the generation towhich the device belongs
Device Type Host, Drive Select the type of device totest
Num of UI 6k, 12k, 30k, 60k, 120k Select the number of unitintervals for which to acquiredata
Cable Attn Range: 100 p-10 G Type the cable attenuationor enter the value within therange from the numerickeypad
Diff Volt Option Option1, Option2 Select Option1 to use thelone bit pattern, and Option2to if no lone bit pattern isavailable
6. From the Control panel, select the mode (Single Run or Single No Acq).
7. Click the Start button to start taking the measurement. When the measurement is complete, the summary of the results is displayed.
8. If the results are not automatically displayed, select Results> Summary to view the results. The Time Units option is the results summary is not available for this test. To view detailed results, select Results> Details.
The following warnings might appear while performing this test. The possible solutions and explanations are also given.
Min. Voltage sample criteria failed. For details refer OLH. Solution: Increase the number of unit intervals and try again.
Max. Voltage sample criteria failed. For details refer OLH. Solution: Increase the number of unit intervals and try again.
LBP pattern mismatch. Performing Minimum voltage measurement using Option 2. Explanation: If LBP pattern is not available or not compliant, the application performs the measurement using differential voltage Option2.
The input pattern is not spec-compliant. The software selected compliant bit transitions in order to approximate the differential voltage measurement. Explanation: When the input pattern does not match with the standard
How To…
Option SST Serial ATA and Serial Attached SCSI Analysis Module
87
definition, the application approximates the pattern definition and displays the results.
Perform Receiver AC CM Voltage Test Follow these steps to measure the AC Common Mode Voltage for a receiver.
1. Set up the DUT (Host or Drive) as shown in the How To Set up the DUT section.
2. Select Measurements> Select from the menu bar.
3. Select Test Point as Receiver and Probe Type as Single-ended.
4. Click AC CM Voltage.
5. To change the configuration settings, select Measurements> Configure from the menu bar or click the Configure button.
In the Source tab, click Live, Ref, or File. Select the channels for D+ and D−, and the Trigger channel. The trigger channels available exclude those channels that you have selected as D+ D−. For the BIST FIS/User test method, Trigger option is not available. Select the Test Method.
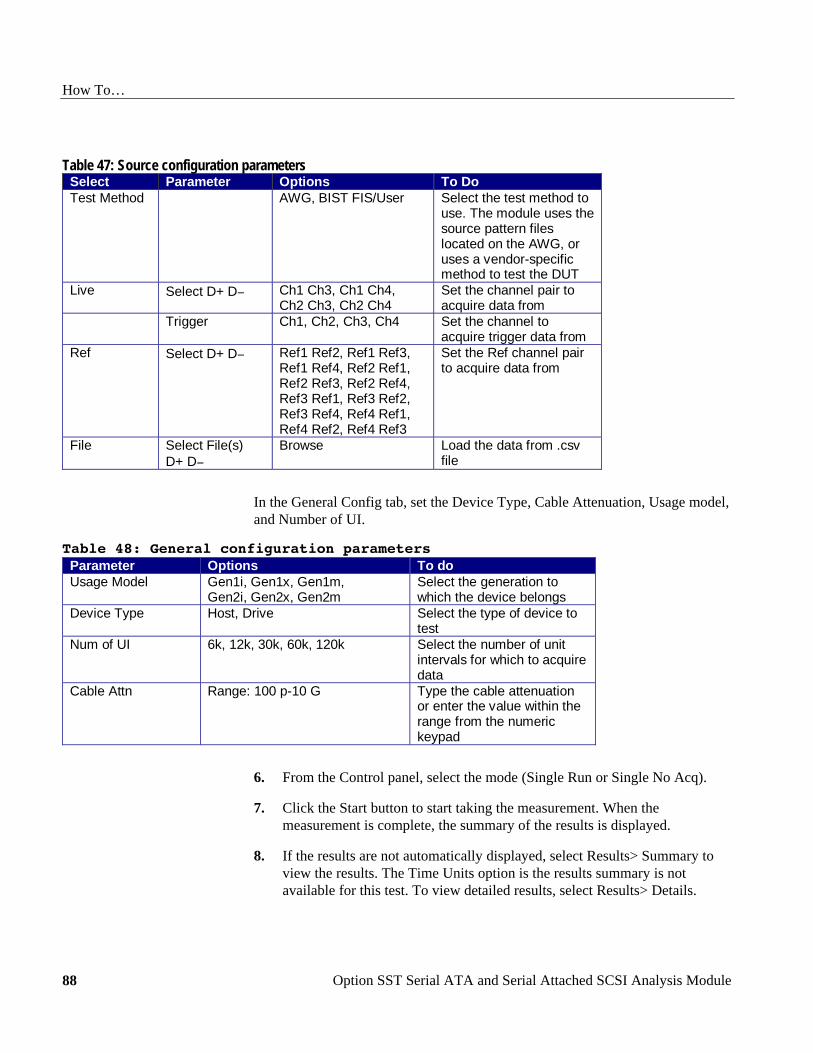
How To…
Option SST Serial ATA and Serial Attached SCSI Analysis Module 88
Table 47: Source configuration parameters Select Parameter Options To DoTest Method AWG, BIST FIS/User Select the test method to
use. The module uses thesource pattern fileslocated on the AWG, oruses a vendor-specificmethod to test the DUT
Live Select D+ D− Ch1 Ch3, Ch1 Ch4,Ch2 Ch3, Ch2 Ch4
Set the channel pair toacquire data from
Trigger Ch1, Ch2, Ch3, Ch4 Set the channel toacquire trigger data from
Ref Select D+ D− Ref1 Ref2, Ref1 Ref3,Ref1 Ref4, Ref2 Ref1,Ref2 Ref3, Ref2 Ref4,Ref3 Ref1, Ref3 Ref2,Ref3 Ref4, Ref4 Ref1,Ref4 Ref2, Ref4 Ref3
Set the Ref channel pairto acquire data from
File Select File(s)D+ D−
Browse Load the data from .csvfile
In the General Config tab, set the Device Type, Cable Attenuation, Usage model, and Number of UI.
Table 48: General configuration parameters Parameter Options To doUsage Model Gen1i, Gen1x, Gen1m,
Gen2i, Gen2x, Gen2mSelect the generation towhich the device belongs
Device Type Host, Drive Select the type of device totest
Num of UI 6k, 12k, 30k, 60k, 120k Select the number of unitintervals for which to acquiredata
Cable Attn Range: 100 p-10 G Type the cable attenuationor enter the value within therange from the numerickeypad
6. From the Control panel, select the mode (Single Run or Single No Acq).
7. Click the Start button to start taking the measurement. When the measurement is complete, the summary of the results is displayed.
8. If the results are not automatically displayed, select Results> Summary to view the results. The Time Units option is the results summary is not available for this test. To view detailed results, select Results> Details.
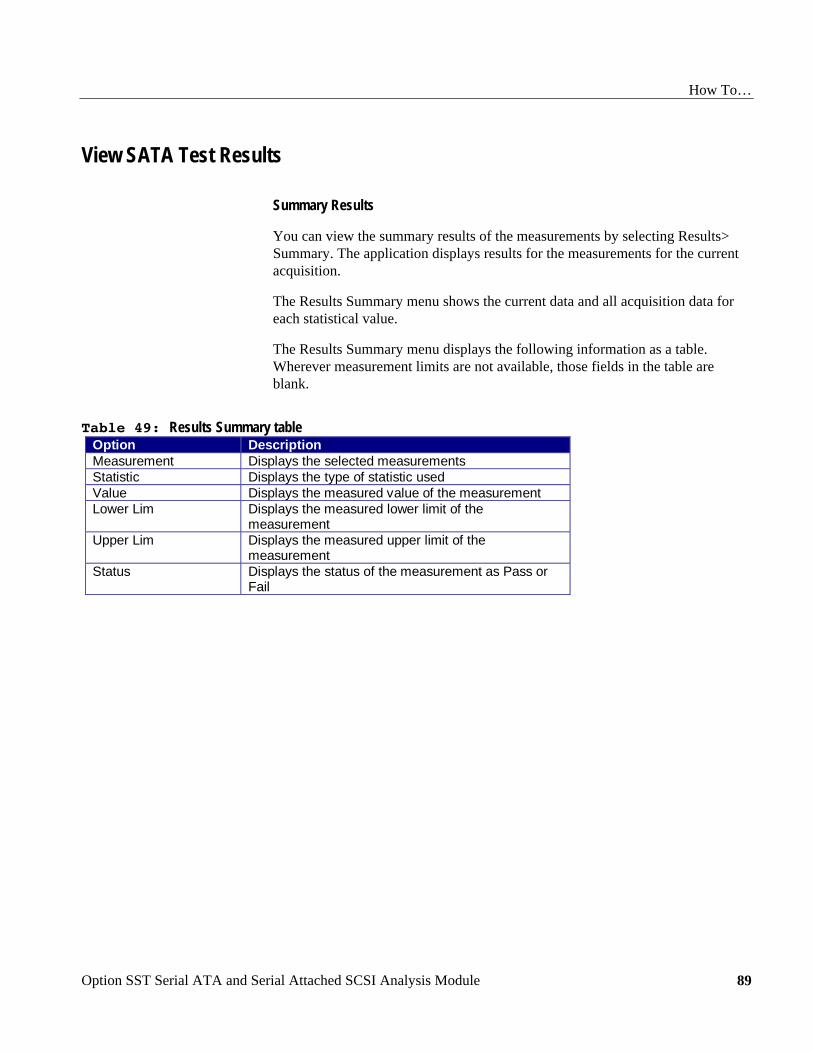
How To…
Option SST Serial ATA and Serial Attached SCSI Analysis Module
89
View SATA Test Results
Summary Results
You can view the summary results of the measurements by selecting Results> Summary. The application displays results for the measurements for the current acquisition.
The Results Summary menu shows the current data and all acquisition data for each statistical value.
The Results Summary menu displays the following information as a table. Wherever measurement limits are not available, those fields in the table are blank.
Table 49: Results Summary table Option DescriptionMeasurement Displays the selected measurementsStatistic Displays the type of statistic usedValue Displays the measured value of the measurementLower Lim Displays the measured lower limit of the
measurementUpper Lim Displays the measured upper limit of the
measurementStatus Displays the status of the measurement as Pass or
Fail

How To…
Option SST Serial ATA and Serial Attached SCSI Analysis Module 90
Other options in the Results Summary screen include:
Table 50: Results Summary options Option DescriptionShow Plot Displays the plot of the eye diagramWorst Case Eye Displays all the worst cases for high rail, low rail, top
margin, bottom margin, and jitterDetails Shortcut to the Results Details menuTime Units Displays results in Unit Intervals or seconds
Detailed Results
You can view the detailed results of the measurements by selecting Results> Details. The application displays results for the measurements for the current acquisition.
For a selected measurement, the Results Details menu displays the following information as a table. Wherever measurement limits are not available, those fields in the table are blank.
Table 51: Results Details table Option DescriptionResult, Statistic Displays the different statistics for the
measurement⎯Population, Mean, Standard Deviation,Maximum, Minimum, Peak-Peak Value.
Value Displays the measured value of the measurementLower Lim Displays the measured lower limit of the measurementUpper Lim Displays the measured upper limit of the measurementStatus Displays the status of the measurement as Pass or Fail
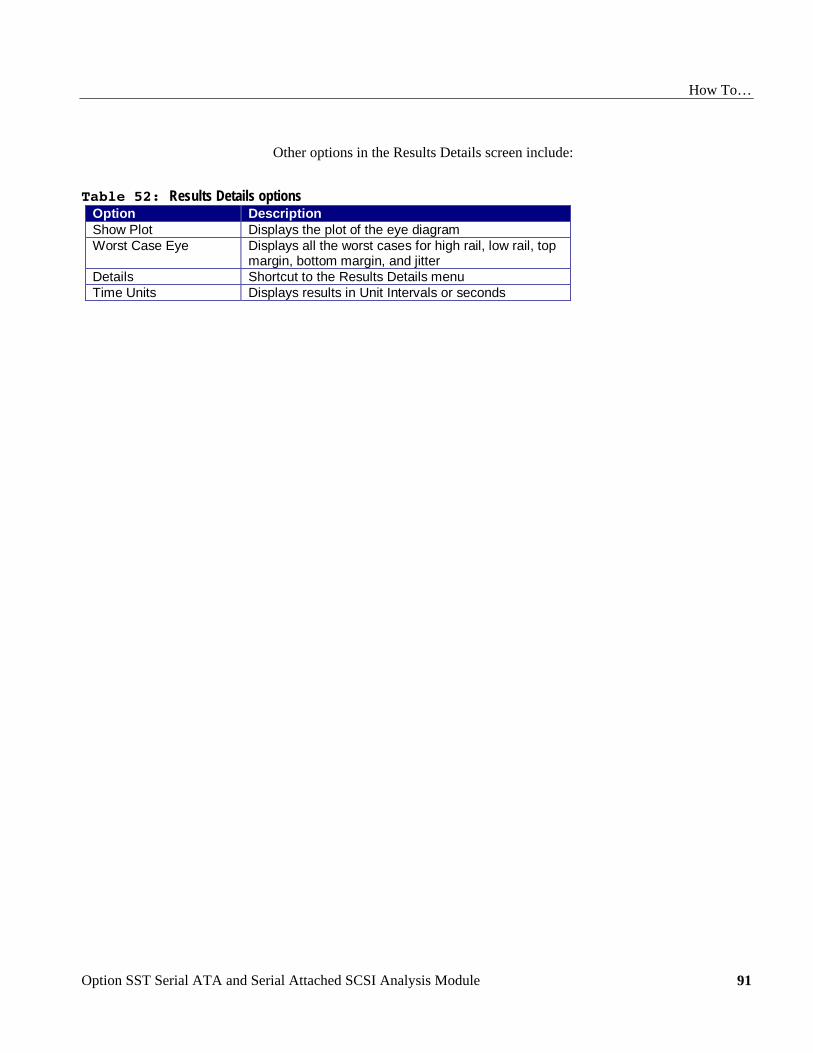
How To…
Option SST Serial ATA and Serial Attached SCSI Analysis Module
91
Other options in the Results Details screen include:
Table 52: Results Details options Option DescriptionShow Plot Displays the plot of the eye diagramWorst Case Eye Displays all the worst cases for high rail, low rail, top
margin, bottom margin, and jitterDetails Shortcut to the Results Details menuTime Units Displays results in Unit Intervals or seconds
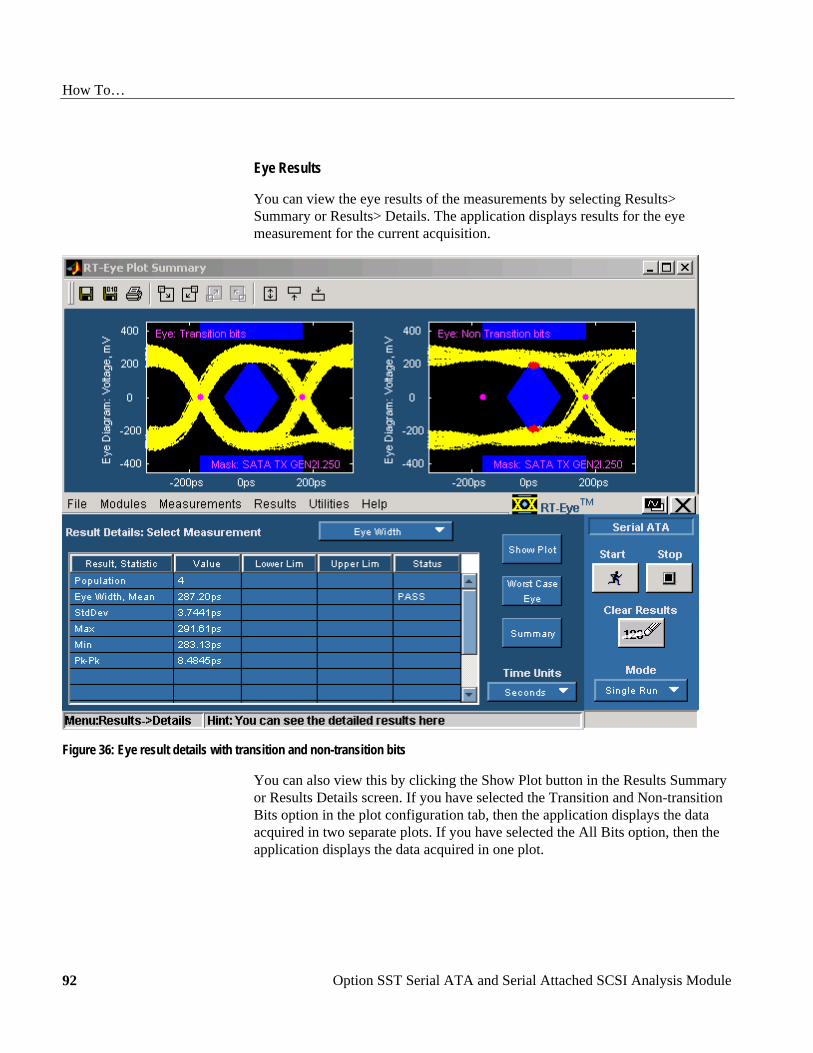
How To…
Option SST Serial ATA and Serial Attached SCSI Analysis Module 92
Eye Results
You can view the eye results of the measurements by selecting Results> Summary or Results> Details. The application displays results for the eye measurement for the current acquisition.
Figure 36: Eye result details with transition and non-transition bits
You can also view this by clicking the Show Plot button in the Results Summary or Results Details screen. If you have selected the Transition and Non-transition Bits option in the plot configuration tab, then the application displays the data acquired in two separate plots. If you have selected the All Bits option, then the application displays the data acquired in one plot.

How To…
Option SST Serial ATA and Serial Attached SCSI Analysis Module
93
Figure 37: Eye result summary with all bits
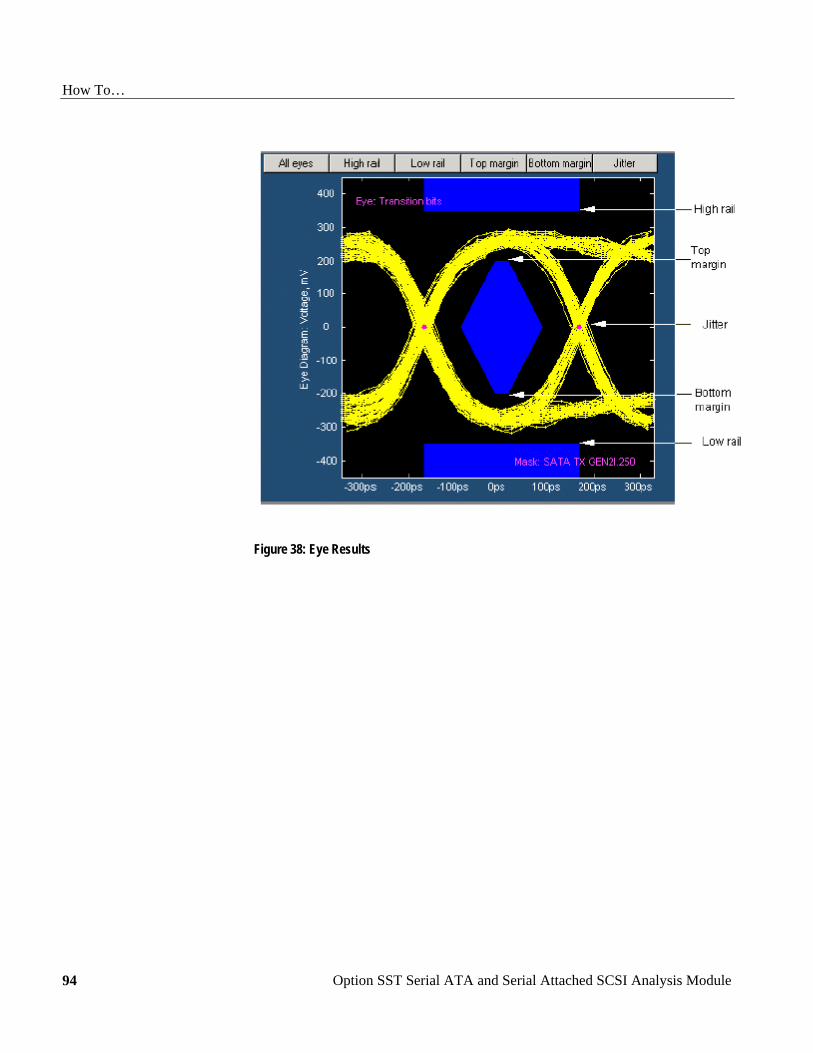
How To…
Option SST Serial ATA and Serial Attached SCSI Analysis Module 94
Figure 38: Eye Results
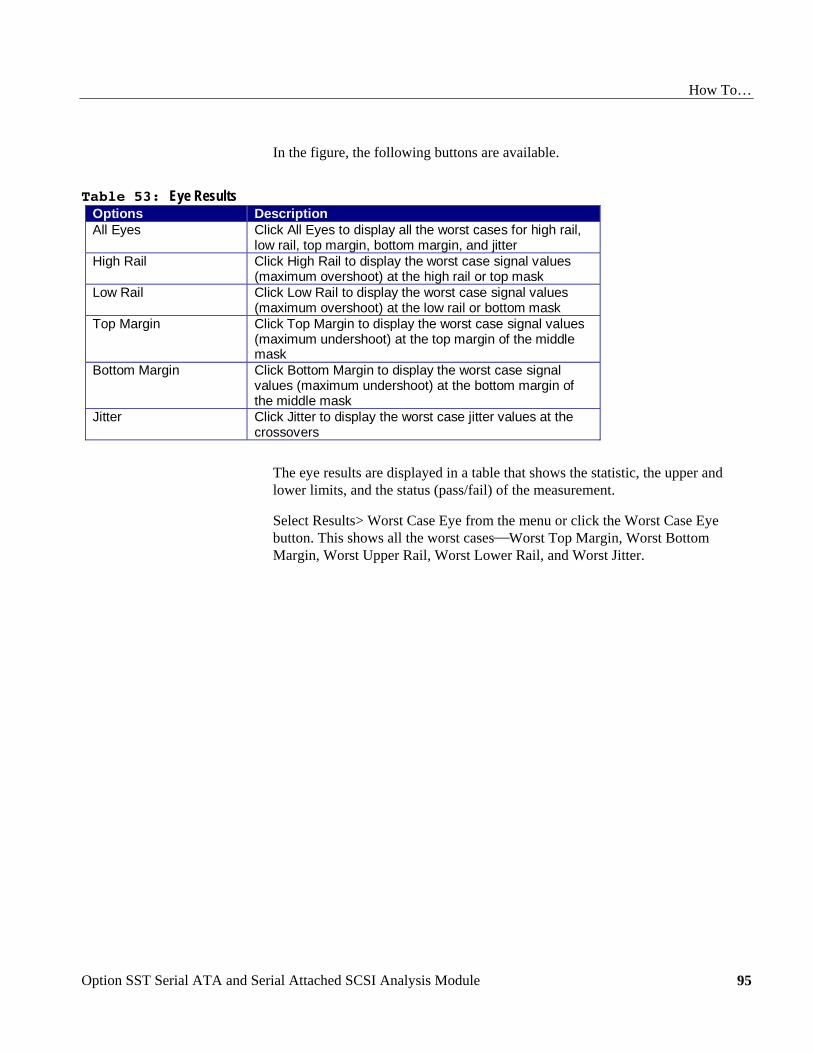
How To…
Option SST Serial ATA and Serial Attached SCSI Analysis Module
95
In the figure, the following buttons are available.
Table 53: Eye Results Options DescriptionAll Eyes Click All Eyes to display all the worst cases for high rail,
low rail, top margin, bottom margin, and jitterHigh Rail Click High Rail to display the worst case signal values
(maximum overshoot) at the high rail or top maskLow Rail Click Low Rail to display the worst case signal values
(maximum overshoot) at the low rail or bottom maskTop Margin Click Top Margin to display the worst case signal values
(maximum undershoot) at the top margin of the middlemask
Bottom Margin Click Bottom Margin to display the worst case signalvalues (maximum undershoot) at the bottom margin ofthe middle mask
Jitter Click Jitter to display the worst case jitter values at thecrossovers
The eye results are displayed in a table that shows the statistic, the upper and lower limits, and the status (pass/fail) of the measurement.
Select Results> Worst Case Eye from the menu or click the Worst Case Eye button. This shows all the worst cases⎯Worst Top Margin, Worst Bottom Margin, Worst Upper Rail, Worst Lower Rail, and Worst Jitter.

How To…
Option SST Serial ATA and Serial Attached SCSI Analysis Module 96
Figure 39: Eye plot of Worst Case
Results Plot
The following figure displays the Eye plot for transition bits. You can view this plot if you have set the option−Transition and Non-Transition Bits−in Configure> Plot Config.
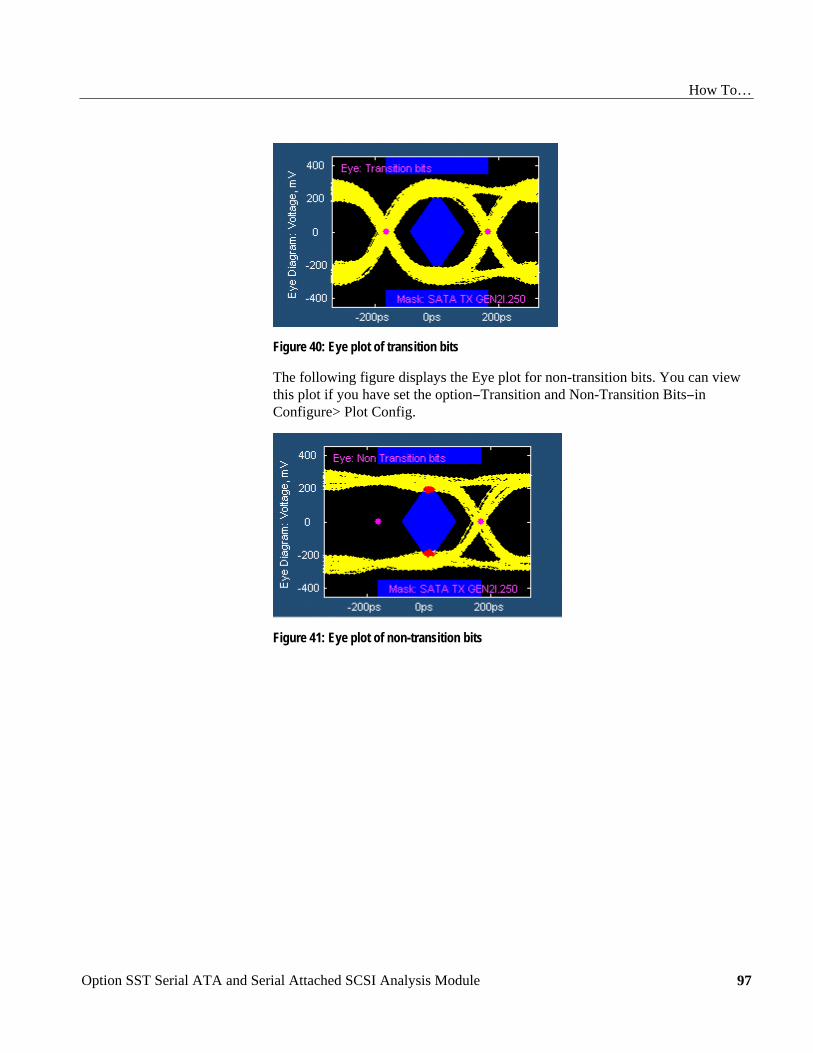
How To…
Option SST Serial ATA and Serial Attached SCSI Analysis Module
97
Figure 40: Eye plot of transition bits
The following figure displays the Eye plot for non-transition bits. You can view this plot if you have set the option−Transition and Non-Transition Bits−in Configure> Plot Config.
Figure 41: Eye plot of non-transition bits
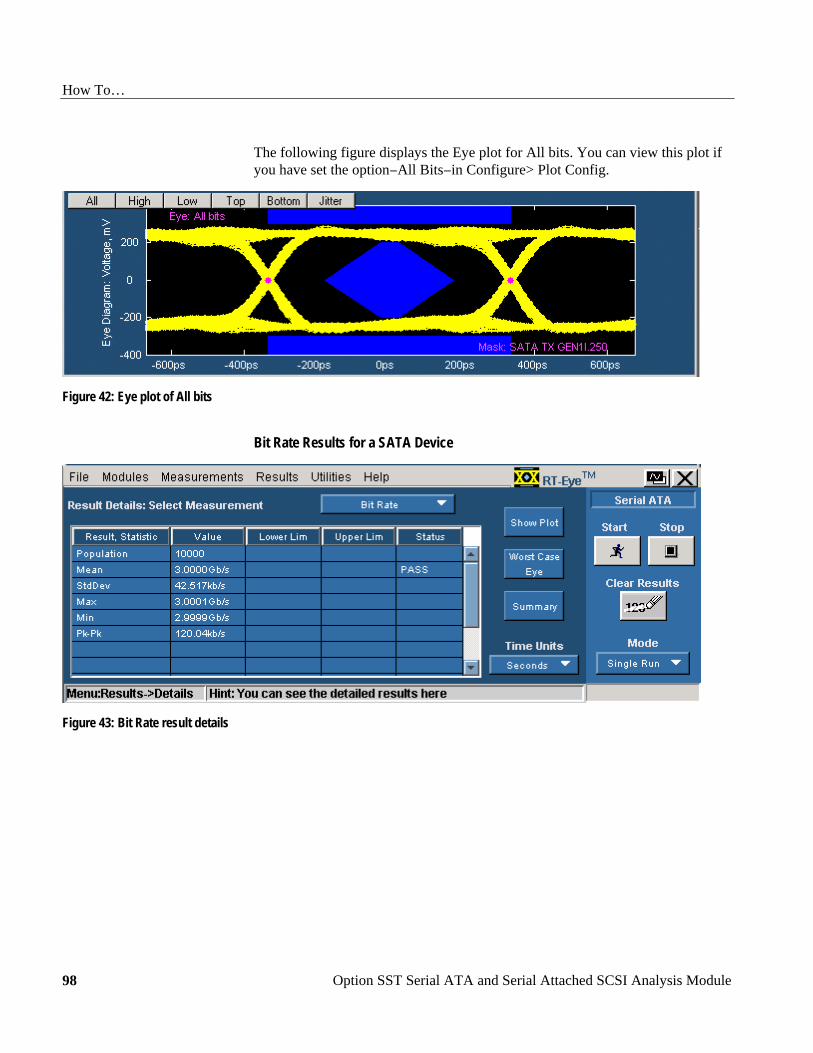
How To…
Option SST Serial ATA and Serial Attached SCSI Analysis Module 98
The following figure displays the Eye plot for All bits. You can view this plot if you have set the option−All Bits−in Configure> Plot Config.
Figure 42: Eye plot of All bits
Bit Rate Results for a SATA Device
Figure 43: Bit Rate result details
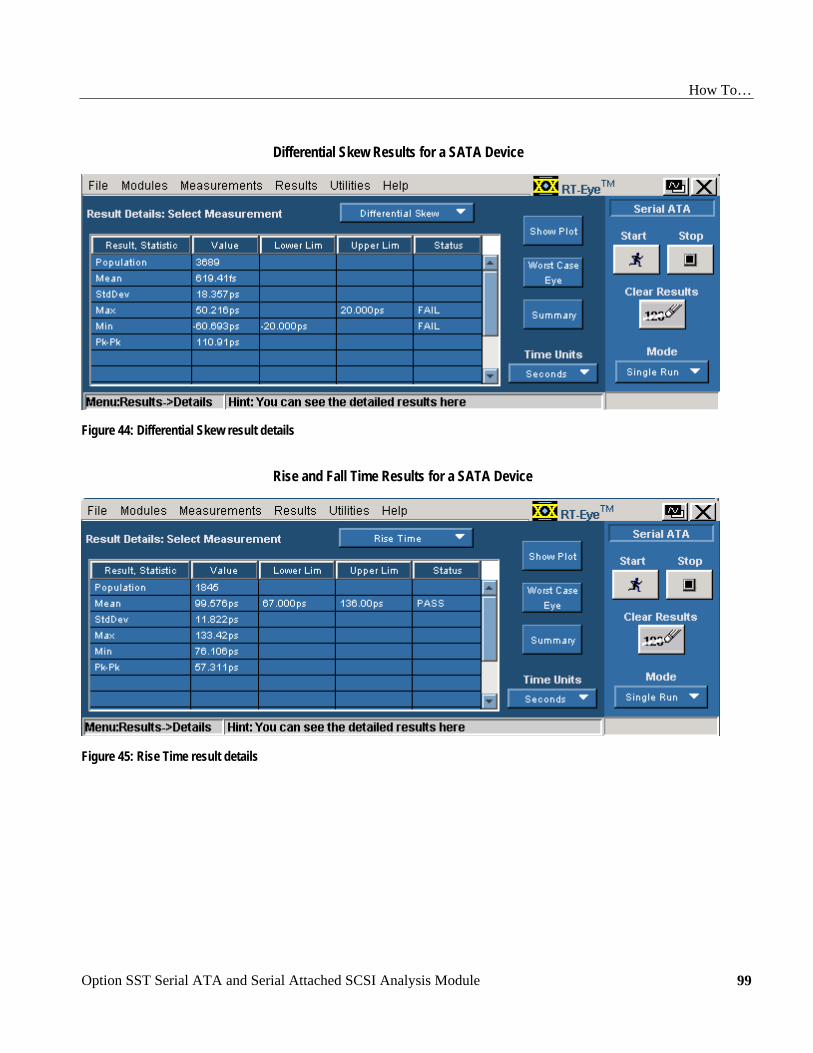
How To…
Option SST Serial ATA and Serial Attached SCSI Analysis Module
99
Differential Skew Results for a SATA Device
Figure 44: Differential Skew result details
Rise and Fall Time Results for a SATA Device
Figure 45: Rise Time result details
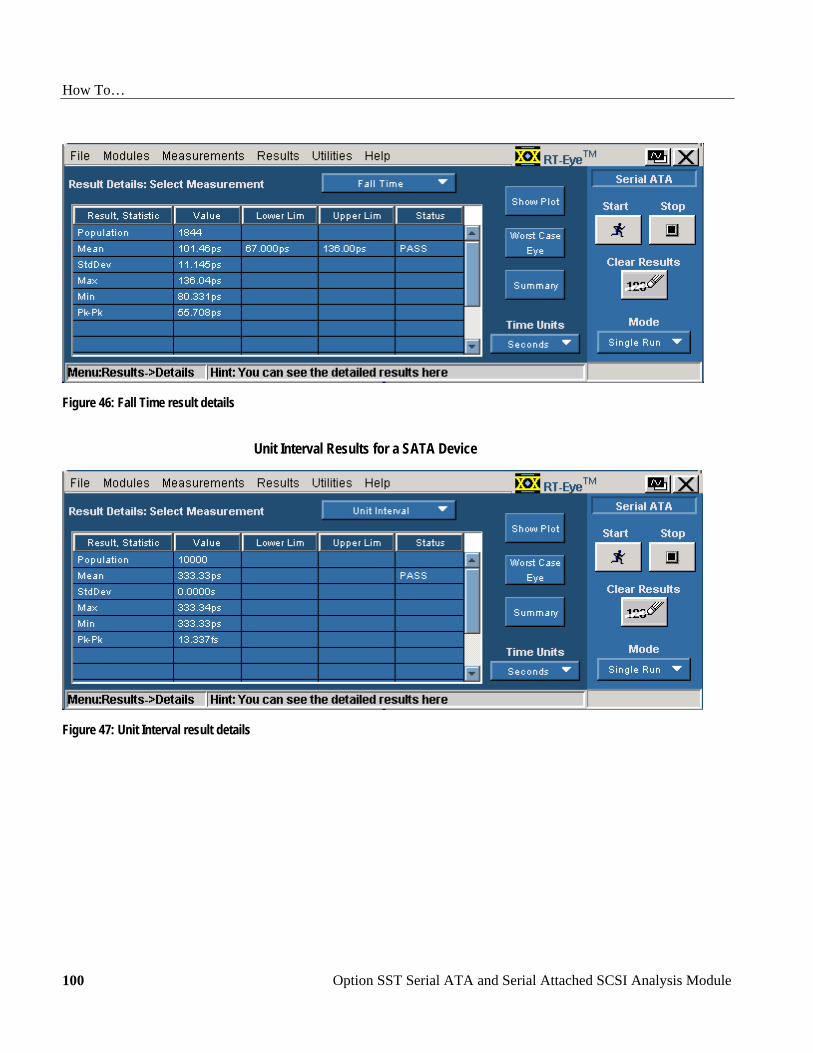
How To…
Option SST Serial ATA and Serial Attached SCSI Analysis Module 100
Figure 46: Fall Time result details
Unit Interval Results for a SATA Device
Figure 47: Unit Interval result details
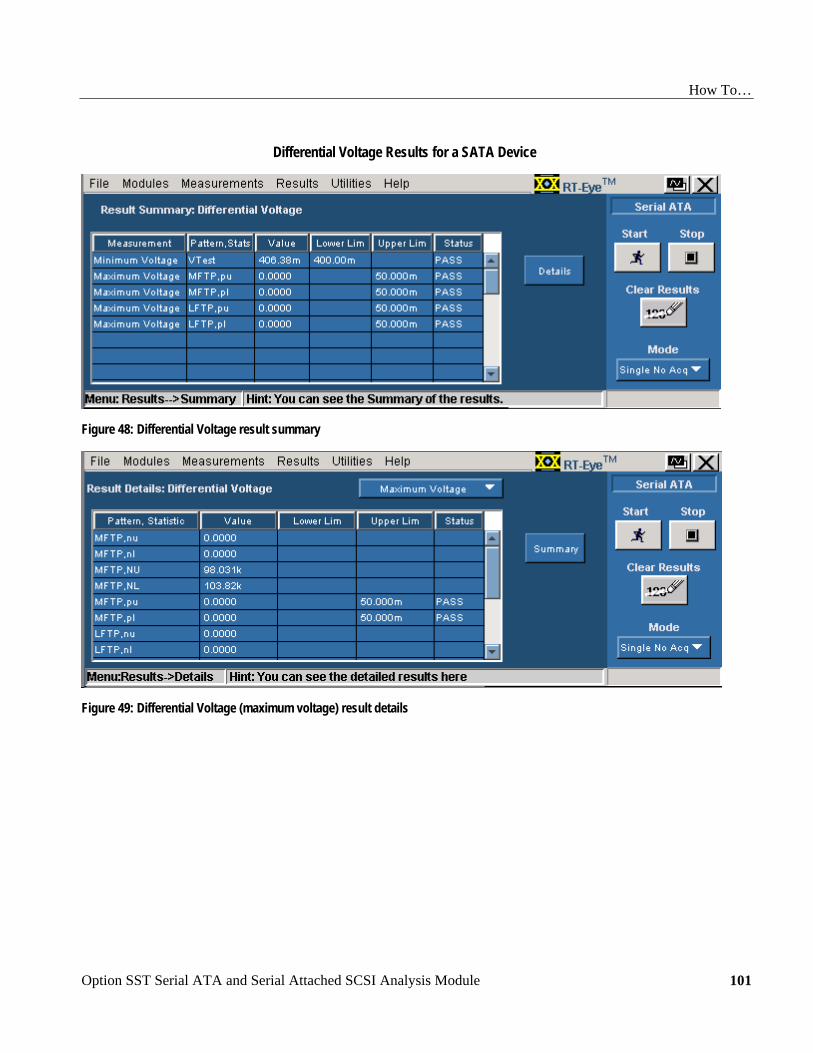
How To…
Option SST Serial ATA and Serial Attached SCSI Analysis Module
101
Differential Voltage Results for a SATA Device
Figure 48: Differential Voltage result summary
Figure 49: Differential Voltage (maximum voltage) result details
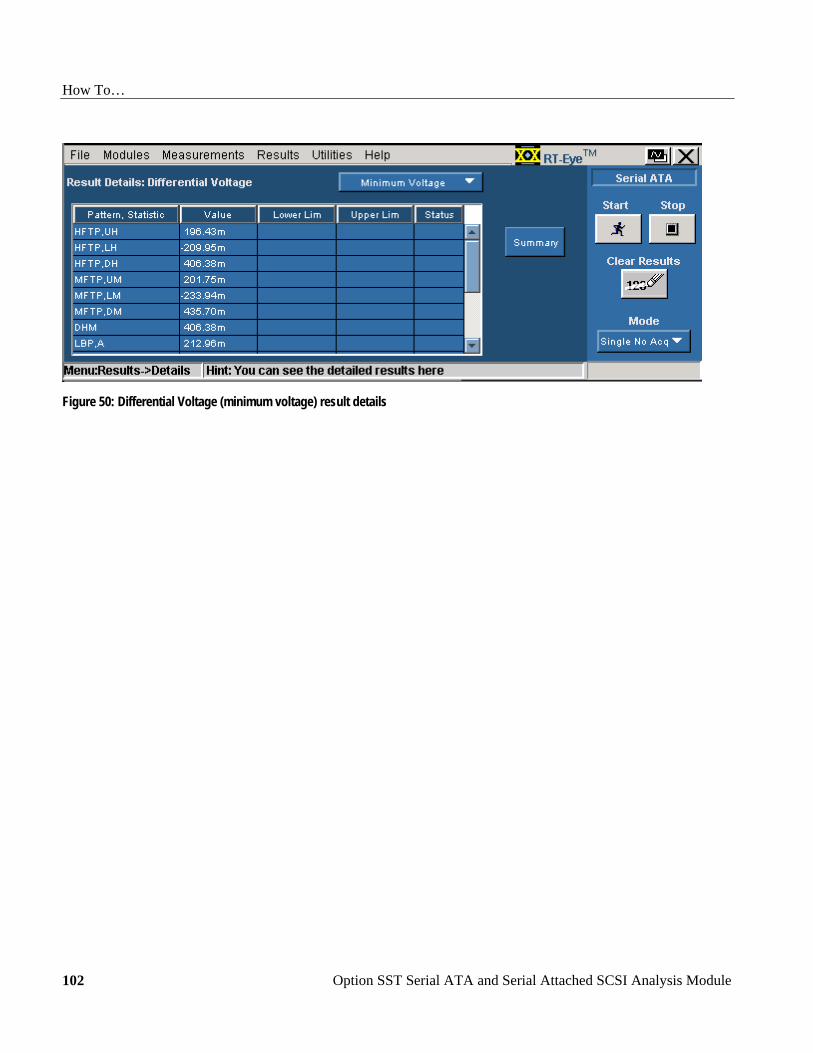
How To…
Option SST Serial ATA and Serial Attached SCSI Analysis Module 102
Figure 50: Differential Voltage (minimum voltage) result details
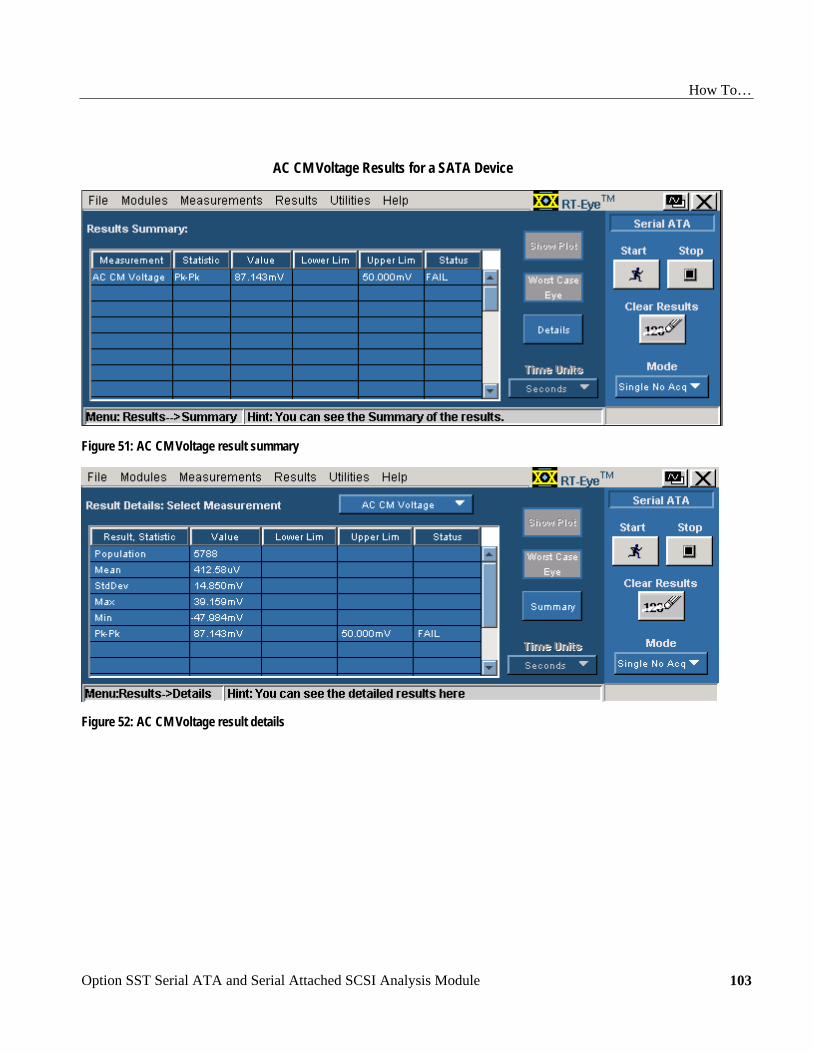
How To…
Option SST Serial ATA and Serial Attached SCSI Analysis Module
103
AC CM Voltage Results for a SATA Device
Figure 51: AC CM Voltage result summary
Figure 52: AC CM Voltage result details
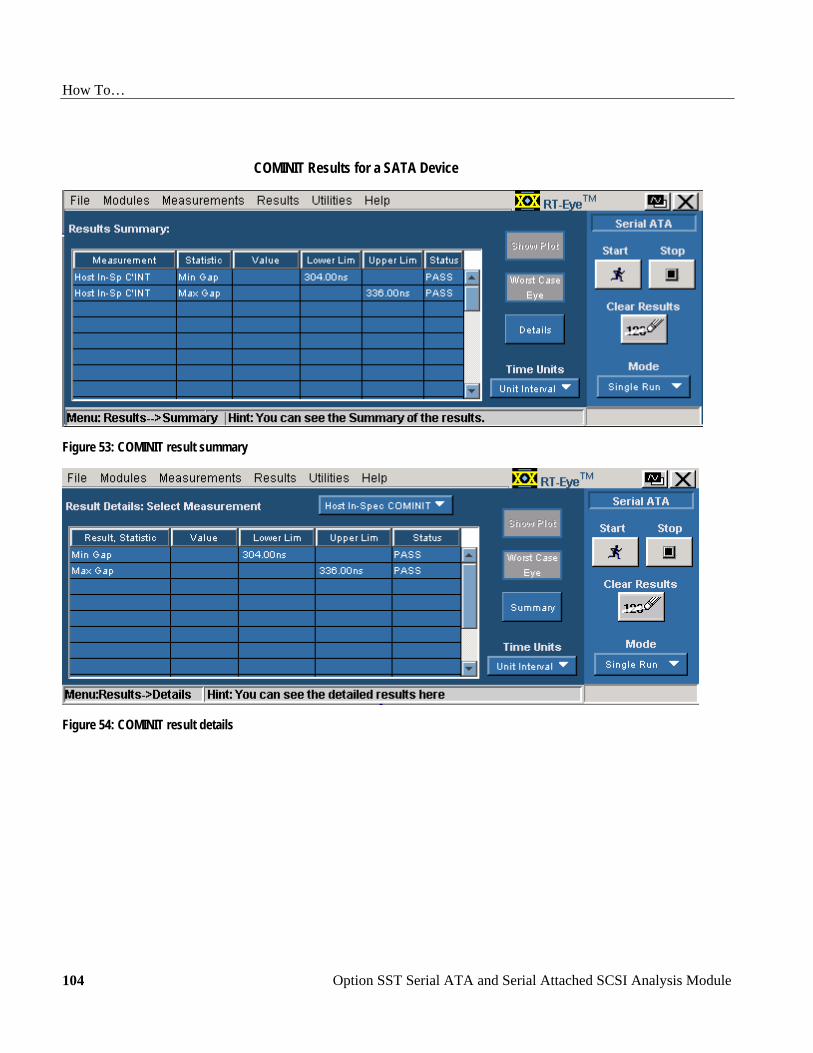
How To…
Option SST Serial ATA and Serial Attached SCSI Analysis Module 104
COMINIT Results for a SATA Device
Figure 53: COMINIT result summary
Figure 54: COMINIT result details
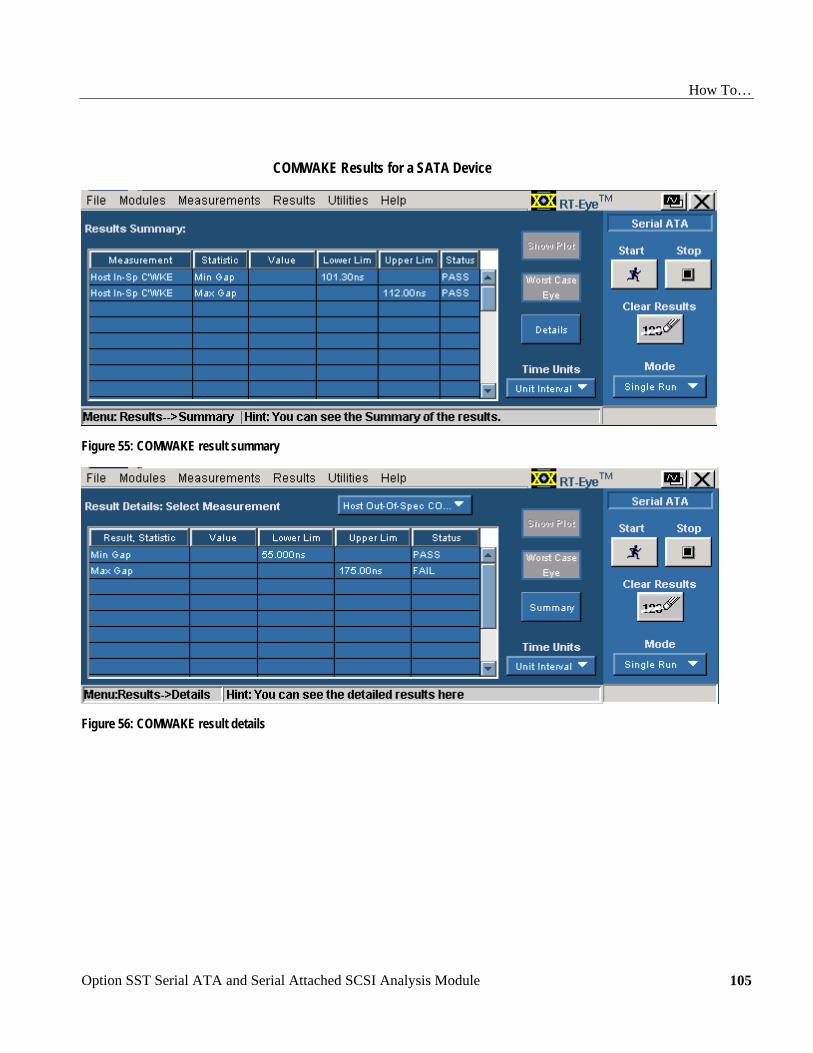
How To…
Option SST Serial ATA and Serial Attached SCSI Analysis Module
105
COMWAKE Results for a SATA Device
Figure 55: COMWAKE result summary
Figure 56: COMWAKE result details
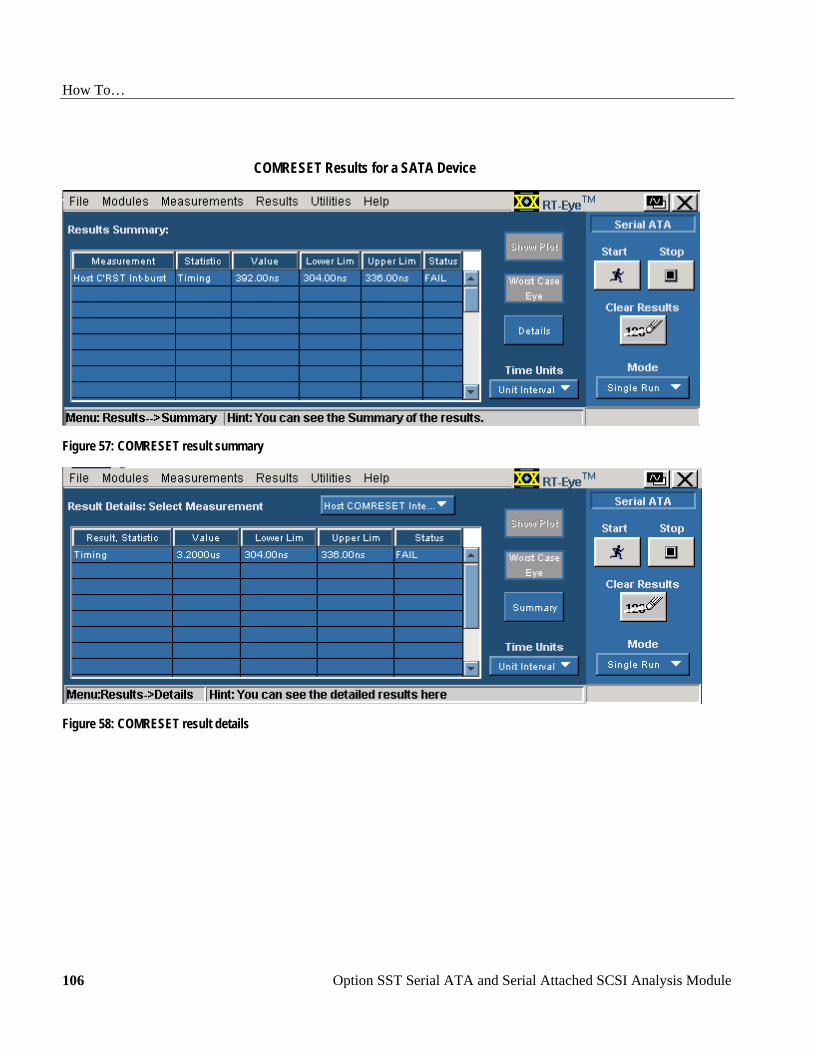
How To…
Option SST Serial ATA and Serial Attached SCSI Analysis Module 106
COMRESET Results for a SATA Device
Figure 57: COMRESET result summary
Figure 58: COMRESET result details

How To…
Option SST Serial ATA and Serial Attached SCSI Analysis Module
107
Select and Configure SAS Measurements
Select SAS Measurements
To select a measurement, select Measurements> Select from the menu bar. The following screen is displayed:
Figure 59: SAS measurements for receiver
Figure 60: SAS measurements for transmitter
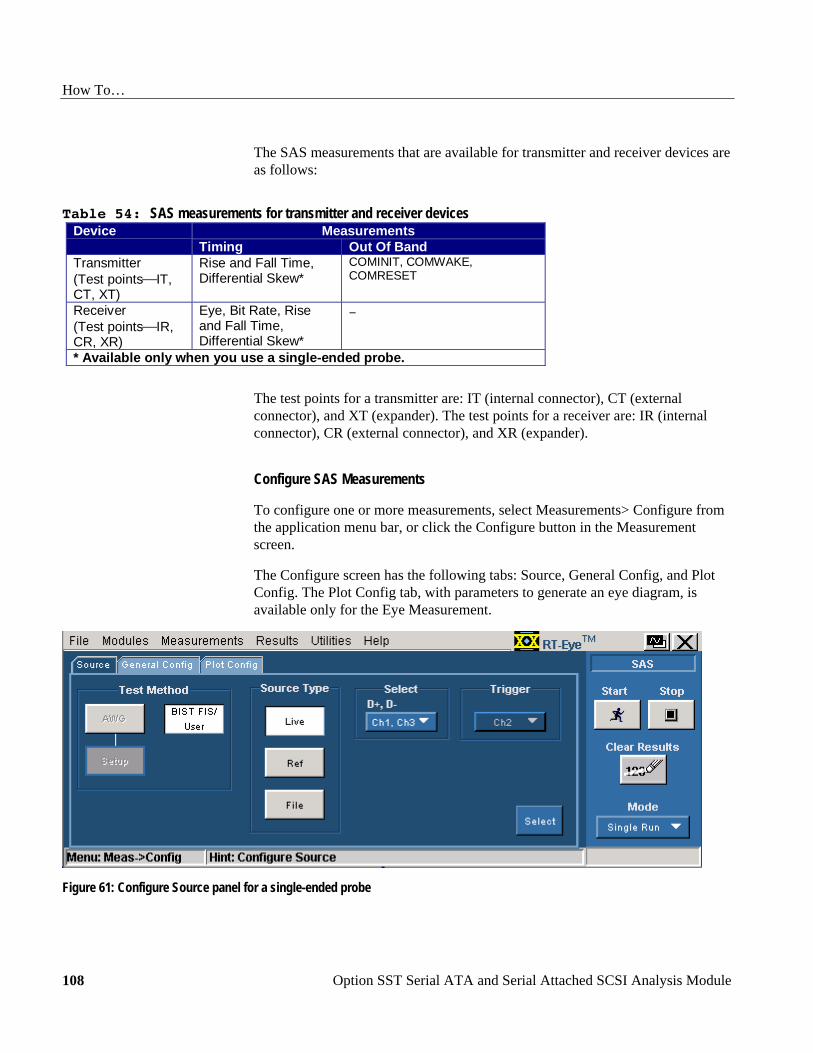
How To…
Option SST Serial ATA and Serial Attached SCSI Analysis Module 108
The SAS measurements that are available for transmitter and receiver devices are as follows:
Table 54: SAS measurements for transmitter and receiver devices MeasurementsDevice
Timing Out Of BandTransmitter(Test points⎯IT,CT, XT)
Rise and Fall Time,Differential Skew*
COMINIT, COMWAKE,COMRESET
Receiver(Test points⎯IR,CR, XR)
Eye, Bit Rate, Riseand Fall Time,Differential Skew*
−
* Available only when you use a single-ended probe.
The test points for a transmitter are: IT (internal connector), CT (external connector), and XT (expander). The test points for a receiver are: IR (internal connector), CR (external connector), and XR (expander).
Configure SAS Measurements
To configure one or more measurements, select Measurements> Configure from the application menu bar, or click the Configure button in the Measurement screen.
The Configure screen has the following tabs: Source, General Config, and Plot Config. The Plot Config tab, with parameters to generate an eye diagram, is available only for the Eye Measurement.
Figure 61: Configure Source panel for a single-ended probe

How To…
Option SST Serial ATA and Serial Attached SCSI Analysis Module
109
Figure 62: Configure Source panel for a differential probe
Figure 63: General configuration
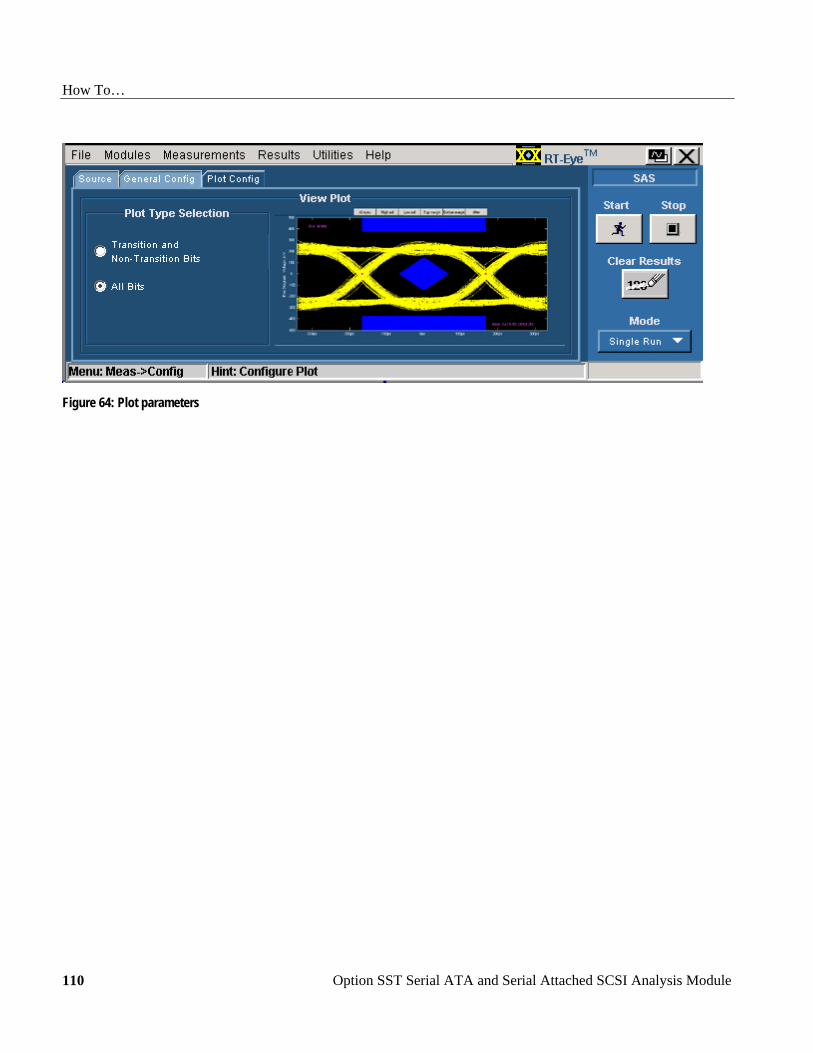
How To…
Option SST Serial ATA and Serial Attached SCSI Analysis Module 110
Figure 64: Plot parameters
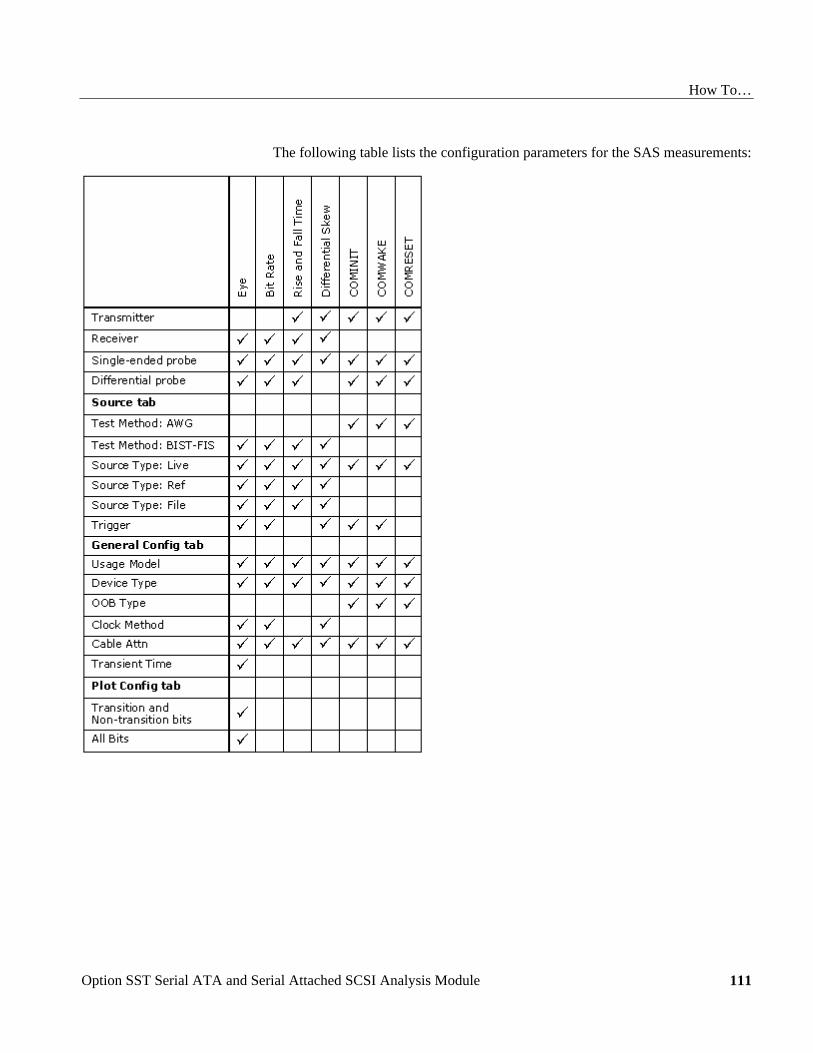
How To…
Option SST Serial ATA and Serial Attached SCSI Analysis Module
111
The following table lists the configuration parameters for the SAS measurements:

How To…
Option SST Serial ATA and Serial Attached SCSI Analysis Module 112
Perform SAS Tests for Transmitter
Transmitter Measurements
The measurements that are available for a SAS Transmitter are Rise and Fall Time and Differential Skew.
Out Of Band (OOB) Signaling Tests are available for a SAS Transmitter. The OOB tests that are supported by the SAS module are COMINIT, COMWAKE, and COMRESET.
Perform Transmitter Rise Time and Fall Time Test Follow these steps to measure the Rise and Fall Time for a transmitter.
1. Set up the DUT (Host or Drive) as shown in the How To Set up the DUT section.
2. Select Measurements> Select from the menu bar.
3. Select Test Point as IT, CT, or XT and Probe Type as Single-ended or Differential.
4. Click Rise and Fall Time.
5. To change the configuration settings, select Measurements> Configure from the menu bar or click the Configure button.
In the Source tab, click Live, Ref, or File. If you are using a single-ended probe (SMA cable), select the channels for D+ and D−, and the Trigger channel. The trigger channels available exclude those channels that you have selected as D+ D−. Select the Test Method to use.
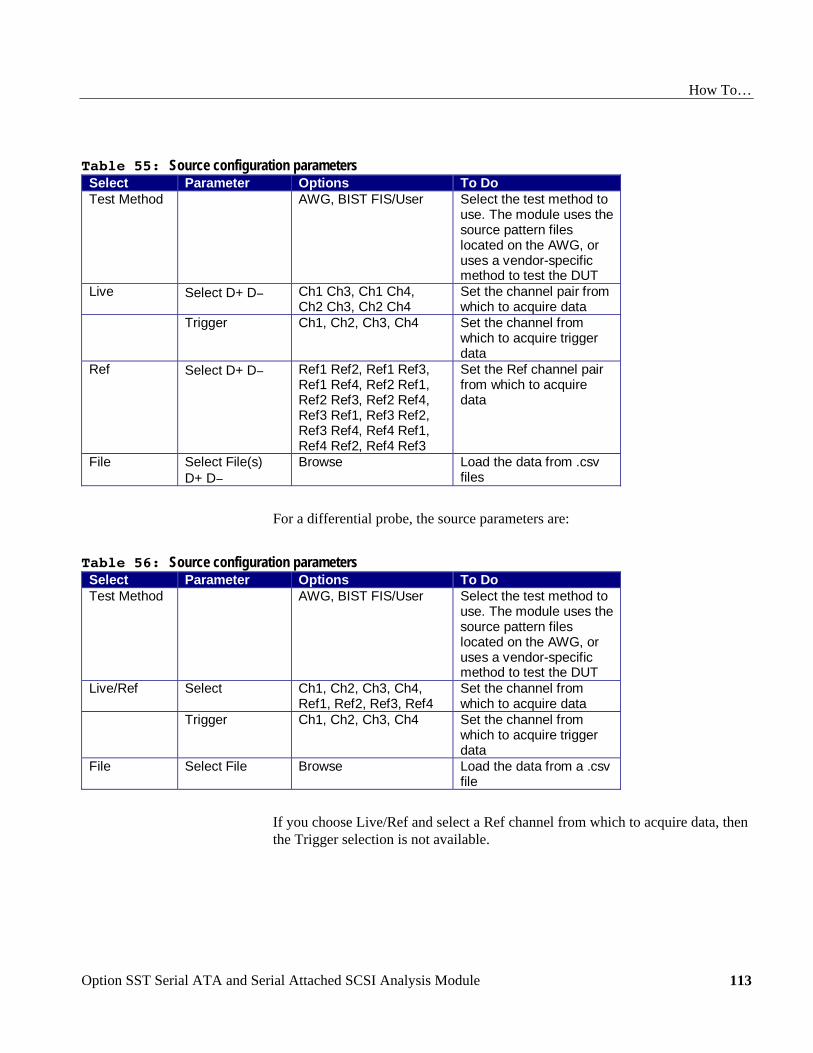
How To…
Option SST Serial ATA and Serial Attached SCSI Analysis Module
113
Table 55: Source configuration parameters Select Parameter Options To DoTest Method AWG, BIST FIS/User Select the test method to
use. The module uses thesource pattern fileslocated on the AWG, oruses a vendor-specificmethod to test the DUT
Live Select D+ D− Ch1 Ch3, Ch1 Ch4,Ch2 Ch3, Ch2 Ch4
Set the channel pair fromwhich to acquire data
Trigger Ch1, Ch2, Ch3, Ch4 Set the channel fromwhich to acquire triggerdata
Ref Select D+ D− Ref1 Ref2, Ref1 Ref3,Ref1 Ref4, Ref2 Ref1,Ref2 Ref3, Ref2 Ref4,Ref3 Ref1, Ref3 Ref2,Ref3 Ref4, Ref4 Ref1,Ref4 Ref2, Ref4 Ref3
Set the Ref channel pairfrom which to acquiredata
File Select File(s)D+ D−
Browse Load the data from .csvfiles
For a differential probe, the source parameters are:
Table 56: Source configuration parameters Select Parameter Options To DoTest Method AWG, BIST FIS/User Select the test method to
use. The module uses thesource pattern fileslocated on the AWG, oruses a vendor-specificmethod to test the DUT
Live/Ref Select Ch1, Ch2, Ch3, Ch4,Ref1, Ref2, Ref3, Ref4
Set the channel fromwhich to acquire data
Trigger Ch1, Ch2, Ch3, Ch4 Set the channel fromwhich to acquire triggerdata
File Select File Browse Load the data from a .csvfile
If you choose Live/Ref and select a Ref channel from which to acquire data, then the Trigger selection is not available.
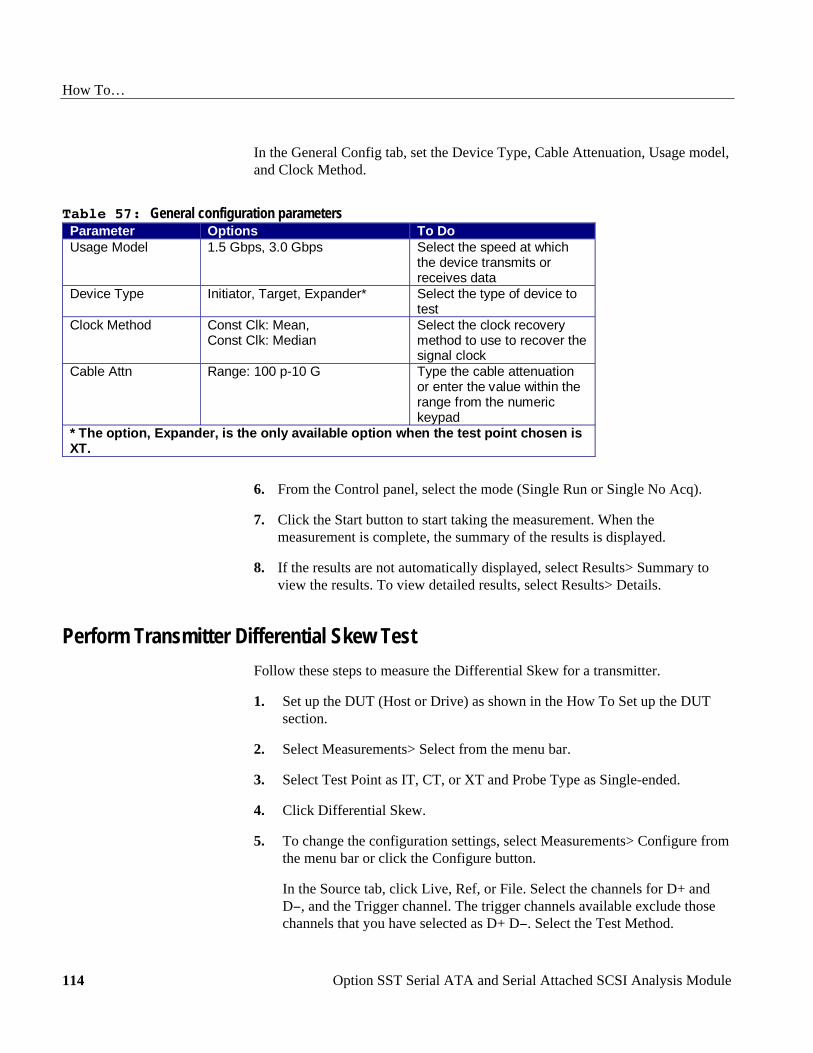
How To…
Option SST Serial ATA and Serial Attached SCSI Analysis Module 114
In the General Config tab, set the Device Type, Cable Attenuation, Usage model, and Clock Method.
Table 57: General configuration parameters Parameter Options To DoUsage Model 1.5 Gbps, 3.0 Gbps Select the speed at which
the device transmits orreceives data
Device Type Initiator, Target, Expander* Select the type of device totest
Clock Method Const Clk: Mean,Const Clk: Median
Select the clock recoverymethod to use to recover thesignal clock
Cable Attn Range: 100 p-10 G Type the cable attenuationor enter the value within therange from the numerickeypad
* The option, Expander, is the only available option when the test point chosen isXT.
6. From the Control panel, select the mode (Single Run or Single No Acq).
7. Click the Start button to start taking the measurement. When the measurement is complete, the summary of the results is displayed.
8. If the results are not automatically displayed, select Results> Summary to view the results. To view detailed results, select Results> Details.
Perform Transmitter Differential Skew Test Follow these steps to measure the Differential Skew for a transmitter.
1. Set up the DUT (Host or Drive) as shown in the How To Set up the DUT section.
2. Select Measurements> Select from the menu bar.
3. Select Test Point as IT, CT, or XT and Probe Type as Single-ended.
4. Click Differential Skew.
5. To change the configuration settings, select Measurements> Configure from the menu bar or click the Configure button.
In the Source tab, click Live, Ref, or File. Select the channels for D+ and D−, and the Trigger channel. The trigger channels available exclude those channels that you have selected as D+ D−. Select the Test Method.
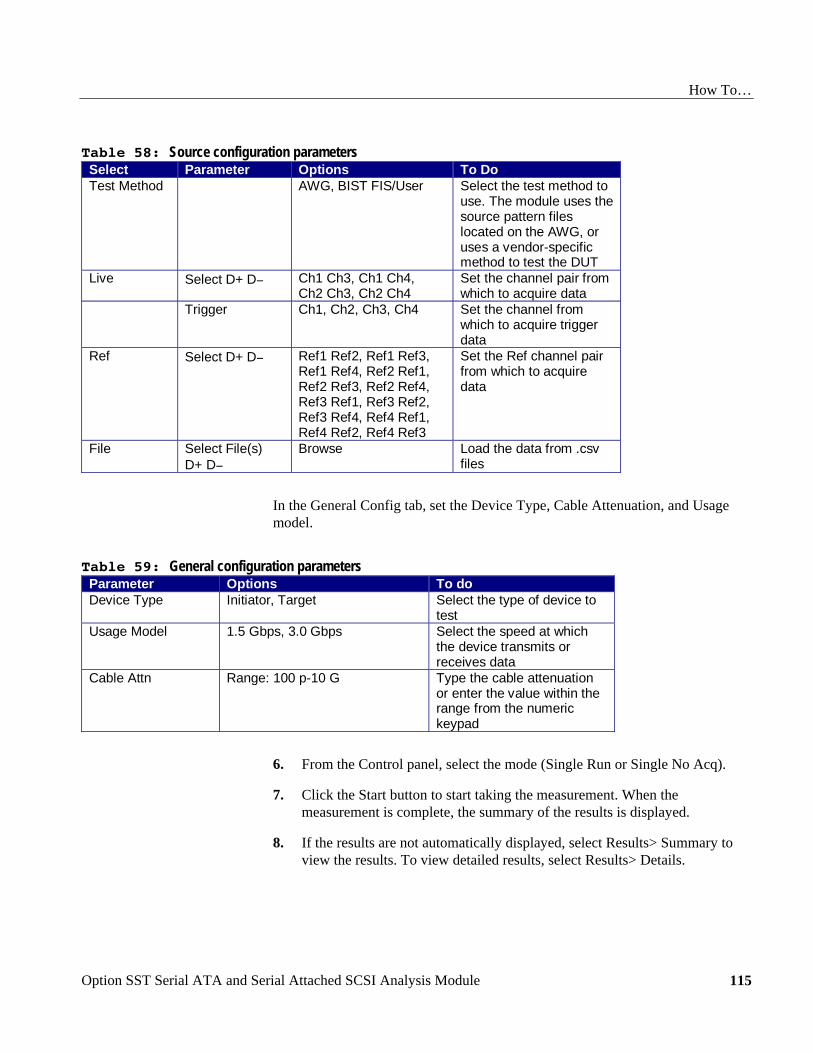
How To…
Option SST Serial ATA and Serial Attached SCSI Analysis Module
115
Table 58: Source configuration parameters Select Parameter Options To DoTest Method AWG, BIST FIS/User Select the test method to
use. The module uses thesource pattern fileslocated on the AWG, oruses a vendor-specificmethod to test the DUT
Live Select D+ D− Ch1 Ch3, Ch1 Ch4,Ch2 Ch3, Ch2 Ch4
Set the channel pair fromwhich to acquire data
Trigger Ch1, Ch2, Ch3, Ch4 Set the channel fromwhich to acquire triggerdata
Ref Select D+ D− Ref1 Ref2, Ref1 Ref3,Ref1 Ref4, Ref2 Ref1,Ref2 Ref3, Ref2 Ref4,Ref3 Ref1, Ref3 Ref2,Ref3 Ref4, Ref4 Ref1,Ref4 Ref2, Ref4 Ref3
Set the Ref channel pairfrom which to acquiredata
File Select File(s)D+ D−
Browse Load the data from .csvfiles
In the General Config tab, set the Device Type, Cable Attenuation, and Usage model.
Table 59: General configuration parameters Parameter Options To doDevice Type Initiator, Target Select the type of device to
testUsage Model 1.5 Gbps, 3.0 Gbps Select the speed at which
the device transmits orreceives data
Cable Attn Range: 100 p-10 G Type the cable attenuationor enter the value within therange from the numerickeypad
6. From the Control panel, select the mode (Single Run or Single No Acq).
7. Click the Start button to start taking the measurement. When the measurement is complete, the summary of the results is displayed.
8. If the results are not automatically displayed, select Results> Summary to view the results. To view detailed results, select Results> Details.
How To…
Option SST Serial ATA and Serial Attached SCSI Analysis Module 116
Perform Transmitter COMINIT, COMWAKE, and COMRESET Tests Follow these steps to perform the COMINIT, COMWAKE, and COMRESET Tests for a transmitter.
1. Set up the DUT (Host or Drive) as shown in the How To Set up the DUT section.
2. Select Measurements> Select from the menu bar.
3. Select Test Point as IT or CT, and Probe Type as Single-ended or Differential.
4. Click any one of the OOB tests: COMINIT, COMWAKE, or COMRESET.
5. To change the configuration settings, select Measurements> Configure from the menu bar or click the Configure button.
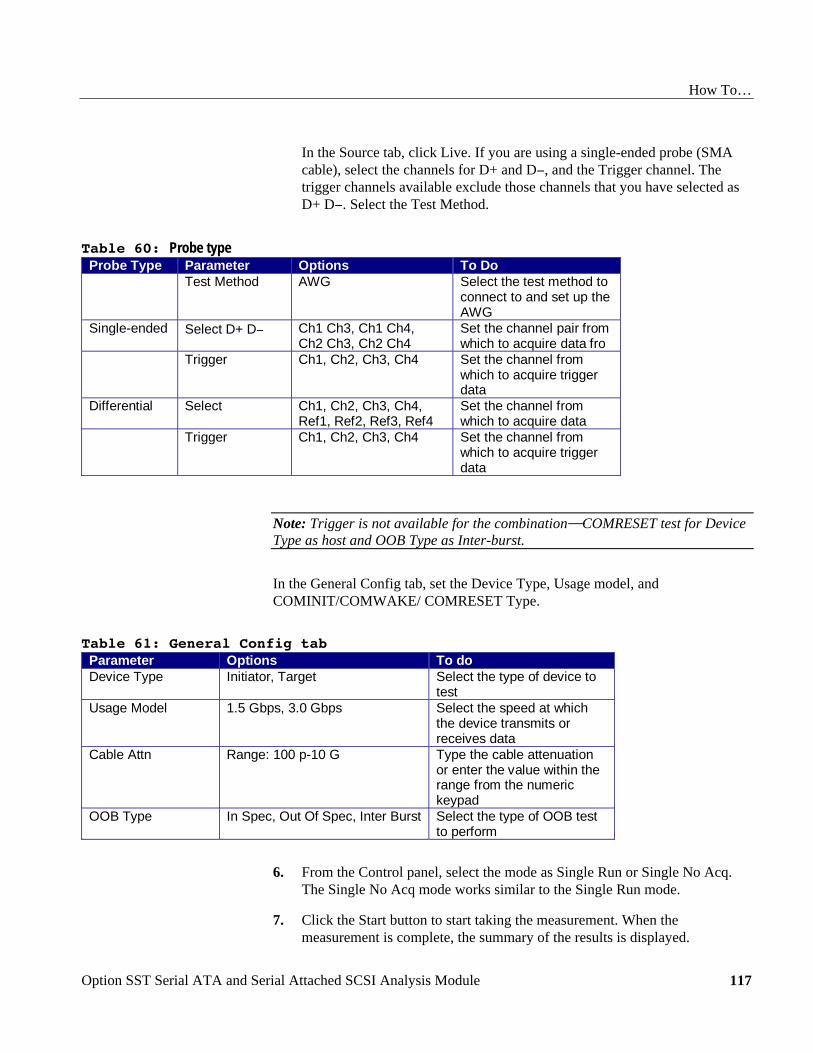
How To…
Option SST Serial ATA and Serial Attached SCSI Analysis Module
117
In the Source tab, click Live. If you are using a single-ended probe (SMA cable), select the channels for D+ and D−, and the Trigger channel. The trigger channels available exclude those channels that you have selected as D+ D−. Select the Test Method.
Table 60: Probe type Probe Type Parameter Options To Do
Test Method AWG Select the test method toconnect to and set up theAWG
Single-ended Select D+ D− Ch1 Ch3, Ch1 Ch4,Ch2 Ch3, Ch2 Ch4
Set the channel pair fromwhich to acquire data fro
Trigger Ch1, Ch2, Ch3, Ch4 Set the channel fromwhich to acquire triggerdata
Differential Select Ch1, Ch2, Ch3, Ch4,Ref1, Ref2, Ref3, Ref4
Set the channel fromwhich to acquire data
Trigger Ch1, Ch2, Ch3, Ch4 Set the channel fromwhich to acquire triggerdata
Note: Trigger is not available for the combination⎯COMRESET test for Device Type as host and OOB Type as Inter-burst.
In the General Config tab, set the Device Type, Usage model, and COMINIT/COMWAKE/ COMRESET Type.
Table 61: General Config tab Parameter Options To doDevice Type Initiator, Target Select the type of device to
testUsage Model 1.5 Gbps, 3.0 Gbps Select the speed at which
the device transmits orreceives data
Cable Attn Range: 100 p-10 G Type the cable attenuationor enter the value within therange from the numerickeypad
OOB Type In Spec, Out Of Spec, Inter Burst Select the type of OOB testto perform
6. From the Control panel, select the mode as Single Run or Single No Acq.
The Single No Acq mode works similar to the Single Run mode.
7. Click the Start button to start taking the measurement. When the measurement is complete, the summary of the results is displayed.

How To…
Option SST Serial ATA and Serial Attached SCSI Analysis Module 118
8. If the results are not automatically displayed, select Results> Summary to view the results. To view detailed results, select Results> Details.
Perform SAS Tests for Receiver
Receiver Measurements
Measurements that are available for a SAS Receiver are Eye, Bit Rate, Rise and Fall Time, and Differential Skew. You can select one measurement at a time.
Perform Receiver Eye and Bit Rate Tests Follow these steps to measure the Eye, Bit Rate, or both for a receiver:
1. Set up the DUT (Host or Drive) as shown in the How To Set up the DUT section.
2. Select Measurements> Select from the menu bar.
3. Select Test Point as IR, CR, XR, and Probe Type as Single-ended or Differential.
4. Click Eye and Bit Rate.
5. To change the configuration settings, select Measurements> Configure from the menu bar or click the Configure button.
In the Source tab, click Live, Ref, or File. If you are using a single-ended probe (SMA cable), select the channels for D+ and D−, and the Trigger channel. The trigger channels available exclude those channels that you have selected as D+ D−. Select the Test Method.

How To…
Option SST Serial ATA and Serial Attached SCSI Analysis Module
119
Table 62: Source tab Select Parameter Options To DoTest Method AWG, BIST FIS/User Select the test method to
use. The module uses thesource pattern fileslocated on the AWG, oruses a vendor-specificmethod to test the DUT
Live Select D+ D− Ch1 Ch3, Ch1 Ch4,Ch2 Ch3, Ch2 Ch4
Set the channel pair toacquire data from
Trigger Ch1, Ch2, Ch3, Ch4 Set the channel toacquire trigger data from
Ref Select D+ D− Ref1 Ref2, Ref1 Ref3,Ref1 Ref4, Ref2 Ref1,Ref2 Ref3, Ref2 Ref4,Ref3 Ref1, Ref3 Ref2,Ref3 Ref4, Ref4 Ref1,Ref4 Ref2, Ref4 Ref3
Set the Ref channel pairto acquire data from
File Select File(s)D+ D−
Browse Load the data from .csvfiles
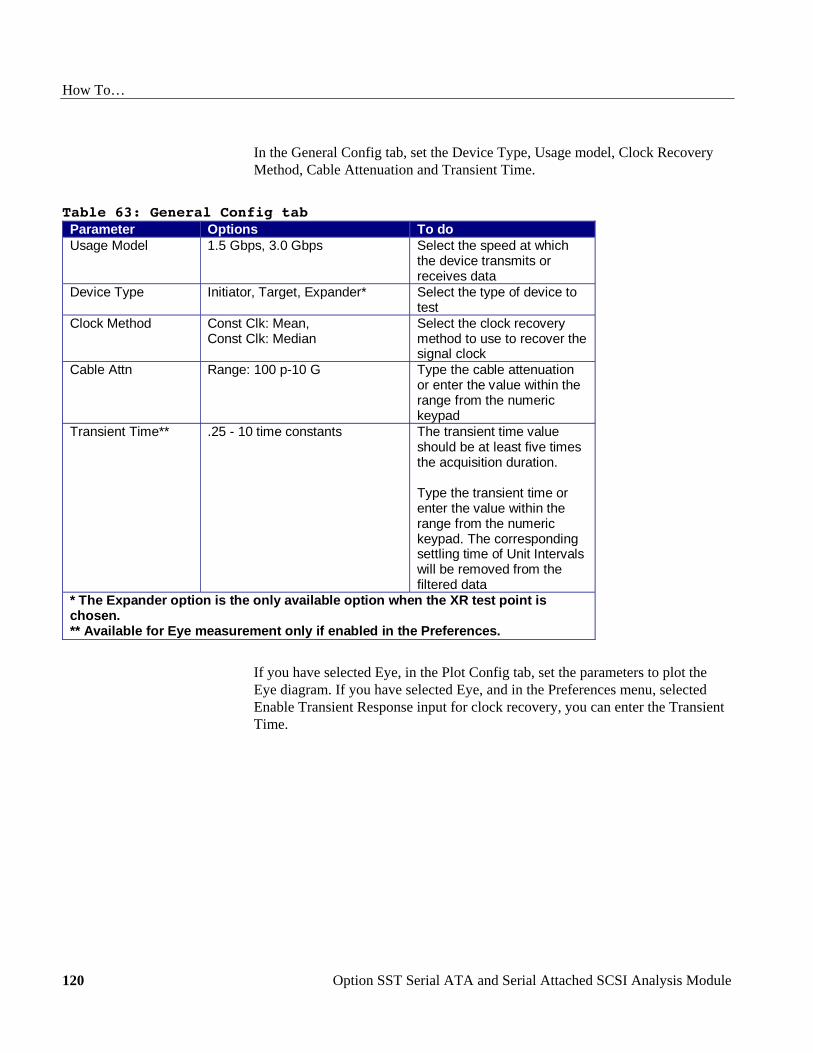
How To…
Option SST Serial ATA and Serial Attached SCSI Analysis Module 120
In the General Config tab, set the Device Type, Usage model, Clock Recovery Method, Cable Attenuation and Transient Time.
Table 63: General Config tab Parameter Options To doUsage Model 1.5 Gbps, 3.0 Gbps Select the speed at which
the device transmits orreceives data
Device Type Initiator, Target, Expander* Select the type of device totest
Clock Method Const Clk: Mean,Const Clk: Median
Select the clock recoverymethod to use to recover thesignal clock
Cable Attn Range: 100 p-10 G Type the cable attenuationor enter the value within therange from the numerickeypad
Transient Time** .25 - 10 time constants The transient time valueshould be at least five timesthe acquisition duration.
Type the transient time orenter the value within therange from the numerickeypad. The correspondingsettling time of Unit Intervalswill be removed from thefiltered data
* The Expander option is the only available option when the XR test point ischosen.** Available for Eye measurement only if enabled in the Preferences.
If you have selected Eye, in the Plot Config tab, set the parameters to plot the Eye diagram. If you have selected Eye, and in the Preferences menu, selected Enable Transient Response input for clock recovery, you can enter the Transient Time.

How To…
Option SST Serial ATA and Serial Attached SCSI Analysis Module
121
Table 64: Plot Config tab Parameter To DoTransition and Non-Transition Bits Plot the transition and non-transition bits as two
separate eye diagramsAll Bits Plot all bits (transition and non-transition) in a
single eye diagram
6. From the Control panel, select the mode (Single Run or Single No Acq).
7. Click the Start button to start taking the measurement. When the measurement is complete, the summary of the results is displayed.
8. If the results are not automatically displayed, select Results> Summary to view the results. To view detailed results, select Results> Details.
Note: The SAS Eye measurement requires at least three data packets that has ≥ 550 clock transitions in the acquired data to calculate clock recovery correctly. If the acquired pattern has insufficient clock transitions (550) then you need to acquire more packets for sufficient clock transitions.
Perform Receiver Differential Skew Test Follow these steps to measure the Differential Skew for a receiver.
1. Set up the DUT (Host or Drive) as shown in the How To Set up the DUT section.
2. Select Measurements> Select from the menu bar.
3. Select Test Point as IR, CR, or XR and Probe Type as Single-ended.
4. Click Differential Skew.
5. To change the configuration settings, select Measurements> Configure from the menu bar or click the Configure button.
In the Source tab, click Live, Ref, or File. Select the channels for D+ and D−, and the Trigger channel. The trigger channels available exclude those channels that you have selected as D+ D−. Select the Test Method.
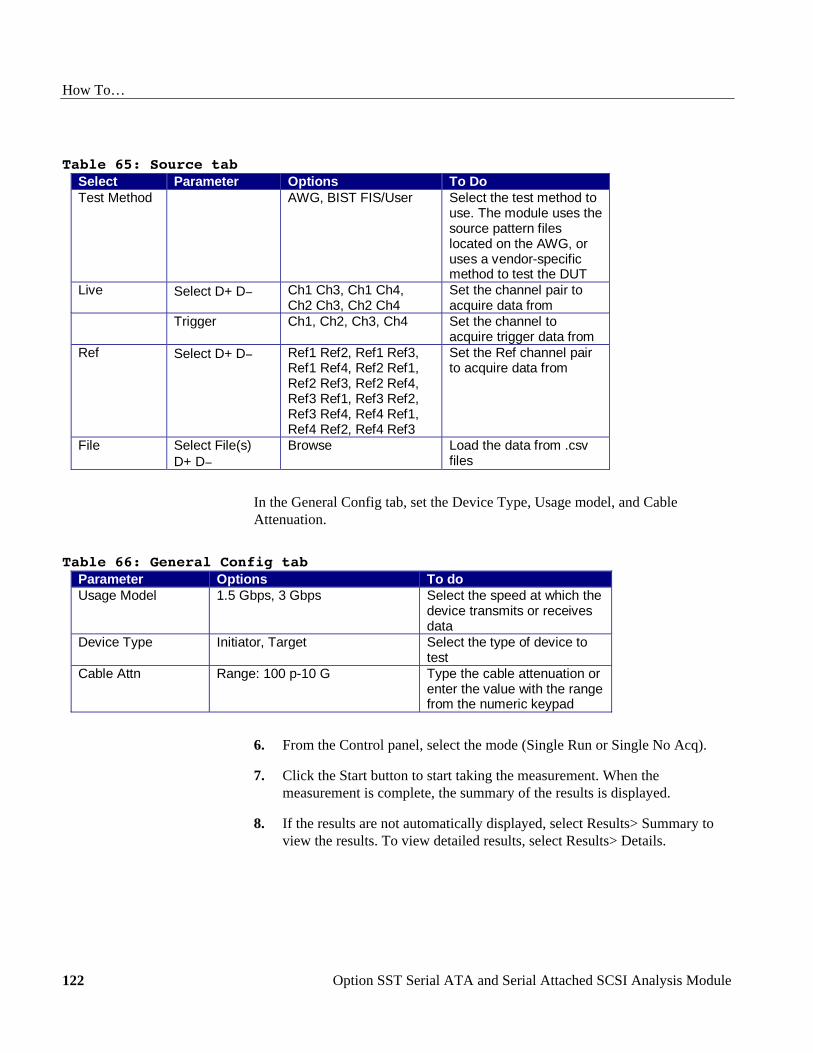
How To…
Option SST Serial ATA and Serial Attached SCSI Analysis Module 122
Table 65: Source tab Select Parameter Options To DoTest Method AWG, BIST FIS/User Select the test method to
use. The module uses thesource pattern fileslocated on the AWG, oruses a vendor-specificmethod to test the DUT
Live Select D+ D− Ch1 Ch3, Ch1 Ch4,Ch2 Ch3, Ch2 Ch4
Set the channel pair toacquire data from
Trigger Ch1, Ch2, Ch3, Ch4 Set the channel toacquire trigger data from
Ref Select D+ D− Ref1 Ref2, Ref1 Ref3,Ref1 Ref4, Ref2 Ref1,Ref2 Ref3, Ref2 Ref4,Ref3 Ref1, Ref3 Ref2,Ref3 Ref4, Ref4 Ref1,Ref4 Ref2, Ref4 Ref3
Set the Ref channel pairto acquire data from
File Select File(s)D+ D−
Browse Load the data from .csvfiles
In the General Config tab, set the Device Type, Usage model, and Cable Attenuation.
Table 66: General Config tab Parameter Options To doUsage Model 1.5 Gbps, 3 Gbps Select the speed at which the
device transmits or receivesdata
Device Type Initiator, Target Select the type of device totest
Cable Attn Range: 100 p-10 G Type the cable attenuation orenter the value with the rangefrom the numeric keypad
6. From the Control panel, select the mode (Single Run or Single No Acq).
7. Click the Start button to start taking the measurement. When the measurement is complete, the summary of the results is displayed.
8. If the results are not automatically displayed, select Results> Summary to view the results. To view detailed results, select Results> Details.
How To…
Option SST Serial ATA and Serial Attached SCSI Analysis Module
123
Perform Receiver Rise Time and Fall Time Test Follow these steps to measure the Rise and Fall Time for a receiver.
1. Set up the DUT (Host or Drive) as shown in the How To Set up the DUT section.
2. Select Measurements> Select from the menu bar.
3. Select Test Point as IR, CR, or XR, and Probe Type as Single-ended or Differential.
4. Click Rise and Fall Time.
5. To change the configuration settings, select Measurements> Configure from the menu bar or click the Configure button.
In the Source tab, click Live, Ref, or File. If you are using a single-ended probe (SMA cable), select the channels for D+ and D−, and the Trigger channel. The trigger channels available exclude those channels that you have selected as D+ D−. Select the Test Method.

How To…
Option SST Serial ATA and Serial Attached SCSI Analysis Module 124
Table 67: Source tab Select Parameter Options To DoTest Method AWG, BIST FIS/User Select the test method to
use. The module uses thesource pattern fileslocated on the AWG, oruses a vendor-specificmethod to test the DUT
Live Select D+ D− Ch1 Ch3, Ch1 Ch4,Ch2 Ch3, Ch2 Ch4
Set the channel pair toacquire data from
Trigger Ch1, Ch2, Ch3, Ch4 Set the channel toacquire trigger data from
Ref Select D+ D− Ref1 Ref2, Ref1 Ref3,Ref1 Ref4, Ref2 Ref1,Ref2 Ref3, Ref2 Ref4,Ref3 Ref1, Ref3 Ref2,Ref3 Ref4, Ref4 Ref1,Ref4 Ref2, Ref4 Ref3
Set the Ref channel pairto acquire data from
File Select File(s)D+ D−
Browse Load the data from .csvfiles
For a differential probe, the source parameters are:
Table 68: Differential probe Select Parameter Options To DoTest Method AWG, BIST FIS/User Select the test method to
use. The module uses thesource pattern fileslocated on the AWG, oruses a vendor-specificmethod to test the DUT
Live/Ref Select Ch1, Ch2, Ch3, Ch4,Ref1, Ref2, Ref3, Ref4
Set the channel toacquire data from
Trigger Ch1, Ch2, Ch3, Ch4 Set the channel toacquire trigger data from
File Select File Browse Load the data from a .csvfile
If you choose Live/Ref and select a Ref channel to acquire data from, then the Trigger selection is not available.
In the General Config tab, set the Device Type, Usage model, and Cable Attenuation.

How To…
Option SST Serial ATA and Serial Attached SCSI Analysis Module
125
Table 69: General Config tab Parameter Options To doUsage Model 1.5 Gbps, 3.0 Gbps Select the speed at which
the device transmits orreceives data
Device Type Initiator, Target, Expander* Select the type of device totest
Cable Attn Range: 100 p-10 G Type the cable attenuationor enter the value within therange from the numerickeypad
* The Expander option is the only available option when XR test point is chosen.
6. From the Control panel, select the mode (Single Run or Single No Acq).
7. Click the Start button to start taking the measurement. When the measurement is complete, the summary of the results is displayed.
8. If the results are not automatically displayed, select Results> Summary to view the results. To view detailed results, select Results> Details.
View SAS Tests Results
Summary Results
You can view the summary results of the measurements by selecting Results> Summary. The application displays results for the measurements for the current acquisition.
The Results Summary menu shows the current data and all acquisition data for each statistical value.
The Results Summary menu displays the following information as a table. Wherever measurement limits are not available, those fields in the table are blank.
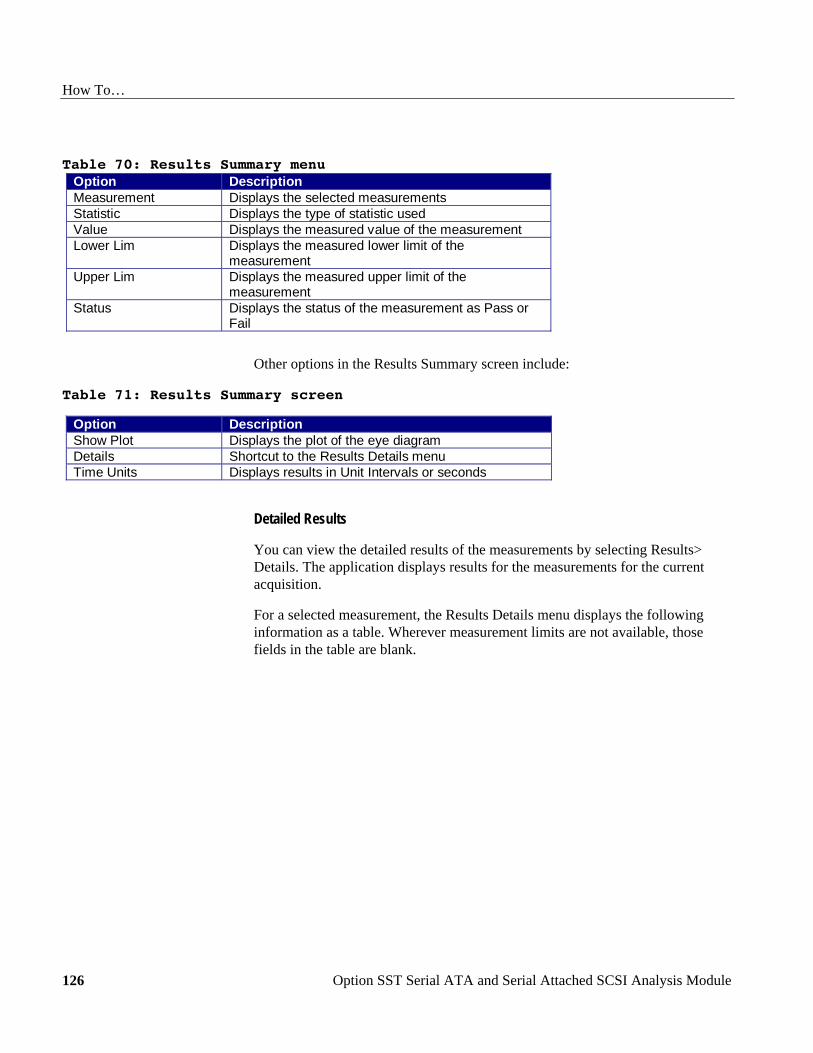
How To…
Option SST Serial ATA and Serial Attached SCSI Analysis Module 126
Table 70: Results Summary menu Option DescriptionMeasurement Displays the selected measurementsStatistic Displays the type of statistic usedValue Displays the measured value of the measurementLower Lim Displays the measured lower limit of the
measurementUpper Lim Displays the measured upper limit of the
measurementStatus Displays the status of the measurement as Pass or
Fail
Other options in the Results Summary screen include:
Table 71: Results Summary screen
Option DescriptionShow Plot Displays the plot of the eye diagramDetails Shortcut to the Results Details menuTime Units Displays results in Unit Intervals or seconds
Detailed Results
You can view the detailed results of the measurements by selecting Results> Details. The application displays results for the measurements for the current acquisition.
For a selected measurement, the Results Details menu displays the following information as a table. Wherever measurement limits are not available, those fields in the table are blank.
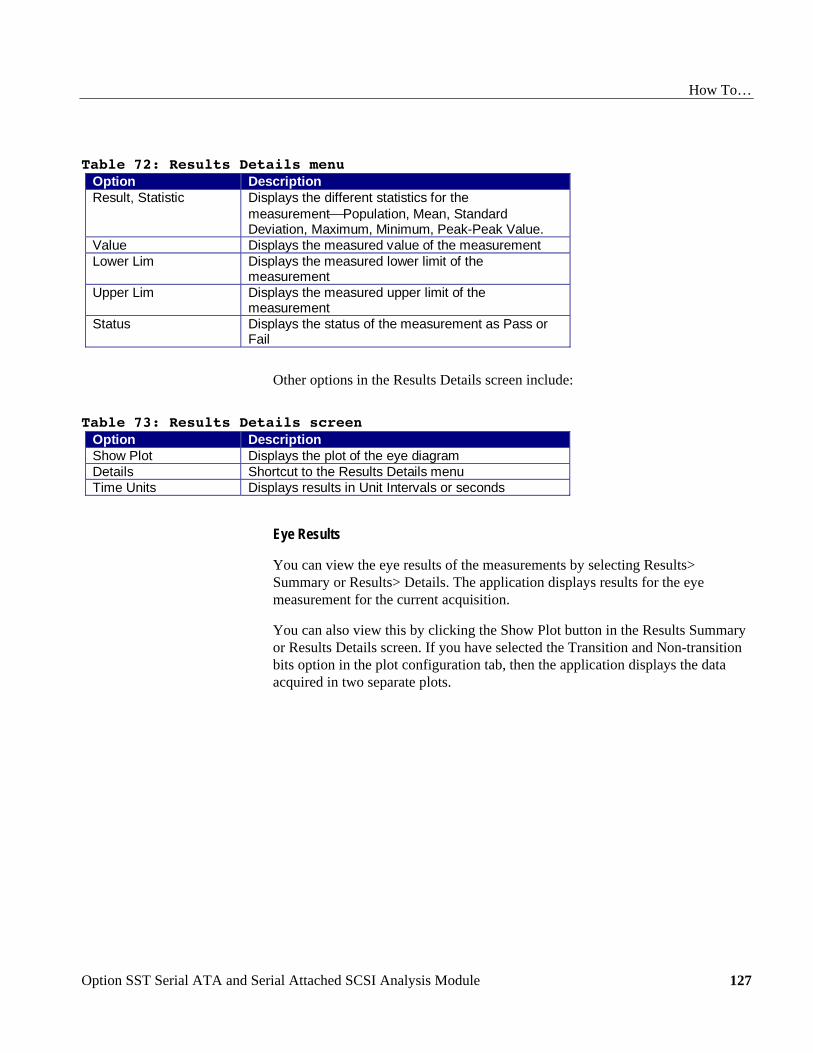
How To…
Option SST Serial ATA and Serial Attached SCSI Analysis Module
127
Table 72: Results Details menu Option DescriptionResult, Statistic Displays the different statistics for the
measurement⎯Population, Mean, StandardDeviation, Maximum, Minimum, Peak-Peak Value.
Value Displays the measured value of the measurementLower Lim Displays the measured lower limit of the
measurementUpper Lim Displays the measured upper limit of the
measurementStatus Displays the status of the measurement as Pass or
Fail
Other options in the Results Details screen include:
Table 73: Results Details screen Option DescriptionShow Plot Displays the plot of the eye diagramDetails Shortcut to the Results Details menuTime Units Displays results in Unit Intervals or seconds
Eye Results
You can view the eye results of the measurements by selecting Results> Summary or Results> Details. The application displays results for the eye measurement for the current acquisition.
You can also view this by clicking the Show Plot button in the Results Summary or Results Details screen. If you have selected the Transition and Non-transition bits option in the plot configuration tab, then the application displays the data acquired in two separate plots.

How To…
Option SST Serial ATA and Serial Attached SCSI Analysis Module 128
Figure 65: Eye Plot with transition and non-transition bits
If you have selected the All Bits option, then the application displays the data acquired in one plot.
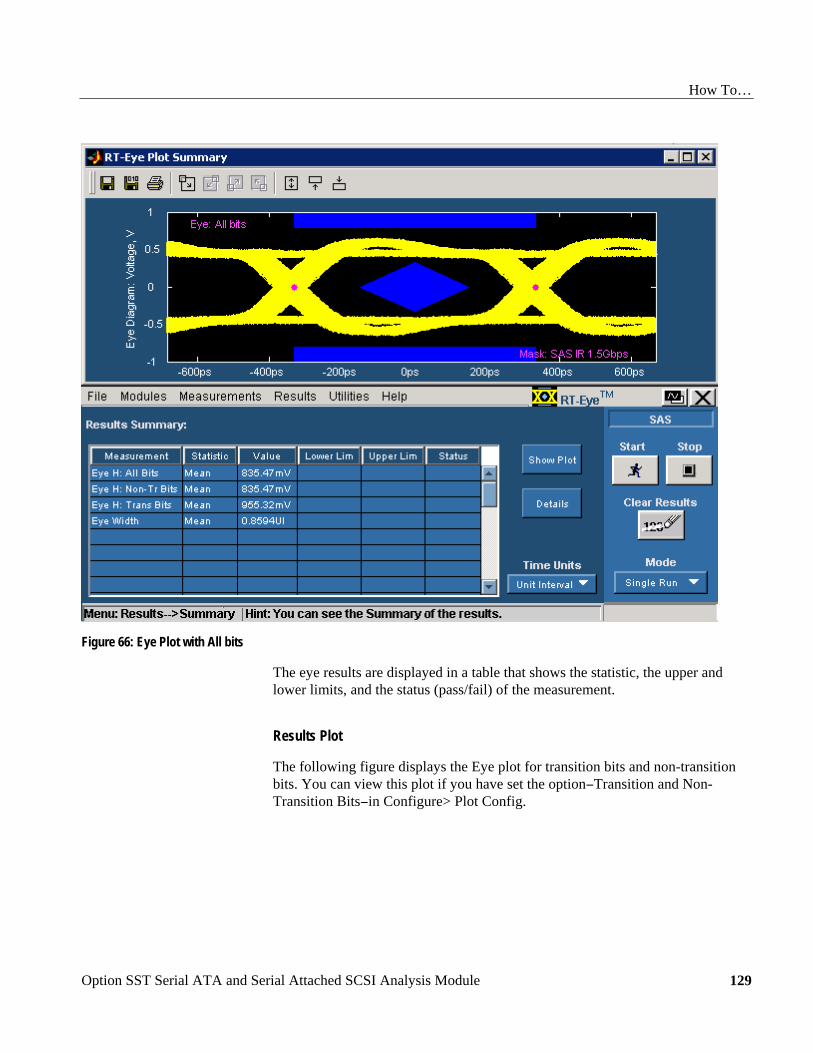
How To…
Option SST Serial ATA and Serial Attached SCSI Analysis Module
129
Figure 66: Eye Plot with All bits
The eye results are displayed in a table that shows the statistic, the upper and lower limits, and the status (pass/fail) of the measurement.
Results Plot
The following figure displays the Eye plot for transition bits and non-transition bits. You can view this plot if you have set the option−Transition and Non-Transition Bits−in Configure> Plot Config.
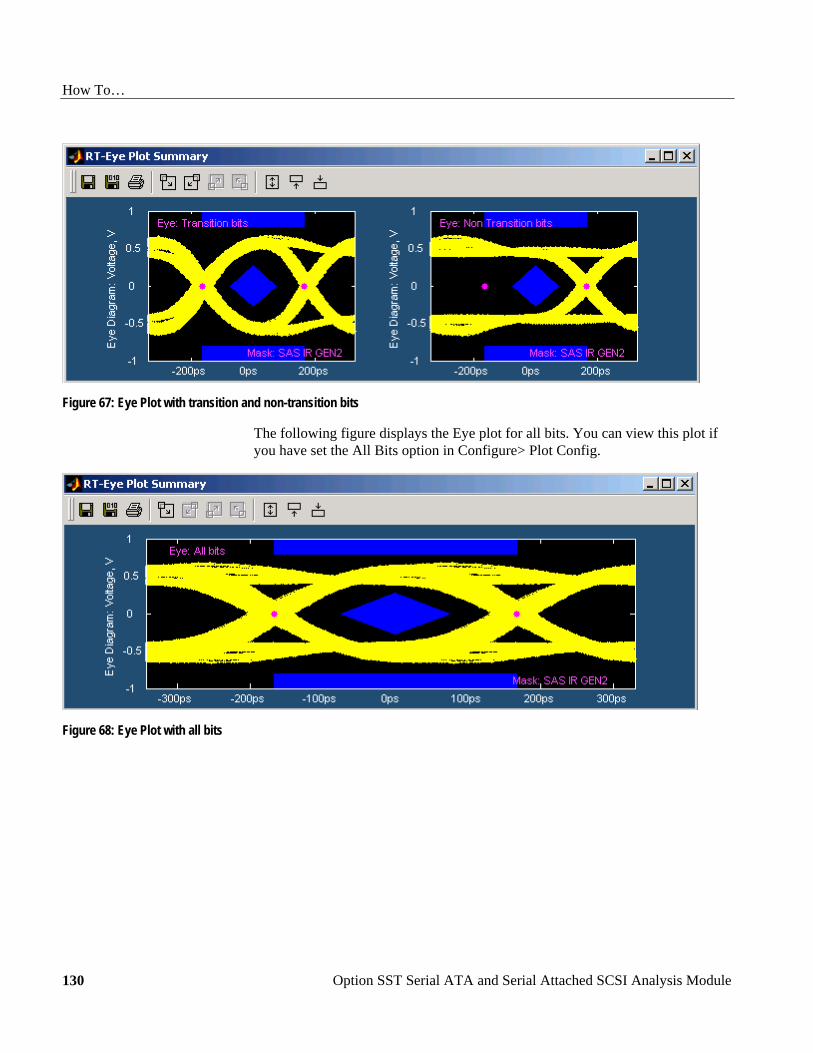
How To…
Option SST Serial ATA and Serial Attached SCSI Analysis Module 130
Figure 67: Eye Plot with transition and non-transition bits
The following figure displays the Eye plot for all bits. You can view this plot if you have set the All Bits option in Configure> Plot Config.
Figure 68: Eye Plot with all bits
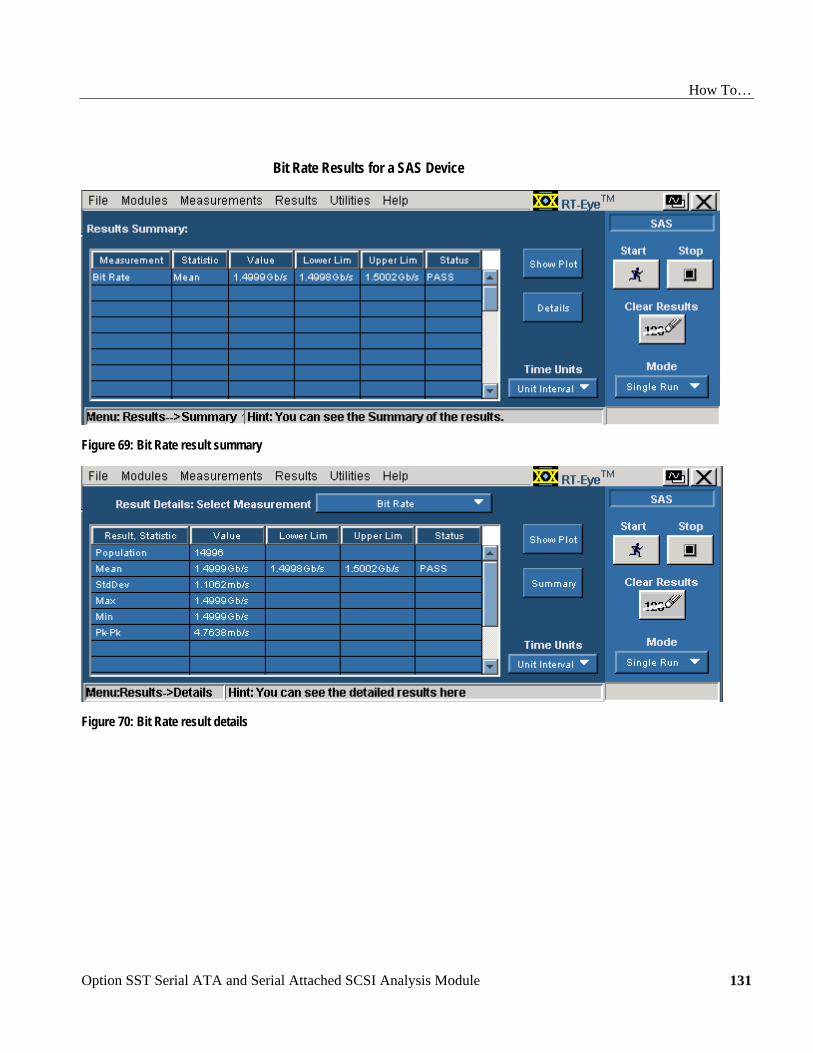
How To…
Option SST Serial ATA and Serial Attached SCSI Analysis Module
131
Bit Rate Results for a SAS Device
Figure 69: Bit Rate result summary
Figure 70: Bit Rate result details
How To…
Option SST Serial ATA and Serial Attached SCSI Analysis Module 132
Rise and Fall Time Results for a SAS Device
Figure 71: Rise Time result details
Figure 72: Fall Time result details
How To…
Option SST Serial ATA and Serial Attached SCSI Analysis Module
133
Differential Skew Results for a SAS Device
Figure 73: Differential Skew result details
How To…
Option SST Serial ATA and Serial Attached SCSI Analysis Module 134
COMINIT for a SAS Device
Figure 74: COMINIT result summary
Figure 75: COMINIT result details

How To…
Option SST Serial ATA and Serial Attached SCSI Analysis Module
135
COMWAKE Results for a SAS Device
Figure 76: COMWAKE result summary
Figure 77: COMWAKE result details
How To…
Option SST Serial ATA and Serial Attached SCSI Analysis Module 136
COMRESET Results for a SAS Device
Figure 78: COMRESET result summary
Figure 79: COMRESET result details

How To…
Option SST Serial ATA and Serial Attached SCSI Analysis Module
137
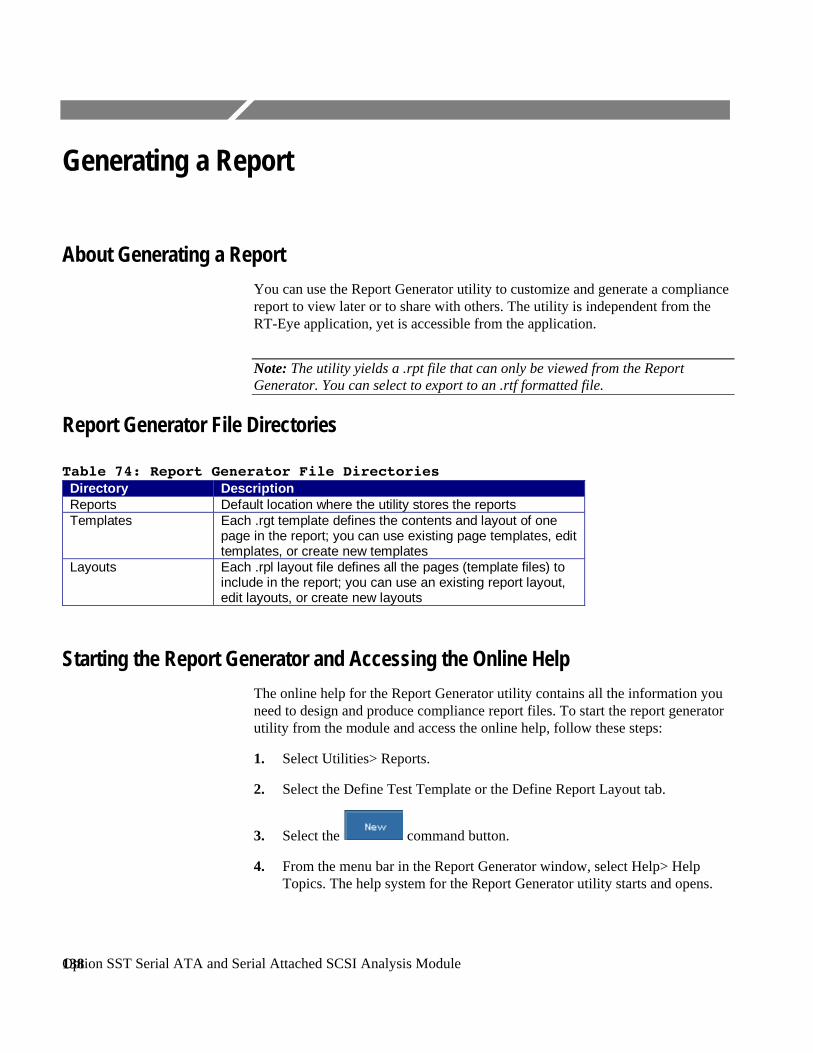
Option SST Serial ATA and Serial Attached SCSI Analysis Module
138
Generating a Report
About Generating a Report You can use the Report Generator utility to customize and generate a compliance report to view later or to share with others. The utility is independent from the RT-Eye application, yet is accessible from the application.
Note: The utility yields a .rpt file that can only be viewed from the Report Generator. You can select to export to an .rtf formatted file.
Report Generator File Directories
Table 74: Report Generator File Directories Directory DescriptionReports Default location where the utility stores the reportsTemplates Each .rgt template defines the contents and layout of one
page in the report; you can use existing page templates, edittemplates, or create new templates
Layouts Each .rpl layout file defines all the pages (template files) toinclude in the report; you can use an existing report layout,edit layouts, or create new layouts
Starting the Report Generator and Accessing the Online Help The online help for the Report Generator utility contains all the information you need to design and produce compliance report files. To start the report generator utility from the module and access the online help, follow these steps:
1. Select Utilities> Reports.
2. Select the Define Test Template or the Define Report Layout tab.
3. Select the command button.
4. From the menu bar in the Report Generator window, select Help> Help Topics. The help system for the Report Generator utility starts and opens.
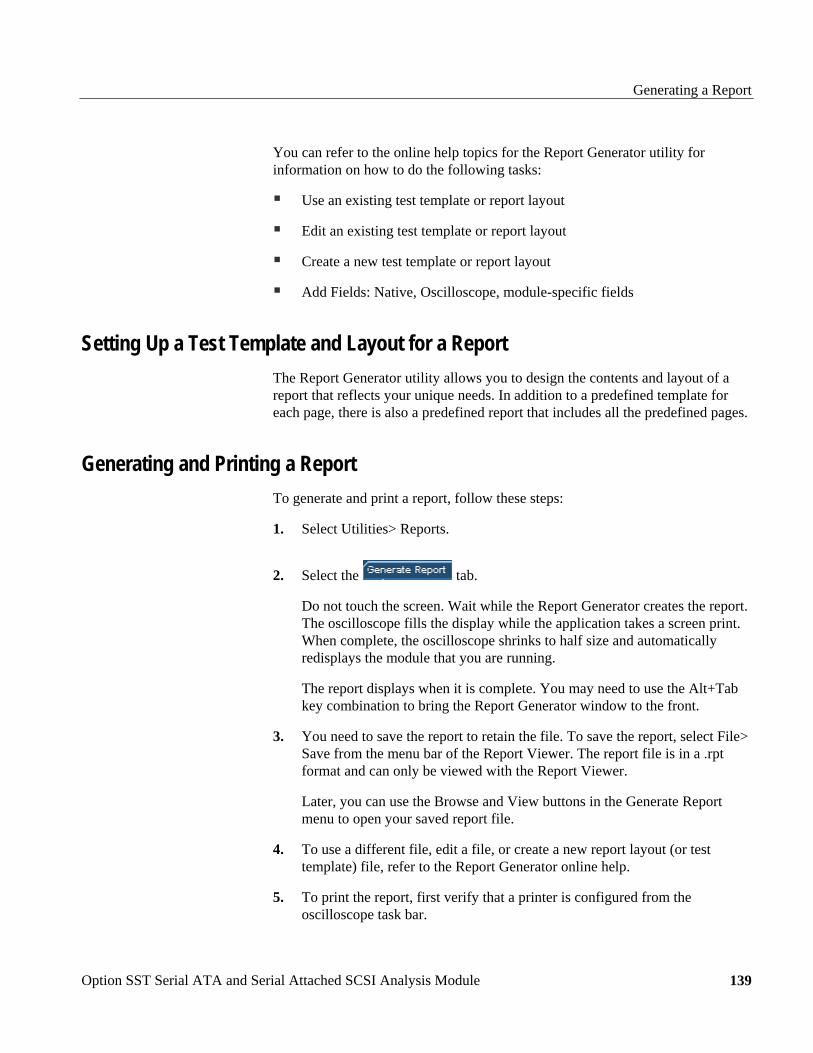
Generating a Report
Option SST Serial ATA and Serial Attached SCSI Analysis Module
139
You can refer to the online help topics for the Report Generator utility for information on how to do the following tasks:
Use an existing test template or report layout
Edit an existing test template or report layout
Create a new test template or report layout
Add Fields: Native, Oscilloscope, module-specific fields
Setting Up a Test Template and Layout for a Report The Report Generator utility allows you to design the contents and layout of a report that reflects your unique needs. In addition to a predefined template for each page, there is also a predefined report that includes all the predefined pages.
Generating and Printing a Report To generate and print a report, follow these steps:
1. Select Utilities> Reports.
2. Select the tab.
Do not touch the screen. Wait while the Report Generator creates the report. The oscilloscope fills the display while the application takes a screen print. When complete, the oscilloscope shrinks to half size and automatically redisplays the module that you are running.
The report displays when it is complete. You may need to use the Alt+Tab key combination to bring the Report Generator window to the front.
3. You need to save the report to retain the file. To save the report, select File> Save from the menu bar of the Report Viewer. The report file is in a .rpt format and can only be viewed with the Report Viewer.
Later, you can use the Browse and View buttons in the Generate Report menu to open your saved report file.
4. To use a different file, edit a file, or create a new report layout (or test template) file, refer to the Report Generator online help.
5. To print the report, first verify that a printer is configured from the oscilloscope task bar.
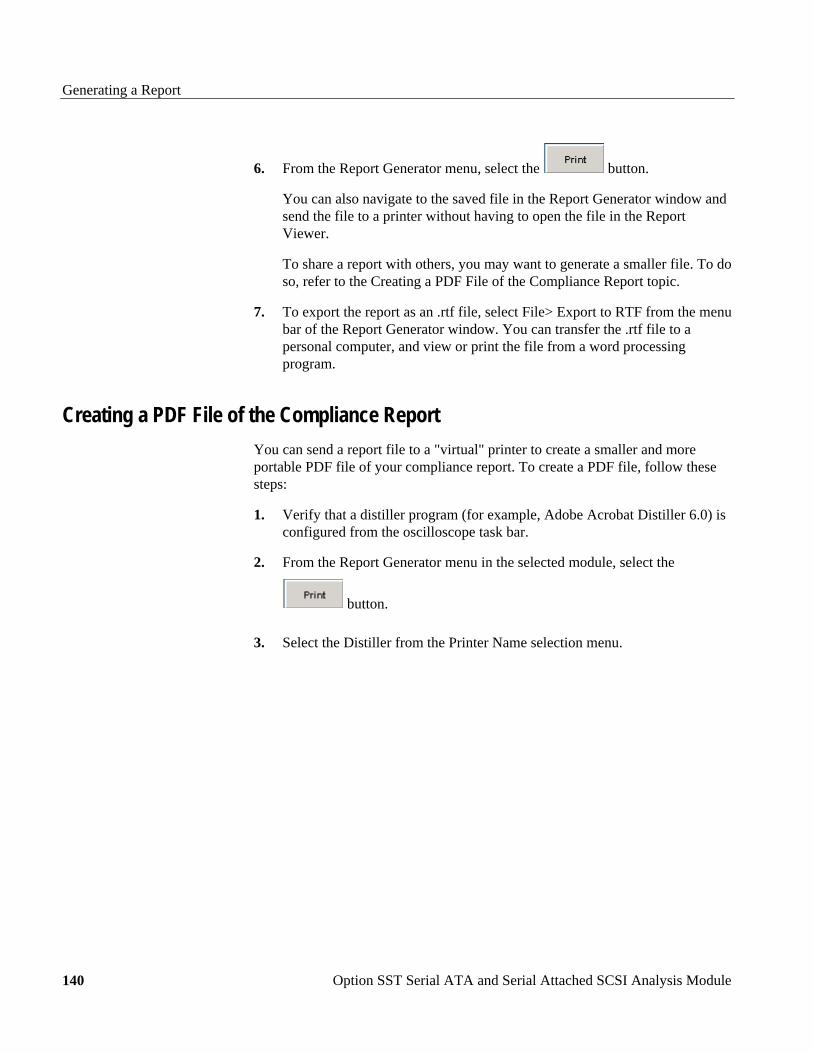
Generating a Report
Option SST Serial ATA and Serial Attached SCSI Analysis Module 140
6. From the Report Generator menu, select the button.
You can also navigate to the saved file in the Report Generator window and send the file to a printer without having to open the file in the Report Viewer.
To share a report with others, you may want to generate a smaller file. To do so, refer to the Creating a PDF File of the Compliance Report topic.
7. To export the report as an .rtf file, select File> Export to RTF from the menu bar of the Report Generator window. You can transfer the .rtf file to a personal computer, and view or print the file from a word processing program.
Creating a PDF File of the Compliance Report You can send a report file to a "virtual" printer to create a smaller and more portable PDF file of your compliance report. To create a PDF file, follow these steps:
1. Verify that a distiller program (for example, Adobe Acrobat Distiller 6.0) is configured from the oscilloscope task bar.
2. From the Report Generator menu in the selected module, select the
button.
3. Select the Distiller from the Printer Name selection menu.
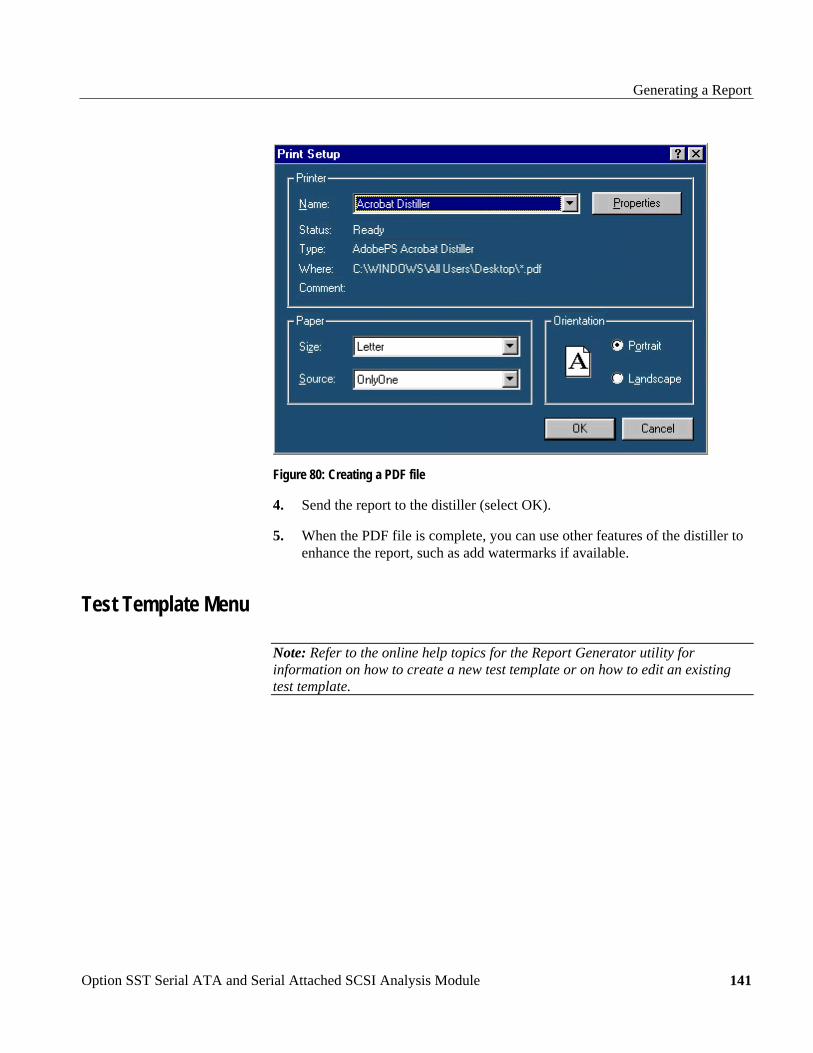
Generating a Report
Option SST Serial ATA and Serial Attached SCSI Analysis Module
141
Figure 80: Creating a PDF file
4. Send the report to the distiller (select OK).
5. When the PDF file is complete, you can use other features of the distiller to enhance the report, such as add watermarks if available.
Test Template Menu
Note: Refer to the online help topics for the Report Generator utility for information on how to create a new test template or on how to edit an existing test template.
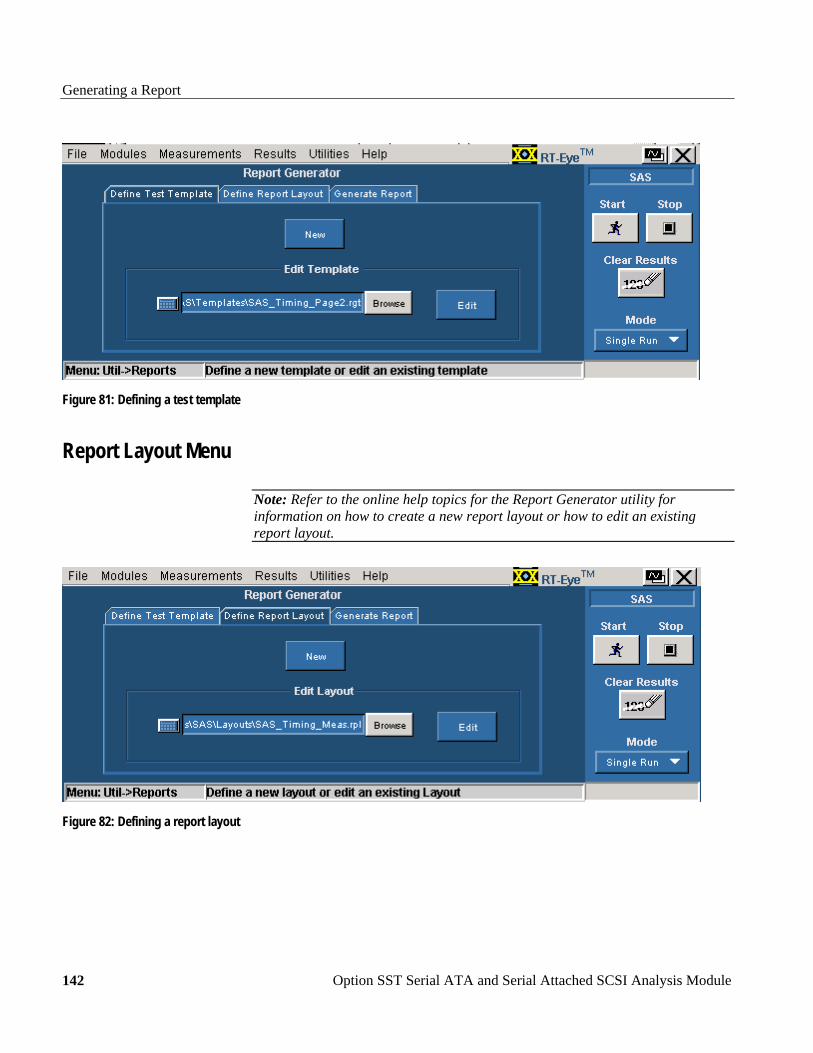
Generating a Report
Option SST Serial ATA and Serial Attached SCSI Analysis Module 142
Figure 81: Defining a test template
Report Layout Menu
Note: Refer to the online help topics for the Report Generator utility for information on how to create a new report layout or how to edit an existing report layout.
Figure 82: Defining a report layout

Generating a Report
Option SST Serial ATA and Serial Attached SCSI Analysis Module
143
Report Generator Menu Options
Table 75: Report Generator menu options Option DescriptionBrowse Select the directory in which to save the report file and
enter a file name; select a file for a template or layoutand edit as needed
Generate Create a reportView View a reportPrint Print a report
Report Generate Menu
Figure 83: Generating a report
Report Generator Fields You can use the fields in the report generator utility to customize the contents and layout of a report. The utility has the following groups of fields:
Oscilloscope
Application
Native

Generating a Report
Option SST Serial ATA and Serial Attached SCSI Analysis Module 144
Application Fields General Information List This is an example of the fields available for the general oscilloscope information in the report.
Figure 84: Example of application fields in a report

Generating a Report
Option SST Serial ATA and Serial Attached SCSI Analysis Module
145
Application Fields Configuration List and an Example This is an example of the fields available for the configuration information. This example also shows the expanded list of fields available for Source in the report.
Figure 85: Example of configuration fields

Generating a Report
Option SST Serial ATA and Serial Attached SCSI Analysis Module 146
Application Fields Results List and Specific Measurements Example This is an example of the fields available for the measurement results information. This example also shows the expanded list of fields available for the Eye measurement in the report.
Figure 86: Example of fields for Eye results
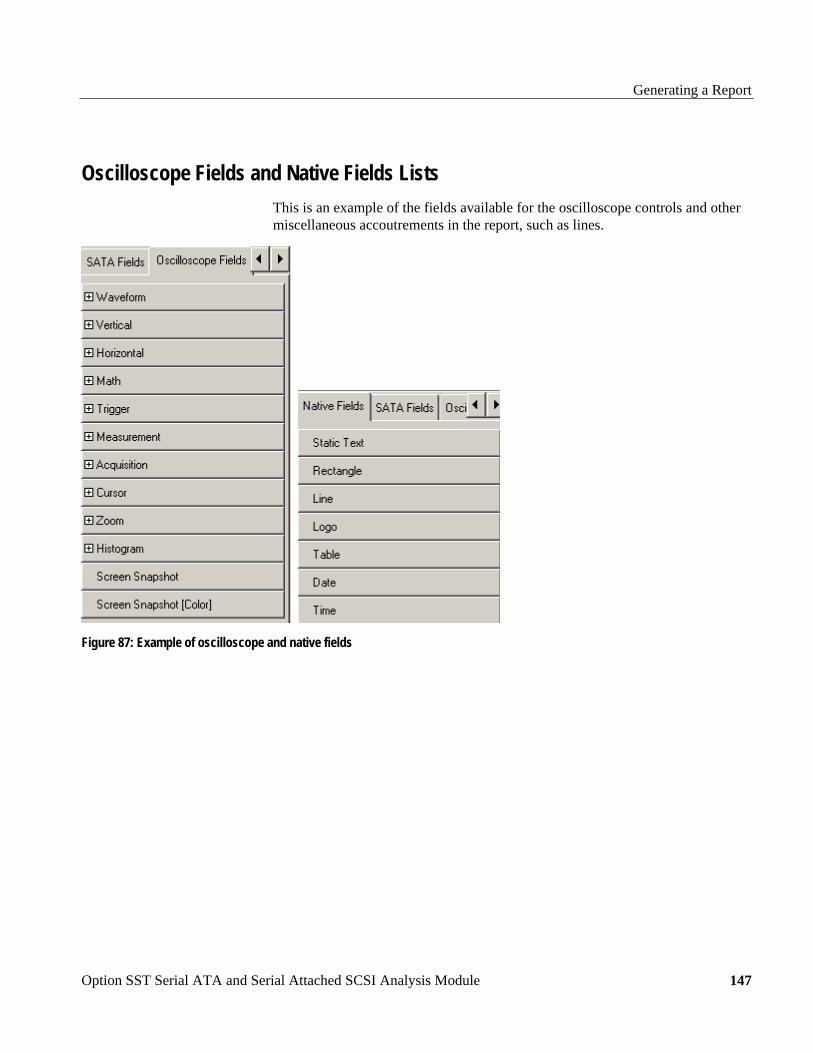
Generating a Report
Option SST Serial ATA and Serial Attached SCSI Analysis Module
147
Oscilloscope Fields and Native Fields Lists This is an example of the fields available for the oscilloscope controls and other miscellaneous accoutrements in the report, such as lines.
Figure 87: Example of oscilloscope and native fields
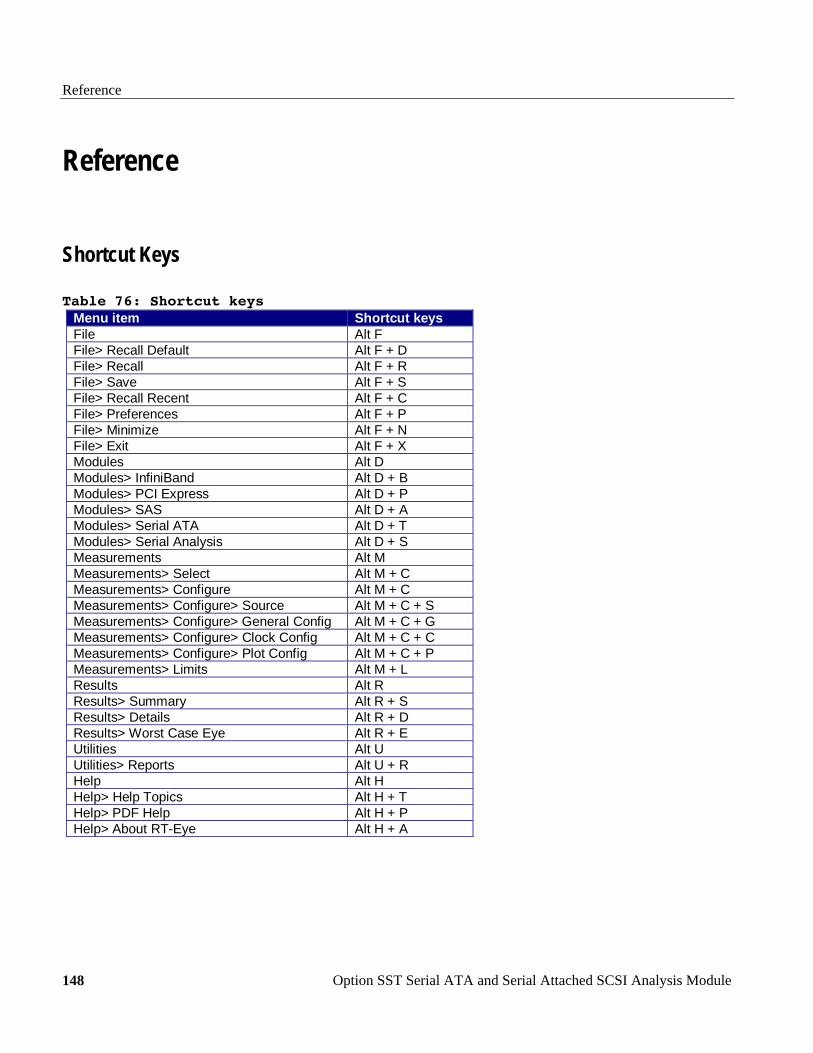
Reference
Option SST Serial ATA and Serial Attached SCSI Analysis Module 148
Reference
Shortcut Keys
Table 76: Shortcut keys Menu item Shortcut keysFile Alt FFile> Recall Default Alt F + DFile> Recall Alt F + RFile> Save Alt F + SFile> Recall Recent Alt F + CFile> Preferences Alt F + PFile> Minimize Alt F + NFile> Exit Alt F + XModules Alt DModules> InfiniBand Alt D + BModules> PCI Express Alt D + PModules> SAS Alt D + AModules> Serial ATA Alt D + TModules> Serial Analysis Alt D + SMeasurements Alt MMeasurements> Select Alt M + CMeasurements> Configure Alt M + CMeasurements> Configure> Source Alt M + C + SMeasurements> Configure> General Config Alt M + C + GMeasurements> Configure> Clock Config Alt M + C + CMeasurements> Configure> Plot Config Alt M + C + PMeasurements> Limits Alt M + LResults Alt RResults> Summary Alt R + SResults> Details Alt R + DResults> Worst Case Eye Alt R + EUtilities Alt UUtilities> Reports Alt U + RHelp Alt HHelp> Help Topics Alt H + THelp> PDF Help Alt H + PHelp> About RT-Eye Alt H + A
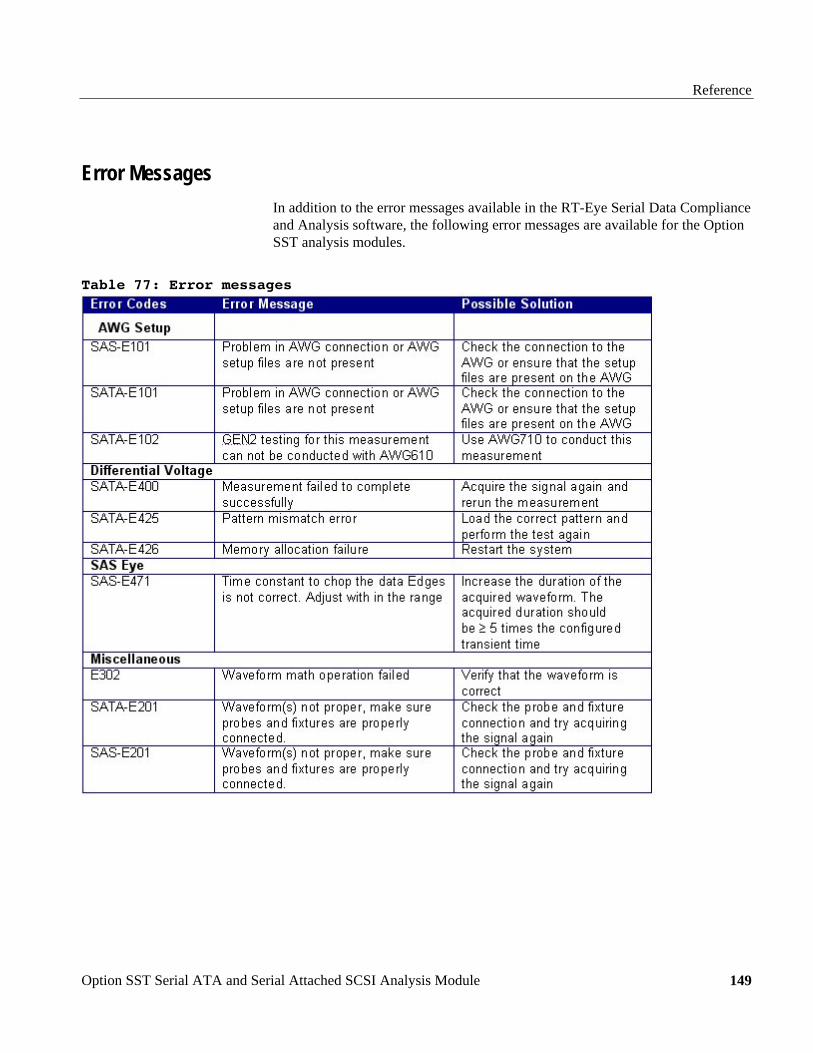
Reference
Option SST Serial ATA and Serial Attached SCSI Analysis Module
149
Error Messages In addition to the error messages available in the RT-Eye Serial Data Compliance and Analysis software, the following error messages are available for the Option SST analysis modules.
Table 77: Error messages
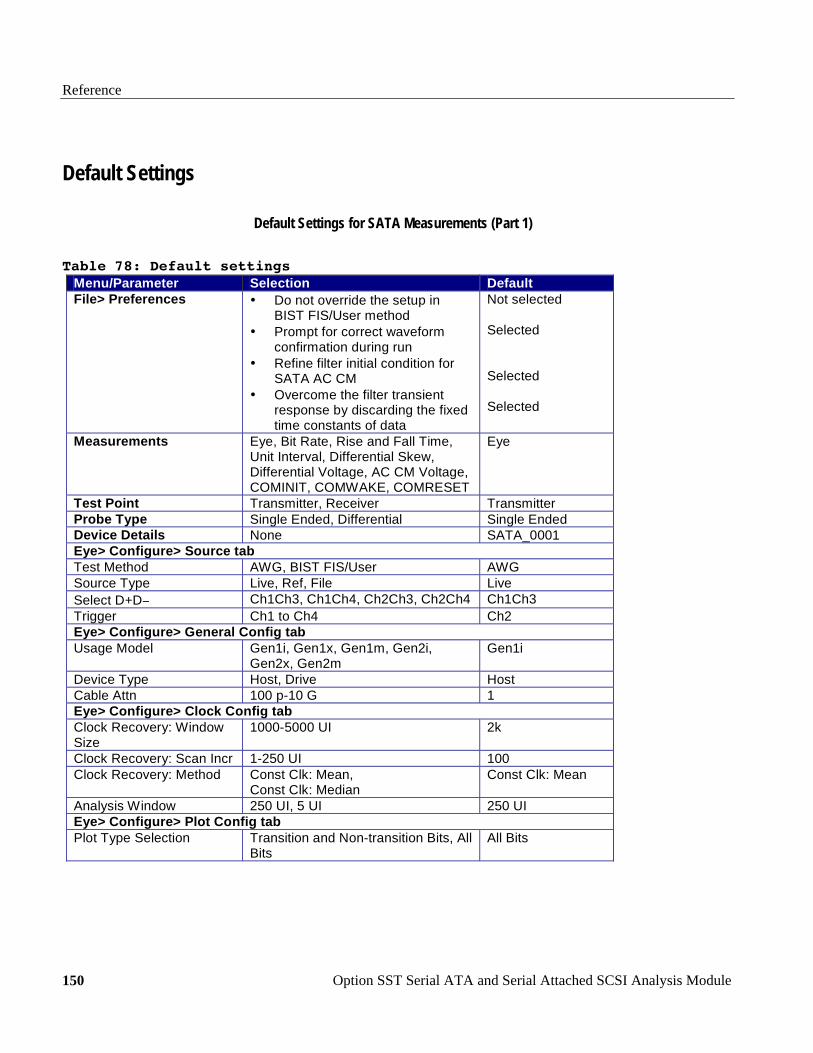
Reference
Option SST Serial ATA and Serial Attached SCSI Analysis Module 150
Default Settings
Default Settings for SATA Measurements (Part 1)
Table 78: Default settings Menu/Parameter Selection Default File> Preferences • Do not override the setup in
BIST FIS/User method • Prompt for correct waveform
confirmation during run • Refine filter initial condition for
SATA AC CM • Overcome the filter transient
response by discarding the fixed time constants of data
Not selected Selected Selected Selected
Measurements Eye, Bit Rate, Rise and Fall Time, Unit Interval, Differential Skew, Differential Voltage, AC CM Voltage, COMINIT, COMWAKE, COMRESET
Eye
Test Point Transmitter, Receiver Transmitter Probe Type Single Ended, Differential Single Ended Device Details None SATA_0001 Eye> Configure> Source tab Test Method AWG, BIST FIS/User AWG Source Type Live, Ref, File Live Select D+D− Ch1Ch3, Ch1Ch4, Ch2Ch3, Ch2Ch4 Ch1Ch3 Trigger Ch1 to Ch4 Ch2 Eye> Configure> General Config tab Usage Model Gen1i, Gen1x, Gen1m, Gen2i,
Gen2x, Gen2m Gen1i
Device Type Host, Drive Host Cable Attn 100 p-10 G 1 Eye> Configure> Clock Config tab Clock Recovery: Window Size
1000-5000 UI 2k
Clock Recovery: Scan Incr 1-250 UI 100 Clock Recovery: Method Const Clk: Mean,
Const Clk: Median Const Clk: Mean
Analysis Window 250 UI, 5 UI 250 UI Eye> Configure> Plot Config tab Plot Type Selection Transition and Non-transition Bits, All
Bits All Bits
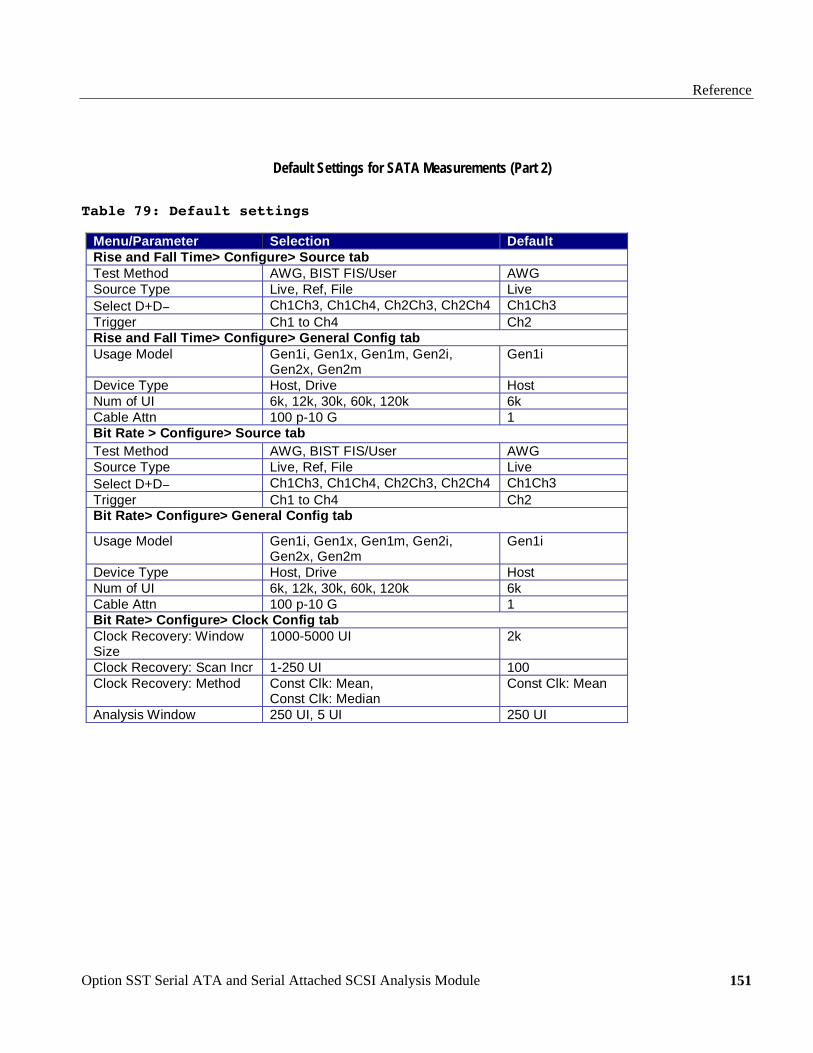
Reference
Option SST Serial ATA and Serial Attached SCSI Analysis Module
151
Default Settings for SATA Measurements (Part 2)
Table 79: Default settings
Menu/Parameter Selection DefaultRise and Fall Time> Configure> Source tabTest Method AWG, BIST FIS/User AWGSource Type Live, Ref, File LiveSelect D+D− Ch1Ch3, Ch1Ch4, Ch2Ch3, Ch2Ch4 Ch1Ch3Trigger Ch1 to Ch4 Ch2Rise and Fall Time> Configure> General Config tabUsage Model Gen1i, Gen1x, Gen1m, Gen2i,
Gen2x, Gen2mGen1i
Device Type Host, Drive HostNum of UI 6k, 12k, 30k, 60k, 120k 6kCable Attn 100 p-10 G 1Bit Rate > Configure> Source tabTest Method AWG, BIST FIS/User AWGSource Type Live, Ref, File LiveSelect D+D− Ch1Ch3, Ch1Ch4, Ch2Ch3, Ch2Ch4 Ch1Ch3Trigger Ch1 to Ch4 Ch2Bit Rate> Configure> General Config tab
Usage Model Gen1i, Gen1x, Gen1m, Gen2i,Gen2x, Gen2m
Gen1i
Device Type Host, Drive HostNum of UI 6k, 12k, 30k, 60k, 120k 6kCable Attn 100 p-10 G 1Bit Rate> Configure> Clock Config tabClock Recovery: WindowSize
1000-5000 UI 2k
Clock Recovery: Scan Incr 1-250 UI 100Clock Recovery: Method Const Clk: Mean,
Const Clk: MedianConst Clk: Mean
Analysis Window 250 UI, 5 UI 250 UI
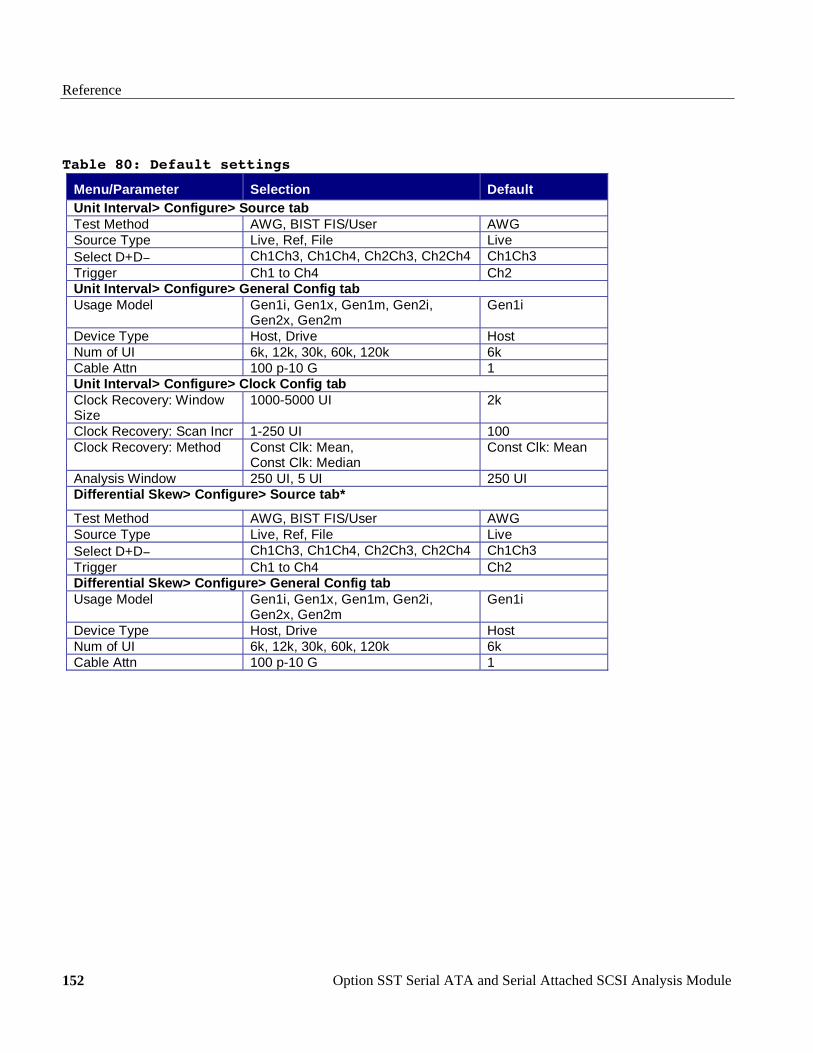
Reference
Option SST Serial ATA and Serial Attached SCSI Analysis Module 152
Table 80: Default settings
Menu/Parameter Selection DefaultUnit Interval> Configure> Source tabTest Method AWG, BIST FIS/User AWGSource Type Live, Ref, File LiveSelect D+D− Ch1Ch3, Ch1Ch4, Ch2Ch3, Ch2Ch4 Ch1Ch3Trigger Ch1 to Ch4 Ch2Unit Interval> Configure> General Config tabUsage Model Gen1i, Gen1x, Gen1m, Gen2i,
Gen2x, Gen2mGen1i
Device Type Host, Drive HostNum of UI 6k, 12k, 30k, 60k, 120k 6kCable Attn 100 p-10 G 1Unit Interval> Configure> Clock Config tabClock Recovery: WindowSize
1000-5000 UI 2k
Clock Recovery: Scan Incr 1-250 UI 100Clock Recovery: Method Const Clk: Mean,
Const Clk: MedianConst Clk: Mean
Analysis Window 250 UI, 5 UI 250 UIDifferential Skew> Configure> Source tab*
Test Method AWG, BIST FIS/User AWGSource Type Live, Ref, File LiveSelect D+D− Ch1Ch3, Ch1Ch4, Ch2Ch3, Ch2Ch4 Ch1Ch3Trigger Ch1 to Ch4 Ch2Differential Skew> Configure> General Config tabUsage Model Gen1i, Gen1x, Gen1m, Gen2i,
Gen2x, Gen2mGen1i
Device Type Host, Drive HostNum of UI 6k, 12k, 30k, 60k, 120k 6kCable Attn 100 p-10 G 1

Reference
Option SST Serial ATA and Serial Attached SCSI Analysis Module
153
Default Settings for SATA Measurements (Part 3)
Table 81: Default settings Menu/Parameter Selection DefaultDifferential Voltage > Configure> Source tabTest Method BIST FIS/User BIST FIS/UserSource Type Live, Ref, File LiveSelect D+D− Ch1Ch3, Ch1Ch4, Ch2Ch3, Ch2Ch4 Ch1Ch3Differential Voltage> Configure> General Config tabUsage Model Gen1i, Gen1x, Gen1m, Gen2i,
Gen2x, Gen2mGen1i
Device Type Host, Drive HostNum of UI 6k, 12k, 30k, 60k, 120k 6kCable Attn 100 p-10 G 1Diff Volt Option Option1, Option2 Option1AC CM Voltage> Configure> Source tab*Test Method BIST FIS/User, AWG AWGSource Type Live, Ref, File LiveSelect D+D− Ch1Ch3, Ch1Ch4, Ch2Ch3, Ch2Ch4 Ch1Ch3Trigger Ch1 to Ch4 Ch2AC CM Voltage> Configure> General Config tabUsage Model Gen1i, Gen1x, Gen1m, Gen2i,
Gen2x, Gen2mGen1i
Device Type Host, Drive HostNum of UI 6k, 12k, 30k, 60k, 120k 6kCable Attn 100 p-10 G 1* These measurements are available only for single-ended probes
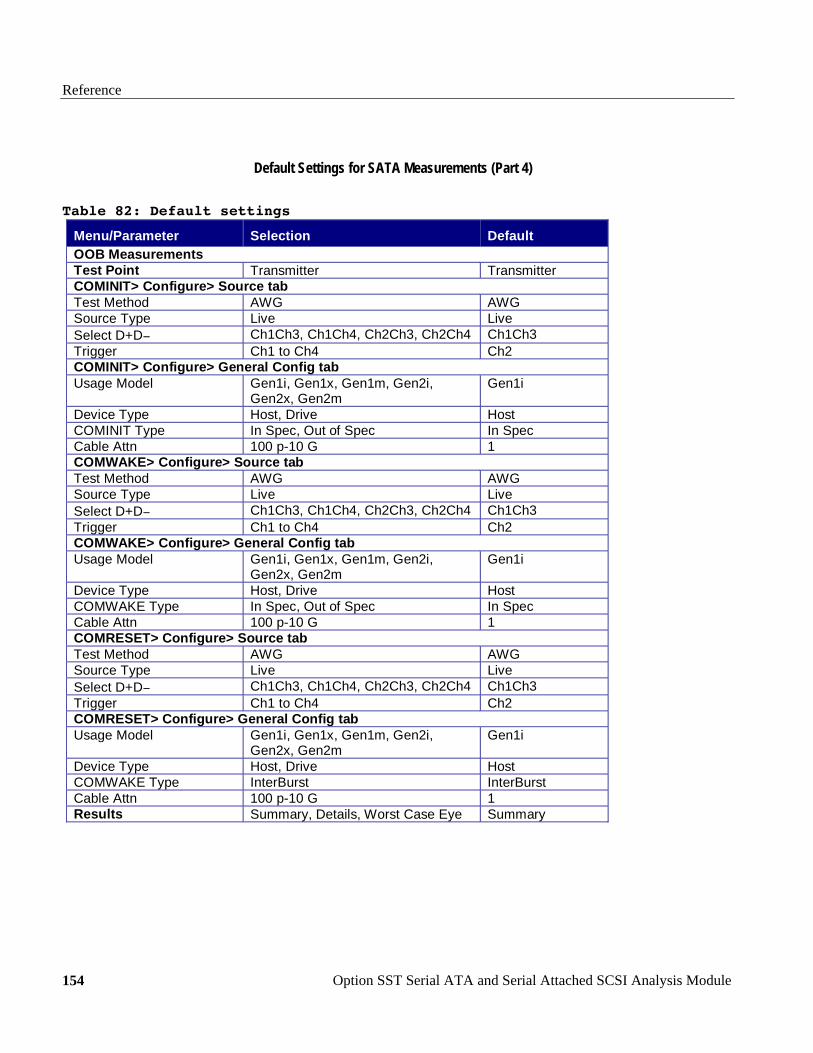
Reference
Option SST Serial ATA and Serial Attached SCSI Analysis Module 154
Default Settings for SATA Measurements (Part 4)
Table 82: Default settings Menu/Parameter Selection DefaultOOB MeasurementsTest Point Transmitter TransmitterCOMINIT> Configure> Source tabTest Method AWG AWGSource Type Live LiveSelect D+D− Ch1Ch3, Ch1Ch4, Ch2Ch3, Ch2Ch4 Ch1Ch3Trigger Ch1 to Ch4 Ch2COMINIT> Configure> General Config tabUsage Model Gen1i, Gen1x, Gen1m, Gen2i,
Gen2x, Gen2mGen1i
Device Type Host, Drive HostCOMINIT Type In Spec, Out of Spec In SpecCable Attn 100 p-10 G 1COMWAKE> Configure> Source tabTest Method AWG AWGSource Type Live LiveSelect D+D− Ch1Ch3, Ch1Ch4, Ch2Ch3, Ch2Ch4 Ch1Ch3Trigger Ch1 to Ch4 Ch2COMWAKE> Configure> General Config tabUsage Model Gen1i, Gen1x, Gen1m, Gen2i,
Gen2x, Gen2mGen1i
Device Type Host, Drive HostCOMWAKE Type In Spec, Out of Spec In SpecCable Attn 100 p-10 G 1COMRESET> Configure> Source tabTest Method AWG AWGSource Type Live LiveSelect D+D− Ch1Ch3, Ch1Ch4, Ch2Ch3, Ch2Ch4 Ch1Ch3Trigger Ch1 to Ch4 Ch2COMRESET> Configure> General Config tabUsage Model Gen1i, Gen1x, Gen1m, Gen2i,
Gen2x, Gen2mGen1i
Device Type Host, Drive HostCOMWAKE Type InterBurst InterBurstCable Attn 100 p-10 G 1Results Summary, Details, Worst Case Eye Summary
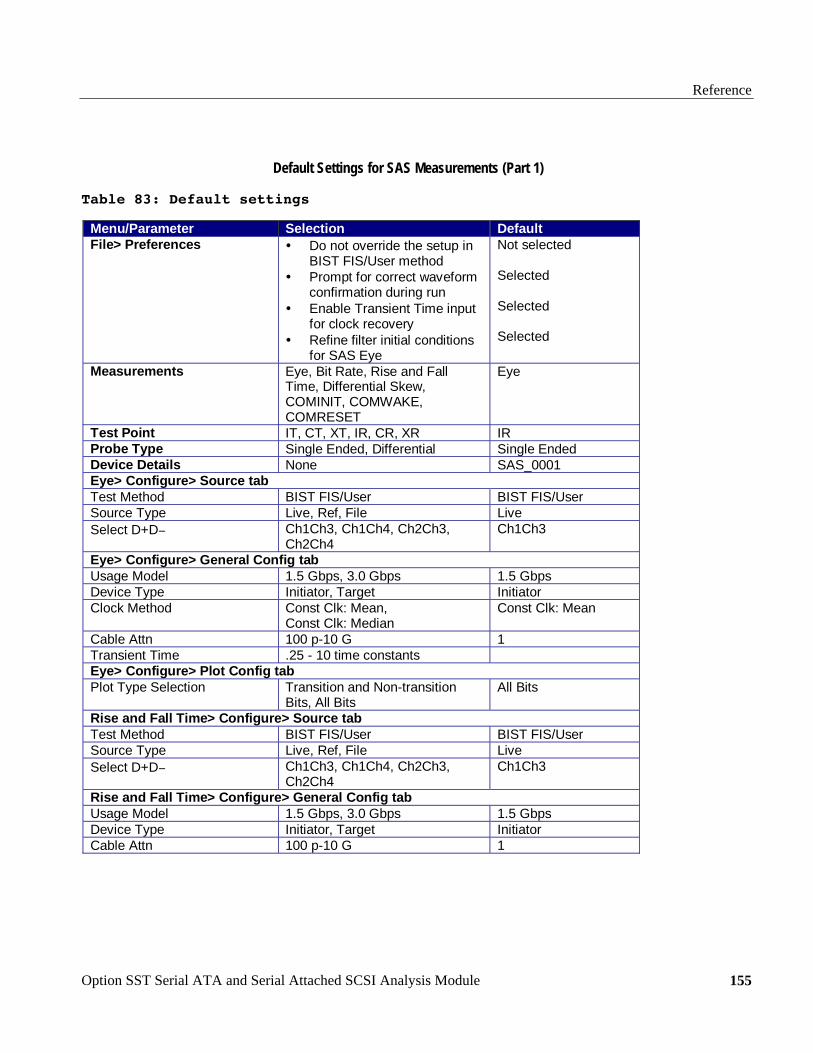
Reference
Option SST Serial ATA and Serial Attached SCSI Analysis Module
155
Default Settings for SAS Measurements (Part 1)
Table 83: Default settings
Menu/Parameter Selection DefaultFile> Preferences • Do not override the setup in
BIST FIS/User method• Prompt for correct waveform
confirmation during run• Enable Transient Time input
for clock recovery• Refine filter initial conditions
for SAS Eye
Not selected
Selected
Selected
Selected
Measurements Eye, Bit Rate, Rise and FallTime, Differential Skew,COMINIT, COMWAKE,COMRESET
Eye
Test Point IT, CT, XT, IR, CR, XR IRProbe Type Single Ended, Differential Single EndedDevice Details None SAS_0001Eye> Configure> Source tabTest Method BIST FIS/User BIST FIS/UserSource Type Live, Ref, File LiveSelect D+D− Ch1Ch3, Ch1Ch4, Ch2Ch3,
Ch2Ch4Ch1Ch3
Eye> Configure> General Config tabUsage Model 1.5 Gbps, 3.0 Gbps 1.5 GbpsDevice Type Initiator, Target InitiatorClock Method Const Clk: Mean,
Const Clk: MedianConst Clk: Mean
Cable Attn 100 p-10 G 1Transient Time .25 - 10 time constantsEye> Configure> Plot Config tabPlot Type Selection Transition and Non-transition
Bits, All BitsAll Bits
Rise and Fall Time> Configure> Source tabTest Method BIST FIS/User BIST FIS/UserSource Type Live, Ref, File LiveSelect D+D− Ch1Ch3, Ch1Ch4, Ch2Ch3,
Ch2Ch4Ch1Ch3
Rise and Fall Time> Configure> General Config tabUsage Model 1.5 Gbps, 3.0 Gbps 1.5 GbpsDevice Type Initiator, Target InitiatorCable Attn 100 p-10 G 1

Reference
Option SST Serial ATA and Serial Attached SCSI Analysis Module 156
Default Settings for SAS Measurements (Part 2)
Table 84: Default settings
Menu/Parameter Selection DefaultBit Rate> Configure> Source tabTest Method BIST FIS/User BIST FIS/UserSource Type Live, Ref, File LiveSelect D+D− Ch1Ch3, Ch1Ch4, Ch2Ch3, Ch2Ch4 Ch1Ch3Bit Rate> Configure> General Config tabUsage Model 1.5 Gbps, 3.0 Gbps 1.5 GbpsDevice Type Initiator, Target InitiatorCable Attn 100 p-10 G 1Differential Skew> Configure> Source tab*Test Method BIST FIS/User BIST FIS/UserSource Type Live, Ref, File LiveSelect D+D− Ch1Ch3, Ch1Ch4, Ch2Ch3, Ch2Ch4 Ch1Ch3Differential Skew> Configure> General Config tabUsage Model 1.5 Gbps, 3.0 Gbps 1.5 GbpsDevice Type Initiator, Target InitiatorCable Attn 100 p-10 G 1* This measurement is available only for single-ended probes

Reference
Option SST Serial ATA and Serial Attached SCSI Analysis Module
157
Table 85: Default settings
Menu/Parameter Selection DefaultCOMINIT> Configure> Source tabTest Method AWG AWGSource Type Live LiveSelect D+D− Ch1Ch3, Ch1Ch4, Ch2Ch3, Ch2Ch4 Ch1Ch3Trigger Ch1 to Ch4 Ch2COMINIT> Configure> General Config tabUsage Model 1.5 Gbps, 3.0 Gbps 1.5 GbpsDevice Type Initiator, Target InitiatorCOMINIT Type In Spec, Out of Spec In SpecCable Attn 100 p-10 G 1COMRESET> Configure> Source tabTest Method AWG AWGSource Type Live LiveSelect D+D− Ch1Ch3, Ch1Ch4, Ch2Ch3, Ch2Ch4 Ch1Ch3COMRESET> Configure> General Config tabUsage Model 1.5 Gbps, 3.0 Gbps 1.5 GbpsDevice Type Initiator, Target InitiatorCOMRESET Type InterBurst InterBurstCable Attn 100 p-10 G 1COMWAKE> Configure> Source tabTest Method AWG AWGSource Type Live LiveSelect D+D− Ch1Ch3, Ch1Ch4, Ch2Ch3, Ch2Ch4 Ch1Ch3Trigger Ch1 to Ch4 Ch2COMWAKE> Configure> General Config tabUsage Model 1.5 Gbps, 3.0 Gbps 1.5 GbpsDevice Type Initiator, Target InitiatorCOMWAKE Type In Spec, Out of Spec, InterBurst In SpecCable Attn 100 p-10 G 1Results Summary, Details Summary

Reference
Option SST Serial ATA and Serial Attached SCSI Analysis Module 158
GPIB Commands
GPIB Information
For information on how to operate the oscilloscope using the application-specific GPIB commands, refer to the following documents:
The user manual for your oscilloscope provides general information on how to operate the oscilloscope
The online help for your oscilloscope can provide details on how to use GPIB commands to control the oscilloscope if you install the GPIB Programmer guide (and code examples) from the oscilloscope CD-ROM.
Remote GPIB Support
The remote GPIB support for the Serial ATA and SAS modules is limited to saving and recalling the setup, running the measurement, and querying for results.
Your GPIB program should comply with the following guidelines:
The application startup must complete before sending additional GPIB commands to the application. Query the variable application; it will return "TDSRT-EYE" when the application startup is complete
Recall a setup file from GPIB to select measurements and set up the application
The measurements cycle must complete before data is queried. Query the variable SequencerState; it will return "Ready" when sequencing is complete
The resultFor variable must be set before querying results; pause a second after setting each variable
The error variable should be checked to ensure that an error has not occurred because of a measurement command problem; the measError variable returns errors specific to the measurement selected by resultFor
Introduction to GPIB Command Syntax
With knowledge of the GPIB command syntax, you can design a GPIB program to do the following tasks:
Start the RT-Eye application
Reference
Option SST Serial ATA and Serial Attached SCSI Analysis Module
159
Recognize an active application with GPIB protocol
Program and read application setup parameters
Sequence measurements
Read measurement results
Generate reports
GPIB Reference Materials
To use GPIB commands with your oscilloscope, you can refer to the following materials:
The rt-eyectrl.c file on the oscilloscope hard drive (located in the c:\TekApplications\tdsrt-eye\Examples\RemoteCtrl directory) provided an example of a GPIB program that can execute the application
The GPIB Program Example topic provides guidelines to use while designing a GPIB program
The programmer information in the online help of your oscilloscope
Starting and Setting Up the Application Using GPIB
To start the RT-Eye application, you must send the oscilloscope the following GPIB command:
application:activate "RT-Eye Serial Compliance and Analysis"
Note: The name of the application in the previous string is identical to the name of the application from the oscilloscope Run Application list.
The application uses the GPIB VARIABLE:VALUE command with arguments to execute some features. The set of GPIB commands does not include the variable names and variable values necessary to select and configure the measurements in the GPIB program.
You must manually set up the application and oscilloscope, selecting and configuring the measurements that you want to use with your GPIB program, and save them in a setup file in the default setup folder for that module. Use the name of the saved setup file as the value for the "recallName" variables in your GPIB program.
Reference
Option SST Serial ATA and Serial Attached SCSI Analysis Module 160
Variable:Value RT-Eye Command
Description
This command accepts string arguments for a control or data variable and a value to which to set the argument.
Syntax
VARIABLE:VALUE "<variable name>","<variable value>"
Note: The arguments <variable name> and <variable value> are required in the order indicated.
VARIABLE:VALUE? <variable name> for query.
CAUTION. Commands are case and space sensitive. Your program will not operate correctly if you do not follow the capitalization and spacing precisely.
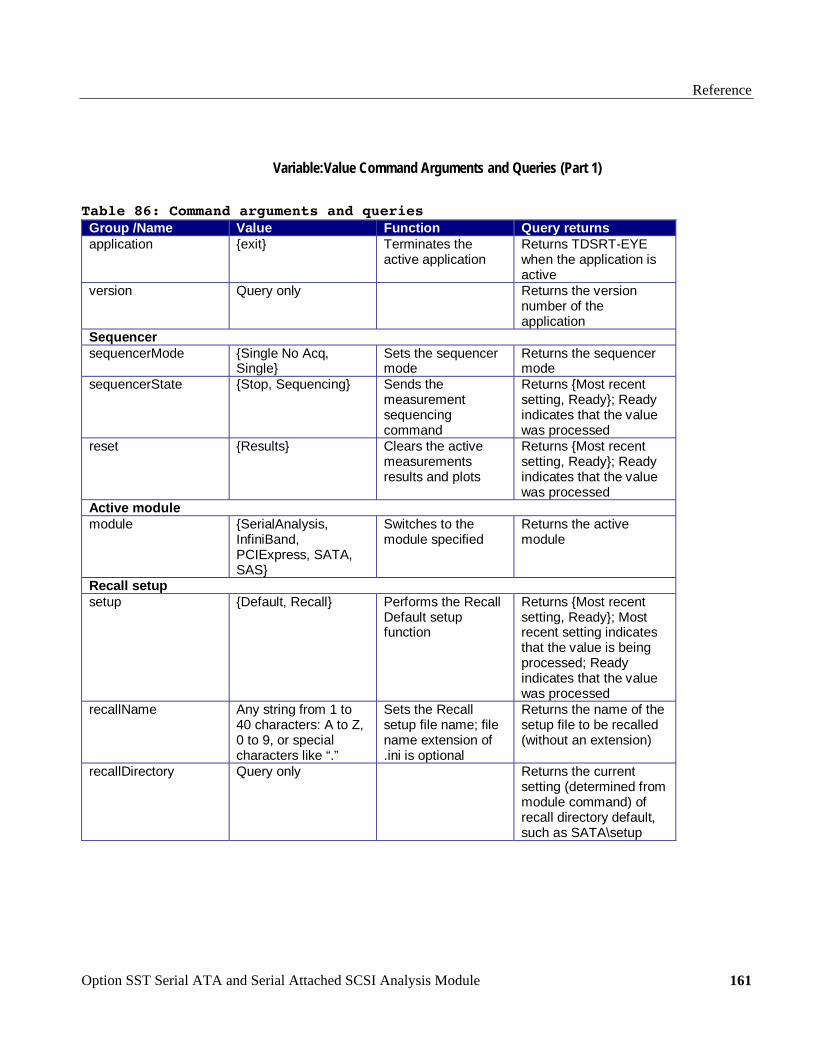
Reference
Option SST Serial ATA and Serial Attached SCSI Analysis Module
161
Variable:Value Command Arguments and Queries (Part 1)
Table 86: Command arguments and queries Group /Name Value Function Query returnsapplication {exit} Terminates the
active applicationReturns TDSRT-EYEwhen the application isactive
version Query only Returns the versionnumber of theapplication
SequencersequencerMode {Single No Acq,
Single}Sets the sequencermode
Returns the sequencermode
sequencerState {Stop, Sequencing} Sends themeasurementsequencingcommand
Returns {Most recentsetting, Ready}; Readyindicates that the valuewas processed
reset {Results} Clears the activemeasurementsresults and plots
Returns {Most recentsetting, Ready}; Readyindicates that the valuewas processed
Active modulemodule {SerialAnalysis,
InfiniBand,PCIExpress, SATA,SAS}
Switches to themodule specified
Returns the activemodule
Recall setupsetup {Default, Recall} Performs the Recall
Default setupfunction
Returns {Most recentsetting, Ready}; Mostrecent setting indicatesthat the value is beingprocessed; Readyindicates that the valuewas processed
recallName Any string from 1 to40 characters: A to Z,0 to 9, or specialcharacters like “.”
Sets the Recallsetup file name; filename extension of.ini is optional
Returns the name of thesetup file to be recalled(without an extension)
recallDirectory Query only Returns the currentsetting (determined frommodule command) ofrecall directory default,such as SATA\setup

Reference
Option SST Serial ATA and Serial Attached SCSI Analysis Module 162
Variable:Value Command Arguments and Queries (Part 2)
Table 87: Command arguments and queries Group /Name Value Function Query returnsreportGen {Now} Exports content from
currentmeasurements into areport template/layoutwhere thetemplate/layout aredefault or as specifiedin the recalled setupfile; concatenates theTemplate name and aTime stamp for the filename
{Most recent setting,Ready} Ready indicatesreport has been createdand saved.
Compliance module onlysatareportDeviceID Any string from 1 to
40 characters: A to Z,0 to 9, or specialcharacters like “.”
Specifies the deviceID fieldfor report generationfor the SATA module
Returns the specifiedDeviceID; applies toonly the SATA module
sasreportDeviceID Any string from 1 to40 characters: A toZ, 0 to 9, or specialcharacters like “.”
Specifies the deviceID fieldfor report generationfor the SAS module
Returns the specifiedDeviceID; applies toonly the SAS module
Result variablesresultFor {Measurement Name} Specifies the
measurement that isthe source for detailedresults queries; referto the tables betweenthis one and the errorcodes table
Returns the selectedmeasurements for thequeries associated withthe resultFor command
resultForWorstEye {Worst Case EyeMeasurement Name}
Specifies themeasurement that isthe source for detailedresults queries; referto the tables betweenSATA MeasurementNames table and theSATA MeasurementNames table
Returns the selectedWorst Case Eyemeasurements for thequeries associated withthe resultForWorstEyecommand
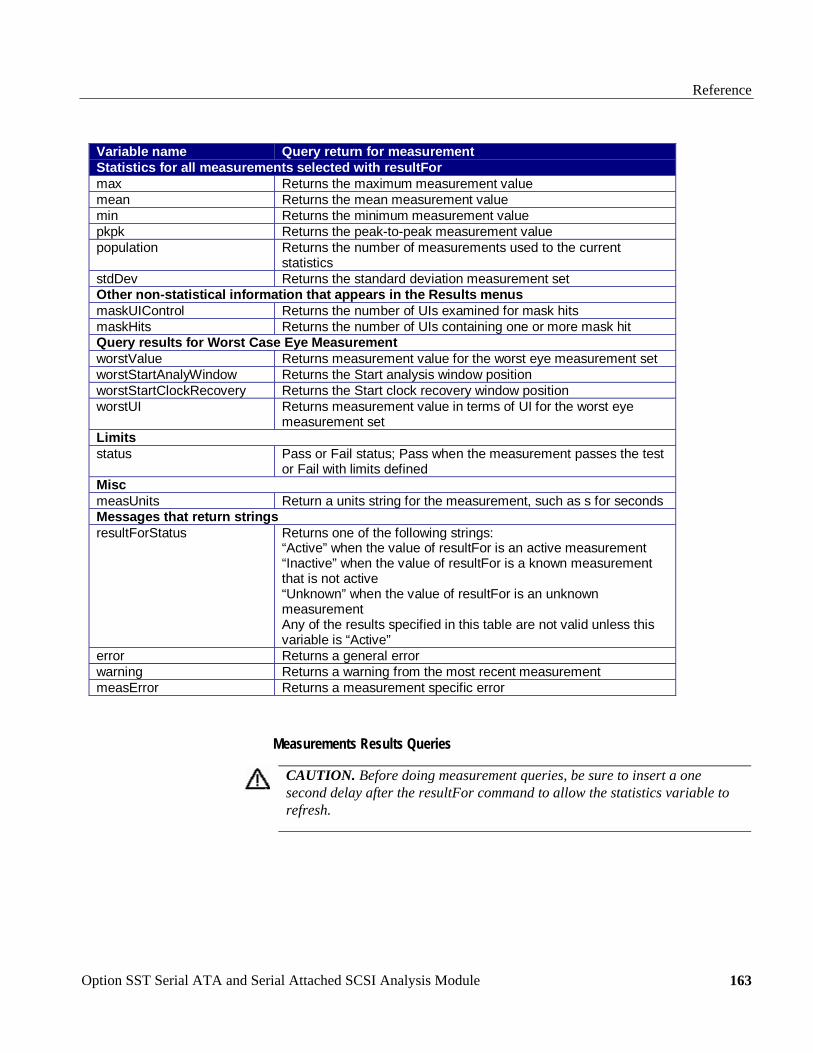
Reference
Option SST Serial ATA and Serial Attached SCSI Analysis Module
163
Variable name Query return for measurementStatistics for all measurements selected with resultFormax Returns the maximum measurement valuemean Returns the mean measurement valuemin Returns the minimum measurement valuepkpk Returns the peak-to-peak measurement valuepopulation Returns the number of measurements used to the current
statisticsstdDev Returns the standard deviation measurement setOther non-statistical information that appears in the Results menusmaskUIControl Returns the number of UIs examined for mask hitsmaskHits Returns the number of UIs containing one or more mask hitQuery results for Worst Case Eye MeasurementworstValue Returns measurement value for the worst eye measurement setworstStartAnalyWindow Returns the Start analysis window positionworstStartClockRecovery Returns the Start clock recovery window positionworstUI Returns measurement value in terms of UI for the worst eye
measurement setLimitsstatus Pass or Fail status; Pass when the measurement passes the test
or Fail with limits definedMiscmeasUnits Return a units string for the measurement, such as s for secondsMessages that return stringsresultForStatus Returns one of the following strings:
“Active” when the value of resultFor is an active measurement“Inactive” when the value of resultFor is a known measurementthat is not active“Unknown” when the value of resultFor is an unknownmeasurementAny of the results specified in this table are not valid unless thisvariable is “Active”
error Returns a general errorwarning Returns a warning from the most recent measurementmeasError Returns a measurement specific error
Measurements Results Queries
CAUTION. Before doing measurement queries, be sure to insert a one second delay after the resultFor command to allow the statistics variable to refresh.
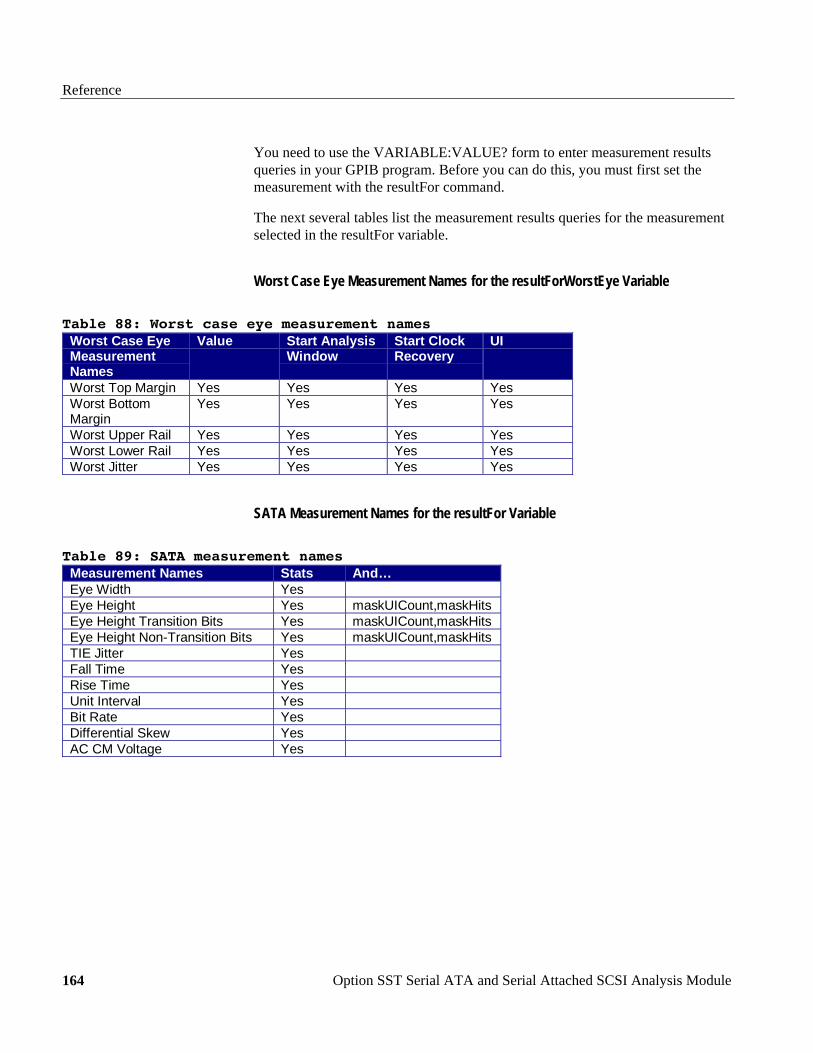
Reference
Option SST Serial ATA and Serial Attached SCSI Analysis Module 164
You need to use the VARIABLE:VALUE? form to enter measurement results queries in your GPIB program. Before you can do this, you must first set the measurement with the resultFor command.
The next several tables list the measurement results queries for the measurement selected in the resultFor variable.
Worst Case Eye Measurement Names for the resultForWorstEye Variable
Table 88: Worst case eye measurement names Worst Case EyeMeasurementNames
Value Start AnalysisWindow
Start ClockRecovery
UI
Worst Top Margin Yes Yes Yes YesWorst BottomMargin
Yes Yes Yes Yes
Worst Upper Rail Yes Yes Yes YesWorst Lower Rail Yes Yes Yes YesWorst Jitter Yes Yes Yes Yes
SATA Measurement Names for the resultFor Variable
Table 89: SATA measurement names Measurement Names Stats And…Eye Width YesEye Height Yes maskUICount,maskHitsEye Height Transition Bits Yes maskUICount,maskHitsEye Height Non-Transition Bits Yes maskUICount,maskHitsTIE Jitter YesFall Time YesRise Time YesUnit Interval YesBit Rate YesDifferential Skew YesAC CM Voltage Yes

Reference
Option SST Serial ATA and Serial Attached SCSI Analysis Module
165
SAS Measurement Names for the resultFor Variable
Table 90: SAS measurement names Measurement Names Stats And…Eye Width YesEye Height Yes maskUICount, maskHitsEye Height Transition Bits Yes maskUICount, maskHitsEye Height Non-Transition Bits Yes maskUICount, maskHitsFall Time YesRise Time YesBit Rate YesDifferential Skew Yes
Measurement Algorithms
Eye Diagram for Serial ATA
The Serial ATA signal consists of Spread Spectrum Clocking (SSC). The Eye will not be accurate if generated on a large number of Unit Intervals. The algorithm uses a sliding window or the scan mode, to reduce the effect of SSC.
Scan mode:
The scan mode method is as follows:
1. Select a large window, for example 2000 UI, for clock recovery.
2. Recover the clock on the 2000 UI window.
3. Calculate the UI values.
4. Go to the center 250 UI or 5 UI (Analysis Window) according to the user selection.
5. Adjust the phase values at this 250/5 UI.
6. Create Eye diagram on analysis window.
7. Calculate the five values:
Jitter
Top rail
Bottom rail

Reference
Option SST Serial ATA and Serial Attached SCSI Analysis Module 166
Bottom opening
And top opening
Move the window by a certain number of unit intervals, for example 100 UI. Repeat all the earlier steps mentioned. Compare all the results computed in the current window with that of the previous window and keep the worst values. Keep moving the window until it reaches end of the data and repeat the same process to get the worst five values and corresponding eye.
The algorithm calculates the Eye Width and Eye Height values to generate the Eye diagram.
Eye Width:
The Eye Width measurement is the measured minimum horizontal eye opening at the zero reference level as shown in the eye diagram.
PkPkAVGWIDTHEYE TIEUIT −− −=
Where:
TEYE−WIDTH is the average UI
TIEPK−PK is the Peak-Peak Time Interval Error
Eye Height:
The Eye Height measurement is the measured minimum vertical eye opening at the UI center as shown in the plot of the eye diagram. There are three types of Eye Height values: Eye Height, Eye Height Transition, and Eye Height Non-Transition.
MAXLOEYEMINHIEYEHEIGHTEYE VVT −−−−− −=
Where:
VEYE−HI−MIN is the minimum of the High voltage at mid UI
VEYE−LO−MAX is the maximum of the Low voltage at mid UI
Eye Height − Transition:
MAXTRANLOEYEMINTRANHIEYETRANHEIGHTEYE VVT −−−−−−−− −=
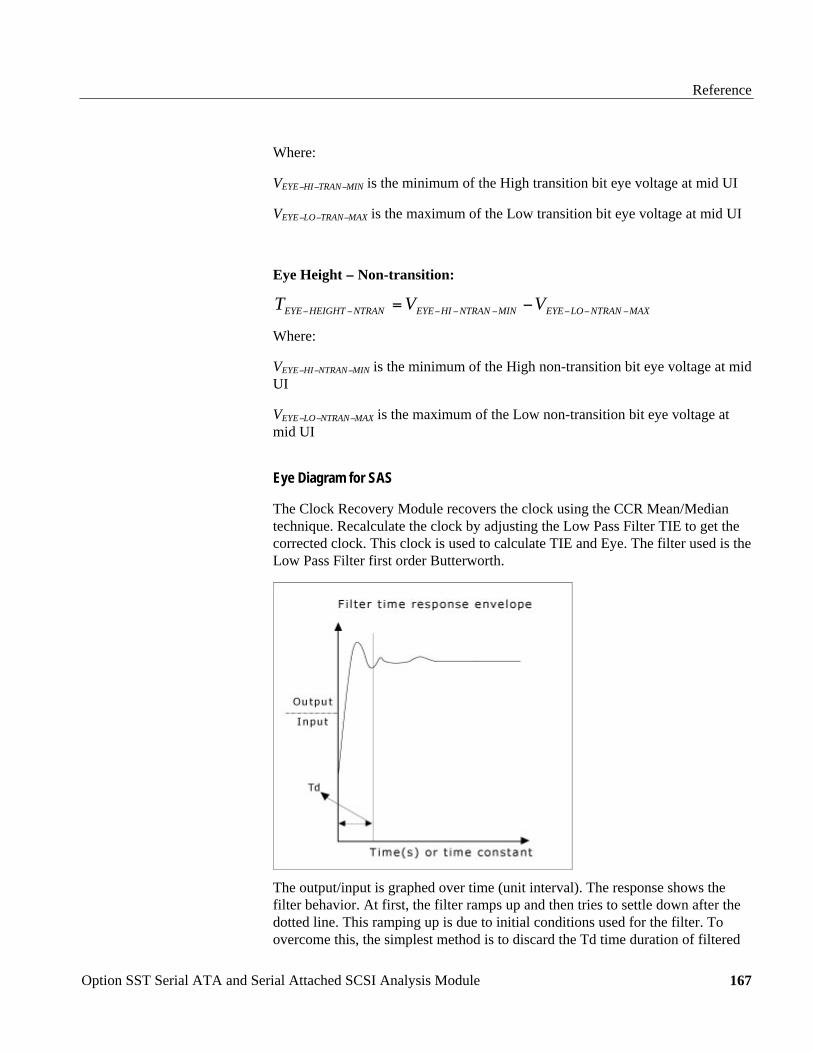
Reference
Option SST Serial ATA and Serial Attached SCSI Analysis Module
167
Where:
VEYE−HI−TRAN−MIN is the minimum of the High transition bit eye voltage at mid UI
VEYE−LO−TRAN−MAX is the maximum of the Low transition bit eye voltage at mid UI
Eye Height − Non-transition:
MAXNTRANLOEYEMINNTRANHIEYENTRANHEIGHTEYE VVT −−−−−−−− −=
Where:
VEYE−HI−NTRAN−MIN is the minimum of the High non-transition bit eye voltage at mid UI
VEYE−LO−NTRAN−MAX is the maximum of the Low non-transition bit eye voltage at mid UI
Eye Diagram for SAS
The Clock Recovery Module recovers the clock using the CCR Mean/Median technique. Recalculate the clock by adjusting the Low Pass Filter TIE to get the corrected clock. This clock is used to calculate TIE and Eye. The filter used is the Low Pass Filter first order Butterworth.
The output/input is graphed over time (unit interval). The response shows the filter behavior. At first, the filter ramps up and then tries to settle down after the dotted line. This ramping up is due to initial conditions used for the filter. To overcome this, the simplest method is to discard the Td time duration of filtered

Reference
Option SST Serial ATA and Serial Attached SCSI Analysis Module 168
data. The Td is called as variable of time constant and one time constant (tau) = 1/(2*pi*fc) where fc is the filter cut off frequency. fc is bitrate/1667.
CCRsedDataEdgeInterpolatTIE −=
The algorithm calculates the Eye Width and Eye Height values to generate the Eye diagram.
Eye Width:
The Eye Width measurement is the measured minimum horizontal eye opening at the zero reference level as shown in the eye diagram.
PkPkAVGWIDTHEYE TIEUIT −− −=
Where:
TEYE−WIDTH is the average UI
TIEPK−PK is the Peak-Peak Time Interval Error
Eye Height:
The Eye Height measurement is the measured minimum vertical eye opening at the UI center as shown in the plot of the eye diagram. There are three types of Eye Height values: Eye Height, Eye Height Transition, and Eye Height Non-Transition.
MAXLOEYEMINHIEYEHEIGHTEYE VVT −−−−− −=
Where:
VEYE−HI−MIN is the minimum of the High voltage at mid UI
VEYE−LO−MAX is the maximum of the Low voltage at mid UI
Eye Height − Transition:
MAXTRANLOEYEMINTRANHIEYETRANHEIGHTEYE VVT −−−−−−−− −=
Where:
VEYE−HI−TRAN−MIN is the minimum of the High transition bit eye voltage at mid UI
VEYE−LO−TRAN−MAX is the maximum of the Low transition bit eye voltage at mid UI
Reference
Option SST Serial ATA and Serial Attached SCSI Analysis Module
169
Eye Height − Non-transition:
MAXNTRANLOEYEMINNTRANHIEYENTRANHEIGHTEYE VVT −−−−−−−− −=
Where:
VEYE−HI−NTRAN−MIN is the minimum of the High non-transition bit eye voltage at mid UI
VEYE−LO−NTRAN−MAX is the maximum of the Low non-transition bit eye voltage at mid UI
When the preference "Refine Filter initial condition for SAS Eye" is selected the algorithm uses four-point forward averaging technique from the first clock edge up to two time constants (tau) of clock edges, and the first order backward filtering to calculate the filter initial conditions.
CfTau
π211 =
where fc is the cut-off frequency and is equal to fBaud/1667. Depending on the device speed, the cut-off frequency changes.
For a 3 Gbps device speed, the algorithm averages TIE values till the index 2*tau/average_Period, where the average_Period is 1/calculated device speed. The number of indexes is ~550.
For a 1.5 Gbps device speed, the number of indexes is ~550.
How to calculate the record length to set in case of non automated mode?
Set the record length as follows to ensure that the acquired waveform is greater than the clock transitions as mentioned for the device speeds. To retain the shape of the bit transmitted eight sample points should be available during each rise and fall slope and >=8 samples in each unit interval. An ideal record length would be 550*8 which is approximately 10 K.
Rise Time
Rise time is the time difference between 20% and 80% of the normalized amplitude of the captured signal at the rising edge.
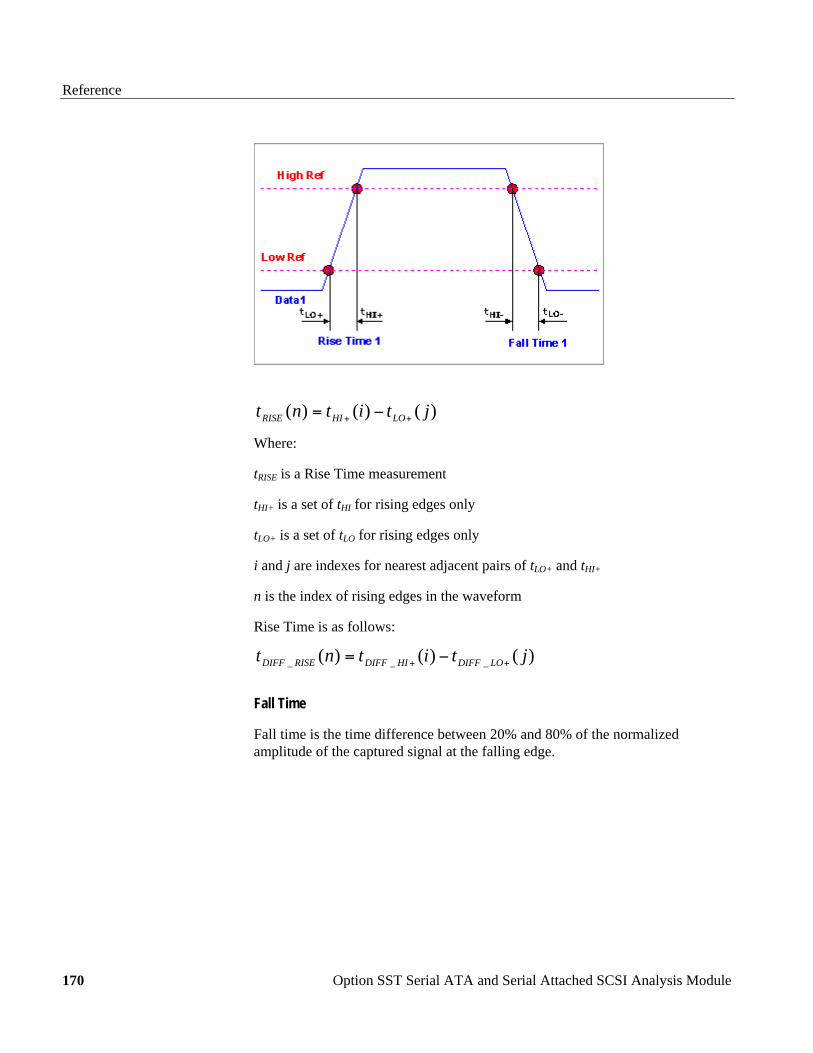
Reference
Option SST Serial ATA and Serial Attached SCSI Analysis Module 170
)()()( jtitnt LOHIRISE ++ −=
Where:
tRISE is a Rise Time measurement
tHI+ is a set of tHI for rising edges only
tLO+ is a set of tLO for rising edges only
i and j are indexes for nearest adjacent pairs of tLO+ and tHI+
n is the index of rising edges in the waveform
Rise Time is as follows:
)()()( ___ jtitnt LODIFFHIDIFFRISEDIFF ++ −=
Fall Time
Fall time is the time difference between 20% and 80% of the normalized amplitude of the captured signal at the falling edge.
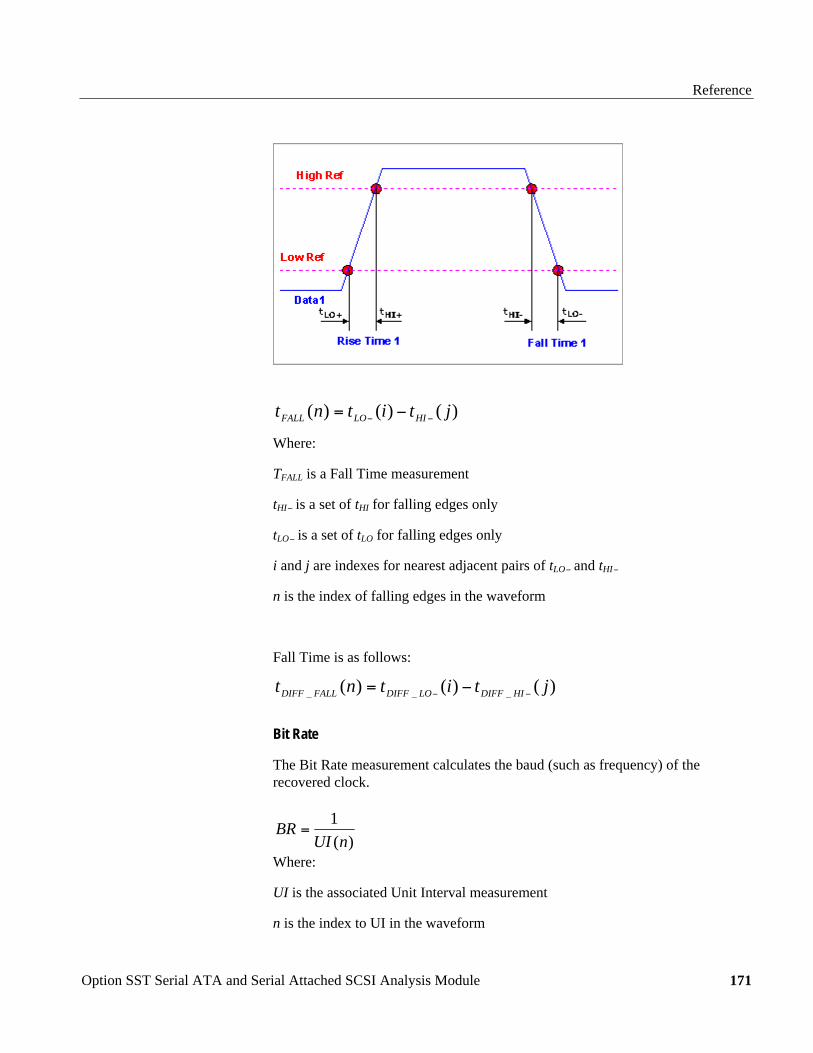
Reference
Option SST Serial ATA and Serial Attached SCSI Analysis Module
171
)()()( jtitnt HILOFALL −− −=
Where:
TFALL is a Fall Time measurement
tHI− is a set of tHI for falling edges only
tLO− is a set of tLO for falling edges only
i and j are indexes for nearest adjacent pairs of tLO− and tHI−
n is the index of falling edges in the waveform
Fall Time is as follows:
)()()( ___ jtitnt HIDIFFLODIFFFALLDIFF −− −=
Bit Rate
The Bit Rate measurement calculates the baud (such as frequency) of the recovered clock.
)(1
nUIBR =
Where:
UI is the associated Unit Interval measurement
n is the index to UI in the waveform

Reference
Option SST Serial ATA and Serial Attached SCSI Analysis Module 172
Unit Interval
The Unit Interval measurement calculates the cycle duration of the recovered clock.
)()1()( ntntnUI CLKRCLKR −− −+=
))(( nUIMeanUI AVG =
Where:
tR−CLK is a recovered clock edge
n is the index to UI in the waveform
Differential Skew
The Skew measurement is the time delay between the two single-ended waveform sources.
)()()( ntntnT MIDDMIDDSKEW −+ −=
Where:
tSKEW is the Skew measurement
tD+MID is the mid level crossing time of vD+
tD−MID is the mid level crossing time of vD-
n is the index to edges in the waveform
Differential Voltage
The algorithm calculates the minimum and maximum differential voltages. The calculations are performed on a series of patterns and the first few are common to Option1 and Option2.
In the following equations,
is the mean of the voltage samples in the histogram
s is the standard deviation of the voltage samples in the histogram
n is the number of samples that contribute to the histogram
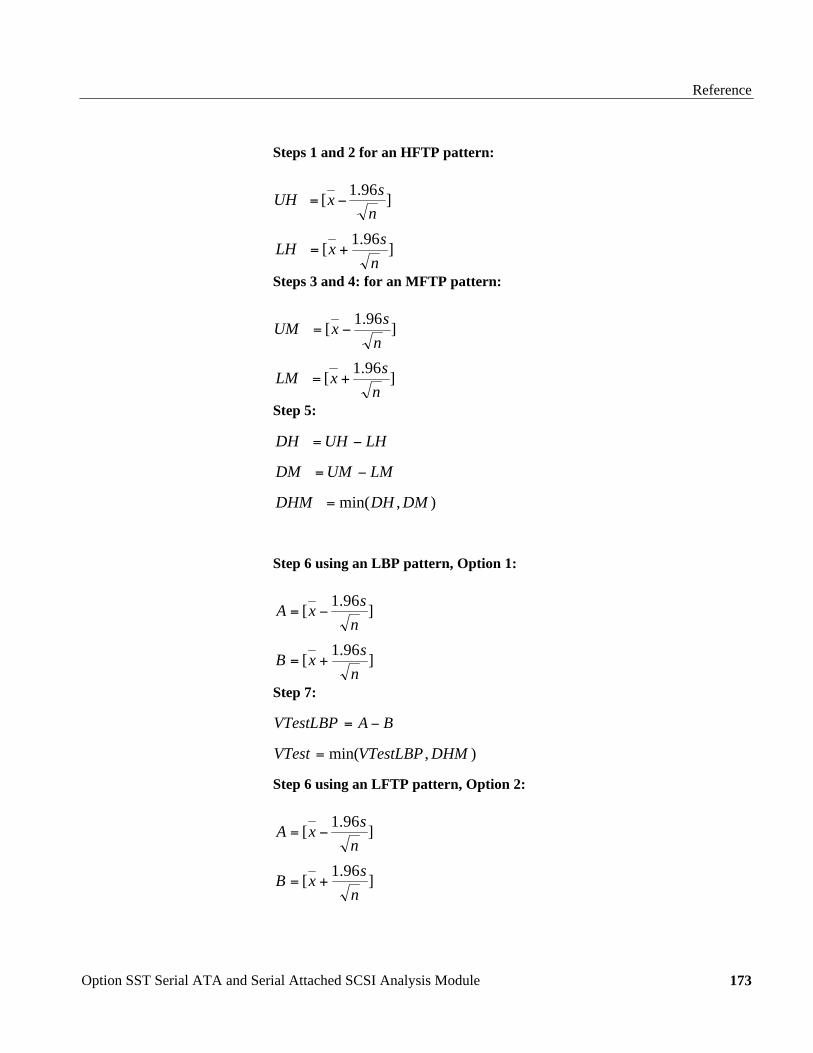
Reference
Option SST Serial ATA and Serial Attached SCSI Analysis Module
173
Steps 1 and 2 for an HFTP pattern:
]96.1[n
sxUH −=
]96.1[n
sxLH +=
Steps 3 and 4: for an MFTP pattern:
]96.1[n
sxUM −=
]96.1[n
sxLM +=
Step 5:
LHUHDH −=
LMUMDM −=
),min( DMDHDHM =
Step 6 using an LBP pattern, Option 1:
]96.1[n
sxA −=
]96.1[n
sxB +=
Step 7:
BAVTestLBP −=
),min( DHMVTestLBPVTest =
Step 6 using an LFTP pattern, Option 2:
]96.1[n
sxA −=
]96.1[n
sxB +=

Reference
Option SST Serial ATA and Serial Attached SCSI Analysis Module 174
Steps 8-11: Calculate the mean of voltage samples in the histogram at points C, D, E, and F.
Step 12:
)()( EDBFCAVTestAPP ++−++=
),min( DHMVTestAPPVTest =
Maximum Differential Voltage:
Step 1: High Test UI
(max)21
DIFFTXVVU =
NU is the number of histogram hits between 0 and VU millivolts: nu is the number of histogram hits between VU and VU+300 millivolts.
Step 2: Low Test UI
(max)21
DIFFTXVVL −=
NL is the number of histogram hits between VL and 0 millivolts: nl is the number of histogram hits between VL − 300 millivolts and VL.

Reference
Option SST Serial ATA and Serial Attached SCSI Analysis Module
175
Step 3:
NUnunupu+
=
NLnlnlpl+
=
AC Common Mode Voltage
The AC Common Mode Voltage measurement calculates the AC statistics of the Common Mode voltage waveform with the DC value removed. This vAC−CM is filtered with a filter having a cut-off frequency of Bitrate/2.
CMCMCMAC Viviv −=− )()(
Where:
i is the index of all waveform values
vAC−CM is the AC Common Mode voltage signal
vCM is the Common Mode voltage signal
VCM is the DC Common Mode voltage signal

Reference
Option SST Serial ATA and Serial Attached SCSI Analysis Module 176
Jitter Measurements using TDSJIT3 v2
Serial ATA Transmitter Jitter Measurements using TDSJIT3 v2
Jitter is an accumulation of short-term variations of the zero crossings from ideal positions in time. A Reference Clock defines the ideal positions in time. The Reference Clock method separates jitter from SSC, tracks SSC and other low frequency modulation but not jitter. Reference Clock extraction is performed using either hardware or software PLLs.
Two Reference Clock PLLs are defined as type 2 PLL with a -3 dB corner frequency
fc3dB = fBAUD/N (N = 10 (Gen2i), 500 (Gen2i), 1667 (Gen1x, Gen2x)) given a transition density of 1.0 (corresponding to a 1010101010 clock-like pattern) and damping factor î = 0.707 min to 1.00 max.
For Gen1i and Gen1x,
fBAUD = 1.5 Gbps and for Gen2i and Gen2x, fBAUD = 3 Gbps.
There are several types of jitter which are separated into two classes: deterministic and random. Deterministic jitter is bounded and random jitter is not. The amount of tolerable jitter is limited by the desired bit error rate performance of the channel. Two classes of jitter are used in analysis because they accumulate differently.
You can configure the reference clock in the TDSJIT3 v2 application as a second order PLL.
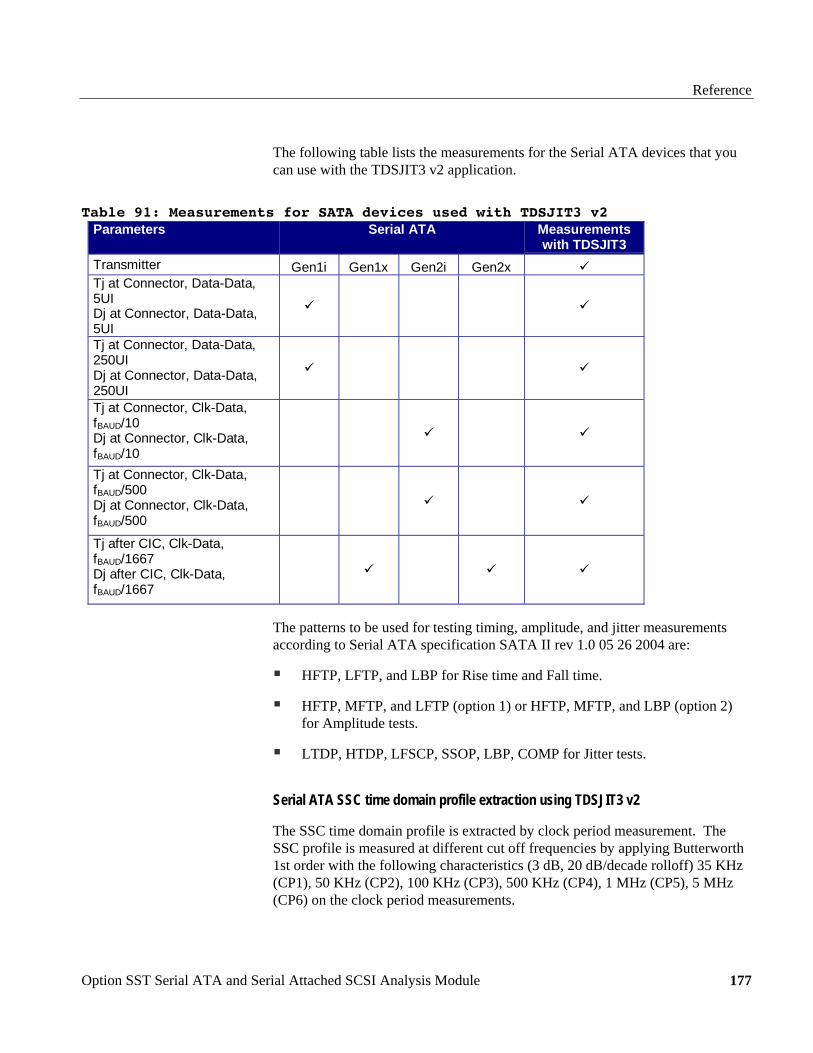
Reference
Option SST Serial ATA and Serial Attached SCSI Analysis Module
177
The following table lists the measurements for the Serial ATA devices that you can use with the TDSJIT3 v2 application.
Table 91: Measurements for SATA devices used with TDSJIT3 v2 Parameters Serial ATA Measurements
with TDSJIT3Transmitter Gen1i Gen1x Gen2i Gen2xTj at Connector, Data-Data,5UIDj at Connector, Data-Data,5UITj at Connector, Data-Data,250UIDj at Connector, Data-Data,250UITj at Connector, Clk-Data,fBAUD/10Dj at Connector, Clk-Data,fBAUD/10Tj at Connector, Clk-Data,fBAUD/500Dj at Connector, Clk-Data,fBAUD/500
Tj after CIC, Clk-Data,fBAUD/1667Dj after CIC, Clk-Data,fBAUD/1667
The patterns to be used for testing timing, amplitude, and jitter measurements according to Serial ATA specification SATA II rev 1.0 05 26 2004 are:
HFTP, LFTP, and LBP for Rise time and Fall time.
HFTP, MFTP, and LFTP (option 1) or HFTP, MFTP, and LBP (option 2) for Amplitude tests.
LTDP, HTDP, LFSCP, SSOP, LBP, COMP for Jitter tests.
Serial ATA SSC time domain profile extraction using TDSJIT3 v2
The SSC time domain profile is extracted by clock period measurement. The SSC profile is measured at different cut off frequencies by applying Butterworth 1st order with the following characteristics (3 dB, 20 dB/decade rolloff) 35 KHz (CP1), 50 KHz (CP2), 100 KHz (CP3), 500 KHz (CP4), 1 MHz (CP5), 5 MHz (CP6) on the clock period measurements.

Reference
Option SST Serial ATA and Serial Attached SCSI Analysis Module 178
TDSJIT3 v2 setup and configuration:
1. Select SelectMeas and select Clock Period.
2. Select ConfigureMeas and select the Filters tab.
3. Select Low-pass filter (f2, first order) and configure the cutoff frequencies ⎯ 35 KHz (CP1), 50 KHz (CP2), 100 KHz (CP3), 500 KHz (CP4), 1 MHz (CP5), 5 MHz (CP6).
4. From the main menu, select Plot> Create. From Add Plot, select Cycle Trend.
Note: Do not configure the High Pass Filter.
5. Select Advanced and configure the Settling Time. Based on the settling time, the initial filtered data will be discarded.
6. Select Go to Results and select Run/Stop or Single. Select the clock periods one after another to see the results and plot for each clock period.
Figure 88: SSC time domain profile extraction
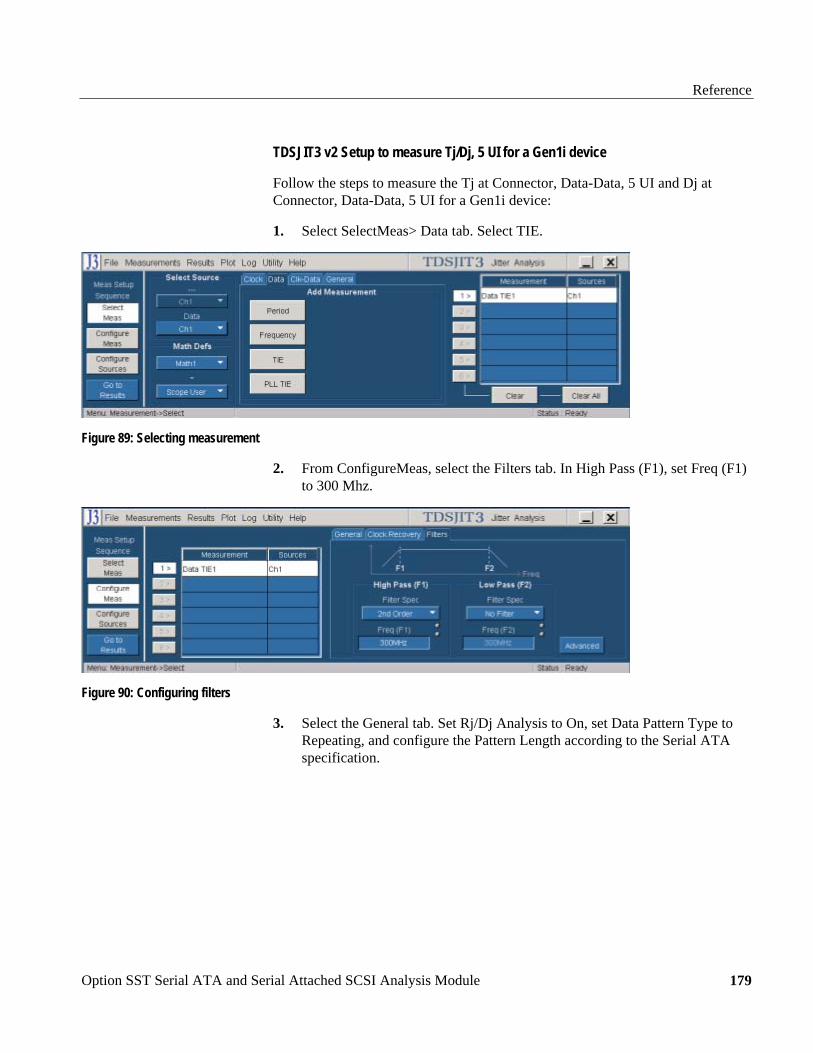
Reference
Option SST Serial ATA and Serial Attached SCSI Analysis Module
179
TDSJIT3 v2 Setup to measure Tj/Dj, 5 UI for a Gen1i device
Follow the steps to measure the Tj at Connector, Data-Data, 5 UI and Dj at Connector, Data-Data, 5 UI for a Gen1i device:
1. Select SelectMeas> Data tab. Select TIE.
Figure 89: Selecting measurement
2. From ConfigureMeas, select the Filters tab. In High Pass (F1), set Freq (F1) to 300 Mhz.
Figure 90: Configuring filters
3. Select the General tab. Set Rj/Dj Analysis to On, set Data Pattern Type to Repeating, and configure the Pattern Length according to the Serial ATA specification.
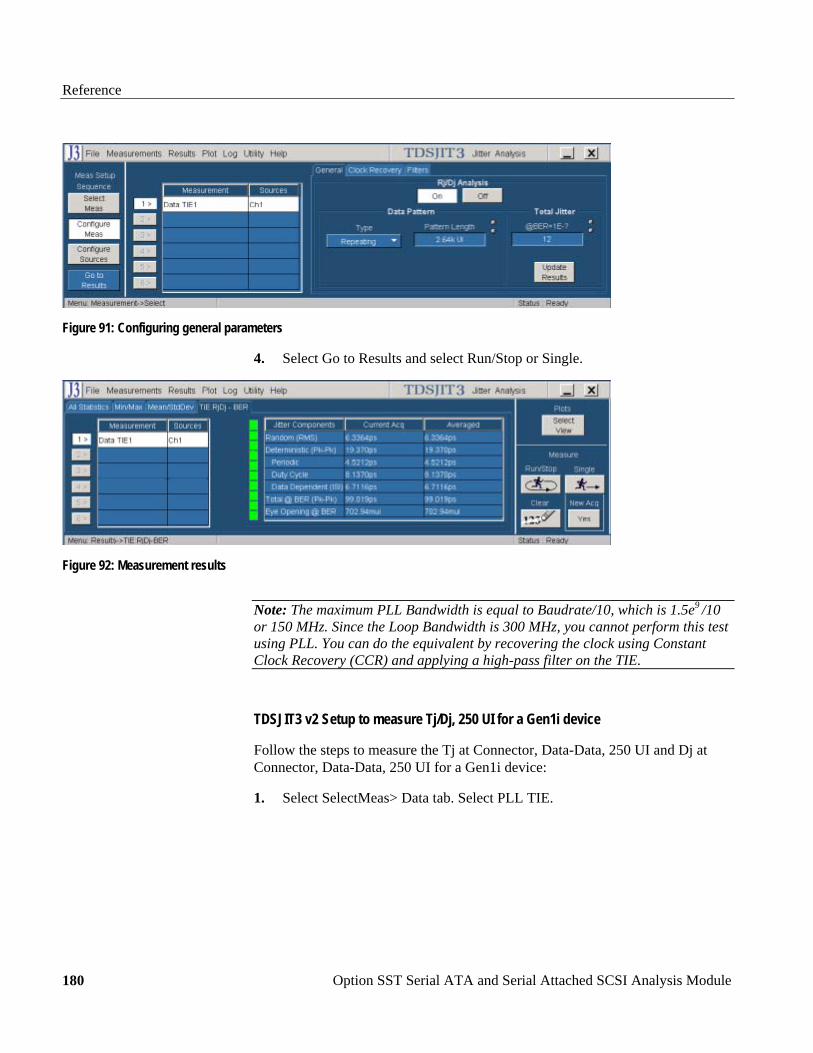
Reference
Option SST Serial ATA and Serial Attached SCSI Analysis Module 180
Figure 91: Configuring general parameters
4. Select Go to Results and select Run/Stop or Single.
Figure 92: Measurement results
Note: The maximum PLL Bandwidth is equal to Baudrate/10, which is 1.5e9 /10 or 150 MHz. Since the Loop Bandwidth is 300 MHz, you cannot perform this test using PLL. You can do the equivalent by recovering the clock using Constant Clock Recovery (CCR) and applying a high-pass filter on the TIE.
TDSJIT3 v2 Setup to measure Tj/Dj, 250 UI for a Gen1i device
Follow the steps to measure the Tj at Connector, Data-Data, 250 UI and Dj at Connector, Data-Data, 250 UI for a Gen1i device:
1. Select SelectMeas> Data tab. Select PLL TIE.
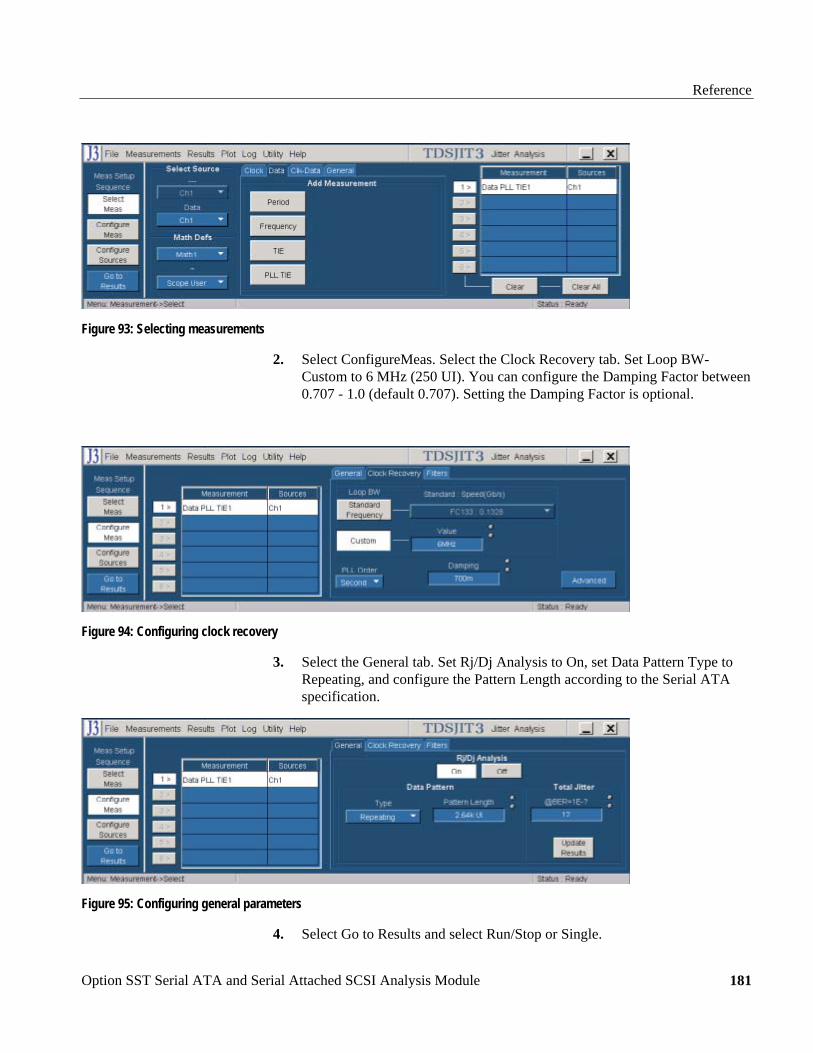
Reference
Option SST Serial ATA and Serial Attached SCSI Analysis Module
181
Figure 93: Selecting measurements
2. Select ConfigureMeas. Select the Clock Recovery tab. Set Loop BW-Custom to 6 MHz (250 UI). You can configure the Damping Factor between 0.707 - 1.0 (default 0.707). Setting the Damping Factor is optional.
Figure 94: Configuring clock recovery
3. Select the General tab. Set Rj/Dj Analysis to On, set Data Pattern Type to Repeating, and configure the Pattern Length according to the Serial ATA specification.
Figure 95: Configuring general parameters
4. Select Go to Results and select Run/Stop or Single.
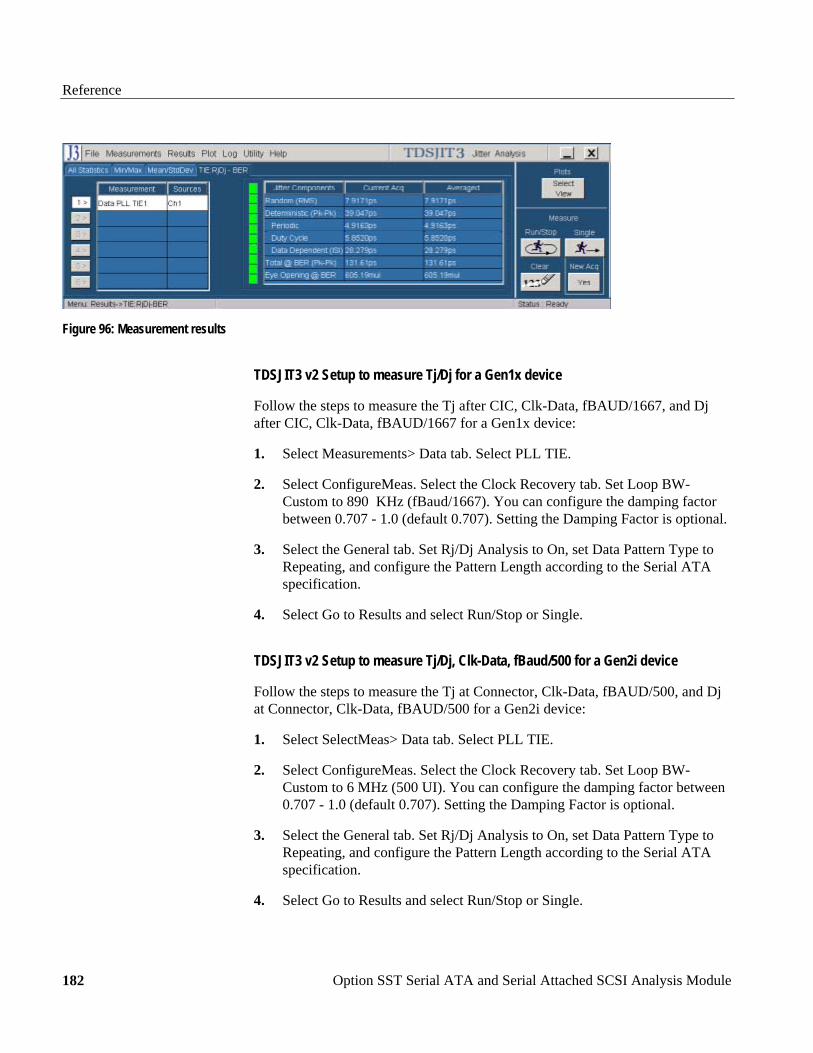
Reference
Option SST Serial ATA and Serial Attached SCSI Analysis Module 182
Figure 96: Measurement results
TDSJIT3 v2 Setup to measure Tj/Dj for a Gen1x device
Follow the steps to measure the Tj after CIC, Clk-Data, fBAUD/1667, and Dj after CIC, Clk-Data, fBAUD/1667 for a Gen1x device:
1. Select Measurements> Data tab. Select PLL TIE.
2. Select ConfigureMeas. Select the Clock Recovery tab. Set Loop BW-Custom to 890 KHz (fBaud/1667). You can configure the damping factor between 0.707 - 1.0 (default 0.707). Setting the Damping Factor is optional.
3. Select the General tab. Set Rj/Dj Analysis to On, set Data Pattern Type to Repeating, and configure the Pattern Length according to the Serial ATA specification.
4. Select Go to Results and select Run/Stop or Single.
TDSJIT3 v2 Setup to measure Tj/Dj, Clk-Data, fBaud/500 for a Gen2i device
Follow the steps to measure the Tj at Connector, Clk-Data, fBAUD/500, and Dj at Connector, Clk-Data, fBAUD/500 for a Gen2i device:
1. Select SelectMeas> Data tab. Select PLL TIE.
2. Select ConfigureMeas. Select the Clock Recovery tab. Set Loop BW-Custom to 6 MHz (500 UI). You can configure the damping factor between 0.707 - 1.0 (default 0.707). Setting the Damping Factor is optional.
3. Select the General tab. Set Rj/Dj Analysis to On, set Data Pattern Type to Repeating, and configure the Pattern Length according to the Serial ATA specification.
4. Select Go to Results and select Run/Stop or Single.
Reference
Option SST Serial ATA and Serial Attached SCSI Analysis Module
183
TDSJIT3 v2 Setup to measure Tj/Dj for a Gen2x device
Follow the steps to measure the Tj after CIC, Clk-Data, fBAUD/1667, and Dj after CIC, Clk-Data, fBAUD/1667for a Gen2x device:
1. Select SelectMeas> Data tab. Select PLL TIE.
2. Select ConfigureMeas. Select the Clock Recovery tab. Set Loop BW-Custom to 1.8 MHz (fBaud/1667). You can configure the damping factor between 0.707 - 1.0 (default 0.707). Setting the Damping Factor is optional.
3. Select the General tab. Set Rj/Dj Analysis to On, set Data Pattern Type to Repeating, and configure the Pattern Length according to the Serial ATA specification.
4. Select Go to Results and select Run/Stop or Single.
TDSJIT3 v2 Setup to measure Tj/Dj, Clk-Data for a Gen2i device
Follow the steps to measure the Tj at Connector, Clk-Data, fBAUD/10, and Dj at Connector, Clk-Data, fBAUD/10 for a Gen2i device:
1. Select SelectMeas> Data tab. Select PLL TIE.
2. Select ConfigureMeas. Select the Clock Recovery tab. Set Loop BW-Custom to 300 MHz (10 UI). You can configure the Damping Factor between 0.707 - 1.0 (default 0.707). Setting the Damping Factor is optional.
3. Select the General tab. Set Rj/Dj Analysis to On, set Data Pattern Type to Repeating, and configure the Pattern Length according to the Serial ATA specification.
4. Select Go to Results and select Run/Stop or Single.
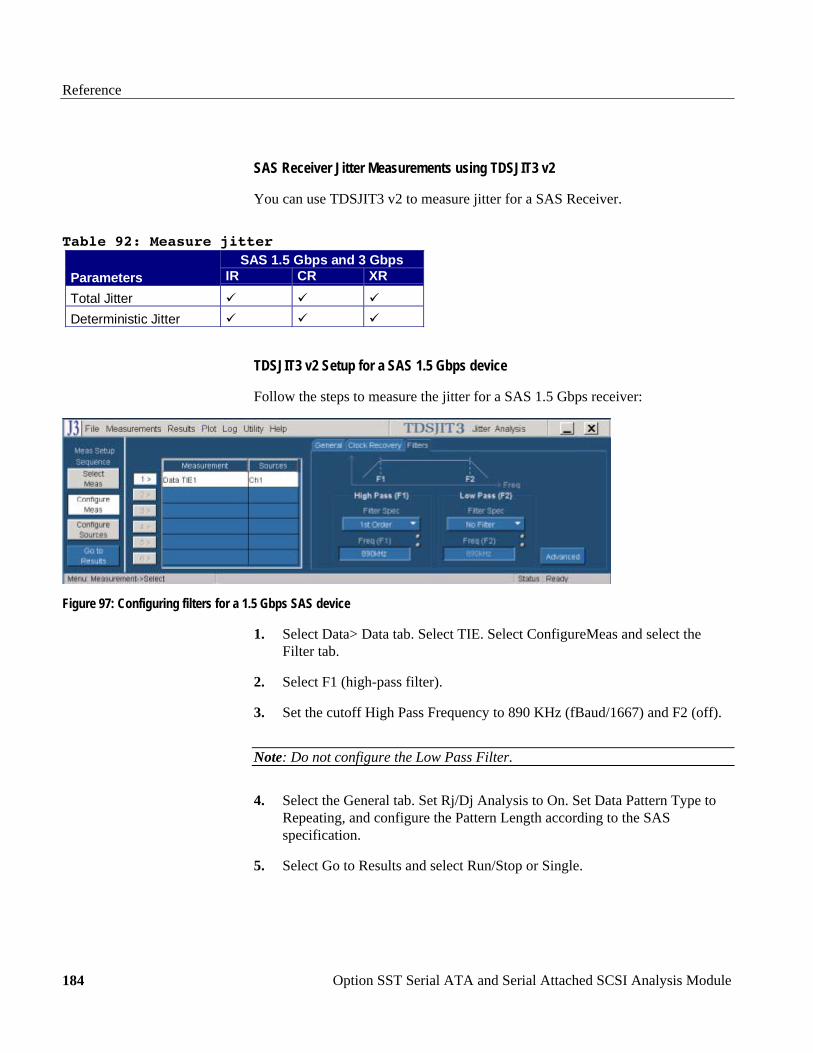
Reference
Option SST Serial ATA and Serial Attached SCSI Analysis Module 184
SAS Receiver Jitter Measurements using TDSJIT3 v2
You can use TDSJIT3 v2 to measure jitter for a SAS Receiver.
Table 92: Measure jitter SAS 1.5 Gbps and 3 Gbps
Parameters IR CR XRTotal JitterDeterministic Jitter
TDSJIT3 v2 Setup for a SAS 1.5 Gbps device
Follow the steps to measure the jitter for a SAS 1.5 Gbps receiver:
Figure 97: Configuring filters for a 1.5 Gbps SAS device
1. Select Data> Data tab. Select TIE. Select ConfigureMeas and select the Filter tab.
2. Select F1 (high-pass filter).
3. Set the cutoff High Pass Frequency to 890 KHz (fBaud/1667) and F2 (off).
Note: Do not configure the Low Pass Filter.
4. Select the General tab. Set Rj/Dj Analysis to On. Set Data Pattern Type to Repeating, and configure the Pattern Length according to the SAS specification.
5. Select Go to Results and select Run/Stop or Single.
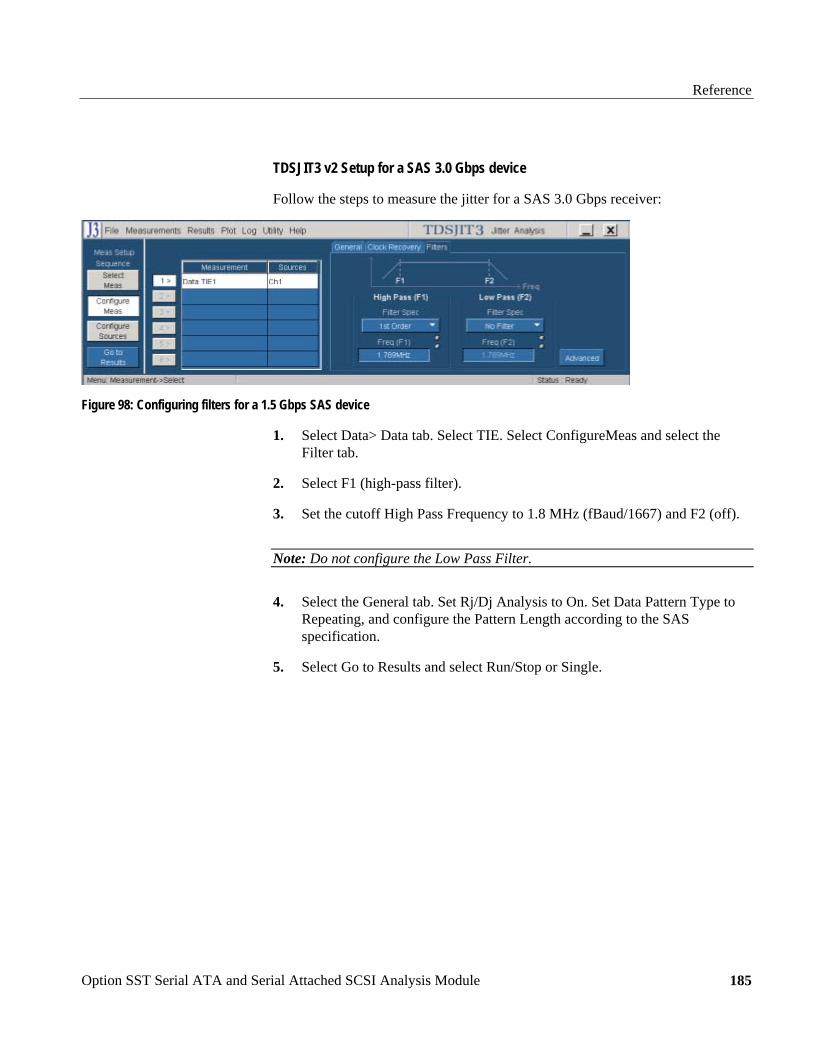
Reference
Option SST Serial ATA and Serial Attached SCSI Analysis Module
185
TDSJIT3 v2 Setup for a SAS 3.0 Gbps device
Follow the steps to measure the jitter for a SAS 3.0 Gbps receiver:
Figure 98: Configuring filters for a 1.5 Gbps SAS device
1. Select Data> Data tab. Select TIE. Select ConfigureMeas and select the Filter tab.
2. Select F1 (high-pass filter).
3. Set the cutoff High Pass Frequency to 1.8 MHz (fBaud/1667) and F2 (off).
Note: Do not configure the Low Pass Filter.
4. Select the General tab. Set Rj/Dj Analysis to On. Set Data Pattern Type to Repeating, and configure the Pattern Length according to the SAS specification.
5. Select Go to Results and select Run/Stop or Single.


![Universal Serial Bus Mass Storage Class USB Attached SCSI ...read.pudn.com/downloads526/ebook/2179283/uasp_1_0... · USB Attached SCSI Protocol (UASP) 5 5 [USB3] Operation 5.1 Overview](https://img.pdfslide.net/doc/110x75/5f06290d7e708231d4169847/universal-serial-bus-mass-storage-class-usb-attached-scsi-readpudncomdownloads526ebook2179283uasp10.jpg)