Embed Size (px)
Citation preview
129
ABSTRACT
Background and Purpose: To identify biomarkers for prediction of the progression to dementia in mild cognitive impairment (MCI) patients, evaluation of brain structure changes has been validated by a comprehensive visual grading scale (CVRS) through magnetic resonance imaging (MRI). In this study, we specifically elucidated for the cognitive change of MCI patients classified based on AT(N) pathological status classification during the follow-up period of 3 years through the CVRS.Methods: The 301 patients with initial MCI visited at least once for follow-up period. The data used in this study were obtained from the Alzheimer's disease (AD) Neuroimaging Initiative study. Brain atrophy was assessed by CVRS using MRI. AT(N) profiles were classified by cerebrospinal fluid abnormality. Based on the AT(N) assessment, all individuals in this study were divided into 3 groups (normal state biomarker, suspected non-Alzheimer's pathology [SNAP], or Alzheimer's continuum). The cox regression was used to analyze the hazard ratios of CVRS for progression to dementia.Results: Sixty-three progressed and 238 remained stable to dementia and the CVRS (mean±standard deviation) had significant difference between progressive MCI and stable MCI (p<0.001). Univariate and multivariate cox regression results (p<0.001) showed the independence of initial CVRS as a predictor for the progression to dementia. Moreover, comparing the classified AT(N) pathology group, SNAP and AD, effectiveness of CVRS as a predictor was verified only in Alzheimer's continuum.Conclusions: The initial CVRS score as a predictor of dementia progression was independently validated at the stage of Alzheimer's progression among AT(N) pathologically differentiated MCI.
Keywords: Alzheimer's Disease; Mild Cognitive Impairment; Magnetic Resonance Imaging; Neuropathology
Dement Neurocogn Disord. 2020 Dec;19(4):129-139https://doi.org/10.12779/dnd.2020.19.4.129pISSN 1738-1495·eISSN 2384-0757
Original Article
Received: Jul 2, 2020Revised: Sep 14, 2020Accepted: Sep 29, 2020
Correspondence toJae-Won JangDepartment of Neuroscience, Kangwon National University School of Medicine, 1 Gangwondaehak-gil, Chuncheon 24341, Korea.E-mail: [email protected]
SangYun KimDepartment of Neurology, Seoul National University Bundang Hospital, 82 Gumi-ro 173-beon-gil, Bundang-gu, Seongnam 13620, Korea.E-mail: [email protected]
© 2020 Korean Dementia AssociationThis is an Open Access article distributed under the terms of the Creative Commons Attribution Non-Commercial License (https://creativecommons.org/licenses/by-nc/4.0/) which permits unrestricted non-commercial use, distribution, and reproduction in any medium, provided the original work is properly cited.
ORCID iDsSang Won Park https://orcid.org/0000-0001-9796-2799Seongheon Kim https://orcid.org/0000-0002-4253-7522Jeonghoon Park https://orcid.org/0000-0002-1020-116XJae-Won Jang https://orcid.org/0000-0003-3540-530XSangYun Kim https://orcid.org/0000-0002-9101-5704
Sang Won Park ,1 Seongheon Kim ,2 Jeonghoon Park ,2 Jae-Won Jang ,1,2 SangYun Kim 3,4
1Department of Neuroscience, Kangwon National University School of Medicine, Chuncheon, Korea2Department of Neurology, Kangwon National University Hospital, Chuncheon, Korea3Department of Neurology, Seoul National University Bundang Hospital, Seongnam, Korea4Department of Neurology, Seoul National University College of Medicine, Seoul, Korea
A Comprehensive Visual Rating Scale for Predicting Progression from Mild Cognitive Impairment to Dementia in Patients with Alzheimer's Pathology or Suspected Non-Alzheimer's Pathology
https://dnd.or.kr
Conflict of InterestThe authors have no financial conflicts of interest.
Author ContributionsConceptualization: Jang JW, Kim S,2; Data curation: Park SW, Jang JW; Formal analysis: Park SW, Jang JW; Investigation: Kim S,1 Park J, Jang JW; Methodology: Kim S,1 Park J, Jang JW; Software: Park SW, Jang JW; Validation: Park SW, Jang JW; Writing - original draft: Park SW; Writing - review & editing: Jang JW, Kim S,2.
Kim S,1 Seongheon Kim; Kim S,2 SangYun Kim.
INTRODUCTION
Mild cognitive impairment (MCI) is the state of transition between normal cognitive function and dementia.1 It is important to assess risk factors for dementia in patients with MCI since interventions that modify disease progression and prepare the patient for future clinical trials can be implemented at an early stage.2,3 Clinical symptoms of MCI, known as the long-term pre-dementia stage, are associated with a variety of trajectories, of which about 15% may progress to dementia annually.4-6 According to longitudinal research, dementia progression can be predicted in patients with MCI through neuroimaging or cerebrospinal fluid (CSF) biomarkers.7 The AT(N) system has recently been used to categorize MCI according to pathophysiological changes in amyloid-β (Aβ), pathological tau, and neurodegeneration.8 Aβ (labeled as A), pathologic tau (labeled as T), and neurodegeneration (labeled as N) can be detected simultaneously using CSF at clinical stages.9,10 Patients can be classified into a normal state biomarker group (A−T−(N)−), suspected non-Alzheimer's pathology group (SNAP; A−T+(N)−, A−T−(N)+, and A−T+(N)+), or an Alzheimer's continuum group (A+T−(N)−, A+T+(N)−, A+T−(N)+, and A+T+(N)+) based on these CSF biomarkers. Brain magnetic resonance imaging (MRI) can be used to detect cerebral structural changes and to perform quantitative analyses to predict future cognitive decline.11 The National Institute on Aging-Alzheimer's Association has adopted structural MRI-confirmed atrophy as a neurodegenerative marker of dementia in addition to increased CSF tau, hypometabolism on [18F]-fluorodeoxyglucose positron emission tomography (PET), or a positive tau PET.12-14 To obtain a complete understanding and a quantified visual rating of structural changes in the brain, such as atrophy and cerebrovascular lesions, a comprehensive visual rating scale (CVRS) has been developed.15 CVRS can be applied to specialized clinical stages and has been shown to predict progression from MCI to dementia through revealing structural changes in the brain. Moreover, CVRS has been shown to be significantly correlated with neuropsychological examination results, such as the Clinical Dementia Rating-Sum of Boxes (CDR-SB) and the Mini-Mental State Examination (MMSE).15 However, pathological characteristics of the patients were not considered for CVRS. In addition, whether this scale can be used along with CSF biomarkers to predict progression from MCI to dementia over time is unclear.
In this study, we hypothesized that the predictive ability of CVRS would change depending on the patient's initial pathologic status. We used the CVRS score as a predictor of progression from MCI to dementia during a follow-up period lasting up to 36 months in 3 patient groups with initial AT(N) classifications based on CSF biomarkers. The patient groups were as follows: normal state biomarkers, SNAP, and Alzheimer's continuum.
METHODS
Ethics statementThe study procedures were approved by the Institutional Review Board of the Kangwon National University Hospital (No. KNUH-2020-04-015). We did not have access to any identifying participant data. All participant data were downloaded from the Alzheimer's Disease Neuroimaging Initiative (ADNI) website (http://adni.loni.usc.edu/wp-ontent/uploads/how_to_apply/ADNI_Acknowledgement_List.pdf ) and the procedures were approved by the institutional review boards of all the participating centers.
In addition, all participants and authorized representatives signed informed consents. Detailed consent protocols can be obtained at the ADNI website (http://www.adni-info.or).
130https://doi.org/10.12779/dnd.2020.19.4.129
Visual Rating Scale with Alzheimer's Pathology
https://dnd.or.kr
SubjectsPatient data used in this study were obtained from the ADNI database (adni.loni.usc.edu) and downloaded on December 21, 2017. The ADNI was launched as a public-private partnership, led by the principal investigator Michael W. Weiner, MD and includes biological, clinical, demographic, and nutritional information about the patients. The primary goal of the ADNI has been to test whether serial MRIs, PETs, other biological markers, and clinical and neuropsychological assessments can be combined to determine the progression of MCI and early Alzheimer's disease (AD).
Data from a total of 301 patients from the ADNI1, 2, and GO cohort were used in this study. We included patients who were initially diagnosed with MCI, and who underwent an MRI and CSF biomarker test at baseline and again during at least one follow-up visit. The primary result of this study was the assessment of patient progression from MCI to dementia during the follow-up period, which lasted up to 36 months. Of all the patients studied, 63 progressed to dementia within 36 months and 238 had stable MCI throughout the follow-up period.
A clinical diagnosis of MCI was defined as the presence of objective memory impairment without meeting the criteria for dementia. Namely, for participants included in this study, information on CSF biomarkers and CVRS scores, which showed atrophic brain structures at baseline, and longitudinal neuropsychological markers such as MMSE and CDR-SB scores, which were used to evaluate the patient at baseline and then annually for up to 3 years, were available. Inclusion criteria for all patients were: an MMSE score of 24 or higher, a global CDR score of 0.5 or higher, a CDR memory score of 0.5 or higher, and a score indicating impairment on the delayed recall of Story A of the Wechsler Memory Scale-Revised (16 years of education: 8; 8–15 years of education: 4; 0–7 years of education: 2).16 A diagnosis of dementia at follow-up was made when, in conjunction with the presence of complaints regarding memory, the patient had a CDR score of 0.5 and significant impairments in objective cognitive measurements and in activities of daily living. Individuals with AD met the National Institute of Neurological and Communicative Disorders and Stroke-Alzheimer's Disease and Related Disorders Association criteria for probable AD.17 Demographic and clinical variables are presented in Table 1.
CSF biomarker measurementsThe standardized protocol for CSF analysis and sample collection for the ADNI is available elsewhere.17 In brief, baseline CSF Aβ1–42, total tau (t-tau), and tau phosphorylated at threonine 181 (p-tau) were measured using the Innogenetics immunoassay kit (INNO-BIA AlzBio3; Innogenetics, Ghent, Belgium) and the multiplex Xmap Luminex platform after executing the quality control studies and organizing the validity of the platform. Using this system, we were able to perform a logistic regression model for Aβ1–42, t-tau, and the apolipoprotein E (APOE) ε4 allele to determine the best assessment and biomarker measurements for the ADNI patients in the same sample simultaneously and match them to the autopsy-confirmed AD cases based on age.18
Classification of the AT(N) profiles and subjectsIn this study, AT(N) profiles were classified as abnormal when the test result was positive, with a CSF Aβ1–42 less than 192 pg/mL classified as A+, a p-tau181p cutoff value greater than 23 pg/mL classified as T+, and a t-tau greater than 93 pg/mL classified as N+.17,19 Based on the AT(N) assessment using CSF biomarkers, all patients in this study were classified into 3 groups (normal state biomarker, SNAP, or Alzheimer's continuum), where the normal
131https://doi.org/10.12779/dnd.2020.19.4.129
Visual Rating Scale with Alzheimer's Pathology
https://dnd.or.kr
state biomarker was A−T−(N)−; SNAP included A−T+(N)−, A−T−(N)+, and A−T+(N)+; and Alzheimer's continuum included A+T−(N)−, A+T+(N)−, A+T−(N)+, and A+T+(N)+.
Structure and acquisition of MRI imagesMRI images were acquired from all subjects using a 3T MRI scanner (GE, Siemens, or Philips). Data collection was conducted at multiple ADNI sites (http://adni.loni.usc.edu/methods/documents/mri-protocols/) according to the MRI standard protocol that was developed by comparing and evaluating 3D T1-weighted sequences for morphometric analysis. MRI processes were performed per standard protocols.20 Pre-processed T1-W MRI images, fluid-attenuated inversion recovery images, and T2 star-weighted images were acquired from the ADNI database.
CVRSThe CVRS evaluates 4 structural features of the brain, namely hippocampal atrophy, cortical atrophy, ventricular enlargement (subcortical atrophy), and small vessel disease, and determines degenerative or vascular injury according to age (Fig. 1, Supplementary Table 1). For hippocampal and cortical atrophy, both coronal and axial rating scales as well as small vessel disease scales were used, which include subcortical white matter hyperintensities, lacunes, and microbleeds.20 These existing scales were adopted for the CVRS score and combined to quantify the effect of multiple brain deficits, thus yielding a scale with scores ranging from 0 to 30 (the higher the score, the greater the deficits). The visual rating assessment was conducted by 3 raters (Jae-Won Jang, Jeonghoon Park, and Seongheon Kim) who were blind to demographic and clinical information.11
Statistical analysisWe compared the groups (normal state biomarker, SNAP, and Alzheimer's continuum), which were divided according to baseline AT(N) profiles using CSF values. To examine variables between different groups, independent t-tests and χ2 tests were used for continuous
132https://doi.org/10.12779/dnd.2020.19.4.129
Visual Rating Scale with Alzheimer's Pathology
https://dnd.or.kr
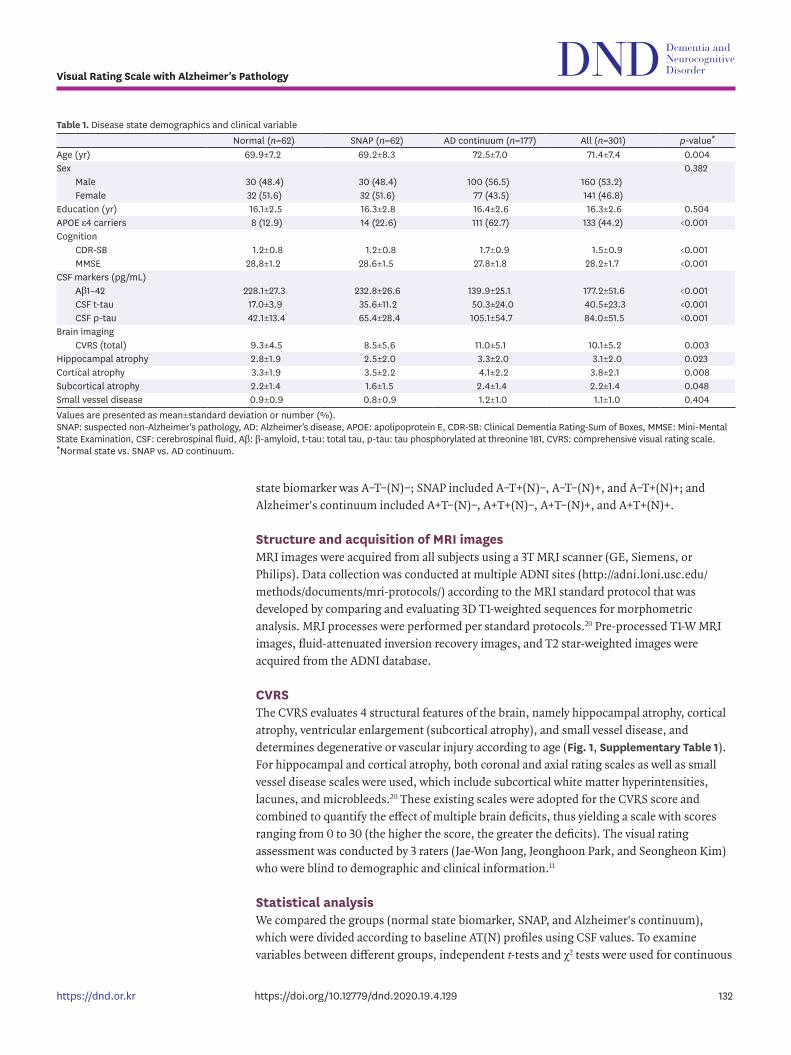
Table 1. Disease state demographics and clinical variableNormal (n=62) SNAP (n=62) AD continuum (n=177) All (n=301) p-value*
Age (yr) 69.9±7.2 69.2±8.3 72.5±7.0 71.4±7.4 0.004Sex 0.382
Male 30 (48.4) 30 (48.4) 100 (56.5) 160 (53.2)Female 32 (51.6) 32 (51.6) 77 (43.5) 141 (46.8)
Education (yr) 16.1±2.5 16.3±2.8 16.4±2.6 16.3±2.6 0.504APOE ε4 carriers 8 (12.9) 14 (22.6) 111 (62.7) 133 (44.2) <0.001Cognition
CDR-SB 1.2±0.8 1.2±0.8 1.7±0.9 1.5±0.9 <0.001MMSE 28.8±1.2 28.6±1.5 27.8±1.8 28.2±1.7 <0.001
CSF markers (pg/mL)Aβ1–42 228.1±27.3 232.8±26.6 139.9±25.1 177.2±51.6 <0.001CSF t-tau 17.0±3.9 35.6±11.2 50.3±24.0 40.5±23.3 <0.001CSF p-tau 42.1±13.4 65.4±28.4 105.1±54.7 84.0±51.5 <0.001
Brain imagingCVRS (total) 9.3±4.5 8.5±5.6 11.0±5.1 10.1±5.2 0.003
Hippocampal atrophy 2.8±1.9 2.5±2.0 3.3±2.0 3.1±2.0 0.023Cortical atrophy 3.3±1.9 3.5±2.2 4.1±2.2 3.8±2.1 0.008Subcortical atrophy 2.2±1.4 1.6±1.5 2.4±1.4 2.2±1.4 0.048Small vessel disease 0.9±0.9 0.8±0.9 1.2±1.0 1.1±1.0 0.404Values are presented as mean±standard deviation or number (%).SNAP: suspected non-Alzheimer's pathology, AD: Alzheimer's disease, APOE: apolipoprotein E, CDR-SB: Clinical Dementia Rating-Sum of Boxes, MMSE: Mini-Mental State Examination, CSF: cerebrospinal fluid, Aβ: β-amyloid, t-tau: total tau, p-tau: tau phosphorylated at threonine 181, CVRS: comprehensive visual rating scale.*Normal state vs. SNAP vs. AD continuum.
variables and the Mann-Whitney U-test was used for continuous variables that did not have a normal distribution.
The hazard ratio (HR) of the CVRS was measured using baseline demographics and neuropsychological profiles through univariate and multivariate Cox regression analyses with the follow-up time as the time variable and progression to dementia as the status variable. To determine whether the CVRS score was correlated to the progression from MCI to dementia, the Kaplan-Meier survival curve was used. The cutoff value of 10 was determined by dividing the high CVRS and the low CVRS in dichotomy according to the top 50% of the CVRS score. To identify independent determinants of dementia progression using variable-relevant covariates, a multivariate Cox analysis was performed. In addition, univariate and multivariate Cox regression analyses were used to assess the possibility of using CVRS as a predictor of progression to dementia within the groups classified by AT(N) based on CSF biomarker assessments.
The retention threshold was set to p<0.2 for the univariate Cox regression analysis. Clinically important factors, such as age at baseline, sex, education, MMSE and CDR-SB scores, APOE ε4 status, and CVRS scores were also included as covariates. Multicollinearity among the covariates was tested by calculating the variance inflation factors.21 The level of statistical significance was set at p<0.05. The Cox regression analysis was performed using the survival package.22 The graphics were generated using the ggplot2 package.23 All statistical analyses were performed using R (version 3.6.3, 64-bit platform; The R Foundation for Statistical Computing, Vienna, Austria).
RESULTS
The study was conducted on a total of 301 patients. The mean age of the patients was 71.4 years, and 160 (53.2%) patients were male. There were 133 (44.2%) patients with at least one APOE ε4 allele, and 63 (20.9%) patients progressed to dementia during the follow-up period (up to 36 months), while 238 (80.1%) patients did not. Table 1 shows patient characteristics classified into demographic, cognitive, and biomarker data based on whether subjects progressed to dementia over the follow-up period (progressive MCI) or not (stable MCI). Concerning baseline neuropsychological data, the mean scores for the MMSE for stable MCI
133https://doi.org/10.12779/dnd.2020.19.4.129
Visual Rating Scale with Alzheimer's Pathology
https://dnd.or.kr
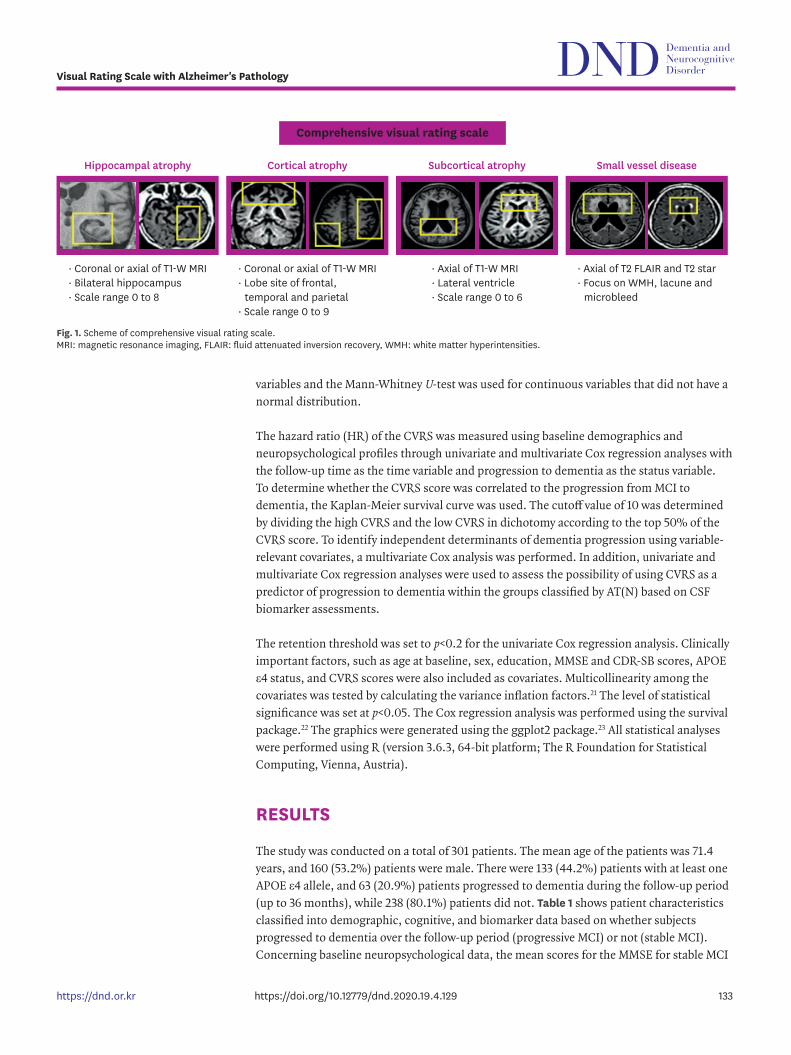
· Coronal or axial of T1-W MRI· Bilateral hippocampus· Scale range 0 to 8
· Coronal or axial of T1-W MRI· Lobe site of frontal,
temporal and parietal· Scale range 0 to 9
· Axial of T1-W MRI· Lateral ventricle· Scale range 0 to 6
· Axial of T2 FLAIR and T2 star· Focus on WMH, lacune and
microbleed
Comprehensive visual rating scale
Hippocampal atrophy Cortical atrophy Subcortical atrophy Small vessel disease
Fig. 1. Scheme of comprehensive visual rating scale. MRI: magnetic resonance imaging, FLAIR: fluid attenuated inversion recovery, WMH: white matter hyperintensities.
and progressive MCI were 28.4 and 27.3, respectively; and that for the CDR-SB were 1.3 and 2.3 points, respectively. Patients who progressed from MCI to dementia had poorer cognitive performance and higher CVRS scores (mean of 12.8) at baseline and were more likely to be APOE ε4 carriers (mean of 41) than stable MCI patients.
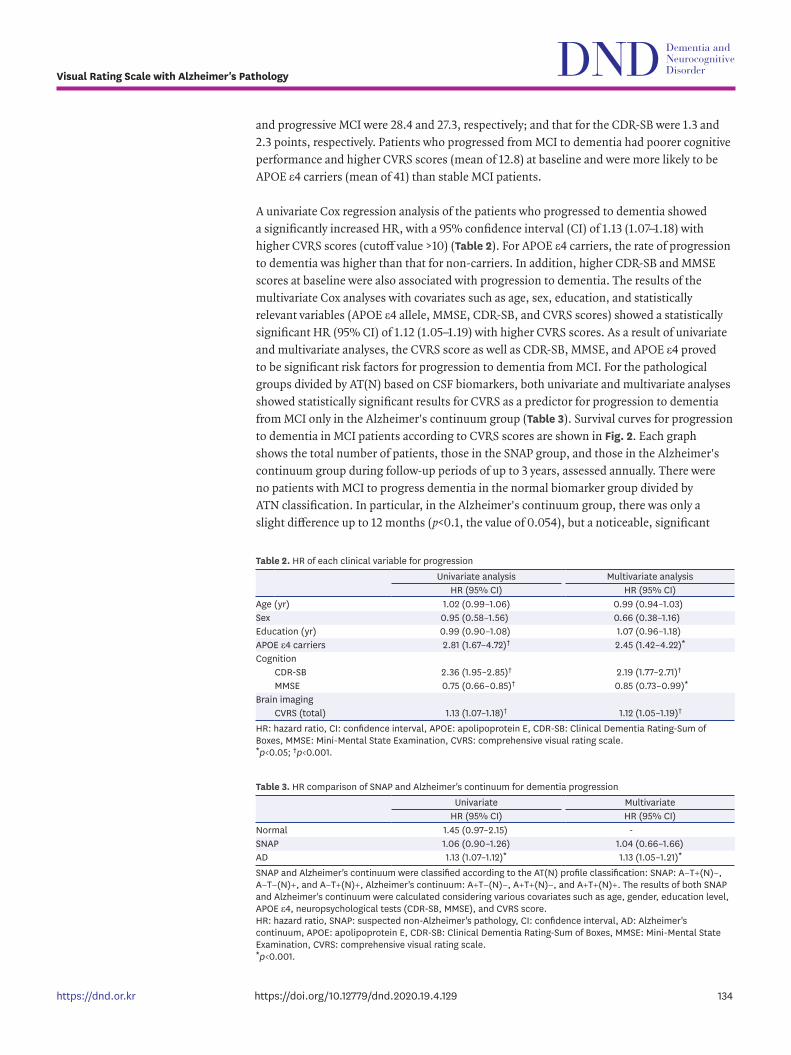
A univariate Cox regression analysis of the patients who progressed to dementia showed a significantly increased HR, with a 95% confidence interval (CI) of 1.13 (1.07–1.18) with higher CVRS scores (cutoff value >10) (Table 2). For APOE ε4 carriers, the rate of progression to dementia was higher than that for non-carriers. In addition, higher CDR-SB and MMSE scores at baseline were also associated with progression to dementia. The results of the multivariate Cox analyses with covariates such as age, sex, education, and statistically relevant variables (APOE ε4 allele, MMSE, CDR-SB, and CVRS scores) showed a statistically significant HR (95% CI) of 1.12 (1.05–1.19) with higher CVRS scores. As a result of univariate and multivariate analyses, the CVRS score as well as CDR-SB, MMSE, and APOE ε4 proved to be significant risk factors for progression to dementia from MCI. For the pathological groups divided by AT(N) based on CSF biomarkers, both univariate and multivariate analyses showed statistically significant results for CVRS as a predictor for progression to dementia from MCI only in the Alzheimer's continuum group (Table 3). Survival curves for progression to dementia in MCI patients according to CVRS scores are shown in Fig. 2. Each graph shows the total number of patients, those in the SNAP group, and those in the Alzheimer's continuum group during follow-up periods of up to 3 years, assessed annually. There were no patients with MCI to progress dementia in the normal biomarker group divided by ATN classification. In particular, in the Alzheimer's continuum group, there was only a slight difference up to 12 months (p<0.1, the value of 0.054), but a noticeable, significant
134https://doi.org/10.12779/dnd.2020.19.4.129
Visual Rating Scale with Alzheimer's Pathology
https://dnd.or.kr
Table 2. HR of each clinical variable for progressionUnivariate analysis Multivariate analysis
HR (95% CI) HR (95% CI)Age (yr) 1.02 (0.99–1.06) 0.99 (0.94–1.03)Sex 0.95 (0.58–1.56) 0.66 (0.38–1.16)Education (yr) 0.99 (0.90–1.08) 1.07 (0.96–1.18)APOE ε4 carriers 2.81 (1.67–4.72)† 2.45 (1.42–4.22)*Cognition
CDR-SB 2.36 (1.95–2.85)† 2.19 (1.77–2.71)†
MMSE 0.75 (0.66–0.85)† 0.85 (0.73–0.99)*Brain imaging
CVRS (total) 1.13 (1.07–1.18)† 1.12 (1.05–1.19)†
HR: hazard ratio, CI: confidence interval, APOE: apolipoprotein E, CDR-SB: Clinical Dementia Rating-Sum of Boxes, MMSE: Mini-Mental State Examination, CVRS: comprehensive visual rating scale.*p<0.05; †p<0.001.
Table 3. HR comparison of SNAP and Alzheimer's continuum for dementia progressionUnivariate Multivariate
HR (95% CI) HR (95% CI)Normal 1.45 (0.97–2.15) -SNAP 1.06 (0.90–1.26) 1.04 (0.66–1.66)AD 1.13 (1.07–1.12)* 1.13 (1.05–1.21)*
SNAP and Alzheimer's continuum were classified according to the AT(N) profile classification: SNAP: A−T+(N)−, A−T−(N)+, and A−T+(N)+, Alzheimer's continuum: A+T−(N)−, A+T+(N)−, and A+T+(N)+. The results of both SNAP and Alzheimer's continuum were calculated considering various covariates such as age, gender, education level, APOE ε4, neuropsychological tests (CDR-SB, MMSE), and CVRS score.HR: hazard ratio, SNAP: suspected non-Alzheimer's pathology, CI: confidence interval, AD: Alzheimer's continuum, APOE: apolipoprotein E, CDR-SB: Clinical Dementia Rating-Sum of Boxes, MMSE: Mini-Mental State Examination, CVRS: comprehensive visual rating scale.*p<0.001.
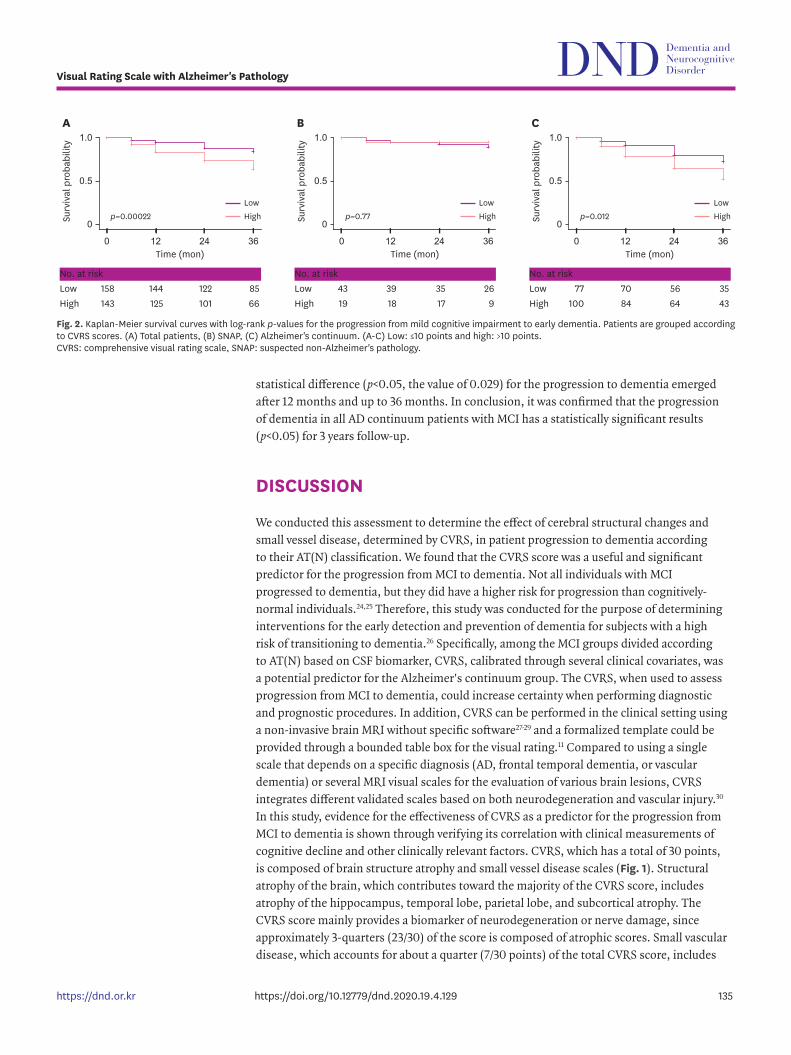
statistical difference (p<0.05, the value of 0.029) for the progression to dementia emerged after 12 months and up to 36 months. In conclusion, it was confirmed that the progression of dementia in all AD continuum patients with MCI has a statistically significant results (p<0.05) for 3 years follow-up.
DISCUSSION
We conducted this assessment to determine the effect of cerebral structural changes and small vessel disease, determined by CVRS, in patient progression to dementia according to their AT(N) classification. We found that the CVRS score was a useful and significant predictor for the progression from MCI to dementia. Not all individuals with MCI progressed to dementia, but they did have a higher risk for progression than cognitively-normal individuals.24,25 Therefore, this study was conducted for the purpose of determining interventions for the early detection and prevention of dementia for subjects with a high risk of transitioning to dementia.26 Specifically, among the MCI groups divided according to AT(N) based on CSF biomarker, CVRS, calibrated through several clinical covariates, was a potential predictor for the Alzheimer's continuum group. The CVRS, when used to assess progression from MCI to dementia, could increase certainty when performing diagnostic and prognostic procedures. In addition, CVRS can be performed in the clinical setting using a non-invasive brain MRI without specific software27-29 and a formalized template could be provided through a bounded table box for the visual rating.11 Compared to using a single scale that depends on a specific diagnosis (AD, frontal temporal dementia, or vascular dementia) or several MRI visual scales for the evaluation of various brain lesions, CVRS integrates different validated scales based on both neurodegeneration and vascular injury.30 In this study, evidence for the effectiveness of CVRS as a predictor for the progression from MCI to dementia is shown through verifying its correlation with clinical measurements of cognitive decline and other clinically relevant factors. CVRS, which has a total of 30 points, is composed of brain structure atrophy and small vessel disease scales (Fig. 1). Structural atrophy of the brain, which contributes toward the majority of the CVRS score, includes atrophy of the hippocampus, temporal lobe, parietal lobe, and subcortical atrophy. The CVRS score mainly provides a biomarker of neurodegeneration or nerve damage, since approximately 3-quarters (23/30) of the score is composed of atrophic scores. Small vascular disease, which accounts for about a quarter (7/30 points) of the total CVRS score, includes
135https://doi.org/10.12779/dnd.2020.19.4.129
Visual Rating Scale with Alzheimer's Pathology
https://dnd.or.kr
0
0.5
1.0
0 12 24 36Time (mon)
Surv
ival
pro
babi
lity
No. at riskLowHigh
158143
144125
122101
8566
p=0.00022
A B C
0
0.5
1.0
0 12 24 36Time (mon)
Surv
ival
pro
babi
lity
No. at riskLowHigh
4319
3918
3517
269
p=0.770
0.5
1.0
0 12 24 36Time (mon)
Surv
ival
pro
babi
lity
No. at riskLowHigh
77100
7084
5664
3543
p=0.012LowHigh
LowHigh
LowHigh
Fig. 2. Kaplan-Meier survival curves with log-rank p-values for the progression from mild cognitive impairment to early dementia. Patients are grouped according to CVRS scores. (A) Total patients, (B) SNAP, (C) Alzheimer's continuum. (A-C) Low: ≤10 points and high: >10 points. CVRS: comprehensive visual rating scale, SNAP: suspected non-Alzheimer's pathology.
injured vascular markers such as white matter hyperintensities, lacunar infarcts, and microbleeds. A complex pathological status, such as a mixture of neurodegenerative and cerebrovascular disease, has attracted attention as an imperative cause of AD and other forms of dementia by several clinical-pathological longitudinal studies.10 A combination of vascular pathologies, such as micro-infarction, atherosclerosis, and cerebral amyloid angiopathy, have been shown in over 58% of MCI patients, and vascular pathology as a direct cause of clinical AD or as an interaction with AD has been demonstrated in several studies.31 However, the mechanism of vascular deterioration for cognitive function and the relationship of some vascular pathologies to other pathologies remain unclear.
This study has some limitations. First, there was an insufficient number of patients to conduct a more detailed analysis. Specifically, there was an insufficient number of patients in the normal state biomarker group (A−T−(N)−) to present detailed results using the Kaplan-Meier survival curve and HR through univariate and multivariate regression analyses.32 Additionally, due to the low number of patients in this group, we could not analyze survival analysis for this group nor categorize them according to the CVRS cutoff value of those who were stable and those who progressed to dementia; the patients in a stable state of MCI were 60 of 62 patients, and those in a progression state were 2 of 60 patients. In addition, the total number of patients was not enough to divide the positive and negative states of each element of AT(N) into the 8 combinations. Second, the CVRS score for small vessel disease was almost the same for stable and progressive MCI patients (Table 1); only cerebral atrophic structural changes revealed any significant difference. These results show that lacunar infarcts and microbleeds had little effect on the progression from MCI to dementia and on the overall CVRS scores originating from atrophic structural changes in the brain. Individuals with Hachinski scores (≤4) were included and those who had multiple lacunes were excluded. Thus, the effect of small vessel disease may have been underestimated in this study. Even though CVRS could not be used to predict progression to dementia in patients with normal baseline AD biomarkers in this study, this scale was shown to be useful for the Alzheimer's continuum biomarker group. Therefore, future studies may need to subdivide the A/T/N system and evaluate the association between atrophy pattern and vascular injury.33-35 In particular, whether white matter hyperintensity along with vascular injury or lacunes are associated with an increase in brain atrophy in pre-dementia AD pathology36,37 or with low cognitive function should be assessed in future studies as one of the CVRS sub-scores of the effects of small vessel disease.
In conclusion, this study showed that high initial CVRS scores in patients with MCI were associated with progression to dementia in the 3-year follow-up period. The CVRS's ability to predict progression to dementia was shown in the Alzheimer's continuum group rather than the SNAP group. This indicates that CVRS can be used to predict progression to dementia in MCI patients.
SUPPLEMENTARY MATERIAL
Supplementary Table 1CVRS and subscales values for brain structures
Click here to view
136https://doi.org/10.12779/dnd.2020.19.4.129
Visual Rating Scale with Alzheimer's Pathology
https://dnd.or.kr
REFERENCES
1. Meles SK, Pagani M, Arnaldi D, De Carli F, Dessi B, Morbelli S, et al. The Alzheimer's disease metabolic brain pattern in mild cognitive impairment. J Cereb Blood Flow Metab 2017;37:3643-3648. PUBMED | CROSSREF
2. Huijbers W, Mormino EC, Schultz AP, Wigman S, Ward AM, Larvie M, et al. Amyloid-β deposition in mild cognitive impairment is associated with increased hippocampal activity, atrophy and clinical progression. Brain 2015;138:1023-1035. PUBMED | CROSSREF
3. Selkoe DJ, Hardy J. The amyloid hypothesis of Alzheimer's disease at 25 years. EMBO Mol Med 2016;8:595-608. PUBMED | CROSSREF
4. Winblad B, Palmer K, Kivipelto M, Jelic V, Fratiglioni L, Wahlund LO, et al. Mild cognitive impairment--beyond controversies, towards a consensus: report of the International Working Group on Mild Cognitive Impairment. J Intern Med 2004;256:240-246. PUBMED | CROSSREF
5. Beach TG, Monsell SE, Phillips LE, Kukull W. Accuracy of the clinical diagnosis of Alzheimer disease at National Institute on Aging Alzheimer Disease Centers, 2005–2010. J Neuropathol Exp Neurol 2012;71:266-273. PUBMED | CROSSREF
6. Gamberger D, Lavrač N, Srivatsa S, Tanzi RE, Doraiswamy PM. Identification of clusters of rapid and slow decliners among subjects at risk for Alzheimer's disease. Sci Rep 2017;7:6763. PUBMED | CROSSREF
7. Hinrichs C, Singh V, Xu G, Johnson SC; Alzheimers Disease Neuroimaging Initiative. Predictive markers for AD in a multi-modality framework: an analysis of MCI progression in the ADNI population. Neuroimage 2011;55:574-589. PUBMED | CROSSREF
8. Jack CR Jr, Bennett DA, Blennow K, Carrillo MC, Dunn B, Haeberlein SB, et al. NIA-AA research framework: toward a biological definition of Alzheimer's disease. Alzheimers Dement 2018;14:535-562. PUBMED | CROSSREF
9. Olsson B, Lautner R, Andreasson U, Öhrfelt A, Portelius E, Bjerke M, et al. CSF and blood biomarkers for the diagnosis of Alzheimer's disease: a systematic review and meta-analysis. Lancet Neurol 2016;15:673-684. PUBMED | CROSSREF
10. Murray ME, Graff-Radford NR, Ross OA, Petersen RC, Duara R, Dickson DW. Neuropathologically defined subtypes of Alzheimer's disease with distinct clinical characteristics: a retrospective study. Lancet Neurol 2011;10:785-796. PUBMED | CROSSREF
11. Jang JW, Park JH, Kim S, Park YH, Pyun JM, Lim JS, et al. A ‘comprehensive visual rating scale’ for predicting progression to dementia in patients with mild cognitive impairment. PLoS One 2018;13:e0201852. PUBMED | CROSSREF
12. McKhann GM, Knopman DS, Chertkow H, Hyman BT, Jack CR Jr, Kawas CH, et al. The diagnosis of dementia due to Alzheimer's disease: recommendations from the National Institute on Aging-Alzheimer's Association workgroups on diagnostic guidelines for Alzheimer's disease. Alzheimers Dement 2011;7:263-269. PUBMED | CROSSREF
13. Sperling RA, Aisen PS, Beckett LA, Bennett DA, Craft S, Fagan AM, et al. Toward defining the preclinical stages of Alzheimer's disease: recommendations from the National Institute on Aging-Alzheimer's Association workgroups on diagnostic guidelines for Alzheimer's disease. Alzheimers Dement 2011;7:280-292. PUBMED | CROSSREF
14. Jack CR Jr, Albert MS, Knopman DS, McKhann GM, Sperling RA, Carrillo MC, et al. Introduction to the recommendations from the National Institute on Aging-Alzheimer's Association workgroups on diagnostic guidelines for Alzheimer's disease. Alzheimers Dement 2011;7:257-262. PUBMED | CROSSREF
15. Jang JW, Park SY, Park YH, Baek MJ, Lim JS, Youn YC, et al. A comprehensive visual rating scale of brain magnetic resonance imaging: application in elderly subjects with Alzheimer's disease, mild cognitive impairment, and normal cognition. J Alzheimers Dis 2015;44:1023-1034. PUBMED | CROSSREF
137https://doi.org/10.12779/dnd.2020.19.4.129
Visual Rating Scale with Alzheimer's Pathology
https://dnd.or.kr
16. Wechsler D. WMS-R: Wechsler Memory Scale--Revised Manual. San Antonio, TX: Psychological Corp., 1987.
17. Shaw LM, Vanderstichele H, Knapik-Czajka M, Clark CM, Aisen PS, Petersen RC, et al. Cerebrospinal fluid biomarker signature in Alzheimer's disease neuroimaging initiative subjects. Ann Neurol 2009;65:403-413. PUBMED | CROSSREF
18. McKhann G, Drachman D, Folstein M, Katzman R, Price D, Stadlan EM. Clinical diagnosis of Alzheimer's disease: report of the NINCDS-ADRDA work group under the auspices of Department of Health and Human Services task force on Alzheimer's disease. Neurology 1984;34:939-944. PUBMED | CROSSREF
19. Jack CR Jr, Bennett DA, Blennow K, Carrillo MC, Feldman HH, Frisoni GB, et al. A/T/N: An unbiased descriptive classification scheme for Alzheimer disease biomarkers. Neurology 2016;87:539-547. PUBMED | CROSSREF
20. Jack CR Jr, Bernstein MA, Fox NC, Thompson P, Alexander G, Harvey D, et al. The Alzheimer's Disease Neuroimaging Initiative (ADNI): MRI methods. J Magn Reson Imaging 2008;27:685-691. PUBMED | CROSSREF
21. Fox J, Monette G. Generalized collinearity diagnostics. J Am Stat Assoc 1992;87:178-183.
22. Therneau T. A Package for Survival Analysis in R. Vienna: R Foundation, 2020.
23. Wickham H. ggplot2: Elegant Graphics for Data Analysis. New York, NY: Springer, 2009.
24. Roberts RO, Knopman DS, Mielke MM, Cha RH, Pankratz VS, Christianson TJ, et al. Higher risk of progression to dementia in mild cognitive impairment cases who revert to normal. Neurology 2014;82:317-325. PUBMED | CROSSREF
25. Jack CR Jr, Wiste HJ, Vemuri P, Weigand SD, Senjem ML, Zeng G, et al. Brain beta-amyloid measures and magnetic resonance imaging atrophy both predict time-to-progression from mild cognitive impairment to Alzheimer's disease. Brain 2010;133:3336-3348. PUBMED | CROSSREF
26. Pankratz VS, Roberts RO, Mielke MM, Knopman DS, Jack CR Jr, Geda YE, et al. Predicting the risk of mild cognitive impairment in the Mayo Clinic Study of Aging. Neurology 2015;84:1433-1442. PUBMED | CROSSREF
27. Shen Q, Loewenstein DA, Potter E, Zhao W, Appel J, Greig MT, et al. Volumetric and visual rating of magnetic resonance imaging scans in the diagnosis of amnestic mild cognitive impairment and Alzheimer's disease. Alzheimers Dement 2011;7:e101-e108. PUBMED | CROSSREF
28. Frisoni GB. Visual rating and volumetry of the medial temporal lobe on magnetic resonance imaging in dementia. J Neurol Neurosurg Psychiatry 2000;69:572. PUBMED | CROSSREF
29. Bresciani L, Rossi R, Testa C, Geroldi C, Galluzzi S, Laakso MP, et al. Visual assessment of medial temporal atrophy on MR films in Alzheimer's disease: comparison with volumetry. Aging Clin Exp Res 2005;17:8-13. PUBMED | CROSSREF
30. Ekman U, Ferreira D, Westman E. The A/T/N biomarker scheme and patterns of brain atrophy assessed in mild cognitive impairment. Sci Rep 2018;8:8431. PUBMED | CROSSREF
31. Maia LF, Kaeser SA, Reichwald J, Hruscha M, Martus P, Staufenbiel M, et al. Changes in amyloid-β and tau in the cerebrospinal fluid of transgenic mice overexpressing amyloid precursor protein. Sci Transl Med 2013;5:194re2. PUBMED | CROSSREF
32. Wallin A, Nordlund A, Jonsson M, Lind K, Edman Å, Göthlin M, et al. The Gothenburg MCI study: design and distribution of Alzheimer's disease and subcortical vascular disease diagnoses from baseline to 6-year follow-up. J Cereb Blood Flow Metab 2016;36:114-131. PUBMED | CROSSREF
33. Barnes J, Carmichael OT, Leung KK, Schwarz C, Ridgway GR, Bartlett JW, et al. Vascular and Alzheimer's disease markers independently predict brain atrophy rate in Alzheimer's Disease Neuroimaging Initiative controls. Neurobiol Aging 2013;34:1996-2002. PUBMED | CROSSREF
34. Fiford CM, Manning EN, Bartlett JW, Cash DM, Malone IB, Ridgway GR, et al. White matter hyperintensities are associated with disproportionate progressive hippocampal atrophy. Hippocampus 2017;27:249-262. PUBMED | CROSSREF
138https://doi.org/10.12779/dnd.2020.19.4.129
Visual Rating Scale with Alzheimer's Pathology
https://dnd.or.kr

35. Ferreira D, Verhagen C, Hernández-Cabrera JA, Cavallin L, Guo CJ, Ekman U, et al. Distinct subtypes of Alzheimer's disease based on patterns of brain atrophy: longitudinal trajectories and clinical applications. Sci Rep 2017;7:46263. PUBMED | CROSSREF
36. Jokinen H, Gouw AA, Madureira S, Ylikoski R, van Straaten ECW, van der Flier WM, et al. Incident lacunes influence cognitive decline: the LADIS study. Neurology 2011;76:1872-1878. PUBMED | CROSSREF
37. Ikram MA, van der Lugt A, Niessen WJ, Koudstaal PJ, Krestin GP, Hofman A, et al. The Rotterdam Scan Study: design update 2016 and main findings. Eur J Epidemiol 2015;30:1299-1315. PUBMED | CROSSREF
139https://doi.org/10.12779/dnd.2020.19.4.129
Visual Rating Scale with Alzheimer's Pathology
https://dnd.or.kr