Embed Size (px)
Citation preview
P-06-15
Oskarshamn site investigation
Coordinated presentation of topographic and geophysical lineaments in selected areas, including field assessment – Laxemar area
Johan Berglund, Mats Nyborg
Swedpower AB
Carl-Axel Triumf, Hans Thunehed
GeoVista AB
January 2006
Svensk Kärnbränslehantering ABSwedish Nuclear Fueland Waste Management CoBox 5864SE-102 40 Stockholm Sweden Tel 08-459 84 00 +46 8 459 84 00Fax 08-661 57 19 +46 8 661 57 19
ISSN 1651-4416
SKB P-06-15
Oskarshamn site investigation
Coordinated presentation of topographic and geophysical lineaments in selected areas, including field assessment – Laxemar area
Johan Berglund, Mats Nyborg
Swedpower AB
Carl-Axel Triumf, Hans Thunehed
GeoVista AB
January 2006
This report concerns a study which was conducted for SKB. The conclusions and viewpoints presented in the report are those of the authors and do not necessarily coincide with those of the client.
A pdf version of this document can be downloaded from www.skb.se
�
Abstract
This report presents the results from an activity in the Oskarshamn site investigation involving:• the identification of new lineaments in a high-resolution digital terrain model based on
airborne laser scanning data (LIDAR),• a revision of previously identified lineaments in topographical data (orthophoto and
digital terrain model) and geophysical data (airborne and ground measurements),• a field reconnaissance of new, local minor lineaments,• a field check of lineaments from remote sensing (topography, orthophotos, geophysics).
The processing of LIDAR–data (airborne laser scanning) resulted in a high-resolution digital terrain model. This model was used to identify local minor topographical lineaments of which many later were verified and characterised in the field. It was also used to confirm the location and orientation of local minor lineaments identified in the field.
The work concentrated on seven subareas distributed over the Laxemar area with surroundings, each subarea covering 400 m by 400 m. During the field check, attributes were assigned to lineaments, primarily based on their field characteristics. The attributes give information in what type of data each individual lineament was identified, the level of uncertainty, how the lineament manifests itself in the morphology, if signs of rock deformation are visible in outcrops etc. The fieldwork was concentrated in areas where bedrock outcrops.
The results indicate that a major part of the identified lineaments may be explained by, or is directly related to observations of deformed rock. This is true not only for the newly identified local minor lineaments, but also for the lineaments based on geophysical data.

�
Sammanfattning
Denna rapport presenterar resultaten av en aktivitet i Oskarshamns platsundersökningar som omfattar:• identifiering av nya lineament i en högupplösande terrängmodell baserad på flygburen
laserskanning,• revidering av tidigare identifierade lineament i topografiska data (ortofoton och digitala
terrängmodeller) samt i geofysiska data (flyg- och helikopterburen mätning och mark-mätningar),
• fältrekognosering av nytolkade lokala mindre lineament,• fältkontroll av lineament.
Bearbetning av s k LIDAR data (flygburen laserskanning) resulterade i en högupplöst digital terrängmodell. Modellen användes för att identifiera lokala mindre topografiska lineament, av vilka många sedan verifierades och karaktäriserades i fält. Den användes också för att bekräfta läge och orientering för lokala mindre lineament som identifierats i fält.
Arbetet med att identifiera, revidera och kontrollera lineament koncentrerades till sju kontrollrutor (400 m × 400 m) i Laxemarområdet. Under fältkontrollen karaktäriserades lineamenten via attributsättning, i huvudsak för att beskriva dess geologiska karaktär. Ur parametrarna går bl a att utläsa i vilka datamängder det enskilda lineamentet har identifierats, om och i så fall vilken typ av direkta observationer av deformation som finns i häll etc. Fältkontrollerna koncentrerades i första hand till områden där hällar förväntades förekomma.
Resultaten visar att en stor del av lineamenten kan förklaras av eller är direkt relaterade till observationer av deformationer i berggrunden eller indirekta orsaker därav. Detta gäller inte bara de nya lokala mindre lineamenten, utan även lineament baserade på geofysiska data.

�
Contents
1 Introduction 7
2 Objectiveandscope 9
3 Equipment 113.1 Description of equipment 11
4 Execution 134.1 General 134.2 Preparatory work 144.3 Identification of lineaments in new high resolution topographical
data. Re-evaluation of previously identified lineaments 154.3.1 Topographical lineaments derived from new aerial imagery
and terrain model 154.3.2 Re-evaluation of existing lineaments derived from the
preceeding digital terrain model, airborne geophysics and ground geophysics 17
4.4 Field control, verification and analysis 174.4.1 Preparation for field control 184.4.2 Execution of field control 184.4.3 Data handling 204.4.4 Analysis and interpretation 214.4.5 Nonconformities 21
5 Results 23
6 Discussion 29
7 References 31
Appendix1 33
�
1 Introduction
This document reports the data gained by the activity named as “A joint interpretation of lineaments using detailed geophysical and topographic data Laxemar – Simpevarp” in the activity plan. It is one of the activities performed within the site investigation at Oskarshamn. The work was carried out in accordance to activity plan SKB AP PS 400-05-038. In Table 1-1 all controlling documents are listed for performing this activity. Also activity plans that the activity is directly dependent on are listed. Both activity plans and method descriptions are SKB’s internal controlling documents.
The work was carried out mainly as a co-operation between Swedpower AB and GeoVista AB during 2005 following the instruction and guidelines from SKB under the supervision of Peter Hultgren, SKB.
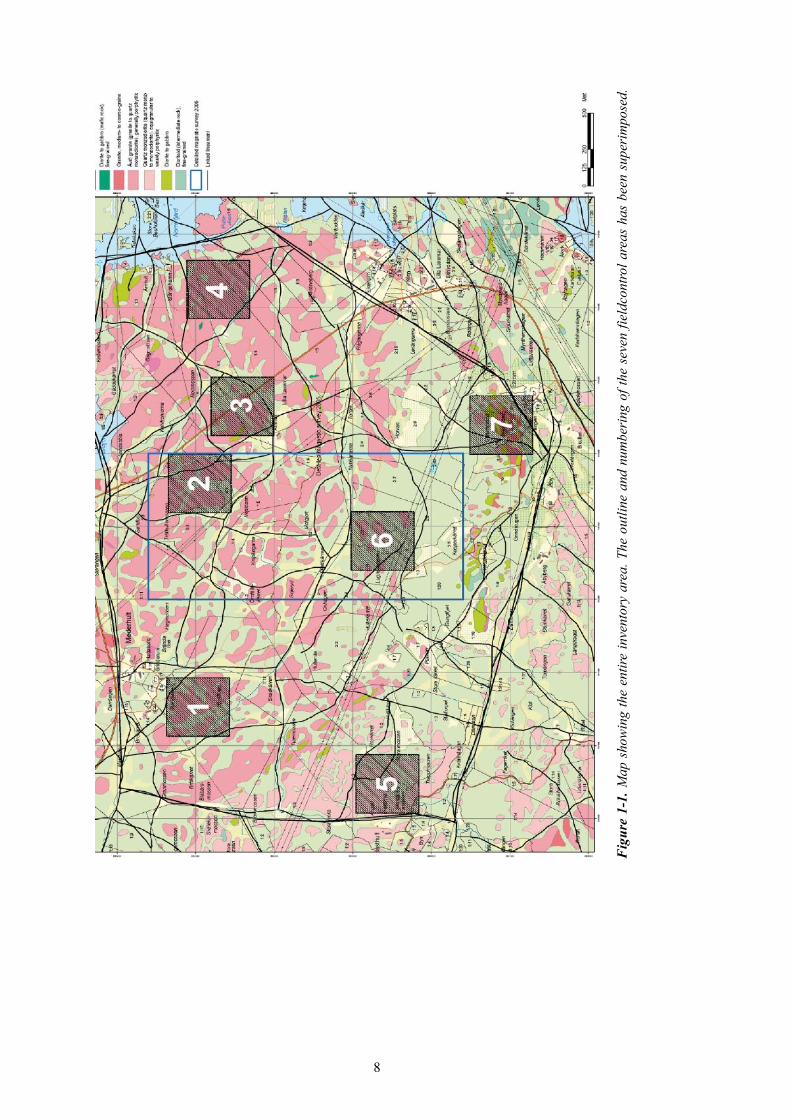
The focus of the study has been in seven field-control areas located in the Laxemar area with surroundings, Figure 1-1.
Table1‑1. Controllingdocumentsfortheperformanceoftheactivity.
ActivityPlan Number Version
Samtolkning av detaljerad markgeofysik, flygfotografering, laserskanning samt geologisk fältkontroll i Laxemar
AP PS 400-05-038 1.0
Detaljerade markgeofysiska mätningar i Laxemar AP PS 400-05-014 1.0
Flygmätningar med laserskanning och flygfotografering, 2005
AP PS 400-05-035 1.0
Methoddescriptions Number VersionMetodbeskrivning för lineamentstolkning baserad på topografiska data
SKB MD 120.001 1.0
Metodbeskrivning för tolkning av flyggeofysiska data SKB MD 211.003 1.0
�
Fig
ure
1‑1.
Map
sho
win
g th
e en
tire
inve
ntor
y ar
ea. T
he o
utlin
e an
d nu
mbe
ring
of t
he s
even
fiel
dcon
trol a
reas
has
bee
n su
peri
mpo
sed.
�
2 Objectiveandscope
Lineaments are line features or patterns on the earth’s surface, which may reflect geological structures or features related to a geological structure, such as a deformation zone, a dyke rock or an esker /8/. Lineaments can however also be the result of man-made structures such as transportation networks (roads, railroads, etc) or natural structures such as drainage networks. Lineaments can be observed as more or less linear features in different sets of spatial data. Such datasets could be aerial photographs, digital terrain models or geophysical maps.
Lineaments are identified in a new high-resolution digital terrain model produced from air-borne laser scanning (LIDAR) in this study. Previously identified lineaments in topographic data and geophysical data are re-evaluated and both new and re-evaluated lineaments are then controlled in field by means of geological observations. The field control is focused on revealing the connection between the studied lineament and its geological setting. Of special interest are signs of rock deformation, at different scales, that may be attributed to the lineament. The focus has been on lineaments shorter than 1 km, which can be caused by local minor deformation zones.
The final result of the present activity is gathered in GIS ESRI shape files. All found parameters connected to the specific lineament can easily be extracted from the shape files. The result of this activity will be delivered to SKB as shape files and presented in this report.

11
3 Equipment
3.1 DescriptionofequipmentThe desktop part of the study was peformed using the following software:• Erdas Imagine 8.6 image analysis software package.• ArcGIS 8 and 9.• MapInfo Professional 7.5 (MapInfo Corporation).• Discover 4.000 (Encom Technology).• Oasis Montaj 5.0 (Geosoft).• ArcView (Environmental Systems Research Institute Inc).
During field survey the following equipment was used:• IPAQ handheld computer.• Trimble Pathfinder GPS.• Geological hammer.• Geological compass with inclination needle.
The software PC Mapper and Discover Mobile 2.1 (Encom Technology) were used in the field computers to display maps and identified lineaments. It also displays the position as given by the GPS signal. The same software was also used to enter, edit and document structures found during the survey.
1�
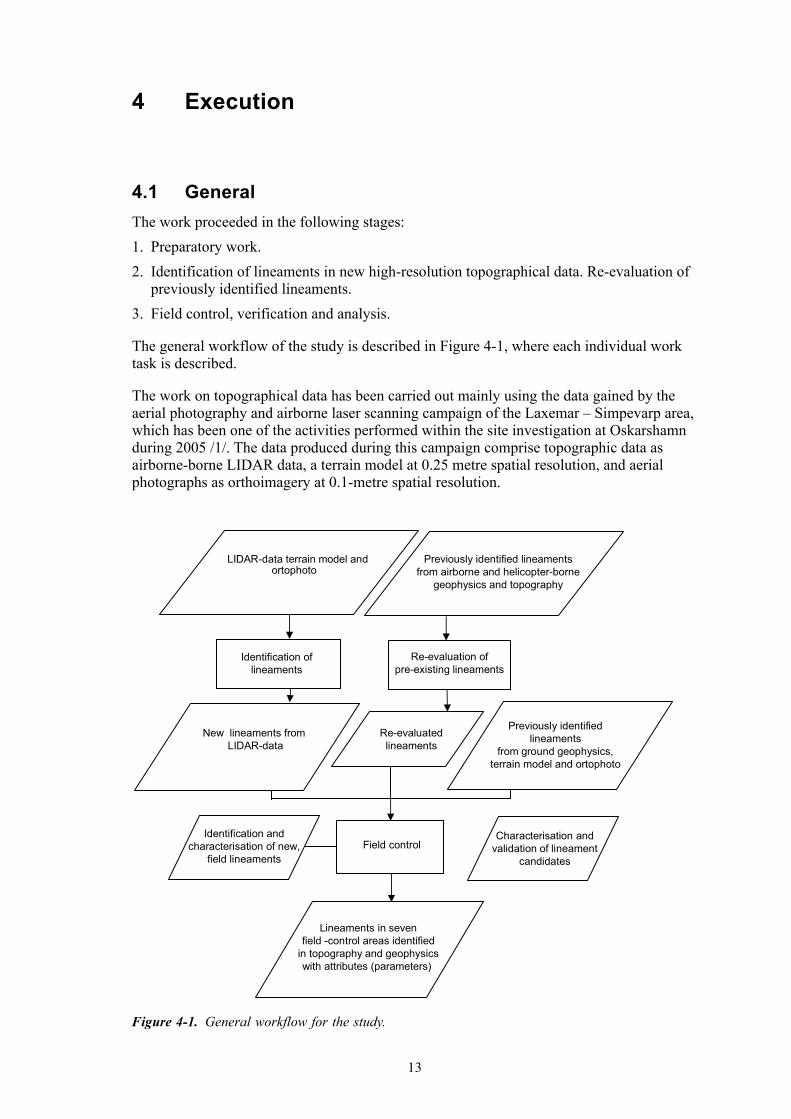
4 Execution
4.1 GeneralThe work proceeded in the following stages:1. Preparatory work.2. Identification of lineaments in new high-resolution topographical data. Re-evaluation of
previously identified lineaments.3. Field control, verification and analysis.
The general workflow of the study is described in Figure 4-1, where each individual work task is described.
The work on topographical data has been carried out mainly using the data gained by the aerial photography and airborne laser scanning campaign of the Laxemar – Simpevarp area, which has been one of the activities performed within the site investigation at Oskarshamn during 2005 /1/. The data produced during this campaign comprise topographic data as airborne-borne LIDAR data, a terrain model at 0.25 metre spatial resolution, and aerial photographs as orthoimagery at 0.1-metre spatial resolution.
Identification of lineaments
Field control
LIDAR-data terrain model and ortophoto
Re-evaluation of pre-existing lineaments
Characterisation and validation of lineament
candidates
Identification and characterisation of new,
field lineaments
Lineaments in seven field -control areas identified
in topography and geophysics with attributes (parameters)
Previously identified lineaments
from ground geophysics, terrain model and ortophoto
Previously identified lineaments from airborne and helicopter-borne
geophysics and topography
Re-evaluated lineaments
New lineaments from LIDAR-data
Figure 4‑1. General workflow for the study.
1�
All interpretations were carried out utilizing GIS software and techniques. The end product of each interpretation stage constitutes one or more GIS themes with accompanying attribute tables. The lineaments are stored in the themes as polylines having unique attributes stored in the table.
4.2 PreparatoryworkThe preparatory work can be divided into two phases; in the first phase lineaments from earlier method specific interpretations /2,3,4/ and joint interpretations /5,6/ were gathered together with base data and images used in the lineament identification/8,9/. The second phase and most cumbersome in the preparatory work, comprised data processing and map compilation of the new topographical data i.e. aerial photographs and digital terrain models based on laser scanning. Data processing was required to process raw data into a form that is more suitable for map compilation, and to enhance data. Several maps were compiled from the processed data to act as the basis for lineament identification.
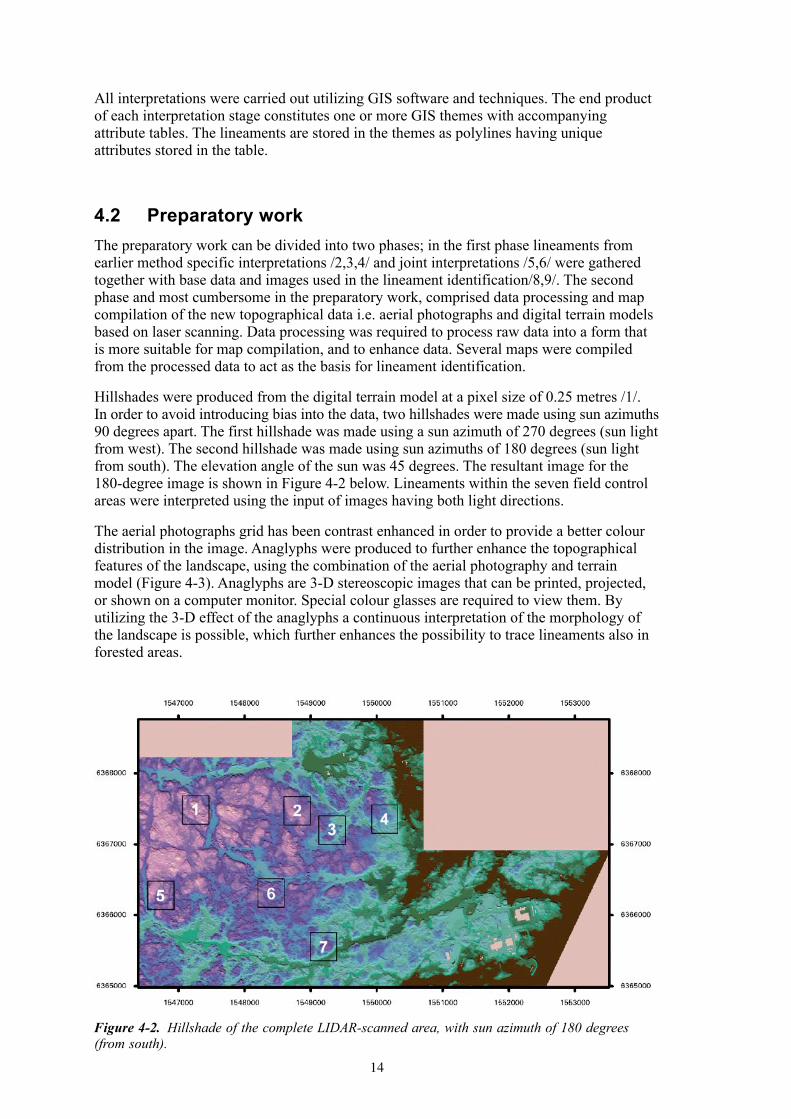
Hillshades were produced from the digital terrain model at a pixel size of 0.25 metres /1/. In order to avoid introducing bias into the data, two hillshades were made using sun azimuths 90 degrees apart. The first hillshade was made using a sun azimuth of 270 degrees (sun light from west). The second hillshade was made using sun azimuths of 180 degrees (sun light from south). The elevation angle of the sun was 45 degrees. The resultant image for the 180-degree image is shown in Figure 4-2 below. Lineaments within the seven field control areas were interpreted using the input of images having both light directions.
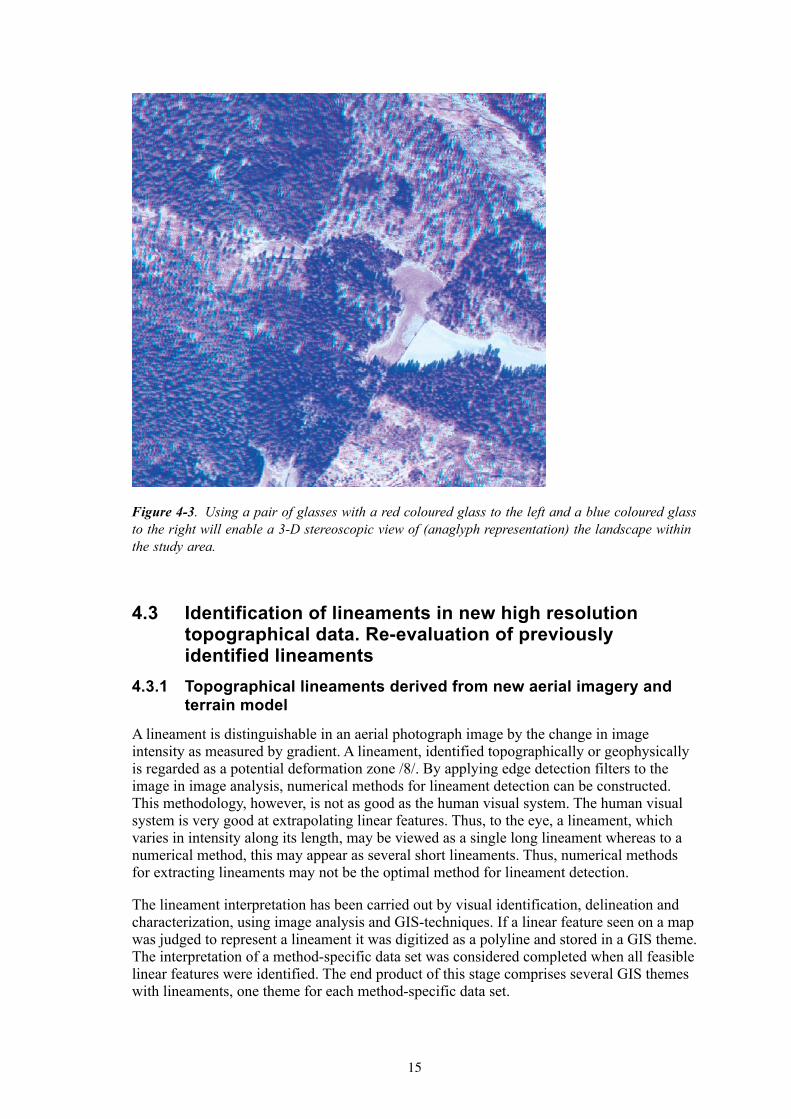
The aerial photographs grid has been contrast enhanced in order to provide a better colour distribution in the image. Anaglyphs were produced to further enhance the topographical features of the landscape, using the combination of the aerial photography and terrain model (Figure 4-3). Anaglyphs are 3-D stereoscopic images that can be printed, projected, or shown on a computer monitor. Special colour glasses are required to view them. By utilizing the 3-D effect of the anaglyphs a continuous interpretation of the morphology of the landscape is possible, which further enhances the possibility to trace lineaments also in forested areas.
Figure 4‑2. Hillshade of the complete LIDAR-scanned area, with sun azimuth of 180 degrees (from south).
1�
Figure 4‑3. Using a pair of glasses with a red coloured glass to the left and a blue coloured glass to the right will enable a 3-D stereoscopic view of (anaglyph representation) the landscape within the study area.
4.3 Identificationoflineamentsinnewhighresolutiontopographicaldata.Re‑evaluationofpreviouslyidentifiedlineaments
4.3.1 Topographicallineamentsderivedfromnewaerialimageryandterrainmodel
A lineament is distinguishable in an aerial photograph image by the change in image intensity as measured by gradient. A lineament, identified topographically or geophysically is regarded as a potential deformation zone /8/. By applying edge detection filters to the image in image analysis, numerical methods for lineament detection can be constructed. This methodology, however, is not as good as the human visual system. The human visual system is very good at extrapolating linear features. Thus, to the eye, a lineament, which varies in intensity along its length, may be viewed as a single long lineament whereas to a numerical method, this may appear as several short lineaments. Thus, numerical methods for extracting lineaments may not be the optimal method for lineament detection.
The lineament interpretation has been carried out by visual identification, delineation and characterization, using image analysis and GIS-techniques. If a linear feature seen on a map was judged to represent a lineament it was digitized as a polyline and stored in a GIS theme. The interpretation of a method-specific data set was considered completed when all feasible linear features were identified. The end product of this stage comprises several GIS themes with lineaments, one theme for each method-specific data set.
16
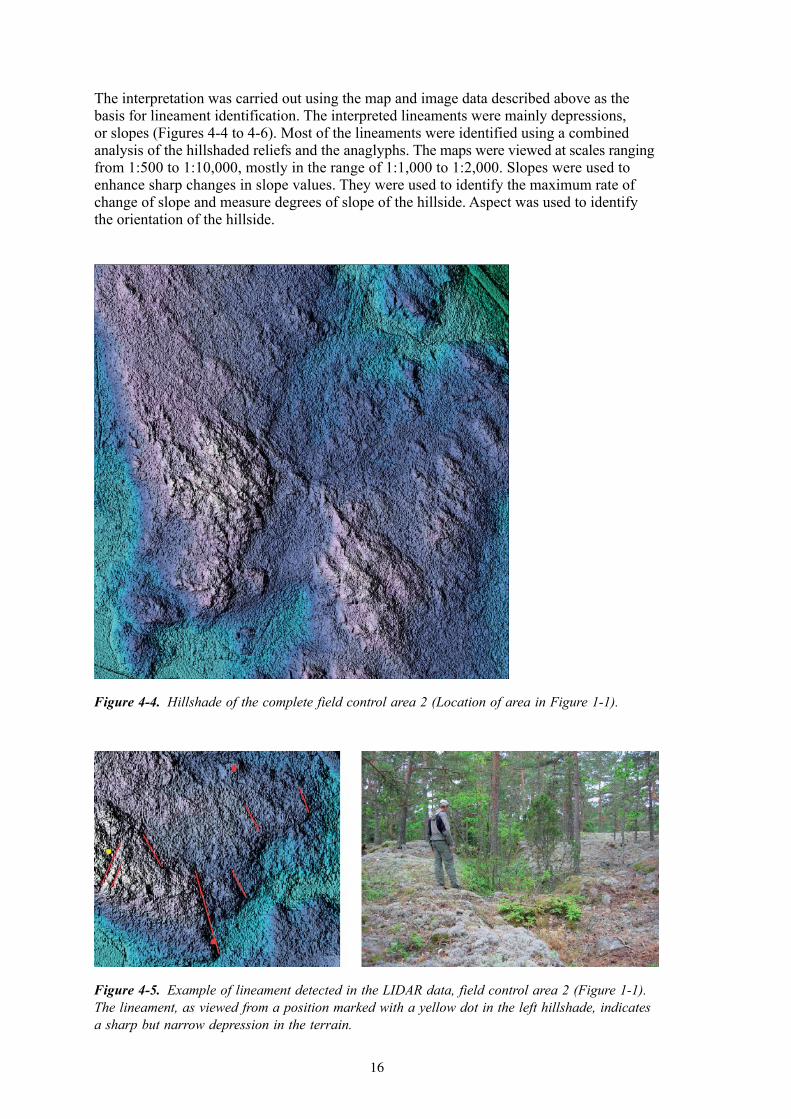
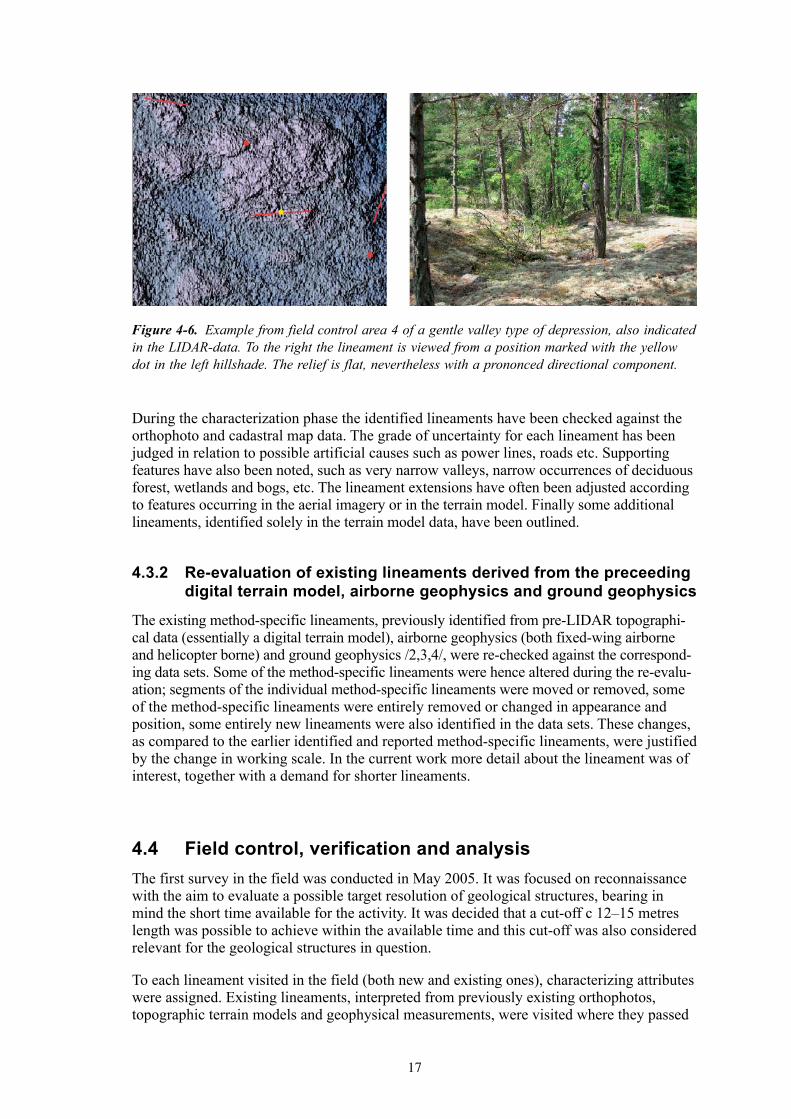
The interpretation was carried out using the map and image data described above as the basis for lineament identification. The interpreted lineaments were mainly depressions, or slopes (Figures 4-4 to 4-6). Most of the lineaments were identified using a combined analysis of the hillshaded reliefs and the anaglyphs. The maps were viewed at scales ranging from 1:500 to 1:10,000, mostly in the range of 1:1,000 to 1:2,000. Slopes were used to enhance sharp changes in slope values. They were used to identify the maximum rate of change of slope and measure degrees of slope of the hillside. Aspect was used to identify the orientation of the hillside.
Figure 4‑4. Hillshade of the complete field control area 2 (Location of area in Figure 1-1).
Figure 4‑5. Example of lineament detected in the LIDAR data, field control area 2 (Figure 1-1). The lineament, as viewed from a position marked with a yellow dot in the left hillshade, indicates a sharp but narrow depression in the terrain.
1�
During the characterization phase the identified lineaments have been checked against the orthophoto and cadastral map data. The grade of uncertainty for each lineament has been judged in relation to possible artificial causes such as power lines, roads etc. Supporting features have also been noted, such as very narrow valleys, narrow occurrences of deciduous forest, wetlands and bogs, etc. The lineament extensions have often been adjusted according to features occurring in the aerial imagery or in the terrain model. Finally some additional lineaments, identified solely in the terrain model data, have been outlined.
4.3.2 Re‑evaluationofexistinglineamentsderivedfromthepreceedingdigitalterrainmodel,airbornegeophysicsandgroundgeophysics
The existing method-specific lineaments, previously identified from pre-LIDAR topographi-cal data (essentially a digital terrain model), airborne geophysics (both fixed-wing airborne and helicopter borne) and ground geophysics /2,3,4/, were re-checked against the correspond-ing data sets. Some of the method-specific lineaments were hence altered during the re-evalu-ation; segments of the individual method-specific lineaments were moved or removed, some of the method-specific lineaments were entirely removed or changed in appearance and position, some entirely new lineaments were also identified in the data sets. These changes, as compared to the earlier identified and reported method-specific lineaments, were justified by the change in working scale. In the current work more detail about the lineament was of interest, together with a demand for shorter lineaments.
4.4 Fieldcontrol,verificationandanalysisThe first survey in the field was conducted in May 2005. It was focused on reconnaissance with the aim to evaluate a possible target resolution of geological structures, bearing in mind the short time available for the activity. It was decided that a cut-off c 12–15 metres length was possible to achieve within the available time and this cut-off was also considered relevant for the geological structures in question.
To each lineament visited in the field (both new and existing ones), characterizing attributes were assigned. Existing lineaments, interpreted from previously existing orthophotos, topographic terrain models and geophysical measurements, were visited where they passed
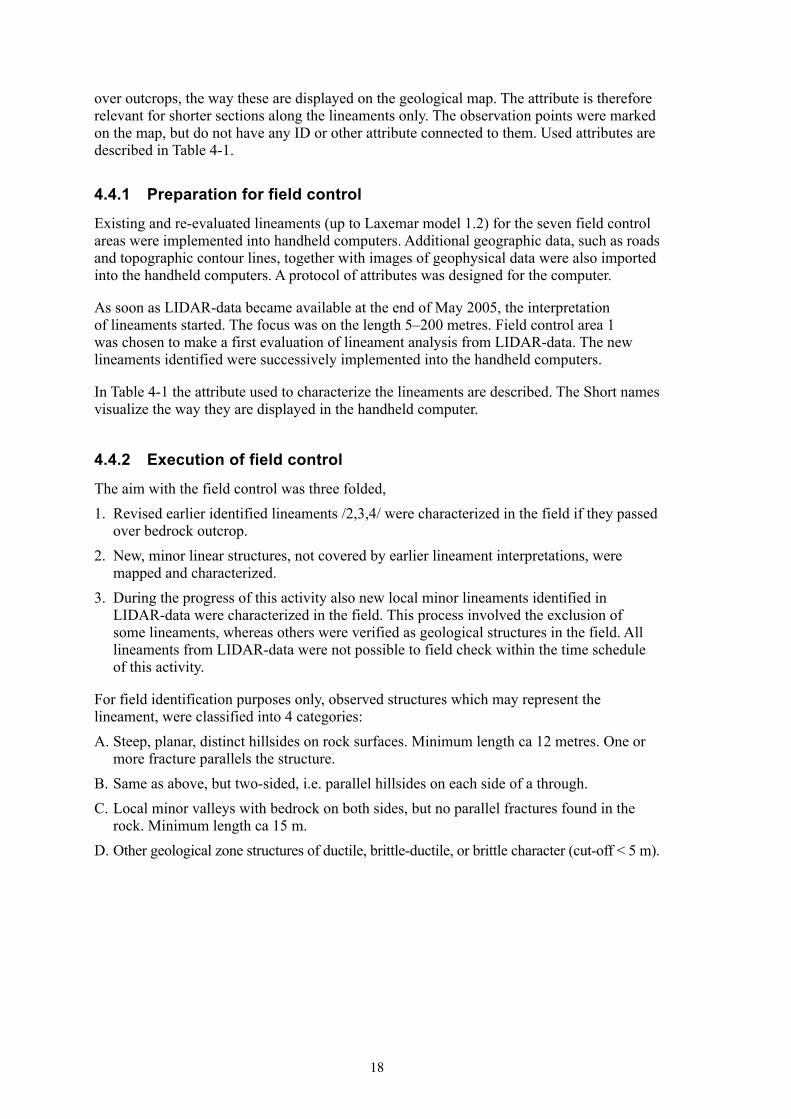
Figure 4‑6. Example from field control area 4 of a gentle valley type of depression, also indicated in the LIDAR-data. To the right the lineament is viewed from a position marked with the yellow dot in the left hillshade. The relief is flat, nevertheless with a prononced directional component.
1�
over outcrops, the way these are displayed on the geological map. The attribute is therefore relevant for shorter sections along the lineaments only. The observation points were marked on the map, but do not have any ID or other attribute connected to them. Used attributes are described in Table 4-1.
4.4.1 Preparationforfieldcontrol
Existing and re-evaluated lineaments (up to Laxemar model 1.2) for the seven field control areas were implemented into handheld computers. Additional geographic data, such as roads and topographic contour lines, together with images of geophysical data were also imported into the handheld computers. A protocol of attributes was designed for the computer.
As soon as LIDAR-data became available at the end of May 2005, the interpretation of lineaments started. The focus was on the length 5–200 metres. Field control area 1 was chosen to make a first evaluation of lineament analysis from LIDAR-data. The new lineaments identified were successively implemented into the handheld computers.
In Table 4-1 the attribute used to characterize the lineaments are described. The Short names visualize the way they are displayed in the handheld computer.
4.4.2 Executionoffieldcontrol
The aim with the field control was three folded,1. Revised earlier identified lineaments /2,3,4/ were characterized in the field if they passed
over bedrock outcrop.2. New, minor linear structures, not covered by earlier lineament interpretations, were
mapped and characterized.3. During the progress of this activity also new local minor lineaments identified in
LIDAR-data were characterized in the field. This process involved the exclusion of some lineaments, whereas others were verified as geological structures in the field. All lineaments from LIDAR-data were not possible to field check within the time schedule of this activity.
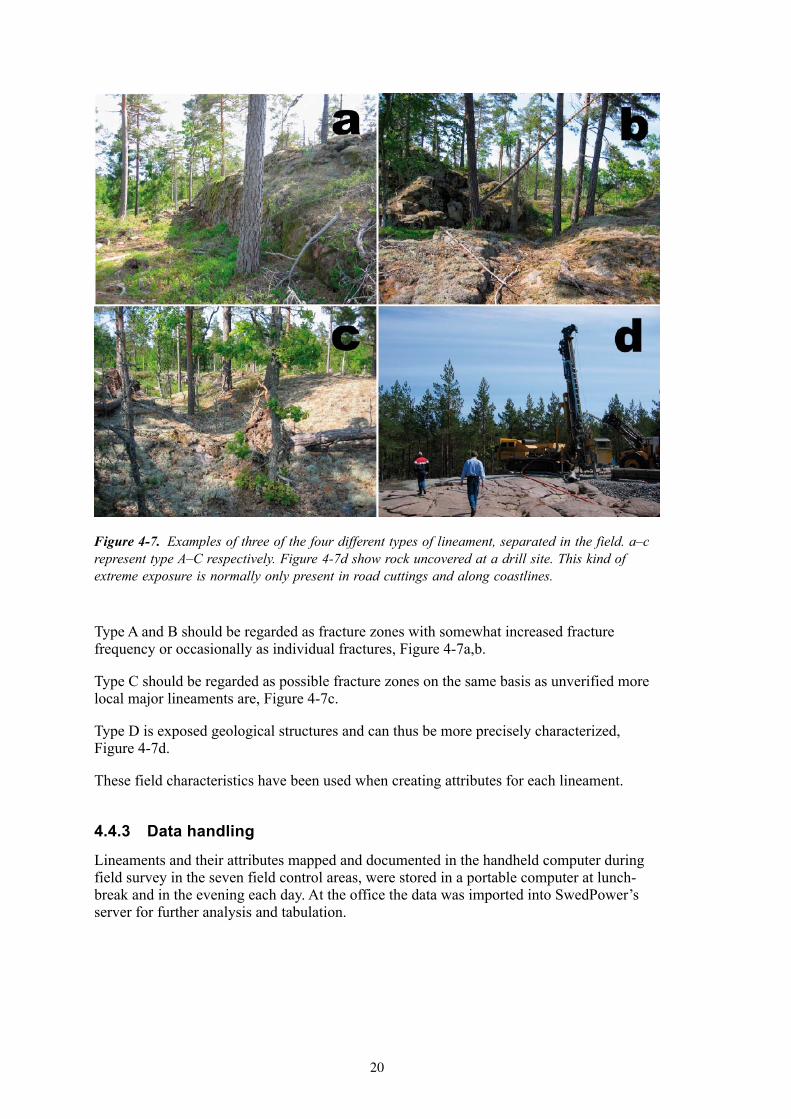
For field identification purposes only, observed structures which may represent the lineament, were classified into 4 categories:A. Steep, planar, distinct hillsides on rock surfaces. Minimum length ca 12 metres. One or
more fracture parallels the structure.B. Same as above, but two-sided, i.e. parallel hillsides on each side of a through.C. Local minor valleys with bedrock on both sides, but no parallel fractures found in the
rock. Minimum length ca 15 m. D. Other geological zone structures of ductile, brittle-ductile, or brittle character (cut-off < 5 m).
1�
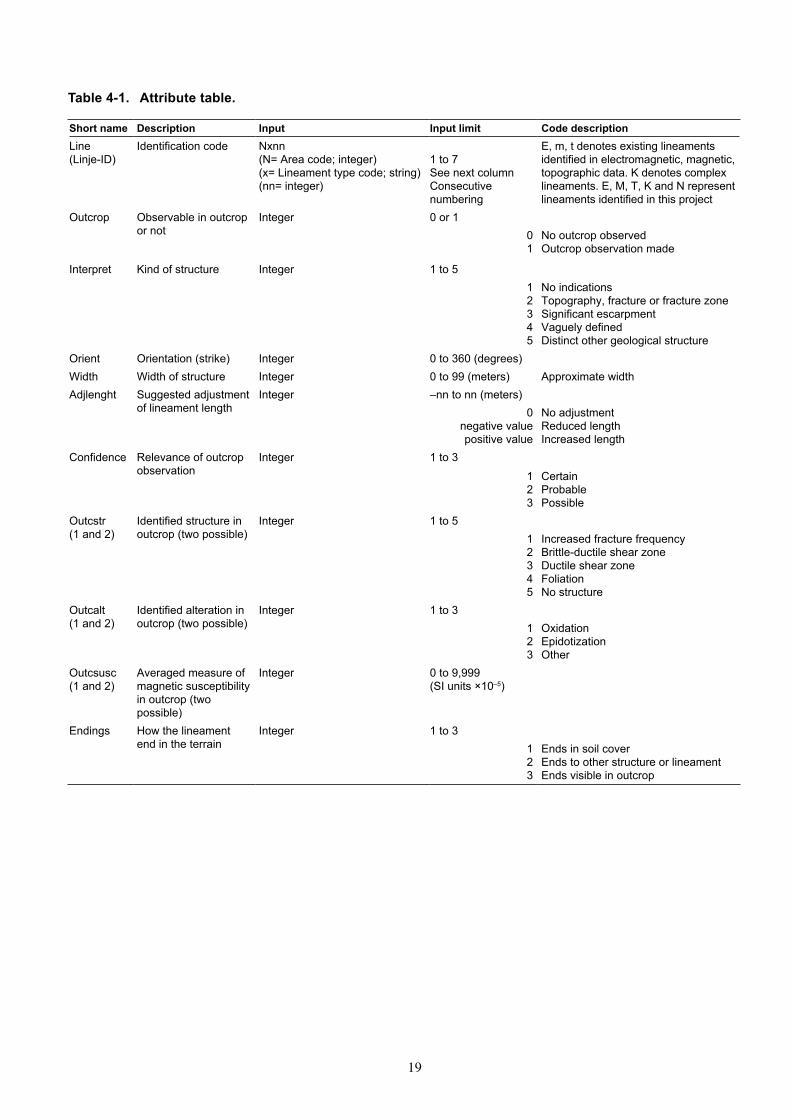
Table4‑1. Attributetable.
Shortname Description Input Inputlimit CodedescriptionLine (Linje-ID)
Identification code Nxnn (N= Area code; integer) (x= Lineament type code; string) (nn= integer)
1 to 7 See next column Consecutive numbering
E, m, t denotes existing lineaments identified in electromagnetic, magnetic, topographic data. K denotes complex lineaments. E, M, T, K and N represent lineaments identified in this project
Outcrop Observable in outcrop or not
Integer 0 or 10 1
No outcrop observed Outcrop observation made
Interpret Kind of structure Integer 1 to 51 2 3 4 5
No indications Topography, fracture or fracture zone Significant escarpment Vaguely defined Distinct other geological structure
Orient Orientation (strike) Integer 0 to 360 (degrees)Width Width of structure Integer 0 to 99 (meters) Approximate widthAdjlenght Suggested adjustment
of lineament lengthInteger –nn to nn (meters)
0 negative value positive value
No adjustment Reduced length Increased length
Confidence Relevance of outcrop observation
Integer 1 to 3
1 2 3
Certain Probable Possible
Outcstr (1 and 2)
Identified structure in outcrop (two possible)
Integer 1 to 51 2 3 4 5
Increased fracture frequency Brittle-ductile shear zone Ductile shear zone Foliation No structure
Outcalt (1 and 2)
Identified alteration in outcrop (two possible)
Integer 1 to 31 2 3
Oxidation Epidotization Other
Outcsusc (1 and 2)
Averaged measure of magnetic susceptibility in outcrop (two possible)
Integer 0 to 9,999 (SI units ×10–5)
Endings How the lineament end in the terrain
Integer 1 to 31 2 3
Ends in soil cover Ends to other structure or lineament Ends visible in outcrop
20
Type A and B should be regarded as fracture zones with somewhat increased fracture frequency or occasionally as individual fractures, Figure 4-7a,b.
Type C should be regarded as possible fracture zones on the same basis as unverified more local major lineaments are, Figure 4-7c.
Type D is exposed geological structures and can thus be more precisely characterized, Figure 4-7d.
These field characteristics have been used when creating attributes for each lineament.
4.4.3 Datahandling
Lineaments and their attributes mapped and documented in the handheld computer during field survey in the seven field control areas, were stored in a portable computer at lunch-break and in the evening each day. At the office the data was imported into SwedPower’s server for further analysis and tabulation.
Figure 4‑7. Examples of three of the four different types of lineament, separated in the field. a–c represent type A–C respectively. Figure 4-7d show rock uncovered at a drill site. This kind of extreme exposure is normally only present in road cuttings and along coastlines.
21
4.4.4 Analysisandinterpretation
In topographically high elevation parts of the investigated areas the frequency of exposed bedrock is rather high and approximates to ca 10–20% of the surface. In these areas not only individual fractures, but also fracture zones and other deformation zones are sometimes exposed and can be studied. Often faults and structures in the bedrock have caused the surface to break up. As a result, escarpments, steep hillsides, cliffs and that alike have been formed in the terrain.
When looking for deformation zones in the bedrock thus, major gradients in the topography are of interest. Steep, straight hillsides in the bedrock most often represent a fracture zone of some kind. Some steep hillsides may represent a single fracture plane, or fractures lying en echelon, but normally there are several sub-parallel fractures along the structure. Depending on what definition is used this kind of structure may represent a fracture zone or a zone of increased fracturing.
Lineaments found explicitly in LIDAR-data are delivered as new “field”-lineament if verified in the field. Attributes have been attached according to Table 4-1, but are also tabulated in Appendix 1 to this report.
4.4.5 Nonconformities
Larger deformation zones are generally more likely to be located in lower terrain, such as valleys, where they cannot be studied without larger effort. Most lineaments from previous studies and from LIDAR-data preferentially run along valleys and these parts have therefore not been characterized along such section in the field. Only at locations where valleys become narrow and where lineaments run over topographically higher areas relevant outcrops may be found.
In the title of the activity plan corresponding to the present activity the expression “joint interpretation” is mentioned. In order not to cause any misunderstanding the use of the expression has been avoided here, since no joint interpretation in the meaning stated earlier /6/ has been carried out within the present activity.
Existing lineaments lacking attributes from this study (Appendix 1) have not been visited in the field.
2�
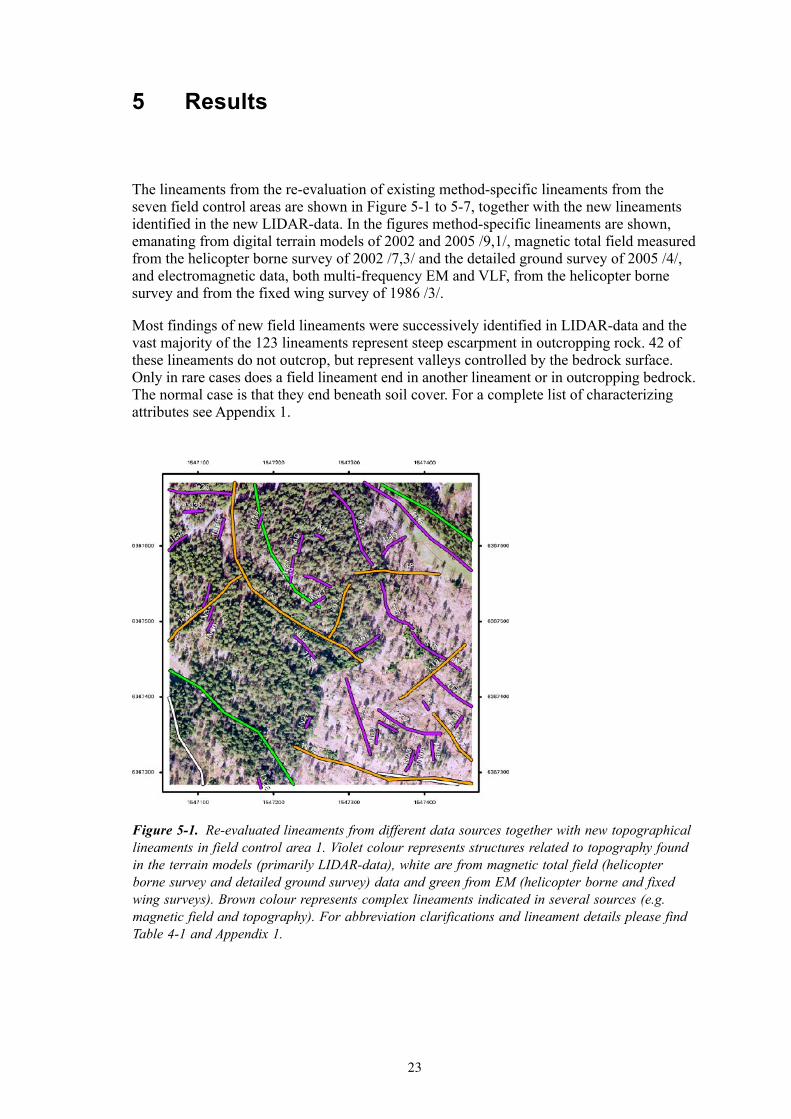
5 Results
The lineaments from the re-evaluation of existing method-specific lineaments from the seven field control areas are shown in Figure 5-1 to 5-7, together with the new lineaments identified in the new LIDAR-data. In the figures method-specific lineaments are shown, emanating from digital terrain models of 2002 and 2005 /9,1/, magnetic total field measured from the helicopter borne survey of 2002 /7,3/ and the detailed ground survey of 2005 /4/, and electromagnetic data, both multi-frequency EM and VLF, from the helicopter borne survey and from the fixed wing survey of 1986 /3/.
Most findings of new field lineaments were successively identified in LIDAR-data and the vast majority of the 123 lineaments represent steep escarpment in outcropping rock. 42 of these lineaments do not outcrop, but represent valleys controlled by the bedrock surface. Only in rare cases does a field lineament end in another lineament or in outcropping bedrock. The normal case is that they end beneath soil cover. For a complete list of characterizing attributes see Appendix 1.
Figure 5‑1. Re-evaluated lineaments from different data sources together with new topographical lineaments in field control area 1. Violet colour represents structures related to topography found in the terrain models (primarily LIDAR-data), white are from magnetic total field (helicopter borne survey and detailed ground survey) data and green from EM (helicopter borne and fixed wing surveys). Brown colour represents complex lineaments indicated in several sources (e.g. magnetic field and topography). For abbreviation clarifications and lineament details please find Table 4-1 and Appendix 1.
2�
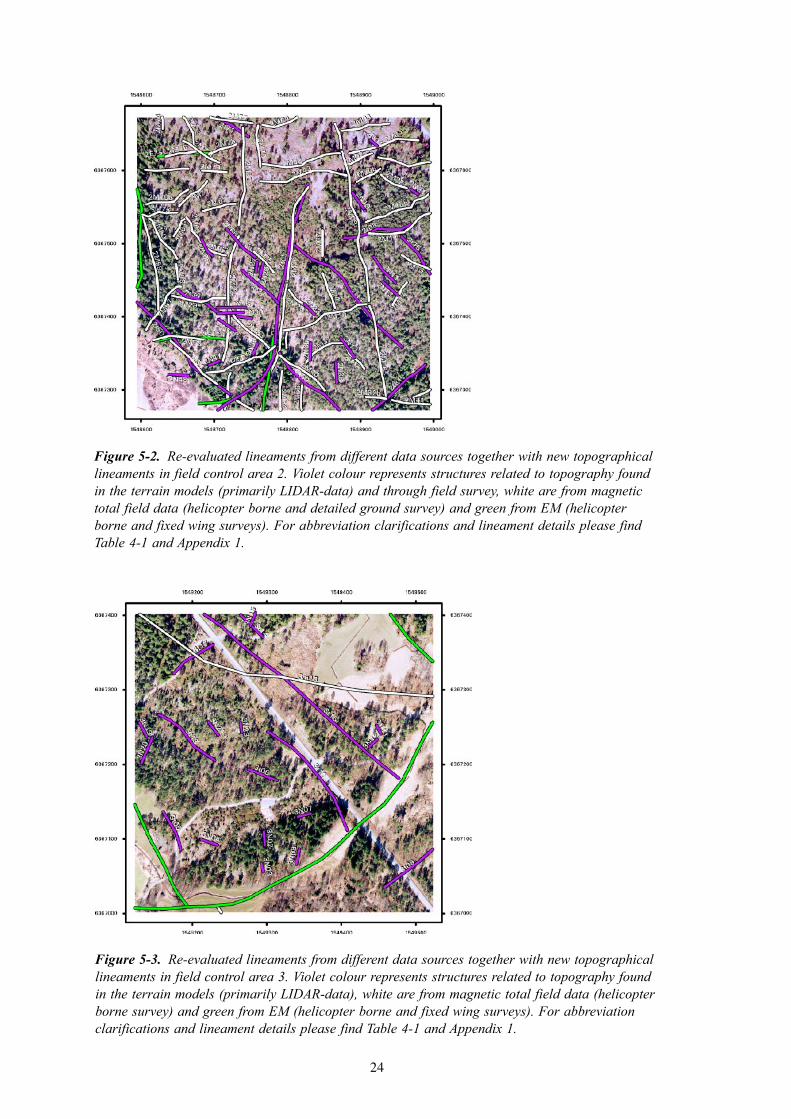
Figure 5‑2. Re-evaluated lineaments from different data sources together with new topographical lineaments in field control area 2. Violet colour represents structures related to topography found in the terrain models (primarily LIDAR-data) and through field survey, white are from magnetic total field data (helicopter borne and detailed ground survey) and green from EM (helicopter borne and fixed wing surveys). For abbreviation clarifications and lineament details please find Table 4-1 and Appendix 1.
Figure 5‑3. Re-evaluated lineaments from different data sources together with new topographical lineaments in field control area 3. Violet colour represents structures related to topography found in the terrain models (primarily LIDAR-data), white are from magnetic total field data (helicopter borne survey) and green from EM (helicopter borne and fixed wing surveys). For abbreviation clarifications and lineament details please find Table 4-1 and Appendix 1.
2�
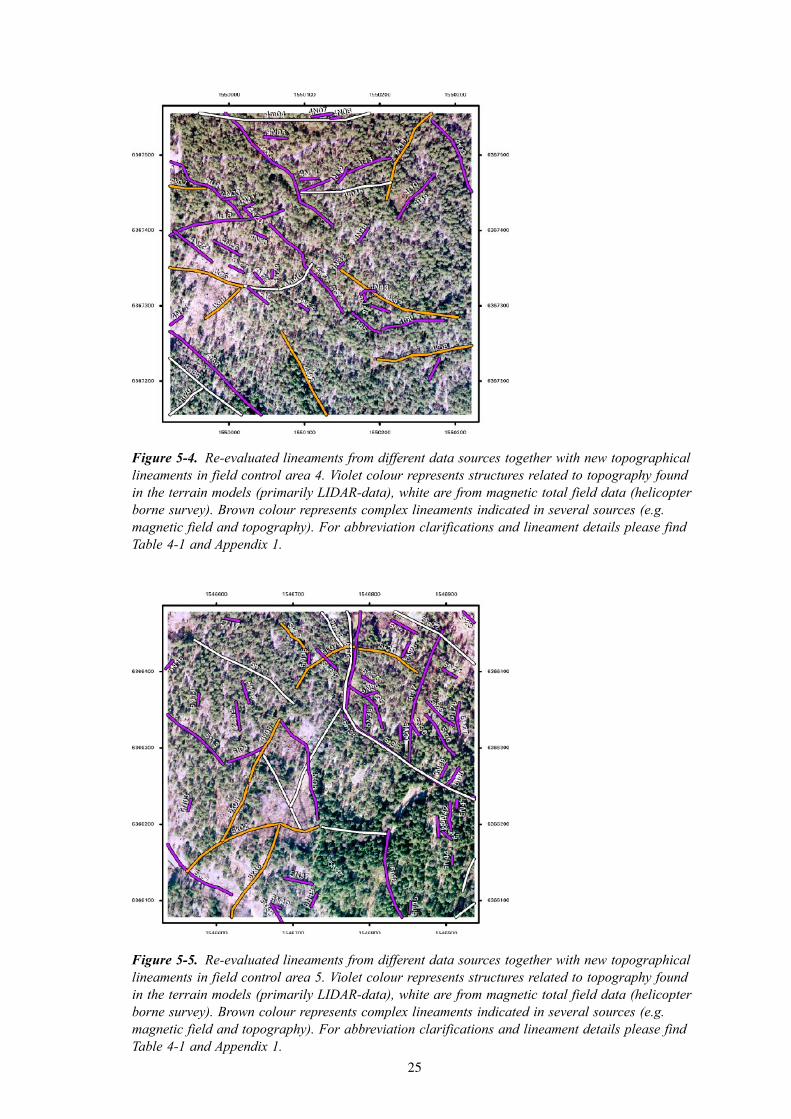
Figure 5‑4. Re-evaluated lineaments from different data sources together with new topographical lineaments in field control area 4. Violet colour represents structures related to topography found in the terrain models (primarily LIDAR-data), white are from magnetic total field data (helicopter borne survey). Brown colour represents complex lineaments indicated in several sources (e.g. magnetic field and topography). For abbreviation clarifications and lineament details please find Table 4-1 and Appendix 1.
Figure 5‑5. Re-evaluated lineaments from different data sources together with new topographical lineaments in field control area 5. Violet colour represents structures related to topography found in the terrain models (primarily LIDAR-data), white are from magnetic total field data (helicopter borne survey). Brown colour represents complex lineaments indicated in several sources (e.g. magnetic field and topography). For abbreviation clarifications and lineament details please find Table 4-1 and Appendix 1.
26
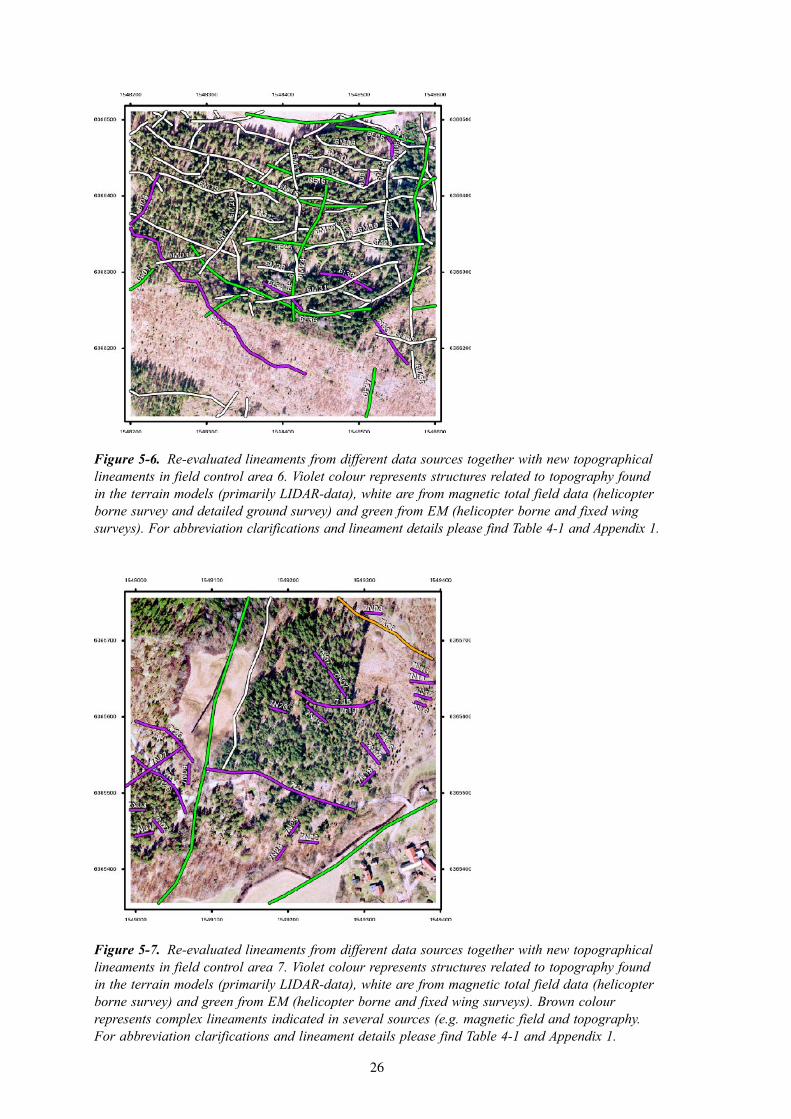
Figure 5‑6. Re-evaluated lineaments from different data sources together with new topographical lineaments in field control area 6. Violet colour represents structures related to topography found in the terrain models (primarily LIDAR-data), white are from magnetic total field data (helicopter borne survey and detailed ground survey) and green from EM (helicopter borne and fixed wing surveys). For abbreviation clarifications and lineament details please find Table 4-1 and Appendix 1.
Figure 5‑7. Re-evaluated lineaments from different data sources together with new topographical lineaments in field control area 7. Violet colour represents structures related to topography found in the terrain models (primarily LIDAR-data), white are from magnetic total field data (helicopter borne survey) and green from EM (helicopter borne and fixed wing surveys). Brown colour represents complex lineaments indicated in several sources (e.g. magnetic field and topography. For abbreviation clarifications and lineament details please find Table 4-1 and Appendix 1.
2�
In Table 5-1 the number of new local minor lineaments (typically a length shorter than 20–30 metres) identified in LIDAR-data and in the field are shown. However, it should be kept in mind that even though each area is of the same size, 400 × 400 m, the amount of outcropping bedrock differs significantly.
The field control of re-evaluated method-specific lineaments from interpretation of airborne electromagnetic data (both helicopter borne and fixed wing borne) has shown that about 50% of the controlled lineaments, may directly be related to deformation in the bedrock, manifested in topography, escarpments, or as fracture zones in outcrops.
Lineaments identified in magnetic data were controlled in field at 84 locations. Approximately 65% of the magnetic lineaments are related to a direct observation of low relative magnetic susceptibility and/or observed deformation in outcrops and/or structural elements in morphology.
Table 5-2 summarises the different kind of lineaments that has been dealt with in this activity, what source they derive from and the outcome related to the lineaments from this work.
Table5‑1. Thenumberoffieldverifiedlocalminorlineamentsperfieldcontrolarea.SeealsoFigures5‑1to5‑7.
Studyarea 1 2 3 4 5 6 7
Number of lineaments 20 19 12 21 28 3 20
Table5‑2. Summaryoflineamentdataforfieldverification.SeealsoFigures5‑1to5‑7.
Lineamenttype Inputdata Outputinthisstudy Fieldcontrolled
Large scale topographic DTM /9/ Re-evaluated lineaments Only partly
Electromagnetic Control area 1, 3, 4, 5 and 7
Helicopter /3,7/ Re-evaluated lineaments On outcrops
Electromagnetic Control area 2 and 6
Ground survey /4/ Detailed lineaments On outcrops
Magnetic Control area 1, 3, 4, 5 and 7
Helicopter /3,7/ Re-evaluated lineaments On outcrops
Magnetic Control area 2 and 6
Ground survey /4/ Detailed lineaments On outcrops
Small scale topographic LIDAR-data /1/ Small scale lineaments (length 10–200 m)
Partly
Morphological Orthophoto /1,5/ Partly
Field defined Field reconnaissance Yes
2�
6 Discussion
The assignment of attributes from the field characteristics was done where relevant obser-vations were possible to make. For new, local minor lineaments recognized in the field, obviously, the character was described by means of the attributes. Other lineaments, derived from interpretation of topographic and geophysical data, were characterized if they passed over, or close to outcropping bedrock. Lineaments not related to outcropping valleys, for example in flat-lying soil-covered areas, have not been characterized in the field. Note, that the outcrop pattern as it appears on the geological map includes thin soil cover. Also a few lineaments running along valleys were characterized, especially where they run close to outcropping bedrock.
In field control areas 2 and 6 the number of lineaments from magnetic data is higher than elsewhere. Furthermore, the number of short lineaments is higher as compared to the other areas. A major reason to this is that these areas are covered by the detailed ground geophysical survey from which the increased number of lineaments as well as the short length is emanating /4/. Other factors that cause large differences in the frequency of especially shorter lineaments are the topographic relief and the percentage of outcrop bedrock.
There is a general experience from extensive fieldwork in the Laxemar and Simpevarp areas that the magnetic susceptibility could be rather low without any visible coupling to deformed rock. Some of these low values in magnetic susceptibility surely can be attributed to primary variations in magnetite content of rocks. It is however strongly suspected that low magnetic susceptibilities at many locations are a sign of secondary metamorphic or hydrothermal changes in the rock and indirectly to fracturing. A study to clarify uncertain-ties in this hypothesis could be a task for future work.
From this limited study it can be concluded that in field control area 2 and 6 a more comprehensive joint interpretation would be possible, since both LIDAR-data, ortophotos and ground geophysical data are present. In general, the interpretation of lineaments followed by field assessment has shown to be an appropriate approach to locate and characterize minor deformation zones, but also to discriminate such structures from other geological features.
�1
7 References
/1/ NyborgM,2005. Oskarshamn site investigation. Aerial photography and airborne laser scanning Laxemar – Simpevarp. The 2005 campaign. SKB P-05-223. Svensk Kärnbränslehantering AB.
/2/ TriumfC-A,2003. Oskarshamn site investigation. Identification of lineaments in the Simpevarp area by the interpretation of topographical data. SKB P-03-99. Svensk Kärnbränslehantering AB.
/3/ TriumfC-A,ThunehedH,KeroL,PerssonL,2003. Oskarshamn site investigation. Interpretation of airborne geophysical data. Helicopterborne survey data of gamma spectrometry, magnetics and EM from 2002 and fixed wing airborne survey data of the VLF-field from 1986. SKB P-03-100. Svensk Kärnbränslehantering AB.
/4/ ThunehedH,TriumfC-A,2005. Oskarshamn site investigation. Detailed ground geophysical survey at Laxemar. Magnetic total field and resistivity. SKB P-05-188. Svensk Kärnbränslehantering AB.
/5/ TriumfC-A,2004. Oskarshamn site investigation. Joint interpretation of lineaments in the eastern part of the site descriptive model area. SKB P-04-37. Svensk Kärnbränslehantering AB.
/6/ TriumfC-A,2004. Oskarshamn site investigation. Joint interpretation of lineaments. SKB P-03-99. Svensk Kärnbränslehantering AB.
/7/ RönningJHS,KihleO,MogaardJO,WalkerP,2003. Simpevarp site investiga-tion. Helicopter borne geophysics at Simpevarp, Oskarshamn, Sweden. SKB P-03-25. Svensk Kärnbränslehantering AB.
/8/ MunierR,StenbergL,StanforsR,MilnesAG,HermanssonJ,TriumfC-A,2003. Geological Site Descriptive Model. A strategy for the model developmentduring site investigations. SKB R-03-07. Svensk Kärnbränslehantering AB.
/9/ WiklundS,2002. Digitala ortofoton och höjdmodeller. Redovisning av metodik för platsundersökningsområdena Oskarshamn och Forsmark samt förstudieområdet Tierp Norra. SKB P-02-02. Svensk Kärnbränslehantering AB.
��
App
endi
x1
List
ofc
hara
cter
ized
topo
grap
hica
llin
eam
ents
(for
geo
grap
hica
lloc
atio
npl
ease
find
Fig
ures
5‑1
to5
‑7)
LIN
EO
UTC
RO
PIN
TER
PRET
OR
IEN
TW
IDTH
AD
JLEN
GTH
CO
NFI
DEN
CE
OU
TCST
R1
OU
TCA
LT1
OU
TCSU
SC1
OU
TCST
R2
OU
TCA
LT2
OU
TCSU
SC2
END
ING
S1t
171
4
21
12,
000
1t18
01
1t
221
4
3
1,
200
1t24
02
20
1t
341
1
1t36
01
1t
460
1t47
14
1t
491
4
2
120
0
1t
540
1t55
0
2t
050
4
2t08
14
2t
140
2
2t15
02
2t
271
2
2t31
04
2t
341
4
2t39
14
2t
500
2
2t71
04
3t
050
4
3t06
03
3t
090
4
3t10
04
3t
140
4
3t16
14
3t
170
1
3t18
02
4t
010
4
��
4t05
14
4t
091
4
4t10
11
4t
130
4
4t17
13
4t
180
4
4t30
02
4t
361
4
4t55
13
4t
560
2
4t68
02
5t
010
2
5t04
02
5t
060
2
5t13
04
5t
190
2
5t23
04
5t
280
4
5t29
04
5t
321
2
5t35
04
2,50
0
5t
370
2
5t40
13
5t
460
4
6t02
04
6t
041
4
6t33
03
6t
341
3
6t39
02
7t
040
4
7t15
04
7t
190
2
7t21
12
125
21
11,
000
7t25
12
7t
261
4
��
List
ofc
hara
cter
ized
com
plex
line
amen
ts(f
org
eogr
aphi
call
ocat
ion
plea
sefi
ndF
igur
es5
‑1to
5‑7
)
LIN
EO
UTC
RO
PIN
TER
PRET
OR
IEN
TW
IDTH
AD
JLEN
GTH
CO
NFI
DEN
CE
OU
TCST
R1
OU
TCA
LT1
OU
TCSU
SC1
OU
TCST
R2
OU
TCA
LT2
OU
TCSU
SC2
END
ING
S1k
021
5
10
2
1
1
1k07
12
2
51
1k
191
4
25
60
01
140
0
1k32
14
2
11
500
1k48
12
2
900
1k50
02
1k
531
2
3
60
0
4k
020
1
4k11
04
4k
251
3
21
130
0
4k
420
2
4k48
14
2,00
0
4k
580
2
4k62
02
5k
021
2
2
2,
000
5k05
12
2
2,00
0
5k
060
2
5k07
04
5k
091
4
2
1,
500
5k20
02
5k
361
4
50
0
7k
091
2
2
15
0
�6
List
ofc
hara
cter
ized
mag
netic
alli
neam
ents
(for
geo
grap
hica
lloc
atio
npl
ease
find
Fig
ures
5‑1
to5
‑7)
LIN
EO
UTC
RO
PIN
TER
PRET
OR
IEN
TW
IDTH
AD
JLEN
GTH
CO
NFI
DEN
CE
OU
TCST
R1
OU
TCA
LT1
OU
TCSU
SC1
OU
TCST
R2
OU
TCA
LT2
OU
TCSU
SC2
END
ING
S2M
011
2
12
160
2M02
11
3
51
400
2M03
12
2
11
200
2M06
04
2M
070
1
2M09
14
3
5
80
10
0
2M12
01
2M
131
1
2M16
15
2
2
31
700
2M17
11
3
5
50
2M
181
2
3
60
0
2M
18b
14
3
600
2M19
14
3
5
1,50
0
2M
200
1
2M20
b0
1
2M22
11
3
200
2M24
04
2M
250
2
2M29
12
2
11
701
110
0
2M32
15
2
2
21
50
2M
32b
01
2M
330
2
2M37
11
3
5
2M
400
2
2M41
11
3
2,00
0
2M
430
1
2M44
02
2M
510
2
2M52
04
��
2M53
02
2M
540
3
2M55
02
2M
570
2
2M58
12
3
5
1,50
0
2M
591
3
15
3
1,
000
2M60
14
2M
610
4
2M62
12
3
150
2M63
12
3
1,50
0
2M
670
4
2M69
04
2M
700
2
2M72
02
3
2,00
0
2M
730
4
2M74
02
2M
751
1
3
1,
500
2M76
01
2M
76b
11
3
2,00
0
2M
771
1
2M77
b0
1
2M78
02
2M
790
1
2M80
11
3m
131
30
0
4m
041
5
10
0
40
0
4m15
11
500
4m46
14
700
4m68
11
1,00
0
4m
701
3
10
0
5m
111
1
2
1,
500
��
5m18
11
1,00
0
5m
221
4
2,
000
1,50
0
5m38
1
1,50
0
6M
031
4
35
11,
500
6M09
02
6M
101
2
2
21
160
0
2,
000
116M
121
3
31
140
0
6M
141
3
21
150
0
6M
171
3
31
1,
500
6M18
14
1
200
6M19
14
2
1
400
6M20
04
6M
210
1
6M22
01
6M
231
4
3
50
0
6M
241
3
32
2,
500
6M26
14
3
1
1,50
0
6M
281
4
3
150
0
6M
290
1
6M30
01
6M
311
3
2
110
11
50
6M32
13
2
11
150
6M38
14
3
5
800
6M40
11
3
1
1,00
0
��
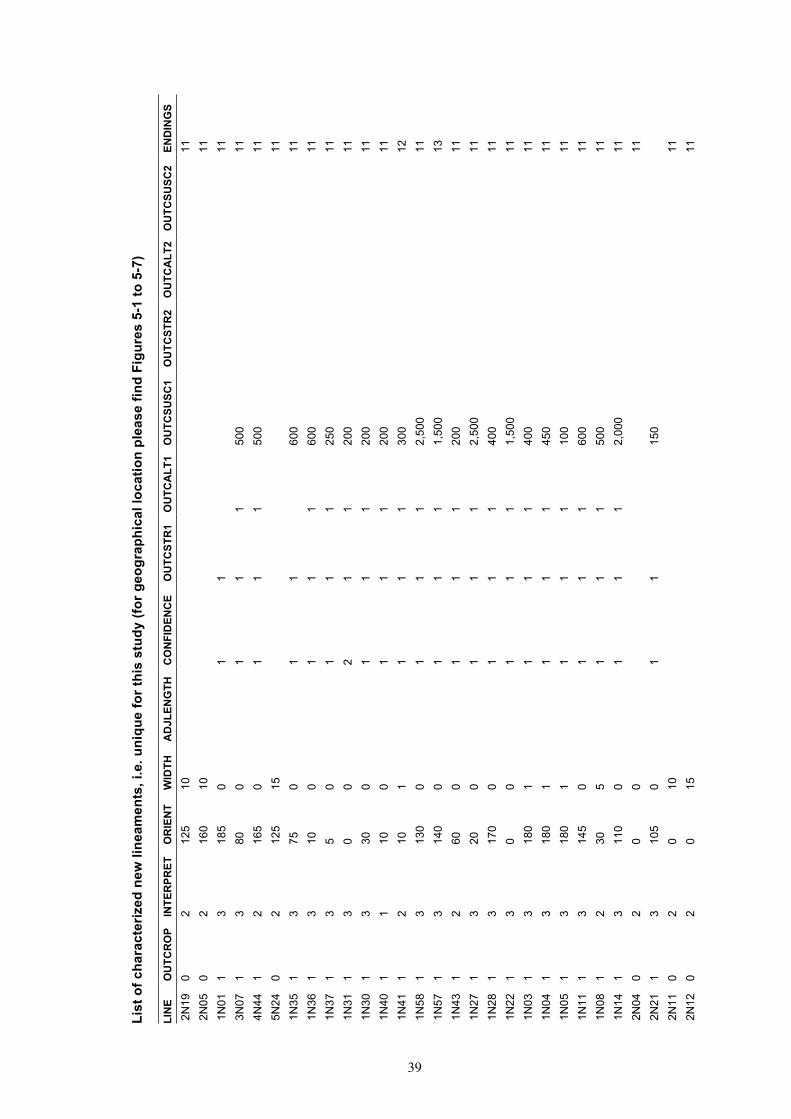
List
ofc
hara
cter
ized
new
line
amen
ts,i
.e.u
niqu
efo
rthi
sst
udy
(forg
eogr
aphi
call
ocat
ion
plea
sefi
ndF
igur
es5
‑1to
5‑7
)
LIN
EO
UTC
RO
PIN
TER
PRET
OR
IEN
TW
IDTH
AD
JLEN
GTH
CO
NFI
DEN
CE
OU
TCST
R1
OU
TCA
LT1
OU
TCSU
SC1
OU
TCST
R2
OU
TCA
LT2
OU
TCSU
SC2
END
ING
S 2
N19
02
125
10
11
2N
050
216
010
11 1
N01
13
185
0
11
11
3N
071
380
0
11
150
0
11 4
N44
12
165
0
11
150
0
11 5
N24
02
125
15
11
1N
351
375
0
11
60
0
11 1
N36
13
100
1
11
600
11
1N
371
35
0
11
125
0
11 1
N31
13
00
2
11
200
11
1N
301
330
0
11
120
0
11 1
N40
11
100
1
11
200
11
1N
411
210
1
11
130
0
12 1
N58
13
130
0
11
12,
500
11
1N
571
314
00
1
11
1,50
0
13 1
N43
12
600
1
11
200
11
1N
271
320
0
11
12,
500
11
1N
281
317
00
1
11
400
11
1N
221
30
0
11
11,
500
11
1N
031
318
01
1
11
400
11
1N
041
318
01
1
11
450
11
1N
051
318
01
1
11
100
11
1N
111
314
50
1
11
600
11
1N
081
230
5
11
150
0
11 1
N14
13
110
0
11
12,
000
11
2N
040
20
0
11
2N
211
310
50
1
1
150
2N
110
20
10
11
2N
120
20
15
11
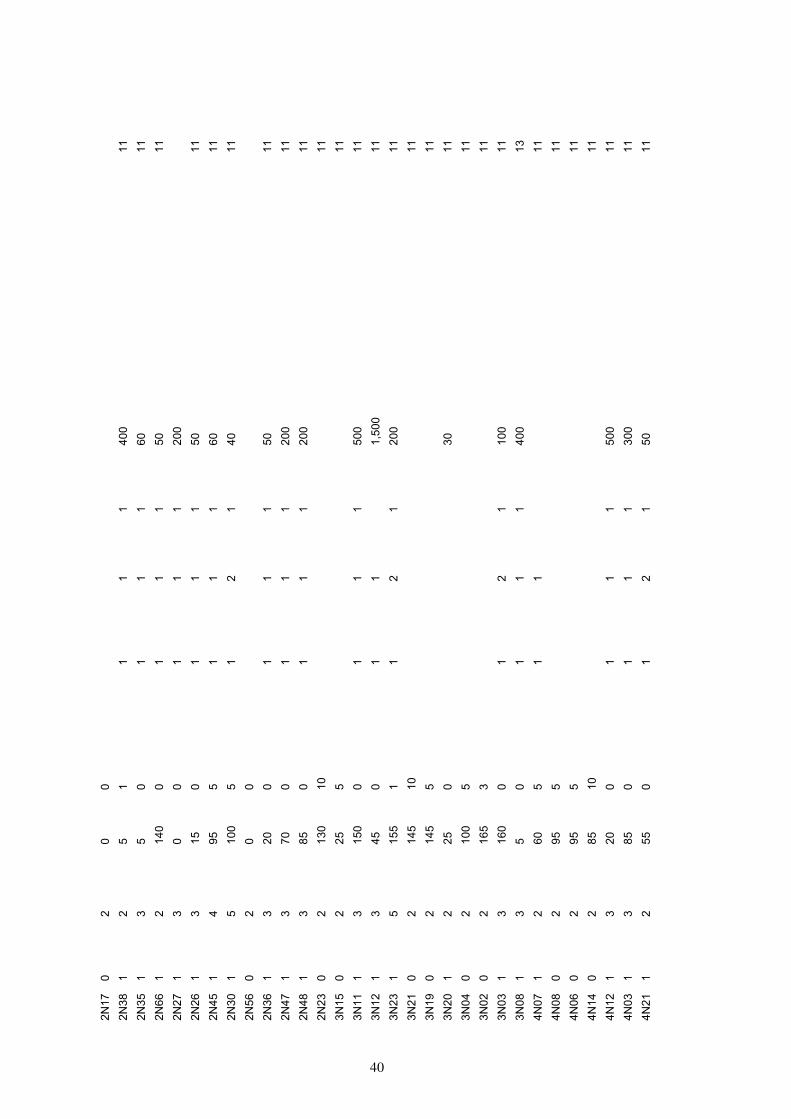
�0
2N
170
20
0
2N
381
25
1
11
140
0
11 2
N35
13
50
1
11
60
11 2
N66
12
140
0
11
150
11
2N
271
30
0
11
120
0
2
N26
13
150
1
11
50
11 2
N45
14
955
1
11
60
11 2
N30
15
100
5
12
140
11
2N
560
20
0
2N
361
320
0
11
150
11
2N
471
370
0
11
120
0
11 2
N48
13
850
1
11
200
11
2N
230
213
010
11 3
N15
02
255
11 3
N11
13
150
0
11
150
0
11 3
N12
13
450
1
1
1,50
0
11 3
N23
15
155
1
12
120
0
11 3
N21
02
145
10
11
3N
190
214
55
11 3
N20
12
250
30
11 3
N04
02
100
5
11
3N
020
216
53
11 3
N03
13
160
0
12
110
0
11 3
N08
13
50
1
11
400
13
4N
071
260
5
11
11
4N
080
295
5
11
4N
060
295
5
11
4N
140
285
10
11
4N
121
320
0
11
150
0
11 4
N03
13
850
1
11
300
11
4N
211
255
0
12
150
11
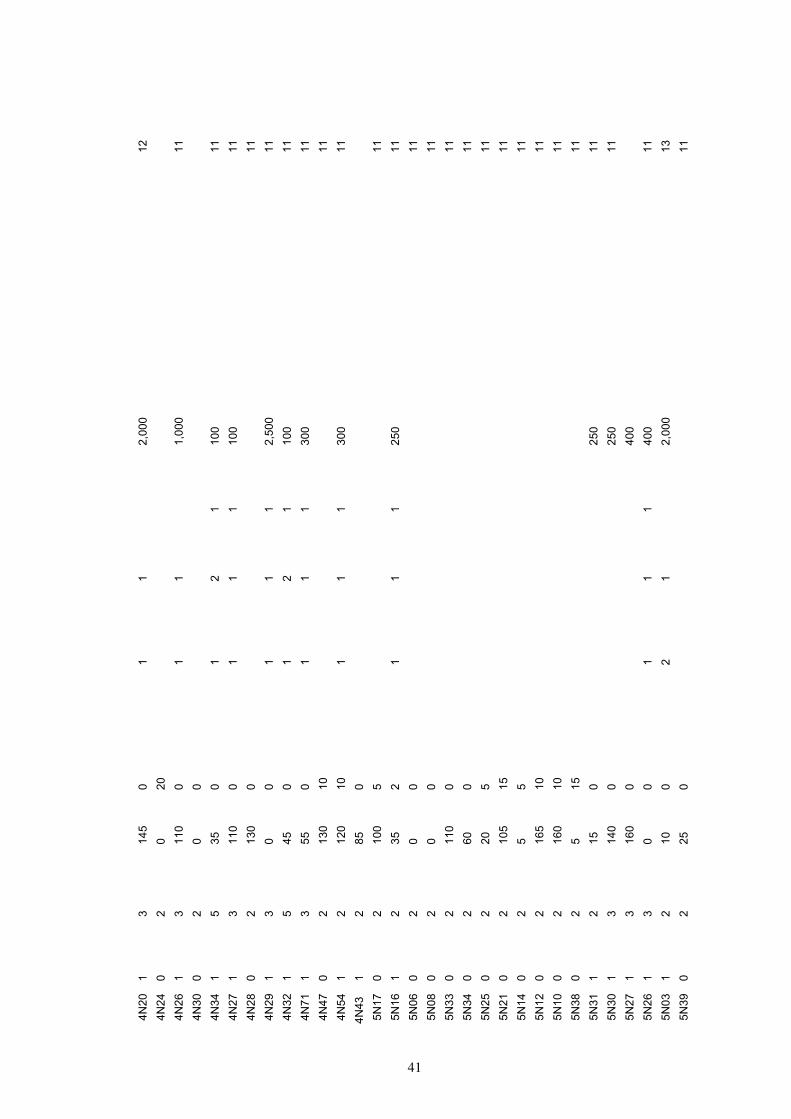
�1
4N
201
314
50
1
1
2,00
0
12 4
N24
02
020
4
N26
13
110
0
11
1,
000
11
4N
300
20
0
4N
341
535
0
12
110
0
11 4
N27
13
110
0
11
110
0
11 4
N28
02
130
0
11
4N
291
30
0
11
12,
500
11
4N
321
545
0
12
110
0
11 4
N71
13
550
1
11
300
11
4N
470
213
010
11 4
N54
12
120
10
11
130
0
114N
431
285
0
5N
170
210
05
11 5
N16
12
352
1
11
250
11
5N
060
20
0
11
5N
080
20
0
11
5N
330
211
00
11 5
N34
02
600
11 5
N25
02
205
11 5
N21
02
105
15
11
5N
140
25
5
11
5N
120
216
510
11 5
N10
02
160
10
11
5N
380
25
15
11
5N
311
215
0
25
0
11 5
N30
13
140
0
25
0
11 5
N27
13
160
0
40
0
5
N26
13
00
1
11
400
11
5N
031
210
0
21
2,
000
13
5N
390
225
0
11
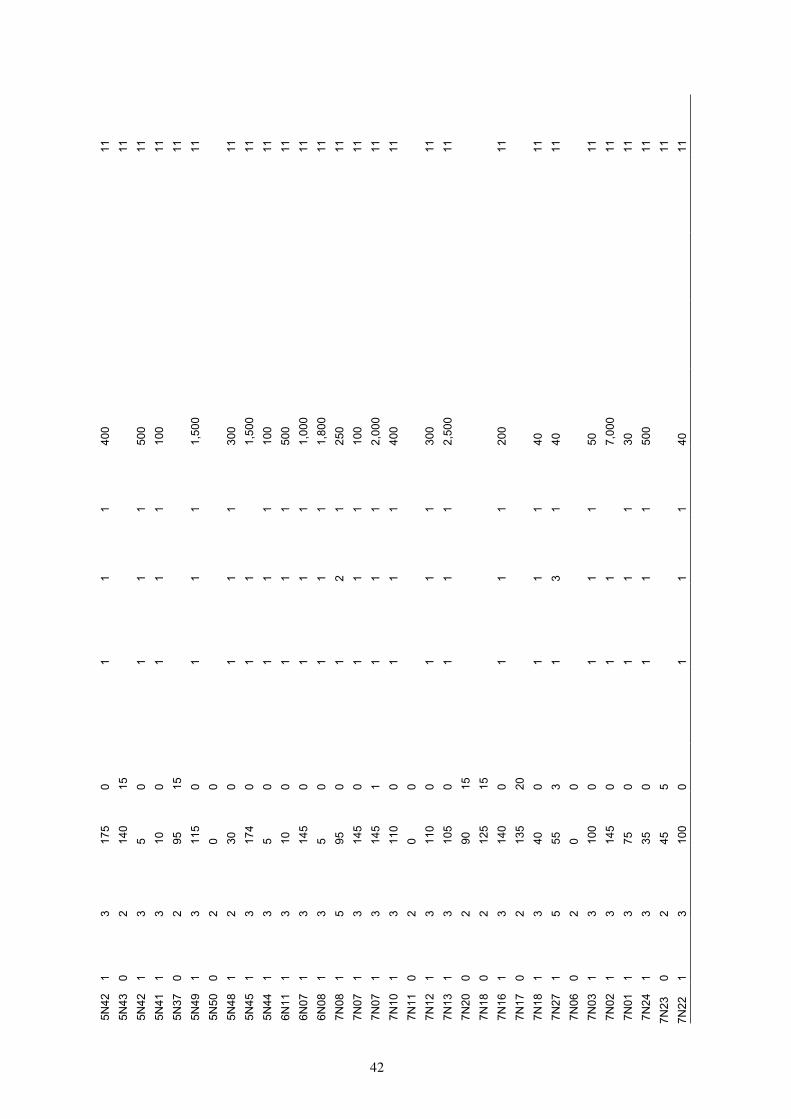
�2
5N
421
317
50
1
11
400
11
5N
430
214
015
11 5
N42
13
50
1
11
500
11
5N
411
310
0
11
110
0
11 5
N37
02
9515
11 5
N49
13
115
0
11
11,
500
11
5N
500
20
0
5N
481
230
0
11
130
0
11 5
N45
13
174
0
11
1,
500
11
5N
441
35
0
11
110
0
11 6
N11
13
100
1
11
500
11
6N
071
314
50
1
11
1,00
0
11 6
N08
13
50
1
11
1,80
0
11 7
N08
15
950
1
21
250
11
7N
071
314
50
1
11
100
11
7N
071
314
51
1
11
2,00
0
11 7
N10
13
110
0
11
140
0
11 7
N11
02
00
7
N12
13
110
0
11
130
0
11 7
N13
13
105
0
11
12,
500
11
7N
200
290
15
7N
180
212
515
7
N16
13
140
0
11
120
0
11 7
N17
02
135
20
7N
181
340
0
11
140
11
7N
271
555
3
13
140
11
7N
060
20
0
7N
031
310
00
1
11
50
11 7
N02
13
145
0
11
7,
000
11
7N
011
375
0
11
130
11
7N
241
335
0
11
150
0
117N
230
245
5
11
7N22
13
100
0
11
140
11
��
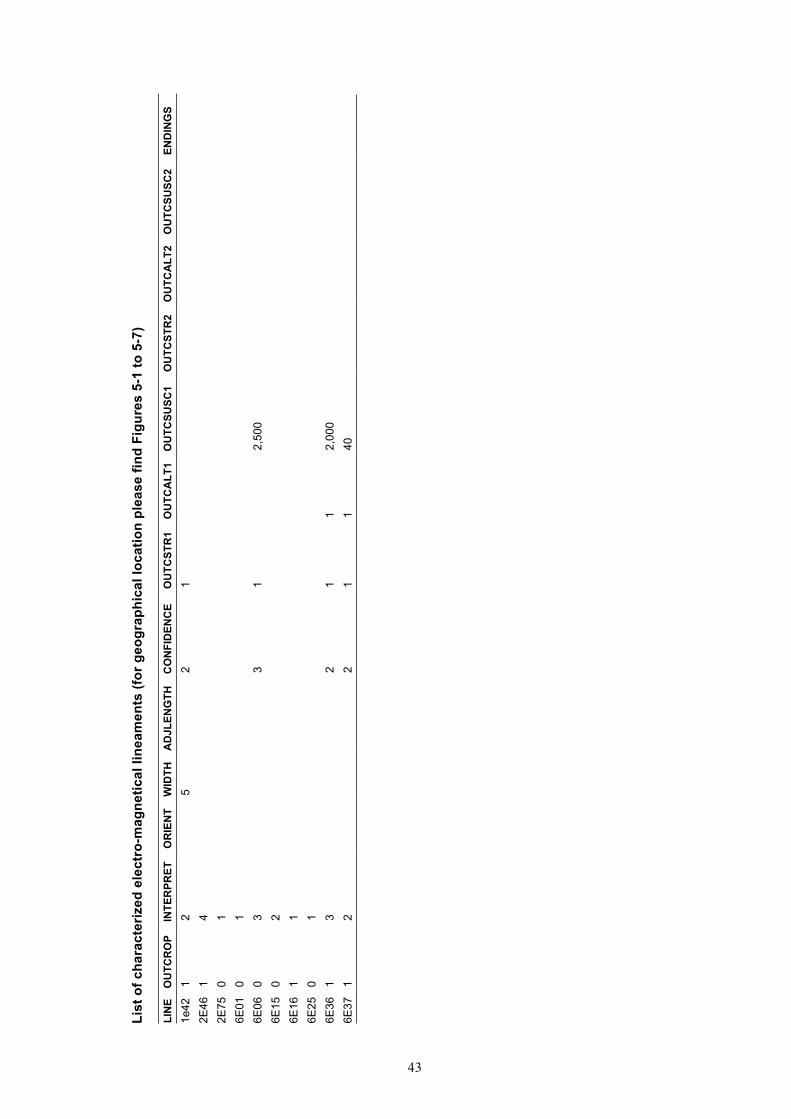
List
ofc
hara
cter
ized
ele
ctro
‑mag
netic
alli
neam
ents
(for
geo
grap
hica
lloc
atio
npl
ease
find
Fig
ures
5‑1
to5
‑7)
LIN
EO
UTC
RO
PIN
TER
PRET
OR
IEN
TW
IDTH
AD
JLEN
GTH
CO
NFI
DEN
CE
OU
TCST
R1
OU
TCA
LT1
OU
TCSU
SC1
OU
TCST
R2
OU
TCA
LT2
OU
TCSU
SC2
END
ING
S1e
421
2
5
21
2E46
14
2E
750
1
6E01
01
6E
060
3
31
2,
500
6E15
02
6E
161
1
6E25
01
6E
361
3
21
12,
000
6E37
12
2
11
40