Embed Size (px)
Citation preview
Bioanalyzer Interpretation
Bioanalyzer RNA Total Eukaryote 2100 Nano
Information gathered from USU and Agilent website 2010
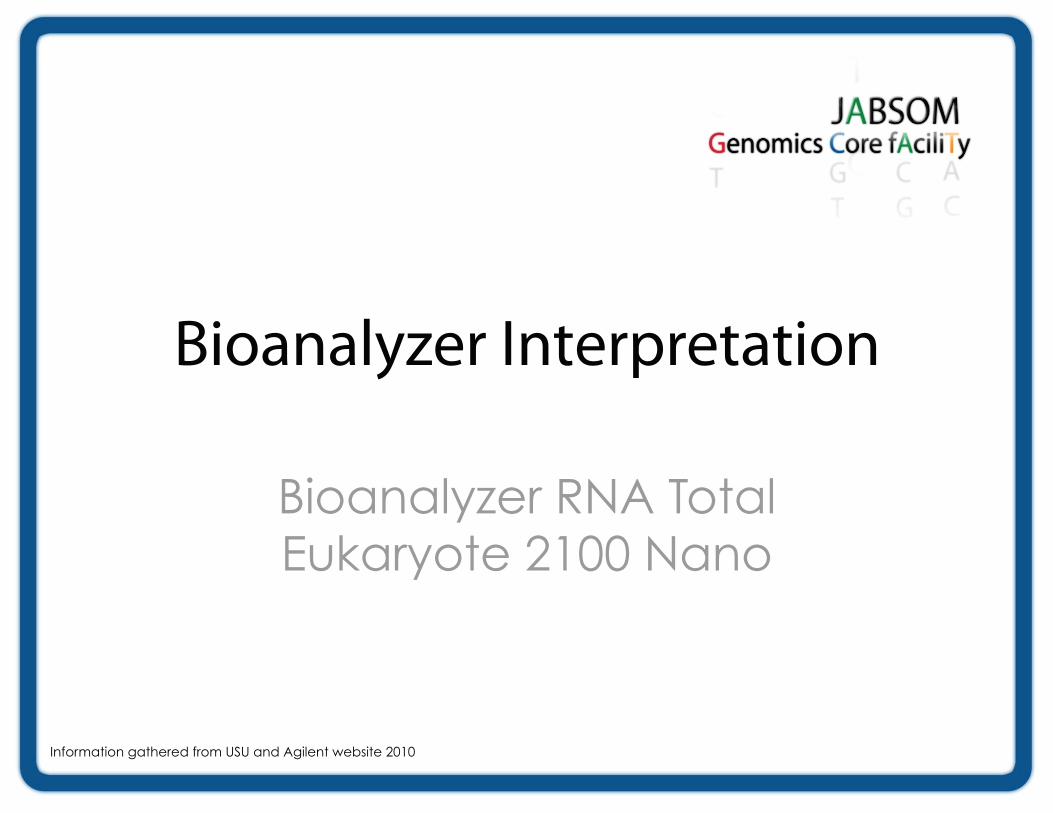
Intact Total RNA
Small peaks are sometimes present after the marker at 24 – 29
seconds. These are represented by 5S and 5.8S subunits, tRNAs, and
small RNA fragments about 100bp. These are especially noted when using phenol and trizol extraction methods. They can be removed by
treating total RNA through Qiagen columns which removes small RNAs.
28S
18S
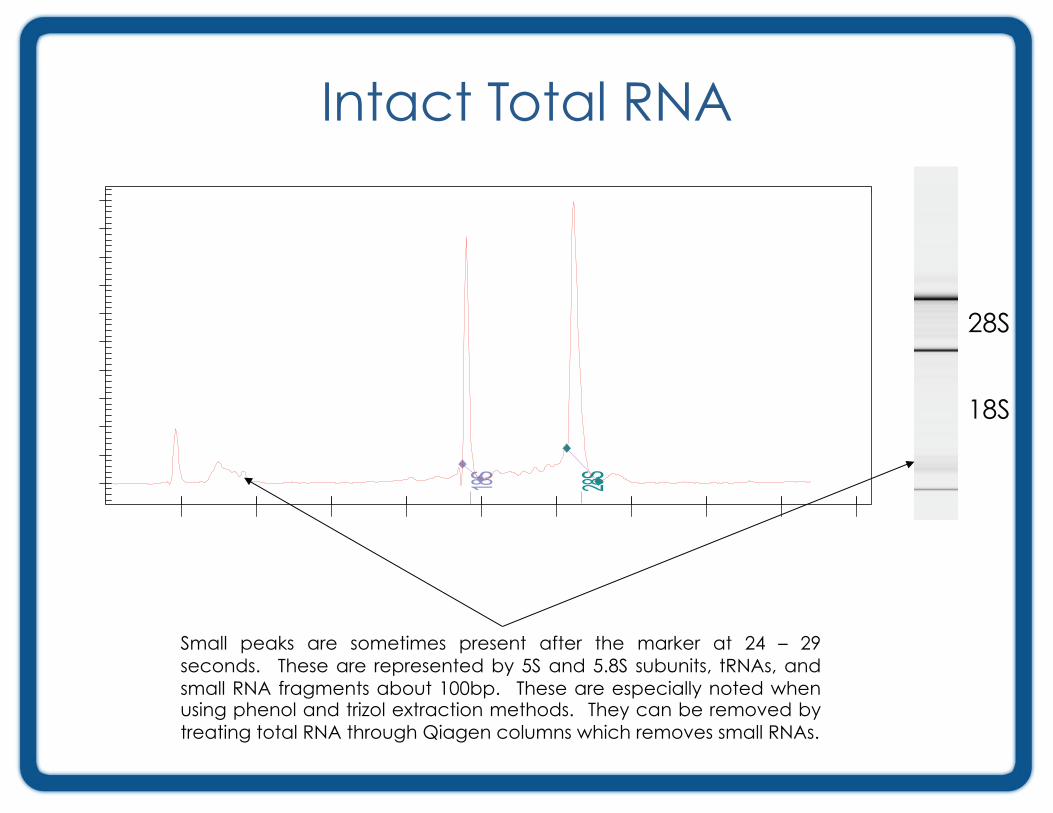
Partially Degraded RNA
Baseline between and to the left
of ribosomal peaks becomes jagged
Total RNA with images like this are borderline. Re-extraction should be seriously considered.

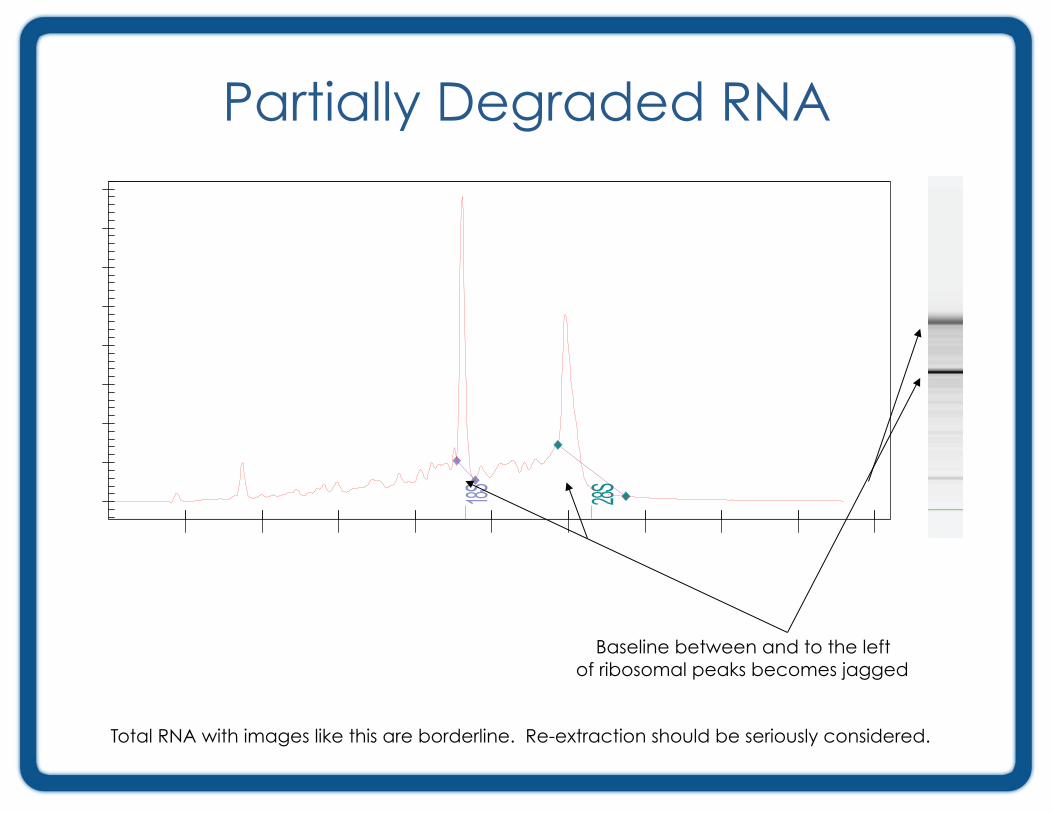
Partially Digested Total RNA Using
Trizol Extraction
Combination of 5S, 5.8S, tRNAs, and an increase in digested RNAs
Decrease in ribosomal peak intensities
marker
Digested RNA
~100 bp
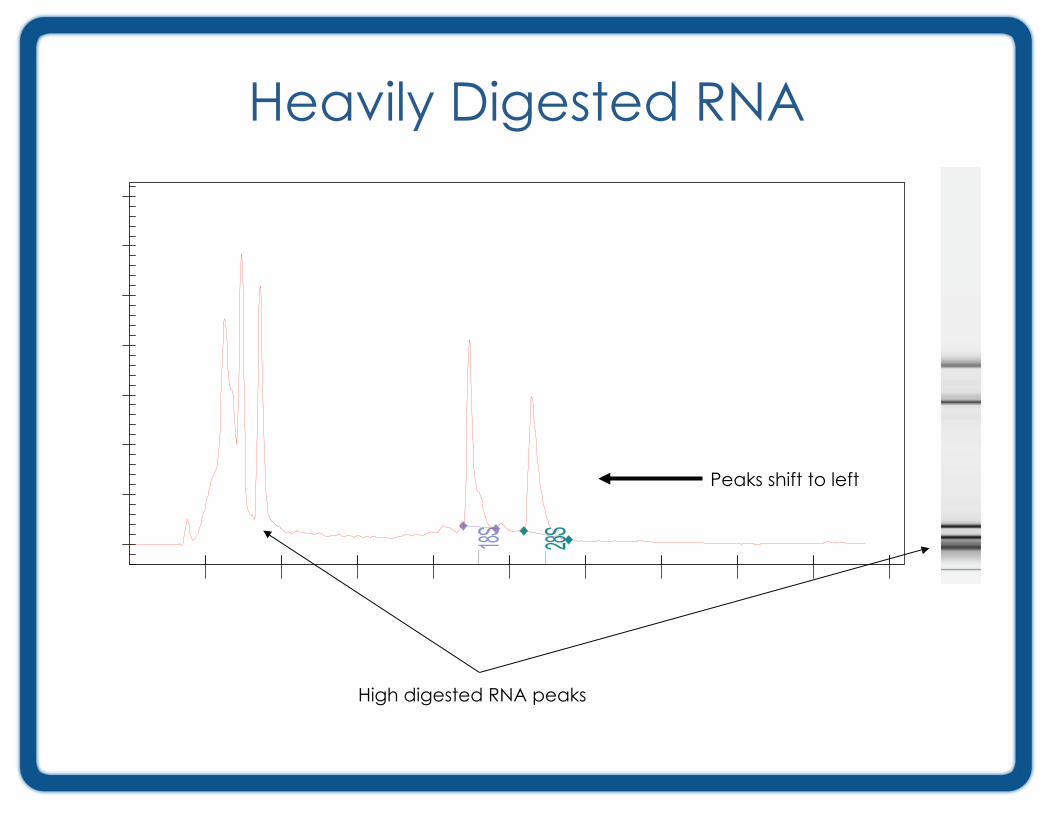
Heavily Digested RNA
Peaks shift to left
High digested RNA peaks
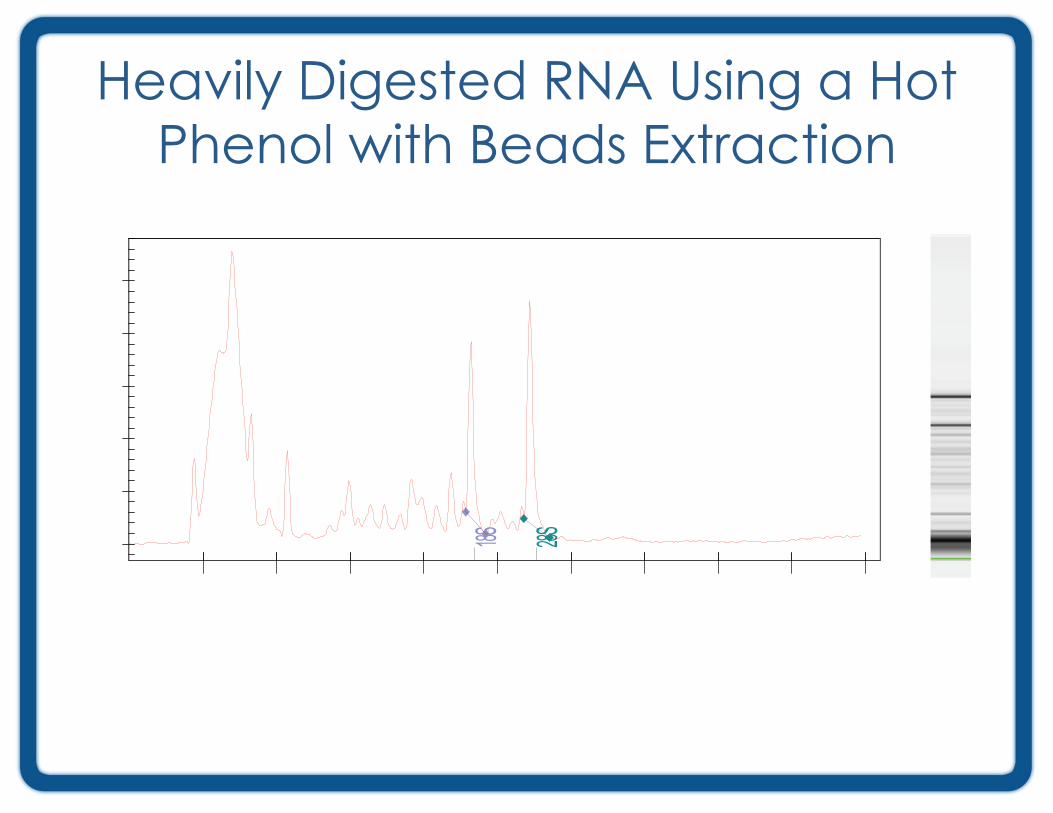
Heavily Digested RNA Using a Hot
Phenol with Beads Extraction
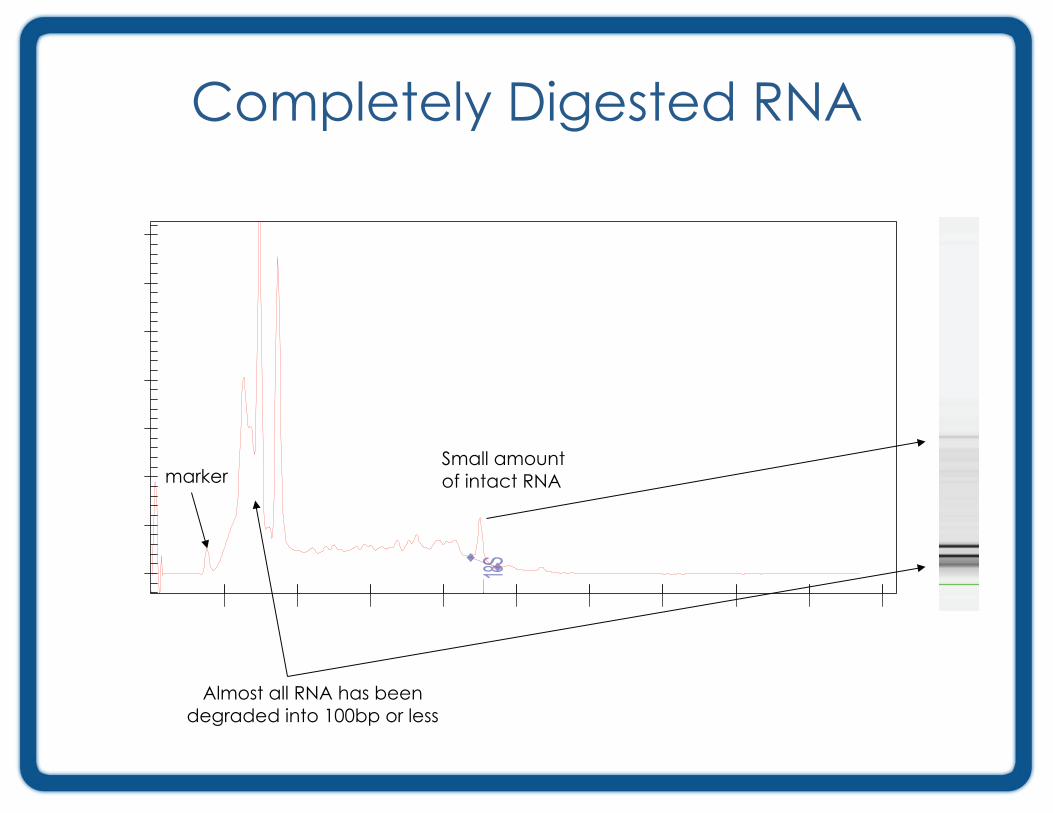
Completely Digested RNA
marker
Almost all RNA has been
degraded into 100bp or less
Small amount
of intact RNA
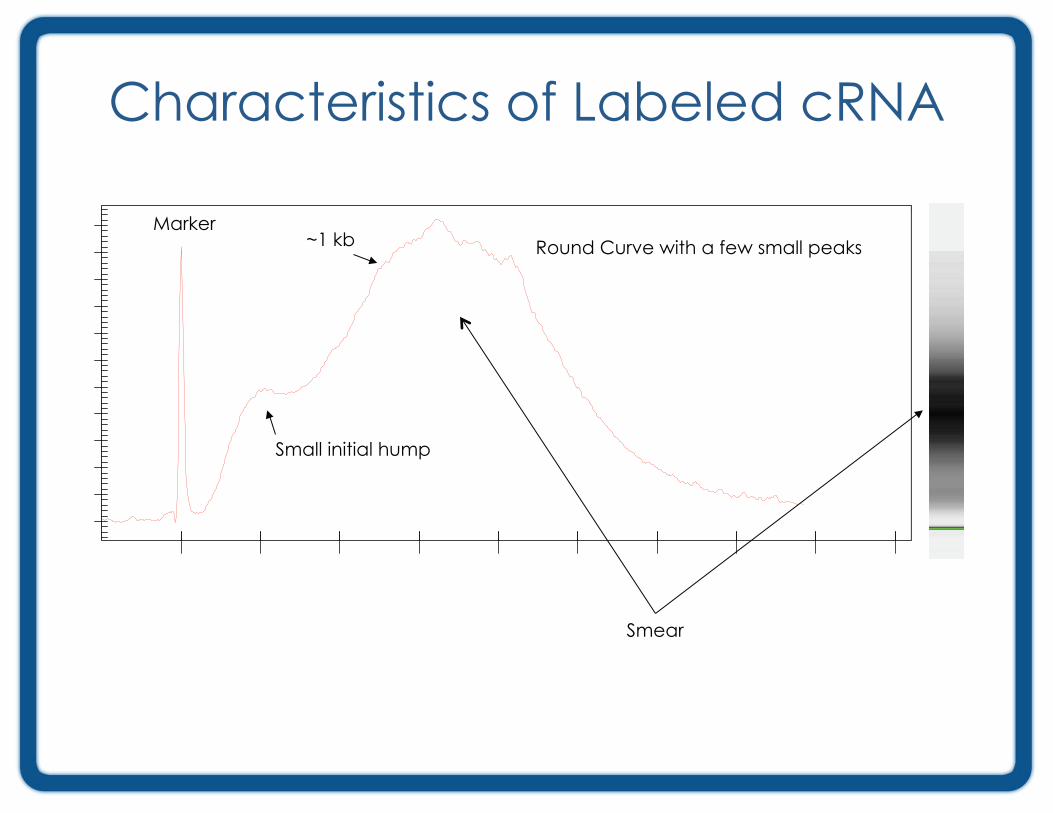
Characteristics of Labeled cRNA
Marker
Small initial hump
Round Curve with a few small peaks
Smear
~1 kb
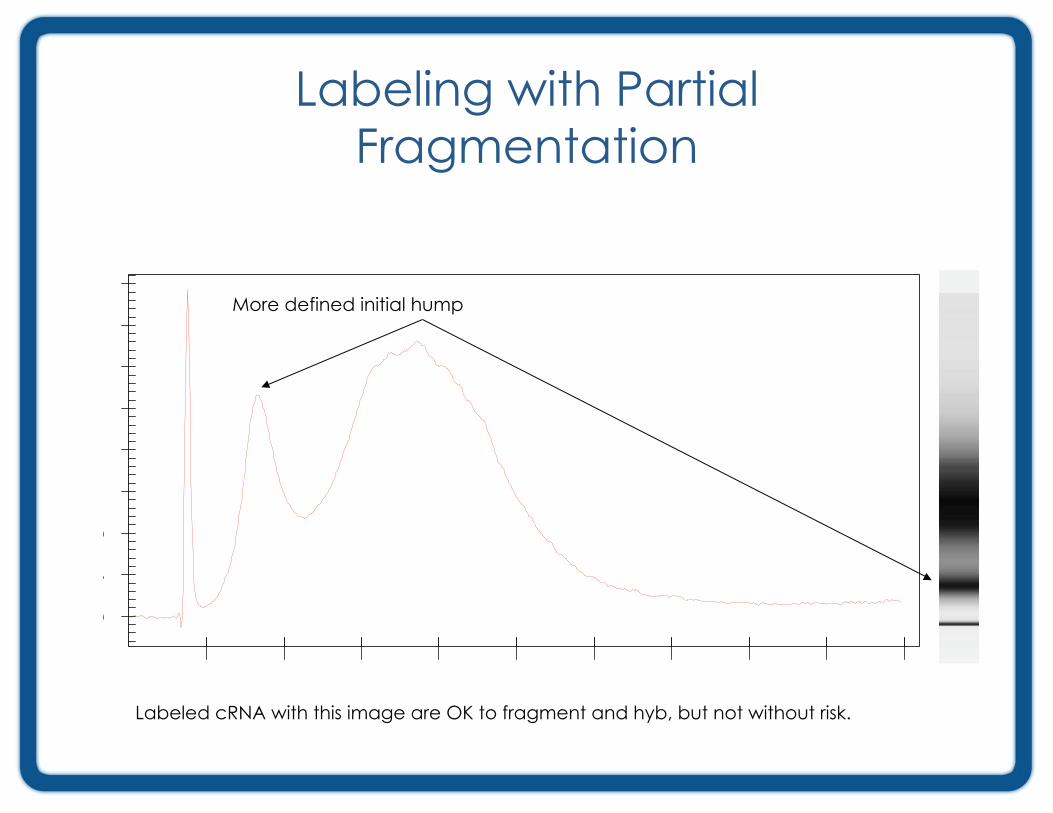
Labeling with Partial Fragmentation
More defined initial hump
Labeled cRNA with this image are OK to fragment and hyb, but not without risk.
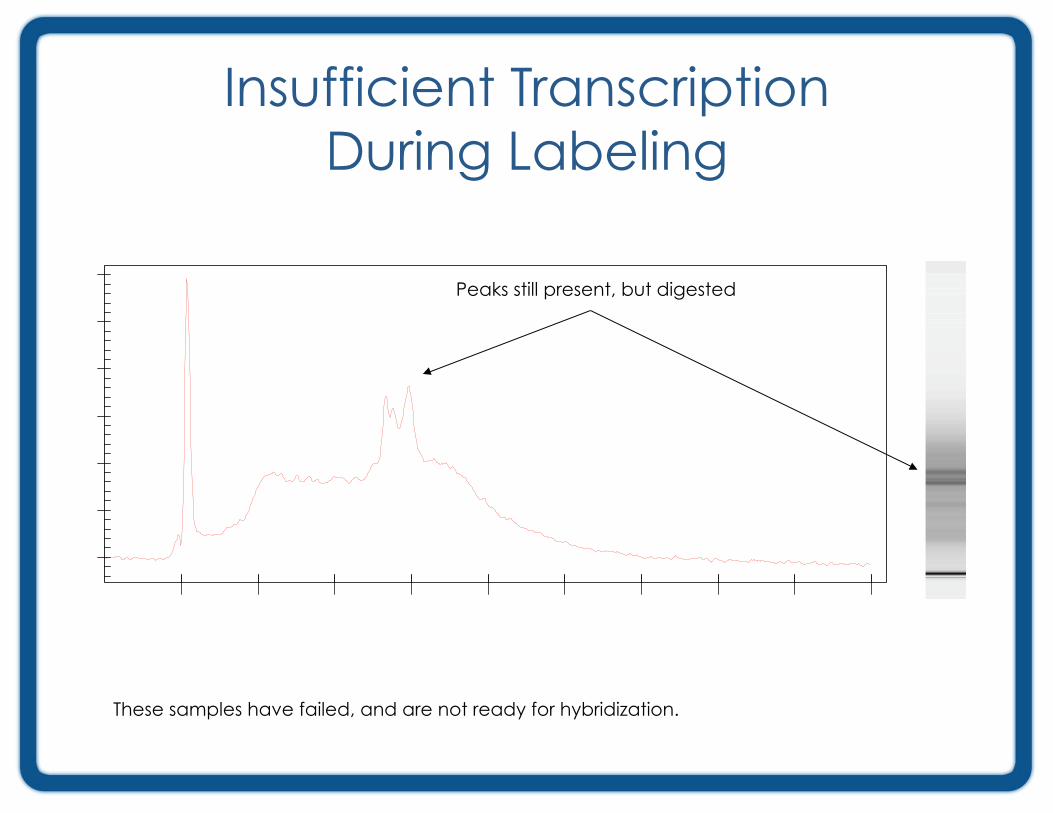
Insufficient Transcription
During Labeling
Peaks still present, but digested
These samples have failed, and are not ready for hybridization.
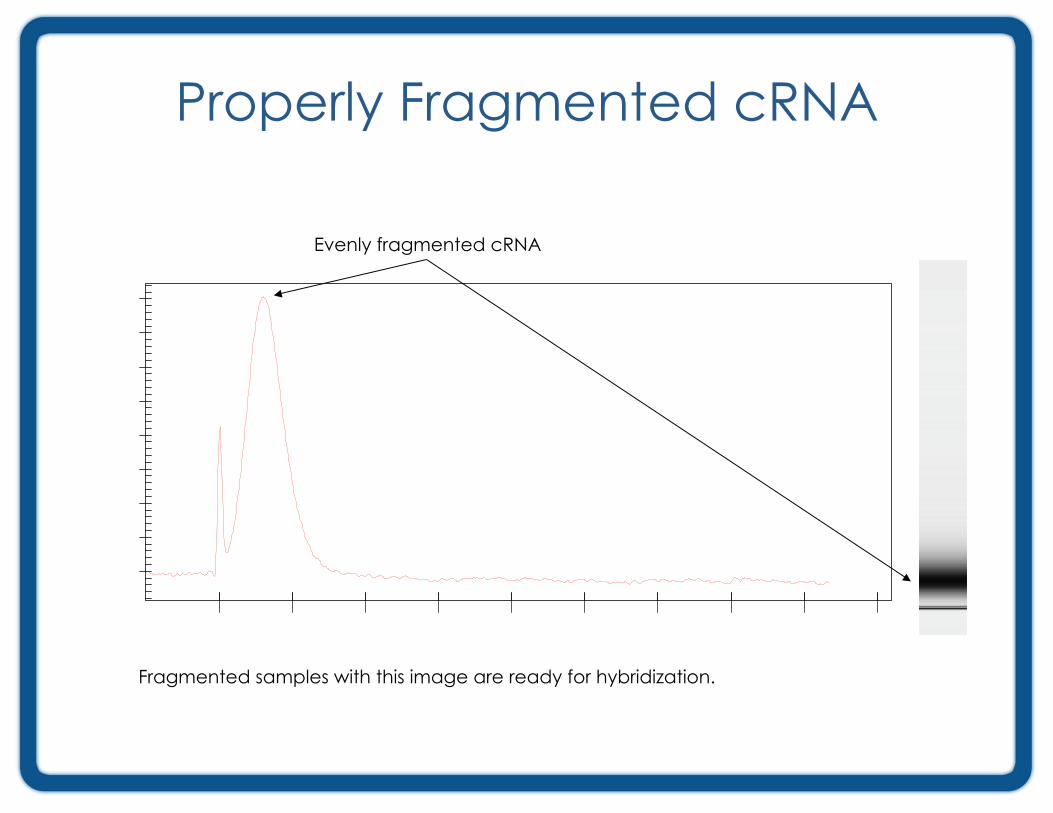
Properly Fragmented cRNA
Fragmented samples with this image are ready for hybridization.
Evenly fragmented cRNA
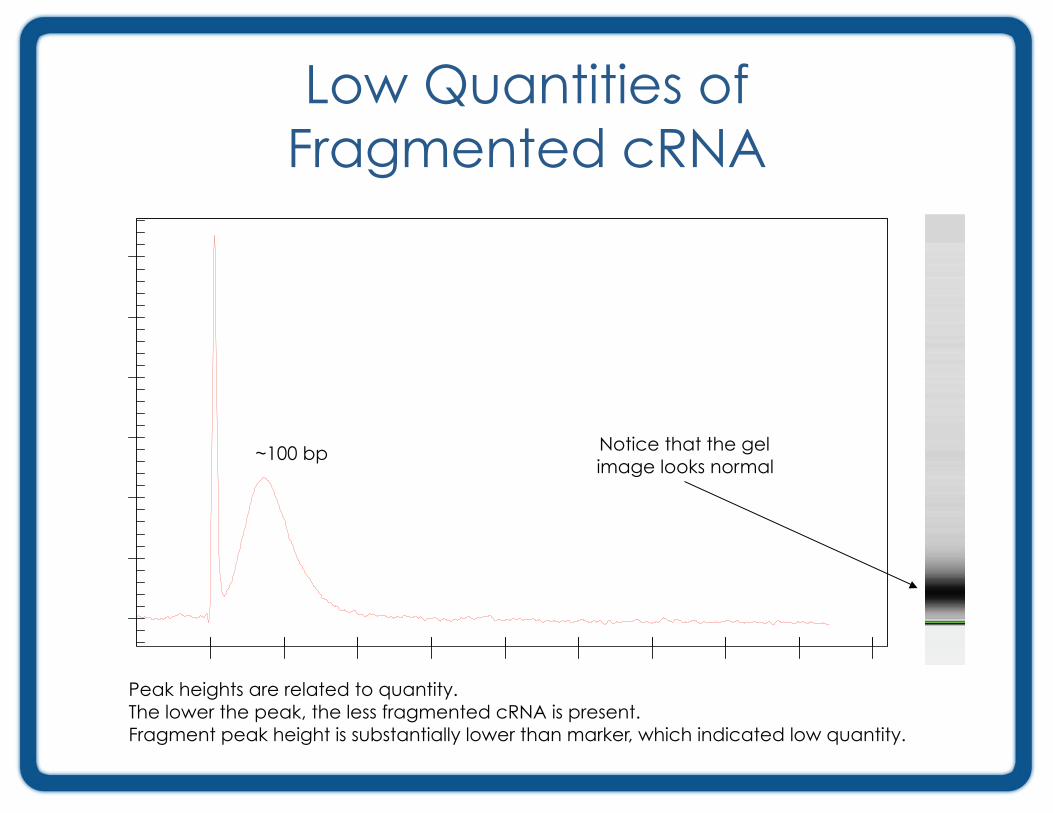
Low Quantities of
Fragmented cRNA
Peak heights are related to quantity.
The lower the peak, the less fragmented cRNA is present.
Fragment peak height is substantially lower than marker, which indicated low quantity.
Notice that the gel
image looks normal ~100 bp

Good Ladder
25 bp
200 bp
500 bp
~6 kb
4 kp
1 kb
2 kb
The larger the ladder fragment, the wider the peak. More difficult to create uniform
peaks of large size.
Baseline is flat and has sharp peaks
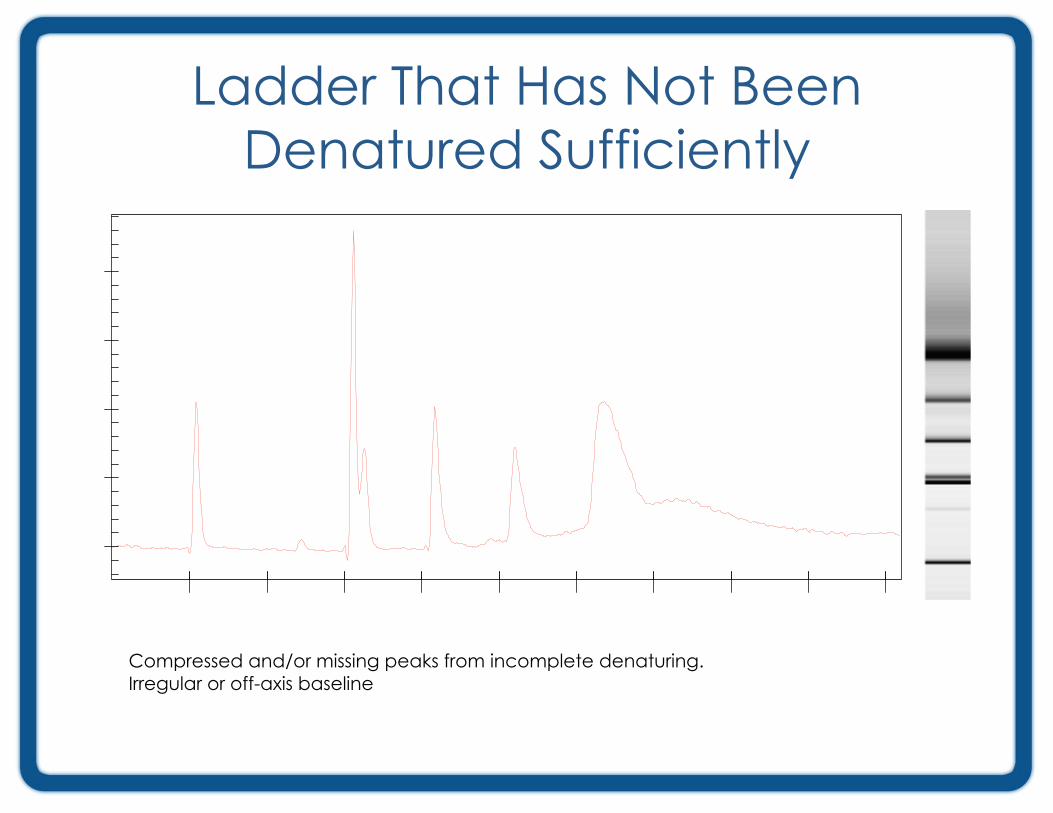
Ladder That Has Not Been
Denatured Sufficiently
Compressed and/or missing peaks from incomplete denaturing.
Irregular or off-axis baseline
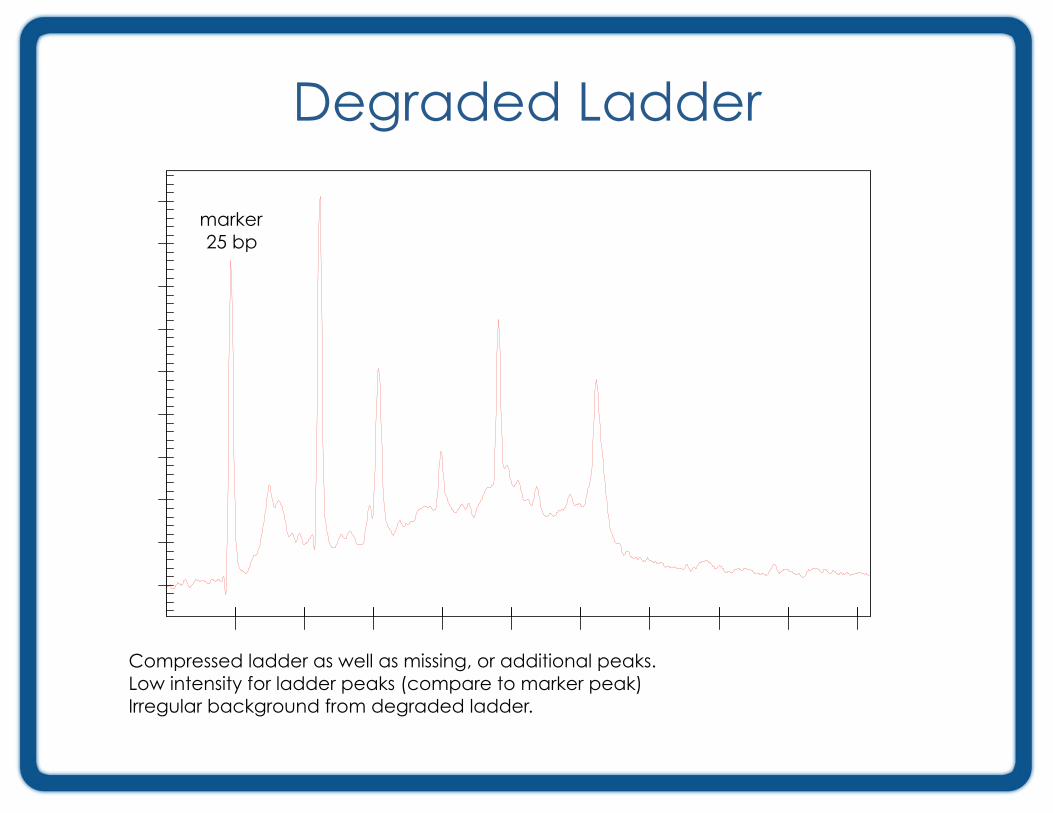
Degraded Ladder
Compressed ladder as well as missing, or additional peaks.
Low intensity for ladder peaks (compare to marker peak)
Irregular background from degraded ladder.
marker
25 bp
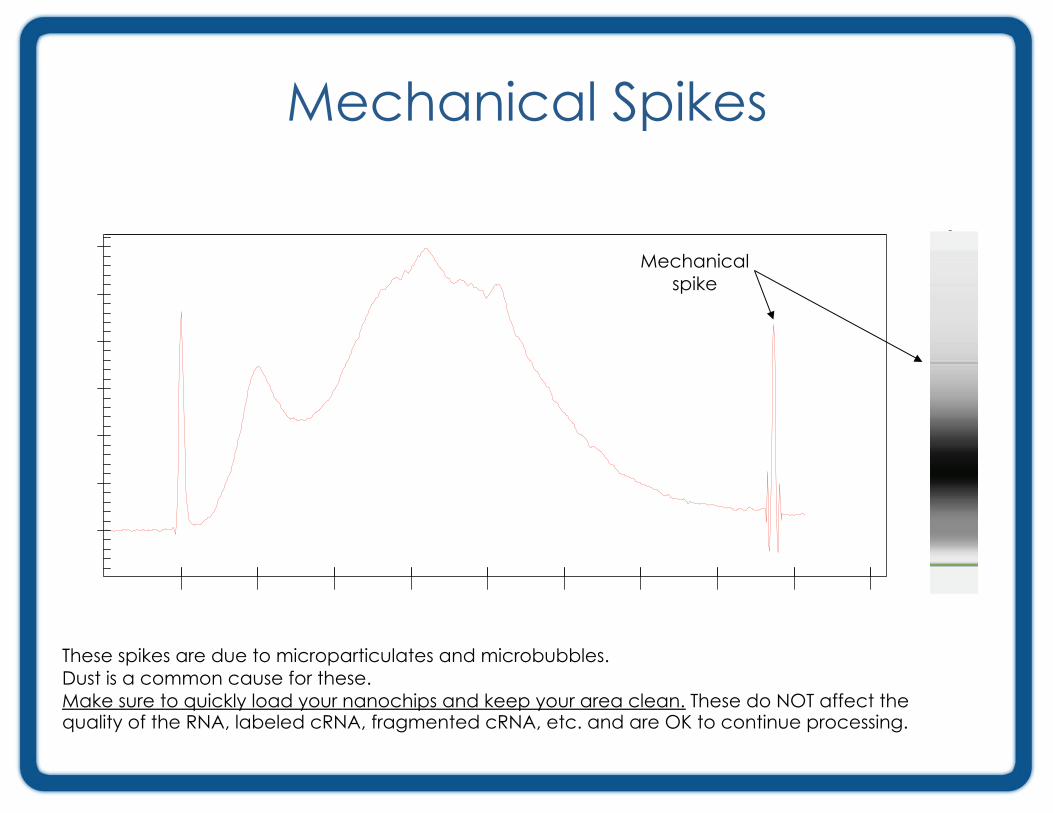
Mechanical Spikes
Mechanical
spike
These spikes are due to microparticulates and microbubbles.
Dust is a common cause for these.
Make sure to quickly load your nanochips and keep your area clean. These do NOT affect the quality of the RNA, labeled cRNA, fragmented cRNA, etc. and are OK to continue processing.
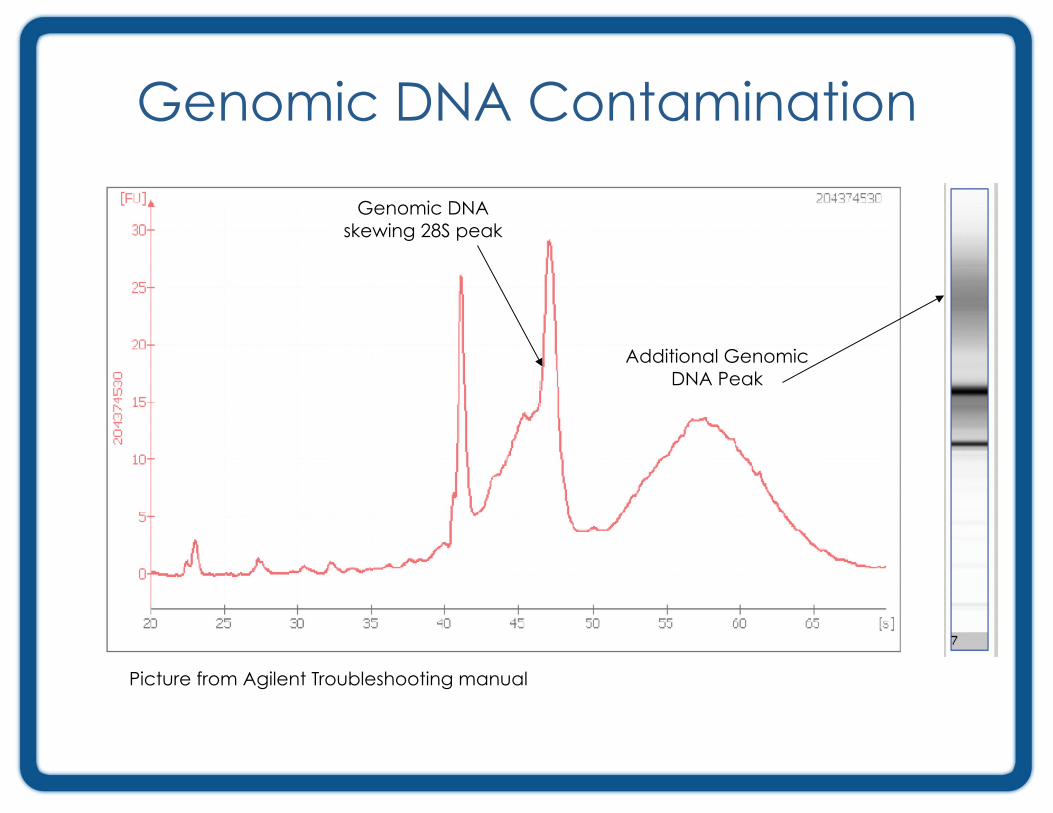
Genomic DNA Contamination
Additional Genomic
DNA Peak
Genomic DNA
skewing 28S peak
Picture from Agilent Troubleshooting manual
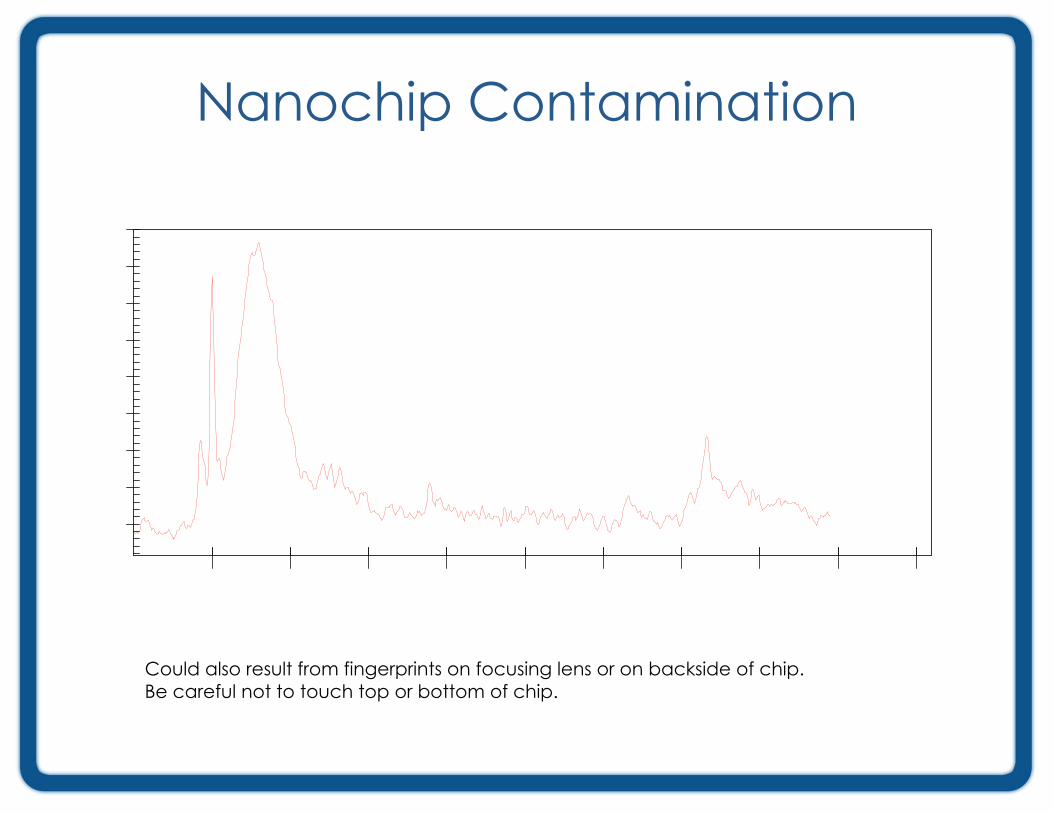
Nanochip Contamination
Could also result from fingerprints on focusing lens or on backside of chip.
Be careful not to touch top or bottom of chip.
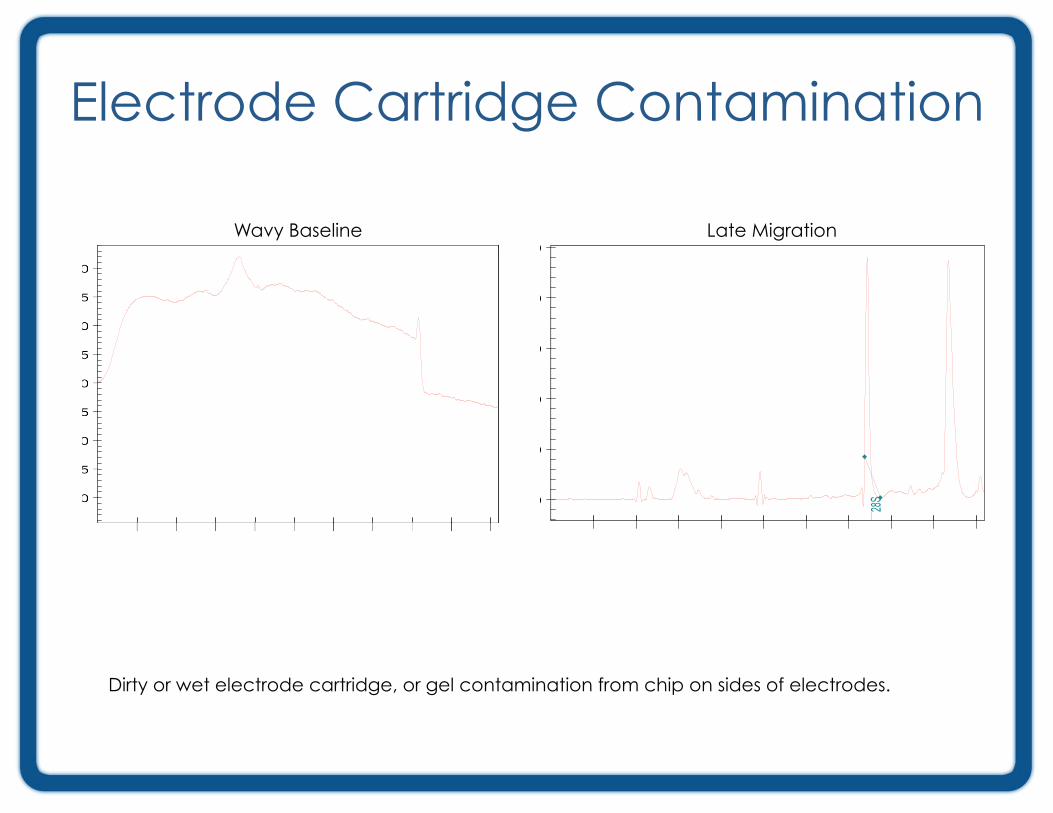
Electrode Cartridge Contamination
Dirty or wet electrode cartridge, or gel contamination from chip on sides of electrodes.
Wavy Baseline Late Migration