Embed Size (px)
Citation preview
1
Our Approach, Capabilities, andCase Studies
DATA ANALYTICS
PURPOSE
DESIRED OUTCOMES03
01
02
04
2
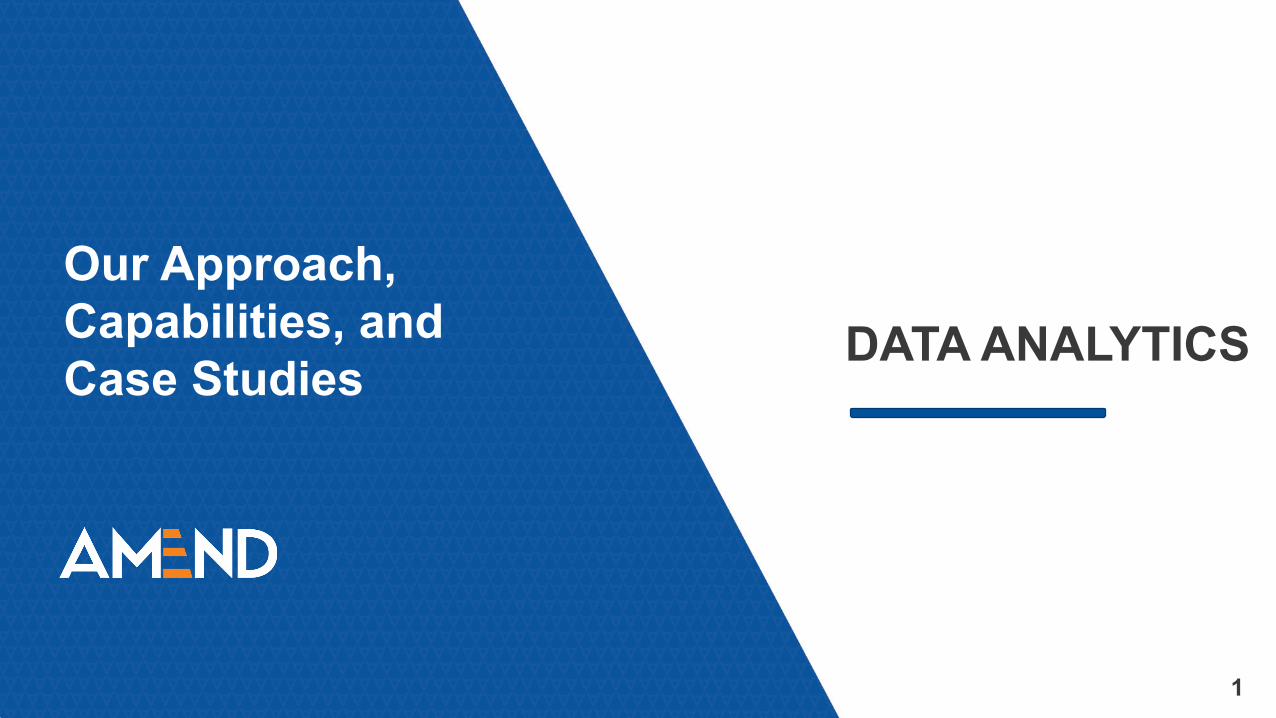
To share AMEND’s observations and provide AMEND’s capabilities
1. To Provide Clarity with Data Analytics2. How Data Analytics will Impact the
Company
The Importance of Automation
Data Analytics Explanation
DSaaS Case Studies
AMEND Overview

3
AMEND Overview
4
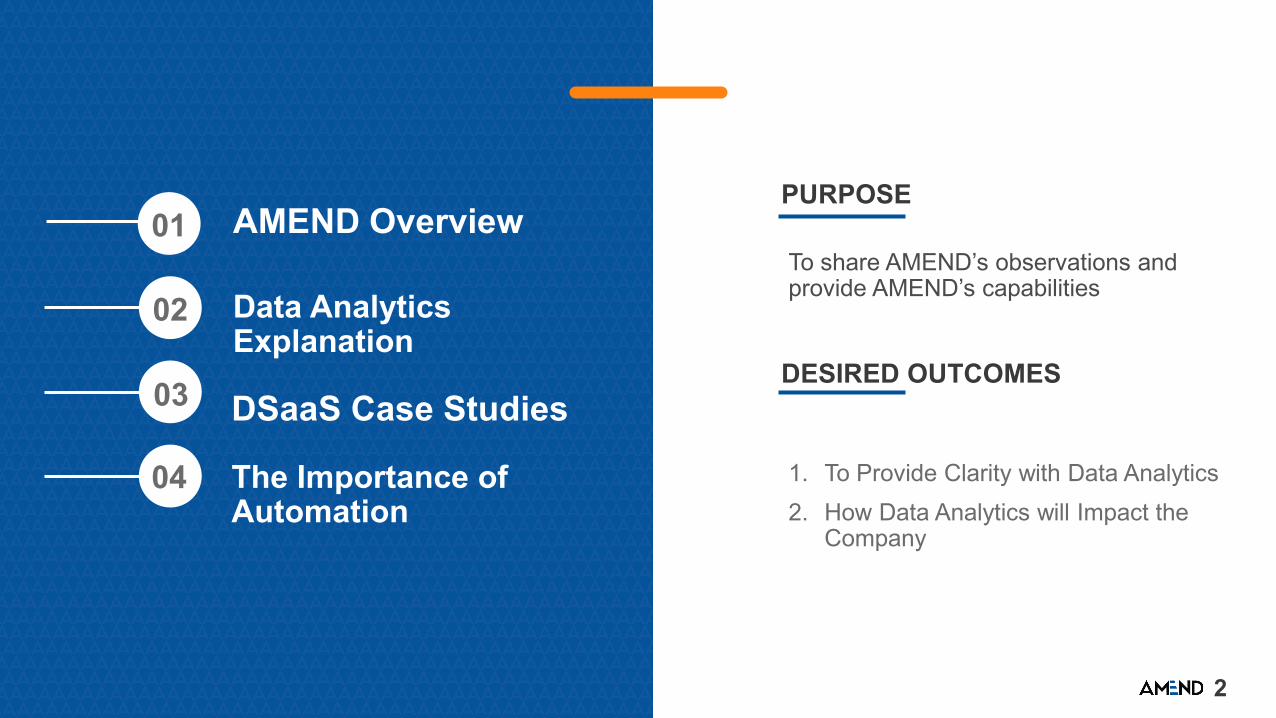
Meet the Partners
Craig Todd
“The AMEND team is jam-packed with smart, talented people who push you to think bigger and do more. I would put any member of the AMEND team up against anyone from McKinsey, any day, because I know they'd win.“
– COO $75MM Manufacturer, former top tier strategy consultant
David Velie
Bobby Smyth
Paul Delaney
Geoff Marsh
Matt Murphy
Meet theTeam
Our History
5
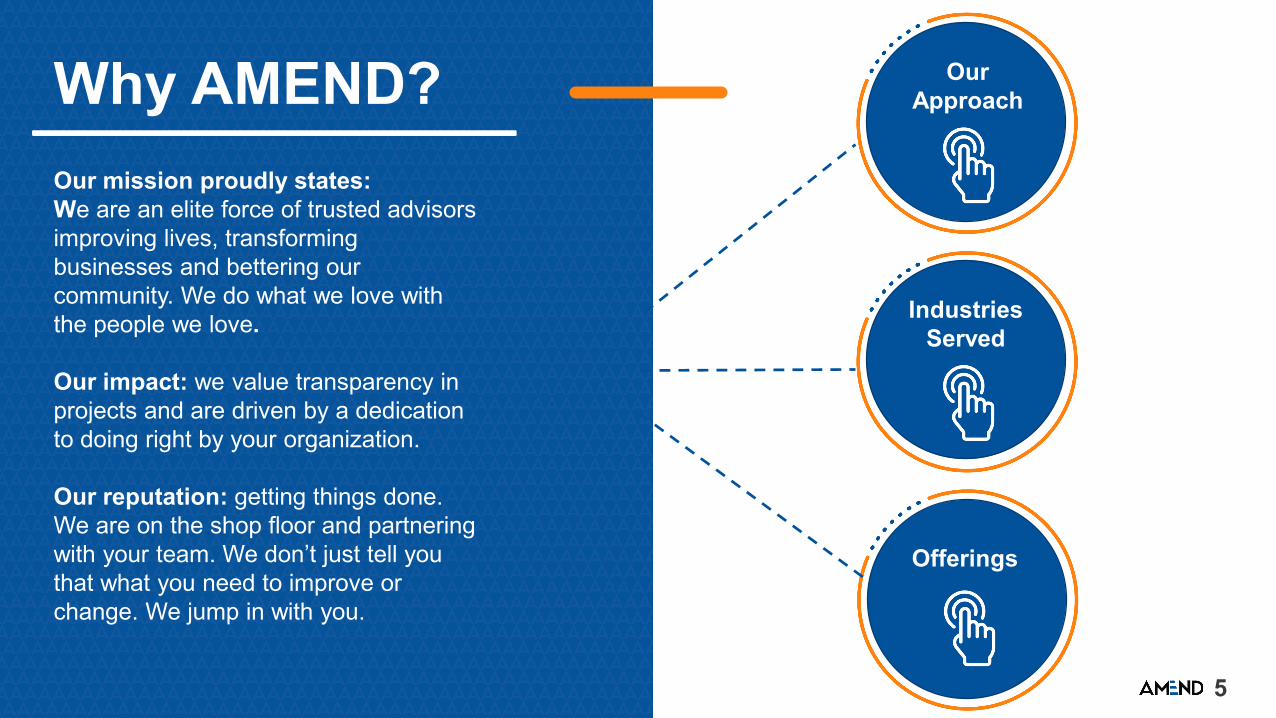
Why AMEND?Our mission proudly states:We are an elite force of trusted advisors improving lives, transforming businesses and bettering our community. We do what we love with the people we love.
Our impact: we value transparency in projects and are driven by a dedication to doing right by your organization.
Our reputation: getting things done. We are on the shop floor and partnering with your team. We don’t just tell you that what you need to improve or change. We jump in with you.
Our Approach
IndustriesServed
Offerings
6
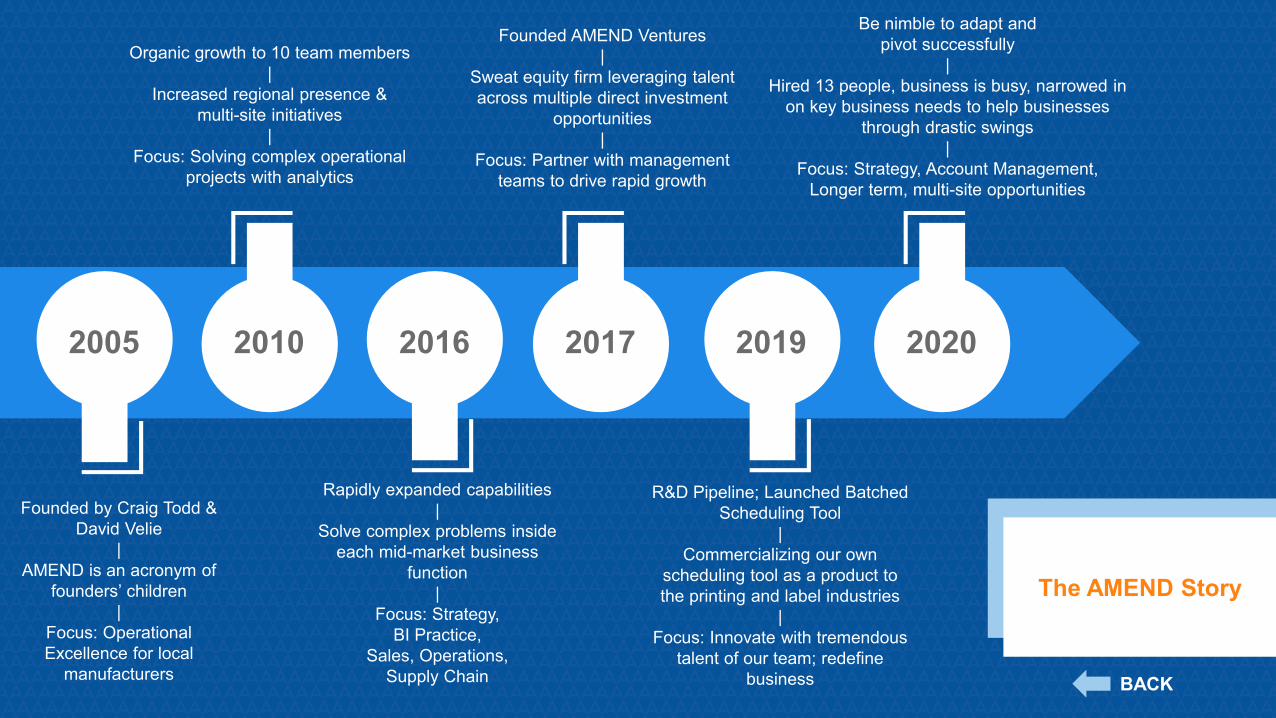
Founded by Craig Todd & David Velie
|AMEND is an acronym of
founders’ children|
Focus: Operational Excellence for local
manufacturers
2005 2010
Organic growth to 10 team members|
Increased regional presence & multi-site initiatives
|Focus: Solving complex operational
projects with analytics
2016
Rapidly expanded capabilities|
Solve complex problems inside each mid-market business
function|
Focus: Strategy, BI Practice,
Sales, Operations, Supply Chain
2017
Founded AMEND Ventures|
Sweat equity firm leveraging talent across multiple direct investment
opportunities|
Focus: Partner with management teams to drive rapid growth
2019
R&D Pipeline; Launched Batched Scheduling Tool
|Commercializing our own
scheduling tool as a product to the printing and label industries
|Focus: Innovate with tremendous
talent of our team; redefine business
2020
Be nimble to adapt and pivot successfully
|Hired 13 people, business is busy, narrowed in
on key business needs to help businesses through drastic swings
|Focus: Strategy, Account Management,
Longer term, multi-site opportunities
The AMEND Story
BACK
7
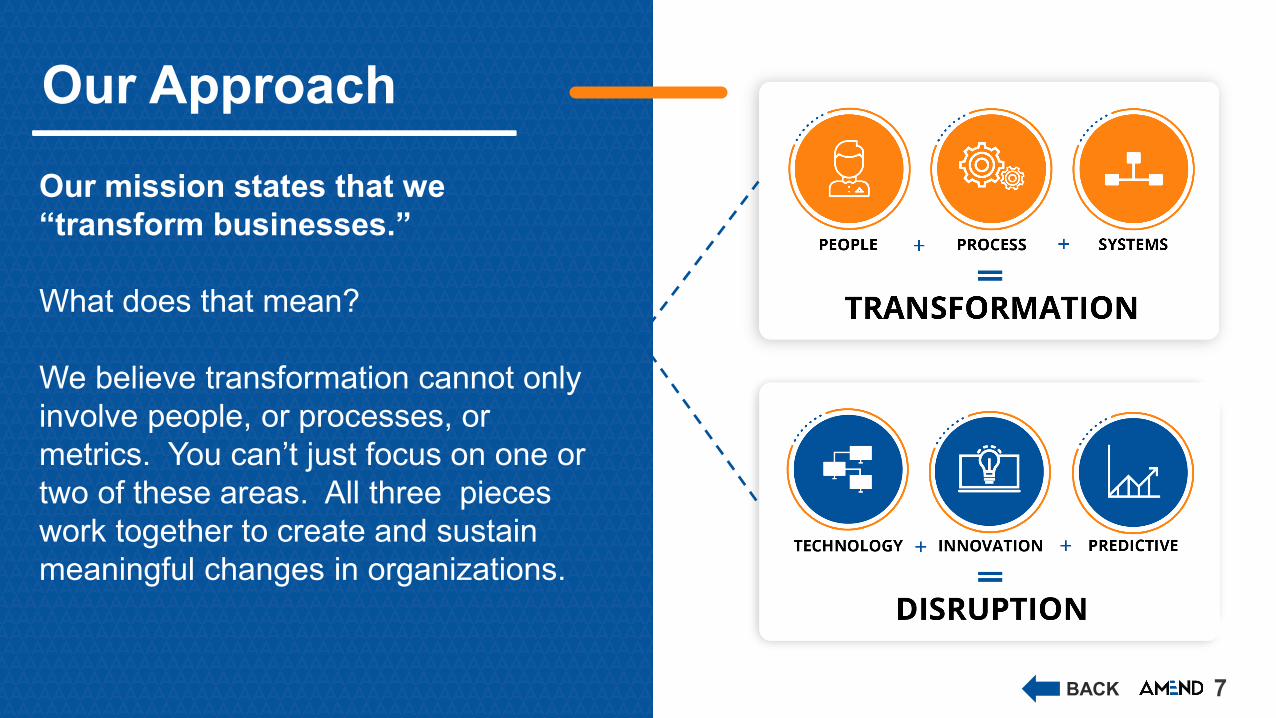
Our ApproachOur mission states that we “transform businesses.”
What does that mean?
We believe transformation cannot only involve people, or processes, or metrics. You can’t just focus on one or two of these areas. All three pieces work together to create and sustain meaningful changes in organizations.
BACK
8
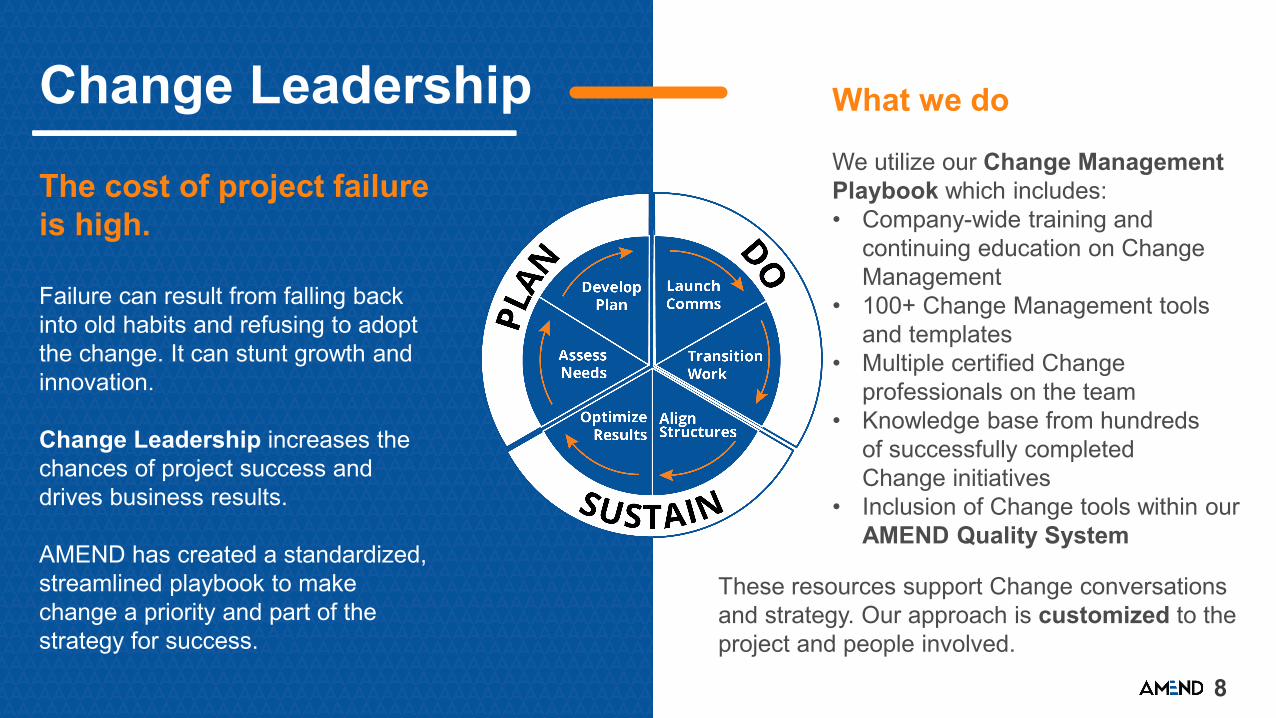
Change LeadershipThe cost of project failure is high.
Failure can result from falling back into old habits and refusing to adopt the change. It can stunt growth and innovation.
Change Leadership increases the chances of project success and drives business results.
AMEND has created a standardized, streamlined playbook to make change a priority and part of the strategy for success.
What we do
We utilize our Change Management Playbook which includes: • Company-wide training and
continuing education on Change Management
• 100+ Change Management tools and templates
• Multiple certified Change professionals on the team
• Knowledge base from hundredsof successfully completed Change initiatives
• Inclusion of Change tools within our AMEND Quality System
These resources support Change conversations and strategy. Our approach is customized to the project and people involved.

9
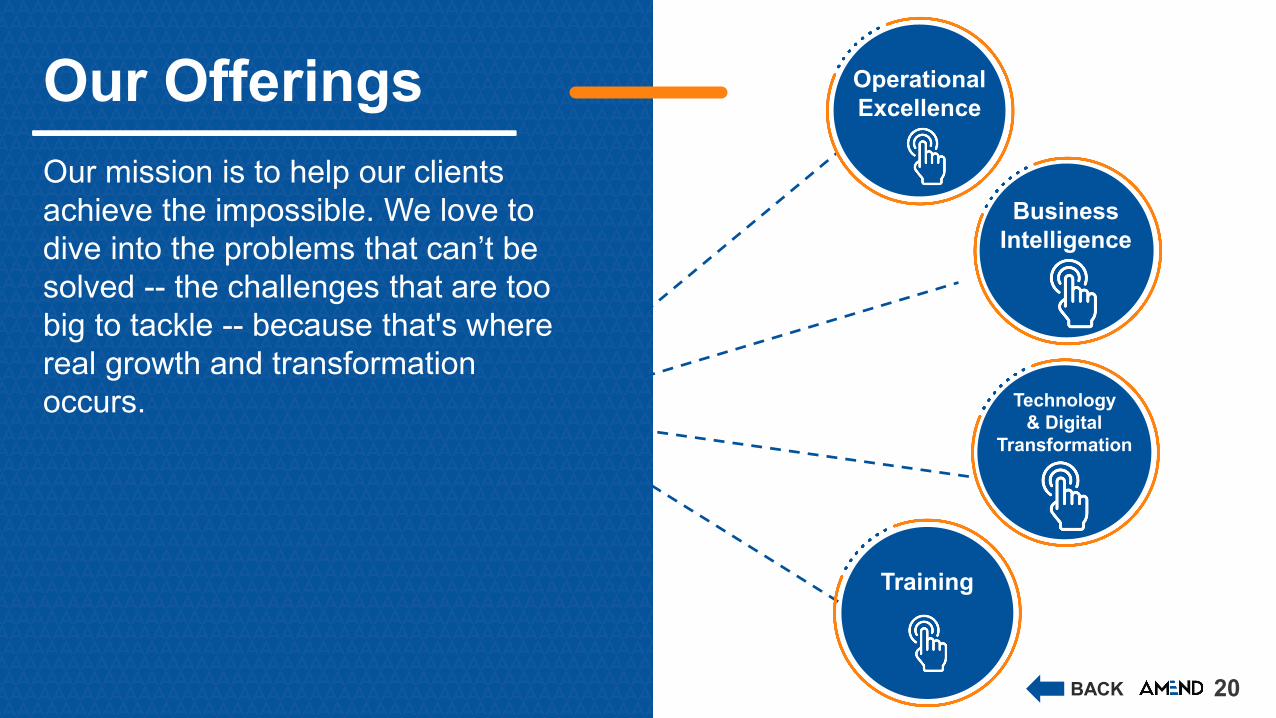
Our OfferingsOur mission is to help our clients achieve the impossible. We love to dive into the problems that can’t be solved -- the challenges that are too big to tackle -- because that's where real growth and transformation occurs.
Operational Excellence
Business Intelligence
Technology& Digital
Transformation
Training
BACK

10
Case Study Examples
11
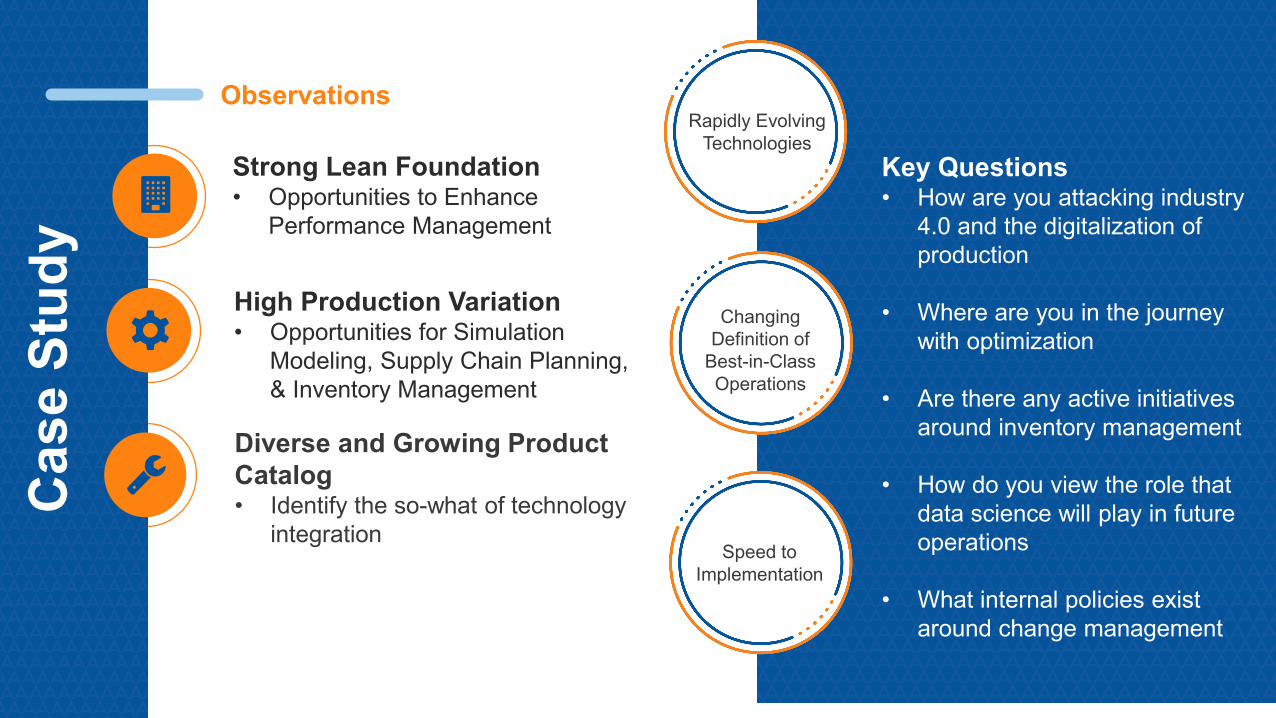
Observations
Diverse and Growing Product Catalog• Identify the so-what of technology
integration
Strong Lean Foundation• Opportunities to Enhance
Performance Management
High Production Variation• Opportunities for Simulation
Modeling, Supply Chain Planning, & Inventory Management
Cas
e St
udy
Key Questions• How are you attacking industry
4.0 and the digitalization of production
• Where are you in the journey with optimization
• Are there any active initiatives around inventory management
• How do you view the role that data science will play in future operations
• What internal policies exist around change management
Changing Definition of
Best-in-Class Operations
Speed to Implementation
Rapidly Evolving Technologies

12
Data Science as a ServiceCase Studies
13
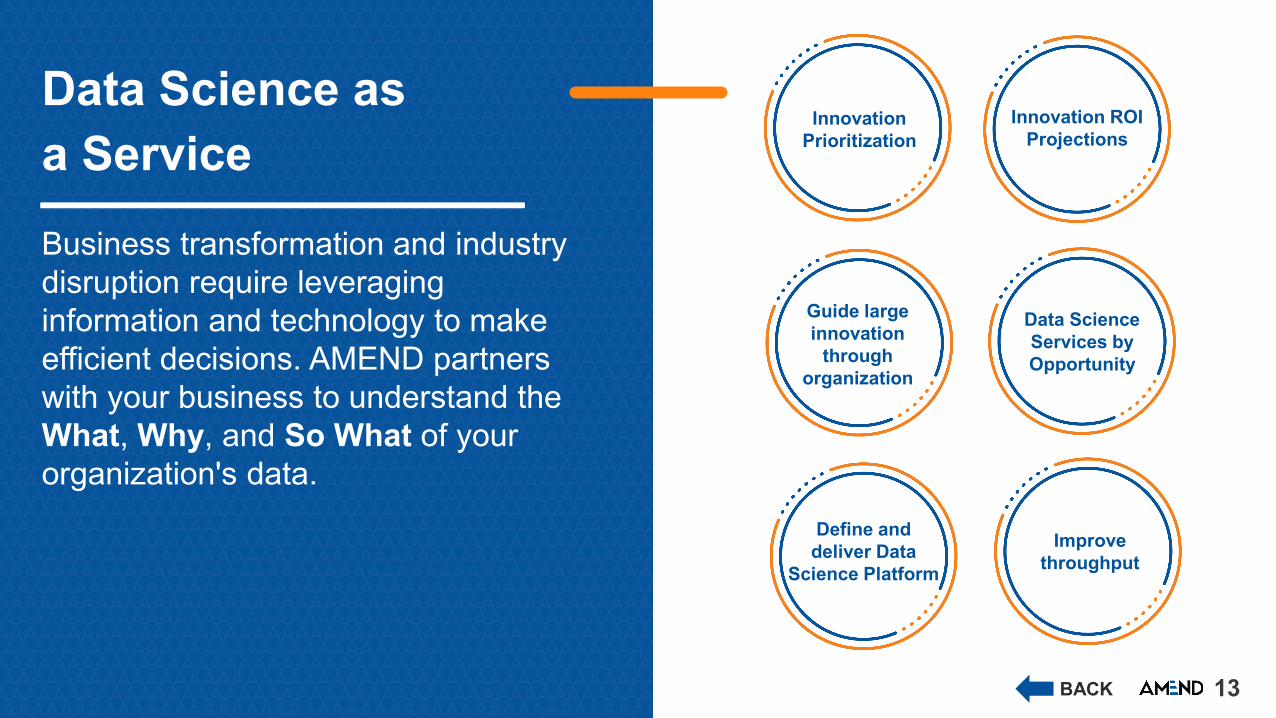
Data Science as a ServiceBusiness transformation and industry disruption require leveraging information and technology to make efficient decisions. AMEND partners with your business to understand the What, Why, and So What of your organization's data.
Define and deliver Data
Science Platform
Guide large innovation
through organization
Innovation Prioritization
Innovation ROI Projections
Improve throughput
Data Science Services by Opportunity
BACK
14
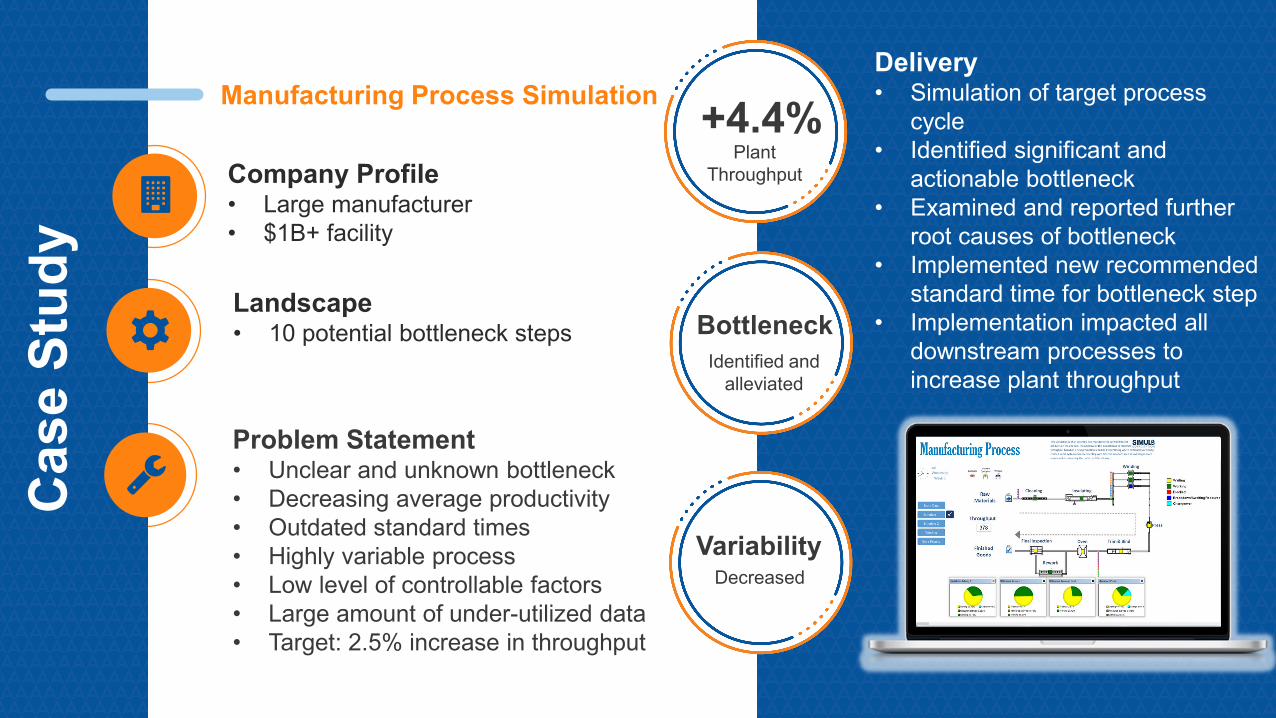
Manufacturing Process Simulation
Problem Statement• Unclear and unknown bottleneck• Decreasing average productivity• Outdated standard times• Highly variable process• Low level of controllable factors• Large amount of under-utilized data• Target: 2.5% increase in throughput
Company Profile• Large manufacturer• $1B+ facility
Landscape• 10 potential bottleneck steps
Cas
e St
udy
Delivery• Simulation of target process
cycle• Identified significant and
actionable bottleneck• Examined and reported further
root causes of bottleneck• Implemented new recommended
standard time for bottleneck step• Implementation impacted all
downstream processes to increase plant throughput
+4.4%Plant
Throughput
BottleneckIdentified and
alleviated
VariabilityDecreased
15
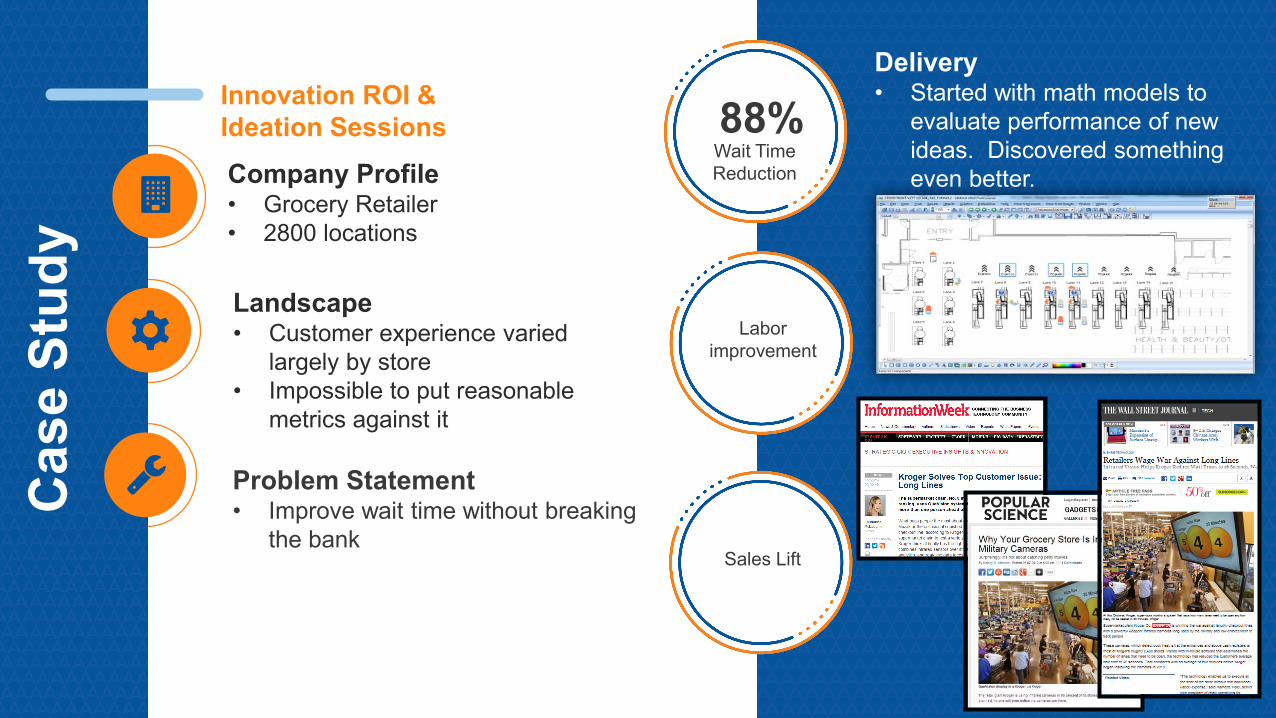
Innovation ROI &Ideation Sessions
Problem Statement• Improve wait time without breaking
the bank
Company Profile• Grocery Retailer• 2800 locations
Landscape• Customer experience varied
largely by store• Impossible to put reasonable
metrics against it
Cas
e St
udy
Delivery• Started with math models to
evaluate performance of new ideas. Discovered something even better.
88%Wait Time Reduction
Labor improvement
Sales Lift
16
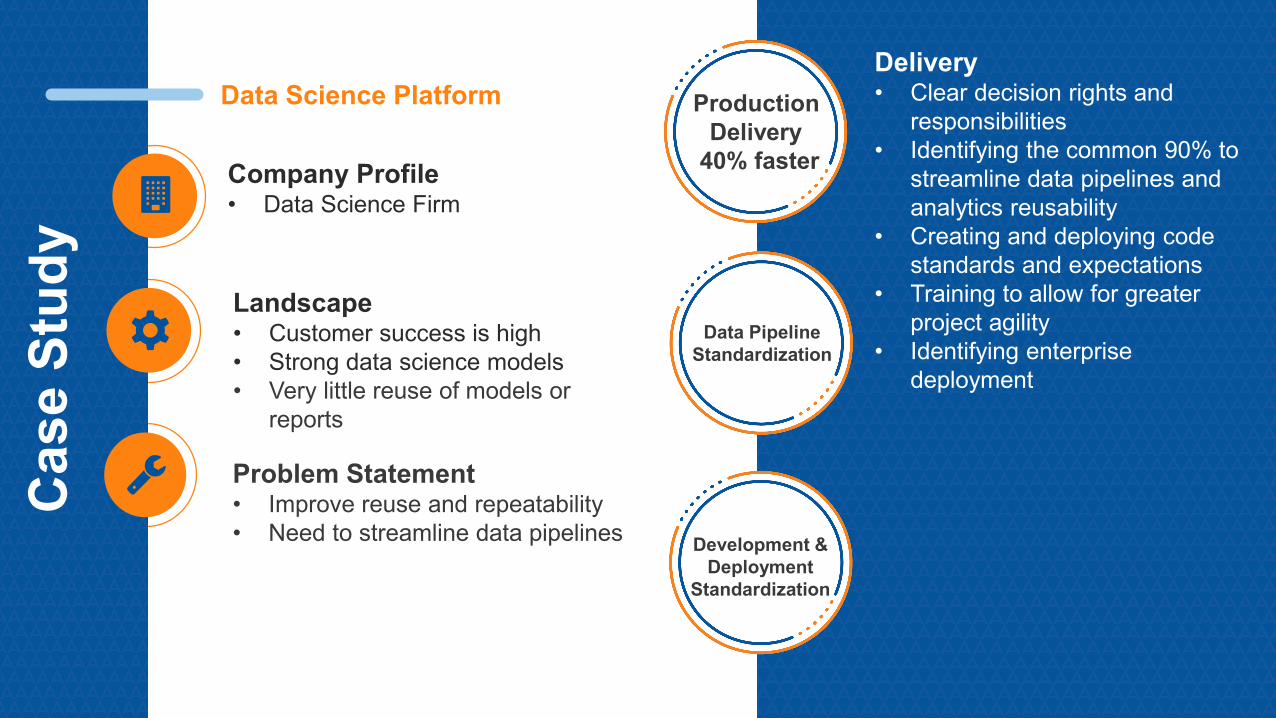
Data Science Platform
Problem Statement• Improve reuse and repeatability• Need to streamline data pipelines
Company Profile• Data Science Firm
Landscape• Customer success is high• Strong data science models• Very little reuse of models or
reports
Cas
e St
udy
Delivery• Clear decision rights and
responsibilities• Identifying the common 90% to
streamline data pipelines and analytics reusability
• Creating and deploying code standards and expectations
• Training to allow for greater project agility
• Identifying enterprise deployment
Production Delivery
40% faster
Data Pipeline Standardization
Development & Deployment
Standardization
17
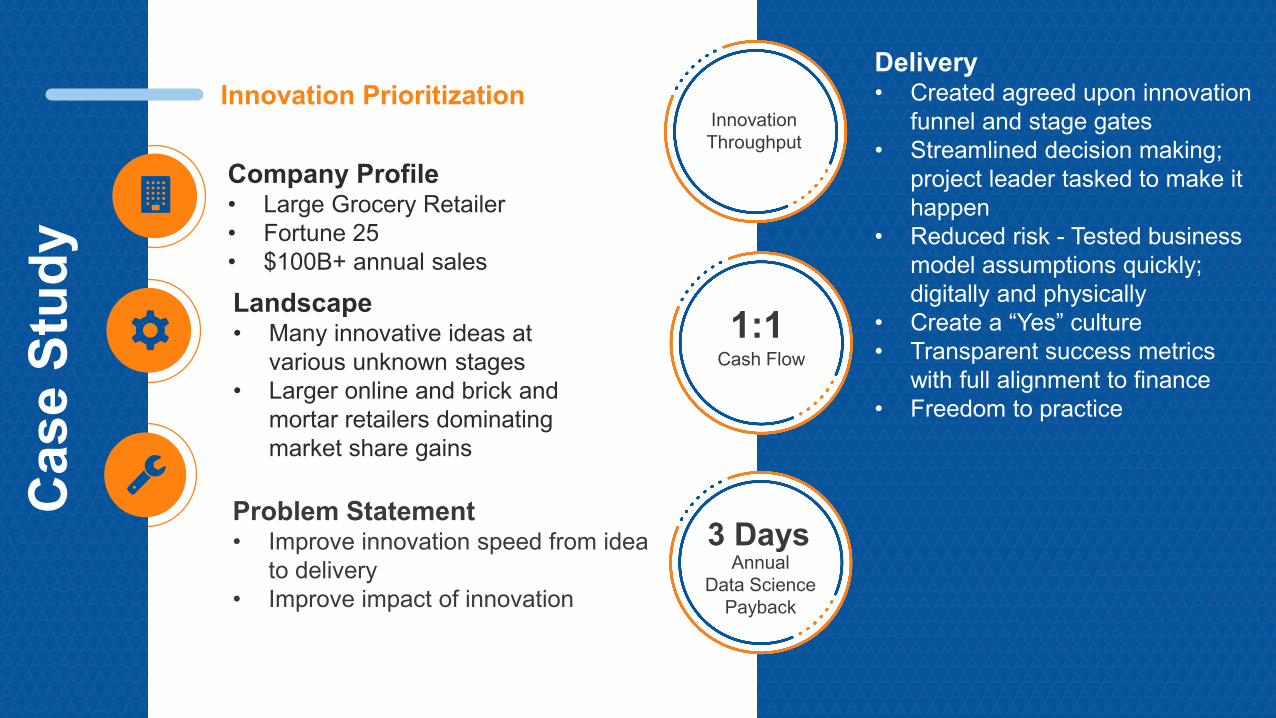
Innovation Prioritization
Problem Statement• Improve innovation speed from idea
to delivery• Improve impact of innovation
Company Profile• Large Grocery Retailer• Fortune 25• $100B+ annual sales
Landscape• Many innovative ideas at
various unknown stages• Larger online and brick and
mortar retailers dominating market share gains
Cas
e St
udy
Delivery• Created agreed upon innovation
funnel and stage gates• Streamlined decision making;
project leader tasked to make it happen
• Reduced risk - Tested business model assumptions quickly; digitally and physically
• Create a “Yes” culture• Transparent success metrics
with full alignment to finance• Freedom to practice
Innovation Throughput
1:1Cash Flow
3 DaysAnnual
Data Science Payback

18
Next StepsAUTOMATION

19
Appendix
20
Our OfferingsOur mission is to help our clients achieve the impossible. We love to dive into the problems that can’t be solved -- the challenges that are too big to tackle -- because that's where real growth and transformation occurs.
Operational Excellence
Business Intelligence
Technology& Digital
Transformation
Training
BACK
21
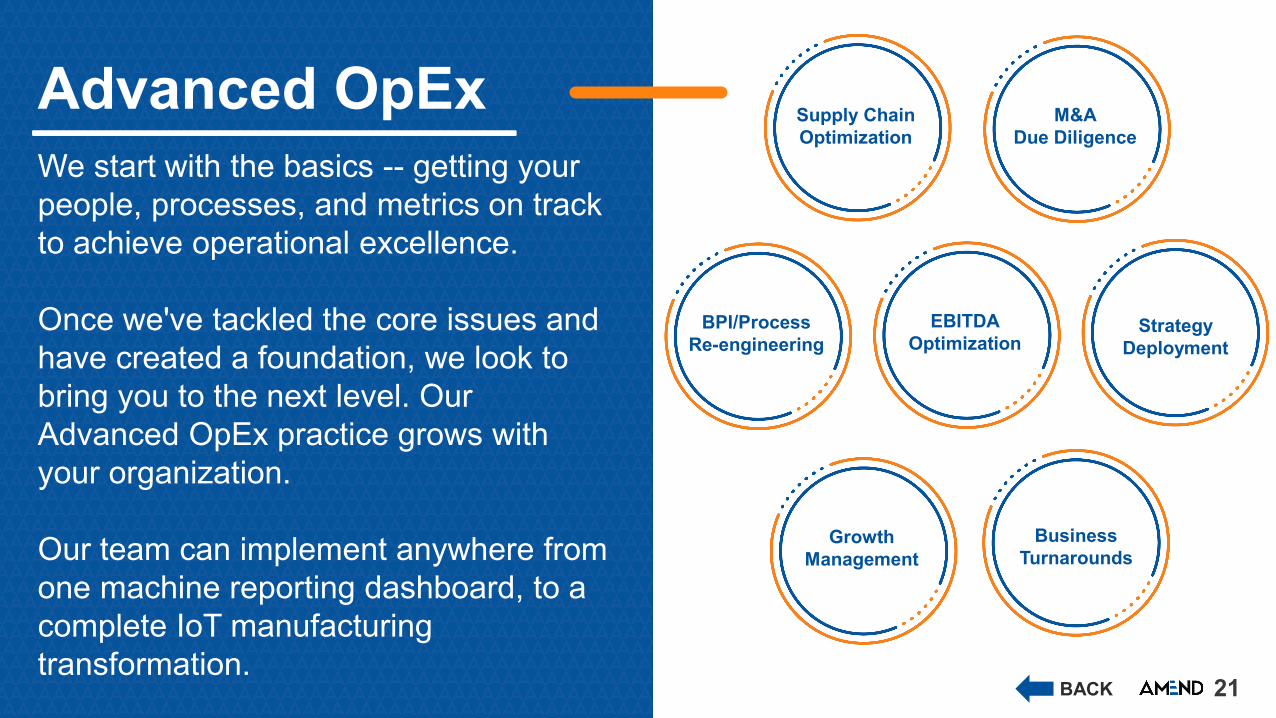
Advanced OpExWe start with the basics -- getting your people, processes, and metrics on track to achieve operational excellence.
Once we've tackled the core issues and have created a foundation, we look to bring you to the next level. Our Advanced OpEx practice grows with your organization.
Our team can implement anywhere from one machine reporting dashboard, to a complete IoT manufacturing transformation.
BusinessTurnarounds
BACK
Growth Management
BPI/ProcessRe-engineering
Supply ChainOptimization
M&ADue Diligence
EBITDAOptimization
BusinessTurnarounds
StrategyDeployment
22
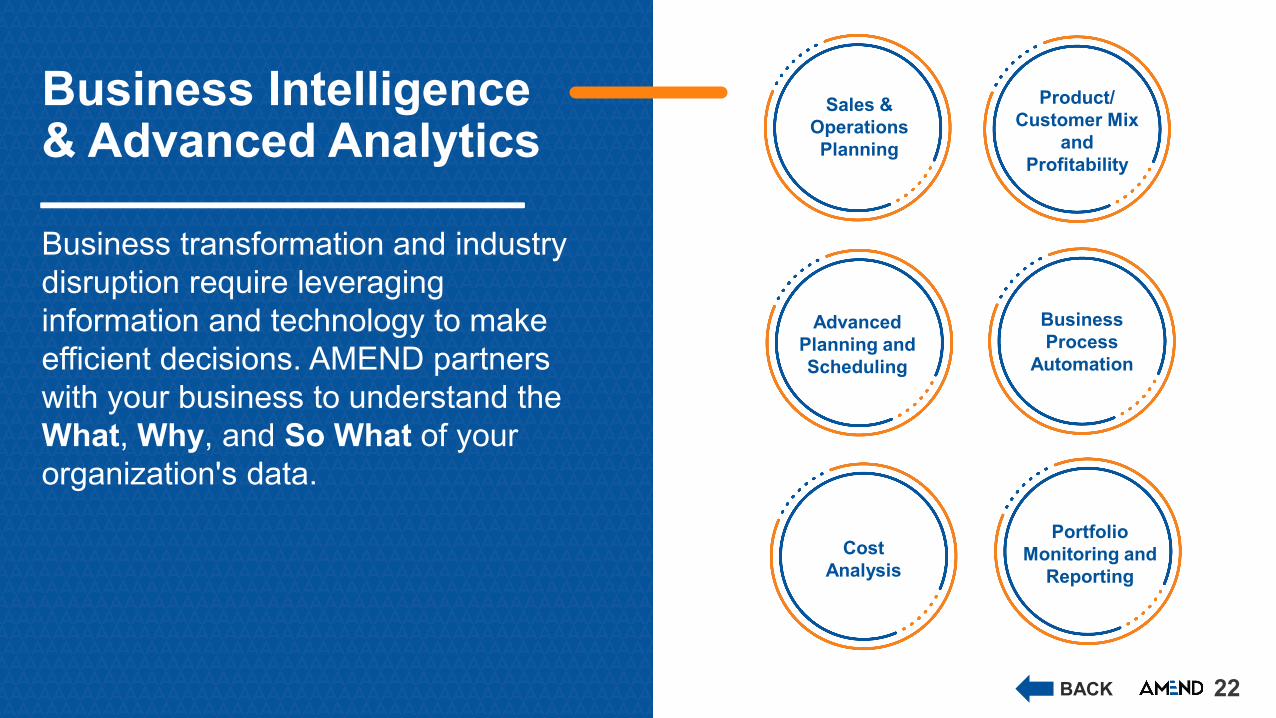
Business Intelligence & Advanced Analytics
Business transformation and industry disruption require leveraging information and technology to make efficient decisions. AMEND partners with your business to understand the What, Why, and So What of your organization's data.
Cost Analysis
Advanced Planning andScheduling
Sales & Operations Planning
Product/Customer Mix
andProfitability
Portfolio Monitoring and
Reporting
Business Process
Automation
BACK
23
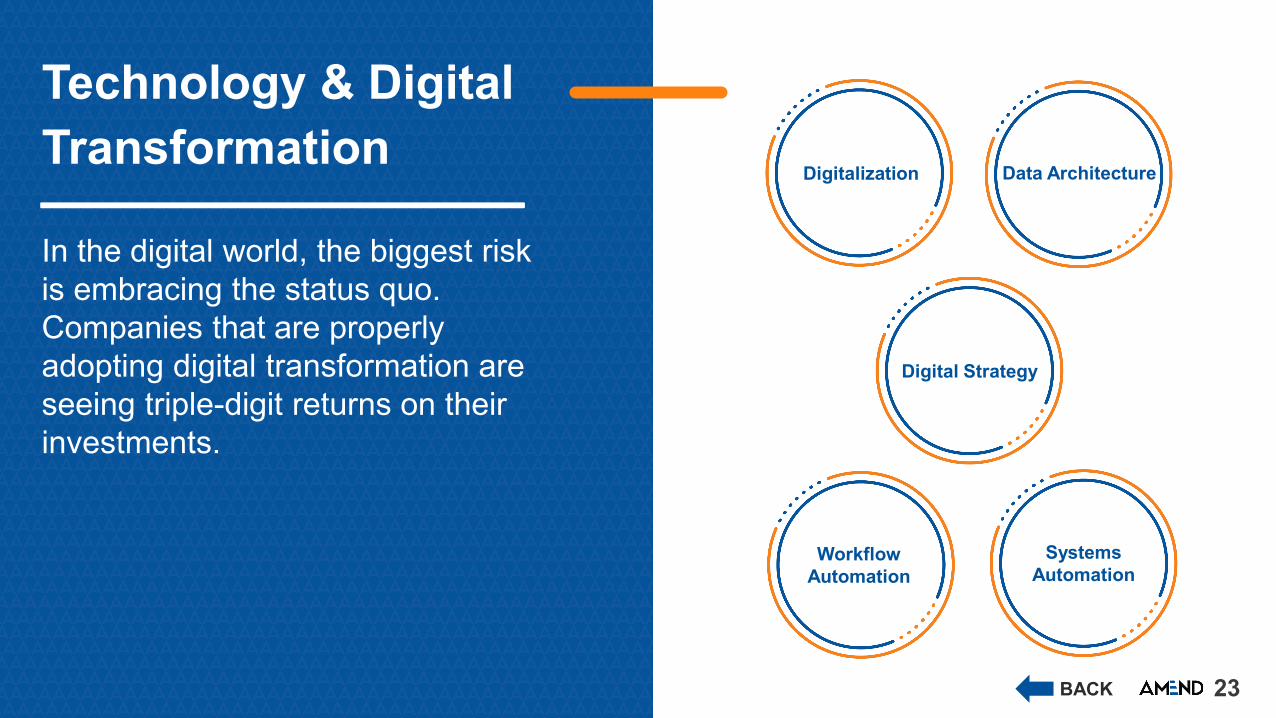
Technology & DigitalTransformation
In the digital world, the biggest risk is embracing the status quo. Companies that are properly adopting digital transformation are seeing triple-digit returns on their investments.
Digital Strategy
WorkflowAutomation
Digitalization Data Architecture
SystemsAutomation
BACK
24
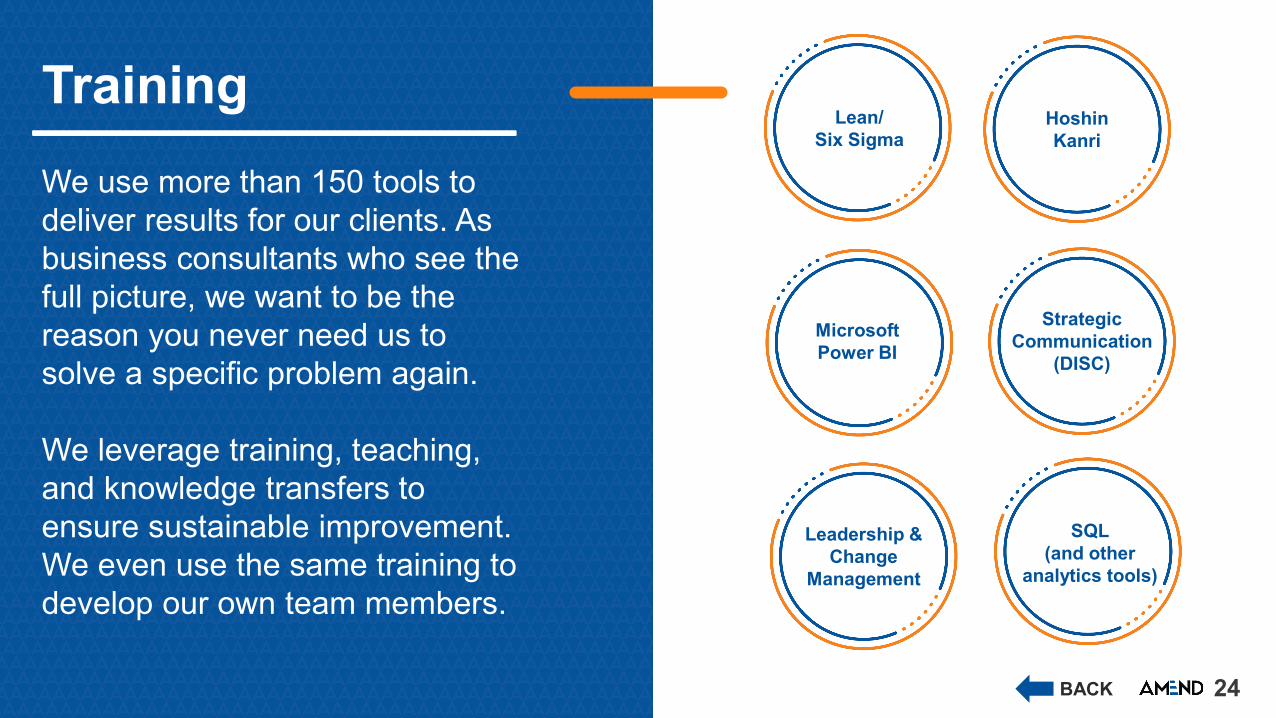
TrainingWe use more than 150 tools to deliver results for our clients. As business consultants who see the full picture, we want to be the reason you never need us to solve a specific problem again.
We leverage training, teaching, and knowledge transfers to ensure sustainable improvement. We even use the same training to develop our own team members.
Leadership &Change
Management
MicrosoftPower BI
Lean/Six Sigma
HoshinKanri
SQL(and other
analytics tools)
StrategicCommunication
(DISC)
BACK
25
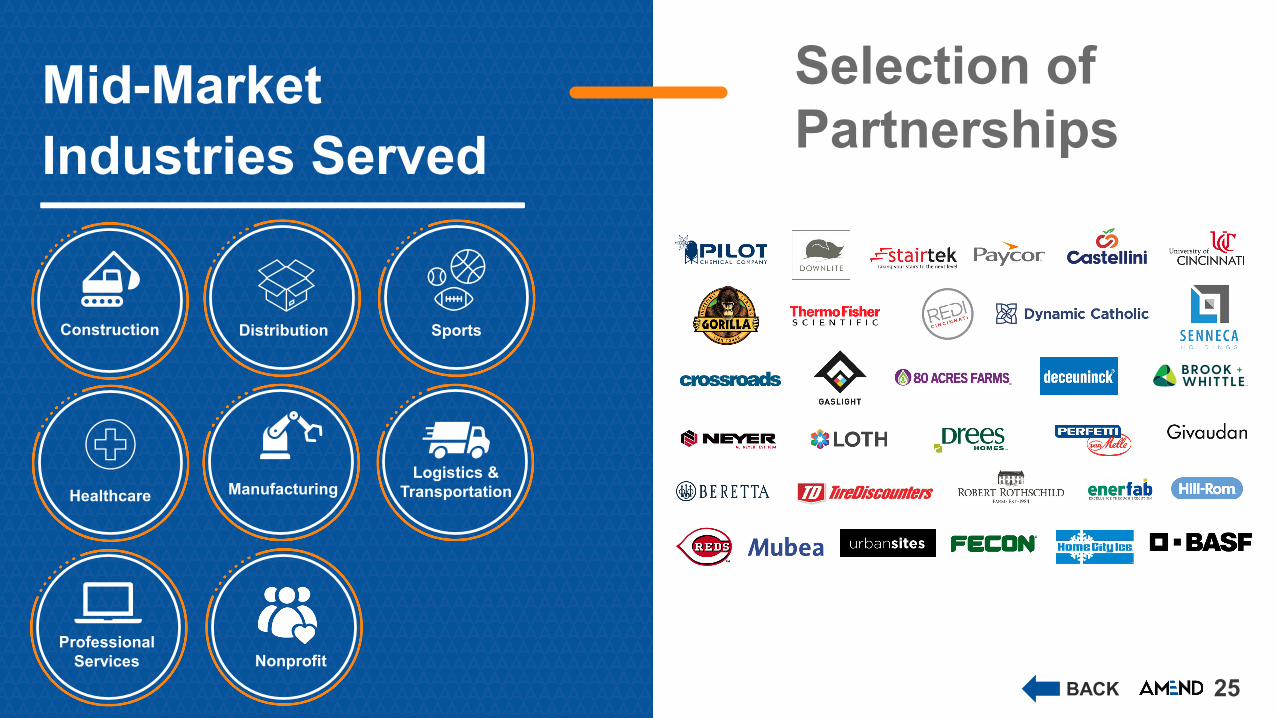
Mid-Market Industries Served
Construction Distribution Sports
Logistics &Transportation
ProfessionalServices Nonprofit
Selection of Partnerships
Healthcare Manufacturing
BACK
2626
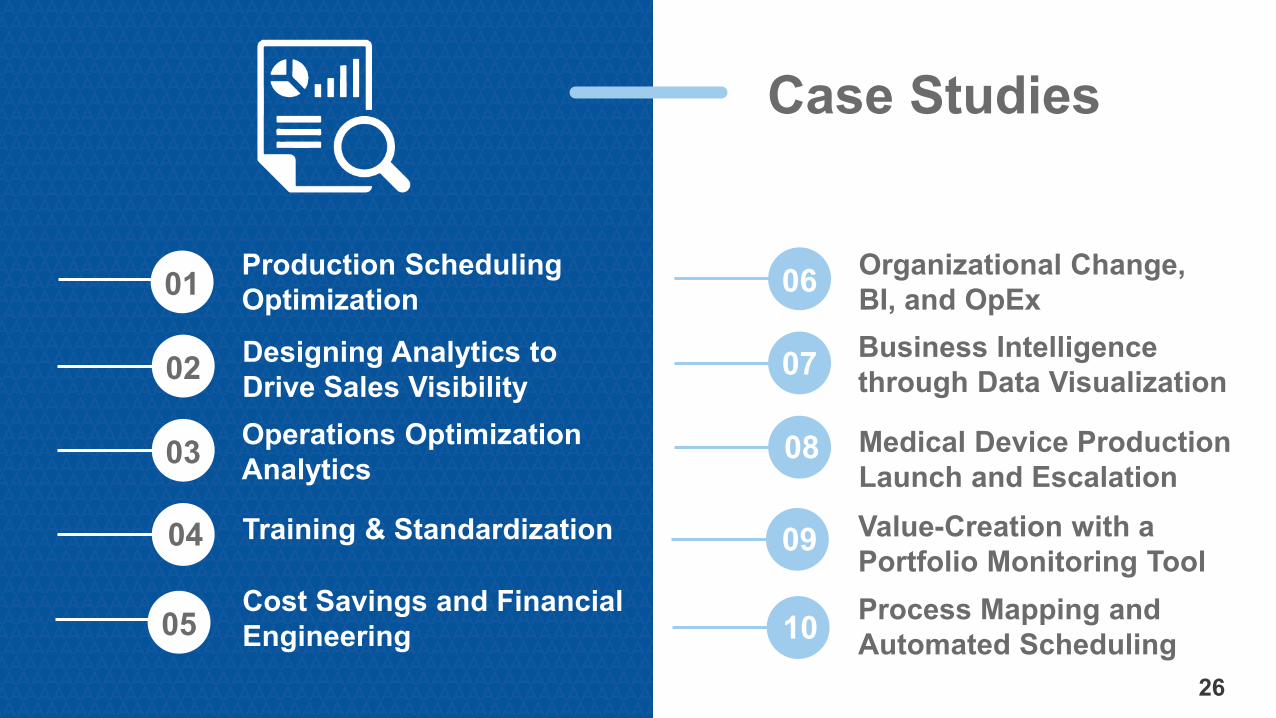
Case Studies
Production Scheduling Optimization
03 Operations Optimization Analytics
Training & Standardization
01
02 Designing Analytics to Drive Sales Visibility
04
Cost Savings and Financial Engineering
07 Business Intelligence through Data Visualization
Medical Device Production Launch and Escalation
05
06 Organizational Change, BI, and OpEx
08
Value-Creation with a Portfolio Monitoring Tool
09
Process Mapping and Automated Scheduling10
27
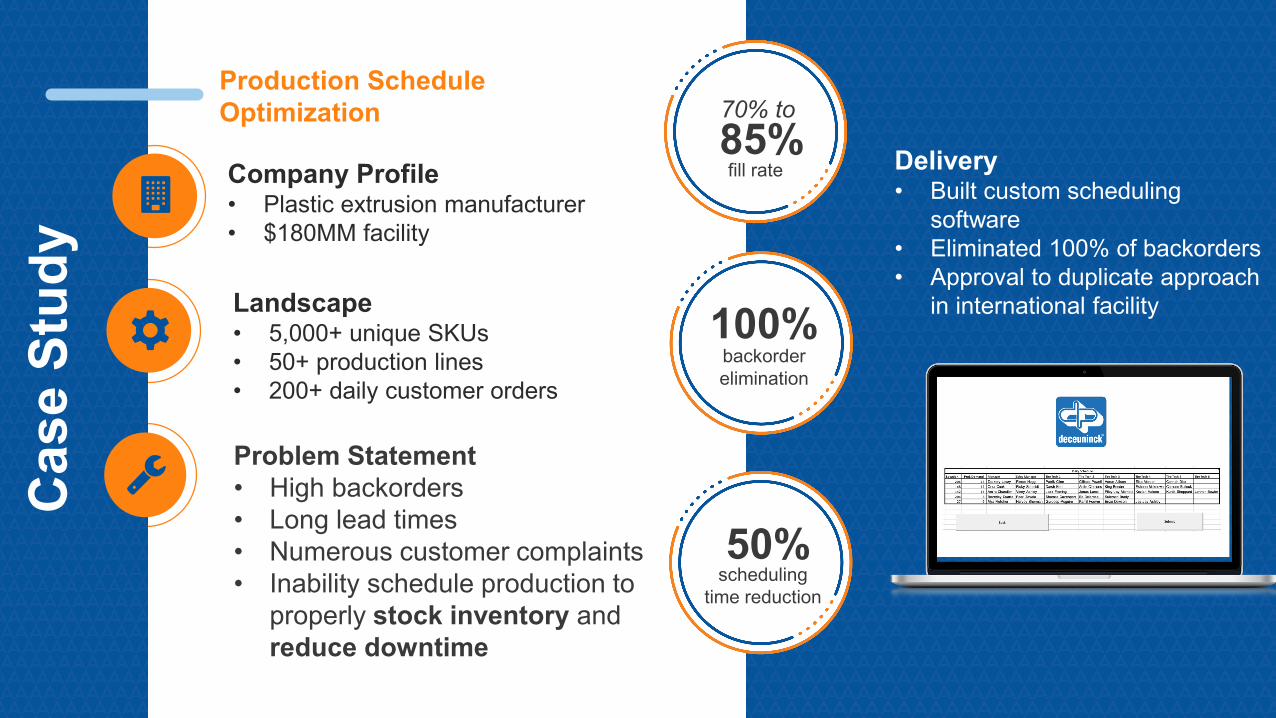
Production Schedule Optimization
Problem Statement• High backorders• Long lead times• Numerous customer complaints• Inability schedule production to
properly stock inventory and reduce downtime
Company Profile• Plastic extrusion manufacturer• $180MM facility
Landscape• 5,000+ unique SKUs• 50+ production lines• 200+ daily customer orders
Cas
e St
udy
Delivery• Built custom scheduling
software• Eliminated 100% of backorders• Approval to duplicate approach
in international facility
85%fill rate
70% to
100%backorder elimination
50%scheduling
time reduction
28
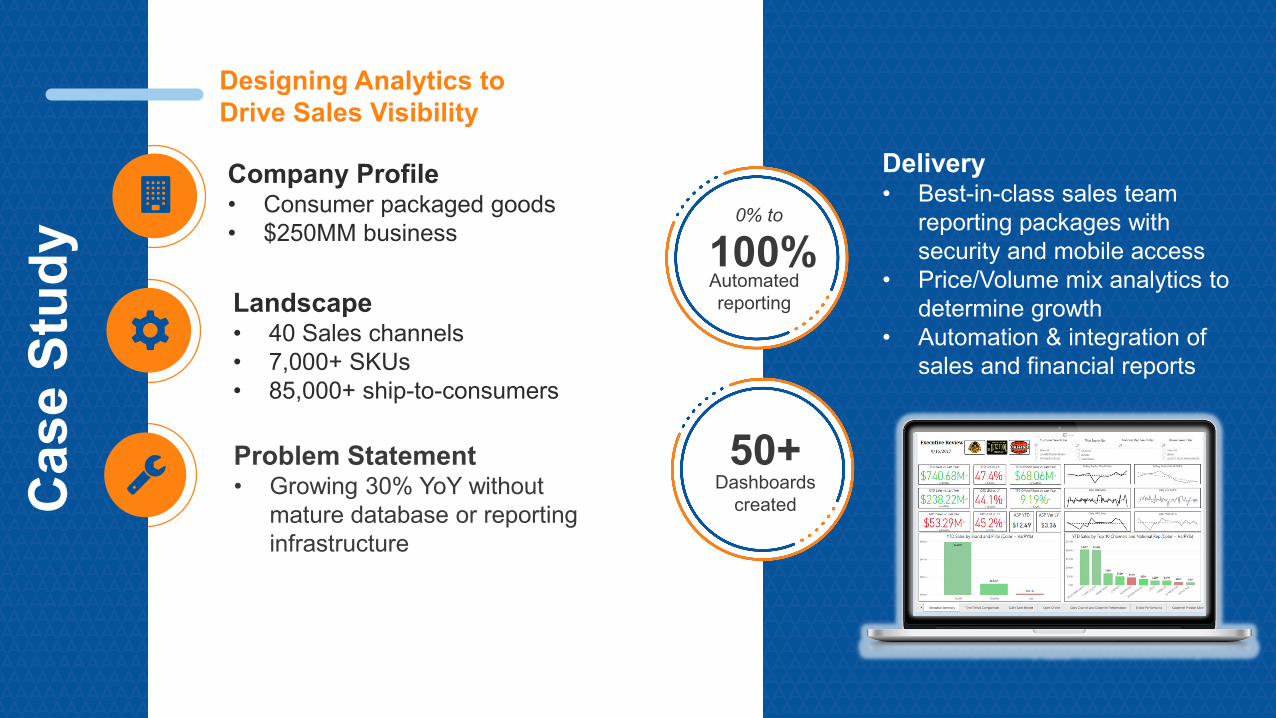
Designing Analytics to Drive Sales Visibility
Problem Statement• Growing 30% YoY without
mature database or reporting infrastructure
Company Profile• Consumer packaged goods• $250MM business
Landscape• 40 Sales channels• 7,000+ SKUs• 85,000+ ship-to-consumers
Cas
e St
udy
Delivery• Best-in-class sales team
reporting packages with security and mobile access
• Price/Volume mix analytics to determine growth
• Automation & integration of sales and financial reports
100%Automated reporting
0% to
50+Dashboards
created
29
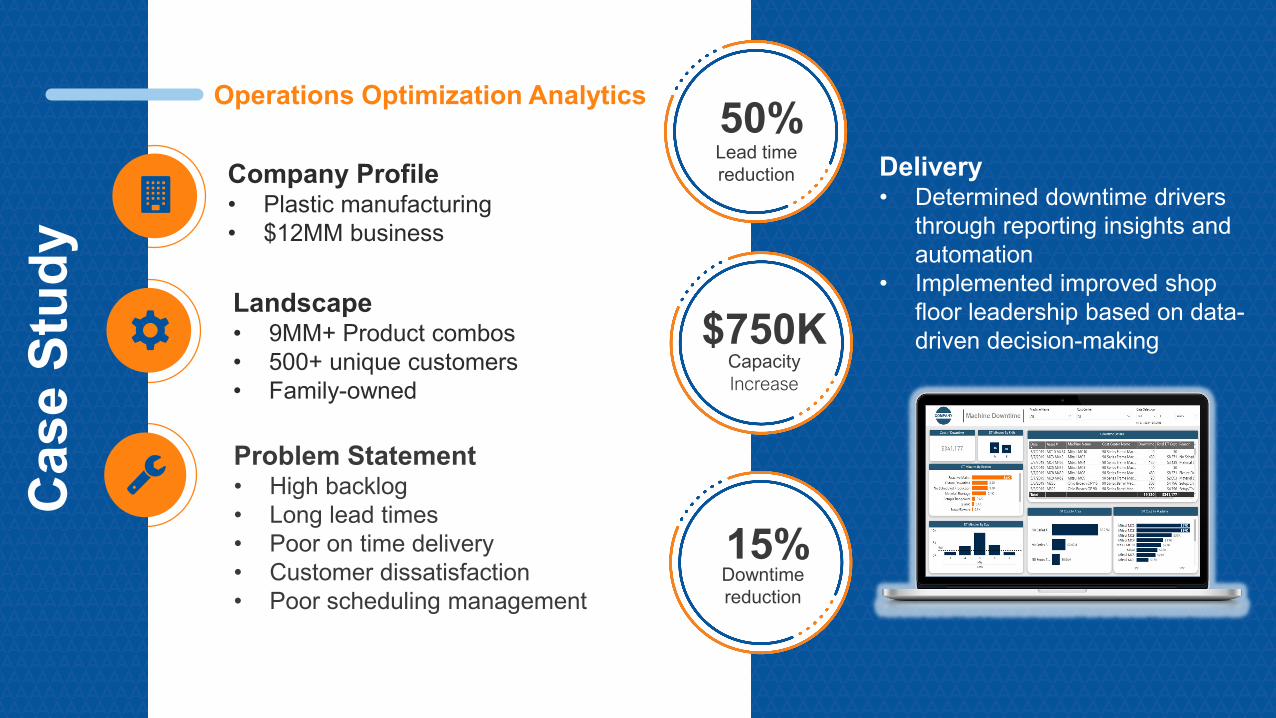
Operations Optimization Analytics
Problem Statement• High backlog• Long lead times• Poor on time delivery• Customer dissatisfaction• Poor scheduling management
Company Profile• Plastic manufacturing• $12MM business
Landscape• 9MM+ Product combos• 500+ unique customers• Family-owned
Cas
e St
udy
Delivery• Determined downtime drivers
through reporting insights and automation
• Implemented improved shop floor leadership based on data-driven decision-making
50%Lead time reduction
$750KCapacity Increase
15%Downtime reduction
30
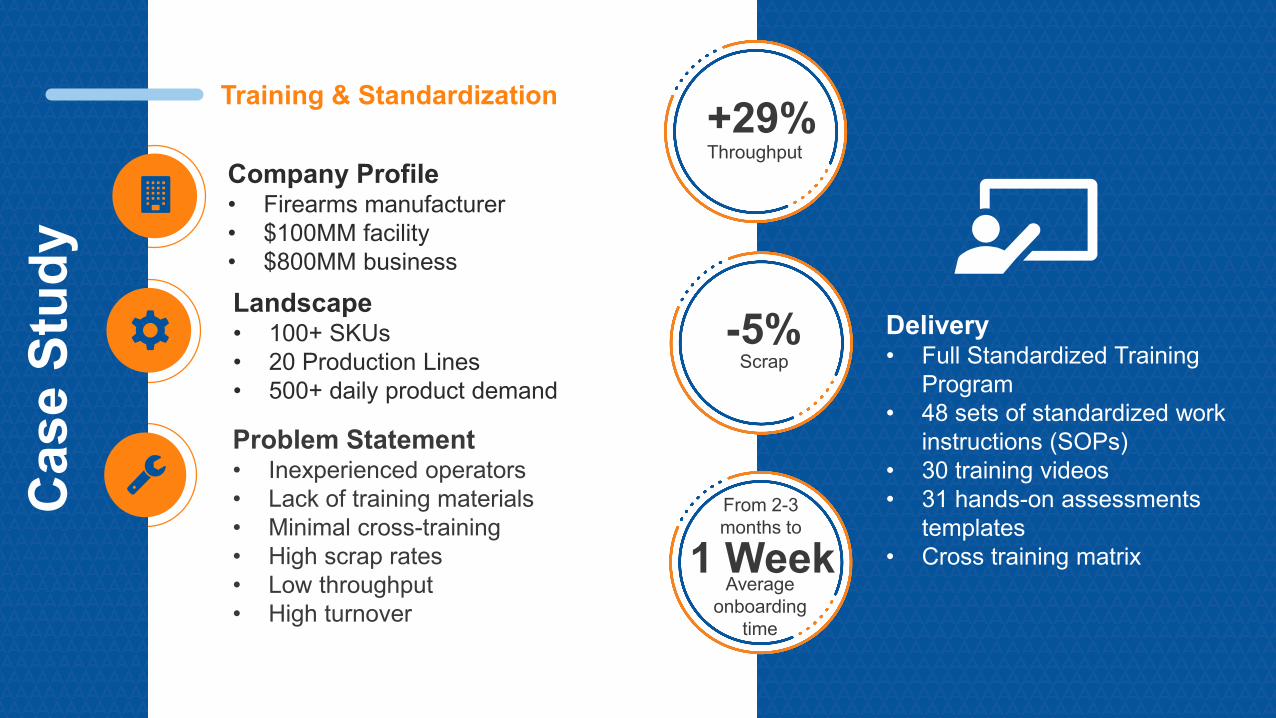
Training & Standardization
Problem Statement• Inexperienced operators • Lack of training materials • Minimal cross-training• High scrap rates• Low throughput• High turnover
Company Profile• Firearms manufacturer• $100MM facility• $800MM business
Landscape• 100+ SKUs• 20 Production Lines• 500+ daily product demand
Cas
e St
udy
Delivery• Full Standardized Training
Program• 48 sets of standardized work
instructions (SOPs)• 30 training videos• 31 hands-on assessments
templates• Cross training matrix
+29%Throughput
-5%Scrap
1 WeekAverage
onboardingtime
From 2-3 months to
31
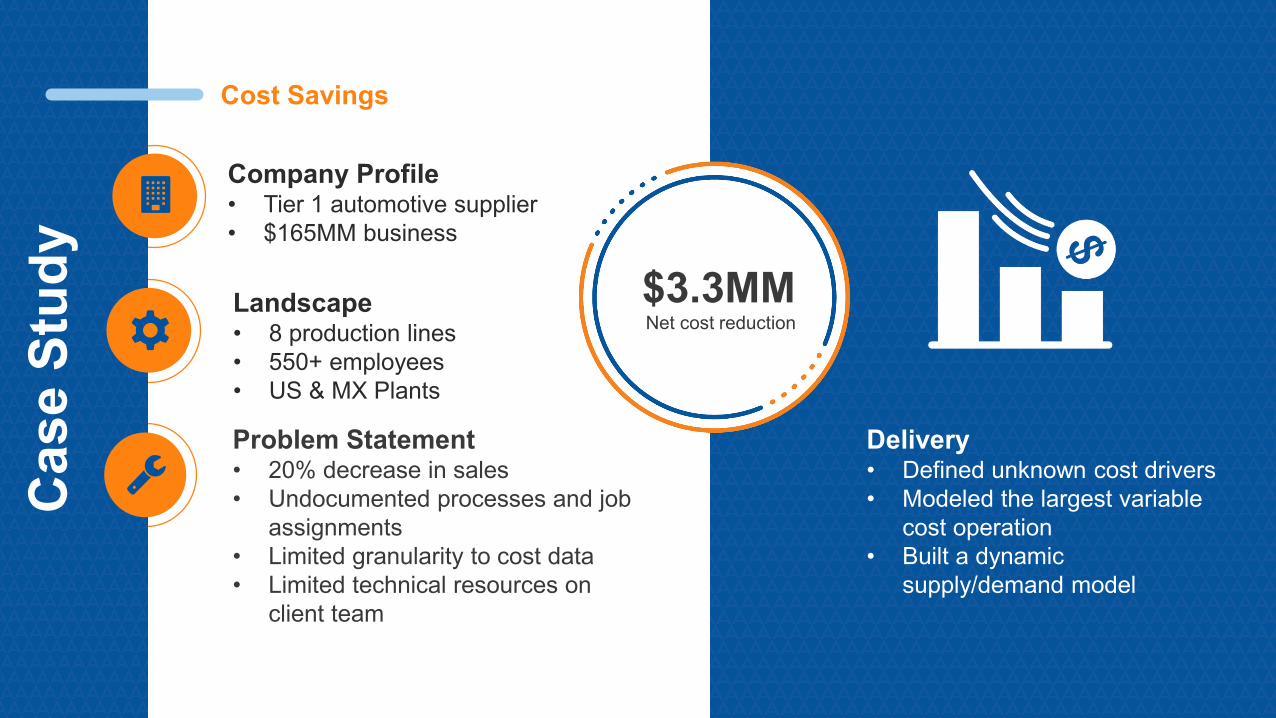
Cost Savings
Problem Statement• 20% decrease in sales• Undocumented processes and job
assignments• Limited granularity to cost data• Limited technical resources on
client team
Company Profile• Tier 1 automotive supplier• $165MM business
Landscape• 8 production lines• 550+ employees• US & MX Plants
Cas
e St
udy
Delivery• Defined unknown cost drivers• Modeled the largest variable
cost operation• Built a dynamic
supply/demand model
$3.3MMNet cost reduction
32
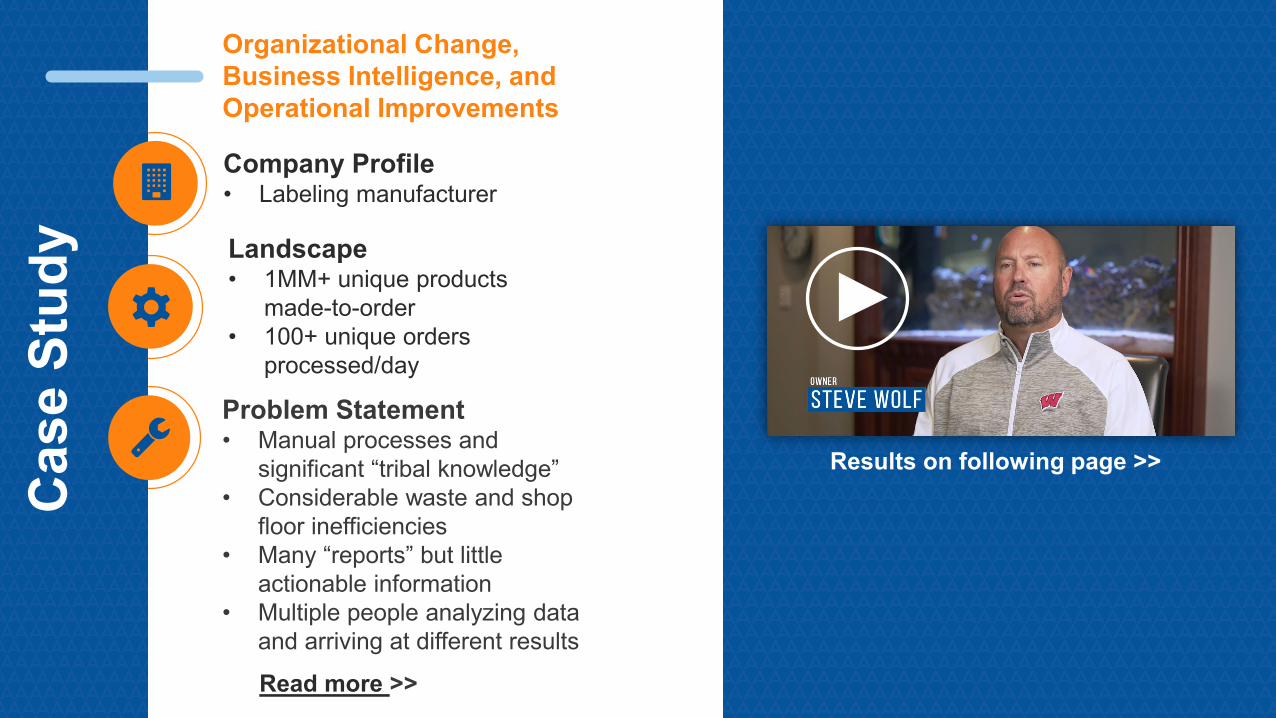
Organizational Change, Business Intelligence, andOperational Improvements
Problem Statement• Manual processes and
significant “tribal knowledge”• Considerable waste and shop
floor inefficiencies• Many “reports” but little
actionable information• Multiple people analyzing data
and arriving at different results
Company Profile• Labeling manufacturer
Landscape• 1MM+ unique products
made-to-order• 100+ unique orders
processed/day
Cas
e St
udy
Read more >>
Results on following page >>
33
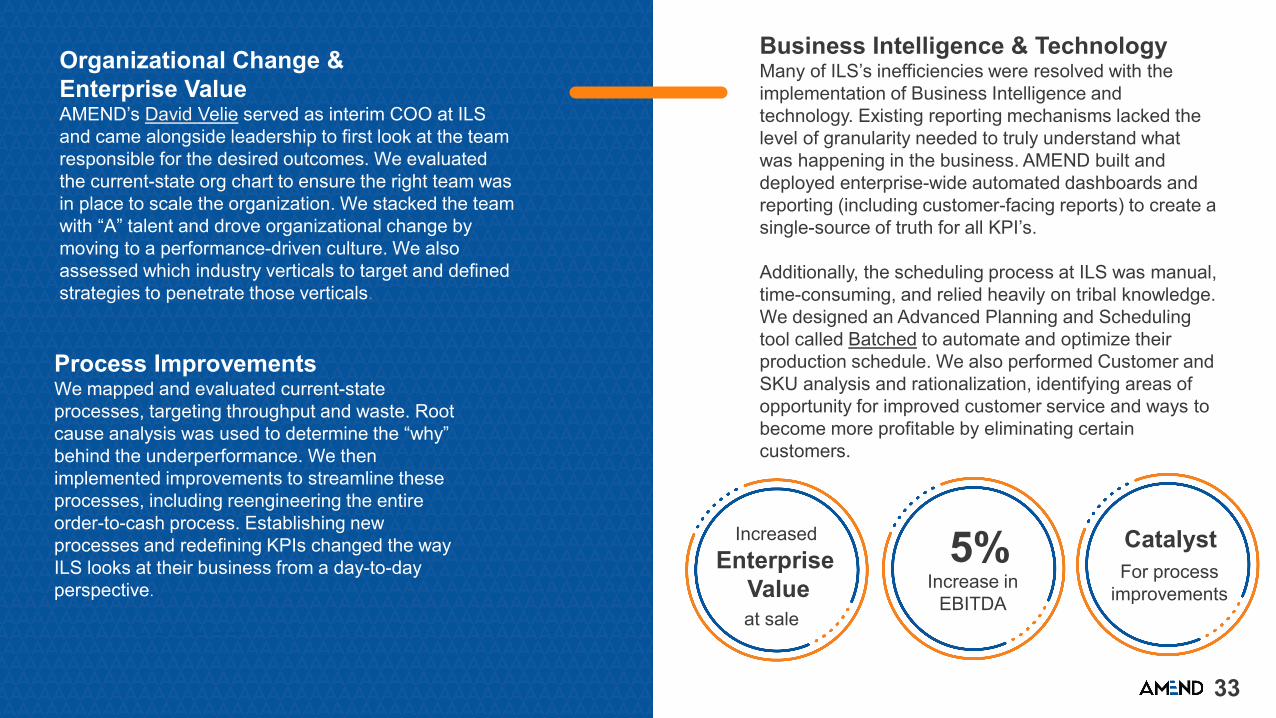
5%Increase in
EBITDA
CatalystFor process
improvements
Enterprise Valueat sale
Increased
Organizational Change & Enterprise ValueAMEND’s David Velie served as interim COO at ILS and came alongside leadership to first look at the team responsible for the desired outcomes. We evaluated the current-state org chart to ensure the right team was in place to scale the organization. We stacked the team with “A” talent and drove organizational change by moving to a performance-driven culture. We also assessed which industry verticals to target and defined strategies to penetrate those verticals.
Process ImprovementsWe mapped and evaluated current-state processes, targeting throughput and waste. Root cause analysis was used to determine the “why” behind the underperformance. We then implemented improvements to streamline these processes, including reengineering the entire order-to-cash process. Establishing new processes and redefining KPIs changed the way ILS looks at their business from a day-to-day perspective.
Business Intelligence & TechnologyMany of ILS’s inefficiencies were resolved with the implementation of Business Intelligence and technology. Existing reporting mechanisms lacked the level of granularity needed to truly understand what was happening in the business. AMEND built and deployed enterprise-wide automated dashboards and reporting (including customer-facing reports) to create a single-source of truth for all KPI’s.
Additionally, the scheduling process at ILS was manual, time-consuming, and relied heavily on tribal knowledge. We designed an Advanced Planning and Scheduling tool called Batched to automate and optimize their production schedule. We also performed Customer and SKU analysis and rationalization, identifying areas of opportunity for improved customer service and ways to become more profitable by eliminating certain customers.
34
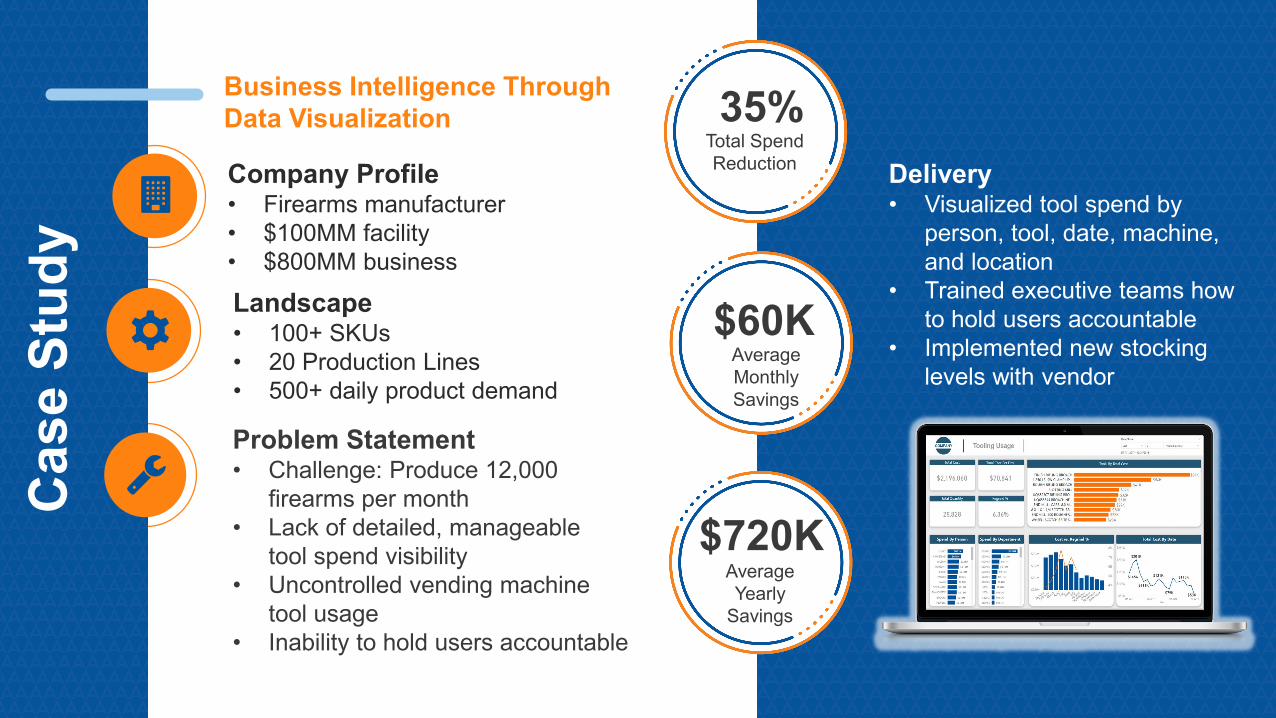
Business Intelligence ThroughData Visualization
Problem Statement• Challenge: Produce 12,000
firearms per month• Lack of detailed, manageable
tool spend visibility• Uncontrolled vending machine
tool usage• Inability to hold users accountable
Company Profile• Firearms manufacturer• $100MM facility• $800MM business
Landscape• 100+ SKUs• 20 Production Lines• 500+ daily product demand
Cas
e St
udy
Delivery• Visualized tool spend by
person, tool, date, machine, and location
• Trained executive teams how to hold users accountable
• Implemented new stocking levels with vendor
35%Total SpendReduction
$60KAverage Monthly Savings
$720KAverage Yearly
Savings
35
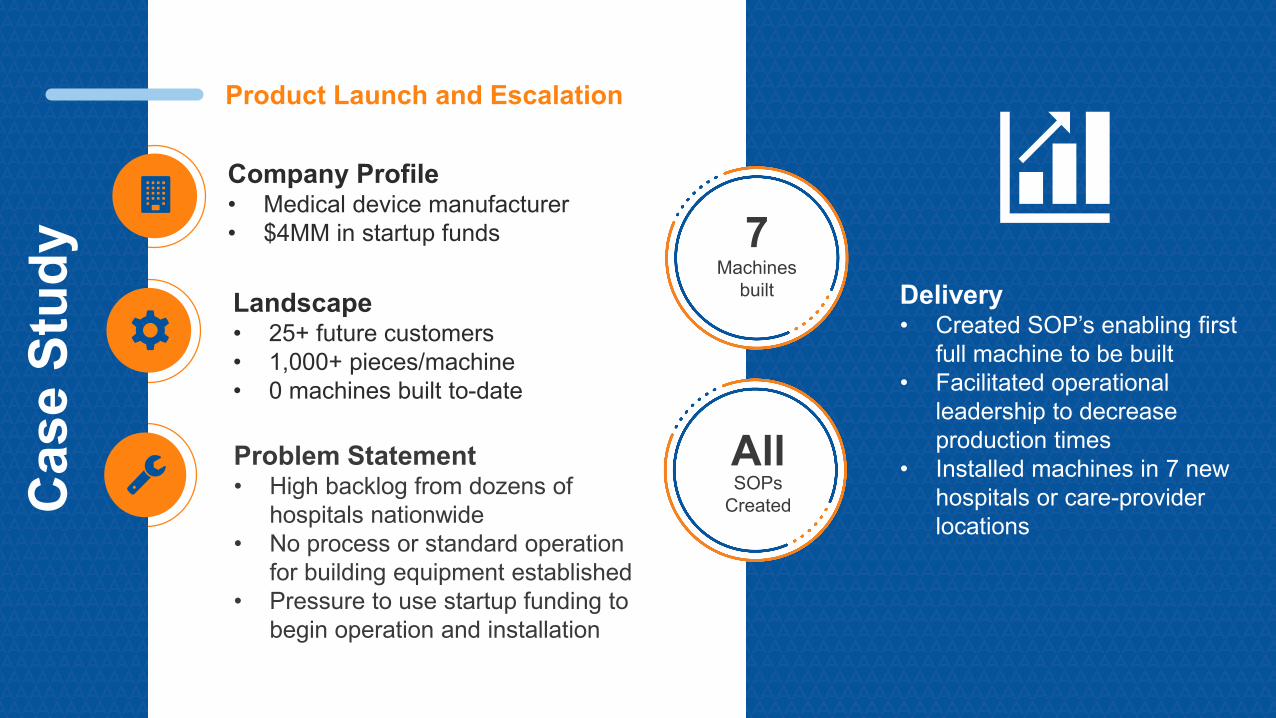
Product Launch and Escalation
Problem Statement• High backlog from dozens of
hospitals nationwide• No process or standard operation
for building equipment established• Pressure to use startup funding to
begin operation and installation
Company Profile• Medical device manufacturer• $4MM in startup funds
Landscape• 25+ future customers• 1,000+ pieces/machine• 0 machines built to-date
Cas
e St
udy
Delivery• Created SOP’s enabling first
full machine to be built• Facilitated operational
leadership to decrease production times
• Installed machines in 7 new hospitals or care-provider locations
7Machines
built
AllSOPs
Created
36
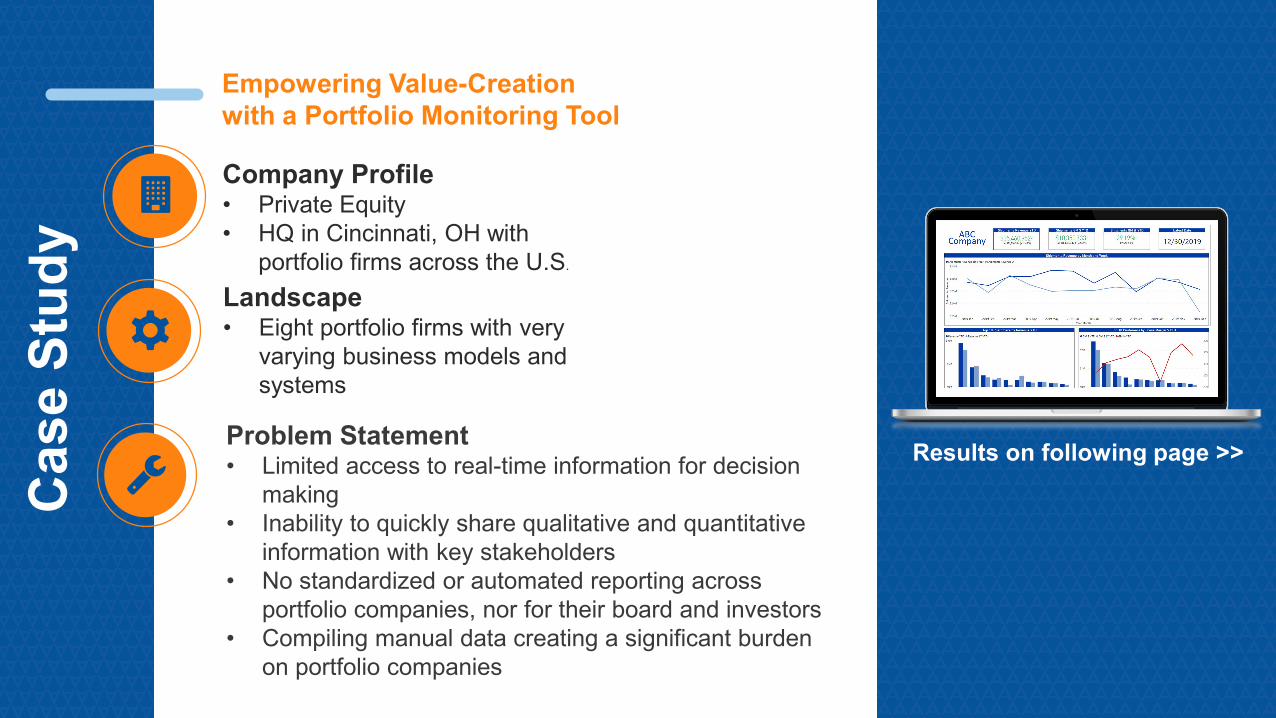
Empowering Value-Creation with a Portfolio Monitoring Tool
Problem Statement• Limited access to real-time information for decision
making• Inability to quickly share qualitative and quantitative
information with key stakeholders• No standardized or automated reporting across
portfolio companies, nor for their board and investors• Compiling manual data creating a significant burden
on portfolio companies
Company Profile• Private Equity• HQ in Cincinnati, OH with
portfolio firms across the U.S.
Landscape• Eight portfolio firms with very
varying business models and systems
Cas
e St
udy
Results on following page >>
37
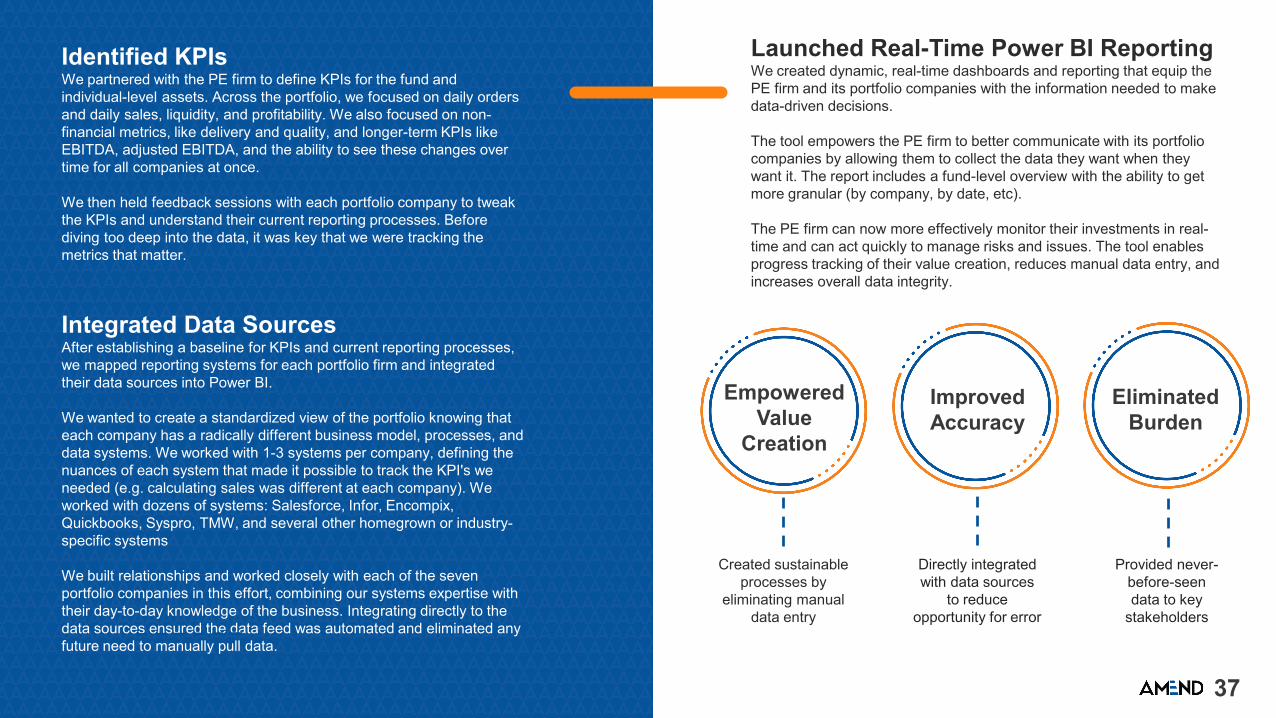
EliminatedBurden
ImprovedAccuracy
EmpoweredValue
Creation
Identified KPIsWe partnered with the PE firm to define KPIs for the fund and individual-level assets. Across the portfolio, we focused on daily orders and daily sales, liquidity, and profitability. We also focused on non-financial metrics, like delivery and quality, and longer-term KPIs like EBITDA, adjusted EBITDA, and the ability to see these changes over time for all companies at once.
We then held feedback sessions with each portfolio company to tweak the KPIs and understand their current reporting processes. Before diving too deep into the data, it was key that we were tracking the metrics that matter.
Integrated Data SourcesAfter establishing a baseline for KPIs and current reporting processes, we mapped reporting systems for each portfolio firm and integrated their data sources into Power BI.
We wanted to create a standardized view of the portfolio knowing that each company has a radically different business model, processes, and data systems. We worked with 1-3 systems per company, defining the nuances of each system that made it possible to track the KPI's we needed (e.g. calculating sales was different at each company). We worked with dozens of systems: Salesforce, Infor, Encompix, Quickbooks, Syspro, TMW, and several other homegrown or industry-specific systems
We built relationships and worked closely with each of the seven portfolio companies in this effort, combining our systems expertise with their day-to-day knowledge of the business. Integrating directly to the data sources ensured the data feed was automated and eliminated any future need to manually pull data.
Launched Real-Time Power BI ReportingWe created dynamic, real-time dashboards and reporting that equip the PE firm and its portfolio companies with the information needed to make data-driven decisions.
The tool empowers the PE firm to better communicate with its portfolio companies by allowing them to collect the data they want when they want it. The report includes a fund-level overview with the ability to get more granular (by company, by date, etc).
The PE firm can now more effectively monitor their investments in real-time and can act quickly to manage risks and issues. The tool enables progress tracking of their value creation, reduces manual data entry, and increases overall data integrity.
Created sustainable processes by
eliminating manual data entry
Directly integrated with data sources
to reduce opportunity for error
Provided never-before-seen data to key
stakeholders
38
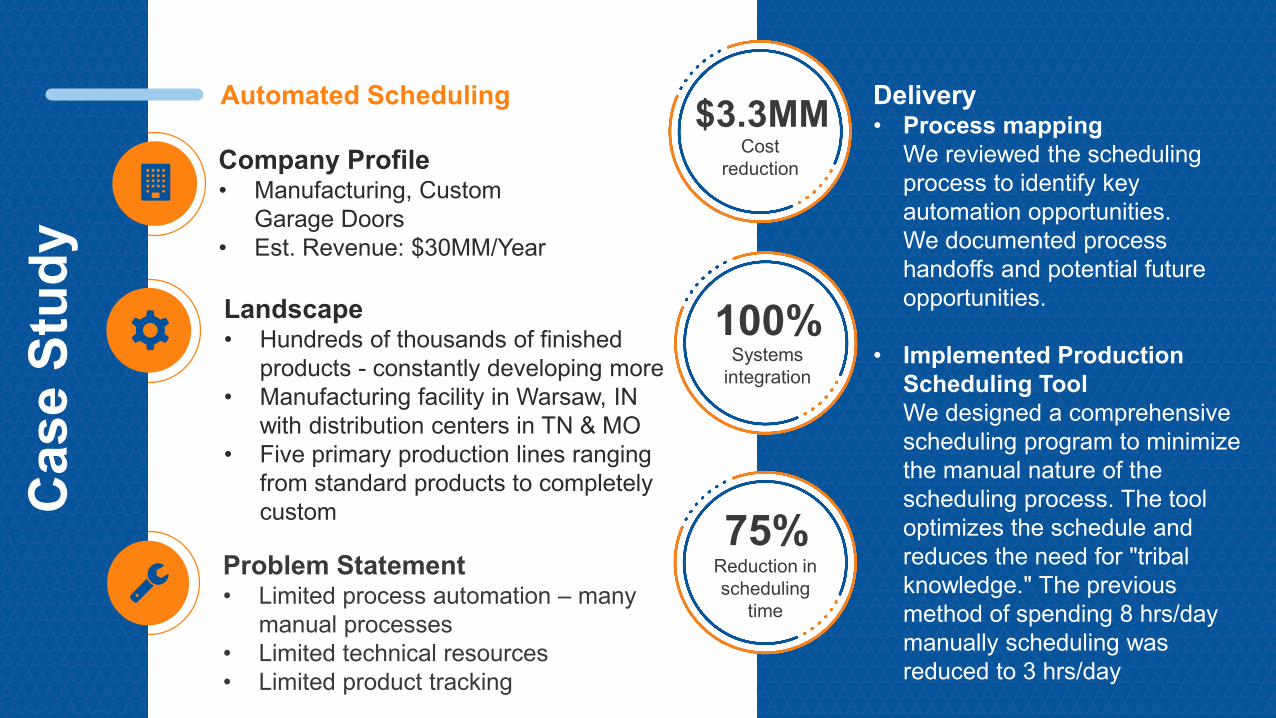
Automated Scheduling
Problem Statement• Limited process automation – many
manual processes• Limited technical resources• Limited product tracking
Company Profile• Manufacturing, Custom
Garage Doors• Est. Revenue: $30MM/Year
Landscape• Hundreds of thousands of finished
products - constantly developing more• Manufacturing facility in Warsaw, IN
with distribution centers in TN & MO• Five primary production lines ranging
from standard products to completely customC
ase
Stud
yDelivery• Process mapping
We reviewed the scheduling process to identify key automation opportunities. We documented process handoffs and potential future opportunities.
• Implemented Production Scheduling ToolWe designed a comprehensive scheduling program to minimize the manual nature of the scheduling process. The tool optimizes the schedule and reduces the need for "tribal knowledge." The previous method of spending 8 hrs/day manually scheduling was reduced to 3 hrs/day
$3.3MMCost
reduction
100%Systems
integration
75%Reduction in scheduling
time
39
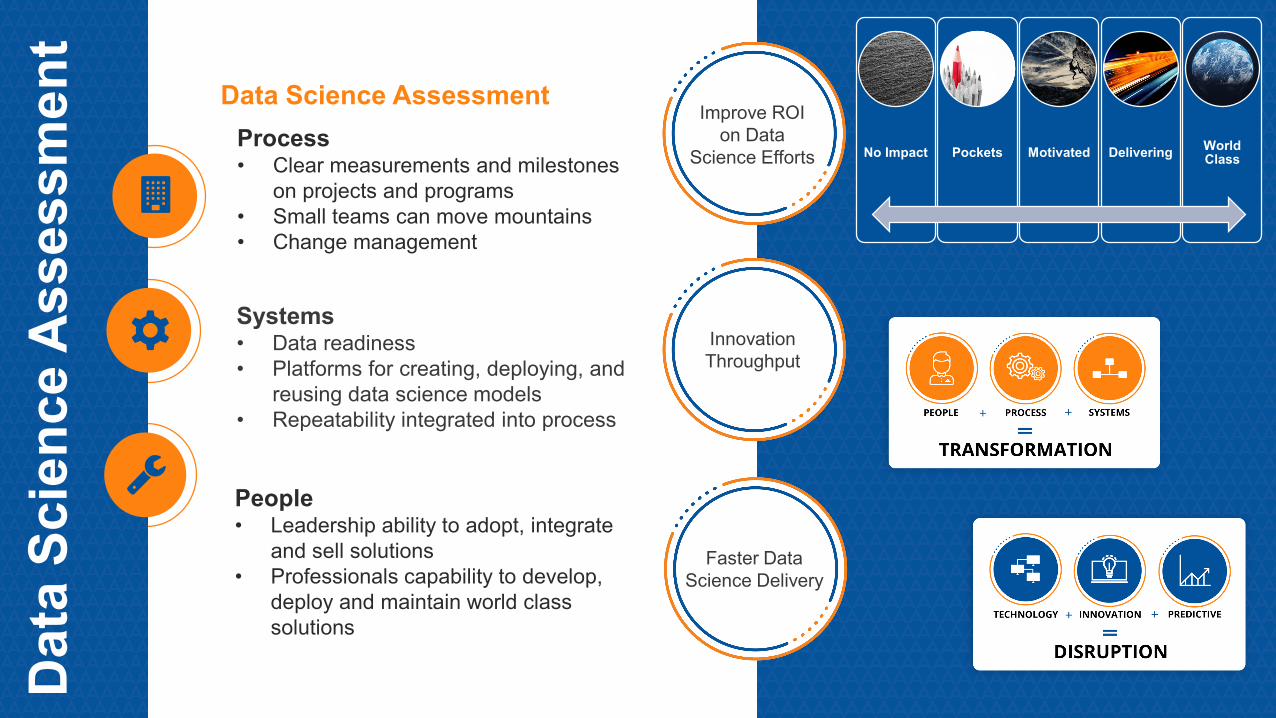
Data Science Assessment
Systems• Data readiness • Platforms for creating, deploying, and
reusing data science models• Repeatability integrated into process
People• Leadership ability to adopt, integrate
and sell solutions• Professionals capability to develop,
deploy and maintain world class solutions
Process• Clear measurements and milestones
on projects and programs• Small teams can move mountains• Change management
Dat
a Sc
ienc
e A
sses
smen
t
Innovation Throughput
Faster Data Science Delivery
Improve ROI on Data
Science Efforts No Impact Pockets Motivated Delivering World Class
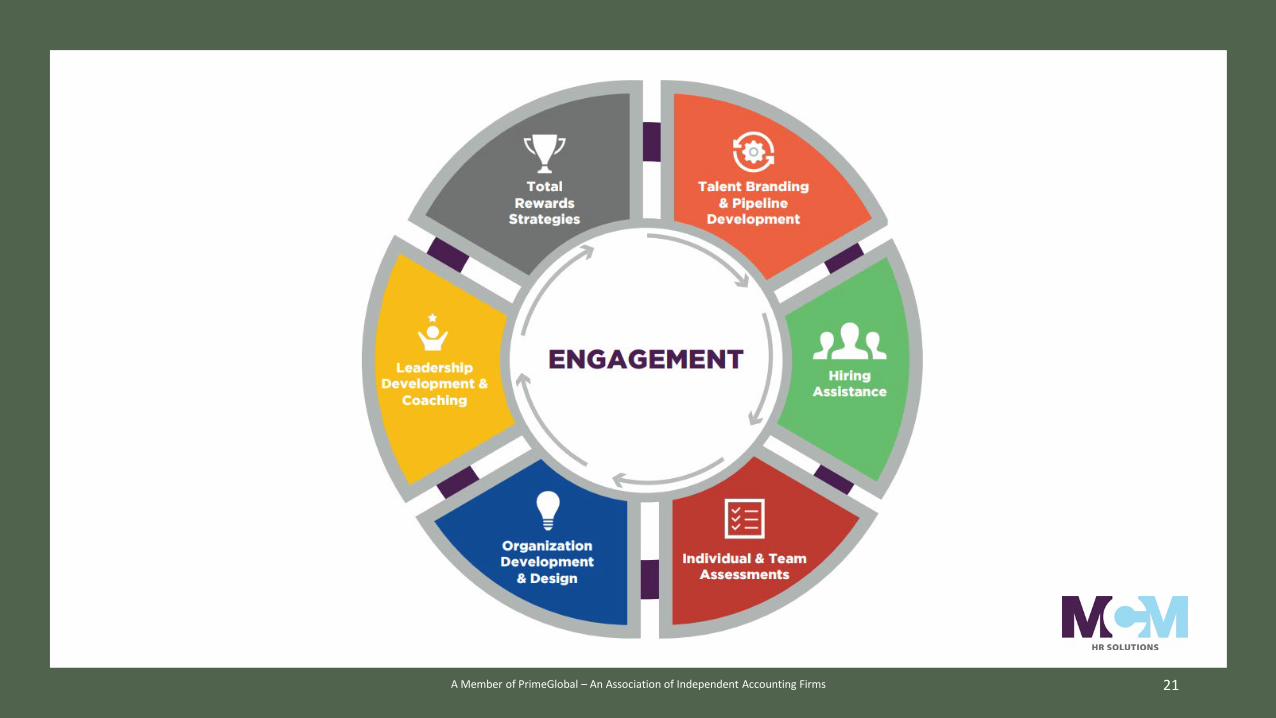
A Member of PrimeGlobal – An Association of Independent Accounting Firms
Continuing to Navigate Workforce Uncertainties as we Re-emerge
November 17, 2021
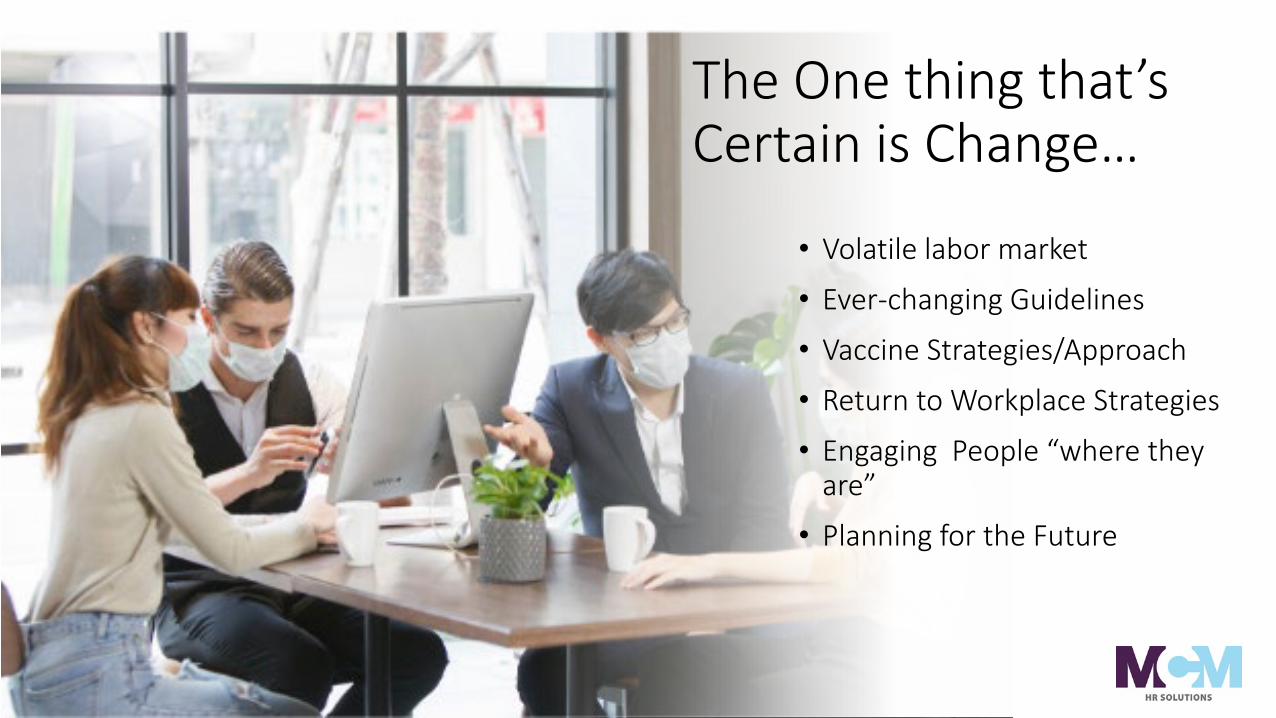
• Volatile labor market
• Ever-changing Guidelines
• Vaccine Strategies/Approach
• Return to Workplace Strategies
• Engaging People “where they are”
• Planning for the Future
The One thing that’s Certain is Change…

What is keeping you awake at night?What are your biggest “People issues”?

What We Heard…

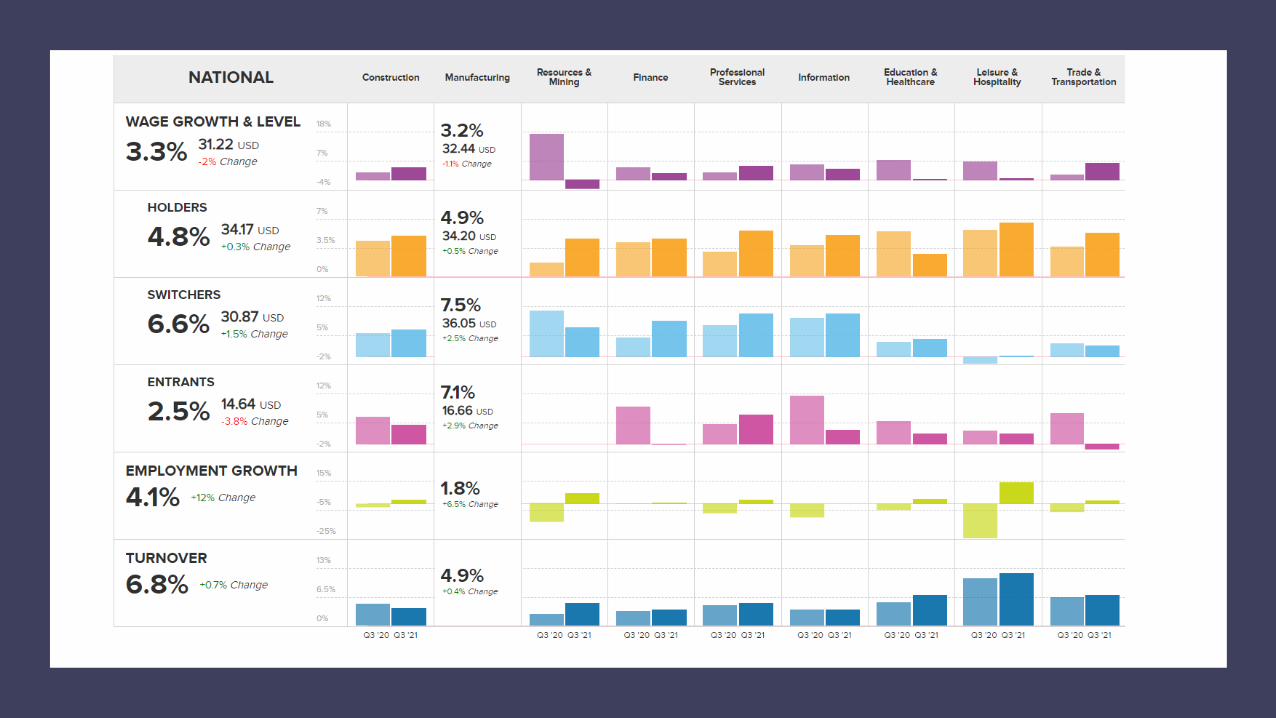
Anticipate the“Great Covid Churn”
2021 Has Been A Year Of Massive Job Turnover
• People hunkered down in 2020
• People are re-thinking their options
• People are ready to move closer to home
• Jobs have changed
• People want control over something

Time to Double-down on your People Strategies
What can you be doing now to retain your most highly-valued employees?
What does your Talent Pipeline look like?
Do you have a competitive compensation & benefits structure?
What are the expectations and needs of the workforce now and in the future?
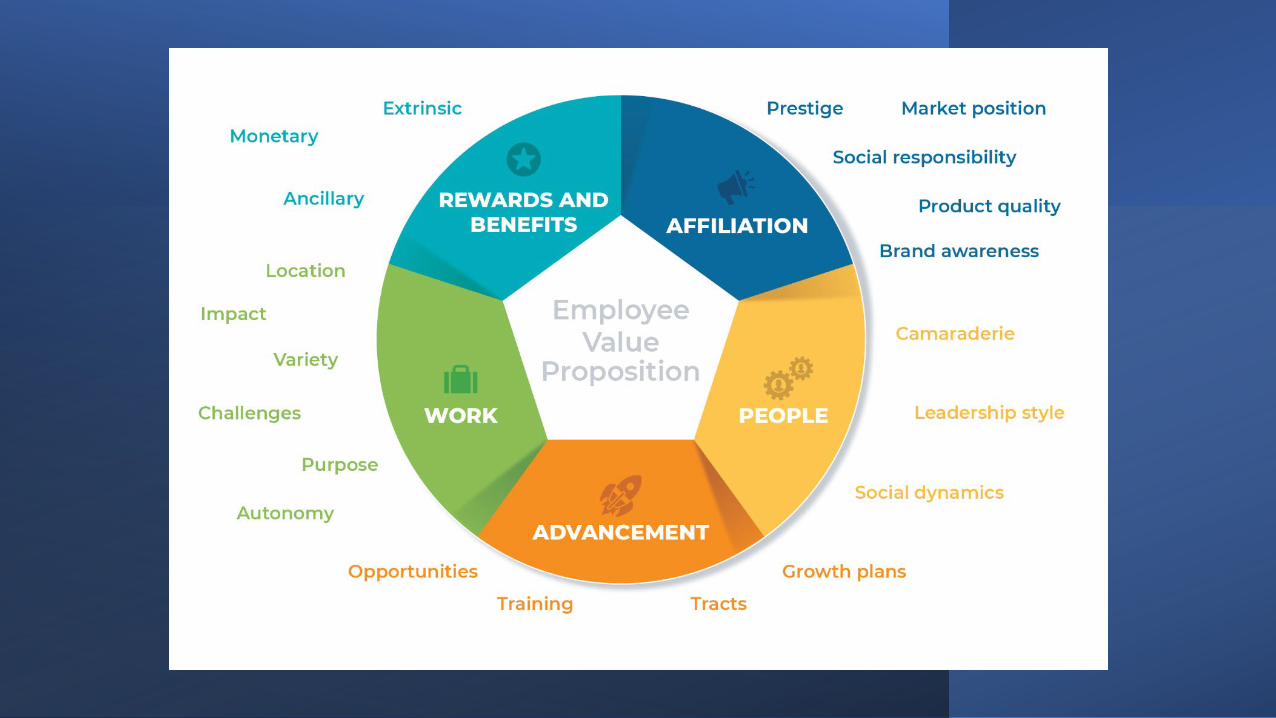
The Power of an Employee Value Proposition (EVP)

Create a Safe, Engaging & Rewarding place to work
Attract & Retain Valued Employees
Pay Competitively: Focus on Total Rewards

Think about…• War for Talent• Candidates now act like Consumers• Work schedules: Flexibility is key

66 % Percentage of People
without Jobs right now want to Change Careers
81% Percentage of
Professionals prefer a Hybrid Work Schedule

What’s a stake?
Revenues
EfficienciesCustomer Satisfaction
Employee Engagement
RetentionHiring Costs
Organization Wellness

What Does Your Talent Pipeline Look Like?
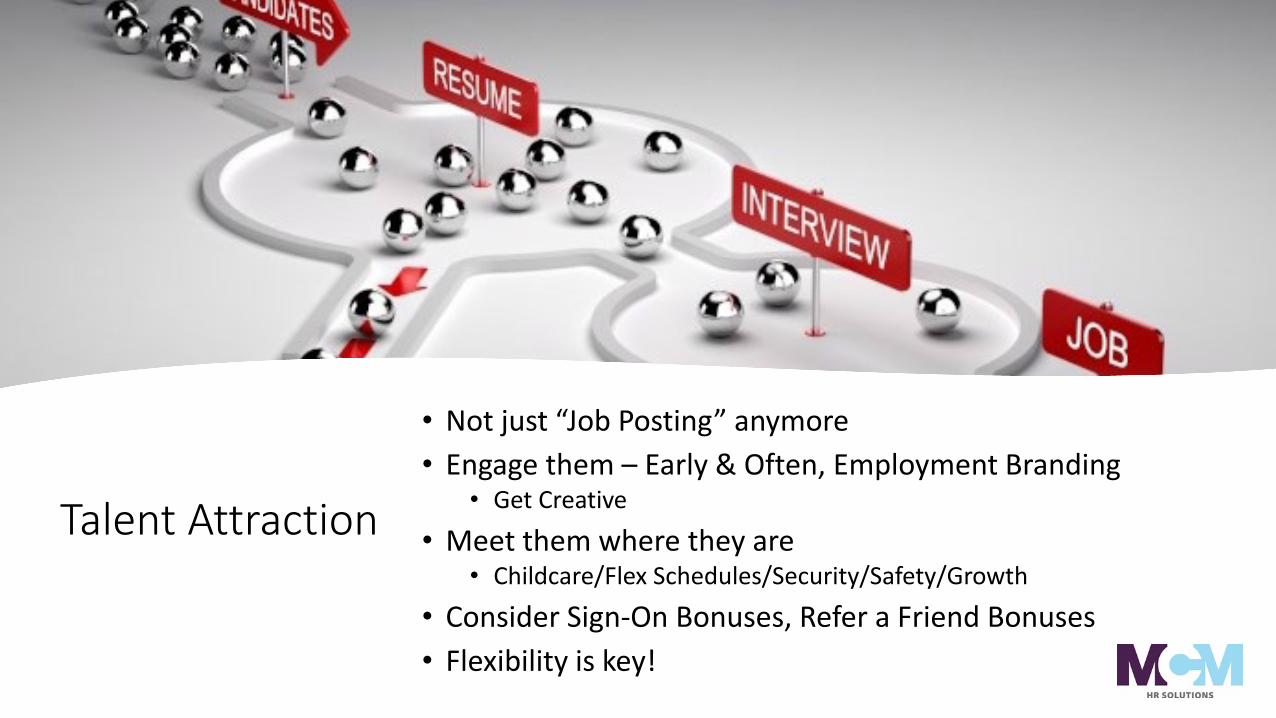
Talent Attraction
• Not just “Job Posting” anymore• Engage them – Early & Often, Employment Branding
• Get Creative
• Meet them where they are• Childcare/Flex Schedules/Security/Safety/Growth
• Consider Sign-On Bonuses, Refer a Friend Bonuses• Flexibility is key!
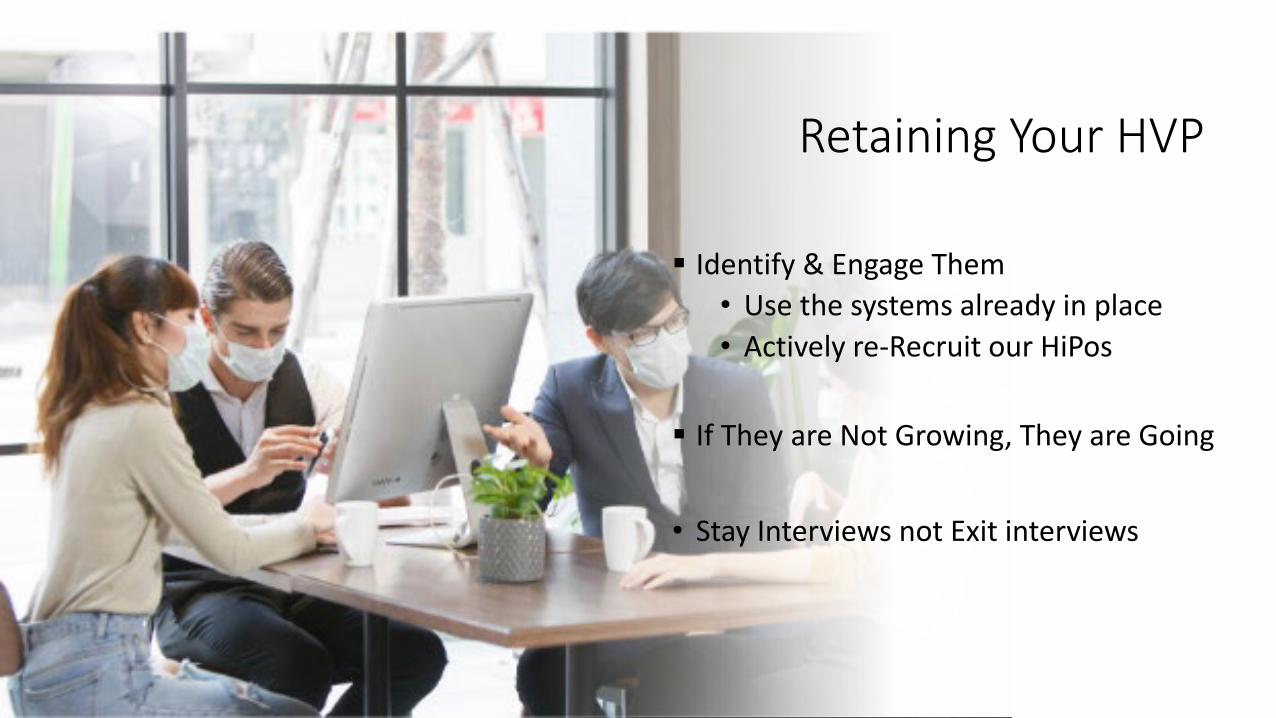
Retaining Your HVP
Identify & Engage Them• Use the systems already in place• Actively re-Recruit our HiPos
If They are Not Growing, They are Going
• Stay Interviews not Exit interviews
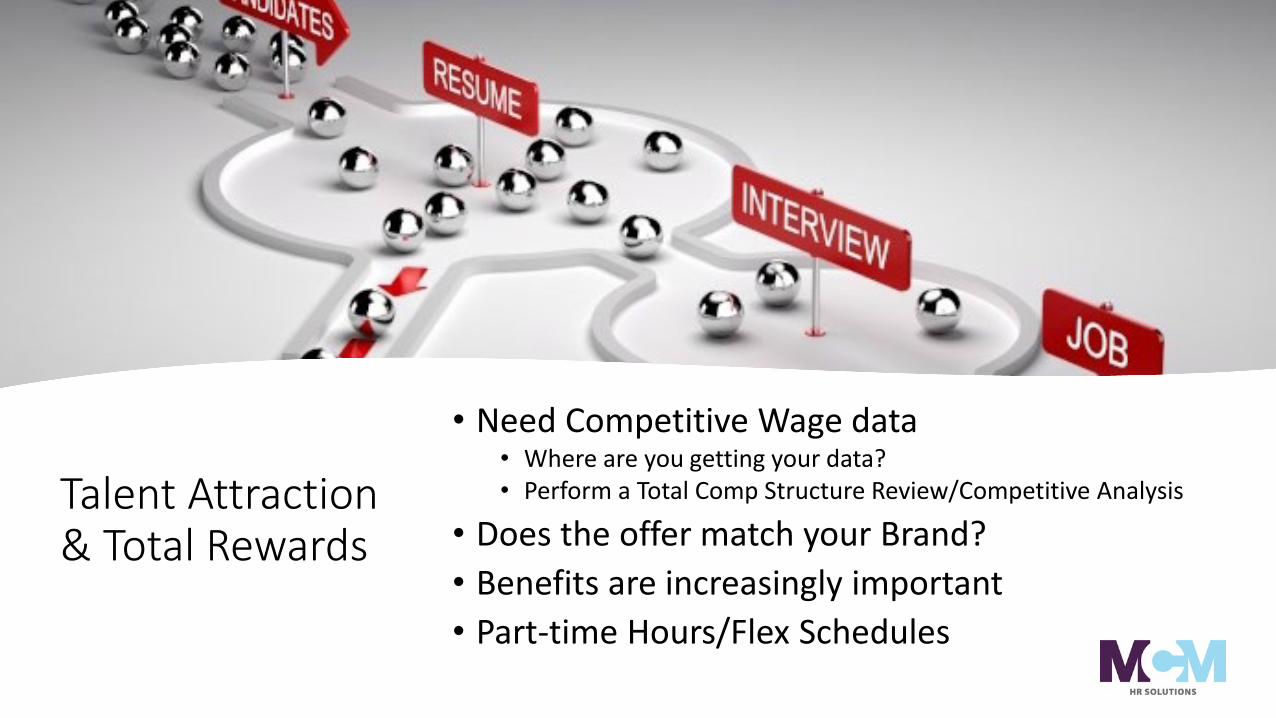
Talent Attraction & Total Rewards
• Need Competitive Wage data• Where are you getting your data? • Perform a Total Comp Structure Review/Competitive Analysis
• Does the offer match your Brand?• Benefits are increasingly important• Part-time Hours/Flex Schedules

17
Wellbeing: Now is Not the Time to Back off!
Provide Holistic Benefits that support/enable employees’
• Mental Health • Life Work Balance
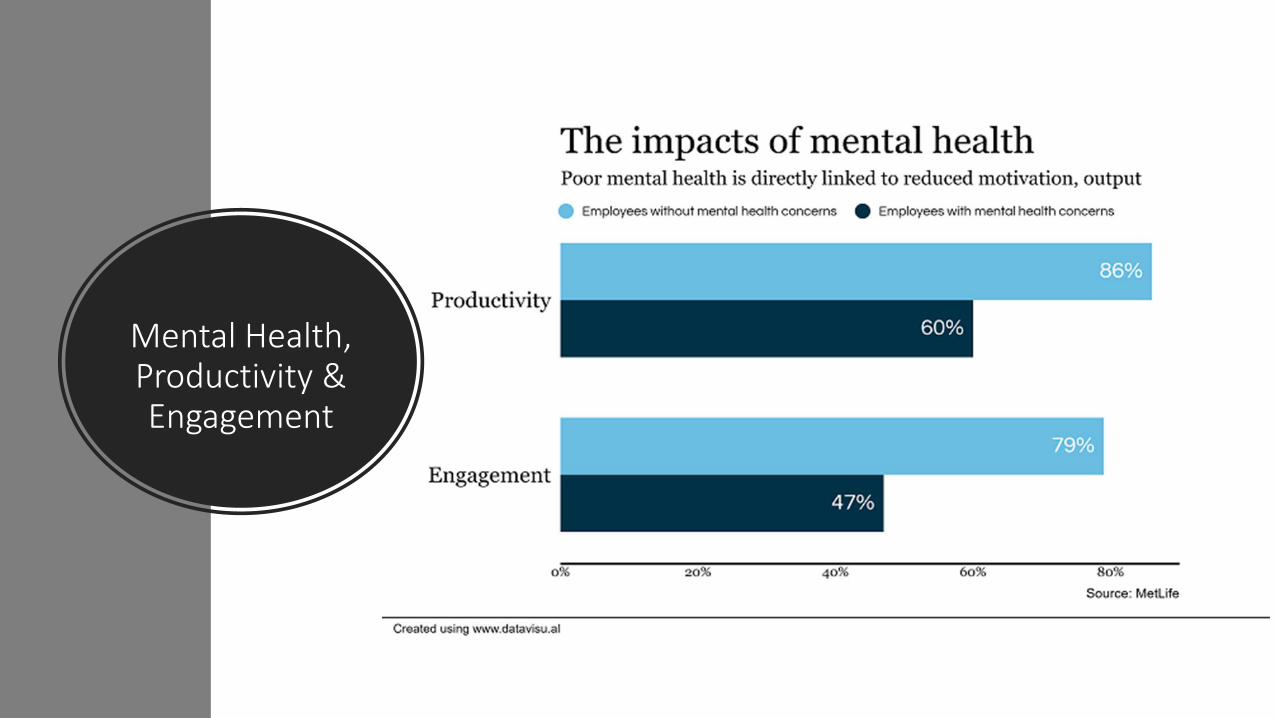
Mental Health, Productivity & Engagement
19
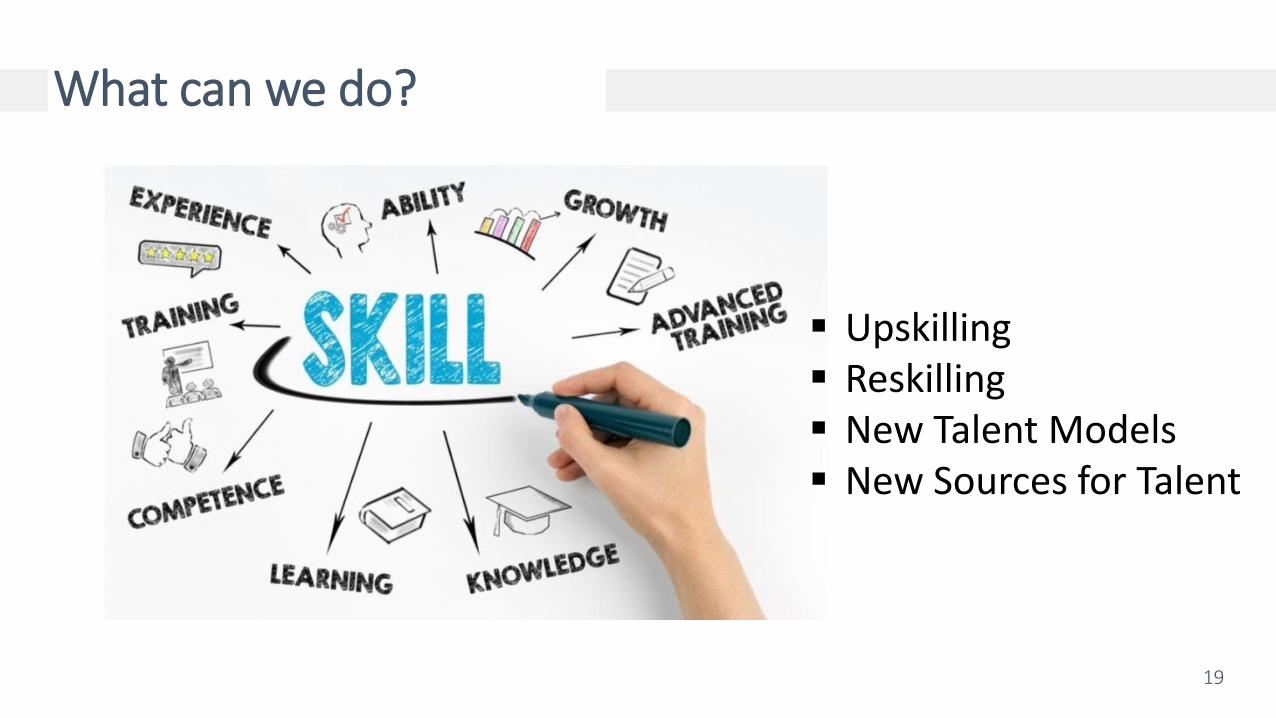
What can we do?
Upskilling Reskilling New Talent Models New Sources for Talent
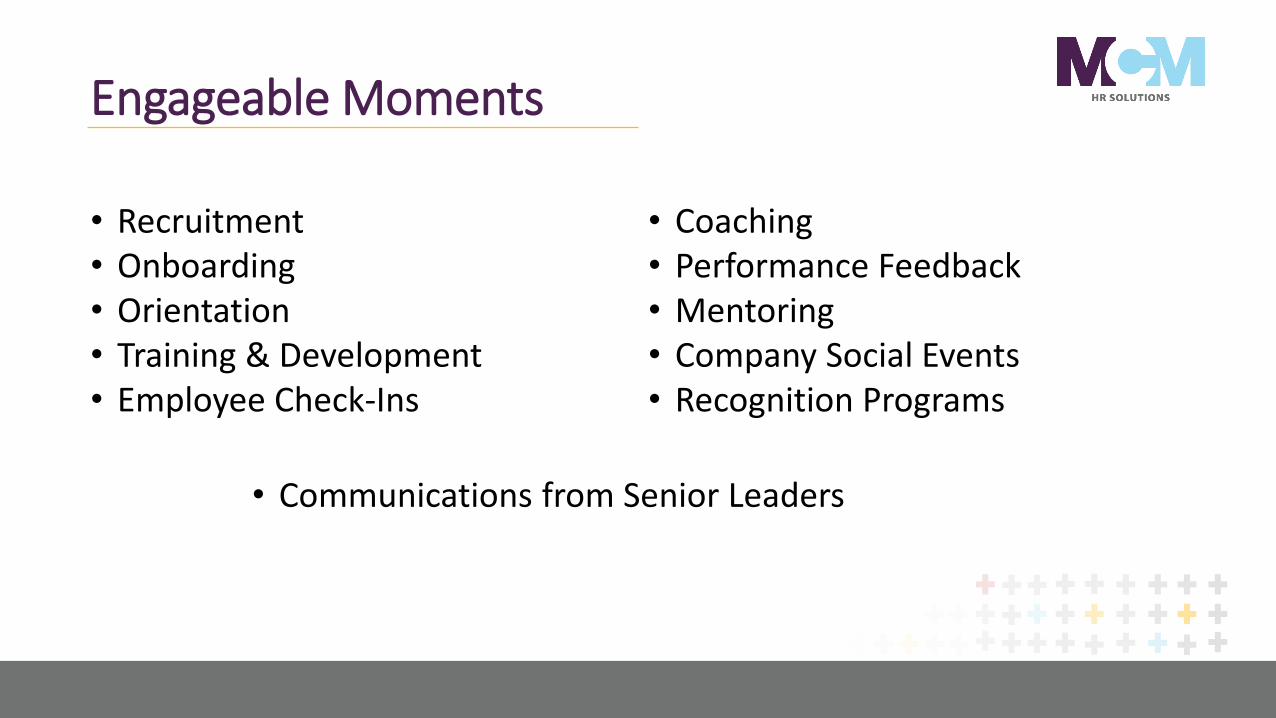
Engageable Moments
• Recruitment• Onboarding• Orientation• Training & Development• Employee Check-Ins
• Coaching• Performance Feedback• Mentoring• Company Social Events• Recognition Programs
• Communications from Senior Leaders
A Member of PrimeGlobal – An Association of Independent Accounting Firms 21
A Member of PrimeGlobal – An Association of Independent Accounting Firms
Susan PittmanMCM HRAS Team Leader
502.548-2743
Tiffany CardwellMCM HRAS Principal