1
and 6 % for Germany to 0.1 % for the Czech Republic and Latvia.  The above data show that EU companies are more eager to set up foreign affiliates in neighbouring countries, usually within the European Union, in other European countries such as Switzerland and Russia, or in countries with historical and cultural links, such as Brazil for Portugal. The USA is by far the major destination for affiliates with headquar- ters in the EU, which can be explained by the fact that it is a very important market. The role of Asia as a market for EU foreign affiliates has increased substantially during the last few years, especially in China and Japan. B T WEB TE Eurostat provides users with free access to all of its databases, as well as PDF versions of its publica- tions. To discover more, open a web browser on the Eurostat home page at: c.europa.eu/Eurostat c.europa.eu/Eurostat . From the Eurostat homepage, statistical themes may be accessed by clicking on ‘Statist ics’ at the top of the page and then clicking on the link to ‘Balance of payments’included in the theme ‘Econ- omy and finance’.  The database may be accessed from the left-hand menu. To access outward FATS data on employment and turnover, click on European Foreign Affiliates Statistics. Links to the methodology, structured according to the International Monetary Fund’s common Special Data Dissemination Standard (SDDS), provide sup- porting information on aspects such as collection methods, data treatment, classifications and defini- tions and quality aspects. SDDS metadata on out- ward FATS may be found by clicking on the symbol ‘M’on the right side of the corresponding chapter. T I TC I O T I TC I O e nit edSt ate s asthemainlo cat ion e nite dStateswasthemai nlocatio n ofE -con trol ledaffil iate s ofEU-controlledaffiliates Issuenumber21/2009 Int ern al ark etsti ll count sform retha n50 Int ern al ark etsti ll count sformor ethan50 % fEU orei gn irec tinvest ment san trad inservic es fEU orei gn irec tinvest ment san tradeinservi ces Issuenumber56/2009 EU- 27curre nt ccou ntdefici trosetoEUR24 n EU- 27curre nt ccou ntdefici trosetoEUR24 n Issuenumber45/2009 tron gincrea seinbothinwar d nd utwa rdFDI lows Stro ngincre aseinbothinwardand utwa rdFDI lows in2007 in2007 Issuenumber19/2009 EUExte rnal urpl usinInterna tion al radein ervic es EUExte rnalSur plusinInte rnati onal radein ervic es in 2 7 rewby22. in2 7gr ewby22. Issuenumber14/2009 I T I AT Recommen aton anual Recommen ations anual on he Produc ion of Foregn on he Production o f Foreign AffiliaTes Stat stics FATS AffiliaTes Stat stics FATS) Product code: KS-RA-07-002 ISBN: 978-92-79-04702-2 ISSN: 1977-0375 Europ an ni n forei gn ir ct European Union foreign irect investment yearbook 2 0 8 – investment yearbook 2008 – Dat -2 Da t 2 1- 200 Format: paper, PDF Language versions: EN Catalogue number: KS-BK-08-001 ISSN: 1605-2935 Europe in figures – Eurostat Europe in figures – Eurostat earb k  ear b ok 0 Format: paper, PDF Language versions: EN, DE and FR Catalogue number: KS-CD-07-001 ISSN: 1681-4789 European Economc tatistics European Economc tatistics Format: paper, PDF Language versions: EN Catalogue number: KS-30-08-410 ISBN: 978-92-79-08886-5 P I AT O C I PU ATIO Foreign filiaT s Statistcs F TS) – Rec mmendation s Foreign ffiliaTes Statistics FATS) – Recommendations anual – 2 anual – 2 nd nd edition Autumn 20 9) edition Autumn 2009) Compact guides ©EuropeanCommunities,2009 twar F reig O wa Freg liaTe lia es tati tic F T tatis ic AT Economy and Finance K   S  - 7   8  -  0   9  -  6  2   6  - E  N -  D  The European Union is one of the world’s biggest investors, and foreign affiliates of European compa- nies play a very important role in the global econ- omy. Therefore, outward foreign affiliates statistics (FATS), which can be defined as statistics describing the activity of foreign affiliates abroad controlled by the compiling economy, are increasingly relevant in formulation of European economic policies, as they provide information on the role which European capital groups play in the world’s economy, espe- cially in terms of sales and employment. Reporting of outward FATS data in Europe has been taking place on a voluntary basis up to the reference year 2006, for which the data are the latest currently available. The variables covered for most countries were number of persons employed and turnover with respectively 11 and 10 Member States provid- ing the data. As from the reference year 2007 out- ward FATS data transmission to Eurostat became compulsory for turnover, number of persons em- ployed and number of enterprises. The publication of those figures is expected in early 2010.  Throughout the reference years 2004–06, out of the Member States with available data, German foreign affiliates had by far the biggest share in terms of both turnover and number of persons employed.  They were followed by foreign affiliates from Italy, Finland and France in terms of turnover and Sweden and Italy in terms of number of persons employed. Activity of the EU foreign affiliates is bigger inside than outside the EU. For reference year 2006, the in- tra-EU27 share in number of persons employed was 56 % (ranging from 42 % for Portugal to 74 % for the Czech Republic, followed by 72 % for Austria). In terms of turnover, the intra-EU27 share represents 57 % (ranging from 51 % for Germany to 90 % for the Czech Republic). EU foreign affiliates’ activity is bigger inside the EU than outside in all Member States with available data and for both character- istics, turnover and number of persons employed, except for number of persons employed in Portu- guese foreign affiliates (where the extra-EU share was 61 %) and in Slovakian foreign affiliates (with a 53 % share), and for turnover in Latvian foreign af- filiates (with a 57 % of turnover registered outside the EU-27). Moreover, the most substantial activity of foreign affiliates takes place in the neighbouring countries (France for Belgium, Slovakia for Czech Republic, Germany for Austria and the Czech Republic, Spain for Portugal or Sweden for Finland). Only for Ger- man foreign affiliates the biggest country of des- tination outside the EU in terms of both turnover and number of persons employed is the United States. The USA is the biggest destination in terms of number of persons employed for Sweden and in terms of turnover for Finland.  The highest activity of European affiliates outside the European Union is registered in North America, with 32 % in terms of persons employed and 54 % for turn- over of affiliates located outside the EU27 (USA rep- resents 92 % of the total figures with North America). Graph 1 shows the whole geographical breakdown for number of persons employed and turnover. In terms of types of activities, services are the main field of activity for European affiliates with 54 % of the total turnover, followed by manufacturing, with 39 %. Only Finland shows a higher share of manufac- turing (57 %) than that for services (39 %) in terms of turnover. On the other hand, considering the number of persons employed, the manufacturing with 52 % recorded the highest share, compared with a 42 % recorded for services. This was caused by share of employment in manufacturing in affili- ates controlled from Czech Republic, Germany, Italy and Finland, while for remaining countries employ- ment in services was greater. ‘Trade and repairs’ represents the biggest share among the services categories in both number of persons employed and turnover (38 % and 56 % re- spectively). Its share, however, differs a great deal from country to country and ranges from 12 % in Italy to 67 % in the Czech Republic and Slovakia for number of persons employed and from 19 % in Italy to 95 % in Slovakia for turnover. ‘Real estate’is the second most relevant activity, with a share of 20 % in the total number of employees, followed by ‘Transpo rt and communicat ion’ together with ‘Financial intermediation’, which represent 19 % of total services each. As regards turnover, ‘Financial intermediation’ is the second most rep resentative activity, with 23 %, followed by ‘Transportation and communication’, with 11 %. For most countries ‘Trade and repairs’has the greatest share for both characteristics with some exceptions. For Belgium, ‘Real estate and business activities’has the highest number of persons employed (73 %) and turnover (62 %). ‘Financial intermediation’represents the highest number of persons employed for Greece (52 %), Italy (59 %), Austria (50 %) and Portugal (56 %). In the case of Italy and Portugal, ‘Financial inter- mediation’ also represents the highest turnover (61 % and 51 % respectively). Finally, for Sweden, ‘Real estate and business activities’is where the highest number of persons employed is registered.  The impact of foreign affiliates for employment dif- fers greatly from country to country, being substan- tial in some countries and rather negligible in others. Among the EU countries with available data, German affiliates are by far the biggest employer abroad, which represents 56 % of the total available data of EU affiliates abroad. But compared with tota l employ- ment within the compiling country, Sweden and Fin- land have the highest ratio of total number of persons employed in foreign affiliates, with 25 % and 18 % respectively of total employment. They are followed by Germany, with a ratio of about 13 %. On the other side, the ratio is very small for countries such as Latvia, Slovakia, the Czech Republic or Portugal, with a ratio of under 1 %. Taking into account only affiliates out- side the EU, these figures range from 7 % for Finland Graph 1— Number o persons employed and turnover in oreign a- iliates located outsidetheEU-27 in 2006 for11 reporting countriesfor number of personsemployed(Belgium, Czech Republic, Germany, Greece, Italy,Latvia,Austria, PortugalSlovakia,Finland andSweden), and10 re- porting countriesforturnover(no dataavailable forSweden) Num er op rs ons m pl oy e urn ver nd empoyment by a vt n % o a F E valabl e co n res t h he rest Num er o p rsons mployed urno ver and empoyment by a v ty n % o al FA T EU valable coun res th he rest h orl d n 20 6 orld n 2006 rnov er nd empoyment by ype ervi c n a s r s F T v il bl o n res th h est rno ver nd empoyment by ype servic n a s r ces F T v il abl o nt res th h est  he or d n 20 the wor d n 20 urn ver urnover REI N AFFL AE AI I (A ) UW EI N AF L AE AI IS (AS) Other European countries 24 % Africa 6 % North American countries 32 % Central American countries 4 % South American countries 10 % Asia 22 % Oceania and Polar regions 2 % Other European countries 10 % Africa 3 % North American countries 54 % Central American countries 4 % South American countr ies7 % Asia 18 % Oceania and Polar regions 4 %  Totalservices Construction Electr icity,gasandwater Manuacturing Miningand quarrying Agricultureand fshing  Turnover Employment 0 % 10 % 20 % 30% 40 % 50 % 60 % Notallocated Realestate& businessactivities Financialintermediation  Transportand communication Hotelsand restaurants  Tradeand repairs  Turnover Employment 0 % 10 % 20 % 30% 40 % 50 % 60 %

Outward Foreign Affiliates Statistics (FATS) - Economy and Finance

Embed Size (px)

Citation preview

8/9/2019 Outward Foreign Affiliates Statistics (FATS) - Economy and Finance

http://slidepdf.com/reader/full/outward-foreign-affiliates-statistics-fats-economy-and-finance 1/2

and 6 % for Germany to 0.1 % for the Czech Republic

and Latvia.

 The above data show that EU companies are more

eager to set up foreign affiliates in neighbouring

countries, usually within the European Union, in

other European countries such as Switzerland andRussia, or in countries with historical and cultural

links, such as Brazil for Portugal. The USA is by far

the major destination for affiliates with headquar-

ters in the EU, which can be explained by the fact

that it is a very important market. The role of Asiaas a market for EU foreign affiliates has increased

substantially during the last few years, especially

in China and Japan.

B TWEB TE

Eurostat provides users with free access to all of its

databases, as well as PDF versions of its publica-

tions. To discover more, open a web browser on the

Eurostat home page at: c.europa.eu/Eurostatc.europa.eu/Eurostat .

From the Eurostat homepage, statistical themes

may be accessed by clicking on ‘Statistics’ at the

top of the page and then clicking on the link to‘Balance of payments’included in the theme ‘Econ-

omy and finance’.

  The database may be accessed from the left-handmenu. To access outward FATS data on employment

and turnover, click on European Foreign Affiliates

Statistics.

Links to the methodology, structured according to

the International Monetary Fund’s common Special

Data Dissemination Standard (SDDS), provide sup-

porting information on aspects such as collectionmethods, data treatment, classifications and defini-

tions and quality aspects. SDDS metadata on out-

ward FATS may be found by clicking on the symbol

‘M’on the right side of the corresponding chapter.

8/9/2019 Outward Foreign Affiliates Statistics (FATS) - Economy and Finance

http://slidepdf.com/reader/full/outward-foreign-affiliates-statistics-fats-economy-and-finance 2/2

  The European Union is one of the world’s biggest

investors, and foreign affiliates of European compa-

nies play a very important role in the global econ-

omy. Therefore, outward foreign affiliates statistics

(FATS), which can be defined as statistics describing

the activity of foreign affiliates abroad controlled by

the compiling economy, are increasingly relevant in

formulation of European economic policies, as they

provide information on the role which European

capital groups play in the world’s economy, espe-

cially in terms of sales and employment.

Reporting of outward FATS data in Europe has been

taking place on a voluntary basis up to the reference

year 2006, for which the data are the latest currently

available. The variables covered for most countries

were number of persons employed and turnover

with respectively 11 and 10 Member States provid-

ing the data. As from the reference year 2007 out-ward FATS data transmission to Eurostat became

compulsory for turnover, number of persons em-

ployed and number of enterprises. The publication

of those figures is expected in early 2010.

 Throughout the reference years 2004–06, out of the

Member States with available data, German foreign

affiliates had by far the biggest share in terms of 

both turnover and number of persons employed.

  They were followed by foreign affiliates from Italy,

Finland and France in terms of turnover and Sweden

and Italy in terms of number of persons employed.

Activity of the EU foreign affiliates is bigger inside

than outside the EU. For reference year 2006, the in-

tra-EU27 share in number of persons employed was

56 % (ranging from 42 % for Portugal to 74 % for

the Czech Republic, followed by 72 % for Austria). In

terms of turnover, the intra-EU27 share represents

57 % (ranging from 51 % for Germany to 90 % for

the Czech Republic). EU foreign affiliates’ activity

is bigger inside the EU than outside in all Member

States with available data and for both character-

istics, turnover and number of persons employed,

except for number of persons employed in Portu-guese foreign affiliates (where the extra-EU share

was 61 %) and in Slovakian foreign affiliates (with a

53 % share), and for turnover in Latvian foreign af-

filiates (with a 57 % of turnover registered outside

the EU-27).

Moreover, the most substantial activity of foreign

affiliates takes place in the neighbouring countries

(France for Belgium, Slovakia for Czech Republic,

Germany for Austria and the Czech Republic, Spain

for Portugal or Sweden for Finland). Only for Ger-

man foreign affiliates the biggest country of des-

tination outside the EU in terms of both turnover

and number of persons employed is the United

States. The USA is the biggest destination in terms

of number of persons employed for Sweden and in

terms of turnover for Finland.

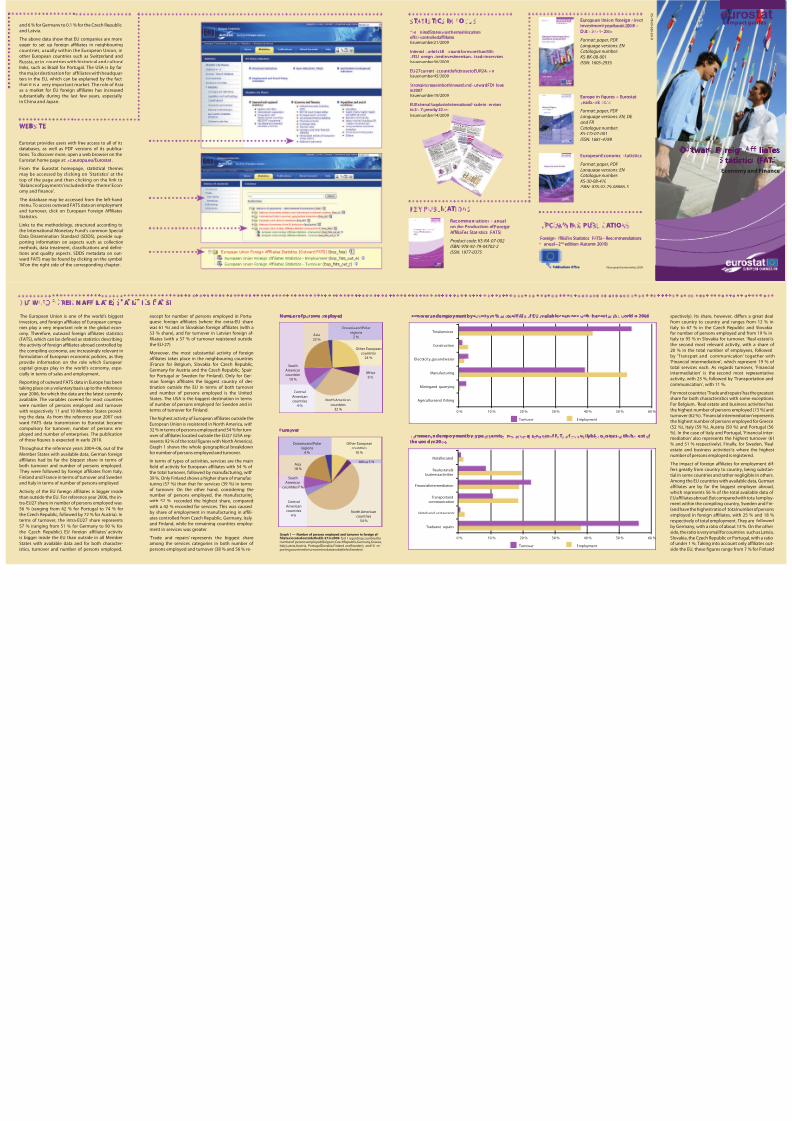
 The highest activity of European affiliates outside theEuropean Union is registered in North America, with

32 % in terms of persons employed and 54 % for turn-

over of affiliates located outside the EU27 (USA rep-

resents 92 % of the total figures with North America).

Graph 1 shows the whole geographical breakdown

for number of persons employed and turnover.

In terms of types of activities, services are the main

field of activity for European affiliates with 54 % of 

the total turnover, followed by manufacturing, with

39 %. Only Finland shows a higher share of manufac-

turing (57 %) than that for services (39 %) in terms

of turnover. On the other hand, considering thenumber of persons employed, the manufacturing

with 52 % recorded the highest share, compared

with a 42 % recorded for services. This was caused

by share of employment in manufacturing in affili-

ates controlled from Czech Republic, Germany, Italy

and Finland, while for remaining countries employ-

ment in services was greater.

‘Trade and repairs’ represents the biggest share

among the services categories in both number of 

persons employed and turnover (38 % and 56 % re-

Graph 1 — Number o persons employed and turnover in oreign a-iliates located outsidetheEU-27 in 2006 for11 reporting countriesfornumber of personsemployed(Belgium, Czech Republic, Germany, Greece,Italy,Latvia,Austria, PortugalSlovakia,Finland andSweden), and10 re-porting countriesforturnover(no dataavailable forSweden)

N um e r o p r so ns m pl oy e Num er o p rsons mployed

u rn v er

urnover

REI N AFF L A E A I I ( A )U W EI N AF L A E A I I S ( A S)

Other Europeancountries

24 %

Africa6 %

North American

countries32 %

Central

Americancountries

4 %

SouthAmericancountries

10 %

Asia22 %

Oceania and Polarregions

2 %

Other Europeancountries

10 %

Africa 3 %

North Americancountries

54 %

CentralAmericancountries

4 %

SouthAmerican

countries7 %

Asia18 %

Oceania and Polarregions

4 %